Embed Size (px)
Citation preview
arX
iv:0
811.
4520
v1 [
nucl
-ex]
27
Nov
200
8
Pygmy dipole strength in 90Zr
R. Schwengner,1 G. Rusev,1, ∗ N. Tsoneva,2, 3 N. Benouaret,1, †
R. Beyer,1 M. Erhard,1 E. Grosse,1, 4 A. R. Junghans,1 J. Klug,1, ‡
K. Kosev,1 H. Lenske,2 C. Nair,1 K. D. Schilling,1 and A. Wagner1
1Institut fur Strahlenphysik, Forschungszentrum
Dresden-Rossendorf, D-01314 Dresden, Germany2Institut fur Theoretische Physik, Universitat Gießen, D-35392 Gießen, Germany
3Institute for Nuclear Research and Nuclear Energy, BAS, BG-1784 Sofia, Bulgaria4Institut fur Kern- und Teilchenphysik,
Technische Universitat Dresden, D-01062 Dresden, Germany
(Dated: February 19, 2013)
AbstractThe dipole response of the N = 50 nucleus 90Zr was studied in photon-scattering experiments at
the electron linear accelerator ELBE with bremsstrahlung produced at kinetic electron energies
of 7.9, 9.0, and 13.2 MeV. We identified 189 levels up to an excitation energy of 12.9 MeV.
Statistical methods were applied to estimate intensities of inelastic transitions and to correct the
intensities of the ground-state transitions for their branching ratios. In this way we derived the
photoabsorption cross section up to the neutron-separation energy. This cross section matches well
the photoabsorption cross section obtained from (γ, n) data and thus provides information about
the extension of the dipole-strength distribution toward energies below the neutron-separation
energy. An enhancement of E1 strength has been found in the range of 6 MeV to 11 MeV.
Calculations within the framework of the quasiparticle-phonon model ascribe this strength to a
vibration of the excessive neutrons against the N = Z neutron-proton core, giving rise to a pygmy
dipole resonance.
PACS numbers: 25.20.Dc, 21.10.Tg, 21.60.Jz, 23.20.-g, 27.50.+e
∗Present address: Department of Physics, Duke University, and Triangle Universities Nuclear Laboratory,
Durham, NC 27708†Permanent address: Faculte de physique, Universite des Sciences et de la technologie d’Alger, El-Alia 16111,
Bab-Ezzouar-Alger, Algerie‡Present address: Ringhals Nuclear Power Plant, SE-43022 Varobacka, Sweden
1
I. INTRODUCTION
Gamma-ray strength functions, in particular dipole-strength functions, are an importantingredient for the analysis of photodisintegration reactions as well as of the inverse reactionslike neutron capture. These reactions play an important role for specific processes of thenucleosynthesis. Moreover, an improved experimental and theoretical description of neutron-capture reactions is important for next-generation nuclear technologies.
The measurement of dipole-strength distributions from low excitation energy up to theneutron-separation energy delivers information about magnitude and structure of the low-energy tail of the giant dipole resonance (GDR), in particular about possible additionalvibrational modes like the so-called pygmy dipole resonance (PDR). Dipole-strength dis-tributions up to neutron-separation energies have been studied for only few nuclides inexperiments with monoenergetic photons (see, e.g., Refs. [1, 2, 3, 4]) and in experimentswith bremsstrahlung (see, e.g., Ref. [5] and Refs. therein). The bremsstrahlung facility [6]at the superconducting electron accelerator ELBE of the research center Dresden-Rossendorfopens up the possibility to study the dipole response of stable nuclei with even the highestneutron-separation energies in photon-scattering experiments. In the course of a system-atic study of dipole-strength distributions for varying neutron and proton numbers in nucleiaround A = 90 [7, 8] we have investigated the N = 50 nuclide 90Zr.
In earlier experiments, the 2+ states at 2186, 3308, 3842, 4120, 4230, 4680, and the1(−) states at 4580 and 5504 keV were studied with bremsstrahlung produced by 5 MeVelectrons [9, 10]. About 20 further states were found in experiments at higher energies upto 10 MeV [11, 12]. For the 15 J = 1 states above 6 MeV negative parity was deduced froman experiment with polarized photons [13].
In the present study we identified about 190 levels up to 12.9 MeV. We applied statisticalmethods to estimate the intensities of inelastic transitions to low-lying excited levels andto correct the intensities of the elastic transitions to the ground state with their branchingratios. The dipole-strength distribution deduced from the present experiments is comparedwith predictions of the quasiparticle-phonon model.
II. EXPERIMENTAL METHODS AND RESULTS
The nuclide 90Zr was studied in photon-scattering experiments at the superconductingelectron accelerator ELBE of the research center Dresden-Rossendorf. Bremsstrahlung wasproduced using electron beams of 7.9, 9.0, and 13.2 MeV kinetic energy. The average currentswere about 330 µA in the measurement at 7.9 MeV and about 500 µA in the measurements athigher energy. The electron beams hit radiators consisting of niobium foils with thicknessesof 4 µm in the low-energy measurements and of 7 µm in the measurement at 13.2 MeV. A 10cm thick aluminum absorber was placed behind the radiator to reduce the low-energy partof the bremsstrahlung spectrum (beam hardener). The collimated photon beam impingedonto the target with a flux of about 109 s−1 in a spot of 38 mm diameter. The targetwas a disk with a diameter of about 20 mm to enable an irradiation with a constant fluxdensity over the target area. The target consisted of 4054.2 mg of 90ZrO2 enriched to 97.7%,combined with 339.5 mg of 11B, enriched to 99.52% and also formed to a disk of 20 mmdiameter, that was used for the determination of the photon flux. Scattered photons weremeasured with four high-purity germanium (HPGe) detectors of 100% efficiency relative toa NaI detector of 3 in. diameter and 3 in. length. All HPGe detectors were surrounded by
2
10500 11000 11500 12000 12500 13000Eγ (keV)
0
50
100
150
8000 8500 9000 9500 10000 105000
250
500
750N
umbe
r of
cou
nts
5500 6000 6500 7000 7500 80000
500
1000
1500
2000
2500
5504
5885
6876
6913
6959
7976
8132
8167
8110
11B
8236
8413 84
40 8501
8718
8761
1059
4
1054
7
1112
7
1145
111
478
1177
8
1206
612
206
1249
4
90Zr(γ,γ’)
Ee
kin = 13.2 MeV
θ = 127o
5808
6296
6390
6424
6566
6669
6761
7198
6798
6048
7249
7281
7475
7702
7808 79
35
9147
9259 92
9294
44 9486
9538
/955
0
9962 10
043
1019
210
314
1037
5
1052
3
1072
610
826
1095
510
985
1123
111
336
1201
9
1224
2
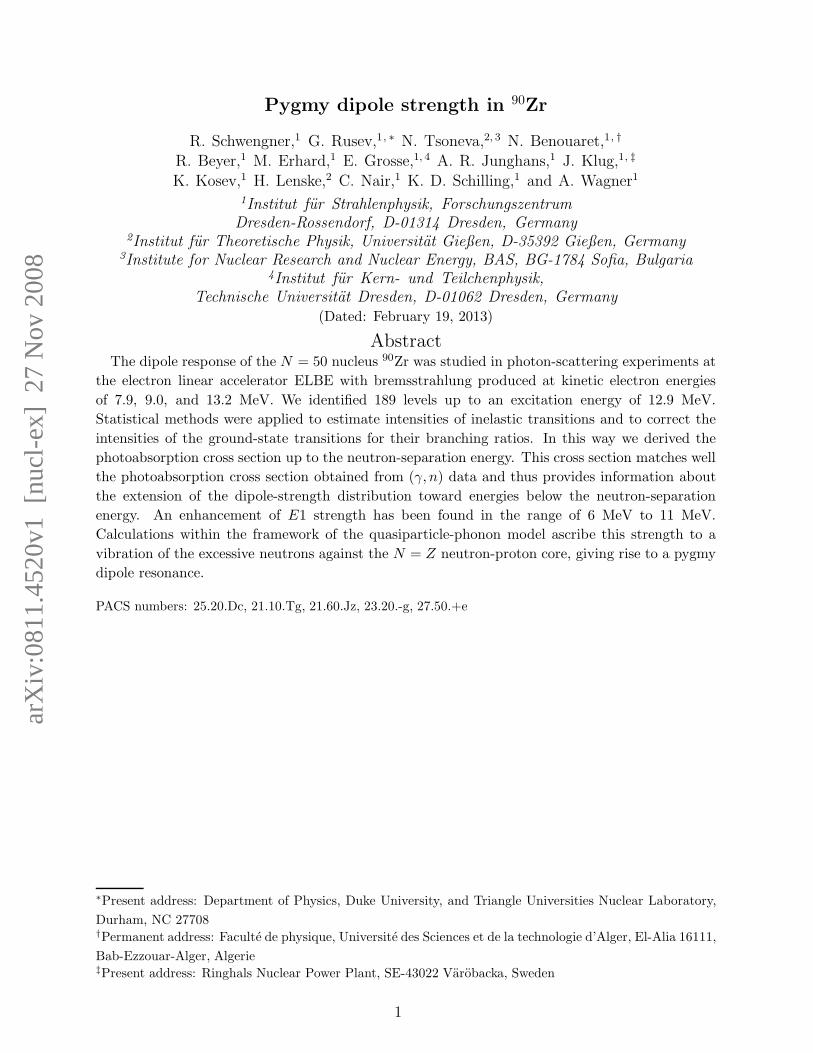
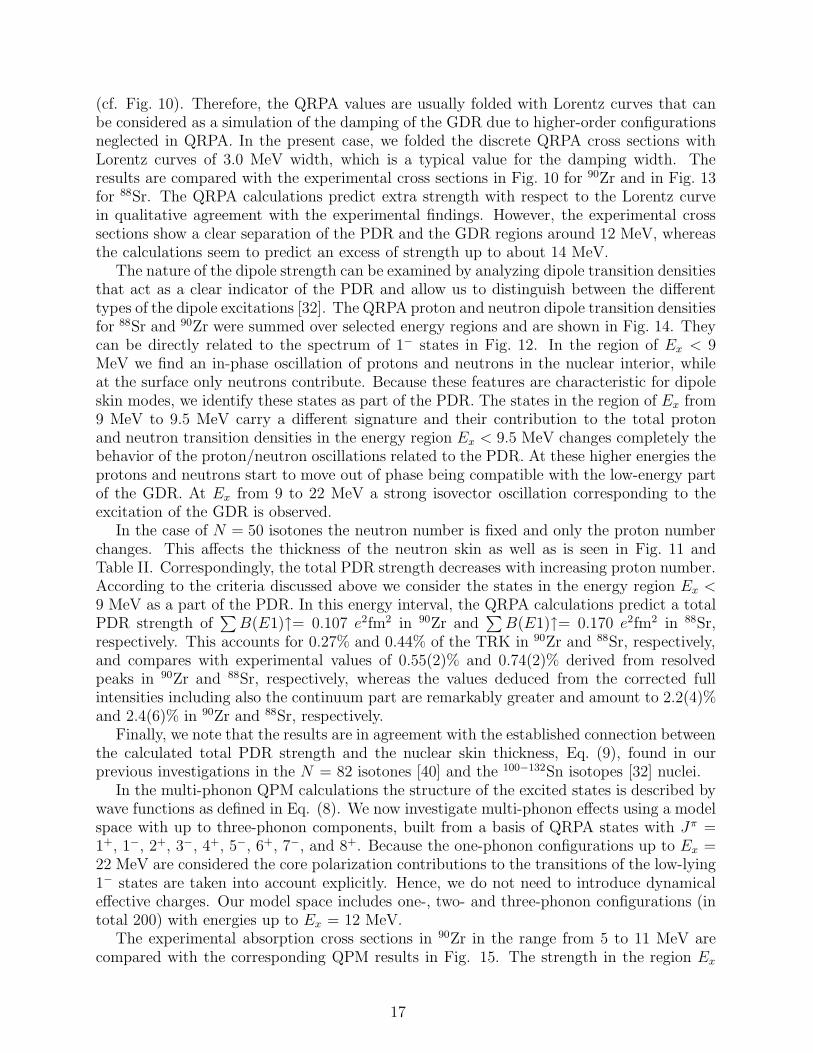
FIG. 1: Parts of a spectrum of photons scattered from 90Zr combined with 11B during the irradia-
tion with bremsstrahlung produced by electrons of an energy of Ekine = 13.2 MeV. This spectrum
is the sum of the spectra measured with the two detectors placed at 127◦ relative to the beam.
The most dominant transitions assigned to 90Zr are marked with their energies in keV.
escape-suppression shields made of bismuth germanate scintillation detectors. Two HPGedetectors were placed vertically at 90◦ relative to the photon-beam direction at a distance of28 cm from the target. The other two HPGe detectors were positioned in a horizontal planeat 127◦ to the beam at a distance of 32 cm from the target. Absorbers of 8 mm Pb plus3 mm Cu and of 3 mm Pb plus 3 mm Cu were placed in front of the detectors at 90◦ and127◦, respectively, in the measurements at 7.9 and 9.0 MeV whereas in the measurement at13.2 MeV absorbers of 13 mm Pb plus 3 mm Cu and of 8 mm Pb plus 3 mm Cu were usedfor the detectors at 90◦ and 127◦, respectively. A detailed description of the bremsstrahlungfacility is given in Ref. [6].
Spectra of scattered photons were measured for 56 h, 65 h, and 97 h in the experimentsat 7.9, 9.0, and 13.2 MeV electron energy, respectively. Parts of a spectrum including eventsmeasured with the two detectors placed at 127◦ relative to the beam at an electron energyof 13.2 MeV are shown in Fig. 1.
A. The photon-scattering method
In photon-scattering experiments the energy-integrated scattering cross section Is of anexcited state at the energy Ex can be deduced from the measured intensity of the respectivetransition to the ground state (elastic scattering). It can be determined relative to the
3
known integrated scattering cross sections Is(EBx ) of states in 11B [14]:
Is(Ex)
Is(EBx )
=
(Iγ(Eγ, θ)
W (Eγ, θ)Φγ(Ex)NN
)(Iγ(E
Bγ , θ)
W (EBγ , θ)Φγ(EB
x )NBN
)−1
. (1)
Here, Iγ(Eγ , θ) and Iγ(EBγ , θ) denote the measured intensities of a considered ground-
state transition at Eγ and of a ground-state transition in 11B at EBγ , respectively, observed
at an angle θ to the beam. W (Eγ, θ) and W (EBγ , θ) describe the angular correlations of
these transitions. The quantities NN and NBN are the numbers of nuclei in the 90Zr and 11B
targets, respectively. The quantities Φγ(Ex) and Φγ(EBx ) stand for the photon fluxes at the
energy of the considered level and at the energy of a level in 11B, respectively.The integrated scattering cross section is related to the partial width of the ground-state
transition Γ0 according to
Is =
∫σγγ dE =
(π~c
Ex
)22Jx + 1
2J0 + 1
Γ20
Γ, (2)
where σγγ is the elastic scattering cross section, Ex, Jx and Γ denote energy, spin and totalwidth of the excited level, respectively, and J0 is the spin of the ground state.
For the determination of the level widths one is faced with two problems. First, a consid-ered level can be fed by transitions from higher-lying states. The measured intensity of theground-state transition is in this case higher than the one resulting from a direct excitationonly. As a consequence, the integrated cross section deduced from this intensity containsa part originating from feeding in addition to the true integrated scattering cross section:Is+f = Is + If . Furthermore, a considered level can deexcite not only to the ground state,but also to low-lying excited states (inelastic scattering). In this case, not all observed γtransitions are ground-state transitions. To deduce the partial width of a ground-state tran-sition Γ0 and the integrated absorption cross section one has to know the branching ratiob0 = Γ0/Γ. If this branching ratio cannot be determined, only the quantity Γ2
0/Γ can bededuced (cf. Eq. (2)).
Spins of excited states can be deduced by comparing experimental ratios of intensitiesmeasured at two angles with theoretical predictions. The optimum combination are anglesof 90◦ and 127◦ because the respective ratios for the spin sequences 0− 1− 0 and 0 − 2 − 0differ most at these angles. The expected values are W (90◦)/W (127◦)0−1−0 = 0.74 andW (90◦)/W (127◦)0−2−0 = 2.18 taking into account opening angles of 16◦ and 14◦ of thedetectors at 90◦ and 127◦, respectively.
B. Detector response and photon flux
For the determination of the integrated scattering cross sections according to Eq. (1)the relative efficiencies of the detectors and the relative photon flux are needed. For thedetermination of the dipole-strength distribution described in Sec. III the experimentalspectrum has to be corrected for detector response, for the absolute efficiency, and forthe absolute photon flux, for background radiation, and for atomic processes induced bythe impinging photons in the target material. The detector response has been simulatedusing the program package GEANT3 [15]. The reliability of the simulation was tested bycomparing simulated spectra with measured ones as described in Refs. [7, 8].
4
4000 6000 8000 10000 12000Eγ (keV)
0
20
40
60
80
100
120
140
160
180
200
Φγ (
(eV
s)−
1 )
Ee
kin = 13.2 MeV
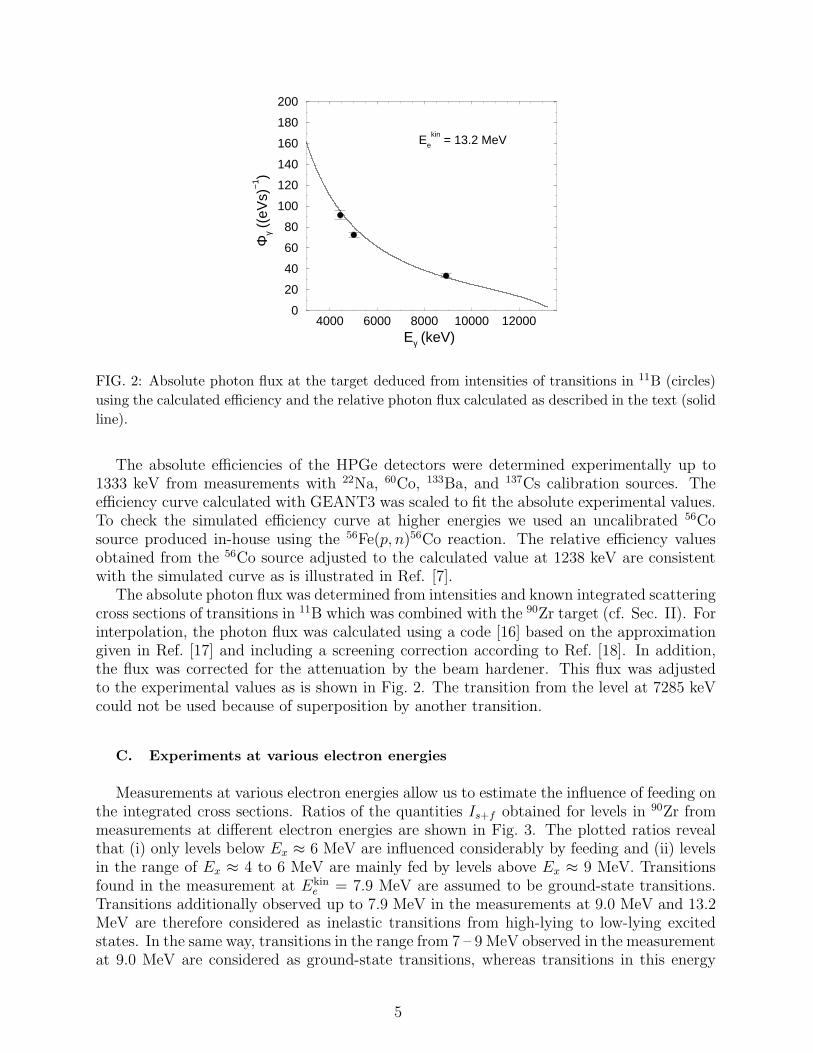
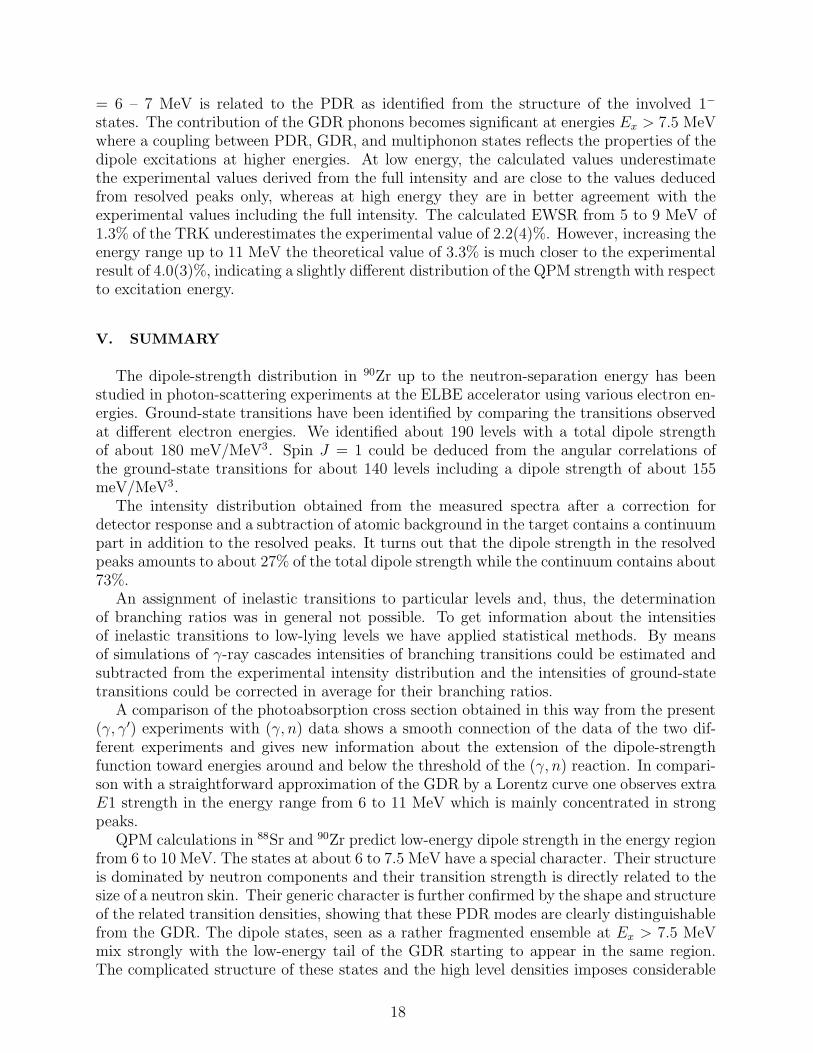
FIG. 2: Absolute photon flux at the target deduced from intensities of transitions in 11B (circles)
using the calculated efficiency and the relative photon flux calculated as described in the text (solid
line).
The absolute efficiencies of the HPGe detectors were determined experimentally up to1333 keV from measurements with 22Na, 60Co, 133Ba, and 137Cs calibration sources. Theefficiency curve calculated with GEANT3 was scaled to fit the absolute experimental values.To check the simulated efficiency curve at higher energies we used an uncalibrated 56Cosource produced in-house using the 56Fe(p, n)56Co reaction. The relative efficiency valuesobtained from the 56Co source adjusted to the calculated value at 1238 keV are consistentwith the simulated curve as is illustrated in Ref. [7].
The absolute photon flux was determined from intensities and known integrated scatteringcross sections of transitions in 11B which was combined with the 90Zr target (cf. Sec. II). Forinterpolation, the photon flux was calculated using a code [16] based on the approximationgiven in Ref. [17] and including a screening correction according to Ref. [18]. In addition,the flux was corrected for the attenuation by the beam hardener. This flux was adjustedto the experimental values as is shown in Fig. 2. The transition from the level at 7285 keVcould not be used because of superposition by another transition.
C. Experiments at various electron energies
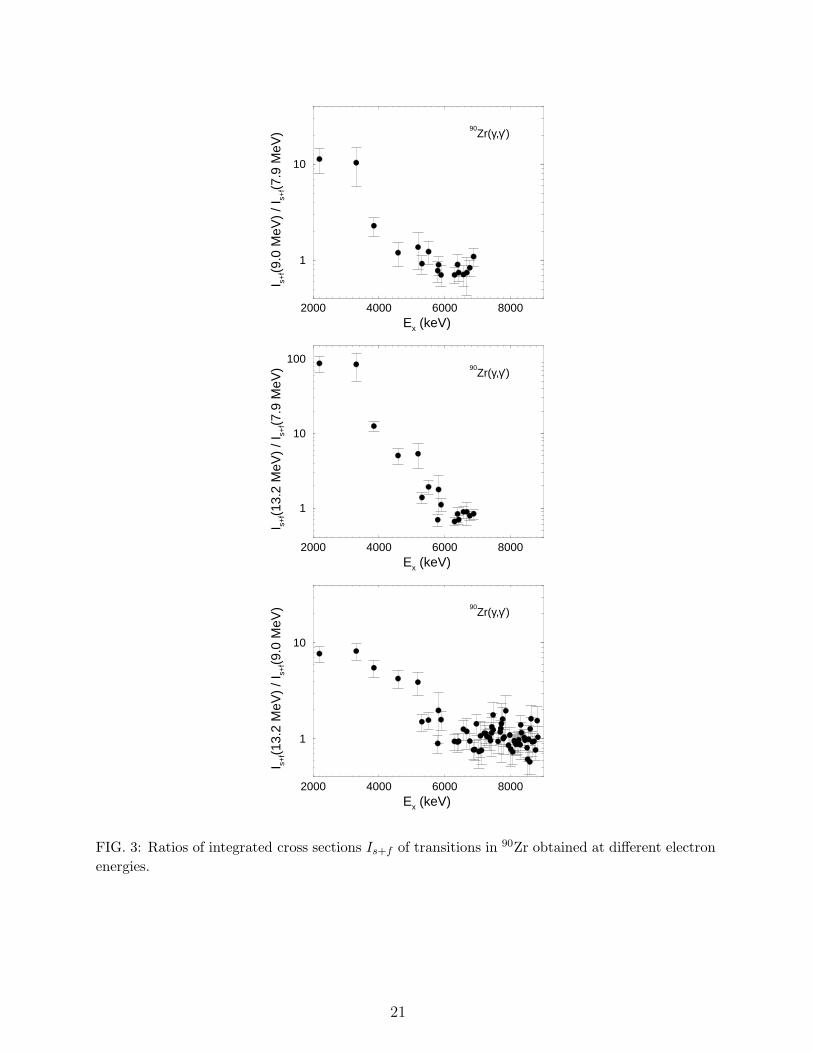
Measurements at various electron energies allow us to estimate the influence of feeding onthe integrated cross sections. Ratios of the quantities Is+f obtained for levels in 90Zr frommeasurements at different electron energies are shown in Fig. 3. The plotted ratios revealthat (i) only levels below Ex ≈ 6 MeV are influenced considerably by feeding and (ii) levelsin the range of Ex ≈ 4 to 6 MeV are mainly fed by levels above Ex ≈ 9 MeV. Transitionsfound in the measurement at Ekin
e = 7.9 MeV are assumed to be ground-state transitions.Transitions additionally observed up to 7.9 MeV in the measurements at 9.0 MeV and 13.2MeV are therefore considered as inelastic transitions from high-lying to low-lying excitedstates. In the same way, transitions in the range from 7 – 9 MeV observed in the measurementat 9.0 MeV are considered as ground-state transitions, whereas transitions in this energy
5
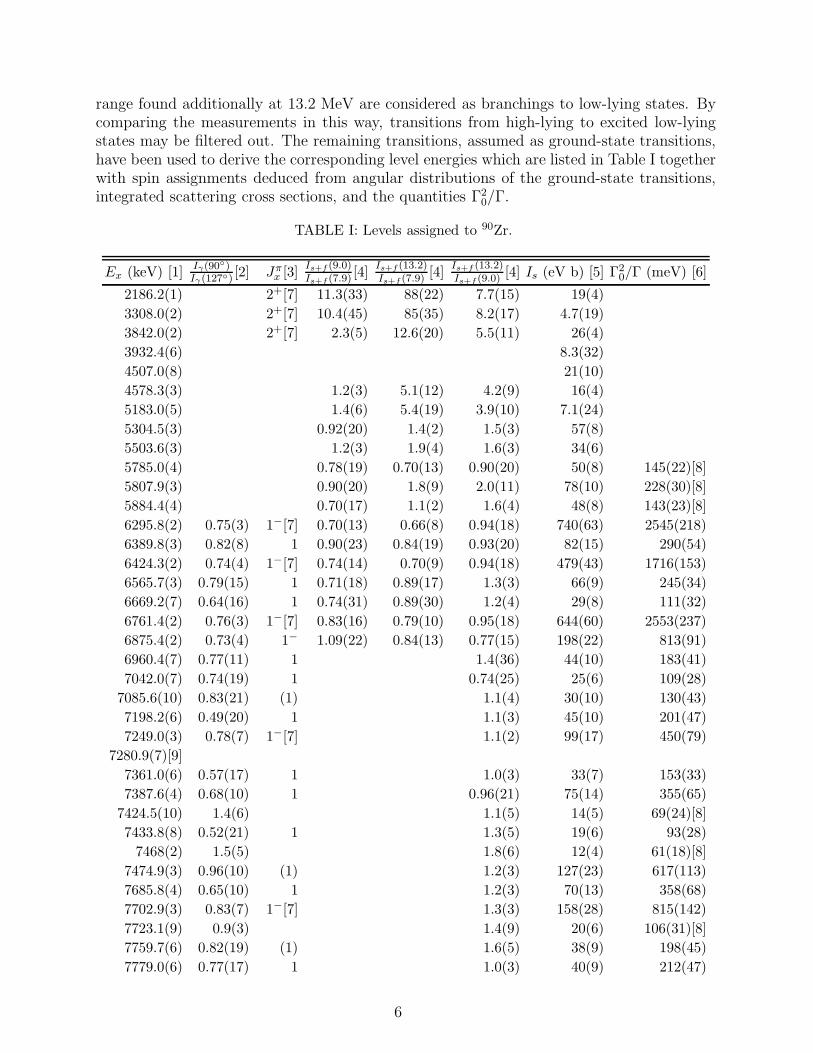
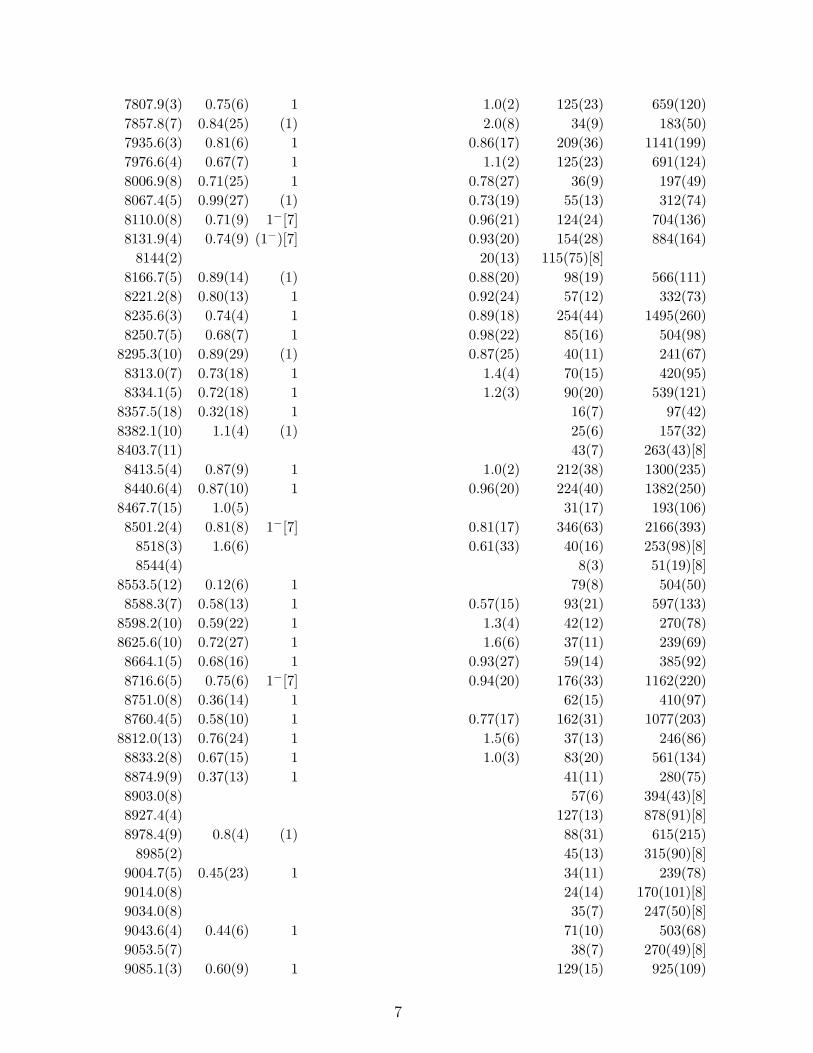
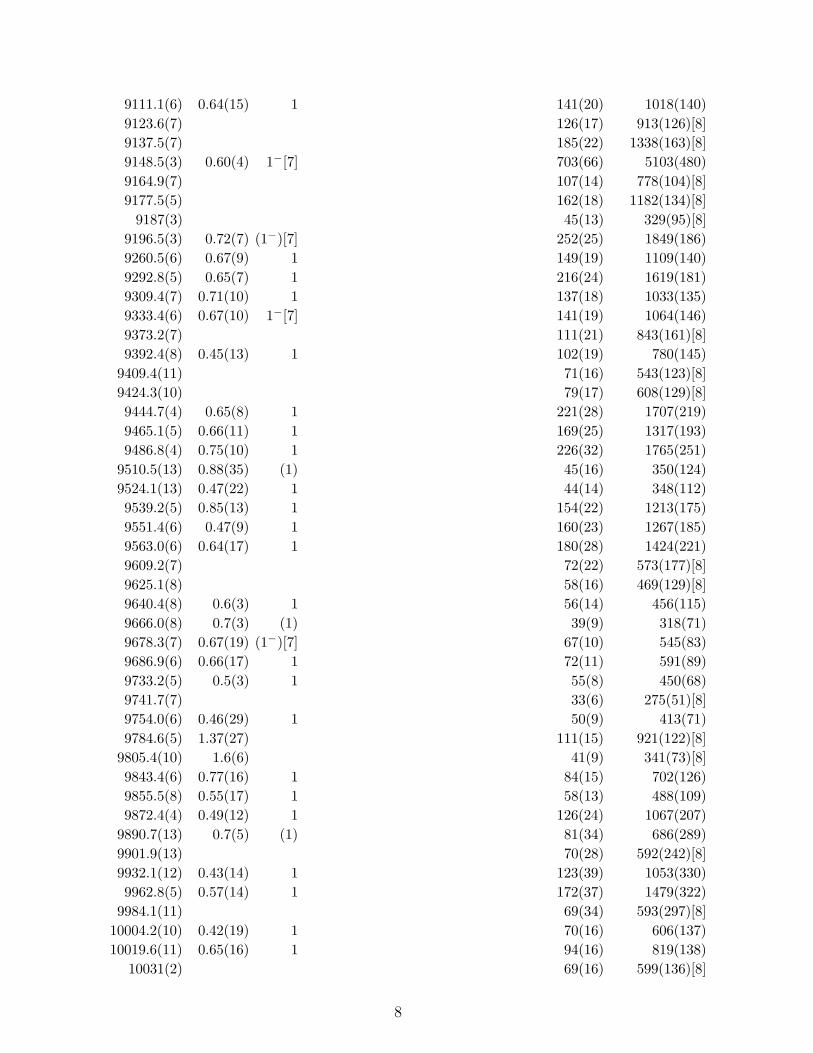
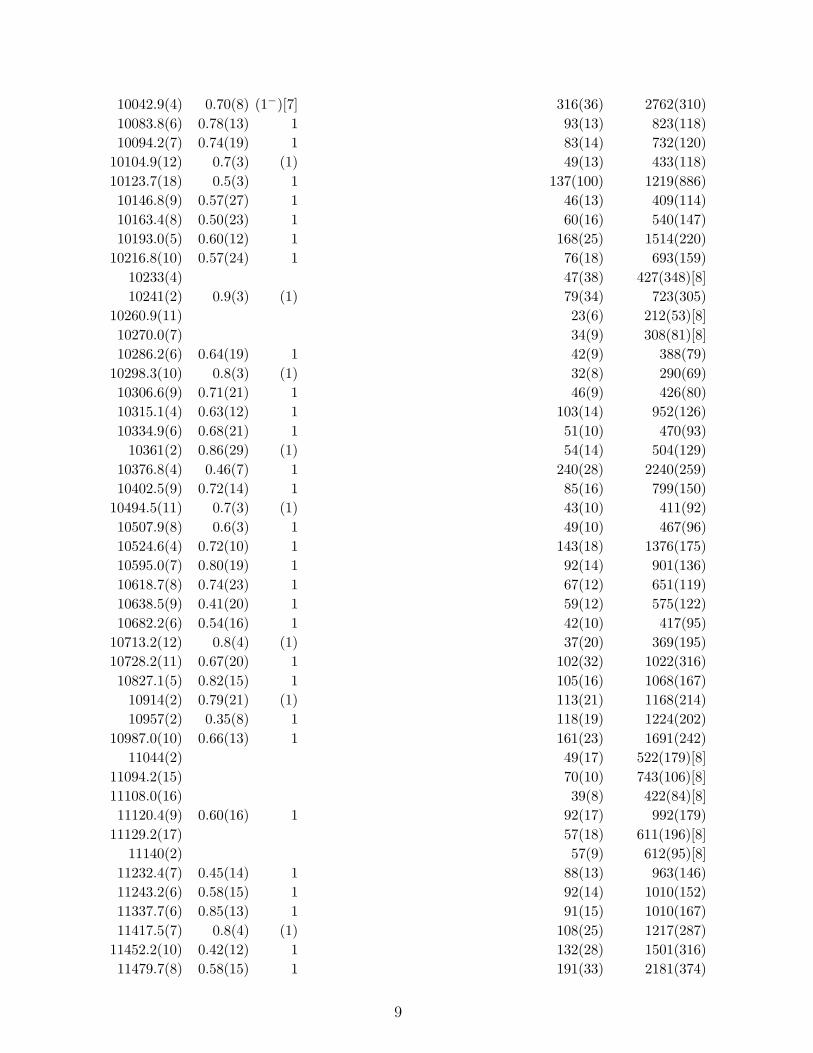
range found additionally at 13.2 MeV are considered as branchings to low-lying states. Bycomparing the measurements in this way, transitions from high-lying to excited low-lyingstates may be filtered out. The remaining transitions, assumed as ground-state transitions,have been used to derive the corresponding level energies which are listed in Table I togetherwith spin assignments deduced from angular distributions of the ground-state transitions,integrated scattering cross sections, and the quantities Γ2
0/Γ.
TABLE I: Levels assigned to 90Zr.
Ex (keV) [1]Iγ(90◦)Iγ(127◦) [2] Jπ
x [3]Is+f (9.0)Is+f (7.9) [4]
Is+f (13.2)Is+f (7.9) [4]
Is+f (13.2)Is+f (9.0) [4] Is (eV b) [5] Γ2
0/Γ (meV) [6]
2186.2(1) 2+[7] 11.3(33) 88(22) 7.7(15) 19(4)
3308.0(2) 2+[7] 10.4(45) 85(35) 8.2(17) 4.7(19)
3842.0(2) 2+[7] 2.3(5) 12.6(20) 5.5(11) 26(4)
3932.4(6) 8.3(32)
4507.0(8) 21(10)
4578.3(3) 1.2(3) 5.1(12) 4.2(9) 16(4)
5183.0(5) 1.4(6) 5.4(19) 3.9(10) 7.1(24)
5304.5(3) 0.92(20) 1.4(2) 1.5(3) 57(8)
5503.6(3) 1.2(3) 1.9(4) 1.6(3) 34(6)
5785.0(4) 0.78(19) 0.70(13) 0.90(20) 50(8) 145(22)[8]
5807.9(3) 0.90(20) 1.8(9) 2.0(11) 78(10) 228(30)[8]
5884.4(4) 0.70(17) 1.1(2) 1.6(4) 48(8) 143(23)[8]
6295.8(2) 0.75(3) 1−[7] 0.70(13) 0.66(8) 0.94(18) 740(63) 2545(218)
6389.8(3) 0.82(8) 1 0.90(23) 0.84(19) 0.93(20) 82(15) 290(54)
6424.3(2) 0.74(4) 1−[7] 0.74(14) 0.70(9) 0.94(18) 479(43) 1716(153)
6565.7(3) 0.79(15) 1 0.71(18) 0.89(17) 1.3(3) 66(9) 245(34)
6669.2(7) 0.64(16) 1 0.74(31) 0.89(30) 1.2(4) 29(8) 111(32)
6761.4(2) 0.76(3) 1−[7] 0.83(16) 0.79(10) 0.95(18) 644(60) 2553(237)
6875.4(2) 0.73(4) 1− 1.09(22) 0.84(13) 0.77(15) 198(22) 813(91)
6960.4(7) 0.77(11) 1 1.4(36) 44(10) 183(41)
7042.0(7) 0.74(19) 1 0.74(25) 25(6) 109(28)
7085.6(10) 0.83(21) (1) 1.1(4) 30(10) 130(43)
7198.2(6) 0.49(20) 1 1.1(3) 45(10) 201(47)
7249.0(3) 0.78(7) 1−[7] 1.1(2) 99(17) 450(79)
7280.9(7)[9]
7361.0(6) 0.57(17) 1 1.0(3) 33(7) 153(33)
7387.6(4) 0.68(10) 1 0.96(21) 75(14) 355(65)
7424.5(10) 1.4(6) 1.1(5) 14(5) 69(24)[8]
7433.8(8) 0.52(21) 1 1.3(5) 19(6) 93(28)
7468(2) 1.5(5) 1.8(6) 12(4) 61(18)[8]
7474.9(3) 0.96(10) (1) 1.2(3) 127(23) 617(113)
7685.8(4) 0.65(10) 1 1.2(3) 70(13) 358(68)
7702.9(3) 0.83(7) 1−[7] 1.3(3) 158(28) 815(142)
7723.1(9) 0.9(3) 1.4(9) 20(6) 106(31)[8]
7759.7(6) 0.82(19) (1) 1.6(5) 38(9) 198(45)
7779.0(6) 0.77(17) 1 1.0(3) 40(9) 212(47)
6
7807.9(3) 0.75(6) 1 1.0(2) 125(23) 659(120)
7857.8(7) 0.84(25) (1) 2.0(8) 34(9) 183(50)
7935.6(3) 0.81(6) 1 0.86(17) 209(36) 1141(199)
7976.6(4) 0.67(7) 1 1.1(2) 125(23) 691(124)
8006.9(8) 0.71(25) 1 0.78(27) 36(9) 197(49)
8067.4(5) 0.99(27) (1) 0.73(19) 55(13) 312(74)
8110.0(8) 0.71(9) 1−[7] 0.96(21) 124(24) 704(136)
8131.9(4) 0.74(9) (1−)[7] 0.93(20) 154(28) 884(164)
8144(2) 20(13) 115(75)[8]
8166.7(5) 0.89(14) (1) 0.88(20) 98(19) 566(111)
8221.2(8) 0.80(13) 1 0.92(24) 57(12) 332(73)
8235.6(3) 0.74(4) 1 0.89(18) 254(44) 1495(260)
8250.7(5) 0.68(7) 1 0.98(22) 85(16) 504(98)
8295.3(10) 0.89(29) (1) 0.87(25) 40(11) 241(67)
8313.0(7) 0.73(18) 1 1.4(4) 70(15) 420(95)
8334.1(5) 0.72(18) 1 1.2(3) 90(20) 539(121)
8357.5(18) 0.32(18) 1 16(7) 97(42)
8382.1(10) 1.1(4) (1) 25(6) 157(32)
8403.7(11) 43(7) 263(43)[8]
8413.5(4) 0.87(9) 1 1.0(2) 212(38) 1300(235)
8440.6(4) 0.87(10) 1 0.96(20) 224(40) 1382(250)
8467.7(15) 1.0(5) 31(17) 193(106)
8501.2(4) 0.81(8) 1−[7] 0.81(17) 346(63) 2166(393)
8518(3) 1.6(6) 0.61(33) 40(16) 253(98)[8]
8544(4) 8(3) 51(19)[8]
8553.5(12) 0.12(6) 1 79(8) 504(50)
8588.3(7) 0.58(13) 1 0.57(15) 93(21) 597(133)
8598.2(10) 0.59(22) 1 1.3(4) 42(12) 270(78)
8625.6(10) 0.72(27) 1 1.6(6) 37(11) 239(69)
8664.1(5) 0.68(16) 1 0.93(27) 59(14) 385(92)
8716.6(5) 0.75(6) 1−[7] 0.94(20) 176(33) 1162(220)
8751.0(8) 0.36(14) 1 62(15) 410(97)
8760.4(5) 0.58(10) 1 0.77(17) 162(31) 1077(203)
8812.0(13) 0.76(24) 1 1.5(6) 37(13) 246(86)
8833.2(8) 0.67(15) 1 1.0(3) 83(20) 561(134)
8874.9(9) 0.37(13) 1 41(11) 280(75)
8903.0(8) 57(6) 394(43)[8]
8927.4(4) 127(13) 878(91)[8]
8978.4(9) 0.8(4) (1) 88(31) 615(215)
8985(2) 45(13) 315(90)[8]
9004.7(5) 0.45(23) 1 34(11) 239(78)
9014.0(8) 24(14) 170(101)[8]
9034.0(8) 35(7) 247(50)[8]
9043.6(4) 0.44(6) 1 71(10) 503(68)
9053.5(7) 38(7) 270(49)[8]
9085.1(3) 0.60(9) 1 129(15) 925(109)
7
9111.1(6) 0.64(15) 1 141(20) 1018(140)
9123.6(7) 126(17) 913(126)[8]
9137.5(7) 185(22) 1338(163)[8]
9148.5(3) 0.60(4) 1−[7] 703(66) 5103(480)
9164.9(7) 107(14) 778(104)[8]
9177.5(5) 162(18) 1182(134)[8]
9187(3) 45(13) 329(95)[8]
9196.5(3) 0.72(7) (1−)[7] 252(25) 1849(186)
9260.5(6) 0.67(9) 1 149(19) 1109(140)
9292.8(5) 0.65(7) 1 216(24) 1619(181)
9309.4(7) 0.71(10) 1 137(18) 1033(135)
9333.4(6) 0.67(10) 1−[7] 141(19) 1064(146)
9373.2(7) 111(21) 843(161)[8]
9392.4(8) 0.45(13) 1 102(19) 780(145)
9409.4(11) 71(16) 543(123)[8]
9424.3(10) 79(17) 608(129)[8]
9444.7(4) 0.65(8) 1 221(28) 1707(219)
9465.1(5) 0.66(11) 1 169(25) 1317(193)
9486.8(4) 0.75(10) 1 226(32) 1765(251)
9510.5(13) 0.88(35) (1) 45(16) 350(124)
9524.1(13) 0.47(22) 1 44(14) 348(112)
9539.2(5) 0.85(13) 1 154(22) 1213(175)
9551.4(6) 0.47(9) 1 160(23) 1267(185)
9563.0(6) 0.64(17) 1 180(28) 1424(221)
9609.2(7) 72(22) 573(177)[8]
9625.1(8) 58(16) 469(129)[8]
9640.4(8) 0.6(3) 1 56(14) 456(115)
9666.0(8) 0.7(3) (1) 39(9) 318(71)
9678.3(7) 0.67(19) (1−)[7] 67(10) 545(83)
9686.9(6) 0.66(17) 1 72(11) 591(89)
9733.2(5) 0.5(3) 1 55(8) 450(68)
9741.7(7) 33(6) 275(51)[8]
9754.0(6) 0.46(29) 1 50(9) 413(71)
9784.6(5) 1.37(27) 111(15) 921(122)[8]
9805.4(10) 1.6(6) 41(9) 341(73)[8]
9843.4(6) 0.77(16) 1 84(15) 702(126)
9855.5(8) 0.55(17) 1 58(13) 488(109)
9872.4(4) 0.49(12) 1 126(24) 1067(207)
9890.7(13) 0.7(5) (1) 81(34) 686(289)
9901.9(13) 70(28) 592(242)[8]
9932.1(12) 0.43(14) 1 123(39) 1053(330)
9962.8(5) 0.57(14) 1 172(37) 1479(322)
9984.1(11) 69(34) 593(297)[8]
10004.2(10) 0.42(19) 1 70(16) 606(137)
10019.6(11) 0.65(16) 1 94(16) 819(138)
10031(2) 69(16) 599(136)[8]
8
10042.9(4) 0.70(8) (1−)[7] 316(36) 2762(310)
10083.8(6) 0.78(13) 1 93(13) 823(118)
10094.2(7) 0.74(19) 1 83(14) 732(120)
10104.9(12) 0.7(3) (1) 49(13) 433(118)
10123.7(18) 0.5(3) 1 137(100) 1219(886)
10146.8(9) 0.57(27) 1 46(13) 409(114)
10163.4(8) 0.50(23) 1 60(16) 540(147)
10193.0(5) 0.60(12) 1 168(25) 1514(220)
10216.8(10) 0.57(24) 1 76(18) 693(159)
10233(4) 47(38) 427(348)[8]
10241(2) 0.9(3) (1) 79(34) 723(305)
10260.9(11) 23(6) 212(53)[8]
10270.0(7) 34(9) 308(81)[8]
10286.2(6) 0.64(19) 1 42(9) 388(79)
10298.3(10) 0.8(3) (1) 32(8) 290(69)
10306.6(9) 0.71(21) 1 46(9) 426(80)
10315.1(4) 0.63(12) 1 103(14) 952(126)
10334.9(6) 0.68(21) 1 51(10) 470(93)
10361(2) 0.86(29) (1) 54(14) 504(129)
10376.8(4) 0.46(7) 1 240(28) 2240(259)
10402.5(9) 0.72(14) 1 85(16) 799(150)
10494.5(11) 0.7(3) (1) 43(10) 411(92)
10507.9(8) 0.6(3) 1 49(10) 467(96)
10524.6(4) 0.72(10) 1 143(18) 1376(175)
10595.0(7) 0.80(19) 1 92(14) 901(136)
10618.7(8) 0.74(23) 1 67(12) 651(119)
10638.5(9) 0.41(20) 1 59(12) 575(122)
10682.2(6) 0.54(16) 1 42(10) 417(95)
10713.2(12) 0.8(4) (1) 37(20) 369(195)
10728.2(11) 0.67(20) 1 102(32) 1022(316)
10827.1(5) 0.82(15) 1 105(16) 1068(167)
10914(2) 0.79(21) (1) 113(21) 1168(214)
10957(2) 0.35(8) 1 118(19) 1224(202)
10987.0(10) 0.66(13) 1 161(23) 1691(242)
11044(2) 49(17) 522(179)[8]
11094.2(15) 70(10) 743(106)[8]
11108.0(16) 39(8) 422(84)[8]
11120.4(9) 0.60(16) 1 92(17) 992(179)
11129.2(17) 57(18) 611(196)[8]
11140(2) 57(9) 612(95)[8]
11232.4(7) 0.45(14) 1 88(13) 963(146)
11243.2(6) 0.58(15) 1 92(14) 1010(152)
11337.7(6) 0.85(13) 1 91(15) 1010(167)
11417.5(7) 0.8(4) (1) 108(25) 1217(287)
11452.2(10) 0.42(12) 1 132(28) 1501(316)
11479.7(8) 0.58(15) 1 191(33) 2181(374)
9
11501(3) 66(37) 756(425)[8]
11510(7) 33(15) 382(172)[8]
11531(2) 0.42(25) 1 74(30) 848(346)
11627.9(9) 44(16) 518(182)[8]
11651.5(8) 1.0(3) (1) 48(16) 564(185)
11777.4(10) 0.46(22) 1 124(40) 1489(479)
11788(3) 0.44(29) 1 73(36) 885(440)
11963.3(18) 0.8(3) (1) 68(14) 845(179)
11984(2) 0.57(18) 1 57(13) 715(167)
12020.6(8) 0.67(14) 1 155(21) 1942(260)
12067.8(9) 0.63(17) 1 124(19) 1570(237)
12208.3(12) 0.40(15) 1 72(16) 929(214)
12243.6(14) 0.57(19) 1 62(15) 799(188)
12496.3(18) 87(18) 1181(244)[8]
12880.3(10) 11(3) 164(46)[8]
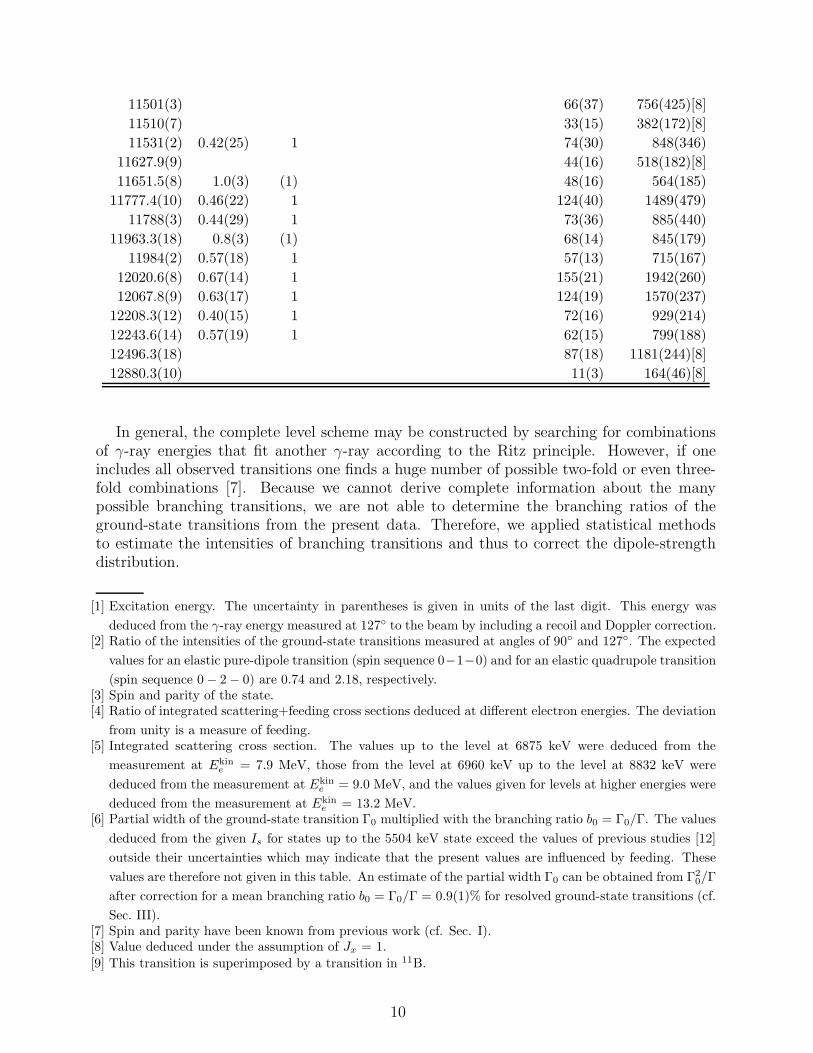
In general, the complete level scheme may be constructed by searching for combinationsof γ-ray energies that fit another γ-ray according to the Ritz principle. However, if oneincludes all observed transitions one finds a huge number of possible two-fold or even three-fold combinations [7]. Because we cannot derive complete information about the manypossible branching transitions, we are not able to determine the branching ratios of theground-state transitions from the present data. Therefore, we applied statistical methodsto estimate the intensities of branching transitions and thus to correct the dipole-strengthdistribution.
[1] Excitation energy. The uncertainty in parentheses is given in units of the last digit. This energy was
deduced from the γ-ray energy measured at 127◦ to the beam by including a recoil and Doppler correction.[2] Ratio of the intensities of the ground-state transitions measured at angles of 90◦ and 127◦. The expected
values for an elastic pure-dipole transition (spin sequence 0−1−0) and for an elastic quadrupole transition
(spin sequence 0 − 2 − 0) are 0.74 and 2.18, respectively.[3] Spin and parity of the state.[4] Ratio of integrated scattering+feeding cross sections deduced at different electron energies. The deviation
from unity is a measure of feeding.[5] Integrated scattering cross section. The values up to the level at 6875 keV were deduced from the
measurement at Ekine
= 7.9 MeV, those from the level at 6960 keV up to the level at 8832 keV were
deduced from the measurement at Ekine
= 9.0 MeV, and the values given for levels at higher energies were
deduced from the measurement at Ekine
= 13.2 MeV.[6] Partial width of the ground-state transition Γ0 multiplied with the branching ratio b0 = Γ0/Γ. The values
deduced from the given Is for states up to the 5504 keV state exceed the values of previous studies [12]
outside their uncertainties which may indicate that the present values are influenced by feeding. These
values are therefore not given in this table. An estimate of the partial width Γ0 can be obtained from Γ20/Γ
after correction for a mean branching ratio b0 = Γ0/Γ = 0.9(1)% for resolved ground-state transitions (cf.
Sec. III).[7] Spin and parity have been known from previous work (cf. Sec. I).[8] Value deduced under the assumption of Jx = 1.
[9] This transition is superimposed by a transition in 11B.
10
III. DETERMINATION OF THE DIPOLE-STRENGTH DISTRIBUTION
In the following we describe the statistical methods used to estimate the intensity distri-bution of branching transitions and the branching ratios of the ground-state transitions.
By using simulations as described in Sec. II B we corrected the spectrum including thetwo detectors at 127◦, measured during the irradiation of the 90Zr target at Ekin
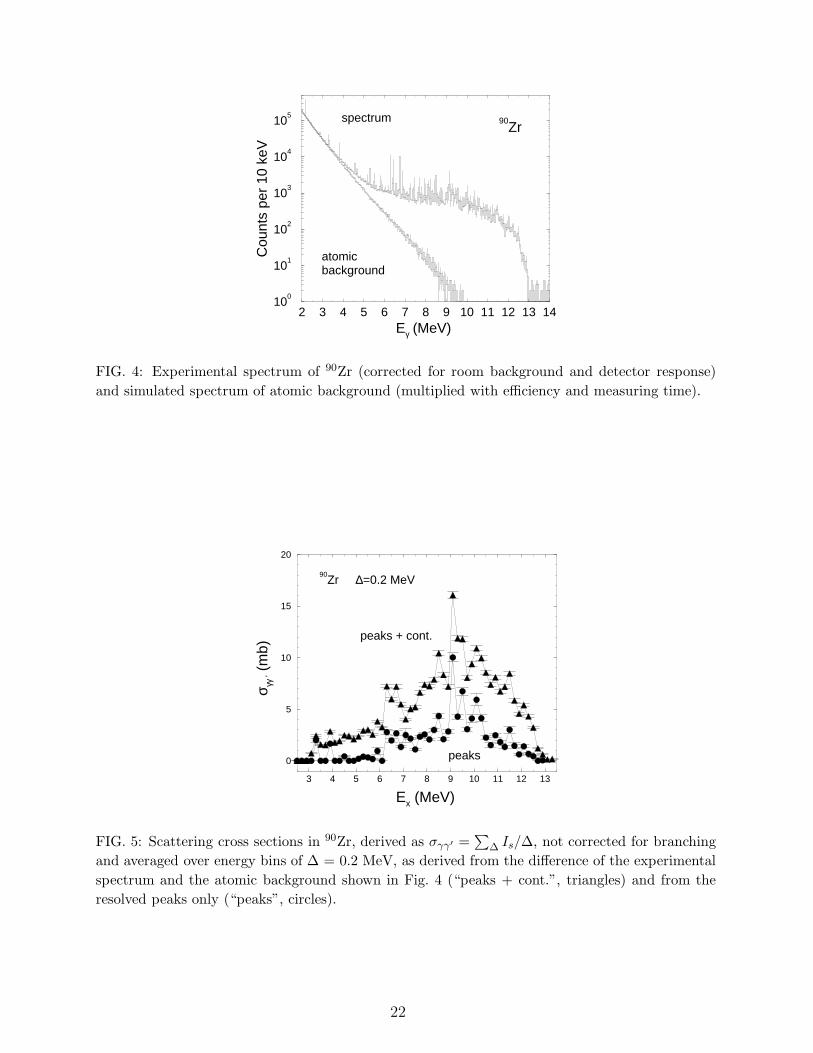
e = 13.2MeV. In a first step spectra of the ambient background adjusted to the intensities of the1460.5 keV transition (decay of 40K) and 2614.9 keV transition (decay of 208Tl) in the in-beam spectrum were subtracted from the measured spectrum. It turned out that transitionsfollowing (n, γ) reactions in the HPGe detectors and in surrounding materials are negligiblysmall and thus, did not require correction. To correct the spectrum for detector response,spectra of monoenergetic γ rays were calculated in steps of 10 keV by using GEANT3.Starting from the high-energy end of the experimental spectrum, the simulated spectra weresubtracted sequentially. The resulting spectrum including the two detectors at 127◦ is shownin Fig. 4.
The background produced by atomic processes in the 90Zr target was obtained from aGEANT3 simulation using the absolute photon flux deduced from the intensities of thetransitions in 11B (cf. Fig. 2). The corresponding background spectrum multiplied withthe efficiency curve and with the measuring time is also depicted in Fig. 4. As can be seenin Fig. 4 the continuum in the spectrum of photons scattered from 90Zr is clearly higherthan the background by atomic scattering. This continuum is formed by a large number ofnon-resolvable transitions with small intensities which are a consequence of the increasingnuclear level density at high energy and of Porter-Thomas fluctuations of the decay widths[19] in connection with the finite detector resolution (e.g. ∆E ≈ 7 keV at Eγ ≈ 9 MeV).
The relevant intensity of the photons resonantly scattered from 90Zr is obtained from asubtraction of the atomic background from the response-corrected experimental spectrum.The remaining intensity distribution includes the intensity contained in the resolved peaks aswell as the intensity of the “nuclear” continuum. The scattering cross sections σγγ′ derivedfrom this intensity distribution for energy bins of 0.2 MeV from the full intensity distributionare shown in Fig. 5. These values are compared with those given in Table I for resolvedtransitions in 90Zr. One sees that the two curves have similar structures caused by theprominent peaks. However, the curve including also the continuum part of the spectrumcontains altogether a strength that is by a factor of about 2.7 greater than the strength ofthe resolved peaks only. The full intensity distribution (resolved peaks and continuum) andthe corresponding scattering cross sections shown in Fig. 5 contain ground-state transitionsand, in addition, branching transitions to lower-lying excited states (inelastic transitions) aswell as transitions from those states to the ground state (cascade transitions). The differenttypes of transitions cannot be clearly distinguished. However, for the determination of thephotoabsorption cross section and the partial widths Γ0 the intensities of the ground-statetransitions are needed. Therefore, contributions of inelastic and cascade transitions haveto be subtracted from the spectra. We corrected the intensity distributions by simulatingγ-ray cascades [20] from the levels with J = 0, 1, 2 in the whole energy range analogouslyto the strategy of the Monte-Carlo code DICEBOX [21]. In these simulations, 1000 nuclearrealizations starting from the ground state were created with level densities derived fromexperiments [22]. We applied the statistical methods also for the low-energy part of thelevel scheme instead of using experimentally known low-lying levels in 90Zr because thiswould require the knowledge of the partial decay widths of all transitions populating these
11
fixed levels. Fluctuations of the nearest-neighbor-spacings were taken into account accordingto the Wigner distribution (see, e.g., Ref. [23]). The partial widths of the transitions tolow-lying levels were assigned using a priori known strength functions for E1, M1, and E2transitions. Fluctuations of the partial widths were treated the applying Porter-Thomasdistribution [19].
In the calculations, the recently published parameters for the Back-Shifted Fermi-Gas(BSFG) model obtained from fits to experimental level densities [22], a = 8.95(41) MeV−1
and E1 = 1.97(30) MeV, were used. In the individual nuclear realizations, the values of aand E1 were varied within their uncertainties. As usual in the BSFG model, we assumedequal level densities for states with positive and negative parities of the same spin [22]. Thisassumption has recently been justified by the good agreement of level densities predictedby the BSFG model with experimental level densities of 1+ states in the energy rangefrom 5 to 10 MeV obtained from the 90Zr(3He,t)90Nb reaction [24] and with experimentallevel densities of 2+ and 2− states in 90Zr studied in the 90Zr(e, e′) and 90Zr(p, p′) reactions[25]. The extended analysis of the 90Zr(3He,t)90Nb reaction in Ref. [25] indicates howeverfluctuations of the level density of 1+ states in 90Nb around the predictions of the BSFGmodel.
For the E1, M1, and E2 photon strength functions Lorentz parametrizations [26] wereused. The parameters of the Lorentz curve for the E1 strength were taken from a fit to(γ, n) data [27] and are consistent with the Thomas-Reiche-Kuhn sum rule (TRK) π
2σ0Γ =
60NZ/A MeV mb [28]. The parameters for the M1 and E2 strengths were taken from globalparametrizations of M1 spin-flip resonances and E2 isoscalar resonances, respectively [29].
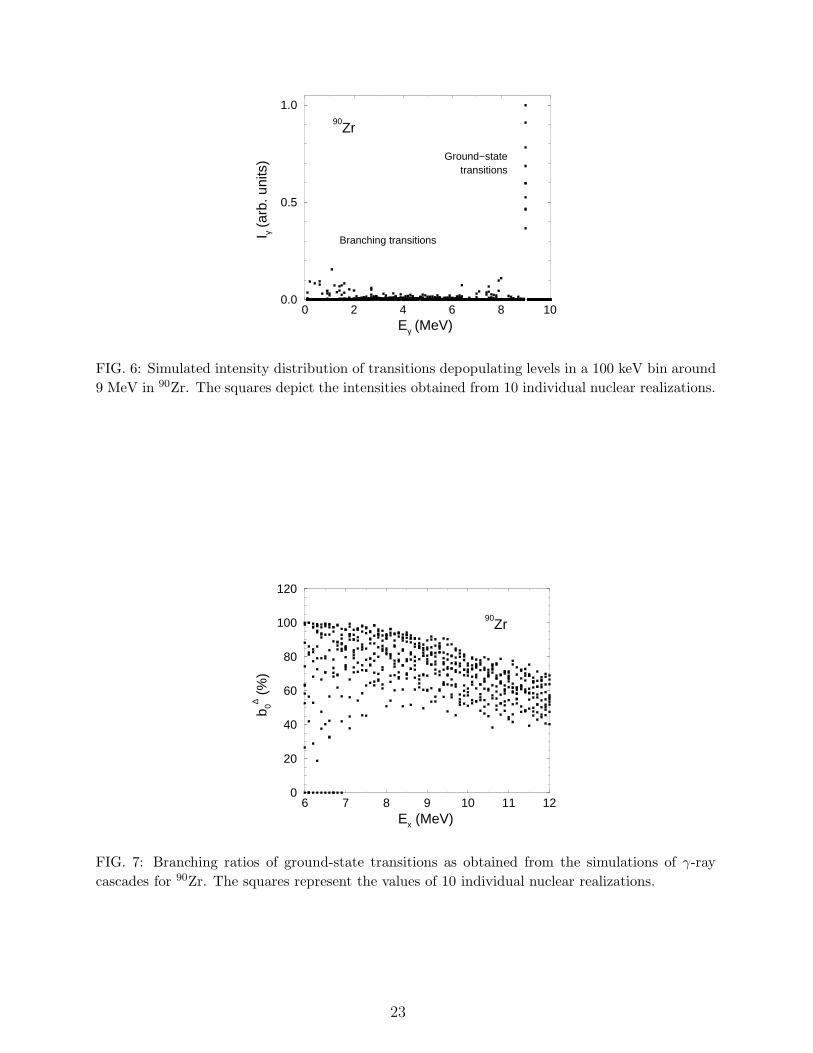
Spectra of γ-ray cascades were generated for groups of levels in 100 keV bins in eachof the 1000 nuclear realizations. For illustration, the distributions resulting from 10 indi-vidual nuclear realizations populating levels in a 100 keV bin around 9 MeV are shown inFig. 6, which reflect the influence of fluctuations of level energies and level widths. Becausein the nuclear realizations the levels were created randomly starting from the ground stateinstead of starting with the known first excited state at 2.2 MeV, the distribution of thebranching transitions continues to the energy bin of the ground-state transitions. Thesespectra resemble qualitatively the ones measured in an experiment on 90Zr using taggedphotons [4]. Starting from the high-energy end of the experimental spectrum, which con-tains ground-state transitions only, the simulated intensities of the ground-state transitionswere normalized to the experimental ones in the considered bin and the intensity distribu-tion of the branching transitions was subtracted from the experimental spectrum. Applyingthis procedure step-by-step for each energy bin moving toward the low-energy end of thespectrum one obtains the intensity distribution of the ground-state transitions. Simultane-ously, the branching ratios b∆0 of the ground-state transitions are deduced for each energybin ∆. In an individual nuclear realization, the branching ratio b∆0 is calculated as the ra-tio of the sum of the intensities of the ground-state transitions from all levels in ∆ to thetotal intensity of all transitions depopulating those levels to any low-lying levels includingthe ground state [7, 8]. By dividing the summed intensities in a bin of the experimentalintensity distribution of the ground-state transitions by the corresponding branching ratiowe obtain the absorption cross section for a bin as σ∆
γ = σ∆γγ/b
∆0 . Finally, the absorption
cross sections of each bin were obtained by averaging over the values of the 1000 nuclearrealizations. For the uncertainty of the absorption cross section a 1σ deviation from themean has been taken.
To get an impression about the branching ratios, the individual values of 10 nuclear
12
realizations are shown in Fig. 7. The mean branching ratio of the 1000 realizatios decreasesfrom about 80% for low-lying states, where only few possibilities for transitions to lower-lying states exist, to about 65% at the neutron-separation energy. Toward low energy theuncertainty of b∆0 increases due to level-spacing fluctuations and the decreasing level density.The large fluctuations below about 6 MeV make these values useless. Note that the meanbranching ratio is not representative for transitions with large intensities like the resolvedtransitions given in Table I. It turns out from the simulations that the branching ratios oftransitions with partial widths Γ0 like the ones given in Table I are in the order of b0 ≈ 85%to 99% (cf. also Ref. [7]).
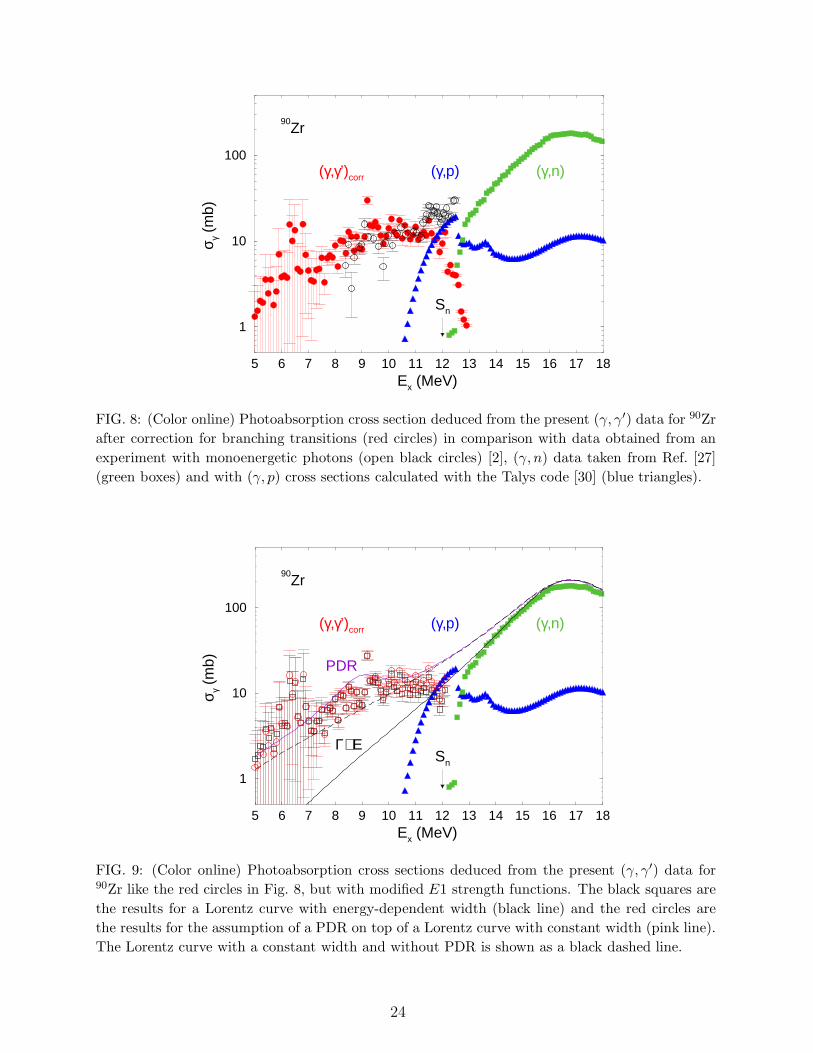
The photoabsorption cross sections obtained for 90Zr are compared with the data of aprevious experiment with monoenergetic photons in the energy range from 8.4 to 12.5 MeV[1] in Fig. 8. The data of Ref. [1] contain corrections in form of additional constant partialwidths for branching and for proton emission, i.e. for the (γ, p) channel. Cross sectionsobtained in (γ, n) experiments [27] and cross sections calculated for the (γ, p) reaction usingthe Talys code [30] with the Lorentz model for the E1 strength function [26] are also shownin Fig. 8.
To test the influence of the E1 strength function on the results of the simulation and tocheck the consistency between input strength function and deduced photoabsorption crosssection we performed cascade simulations with modified E1 strength functions. In one case,we applied a Lorentz curve with an energy-dependent width Γ(E) ∼ E. In another casewe assumed a PDR on top of the Lorentz curve with constant width. The PDR had aBreit-Wigner shape with its maximum at 9 MeV and a width of 2 MeV. The cross sectionof the PDR was chosen 2.2% of the TRK (see discussion in Sec. IVB). Cross sectionscorresponding to these input strength functions and the obtained absorption cross sectionsare shown in Fig. 9. One sees that the resulting absorption cross sections differ only slightlyfrom each other and also from the ones obtained by using the Lorentz curve with constantwidth (cf. Fig. 8) and overlap within their uncertainties. This shows that the resulting crosssections are not very sensitive to modifications of the input strength functions. However, thecomparison of the resulting cross sections with the input strength functions shows that thereis consistency in the case of the Lorentz curve with a PDR in addition, whereas there is a largediscrepancy in the case of the Lorentz curve with energy-dependent width. Summarizing,the Lorentz curve with a constant width and this curve with a PDR in addition deliverconsistency between input and output strength functions and similar results.
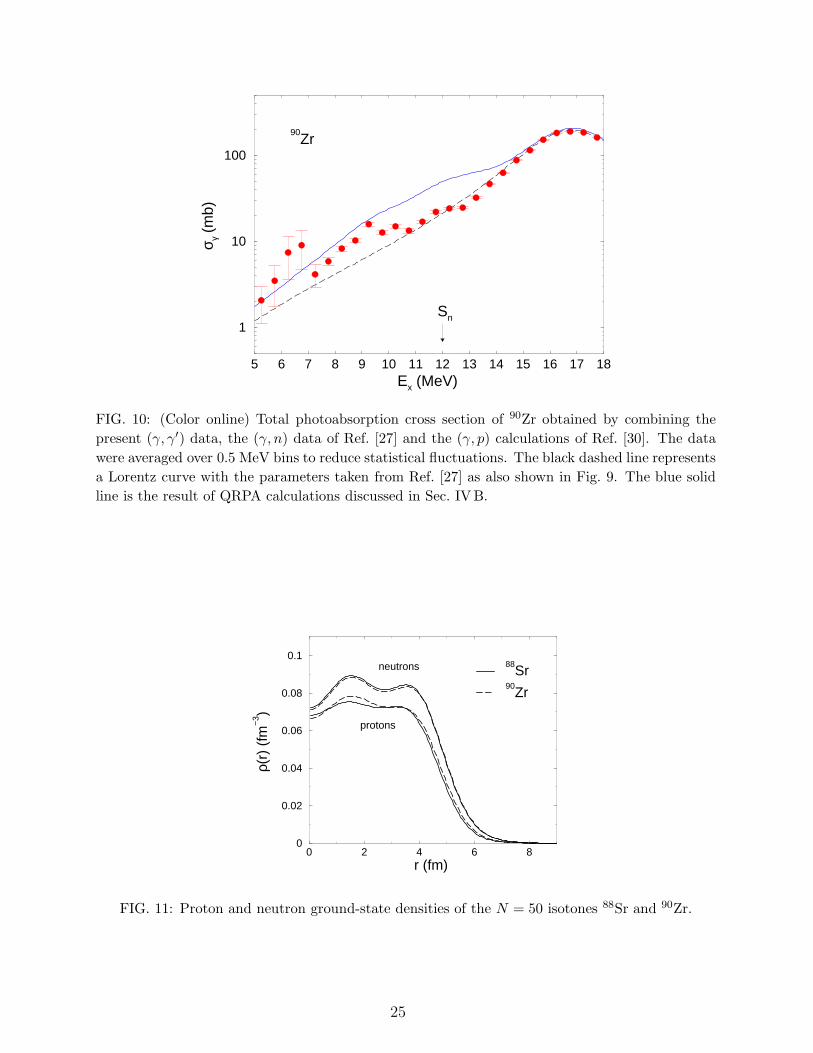
The total photoabsorption cross section has been deduced by combining the present(γ, γ′) data with the (γ, n) data of Ref. [27] and calculated (γ, p) cross sections [30]. Thistotal cross section is compared with the Lorentz curve described above, which is currentlyused as a standard strength function for the calculation of reaction data [29], in Fig. 10. Itcan be seen that the experimental cross section includes extra strength with respect to theapproximation of the low-energy tail of the GDR by a Lorentz curve in the energy rangefrom 6 to 11 MeV and is in better agreement with a strength function including a PDR ontop of the Lorentz curve (cf. Fig. 9). To investigate the nature of this extra strength wehave performed model calculations which are discussed in the following section.
13
IV. QUASIPARTICLE-PHONON-MODEL CALCULATIONS FOR THE N = 50
ISOTONES 88Sr AND 90Zr
The experimental data on the dipole response of 90Zr discussed in the present work reveala strong enhancement of the photoabsorption cross section (see Fig. 10) in the energy rangeEx = 6 – 11 MeV and a considerable deviation of its shape from the Lorentz-like strengthfunction used to adjust the GDR. Similar dipole resonance structures have been detectedalso in our recent study of 88Sr [7]. In the following we investigate the nature of the dipolestrength in the N = 50 isotones 88Sr and 90Zr in the framework of the extended quasiparticle-phonon model (QPM) [31, 32]. The approach is based on a Hartree-Fock-Bogoljubov (HFB)description of the ground state [31] by using a phenomenological energy-density functional(EDF) [32]. The excited states are calculated within the QPM [33].
A. The QPM model
The model hamiltonian is given by:
H = HMF +HphM +Hph
SM +HppM (3)
and resembles in structure that of the traditional QPM model [33] but in detail differs inthe physical content in important aspects as discussed in Ref. [31, 32]. The HFB termHMF = Hsp + Hpair contains two parts. Hsp describes the motion of protons and neutronsin a static, spherically-symmetric mean field and Hpair accounts for the monopole pairingbetween isospin-identical particles with phenomenologically adjusted coupling constants,fitted to data [34]. The mean-field hamiltonian compromises microscopic HFB effects [32, 35]and phenomenological aspects like experimental separation energies and, when available, alsocharge and mass radii. For numerical convenience the mean-field potential is parametrizedin terms of a superpositions of Wood-Saxon (WS) potentials with adjustable parameters[32].
The remaining three terms present the residual interaction Hres = HphM + Hph
SM + HppM .
As typical for the QPM, we use separable multipole-multipole HphM and spin-multipole Hph
SM
interactions both of isoscalar and isovector type in the particle-hole channel and a multipole-multipole pairing Hpp
M in the particle-particle channel. The isoscalar and isovector couplingconstants are obtained by a fit to energies and transition strengths of low-lying vibrationalstates and high-lying GDRs [32, 36].
The excited nuclear states are described by quasiparticle-random-phase-approximation(QRPA) phonons. They are defined as a linear combination of two-quasiparticle creationand annihilation operators:
Q+λµi =
1
2
∑
jj′
(ψλi
jj′A+λµ(jj′) − ϕλi
jj′Aλµ(jj′)), (4)
where j ≡ (nljmτ) is a single-particle proton or neutron state, A+λµ and Aλµ are time-forward
and time-backward operators, coupling proton and neutron two-quasiparticle creation orannihilation operators to a total angular momentum λ with projection µ by means of theClebsch-Gordan coefficients Cλµ
jmj′m′ = 〈jmj′m′|λµ〉. The time reversed operator is defined
as Aλµ = (−)λ−µAλ−µ.
14
We take into account the intrinsic fermionic structure of the phonons by the commutationrelations:
[Qλµi, Q+λ′µ′i′ ] =
δλ,λ′δµ,µ′δi,i′
2
∑
jj′
[ψλijj′ψ
λi′
jj′ − ϕλijj′ϕ
λi′
jj′]
−∑
jj′j2mm′m2
α+jmαj′m′ ×
{ψλi
j′j2ψλ′i′
jj2Cλµ
j′m′j2m2Cλ′µ′
jmj2m2
−(−)λ+λ′+µ+µ′
ϕλijj2ϕλ′i′
j′j2Cλ−µ
jmj2m2Cλ′−µ′
j′m′j2m2.}
(5)
The QRPA phonons obey the equation of motion
[H,Q+
i
]= EiQ
+i , (6)
which solves the eigenvalue problem, i.e. it gives the excitation energies Ei and the time-forward and time-backward amplitudes [33] ψλi
j1j2and ϕλi
j1j2, respectively.
In terms of the QRPA phonons the model hamiltonian can be expressed as
H = Hph +Hqph =∑
λµi
ωλiQ+λµiQλµi (7)
+1
2
∑
λ1λ2λ3i1i2i3µ1µ2µ3
Cλ3−µ3
λ1µ1λ2µ2Uλ2i2
λ1i1(λ3i3)
[Q+λ1µ1i1
Q+λ2µ2i2
Qλ3−µ3i3+ h.c.].
The first part in the Eq. (7) refers to the harmonic part of nuclear vibrations, while thesecond one is accounting for the interaction between quasiparticles and phonons. The latterallows us to go beyond the ideal harmonic picture by including effects due to the non-bosonicfeatures of the nuclear excitations.
The model hamiltonian is diagonalized assuming a spherical 0+ ground state which leadsto an orthonormal set of wave functions with good total angular momentum JM . For even-even nuclei we extend the approach to anharmonic effects by considering wave functionsincluding a mixture of one-, two-, and three-phonon components [37]:
Ψν(JM) =
{∑
i
Ri(Jν)Q+JMi (8)
+∑
λ1i1λ2i2
P λ1i1λ2i2
(Jν)[Q+
λ1µ1i1×Q+
λ2µ2i2
]JM
+∑
λ1i1λ2i2λ3i3I
T λ1i1λ2i2Iλ3i3
(Jν)[[Q+
λ1µ1i1⊗Q+
λ2µ2i2
]IK
⊗Q+λ3µ3i3
]
JM
}Ψ0,
where ν labels the number of the excited states. The energies and the phonon-mixingamplitudes R, P , and T are determined by solving the extended multi-phonon equations ofmotions.
15
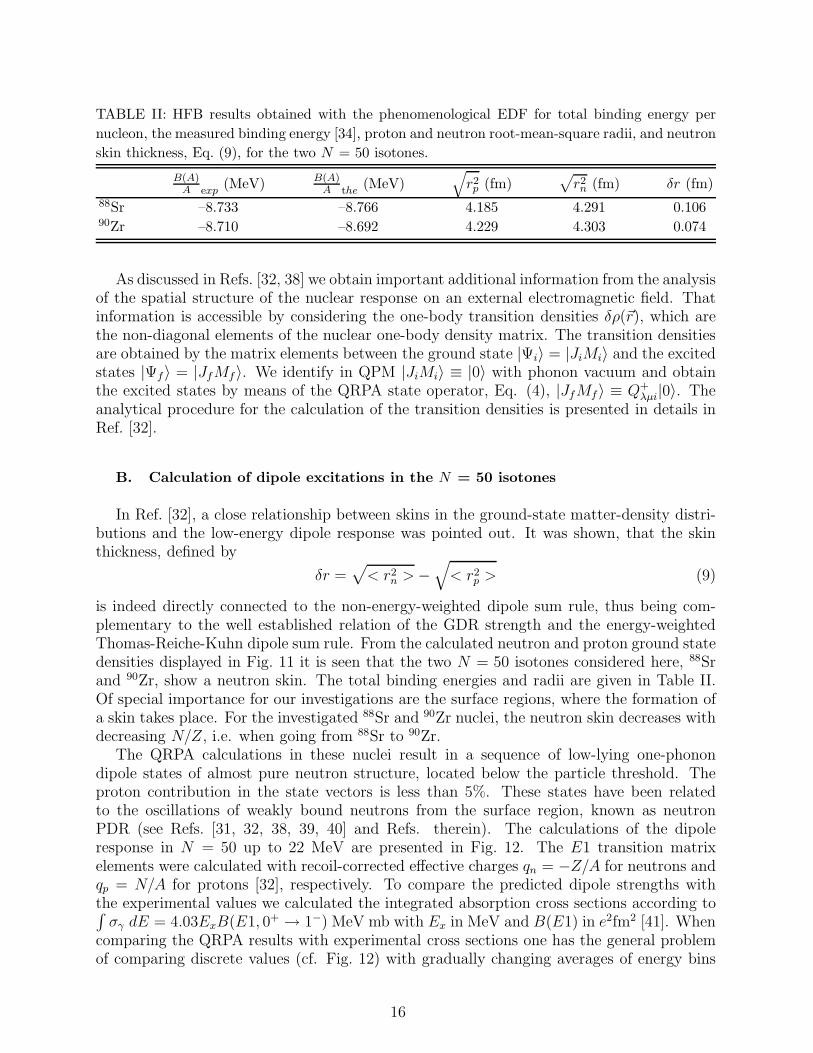
TABLE II: HFB results obtained with the phenomenological EDF for total binding energy per
nucleon, the measured binding energy [34], proton and neutron root-mean-square radii, and neutron
skin thickness, Eq. (9), for the two N = 50 isotones.
B(A)A exp
(MeV) B(A)A the
(MeV)√
r2p (fm)
√r2n (fm) δr (fm)
88Sr –8.733 –8.766 4.185 4.291 0.10690Zr –8.710 –8.692 4.229 4.303 0.074
As discussed in Refs. [32, 38] we obtain important additional information from the analysisof the spatial structure of the nuclear response on an external electromagnetic field. Thatinformation is accessible by considering the one-body transition densities δρ(~r), which arethe non-diagonal elements of the nuclear one-body density matrix. The transition densitiesare obtained by the matrix elements between the ground state |Ψi〉 = |JiMi〉 and the excitedstates |Ψf〉 = |JfMf 〉. We identify in QPM |JiMi〉 ≡ |0〉 with phonon vacuum and obtainthe excited states by means of the QRPA state operator, Eq. (4), |JfMf 〉 ≡ Q+
λµi|0〉. Theanalytical procedure for the calculation of the transition densities is presented in details inRef. [32].
B. Calculation of dipole excitations in the N = 50 isotones
In Ref. [32], a close relationship between skins in the ground-state matter-density distri-butions and the low-energy dipole response was pointed out. It was shown, that the skinthickness, defined by
δr =√< r2
n >−√< r2
p > (9)
is indeed directly connected to the non-energy-weighted dipole sum rule, thus being com-plementary to the well established relation of the GDR strength and the energy-weightedThomas-Reiche-Kuhn dipole sum rule. From the calculated neutron and proton ground statedensities displayed in Fig. 11 it is seen that the two N = 50 isotones considered here, 88Srand 90Zr, show a neutron skin. The total binding energies and radii are given in Table II.Of special importance for our investigations are the surface regions, where the formation ofa skin takes place. For the investigated 88Sr and 90Zr nuclei, the neutron skin decreases withdecreasing N/Z, i.e. when going from 88Sr to 90Zr.
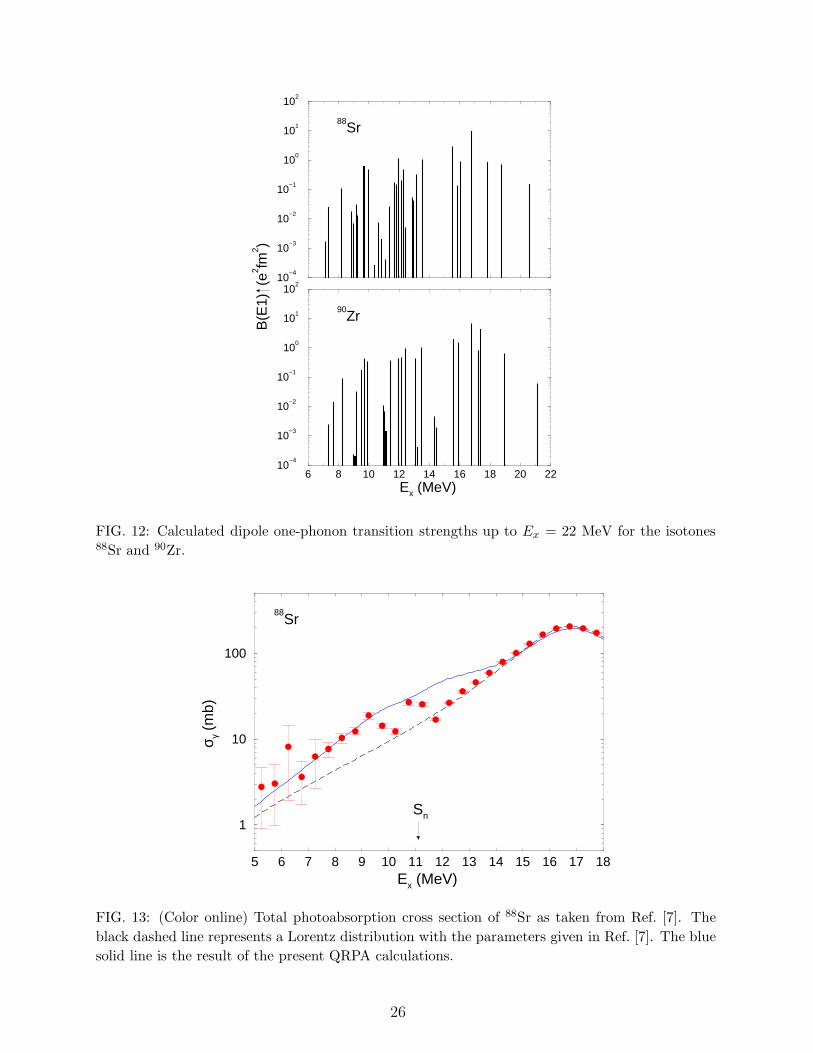
The QRPA calculations in these nuclei result in a sequence of low-lying one-phonondipole states of almost pure neutron structure, located below the particle threshold. Theproton contribution in the state vectors is less than 5%. These states have been relatedto the oscillations of weakly bound neutrons from the surface region, known as neutronPDR (see Refs. [31, 32, 38, 39, 40] and Refs. therein). The calculations of the dipoleresponse in N = 50 up to 22 MeV are presented in Fig. 12. The E1 transition matrixelements were calculated with recoil-corrected effective charges qn = −Z/A for neutrons andqp = N/A for protons [32], respectively. To compare the predicted dipole strengths withthe experimental values we calculated the integrated absorption cross sections according to∫σγ dE = 4.03ExB(E1, 0+ → 1−) MeV mb with Ex in MeV and B(E1) in e2fm2 [41]. When
comparing the QRPA results with experimental cross sections one has the general problemof comparing discrete values (cf. Fig. 12) with gradually changing averages of energy bins
16
(cf. Fig. 10). Therefore, the QRPA values are usually folded with Lorentz curves that canbe considered as a simulation of the damping of the GDR due to higher-order configurationsneglected in QRPA. In the present case, we folded the discrete QRPA cross sections withLorentz curves of 3.0 MeV width, which is a typical value for the damping width. Theresults are compared with the experimental cross sections in Fig. 10 for 90Zr and in Fig. 13for 88Sr. The QRPA calculations predict extra strength with respect to the Lorentz curvein qualitative agreement with the experimental findings. However, the experimental crosssections show a clear separation of the PDR and the GDR regions around 12 MeV, whereasthe calculations seem to predict an excess of strength up to about 14 MeV.
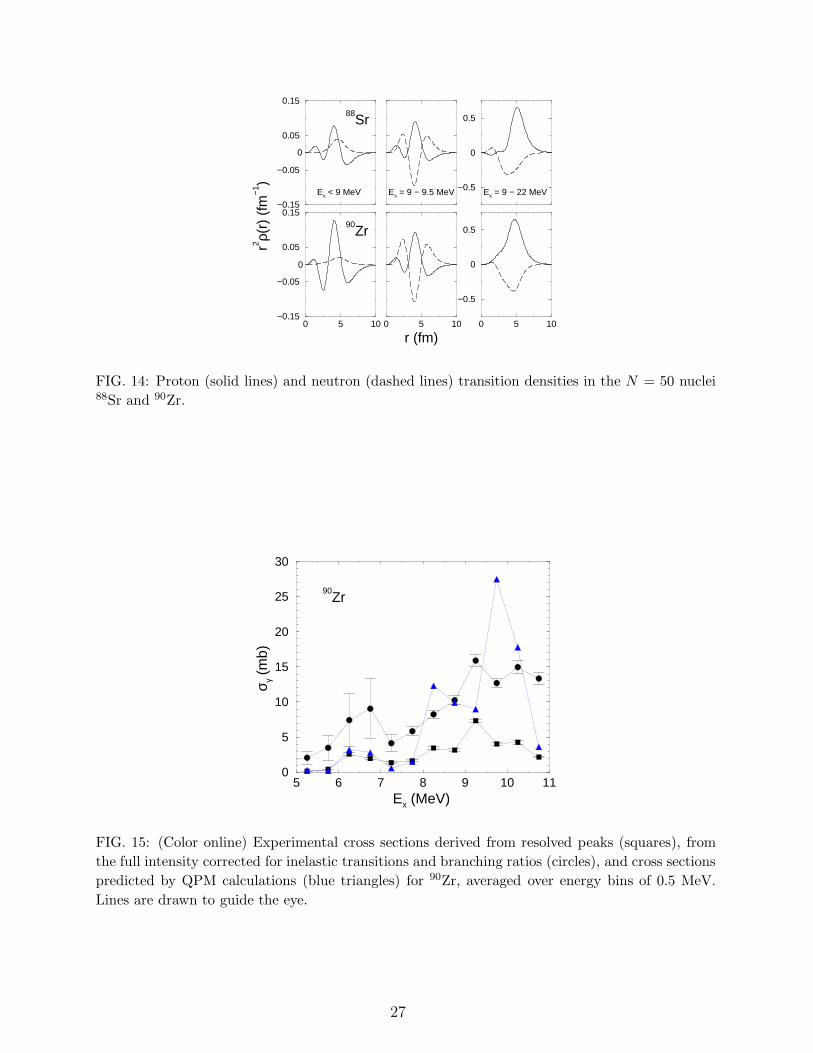
The nature of the dipole strength can be examined by analyzing dipole transition densitiesthat act as a clear indicator of the PDR and allow us to distinguish between the differenttypes of the dipole excitations [32]. The QRPA proton and neutron dipole transition densitiesfor 88Sr and 90Zr were summed over selected energy regions and are shown in Fig. 14. Theycan be directly related to the spectrum of 1− states in Fig. 12. In the region of Ex < 9MeV we find an in-phase oscillation of protons and neutrons in the nuclear interior, whileat the surface only neutrons contribute. Because these features are characteristic for dipoleskin modes, we identify these states as part of the PDR. The states in the region of Ex from9 MeV to 9.5 MeV carry a different signature and their contribution to the total protonand neutron transition densities in the energy region Ex < 9.5 MeV changes completely thebehavior of the proton/neutron oscillations related to the PDR. At these higher energies theprotons and neutrons start to move out of phase being compatible with the low-energy partof the GDR. At Ex from 9 to 22 MeV a strong isovector oscillation corresponding to theexcitation of the GDR is observed.
In the case of N = 50 isotones the neutron number is fixed and only the proton numberchanges. This affects the thickness of the neutron skin as well as is seen in Fig. 11 andTable II. Correspondingly, the total PDR strength decreases with increasing proton number.According to the criteria discussed above we consider the states in the energy region Ex <9 MeV as a part of the PDR. In this energy interval, the QRPA calculations predict a totalPDR strength of
∑B(E1)↑= 0.107 e2fm2 in 90Zr and
∑B(E1)↑= 0.170 e2fm2 in 88Sr,
respectively. This accounts for 0.27% and 0.44% of the TRK in 90Zr and 88Sr, respectively,and compares with experimental values of 0.55(2)% and 0.74(2)% derived from resolvedpeaks in 90Zr and 88Sr, respectively, whereas the values deduced from the corrected fullintensities including also the continuum part are remarkably greater and amount to 2.2(4)%and 2.4(6)% in 90Zr and 88Sr, respectively.
Finally, we note that the results are in agreement with the established connection betweenthe calculated total PDR strength and the nuclear skin thickness, Eq. (9), found in ourprevious investigations in the N = 82 isotones [40] and the 100−132Sn isotopes [32] nuclei.
In the multi-phonon QPM calculations the structure of the excited states is described bywave functions as defined in Eq. (8). We now investigate multi-phonon effects using a modelspace with up to three-phonon components, built from a basis of QRPA states with Jπ =1+, 1−, 2+, 3−, 4+, 5−, 6+, 7−, and 8+. Because the one-phonon configurations up to Ex =22 MeV are considered the core polarization contributions to the transitions of the low-lying1− states are taken into account explicitly. Hence, we do not need to introduce dynamicaleffective charges. Our model space includes one-, two- and three-phonon configurations (intotal 200) with energies up to Ex = 12 MeV.
The experimental absorption cross sections in 90Zr in the range from 5 to 11 MeV arecompared with the corresponding QPM results in Fig. 15. The strength in the region Ex
17
= 6 – 7 MeV is related to the PDR as identified from the structure of the involved 1−
states. The contribution of the GDR phonons becomes significant at energies Ex > 7.5 MeVwhere a coupling between PDR, GDR, and multiphonon states reflects the properties of thedipole excitations at higher energies. At low energy, the calculated values underestimatethe experimental values derived from the full intensity and are close to the values deducedfrom resolved peaks only, whereas at high energy they are in better agreement with theexperimental values including the full intensity. The calculated EWSR from 5 to 9 MeV of1.3% of the TRK underestimates the experimental value of 2.2(4)%. However, increasing theenergy range up to 11 MeV the theoretical value of 3.3% is much closer to the experimentalresult of 4.0(3)%, indicating a slightly different distribution of the QPM strength with respectto excitation energy.
V. SUMMARY
The dipole-strength distribution in 90Zr up to the neutron-separation energy has beenstudied in photon-scattering experiments at the ELBE accelerator using various electron en-ergies. Ground-state transitions have been identified by comparing the transitions observedat different electron energies. We identified about 190 levels with a total dipole strengthof about 180 meV/MeV3. Spin J = 1 could be deduced from the angular correlations ofthe ground-state transitions for about 140 levels including a dipole strength of about 155meV/MeV3.
The intensity distribution obtained from the measured spectra after a correction fordetector response and a subtraction of atomic background in the target contains a continuumpart in addition to the resolved peaks. It turns out that the dipole strength in the resolvedpeaks amounts to about 27% of the total dipole strength while the continuum contains about73%.
An assignment of inelastic transitions to particular levels and, thus, the determinationof branching ratios was in general not possible. To get information about the intensitiesof inelastic transitions to low-lying levels we have applied statistical methods. By meansof simulations of γ-ray cascades intensities of branching transitions could be estimated andsubtracted from the experimental intensity distribution and the intensities of ground-statetransitions could be corrected in average for their branching ratios.
A comparison of the photoabsorption cross section obtained in this way from the present(γ, γ′) experiments with (γ, n) data shows a smooth connection of the data of the two dif-ferent experiments and gives new information about the extension of the dipole-strengthfunction toward energies around and below the threshold of the (γ, n) reaction. In compari-son with a straightforward approximation of the GDR by a Lorentz curve one observes extraE1 strength in the energy range from 6 to 11 MeV which is mainly concentrated in strongpeaks.
QPM calculations in 88Sr and 90Zr predict low-energy dipole strength in the energy regionfrom 6 to 10 MeV. The states at about 6 to 7.5 MeV have a special character. Their structureis dominated by neutron components and their transition strength is directly related to thesize of a neutron skin. Their generic character is further confirmed by the shape and structureof the related transition densities, showing that these PDR modes are clearly distinguishablefrom the GDR. The dipole states, seen as a rather fragmented ensemble at Ex > 7.5 MeVmix strongly with the low-energy tail of the GDR starting to appear in the same region.The complicated structure of these states and the high level densities imposes considerable
18
difficulties for a reliable description of the fragmentation pattern.The present analysis shows that standard strength functions currently used for the calcu-
lation of reaction data do not describe the dipole-strength distribution below the (γ, n)threshold correctly and should be improved by taking into account the observed extrastrength.
VI. ACKNOWLEGDMENTS
We thank the staff of the ELBE accelerator for their cooperation during the experimentsand we thank A. Hartmann and W. Schulze for their technical assistance. Valuable discus-sions with F. Donau and S. Frauendorf are gratefully acknowledged. This work was sup-ported by the Deutsche Forschungsgemeinschaft under contracts Do466/1-2 and Le439/4-3.
[1] P. Axel, K. K. Min, and D. C. Sutton, Phys. Rev. C 2, 689 (1970).
[2] S. Datta and J. S. Allen, Phys. Rev. C 8, 1421 (1973).
[3] R. M. Laszewski, R. Alarcon, and S. D. Hoblit, Phys. Rev. Lett. 59, 431 (1987).
[4] R. Alarcon, R. M. Laszewski, A. M. Nathan, and S. D. Hoblit, Phys. Rev. C 36, 954 (1987).
[5] U. Kneissl, N. Pietralla, and A. Zilges, J. Phys. G: Nucl. Part. Phys. 32, R217 (2006).
[6] R. Schwengner, R. Beyer, F. Donau, E. Grosse, A. Hartmann, A. R. Junghans, S. Mallion, G.
Rusev, K. D. Schilling, W. Schulze, and A. Wagner, Nucl. Instr. Meth. A 555, 211 (2005).
[7] R. Schwengner, G. Rusev, N. Benouaret, R. Beyer, M. Erhard, E. Grosse, A. R. Junghans, J.
Klug, K. Kosev, N. Kostov, C. Nair, N. Nankov, K. D. Schilling, and A. Wagner, Phys. Rev.
C 76, 034321 (2007).
[8] G. Rusev, R. Schwengner, F. Donau, M. Erhard, E. Grosse, A. R. Junghans, K. Kosev, N.
Kostov, K. D. Schilling, A. Wagner, F. Becvar, and M. Krticka, Phys. Rev. C 77, 064321
(2008).
[9] F. R. Metzger, Nucl. Phys. A182, 213 (1972).
[10] F. R. Metzger, Phys. Rev. C 9, 1525 (1974).
[11] L. E. Cannell, Thesis, University of Illinois (1976), unpublished.
[12] E. Browne, Nucl. Data Sheets 82, 379 (1997).
[13] U. E. P. Berg, J. Phys. (Paris), Colloq. C4, 359 (1984).
[14] F. Ajzenberg-Selove and J. H. Kelley, Nucl. Phys. A506, 1 (1990).
[15] CERN Program Library Long Writeup W5013, Geneva 1993, unpublished.
[16] E. Haug, Rad. Phys. Chem. 77, 207 (2008).
[17] G. Roche, C. Ducos, and J. Proriol, Phys. Rev. A 5, 2403 (1972).
[18] F. Salvat, J. D. Martinez, R. Mayol, and J. Parellada, Phys. Rev. A 36, 467 (1987).
[19] C. E. Porter and R. G. Thomas, Phys. Rev. 104, 483 (1956).
[20] G. Rusev, Dissertation, Technische Universitat Dresden 2007, Report FZD-478 (ISSN 1437-
322X), http://fzd.de/publications/010008/10008.pdf
[21] F. Becvar, Nucl. Instr. Meth. A 417, 434 (1998).
[22] T. von Egidy and D. Bucurescu, Phys. Rev. C 72, 044311 (2005).
[23] T. A. Brody, J. Flores, J. B. French, P. A. Mello, A. Pandey, and S. S. M. Wong, Rev. Mod.
Phys. 53, 385 (1981).
19
[24] Y. Kalmykov, T. Adachi, G. P. A. Berg, H. Fujita, K. Fujita, Y. Fujita, K. Hatanaka, J.
Kamiya, K. Nakanishi, P. von Neumann-Cosel, V. Yu. Ponomarev, A. Richter, N. Sakamoto,
Y. Sakemi, A. Shevchenko, Y. Shimbara, Y. Shimizu, F. D. Smit, T. Wakasa, J. Wambach,
and M. Yosoi, Phys. Rev. Lett. 96, 012502 (2006).
[25] Y. Kalmykov, C. Ozen, K. Langanke, G. Martınez-Pinedo, P. von Neumann-Cosel, and A.
Richter, Phys. Rev. Lett. 99, 202502 (2007).
[26] P. Axel, Phys. Rev. 126, 671 (1962).
[27] B. L. Berman, J. T. Caldwell, R. R. Harvey, M. A. Kelly, R. L. Bramblett, and S. C. Fultz,
Phys. Rev. 162, 1098 (1967).
[28] P. Ring and P. Schuck, in The Nuclear Many Body Problem, (Springer, New York, 1980).
[29] T. Belgya, O. Bersillon, R. Capote, T. Fukahori, G. Zhigang, S. Goriely, M. Herman, A.
V. Ignatyuk, S. Kailas, A. Koning, P. Oblozinsky, V. Plujko, and P. Young, Handbook for
calculations of nuclear reaction data, RIPL-2, IAEA-TECDOC-1506 (IAEA, Vienna, 2006);
http://www-nds.iaea.org/RIPL-2/.
[30] A. J. Koning, S. Hilaire, and M. C. Duijvestijn, AIP Conf. Proc. 769, 1154 (2005).
[31] N. Tsoneva, H. Lenske, and Ch. Stoyanov, Phys. Lett. B586, 213 (2004).
[32] N. Tsoneva and H. Lenske, Phys. Rev. C 77, 024321 (2008).
[33] V. G. Soloviev, Theory of complex nuclei, Pergamon Press, Oxford, 1976.
[34] G. Audi and A. H. Wapstra, Nucl. Phys. A595, 409 (1995).
[35] F. Hofmann and H. Lenske, Phys. Rev. C 57, 2281 (1998).
[36] A. Vdovin and V. G. Soloviev, Phys. Elem. Part. At. Nucl. 14, 237 (1983).
[37] M. Grinberg and Ch. Stoyanov, Nucl. Phys. A573, 231 (1994).
[38] N. Ryezayeva, T. Hartmann, Y. Kalmykov, H. Lenske, P. von Neumann-Cosel, V. Yu. Pono-
marev, A. Richter, A. Shevchenko, S. Volz, and J. Wambach, Phys. Rev. Lett. 89, 272502
(2002).
[39] P. Adrich, A. Klimkiewicz, M. Fallot, K. Boretzky, T. Aumann, D. Cortina-Gil, U. Datta
Pramanik, Th. W. Elze, H. Emling, H. Geissel, M. Hellstrom, K. L. Jones, J. V. Kratz, R.
Kulessa, Y. Leifels, C. Nociforo, R. Palit, H. Simon, G. Surowka, K. Summerer, and W. Walus,
Phys. Rev. Lett. 95, 132501 (2005).
[40] S. Volz, N. Tsoneva, M. Babilon, M. Elvers, J. Hasper, R.-D. Herzberg, H. Lenske, K. Lin-
denberg, D. Savran, and A. Zilges, Nucl. Phys. A779, 1 (2006).
[41] A. Bohr and B. Mottelson, Nuclear Structure II, World Scientific (1998).
20
2000 4000 6000 8000Ex (keV)
1
10
I s+f(9
.0 M
eV)
/ Is+
f(7.9
MeV
) 90Zr(γ,γ’)
2000 4000 6000 8000Ex (keV)
1
10
100
I s+f(1
3.2
MeV
) / I
s+f(7
.9 M
eV) 90
Zr(γ,γ’)
2000 4000 6000 8000Ex (keV)
1
10
I s+f(1
3.2
MeV
) / I
s+f(9
.0 M
eV) 90
Zr(γ,γ’)
FIG. 3: Ratios of integrated cross sections Is+f of transitions in 90Zr obtained at different electron
energies.
21
2 3 4 5 6 7 8 9 10 11 12 13 14Eγ (MeV)
100
101
102
103
104
105
Cou
nts
per
10 k
eV
90Zr
spectrum
backgroundatomic
FIG. 4: Experimental spectrum of 90Zr (corrected for room background and detector response)
and simulated spectrum of atomic background (multiplied with efficiency and measuring time).
3 4 5 6 7 8 9 10 11 12 13
Ex (MeV)
0
5
10
15
20
σ γγ ’ (
mb)
90Zr
peaks + cont.
peaks
∆=0.2 MeV
FIG. 5: Scattering cross sections in 90Zr, derived as σγγ′ =∑
∆ Is/∆, not corrected for branching
and averaged over energy bins of ∆ = 0.2 MeV, as derived from the difference of the experimental
spectrum and the atomic background shown in Fig. 4 (“peaks + cont.”, triangles) and from the
resolved peaks only (“peaks”, circles).
22
0 2 4 6 8 10Eγ (MeV)
0.0
0.5
1.0
I γ (ar
b. u
nits
)
90Zr
Ground−statetransitions
Branching transitions
FIG. 6: Simulated intensity distribution of transitions depopulating levels in a 100 keV bin around
9 MeV in 90Zr. The squares depict the intensities obtained from 10 individual nuclear realizations.
6 7 8 9 10 11 12Ex (MeV)
0
20
40
60
80
100
120
b 0∆ (%
)
90Zr
FIG. 7: Branching ratios of ground-state transitions as obtained from the simulations of γ-ray
cascades for 90Zr. The squares represent the values of 10 individual nuclear realizations.
23
5 6 7 8 9 10 11 12 13 14 15 16 17 18Ex (MeV)
1
10
100
σ γ (m
b)
Sn
(γ,γ’)corr
90Zr
(γ,p) (γ,n)
FIG. 8: (Color online) Photoabsorption cross section deduced from the present (γ, γ′) data for 90Zr
after correction for branching transitions (red circles) in comparison with data obtained from an
experiment with monoenergetic photons (open black circles) [2], (γ, n) data taken from Ref. [27]
(green boxes) and with (γ, p) cross sections calculated with the Talys code [30] (blue triangles).
5 6 7 8 9 10 11 12 13 14 15 16 17 18Ex (MeV)
1
10
100
σ γ (m
b)
Sn
(γ,γ’)corr
90Zr
(γ,p) (γ,n)
PDR
Γ∼ E
FIG. 9: (Color online) Photoabsorption cross sections deduced from the present (γ, γ′) data for90Zr like the red circles in Fig. 8, but with modified E1 strength functions. The black squares are
the results for a Lorentz curve with energy-dependent width (black line) and the red circles are
the results for the assumption of a PDR on top of a Lorentz curve with constant width (pink line).
The Lorentz curve with a constant width and without PDR is shown as a black dashed line.
24
5 6 7 8 9 10 11 12 13 14 15 16 17 18Ex (MeV)
1
10
100
σ γ (m
b)
Sn
90Zr
FIG. 10: (Color online) Total photoabsorption cross section of 90Zr obtained by combining the
present (γ, γ′) data, the (γ, n) data of Ref. [27] and the (γ, p) calculations of Ref. [30]. The data
were averaged over 0.5 MeV bins to reduce statistical fluctuations. The black dashed line represents
a Lorentz curve with the parameters taken from Ref. [27] as also shown in Fig. 9. The blue solid
line is the result of QRPA calculations discussed in Sec. IVB.
0 2 4 6 8r (fm)
0
0.02
0.04
0.06
0.08
0.1
ρ(r)
(fm
−3 )
88Sr
90Zr
neutrons
protons
FIG. 11: Proton and neutron ground-state densities of the N = 50 isotones 88Sr and 90Zr.
25
6 8 10 12 14 16 18 20 22Ex (MeV)
10−4
10−3
10−2
10−1
100
101
102
B(E
1) (
e2 fm2 )
10−4
10−3
10−2
10−1
100
101
102
90Zr
88Sr
FIG. 12: Calculated dipole one-phonon transition strengths up to Ex = 22 MeV for the isotones88Sr and 90Zr.
5 6 7 8 9 10 11 12 13 14 15 16 17 18Ex (MeV)
1
10
100
σ γ (m
b)
Sn
88Sr
FIG. 13: (Color online) Total photoabsorption cross section of 88Sr as taken from Ref. [7]. The
black dashed line represents a Lorentz distribution with the parameters given in Ref. [7]. The blue
solid line is the result of the present QRPA calculations.
26
0 5 10−0.15
−0.05
0.05
0.15
r2 ρ(r)
(fm
−1 )
−0.15
−0.05
0.05
0.15
0 5 10
r (fm)0 5 10
−0.5
0
0.5
−0.5
0
0.588Sr
90Zr
0
0
Ex < 9 MeV Ex = 9 − 9.5 MeV Ex = 9 − 22 MeV
FIG. 14: Proton (solid lines) and neutron (dashed lines) transition densities in the N = 50 nuclei88Sr and 90Zr.
5 6 7 8 9 10 11Ex (MeV)
0
5
10
15
20
25
30
σ γ (m
b)
90Zr
FIG. 15: (Color online) Experimental cross sections derived from resolved peaks (squares), from
the full intensity corrected for inelastic transitions and branching ratios (circles), and cross sections
predicted by QPM calculations (blue triangles) for 90Zr, averaged over energy bins of 0.5 MeV.
Lines are drawn to guide the eye.
27


