Embed Size (px)
Citation preview
The 10th International Symposium on Virtual Reality, Archaeology and Cultural HeritageVAST (2009)C. Perlingieri and D. Pitzalis (Editors)
Pushing Time-of-Flight scanners to the limit
M. Callieri, P. Cignoni, M. Dellepiane, R. Scopigno
Visual Computing Laboratory, ISTI-CNR, Italy
AbstractThe paper describes a pipeline for 3D scanning acquisition and processing that allow to exploit the utmost preci-sion and quality out of ToF scanners. The proposed approach capitalize on the knowledge of the distribution of thenoise to apply sophisticated fairing techniques for cleaning up the data. Leveraging on the very dense samplingof this kind of scanners we show that is possible to attain high accuracy. We present a practical application of theproposed approach for the scanning of a large (5mt) statue with millimetric precision.
Categories and Subject Descriptors (according to ACM CCS): Computer Graphics [I.3.3]: Picture/Image Generation
1. Introduction
3D scanning has become a widely used technology in thecultural heritage field. Many different measuring devices andsoftware tools for data processing are available in the mar-ket and in the academic community. While this technologymay be considered stable on a quite large variety of ”stan-dard" objects, there still exist many complex objects whichstill require lot of planning, tweaking and specific work,in order to obtain usable and high quality results. It couldbe said that there is a scanning technology for each ob-ject and sampling scale: conoscopy for submillimetric ob-jects, the various kind of triangulation-based for small tohuman-size objects, phase-shifting TOF for 1..20 mt sizedobjects, Time-of-Flight for buildings, long range TOF forlandscapes. However, world is not so easily confined in cat-egories and not always the best instrument is available; ithappens quite often to encounter objects that are borderlinebetween two categories, thus being oversized for a technol-ogy and short-sized for another. A typical case is large stat-ues (more than 3-4 meter tall) or very detailed buildings likeruins or heavily sculpted monuments: these artifacts, wouldrequire a millimetrical resolution sampling but they are toolarge for being practically acquired with triangulation scan-ners, moreover it is considered hard to sample them at highresolution with Time-of-Flight devices due to their charac-teristics. Newer phase-shifting TOF devices that could fitwell of this class of objects are not widespread and some-times they need significantly longer acquisition time. Two
prejudice often arises when considering the Time-of-Flighttechnology as a possible instrument for this kind of works:
The Time-of-Flight data is too noisy Apart from the lat-eral resolution one of the characteristics of the TOF de-vices is that the range accuracy is rather independent ofthe actual distance of the object. So it is not important ifan object is near to the scanner or half a kilometer awaythe range accuracy is always the same and usually consid-ered too low for objects like large statues.
It is dif�cult to build a complete model Given the longacquisition time needed for older TOF devices and the dif-ficulties of framing difficult-to-reach areas (TOF devicesare typically bigger, heavier and less orientable w.r.t. tri-angulation scanners), the models built using these tech-nologies are often fairly incomplete.
The new scanners based on phase shifting or interferenceTime-of-Flight technology (with their greatly increased pre-cision) would greatly helpin making things easier, but thiskind of devices are still very expensive, heavy, sometimesslow and not quite diffused [CSCA05]. The installed baseof pure Time-of-Flight scanners is much larger and, whilerequiring a more careful data processing, we will show thatthey can be efficiently used to produce high quality result onthose borderline artifacts.
The problem of the noise is very disrupting, since theamount of noise in high resolution TOF scan may be largeenough to prevents further processing. When working withtriangulation range map, the sampling noise is often elimi-
c The Eurographics Association 2009.
M. Callieri et al. / Pushing Time-of-Flight scanners to the limit
nated in the merging phase, when data acquired from differ-ent directions is blended together. In TOF scans the amountof overlap between scans, even if it is sufficient to guaran-tee a good alignment, may not be enough to provide enoughdata to perform noise canceling filtering everywhere, so thesolution may be filtering each scan. However, to be able toeffectively filter a single range map, the data should be denseenough to provide enough redundancy: it is necessary thento do all scans at maximum sampling density. This advicemay sound strange, given the additional time it requires, butthe large amount of data produced by this procedure, givesus enough redundancy to be able to efficiently and accuratelyfilter the range maps it in order to remove the noise. We willdiscuss filtering techniques for noise removal in Section 3.
As a further note we remember the importance of a a care-ful planning of the scanning campaign for having a goodcoverage without spending ages working on the field. Whiletrue for all kind of 3D scanning campaign, this remark isespecially important in the case of TOF devices: by consid-ering in advance the difficulties of the scan and by findingthe best scanning position it is possible to greatly reduce thetime spent on the field and avoid to ”miss" some spots onthe object due to a poor choice of acquisition spot. We willshow in Section 2.1 how the scanning of this monument hasbeen carefully studied in advance, in order to evaluate thebest scanning strategy.
If a correct scanning plan is essential, it is also necessaryto be able to process all the gathered data in the most efficientway. A very good set of processing tools (capable to dealwith the large amount of data) is really important but, espe-cially in tricky projects like this, it may be even more impor-tant to being able to ”bend the pipeline", slightly customiz-ing the processing steps in order to be able to deal with thespecific constrains/difficulties/needs of the project. In Sec-tion 4 we will detail the process used to generate the com-plete 3D model of the object, discussing how we tweakedthe various steps of alignment, merging and color mappingin order to be able to work on this peculiar dataset.
2. The Diagnostic Investigation of the Nettuno Statue
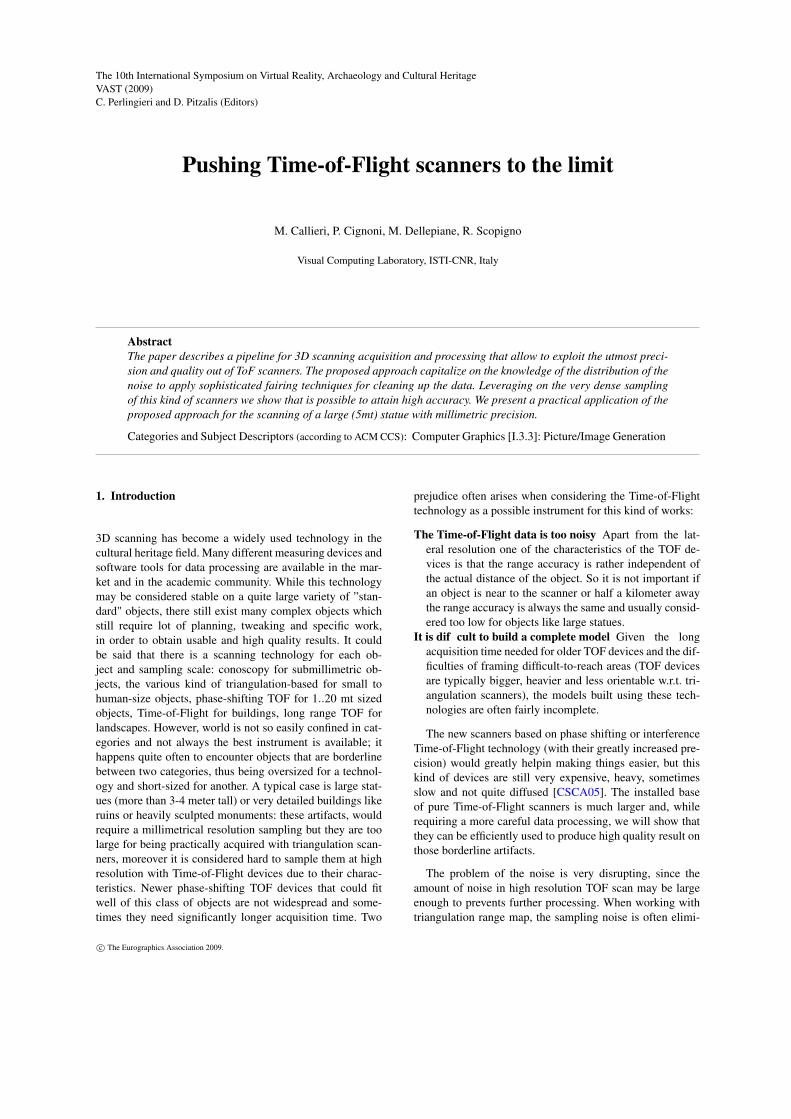
The Fountain of Neptune is a fountain in Florence, situatedon the Piazza della Signoria, in the north-west corner of thePalazzo Vecchio. The sculptures are a work by BartolomeoAmmannati (1563-1565) and some assistants (such as Gi-ambologna), and was commissioned in 1565. The centralpiece of the fountain (see Figure 1) is a five meters tall Nep-tune statue, placed on a high decorated pedestal. Three smallfigures (mermen) are between the Neptune's legs, carryingshells that, originally, were water sprinklers. The Neptunestatue is friendly called by �orentines ”Il Biancone" (thewhite big man).
This statue is the primary objective of an extensive diag-nostic investigation carried out by the Opificio delle Pietre
Figure 1: Three views of the Neptune fountain. In the TopLeft: the Time-Of-Flight scanning device during the acquisi-tion
Dure, one of the most important restoration institutes in Italy.Many different analysis will be carried out on the statue(chemical, thermographic, ultrasonic) and many experts willexamine the surface of the monument. The aim of the acqui-sition campaign is to provide a clear overview of the condi-tion of the statue, in order to assess the necessity of a restora-tion action. The 3D model will be the the base to plan theinvestigation campaign but also, during the campaign, thesubstrate on which all the analytic data will be mapped.
It will then be necessary to obtain a 3D model completeenough to be useful as a three-dimensional index for the var-ious analysis, and precise (and realistic) enough to be usedas a guide to plan the investigation and to easily locate all
c The Eurographics Association 2009.
M. Callieri et al. / Pushing Time-of-Flight scanners to the limit
the interesting areas. The model should be at a resolutionof around 3-5 mm (in order to show enough details), witha precision of around 1-2 mm (to be a precise index) andwith surface color (in order to show the very small surfacecharacteristics not acquirable by the laser scanner).
On each corner of the four-sided fountain there is a groupof three human-size bronze statues. One of these smallerbronze figures (a satyr) was also included in the acquisitionprocess and diagnostic investigation.
2.1. Planning of the scanning campaign
Due to the artistic (and touristic) importance of the fountain,it was not possible to build a scaffolding around the statue,not even a temporary one. This restriction made impossiblethe use of triangulation laser scanners, since their range ofoperativity is quite small, requiring to place the acquisitiondevice very close to the statue. The only possible solutionwas to use Time-of-Flight devices. The no-scaffolding re-striction also affected the possible placements of the TOFdevices: all acquisition should have been done from groundlevel. These conditions posed serious doubts about the pos-sibility of generating a good and complete 3D model; forthis reason, the planning of the scanning positions has beencarried out with particular care.
Being on ground level, while the statue rested on a plat-form at around 2.5 meters of height, gave a good opportunityto avoid unsampled areas visible from bottom. We decidedthat, to have the optimal view angle, the best position wouldbe a couple meters away from the fountain border. Judgingfrom the general shape of the statue, we would expect thatthe only areas not acquirable from this lower position wouldbe the head top and the upper part of the shoulders. A singleelevated viewpoint was available from the terrace of PalazzoVecchio and we decided to exploit it to cover those difficult-to-reach areas, even though from this point it was only vis-ible a side of the statue. Unfortunately, the buildings on theother sides of the statue were too far to obtain a coveragedense enough to overcome the measurement errors.
During the planning of the scanning campaign, we wereparticularly worried about the area under Neptune's legs,where three small figures are interweaved, generating a verycomplex geometry. The groups of statues on the angles ofthe fountain prevented a diagonal placement; so we decidedto use two point of view from each side of the fountain, giv-ing eight equispaced points of view. We believed that eightwell distributed viewpoints could be enough to cope with thecomplexity of the base figures.
2.2. Data Acquisition
The scanning has been performed by using a RIEGL LMS-Z390i, a standard Time-Of-Flight scanner that exploits thetime used by the laser light to travel from the scanner to
the acquired surface and back to estimate the distance of thesampled point.
The acquisition process, carried out exactly as it wasplanned, took around four hours; like in most of this cases,almost half of the time was spent in moving the scanner fromone position to another. We acquired the statues from eightscan positions from the ground, plus one from the PalazzoVecchio balcony. One of the ground scans has been donewith the device in a perfectly horizontal position, in order topreserve the vertical axis of the statue in the final 3D model.
Knowing the kind of error we could expect from this kindof device, we decided to have as much data as possible. So,we did all the scan at the maximum possible resolution (0.02degree); even with such detailed sampling, the acquisitiontime was not that long. Each of the eight ground scans tookbetween 12-18 minutes (the complex is smaller from theside position and larger from front and back), while the scanfrom the building took a bit less. Each range map containedaround 2-2.5 million points (4-5 million triangles), giving agrand total of 19 million points sampled.
A professional photographer, during the following morn-ings (in order to have a less direct lighting), carried out anextensive photographic coverage of the statue. The photo-graphic campaign produced a very large dataset of nearly250 photos at 12 MPixels resolution. A subset of the pho-tos taken, has been used to map color on the surface of the3D model, this will give the diagnostic team a more clearreference to locate areas on the 3D surface.
Scanning the bronze statue was much easier; when mov-ing around the main statue, we acquired the satyr from threepositions. The only problem, in this case, was the rear of thestatue: it was not possible to acquire it from inside of the tub(since the back was too close to the border) or from the otherside of the fountain (too far, and not enough visibility due tothe other bronze statue). For this reason we used a triangula-tion scanner to cover the hard-to-reach areas, combining thedifferent scans during processing.
3. Sampled Data Filtering
The main idea driving the processing of the acquired datasetwas the fact that, while the input data is very noisy, we havea good knowledge of the distribution of this noise and we ex-ploit it during acquisition and processing. Infact TOF laserscanners are based on the principle of measuring the timeused by the light to travel from the scanner to the acquiredsurface and back to estimate the distance of the sampledpoint. This information together with the knowledge of di-rection of the laser ray, allows to compute the position ofthe hit point with a given degree of accuracy. One of thecharacteristic of the TOF devices is that the accuracy of themeasure of the distance is rather independent of the actualdistance of the object, so for that part of the measure it is
c The Eurographics Association 2009.
M. Callieri et al. / Pushing Time-of-Flight scanners to the limit
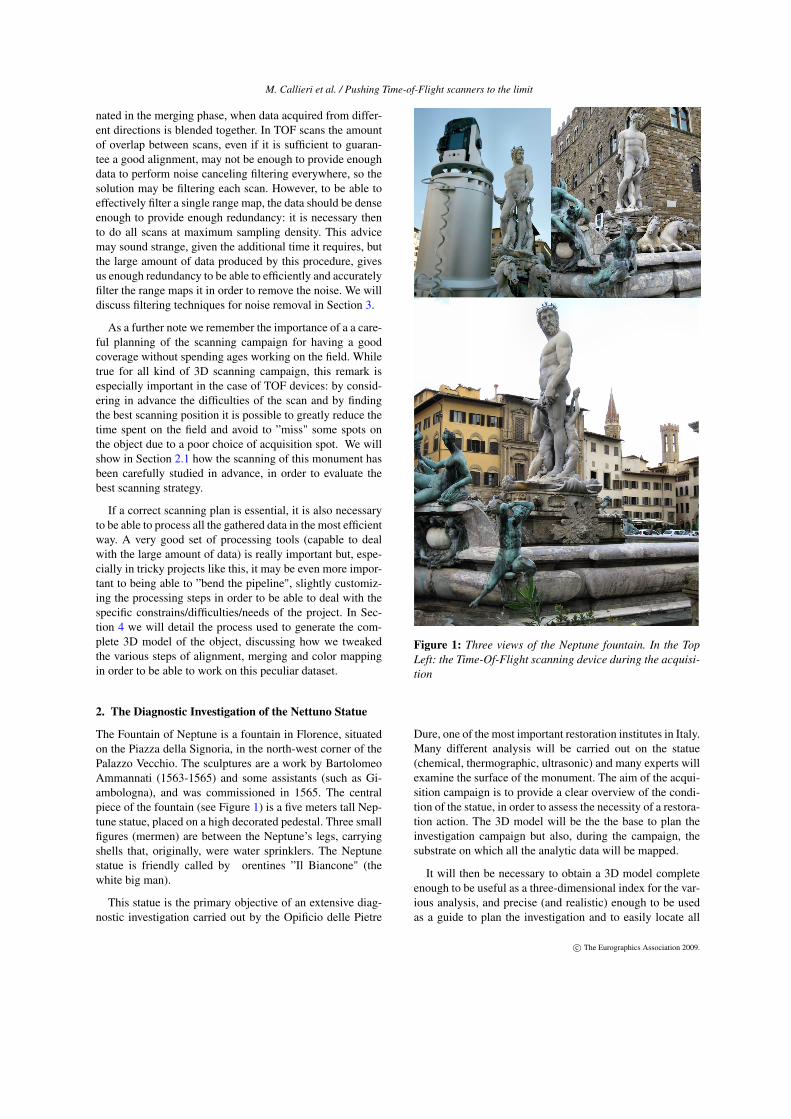
Figure 2: A range map before filtering (Left), almost all detail is hidden beneath the noise. The two close-up (Center and Right)clearly show how the size of the noise exceed the sampling rate
not important if an object is near to the scanner or half akilometer away.
In practice the above considerations means that the distri-bution of error of the returned positions is not somethingconstant, but it depends on the distance of the acquiredpoints: on close to the scanner points the ray direction es-timation is much more accurate than the distance estimationso the position of the measured point has an ellipsoid of un-certainty that is aligned and stretched along the ray direction,like is depicted in figure ??.
For a number of reasons (including the fact that it is quitesimple to produce a very precise and repeatable polar move-ment system but it is difficult to obtain really good precisionin the distantiometer that measures the distance using a cal-culation based the the speed of light) TOF are designed tooperate in the range of tens/hundreds of meters and there-fore for that distance range they have reasonably well shapedellipsoids of uncertainty. As a consequence when used onclose ranges, they are able to sample very densely the sur-face, with a sampling step that is much smaller than the ex-pected error in distance estimation. Common practice sug-gests that you should tune the acquisition parameters in or-der to keep the sampling step more or less of the same sizeof the distance estimation error, but as we show in this pa-per, oversampling and careful fairing can vastly improve thequality of the acquired meshes.
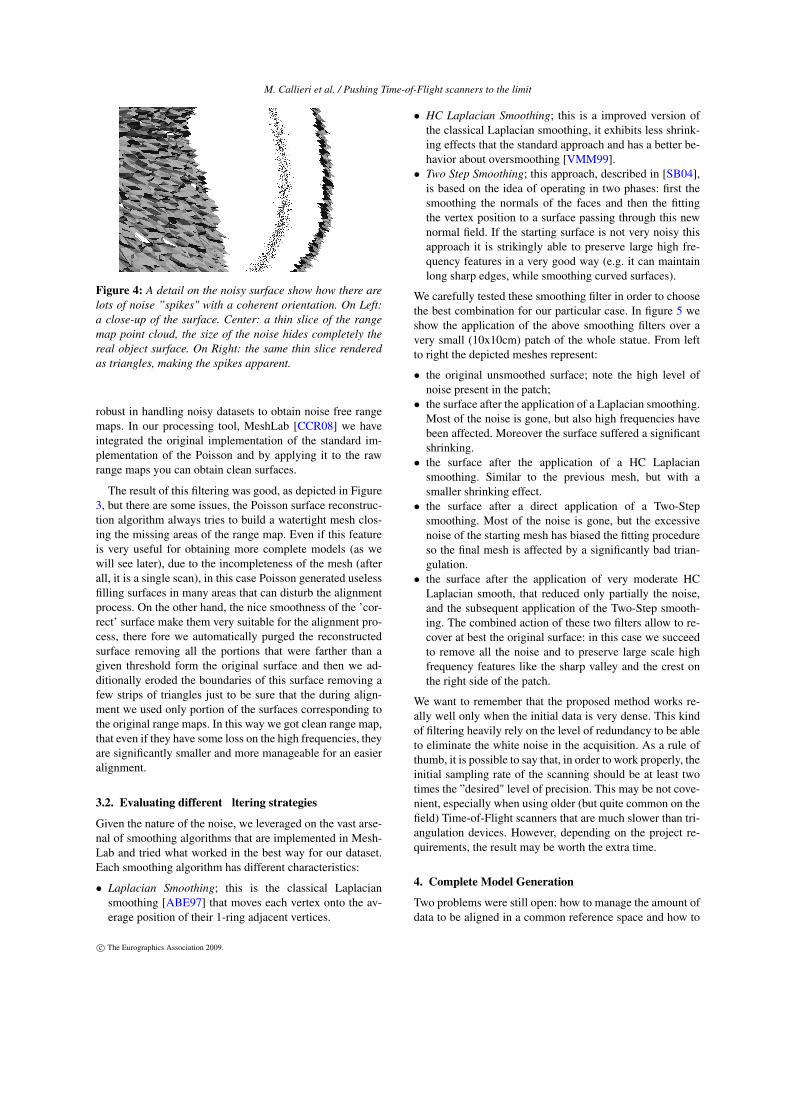
As expected after acquiring at an high sampling densitya brief inspection of the sampled data shows the high levelof noise that is present on the range maps. The range mapshown in Figure 4 appear quite confuse: getting close to thesurface, it is possible to see that this blurring effect is causedby the many ”spikes" that are visible on the local geome-try, whose lenght exceeds the sampling rate, do hide the realgeometric information.
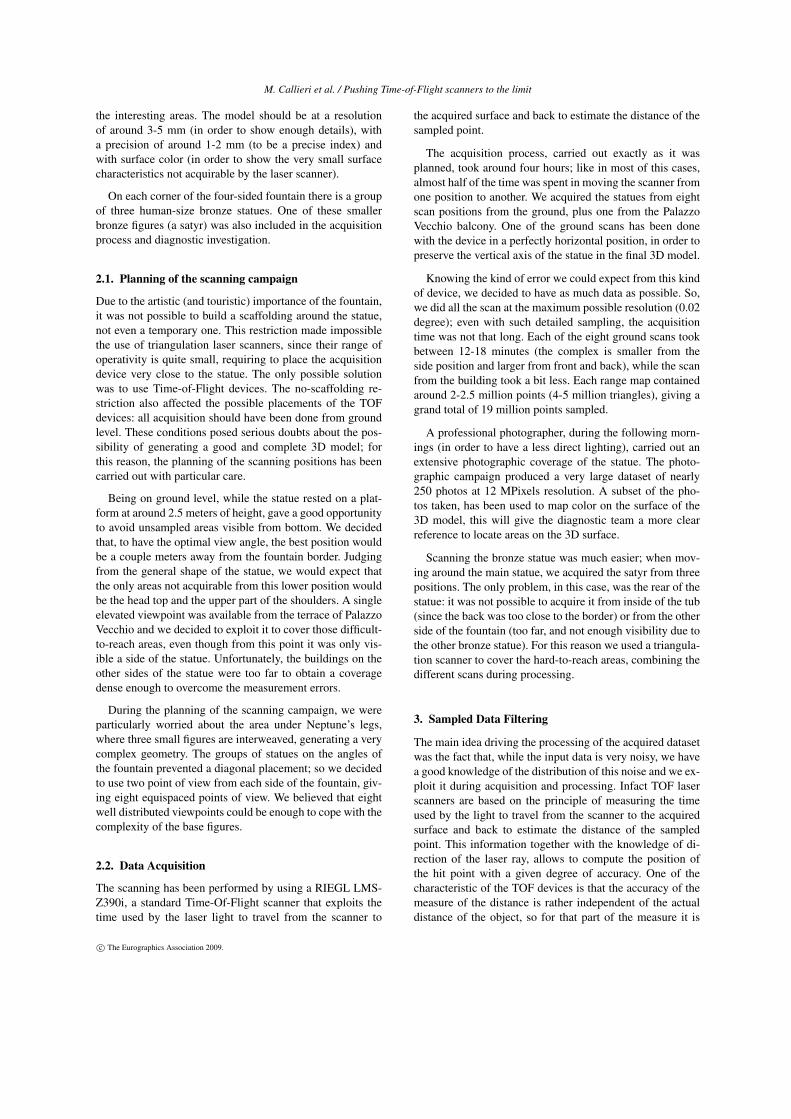
Figure 3: Using a Poisson based surface reconstruction al-gorithm can remove most of the scanning noise but createsadditional interpolating surfaces that can make difficult thealignment process. By removing the portion of the recon-structed surface at a distance larger than the scanner error,and further eroding the border of surface we are able to geta safe clean smooth surface.
Visualizing the range maps as points, instead of surface,the details of the statue are more visible. It is clear that thereis lot of information, but somehow hidden under the noise.
Considering this, it is easy to see how the sampled pointsare on the "correct" ray, but probably with a range error.This explains also the fact that, on close inspection (See Fig-ure 4), the direction of all the spikes on the range map sur-face are clearly directed toward the scanner optical center(the origin of the probing rays). This fact is quite importantfor the good behavior of the advanced smoothing algorithmdiscussed later, as seen from the acquisition vantage pointsthe mesh has a nice simple topology and therefore there is acorrect underlying meshing that can be recovered by simplymoving the vertex positions.
3.1. Poisson Filtering
A first idea to clean the sampled data was to use the Pois-son surface reconstruction [KBH06] algorithm that is very
c© The Eurographics Association 2009.
M. Callieri et al. / Pushing Time-of-Flight scanners to the limit
Figure 4: A detail on the noisy surface show how there arelots of noise ”spikes" with a coherent orientation. On Left:a close-up of the surface. Center: a thin slice of the rangemap point cloud, the size of the noise hides completely thereal object surface. On Right: the same thin slice renderedas triangles, making the spikes apparent.
robust in handling noisy datasets to obtain noise free rangemaps. In our processing tool, MeshLab [CCR08] we haveintegrated the original implementation of the standard im-plementation of the Poisson and by applying it to the rawrange maps you can obtain clean surfaces.
The result of this filtering was good, as depicted in Figure3, but there are some issues, the Poisson surface reconstruc-tion algorithm always tries to build a watertight mesh clos-ing the missing areas of the range map. Even if this featureis very useful for obtaining more complete models (as wewill see later), due to the incompleteness of the mesh (afterall, it is a single scan), in this case Poisson generated uselessfilling surfaces in many areas that can disturb the alignmentprocess. On the other hand, the nice smoothness of the 'cor-rect' surface make them very suitable for the alignment pro-cess, there fore we automatically purged the reconstructedsurface removing all the portions that were farther than agiven threshold form the original surface and then we ad-ditionally eroded the boundaries of this surface removing afew strips of triangles just to be sure that the during align-ment we used only portion of the surfaces corresponding tothe original range maps. In this way we got clean range map,that even if they have some loss on the high frequencies, theyare significantly smaller and more manageable for an easieralignment.
3.2. Evaluating different �ltering strategies
Given the nature of the noise, we leveraged on the vast arse-nal of smoothing algorithms that are implemented in Mesh-Lab and tried what worked in the best way for our dataset.Each smoothing algorithm has different characteristics:
• Laplacian Smoothing; this is the classical Laplaciansmoothing [ABE97] that moves each vertex onto the av-erage position of their 1-ring adjacent vertices.
• HC Laplacian Smoothing; this is a improved version ofthe classical Laplacian smoothing, it exhibits less shrink-ing effects that the standard approach and has a better be-havior about oversmoothing [VMM99].
• Two Step Smoothing; this approach, described in [SB04],is based on the idea of operating in two phases: first thesmoothing the normals of the faces and then the fittingthe vertex position to a surface passing through this newnormal field. If the starting surface is not very noisy thisapproach it is strikingly able to preserve large high fre-quency features in a very good way (e.g. it can maintainlong sharp edges, while smoothing curved surfaces).
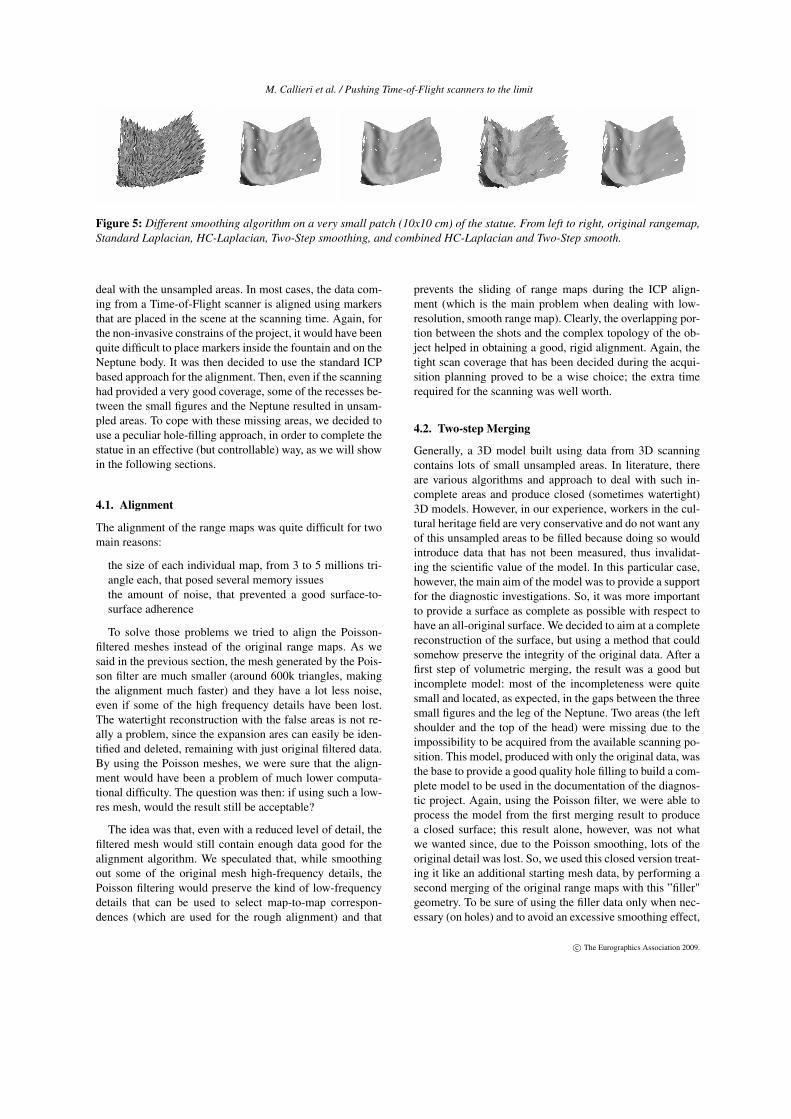
We carefully tested these smoothing filter in order to choosethe best combination for our particular case. In figure 5 weshow the application of the above smoothing filters over avery small (10x10cm) patch of the whole statue. From leftto right the depicted meshes represent:
• the original unsmoothed surface; note the high level ofnoise present in the patch;
• the surface after the application of a Laplacian smoothing.Most of the noise is gone, but also high frequencies havebeen affected. Moreover the surface suffered a significantshrinking.
• the surface after the application of a HC Laplaciansmoothing. Similar to the previous mesh, but with asmaller shrinking effect.
• the surface after a direct application of a Two-Stepsmoothing. Most of the noise is gone, but the excessivenoise of the starting mesh has biased the fitting procedureso the final mesh is affected by a significantly bad trian-gulation.
• the surface after the application of very moderate HCLaplacian smooth, that reduced only partially the noise,and the subsequent application of the Two-Step smooth-ing. The combined action of these two filters allow to re-cover at best the original surface: in this case we succeedto remove all the noise and to preserve large scale highfrequency features like the sharp valley and the crest onthe right side of the patch.
We want to remember that the proposed method works re-ally well only when the initial data is very dense. This kindof filtering heavily rely on the level of redundancy to be ableto eliminate the white noise in the acquisition. As a rule ofthumb, it is possible to say that, in order to work properly, theinitial sampling rate of the scanning should be at least twotimes the ”desired" level of precision. This may be not cove-nient, especially when using older (but quite common on thefield) Time-of-Flight scanners that are much slower than tri-angulation devices. However, depending on the project re-quirements, the result may be worth the extra time.
4. Complete Model Generation
Two problems were still open: how to manage the amount ofdata to be aligned in a common reference space and how to
c The Eurographics Association 2009.
M. Callieri et al. / Pushing Time-of-Flight scanners to the limit
Figure 5: Different smoothing algorithm on a very small patch (10x10 cm) of the statue. From left to right, original rangemap,Standard Laplacian, HC-Laplacian, Two-Step smoothing, and combined HC-Laplacian and Two-Step smooth.
deal with the unsampled areas. In most cases, the data com-ing from a Time-of-Flight scanner is aligned using markersthat are placed in the scene at the scanning time. Again, forthe non-invasive constrains of the project, it would have beenquite difficult to place markers inside the fountain and on theNeptune body. It was then decided to use the standard ICPbased approach for the alignment. Then, even if the scanninghad provided a very good coverage, some of the recesses be-tween the small figures and the Neptune resulted in unsam-pled areas. To cope with these missing areas, we decided touse a peculiar hole-filling approach, in order to complete thestatue in an effective (but controllable) way, as we will showin the following sections.
4.1. Alignment
The alignment of the range maps was quite difficult for twomain reasons:
� the size of each individual map, from 3 to 5 millions tri-angle each, that posed several memory issues
� the amount of noise, that prevented a good surface-to-surface adherence
To solve those problems we tried to align the Poisson-filtered meshes instead of the original range maps. As wesaid in the previous section, the mesh generated by the Pois-son filter are much smaller (around 600k triangles, makingthe alignment much faster) and they have a lot less noise,even if some of the high frequency details have been lost.The watertight reconstruction with the false areas is not re-ally a problem, since the expansion ares can easily be iden-tified and deleted, remaining with just original filtered data.By using the Poisson meshes, we were sure that the align-ment would have been a problem of much lower computa-tional difficulty. The question was then: if using such a low-res mesh, would the result still be acceptable?
The idea was that, even with a reduced level of detail, thefiltered mesh would still contain enough data good for thealignment algorithm. We speculated that, while smoothingout some of the original mesh high-frequency details, thePoisson filtering would preserve the kind of low-frequencydetails that can be used to select map-to-map correspon-dences (which are used for the rough alignment) and that
prevents the sliding of range maps during the ICP align-ment (which is the main problem when dealing with low-resolution, smooth range map). Clearly, the overlapping por-tion between the shots and the complex topology of the ob-ject helped in obtaining a good, rigid alignment. Again, thetight scan coverage that has been decided during the acqui-sition planning proved to be a wise choice; the extra timerequired for the scanning was well worth.
4.2. Two-step Merging
Generally, a 3D model built using data from 3D scanningcontains lots of small unsampled areas. In literature, thereare various algorithms and approach to deal with such in-complete areas and produce closed (sometimes watertight)3D models. However, in our experience, workers in the cul-tural heritage field are very conservative and do not want anyof this unsampled areas to be filled because doing so wouldintroduce data that has not been measured, thus invalidat-ing the scientific value of the model. In this particular case,however, the main aim of the model was to provide a supportfor the diagnostic investigations. So, it was more importantto provide a surface as complete as possible with respect tohave an all-original surface. We decided to aim at a completereconstruction of the surface, but using a method that couldsomehow preserve the integrity of the original data. After afirst step of volumetric merging, the result was a good butincomplete model: most of the incompleteness were quitesmall and located, as expected, in the gaps between the threesmall figures and the leg of the Neptune. Two areas (the leftshoulder and the top of the head) were missing due to theimpossibility to be acquired from the available scanning po-sition. This model, produced with only the original data, wasthe base to provide a good quality hole filling to build a com-plete model to be used in the documentation of the diagnos-tic project. Again, using the Poisson filter, we were able toprocess the model from the first merging result to producea closed surface; this result alone, however, was not whatwe wanted since, due to the Poisson smoothing, lots of theoriginal detail was lost. So, we used this closed version treat-ing it like an additional starting mesh data, by performing asecond merging of the original range maps with this ”filler"geometry. To be sure of using the filler data only when nec-essary (on holes) and to avoid an excessive smoothing effect,
c© The Eurographics Association 2009.
M. Callieri et al. / Pushing Time-of-Flight scanners to the limit
we assigned a very low weight to this additional geometry (1hundred times lower) with respect to the other range maps.
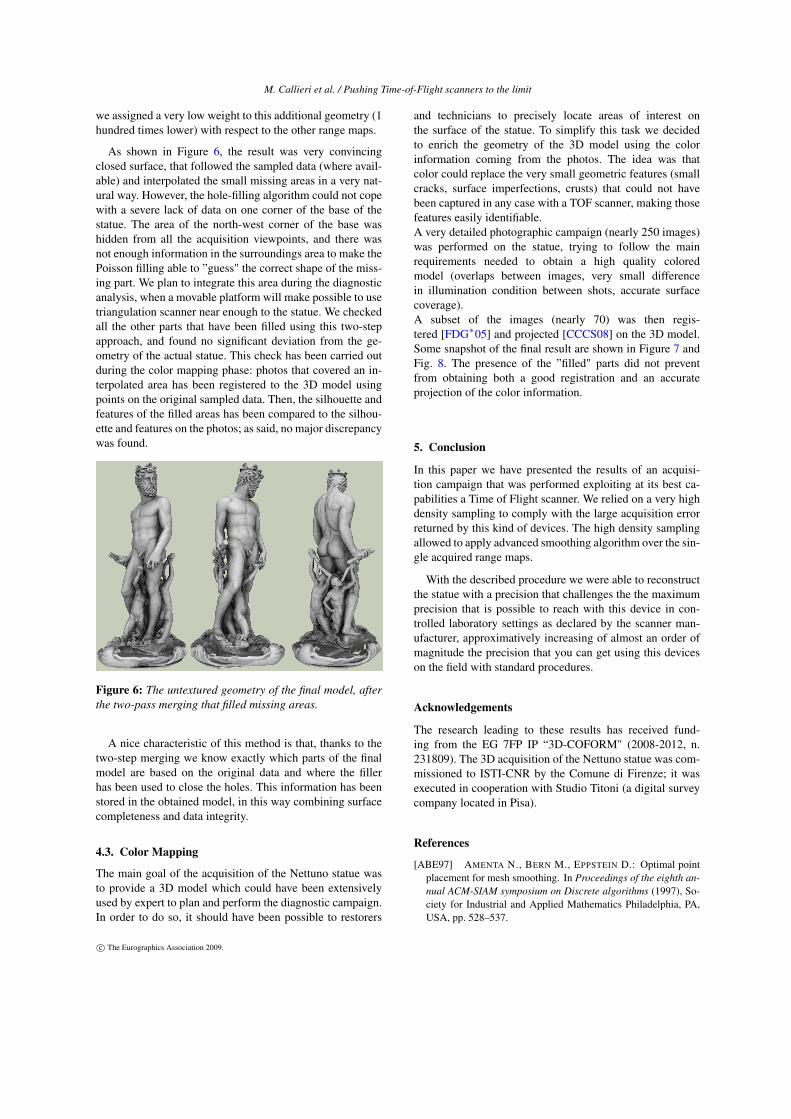
As shown in Figure 6, the result was very convincingclosed surface, that followed the sampled data (where avail-able) and interpolated the small missing areas in a very nat-ural way. However, the hole-filling algorithm could not copewith a severe lack of data on one corner of the base of thestatue. The area of the north-west corner of the base washidden from all the acquisition viewpoints, and there wasnot enough information in the surroundings area to make thePoisson filling able to ”guess" the correct shape of the miss-ing part. We plan to integrate this area during the diagnosticanalysis, when a movable platform will make possible to usetriangulation scanner near enough to the statue. We checkedall the other parts that have been filled using this two-stepapproach, and found no significant deviation from the ge-ometry of the actual statue. This check has been carried outduring the color mapping phase: photos that covered an in-terpolated area has been registered to the 3D model usingpoints on the original sampled data. Then, the silhouette andfeatures of the filled areas has been compared to the silhou-ette and features on the photos; as said, no major discrepancywas found.
Figure 6: The untextured geometry of the final model, afterthe two-pass merging that filled missing areas.
A nice characteristic of this method is that, thanks to thetwo-step merging we know exactly which parts of the finalmodel are based on the original data and where the fillerhas been used to close the holes. This information has beenstored in the obtained model, in this way combining surfacecompleteness and data integrity.
4.3. Color Mapping
The main goal of the acquisition of the Nettuno statue wasto provide a 3D model which could have been extensivelyused by expert to plan and perform the diagnostic campaign.In order to do so, it should have been possible to restorers
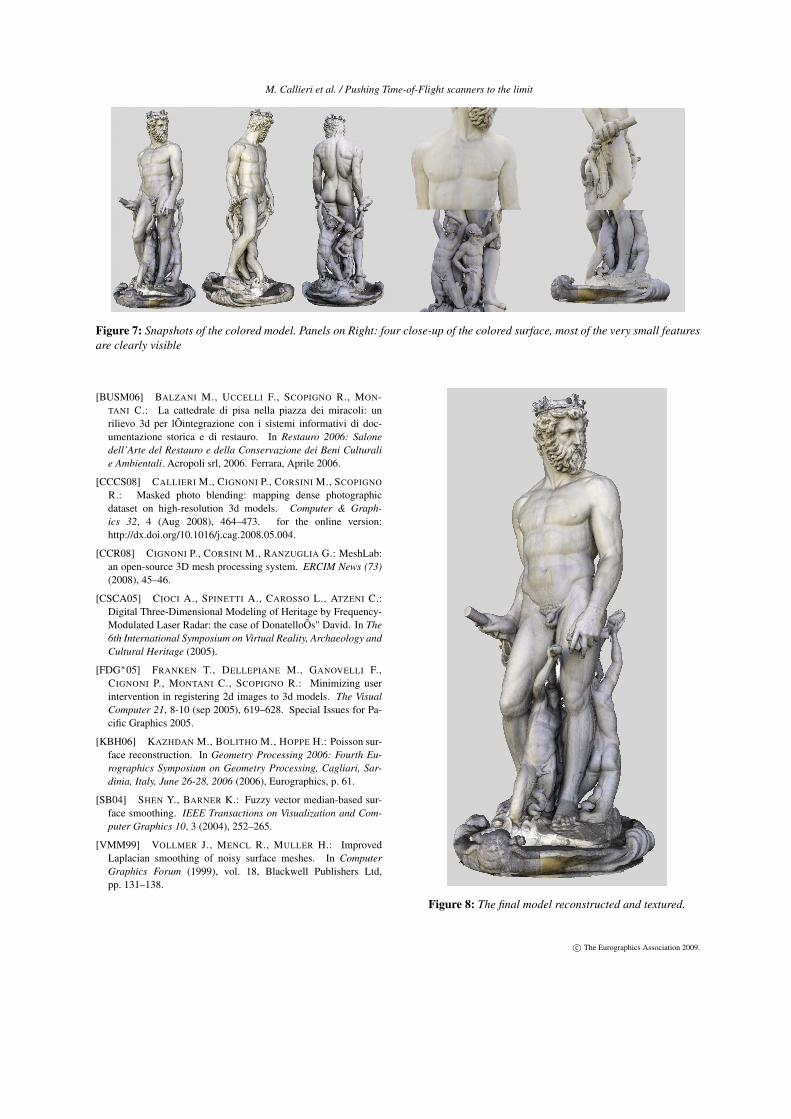
and technicians to precisely locate areas of interest onthe surface of the statue. To simplify this task we decidedto enrich the geometry of the 3D model using the colorinformation coming from the photos. The idea was thatcolor could replace the very small geometric features (smallcracks, surface imperfections, crusts) that could not havebeen captured in any case with a TOF scanner, making thosefeatures easily identifiable.A very detailed photographic campaign (nearly 250 images)was performed on the statue, trying to follow the mainrequirements needed to obtain a high quality coloredmodel (overlaps between images, very small differencein illumination condition between shots, accurate surfacecoverage).A subset of the images (nearly 70) was then regis-tered [FDG∗05] and projected [CCCS08] on the 3D model.Some snapshot of the final result are shown in Figure 7 andFig. 8. The presence of the ”filled" parts did not preventfrom obtaining both a good registration and an accurateprojection of the color information.
5. Conclusion
In this paper we have presented the results of an acquisi-tion campaign that was performed exploiting at its best ca-pabilities a Time of Flight scanner. We relied on a very highdensity sampling to comply with the large acquisition errorreturned by this kind of devices. The high density samplingallowed to apply advanced smoothing algorithm over the sin-gle acquired range maps.
With the described procedure we were able to reconstructthe statue with a precision that challenges the the maximumprecision that is possible to reach with this device in con-trolled laboratory settings as declared by the scanner man-ufacturer, approximatively increasing of almost an order ofmagnitude the precision that you can get using this deviceson the field with standard procedures.
Acknowledgements
The research leading to these results has received fund-ing from the EG 7FP IP “3D-COFORM" (2008-2012, n.231809). The 3D acquisition of the Nettuno statue was com-missioned to ISTI-CNR by the Comune di Firenze; it wasexecuted in cooperation with Studio Titoni (a digital surveycompany located in Pisa).
References
[ABE97] AMENTA N., BERN M., EPPSTEIN D.: Optimal pointplacement for mesh smoothing. In Proceedings of the eighth an-nual ACM-SIAM symposium on Discrete algorithms (1997), So-ciety for Industrial and Applied Mathematics Philadelphia, PA,USA, pp. 528–537.
c The Eurographics Association 2009.
M. Callieri et al. / Pushing Time-of-Flight scanners to the limit
Figure 7: Snapshots of the colored model. Panels on Right: four close-up of the colored surface, most of the very small featuresare clearly visible
[BUSM06] BALZANI M., UCCELLI F., SCOPIGNO R., MON-TANI C.: La cattedrale di pisa nella piazza dei miracoli: unrilievo 3d per lÕintegrazione con i sistemi informativi di doc-umentazione storica e di restauro. In Restauro 2006: Salonedell'Arte del Restauro e della Conservazione dei Beni Culturalie Ambientali. Acropoli srl, 2006. Ferrara, Aprile 2006.
[CCCS08] CALLIERI M., CIGNONI P., CORSINI M., SCOPIGNO
R.: Masked photo blending: mapping dense photographicdataset on high-resolution 3d models. Computer & Graph-ics 32, 4 (Aug 2008), 464–473. for the online version:http://dx.doi.org/10.1016/j.cag.2008.05.004.
[CCR08] CIGNONI P., CORSINI M., RANZUGLIA G.: MeshLab:an open-source 3D mesh processing system. ERCIM News (73)(2008), 45–46.
[CSCA05] CIOCI A., SPINETTI A., CAROSSO L., ATZENI C.:Digital Three-Dimensional Modeling of Heritage by Frequency-Modulated Laser Radar: the case of DonatelloÕs" David. In The6th International Symposium on Virtual Reality, Archaeology andCultural Heritage (2005).
[FDG�05] FRANKEN T., DELLEPIANE M., GANOVELLI F.,CIGNONI P., MONTANI C., SCOPIGNO R.: Minimizing userintervention in registering 2d images to 3d models. The VisualComputer 21, 8-10 (sep 2005), 619–628. Special Issues for Pa-cific Graphics 2005.
[KBH06] KAZHDAN M., BOLITHO M., HOPPE H.: Poisson sur-face reconstruction. In Geometry Processing 2006: Fourth Eu-rographics Symposium on Geometry Processing, Cagliari, Sar-dinia, Italy, June 26-28, 2006 (2006), Eurographics, p. 61.
[SB04] SHEN Y., BARNER K.: Fuzzy vector median-based sur-face smoothing. IEEE Transactions on Visualization and Com-puter Graphics 10, 3 (2004), 252–265.
[VMM99] VOLLMER J., MENCL R., MULLER H.: ImprovedLaplacian smoothing of noisy surface meshes. In ComputerGraphics Forum (1999), vol. 18, Blackwell Publishers Ltd,pp. 131–138.
Figure 8: The final model reconstructed and textured.
c The Eurographics Association 2009.


