Embed Size (px)
Citation preview
1
PULLOUT STRENGTH OF NSM CFRP STRIPS BONDED TO
VINTAGE CLAY BRICK MASONRY
Dizhura D., Griffithb M. C. and Inghama J. M.
a Department of Civil and Environmental Engineering, The University of Auckland, Private Bag 92019, Auckland 1142, New
Zealand
b School of Civil, Environmental and Mining Engineering, The University of Adelaide, Australia
ABSTRACT
The frequently observed inadequate seismic performance of unreinforced masonry (URM)
buildings necessitates the development of cost effective minimally-invasive seismic improvement
techniques for this type of construction. One promising solution is use of the near surface
mounted (NSM) technique to incorporate fibre reinforced polymers (FRP) strips as longitudinal
reinforcement. In particular, the NSM technique provides several advantages over externally
bonded (EB) FRP as a seismic improvement technique including significantly higher axial strain
at debonding, minimal negative impact upon the aesthetics of the structure, reduced installation
time, and superior protection from fire and the environment, thus providing a cost effective and
minimally-invasive option for seismically strengthening URM buildings. An experimental
program consisting of 39 pull tests was conducted using NSM carbon (C)FRP strips bonded to
vintage solid clay brick masonry, to provide data with which to validate the accuracy of existing
predictive FRP-to-masonry bond models. Based on experimental findings, a variation of an
existing analytical FRP-to-masonry bond model is proposed and the effects of geometric
variation of the NSM groove and the reinforcing CFRP strip are discussed.
Keywords: Historic masonry, clay brick, bond strength, unreinforced masonry (URM), seismic retrofit, near surface mounting (NSM), carbon fibre reinforced polymers (CFRP)

2
1 BACKGROUND
It is well known and was once again highlighted during the 2010 M7.1 Darfield (New Zealand)
earthquake [1] and subsequent 2011 M6.3 aftershock [2], that unreinforced masonry (URM)
construction often has insufficient strength to resist lateral earthquake forces in high and
moderate seismic zones [3-5]. One of the most critical deficiencies of URM buildings is the lack
of wall-diaphragm connections, but once added, it is the out-of-plane bending failure mechanism
and subsequent wall collapse that poses the greatest risk to both the building’s occupants and to
passers-by [6]. To mitigate this risk, various seismic improvement techniques have been
developed over the decades. One such established technique for strengthening and increasing the
ductility capacity of URM walls subjected to earthquake loading is the use of fibre reinforced
polymer (FRP) material. Externally bonded (EB) FRP sheets or plates [7, 8] and, more recently,
near-surface mounted (NSM) FRP bars or strips are the two FRP application techniques that are
commonly used. Using the NSM strip technique provides several advantages over the EB
technique, including significantly higher axial strain at debonding, minimal negative impact upon
the aesthetics of the structure, reduced installation time, and superior protection from fire and
the environment [9, 10], thus providing a cost effective and minimally-invasive option for
seismically strengthening URM buildings. It is typically assumed that a horizontal crack at
approximately wall mid-height will initially develop at a low level of out-of-plane loading applied
to a vertically-spanning URM wall [11]. Hence, because vertical bending of URM walls is
typically critical, the application of vertically oriented strengthening elements to improve the
vertical bending capacity of such walls is most appropriate [12].
Accurately predicting the strength of the bond between an NSM FRP strip and the substrate
material is essential to ensure the effectiveness of the NSM CFRP strengthening. The
intermediate crack (IC) debonding mechanism [13] governs the increase in moment capacity and
ductility of structural sections strengthened using NSM FRP, and is considered to be the most
critical of the commonly observed debonding mechanisms. A good understanding of FRP-to-
concrete bond behaviour and the IC debonding mechanism has been achieved from extensive
previous research, as reported by Stone et al. [14] and Hassan and Rizkalla [15], with reliable
analytical predictive models for the IC debonding resistance also having being established [16].
Initial experimental validation of the use of NSM FRP as a technique for seismic improvement
3
of masonry focused on strengthening modern URM and involved simulation of the IC
debonding failure mechanism using simple monotonic pull tests [9, 17-19]. The observed failure
modes are categorised as: (i) IC debonding failure, where cracking propagated in the masonry; (ii)
Sliding failure, where failure occurred at the CFRP strip-adhesive interface; (iii) Rupture of the
CFRP strip. Subsequently, analytical models to predict the bond behaviour of modern masonry-
to-FRP were developed. However, the advances in the clay brick manufacturing process such us
the firing temperature, the use of chemical additives and stricter in place quality controls change
the physical and mechanical properties of clay brick masonry when compared to clay bricks
manufactured using traditional manufacturing processes approximately 100 years ago [20].
Hence, applicability of the developed models to the bond formed between NSM FRP and
vintage clay brick masonry requires further validation.
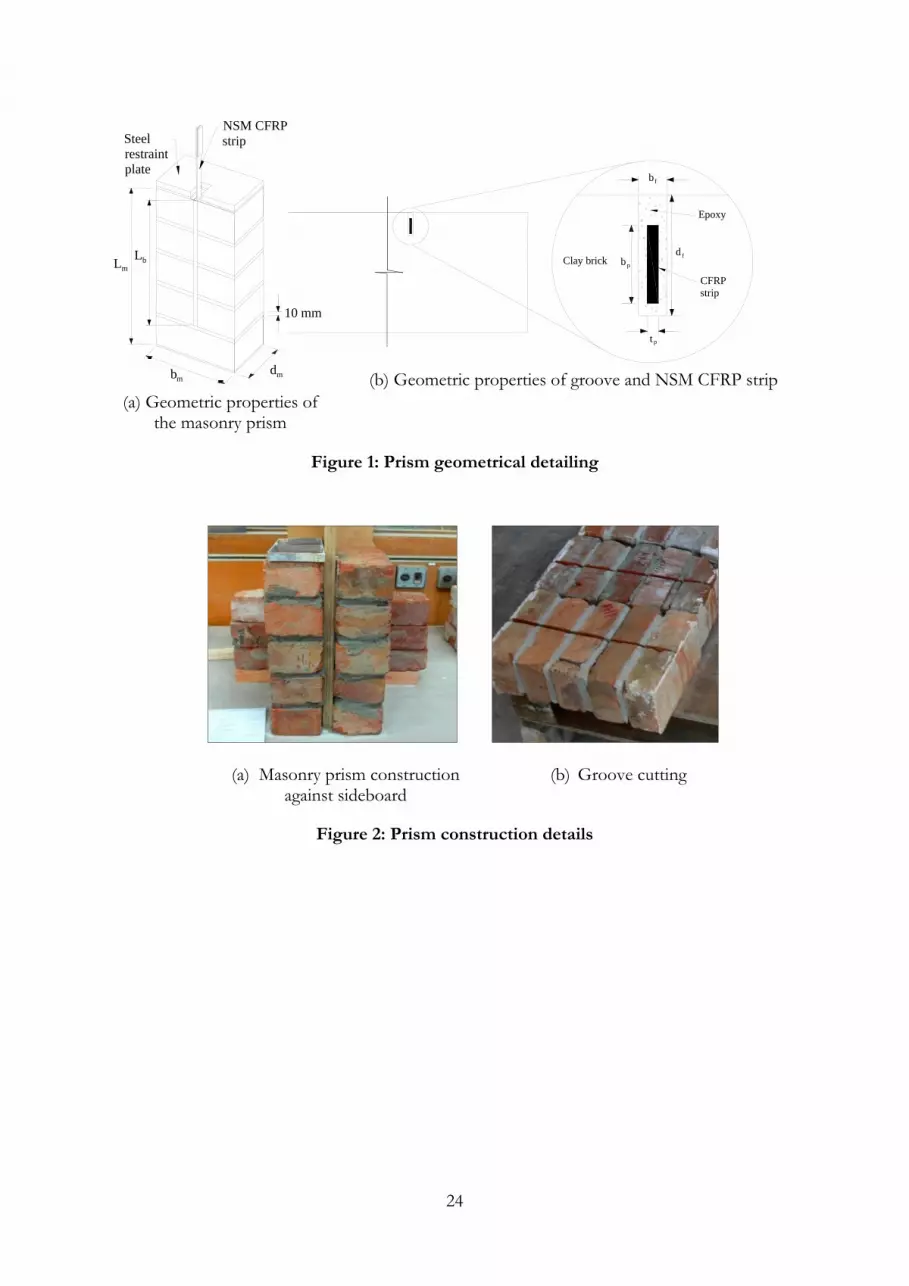
The strength of the FRP-to-masonry bond depends on the following parameters [10]: the groove
and the strip dimensions (see Figure 1), the tensile and shear strength of masonry and groove
filler, the level of preparation of the groove substrate and the position of the FRP strip within
the member being strengthened. Previously conducted research was undertaken using a variety
of test setups, with the most common procedures including small-scale simple block pull tests
[10, 21], beam tests [15, 22] and full scale walls loaded out-of-plane [7, 12]. Although beam tests
and full scale wall tests are typically considered to provide better representation of how the IC
debonding mechanism develops during an earthquake, these test methods are both time
consuming and expensive to prepare and undertake. Previous small-scale experimental pull tests
considering the FRP to masonry bond behaviour [9, 17-19] included a limited range of brick
strength (brick modulus of rupture strength ranging from 3.41 MPa to 3.57 MPa) and a limited
variation of geometric parameters, and therefore further research is warranted.
A companion study to the research conducted by Petersen et al. [9], Willis et al. [18] and
Kashyap et al. [17] is reported here, that entailed the use of small-scale monotonic pull tests. This
4
test method was adopted as it permitted a greater number of tests and a wider range of variables
to be considered in comparison to the testing of masonry beams or full-scale walls. As no
standard testing procedure currently exists pertaining to the method of testing, a large number of
different experimental test setups have previously been adopted by various researchers studying
the bond strength of FRP-to-concrete and FRP-to-masonry joints. During previous experimental
and numerical studies on the bond strength of FRP-to-concrete joints, it was shown that the
variation in test setup used can result in substantial differences in the produced test results [23].
The near-end supported single shear pull test setup appears to be the most popular test setup
due to its simplicity and proven reliability [24]. It is recognised that this type of single shear pull
test setup, that is near-end supported with the masonry in compression, does not necessarily
accurately represent a URM wall loaded out-of-plane, where the zone containing the NSM CFRP
strip is in tension. However, due to the simplicity and reliability of this test setup and the ability
to make direct comparison to the aforementioned studies previously conducted by other [9, 17,
18] the near-end supported single shear pull test setup was selected for the experimental study
reported herein. The experimental study reported here consisted of 39 pull-test prisms and the
aim of the experimental study was also to investigate the influence of the brick compressive
strength and geometric parameters of the FRP strip and the cut groove on the FRP-to-masonry
bond. Also, the aim of the experimental study was to acquire experimental results to allow
interrogation of the adequacy of existing bond behavioural models of NSM FRP when bonded
to vintage clay brick masonry, with the intention of incorporating the model into design
guidelines for the seismic strengthening of multi-leaf (also referred to as ‘multi-wythe’) clay brick
URM building components.
5
2 EXPERIMENTAL PROGRAM
2.1 Material Characterisation
Six brick types with varying mechanical properties were used in the experimental study. All brick
types consisted of solid clay bricks with typical nominal dimensions of 230 × 110 × 75 mm, that
were sourced and recycled from historic URM buildings located in various parts of New
Zealand, with the details of brick origin and building construction date given in Table 1. The
mortar mix used in the construction of the masonry prisms had a 1:2:6 ratio by volume of
Portland cement, hydrated lime and sand. A stronger mortar mix was adopted in comparison to
that suggested for replicating historic masonry [25] in order to reduce the risk of damage during
prism relocation and positioning. The adopted mortar mix is expected to have a minimal effect
on the test results due to the relatively small portion of bond area where the mortar joints
intersected with the FRP strip in comparison to the bond area associated with intersection
between the clay bricks and FRP. Willis et al. [18] found that the contribution of the mortar
joints to the FRP-to-masonry bond strength was negligible. However, it is recognised that the
pull tests reported by Willis et al. [18] were conducted with the mortar joints being in a
compressive stress state due to the nature of test setup used. The tension state of masonry is
difficult to replicate in a practical manner for small scale tests. Hence, a full scale companion
study was conducted [26] in order to validate the realistic out-of-plane loading condition when
the masonry is in the tensile state.
Accurate material properties were established by testing the masonry prism assemblages and
their constituent materials. Individual bricks were subjected to the half brick compression (f’b)
test [27] whilst incorporating displacement gauges on either side of the half brick, allowing the
brick unit stress-strain relationship to be determined. From this data the brick unit Modulus of
Elasticity (Eb) was calculated using the stress-strain ordinates at 0.05f’b and 0.70f’b [20]. The
compressive strength of the mortar (f’j) was obtained through compression testing of 50 mm
mortar cubes [28] and the masonry prism compressive strength (f’m) was determined following
ASTM C 1314-03b [29]. Modulus of Rupture (f’rup) tests were also conducted on the bricks [27],
with results from the aforementioned tests summarised in Table 1.

6
Carbon FRP (C)FRP strips and a two-part epoxy based adhesive were used in this experimental
study due to their high tensile strength and wide availability. Alternative cement based grouts
were not considered in this experimental program due to their reduced tensile strength when
compared to two-part epoxy based adhesives [30]. In Table 2 the material properties of the
CFRP and the adhesive used in the experimental program, as provided in manufacturers’
specifications, are compared to experimentally obtained test values. It is also noted that the
rupture strain values obtained for the pull test prism C3-4-15-(6/20) compare well to the
experimentally obtained values reported in Table 2.
2.2 Pull test prisms
The experimental study consisted of two stages and the following variables were investigated: (i)
bond length of the strip (Lb) as illustrated in Figure 1(a); (ii) geometric properties of the
reinforcement CFRP strip (bp and tp as shown in Figure 1(b)); (iii) geometric properties of the cut
groove (df and bf as shown in Figure 1(b)); (iv) brick strength. Critical bond length (Le) was
initially estimated as 100 times the CFRP strip thickness, tp [18]. The 1.2 mm thickness of the
CFRP strip resulted in the required critical bond length of 120 mm and hence masonry prisms
consisting of typically 3 bricks in height (approximately 260 mm). The testing consisted of 39
prisms, with the height of the masonry prisms typically increased to 5 bricks to ensure that the
bond length, Lb, was greater when compared to the critical bond length and to allow the bond
length to be a variable parameter. Table 3 conveys the details of all pull test prisms, with each
prism denoted with the following notation:
For example, A3-4-15 (5/25) denotes a prism 3 constructed using A group bricks, with a 15 mm
wide CFRP strip inserted into a 5 mm × 25 mm groove and bonded to the top four bricks.
A2-4-15 (5/25)
bpBrick group
bf/dfLb (No. of bricks)
7
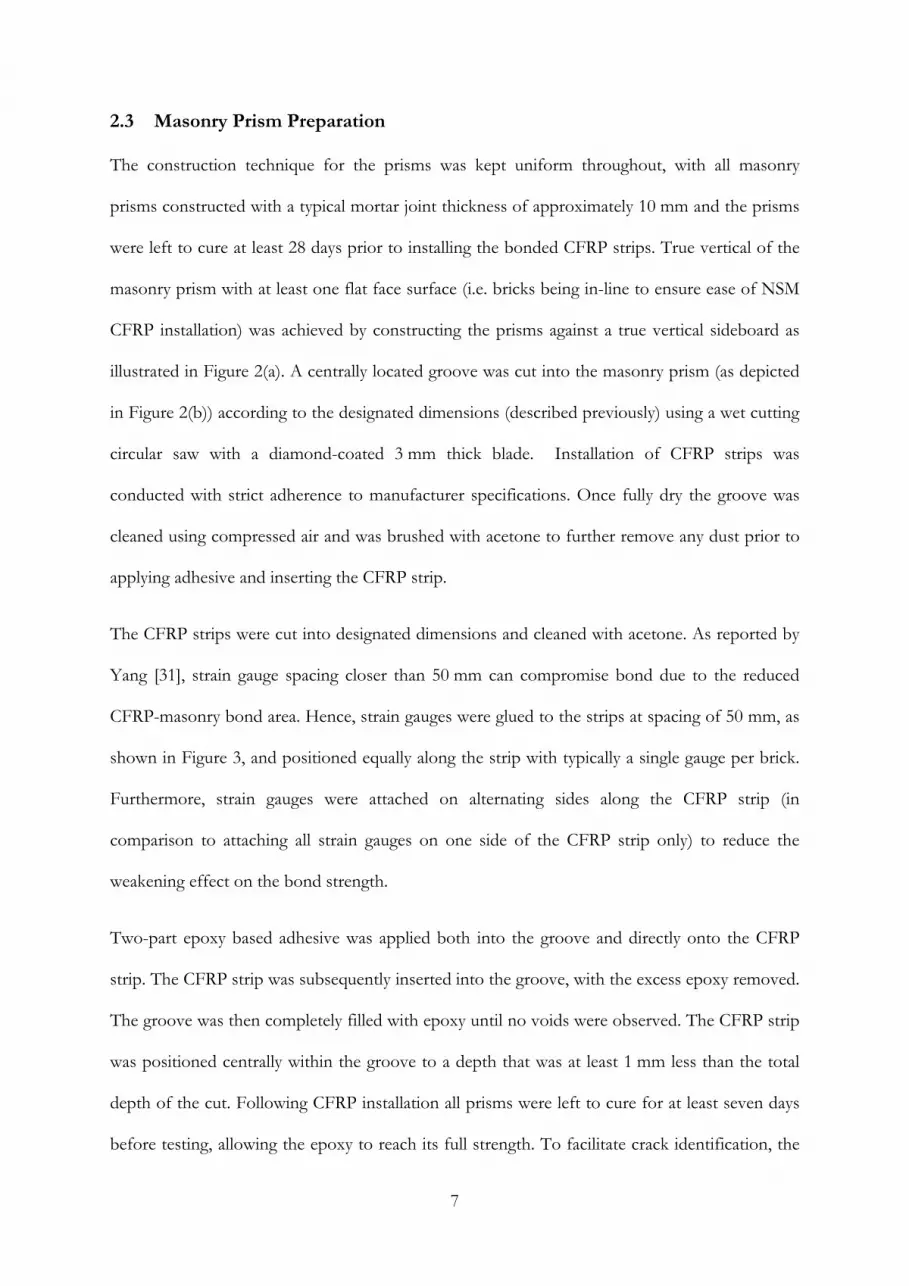
2.3 Masonry Prism Preparation
The construction technique for the prisms was kept uniform throughout, with all masonry
prisms constructed with a typical mortar joint thickness of approximately 10 mm and the prisms
were left to cure at least 28 days prior to installing the bonded CFRP strips. True vertical of the
masonry prism with at least one flat face surface (i.e. bricks being in-line to ensure ease of NSM
CFRP installation) was achieved by constructing the prisms against a true vertical sideboard as
illustrated in Figure 2(a). A centrally located groove was cut into the masonry prism (as depicted
in Figure 2(b)) according to the designated dimensions (described previously) using a wet cutting
circular saw with a diamond-coated 3 mm thick blade. Installation of CFRP strips was
conducted with strict adherence to manufacturer specifications. Once fully dry the groove was
cleaned using compressed air and was brushed with acetone to further remove any dust prior to
applying adhesive and inserting the CFRP strip.
The CFRP strips were cut into designated dimensions and cleaned with acetone. As reported by
Yang [31], strain gauge spacing closer than 50 mm can compromise bond due to the reduced
CFRP-masonry bond area. Hence, strain gauges were glued to the strips at spacing of 50 mm, as
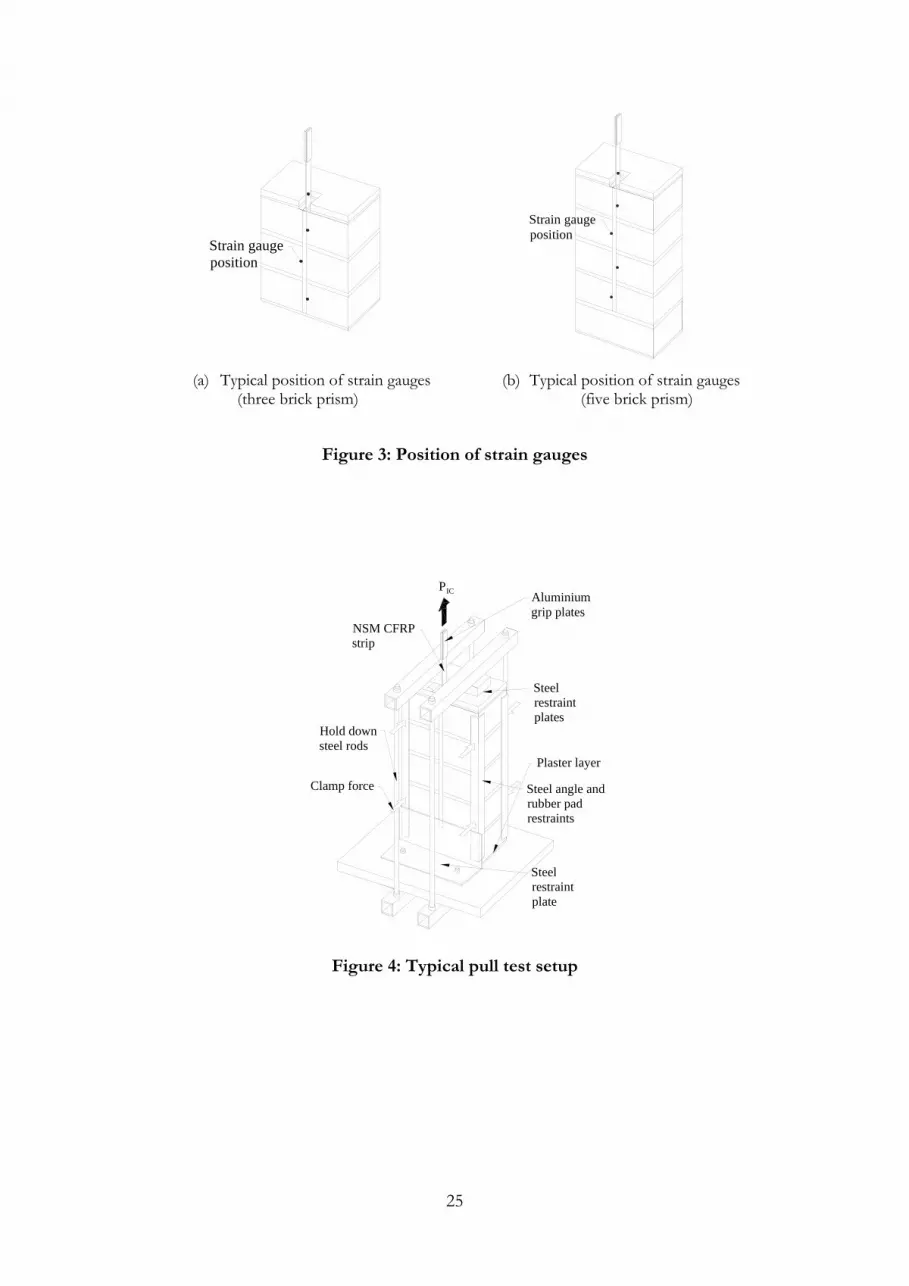
shown in Figure 3, and positioned equally along the strip with typically a single gauge per brick.
Furthermore, strain gauges were attached on alternating sides along the CFRP strip (in
comparison to attaching all strain gauges on one side of the CFRP strip only) to reduce the
weakening effect on the bond strength.
Two-part epoxy based adhesive was applied both into the groove and directly onto the CFRP
strip. The CFRP strip was subsequently inserted into the groove, with the excess epoxy removed.
The groove was then completely filled with epoxy until no voids were observed. The CFRP strip
was positioned centrally within the groove to a depth that was at least 1 mm less than the total
depth of the cut. Following CFRP installation all prisms were left to cure for at least seven days
before testing, allowing the epoxy to reach its full strength. To facilitate crack identification, the
8
front face (i.e. the face containing the CFRP strip) was painted white. The top and bottom of the
masonry prism were plastered prior to positioning into the test setup to ensure both a flat resting
surface and vertical and horizontal levelling, to minimise eccentricity and to limit bending
stresses in the prisms.
2.4 Test setup
Each prism was carefully positioned with the strip centred under the loading grips of the Instron
universal testing machine. From preliminary test trials it was established that gripping the CFRP
strip directly proved ineffective and slip occurred at loads above approximately 15 kN (on
average approximately 30% of the ultimate pull-out loads). To facilitate a greater distribution of
stress at the loaded end of the strip a pair of aluminium plates was attached to either side of the
CFRP strip using high strength instant adhesive.
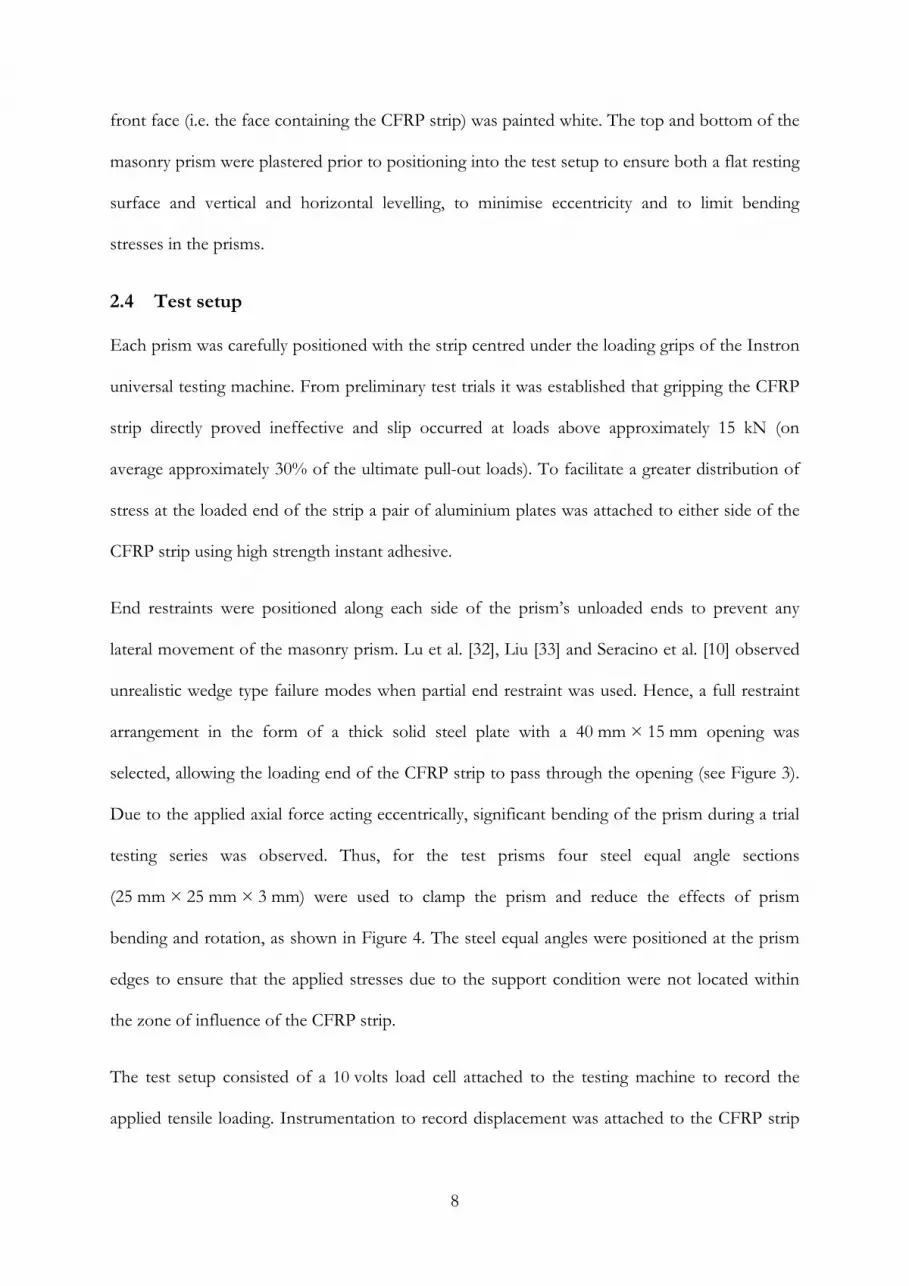
End restraints were positioned along each side of the prism’s unloaded ends to prevent any
lateral movement of the masonry prism. Lu et al. [32], Liu [33] and Seracino et al. [10] observed
unrealistic wedge type failure modes when partial end restraint was used. Hence, a full restraint
arrangement in the form of a thick solid steel plate with a 40 mm × 15 mm opening was
selected, allowing the loading end of the CFRP strip to pass through the opening (see Figure 3).
Due to the applied axial force acting eccentrically, significant bending of the prism during a trial
testing series was observed. Thus, for the test prisms four steel equal angle sections
(25 mm × 25 mm × 3 mm) were used to clamp the prism and reduce the effects of prism
bending and rotation, as shown in Figure 4. The steel equal angles were positioned at the prism
edges to ensure that the applied stresses due to the support condition were not located within
the zone of influence of the CFRP strip.
The test setup consisted of a 10 volts load cell attached to the testing machine to record the
applied tensile loading. Instrumentation to record displacement was attached to the CFRP strip
9
and to the steel restraint plate to record the movement of the CFRP strip relative to the masonry
substrate.
3 EXPERIMENTAL RESULTS
3.1 Failure Modes
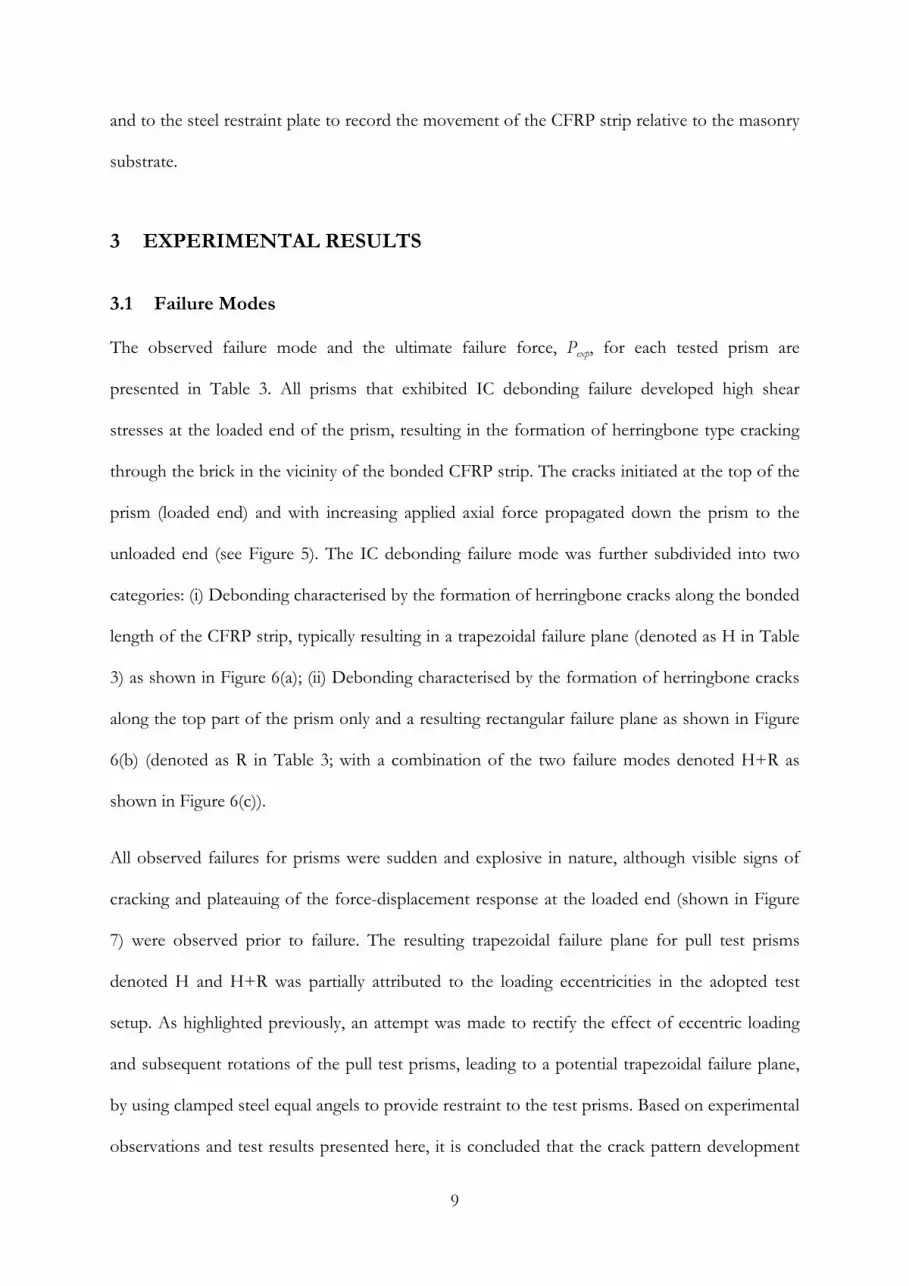
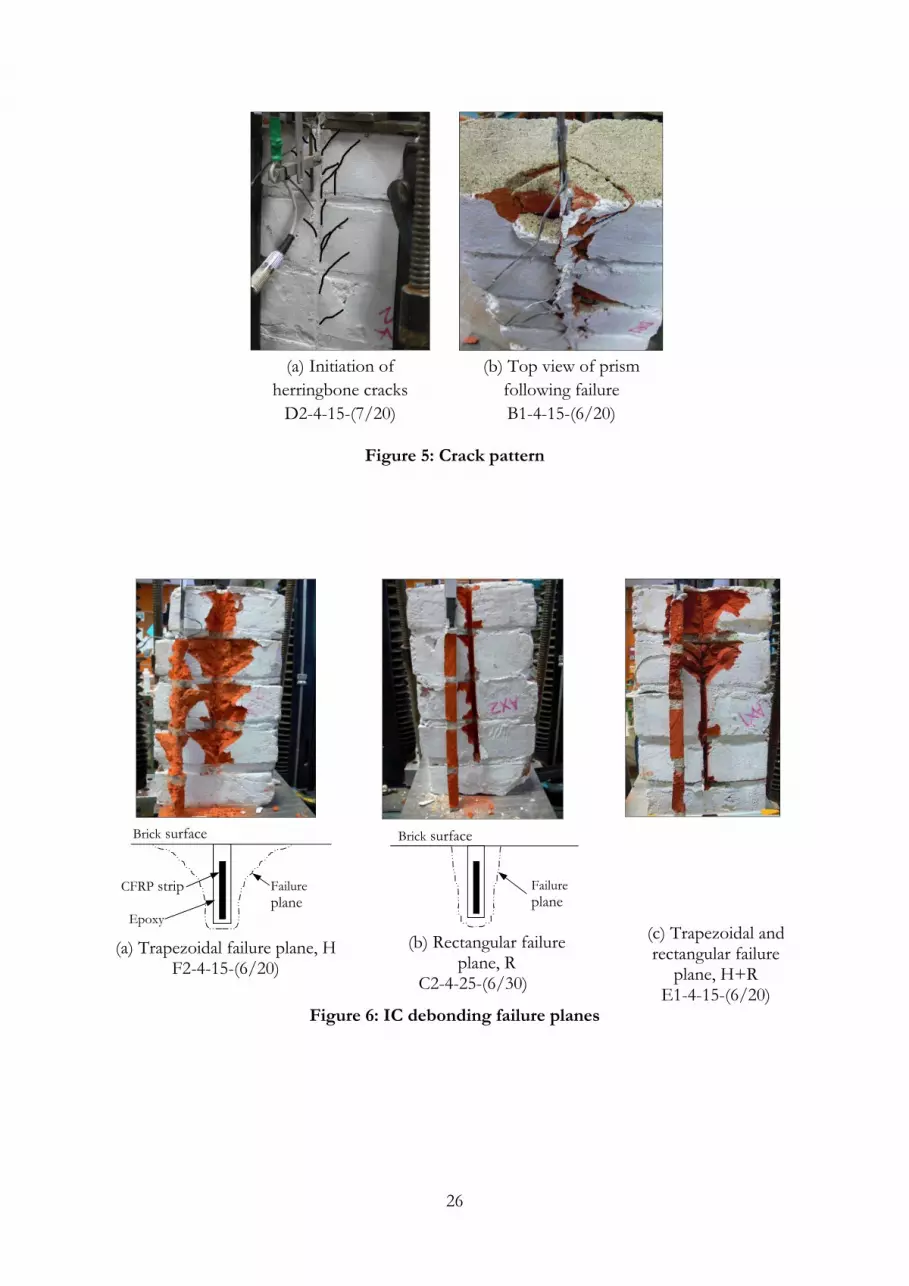
The observed failure mode and the ultimate failure force, Pexp, for each tested prism are
presented in Table 3. All prisms that exhibited IC debonding failure developed high shear
stresses at the loaded end of the prism, resulting in the formation of herringbone type cracking
through the brick in the vicinity of the bonded CFRP strip. The cracks initiated at the top of the
prism (loaded end) and with increasing applied axial force propagated down the prism to the
unloaded end (see Figure 5). The IC debonding failure mode was further subdivided into two
categories: (i) Debonding characterised by the formation of herringbone cracks along the bonded
length of the CFRP strip, typically resulting in a trapezoidal failure plane (denoted as H in Table
3) as shown in Figure 6(a); (ii) Debonding characterised by the formation of herringbone cracks
along the top part of the prism only and a resulting rectangular failure plane as shown in Figure
6(b) (denoted as R in Table 3; with a combination of the two failure modes denoted H+R as
shown in Figure 6(c)).
All observed failures for prisms were sudden and explosive in nature, although visible signs of
cracking and plateauing of the force-displacement response at the loaded end (shown in Figure
7) were observed prior to failure. The resulting trapezoidal failure plane for pull test prisms
denoted H and H+R was partially attributed to the loading eccentricities in the adopted test
setup. As highlighted previously, an attempt was made to rectify the effect of eccentric loading
and subsequent rotations of the pull test prisms, leading to a potential trapezoidal failure plane,
by using clamped steel equal angels to provide restraint to the test prisms. Based on experimental
observations and test results presented here, it is concluded that the crack pattern development
10
and the observed IC debonding failure planes were similar to those observed in pull-tests with
NSM CFRP bonded to concrete substrate (Seracino et al. 2007a), which highlights similarities of
the load transfer mechanism for the two construction materials.
The sliding failure mode was observed in 8 prisms. This type of failure mode was typically
observed for prisms having thick adhesive layers (df ≥ 9 mm) and for prisms with evidence of
poor adhesive bond to CFRP strips observed following testing. Due to under-utilisation of
adhesive material and the absence of failure warning signs, sliding failure is deemed undesirable
and should be avoided. The sliding failure mode is eluded by not using wide grooves and by
ensuring adequate preparation and cleaning of all bonded surfaces.
A NSM CFRP strip is able to develop higher axial strains in comparison to those developed
when using the EB technique due to greater confinement from the substrate material, hence
making it possible for rupture failure of the CFRP strip to occur. Rupture failure utilises the
CFRP material to the full capacity, but provides no visual warning of failure and hence should be
avoided in practical scenarios of masonry strengthening. Rupture failure was observed for prism
B10-4-25-(6/30) only.
3.2 Parametric Study of Bond Strength
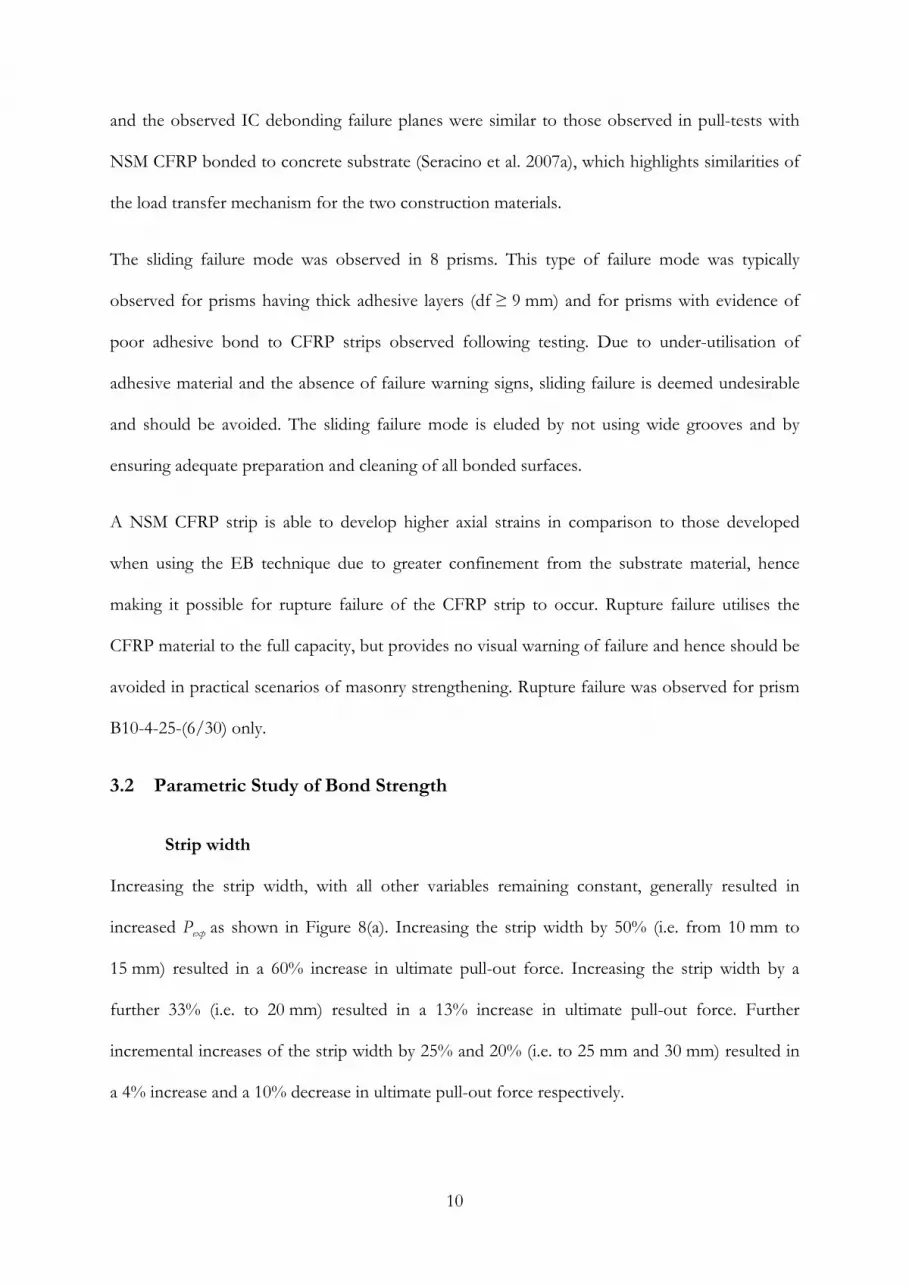
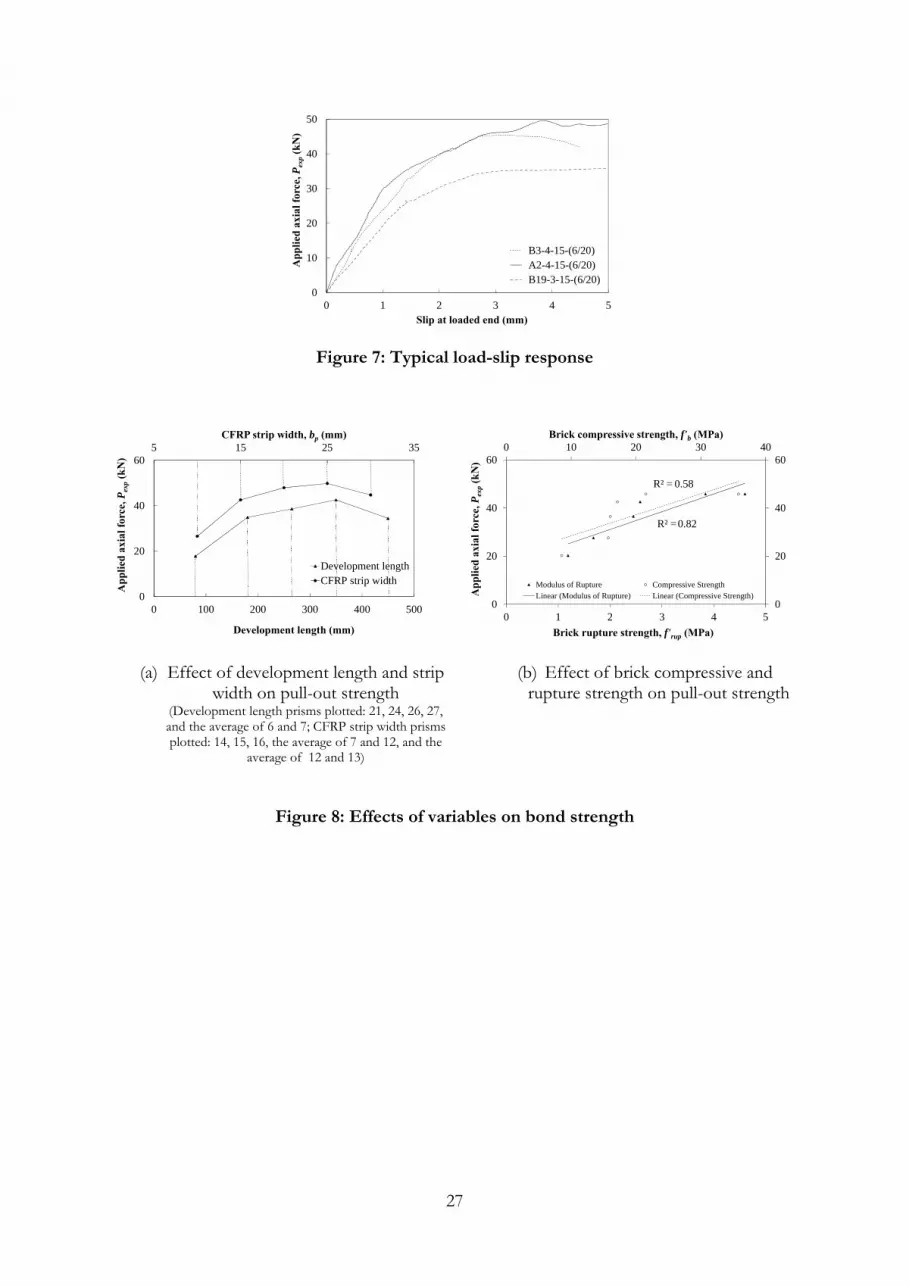
Strip width
Increasing the strip width, with all other variables remaining constant, generally resulted in
increased Pexp as shown in Figure 8(a). Increasing the strip width by 50% (i.e. from 10 mm to
15 mm) resulted in a 60% increase in ultimate pull-out force. Increasing the strip width by a
further 33% (i.e. to 20 mm) resulted in a 13% increase in ultimate pull-out force. Further
incremental increases of the strip width by 25% and 20% (i.e. to 25 mm and 30 mm) resulted in
a 4% increase and a 10% decrease in ultimate pull-out force respectively.
11
Masonry prisms strengthened using a 30 mm wide CFRP strip had a tendency to split fully in
half at failure. The split occurred at the location of the CFRP strip, resulting in the loss of strip
confinement, premature failure, and a subsequent decrease in load carrying capacity, and was
attributed to the narrow size of the prism (depth of groove cut being approximately one third of
a typically 110 mm wide brick). The premature failure and reduction in load carrying capacity of
masonry prisms strengthened using a 30 mm wide CFRP strip contradicts the observations made
by Seracino et al. [10] for concrete specimens, where the pull-out capacity increased at a higher
rate with increasing strip width due to greater confinement. However, it must be noted that the
depth of the groove cut was approximately 7% of the total specimen thickness for the tests
reported by Seracino et al. [10] in comparison to the depth of groove cut being approximately
30% of the prism thickness for the study reported here. Also, observations made by Seracino et
al. [10] suggest a trapezoidal (H) type failure plane in prisms strengthened using 20 mm wide
strips in comparison to rectangular (R) type failure for 10 mm and 15 mm wide CFRP strips. No
such correlation between the strip width and the type of failure planes (i.e. rectangular (R) or
trapezoidal (H)) can be made for masonry prisms tested as part of the experimental study
presented here.
Groove dimensions
The effect of the groove geometry on FRP to masonry bond was investigated as part of the
experimental program. The geometry of the CFRP strip remained constant and the groove
width, bf was increased from 3 mm to 12 mm in 3 mm increments. Based on the experimental
results, increasing groove width, bf had no influence on the ultimate applied pull-out axial force.
Prisms with groove thicknesses of 9 mm and 12 mm exhibited a sliding failure within the
adhesive layer with no decrease in the ultimate axial pull-out force when compared to prisms
with a narrower groove width.
12
Increasing the depth of the groove, df with CFRP strip geometry remaining constant did not
result in increased ultimate pull-out capacity and hence led to under-utilisation of adhesive
material and the initiation of premature brick splitting. As a result, it is recommended that the
groove depth be no greater than is required to accommodate the CFRP strip and that at least
5 mm of adhesive cover be provided for minimal protection of the CFRP strip from fire,
vandalism and exposure to environmental elements.
Brick strength
Increased brick strength with all other variables remaining constant generally resulted in
increased Pexp. From Figure 8(b) it is evident that the brick modulus of rupture versus
experimental axial force provided a linear fit with an R-squared value of 0.82 in comparison to an
R-squared value for the brick compression strength versus experimental axial force of 0.58. As
the herringbone crack formation in a direction perpendicular to the principal tensile stress is an
indication that the ultimate failure force is related to the brick tensile strength, a linear fit of the
experimental results to the brick modulus of rupture is expected.
Bond length
Experimental tests were conducted where all variables were held constant except for the bonded
length, Lb of the CFRP strip. As shown in Figure 8(a) (prisms 21, 24, 26, 27 and the average of 6
and 7), Pexp did not significantly increase when the critical bond length, Le was reached. It was
found that the critical bond length, Le was equal to the height of the prism, consisting of either
nb = 3 or 4 bricks.
3.3 Bond Interface Behaviour
All experimentally tested prisms had similar load-slip response at the loaded end, with the
representative response for 3 prisms shown in Figure 7. Increasing applied axial tension in the
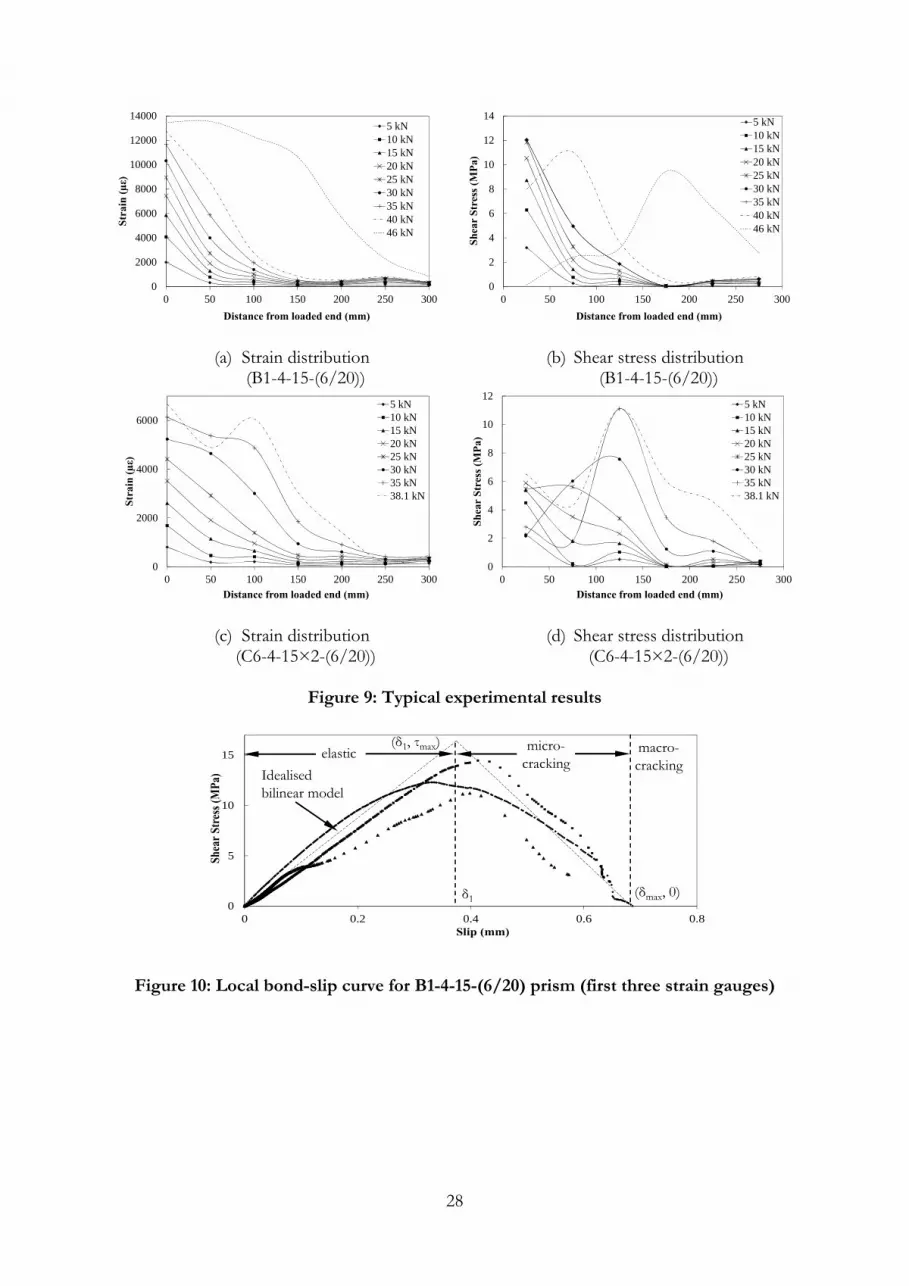
CFRP strip resulted in an increase of the axial strain along the CFRP strip. Two representative
examples of strain distribution along the CFRP strip with increased axial force are presented in
13
Figure 9. For prism B1-4-15-(6/20) (see Figure 9(a)) at maximum loading the strain plateaued at
approximatly 13,500 µε (80% of the rupture strain specified by the manufacturer). Similar
behaviour was observed for prism C6-4-15×2-(6/20) (see Figure 9(c)) with lower axial strain due
to the use of 2.4 mm thick CFRP strips.
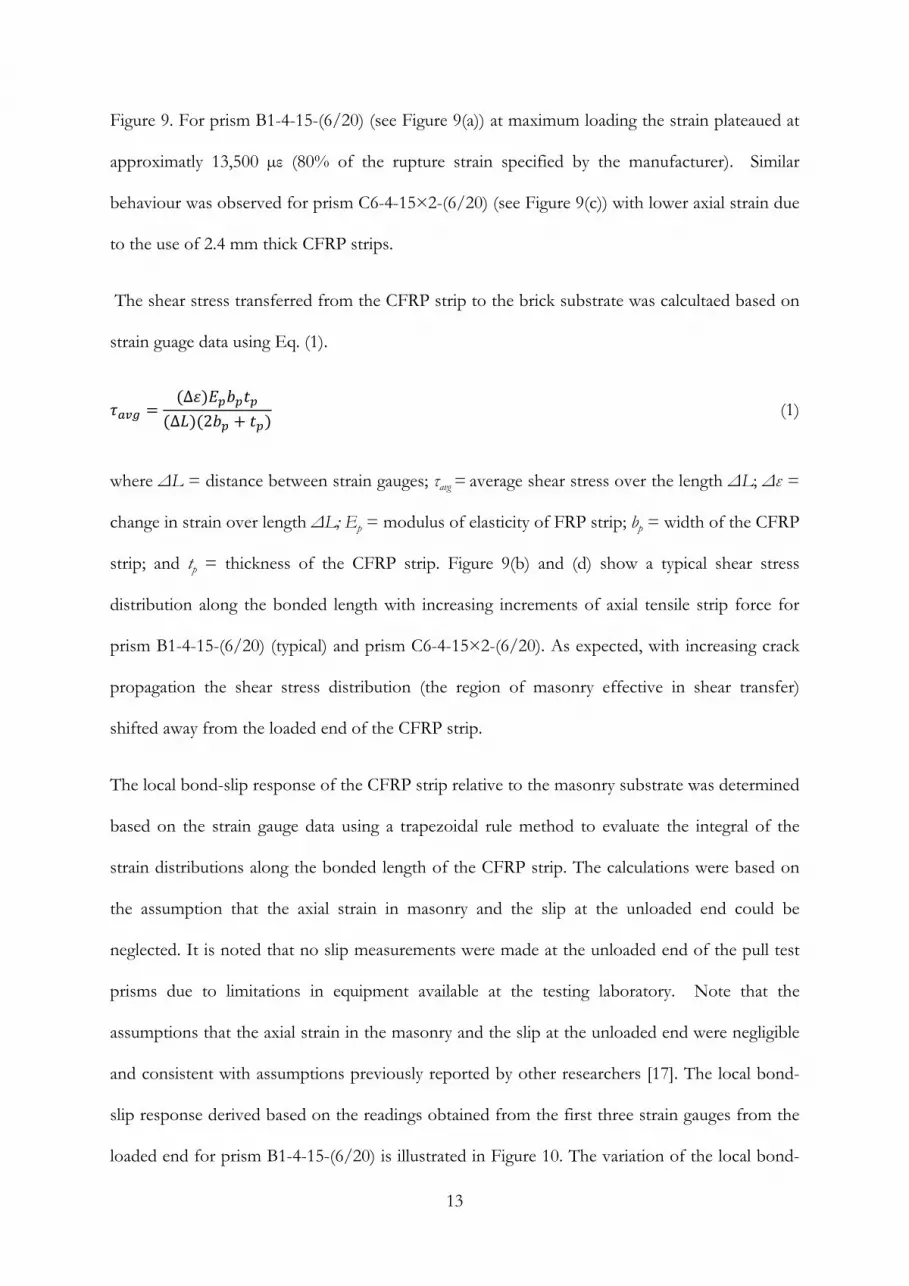
The shear stress transferred from the CFRP strip to the brick substrate was calcultaed based on
strain guage data using Eq. (1).
∆∆ 2
(1)
where ΔL = distance between strain gauges; τavg = average shear stress over the length ΔL; Δε =
change in strain over length ΔL; Ep = modulus of elasticity of FRP strip; bp = width of the CFRP
strip; and tp = thickness of the CFRP strip. Figure 9(b) and (d) show a typical shear stress
distribution along the bonded length with increasing increments of axial tensile strip force for
prism B1-4-15-(6/20) (typical) and prism C6-4-15×2-(6/20). As expected, with increasing crack
propagation the shear stress distribution (the region of masonry effective in shear transfer)
shifted away from the loaded end of the CFRP strip.
The local bond-slip response of the CFRP strip relative to the masonry substrate was determined
based on the strain gauge data using a trapezoidal rule method to evaluate the integral of the
strain distributions along the bonded length of the CFRP strip. The calculations were based on
the assumption that the axial strain in masonry and the slip at the unloaded end could be
neglected. It is noted that no slip measurements were made at the unloaded end of the pull test
prisms due to limitations in equipment available at the testing laboratory. Note that the
assumptions that the axial strain in the masonry and the slip at the unloaded end were negligible
and consistent with assumptions previously reported by other researchers [17]. The local bond-
slip response derived based on the readings obtained from the first three strain gauges from the
loaded end for prism B1-4-15-(6/20) is illustrated in Figure 10. The variation of the local bond-
14
slip response was observed in all prisms instrumented with strain gauges, with the local bond-slip
response typically decreasing with increasing distance towards the unloaded end of the CFRP
strip. This variation was partially attributed to the inability of the data logging equipment to
record the rapid change in strain that occurred once the cracking had propagated well into the
top 2-3 bricks and immediately prior to sudden explosive failure. The variation in the local bond-
slip response within the top portion of the bonded length (i.e. top three strain gauges) was
insignificant for all prisms and was attributed to the slight variation in strain gauge spacing and
the local variation in brick tensile strength and/or location of crack formation. Based on local
bond-slip response for all prisms instrumented with strain gauges, three stages for the load
transfer mechanism (i.e. elastic, microcracking and macrockracking) for NSM FRP bonded to
concrete, as suggested by Yuan et al. [34], are also applicable to vintage clay brick masonry.
These stages are defined in Figure 10 for the experimentally obtained local-slip versus shear
stress response. The average maximum shear stress for prisms B1-4-15-(6/20), C6-4-15×2-
(6/20) and B15-4-15×2-(7/20) was 12.7 MPa, 11.9 MPa and 10.5 MPa respectively.
3.4 Predictive Models
The behaviour of bond between FRP and concrete has been previously studied in substantial
detail, resulting in numerous experimental and theoretical data, and published textbooks by Teng
et al. [35] and Oehlers and Seracino [36]. From current literature, numerous models are available
that are specific for EB FRP bonded to concrete and are well reviewed by Smith and Teng [37],
Lu et al. [32], Karbhari et al. [38] and Sayed-Ahmed et al. [39]. Specific analytical models
developed for the response of the NSM retrofit technique are reported by Blaschko [21], Hassan
and Rizkalla [15] and Seracino et al. [10, 16]. Models proposed by Bleshenko [21] (considering
adhesive properties only) and Hassan and Rizkalla [15] (pure shear stress state of concrete
assumed) are limited only to the failure modes observed by the authors and are not always
consistent with failure modes observed in other experimental tests [9, 10, 17, 18].
15
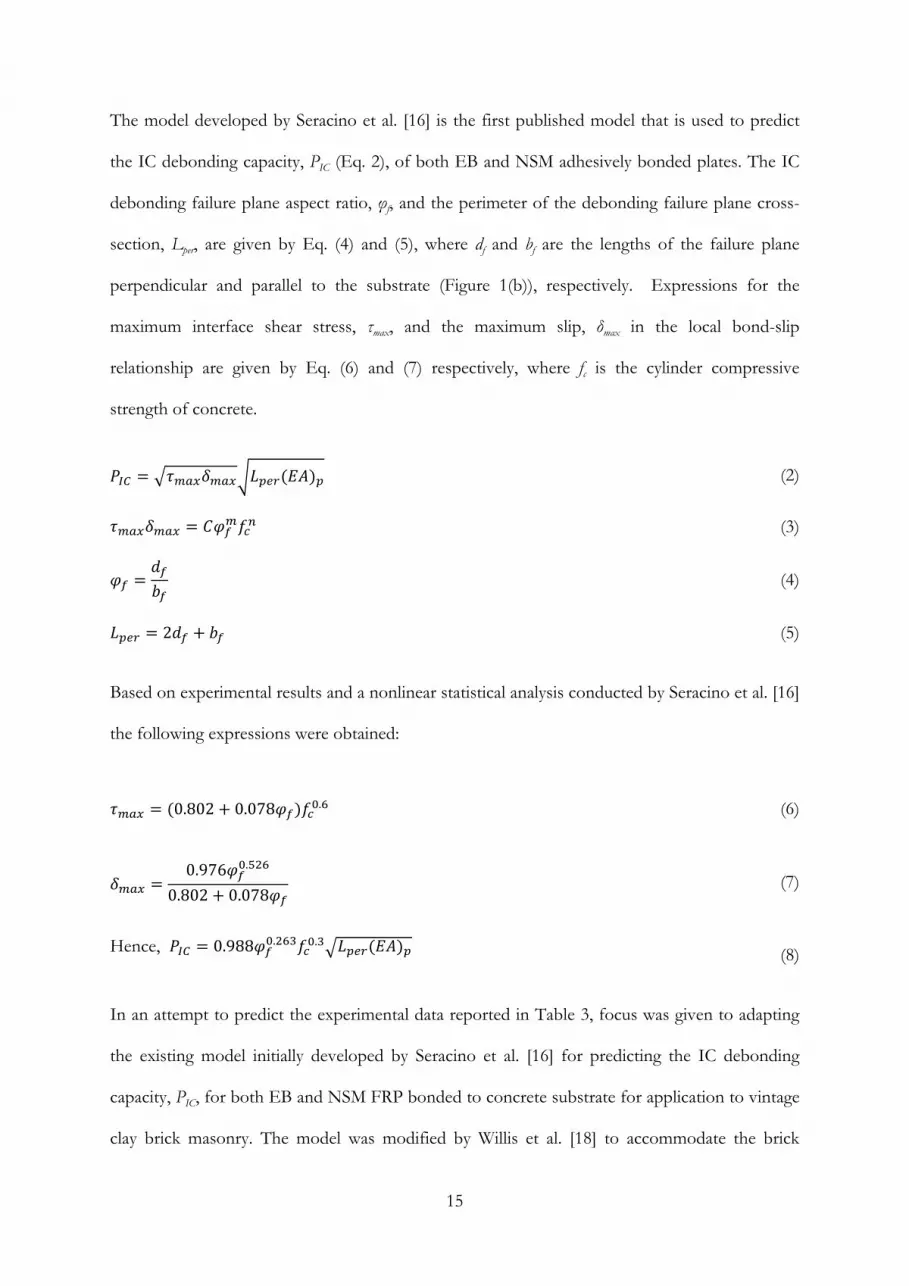
The model developed by Seracino et al. [16] is the first published model that is used to predict
the IC debonding capacity, PIC (Eq. 2), of both EB and NSM adhesively bonded plates. The IC
debonding failure plane aspect ratio, φf, and the perimeter of the debonding failure plane cross-
section, Lper, are given by Eq. (4) and (5), where df and bf are the lengths of the failure plane
perpendicular and parallel to the substrate (Figure 1(b)), respectively. Expressions for the
maximum interface shear stress, τmax, and the maximum slip, δmax in the local bond-slip
relationship are given by Eq. (6) and (7) respectively, where fc is the cylinder compressive
strength of concrete.
(2)
(3)
(4)
2 (5)
Based on experimental results and a nonlinear statistical analysis conducted by Seracino et al. [16]
the following expressions were obtained:
0.802 0.078 . (6)
0.976 .
0.802 0.078 (7)
Hence, 0.988 . . (8)
In an attempt to predict the experimental data reported in Table 3, focus was given to adapting
the existing model initially developed by Seracino et al. [16] for predicting the IC debonding
capacity, PIC, for both EB and NSM FRP bonded to concrete substrate for application to vintage
clay brick masonry. The model was modified by Willis et al. [18] to accommodate the brick
16
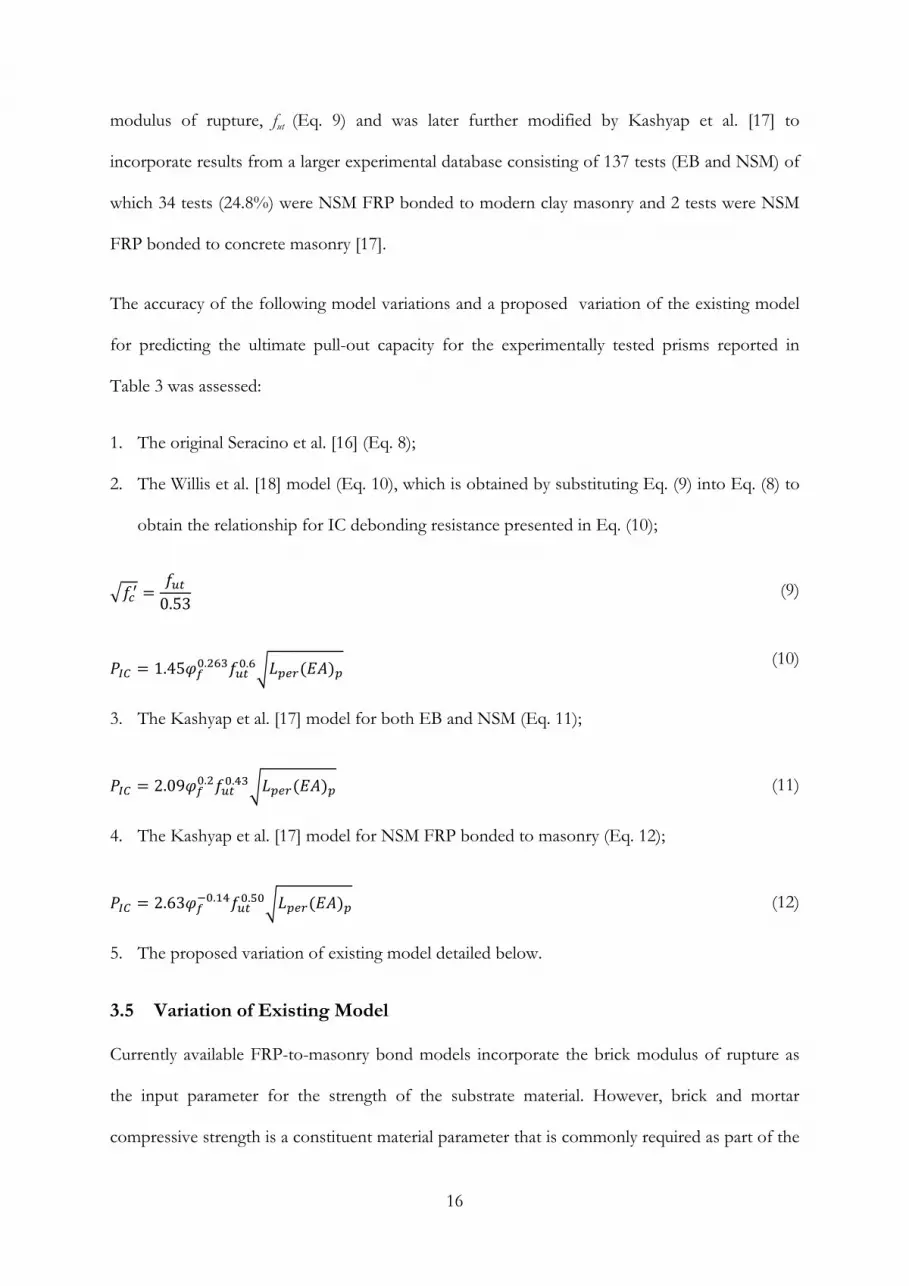
modulus of rupture, fut (Eq. 9) and was later further modified by Kashyap et al. [17] to
incorporate results from a larger experimental database consisting of 137 tests (EB and NSM) of
which 34 tests (24.8%) were NSM FRP bonded to modern clay masonry and 2 tests were NSM
FRP bonded to concrete masonry [17].
The accuracy of the following model variations and a proposed variation of the existing model
for predicting the ultimate pull-out capacity for the experimentally tested prisms reported in
Table 3 was assessed:
1. The original Seracino et al. [16] (Eq. 8);
2. The Willis et al. [18] model (Eq. 10), which is obtained by substituting Eq. (9) into Eq. (8) to
obtain the relationship for IC debonding resistance presented in Eq. (10);
0.53 (9)
1.45 . . (10)
3. The Kashyap et al. [17] model for both EB and NSM (Eq. 11);
2.09 . . (11)
4. The Kashyap et al. [17] model for NSM FRP bonded to masonry (Eq. 12);
2.63 . . (12)
5. The proposed variation of existing model detailed below.
3.5 Variation of Existing Model
Currently available FRP-to-masonry bond models incorporate the brick modulus of rupture as
the input parameter for the strength of the substrate material. However, brick and mortar
compressive strength is a constituent material parameter that is commonly required as part of the
17
seismic assessment of historic URM buildings. Hence, the brick compressive strength is
commonly assessed as part of the on-site building investigation and material characterisation, and
is typically obtained using non-destructive methods or by extracting brick and mortar samples
and testing in a laboratory. The compressive strength of clay brick units is hence more readily
available than is the brick modulus of rupture, and is more widely used in engineering practice.
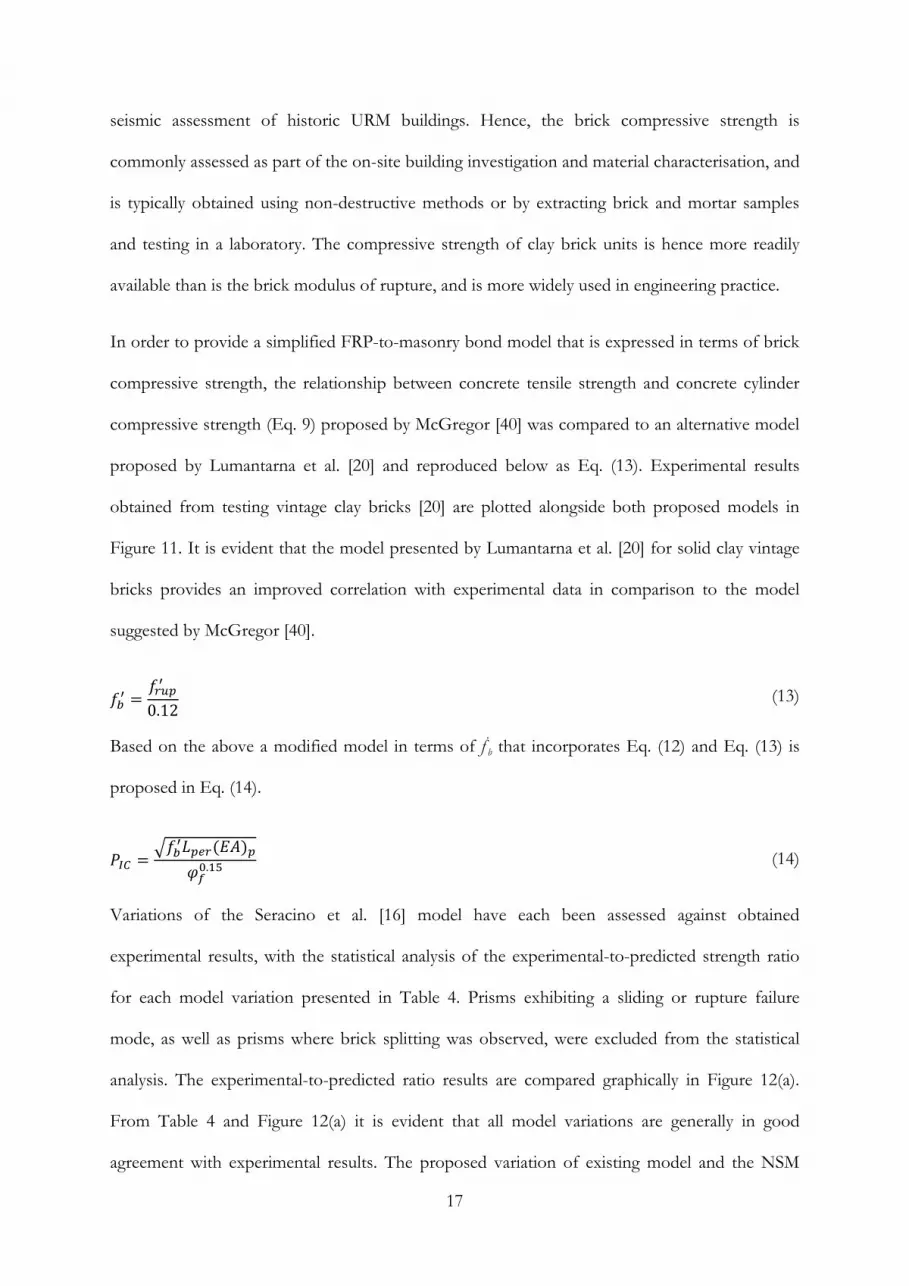
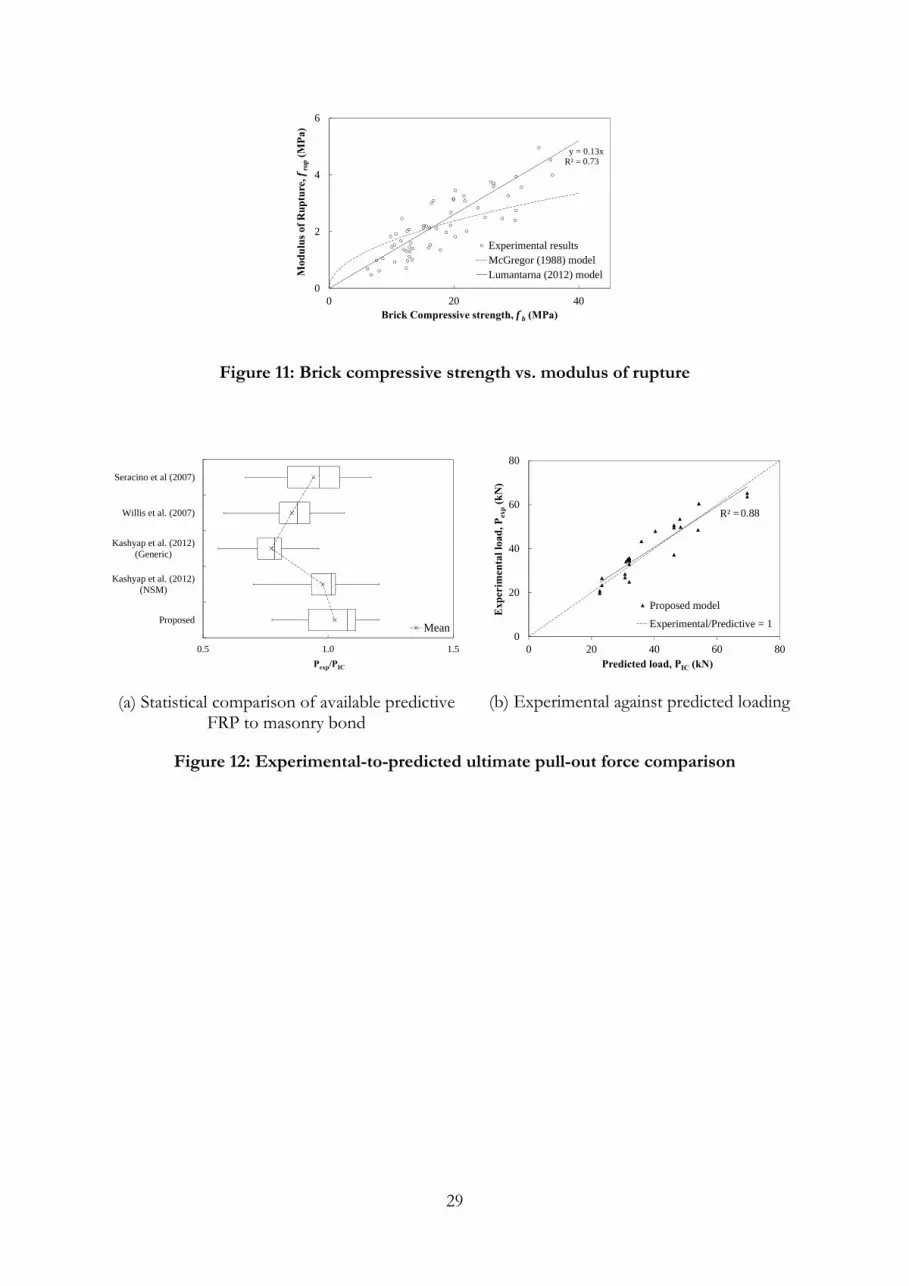
In order to provide a simplified FRP-to-masonry bond model that is expressed in terms of brick
compressive strength, the relationship between concrete tensile strength and concrete cylinder
compressive strength (Eq. 9) proposed by McGregor [40] was compared to an alternative model
proposed by Lumantarna et al. [20] and reproduced below as Eq. (13). Experimental results
obtained from testing vintage clay bricks [20] are plotted alongside both proposed models in
Figure 11. It is evident that the model presented by Lumantarna et al. [20] for solid clay vintage
bricks provides an improved correlation with experimental data in comparison to the model
suggested by McGregor [40].
0.12 (13)
Based on the above a modified model in terms of f’b that incorporates Eq. (12) and Eq. (13) is
proposed in Eq. (14).
. (14)
Variations of the Seracino et al. [16] model have each been assessed against obtained
experimental results, with the statistical analysis of the experimental-to-predicted strength ratio
for each model variation presented in Table 4. Prisms exhibiting a sliding or rupture failure
mode, as well as prisms where brick splitting was observed, were excluded from the statistical
analysis. The experimental-to-predicted ratio results are compared graphically in Figure 12(a).
From Table 4 and Figure 12(a) it is evident that all model variations are generally in good
agreement with experimental results. The proposed variation of existing model and the NSM

18
model by Kashyap et al. [17] both resulted in mean values close to unity, being 1.026 and 0.979
respectively. These two models also had the smallest CoV of 11.4% and 11.5% respectively
when compared to the other models considered in Table 4. The generic model proposed by
Kashyap et al. [17] resulted in the worst mean value of 0.774 and a CoV of 14.1% which was
partially attributed to the large number of specimens having EB FRP that was incorporated
within the dataset used for the development of the model. It was concluded that the proposed
variation of existing model for predicting the pull-out capacity of NSM CFRP strips in vintage
masonry has sufficient accuracy when compared to the obtained experimental results (see Figure
12(b)) with a low CoV (11.4%).
4 BOUNDS OF THE PROPOSED VARAITION OF EXISTING
MODEL
The proposed variation of existing model is applicable to the bond of CFRP FRP to vintage clay
brick masonry within the bounds of the investigated variables. However, the range of variables
investigated and reported here covers a wide range of practical applications
(8.9 MPa ≤f’b ≤ 35.8 MPa, 10 mm ≤ bp ≤ 30 mm, 1.2 mm ≤ tp ≤ 2.4 mm). The IC debonding
capacity is limited by the rupture strength of the CFRP strip. Also, in the development of the
proposed variation of existing model the prisms that exhibited sliding failure and brick splitting
were excluded. However, it must be noted that brick splitting for a strip width of 30 mm and for
deeply cut grooves is assumed to be limited in full scale multi-leaf walls where the continuity of
the wall provides lateral restraint.
5 CONCLUSIONS
An experimental study was presented that consisted of 39 clay brick prisms that were tested to
investigate the behaviour of NSM CFRP strips bonded to vintage solid clay brick masonry. The
following can be concluded from the study:
19
The main failure mode of the prisms was IC debonding with only 8 prisms exhibiting a
sliding type of failure and 1 prism exhibiting rupture failure of the CFRP;
Masonry prisms strengthened using 30 mm wide CFRP strips had a tendency to split fully in
half at failure. The splitting was attributed to the large depth of the groove cut, being
approximately 30% of the prism thickness;
The bond behaviour and load transfer mechanism of CFRP-to-vintage clay brick masonry
were found to be similar to CFRP bonded to modern clay brick masonry and CFRP bonded
to concrete;
Severe bending of the prisms was observed due to eccentrically applied force in cases where
laterally unrestrained prisms were tested (trail tests), resulting in low pull-out forces;
Analytical models currently available in the literature were assessed using the available
experimental results and a modified variation of existing model was proposed. For the range
of experimental parameters included as part of the study reported here, the predicted values
from the proposed variation of existing model correlated well with the experimentally
obtained results;
The proposed variation of the existing analytical model is rather simple but provides a
straightforward approach for a practicing structural engineer to evaluate the pull-out
resistance of NSM FRP strips using readily available mechanical properties of building
constituent materials.
6 ACKNOWLEDGEMENTS
The authors wish to thank and acknowledge the support provided by the technical staff of the
Department of Civil and Environmental Engineering at the University of Auckland. The
authors also thank Contech Limited and Sika NZ for supplying the CFRP and epoxy used in this

20
research. This study was conducted with financial support provided by the New Zealand
Foundation for Research, Science and Technology (FRST).
7 REFERENCES
[1] Gledhill K, Ristau J, Reyners M, Fry B, Holden C. The Darfield (Canterbury) earthquake of September
2010: Preliminary seismological report. Bulletin of the New Zealand Society for Earthquake Engineering.
2010;43:215-21.
[2] Bradley BA, Cubrinovski M. Near-Source Strong Ground Motion Observated in the 22 Febuary 2011
Christchurch Earthquake. Bulletin of New Zealand Society for Earthquake Engineering. 2011;44:181-95.
[3] Ingham JM, Griffith MC. Performance of unreinforced masonry buildings during the 2010 Darfield
(Christchurch, NZ) earthquake. Australian Journal of Structural Engineering. 2011;11:207-24.
[4] Dizhur D, Ingham JM, Moon L, Griffith MC, Schultz A, Senaldi I et al. Performance of masonry
buildings and churches in the 22 February 2011 Christchurch earthquake. Bulletin of New Zealand
Society for Earthquake Engineering. 2011;44:279-97.
[5] Dizhur D, Ismail N, Knox C, Lumantarna R, Ingham JM. Performance of unreinforced and
retrofitted masonry buildings during the 2010 Darfield earthquake. Bulletin of the New Zealand Society
for Earthquake Engineering. 2010;43:321-39.
[6] Griffith MC, Magenes G, Melis G, Picchi L. Evaluation of out-of-plane stability of unreinforced
masonry walls subjected to seismic excitation. Journal of Earthquake Engineering. 2003;7:141-69.
[7] Korany Y, Drysdale R. Rehabilitation of masonry walls using unobtrusive FRP techniques for
enhanced out-of-plane seismic resistance. Journal of Composites for Construction. 2006;10:213-22.
[8] Mosallam AS. Out-of-plane flexural behavior of unreinforced red brick walls strengthened with FRP
composites. Composites Part B: Engineering. 2007;38:559-74.
[9] Petersen RB, Masia MJ, Seracino R. Bond Behavior of Near-Surface Mounted FRP Strips Bonded to
Modern Clay Brick Masonry Prisms: Influence of Strip Orientation and Compression Perpendicular to
the Strip. Journal of Composites for Construction. 2009;13:169-78.
[10] Seracino R, Jones NM, Ali MSM, Page MW, Oehlers DJ. Bond Strength of Near-Surface Mounted
FRP Strip-to-Concrete Joints. Journal of Composites for Construction. 2007;11:401-9.
21
[11] Derakhshan H, Griffith M, Ingham J. Out-Of-Plane Behavior of One-Way Spanning Unreinforced
Masonry Walls. Journal of Engineering Mechanics.0:277.
[12] Willis CR, Yang Q, Seracino R, Griffith MC. Damaged masonry walls in two-way bending retrofitted
with vertical FRP strips. Construction and Building Materials. 2009;23:1591-604.
[13] Oehlers DJ, Seracino R. Design of FRP and Steel Plated RC Structures. Oxford: Elsevier Science;
2004. p. 24-45.
[14] Stone D, Tumialan G, Nanni A, Perretti R. Near surface mounted FRP reinforcement: Application
of an emerging technology. Concrete International. 2002;35:42-4.
[15] Hassan T, Rizkalla S. Investigation of Bond in Concrete Structures Strengthened with Near Surface
Mounted Carbon Fiber Reinforced Polymer Strips. Journal of Composites for Construction. 2003;7:248-
57.
[16] Seracino R, Saifulnaz MR, Oehlers DJ. Generic Debonding Resistance of EB and NSM Plate-to-
Concrete Joints. Journal of Composites for Construction. 2007;11:62-70.
[17] Kashyap J, C.R. W, Griffith MC, Ingham JM. Debonding Resistance of FRP-to-Masonry Joints.
Engineering Structures. 2012;40:186-98.
[18] Willis CR, Yang Q, Seracino R, Griffith MC. Bond behaviour of FRP-to-clay brick masonry joints.
Engineering Structures. 2009;31:2580-7.
[19] Konthesingha KMC, Masia MJ, Petersen RB, Page AW. Bond behaviour of NSM FRP strips to
modern clay brick masonry prisms under cyclic loading. 11th Canadian Masonry Symposium. Toronto,
Canada: McMaster University / Canadian Masonry Design Centre; 2009. p. 665-74.
[20] Lumantarna R, Biggs DT, Ingham JM. Studies on the physical and mechanical properties of vintage
solid clay bricks. Journal of Materials and Structures. 2012;under review.
[21] Blaschko M. Bond behaviour of cfrp strips glued into slits. Sixth International Symposium on FRP
Reinforcement for Concrete Structures (FRPRCS-6). Singapore2003.
[22] De Lorenzis L, Lundgren K, Rizzo A. Anchorage Length of Near-Surface Mounted Fiber-
Reinforced Polymer Bars for Concrete Strengthening - Experimental Investigation and Numerical
Modeling. ACI Structural Journal. 2004;101:269-78.
[23] Chen JF, Teng JG. Anchorage strength models for FRP and steel plates bonded to concrete. Journal
of Structural Engineering. 2001;127:784-91.
22
[24] Yao J, Teng JG, Chen JF. Experimental study on FRP-to-concrete bonded joints. Composites Part B:
Engineering. 2005;36:99-113.
[25] Dizhur D, Ingham JM. Diagonal tension strength of vintage unreinforced clay brick masonry.
Construction and Building Materials. 2012;Under review.
[26] Dizhur D. Performance of masonry buildings in the Canterbury earthquakes and corresponding
strengthening solution using NSM CFRP. Doctorate Thesis, The University of Auckland; 2013.
[27] ASTM. Standard Test Methods for Sampling and Testing Brick and Structural Clay Tile C 67-03a.
ASTM International. Pennsylvania, United States2003.
[28] ASTM. Standard Test Method for Compressive Strength of Hydraulic Cement Mortars (Using 2-in.
or [50-mm] Cube Specimens) C 109/C 109M - 08. ASTM International. Pennsylvania, United
States2008.
[29] ASTM. Standard Test Method for Compressive Strength of Masonry Prisms. C 1314-03b. ASTM
International. Pennsylvania, United States.2003.
[30] Täljsten B, Carolin A, Nordin H. Concrete structures strengthened with near surface mounted
reinforcement of CFRP. Advances in Structural Engineering. 2003;6:201-13.
[31] Yang Q. Seismic retrofit of URM walls with externaly bonded FRP composites. Adelaide: The
Univeristy of Adelaide; 2006.
[32] Lu XZ, Teng JG, Ye LP, Jiang JJ. Bond-slip models for FRP sheets/plates bonded to concrete.
Engineering Structures. 2005;27:920-37.
[33] Liu I. Retrofitting reinforced concrete beams and slabs by adhesively bonding new advanced fibre
reinforced polymer (FRP) composites to their surface. Adelaide, Australia The University of Adelaide;
2005.
[34] Yuan H, Teng JG, Seracino R, Wu ZS, Yao J. Full-range behavior of FRP-to-concrete bonded joints.
Engineering Structures. 2004;26:553-65.
[35] Teng JG, Chen JF, Smith ST, Lam L. FRP Strengthened RC Structures Chichester, England: John
Wiley and Sons Limited 2002.
[36] Oehlers DJ, Seracino R. Design of FRP and Steel Plated RC Structures: Retrofitting of Beams and
Slabs for Strength, Stiffness and Ductility. Elservier, Kinlington, Oxford, UK2004.
23
[37] Smith ST, Teng JG. FRP-strengthened RC beams. II: Assessment of debonding strength models.
Engineering Structures. 2002;24:397-417.
[38] Karbhari VM, Niu H, Sikorsky C. Review and comparison of fracture mechanics-based bond
strength models for FRP-strengthened structures. Journal of Reinforced Plastics and Composites.
2006;25:1757-94.
[39] Sayed-Ahmed EY, Bakay R, Shrive NG. Bond strength of FRP laminates to concrete: State-of-the-art
review. Electronic Journal of Structural Engineering. 2009;9:45-61.
[40] MacGregor JG. Reinforeced concrete: Mechanics and design. New Jersey: Prentice Hall: Englewood
Cliffs; 1988.
[41] DIN53455. Testing of Plastics; Tensile Test. Berlin: Deutsches Institut für Normung (DIN) 1981.
[42] EN196-1. Methods of testing cement - Part 1: Determination of strength. Brussels: European
Committe for Standardization; 2005.
[43] ASTM. Standard Test Method for Compressive Properties of Rigid Plastics D695 - 10. Pennsylvania,
United States.: ASTM International 2010.
24
(a) Geometric properties of
the masonry prism
(b) Geometric properties of groove and NSM CFRP strip
Figure 1: Prism geometrical detailing
(a) Masonry prism construction against sideboard
(b) Groove cutting
Figure 2: Prism construction details
NSM CFRPstripSteel
restraintplate
10 mm
dmbm
Lm
Lbd f
bp
t p
bf
Clay brick
Epoxy
CFRPstrip
25
(a) Typical position of strain gauges (three brick prism)
(b) Typical position of strain gauges (five brick prism)
Figure 3: Position of strain gauges
Figure 4: Typical pull test setup
Strain gaugeposition
Strain gaugeposition
PIC
Hold downsteel rods
Plaster layer
Aluminiumgrip plates
Steel angle andrubber padrestraints
Steelrestraintplate
Clamp force
NSM CFRPstrip
Steelrestraintplates
26
(a) Initiation of
herringbone cracks D2-4-15-(7/20)
(b) Top view of prism
following failure B1-4-15-(6/20)
Figure 5: Crack pattern
(a) Trapezoidal failure plane, H
F2-4-15-(6/20)
(b) Rectangular failure
plane, R C2-4-25-(6/30)
(c) Trapezoidal and rectangular failure
plane, H+R E1-4-15-(6/20)
Figure 6: IC debonding failure planes
Failure plane
CFRP strip
Epoxy
Brick surface
Failureplane
Brick surface
27
Figure 7: Typical load-slip response
(a) Effect of development length and strip width on pull-out strength
(Development length prisms plotted: 21, 24, 26, 27, and the average of 6 and 7; CFRP strip width prisms plotted: 14, 15, 16, the average of 7 and 12, and the
average of 12 and 13)
(b) Effect of brick compressive and rupture strength on pull-out strength
Figure 8: Effects of variables on bond strength
0
10
20
30
40
50
0 1 2 3 4 5A
ppli
ed a
xial
for
ce, P
exp
(kN
)
Slip at loaded end (mm)
2B3-4-15-(6/20)2A2-4-15-(6/20)2B19-3-15-(6/20)
5 15 25 35
0
20
40
60
0 100 200 300 400 500
CFRP strip width, bp (mm)
Ap
plie
d a
xial
for
ce, P
exp
(kN
)
Development length (mm)
Development lengthCFRP strip width
R² = 0.8149
R² = 0.5799
0 10 20 30 40
0
20
40
60
0
20
40
60
0 1 2 3 4 5
Brick compressive strength, f'b (MPa)
Ap
plie
d ax
ial f
orce
, Pex
p(k
N)
Brick rupture strength, f'rup (MPa)
Modulus of Rupture Compressive StrengthLinear (Modulus of Rupture) Linear (Compressive Strength)
0.58
0.82
28
(a) Strain distribution (B1-4-15-(6/20))
(b) Shear stress distribution (B1-4-15-(6/20))
(c) Strain distribution (C6-4-15×2-(6/20))
(d) Shear stress distribution (C6-4-15×2-(6/20))
Figure 9: Typical experimental results
Figure 10: Local bond-slip curve for B1-4-15-(6/20) prism (first three strain gauges)
0
2000
4000
6000
8000
10000
12000
14000
0 50 100 150 200 250 300
Str
ain
(µε)
Distance from loaded end (mm)
5 kN10 kN15 kN20 kN25 kN30 kN35 kN40 kN46 kN
0
2
4
6
8
10
12
14
0 50 100 150 200 250 300
She
ar S
tres
s (M
Pa)
Distance from loaded end (mm)
5 kN10 kN15 kN20 kN25 kN30 kN35 kN40 kN46 kN
0
2000
4000
6000
0 50 100 150 200 250 300
Stra
in (
µε)
Distance from loaded end (mm)
5 kN10 kN15 kN20 kN25 kN30 kN35 kN38.1 kN
0
2
4
6
8
10
12
0 50 100 150 200 250 300
She
ar S
tres
s (M
Pa)
Distance from loaded end (mm)
5 kN10 kN15 kN20 kN25 kN30 kN35 kN38.1 kN
0
5
10
15
0 0.2 0.4 0.6 0.8
Shea
r St
ress
(MPa
)
Slip (mm)
elastic micro-cracking
macro-cracking
(δ1, τmax)
δ1 (δmax, 0)
Idealisedbilinear model
29
Figure 11: Brick compressive strength vs. modulus of rupture
(a) Statistical comparison of available predictive FRP to masonry bond
(b) Experimental against predicted loading
Figure 12: Experimental-to-predicted ultimate pull-out force comparison
y = 0.13xR² = 0.7255
0
2
4
6
0 20 40M
odu
lus
of R
uptu
re,f
' rup
(MP
a)Brick Compressive strength, f'
b (MPa)
Experimental resultsMcGregor (1988) modelLumantarna (2012) model
0.73
0.5 1.0 1.5
Seracino et al (2007)
Willis et al. (2007)
Kashyap et al. (2012)(Generic)
Kashyap et al. (2012)(NSM)
Proposed
Pexp/PIC
Mean
R² = 0.8784
0
20
40
60
80
0 20 40 60 80
Exp
erim
enta
l loa
d, P
exp
(kN
)
Predicted load, PIC (kN)
Proposed model
Experimental/Predictive = 1
0.88

30
Table 1: Masonry material properties
Brick group Origin & year built f’b
(N/mm2) n
f’m (N/mm2)
nf’j
(N/mm2) n
f’rup (N/mm2)
n Eb
(N/mm2) n
A Auckland, 1930’s 35.8 (0.21) 10 -
15.0 (0.11) 6
3.8 (0.14) 8 9,600 (0.35) 6 B Auckland, 1940’s 17.1 (0.15) 10 7.79 (0.14) 3 2.6 (0.26) 11 6,200 (0.29) 4 C Auckland, pre-1930’s 21.5 (0.25) 8 - 3.4 (0.24) 9 3,600 (0.42) 5 D Auckland, 1910 16.0 (0.11) 6 - 2.5 (0.35) 4 3,000 (0.38) 10E Gisborne, 1906 15.7 (0.21) 8 - 1.9 (0.36) 9 2,700 (0.32) 10F Wellington, 1884 8.9 (0.18) 9 - 1.2 (0.29) 5 1,000 (0.47) 9
Note: n – sample size; ( ) – coefficient of variation (CoV).
Table 2: CFRP and adhesive material data
Property Adhesive CFRP
Manufacture’s specifications
Experimental results
n Manufacture’s specifications
Experimental results
n
Compressive strength (N/mm2) 90.0 [EN 196-1] 82.5 (0.13) 5 - - -
Shear strength (N/mm2) 17.5 [FIP 5.15] N/A - - - -
Tensile strength (N/mm2) 28.5 [DIN 53455] N/A - 3,100 2,850 (0.23) 3Modulus of elasticity, E (N/mm2) 9,600 [ASTM D695] N/A - 165,000 155,00 (0.11) 3
Rupture strain, εrup (µε) - - - 17,000 12,200 3Note: [ ] - signifies testing standard used from manufacture’s provided literature; N/A – data not available; ( ) – coefficient of variation (CoV); n – sample size. [41-43]
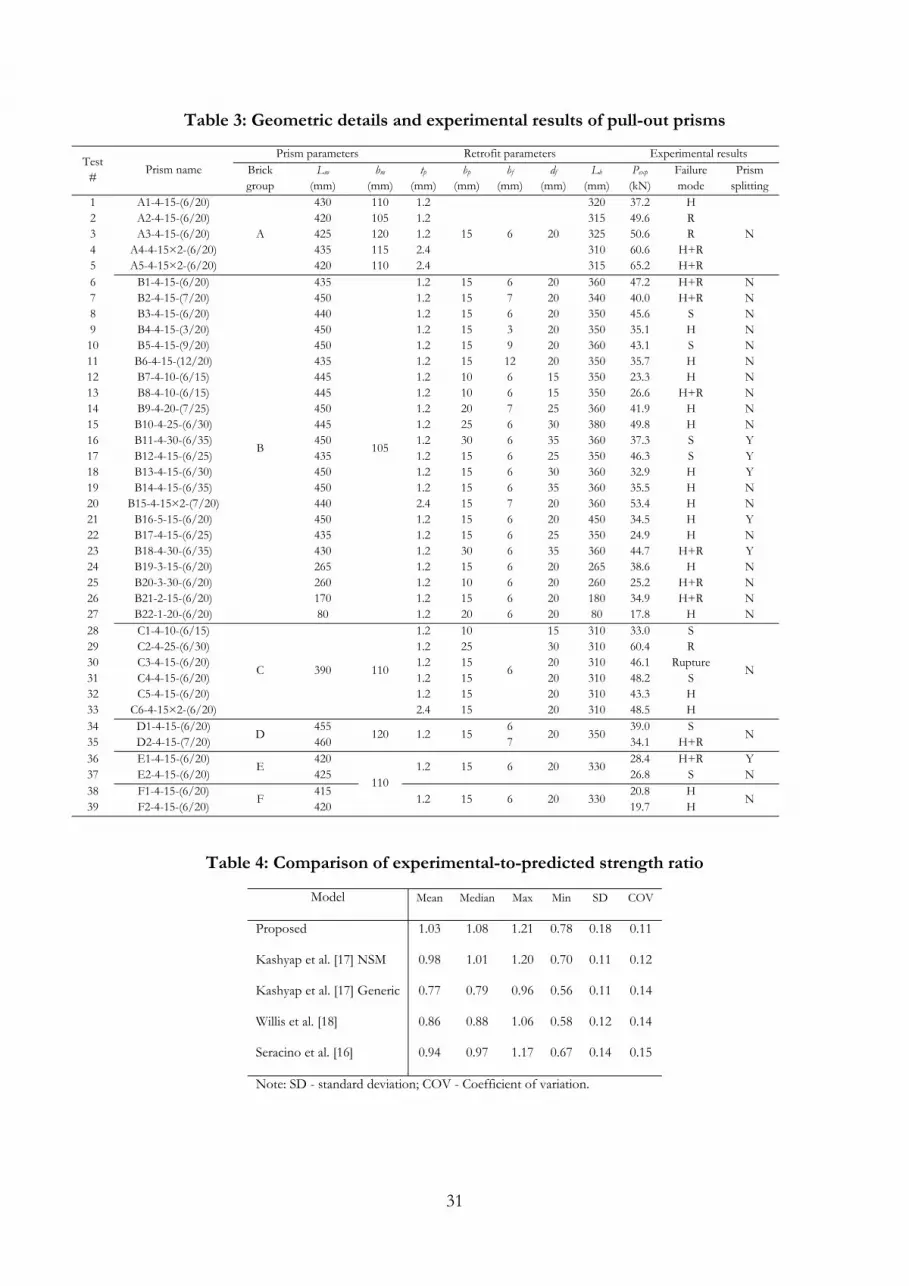
31
Table 3: Geometric details and experimental results of pull-out prisms
Test #
Prism name Prism parameters Retrofit parameters Experimental results
Brick group
Lm (mm)
bm
(mm) tp
(mm) bp
(mm) bf
(mm) df
(mm) Lb
(mm) Pexp
(kN) Failure mode
Prism splitting
1 A1-4-15-(6/20)
A
430 110 1.2
15 6 20
320 37.2 H
N 2 A2-4-15-(6/20) 420 105 1.2 315 49.6 R 3 A3-4-15-(6/20) 425 120 1.2 325 50.6 R 4 A4-4-15×2-(6/20) 435 115 2.4 310 60.6 H+R 5 A5-4-15×2-(6/20) 420 110 2.4 315 65.2 H+R 6 B1-4-15-(6/20)
B
435
105
1.2 15 6 20 360 47.2 H+R N7 B2-4-15-(7/20) 450 1.2 15 7 20 340 40.0 H+R N8 B3-4-15-(6/20) 440 1.2 15 6 20 350 45.6 S N9 B4-4-15-(3/20) 450 1.2 15 3 20 350 35.1 H N10 B5-4-15-(9/20) 450 1.2 15 9 20 360 43.1 S N11 B6-4-15-(12/20) 435 1.2 15 12 20 350 35.7 H N12 B7-4-10-(6/15) 445 1.2 10 6 15 350 23.3 H N13 B8-4-10-(6/15) 445 1.2 10 6 15 350 26.6 H+R N14 B9-4-20-(7/25) 450 1.2 20 7 25 360 41.9 H N15 B10-4-25-(6/30) 445 1.2 25 6 30 380 49.8 H N16 B11-4-30-(6/35) 450 1.2 30 6 35 360 37.3 S Y17 B12-4-15-(6/25) 435 1.2 15 6 25 350 46.3 S Y18 B13-4-15-(6/30) 450 1.2 15 6 30 360 32.9 H Y19 B14-4-15-(6/35) 450 1.2 15 6 35 360 35.5 H N20 B15-4-15×2-(7/20) 440 2.4 15 7 20 360 53.4 H N21 B16-5-15-(6/20) 450 1.2 15 6 20 450 34.5 H Y22 B17-4-15-(6/25) 435 1.2 15 6 25 350 24.9 H N23 B18-4-30-(6/35) 430 1.2 30 6 35 360 44.7 H+R Y24 B19-3-15-(6/20) 265 1.2 15 6 20 265 38.6 H N25 B20-3-30-(6/20) 260 1.2 10 6 20 260 25.2 H+R N26 B21-2-15-(6/20) 170 1.2 15 6 20 180 34.9 H+R N27 B22-1-20-(6/20) 80 1.2 20 6 20 80 17.8 H N28 C1-4-10-(6/15)
C 390 110
1.2 10
6
15 310 33.0 S
N
29 C2-4-25-(6/30) 1.2 25 30 310 60.4 R 30 C3-4-15-(6/20) 1.2 15 20 310 46.1 Rupture 31 C4-4-15-(6/20) 1.2 15 20 310 48.2 S 32 C5-4-15-(6/20) 1.2 15 20 310 43.3 H 33 C6-4-15×2-(6/20) 2.4 15 20 310 48.5 H 34 D1-4-15-(6/20)
D 455
120 1.2 15 6
20 350 39.0 S
N 35 D2-4-15-(7/20) 460 7 34.1 H+R 36 E1-4-15-(6/20)
E 420
110 1.2 15 6 20 330
28.4 H+R Y37 E2-4-15-(6/20) 425 26.8 S N38 F1-4-15-(6/20)
F 415
1.2 15 6 20 330 20.8 H
N 39 F2-4-15-(6/20) 420 19.7 H
Table 4: Comparison of experimental-to-predicted strength ratio
Model Mean Median Max Min SD COV
Proposed 1.03 1.08 1.21 0.78 0.18 0.11
Kashyap et al. [17] NSM 0.98 1.01 1.20 0.70 0.11 0.12
Kashyap et al. [17] Generic 0.77 0.79 0.96 0.56 0.11 0.14
Willis et al. [18] 0.86 0.88 1.06 0.58 0.12 0.14
Seracino et al. [16] 0.94 0.97 1.17 0.67 0.14 0.15
Note: SD - standard deviation; COV - Coefficient of variation.


