Embed Size (px)
Citation preview
RESEARCH Open Access
Psychoactive pharmaceuticals as environmentalcontaminants may disrupt highly inter-connectednodes in an Autism-associated protein-proteininteraction networkGaurav Kaushik, Michael A Thomas, Ken A Aho*
From The 11th Annual Biotechnology and Bioinformatics Symposium (BIOT-2014)Provo, UT USA. 11-12 December 2014
Abstract
Background: Most cases of idiopathic autism spectrum disorder (ASD) likely result from unknown environmentaltriggers in genetically susceptible individuals. These triggers may include maternal exposure of a fetus to minuteconcentrations of pharmaceuticals, such as carbamazepine (CBZ), venlafaxine (VNX) and fluoxetine (FLX).Unmetabolized pharmaceuticals reach drinking water through a variety of routes, including ineffectively treatedsewage. Previous studies in our laboratory examined the extent to which gene sets were enriched in minnowbrains treated with pharmaceuticals. Here, we tested the hypothesis that genes in fish brains and human cellcultures, significantly enriched by pharmaceuticals, would have distinct characteristics in an ASD-associated proteininteraction network. We accomplished this by comparing these groups using 10 network indices.
Results: A network of 7212 proteins and 33,461 interactions was generated. We found that network characteristicsfor enriched gene sets for particular pharmaceuticals were distinct from each other, and were different from non-enriched ASD gene sets. In particular, genes in fish brains, enriched by CBZ and VNX 1) had higher networkimportance than that in the overall network, and those enriched by FLX, and 2) were distinct from FLX and non-enriched ASD genes in multivariate network space. Similarly, genes in human cell cultures enriched bypharmaceutical mixtures (at environmental concentrations) and valproate (at clinical dosages) had similar networksignatures, and had greater network importance than genes in the overall ASD network.
Conclusions: The results indicate that important gene sets in the ASD network are particularly susceptible toperturbation by pharmaceuticals at environmental concentrations.
BackgroundAutism is a complex neurobiological developmental dis-order belonging to a group of conditions known as Aut-ism Spectrum Disorder (ASD) [1,2]. ASD has an overallprevalence of approximately one case in every 50 childrenin USA [3], notably affecting four times as many males asfemales [4,5]. To date, several studies have reported ASD−associated genetic factors and have categorized theminto 2 groups: rare variants (genes with low susceptibility
and high penetrance) and common variants (genes withhigh susceptibility and low penetrance) [4]. These geneticfactors, however, are responsible for only 2-3% of identi-fied ASD cases [5,6].In most other instances, studies suggest that ASD
results from unknown environmental triggers acting ongenetically susceptible individuals [6-9]. Susceptibilitymay be associated with gene variants [9] involved in bio-logical pathways associated with ASD such as cell adhe-sion, synaptic vessel release, neurotransmission, andsynaptic structure [6,10,11]. These biological pathwaysare inter-connected in a very complex manner [12].
* Correspondence: [email protected] of Biological Sciences, Idaho State University, Stop 8007, 921 S8th Ave, Pocatello, ID 83209-8007, USA
Kaushik et al. BMC Bioinformatics 2015, 16(Suppl 7):S3http://www.biomedcentral.com/1471-2105/16/S7/S3
© 2015 Kaushik et al.; licensee BioMed Central Ltd. This is an Open Access article distributed under the terms of the Creative CommonsAttribution License (http://creativecommons.org/licenses/by/4.0), which permits unrestricted use, distribution, and reproduction inany medium, provided the original work is properly cited. The Creative Commons Public Domain Dedication waiver (http://creativecommons.org/publicdomain/zero/1.0/) applies to the data made available in this article, unless otherwise stated.
However, it is unclear how environmental contaminantsinteract with or otherwise perturb ASD-associated biolo-gical pathways [12].Today, genetically susceptible individuals may be
exposed to combinations of 3000 synthetic chemicals viaair, food and water [8]. Synthetic chemicals are generallycategorized into two groups: pharmaceuticals and perso-nal care products (PPCPs), and other industrial chemi-cals, such as organophosphate insecticides and organicsolvents (e.g., ethyl alcohol) [8]. PPCPs include exten-sively used psychoactive pharmaceuticals [13], but alsoinclude bis-phenyl A in plastics, phthalates in cosmeticsand household products, and known teratogenic phar-maceuticals [8]. In this study we focus on psychoactivepharmaceuticals that 1) may find their way to drinkingwater from clinical dosages excreted by patients, 2) aregenerally untreated by waste-water treatment plants[14], and 3) have sufficiently long half-lives [10] to even-tually emerge in drinking water. Because many PPCPsare known to perturb neurological systems, exposure ofa fetus to these contaminants by way of the pregnantmother’s water consumption is a plausible environmen-tal risk factor for neurological disorders like ASD [7,8].In a previous study, we investigated psychoactive
pharmaceuticals presented at very low concentrations inthe environment [10,11]. Juvenile fathead minnows(Pimephales promelas) were exposed to fluoxetine(FLX), venlafaxine (VNX) and carbamazepine (CBZ)individually and in mixtures at environmentally relevantconcentrations [11]. Using gene-class analysis [15], geneexpression data indicated enrichment (significant up- ordown-regulation) of gene sets associated with neuronalgrowth, regulation, and development in the juvenileminnow brains in response to psychoactive drug exposure[11]. Moreover, a significant behavioral change (number ofturns, lateralization, distance travelled) was observed infish exposed to pharmaceuticals. We sought to identifypotential pharmaceutical-associated gene expressionmechanisms underlying these responses. As a first step,we considered the interaction of pharmaceuticals withinthe underlying ASD-associated protein network. Thisapproach has been used elsewhere to determine how alter-ing expression of one or a few genes can influence biologi-cal pathways, ultimately contributing to complexphenotypes [16].We found previously that fathead minnows exposed to
PPCPs had a significantly altered behavioral phenotypecompared to a non-exposed (control) group [11], andthat PPCP-enriched gene sets represented biological path-ways, which play a major role in neuronal systems. Thus,we predicted 1) that gene sets enriched by CBZ, VNX,FLX and MIX (all three) contained proteins that wouldbe more interconnected than genes in the overall ASD-network, and 2) that gene sets enhanced by individual
pharmaceuticals would have distinct network characteris-tics from each other.To address these hypotheses, we constructed a protein-
protein interaction (PPI) network of gene products knownto be associated with ASD [17,18], and examined 1) genesenhanced by particular PPCPs in fish brains, and 2) genesenhanced by a PPCP mixture and valproate (VPA) inhuman neuronal cells. We note that VPA is known toinduce ASD-like phenotypes in mice [19]. We sought toquantify patterns among gene sets enriched by PPCPs inboth fish brains and human cell cultures by analyzing theirnetwork indices. Of particular interest was the identifica-tion of relationships between PCPP treatments and highlyinterconnected gene sets, as these are more likely to haveprofound effects on the functioning of the protein networkbecause of their ripple effects on downstream proteins [20].
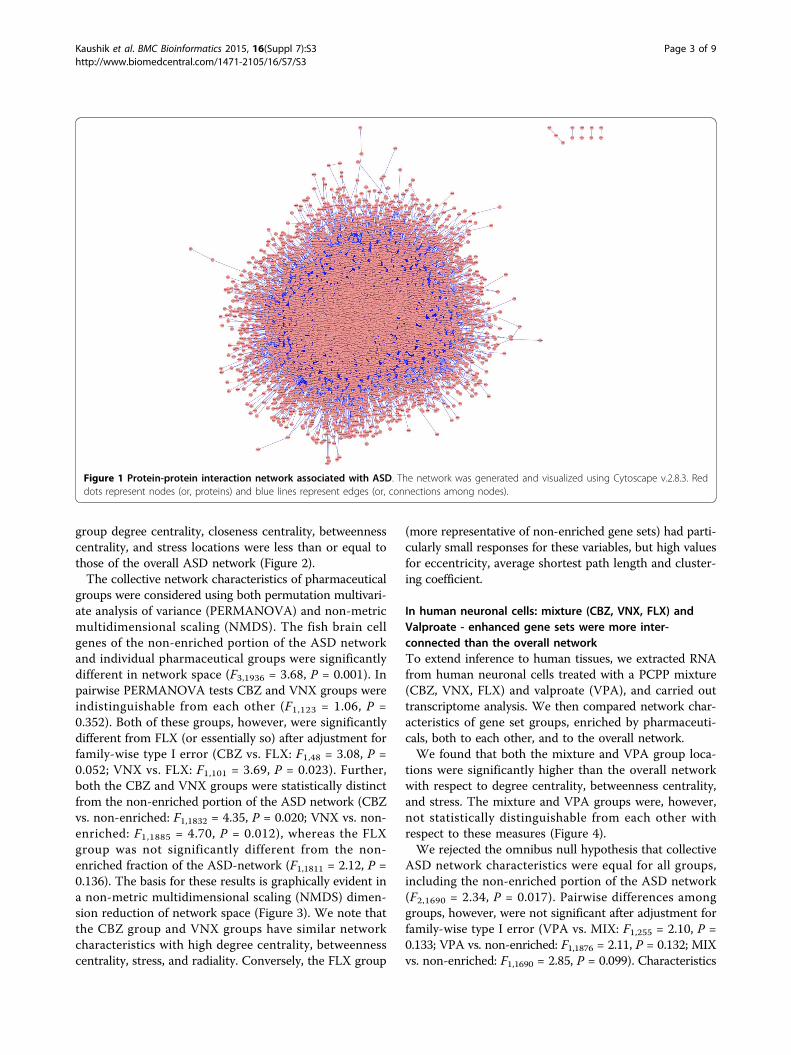
ResultsWe postulated that proteins within PPCP-enriched groupswould have both distinct network characteristics from eachother and higher levels of importance in the ASD protein-protein network. Support of this hypothesis would suggestthat any dysregulation in the expression of PPCP-enrichedproteins would result in large impacts to the network dueto ripple effects on downstream proteins. To address thisquestion, we generated an ASD protein-protein interactionnetwork. The network consisted of 7212 nodes, withapproximately 2000 primary neighbor proteins and 5000secondary neighbor proteins (Figure 1). The averagenumber of adjacent neighbors (average degree centrality;See additional file 1) for proteins in the network was 9.279,while the median degree centrality was 5.000. Additionalsummaries of network properties are listed in additionaldocuments to this manuscript. (See additional file 1)
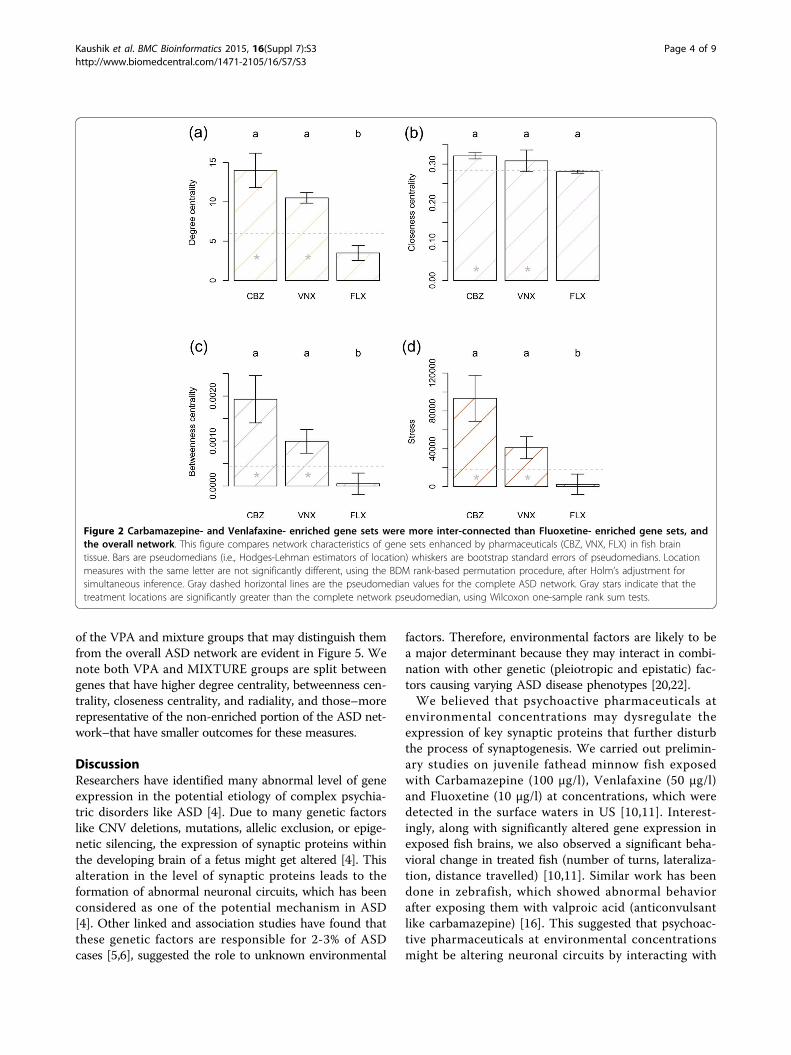
In fish brains: Carbamazepine- and Venlafaxine- enhancedgene sets were more inter-connected in the ASD-networkthan both Fluoxetine- enhanced gene sets and the non-enriched portion of the networkWhen considering fish brain cells, the VNX and CBZgroups had significantly higher location shifts (medianand pseudomedian), compared to the overall network, fornetwork indices widely deemed to be most important inidentifying nodal importance (i.e., degree centrality, close-ness centrality, betweenness centrality, and stress). Theomnibus null hypothesis of equal location shifts forgroups was rejected for all four of these measures allow-ing protected pairwise comparisons of groups [21]. Inthese comparisons the CBZ and VNX groups were statis-tically equivalent with respect to degree centrality,betweenness centrality and stress. The CBZ and VNXgroups, however, had significant location shifts comparedto the FLX group, and significantly higher locations thanthe overall ASD network (Figure 2). Strikingly, the FLX
Kaushik et al. BMC Bioinformatics 2015, 16(Suppl 7):S3http://www.biomedcentral.com/1471-2105/16/S7/S3
Page 2 of 9
group degree centrality, closeness centrality, betweennesscentrality, and stress locations were less than or equal tothose of the overall ASD network (Figure 2).The collective network characteristics of pharmaceutical
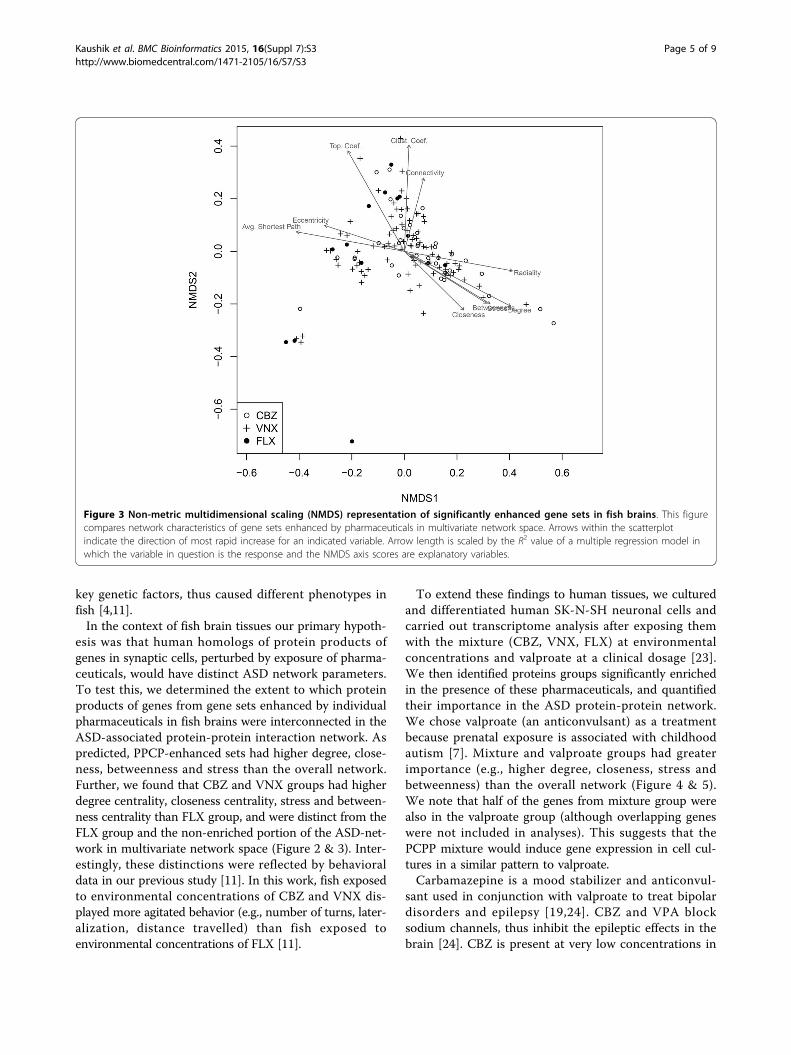
groups were considered using both permutation multivari-ate analysis of variance (PERMANOVA) and non-metricmultidimensional scaling (NMDS). The fish brain cellgenes of the non-enriched portion of the ASD networkand individual pharmaceutical groups were significantlydifferent in network space (F3,1936 = 3.68, P = 0.001). Inpairwise PERMANOVA tests CBZ and VNX groups wereindistinguishable from each other (F1,123 = 1.06, P =0.352). Both of these groups, however, were significantlydifferent from FLX (or essentially so) after adjustment forfamily-wise type I error (CBZ vs. FLX: F1,48 = 3.08, P =0.052; VNX vs. FLX: F1,101 = 3.69, P = 0.023). Further,both the CBZ and VNX groups were statistically distinctfrom the non-enriched portion of the ASD network (CBZvs. non-enriched: F1,1832 = 4.35, P = 0.020; VNX vs. non-enriched: F1,1885 = 4.70, P = 0.012), whereas the FLXgroup was not significantly different from the non-enriched fraction of the ASD-network (F1,1811 = 2.12, P =0.136). The basis for these results is graphically evident ina non-metric multidimensional scaling (NMDS) dimen-sion reduction of network space (Figure 3). We note thatthe CBZ group and VNX groups have similar networkcharacteristics with high degree centrality, betweennesscentrality, stress, and radiality. Conversely, the FLX group
(more representative of non-enriched gene sets) had parti-cularly small responses for these variables, but high valuesfor eccentricity, average shortest path length and cluster-ing coefficient.
In human neuronal cells: mixture (CBZ, VNX, FLX) andValproate - enhanced gene sets were more inter-connected than the overall networkTo extend inference to human tissues, we extracted RNAfrom human neuronal cells treated with a PCPP mixture(CBZ, VNX, FLX) and valproate (VPA), and carried outtranscriptome analysis. We then compared network char-acteristics of gene set groups, enriched by pharmaceuti-cals, both to each other, and to the overall network.We found that both the mixture and VPA group loca-
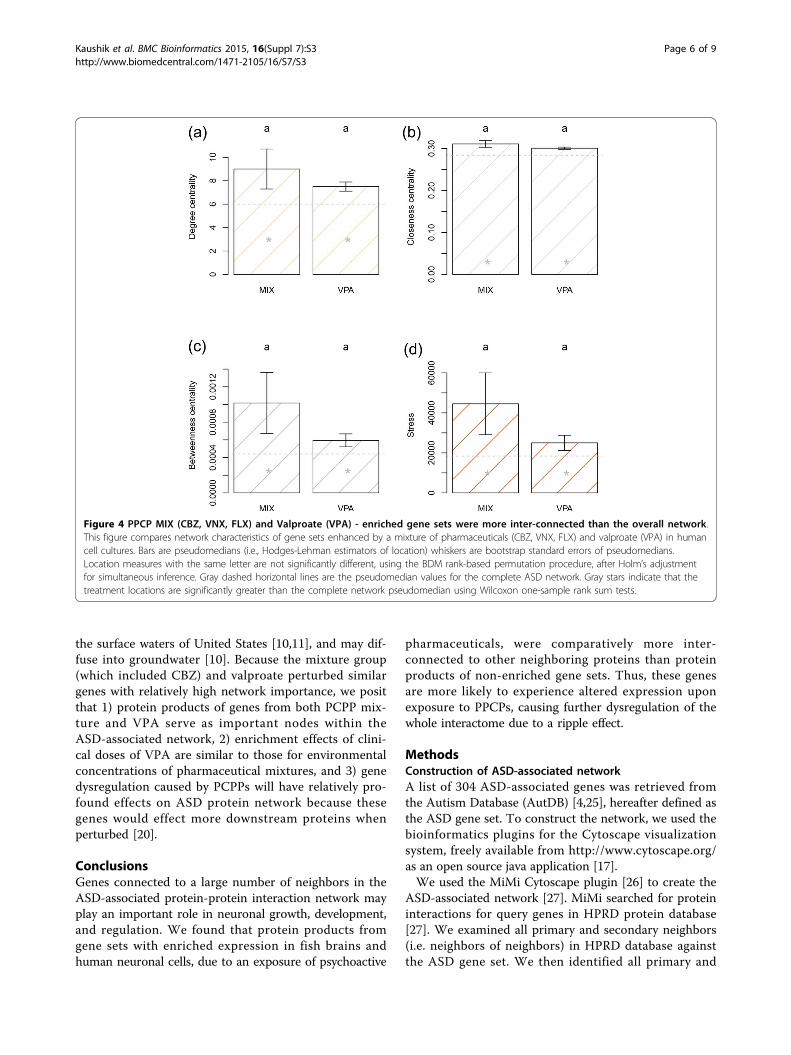
tions were significantly higher than the overall networkwith respect to degree centrality, betweenness centrality,and stress. The mixture and VPA groups were, however,not statistically distinguishable from each other withrespect to these measures (Figure 4).We rejected the omnibus null hypothesis that collective
ASD network characteristics were equal for all groups,including the non-enriched portion of the ASD network(F2,1690 = 2.34, P = 0.017). Pairwise differences amonggroups, however, were not significant after adjustment forfamily-wise type I error (VPA vs. MIX: F1,255 = 2.10, P =0.133; VPA vs. non-enriched: F1,1876 = 2.11, P = 0.132; MIXvs. non-enriched: F1,1690 = 2.85, P = 0.099). Characteristics
Figure 1 Protein-protein interaction network associated with ASD. The network was generated and visualized using Cytoscape v.2.8.3. Reddots represent nodes (or, proteins) and blue lines represent edges (or, connections among nodes).
Kaushik et al. BMC Bioinformatics 2015, 16(Suppl 7):S3http://www.biomedcentral.com/1471-2105/16/S7/S3
Page 3 of 9
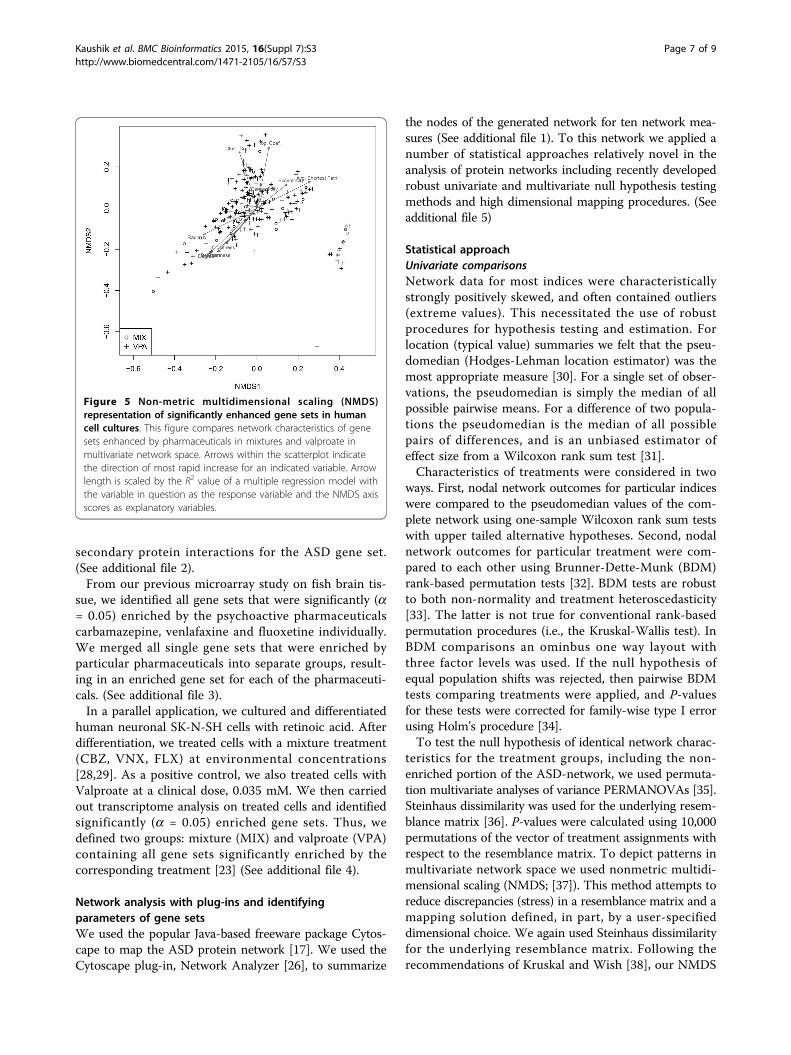
of the VPA and mixture groups that may distinguish themfrom the overall ASD network are evident in Figure 5. Wenote both VPA and MIXTURE groups are split betweengenes that have higher degree centrality, betweenness cen-trality, closeness centrality, and radiality, and those–morerepresentative of the non-enriched portion of the ASD net-work–that have smaller outcomes for these measures.
DiscussionResearchers have identified many abnormal level of geneexpression in the potential etiology of complex psychia-tric disorders like ASD [4]. Due to many genetic factorslike CNV deletions, mutations, allelic exclusion, or epige-netic silencing, the expression of synaptic proteins withinthe developing brain of a fetus might get altered [4]. Thisalteration in the level of synaptic proteins leads to theformation of abnormal neuronal circuits, which has beenconsidered as one of the potential mechanism in ASD[4]. Other linked and association studies have found thatthese genetic factors are responsible for 2-3% of ASDcases [5,6], suggested the role to unknown environmental
factors. Therefore, environmental factors are likely to bea major determinant because they may interact in combi-nation with other genetic (pleiotropic and epistatic) fac-tors causing varying ASD disease phenotypes [20,22].We believed that psychoactive pharmaceuticals at
environmental concentrations may dysregulate theexpression of key synaptic proteins that further disturbthe process of synaptogenesis. We carried out prelimin-ary studies on juvenile fathead minnow fish exposedwith Carbamazepine (100 μg/l), Venlafaxine (50 μg/l)and Fluoxetine (10 μg/l) at concentrations, which weredetected in the surface waters in US [10,11]. Interest-ingly, along with significantly altered gene expression inexposed fish brains, we also observed a significant beha-vioral change in treated fish (number of turns, lateraliza-tion, distance travelled) [10,11]. Similar work has beendone in zebrafish, which showed abnormal behaviorafter exposing them with valproic acid (anticonvulsantlike carbamazepine) [16]. This suggested that psychoac-tive pharmaceuticals at environmental concentrationsmight be altering neuronal circuits by interacting with
Figure 2 Carbamazepine- and Venlafaxine- enriched gene sets were more inter-connected than Fluoxetine- enriched gene sets, andthe overall network. This figure compares network characteristics of gene sets enhanced by pharmaceuticals (CBZ, VNX, FLX) in fish braintissue. Bars are pseudomedians (i.e., Hodges-Lehman estimators of location) whiskers are bootstrap standard errors of pseudomedians. Locationmeasures with the same letter are not significantly different, using the BDM rank-based permutation procedure, after Holm’s adjustment forsimultaneous inference. Gray dashed horizontal lines are the pseudomedian values for the complete ASD network. Gray stars indicate that thetreatment locations are significantly greater than the complete network pseudomedian, using Wilcoxon one-sample rank sum tests.
Kaushik et al. BMC Bioinformatics 2015, 16(Suppl 7):S3http://www.biomedcentral.com/1471-2105/16/S7/S3
Page 4 of 9
key genetic factors, thus caused different phenotypes infish [4,11].In the context of fish brain tissues our primary hypoth-
esis was that human homologs of protein products ofgenes in synaptic cells, perturbed by exposure of pharma-ceuticals, would have distinct ASD network parameters.To test this, we determined the extent to which proteinproducts of genes from gene sets enhanced by individualpharmaceuticals in fish brains were interconnected in theASD-associated protein-protein interaction network. Aspredicted, PPCP-enhanced sets had higher degree, close-ness, betweenness and stress than the overall network.Further, we found that CBZ and VNX groups had higherdegree centrality, closeness centrality, stress and between-ness centrality than FLX group, and were distinct from theFLX group and the non-enriched portion of the ASD-net-work in multivariate network space (Figure 2 & 3). Inter-estingly, these distinctions were reflected by behavioraldata in our previous study [11]. In this work, fish exposedto environmental concentrations of CBZ and VNX dis-played more agitated behavior (e.g., number of turns, later-alization, distance travelled) than fish exposed toenvironmental concentrations of FLX [11].
To extend these findings to human tissues, we culturedand differentiated human SK-N-SH neuronal cells andcarried out transcriptome analysis after exposing themwith the mixture (CBZ, VNX, FLX) at environmentalconcentrations and valproate at a clinical dosage [23].We then identified proteins groups significantly enrichedin the presence of these pharmaceuticals, and quantifiedtheir importance in the ASD protein-protein network.We chose valproate (an anticonvulsant) as a treatmentbecause prenatal exposure is associated with childhoodautism [7]. Mixture and valproate groups had greaterimportance (e.g., higher degree, closeness, stress andbetweenness) than the overall network (Figure 4 & 5).We note that half of the genes from mixture group werealso in the valproate group (although overlapping geneswere not included in analyses). This suggests that thePCPP mixture would induce gene expression in cell cul-tures in a similar pattern to valproate.Carbamazepine is a mood stabilizer and anticonvul-
sant used in conjunction with valproate to treat bipolardisorders and epilepsy [19,24]. CBZ and VPA blocksodium channels, thus inhibit the epileptic effects in thebrain [24]. CBZ is present at very low concentrations in
Figure 3 Non-metric multidimensional scaling (NMDS) representation of significantly enhanced gene sets in fish brains. This figurecompares network characteristics of gene sets enhanced by pharmaceuticals in multivariate network space. Arrows within the scatterplotindicate the direction of most rapid increase for an indicated variable. Arrow length is scaled by the R2 value of a multiple regression model inwhich the variable in question is the response and the NMDS axis scores are explanatory variables.
Kaushik et al. BMC Bioinformatics 2015, 16(Suppl 7):S3http://www.biomedcentral.com/1471-2105/16/S7/S3
Page 5 of 9
the surface waters of United States [10,11], and may dif-fuse into groundwater [10]. Because the mixture group(which included CBZ) and valproate perturbed similargenes with relatively high network importance, we positthat 1) protein products of genes from both PCPP mix-ture and VPA serve as important nodes within theASD-associated network, 2) enrichment effects of clini-cal doses of VPA are similar to those for environmentalconcentrations of pharmaceutical mixtures, and 3) genedysregulation caused by PCPPs will have relatively pro-found effects on ASD protein network because thesegenes would effect more downstream proteins whenperturbed [20].
ConclusionsGenes connected to a large number of neighbors in theASD-associated protein-protein interaction network mayplay an important role in neuronal growth, development,and regulation. We found that protein products fromgene sets with enriched expression in fish brains andhuman neuronal cells, due to an exposure of psychoactive
pharmaceuticals, were comparatively more inter-connected to other neighboring proteins than proteinproducts of non-enriched gene sets. Thus, these genesare more likely to experience altered expression uponexposure to PPCPs, causing further dysregulation of thewhole interactome due to a ripple effect.
MethodsConstruction of ASD-associated networkA list of 304 ASD-associated genes was retrieved fromthe Autism Database (AutDB) [4,25], hereafter defined asthe ASD gene set. To construct the network, we used thebioinformatics plugins for the Cytoscape visualizationsystem, freely available from http://www.cytoscape.org/as an open source java application [17].We used the MiMi Cytoscape plugin [26] to create the
ASD-associated network [27]. MiMi searched for proteininteractions for query genes in HPRD protein database[27]. We examined all primary and secondary neighbors(i.e. neighbors of neighbors) in HPRD database againstthe ASD gene set. We then identified all primary and
Figure 4 PPCP MIX (CBZ, VNX, FLX) and Valproate (VPA) - enriched gene sets were more inter-connected than the overall network.This figure compares network characteristics of gene sets enhanced by a mixture of pharmaceuticals (CBZ, VNX, FLX) and valproate (VPA) in humancell cultures. Bars are pseudomedians (i.e., Hodges-Lehman estimators of location) whiskers are bootstrap standard errors of pseudomedians.Location measures with the same letter are not significantly different, using the BDM rank-based permutation procedure, after Holm’s adjustmentfor simultaneous inference. Gray dashed horizontal lines are the pseudomedian values for the complete ASD network. Gray stars indicate that thetreatment locations are significantly greater than the complete network pseudomedian using Wilcoxon one-sample rank sum tests.
Kaushik et al. BMC Bioinformatics 2015, 16(Suppl 7):S3http://www.biomedcentral.com/1471-2105/16/S7/S3
Page 6 of 9
secondary protein interactions for the ASD gene set.(See additional file 2).From our previous microarray study on fish brain tis-
sue, we identified all gene sets that were significantly (a= 0.05) enriched by the psychoactive pharmaceuticalscarbamazepine, venlafaxine and fluoxetine individually.We merged all single gene sets that were enriched byparticular pharmaceuticals into separate groups, result-ing in an enriched gene set for each of the pharmaceuti-cals. (See additional file 3).In a parallel application, we cultured and differentiated
human neuronal SK-N-SH cells with retinoic acid. Afterdifferentiation, we treated cells with a mixture treatment(CBZ, VNX, FLX) at environmental concentrations[28,29]. As a positive control, we also treated cells withValproate at a clinical dose, 0.035 mM. We then carriedout transcriptome analysis on treated cells and identifiedsignificantly (a = 0.05) enriched gene sets. Thus, wedefined two groups: mixture (MIX) and valproate (VPA)containing all gene sets significantly enriched by thecorresponding treatment [23] (See additional file 4).
Network analysis with plug-ins and identifyingparameters of gene setsWe used the popular Java-based freeware package Cytos-cape to map the ASD protein network [17]. We used theCytoscape plug-in, Network Analyzer [26], to summarize
the nodes of the generated network for ten network mea-sures (See additional file 1). To this network we applied anumber of statistical approaches relatively novel in theanalysis of protein networks including recently developedrobust univariate and multivariate null hypothesis testingmethods and high dimensional mapping procedures. (Seeadditional file 5)
Statistical approachUnivariate comparisonsNetwork data for most indices were characteristicallystrongly positively skewed, and often contained outliers(extreme values). This necessitated the use of robustprocedures for hypothesis testing and estimation. Forlocation (typical value) summaries we felt that the pseu-domedian (Hodges-Lehman location estimator) was themost appropriate measure [30]. For a single set of obser-vations, the pseudomedian is simply the median of allpossible pairwise means. For a difference of two popula-tions the pseudomedian is the median of all possiblepairs of differences, and is an unbiased estimator ofeffect size from a Wilcoxon rank sum test [31].Characteristics of treatments were considered in two
ways. First, nodal network outcomes for particular indiceswere compared to the pseudomedian values of the com-plete network using one-sample Wilcoxon rank sum testswith upper tailed alternative hypotheses. Second, nodalnetwork outcomes for particular treatment were com-pared to each other using Brunner-Dette-Munk (BDM)rank-based permutation tests [32]. BDM tests are robustto both non-normality and treatment heteroscedasticity[33]. The latter is not true for conventional rank-basedpermutation procedures (i.e., the Kruskal-Wallis test). InBDM comparisons an ominbus one way layout withthree factor levels was used. If the null hypothesis ofequal population shifts was rejected, then pairwise BDMtests comparing treatments were applied, and P-valuesfor these tests were corrected for family-wise type I errorusing Holm’s procedure [34].To test the null hypothesis of identical network charac-
teristics for the treatment groups, including the non-enriched portion of the ASD-network, we used permuta-tion multivariate analyses of variance PERMANOVAs [35].Steinhaus dissimilarity was used for the underlying resem-blance matrix [36]. P-values were calculated using 10,000permutations of the vector of treatment assignments withrespect to the resemblance matrix. To depict patterns inmultivariate network space we used nonmetric multidi-mensional scaling (NMDS; [37]). This method attempts toreduce discrepancies (stress) in a resemblance matrix and amapping solution defined, in part, by a user-specifieddimensional choice. We again used Steinhaus dissimilarityfor the underlying resemblance matrix. Following therecommendations of Kruskal and Wish [38], our NMDS
Figure 5 Non-metric multidimensional scaling (NMDS)representation of significantly enhanced gene sets in humancell cultures. This figure compares network characteristics of genesets enhanced by pharmaceuticals in mixtures and valproate inmultivariate network space. Arrows within the scatterplot indicatethe direction of most rapid increase for an indicated variable. Arrowlength is scaled by the R2 value of a multiple regression model withthe variable in question as the response variable and the NMDS axisscores as explanatory variables.
Kaushik et al. BMC Bioinformatics 2015, 16(Suppl 7):S3http://www.biomedcentral.com/1471-2105/16/S7/S3
Page 7 of 9
solutions were the lowest stress results from 20 rando-mized starting configurations.All statistical analyses we conducted using the statisti-
cal package R [31]. In particular, nodal summary datawere from Cytoscape using the package R-Cytoscape[39], and estimation procedures and hypothesis testswere run using R-base packages, and the packages asbio[40] and vegan [41].
Additional material
Additional file 1: Description of network indices used in this paper.This word file contained brief explanations of network indices.
Additional file 2: ASD-associated PPI network Cytoscape file. Cytoscapecompatible file of Core network is available at https://sites.google.com/a/isu.edu/aho/ This file is in .cys format, and will be opened usingCytoscape software. (Cytoscape software can be downloaded for free atwww.cytoscape.org).
Additional file 3: Complete gene data sets for fish and human cells(CBZ-enriched in fish brains, VNX-enriched in fish brains, FLX-enriched infish brains, Mixture-enriched in human cells, Valproate-enriched in humancells). These files are also available at https://sites.google.com/a/isu.edu/aho/
Additional file 4: Complete data of gene sets for fish and human cells.Excel files containing a complete data of all gene sets (CBZ-enriched infish brains, VNX-enriched in fish brains, FLX-enriched in fish brains,Mixture-enriched in human cells, Valproate-enriched in human cells).These files are available at https://sites.google.com/a/isu.edu/aho/
Additional file 5: Nodal summary statistics for gene set groups. The filecontains summary statistics for all nodes in the network. This file isavailable at https://sites.google.com/a/isu.edu/aho/
Competing interestsThe authors declare that they have no competing interests.
Authors’ contributionsGK, KA and MAT designed and carried out the research. MAT provided thedirection and guidance for the research. KA carried out analyses using R-programming and GK collected all the data and interpreted it after testinghypotheses. GK wrote the manuscript. All authors have read and approvedthe final manuscript.
AcknowledgementsThe authors thank Dr. Pete Hallock for providing the guidance for usingCytoscape software for our study. Dr.Luobin Yang also assisted in carryingout gene set enrichment analyses. We also thank Dr.Terry Bowyer forproviding his guidance in writing; Cheng Han Chung for reviewing thismanuscript. The project described was supported by the INBRE Program,NIH Grant Nos. P20 RR016454 (National Center for Research Resources) andP20 GM103408 (national Institute of General Medical Sciences), and theUniversity Research Council (URC) of Idaho State University.
DeclarationsThe publication costs for this article were funded by an InstitutionalDevelopment Award (IDeA) from the National Institute of General MedicalSciences of the National Institutes of Health under Grant #P20GM103408.This article has been published as part of BMC Bioinformatics Volume 16Supplement 7, 2015: Selected articles from The 11th Annual Biotechnologyand Bioinformatics Symposium (BIOT-2014): Bioinformatics. The full contentsof the supplement are available online at http://www.biomedcentral.com/bmcbioinformatics/supplements/16/S7.
Published: 23 April 2015
References1. Matuszek G, Talebizadeh Z: Autism genetic database (AGD): a
comprehensive database including autism susceptibility gene-CNVsintegrated with known noncoding RNAs and fragile sites. Bmc MedicalGenetics 2009, 10.
2. Geschwind DH: Autism: Many Genes, Common Pathways? Cell 2008,135(3):391-395.
3. SJ B, MD B, MD K, LA S, JR J, MC L: Changes in Prevalence of Parent-reported Autism Spectrum Disorder in School-aged U.S. Children: 2007to 2011-2012. National health statistics reports 2013.
4. Toro R, Konyukh M, Delorme R, Leblond C, Chaste P, Fauchereau F,Coleman M, Leboyer M, Gillberg C, Bourgeron T: Key role for gene dosageand synaptic homeostasis in autism spectrum disorders. Trends inGenetics 2010, 26(8):363-372.
5. Landrigan PJ, Lambertini L, Birnbaum LS: A Research Strategy to Discoverthe Environmental Causes of Autism and NeurodevelopmentalDisabilities. Environmental Health Perspectives 2012, 120(7).
6. Geschwind DH: Genetics of autism spectrum disorders. Trends in cognitivesciences 2011, 15(9):409-416.
7. Dufour-Rainfray D, Vourc’h P, Tourlet S, Guilloteau D, Chalon S, Andres CR:Fetal exposure to teratogens: Evidence of genes involved in autism.Neuroscience and Biobehavioral Reviews 2011, 35(5):1254-1265.
8. Landrigan PJ: What causes autism? Exploring the environmentalcontribution. Current Opinion in Pediatrics 2010, 22(2):219-225.
9. State MW, Levitt P: The conundrums of understanding genetic risks forautism spectrum disorders. Nature Neuroscience 2011, 14(12).
10. Thomas MA, Klaper RD: Psychoactive Pharmaceuticals Induce Fish GeneExpression Profiles Associated with Human Idiopathic Autism. Plos One2012, 7(6).
11. Thomas MA, Joshi PP, Klaper RD: Gene-class analysis of expression patternsinduced by psychoactive pharmaceutical exposure in fathead minnow(Pimephales promelas) indicates induction of neuronal systems. ComparativeBiochemistry and Physiology C-Toxicology & Pharmacology 2012, 155(1).
12. Ghosh A, Michalon A, Lindemann L, Fontoura P, Santarelli L: Drugdiscovery for autism spectrum disorder: challenges and opportunities.Nature Reviews Drug Discovery 2013, 12(10):777-790.
13. Croen LA, Grether JK, Yoshida CK, Odouli R, Hendrick V: AntidepressantUse During Pregnancy and Childhood Autism Spectrum Disorders. ArchGen Psychiatry 2011, 68:1104-1112, NOV.
14. Anderson PD, D’Aco VJ, Shanahan P, Chapra SC, Buzby ME, Cunningham VL,Duplessie BM, Hayes EP, Mastrocco FJ, Parke NJ, et al: Screening analysis ofhuman pharmaceutical compounds in US surface waters. EnvironmentalScience & Technology 2004, 38(3):838-849.
15. Subramanian A, Tamayo P, Mootha VK, Mukherjee S, Ebert BL, Gillette MA,Paulovich A, Pomeroy SL, Golub TR, Lander ES, et al: Gene set enrichmentanalysis: A knowledge-based approach for interpreting genome-wideexpression profiles. Proceedings of the National Academy of Sciences of theUnited States of America 2005, 102(43):15545-15550.
16. Aluru N, Deak KL, Jenny MJ, Hahn ME: Developmental exposure to valproicacid alters the expression of microRNAs involved in neurodevelopment inzebrafish. Neurotoxicology and Teratology 2013, 40:46-58.
17. Shannon P, Markiel A, Ozier O, Baliga NS, Wang JT, Ramage D, Amin N,Schwikowski B, Ideker T: Cytoscape: A software environment forintegrated models of biomolecular interaction networks. GenomeResearch 2003, 13(11):2498-2504.
18. Hallock P, Thomas MA: Integrating the Alzheimer’s Disease Proteome andTranscriptome: A Comprehensive Network Model of a Complex Disease.Omics-a Journal of Integrative Biology 2012, 16(1-2).
19. Harden CL: In Utero Valproate Exposure and Autism: Long Suspected,Finally Proven. Epilepsy Currents 2013, 13(6):282.
20. Gonzalez MW, Kann MG: Chapter 4: Protein Interactions and Disease. PlosComputational Biology 2012, 8(12).
21. Aho K: Foundational and Applied Statistics for Biologists Using R Chapmanand hall/CRC Press; 2014.
22. Bill BR, Geschwind DH: Genetic advances in autism: heterogeneity andconvergence on shared pathways. Current Opinion in Genetics &Development 2009, 19(3):271-278.
23. Kaushik G, Xia Y, Yang L, Thomas M: Comparison of Autism-associatedgene expression profiles between Fish brains and human neuronal cellsinduced by environmental contaminants: RNA-Seq Approach..
Kaushik et al. BMC Bioinformatics 2015, 16(Suppl 7):S3http://www.biomedcentral.com/1471-2105/16/S7/S3
Page 8 of 9
24. Hough CJ, Irwin RP, Gao XM, Rogawski MA, Chuang DM: Carbamazepineinhibition of N-methyl-D-aspartate-evoked calcium influx in ratcerebellar granule cells. Journal of Pharmacology and ExperimentalTherapeutics 1996, 276(1):143-149.
25. Basu SN, Kollu R, Banerjee-Basu S: AutDB: a gene reference resource forautism research. Nucleic Acids Research 2009, 37:D832-D836.
26. Cline MS, Smoot M, Cerami E, Kuchinsky A, Landys N, Workman C,Christmas R, Avila-Campilo I, Creech M, Gross B, et al: Integration ofbiological networks and gene expression data using Cytoscape. NatureProtocols 2007, 2(10).
27. Gao J, Ade AS, Tarcea VG, Weymouth TE, Mirel BR, Jagadish HV, States DJ:Integrating and annotating the interactome using the MiMI plugin forcytoscape. Bioinformatics 2009, 25(1).
28. Jain P, Cerone MA, LeBlanc AC, Autexier C: Telomerase and neuronal markerstatus of differentiated NT2 and SK-N-SH human neuronal cells andprimary human neurons. Journal of Neuroscience Research 2007, 85(1):83-89.
29. PN P, H S, L N, G H, V L, W S: Neuronal cell differentiation of humanneuroblastoma cells by retinoic acid plus herbimycin A. Cancer Research1988, 48:6530-6534, Nov 15.
30. Hodges J, Lehmann E: Estimation of location based on ranks. Annals ofMathematical Statistics 1963, 34:598-611.
31. Team RC: R: A Language and Environment for Statistical Computing. RFoundation for Statistical Computing 2012.
32. Brunner E, Dette H, Munk A: Box-type approximations in nonparametricfactorial designs. Journal of the American Statistical Association 1997,92(440):1494-1502.
33. Wilcox RR: Introduction to Robust Estimation and Hypothesis Testing.Academic Press; 2005.
34. Holm S: A simple Sequentially Rejective Multiple Test Procedure. InScandinavian Journal of Statistics. Volume 6. Wiley; 1979:65-70.
35. McArdle BH, Anderson MJ: Fitting multivariate models to communitydata: A comment on distance-based redundancy analysis. Ecology 2001,82(1):290-297.
36. Legendre P, Legendre L: Numerical Ecology Elsevier; 2012, July.37. Cox MAA, Cox TF: Multidimensional Scaling. Handbook of Data
Visualization. Springer Berlin Heidelberg; 2008, 315-347.38. Kruskal JB, Wish M: Multidimensional Scaling. SAGE 1978.39. Shannon PT, Grimes M, Kutlu B, Bot JJ, Galas DJ: RCytoscape: tools for
exploratory network analysis. Bmc Bioinformatics 2013, 14.40. Aho K: asbio: A collection of statistical tools for biologists. R package
version 1.1-3. CRAN 2014.41. Oksanen J, Blanchet F, Kindt R, Legendre P, Minchin P, O’Hara R, Simpson G,
Solymos P, Henry M, Stevens H, et al: vegan: Community EcologyPackage. R package version 2.0-10. CRAN 2013.
doi:10.1186/1471-2105-16-S7-S3Cite this article as: Kaushik et al.: Psychoactive pharmaceuticals asenvironmental contaminants may disrupt highly inter-connected nodesin an Autism-associated protein-protein interaction network. BMCBioinformatics 2015 16(Suppl 7):S3.
Submit your next manuscript to BioMed Centraland take full advantage of:
• Convenient online submission
• Thorough peer review
• No space constraints or color figure charges
• Immediate publication on acceptance
• Inclusion in PubMed, CAS, Scopus and Google Scholar
• Research which is freely available for redistribution
Submit your manuscript at www.biomedcentral.com/submit
Kaushik et al. BMC Bioinformatics 2015, 16(Suppl 7):S3http://www.biomedcentral.com/1471-2105/16/S7/S3
Page 9 of 9


