Embed Size (px)
Citation preview

JOURNAL OF RAMAN SPECTROSCOPYJ. Raman Spectrosc. 2008; 39: 1915–1924Published online 21 July 2008 in Wiley InterScience(www.interscience.wiley.com) DOI: 10.1002/jrs.2058
Pseudopolymorphic transitions of niclosamidemonitored by Raman spectroscopy
Mariana Sardo,1 Ana M. Amado2 and Paulo J. A. Ribeiro-Claro1∗
1 CICECO, Departamento de Quımica, Universidade de Aveiro, P-3810-193 Aveiro, Portugal2 Quımica-Fısica Molecular, Departamento de Quımica, FCTUC, Universidade de Coimbra, P-3004-535 Coimbra, Portugal
Received 29 January 2008; Accepted 28 May 2008
Niclosamide suffers pseudopolymorphic transformations when exposed to different ambient conditions,which can lead to changes in its bioavailability. In this study, the kinetics of the pseudopolymorphictransitions of niclosamide crystals are characterized. FT-Raman spectroscopy is used to quantify theanhydrate and hydrate forms of niclosamide crystals, mostly because of its high sensitivity to the strongintermolecular interactions present in these systems. The samples are exposed to well-characterized relativehumidity (RH) conditions during different periods of time and both water diffusion and polymorphicchanges are monitored from the corresponding changes observed in the vibrational spectra. Both hydrationand dehydration were found to be single-step processes, with a half-life time of ca. 142 and 63 h,respectively, at 24 °C. Copyright 2008 John Wiley & Sons, Ltd.
Supporting information may be found in the online version of this article.
KEYWORDS: niclosamide; hydration/dehydration; Raman spectroscopy; relative humidity; kinetics
INTRODUCTION
The phenomenon of polymorphism and pseudopolymor-phism – solvates in general, hydrates in particular – is verycommon among pharmaceuticals and has been widelyreported in the literature.1 – 6 Approximately one-third ofpharmaceutical solids are able to form hydrate species,depending on the temperature and humidity conditions.7
Polymorphism/pseudopolymorphism reported by a givendrug has become a major concern for pharmaceutics, sinceit has been recognized that differential crystal structuresof a given chemical might exhibit different biopharma-ceutical properties such as solubility, stability, and/orbioavailability.8,9 The unexpected occurrence of polymor-phic or pseudopolymorphic transitions may lead to severepharmaceutical consequences, which can result in productdevelopment delay and commercial production disruption,as in the case of ritonavir.10,11 Hydration and dehydra-tion processes of a pharmaceutical solid during formulationdevelopment or in a final dosage form may adversely affectthe physical, chemical, and/or biological performance of apharmaceutical product.12
When polymorphism/pseudopolymorphism is knownto occur, spectral methods of analysis can be of great value
ŁCorrespondence to: Paulo J. A. Ribeiro-Claro, CICECO,Departamento de Quımica, Universidade de Aveiro, P-3810-193Aveiro, Portugal. E-mail: [email protected]
to assess the drug’s behavior. Vibrational spectroscopy con-tains information about the motions of functional groupsin the solid and is often site-specific in nature, pro-viding some insights as to the origins of the structuralvariations.9
Raman spectroscopy is finding increasing applicationin the field of pharmaceutical analysis13 due to its well-known advantages over Fourier transform infrared (FTIR)spectroscopy for this type of study. The versatility of Ramanspectroscopy allows the identification of polymorphic formsduring crystallization, drying, milling, and granulationprocesses even in the presence of excipient, behind glass or inwater.14 – 16 Moreover, Raman spectroscopy reveals changesin vibrations of the drug molecule during hydrate formation,and provides an excellent method for probing solid-state hydrogen-bonding interactions between molecules,including polymorphs and solvates.8,13 – 23
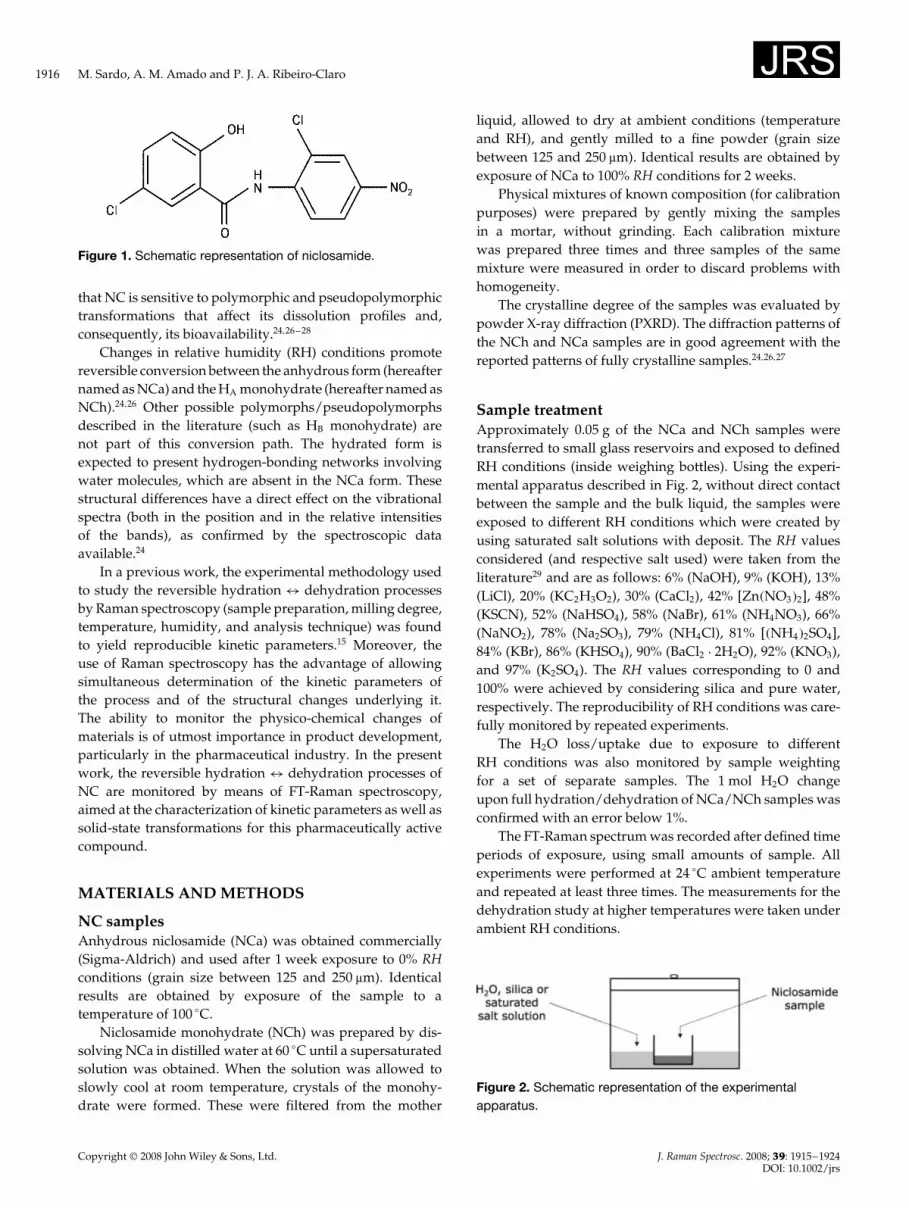
Niclosamide (5-chloro-N(2-chloro-4-nitrophenyl)-2-hy-droxybenzamide, hereafter named NC, Fig. 1) is used as ananthelmintic, mainly for the treatment of worm infestationsin humans and animals, namely, ruminants, ostriches, poul-try, cats, and dogs.24 A significant antituberculosis activityfor NC was also found in previous studies, with a minimalinhibitory concentration of 0.5 to 1 µg ml�1.25
Many studies indicate that NC crystallizes into a numberof solvated forms, two monohydrates (usually labeled as HA
and HB) and one anhydrous form.24,26 It is well documented
Copyright 2008 John Wiley & Sons, Ltd.
1916 M. Sardo, A. M. Amado and P. J. A. Ribeiro-Claro
Figure 1. Schematic representation of niclosamide.
that NC is sensitive to polymorphic and pseudopolymorphictransformations that affect its dissolution profiles and,consequently, its bioavailability.24,26 – 28
Changes in relative humidity (RH) conditions promotereversible conversion between the anhydrous form (hereafternamed as NCa) and the HA monohydrate (hereafter named asNCh).24,26 Other possible polymorphs/pseudopolymorphsdescribed in the literature (such as HB monohydrate) arenot part of this conversion path. The hydrated form isexpected to present hydrogen-bonding networks involvingwater molecules, which are absent in the NCa form. Thesestructural differences have a direct effect on the vibrationalspectra (both in the position and in the relative intensitiesof the bands), as confirmed by the spectroscopic dataavailable.24
In a previous work, the experimental methodology usedto study the reversible hydration $ dehydration processesby Raman spectroscopy (sample preparation, milling degree,temperature, humidity, and analysis technique) was foundto yield reproducible kinetic parameters.15 Moreover, theuse of Raman spectroscopy has the advantage of allowingsimultaneous determination of the kinetic parameters ofthe process and of the structural changes underlying it.The ability to monitor the physico-chemical changes ofmaterials is of utmost importance in product development,particularly in the pharmaceutical industry. In the presentwork, the reversible hydration $ dehydration processes ofNC are monitored by means of FT-Raman spectroscopy,aimed at the characterization of kinetic parameters as well assolid-state transformations for this pharmaceutically activecompound.
MATERIALS AND METHODS
NC samplesAnhydrous niclosamide (NCa) was obtained commercially(Sigma-Aldrich) and used after 1 week exposure to 0% RHconditions (grain size between 125 and 250 µm). Identicalresults are obtained by exposure of the sample to atemperature of 100 °C.
Niclosamide monohydrate (NCh) was prepared by dis-solving NCa in distilled water at 60 °C until a supersaturatedsolution was obtained. When the solution was allowed toslowly cool at room temperature, crystals of the monohy-drate were formed. These were filtered from the mother
liquid, allowed to dry at ambient conditions (temperatureand RH), and gently milled to a fine powder (grain sizebetween 125 and 250 µm). Identical results are obtained byexposure of NCa to 100% RH conditions for 2 weeks.
Physical mixtures of known composition (for calibrationpurposes) were prepared by gently mixing the samplesin a mortar, without grinding. Each calibration mixturewas prepared three times and three samples of the samemixture were measured in order to discard problems withhomogeneity.
The crystalline degree of the samples was evaluated bypowder X-ray diffraction (PXRD). The diffraction patterns ofthe NCh and NCa samples are in good agreement with thereported patterns of fully crystalline samples.24,26,27
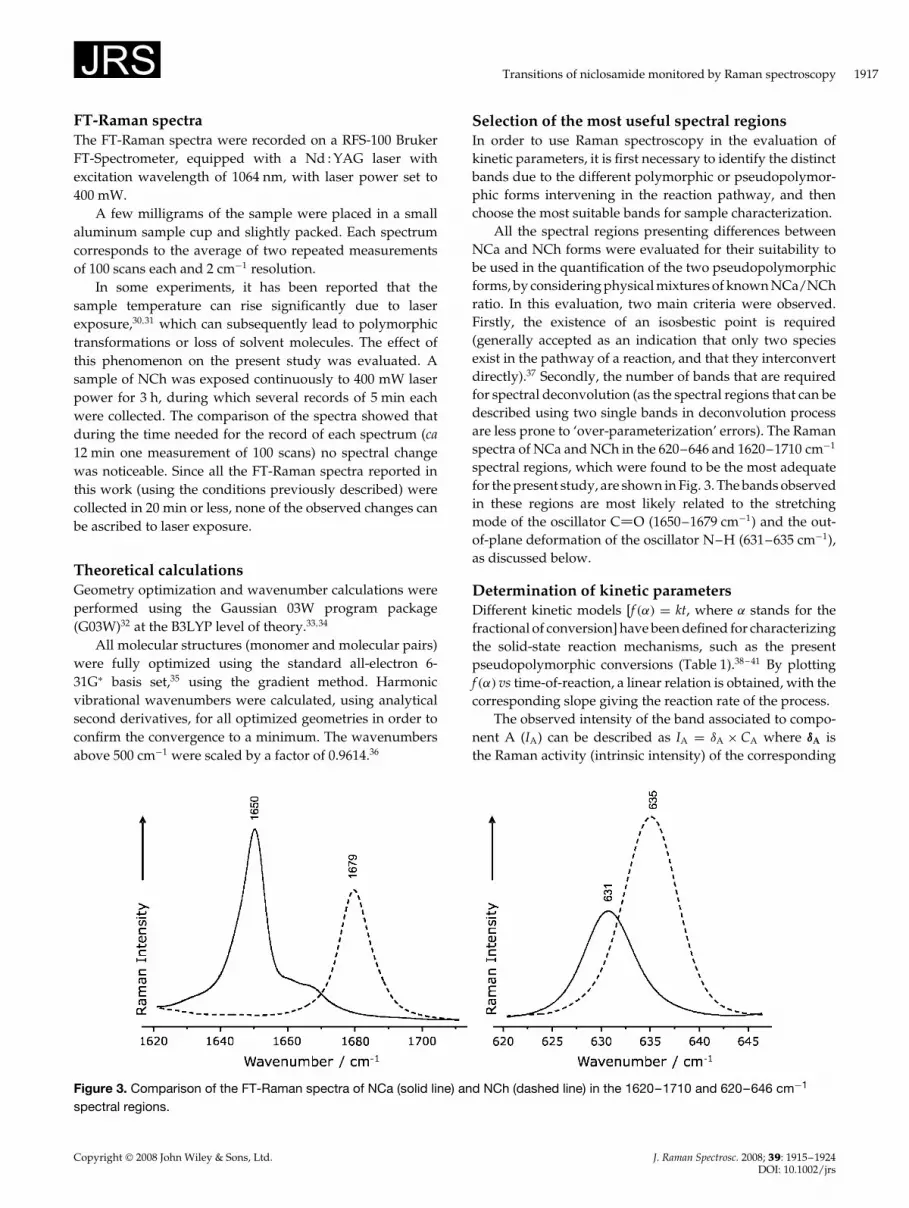
Sample treatmentApproximately 0.05 g of the NCa and NCh samples weretransferred to small glass reservoirs and exposed to definedRH conditions (inside weighing bottles). Using the experi-mental apparatus described in Fig. 2, without direct contactbetween the sample and the bulk liquid, the samples wereexposed to different RH conditions which were created byusing saturated salt solutions with deposit. The RH valuesconsidered (and respective salt used) were taken from theliterature29 and are as follows: 6% (NaOH), 9% (KOH), 13%(LiCl), 20% (KC2H3O2), 30% (CaCl2), 42% [Zn�NO3�2], 48%(KSCN), 52% (NaHSO4), 58% (NaBr), 61% (NH4NO3), 66%(NaNO2), 78% (Na2SO3), 79% (NH4Cl), 81% [�NH4�2SO4],84% (KBr), 86% (KHSO4), 90% (BaCl2 Ð 2H2O), 92% (KNO3),and 97% (K2SO4). The RH values corresponding to 0 and100% were achieved by considering silica and pure water,respectively. The reproducibility of RH conditions was care-fully monitored by repeated experiments.
The H2O loss/uptake due to exposure to differentRH conditions was also monitored by sample weightingfor a set of separate samples. The 1 mol H2O changeupon full hydration/dehydration of NCa/NCh samples wasconfirmed with an error below 1%.
The FT-Raman spectrum was recorded after defined timeperiods of exposure, using small amounts of sample. Allexperiments were performed at 24 °C ambient temperatureand repeated at least three times. The measurements for thedehydration study at higher temperatures were taken underambient RH conditions.
Figure 2. Schematic representation of the experimentalapparatus.
Copyright 2008 John Wiley & Sons, Ltd. J. Raman Spectrosc. 2008; 39: 1915–1924DOI: 10.1002/jrs
Transitions of niclosamide monitored by Raman spectroscopy 1917
FT-Raman spectraThe FT-Raman spectra were recorded on a RFS-100 BrukerFT-Spectrometer, equipped with a Nd : YAG laser withexcitation wavelength of 1064 nm, with laser power set to400 mW.
A few milligrams of the sample were placed in a smallaluminum sample cup and slightly packed. Each spectrumcorresponds to the average of two repeated measurementsof 100 scans each and 2 cm�1 resolution.
In some experiments, it has been reported that thesample temperature can rise significantly due to laserexposure,30,31 which can subsequently lead to polymorphictransformations or loss of solvent molecules. The effect ofthis phenomenon on the present study was evaluated. Asample of NCh was exposed continuously to 400 mW laserpower for 3 h, during which several records of 5 min eachwere collected. The comparison of the spectra showed thatduring the time needed for the record of each spectrum (ca12 min one measurement of 100 scans) no spectral changewas noticeable. Since all the FT-Raman spectra reported inthis work (using the conditions previously described) werecollected in 20 min or less, none of the observed changes canbe ascribed to laser exposure.
Theoretical calculationsGeometry optimization and wavenumber calculations wereperformed using the Gaussian 03W program package(G03W)32 at the B3LYP level of theory.33,34
All molecular structures (monomer and molecular pairs)were fully optimized using the standard all-electron 6-31GŁ basis set,35 using the gradient method. Harmonicvibrational wavenumbers were calculated, using analyticalsecond derivatives, for all optimized geometries in order toconfirm the convergence to a minimum. The wavenumbersabove 500 cm�1 were scaled by a factor of 0.9614.36
Selection of the most useful spectral regionsIn order to use Raman spectroscopy in the evaluation ofkinetic parameters, it is first necessary to identify the distinctbands due to the different polymorphic or pseudopolymor-phic forms intervening in the reaction pathway, and thenchoose the most suitable bands for sample characterization.
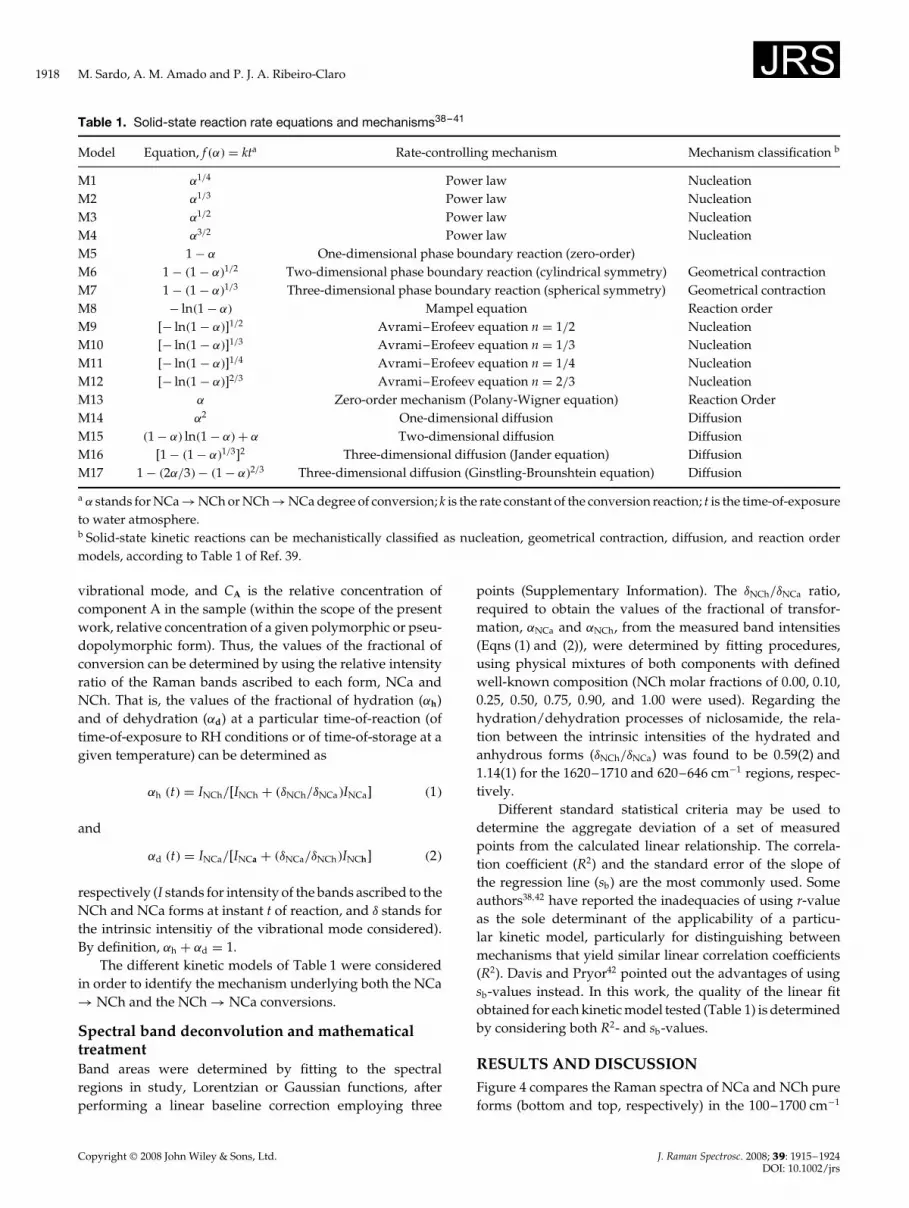
All the spectral regions presenting differences betweenNCa and NCh forms were evaluated for their suitability tobe used in the quantification of the two pseudopolymorphicforms, by considering physical mixtures of known NCa/NChratio. In this evaluation, two main criteria were observed.Firstly, the existence of an isosbestic point is required(generally accepted as an indication that only two speciesexist in the pathway of a reaction, and that they interconvertdirectly).37 Secondly, the number of bands that are requiredfor spectral deconvolution (as the spectral regions that can bedescribed using two single bands in deconvolution processare less prone to ‘over-parameterization’ errors). The Ramanspectra of NCa and NCh in the 620–646 and 1620–1710 cm�1
spectral regions, which were found to be the most adequatefor the present study, are shown in Fig. 3. The bands observedin these regions are most likely related to the stretchingmode of the oscillator C O (1650–1679 cm�1) and the out-of-plane deformation of the oscillator N–H (631–635 cm�1),as discussed below.
Determination of kinetic parametersDifferent kinetic models [f �˛� D kt, where ˛ stands for thefractional of conversion] have been defined for characterizingthe solid-state reaction mechanisms, such as the presentpseudopolymorphic conversions (Table 1).38 – 41 By plottingf �˛� vs time-of-reaction, a linear relation is obtained, with thecorresponding slope giving the reaction rate of the process.
The observed intensity of the band associated to compo-nent A (IA) can be described as IA D υA ð CA where dA isthe Raman activity (intrinsic intensity) of the corresponding
Figure 3. Comparison of the FT-Raman spectra of NCa (solid line) and NCh (dashed line) in the 1620–1710 and 620–646 cm�1
spectral regions.
Copyright 2008 John Wiley & Sons, Ltd. J. Raman Spectrosc. 2008; 39: 1915–1924DOI: 10.1002/jrs
1918 M. Sardo, A. M. Amado and P. J. A. Ribeiro-Claro
Table 1. Solid-state reaction rate equations and mechanisms38–41
Model Equation, f �˛� D kta Rate-controlling mechanism Mechanism classification b
M1 ˛1/4 Power law NucleationM2 ˛1/3 Power law NucleationM3 ˛1/2 Power law NucleationM4 ˛3/2 Power law NucleationM5 1 � ˛ One-dimensional phase boundary reaction (zero-order)M6 1 � �1 � ˛�1/2 Two-dimensional phase boundary reaction (cylindrical symmetry) Geometrical contractionM7 1 � �1 � ˛�1/3 Three-dimensional phase boundary reaction (spherical symmetry) Geometrical contractionM8 � ln�1 � ˛� Mampel equation Reaction orderM9 [� ln�1 � ˛�]1/2 Avrami–Erofeev equation n D 1/2 NucleationM10 [� ln�1 � ˛�]1/3 Avrami–Erofeev equation n D 1/3 NucleationM11 [� ln�1 � ˛�]1/4 Avrami–Erofeev equation n D 1/4 NucleationM12 [� ln�1 � ˛�]2/3 Avrami–Erofeev equation n D 2/3 NucleationM13 ˛ Zero-order mechanism (Polany-Wigner equation) Reaction OrderM14 ˛2 One-dimensional diffusion DiffusionM15 �1 � ˛� ln�1 � ˛� C ˛ Two-dimensional diffusion DiffusionM16 [1 � �1 � ˛�1/3]2 Three-dimensional diffusion (Jander equation) DiffusionM17 1 � �2˛/3� � �1 � ˛�2/3 Three-dimensional diffusion (Ginstling-Brounshtein equation) Diffusion
a ˛ stands for NCa ! NCh or NCh ! NCa degree of conversion; k is the rate constant of the conversion reaction; t is the time-of-exposureto water atmosphere.b Solid-state kinetic reactions can be mechanistically classified as nucleation, geometrical contraction, diffusion, and reaction ordermodels, according to Table 1 of Ref. 39.
vibrational mode, and CA is the relative concentration ofcomponent A in the sample (within the scope of the presentwork, relative concentration of a given polymorphic or pseu-dopolymorphic form). Thus, the values of the fractional ofconversion can be determined by using the relative intensityratio of the Raman bands ascribed to each form, NCa andNCh. That is, the values of the fractional of hydration (˛h)and of dehydration (˛d) at a particular time-of-reaction (oftime-of-exposure to RH conditions or of time-of-storage at agiven temperature) can be determined as
˛h �t� D INCh/[INCh C �υNCh/υNCa�INCa] �1�
and
˛d �t� D INCa/[INCa C �υNCa/υNCh�INCh] �2�
respectively (I stands for intensity of the bands ascribed to theNCh and NCa forms at instant t of reaction, and υ stands forthe intrinsic intensitiy of the vibrational mode considered).By definition, ˛h C ˛d D 1.
The different kinetic models of Table 1 were consideredin order to identify the mechanism underlying both the NCa! NCh and the NCh ! NCa conversions.
Spectral band deconvolution and mathematicaltreatmentBand areas were determined by fitting to the spectralregions in study, Lorentzian or Gaussian functions, afterperforming a linear baseline correction employing three
points (Supplementary Information). The υNCh/υNCa ratio,required to obtain the values of the fractional of transfor-mation, ˛NCa and ˛NCh, from the measured band intensities(Eqns (1) and (2)), were determined by fitting procedures,using physical mixtures of both components with definedwell-known composition (NCh molar fractions of 0.00, 0.10,0.25, 0.50, 0.75, 0.90, and 1.00 were used). Regarding thehydration/dehydration processes of niclosamide, the rela-tion between the intrinsic intensities of the hydrated andanhydrous forms (υNCh/υNCa) was found to be 0.59(2) and1.14(1) for the 1620–1710 and 620–646 cm�1 regions, respec-tively.
Different standard statistical criteria may be used todetermine the aggregate deviation of a set of measuredpoints from the calculated linear relationship. The correla-tion coefficient (R2) and the standard error of the slope ofthe regression line (sb) are the most commonly used. Someauthors38,42 have reported the inadequacies of using r-valueas the sole determinant of the applicability of a particu-lar kinetic model, particularly for distinguishing betweenmechanisms that yield similar linear correlation coefficients(R2). Davis and Pryor42 pointed out the advantages of usingsb-values instead. In this work, the quality of the linear fitobtained for each kinetic model tested (Table 1) is determinedby considering both R2- and sb-values.
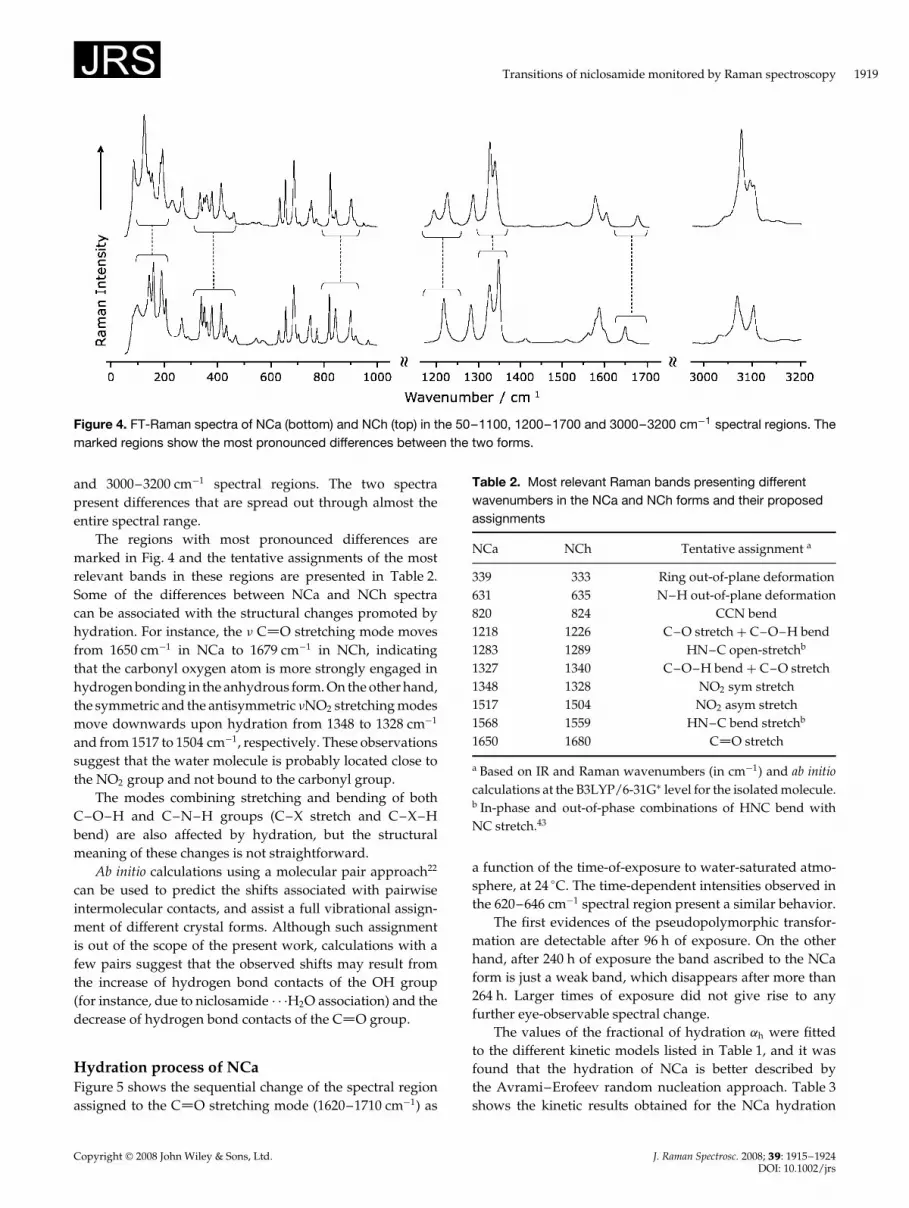
RESULTS AND DISCUSSIONFigure 4 compares the Raman spectra of NCa and NCh pureforms (bottom and top, respectively) in the 100–1700 cm�1
Copyright 2008 John Wiley & Sons, Ltd. J. Raman Spectrosc. 2008; 39: 1915–1924DOI: 10.1002/jrs
Transitions of niclosamide monitored by Raman spectroscopy 1919
Figure 4. FT-Raman spectra of NCa (bottom) and NCh (top) in the 50–1100, 1200–1700 and 3000–3200 cm�1 spectral regions. Themarked regions show the most pronounced differences between the two forms.
and 3000–3200 cm�1 spectral regions. The two spectrapresent differences that are spread out through almost theentire spectral range.
The regions with most pronounced differences aremarked in Fig. 4 and the tentative assignments of the mostrelevant bands in these regions are presented in Table 2.Some of the differences between NCa and NCh spectracan be associated with the structural changes promoted byhydration. For instance, the � C O stretching mode movesfrom 1650 cm�1 in NCa to 1679 cm�1 in NCh, indicatingthat the carbonyl oxygen atom is more strongly engaged inhydrogen bonding in the anhydrous form. On the other hand,the symmetric and the antisymmetric �NO2 stretching modesmove downwards upon hydration from 1348 to 1328 cm�1
and from 1517 to 1504 cm�1, respectively. These observationssuggest that the water molecule is probably located close tothe NO2 group and not bound to the carbonyl group.
The modes combining stretching and bending of bothC–O–H and C–N–H groups (C–X stretch and C–X–Hbend) are also affected by hydration, but the structuralmeaning of these changes is not straightforward.
Ab initio calculations using a molecular pair approach22
can be used to predict the shifts associated with pairwiseintermolecular contacts, and assist a full vibrational assign-ment of different crystal forms. Although such assignmentis out of the scope of the present work, calculations with afew pairs suggest that the observed shifts may result fromthe increase of hydrogen bond contacts of the OH group(for instance, due to niclosamide Ð Ð ÐH2O association) and thedecrease of hydrogen bond contacts of the C O group.
Hydration process of NCaFigure 5 shows the sequential change of the spectral regionassigned to the C O stretching mode (1620–1710 cm�1) as
Table 2. Most relevant Raman bands presenting differentwavenumbers in the NCa and NCh forms and their proposedassignments
NCa NCh Tentative assignment a
339 333 Ring out-of-plane deformation631 635 N–H out-of-plane deformation820 824 CCN bend1218 1226 C–O stretch C C–O–H bend1283 1289 HN–C open-stretchb
1327 1340 C–O–H bend C C–O stretch1348 1328 NO2 sym stretch1517 1504 NO2 asym stretch1568 1559 HN–C bend stretchb
1650 1680 C O stretch
a Based on IR and Raman wavenumbers (in cm�1) and ab initiocalculations at the B3LYP/6-31GŁ level for the isolated molecule.b In-phase and out-of-phase combinations of HNC bend withNC stretch.43
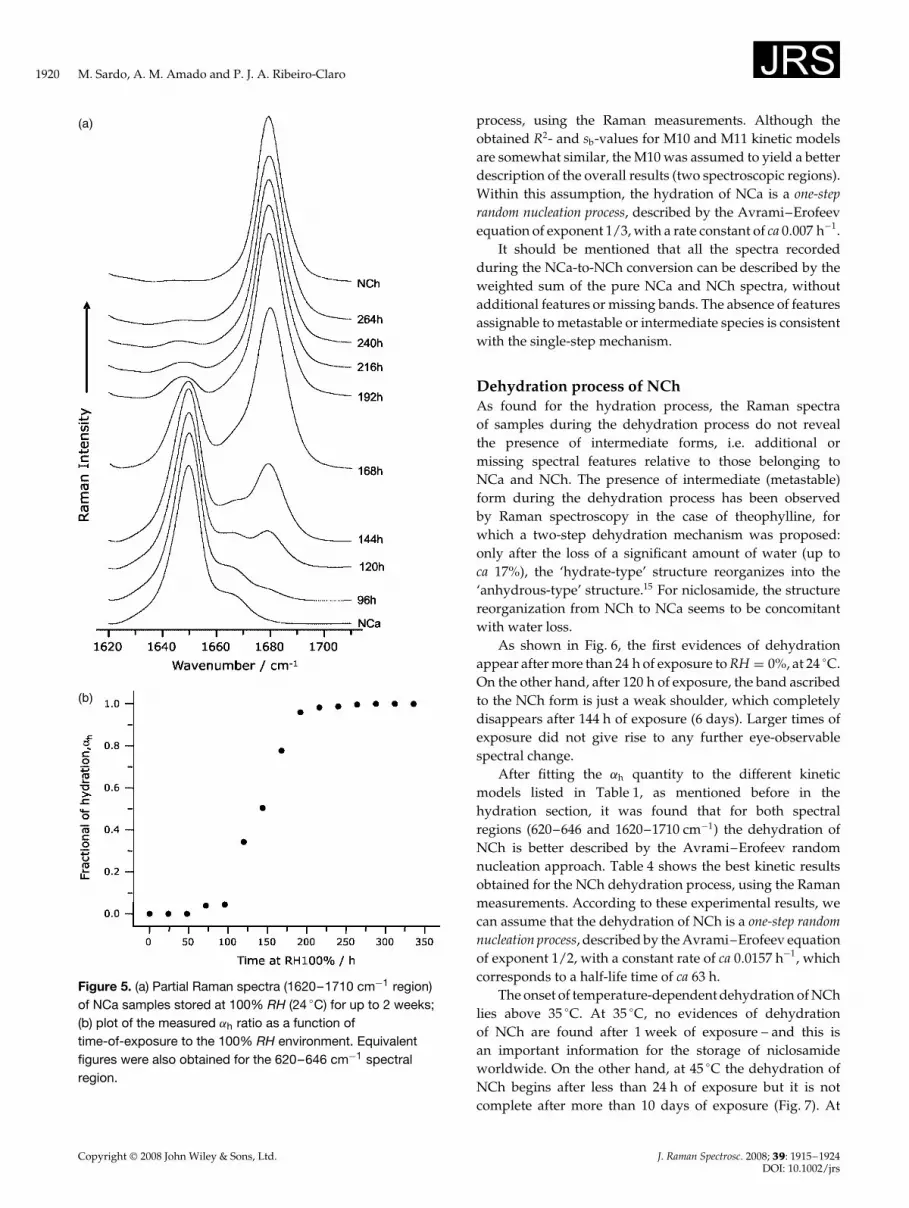
a function of the time-of-exposure to water-saturated atmo-sphere, at 24 °C. The time-dependent intensities observed inthe 620–646 cm�1 spectral region present a similar behavior.
The first evidences of the pseudopolymorphic transfor-mation are detectable after 96 h of exposure. On the otherhand, after 240 h of exposure the band ascribed to the NCaform is just a weak band, which disappears after more than264 h. Larger times of exposure did not give rise to anyfurther eye-observable spectral change.
The values of the fractional of hydration ˛h were fittedto the different kinetic models listed in Table 1, and it wasfound that the hydration of NCa is better described bythe Avrami–Erofeev random nucleation approach. Table 3shows the kinetic results obtained for the NCa hydration
Copyright 2008 John Wiley & Sons, Ltd. J. Raman Spectrosc. 2008; 39: 1915–1924DOI: 10.1002/jrs
1920 M. Sardo, A. M. Amado and P. J. A. Ribeiro-Claro
(a)
(b)
Figure 5. (a) Partial Raman spectra (1620–1710 cm�1 region)of NCa samples stored at 100% RH (24 °C) for up to 2 weeks;(b) plot of the measured ˛h ratio as a function oftime-of-exposure to the 100% RH environment. Equivalentfigures were also obtained for the 620–646 cm�1 spectralregion.
process, using the Raman measurements. Although theobtained R2- and sb-values for M10 and M11 kinetic modelsare somewhat similar, the M10 was assumed to yield a betterdescription of the overall results (two spectroscopic regions).Within this assumption, the hydration of NCa is a one-steprandom nucleation process, described by the Avrami–Erofeevequation of exponent 1/3, with a rate constant of ca 0.007 h�1.
It should be mentioned that all the spectra recordedduring the NCa-to-NCh conversion can be described by theweighted sum of the pure NCa and NCh spectra, withoutadditional features or missing bands. The absence of featuresassignable to metastable or intermediate species is consistentwith the single-step mechanism.
Dehydration process of NChAs found for the hydration process, the Raman spectraof samples during the dehydration process do not revealthe presence of intermediate forms, i.e. additional ormissing spectral features relative to those belonging toNCa and NCh. The presence of intermediate (metastable)form during the dehydration process has been observedby Raman spectroscopy in the case of theophylline, forwhich a two-step dehydration mechanism was proposed:only after the loss of a significant amount of water (up toca 17%), the ‘hydrate-type’ structure reorganizes into the‘anhydrous-type’ structure.15 For niclosamide, the structurereorganization from NCh to NCa seems to be concomitantwith water loss.
As shown in Fig. 6, the first evidences of dehydrationappear after more than 24 h of exposure to RH D 0%, at 24 °C.On the other hand, after 120 h of exposure, the band ascribedto the NCh form is just a weak shoulder, which completelydisappears after 144 h of exposure (6 days). Larger times ofexposure did not give rise to any further eye-observablespectral change.
After fitting the ˛h quantity to the different kineticmodels listed in Table 1, as mentioned before in thehydration section, it was found that for both spectralregions (620–646 and 1620–1710 cm�1) the dehydration ofNCh is better described by the Avrami–Erofeev randomnucleation approach. Table 4 shows the best kinetic resultsobtained for the NCh dehydration process, using the Ramanmeasurements. According to these experimental results, wecan assume that the dehydration of NCh is a one-step randomnucleation process, described by the Avrami–Erofeev equationof exponent 1/2, with a constant rate of ca 0.0157 h�1, whichcorresponds to a half-life time of ca 63 h.
The onset of temperature-dependent dehydration of NChlies above 35 °C. At 35 °C, no evidences of dehydrationof NCh are found after 1 week of exposure – and this isan important information for the storage of niclosamideworldwide. On the other hand, at 45 °C the dehydration ofNCh begins after less than 24 h of exposure but it is notcomplete after more than 10 days of exposure (Fig. 7). At
Copyright 2008 John Wiley & Sons, Ltd. J. Raman Spectrosc. 2008; 39: 1915–1924DOI: 10.1002/jrs

Transitions of niclosamide monitored by Raman spectroscopy 1921
Table 3. Values of rate constant of hydration (k), standard deviation of the slope (sb), correlation coefficient (R2), and times ofhalf-hydration (t1/2) and complete hydration (th), obtained for the best linear fits f�˛� for the two spectral regions considered
Spectralregion cm�1 Model f �˛� k h�1 sb R2 t1/2
a h�1 thb h�1
1620–1710 M10 0.00754t � 0.14412 0.00754 0.00059 0.9649 136 319M11 0.00625t C 0.00240 0.00625 0.00042 0.9733 145 295
620–646 M10 0.00664t � 0.09544 0.00664 0.00051 0.9597 147 319
a Time for half-hydration [f �˛� is equal to 0.88 and 0.91 for M10 and M11, respectively, using ˛ D 0.5].b Time for total hydration [f �˛� is equal to 2.26 and 1.84 for M10 and M11, respectively, using ˛ D 0.99999].
(a) (b)
Figure 6. (a) Partial Raman spectra (1620–1710 cm�1) of NCh samples stored at 0% RH (24 °C) for up to 1 week; (b) plot of themeasured ˛h ratio as a function of time-of-exposure to the 0% RH environment. Equivalent figures were also obtained for the620–646 cm�1 spectral region.
Copyright 2008 John Wiley & Sons, Ltd. J. Raman Spectrosc. 2008; 39: 1915–1924DOI: 10.1002/jrs
1922 M. Sardo, A. M. Amado and P. J. A. Ribeiro-Claro
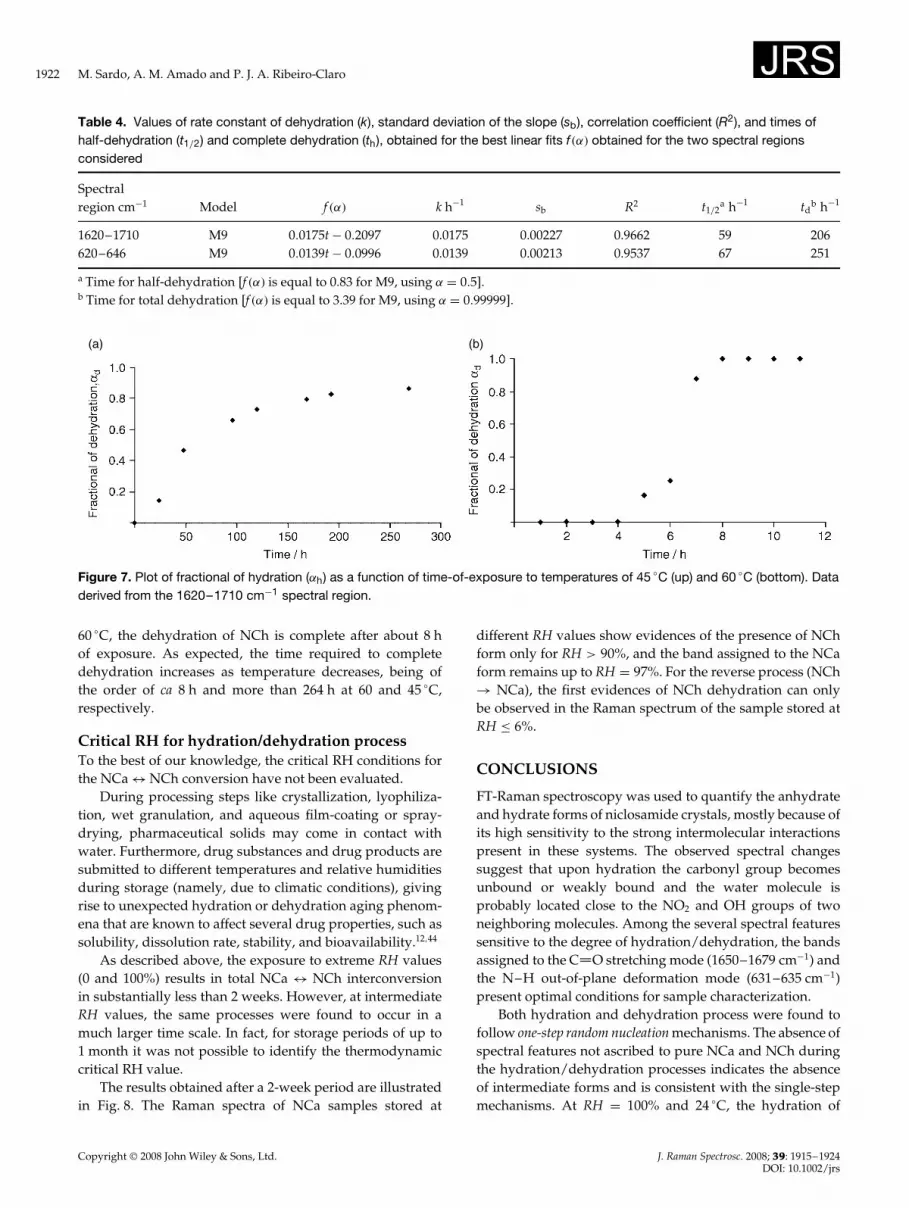
Table 4. Values of rate constant of dehydration (k), standard deviation of the slope (sb), correlation coefficient (R2), and times ofhalf-dehydration (t1/2) and complete dehydration (th), obtained for the best linear fits f�˛� obtained for the two spectral regionsconsidered
Spectralregion cm�1 Model f �˛� k h�1 sb R2 t1/2
a h�1 tdb h�1
1620–1710 M9 0.0175t � 0.2097 0.0175 0.00227 0.9662 59 206620–646 M9 0.0139t � 0.0996 0.0139 0.00213 0.9537 67 251
a Time for half-dehydration [f �˛� is equal to 0.83 for M9, using ˛ D 0.5].b Time for total dehydration [f �˛� is equal to 3.39 for M9, using ˛ D 0.99999].
(a) (b)
Figure 7. Plot of fractional of hydration (˛h) as a function of time-of-exposure to temperatures of 45 °C (up) and 60 °C (bottom). Dataderived from the 1620–1710 cm�1 spectral region.
60 °C, the dehydration of NCh is complete after about 8 hof exposure. As expected, the time required to completedehydration increases as temperature decreases, being ofthe order of ca 8 h and more than 264 h at 60 and 45 °C,respectively.
Critical RH for hydration/dehydration processTo the best of our knowledge, the critical RH conditions forthe NCa $ NCh conversion have not been evaluated.
During processing steps like crystallization, lyophiliza-tion, wet granulation, and aqueous film-coating or spray-drying, pharmaceutical solids may come in contact withwater. Furthermore, drug substances and drug products aresubmitted to different temperatures and relative humiditiesduring storage (namely, due to climatic conditions), givingrise to unexpected hydration or dehydration aging phenom-ena that are known to affect several drug properties, such assolubility, dissolution rate, stability, and bioavailability.12,44
As described above, the exposure to extreme RH values(0 and 100%) results in total NCa $ NCh interconversionin substantially less than 2 weeks. However, at intermediateRH values, the same processes were found to occur in amuch larger time scale. In fact, for storage periods of up to1 month it was not possible to identify the thermodynamiccritical RH value.
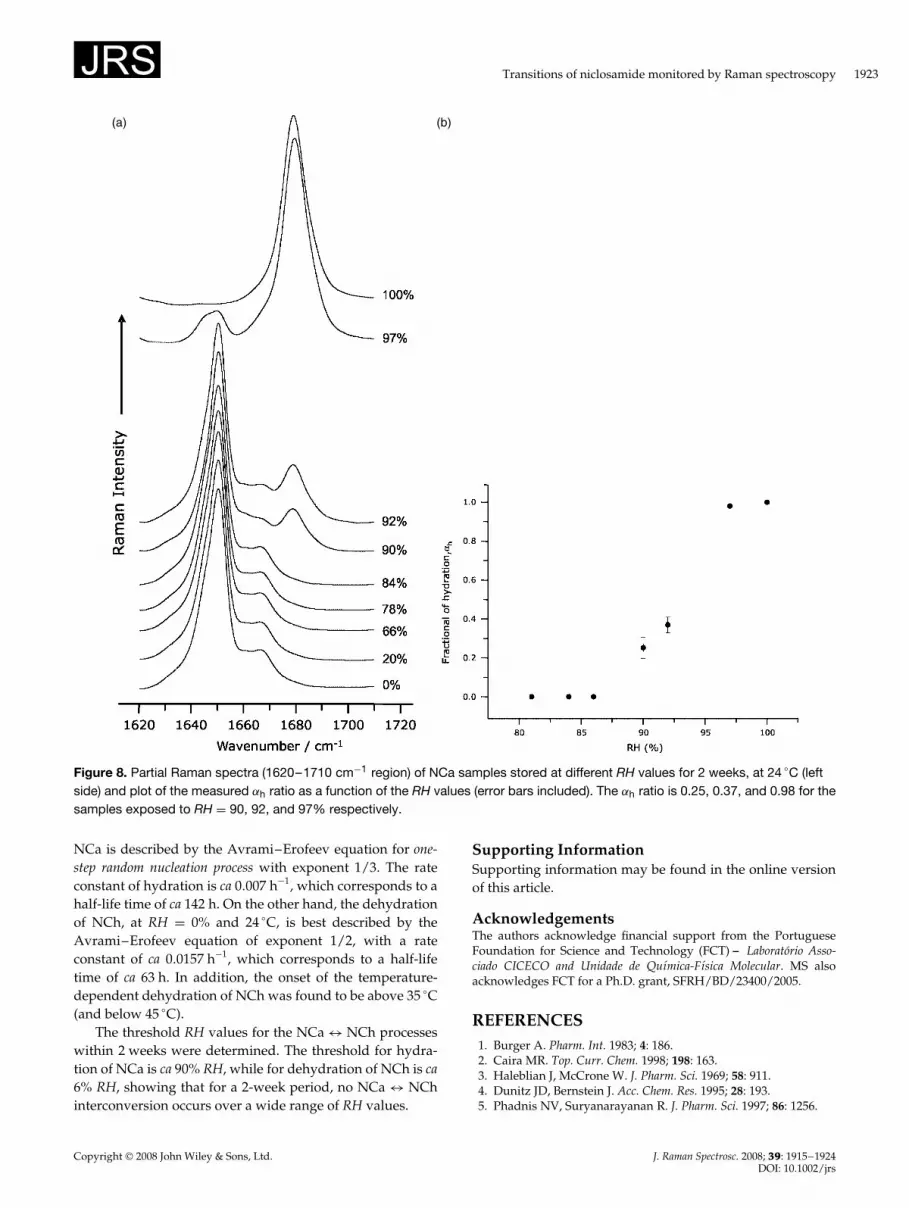
The results obtained after a 2-week period are illustratedin Fig. 8. The Raman spectra of NCa samples stored at
different RH values show evidences of the presence of NChform only for RH > 90%, and the band assigned to the NCaform remains up to RH D 97%. For the reverse process (NCh! NCa), the first evidences of NCh dehydration can onlybe observed in the Raman spectrum of the sample stored atRH � 6%.
CONCLUSIONS
FT-Raman spectroscopy was used to quantify the anhydrateand hydrate forms of niclosamide crystals, mostly because ofits high sensitivity to the strong intermolecular interactionspresent in these systems. The observed spectral changessuggest that upon hydration the carbonyl group becomesunbound or weakly bound and the water molecule isprobably located close to the NO2 and OH groups of twoneighboring molecules. Among the several spectral featuressensitive to the degree of hydration/dehydration, the bandsassigned to the C O stretching mode (1650–1679 cm�1) andthe N–H out-of-plane deformation mode (631–635 cm�1)present optimal conditions for sample characterization.
Both hydration and dehydration process were found tofollow one-step random nucleation mechanisms. The absence ofspectral features not ascribed to pure NCa and NCh duringthe hydration/dehydration processes indicates the absenceof intermediate forms and is consistent with the single-stepmechanisms. At RH D 100% and 24 °C, the hydration of
Copyright 2008 John Wiley & Sons, Ltd. J. Raman Spectrosc. 2008; 39: 1915–1924DOI: 10.1002/jrs
Transitions of niclosamide monitored by Raman spectroscopy 1923
(a) (b)
Figure 8. Partial Raman spectra (1620–1710 cm�1 region) of NCa samples stored at different RH values for 2 weeks, at 24 °C (leftside) and plot of the measured ˛h ratio as a function of the RH values (error bars included). The ˛h ratio is 0.25, 0.37, and 0.98 for thesamples exposed to RH D 90, 92, and 97% respectively.
NCa is described by the Avrami–Erofeev equation for one-step random nucleation process with exponent 1/3. The rateconstant of hydration is ca 0.007 h�1, which corresponds to ahalf-life time of ca 142 h. On the other hand, the dehydrationof NCh, at RH D 0% and 24 °C, is best described by theAvrami–Erofeev equation of exponent 1/2, with a rateconstant of ca 0.0157 h�1, which corresponds to a half-lifetime of ca 63 h. In addition, the onset of the temperature-dependent dehydration of NCh was found to be above 35 °C(and below 45 °C).
The threshold RH values for the NCa $ NCh processeswithin 2 weeks were determined. The threshold for hydra-tion of NCa is ca 90% RH, while for dehydration of NCh is ca6% RH, showing that for a 2-week period, no NCa $ NChinterconversion occurs over a wide range of RH values.
Supporting InformationSupporting information may be found in the online versionof this article.
AcknowledgementsThe authors acknowledge financial support from the PortugueseFoundation for Science and Technology (FCT) – Laboratorio Asso-ciado CICECO and Unidade de Quımica-Fısica Molecular. MS alsoacknowledges FCT for a Ph.D. grant, SFRH/BD/23400/2005.
REFERENCES1. Burger A. Pharm. Int. 1983; 4: 186.2. Caira MR. Top. Curr. Chem. 1998; 198: 163.3. Haleblian J, McCrone W. J. Pharm. Sci. 1969; 58: 911.4. Dunitz JD, Bernstein J. Acc. Chem. Res. 1995; 28: 193.5. Phadnis NV, Suryanarayanan R. J. Pharm. Sci. 1997; 86: 1256.
Copyright 2008 John Wiley & Sons, Ltd. J. Raman Spectrosc. 2008; 39: 1915–1924DOI: 10.1002/jrs
1924 M. Sardo, A. M. Amado and P. J. A. Ribeiro-Claro
6. Giordano F, Gazzaniga A, Moyano JR, Ventura P, Zanol M,Peveri T, Carima L. J. Pharm. Sci. 1998; 87: 333.
7. Stahl HP. The Problem of Drug Interactions with Excipients inTowards Better Safety of Drugs and Pharmaceutical Products.Elsevier: New York, 1980.
8. Fini G. J. Raman Spectrosc. 2004; 35: 335.9. Brittain HG. J. Pharm. Sci. 1997; 86: 405.
10. Bauer J, Spanton S, Henry R, Quick J, Dziki W, Porter W,Morris J. Pharm. Res. 2001; 18: 859.
11. Yu LX, Furness MS, Raw A, Outlaw KPW, Nashed NE,Ramos E, Miller SPF, Adams RC, Fang F, Patel RM, Hol-combe FO Jr, Chiu Y-y, Hussain AS. Pharm. Res. 2003; 20: 531.
12. Khankari RK, Grant DJW. Thermochim. Acta 1995; 248: 61.13. Bugay DE. Adv. Drug Deliv. Rev. 2001; 48: 43.14. Szelagiewicz M, Marcolli C, Cianferani S, Hard AP, Vit A,
Burkhard A, von Raumer M, Hofmeier UC, Zilian A,Francotte E, Schenker R. J. Therm. Anal. Calorim. 1999; 57: 23.
15. Amado AM, Nolasco MM, Ribeiro-Claro PJA. J. Pharm. Sci. 2007;96: 1366.
16. Rodrıguez-Spong B, Price CP, Jayasankar A, Matzger AJ,Rodrıguez-Hornedoa N. Adv. Drug Deliv. Rev. 2004; 56: 271.
17. O’Brien LE, Timmins P, Williams AC, York P. J. Pharm. Biomed.Anal. 2004; 36: 335.
18. Hausman DS, Cambron RT, Sakr A. Int. J. Pharm. 2005; 299: 19.19. Pratiwi D, Fawcett JP, Gordon KC, Rades T. Eur. J. Pharm.
Biopharm. 2002; 54: 337.20. Gamberini MC, Baraldi C, Tinti A, Rustichelli C, Ferioli V,
Gamberini G. J. Mol. Struct. 2006; 785: 216.21. Starbuck C, Spartalis A, Wai L, Wang J, Fernandez P,
Lindemann CM, Zhou GX, Ge Z. Cryst. Growth Des. 2002; 2:515.
22. Nolasco MM, Amado AM, Ribeiro-Claro PJA. ChemPhysChem2006; 7: 2150.
23. Jørgensen A, Rantanen J, Karjalainen M, Khriachtchev L,Rasanen E, Yliruusi J. Pharm. Res. 2002; 19: 1285.
24. van Tonder EC, Maleka TSP, Liebenberg W, Song M,Wurster DE, de Villiers MM. Int. J. Pharm. 2004; 269: 417.
25. Sun Z, Zhang Y. Tuber. Lung Dis. 1999; 79: 319.26. de Villiers MM, Mahlatji MD, van Tonder EC, Malan SF,
Lotter AP, Liebenberg W. Drug Dev. Ind. Pharm. 2004; 30: 581.27. Manek RV, Kolling WM. AAPS PharmSciTech 2004; 5(1): 1.
28. Caira MR, van Tonder EC, de Villiers MM, Lotter AP. J. InclusionPhenom. Mol. Recognit. Chem. 1998; 31: 1.
29. Weast RC, Astle MJ, Beyer WH (eds). CRC Handbook of Chemistryand Physics a Ready-reference Book of Chemical and Physical Data.CRC Press: Florida, 1983.
30. Marigheto NA, Kemsley EK, Potter J, Belton PS, Wilson RH.Spectrochim. Acta, Part A 1996; 52: 1571.
31. Johansson J, Pettersson S, Taylor LS. J. Pharm. Biomed. Anal. 2002;30: 1223.
32. Frisch MJ, Trucks GW, Schlegel HB, Scuseria GE, Robb MA,Cheeseman JR, Montgomery JA Jr, Vreven T, Kudin KN,Burant JC, Millam JM, Iyengar SS, Tomasi S, Barone V, Men-nucci B, Cossi M, Scalmani G, Rega N, Petersson GA, Nakat-suji H, Hada M, Ehara M, Toyota K, Fukuda R, Hasegawa J,Ishida M, Nakajima T, Honda Y, Kitao O, Nakai H, Klene M,Li X, Knox JE, Hratchian HP, Cross JB, Adamo C, Jaramillo J,Gomperts R, Stratmann RE, Yazyev O, Austin AJ, Cammi R,Pomelli C, Ochterski JW, Ayala PY, Morokuma K, Voth GA,Salvador P, Dannenberg JJ, Zakrzewski VG, Dapprich S,Daniels AD, Strain MC, Farkas O, Malick DK, Rabuck AD,Raghavachari K, Foresman JB, Ortiz JV, Cui Q, Baboul AG, Clif-ford S, Cioslowski J, Stefanov BB, Liu G, Liashenko A, Piskorz P,Komaromi I, Martin RL, Fox DJ, Keith T, Al-Laham MA,Peng CY, Nanayakkara A, Challacombe M, Gill PMW, John-son B, Chen W, Wong MW, Gonzalez C, Pople JA. Gaussian 03RB. Gaussian: Pittsburgh, 2003.
33. Becke A. J. Chem. Phys. 1993; 98: 5648.34. Lee C, Yang W, Parr RG. Phys. Rev. B 1988; 37: 785.35. Hariharan PC, Pople JA. Theor. Chim. Acta 1973; 28: 213.36. Scott AP, Radom L. J. Phys. Chem. B 1996; 100: 16502.37. Girling RB, Shurvell HFA. Vib. Spectrosc. 1998; 18: 77.38. Brown ME, Galwey AK. Thermochim. Acta 1979; 29: 129.39. Khawam A, Flanagan DR. J. Pharm. Sci. 2006; 95: 472.40. Vyazovkin S. J. Comput. Chem. 1997; 18: 393.41. Ortega A. Int. J. Chem. Kinet. 2002; 34: 223.42. Davis WHJ, Pryor WA. J. Chem. Educ. 1976; 53: 285.43. Colthup NB, Daly LH, Wiberley SE. Introduction to Infrared and
Raman Spectroscopy. Academic Press: San Diego, 1990.44. Giron D, Goldbronn C, Mutz M, Pfeffer S, Piechon P, Schwab P.
J. Therm. Anal. Calorim. 2002; 68: 453.
Copyright 2008 John Wiley & Sons, Ltd. J. Raman Spectrosc. 2008; 39: 1915–1924DOI: 10.1002/jrs


