Embed Size (px)
Citation preview

Environmental Health Perspectives • volume 123 | number 1 | January 2015 21
ResearchA Section 508–conformant HTML version of this article is available at http://dx.doi.org/10.1289/ehp.1307732.
IntroductionUnconventional methods of natural gas extraction, including directional drilling and hydraulic fracturing (also known as “fracking”), have made it possible to reach natural gas reserves in shale deposits thousands of feet underground (Myers 2012). Increased drilling activity in a number of locations in the United States has led to growing concern that natural gas extraction activities could contaminate water supplies and ambient air, resulting in unforeseen adverse public health effects (Goldstein et al. 2012). At the same time, there is little peer-reviewed evidence regarding the public health risks of natural gas drilling activities (Kovats et al. 2014; McDermott-Levy and Kaktins 2012; Mitka 2012), including a lack of systematic surveys of human health effects.
The process of natural gas extraction. Natural gas extraction of shale gas reserves may involve multiple activities occurring over a period of months. These include drilling and casing of deep wells that contain both
vertical and horizontal components as well as placement of underground explosives and transport and injection of millions of gallons of water containing sand and a number of chemical additives into the wells at high pres-sures to extract gas from the shale deposits (hydraulic fracturing) (Jackson RE et al. 2013). Chemicals used in the hydraulic fracturing process can include inorganic acids, polymers, petroleum distillates, anti-scaling compounds, microbicides, and surfactants (Vidic et al. 2013). Although some of these fluids are recovered during the fracking process as “flowback” or “produced” water, a significant amount (as much as 90%) (Vidic et al. 2013) may remain underground. The recovered flowback water—which may contain chemi-cals added to the fracking fluid as well as natu-rally occurring chemicals such as salts, arsenic, and barium and naturally occurring radio-active material originating in the geologi cal formations—may be stored in holding ponds or transported offsite for disposal and/or wastewater treatment elsewhere.
Potential water exposures. Although much of the hydraulic fracturing process takes place deep underground, there are a number of potential mechanisms for chemi-cals used in the fracturing process as well as naturally occurring minerals, petroleum compounds (including volatile organic compounds; VOCs), and other substances of flowback water (Chapman et al. 2012) to enter drinking-water supplies. These include spills during transport of chemicals and flowback water, leaks of a well casing (Kovats et al. 2014), leaks through under-ground fissures in rock formations, runoff from drilling sites, and disposal of fracking flowback water (Rozell and Reaven 2012). Studies have reported increased levels of methane in drinking water wells located < 1 km from natural gas drilling, suggesting contamination of water wells from hydraulic
Address correspondence to P.M. Rabinowitz, University of Washington School of Public Health, Department of Environmental and Occupational Health, 1959 NE Pacific St., F551 Health Sciences Center, Box 357234, Seattle, WA 98195 USA. Telephone: (206) 685-2654. E-mail: [email protected]
Supplemental Material is available online (http://dx.doi.org/10.1289/ehp.1307732).
We thank the Southwes t Pennsy lvan ia Environmental Health Project for assistance with pre-testing of the community survey, L. Conti for assis-tance with study design, D. Galusha and F. Li for assistance with data analysis, and J. Bonthius for assis-tance with data entry and management.
This study was supported by grants from The Heinz Endowments, as well as the 11th Hour Project, a pro-gram of the Schmidt Family Foundation, and the Claneil Foundation. Additional support was received from the Jan Stolwijk Fellowship fund and by the Yale University Clinical and Translational Science Award grant UL1 RR024139 from the National Center for Research Resources and the National Center for Advancing Translational Science, components of the National Institutes of Health (NIH), and the NIH Roadmap for Medical Research. None of the funders participated in the study design, data collection, or analysis of study results.
P.M.R. and J.D.D. had full access to all the data in the study and take responsibility for the integrity of the data and the accuracy of the data analysis.
The contents are solely the responsibility of the authors and do not necessarily represent the official views of NIH.
The authors declare they have no actual or potential competing financial interests.
Received: 17 October 2013; Accepted: 20 August 2014; Advance Publication: 10 September 2014; Final Publication: 1 January 2015.
Proximity to Natural Gas Wells and Reported Health Status: Results of a Household Survey in Washington County, PennsylvaniaPeter M. Rabinowitz,1,2 Ilya B. Slizovskiy,1,3 Vanessa Lamers,3,4 Sally J. Trufan,1,2 Theodore R. Holford,3 James D. Dziura,3 Peter N. Peduzzi,3 Michael J. Kane,3 John S. Reif,5 Theresa R. Weiss,1 and Meredith H. Stowe1
1Yale University School of Medicine, Yale University, New Haven, Connecticut, USA; 2University of Washington, Seattle, Washington, USA; 3Yale School of Public Health, and 4Yale School of Forestry & Environmental Sciences, Yale University, New Haven, Connecticut, USA; 5Colorado State University College of Veterinary Medicine & Biomedical Sciences, Colorado State University, Fort Collins, Colorado, USA
Background: Little is known about the environmental and public health impact of unconventional natural gas extraction activities, including hydraulic fracturing, that occur near residential areas.
oBjectives: Our aim was to assess the relationship between household proximity to natural gas wells and reported health symptoms.
Methods: We conducted a hypothesis-generating health symptom survey of 492 persons in 180 randomly selected households with ground-fed wells in an area of active natural gas drilling. Gas well proximity for each household was compared with the prevalence and frequency of reported dermal, respiratory, gastrointestinal, cardiovascular, and neurological symptoms.
results: The number of reported health symptoms per person was higher among residents living < 1 km (mean ± SD, 3.27 ± 3.72) compared with > 2 km from the nearest gas well (mean ± SD, 1.60 ± 2.14; p = 0.0002). In a model that adjusted for age, sex, household education, smoking, awareness of environmental risk, work type, and animals in house, reported skin conditions were more common in households < 1 km compared with > 2 km from the nearest gas well (odds ratio = 4.1; 95% CI: 1.4, 12.3; p = 0.01). Upper respiratory symptoms were also more frequently reported in persons living in households < 1 km from gas wells (39%) compared with households 1–2 km or > 2 km from the nearest well (31 and 18%, respectively) (p = 0.004). No equivalent correlation was found between well proximity and other reported groups of respiratory, neurological, cardiovascular, or gastrointestinal conditions.conclusion: Although these results should be viewed as hypothesis generating, and the population studied was limited to households with a ground-fed water supply, proximity of natural gas wells may be associated with the prevalence of health symptoms including dermal and respiratory condi-tions in residents living near natural gas extraction activities. Further study of these associations, including the role of specific air and water exposures, is warranted.
citation: Rabinowitz PM, Slizovskiy IB, Lamers V, Trufan SJ, Holford TR, Dziura JD, Peduzzi PN, Kane MJ, Reif JS, Weiss TR, Stowe MH. 2015. Proximity to natural gas wells and reported health status: results of a household survey in Washington County, Pennsylvania. Environ Health Perspect 123:21–26; http://dx.doi.org/10.1289/ehp.1307732
Rabinowitz et al.
22 volume 123 | number 1 | January 2015 • Environmental Health Perspectives
fracturing activities (Jackson RB et al. 2013; Osborn et al. 2011), although natural movement of methane and brine from shale deposits into aquifers has also been suggested (Warner et al. 2012). If contaminants from hydraulic fracturing activities were able to enter drinking water supplies or surface water bodies, humans could be exposed to such contaminants through drinking, cooking, showering, and swimming.
Potential air exposures. The drilling and completion of natural gas wells, as well as the storage of waste fluids in containment ponds, may release chemicals into the atmosphere through evaporation and off-gassing. In Pennsylvania, flowback fluids are not usually disposed of in deep injection wells; therefore surface ponds containing flowback fluids are relatively common and could be sources of air contamination through evaporation. Flaring of gas wells, operation of diesel equipment and vehicles, and other point sources for air quality contamination around drilling activities may also pose a risk of respiratory exposures to nitrogen oxides, VOCs, and particulate matter. Release of ozone precursors into the environment by natural gas production activities may lead to increases in local ozone levels (Olaguer 2012). Well completion and gas transport may cause leakage of methane and other greenhouse gases into the environ-ment (Allen 2014). Studies in Colorado have reported elevated air levels of VOCs including trimethylbenzenes, xylenes, and aliphatic hydrocarbons related to well drilling activities (McKenzie et al. 2012).
Human health impact. Concerns about the impact of natural gas extraction on the health of nearby communities have included exposures to contaminants in water and air described above as well as noise and social disruption (Witter et al. 2013). A published case series cited the occurrence of respira-tory, skin, neurological, and gastrointestinal symptoms in humans living near gas wells (Bamberger and Oswald 2012). A conve-nience sample survey of 108 individuals in 55 households across 14 counties in Pennsylvania who were concerned about health effects from natural gas facilities found that a number of self-reported symptoms were more common in individuals living near gas facilities, including throat and nasal irritation, eye burning, sinus problems, headaches, skin problems, loss of smell, cough, nosebleeds, and painful joints (Steinzor et al. 2013). Similarly, a convenience sample survey of 53 community members living near Marcellus Shale development found that respondents attributed a number of health impacts and stressors to the develop-ment. Stress was the symptom reported most frequently (Ferrar et al. 2013).
Here we report on the analysis of a cross-sectional, random-sample survey of the health
of residents who had ground-fed water wells in the vicinity of natural gas extraction wells to determine whether proximity to gas wells was associated with reported respiratory, dermal, neurological, or gastrointestinal symptoms.
MethodsSelection of study area. The Marcellus formation, a principal source of shale-based natural gas in the United States, is a Middle Devonian–age black, low-density, organi-cally rich shale that has been predominantly horizontally drilled for gas extraction in the southwestern portion of Pennsylvania since 2003 [Pennsylvania Spatial Data Access (PASDA) 2013]. In this study we focused on Washington County in southwestern Pennsylvania, an area of active natural gas drilling (Carter et al. 2011). At the time of the administration of the household survey during summer 2012, there were, according to the Pennsylvania Department of Environmental Protection, 624 active natural gas wells in Washington County. Of these natural gas wells, 95% were horizontally drilled (Pennsylvania Department of Environmental Protection 2012). The county has a highly rural classification with nearly 40% of the
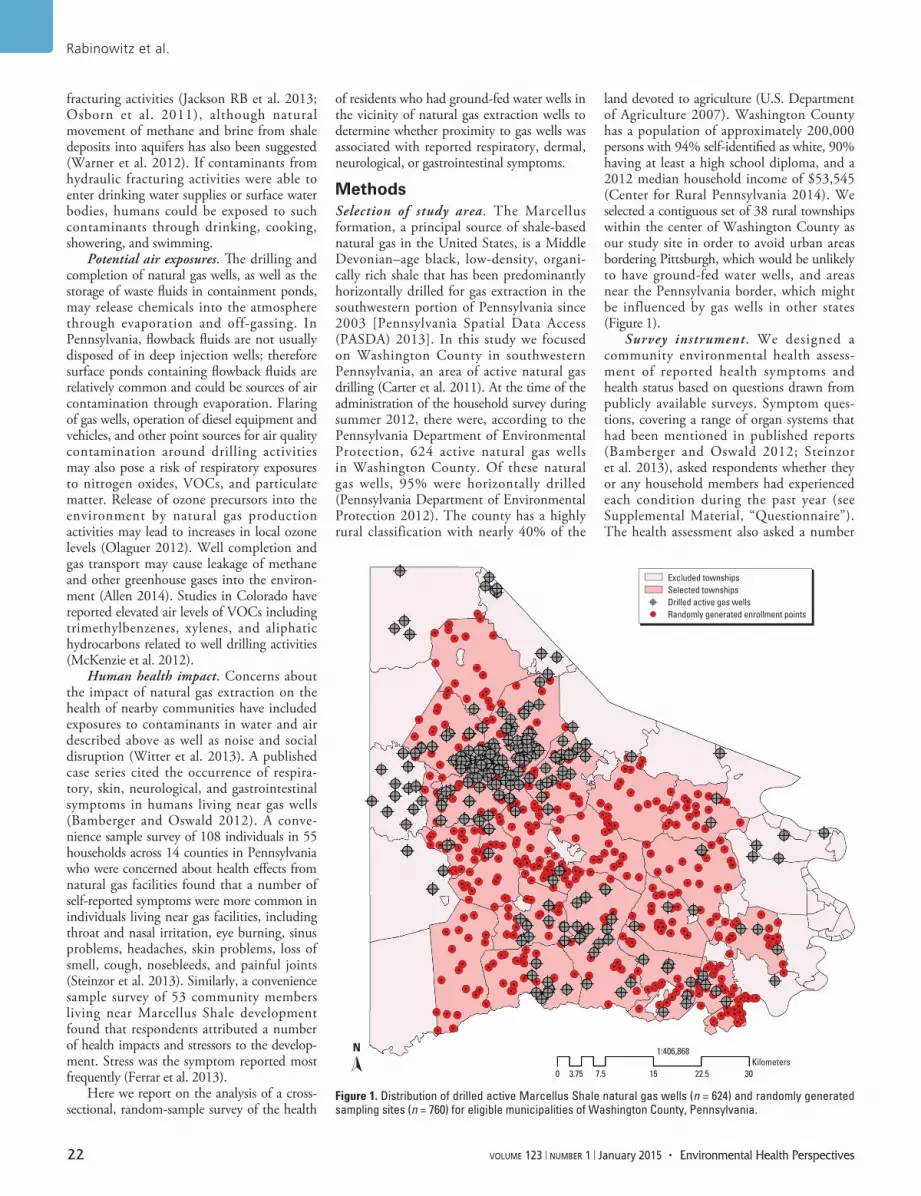
land devoted to agriculture (U.S. Department of Agriculture 2007). Washington County has a population of approximately 200,000 persons with 94% self-identified as white, 90% having at least a high school diploma, and a 2012 median household income of $53,545 (Center for Rural Pennsylvania 2014). We selected a contiguous set of 38 rural townships within the center of Washington County as our study site in order to avoid urban areas bordering Pittsburgh, which would be unlikely to have ground-fed water wells, and areas near the Pennsylvania border, which might be influenced by gas wells in other states (Figure 1).
Survey instrument. We designed a community environmental health assess-ment of reported health symptoms and health status based on questions drawn from publicly available surveys. Symptom ques-tions, covering a range of organ systems that had been mentioned in published reports (Bamberger and Oswald 2012; Steinzor et al. 2013), asked respondents whether they or any household members had experienced each condition during the past year (see Supplemental Material, “Questionnaire”). The health assessment also asked a number
Figure 1. Distribution of drilled active Marcellus Shale natural gas wells (n = 624) and randomly generated sampling sites (n = 760) for eligible municipalities of Washington County, Pennsylvania.
N 1:406,868
0 3.75 7.5 15 22.5 30Kilometers
Excluded townshipsSelected townshipsDrilled active gas wellsRandomly generated enrollment points

Proximity to gas wells and reported health status
Environmental Health Perspectives • volume 123 | number 1 | January 2015 23
of general yes/no questions about concerns of environmental hazards in the community, such as whether respondents were satisfied with air quality, water quality, soil quality, environmental noise and odors, and traffic, but did not specifically mention natural gas wells or hydraulic fracturing or other natural gas extraction activities. The survey was pretested with focus groups in the study area in collaboration with a community based group and revised to ensure comprehensibility of questions.
Selection and recruitment of households. Using ArcGIS Desktop 10.0 software (ESRI, Inc., Redlands, CA), we randomly selected 20 geographic points from each of 38 contiguous townships in the study county (Figure 1). We identified an eligible home nearest to each randomly generated sampling point, and visited each home to determine which households were occupied and had ground-fed water wells. We selected households with ground-fed water wells to assess possible health effects related to water contamination. From the original 760 points identified (i.e., 20 points in each of the 38 townships), we excluded 12 duplicate points and 64 points found not to correspond to a house structure (see Supplemental Material, Figure S1). After site visits by the study team who spoke to residents or neighbors, we excluded house locations determined not to have a ground-fed well or spring. Additional points were excluded if the structure was not occupied (n = 5) or inaccessible from the road (n = 4). During visits to eligible households, a study member invited a responding adult at least 18 years of age to participate in the survey, described as a survey of community environ-mental health that considered a number of environmental health factors. Three house-holds were excluded when the respondent was unable to answer the questionnaire due to language or health problems. Eligible house-holds were offered a small cash stipend for participation.
The Yale University School of Medicine Human Research Protection Program deter-mined the study to be exempt from Human Subjects review. Respondents provided oral consent but were not asked to sign consent forms; their names were not recorded.
Of the 255 eligible households, respon-dents refused to complete the survey in 47 households, and we were not able to contact residents in another 26 households. Reasons for refusal included “not interested” (n = 8), “no time/too busy” (n = 3), “afraid” (n = 1), and 35 gave no reason. The rate of refusal varied by distance category, with 12 of 74 (16%) of households < 1 km from a gas well, 10 of 67 (15%) of households 1–2 km from wells, and 25 of 86 (25%) of eligible households > 2 km from a gas well refusing
to participate, but the differences were not statistically significant. At the consenting 180 households (71% of eligible households), an adult respondent completed the survey covering the health status of the 492 indi-viduals living in these households.
Administration of survey at residence. Trained study personnel administered the survey in English. The responding adult at the participating household reported on the health status of all persons in the household over the past year. A study team member recorded the global positioning system (GPS) coordinates of the household using a Garmin GPSMAP® 62S Series handheld GPS device (Garmin International, Inc., Olathe, KS). Survey personnel were not aware of the mapping results for gas well proximity to the households being surveyed.
Household proximity to nearest active gas well and age of wells. A map of 624 active natural gas wells in the study area, and their age and type, was created by utilizing gas well permit data publicly available at the PASDA (2013). Ninety five percent of the gas wells had “spud dates” (first date of drilling) between 2008 and 2012, with more than half of spud dates occurring in 2010 and 2011. We used ArcGIS to calculate the distance between each household location (as defined by the GPS reading taken during the site visit) and each natural gas well in the study area. We then classified households according to their distance from the nearest gas well with distance categories of < 1 km, 1–2 km, or > 2 km. We used 1 km as the initial cut point for distance to a nearest gas well because of the reported association of higher methane levels in drinking-water wells located < 1 km from natural gas wells (Osborn et al. 2011), and 2 km as the second cut point because it was close to the mean of the distances between households and nearest gas wells. The mean and median distance between a household and the nearest natural gas well were 2.0 km and 1.4 km, respectively. We classified the age of each gas well as the time interval between spud date and the date that the household survey was conducted during summer, 2012.
Statistical analysis. Demographic vari-ables were analyzed for differences among individuals between distance categories using chi-square, analysis of variance, or generalized linear mixed-model statistics as appropriate. Reported occupation was classified as either blue collar, office sales and service, management/professional, or not working, using classifications of the U.S. Bureau of Labor Statistics (2014).
The prevalence of each outcome and the number of symptoms reported for each household member included in the study were calculated according to the distance of each household (< 1, 1–2, or > 2 km)
from the nearest gas well. To test the asso-ciation between household distance from a well and the overall number of symptoms as well as the presence or absence of each of six groups of health conditions (dermal, upper respiratory, lower respiratory, gastro intestinal, neurological, and cardiovascular), we used SAS 9.3 in a generalized linear mixed model (GLMM) analysis (SAS Institute Inc., Cary, NC). The analysis used maximum likeli-hood estimation with adaptive quadrature methods (Schabenberger 2007) including a random effect for household to account for the clustering of individuals within a household. The model was adjusted for age of individual (continuous), sex (binary), average adult house-hold education (continuous), smoker present in household (yes/no), awareness of environ-mental hazard nearby (yes/no), employment type (four categories), and whether animals were present in the home or backyard (yes/no). Given the exploratory nature of this study, no adjustments were made for multiple compari-sons and significance was established at the two-sided 0.05 level. Statistical analyses were conducted using SAS 9.3.
ResultsDemographics. Individuals living in house-holds < 1 km from gas wells were older (mean, 46.9 ± 21.9) compared with indi-viduals in households > 2 km from a gas well (mean, 40.0 ± 23.5 years, p = 0.03) (Table 1). There was a higher proportion of children in the households > 2 km from a gas well compared with those < 1 km from a gas well (27% vs. 14%, p = 0.008). Families had lived in their homes an average of 22.8 ± 17.2 years at the time of the interview. Thirty-four percent of individuals had blue-collar jobs and 38% of the subjects were nonworkers (e.g., unemployed, students). Sixty-six percent reported using their ground-fed water (well or natural spring) for drinking water, and 84% reported using it for other activities such as bathing. The age of the nearest gas well was significantly greater for households < 1 km from a gas well (mean, 2.3 ± 1.6) compared with those 1–2 km or > 2 km from a well (1.5 ± 1.3 and 1.1 ± 0.9, respectively, p < 0.05). Reported smoking was less common in households near gas wells, whereas reported respondent aware-ness regarding environmental health risks was higher, although these differences were not statistically significant.
Reported health symptoms. The average number of reported symptoms per person in residents of households < 1 km from a gas well (3.27 ± 3.72) was greater compared with those living > 2 km from gas wells (1.60 ± 2.14, p = 0.0002).
Individuals living in households < 1 km from natural gas wells were more likely to
Rabinowitz et al.
24 volume 123 | number 1 | January 2015 • Environmental Health Perspectives
report having any of the queried skin condi-tions over the past year (13%) than residents of households > 2 km from a well (3%; χ2 = 13.8, p = 0.001) (Table 2). Reported upper respiratory symptoms were also more frequent among households < 1 km (39%) compared with households > 2 km from gas wells (18%; χ2 = 17.9, p = 0.0001).
In a hierarchical model that adjusted for age, sex, household education level, smokers in household, job type, animals in house-hold, and awareness of environmental risk (Table 3), household proximity to natural gas wells remained associated with number of symptoms reported per person < 1 km (p = 0.002) and 1–2 km (p = 0.05) compared with > 2 km from gas wells, respectively. In similar models, living in a household < 1 km from the nearest gas well remained associated with increased reporting of skin conditions [odds ratio (OR) = 4.13; 95% confidence interval (CI): 1.38, 12.3] and upper respi-ratory symptoms (OR = 3.10; 95% CI: 1.45, 6.65) compared with households > 2 km from the nearest gas well.
For the other grouped symptom complexes examined, there was not a signifi-cant relationship in our adjusted model between the prevalence of symptom reports and proximity to nearest gas well. In the multivariate model, however, environmental risk awareness was significantly associated with report of all groups of symptoms.
Age of the nearest gas well was found to be negatively correlated with distance (r = –0.325; p < 0.0001): Gas wells < 1 km from house-holds tended to be older than the nearest wells in other distance categories. When age of wells was added to the multivariate model, proximity to gas wells remained significantly associated with respiratory symptoms, but the association between proximity and dermal symptoms lost statistical significance.
DiscussionThis spatially random health survey of house-holds with ground-fed water supply in a region with a large number of active natural gas wells is to our knowledge the largest study to date of the association of reported symptoms and natural gas drilling activities.We found an increased frequency of reported symptoms over the past year in households in closer proximity to active gas wells compared with households farther from gas wells. This association was also seen for certain categories of symptoms, including skin conditions and upper respiratory symptoms. This association persisted even after adjusting for age, sex, smokers in household, presence of animals in the household, education level, work type, and awareness of environmental risks. Other groups of reported symptoms, including cardiac, neurological, or gastrointestinal
symptoms, did not show a similar association with gas well proximity. These results support the need for further investigation of whether natural gas extraction activities are associated with community health impacts.
These findings are consistent with earlier reports of respiratory and dermal condi-tions in persons living near natural gas wells (Bamberger and Oswald 2012; Steinzor et al. 2013). Strengths of the study included the larger sample size compared with previously published surveys, and the random method of selecting households using geographic infor-mation system methodology, which reduces the possibility of selection bias (although only a subset of households, those with ground-fed water supply, were sampled).
A limitation of the study was the reliance on self-report of health symptoms. On one hand, symptoms in other household members may have been underreported by the house-hold respondent; on the other hand, aware-ness bias in individuals concerned about the presence of an environmental health hazard would be more likely to increase reporting of illness symptoms, leading to recall bias of the results. We did not collect data on whether individuals were receiving financial compen-sation for gas well drilling on their property, which could have affected their willingness
to report symptoms. It is possible that differ-ential refusal to participate could have intro-duced potential for selection bias; for example, individuals who were receiving compensation for gas drilling on their property might be less willing to participate in the survey. We found instead that the refusal rate, though < 25% overall, was higher among households farther from gas wells, suggesting that such households may have been less interested in participating because they had less awareness of hazards. The study questionnaire did not include questions about natural gas extraction activities, in order to reduce awareness bias. At the same time, it is likely that household residents were aware of gas drilling activities in the vicinity of households; and the fact that reported environmental awareness by respon-dents was associated with the prevalence of all groups of reported health symptoms suggests a correlation between heightened awareness of health risks and reported health conditions. Nevertheless, the observed association between gas well proximity and reported dermal and upper respiratory symptoms persisted in the multivariate model even after adjusting for environmental awareness. Future studies should attempt to medically confirm particular diagnoses and further assess and control for the effect of awareness on reported health status.
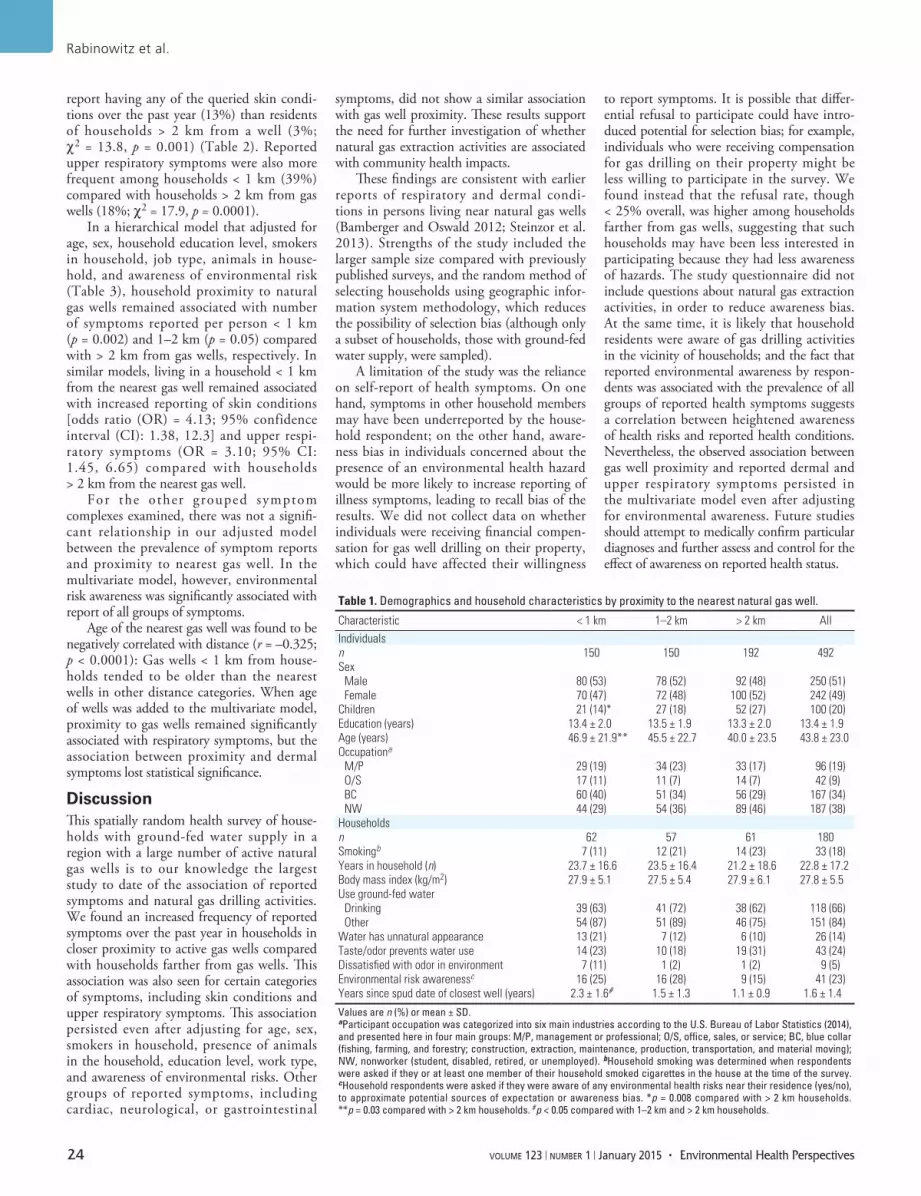
Table 1. Demographics and household characteristics by proximity to the nearest natural gas well.
Characteristic < 1 km 1–2 km > 2 km AllIndividualsn 150 150 192 492Sex
Male 80 (53) 78 (52) 92 (48) 250 (51)Female 70 (47) 72 (48) 100 (52) 242 (49)
Children 21 (14)* 27 (18) 52 (27) 100 (20)Education (years) 13.4 ± 2.0 13.5 ± 1.9 13.3 ± 2.0 13.4 ± 1.9Age (years) 46.9 ± 21.9** 45.5 ± 22.7 40.0 ± 23.5 43.8 ± 23.0Occupationa
M/P 29 (19) 34 (23) 33 (17) 96 (19)O/S 17 (11) 11 (7) 14 (7) 42 (9)BC 60 (40) 51 (34) 56 (29) 167 (34)NW 44 (29) 54 (36) 89 (46) 187 (38)
Householdsn 62 57 61 180Smokingb 7 (11) 12 (21) 14 (23) 33 (18)Years in household (n) 23.7 ± 16.6 23.5 ± 16.4 21.2 ± 18.6 22.8 ± 17.2Body mass index (kg/m2) 27.9 ± 5.1 27.5 ± 5.4 27.9 ± 6.1 27.8 ± 5.5Use ground-fed water
Drinking 39 (63) 41 (72) 38 (62) 118 (66)Other 54 (87) 51 (89) 46 (75) 151 (84)
Water has unnatural appearance 13 (21) 7 (12) 6 (10) 26 (14)Taste/odor prevents water use 14 (23) 10 (18) 19 (31) 43 (24)Dissatisfied with odor in environment 7 (11) 1 (2) 1 (2) 9 (5)Environmental risk awarenessc 16 (25) 16 (28) 9 (15) 41 (23)Years since spud date of closest well (years) 2.3 ± 1.6# 1.5 ± 1.3 1.1 ± 0.9 1.6 ± 1.4
Values are n (%) or mean ± SD.aParticipant occupation was categorized into six main industries according to the U.S. Bureau of Labor Statistics (2014), and presented here in four main groups: M/P, management or professional; O/S, office, sales, or service; BC, blue collar (fishing, farming, and forestry; construction, extraction, maintenance, production, transportation, and material moving); NW, nonworker (student, disabled, retired, or unemployed). bHousehold smoking was determined when respondents were asked if they or at least one member of their household smoked cigarettes in the house at the time of the survey. cHousehold respondents were asked if they were aware of any environmental health risks near their residence (yes/no), to approximate potential sources of expectation or awareness bias. *p = 0.008 compared with > 2 km households. **p = 0.03 compared with > 2 km households. #p < 0.05 compared with 1–2 km and > 2 km households.

Proximity to gas wells and reported health status
Environmental Health Perspectives • volume 123 | number 1 | January 2015 25
A further study limitation was the fact that our analysis includes multiple compari-sons between groups of households, and the consequent possibility that random error could account for some of our findings. We limited such comparisons by grouping individual symptoms into organ system clusters. However, we acknowledge that the multiple comparisons used in the methodo-logy mean that any such particular findings should be viewed as preliminary and hypothesis generating.
Our use of gas well proximity as a measure of exposure was an indirect measure of poten-tial water or airborne exposures. More precise data could come from direct monitoring and modeling of air and water contaminants, and correlating such measured exposures with confirmed health effects should be a focus of future study. Biomonitoring of individuals living near natural gas wells could provide additional information about the role and extent of particular chemical exposures.
There are several potential explanations for the finding of increased skin conditions among inhabitants living near gas wells. One is that natural gas extraction wells could have caused contamination of well water through breaks in the gas well casing or other under-ground communication between ground water supplies and fracking activities. The geographic area studied has experienced petroleum and coal exploration and extrac-tion activities in the past century, and such activities may increase the risk of chemicals in fracking fluid or flowback water entering ground water and contaminating wells. If such contamination did occur, several types of chemicals in fracking fluid have irritant properties and could potentially cause skin rashes or burning sensation through exposure during showers or baths. There are published reports of associations between the preva-lence of eczema and other skin conditions with exposure to drinking water polluted with chemicals including VOCs (Chaumont et al. 2012; Lampi et al. 2000; Yorifuji et al. 2012) as well as changes in water hardness (Chaumont et al. 2012; McNally et al. 1998).
A second possible explanation for the skin symptoms could be exposure to air pollut-ants including VOCs, particulates, and ozone from upwind sources, such as flaring of gas wells (McKenzie et al. 2012) and exhaust from vehicles and heavy machinery.
A third possibility to explain the clustering of skin and other symptoms would be that they could be related to stress or anxiety that was greater for households living near gas wells. In this study, awareness of environ mental risk was independently associated with overall reporting of symptoms as well as reporting of skin problems. However, in multivariate models, proximity to gas wells remained a
significant predictor of symptoms even when adjusting for such awareness. These results argue for possible air or water contaminant exposures, in addition to stress, contributing to the observed patterns of increased health symptoms in households near gas wells. A fourth possibility would be the role of allergens or irritant chemicals not related to natural gas
drilling activities, such as exposure to agricul-tural chemicals or household animals. We did not see a correlation between skin conditions and either the presence of an animal in the household or agricultural occupation, making this association less likely. At the same time, it is possible that other confounding could be present but not accounted for in our models.
Table 2. Prevalence of selected health conditions reported by individuals by proximity to the nearest gas well (2011–2012).a
Symptoms< 1 km
(n = 150)1–2 km (n = 150)
> 2 km (n = 192)
Total number of symptoms per individual 3.27 ± 3.72 2.56 ± 3.26 1.60 ± 2.14Dermal [n (%)] 19 (13) 7 (5) 6 (3)
Rashes/skin problems 10 (7) 7 (5) 6 (3)Dermatitis 6 (4) 5 (3) 2 (1)Irritation 6 (4) 2 (1) 1 (1)Burning 8 (5) 4 (3) 1 (1)Itching 9 (6) 5 (3) 2 (1)Hair loss 2 (1) 0 (0) 1 (1)
Upper respiratory [n (%)] 58 (39) 46 (31) 35 (18)Allergies/sinus problems 35 (23) 27 (18) 27 (14)Cough/sore throat 10 (7) 3 (2) 2 (1)Itchy eyes 19 (13) 22 (15) 10 (5)Nose bleeds 13 (9) 8 (5) 4 (2)Stuffy nose 16 (11) 8 (5) 4 (2)
Lower respiratory [n (%)] 29 (19) 29 (19) 27 (14)Asthma/COPD 16 (11) 21 (14) 15 (8)Chronic bronchitis 8 (5) 2 (1) 2 (1)Chest wheeze/whistling 6 (4) 9 (6) 7 (4)Shortness of breath 8 (5) 7 (5) 8 (4)Chest tightness 4 (3) 6 (4) 5 (3)
Cardiac [n (%)] 46 (31) 39 (26) 37 (19)High blood pressure 38 (25) 33 (22) 29 (15)Chest pain 8 (5) 5 (3) 6 (3)Heart palpitations 10 (7) 7 (5) 4 (2)Ankle swelling 11 (7) 5 (3) 5 (3)
Gastrointestinal [n (%)] 15 (10) 13 (9) 11 (6)Ulcers/stomach problems 11 (7) 7 (5) 8 (4)Liver problems 4 (3) 0 (0) 1 (0.5)Nausea/vomiting 1 (1) 3 (2) 1 (0.5)Abdominal pain 4 (3) 2 (1) 2 (1)Diarrhea 5 (3) 2 (1) 2 (1)Bleeding 4 (3) 4 (3) 0 (0)
Neurologic [n (%)] 48 (32) 37 (25) 39 (20)Neurologic problems 1 (0.7) 5 (3) 0 (0)Severe headache/migraine 24 (16) 14 (9) 18 (9)Dizziness/balance problems 11 (7) 12 (8) 11 (6)Depression 4 (3) 3 (2) 2 (1)Difficulty concentrating/remembering 9 (6) 9 (6) 6 (3)Difficulty sleeping/insomnia 18 (12) 19 (13) 10 (5)Anxiety/nervousness 11 (7) 4 (3) 11 (6)Seizures 2 (1) 2 (1) 1 (0.5)
COPD, chronic obstructive pulmonary disease.aSix categories representing major health conditions of a priori interest chosen to ascertain symptom prevalence among individuals living in proximity to the nearest gas well in 2011–2012.
Table 3. Associations of nearest gas well proximity and symptoms.
Outcome
< 1 km 1–2 km
> 2 kmOR (95% CI) p-Value OR (95% CI) p-ValueDermal 4.13 (1.38, 12.3) 0.011 1.44 (0.42, 4.9) 0.563 RefUpper respiratory 3.10 (1.45, 6.65) 0.004 1.76 (0.81, 3.76) 0.148 RefLower respiratory 1.45 (0.67, 3.14) 0.339 1.40 (0.65, 3.03) 0.387 RefCardiac 1.67 (0.85, 3.26) 0.135 1.28 (0.65, 2.52) 0.473 RefGastrointestinal 2.01 (0.49, 8.18) 0.328 1.79 (0.43, 7.41) 0.417 RefNeurological 1.53 (0.89, 2.63) 0.123 1.04 (0.59, 1.82) 0.885 Ref
Ref, reference. Results are from hierarchical logistic regression that adjusted for age, household education level, sex, smokers in household, job type, animals in household, and awareness of environmental risk.
Rabinowitz et al.
26 volume 123 | number 1 | January 2015 • Environmental Health Perspectives
Our findings of increased reporting of upper respiratory symptoms among persons living < 1 km from a natural gas well suggests that airborne irritant exposures related to natural gas extraction activities could be playing a role. Such irritant exposures could result from a number of activities related to natural gas drilling, including flaring of gas wells and exhaust from diesel equipment. Because other studies have suggested that airborne exposures could be a significant consequence of natural gas drilling activity, further investigation of the impact of such activities on respiratory health of nearby communities should be investigated. Future studies should collect such data.
Since most of the gas wells in the study area had been drilled in the past 5–6 years, one would not yet expect to see associations with diseases with long latency, such as cancer. Furthermore, if some of the impact of natural gas extraction on ground water happens over a number of years, this initial survey could have failed to detect health consequences of delayed contamination. However, if the finding of skin and respiratory conditions near gas wells indi-cates significant exposure to either fracking fluids and chemicals or airborne contaminants from natural gas wells, studies looking at such long-term health effects in chronically exposed populations would be indicated.
ConclusionsThe results of this study suggest that natural gas drilling activities could be associated with increased reports of dermal and upper respira-tory symptoms in nearby communities; these results support the need for further research into health effects of natural gas extraction activities. Such research could include longi-tudinal assessment of the health of individuals living in proximity to natural gas drilling activities, medical confirmation of health conditions, and more precise assessment of contaminant exposures.
RefeRences
Allen DT. 2014. Atmospheric emissions and air quality impacts from natural gas production and use. Annu Rev Chem Biomol Eng 5:55–75.
Bamberger M, Oswald RE. 2012. Impacts of gas drilling on human and animal health. New Solut 22:51–77.
Carter KM, Harper JA, Schmid KW, Kostelnik J. 2011. Unconventional natural gas resources in Pennsylvania: the backstory of the modern Marcellus Shale play. Environ Geosci 18:217–257.
Center for Rural Pennsylvania. 2014. Demographics for Washington County. Available: http://www.ruralpa2.org/county_profiles.cfm [accessed 29 July 2014].
Chapman EC, Capo RC, Stewart BW, Kirby CS, Hammack RW, Schroeder KT, et al. 2012. Geochemical and strontium isotope characterization of produced waters from Marcellus Shale natural gas extraction. Environ Sci Technol 46:3545–3553.
Chaumont A, Voisin C, Sardella A, Bernard A. 2012. Interactions between domestic water hardness, infant swimming and atopy in the development of childhood eczema. Environ Res 116:52–57.
Ferrar KJ, Kriesky J, Christen CL, Marshall LP, Malone SL, Sharma RK, et al. 2013. Assessment and longitudinal analysis of health impacts and stressors perceived to result from unconventional shale gas development in the Marcellus Shale region. Int J Occup Environ Health 19:104–112.
Goldstein BD, Kriesky J, Pavliakova B. 2012. Missing from the table: role of the environmental public health community in governmental advisory commissions related to Marcellus Shale drilling. Environ Health Perspect 120:483–486; doi:10.1289/ehp.1104594.
Jackson RB, Vengosh A, Darrah TH, Warner NR, Down A, Poreda RJ, et al. 2013. Increased stray gas abundance in a subset of drinking water wells near Marcellus shale gas extraction. Proc Natl Acad Sci USA 110:11250–11255.
Jackson RE, Gorody AW, Mayer B, Roy JW, Ryan MC, Van Stempvoort DR. 2013. Groundwater protection and unconventional gas extraction: the critical need for field-based hydrogeological research. Ground Water 51:488–510.
Kovats S, Depledge M, Haines A, Fleming LE, Wilkinson P, Shonkoff SB, et al. 2014. The health implications of fracking. Lancet 383:757–758.
Lampi P, Vohlonen I, Tuomisto J, Heinonen OP. 2000. Increase of specific symptoms after long-term use of chlorophenol polluted drinking water in a community. Eur J Epidemiol 16:245–251.
McDermott-Levy R, Kaktins N. 2012. Preserving health in the Marcellus region. Pa Nurse 67:4–10.
McKenzie LM, Witter RZ, Newman LS, Adgate JL. 2012. Human health risk assessment of air emissions from development of unconventional natural gas resources. Sci Total Environ 424:79–87.
McNally NJ, Williams HC, Phillips DR, Smallman-Raynor M, Lewis S, Venn A, et al. 1998. Atopic eczema and domestic water hardness. Lancet 352:527–531.
Mitka M. 2012. Rigorous evidence slim for determining health risks from natural gas fracking. JAMA 307:2135–2136.
Myers T. 2012. Potential contaminant pathways from
hydraulically fractured shale to aquifers. Ground Water 50:872–882.
Olaguer EP. 2012. The potential near-source ozone impacts of upstream oil and gas industry emissions. J Air Waste Manag Assoc 62:966–977.
Osborn SG, Vengosh A, Warner NR, Jackson RB. 2011. Methane contamination of drinking water accompanying gas-well drilling and hydraulic fracturing. Proc Natl Acad Sci USA 108:8172–8176.
PADEP (Pennsylvania Department of Environmental Protection). 2012. Homepage. Available: https://w w w . p a o i l a n d g a s r e p o r t i n g . s t a t e . p a . u s /publicreports/Modules/DataExports/DataExports.aspx [accessed 12 January 2012].
PASDA (Pennsylvania Spatial Data Access). 2013. Coal Mining Operations. Available: www.pasda.psu.edu/uci/SearchResults.aspx?originator=Pennsylvania Department of Environmental Protection&Keyword=&searchType=originator&entry=PASDA [accessed 12 October 2012].
Rozell DJ, Reaven SJ. 2012. Water pollution risk associated with natural gas extraction from the Marcellus Shale. Risk Anal 32:1382–1393.
Schabenberger O. 2007. Growing Up Fast: SAS® 9.2 Enhancements to the GLIMMIX Procedure. Paper 177-2007. Cary, NC:SAS Institute Inc. Available: http://www2.sas.com/proceedings/forum2007/177-2007.pdf [accessed 8 December 2014].
Steinzor N, Subra W, Sumi L. 2013. Investigating links between shale gas development and health impacts through a community survey project in Pennsylvania. New Solut 23:55–83.
U.S. Bureau of Labor Statistics. 2014. 2010 Census Occupational Classification. Available: http://www.bls.gov/cps/cenocc2010.htm [accessed 31 July 2014].
U.S. Department of Agriculture. 2007. Census of Agriculture. National Agriculture Statistics Service. Available: http://www.agcensus.usda.gov/index.php [accessed 10 January 2014].
V id ic RD, Brant ley SL, Vandenbossche JM, Yoxtheimer D, Abad JD. 2013. Impact of shale gas development on regional water quality. Science 340:1235009; doi:10.1126/science.1235009.
Warner NR, Jackson RB, Darrah TH, Osborn SG, Down A, Zhao K, et al. 2012. Geochemical evidence for possible natural migration of Marcellus Formation brine to shallow aquifers in Pennsylvania. Proc Natl Acad Sci USA 109:11961–11966.
Witter RZ, McKenzie L, Stinson KE, Scott K, Newman LS, Adgate J. 2013. The use of health impact assess-ment for a community undergoing natural gas development. Am J Public Health 103:1002–1010.
Yorifuji T, Noguchi M, Tsuda T, Suzuki E, Takao S, Kashima S, et al. 2012. Does open-air exposure to volatile organic compounds near a plastic recycling factory cause health effects? J Occup Health. 54:79–87.


![[Pennsylvania county histories]](https://img.dokumen.tips/doc/110x75/63359360d2b728420307fa00/pennsylvania-county-histories.jpg)


