Embed Size (px)
Citation preview
This article appeared in a journal published by Elsevier. The attachedcopy is furnished to the author for internal non-commercial researchand education use, including for instruction at the authors institution
and sharing with colleagues.
Other uses, including reproduction and distribution, or selling orlicensing copies, or posting to personal, institutional or third party
websites are prohibited.
In most cases authors are permitted to post their version of thearticle (e.g. in Word or Tex form) to their personal website orinstitutional repository. Authors requiring further information
regarding Elsevier’s archiving and manuscript policies areencouraged to visit:
http://www.elsevier.com/copyright
Author's personal copy
Journal of Geodynamics 50 (2010) 154–165
Contents lists available at ScienceDirect
Journal of Geodynamics
journa l homepage: ht tp : / /www.e lsev ier .com/ locate / jog
Protopangaea: Palaeomagnetic definition of Earth’s oldest(mid-Archaean-Palaeoproterozoic) supercontinent
J.D.A. PiperGeomagnetism Laboratory, Department of Earth and Ocean Sciences, University of Liverpool, Liverpool L69 7ZE, UK
a r t i c l e i n f o
Article history:Received 9 October 2009Received in revised form18 December 2009Accepted 1 January 2010
Keywords:ArchaeanProterozoicSupercontinentsPalaeomagnetismPangaeaGeoid
a b s t r a c t
The geological record of consolidation and uplift of crustal protolith identifies three major groupingsof Archaean cratonic nuclei (Rogers, 1996). These comprise ‘Ur’ (∼3.0 Ga cratons of Southern Africa,Western Australia), ‘Arctica’ (∼2.5 Ga cratons of Greenland, Fennoscandia, Laurentia and Siberia) and‘Atlantica’ (∼2.0 Ga cratons of Western Africa and South America). In this paper the ∼2.9–2.0 Ga recordfrom these cratons is used to develop a palaeogeographic model based on (i) the proximities recognisedfrom geological evidence and (ii) the correlation of ∼2.7–2.2 Ga palaeomagnetic poles between Ur andArctica (Piper, 1982, 2003). The solution shows that Archaean continental crust had aggregated into acrescent-shaped supercontinent, ‘Protopangaea’, by mid-Archaean times. The outer wings comprisedcore elements of Ur and Arctica which appear to have retained internal quasi-integrity with respectto each other until the end of the Proterozoic eon. Crust in between was still consolidating in earlyPalaeoproterozoic times and would ultimately include the Atlantica cratonic grouping. Geological tracers,including straight belts and mineral provinces, form lineaments parallel to the arcuate shape of theprotocontinent and, as presently defined, the reconstruction indicates that a minimum of 35–56% ofthe present continental crust had been extracted from the mantle by these times. Derivation of thereconstruction is facilitated because the bulk of the ∼2.7–2.2 Ga poles imply very low rates of apparentpolar wander (APW, <10 mm/year) during this∼5 Ga interval. These low APW rates correlate with the latergranite–greenstone tectonics and are presumed to reflect dominant small scale convection. In contrastrapid APW after ∼2.2 Ga records a transition to typical Proterozoic tectonics with large scale mobilityreflected in the accretion of mobile belts to the core Ur-Atlantica-Arctica assemblage. The reason whycontinental crust accretes into supercontinents of symmetrical crescent-shaped form is also addressed.By analogy with Phanerozoic Pangaea and the present-day geoid it is interpreted to have resulted fromlarge-scale, presumably whole mantle, convection systems driving the continental crust towards regionsof minimum gravitational potential.
© 2010 Elsevier Ltd. All rights reserved.
1. Introduction
The earliest assemblages of continental crust comprise theArchaean and early Proterozoic nuclei that have been involved inthe accretion and break-up of all the subsequent supercontinents.An insight into their origins can be recognised from the pattern ofcratonic stabilisation ages, and from the timing of subsequent upliftand cover by supracrustal successions. From this evidence Rogers(1996) and Rogers and Santosh (2004) propose that Earth’s oldestsurviving crust comprised three major agglomerations of ancientnuclei. The oldest, referred to as ‘Ur’, included the only large areas ofcrust stabilised by ∼3.0 Ga and incorporated five cratons includingthe Kaapvaal of southern Africa, the Pilbara of Western Australia
E-mail address: [email protected].
and the Dharwar, Bhandar and Singhbhum cratons of India. Smallexposures of ∼3.0 Ga crust along the periphery of East Antarcticatogether with the protolith histories of metamorphic nuclei in Zim-babwe and Madagascar suggest the possible wider extent to thisgrouping of cratons.
Secondly, primeval crust of Archaean age underlies much ofNorth America, Greenland, Siberia and Fennoscandia and the firstthree are grouped by Rogers (1996) into the protocontinent of ‘Arc-tica’. Although isolated relicts as old as ∼3.85 Ga are present here,major protolith formation was concentrated much later near theArchaean-Proterozoic boundary at 2.6–2.4 Ga. There is substantialgeological and palaeomagnetic evidence (e.g. Buchan et al., 2000;Mertanen et al., 1999; Windley, 1993a,b; Piper, 1982, 2003) thatthe core of the Fennoscandian Shield was part of this divisionby 2.5 Ga. Subsequently Laurentia and Fennoscandia also share acommon geological history including Mesoproterozoic marginalaccretion and anorogenic magmatism (Bridgewater and Windley,
0264-3707/$ – see front matter © 2010 Elsevier Ltd. All rights reserved.doi:10.1016/j.jog.2010.01.002
Author's personal copy
J.D.A. Piper / Journal of Geodynamics 50 (2010) 154–165 155
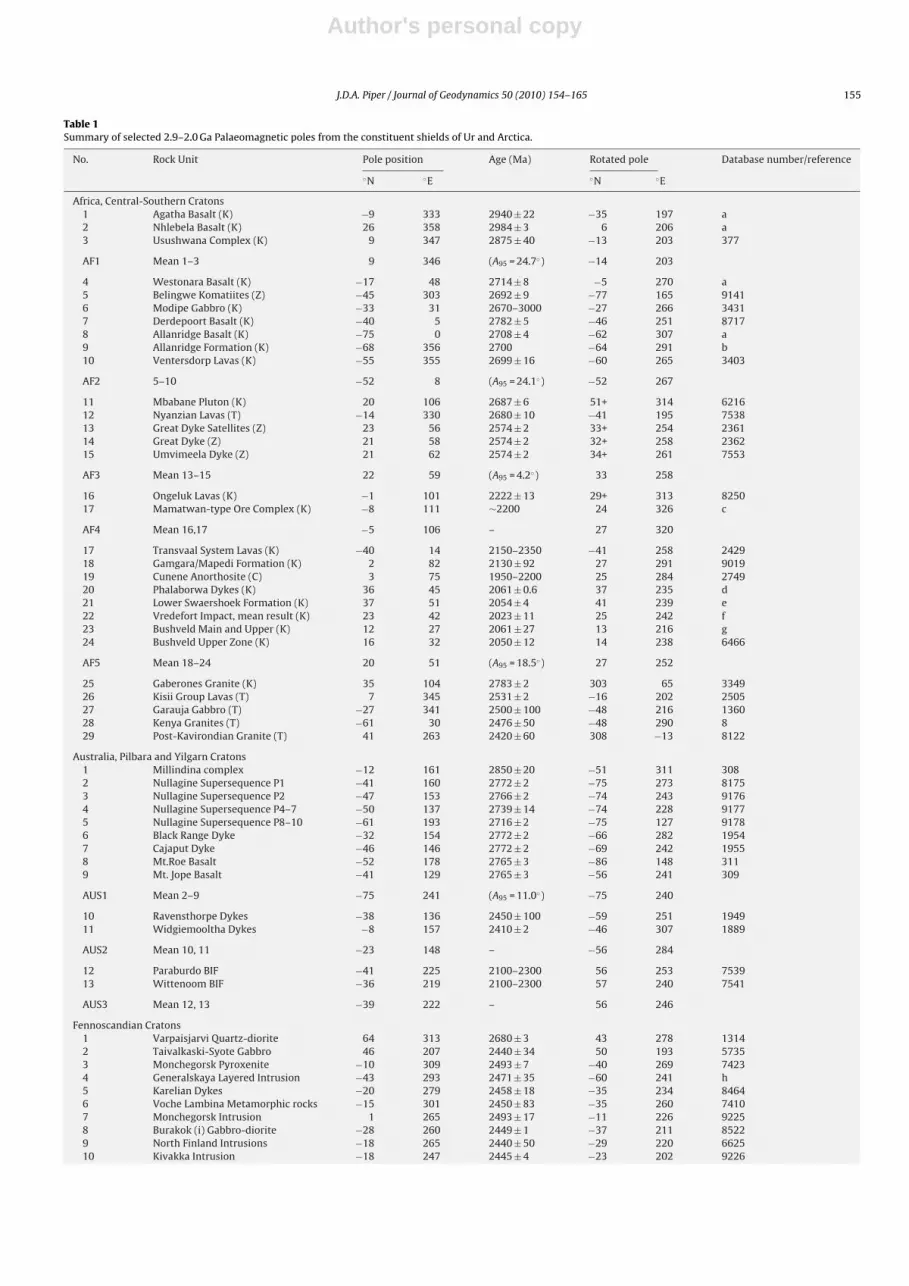
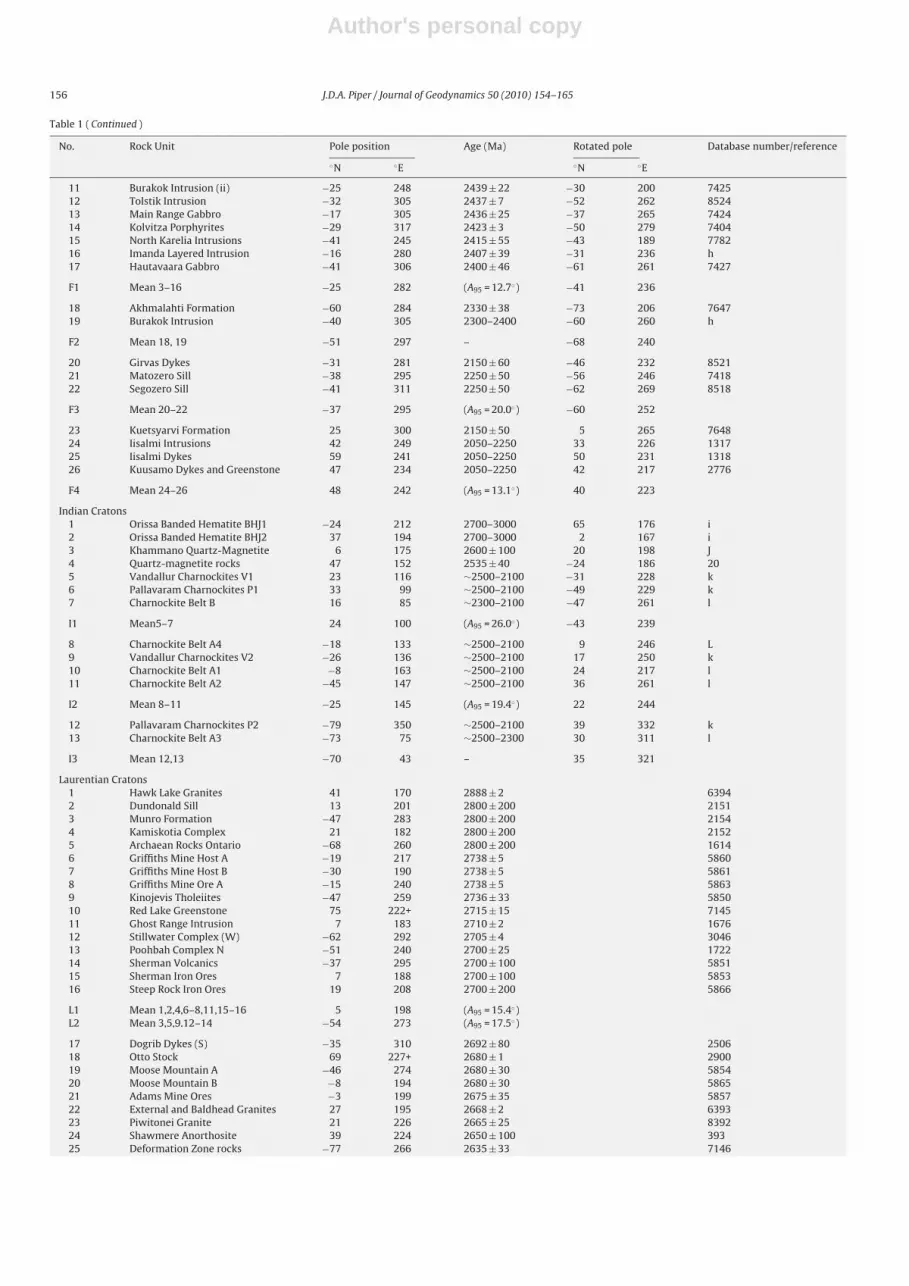
Table 1Summary of selected 2.9–2.0 Ga Palaeomagnetic poles from the constituent shields of Ur and Arctica.
No. Rock Unit Pole position Age (Ma) Rotated pole Database number/reference
◦N ◦E ◦N ◦E
Africa, Central-Southern Cratons1 Agatha Basalt (K) −9 333 2940 ± 22 −35 197 a2 Nhlebela Basalt (K) 26 358 2984 ± 3 6 206 a3 Usushwana Complex (K) 9 347 2875 ± 40 −13 203 377
AF1 Mean 1–3 9 346 (A95 = 24.7◦) −14 203
4 Westonara Basalt (K) −17 48 2714 ± 8 −5 270 a5 Belingwe Komatiites (Z) −45 303 2692 ± 9 −77 165 91416 Modipe Gabbro (K) −33 31 2670–3000 −27 266 34317 Derdepoort Basalt (K) −40 5 2782 ± 5 −46 251 87178 Allanridge Basalt (K) −75 0 2708 ± 4 −62 307 a9 Allanridge Formation (K) −68 356 2700 −64 291 b10 Ventersdorp Lavas (K) −55 355 2699 ± 16 −60 265 3403
AF2 5–10 −52 8 (A95 = 24.1◦) −52 267
11 Mbabane Pluton (K) 20 106 2687 ± 6 51+ 314 621612 Nyanzian Lavas (T) −14 330 2680 ± 10 −41 195 753813 Great Dyke Satellites (Z) 23 56 2574 ± 2 33+ 254 236114 Great Dyke (Z) 21 58 2574 ± 2 32+ 258 236215 Umvimeela Dyke (Z) 21 62 2574 ± 2 34+ 261 7553
AF3 Mean 13–15 22 59 (A95 = 4.2◦) 33 258
16 Ongeluk Lavas (K) −1 101 2222 ± 13 29+ 313 825017 Mamatwan-type Ore Complex (K) −8 111 ∼2200 24 326 c
AF4 Mean 16,17 −5 106 – 27 320
17 Transvaal System Lavas (K) −40 14 2150–2350 −41 258 242918 Gamgara/Mapedi Formation (K) 2 82 2130 ± 92 27 291 901919 Cunene Anorthosite (C) 3 75 1950–2200 25 284 274920 Phalaborwa Dykes (K) 36 45 2061 ± 0.6 37 235 d21 Lower Swaershoek Formation (K) 37 51 2054 ± 4 41 239 e22 Vredefort Impact, mean result (K) 23 42 2023 ± 11 25 242 f23 Bushveld Main and Upper (K) 12 27 2061 ± 27 13 216 g24 Bushveld Upper Zone (K) 16 32 2050 ± 12 14 238 6466
AF5 Mean 18–24 20 51 (A95 = 18.5◦) 27 252
25 Gaberones Granite (K) 35 104 2783 ± 2 303 65 334926 Kisii Group Lavas (T) 7 345 2531 ± 2 −16 202 250527 Garauja Gabbro (T) −27 341 2500 ± 100 −48 216 136028 Kenya Granites (T) −61 30 2476 ± 50 −48 290 829 Post-Kavirondian Granite (T) 41 263 2420 ± 60 308 −13 8122
Australia, Pilbara and Yilgarn Cratons1 Millindina complex −12 161 2850 ± 20 −51 311 3082 Nullagine Supersequence P1 −41 160 2772 ± 2 −75 273 81753 Nullagine Supersequence P2 −47 153 2766 ± 2 −74 243 91764 Nullagine Supersequence P4–7 −50 137 2739 ± 14 −74 228 91775 Nullagine Supersequence P8–10 −61 193 2716 ± 2 −75 127 91786 Black Range Dyke −32 154 2772 ± 2 −66 282 19547 Cajaput Dyke −46 146 2772 ± 2 −69 242 19558 Mt.Roe Basalt −52 178 2765 ± 3 −86 148 3119 Mt. Jope Basalt −41 129 2765 ± 3 −56 241 309
AUS1 Mean 2–9 −75 241 (A95 = 11.0◦) −75 240
10 Ravensthorpe Dykes −38 136 2450 ± 100 −59 251 194911 Widgiemooltha Dykes −8 157 2410 ± 2 −46 307 1889
AUS2 Mean 10, 11 −23 148 – −56 284
12 Paraburdo BIF −41 225 2100–2300 56 253 753913 Wittenoom BIF −36 219 2100–2300 57 240 7541
AUS3 Mean 12, 13 −39 222 – 56 246
Fennoscandian Cratons1 Varpaisjarvi Quartz-diorite 64 313 2680 ± 3 43 278 13142 Taivalkaski-Syote Gabbro 46 207 2440 ± 34 50 193 57353 Monchegorsk Pyroxenite −10 309 2493 ± 7 −40 269 74234 Generalskaya Layered Intrusion −43 293 2471 ± 35 −60 241 h5 Karelian Dykes −20 279 2458 ± 18 −35 234 84646 Voche Lambina Metamorphic rocks −15 301 2450 ± 83 −35 260 74107 Monchegorsk Intrusion 1 265 2493 ± 17 −11 226 92258 Burakok (i) Gabbro-diorite −28 260 2449 ± 1 −37 211 85229 North Finland Intrusions −18 265 2440 ± 50 −29 220 662510 Kivakka Intrusion −18 247 2445 ± 4 −23 202 9226
Author's personal copy
156 J.D.A. Piper / Journal of Geodynamics 50 (2010) 154–165
Table 1 ( Continued )
No. Rock Unit Pole position Age (Ma) Rotated pole Database number/reference
◦N ◦E ◦N ◦E
11 Burakok Intrusion (ii) −25 248 2439 ± 22 −30 200 742512 Tolstik Intrusion −32 305 2437 ± 7 −52 262 852413 Main Range Gabbro −17 305 2436 ± 25 −37 265 742414 Kolvitza Porphyrites −29 317 2423 ± 3 −50 279 740415 North Karelia Intrusions −41 245 2415 ± 55 −43 189 778216 Imanda Layered Intrusion −16 280 2407 ± 39 −31 236 h17 Hautavaara Gabbro −41 306 2400 ± 46 −61 261 7427
F1 Mean 3–16 −25 282 (A95 = 12.7◦) −41 236
18 Akhmalahti Formation −60 284 2330 ± 38 −73 206 764719 Burakok Intrusion −40 305 2300–2400 −60 260 h
F2 Mean 18, 19 −51 297 – −68 240
20 Girvas Dykes −31 281 2150 ± 60 −46 232 852121 Matozero Sill −38 295 2250 ± 50 −56 246 741822 Segozero Sill −41 311 2250 ± 50 −62 269 8518
F3 Mean 20–22 −37 295 (A95 = 20.0◦) −60 252
23 Kuetsyarvi Formation 25 300 2150 ± 50 5 265 764824 Iisalmi Intrusions 42 249 2050–2250 33 226 131725 Iisalmi Dykes 59 241 2050–2250 50 231 131826 Kuusamo Dykes and Greenstone 47 234 2050–2250 42 217 2776
F4 Mean 24–26 48 242 (A95 = 13.1◦) 40 223
Indian Cratons1 Orissa Banded Hematite BHJ1 −24 212 2700–3000 65 176 i2 Orissa Banded Hematite BHJ2 37 194 2700–3000 2 167 i3 Khammano Quartz-Magnetite 6 175 2600 ± 100 20 198 J4 Quartz-magnetite rocks 47 152 2535 ± 40 −24 186 205 Vandallur Charnockites V1 23 116 ∼2500–2100 −31 228 k6 Pallavaram Charnockites P1 33 99 ∼2500–2100 −49 229 k7 Charnockite Belt B 16 85 ∼2300–2100 −47 261 l
I1 Mean5–7 24 100 (A95 = 26.0◦) −43 239
8 Charnockite Belt A4 −18 133 ∼2500–2100 9 246 L9 Vandallur Charnockites V2 −26 136 ∼2500–2100 17 250 k10 Charnockite Belt A1 −8 163 ∼2500–2100 24 217 l11 Charnockite Belt A2 −45 147 ∼2500–2100 36 261 l
I2 Mean 8–11 −25 145 (A95 = 19.4◦) 22 244
12 Pallavaram Charnockites P2 −79 350 ∼2500–2100 39 332 k13 Charnockite Belt A3 −73 75 ∼2500–2300 30 311 l
I3 Mean 12,13 −70 43 – 35 321
Laurentian Cratons1 Hawk Lake Granites 41 170 2888 ± 2 63942 Dundonald Sill 13 201 2800 ± 200 21513 Munro Formation −47 283 2800 ± 200 21544 Kamiskotia Complex 21 182 2800 ± 200 21525 Archaean Rocks Ontario −68 260 2800 ± 200 16146 Griffiths Mine Host A −19 217 2738 ± 5 58607 Griffiths Mine Host B −30 190 2738 ± 5 58618 Griffiths Mine Ore A −15 240 2738 ± 5 58639 Kinojevis Tholeiites −47 259 2736 ± 33 585010 Red Lake Greenstone 75 222+ 2715 ± 15 714511 Ghost Range Intrusion 7 183 2710 ± 2 167612 Stillwater Complex (W) −62 292 2705 ± 4 304613 Poohbah Complex N −51 240 2700 ± 25 172214 Sherman Volcanics −37 295 2700 ± 100 585115 Sherman Iron Ores 7 188 2700 ± 100 585316 Steep Rock Iron Ores 19 208 2700 ± 200 5866
L1 Mean 1,2,4,6–8,11,15–16 5 198 (A95 = 15.4◦)L2 Mean 3,5,9.12–14 −54 273 (A95 = 17.5◦)
17 Dogrib Dykes (S) −35 310 2692 ± 80 250618 Otto Stock 69 227+ 2680 ± 1 290019 Moose Mountain A −46 274 2680 ± 30 585420 Moose Mountain B −8 194 2680 ± 30 586521 Adams Mine Ores −3 199 2675 ± 35 585722 External and Baldhead Granites 27 195 2668 ± 2 639323 Piwitonei Granite 21 226 2665 ± 25 839224 Shawmere Anorthosite 39 224 2650 ± 100 39325 Deformation Zone rocks −77 266 2635 ± 33 7146
Author's personal copy
J.D.A. Piper / Journal of Geodynamics 50 (2010) 154–165 157
Table 1 ( Continued )
No. Rock Unit Pole position Age (Ma) Rotated pole Database number/reference
◦N ◦E ◦N ◦E
26 Chibougamau Greenstone −61 273 2600 ± 100 2415
L3 Mean 20–23 10 203 (A95 = 20.3◦)L4 Mean 17,19, 24–26 −61 286 (A95 = 27.5◦)
27 Racine Lake Tonalite −70 261 2500–2700 39428 Kapuskasing Structural Zone −9 239 2500–2600 900529 Shelley Lake Granite −78 246 2580 ± 20 171630 Burchell Lake Granite −71 263 2580 ± 30 171831 Red Lake RLG Magnetisation −77 266 2550–2610 714632 Archaean Gneiss −66 223 2550 ± 100 602333 Poohbah Complex R −78 270 2550 ± 50 172334 Ptarmigan Dykes −42 220 2505 ± 2 8308
L5 Mean 27–33 −70 243 (A95 = 15.4◦)
35 Matachewan Dykes −45 241 2453 ± 2 Footnote (a)36 Matachewan Dykes −53 261 2453 ± 2 Footnote (b)37 Matachewan Dykes −40 216 2453 ± 2 Footnote (c)38 Chipman Lake Diorite −51 229 2400–2500 6669
L6 Mean 35–38 −48 236 (A95 = 17.6◦)
39 Lorrain Formation −46 268 2350 ± 50 824440 Coleman Member −31 234 2350 ± 50 824841 Lorrain Formation −21 213 2350 ± 50 848042 Kaminak Dykes −24 238 2170–2570 216843 Tulemalu Dykes (C) 1 302 2255 ± 15 171444 Maguire Dykes −9 267 2229 ± 35 830945 Nipissing Diabase N1 −15 263 2219 ± 4 Footnote (d)46 Semeterre Dykes −15 284 2216 ± 8 719047 Caribou Gabbro 14 296 2176–2196 117448 Indin Dykes 19 284 2007–2179 2898
L7 Mean 43–48 −5 277 (A95 = 15.6◦)
49 Otish Gabbro 35 253 2000–2200 223050 Sokoman Iron Formation 33 255 2100–2200 242151 Wind river Diorite (W) 84 215 2170 ± 8 899452 Big Spruce Complex 67 247 2066 ± 40 203453 Kapuskasing Dykes 61 253 2043 ± 14 644454 Dollyberry Lake Basalts 59 200 2040–2400 1410
L8 Mean 49–54 58 244 (A95 = 19.4◦)
55 Biscotasing Dykes 28 223 2166 ± 14 718956 Biscotasing West Dykes 17 225 2166 ± 14 921357 Superior Dykes 27 226 2150 ± 25 304058 Marathon Normal Dykes 43 196 2121 ± 14 647059 Molson Dykes C1 53 180 2091 ± 2 854860 Fort Frances Dykes 43 184 2076 ± 5 173961 Fort Frances Dykes 51 175 2076 ± 5 8034
L9 Mean 55–61 39 205 (A95 = 17.1◦)
Rotated poles are in a Laurentian reference frame. African poles are distinguished by craton of origin as follows—C: Congo, K: Kaapvaal, T: Tanzania, Z: Zimbabwe. Laurentianpoles distinguished as S, C and W come from the Slave, Churchill and Wyoming terranes respectively; the remainder are from the Superior Craton. (a) ‘Majority’ result; meanof results 1273, 1721, 2153, 3489, 3492, 5876, 6353, 6392, 6401, 6441 (intrudes result 18), 6455 and 64563. (b) Mean of Groundhog, Hornepayne and Ogoki results 5147,6453 and 6452. (c) Mean of results 6442, 6454 and 6672. (d) Mean of results 1599, 1639, 1666, 2620, 2804, 3071, 3417, and 6355. References to sources are GPDB resultsnumbers of lettered: a, Strik et al. (2003); b, de Kock (2007); c, Evans et al. (2001); d, Morgan and Briden (1981); e, de Kock et al. (2006); f, Salminen et al. (2009); g, Evans etal. (2002) and Hattingh (1989); h, Arestova et al. (2002), i, Das et al. (1996), j, Poornachandra Rao et al. (1989); k, Piper et al. (2003); l, Mondal et al. (2009).
1973; Piper, 1980, 1987). Together with Proterozoic additions, thisis embraced by the extended protocontinent of ‘Nena’ (Gower etal., 1990) or ‘Kenorland’ (Williams et al., 1991).
Thirdly much of the continental protolith of South Americaand western Africa appears to have stabilised at ∼2.3–2.0 Ga fol-lowing Transamazonian and Eburnian orogenic episodes. A mostimportant line of evidence linking the constituent cratons of thisassemblage is the widespread development of ∼2 Ga fluvio-deltaicsediments on five cratons (Ledru et al., 1994; Rogers, 1996). Thepresence of this craton-linking episode effectively excludes thepossibility of later widespread dispersal and rewelding of theseelements. This cratonic assemblage is referred to as ‘Atlantica’ byRogers (1996).
Preservation of these three groups of cratons within the muchlater Phanerozoic supercontinent of Pangaea suggests that they
have preserved a strong degree of internal quasi-integrity dur-ing their lengthy subsequent histories. This implies that youngerorogenic belts separating the cratons involved limited relativemotions and did not include the development of wide ocean basins.However, whilst the histories of protolith consolidation and sub-sequent supracrustal cover can provide strong indications that thiswas the case, palaeomagnetic data are required to constrain theconfigurations of the cratons and evaluate their wider global rela-tionship. With this objective in mind, the present paper compiles adatabase of Archaean and Early Proterozoic palaeomagnetic polesand employs it to evaluate cratonic configurations during thesetimes. An earlier interpretation (Piper, 2003) is updated by incor-porating new data, and the links to crust forming processes in theLate Archaean-early Proterozoic are evaluated. The derivation ofthe supercontinent shape is used to speculate on the wider relation-

Author's personal copy
158 J.D.A. Piper / Journal of Geodynamics 50 (2010) 154–165
Fig. 1. Reconstruction of Protopangaea, the continental crust in mid-Archaean to Early Proterozoic times, as derived from proximities deduced from geological evidence andpalaeomagnetic data (see text). The Laurentian Shield of North America with Greenland rotated to North America) is retained in present day coordinates and other shieldsare rotated according to Eulerian operations (Euler angle positive anticlockwise, Euler pole ◦E, ◦N) Africa (−146◦ , 138◦ , 73.0◦), Australia (−161◦ , 167◦ , −69◦), India (−149.5◦ , 4◦ ,−16.5◦), Fennoscandia (−42.5◦ , 211◦ , 60◦), Siberia (107.3◦ , 271◦ , 77◦). Continental crust, which had consolidated by these times and escaped later reworking, is shown in densecolour; inferred crust in process of consolidating and or subsequently reworked is shown in light colour. Continental assemblages identified as ‘Ur’. ‘Arctica’ and ‘Atlantica’by Rogers (1996) and Rogers and Santosh (2004) are indicated but note that Atlantica had not fully consolidated by the time period considered here. The distribution ofstraight belts is after Watson (1973) and the mineral distributions are generalised after Petrasheck (1973), Watson (1978), Berry (1980) and de Wit et al. (1999). Note theconcentration of gold and economic pegmatites within the oldest protocontinent of Ur with a second belt of gold emplacement running through Atlantica, whilst the broadzones of Tin and Tungsten are exclusive to Atlantica and comprise broad belts conforming to the form of the supercontinent.
ship of the continental crust to whole-mantle processes operatingduring this early part of Earth history.
2. The palaeomagnetic data
Table 1 summarises palaeomagnetic results assigned to theinterval ∼2.9–2.0 Ma with data selected to preserve a testabledataset whilst constrained to four criteria: (i) demagnetisationapplied, (ii) A95 ≤ 16◦, (iii) interpreted as primary by the authors,and (iv) ages of the poles estimated to ±200 Ma or better by strati-graphic or isotopic evidence (but see an exception with the IndianShield data noted below); poles dated by magnetic correlation areexcluded. Unfortunately it is not possible to apply the common cri-terion N (number of samples) ≥ 24 and leave a substantial datasetfrom the Fennoscandian Shield where a high proportion of resultsare based on small numbers of samples; nevertheless the polesfrom this shield are internally consistent and well grouped and thederivative studies have a minimum N of 13. The data of Table 1 aremostly compiled from the Global Palaeomagnetic Database (GPDB)where they are referred to their result numbers; some new data orresults not included in the GPDB are incorporated in the compila-tion and referenced accordingly.
In this short review it is not possible to note specific reser-vations relevant to individual results (mostly relating to the ageassignments). Within Laurentia and Fennoscandia a specific chal-lenge is the isolation of results which have not been overprinted bysubsequent widespread Palaeo-Mesoproterozoic Hudsonian andSvecofennian orogenic events; important recent reviews includingnew data from southern Africa are included in Strik et al. (2007) andSalminen et al. (2009). In spite of the great antiquity of the sourcerocks, the compilation provides a robust dataset for interpretation.Thus 76% of the 143 poles are derived from igneous rocks linkedto radiometric age dating on the same or related units. The value
of the remaining fraction derived mostly from metamorphic rocksor ore deposits is of more limited value; this is specifically becausethe depressed temperature of remanence acquisition during pro-tracted cooling makes age assignments correspondingly tenuous.The bulk of the poles from India (5–13) for example, come fromexhumed granulite-charnockite terranes and, although this coolingwas clearly Early Proterozoic in age, no specific assignments withinthe general range ∼2.5–2.0 Ga are possible. Important reservationsalso apply to the small (9%) fraction of data from sedimentary unitsincluding banded ironstone formations. The complexities of themagnetic record in sediments of this great age are illustrated forexample, by study of the Huronian Supergroup where Williams andSchmidt (1997) consider that just two of six components identifiedare interpretable as quasi-primary. Limitations of the sedimentaryand metamorphic results do not however, influence the essentialconclusions drawn here due to their relatively small contributionto the database and their general conformity with the igneous data;the exception is the case of the Indian cratons where they comprisethe total evidence. To simplify inter-cratonic correlations Table 1 isorganised into successive pole position–age groupings; mean polecalculations are shown in bold where common age and positionalgroups are recognisable.
3. The Late Archaean-Palaeoproterozoic protocontinent
The continental reconstruction developed here is based on twocriteria. The first is the evident ancient proximity of cratons onthe basis of similar geological histories (Rogers, 1996; Rogers andSantosh, 2004) and the second is the constraint provided by thepalaeomagnetic poles, and specifically by long-term similarities inthe palaeomagnetic records of the five major shields for which atest is possible during the Late Archaean-Palaeoproterozoic intervalunder consideration. A surprising finding of Precambrian palaeo-

Author's personal copy
J.D.A. Piper / Journal of Geodynamics 50 (2010) 154–165 159
Fig. 2. Contoured distribution of all palaeomagnetic poles assigned to the interval 2.9-2.2 Ga from the shields of Africa, Australia, Fennoscandia, India and Laurentia (Table 1)plotted following rotation into the reconstruction of Protopangaea; rotation operations are given in the caption to Fig. 1.
magnetism has been that a single rotational operation, namelyclockwise rotation of 146◦ about a Eulerian pole at 73◦N, 138◦Erepeatedly brings poles positions from Laurentia and central-southern Africa into agreement over an interval of more than 2 Ga;this accordance over such a long interval of time without the needto adjust the primary rotational operation even marginally is apowerful indication that the heart of the continental crust wascoherent on a palaeomagnetic scale (Piper, 1982, 2003, 2007). Thispoint is reinforced by the correlation of palaeomagnetic poles here(Figs. 2 and 3): not only are the bulk of the poles from the tworegions brought together by this single rotational operation but,as noted below, two key polar trends towards either end of theinvestigated time interval are recognised within the two datasets.
The Kaapvaal Craton of South Africa and the Pilbara Cratonof Western Australia are elements of the earliest recognisableprotocontinent ‘Vaalbara’ which is identified by impressive lithos-tratigraphic and chronostratigraphic correlations of 3.6–2.1 Gagranite–greenstone rocks (Cheney, 1996; Sinomson et al., 2009).Palaeomagnetic data supports close proximity of these nuclei by2.87 Ga (Zegers et al., 1998), with newer evidence indicating thatthis correlation can be extended back to at least ∼3.5 Ga (Usuiet al., 2009). Proximity of these nuclei by Late Archaean timesis accepted here using a position with Pilbara sited south ratherthan north of the Kaapvaal (Fig. 1); this position is permissiblewithin the palaeomagnetic constraints of the above authors andbrings the NNE–NE lineaments in the Kaapvaal into broad continu-ity with N–S to ENE–WSW trending lineaments in the Kaapvaal. Itis favoured by three further observations namely (i) terrane accre-tion at 2.65–2.0 Ga excludes a position along the western marginof the Kaapvaal Craton (de Wit et al., 1992), (ii) consolidation ofcrust to the north of the Kaapvaal into the Limpopo Belt (cf. Zegerset al., 1998) had welded this craton with the Zimbabwe Craton by∼2.6 Ga (Windley, 1993a,b), and (iii) the APW link between ∼2.45and ∼2.2 Ga poles from Australia with those from other cratonsis implied by this configuration (Fig. 2 and see poles AUS1-3 inTable 1).
The position of India within the Ur assemblage is constrained byan APW swathe defined by the range of Early Proterozoic charnock-ite poles (Mondal et al., 2009) and by their relationship to two∼2.6 Ga poles from the Singhbhum Craton in the NE sector of theshield (Figs. 1 and 2); these data locate this shield immediate belowWestern Australia and Southern Africa. Although now separated
by a rift zone active during Phanerozoic times, the Dharwar andSinghbhum cratons have comparable Archaean histories; similar-ities between the Bangemall Basin of Western Australia and theCuddapah Basin of eastern India also provide a case for postulat-ing proximity of these two blocks since Palaeoproterozoic times(Prasad et al., 1987). Hence collectively the Ur nucleus seems tohave comprised an alignment of cratons (Fig. 1) embracing at leastthe Archaean nuclei of India, Australia and southern Africa. A fewsouth-central Africa poles (6, 19, and 26–28) from outside of theKaapvall-Zimbabwe core suggest a wider inclusion of cratons tothe west and north within this group. Whilst the significance ofthis palaeomagnetic correlation is marginal, the extraordinarilylong duration of the palaeomagnetic correlation between Ur andArctica (Piper, 1982, 2007) must have implications to the integrityof the continental crust in between. It indicates that mobile beltsin between such as the Ubendian, Irumide and Lufilian-Zambeziof Mesoproterozoic and Pan-African ages are essentially intracra-tonic. Broad structural correlations of Mesoproterozoic age crossthe younger orogenic belts and also seem to mitigate against largelater dislocations (Shackleton, 1973) although a minimum PanAfrican motion comprised sinistral strike slip (Hanson et al., 1993)on a scale which is unlikely to be detectable by palaeomagnetism;possible oceanic sutures occur to the east and south east of thecollective cratonic assemblage (Daly, 1986). The exceptions to thecorrelations noted above are one pole (25) which does not conformto poles from elsewhere and poles 13–15 from the Great Dyke andsatellites of the Zimbabwe Craton (mean AF3) which plot with poles400 Myr younger (Fig. 3).
Poles in the ∼2.9–2.7 and 2.7–2.6 Ga age divisions from Lauren-tia fall into two groups (summarised by L1–L3 and L2–L4 in Table 1).These are internally consistent but approximately 90◦ apart. Sincethey are derived from the same shield and all but two results comefrom the Superior Craton, this difference cannot have a tectonicexplanation; also, there is no clear age distinction between thetwo groups so APW motion does not obviously apply here. Thesame difference is present between African poles AF1 and AF2 andis also suggested by Indian poles 2–4 and mean pole I1 all withassigned ages between ∼2.9 and 2.6 Ga (Fig. 3). Since these polesfrom three different nuclei are separated by ∼90◦ an alternativeexplanation is that they record inertial interchange true polar wan-der (IITPW). True polar wander (TPW) is caused by migration of thegeographic reference frame relative to the dynamically conserved

Author's personal copy
160 J.D.A. Piper / Journal of Geodynamics 50 (2010) 154–165
Fig. 3. Mean palaeomagnetic poles from Africa, Australia, Fennoscandia, India andLaurentia assigned to the interval 2.9–2.2 Ga (Table 1) plotted following rotationoperations given in the caption of Fig. 1 into the reconstruction of Protopangaeawith assigned mean ages. A generalised interpretation of apparent polar wander(APW) during mid-Archaean to Early Proterozoic times is also indicated (see text).
angular momentum vector (the spin axis). It can be a responseto the redistribution of mass within the Earth caused by mantleperturbations (see Phillips et al., 2009). The rising and sinking ofmantle density variations can cause deflection in discontinuitieswithin the planetary interior and perturb the Earth’s inertia ten-sor. A potential consequence is the wholesale rotation of the solidEarth with respect to the spin axis until the maximum principalinertia axis (Imax) is aligned with the spin axis (Evans, 1998). Posi-tive mass anomalies represented by the principal axes Iint and Iminare driven towards the equator (Goldreich and Toomre, 1969). Thus,if mantle density heterogeneities change the relative magnitudesrather than the orientations of the principal inertial axes, then Imax
can potentially fall below Iint so that the entire tectosphere rotatesaround Imin to align the new Imax with the spin axis. The signa-ture of such a motion is a rotation of ∼90◦ confined to a circle atright angles to the Imin axis (although differing amounts of rota-tion could result depending on the character of mantle convectionand the internal density structure). Several instances of rapid ∼90◦
APW motions have been attributed to IITPW in Precambrian (Evans,1998) and Palaeozoic (Piper, 2006) times and might be expected tohave occurred more readily in a thermally active Archaean-earlyProterozoic Earth. Tsai and Stevenson (2007) estimate that thepresent day mantle viscosity structure limits the speed of IITPWto no more than ∼8◦ over 10 Myr although rates are likely to havebeen faster when lower viscosities pertained in Archaean times.
The core link between the Laurentia and Fennoscandia shieldsand the Ur cratonic group shown in Fig. 1 and used to reconstructthe poles in Figs. 2 and 3 is also embraced by Neoprotero-zoic data (Piper, 2003, 2007). A corollary of this observation isthat the combined shield area in between, although apparentlynot fully cratonised during the time period reviewed here, hasremained coherent on a scale resolvable by palaeomagnetism.In general terms the wide spatial separation of the Ur and Arc-tica cratonic groupings is suggested by totally distinct geological
histories until the widespread deposition of glaciogenic rocks at2.4–2.2 Ga (Aspler and Chiarenzelli, 1998). The Fennoscandian dataof Table 1 are derived mainly from study of igneous episodeslinked to superplume events at ∼2.45–2.25 Ga (Abbott and Isley,2002; Buchan et al., 2000) and approximately equal numbers ofpoles come from Kola and Karelia cratonic nuclei separated by theLapland-Belomorian Belt. Although this latter orogen includes a1.97–1.87 Ga volcanic arc suite interpreted as the site of a collisionalsuture by Berthelsen and Marker (1986), there is no clear distinctionbetween them on a palaeomagnetic scale and the short swathe of∼2.45–2.25 Ga Fennoscandian poles (F1–F3) correlates with Lau-rentian poles L2, L4–L6 (Fig. 3) with mean ages of 2.56–2.36 Ma.A similar palaeomagnetic correlation has emerged from severalindependent analyses (Mertanen et al., 1999; Piper, 1982, 2003;Buchan et al., 2000; Pesonen et al., 2003) and implies that the Kola-Karelia nucleus was in broad continuity with the Archaean terranesof Labrador and Greenland. It further supports the view that a singlelarge igneous province embraced the Superior, Kola and Kareliancratons early in Palaeoproterozoic times (∼2.45 Ga, Heaman, 1997).
Contrasting interpretations have sited Siberia either to thenorth (Condie and Rosen, 1994) or to the west (Sears and Price,1978,2000) of Laurentia during the Proterozoic but cannot beaddressed here due to absence of data from Siberia; the Searsand Price orientation is however, endorsed by Neoproterozoic data(Piper, 2007) and 2.9–2.2 Ga poles from Australia come from steepinclination magnetisations and plot close to this nucleus so thatthey cannot be matched with the bulk of the remaining data inFig. 2 by locating Australia in the conventional Rodinian positionwest of North America. The Sears and Price (2000) configurationis therefore adopted in Fig. 1 and achieves broad continuity ofcontinental crust between Laurentia-Fennoscandia and the area ofAtlantica protocontinent (still consolidating during these times).An implication of this assumption is that Arctica comprised a sec-ond linear grouping of cratons embracing Fennoscandia, Laurentiaand Siberia. The adopted palaeomagnetic reconstruction is stronglyendorsed by the collective grouping of ∼2.7–2.2 Ga poles from 5shields into a quasi-static grouping close to the periphery of Ur(Figs. 2 and 3). In this configuration the subsidiary grouping of∼2.8–2.6 Ga poles from Laurentia (L1, L3) is also supported by polesfrom India and the Kaapvaal. In contrast, poles from all five shieldsfalling in the younger age range of the dataset (∼2.2–2.0 Ga) plot faraway from this ∼2.7–2.2 Ga quasi-static group and in the vicinityof Laurentia-Siberia (Fig. 2). The south to north APW movement tothese latter younger poles is recognised in all five cratonic groups(Fig. 3, AF2 → AF5 in Africa, AUS2 → AUS3 in Australia, I1 → I2 inIndia, F3 → F4 in Fennoscandia and L6 → L7 → L8 in Laurentia whereit moves specifically to the key ∼2.22 Ga Nipissing pole). Hence theanalysis of Figs. 2 and 3 identifies an interval comparable in lengthto the whole of the Phanerozoic eon, when the continental crustexhibited little of no movement with respect to the poles, whichwas succeeded by a rapid APW movement at ∼2.2 Ga carrying thepath across the supercontinent. It seems unlikely that the conti-nental crust ever subsequently became quasi-static with respect tothe poles: there is no comparable grouping of ∼2.2–2.0 Ga polesand there is some indication that APW motion crossed Laurentiaand moved towards the east (AF4, I3, Figs. 2 and 3) late in the timeinterval under consideration here.
4. Implications to crustal extraction, rate of continentalmovement and tectonic style
The observation that the shields moved only slightly withrespect to the geomagnetic poles over a time interval of some500 Myr (Figs. 2 and 3) has clearly facilitated the derivation ofthe primary reconstruction and the contrast with the continuous
Author's personal copy
J.D.A. Piper / Journal of Geodynamics 50 (2010) 154–165 161
and sometimes rapid APW during subsequent Proterozoic times(e.g. Pesonen et al., 2003; Piper, 2007) is a significant signature ofcontrasting tectonic regimes. It correlates temporally with the tran-sition from the granite–greenstone belt tectonics characterisingthe Archaean and Early Proterozoic to the formation of long lineartectono-thermal mobile belts subsequently during the Proterozoiceon (Piper, 1987; Windley, 1993a,b; Condie, 1997). Only relativelysmall areas of the supercontinent as defined here have escaped sub-sequent tectonic-thermal reworking and it remains unclear howmuch of the continental area suggested in Fig. 1, notably withinAtlantica, was either still consolidating or not yet extracted fromthe mantle.
The two envelopes surrounding the stabilised cratons in thisreconstruction suggest a minimum area of the continental crustformed by Late Archaean and Early Palaeoproterozoic timesamounting to approximately 35% of the present crustal area. A cal-culation of the minimum crustal volume extracted by ∼2.2 Ga mustincorporate changes in crustal erosion and crustal recycling sincethe Archaean, plus estimates of the amount of trapped and con-gealed melt (Abbott et al., 2000). There are two approaches: thefirst sums the volume of seismic crust, eroded crust and trappedmelt in the lithospheric mantle. The second assumes that the litho-sphere root is the residue of a melt column and yields an estimatesome 20% higher. Employing the recent estimates of crustal thick-ness prior to 2.4 Ga (Abbott et al., 2000), the reconstruction of Fig. 1implies that a minimum of between 35 ± 6% and 56 ± 8% of the con-tinental crust had been extracted from the mantle by the end of thetime interval considered here; these estimates compare with fig-ures of between 48% and 72% deduced by Abbott et al. (2000) at∼2.2 Ga and are broadly consistent with geochemical models forcontinuing continental growth but with some recycling of earlyextracted crust (McClennan and Taylor, 1982). Important uncer-tainties in these calculations relate to the Ukrainian Shield, whichincludes Archaean crust but was probably not in its present config-uration in continuity with Fennoscandia before 1.8 Ga (Elming etal., 2001) and the constituent cratons of South American and WestAfrican Shields. The latter are identified as mostly Archaean in ori-gin by Abbott et al. (2000) but considered by Rogers (1996) to bestill consolidating until shortly before uplift and cover by shallowfluvio-deltaic sedimentation at ∼2.1 Ga.
5. Why do supercontinents tend to form elongate andcrescent-shaped bodies?
The subject of pre-Phanerozoic supercontinent reconstructionshas been a fertile field of discussion in recent years (e.g. Rino etal., 2008; Cordani et al., 2009; Eriksson et al., 2009) with partic-ular focus on the role of mantle dynamics in the formation anddisruption of supercontinents (e.g. Santosh et al., 2009; Senshuet al., 2009). However, a key question that is rarely addressed(although implicit in all of them) is: ‘how did the mantle pro-duce the synergy of conditions responsible for the supercontinentshape?’ If the key premises used here to reconstruct Protopan-gaea in mid-Archaean to Early Proterozoic times are broadly correct(Fig. 1) a solution is derived which is remarkably similar in form tothe much younger supercontinent comprising Wegener’s Pangaea.This observation enables some evaluation of this question. Thehigh degrees of symmetry illustrated by Phanerozoic Pangaea werehighlighted by Le Pichon and Huchon (1984) who also noted that itwas symmetrically disposed about the poles of rotation as definedby ∼160–300 Ma palaeomagnetic poles (i.e. embracing most of thelifetime of the supercontinent). They linked this configuration tothe longest wavelength component of the present day geoid. Thegeoid is the equipotential surface of the Earth’s gravity field andrepresents the best fit to global mean sea level. It is dominated by
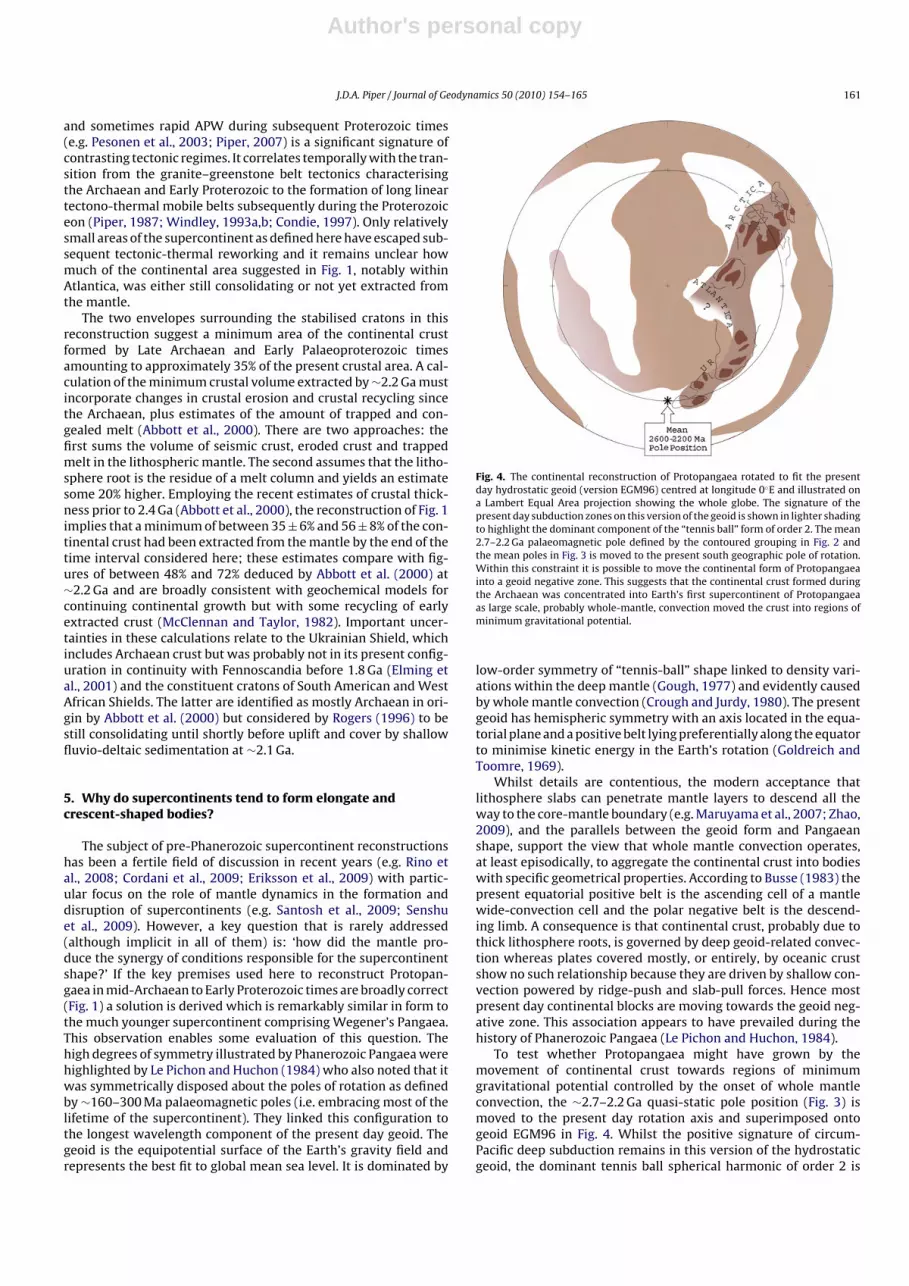
Fig. 4. The continental reconstruction of Protopangaea rotated to fit the presentday hydrostatic geoid (version EGM96) centred at longitude 0◦E and illustrated ona Lambert Equal Area projection showing the whole globe. The signature of thepresent day subduction zones on this version of the geoid is shown in lighter shadingto highlight the dominant component of the “tennis ball” form of order 2. The mean2.7–2.2 Ga palaeomagnetic pole defined by the contoured grouping in Fig. 2 andthe mean poles in Fig. 3 is moved to the present south geographic pole of rotation.Within this constraint it is possible to move the continental form of Protopangaeainto a geoid negative zone. This suggests that the continental crust formed duringthe Archaean was concentrated into Earth’s first supercontinent of Protopangaeaas large scale, probably whole-mantle, convection moved the crust into regions ofminimum gravitational potential.
low-order symmetry of “tennis-ball” shape linked to density vari-ations within the deep mantle (Gough, 1977) and evidently causedby whole mantle convection (Crough and Jurdy, 1980). The presentgeoid has hemispheric symmetry with an axis located in the equa-torial plane and a positive belt lying preferentially along the equatorto minimise kinetic energy in the Earth’s rotation (Goldreich andToomre, 1969).
Whilst details are contentious, the modern acceptance thatlithosphere slabs can penetrate mantle layers to descend all theway to the core-mantle boundary (e.g. Maruyama et al., 2007; Zhao,2009), and the parallels between the geoid form and Pangaeanshape, support the view that whole mantle convection operates,at least episodically, to aggregate the continental crust into bodieswith specific geometrical properties. According to Busse (1983) thepresent equatorial positive belt is the ascending cell of a mantlewide-convection cell and the polar negative belt is the descend-ing limb. A consequence is that continental crust, probably due tothick lithosphere roots, is governed by deep geoid-related convec-tion whereas plates covered mostly, or entirely, by oceanic crustshow no such relationship because they are driven by shallow con-vection powered by ridge-push and slab-pull forces. Hence mostpresent day continental blocks are moving towards the geoid neg-ative zone. This association appears to have prevailed during thehistory of Phanerozoic Pangaea (Le Pichon and Huchon, 1984).
To test whether Protopangaea might have grown by themovement of continental crust towards regions of minimumgravitational potential controlled by the onset of whole mantleconvection, the ∼2.7–2.2 Ga quasi-static pole position (Fig. 3) ismoved to the present day rotation axis and superimposed ontogeoid EGM96 in Fig. 4. Whilst the positive signature of circum-Pacific deep subduction remains in this version of the hydrostaticgeoid, the dominant tennis ball spherical harmonic of order 2 is
Author's personal copy
162 J.D.A. Piper / Journal of Geodynamics 50 (2010) 154–165
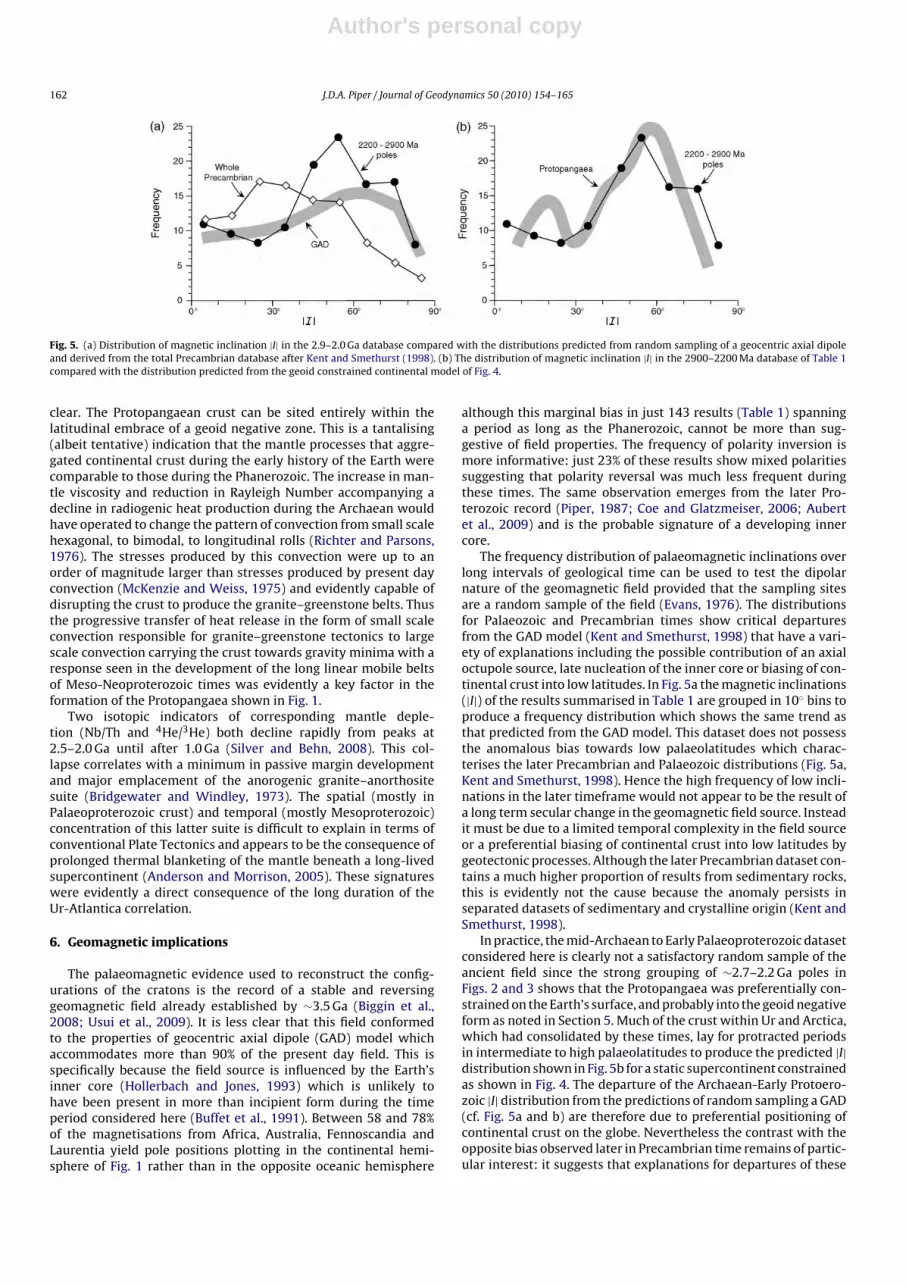
Fig. 5. (a) Distribution of magnetic inclination |I| in the 2.9–2.0 Ga database compared with the distributions predicted from random sampling of a geocentric axial dipoleand derived from the total Precambrian database after Kent and Smethurst (1998). (b) The distribution of magnetic inclination |I| in the 2900–2200 Ma database of Table 1compared with the distribution predicted from the geoid constrained continental model of Fig. 4.
clear. The Protopangaean crust can be sited entirely within thelatitudinal embrace of a geoid negative zone. This is a tantalising(albeit tentative) indication that the mantle processes that aggre-gated continental crust during the early history of the Earth werecomparable to those during the Phanerozoic. The increase in man-tle viscosity and reduction in Rayleigh Number accompanying adecline in radiogenic heat production during the Archaean wouldhave operated to change the pattern of convection from small scalehexagonal, to bimodal, to longitudinal rolls (Richter and Parsons,1976). The stresses produced by this convection were up to anorder of magnitude larger than stresses produced by present dayconvection (McKenzie and Weiss, 1975) and evidently capable ofdisrupting the crust to produce the granite–greenstone belts. Thusthe progressive transfer of heat release in the form of small scaleconvection responsible for granite–greenstone tectonics to largescale convection carrying the crust towards gravity minima with aresponse seen in the development of the long linear mobile beltsof Meso-Neoproterozoic times was evidently a key factor in theformation of the Protopangaea shown in Fig. 1.
Two isotopic indicators of corresponding mantle deple-tion (Nb/Th and 4He/3He) both decline rapidly from peaks at2.5–2.0 Ga until after 1.0 Ga (Silver and Behn, 2008). This col-lapse correlates with a minimum in passive margin developmentand major emplacement of the anorogenic granite–anorthositesuite (Bridgewater and Windley, 1973). The spatial (mostly inPalaeoproterozoic crust) and temporal (mostly Mesoproterozoic)concentration of this latter suite is difficult to explain in terms ofconventional Plate Tectonics and appears to be the consequence ofprolonged thermal blanketing of the mantle beneath a long-livedsupercontinent (Anderson and Morrison, 2005). These signatureswere evidently a direct consequence of the long duration of theUr-Atlantica correlation.
6. Geomagnetic implications
The palaeomagnetic evidence used to reconstruct the config-urations of the cratons is the record of a stable and reversinggeomagnetic field already established by ∼3.5 Ga (Biggin et al.,2008; Usui et al., 2009). It is less clear that this field conformedto the properties of geocentric axial dipole (GAD) model whichaccommodates more than 90% of the present day field. This isspecifically because the field source is influenced by the Earth’sinner core (Hollerbach and Jones, 1993) which is unlikely tohave been present in more than incipient form during the timeperiod considered here (Buffet et al., 1991). Between 58 and 78%of the magnetisations from Africa, Australia, Fennoscandia andLaurentia yield pole positions plotting in the continental hemi-sphere of Fig. 1 rather than in the opposite oceanic hemisphere
although this marginal bias in just 143 results (Table 1) spanninga period as long as the Phanerozoic, cannot be more than sug-gestive of field properties. The frequency of polarity inversion ismore informative: just 23% of these results show mixed polaritiessuggesting that polarity reversal was much less frequent duringthese times. The same observation emerges from the later Pro-terozoic record (Piper, 1987; Coe and Glatzmeiser, 2006; Aubertet al., 2009) and is the probable signature of a developing innercore.
The frequency distribution of palaeomagnetic inclinations overlong intervals of geological time can be used to test the dipolarnature of the geomagnetic field provided that the sampling sitesare a random sample of the field (Evans, 1976). The distributionsfor Palaeozoic and Precambrian times show critical departuresfrom the GAD model (Kent and Smethurst, 1998) that have a vari-ety of explanations including the possible contribution of an axialoctupole source, late nucleation of the inner core or biasing of con-tinental crust into low latitudes. In Fig. 5a the magnetic inclinations(|I|) of the results summarised in Table 1 are grouped in 10◦ bins toproduce a frequency distribution which shows the same trend asthat predicted from the GAD model. This dataset does not possessthe anomalous bias towards low palaeolatitudes which charac-terises the later Precambrian and Palaeozoic distributions (Fig. 5a,Kent and Smethurst, 1998). Hence the high frequency of low incli-nations in the later timeframe would not appear to be the result ofa long term secular change in the geomagnetic field source. Insteadit must be due to a limited temporal complexity in the field sourceor a preferential biasing of continental crust into low latitudes bygeotectonic processes. Although the later Precambrian dataset con-tains a much higher proportion of results from sedimentary rocks,this is evidently not the cause because the anomaly persists inseparated datasets of sedimentary and crystalline origin (Kent andSmethurst, 1998).
In practice, the mid-Archaean to Early Palaeoproterozoic datasetconsidered here is clearly not a satisfactory random sample of theancient field since the strong grouping of ∼2.7–2.2 Ga poles inFigs. 2 and 3 shows that the Protopangaea was preferentially con-strained on the Earth’s surface, and probably into the geoid negativeform as noted in Section 5. Much of the crust within Ur and Arctica,which had consolidated by these times, lay for protracted periodsin intermediate to high palaeolatitudes to produce the predicted |I|distribution shown in Fig. 5b for a static supercontinent constrainedas shown in Fig. 4. The departure of the Archaean-Early Protoero-zoic |I| distribution from the predictions of random sampling a GAD(cf. Fig. 5a and b) are therefore due to preferential positioning ofcontinental crust on the globe. Nevertheless the contrast with theopposite bias observed later in Precambrian time remains of partic-ular interest: it suggests that explanations for departures of these
Author's personal copy
J.D.A. Piper / Journal of Geodynamics 50 (2010) 154–165 163
distributions from the GAD are dominated by effects that tend tocluster continental crust into specific regions of the globe. As suchthey are a potential signature of geotectonic processes.
7. Metallogenic provinces and ‘straight belts’
There were spikes in gold deposition at ∼2.7 Ga and in volcanic-hosted massive sulphide deposition at ∼2.6 Ga and ∼1.7 Ga whichcorrelate temporally with peaks in juvenile continental crust pro-duction and mantle depletion (Groves et al., 2005). The former areembraced by the interval considered here. Whilst the heteroge-neous distribution of metallogenesis in the crust has usefully beenlinked to Plate Tectonic processes from several decades of study, ithas become apparent that these distributions frequently reflect theproducts of older, and often Archaean and Palaeoproterozoic, depo-sition so that they can provide key tracers of continental growth(de Wit et al., 1999). One of the most striking is the concentrationof tin and tungsten within long zones running through Atlantica(Fig. 1) but absent elsewhere (de Wit et al., 1999). The easternbelt lies mostly within reworked Pan Africa terranes whilst thewestern belt is within more ancient shields. Although the natureof reworking of Sn and W ores is not understood, the extent ofthese belts and their broad conformity with the arcuate form ofProtopangaea indicates that they had their origin in Palaeoprotero-zoic crustal accretion. In contrast gold and economic pegmatites arelargely restricted to an arcuate belt of Early Archaean crust run-ning through Ur; a second gold belt parallels the Sn-W belts whilsta zone of lesser importance is hinted at by the alignment of sim-ilar deposits in the younger crust of Atlantica (Fig. 1). Althoughthe gold often originated in concordant lodes in volcanic succes-sion, remobilisation has re-deposited it as discordant lodes andultimately as placers. Again the broad axial trend indicates an originin mantle extraction early in the history of Protopangaea. Other dis-tinctive tracers already established by mid-Archaean times includethe regional distributions of nickel beneath the Laurentian andFennoscandian shields and chromium beneath southern Africa(Watson, 1978). In each of these examples the mineral distribu-tion is intrinsically related to the reconstruction of Protopangaea,and specifically to the configuration of Ur, Atlantica and Arctica(Fig. 1).
Whilst the relict Archaean crust tends to exhibit only weakanisotropy over much of its preserved area, volatile transfer accom-panied distributed strike slip motions and produced zones of strongductile transpression or ‘straight belts’ (Watson, 1973). These com-prise the oldest pure lineaments in the continental crust whereArchaean structures are deflected into broad zones of intense defor-mation. They are observed to be sub-parallel to the axial trend ofthe protocontinent (Fig. 1; Watson, 1973; Windley, 1999).
8. Conclusions
• The Late Archaean-Early Proterozoic continental crust is definedby protolith histories which define three distinct groups of cra-tons (Ur, Arctica and Atlantica). The 2.9–2.0 Ga palaeomagneticdata from Ur and Arctic indicate that they occupied oppositelimbs of an arcuate protocontinent (‘Protopangaea’).
• The palaeomagnetic correlation between these two groups isreinforced by two further observations: firstly a ∼90◦ shift ispresent between ∼2.9 and 2.6 Ga poles from Laurentia, Africa andIndia and poles which might record true polar wander. Secondlya rapid APW shift is observed in African, Australian, Fennoscan-dian, Indian and Laurentian shields at ∼2.2–2.1 Ga between the∼2.7–2.2 Ga quasi-static grouping and ∼2.2–2.0 Ga poles.
• By analogy with the lowest order component of the present daygeoid, the symmetrical crescent shape adopted by superconti-
nents throughout geological time appears to be due to large scale,probably whole, mantle convection carrying the continental crusttowards zones of lowest gravitation potential.
• The quasi-static grouping of 2.7–2.2 Ga poles show that little orno movement of the continental crust with respect to the polesoccurred during this long interval. This correlates with youngergranite–greenstone tectonism and is interpreted to be the signa-ture of dominant small scale convection in the upper mantle.
• Surviving areas of Archaean-Early Proterozoic crust suggest that35–56% of the present crust had been extracted from the man-tle by these times in broad agreement with arguments based ongeochemical data. The long-term duration of the palaeomagneticlink between Ur and Atlantica has implications to the integrityof the crust in between and provides a general explanation forstrong indications of continentality during the Proterozoic eon.
• The distribution of magnetic inclination in the 2.9–2.2 Ga palaeo-magnetic data is consistent with a dominant geocentric dipoleduring this interval. The low frequency of reversals within thedatabase may be a signature of little or no inner core during thesetimes.
• Late Archaean-Early Proterozoic zones of strong ductile strike slipand the metallogenic provinces originating during these timesshow a prominent axial alignment evidently reflecting the accre-tionary processes that operated to aggregate the oldest survivingcrust into the first supercontinent.
Acknowledgements
I am grateful to Kay Lancaster for drafting the figures, Profes-sor M. Santosh for careful editorial advice and Andrew Biggin andtwo anonymous reviewers for critical suggestions that materiallyimproved the manuscript.
References
Abbott, D.A., Isley, A.E., 2002. The intensity, occurrence and duration of superplumeevents and eras over geological time. Journal of Geodynamics 34, 265–307.
Abbott, D.A., Sparks, D., Herzberg, C., Mooney, W., Nikishin, A., Zhang, Y.S., 2000.Quantifying Precambrian crustal extraction: the root is the answer. Tectono-physics 322, 163–190.
Anderson, J.L, Morrison, J., 2005. Ilmenite, magnetite, and peraluminous Mesopro-terozoic anorogenic granites of Laurentia and Baltica. Lithos 80, 45–60.
Arestova, N.A., Khramov, A.N., Guskova, E.G., Losifidi, A.G., 2002. New palaeomag-netic evidence from the Early Proterozoic (2.5–2.4 Ga) Mount Generalskaya andImandra layered intrusions, Kola Peninsula. Fizika Zemli 38, 65–78.
Aspler, L.B., Chiarenzelli, J.R., 1998. Two Neoarchaean supercontinents? Evidencefrom the Palaeoproterozoic. Sedimentary Geology 120, 75–104.
Aubert, J., Labrosse, S., Poitou, C., 2009. Modelling the palaeoevolutionof the geodynamo. Geophysical Journal International. doi:10.1111/j.1365-245X2009.04361.x.
Berry, G.R., 1980. World Atlas of Geology and Mineral Deposits. Mining JournalBooks, London, 110 pp.
Berthelsen, A., Marker, M., 1986. Tectonics of the Kola collision suture and adjacentArchaean and Early Proterozoic terrains in the northeastern region of the BalticShield. Tectonophysics 126, 31–55.
Biggin, A.J., Strik, G.H.M.A., Langeris, C.G., 2008. Evidence for a very-long-term-trendin geomagnetic secular variation. Nature. doi:10.1038/ngeo181.
Bridgewater, D., Windley, B.F., 1973. Anorthosites, post-orogenic granites, acid vol-canic rocks and crustal development in the North Atlantic Shield during theProterozoic. In: Lister, L.A. (Ed.), Symposium on Granites and Related Rocks, vol.3. Geological Society of South Africa Special Publication, pp. 307–318.
Buchan, K.L., Mertanen, S., Park, R.G., Pesonen, L.J., Elming, S.-A., Abrahamsen, N.,Bylund, G., 2000. Comparing the drift of Laurentia and Baltica in the Proterozoic:the importance of key palaeomagnetic poles. Tectonophysics 319, 167–198.
Buffet, B.A., Huppert, H.E., Lister, J.R., Woods, A.W., 1991. Analytical model for solid-ification of the Earth’s core. Nature 356, 329.
Busse, F.H., 1983. Quadrupole convection in the lower mantle? Geophysical ResearchLetters 10, 285–288.
Cheney, E.S., 1996. Sequence stratigraphy and plate tectonic significance of theTransvaal succession of southern Africa and its equivalent in Western Australia.Precambrian Research 79, 3–24.
Coe, R.S., Glatzmeiser, G.A., 2006. Symmetry and stability of the geomagnetic field.Geophysical Research Letters 33, L21311. doi:10.1029/2006GL027903.
Condie, K.C., 1997. Plate Tectonics and Crustal Evolution, 4th ed. Heinemann, But-terworth, 282 pp.
Author's personal copy
164 J.D.A. Piper / Journal of Geodynamics 50 (2010) 154–165
Condie, K.C., Rosen, O.M., 1994. Laurentia-Siberia connection revisited. Geology 22,168–170.
Cordani, U.G., Teixeira, W.T., D’Agrella-Filho, M.S., Trindade, R.I., 2009. The positionof the Amazonian Craton in supercontinents. Gondwana Research 15, 396–407.
Crough, S.T., Jurdy, D.M., 1980. Subducted lithosphere, hot spots and the geoid. Earthand Planetary Science Letters 48, 15–22.
Daly, M.C, 1986. The intracratonic Irumide Belt of Zambia and its bearing on colli-sion orogeny during the Proterozoic of Africa. In: Coward, M.P., Ries, A.I. (Eds.),Collision Tectonics, vol. 19. Geological Society of London Special Publication, pp.321–328.
Das, A.K., Piper, J.D.A., Mallik, S.B., Sherwood, G.J., 1996. Palaeomagnetic study ofArchaean Banded hematite jasper rocks from the Singhbhum-Orissa Craton,India. Precambrian Research 80, 193–204.
de Kock, M.O., 2007. Paleomagnetism of selected Neoarchean-Paleoproterozoiccover sequences on the Kaapvaal craton and implications for Vaalbara. Unpub-lished Ph.D. Thesis. University of Johannesburg, Johannesburg, 276 pp.
de Kock, M.O., Evans, D.A.D., Dorland, H.C., Beukes, N.J., Gutzmer, J., 2006. Paleomag-netism of the lower two unconformity-bounded sequences of the WaterbergGroup, South Africa: towards a better-defined apparent polar wander forthe Proterozoic Kaapvaal Craton. South African Journal of Geology 109, 157–182.
de Wit, M.J., Roering, C., Hart, R.J., Armstrong, R.A., de Ronde, C.E.J., Green, R.W.E.,Tedoux, M., Perberdy, E., Hart, R.A., 1992. Formation of an Archaean continent.Nature 357, 553–562.
de Wit, M.J., Thiart, C., Doucouré, M., Wilsher, W., 1999. Scent of a supercontinent:Gondwana’s ores as chemical tracers—tin, tungsten and the NeoproterozoicLaurentia-Gondwana connection. Journal of African Earth Sciences 28, 35–51.
Elming, S.-A, Mikhailova, N.P., Kravchenko, S., 2001. Palaeomagnetism of Proterozoicrocks from the Ukrainian Shield: new tectonic reconstructions of the Ukrainianand Fennoscandian shields. Tectonophysics 339, 19–38.
Eriksson, P.G., Banerjee, S., Nelson, D.R., Rigby, M.J., Catuneanu, O., Sarkar, S., Roberts,R.J., Ruban, D., Mtimkulu, M.N., Raju, S., 2009. A Kaapvaal craton debate: nucleusof an early small supercontinent or affected by an enhanced accretion event?Gondwana Research 15, 354–372.
Evans, M.E., 1976. Test of the dipolar nature of the geomagnetic field throughoutPhanerozoic time. Nature 262, 676–678.
Evans, D.A.D., 1998. True polar wander, a supercontinental legacy. Earth PlanetaryScience Letters 157, 1–8.
Evans, D.A.D., Gutzmer, J., Beukes, N.J., Kirschvink, J.L., 2001. Paleomagnetic con-straints on ages of mineralization in the Kalahari Manganese Field, South Africa.Economic Geology 96, 621–631.
Evans, D.A.D., Beukes, N.J., Kirschvink, J.L., 2002. Paleomagnetism of a lateritic paleo-weathering horizon and overlying Paleoproterozoic redbeds from South Africa:implications for the Kaapvaal apparent polar wander path and a confirmationof atmospheric oxygen enrichment. Journal of Geophysical Research 107 2326.doi:10.1029/2001JB000432.
Goldreich, P., Toomre, A., 1969. Some remarks on polar wandering. Journal of Geo-physical Research 74, 2555–2567.
Gough, D.I., 1977. The geoid and single cell mantle convection. Earth Planetary Sci-ence Letters 34, 360–364.
Gower, C.F., Ryan, A.B., Rivers, T., 1990. Mid-Proterozoic Laurentia-Baltica: anoverview of its geological evolution and summary of contributions made by thisvolume. In: Gower, C.F., Ryan, A.B., Rivers, T. (Eds.). Mid Proterozoic Laurentia-Baltica, GAC Special Paper 38, Geological Association of Canada, 1-22.
Groves, D.I., Vielreicher, R.M., Godfarb, R.J., Condie, K.C., 2005. Controls on the hetero-geneous distribution of mineral deposits through time. In: McDonald, I., Boyce,A.J., Butler, I.B., Herrington, R.J., Polya, D.A. (Eds.), Mineral Deposits and EarthEvolution, vol. 248. Geological Society of London Special Publication, pp. 71–101.
Hanson, R.E., Wardlaw, M.S., Wilson, T.J., Mwale, G., 1993. U–Pb zircon ages from theHook granite massif and Mwembeshi dislocation: constraints on Pan-Africandeformation, plutonism and transcurrent shearing in central Zambia. Precam-brian Research 63, 189–209.
Hattingh, P.J, 1989. The paleomagnetism of the upper zone of Bushveld Complex.Tectonophysics 165, 131–142.
Heaman, L.M., 1997. Global mafic magmatism at 2.45 Ga: remnants of an ancientlarge igneous province? Geology 25, 299–302.
Hollerbach, R., Jones, C.A., 1993. Influence of the Earth’s inner core on geomagneticfluctuations and reversals. Nature 365, 541–543.
Kent, D.V., Smethurst, M.A., 1998. Shallow bias of palaeomagnetic inclinations in thePalaeozoic and Precambrian. Earth and Planetary Science Letters 160, 391–402.
Le Pichon, X., Huchon, P., 1984. Geoid, Pangaea and convection. Earth and PlanetaryScience Letters 67, 123–135.
Ledru, P., Johan, V., Millesi, J.P., Tegyey, M., 1994. Markers of the last stage ofthe Palaeoproterozoic collision: evidence for a 2 Ga continent involving cicum-Atlantic provinces. Precambrian Research 69, 169–191.
Maruyama, S., Santosh, M., Zhao, D., 2007. Superplume, supercontinent, and post-perovskite: mantle dynamics and anti-plate tectonics on the core–mantleboundary. Gondwana Research 11, 7–37.
McClennan, S.M., Taylor, S.R., 1982. Geochemical constraints on the growth of thecontinental crust. Journal of Geology 90, 347–361.
McKenzie, D.P., Weiss, N., 1975. Speculations on the thermal and tectonic history ofthe Earth. Geophysical Journal of the Royal Astronomical Society 42, 131–174.
Mertanen, S., Halls, H.C., Vuollo, J.I., Pesonen, L.J., Stepanov, V.S., 1999. Palaeo-magnetism of 2.44 Ga mafic dykes in Russia Karelia, eastern FenoscandianShield—implications for continental reconstructions. Precambrian Research 98,197–221.
Mondal, S., Piper, J.D.A., Hunt, L., Bandyopadhyay, G., Basu Mallik, S., 2009. Palaeo-magnetic and rock magnetic study of charnockites from Tamil Nadu, India, andthe ‘Ur’ protocontinent in Early Palaeoproterozoic times. Journal of Asian EarthSciences 34, 493–506.
Morgan, G.E, Briden, J.C., 1981. Aspects of Precambrian palaeomagnetism, with newdata from the Limpopo Mobile Belt and Kaapvaal Craton in southern Africa.Physics of the Earth and Planetary Interiors 24, 142–168.
Pesonen, L.J., Elming, S.-S., Mertanen, S., Pisarevsky, S., D’Agrella-Filho, M.S., Meert,J.G., Schmidt, P.W., Abrahamsen, N., Bylund, G., 2003. Palaeomagnetic configu-ration of continents during the Proterozoic. Tectonophysics 375, 289–324.
Petrasheck, W.E., 1973. Some aspects of the relations between continental driftand metallogenic provinces. In: Tarling, D.H., Runcorn, S.K. (Eds.), Implicationsof Continental Drift to the Earth Sciences, vol. 1. Academic Press, London, pp.567–572.
Phillips, B.R., Bunge, H.-P., Schaber, K., 2009. True polar wander in mantle convectionmodels with multiple, mobile continents. Gondwana Research 15, 288–296.
Piper, J.D.A., 1980. Analogous Upper Proterozoic apparent polar wander loops.Nature 283, 845–847.
Piper, J.D.A., 1982. The Precambrian palaeomagnetic record: the case for the Pro-terozoic Supercontinent. Earth Planetary Science Letters 59, 61–89.
Piper, J.D.A., 1987. Palaeomagnetism and the Continental Crust. Open UniversityPress, 488 pp.
Piper, J.D.A., 2003. Consolidation of Continental Crust in Late Archaean-Early Pro-terozoic times: a Palaeomagnetic test. Gondwana Research 6, 435–448.
Piper, J.D.A., 2006. A ∼90◦ Late Silurian-Early Devonian apparent polar wander loop:the latest inertial interchange of planet Earth? Earth and Planetary Science Let-ters 250, 345–357.
Piper, J.D.A., 2007. The Neoproterozoic Supercontinent Palaeopangaea. GondwanaResearch 12, 202–227.
Piper, J.D.A., Mallik, S.B., Bandyopadhyay, G., Mondal, S., Das, A.K., 2003. Palaeo-magnetic and rock magnetic study of a deeply-exposed continental crustalsection: the charnockite belt of Southern India. Precambrian Research 121, 185–219.
Poornachandra Rao, G.V.S., Mallikarjuna Rao, J., Reddi, A.E.B., 1989. Preliminarypalaeomagnetic and geochemical studies of granulites from Tamil Nadu andKerala. In: Proceedings of the IASPEI Meeting on Structure and Dynamics ofIndian Lithosphere, Hyderabad, pp. 1–3.
Prasad, C.V.R.K., Pulla Reddy, V., Subbarao, K.V., Radhakrishnamurty, C., 1987. Palaeo-magnetism and the crescent shape of the Cuddapah Basin, Purana Basins ofPeninsula India. Geological Society of India Memoir 6, 331–347.
Richter, F.M., Parsons, B., 1976. On the interaction of two scales of convection in themantle. Journal of Geophysical Research 80, 2529–2541.
Rino, S., Kon, Y., Sato, W., Maruyama, S., Santosh, M., Zhao, D., 2008. The Grenvillianand Pan-African orogens: World’s largest orogenies through geologic time, andtheir implications on the origin of superplume. Gondwana Research 14, 51–72.
Rogers, J.J.W., 1996. A history of continents in the past three billion years. Journal ofGeology 104, 91–107.
Rogers, J.J.W., Santosh, M., 2004. Continents and Supercontinents. Oxford UniversityPress, 289 pp.
Salminen, J., Pesonen, L.J., Reimold, W.U., Donaldini, F., Gibson, R.L., 2009. Palaeo-magnetic and rock magnetic study of the Vredefort impact structure and theJohannesburg Dome, Kaapvaal Craton during the Mesoproterozoic. PrecambrianResearch 168, 167–184.
Santosh, M., Maruyama, S., Yamamoto, S., 2009. The making and breaking of super-continents: some speculations based on superplumes, superdownwelling andthe role of tectosphere. Gondwana Research 15, 324–341.
Sears, J.W., Price, R.A., 1978. The Siberian connection: a case for the Precambrianseparation of the North American and Siberian cratons. Geology 6, 267–270.
Sears, J.W., Price, R.A., 2000. New look at the Siberia connection: no SWEAT. Geology28, 423–426.
Senshu, H., Maruyama, S., Rino, S., Santosh, M., 2009. Role oftonalite–trondhjemite–granite (TTG) crust subduction on the mechanismof supercontinent breakup. Gondwana Research 15, 433–442.
Shackleton, R.M., 1973. Correlations of structures across Precambrian orogenic beltsin Africa. In: Tarling, D.H., Runcorn, S.K. (Eds.), Implications of Continental Driftto the Earth Sciences, vol. 2. Academic Press, London, pp. 1091–1095.
Silver, P.G., Behn, M.D., 2008. Intermittent Plate Tectonics? Science 319, 85–89.Sinomson, B.M., Sumner, D.Y., Beukes, N.J., Johnson, S., Gutzmer, J., 2009. Correlating
multiple Neoarchaean-Palaeoproterozoic impact spherule layers between SouthAfrica and Western Australia. Precambrian Research 169, 100–111.
Strik, G., Blake, T.S., Zegers, T.E., White, S.H., Langereis, C.G., 2003. Palaeomagnetismof flood basalts in the Pilbara Craton, Western Australia: Late Archaean conti-nental drift and the oldest known reversal of the geomagnetic field, Journal ofGeophysical Research 108. EPM 2, 1–21.
Strik, G., de Wit, M.J., Langereis, C.G., 2007. Palaeomagnetism of the NeoarchaeanPongola and Ventersdorp Supergroups and an appraisal of the 3.0–1.9 Ga appar-ent polarwander path of the Kaapvaal Craton, Southern Africa. PrecambrianResearch 153, 96–115.
Tsai, V.C., Stevenson, D.J., 2007. Theoretical constraints on true polar wander. Journalof Geophysical Research 112, B5, B05415. doi:10.1029/2005JB003923.
Usui, Y., Tarduno, J.H., Watkeys, M., Hofmann, A., Cottrell, R., 2009. Evidence fora 3.45-billion–year-old magnetic remanence: hints of an ancient geodynamofrom comglomerates of South Africa. Geochemistry, Geophysics, Geosystems10, Q09207. doi:10.1029/2009GC002496.
Watson, J.V., 1973. Effects of reworking on high-grade gneiss complexes. Philosoph-ical Transactions of the Royal Society of London A273, 433–456.

Author's personal copy
J.D.A. Piper / Journal of Geodynamics 50 (2010) 154–165 165
Watson, J.V., 1978. Ore deposition through geological time. Proceedings of the RoyalSociety of London A362, 305–328.
Williams, G.E., Schmidt, P.W., 1997. Palaeomagnetism of the Palaeopro-terozoic Gowganda and Lorrain Formations, Ontario: low palaeolatitudefor Huronian glaciation. Earth and Planetary Science Letters 153, 157–169.
Williams, H., Hoffman, P.F., Lewry, J.F., Monger, J.W.H., Rivers, T., 1991. Anatomyof North America: thematic portrayals of the continent. Tectonophysics 187,117–134.
Windley, B.F., 1993a. The Evolving Continents, 3rd ed. John Wiley, New York, 526pp.
Windley, B.F., 1993b. Uniformitarianism today: plate tectonics is the key to the past.Journal of the Geological Society of London 150, 7–19.
Zegers, T.E., de Wit, M.J., Dann, J., White, S.H., 1998. Vaalbara, Earth’s oldest assem-bled continent? A combined structural, geochronological and palaeomagnetictest. Terra Nova 10, 250–259.
Zhao, D, 2009. Multiscale seismic tomography and mantle dynamics. GondwanaResearch 15, 297–323.


