Embed Size (px)
Citation preview
J O U R N A L O F E N V I R O N M E N T A L S C I E N C E S 2 6 ( 2 0 1 4 ) 1 9 0 3 – 1 9 1 2
Ava i l ab l e on l i ne a t www.sc i enced i r ec t . com
ScienceDirect
www. jou rna l s . e l sev i e r . com/ jou rna l -o f - env i r onmenta l - sc i ences
Properties of agricultural aerosol released during wheatharvest threshing, plowing and sowing
Chiara Telloli1,⁎, Antonella Malaguti1, Mihaela Mircea1, Renzo Tassinari2,Carmela Vaccaro2, Massimo Berico1
1. ENEA, National Agency for New Technologies, Energy and Sustainable Economic Development, Via Martiri di Monte Sole 4,Bologna 40129, Italy. E-mail: [email protected]. Department of Earth Science, Ferrara University, Italy
A R T I C L E I N F O
⁎ Corresponding author.
http://dx.doi.org/10.1016/j.jes.2014.07.0041001-0742/© 2014 The Research Center for Ec
A B S T R A C T
Article history:Received 6 November 2013Revised 3 February 2014Accepted 24 February 2014Available online 16 July 2014
This study shows for the first time a chemical and morphological characterization ofagricultural aerosols released during three important agricultural operations: threshing,plowing and sowing. The field campaigns were carried out in the eastern part of the PoValley, Italy, in summer and autumn 2009. The aerosol particles were sampled on quartzfiber filters and polytetrafluoroethylene membranes in order to allow Inductively CoupledPlasma Mass Spectrometry (ICP-MS) analysis and Scanning Electron Microscopy equippedwith an Energy Dispersive X-ray Spectrometer (SEM-EDS) investigations, respectively. Theorganic carbon mass concentrations were measured with a Sunset Laboratory Dual-OpticalOrganic Carbone/Elemental Carbon (OCEC) Aerosol analyzer. The morphological andchemical analyses by SEM-EDS allowed recognizing four main particle classes: organic,silica, calcite and clay minerals. The organic particles contribute to both fine and coarseaerosol fractions up to ca. 50% for all three agricultural activities. This was also confirmedby OCEC analysis for fine fraction. Most of the agricultural aerosols, about 60%, were singleparticles and the remaining 40% were agglomerations of particles. The ICP-MS resultsshowed that threshing and plowing producemore aerosol particles than sowing, which wascharacterized by important amounts of clay minerals produced from land soils.© 2014 The Research Center for Eco-Environmental Sciences, Chinese Academy of Sciences.
Published by Elsevier B.V.
Keywords:AerosolAgricultureSEM-EDSICP-MS and OCEC analyses
Introduction
Recent studies show that agricultural operations produce an increaseof aerosol concentrations in atmosphere (Clausnitzer and Singer,1997; Kjelgaard et al., 2004; Qiu and Pattey, 2008), especially in thevicinity of agricultural field (Kasumba et al., 2011). Erisman et al.(2008) showed that 20% of aerosol in Europe is due to theemissions from agricultural operations. California Air ResourcesBoard also proved that aerosol from agricultural operations modifiesthe atmospheric aerosol concentrations in California (CARB, 2004):20%–25% of aerosol is due to the emissions from agriculturaloperations, this estimation is based on lidar measurements for a
o-Environmental Science
variety of farming operations (tillage procedures such as disking,floating and land planning) (Cassel et al., 2003).
According to the guidelines European Environment Agency ofthe European Monitoring and Evaluation Programme (EMEP/EEA,2009), significant fractions of PM10 and PM2.5 are emitted from landcultivation. The knowledge of aerosol concentrations emitted in theatmosphere from agricultural activity is important, because theincrease of aerosol concentrations reduces the visibility, influencesthe climate change and has a deleterious environmental impact oninhabitant of nearby towns (Auvermann et al., 2004). Epidemiolog-ical and environmental studies (Pope et al., 1995; Schwartz et al.,1996) have shown that exposure to fine particles can result in
s, Chinese Academy of Sciences. Published by Elsevier B.V.
1904 J O U R N A L O F E N V I R O N M E N T A L S C I E N C E S 2 6 ( 2 0 1 4 ) 1 9 0 3 – 1 9 1 2
serious respiratory disorders as cardiovascular and respiratorydiseases (BlacqueBelair, 1991; Chestnut et al., 1991; Abbey et al.,1995; Pope, 2000; Pope et al., 2002; Laden et al., 2006; Hopke, 2008;Kelly, 2009).
The aerosol concentration in some rural areas may be due toagricultural activities (Bhat and Kumar, 2012), but limited dataare available about chemical and morphological characteristicsof this agricultural aerosol. Thoracic fraction (PM2.5–PM10) of theaerosol can be generated due to the agricultural activities involvingmechanical processes: windblown dust, dust from rural roads, anddust generated from farming activities such as harvesting, tilting,and disking (Claiborn, 2006). This aerosol may carry potentiallyhazardous co-pollutants, such as viruses, pathogens, endotoxins,pesticides, and heavy metals, which could result into potentialhealth issues (Bhat and Kumar, 2012). Few studies calculated theaerosol emission factors (Flocchini et al., 1994) while otherscalculated the impact of fertilizers (Mukai and Ambe, 1987; Baraudet al., 2003; UlénandMattsson, 2003) or the impact of animal activityon the aerosol production (Gibbs et al., 2004; Priyadarsan et al., 2005;Rule et al., 2005; Upadhyay et al., 2008; Schicker et al., 2009;Hiranuma et al., 2011).
To our knowledge, only one study on the aerosol product byemission of fertilizer in an agricultural area of the Po Valley hasbeen done by Corradini et al. (1977). Therefore, it is still importantto quantify the contribution of emitted aerosols from agriculturalsources and to know its morphology and chemical composition inorder to discriminate the local and natural sources from anthro-pogenic sources. The size and mass distribution of particlesemitted from various urban and rural sources, including agricul-tural burning and ambient sources are studied in detail (Fang etal., 2003; Awasthi et al., 2011; Bhat and Kumar, 2012).
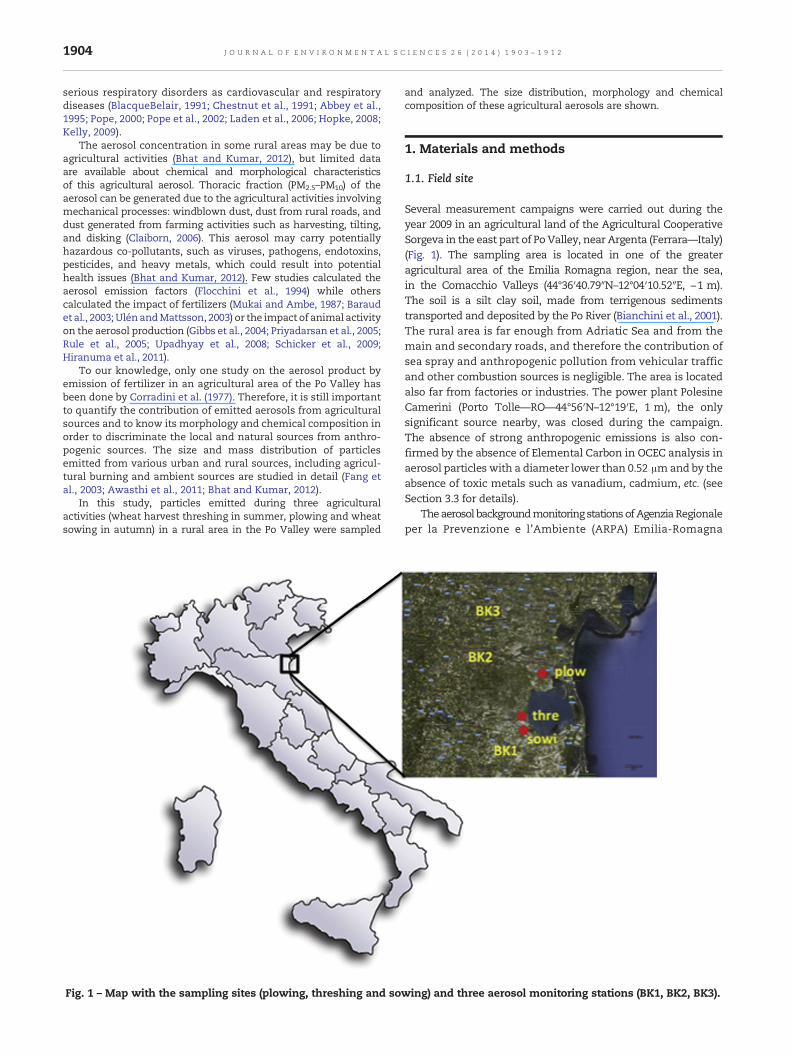
In this study, particles emitted during three agriculturalactivities (wheat harvest threshing in summer, plowing and wheatsowing in autumn) in a rural area in the Po Valley were sampled
Fig. 1 – Map with the sampling sites (plowing, threshing and so
and analyzed. The size distribution, morphology and chemicalcomposition of these agricultural aerosols are shown.
1. Materials and methods
1.1. Field site
Several measurement campaigns were carried out during theyear 2009 in an agricultural land of the Agricultural CooperativeSorgeva in the east part of Po Valley, near Argenta (Ferrara—Italy)(Fig. 1). The sampling area is located in one of the greateragricultural area of the Emilia Romagna region, near the sea,in the Comacchio Valleys (44°36′40.79″N–12°04′10.52″E, −1 m).The soil is a silt clay soil, made from terrigenous sedimentstransported and deposited by the Po River (Bianchini et al., 2001).The rural area is far enough from Adriatic Sea and from themain and secondary roads, and therefore the contribution ofsea spray and anthropogenic pollution from vehicular trafficand other combustion sources is negligible. The area is locatedalso far from factories or industries. The power plant PolesineCamerini (Porto Tolle—RO—44°56′N–12°19′E, 1 m), the onlysignificant source nearby, was closed during the campaign.The absence of strong anthropogenic emissions is also con-firmed by the absence of Elemental Carbon in OCEC analysis inaerosol particles with a diameter lower than 0.52 μmand by theabsence of toxic metals such as vanadium, cadmium, etc. (seeSection 3.3 for details).
Theaerosol backgroundmonitoring stationsofAgenziaRegionaleper la Prevenzione e l’Ambiente (ARPA) Emilia-Romagna
wing) and three aerosol monitoring stations (BK1, BK2, BK3).

1905J O U R N A L O F E N V I R O N M E N T A L S C I E N C E S 2 6 ( 2 0 1 4 ) 1 9 0 3 – 1 9 1 2
(http://www.arpa.emr.it/aria/index.asp?idlivello=134): BalliranaAlfonsine (BK1), Ostellato (BK2) and Gherardi Jolanda di Savoia(BK3) shown in Fig. 1, have measured an averaged mean PM2.5
concentration of 8 ± 2.6, 19.8 ± 4 and 25.7 ± 0.6 μg/m3 duringthreshing, plowing and sowing operations.
There was no contribution from biomass burning to theaerosol samples since no fire event existed in the nearby areaduring the sampling, according to MODIS data.
In Italy, the wheat is the main grown product and it isfarmed in extended fields (AGRIT, 2008). Therefore, theaerosol was sampled within the emitted plume behind theagricultural machine during wheat harvest threshing insummer, plowing andwheat sowing in autumn. The samplingperiods were chosen to minimize the contribution of anthro-pogenic sources, therefore they were not affected by strongthermal inversions.
An eight-stage Marple cascade impactor (Model 298,Graseby Andersen Samplers, Inc., Atlanta, GA, USA) wasused for size dependent aerosol collection. Two quartz fiberfilter types were used as collection substrates, SKC 225–18261.2 μm R-100 and PALL Tissuquartz filters, 2500 QAT-UPØ34 mm - Sigma-Aldrich. The SKC substrates were used for8 size ranges with aerodynamic equivalent particle diameters(AED): 0.52–0.93, 0.93–1.55, 1.55–3.5, 3.5–6, 6–9.8, 9.8–14.8, 14.8–21.3, >21.3 μm and the PALL 2500 QAT-UP filter was used asfinal filter (AED < 0.52 μm).
An open filter holder equipped with a cylindrical apronwas used to collect total suspended particles (TSP) ona polytetrafluoroethylene (PTFE) membrane (Pall TEFLOW/RING pore size 1.0 μm Ø47 mm). Samplers were placedwithin the dust plume by a telescopic pole mounted on avehicle.
An air sampling pump SKC AirChek 2000 (SKC, Inc., USA)was used with a flow rate of 2 L/min. The pump wascompensated for losses up to 1000 mm H2O to keep constantthe sampling flow rate. Sample times were 5, 10 and 60 minfor harvest, plowing and sowing respectively. The highaerosol concentrations during the harvest and plowingactivity near the sources emitted, allowed short samplingtimes (5 and 10 min, respectively), while the low aerosolconcentrations during sowing activity required a samplingtime of 60 min.
The aerosol was sampled into the emitted cloud, followingthe agricultural machines. The distance between the impac-tors and the emission point (agricultural machine) was keptconstant in order to avoid the aerosol dispersion as much aspossible. The sampling methodology is described in moredetails in Telloli et al., submitted.
Table 1 – Average and standard deviation of meteorological par
Sampling day Wind speed(m/sec)
Threshing 25 June 4.1 ± 0.4Plowing 7 October
8 October2.2 ± 0.33.2 ± 0.2
Sowing 17 November 1 ± 0.4
m/sec = meters/second; N = Nord; °C = centigrade scale.
1.2. Sampling
All the campaigns were carried out down-wind the agriculturalmachine and with the sampler inside the emitted plume. Themeteorological data (temperature, humidity, wind directionand wind velocity) were provided by ARPA Emilia Romagnaweather station (44°36′01.24″N–12°04′37.72″E), which was thenearest station to all sampling sites. The distance from stationto sampling sites ranged from 0.5 to 10 km.
The three basic agricultural operations related to the wheatcycle were carried out in different seasons (summer andautumn), therefore different meteorological conditions, includ-ing soil moisture. Soil moisture is an important factor foragricultural emissions, in particular for the same agriculturaloperations and this subject requires further founding over theseveral years. Here, the three agricultural operations arecompletely different in nature, but the sampling methodologyand the analysis were the same.
The sampling during threshing operationswas carried out inthe afternoon, from 2:00 to 7:00 pm, on 25/06/2009 (UTC +1). Ingeneral, wheat threshing began at noon and ended at sunset.The start in mid-day ensured the minimum moisture content(MC) in grain (<15% MC), thereby reducing the possibility ofmold growth during storage. The average wind speed anddirection were 4.1 ± 0.4 m/sec and 149 ± 3°N respectively. Highvalues of relative humidity (max 82%,min 45%), associatedwithcold weather and rain events, reduced the resuspension ofaerosol particles (Table 1). The five samples collected on thesedays may be considered representative of agricultural particlesduring summer in the eastern part of the Po Valley.
The sampling during plowing operationswas carried out from12:00 am to 3:00 pm on 7/10/2009 and from 11:00 am to 12:30 amon 8/10/2009 (UTC +1). In the days prior to the measures nosignificant rain events were recorded. The average wind speedanddirectionwere 2.2 ± 0.3 m/sec and314 ± 11°Nduring the firstsampling day and 3.2 ± 0.2 m/sec and 319 ± 6°N during thesecond sampling day. High values of relative humidity (max82%) and low temperatures (min 14°C) during the night causedthe formation of dew on the ground, and the reduction of theaerosol resuspension (Table 1). For this operation, five sampleswere collected representative of agricultural particles in October.
The sampling during sowing operations was carried outfrom 12:00 am to 1:30 pm and from 4:15 pm to 5:30 pm on 17/11/2009 (UTC +1). The average wind speed and direction were1.2 ± 0.4 m/sec and 317 ± 9°N in the morning and 0.8 ± 0.4 m/sec and 304 ± 20°N in the afternoon. High values of relativehumidity (86% ± 1%) and low temperature (11.5 ± 0.3°C)maintained the environment stable and the soil wet during
ameters for ARPA CAMSE.
Wind direction(°N)
RH (%) Temperature(°C)
149 ± 3 56 ± 6 24.6 ± 1.6314 ± 11319 ± 6
38 ± 349 ± 3
27.3 ± 0.925.5 ± 1.4
311 ± 8 86 ± 1 11.5 ± 0.3
1906 J O U R N A L O F E N V I R O N M E N T A L S C I E N C E S 2 6 ( 2 0 1 4 ) 1 9 0 3 – 1 9 1 2
the sampling (Table 1). Therefore, only two samples werecollected for this operation.
1.3. Analysis
After collection, all samples were transported in a refri-gerated cooler to ENEA (Agenzia nazionale per le nuovetecnologie, l’energia e lo sviluppo economico sostenibile)laboratory in Bologna and stored under refrigeration untilmicroscopy analysis was performed (Hiranuma et al., 2008).
PTFE membranes were used for SEM-EDS analysis tocharacterize the shape and morphology and the elementalcomposition of collected aerosol particles. Quartz fiber filterswere used to characterize the chemical composition of thesamples by ICP-MS technique.
Morphological characteristics, size and elemental ana-lysis of individual particles were identified with a ScanningElectron Microscopy (SEM) (EVO® 40 Series, Carl Zeiss AG,EVISA) equipped with an Energy Dispersive X-ray Spec-trometer (EDS) (Oxford instruments Inca 300 EDS system,Oxfordshire, UK) for X-ray microanalysis. The particle sizeand the surface morphology of sampled aerosol particleswere investigated in high resolution mode (up to 20,000×)with a working voltage of 20 kV which corresponds to thedetection limit of 1 μmparticle size. High-resolution imagesof particles were obtained by the regulation of vacuuminside the instrument chamber. The analyses were qualita-tive and were performed in the manual mode. SEM-EDS isoften employed to identify airborne particulate deposits andbiological materials (Haapala, 1998). In EDS, the X-ray detectormeasures the number of emitted X-rays as a function of theirenergy. Since elements have a characteristic energy, the EDSspectrum can be used to identify the quantity of elementspresent (Frankel and Aitken, 1970). EDS technique is able tocharacterize the chemical composition of particles whosediameter is greater than 1 μm (Wilkinson et al., 2011). TheScanning Electron Microscopy is a technique employed indifferent atmospherical studies (De La Campa et al., 2007;Fromme et al., 2008; Hiranuma et al., 2008; Campos-Ramos etal., 2009; Wilkinson et al., 2011).
It is important to know that chemical and physicalcharacterizations of individual particles by SEM-EDS ins-trument reveal source information which cannot be deter-mined through bulk chemical characterization (Dzubay andMamane, 1989; Jambers and Van Grieken, 1997; Katrinak et al.,1995; Conner and Williams, 2004).
SEM-EDSmeasurements were performed on TSP samplescollected on PTFE membranes. Portions of the filters weremounted on aluminum support SEM “stubs” with double-sided tape which had a conductive graphite-based. Thesamples were then coated with a thin layer of gold (coating)film by electric arc high vacuum method and then analyzedby SEM. In addition to the detection limit of the instrument,characterization of the fine particles was prevented by thedifficulty to identify the small particles within the web ofPTFE membranes (Conner and Williams, 2004; Casuccio etal., 2004).
The multi-element analysis was carried out by Inductive-ly Coupled Plasma Mass Spectrometry (ICP-MS, X Seriesspectrometer, collision/reaction cell CCTED, Thermo Electron
Corporation, Winsford, UK), which has become an increasinglypopular technique for characterization of atmospheric aerosols(Upadhyay et al., 2009). Multi-element characterization is doneusing a small sample volume; it has a large dynamic range (pptor ppb) and a short analysis time (Arimoto et al., 1995; Bettinelliet al., 1998; Vallius et al., 2005; Pekney and Davidson, 2005;Herner et al., 2006; Witt et al., 2006). This technique has beenrecently used (Goodarzi, 2006; Herner et al., 2006; De La Campaet al., 2007; Upadhyay et al., 2009) for quantifying the presenceof toxic elements in the aerosol.
The organic compounds and silicate are destroyed during thepreparation of samples for ICP-MS analysis which implied theaddition of nitric acid andhydrofluoric acid (Bettinelli et al., 1998),for this reason the organic compounds and Si are not present inthe graphs for ICP-MS results (Fig. 3).
For the ICP-MS analysis the aerosol samples collected onquartz fiber filters were extracted by using acid digestion in ahotplate open system in different steps with HF, HNO3 andH2O2 (Chao and Sanzolone, 1992). The Limits of Detection(LOD) values, calculated as three times the standard deviation(3δ) of blanks are (in μg/m3): 0.004 (Na); 0.001 (Mg); 0.003 (Al);0.001 (K); 0.004 (Ca); 0.004 (Fe); 0.000 (B); 0.001 (Mn); 0.002 (Cu);0.004 (Zn); 0.002 (Sn); 0.002 (Co); 0.008 (Mo); 0.001 (V); 0.001 (Cr);0.001 (Ni); 0.000 (Rb); 0.001 (Sr); 0.001 (Ba) and 0.000 (U).
This analysis allows us to recognize the geochemicalfingerprint of the soil, to provide markers to refer the localsoil and to identify anomalies related to the contributions ofparticles from near fields.
The contributions of Particulate Organic and ElementalCarbon were analyzed on quartz filter that collected aerosolparticles with AED lower than 0.52 μm using a thermal opticalanalyzer (Sunset Laboratory Dual-OpticalCarbonaceous Analyz-er, Portland, OR). For the analysis a 1.5 cm2 sample piece waspunched from the quartz filter. The analyses were performedwithEUSAAR_2 thermal optical transmittanceprotocol (Cavalli etal., 2010). EUSAAR_2 protocol has been specifically developed forrural background samples.
2. Results and discussion
2.1. Morphological classification by SEM analysis
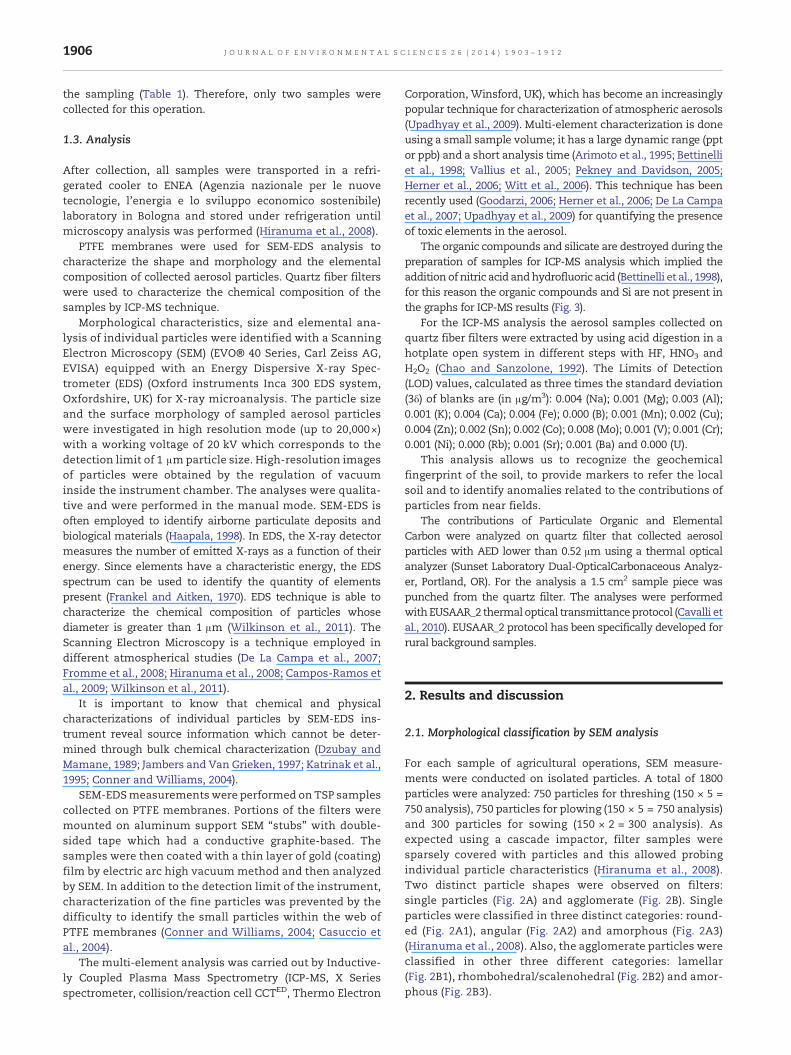
For each sample of agricultural operations, SEM measure-ments were conducted on isolated particles. A total of 1800particles were analyzed: 750 particles for threshing (150 × 5 =750 analysis), 750 particles for plowing (150 × 5 = 750 analysis)and 300 particles for sowing (150 × 2 = 300 analysis). Asexpected using a cascade impactor, filter samples weresparsely covered with particles and this allowed probingindividual particle characteristics (Hiranuma et al., 2008).Two distinct particle shapes were observed on filters:single particles (Fig. 2A) and agglomerate (Fig. 2B). Singleparticles were classified in three distinct categories: round-ed (Fig. 2A1), angular (Fig. 2A2) and amorphous (Fig. 2A3)(Hiranuma et al., 2008). Also, the agglomerate particles wereclassified in other three different categories: lamellar(Fig. 2B1), rhombohedral/scalenohedral (Fig. 2B2) and amor-phous (Fig. 2B3).

A1 A2 A3
B1 B2 B3
Fig. 2 – Images of representative particle shapes: single (A1 round particle, A2 angular particle, A3 amorphous particle) andagglomerate (B1 lamellar particles, B2 rhombohedral/scalenohedral particles, B3 amorphous particles).
1907J O U R N A L O F E N V I R O N M E N T A L S C I E N C E S 2 6 ( 2 0 1 4 ) 1 9 0 3 – 1 9 1 2
The single particles were present in a major percentage(58%) with respect to the agglomeration particles (42%)(Table 2). The majority of single particles, randomly selected,were classified as rounded particles (50%), amorphous par-ticles (45%) and a minority as angular particles (5%). Theagglomerate particles were classified as amorphous particles(64%), lamellar particles (31%) and a minority as rhombohe-dral/scalenohedral particles (5%).
2.2. Elemental composition by SEM-EDS microanalysis
Aerosol compositionof single particlewasdeterminedusingEDSmicroanalysiswhichdetected the presence of C, O, Na,Mg, Al, Si,P, S, Cl, K, Ca, Mn and Fe. The ammonium compounds containedin the aerosol particles were not identified because of the poorefficiency in detecting nitrogen by the X-ray spectrometer(Paoletti et al., 2002); in addition the ammoniumnitrate particles
Table 2 – Characterization of aerosol sampled during agricultur
Morphology Chemicalsignature
Total relativeabundance
(%)
Relativethresh
Single Rounded Clay mineral 3Organic 23Silica 3
Angular Clay mineral 1Organic 0.5Silica 1.5
Amorphous Carbonate 3.5Clay mineral 4Organic 15Silica 3.5
Agglomerate Lamellar Clay mineral 13Rhombohed./Scalenohed.
Carbonate 3
Amorphous Clay mineral 14Organic 12
are volatile compounds, and therefore they were lost. Thechemical composition of the analyzed particles can be dividedin two main categories: the first category of particles containsinorganic compounds, like silica (Fig. 2A2), carbonate (Fig. 2B2)and clay mineral (Fig. 2B1 and B3); the second category ofparticles contains smaller and larger organic compounds (Fig.2A1 andA3), including biogenicmaterials, pollens, spores,moldsand bacterial, which are usually used as indicators of humanmortality and respiratory morbidity (Beggs and Bambrick, 2005;D'Amato and Cecchi, 2008; Shea et al., 2008; Ziska et al., 2008;Shendell et al., 2012).
The relative concentration of four particles groups (organ-ic, silica, carbonate and clay) observed by SEM-EDS is differentfor the three agricultural activities as reported in Table 2.
Table 2 shows the percentage of single and agglomerateparticles analyzed by SEM-EDS, which are distinct by theirmorphology and chemical signature on the left part. On the
al operations in Po Valley with SEM-EDS technique.
abundance ining operation(%)
Relative abundancein plowing operation
(%)
Relative abundancein sowing operation
(%)
5 2 037 22 393 3 20 2 00.5 0 33 2 63 4 45 1 0
14 6 34 0 08 22 85 0 0
12 19 163.5 17 19
1908 J O U R N A L O F E N V I R O N M E N T A L S C I E N C E S 2 6 ( 2 0 1 4 ) 1 9 0 3 – 1 9 1 2
right part, the relative abundance of each particles analyzedin the three distinct agricultural operations is shown. Fromthe total of 750 particles analyzed, in threshing samples, theorganic particles were present in a major percentage (55%)with respect to the inorganic particles (45%); in plowing, fromthe total 750 particles, the organic particles were present in aminor percentage (45%) with respect to the inorganic particles(55%) and in sowing samples from the total 300 particles, theorganic particles were present in a larger percentage withrespect to the inorganic particles (36%). The concentration oforganic material was high in all the three agricultural activitiessince the machineries act upon seeds, plants or rest of plants.The high contributions of the inorganic particles in threshingsamples may be explained by the fact that during their growththe plants collected important amounts of inorganic aerosolparticles from soil and rain.
In threshing and sowing samples the organic roundedsingle particles represent the majority, while in the plowingsamples the clay mineral lamellar agglomerates are themajority observed: this reflects the resuspension of the soilduring the operation.
Based on the knowledge of local sources (Bianchini et al.,2001) four particle types were determined: Organic (C\O only)indicative of organic carbon and plant matter (as in Wagner etal., 2012); Silica (Si\O only) indicative of sand and quartz(as in Wagner et al., 2012); Clay mineral (Al\Si unless theycontain Na, Mg, K and Fe) indicative of crustal material;and Carbonates (Ca only or Ca\Mg) indicative of Calciumcompounds. Carbonates, silica and clay minerals are mainlyoriginated from soil erosion and its resuspension (Paoletti etal., 2002) and these particles had the typical morphology ofcrustal mineral: carbonates are crystalline (rhombohedral andscalenohedral morphology), clay minerals are lamellar andsilica particles are angular or rounded. SEM-EDS analysis hadshown high concentrations of Silica that is present both insingle mineral (quartz) than in agglomerate clay mineral withother elements (Al, Na, Mg, K, Fe).
For plowing and sowing, the particles were directly producedfrom land soil because of the agricultural machines operated incontact with the ground. During threshing operations, themachines act on the plants, therefore the particles are producedfrom matter already deposited on the plants (up ca. 75%particles), which have the same composition (Bianchini et al.,2001). Table 2 shows chemical composition of particles forthreshing, plowing and sowing activities. For all the threeagricultural operations, the aerosol particles have almost thesame amounts of organic and inorganic compounds. In allsamples clay mineral is the most abundant component of theinorganic fraction, followed by silicates (quartz) and calcite. Thequartz particles and calcite had different single morphologies:rounded or angular, instead of clay minerals were agglomerate.
In threshing samples, the clay mineral particles were thehighest percentage of the inorganic fraction. The lamellarmorphology suggested a local source. Few quartz and calciteparticles were observed often aggregated with clay minerals.The rhombohedra and scalenohedra morphologies of calciteparticles suggested that they were formed through chemicaland physical processes in the presence of water, so called: achemical precipitation source. Since these particles do notcontain organic materials, it can be assumed that the chemical
precipitation had not occurred on site, but the particles werecrystallized somewhere else in a context where organic par-ticles were not available to act as crystallization seeds for watercondensation.
In plowing samples, the clay minerals are ca. 47% of theinorganic fraction. These particles were always aggregate withquartz and calcite particles. They had a lamellar morphologyindicating the production from local sources. Few other differentparticles were identified: calcite and magnesium carbonatewith a round morphology; and quartz particles with differentmorphology, some rounded from a long range sources, somewith angular morphology from local sources.
In sowing samples, the inorganic particles were in poorquantity and they were prevalent clay minerals with a lamellarmorphology produced from local sources. Few quartz andcalcium carbonate particles were also observed. The calciumparticles precipitate on local site, while the quartz particles haddifferent morphologies, like in plowing samples.
2.3. Chemical composition by ICP-MS technique
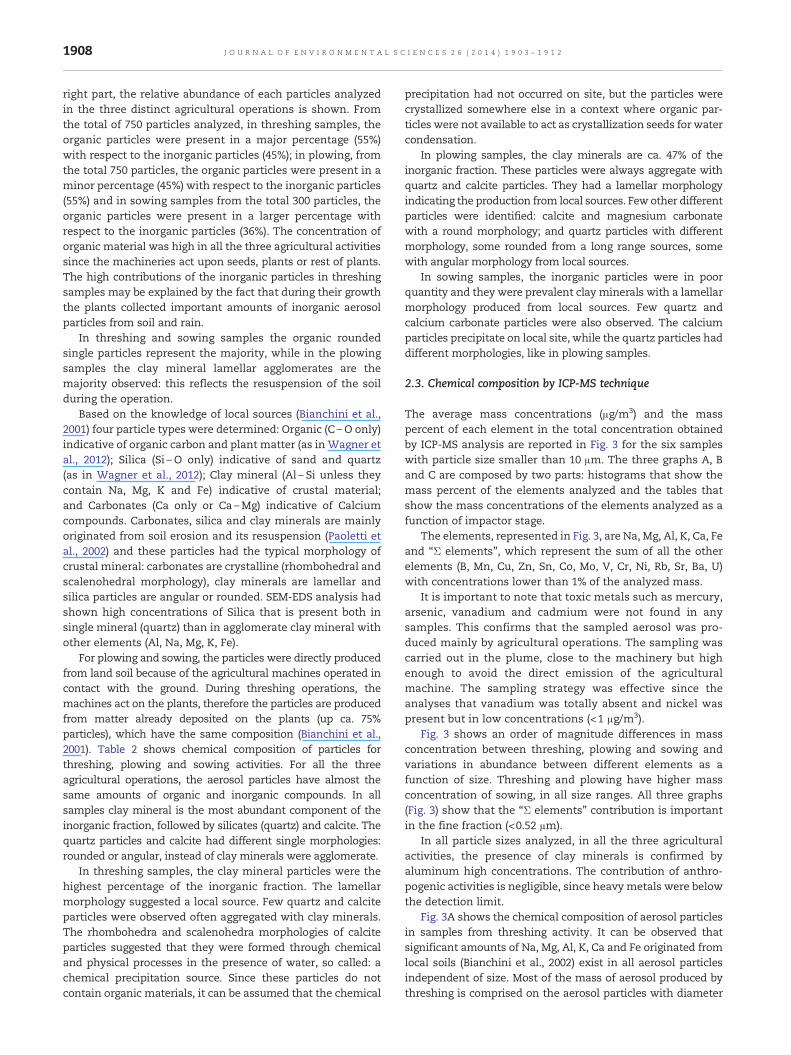
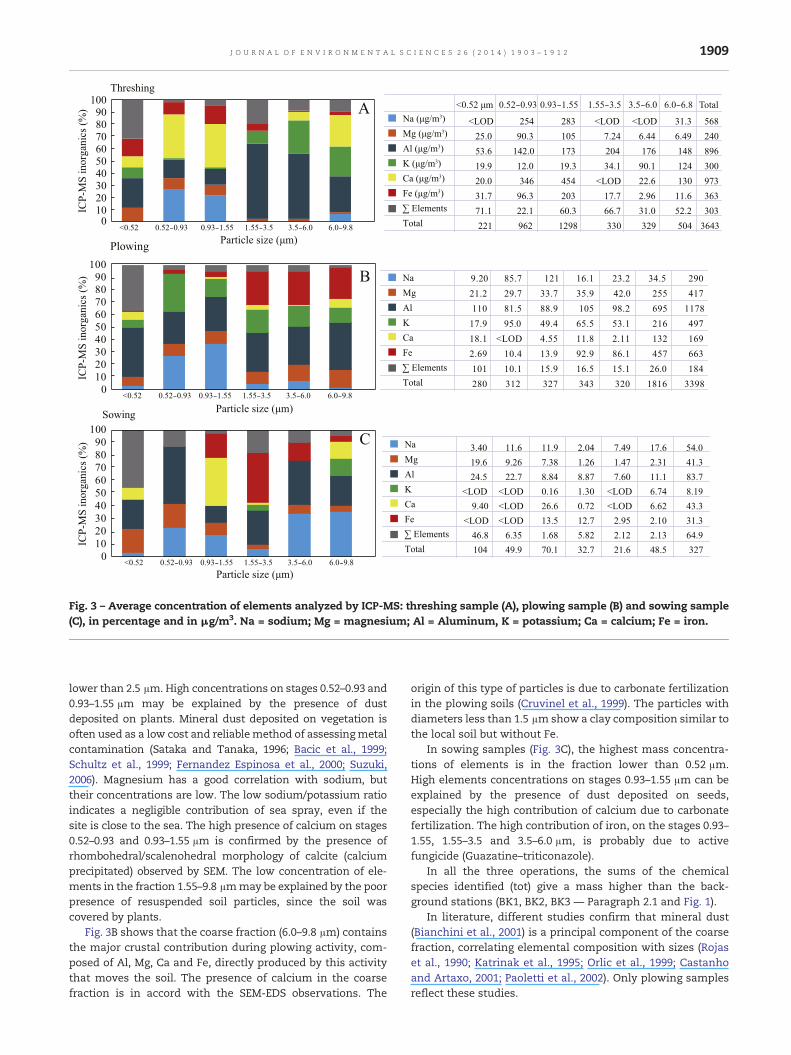
The average mass concentrations (μg/m3) and the masspercent of each element in the total concentration obtainedby ICP-MS analysis are reported in Fig. 3 for the six sampleswith particle size smaller than 10 μm. The three graphs A, Band C are composed by two parts: histograms that show themass percent of the elements analyzed and the tables thatshow the mass concentrations of the elements analyzed as afunction of impactor stage.
The elements, represented in Fig. 3, are Na, Mg, Al, K, Ca, Feand “Σ elements”, which represent the sum of all the otherelements (B, Mn, Cu, Zn, Sn, Co, Mo, V, Cr, Ni, Rb, Sr, Ba, U)with concentrations lower than 1% of the analyzed mass.
It is important to note that toxic metals such as mercury,arsenic, vanadium and cadmium were not found in anysamples. This confirms that the sampled aerosol was pro-duced mainly by agricultural operations. The sampling wascarried out in the plume, close to the machinery but highenough to avoid the direct emission of the agriculturalmachine. The sampling strategy was effective since theanalyses that vanadium was totally absent and nickel waspresent but in low concentrations (<1 μg/m3).
Fig. 3 shows an order of magnitude differences in massconcentration between threshing, plowing and sowing andvariations in abundance between different elements as afunction of size. Threshing and plowing have higher massconcentration of sowing, in all size ranges. All three graphs(Fig. 3) show that the “Σ elements” contribution is importantin the fine fraction (<0.52 μm).
In all particle sizes analyzed, in all the three agriculturalactivities, the presence of clay minerals is confirmed byaluminum high concentrations. The contribution of anthro-pogenic activities is negligible, since heavy metals were belowthe detection limit.
Fig. 3A shows the chemical composition of aerosol particlesin samples from threshing activity. It can be observed thatsignificant amounts of Na, Mg, Al, K, Ca and Fe originated fromlocal soils (Bianchini et al., 2002) exist in all aerosol particlesindependent of size. Most of the mass of aerosol produced bythreshing is comprised on the aerosol particles with diameter
0102030405060708090
100
<0.52 0.52-0.93 0.93-1.55 1.55-3.5 3.5-6.0 6.0-9.8
ICP-
MS
inor
gani
cs (%
)IC
P-M
S in
orga
nics
(%)
ICP-
MS
inor
gani
cs (%
)Threshing
Na (μg/m3) <LOD 254 283 <LOD <LOD 31.3 568Mg (μg/m3) 25.0 90.3 105 7.24 6.44 6.49 240Al (μg/m3) 53.6 142.0 173 204 176 148 896K (μg/m3) 19.9 12.0 19.3 34.1 90.1 124 300Ca (μg/m3) 20.0 346 454 <LOD 22.6 130 973Fe (μg/m3) 31.7 96.3 203 17.7 2.96 11.6 363
∑ Elements 71.1 22.1 60.3 66.7 31.0 52.2 303Total 221 962 1298 330 329 504 3643
0102030405060708090
100
Plowing
0102030405060708090
100Sowing
NaMgAlKCaFe
∑ ElementsTotal
9.20 85.7 121 16.1 23.2 34.5 29021.2 29.7 33.7 35.9 42.0 255 417110 81.5 88.9 105 98.2 695 1178
17.9 95.0 49.4 65.5 53.1 216 49718.1 <LOD 4.55 11.8 2.11 132 1692.69 10.4 13.9 92.9 86.1 457 663101 10.1 15.9 16.5 15.1 26.0 184280 312 327 343 320 1816 3398
NaMgAlKCaFe
∑ ElementsTotal
3.40 11.6 11.9 2.04 7.49 17.6 54.019.6 9.26 7.38 1.26 1.47 2.31 41.324.5 22.7 8.84 8.87 7.60 11.1 83.7
<LOD <LOD 0.16 1.30 <LOD 6.74 8.199.40 <LOD 26.6 0.72 <LOD 6.62 43.3
<LOD <LOD 13.5 12.7 2.95 2.10 31.346.8 6.35 1.68 5.82 2.12 2.13 64.9104 49.9 70.1 32.7 21.6 48.5 327
Particle size (μm)
Particle size (μm)
Particle size (μm)
<0.52 0.52-0.93 0.93-1.55 1.55-3.5 3.5-6.0 6.0-9.8
<0.52 0.52-0.93 0.93-1.55 1.55-3.5 3.5-6.0 6.0-9.8
A
B
C
<0.52 μm 0.52-0.93 0.93-1.55 1.55-3.5 3.5-6.0 6.0-6.8 Total
Fig. 3 – Average concentration of elements analyzed by ICP-MS: threshing sample (A), plowing sample (B) and sowing sample(C), in percentage and in μg/m3. Na = sodium; Mg = magnesium; Al = Aluminum, K = potassium; Ca = calcium; Fe = iron.
1909J O U R N A L O F E N V I R O N M E N T A L S C I E N C E S 2 6 ( 2 0 1 4 ) 1 9 0 3 – 1 9 1 2
lower than 2.5 μm. High concentrations on stages 0.52–0.93 and0.93–1.55 μm may be explained by the presence of dustdeposited on plants. Mineral dust deposited on vegetation isoften used as a low cost and reliablemethod of assessingmetalcontamination (Sataka and Tanaka, 1996; Bacic et al., 1999;Schultz et al., 1999; Fernandez Espinosa et al., 2000; Suzuki,2006). Magnesium has a good correlation with sodium, buttheir concentrations are low. The low sodium/potassium ratioindicates a negligible contribution of sea spray, even if thesite is close to the sea. The high presence of calcium on stages0.52–0.93 and 0.93–1.55 μm is confirmed by the presence ofrhombohedral/scalenohedral morphology of calcite (calciumprecipitated) observed by SEM. The low concentration of ele-ments in the fraction 1.55–9.8 μmmay be explained by the poorpresence of resuspended soil particles, since the soil wascovered by plants.
Fig. 3B shows that the coarse fraction (6.0–9.8 μm) containsthe major crustal contribution during plowing activity, com-posed of Al, Mg, Ca and Fe, directly produced by this activitythat moves the soil. The presence of calcium in the coarsefraction is in accord with the SEM-EDS observations. The
origin of this type of particles is due to carbonate fertilizationin the plowing soils (Cruvinel et al., 1999). The particles withdiameters less than 1.5 μmshow a clay composition similar tothe local soil but without Fe.
In sowing samples (Fig. 3C), the highest mass concentra-tions of elements is in the fraction lower than 0.52 μm.High elements concentrations on stages 0.93–1.55 μm can beexplained by the presence of dust deposited on seeds,especially the high contribution of calcium due to carbonatefertilization. The high contribution of iron, on the stages 0.93–1.55, 1.55–3.5 and 3.5–6.0 μm, is probably due to activefungicide (Guazatine–triticonazole).
In all the three operations, the sums of the chemicalspecies identified (tot) give a mass higher than the back-ground stations (BK1, BK2, BK3 — Paragraph 2.1 and Fig. 1).
In literature, different studies confirm that mineral dust(Bianchini et al., 2001) is a principal component of the coarsefraction, correlating elemental composition with sizes (Rojaset al., 1990; Katrinak et al., 1995; Orlic et al., 1999; Castanhoand Artaxo, 2001; Paoletti et al., 2002). Only plowing samplesreflect these studies.
1910 J O U R N A L O F E N V I R O N M E N T A L S C I E N C E S 2 6 ( 2 0 1 4 ) 1 9 0 3 – 1 9 1 2
Most of the aerosol mass is contained in coarse particlesfor threshing and plowing while for sowing it is on fineparticles (Fig. 3). Threshing produces the highest aerosolconcentrations while the sowing produces the lowest. Dif-ference in soil humidity can be the reason for emissionchanges of an order of magnitude. Sowing operations aremade generally in autumn (November), a period with a lot ofrain events which wet the soil.
Plowing operation produces a high concentration of soilparticles, mainly in the coarse fractions (6.0–9.8 μm), whilethreshing operation also raises many particles in the fractionbelow (3.5–6.0 μm). Threshing samples show higher aerosolconcentration even if the sampling lasted only 5 min. This isdetermined by the resuspension of biogenic aerosol, brokenpieces of wheat covered with dust soil resuspended fromneighbors' lands or by fungi, spores, bacteria, pollens or otherbiogenic fragments.
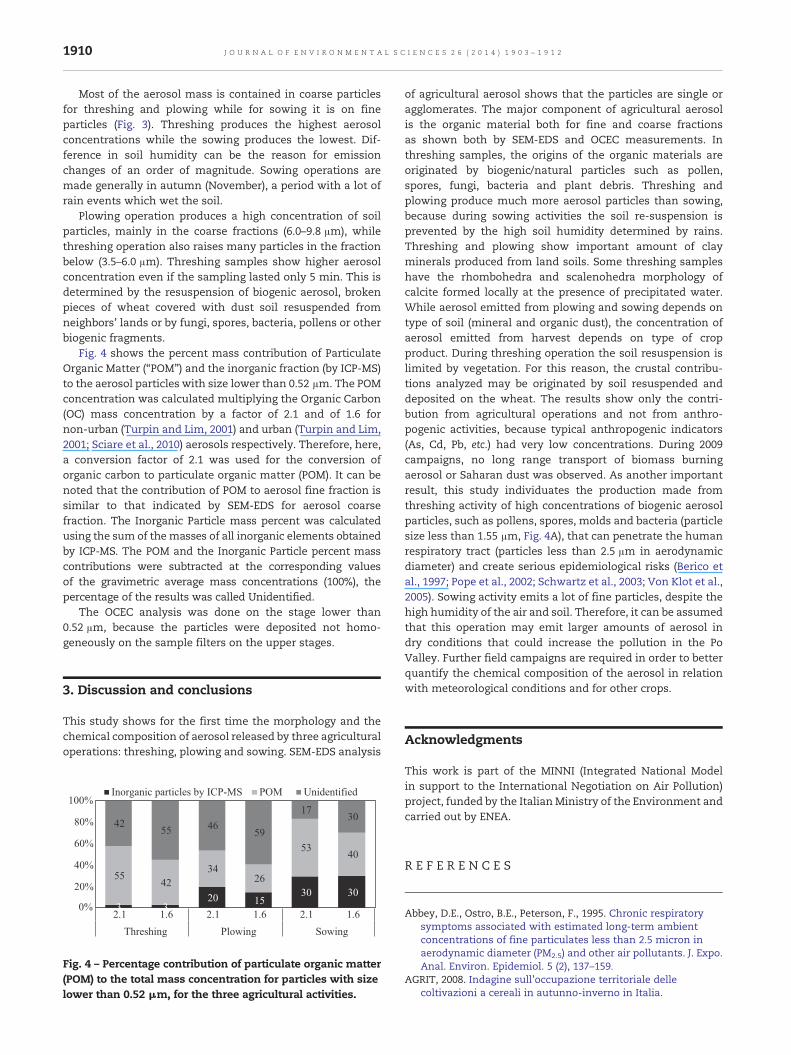
Fig. 4 shows the percent mass contribution of ParticulateOrganic Matter (“POM”) and the inorganic fraction (by ICP-MS)to the aerosol particles with size lower than 0.52 μm. The POMconcentration was calculated multiplying the Organic Carbon(OC) mass concentration by a factor of 2.1 and of 1.6 fornon-urban (Turpin and Lim, 2001) and urban (Turpin and Lim,2001; Sciare et al., 2010) aerosols respectively. Therefore, here,a conversion factor of 2.1 was used for the conversion oforganic carbon to particulate organic matter (POM). It can benoted that the contribution of POM to aerosol fine fraction issimilar to that indicated by SEM-EDS for aerosol coarsefraction. The Inorganic Particle mass percent was calculatedusing the sum of themasses of all inorganic elements obtainedby ICP-MS. The POM and the Inorganic Particle percent masscontributions were subtracted at the corresponding valuesof the gravimetric average mass concentrations (100%), thepercentage of the results was called Unidentified.
The OCEC analysis was done on the stage lower than0.52 μm, because the particles were deposited not homo-geneously on the sample filters on the upper stages.
3. Discussion and conclusions
This study shows for the first time the morphology and thechemical composition of aerosol released by three agriculturaloperations: threshing, plowing and sowing. SEM-EDS analysis
3 320 15
30 3055 42
3426
53 40
42 55 4659
17 30
0%
20%
40%
60%
80%
100%
2.1 1.6 2.1 1.6 2.1 1.6Threshing Plowing Sowing
Inorganic particles by ICP-MS POM Unidentified
Fig. 4 – Percentage contribution of particulate organic matter(POM) to the total mass concentration for particles with sizelower than 0.52 μm, for the three agricultural activities.
of agricultural aerosol shows that the particles are single oragglomerates. The major component of agricultural aerosolis the organic material both for fine and coarse fractionsas shown both by SEM-EDS and OCEC measurements. Inthreshing samples, the origins of the organic materials areoriginated by biogenic/natural particles such as pollen,spores, fungi, bacteria and plant debris. Threshing andplowing produce much more aerosol particles than sowing,because during sowing activities the soil re-suspension isprevented by the high soil humidity determined by rains.Threshing and plowing show important amount of clayminerals produced from land soils. Some threshing sampleshave the rhombohedra and scalenohedra morphology ofcalcite formed locally at the presence of precipitated water.While aerosol emitted from plowing and sowing depends ontype of soil (mineral and organic dust), the concentration ofaerosol emitted from harvest depends on type of cropproduct. During threshing operation the soil resuspension islimited by vegetation. For this reason, the crustal contribu-tions analyzed may be originated by soil resuspended anddeposited on the wheat. The results show only the contri-bution from agricultural operations and not from anthro-pogenic activities, because typical anthropogenic indicators(As, Cd, Pb, etc.) had very low concentrations. During 2009campaigns, no long range transport of biomass burningaerosol or Saharan dust was observed. As another importantresult, this study individuates the production made fromthreshing activity of high concentrations of biogenic aerosolparticles, such as pollens, spores, molds and bacteria (particlesize less than 1.55 μm, Fig. 4A), that can penetrate the humanrespiratory tract (particles less than 2.5 μm in aerodynamicdiameter) and create serious epidemiological risks (Berico etal., 1997; Pope et al., 2002; Schwartz et al., 2003; Von Klot et al.,2005). Sowing activity emits a lot of fine particles, despite thehigh humidity of the air and soil. Therefore, it can be assumedthat this operation may emit larger amounts of aerosol indry conditions that could increase the pollution in the PoValley. Further field campaigns are required in order to betterquantify the chemical composition of the aerosol in relationwith meteorological conditions and for other crops.
Acknowledgments
This work is part of the MINNI (Integrated National Modelin support to the International Negotiation on Air Pollution)project, funded by the Italian Ministry of the Environment andcarried out by ENEA.
R E F E R E N C E S
Abbey, D.E., Ostro, B.E., Peterson, F., 1995. Chronic respiratorysymptoms associated with estimated long-term ambientconcentrations of fine particulates less than 2.5 micron inaerodynamic diameter (PM2.5) and other air pollutants. J. Expo.Anal. Environ. Epidemiol. 5 (2), 137–159.
AGRIT, 2008. Indagine sull'occupazione territoriale dellecoltivazioni a cereali in autunno-inverno in Italia.

1911J O U R N A L O F E N V I R O N M E N T A L S C I E N C E S 2 6 ( 2 0 1 4 ) 1 9 0 3 – 1 9 1 2
Arimoto, R., Duce, R.A., Ray, B.J., Ellis, W.G., Cullen, J.D., Merrill, J.T.,1995. Trace elements in the atmosphere over the North Atlantic.J. Geophys. Res. Atmos. 100 (D1), 1199–1213.
Auvermann, B.W., Hiranuma, N., Heflin, K., Marek, G.W., 2004.Open-path transmissometry for measurement of visibilityimpairment by fugitive emissions from livestock facilities.ASAE Conference Proceeding No. 044010. ASAE, Ottawa,Ontario, Canada.
Awasthi, A., Agarwal, R., Mittal, S.K., Singh, N., Singh, K., Gupta, P.,2011. Study of size and mass distribution of particulate matterdue to crop residue burning with seasonal variation in ruralarea of Punjab India. J. Environ. Monit. 13 (4), 1073–1081.
Bacic, T., Lynch, A.H., Cutler, D., 1999. Reaction to cement factorydust contamination by Pinus halepensis needle. Environ. Exp.Bot. 41 (2), 155–166.
Baraud, L., Tessier, D., Aaron, J.J., Quisefit, J.P., Pinart, J., 2003. Amulti-residue method for characterization and determinationof atmospheric pesticides measured at two French urbanand rural sampling sites. Anal. Bioanal. Chem. 377 (7–8),1148–1152.
Beggs, P.J., Bambrick, H.J., 2005. Is the global rise of asthma anearly impact of anthropogenic climate change? Environ.Health Perspect. 113 (8), 915–919.
Berico, M., Formignani, M., Luciani, A., 1997. Atmospheric aerosolin an urban area: measurements of TSP and PM10 standardsand pulmonary deposition assessment. Atmos. Environ. 31(21) (3669-3665).
Bettinelli, M., Spezia, S., Baroni, U., Bizzarri, G., 1998.Determination of trace elements in power plant emissions byinducitvely coupled plasma mass spectrometry: comparisonwith other spectrometric techniques. Microchem. J. 59 (2),203–218.
Bhat, A., Kumar, A., 2012. Particulate characteristics and emissionrates during the injection of class B biosolids into anagricultural field. Sci. Total Environ. 414, 328–334.
Bianchini, G., Laviano, R., Lovo, S., Vaccaro, C., 2001. Chemicalmineralogical characterisation of clay sediments aroundFerrara: a tool for an environmental analysis. Appl. Clay Sci. 21(3–4), 165–176.
BlacqueBelair, A., 1991. Dictionnaire des Constantes Biologiqueset Physiques en Médecine-Applications, CliniquesPratiques6th ed. Maloine.
Campos-Ramos, A., Aragón-Piña, A., Galindo-Estrada, I., Querol, X.,Alastuey, A., 2009. Characterization of atmospheric aerosols bySEM in a rural area in the western part of México and ist relationwith different pollution sources. Atmos. Environ. 43 (39),6159–6167.
CARB, 2004. California Air Resource Board (CARB) emissioninventory.
Cassel, T., Trzepla-Nabaglo, K., Flocchini, R., 2003. PM10emission factors for harvest and tillage of row crops. 12thInternational Emission Inventory Conference “EmissionInventories — Apllying New Technologies”. San Diego, April29–May 1, 2003.
Castanho, A.D.A., Artaxo, P., 2001. Wintertime and summertimeSão Paulo aerosol source apportionment study. Atmos.Environ. 35 (29), 4889–4902.
Casuccio, G.S., Schlaegle, S.F., Lersch, T.L., Huffman, G.P., Chen, Y.,Shah, N., 2004. Measurement of fine particulate matter usingelectron microscopy techniques. Fuel Process. Technol. 85(6–7), 763–779.
Cavalli, F., Viana, M., Yttri, K.E., Genberg, J., Putaud, J.P., 2010.Toward a standardised thermal–optical protocol for measuringatmospheric organic and elemental carbon, the EUSAARprotocol. Atmos. Meas. Tech. 3 (1), 79–89.
Chao, T.T., Sanzolone, R.F., 1992. Decomposition techniques. J.Geochem. Explor. 44 (1–3), 65–106.
Chestnut, L.G., Schwartz, J., Savitz, O., Burchfiel, C., 1991.Pulmonary function and ambient particulate matter:
epidemiological evidence from NHANES-I. Arch. Environ.Health 46 (3), 135–144.
Claiborn, C., 2006. Agriculture and air quality—airborneparticulate matter. Workshop on agricultural air quality,Washington D.C. (USA), pp. 355–356.
Clausnitzer, H., Singer, M.J., 1997. Intensive land preparationemits respirable dust. Calif. Agric. 51 (2), 27–30.
Conner, T.L., Williams, R.W., 2004. Identification of possiblesources of particulate matter in the personal cloud usingSEM-EDX. Atmos. Environ. 38 (31), 5305–5310.
Corradini, C., Dalfiume, M., Favale, B., 1977. On the origin ofaerosol in an agricultural area of the Po Valley. J. Aerosol Sci. 8(4), 231–236.
Cruvinel, P.E., Flocchini, R.G., Artaxo, P., Crestana, S., Herrmann Jr.,P.S.P., 1999. Elemental analysis of agricultural soil samples byparticle induced X-ray emission (PIXE) technique. Nucl. Instrum.Methods Phys. Res. 150 (1–4), 478–483.
D'Amato, G., Cecchi, L., 2008. Effects of climate change onenvironmental factors inrespiratory allergic diseases. Clin.Exp. Allergy 38 (8), 1264–1274.
De La Campa, A.M.S., De La Rosa, J., Querol, X., Alastuey, A., Mantilla,E., 2007. Geochemistry and origin of PM10 in the Huelva region,Southwestern Spain. Environ. Res. 103 (3), 305–316.
Dzubay, T., Mamane, Y., 1989. Use of electron microscopy data inreceptor models for PM10. Atmos. Environ. 23 (2), 467–476.
Erisman, J.W., Bleecker, A., Hansen, A., Vermeulen, A., 2008.Agricultural air quality in Europe and the future perspectives.Atmos. Environ. 42 (14), 3209–3217.
Fang, G.C., Chuang, C.H.I.N., Chu, C.C., Wu, Y.I., Fu, P.P., Yang, I.L.,et al., 2003. Characterization of particulate, metallicelements of TSP, PM2.5 and PM2.5–10 aerosols at farmsampling site in Taiwan, Taichung. Sci. Total Environ. 308 (1/3),157–166.
Fernandez Espinosa, Y., Ternero Rodriguez, M., Barragan, De LaRosa, F.J., Jimenez Sanchez, J.C., 2000. A chemical speciation oftrace metals for fine urban particles. Atmos. Environ. 36 (5),773–780.
Flocchini, R.G., Cahill, T.A., Matsumura, R.T., Carvacho, O., Lu, Z.,1994. Study of fugitive PM10 emissions for selected agriculturalpractices on selected agricultural soil. SJV Grant File # 20960University of California, Davis, CA.
Frankel, R.S., Aitken, D.W., 1970. Energy dispersive X-ray emissionspectroscopy. Appl. Spectrosc. 24 (6), 557–566.
Fromme, H., Diemer, J., Dietrich, S., Cyrys, J., Heinrich, J., Lang, W.,et al., 2008. Chemical and morphological properties ofparticulate matter (PM10 and PM2.5) in school classrooms andoutdoor air. Atmos. Environ. 42 (27), 6597–6605.
Gibbs, S.G., Green, C.F., Tarwater, P.M., Scarpinc, P.V., 2004.Airborne antibiotic resistant and nonresistant bacteriaand fungi recovered from two swine herd confinedanimal feeding operations. J. Occup. Environ. Hyg. 1 (11),699–706.
Goodarzi, F., 2006. Morphology and chemistry of fine particlesemitted from a Canadian coal-fired power plant. Fuel 85 (3),273–280.
Haapala, H., 1998. The use of SEM/EDX for studying thedistribution of air pollutants in the surroundings of theemission source. Environ. Pollut. 9 (3), 361–363.
Herner, J.D., Green, P.G., Kleeman, M.J., 2006. Measuring the traceelemental composition of size-resolved airborne particles.Environ. Sci. Technol. 40 (6), 1925–1933.
Hiranuma, N., Brooks, S.D., Auvermann, B.W., Littleton, R., 2008.Using environmental scanning electron microscopy todetermine the hygroscopic properties of agricultural aerosols.Atmos. Environ. 42 (9), 1983–1994.
Hiranuma, N., Brooks, S.D., Gramann, J., Auvermann, B.E., 2011.The unique properties of agricultural aerosols measured at acattle feeding operation. Atmos. Chem. Phys. Discuss. 11 (5),14417–14453.
1912 J O U R N A L O F E N V I R O N M E N T A L S C I E N C E S 2 6 ( 2 0 1 4 ) 1 9 0 3 – 1 9 1 2
Hopke, P.K., 2008. The use of source apportionment for air qualitymanagement and health assessment. J. Toxicol. Environ.Health 71 (9–10), 555–563.
Jambers, W., Van Grieken, R., 1997. Single particle characterizationof inorganic suspension in Lake Baikal, Siberia. Environ. Sci.Technol. 31 (5), 1525–1533.
Kasumba, J., Holmén, B.A., Hiscox, A., Wang, J., Miller, D., 2011.Agricultural PM10 emissions from cotton field disking in LasCruces, NM. Atmos. Environ. 45 (9), 1668–1674.
Katrinak, K.A., Anderson, J.R., Buseck, P.R., 1995. Individualparticle types in the aerosol of Phoenix Arizona. Environ. Sci.Technol. 29 (2), 321–329.
Kelly, R.J., 2009. Occupational medicine implications ofengineered nanoscale particulate matter. J. Chem. Health Saf.16 (1), 24–39.
Kjelgaard, J., Sharratt, B., Sundram, I., Lamb, B., Claiborn, C.,Saxton, K., et al., 2004. PM10 emission from agricultural soilson the Columbia Plateau: comparison of dynamic andtime-integrated field-scale measurements and entrainmentmechanisms. Agric. For. Meteorol. 125 (3–4), 259–277.
Laden, F., Schwartz, J., Speizer, F.E., Dockery, D.W., 2006.Reduction in fine particulate air pollution and mortality:extended follow-up of the Harvard six cities study. Am. J.Respir. Crit. Care Med. 173 (6), 667–672.
Mukai, H., Ambe, Y., 1987. Detection of monomethylarseniccompounds originating from pesticide in airborne particulatematter sampled in an agricultural area in Japan. Atmos.Environ. 21 (1), 183–189.
Orlic, I., Won, X., Ng, T.H., Tang, S.M., 1999. Two years of aerosolpollution monitoring in Singapore: a review. Nucl. Instrum.Methods Phys. Res. B 150 (1–4), 457–464.
Paoletti, L., De Berardis, B., Diociaiuti, M., 2002. Physico-chemicalcharacterisation of the inhalable particulate matter (PM10) inan urban area: an analysis of the seasonal trend. Sci. TotalEnviron. 292 (3), 265–275.
Pekney, N.J., Davidson, C.I., 2005. Determination of trace elementsin ambient aerosol samples. Anal. Chim. Acta. 540 (13),269–277.
Pope 3rd, C.A., 2000. Epidemiology of fine particulate air pollutionand human health; biological mechanisms and who's at risk?Environ. Health Perspect. 108 (S4), 713–723.
Pope 3rd, C.A., Thun, M.J., Namboodiri, M.M., Dockery, D.W.,Evans, J.S., Speizer, F.E., et al., 1995. Particulate air pollution asa predictor of mortality in a prospective study of US adults.Am. J. Respir. Crit. Care Med. 151 (3Pt 1), 669–674.
Pope 3rd, C.A., Burnett, R.T., Thun, M.J., Calle, E.E., Krewski, D., Ito,K., 2002. Lung cancer, cardiopulmonary mortality, andlong-term exposure to fine particulate air pollution. JAMA 287(9), 1132–1141.
Priyadarsan, S., Annamalai, K., Sweeten, J.M., Holtzapple, M.T.,Mukhtar, S., 2005. Co-gasification of blended coal with feedlotand chicken litter biomass. Proc. Combust. Inst. 30 (2),2973–2980.
Qiu, G., Pattey, E., 2008. Estimating PM10 emissions from springwheat harvest using an atmospheric tracer technique. Atmos.Environ. 42 (35), 8315–8321.
Rojas, C.M., Prodi, F., Vivarelli, F., 1990. Aerosols in Santiago deChile: a study using receptor modeling with X-ray fluorescenceand single particle analysis. Atmos. Environ. 24 (2), 227–241.
Rule, A.M., Chapin, A.R., McCarthy, S.A., Gibson, K.E., Schwab, K.J.,Buckley, T.J., 2005. Assessment of an aerosol treatment toimprove air quality in a swine concentrated animal feedingoperation (CAFO). Environ. Sci. Technol. 39 (24), 9649–9655.
Schicker, B., Kuhn, M., Fehr, R., Asmis, L.M., Karagiannidis, C.,Reinhart, W.H., 2009. Particulate matter inhalation during haystoring activity induces systematic inflammation and plateletaggregation. Eur. J. Appl. Physiol. 105 (4), 771–778.
Schultz, H., Popp, P., Huhn, G., Stark, H.J., Schuurmann, G., 1999.Biomonitoring of airborne inorganic and organic pollutants bymeans of pine tree barks. I. Temporal and spatial variations.Sci. Total Environ. 232 (1–2), 49–58.
Schwartz, J., Dockery, D.W., Neas, L.M., 1996. Is daily mortalityassociated specifically with fine particles. J. Air Waste Manag.Assoc. 46 (10), 927–939.
Schwartz, J., Zanobetti, A., Bateson, T.F., 2003. Mortality andmorbidity among elderly residents of cities with daily PMmeasurements. Revisited Analysis of Time-series Studies of AirPollution and HealthHealth Effects Institute, Boston, pp. 25–58.
Sciare, J., d'Argouges, O., Zhang, Q.J., Sarda-Estève, R., Gaimoz, C.,Gros, V., et al., 2010. Comparison between simulated andobserved chemical composition of fine aerosols in Paris(France) during springtime: contribution of regional versuscontinental emissions. Atmos. Chem. Phys. 10 (24),11987–12004.
Shea, K.M., Truckner, R.T., Weber, R.W., Peden, D.B., 2008. Climatechange and allergic disease. J. Allergy Clin. Immunol. 122 (3),443–453.
Shendell, D.G., Therkorn, J.H., Yamamoto, N., Meng, Q., Kelly, S.W.,Foster, C.A., 2012. Outdoor near-roadway, community andresidential pollen, carbon dioxide and particulate mattermeasurements in the urban core of an agricultural region incentral CA. Atmos. Environ. 20, 103–111.
Suzuki, K., 2006. Characterisation of airborne particulates andassociated trace metals deposited on tree bark by ICP-OES,ICP-MS, SEM-EDX and laser ablation ICP-MS. Atmos. Environ.40 (14), 2626–2634.
Turpin, B.J., Lim, H.J., 2001. Species contributions to PM2.5 massconcentrations: revisiting common assumptions forestimating organic mass. Aerosol Sci. Technol. 35 (1), 602–610.
Ulén, B., Mattsson, L., 2003. Transport of phosphorus forms and ofnitrate through a clay soil under grass and cereal production.Nutr. Cycl. Agroecosyst. 65 (2), 129–140.
Upadhyay, J., Auvermann, B.W., Paila, A.N., Hiranuma, N., 2008.Open-path transmissometry to determine atmosphericextinction efficiency of feedyard dust. Trans. ASAE 51 (4),1433–1441.
Upadhyay, J., Majestic, B.J., Prapaipong, P., Herckes, P., 2009.Evaluation of polyurethane foam, polypropylene, quartz fiber,and cellulose substrates for multi-element analysis ofatmospheric particulate matter by ICP-MS. Anal. Bioanal.Chem. 394 (1), 255–266.
Vallius, M., Janssen, N.A.H., Heinrich, J., Hoek, G., Ruuskanen, J.,Cyrys, J., et al., 2005. Sources and elemental composition ofambient PM2.5 in three European cities. Sci. Total Environ. 337(1–3), 147–162.
Von Klot, S., Peters, A., Aalto, P., Bellander, T., Berglind, N.,D'Ippoliti, D., et al., 2005. Ambient air pollution is associatedwith increate risk of hospital cardiac readmissions ofmyocardial infarction survivors in five European cities.Circulation 112, 3073–3079.
Wagner, J., Naik-Patel, K., Wall, S., Harnly, M., 2012. Measurementof ambient particulate matter concentrations and particletypes near agricultural burns using electron microscopy andpassive samplers. Atmos. Environ. 54, 260–271.
Wilkinson, K., Lundkvist, J., Seisenbaeva, G., Kessler, V., 2011. Newtabletop SEM-EDS-based approach for cost-efficient monitoringof airborne particulate matter. Environ. Pollut. 159 (1), 311–318.
Witt, M., Baker, A.R., Jickells, T.D., 2006. Atmospheric trace metalsover the Atlantic and South Indian Oceans: investigation ofmetal concentrations and lead isotope ratios in coastal andremote marine aerosols. Atmos. Environ. 40 (28), 5435–5451.
Ziska, L.H., Epstein, P.R., Schlesinger, W.H., 2008. Rising CO2,climate change, and public health: exploring the links to plantbiology. Environ. Health Perspect. 117 (2), 155–158.


