Embed Size (px)
Citation preview

2013 Engineering and Physical Sciences in Medicine Conference
Excellence through Innovation and Professional Development
Program
Pan Pacific Hotel Perth3rd – 7th November 2013
MAJOR CONFERENCE SPONSORSThis conference has received funding from the Australian Government Department of Health.
Platinum Sponsor
Silver Sponsor
Welcome Reception Sponsor
Melbourne Cup Sponsor
Other sponsors
CONFERENCE VENUEPan Pacific Hotel
207 Adelaide Terrace
Perth, Western Australia 6000
EPSM CONFERENCE BOOKLETThis booklet contains abstracts of the papers which have been accepted for the EPSM 2013 Conference.
All abstracts have been subject to a peer reviewing process.
The contents and any opinions expressed represent the views of the authors only. This publication is copyright. Apart from fair dealing for the purpose of private study, research, criticism or review as permitted under the Copyright Act, no part may be reproduced without prior written permission from the Publisher.
CONFERENCE MANAGEMENT Promaco Conventions as Conference Managers for the EPSM 2013 Conference are pleased to welcome delegates to the Conference. We are positive you will find this a most rewarding experience. If we can be of any assistance please see a staff person at the registration desk.
Promaco ConventionsPO Box 890Canning Bridge WA 6153AustraliaPhone: +61 8 9332 2900Email: [email protected] Web: www.promaco.com.au
The Australasian College of Physical Scientists and Engineers in Medicine (ACPSEM) represents Physical Scientists and Engineers providing a broad range of professional services to the medical community. The college has six branches covering the states of Australia and New Zealand. The college is dedicated to continuing education and professional development over a number of specialist areas and confers certification in these fields. Please visit www.acpsem.org.au for more information.
DISCLAIMER
The information contained in this publication is correct at the time of printing. Promaco Conventions and the Organising Committee reserve the right to alter or delete items from the program. The organisers shall not be responsible for any costs or damages arising from any action based on the information contained in this booklet. E.&.O. E.
EPSM Perth 2013 — Excellence through Innovation and Professional Development
2

Welcome to EPSM 2013On behalf of the Organising Committee, it is with great pleasure I welcome you to Perth for the Engineering and Physical Sciences in Medicine (EPSM) Conference 2013. We hope you enjoy the diverse scientific program and the exciting social events.The conference theme, Excellence through Innovation and Professional Development, was chosen as our conference provides a great opportunity to share in the excellent research and development happening across our professions. EPSM 2013 aims to bring together the diverse intellectual endeavours of our field in addition to providing an opportunity for professional development. To add to the excitement, this year’s conference coincides with the International Day of Medical Physics and the Melbourne Cup. We look forward to celebrating both these events with you.
Perth is a beautiful city and our conference venue, the Pan Pacific Hotel, is only minutes from the magnificent Swan River and a short walk to the heart of the Perth CBD. This year’s conference dinner will be held at Fraser’s Restaurant located in Perth’s premier location, King’s Park, set with the spectacular backdrop of the city and the Swan River.
I would like to thank everyone who has contributed to EPSM 2013. In particular, I would like to thank the Australian Government Department of Health and all the companies who have provided support through sponsorship and the trade exhibition. The continued support of these companies helps make this event possible and their participation provides a valuable, informative contribution to our professions. I would also like to thank all the speakers, presenters and delegates for their intellectual contributions, their collegial spirit and for hopefully making EPSM 2013 a very successful and memorable event.
I have been privileged to work with an outstanding organising committee. EPSM 2013 would not have been possible without their dedication, hard work and sharp minds. I greatly appreciate all their efforts and valuable advice!
If you have any questions about Perth or the Conference, you are welcome to speak to an organising committee member or the Promaco Conventions’ staff at the registration desk.
I look forward to meeting you all during the conference and I hope you enjoy EPSM 2013 and Perth, Western Australia.
Janette AtkinsonConference Convenor
EPSM 2013 Conference CommitteeJanette Atkinson (Sir Charles Gairdner Hospital) – Executive CommitteeDr. John Burrage (Royal Perth Hospital) – Executive & Scientific CommitteeDr Andrew Campbell (Royal Perth Hospital) – Executive & Scientific CommitteeDr Matthew Carroll (University of Western Australia) – Scientific CommitteeRobert Day (Royal Perth Hospital) – Executive & Scientific CommitteeProf. Martin Ebert (Sir Charles Gairdner Hospital) – Executive & Scientific CommitteeDr Bruce Gardiner (University of Western Australia) – Scientific CommitteeTom Greig (Sir Charles Gairdner Hospital) – Scientific CommitteeAssoc/Prof Mike House (University of Western Australia) – Executive & Scientific CommitteePeter Lanzon (Sir Charles Gairdner Hospital) – Scientific CommitteePeter McLoone (Genesis Cancer Care) – Executive & Scientific CommitteeDr David Waterhouse (Sir Charles Gairdner Hospital) – Executive & Scientific Committee
EPSM Perth 2013 — Excellence through Innovation and Professional Development
3

EPSM Perth 2013 — Excellence through Innovation and Professional Development
4
ContentsKeynote Speakers ..................................5
Invited Speakers ....................................6
International Day of Medical Physics .......7
General Information ..............................8
Venue ......................................................9
Poster Floorplan ....................................9
Presenters Information .........................10
Prizes .....................................................10
Meetings & Workshops ..........................11
Social Functions .....................................12
Exhibition ...............................................13
EPSM Conference Program ...................14
Abstracts ................................................23
WHEN YOU NEED TO BE SUREPERSONAL RADIATION MONITORING SERVICES
PERSONAL RADIATION MONITORING SERVICES
RADIATION MONITOR CALIBRATIONS AND REPAIR
RADIATION MONITOR CALIBRATION AND REPAIR
SOURCE DISPOSAL
SOURCE DISPOSAL
TRAINING COURSES
TRAINING COURSES
EQUIPMENT SALES
MEDICAL PHYSICSCOMPLIANCE TESTING
COMPLIANCE TESTING
CONSULTANCY SERVICES
ANALYTICAL SERVICES
ANALYTICAL SERVICES
ENVIRONMENTAL SURVEYS
ENVIRONMENTAL SURVEYS
SGS AUSTRALIAN RADIATION SERVICESPO Box 3103, Nunawading VIC 31317/25-37 Chapman StreetBlackburn North VIC 3130t: +61 (0)3 9210 2000f: +61 (0)3 9899 6155Website: www.radiation.net.au www.sgs.com
AUSTRALIAN RADIATION SERVICES PTY LTD IS NOW PART OF SGS, THE WORLD’S LEADING INSPECTION, VERIFICATION, TESTING AND CERTIFICATION COMPANY.
SGS-ENVI-ARPS conference booklet ad-A5-EN-13-10-v2.indd 1 10/25/2013 2:59:22 PM
EPSM Perth 2013 — Excellence through Innovation and Professional Development
5
Keynote Speakers
Dr. Catharine ClarkDr Catharine Clark studied at University College London where she read Physics with Medical Physics followed by an MSc and PhD in Radiation Physics, which she completed in 1998. She moved to Paris, France where she was at the Institut Gustave Roussy and worked on the development of the Dosisoft
treatment planning system. She then took up a post as a clinical Radiotherapy physicist at Stanford University, California, USA, as well as being involved in the development of an online training course for dosimetrists. Catharine returned to the UK in 2001 and joined the Royal Marsden in London. She led the IMRT QA for the first national head and neck IMRT trial and set up the UK IMRT credentialing programme. Catharine has worked in the field of IMRT for the last 12 years and has published widely in this area. She recently led a national dosimetry audit of rotational IMRT in the UK and this work was awarded the highest scoring physics abstract at the ESTRO 2nd Forum in Geneva. She has lectured on IMRT on many national and international courses. Catharine currently holds a joint post at the Royal Surrey Hospital, in Guildford, Surrey and the National Physical Laboratory in London, UK.
Assoc. Prof. Dr. DI Dietmar GeorgDietmar Georg performed his basic studies at the University of Technology in Vienna. Between 1995 and 1999 he was working as a research fellow and post doc researcher at the Catholic University Leuven. Since 1999 he has been employed at the Medical University of Vienna, becoming Associated Professor
(Habilitation in Medical Physics) and Head of the Division of Medical Radiation Physics at the Department of Radiation Oncology in 2001. Dietmar Georg is the author or co-author of more than 110 peer-reviewed scientific articles in international journals. The main topics of his scientific work include dose calculation, treatment planning, dosimetry, image guided radiotherapy, particle therapy, as well as quality assurance and radiation protection. He has received awards for his work from different international and national associations. Furthermore he is/was the project or work-package leader of several research projects related to image guided radiotherapy or ion beam therapy.
Dr. James M. KoflerDr. Kofler completed undergraduate degrees in Nuclear Engineering and Engineering Physics and Physics at The University of Wisconsin – Madison, where he also completed his Ph.D. He has been a medical physicist at Mayo Clinic in Rochester, Minnesota for over 20 years and has worked in
general radiography and fluoroscopy, mammography, ultrasound, and has specialized in computed tomography for the last 13 years. He has published over 40 journal articles and three book chapters. His interests focus on the clinical implementation of CT scanner technologies, radiation dose and protocol management, and CT quality assurance. Dr. Kofler is a Fellow of the American Association of Physicists in Medicine (AAPM) and is active in many professional societies, including the AAPM, the American College of Radiology, and the American Board of Radiology.
Professor Joao SecoJoao Seco is Assistant Professor of Radiation Oncology at Harvard Medical School and Massachusetts General Hospital in Boston USA. He earned his PhD from the Institute of Cancer Research, University of London in the United Kingdom 2002. He held research positions at the Royal Marsden Hospital, UK and
the Harvard Medical School, Boston USA for several years. His group has published over 60 research papers and he was the recipient of the Harvard Club of Australia Foundation Award in 2012 on the development of Monte Carlo and optimization techniques for use in radiation therapy of lung cancer. His interests range from proton imaging and therapy to photon beam modeling Monte Carlo, electronic portal imaging and 4D Monte Carlo proton and photon dosimetry. He started working on Monte Carlo simulations while working as a Masters student at the Laboratory of Instrumentation and Experimental Particle Physics (LIP), a Portuguese research institute part of the CERN (the European Organization for Nuclear Research) worldwide network for particle physics research.

EPSM Perth 2013 — Excellence through Innovation and Professional Development
6
Professor Suzanne V SmithProfessor Suzanne V Smith has over 25 years of research experience in the production of reactor and cyclotron radioisotopes and their application in medicine, industry and the environment. A medical scientist in the Collider-Accelerator Department at the Brookhaven National Laboratory
and she holds an Adjunct Professorship with Australian National University as a Principle Investigator with the ARC Centre of Excellence in Antimatter Matter Studies (CAMS - partnership of 8 Australian and 13 International Institutes). She was an Executive Board member and Node Director for over 7 years, and the National Materials Theme Leader for CAMS. Her current role involves research and development into the production of radioisotopes using high-energy protons of the Brookhaven Linac Isotope Producer. She has experience that spans all aspects of the research and development in radiopharmaceuticals from “bench to production” under GMP (Good Manufacturing Practices) and ISO9001, including clinical trials under GCRP (Good Clinical Research Practices).
Professor Pamela J SykesProf Sykes obtained her PhD in somatic cell genetics at the University of Adelaide. She then undertook a post-doctoral position at the University of Oklahoma, USA on bacterial gene cloning before returning to Adelaide to the Flinders University to study residual disease in childhood leukaemia.
During this time she joined the Pathology Service at Flinders Medical Centre, becoming the Department Head of Genetics and Molecular Pathology in 2004, and is a Founding Fellow of the Faculty of Science in the Royal College of Pathologists of Australasia. Her current research is focussed on studying the mechanism of the protective role of low dose ionising radiation, which has been largely funded by the United States Department of Energy Low Dose Radiation Program. Prof Sykes was appointed as Professor, Preventive Cancer Biology in the Flinders Centre for Innovation in Cancer at Flinders University in 2011. She has collaborative low dose radio-biology projects in Australia, Canada, UK and Italy. Current appointments include membership on state and national committees for radiation protection and research and she is an Associate Editor for the journal Radiation Research.
Invited Speakers
Ms. Anna Hayton (ARPANSA, VIC)
Dr. Brad Oborn (Illawarra Cancer Care Centre, Wollongong, NSW)
Dr. Stephanie Rainey-Smith (Edith Cowan University, WA)
Dr. Gary Liney (Ingham Institute for Applied Medical Research, Liverpool NSW)
Dr. Georgia Halkett (Curtin University, WA)
Dr. Hamish Meffin (University of Melbourne, VIC)
Dr. Jason Dowling (CSIRO Brisbane, QLD)

Conference AppEPSM2013 Conference has gone mobile!
Please download guidebook on the Apple App Store or Android Market Place, then search for EPSM2013.
EPSM Perth 2013 — Excellence through Innovation and Professional Development
7
Dr. Jonathan Sykes (Napean Cancer Centre, NSW)
Prof. Karen Reynolds (Flinders University, SA)
Prof. Lin Fritschi (Western Australian Institute for Medical Research, WA)
Dr. Michael House (University of Western Australia, WA)
Dr. Michael Taylor (Australian Federal Police, Canberra, ACT)
Dr. Ming Hao Zheng (University of Western Australia, WA)
Dr. Pejman Rowshanfarzad (University of Western Australia, WA)
A/Prof. Robert McLaughlin (University of Western Australia, WA)
A/Prof. Roslyn Francis (Sir Charles Gairdner Hospital & University of Western Australia, WA)
Dr. Xiao Zhi Hu (University of Western Australia, WA)
Dr. Yuanyuan Ge (University of Sydney, NSW)
Prof. David Joske (Sir Charles Gairdner Hospital, WA)
EPSM Perth 2013 — Excellence through Innovation and Professional Development
8
International Day Of Medical PhysicsThis year marks the 50th Anniversary of the International Organization for Medical Physics (IOMP). This milestone occasion will see the commencement of an ongoing annual celebration, with the inaugural International Day of Medical Physics on the 7th November 2013. This day was chosen as it is the birthday of Marie Sklodowska Curie, a truly remarkable scientist and outstanding pioneer in the profession of Medical Physics. Marie Curie’s discovery of radium in 1898 not only provided a scientific breakthrough which would contribute to the development of medical imaging and therapy utilizing ionizing radiation, but over the course of her life she contributed to advancements in radiological imaging and radiotherapy.
The EPSM 2013 organising committee looks forward to celebrating this exciting occasion with you on Thursday 7th November 2013. There will be a plenary session in the morning with three renowned Medical Physicists speaking about Medical Physics: the past, the present and the future.
ACPESM Members Recognised On The 50th Anniversary Of The IOMPThe EPSM 2013 organising committee would like to congratulate Prof Allen, Prof Kron and Prof Thwaites, all ACPSEM Fellows who were recognised for their international contributions to Medical Physics at the 50th Anniversary of the IOMP celebrations in the UK in September. Please visit the poster at the entrance to the exhibition area to read more about the outstanding professional contributions made by each of these Medical Physicists
General Information
Telephone Directory Promaco Conventions (08) 9332 2900
Pan Pacific Perth (08) 9224 7777
Ambassador Hotel (08) 9325 1455
Perth Taxis 131 330
Jetstar 131 538
Qantas 131 313
Virgin Australia 136 789
Medical InformationFloreat Park Dental Centre - 150 Adelaide Terrace, East Perth WA 6004 - (08) 9221 3787
Rosens Pharmacy - 234 Hay Street, East Perth WA 6004 - (08) 9325 2843
East Perth Medical Centre - 168 Adelaide Terrace, East Perth WA 6004 - (08) 9221 4242
Registration and Message BoardThe registration desk is located close to the lifts on functions level at Pan Pacific, and will be operating at the following times. You must visit the registration desk before attending a session.
Sunday 3rd November: 17.00 – 19.00
Monday 4th November: 08.00 – 17.00
Tuesday 5th November: 08.15 – 17.45
Wednesday 6th November: 08.30 – 16.15
Thursday 7th November: 08.30 – 12.00
There will be a message board at the registration desk.
Please check for any last minute changes to the program.

EPSM Perth 2013 — Excellence through Innovation and Professional Development
9
CateringMorning, Lunch and Afternoon Tea are being provided in the Grand River Ballroom Exhibition area. Please refer to the detailed program for timings of when catering will be served each day.
Vegetarian options will be available during the conference, however please notify a member of staff if your have specific dietary requirements. These should have been noted during registration.
CMS Alphatech are sponsoring the barista served coffee cart at the conference. This will be located in the exhibition space between Monday – Wednesday and in the corridor by the conference rooms on Thursday.
Mobile PhonesDelegates are advised that all phones must be switched off or on silent mode during sessions.
Name BadgeEach delegate registered for the Conference will receive a name badge at the registration desk. This badge will be your official pass and must be clearly visible at all times to obtain entry to all sessions and to social functions.
Wifi at Pan PacificPlease connect to the following network, following the on-screen instructions and enter the below password to connect to wifi.
Network: conferences@panpacific
Password: CMSALPHATECH
Public TransportPan Pacific Perth is very well connected to public transport. Perth’s Esplanade station is 15 minutes walk from the venue. 15 separate buses run along Adelaide Terrace and can connect you with the Esplanade station and the rest of Perth. Please visit www.transperth.wa.gov.au for more information.
ParkingThe hotel’s parking entrance is adjacent to the Pan Pacific on Hill Street. Charges will apply. Alternatively valet parking is available at $50 per day. Please contact the Pan Pacific to arrange valet parking.
Presenters Information
Oral PresentersAll speakers are required to visit the speaker prep room (Hamersley South room) at least 2 hours before their scheduled presentation slot. Please bring your presentation on a USB stick.
It is recommended to keep a copy of your presentation accessible over the internet.
The speaker preparation room will be open:
Monday 4th November ......................... 08.00 – 17.30Tuesday 5th November ........................ 08.15 – 17.45Wednesday 6th November ................... 08.30 – 17.45Thursday 7th November ...................... 08.30 – 12.00
An AV technician will be available to assist in uploading and checking the speaker’s presentations in the speaker prep room. Please note, speakers must check their presentation at least 2 hours before their allocated time. It is the speaker’s responsibility for checking their material with the AV technicians.
Poster PresentersAll posters will be presented in Foyer 3, outside the Grand River Ballroom exhibition area.
The posters will be on display for the entirety of the conference.
There will be a dedicated poster display session on Monday 13.00 – 13.30 for all the even-numbered posters, and Wednesday 13.15 – 13.45 for the odd-numbered posters.
Please see the poster list at the back of this program for titles and authors.

EPSM Perth 2013 — Excellence through Innovation and Professional Development
10
PrizesOral Presentations
EPSM 2013 Committee Oral Presentation PrizeThis prize is awarded to the best non-radiotherapy oral presentation at the EPSM 2013 Conference.Eligibility Criteria: All oral presentations focused on topics other than radiotherapy and nominated for this prize will be eligible. Invited speakers are not eligible.Details of Award: The recipient of the EPSM Oral Presentation Prize will receive a cash prize of $1000 and a certificate.
Radiotherapy Oral Presentation Prize This prize is awarded to the best oral presentation related to radiotherapy at the EPSM 2013 Conference.Eligibility Criteria: All oral presentations focused on radiotherapy (submitted under the ‘Radiotherapy’ theme, and in the judges’ opinion having radiotherapy as a focus) and nominated for this prize will be eligible. Invited speakers are not eligible.Details of Award: The recipient of the Varian prize will receive a cash prize of $1000 and a commemorative plaque.
branch hosts the EPSM Conference the John Black Prize is awarded to the best student presentation at that the EPSM Conference. This prize is named in honour of one of the ACPSEM’s founding members, Dr John Black.Eligibility Criteria: To be eligible for this prize you must be a full-time student delivering an oral presentation and have nominated to be considered for this prize. Student ID is required to be eligible.Details of Award: The recipient of the John Black Student Prize will receive $300 and a certificate.
Poster PresentationsJudging Criteria For Poster PrizesThe recipient of the Award will be decided by nominated referees, who will attend the poster viewing sessions. Assessment of the abstract and poster presentation will be based on consideration of the following areas:1. QUALITY - Strong technical content2. ORIGINALITY - with emphasis on original work as
opposed to reviews3. PRESENTATION – Clarity in conveying the topic.
Good visual presentation (organisation, use of images, graphs and tables).
4. VALUE - Relevance to Medical Physics and value to the wider community
The judges’ decision will be final. Presentation of the Award will be made at the closing ceremony.
Poster Presentation Prize for RadiotherapyThis prize is awarded to the best poster related to radiotherapy at the EPSM 2013 Conference.Eligibility Criteria: All posters focused on topics related to radiotherapy and nominated for this prize will be eligible. Invited speakers are not eligible.Details of Award: The recipient of the CMS Alphatech Poster Prize will receive a cash prize of $500 and a certificate.
Judging Criteria for Oral Presentation AwardsThe recipient of the Award will be decided by nominated judges, who will attend the oral presentations. Assessment of the abstract and oral presentation will be based on consideration of the following areas:
1. QUALITY - Strong technical content2. ORIGINALITY - with emphasis on original work as
opposed to reviews3. CLARITY - Quality of delivery - easily understood4. PRESENTATION - Good audio-visual presentation
(organisation, use of images, graphs and tables). Keeping to time limit.
5. VALUE - Relevance to Medical Physics and value to the wider community
The judges’ decision will be final. Presentation of the Award will be made at the closing ceremony.
EPSM 2013 Committee Poster Presentation PrizeThis prize is awarded to the best non-radiotherapy poster at the EPSM 2013 Conference. Eligibility Criteria: All posters not related to radiotherapy and nominated for this prize will be eligible. Invited speakers are not eligible.Details of Award: The recipient of the EPSM Poster Prize will receive a cash prize of $500 and a certificate.
John Black Student Oral Presentation PrizeThe John Black Prize is normally awarded to the best student presentation at the Western Australian Branch Scientific Meeting, but in years when the
EPSM Perth 2013 — Excellence through Innovation and Professional Development
11
QueensGardens
PerthConcert Hall
Royal PerthHospital
QueensGardens
East PerthCemeteries
WellingtonSquare
WACA Oval
GloucesterPark
Western AustralianCricket Association
St GeorgeCathedral
PerthTown Hall
GovernmentHouse
East Perth
LangleyPark
Perth Mint
Swan BellsCaptain
Cook Cruises
Swan RiverCruise
Adelaide Tce
Hay St
Goderich St
Wellington St
Moore St
Wellington St
Bishop Row
Moore St
Royal StSaunders St
Royal St
Aberdeen St
Goderich St
Bronte St
Bronte St
Wickham StWittenoom St
Nelson Cres
Forrest Ave
Hay St
Hay StTerrace Rd
Riverside Dr
Riverside Dr
Riverside Dr
St Georges Tce
Murray St
Bridge St
Roe St
James St
Adel
aide
Tce
Hora
tio S
t
Benn
ett S
t
Benn
ett S
t
Hill
St
Vict
oria
Ave
Irwin
St
Pier
St
Pier
St
Nash
St
Stirl
ing
St
Barra
ck S
t
Hill
St
Lord
St
Lord
St
Plai
n St
Plai
n St
Swan Rive
r
Adelaide Tce
Causeway
Rivers
ide
Dr
Causeway
Causeway
Victoria Sq
Nelson Ave
Witteno om
St
Wat
erlo
o Cr
es
Trinity Ave
Nor
bert
St
Clot
ilde
St
Lim
e St
Leah
y Wal
k
Glyde St
Clai
sebr
ook
Rd
Hill S
t
M a ggs
Ln
Plai
n St
Brem
er P
rom
Wittenoom St
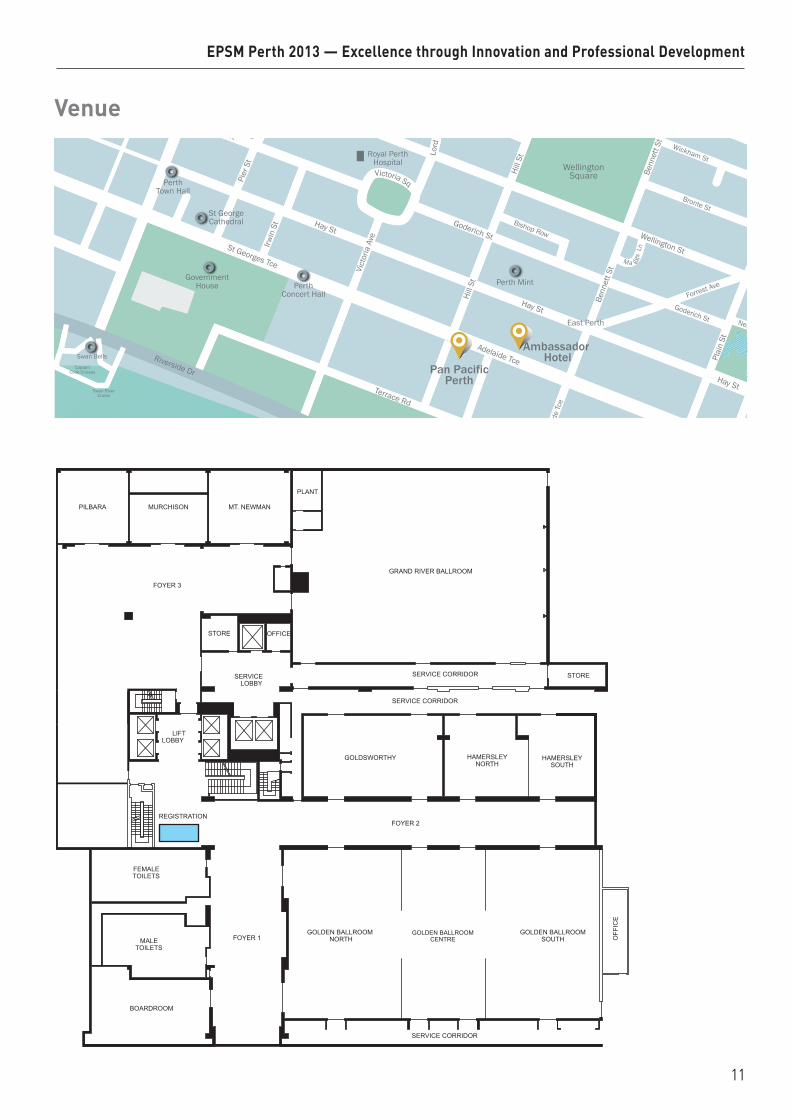
Pan PacificPerth
Ambassador Hotel
GOLDEN BALLROOMCENTRE
GOLDEN BALLROOMSOUTH
GOLDEN BALLROOMNORTH
FEMALETOILETS
MALETOILETS
BOARDROOM
SERVICE CORRIDOR
FOYER 2REGISTRATION
HAMERSLEYNORTH
HAMERSLEYSOUTH
SERVICE CORRIDOR
OFF
ICE
FOYER 1
LIFTLOBBY
SERVICELOBBY
SERVICE CORRIDOR
PLANT
GRAND RIVER BALLROOM
STORE
MT. NEWMANMURCHISONPILBARA
FOYER 3
STORE
OFFICE
GOLDSWORTHY
Venue

EPSM Perth 2013 — Excellence through Innovation and Professional Development
12
Social Functions
Welcome Reception Venue: Pan Pacific Hotel – Grand River Ballroom, 207 Adelaide Terrace
Date: Sunday 3rd November 2013
Time: 6.00pm – 8.00pm
Cost: Included in full & student registration
Dress: Smart casual
The perfect opportunity to enjoy canapés and fine wine, renew old friendships and make new acquaintances, as we welcome you to Perth and the start of the 2013 EPSM Conference.
The Welcome Reception is sponsored by Elekta.
Melbourne Cup Luncheon
Venue: Pan Pacific Hotel – Grand River Ballroom, 207 Adelaide Terrace
Date: Tuesday 5th November 2013
Time: 11.30am – 1.00pm
Cost: Included in full, student and Tuesday day registration
Dress: Smart Casual
The Melbourne Cup is the richest handicap race held in Australia, and the prize money and trophies make it among the richest horseraces in the world. This year, the EPSM Committee will be hosting a sumptuous Melbourne Cup Luncheon for conference delegates at the Pan Pacific. This is also the perfect opportunity to network with peers and also watch the ‘race that stops the nation’ on TV.
The Melbourne Cup Luncheon is sponsored by Brainlab.
Conference Dinner
Venue: Frasers Restaurant, Fraser Avenue, Kings Park
Date: Wednesday 6th November 2013
Time: 7.00pm - 11.00pm
Cost: Included for Full Registrations
Dress: Smart Casual
Join us for a fabulous night with friends and colleagues at Perth’s recently renewed Fraser’s Restaurant with magnificent views overlooking Perth’s Swan River and city skyline. Enjoy a delicious menu with a selection of beers and wines before you dance the night away. Fraser’s Restaurant is located in Perth’s highly visited King’s Park. Transport will be leaving the Pan Pacific at 6.30pm and return transportation will be available at the end of the night to the CBD. Approximate travel time 5-10 minutes.
EPSM Perth 2013 — Excellence through Innovation and Professional Development
13
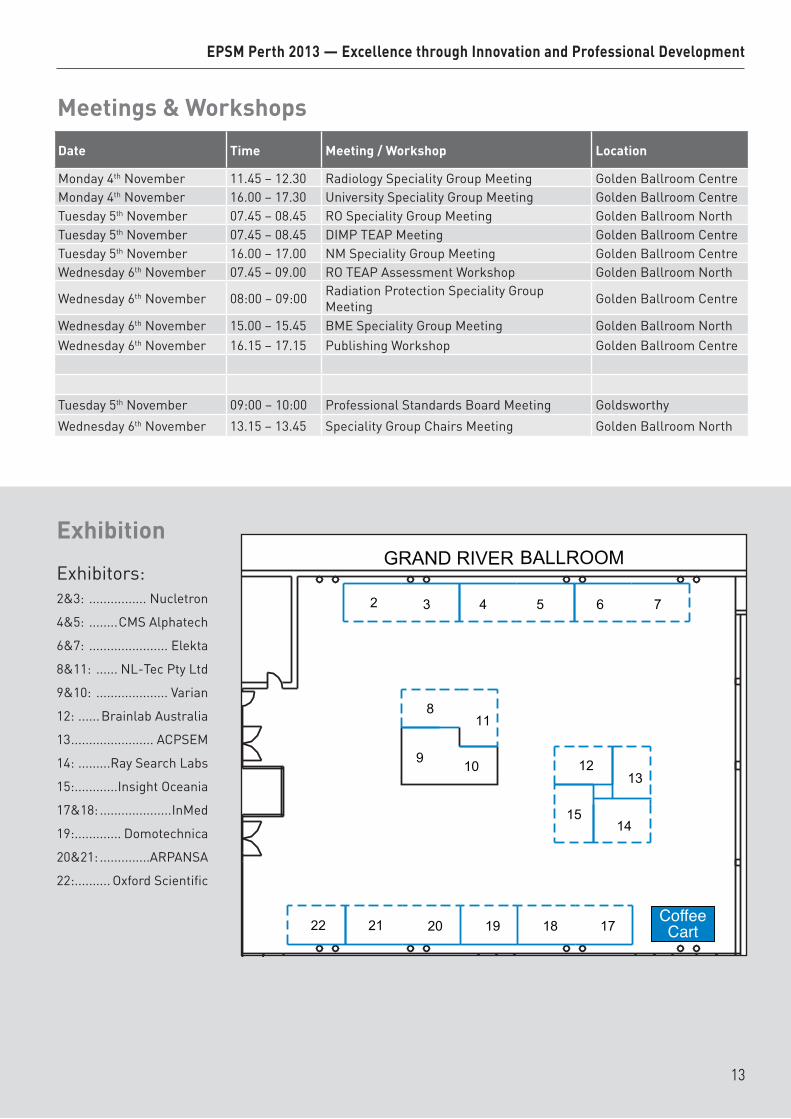
Exhibition
Exhibitors:2&3: ................ Nucletron
4&5: ........CMS Alphatech
6&7: ...................... Elekta
8&11: ...... NL-Tec Pty Ltd
9&10: .................... Varian
12: ......Brainlab Australia
13 ....................... ACPSEM
14: .........Ray Search Labs
15: ............Insight Oceania
17&18: ....................InMed
19: ............. Domotechnica
20&21: ..............ARPANSA
22: .......... Oxford Scientific
Coffee Cart
Meetings & Workshops
Date Time Meeting / Workshop Location
Monday 4th November 11.45 – 12.30 Radiology Speciality Group Meeting Golden Ballroom CentreMonday 4th November 16.00 – 17.30 University Speciality Group Meeting Golden Ballroom CentreTuesday 5th November 07.45 – 08.45 RO Speciality Group Meeting Golden Ballroom NorthTuesday 5th November 07.45 – 08.45 DIMP TEAP Meeting Golden Ballroom CentreTuesday 5th November 16.00 – 17.00 NM Speciality Group Meeting Golden Ballroom CentreWednesday 6th November 07.45 – 09.00 RO TEAP Assessment Workshop Golden Ballroom North
Wednesday 6th November 08:00 – 09:00 Radiation Protection Speciality Group Meeting Golden Ballroom Centre
Wednesday 6th November 15.00 – 15.45 BME Speciality Group Meeting Golden Ballroom NorthWednesday 6th November 16.15 – 17.15 Publishing Workshop Golden Ballroom Centre
Tuesday 5th November 09:00 – 10:00 Professional Standards Board Meeting Goldsworthy
Wednesday 6th November 13.15 – 13.45 Speciality Group Chairs Meeting Golden Ballroom North

SUNDAY 3rd NOVEMBER 2013 - CONFERENCE WELCOME RECEPTION16.00 – 18.00 REGISTRATION (Foyer 2, Functions & Events Floor)
18.00 – 20:00 WELCOME RECEPTION SPONSORED BY ELEKTA (Grand River Ballroom)
MONDAY 4th NOVEMBER 2013 - DAY ONE8:00 REGISTRATION (Foyer 2, Functions & Events Floor)
8.30OPENING CEREMONYGolden Ballroom
Conference Welcome from Janette Atkinson (Conference Convenor)
Welcome to Country
Opening Address – Prof. Lyn Beazley (Chief Scientist of Western Australia)9:15
THE CHALLENGES OF RECONCILING LOW DOSE RADIOBIOLOGY WITH RADIATION PROTECTIONP. Sykes
9:30
9:45
10:00 MORNING TEA (Grand River Ballroom)
Golden Ballroom SouthChair: A. Haworth
Golden Ballroom Centre
Chair: M. Caon
Golden Ballroom North
Chair: P. Lanzon
10:30
STEREOTACTIC ABLATIVE BODY RADIOTHERAPY (SABR): COMPARING PHOTON AND PROTON TECHNIQUES
J. Seco
CT QUALITY ASSURANCE: EXPERIENCE AND TRENDS IN THE UNITED STATES
J. Kofler
FLATTENING FILTER FREE PHOTO BEAMS - DOSIMETRIC CHARACTERISTICS AND
CLINICAL IMPLICATIONS D. Georg
10:45
11:00DETERMINING CURRENT WORKFORCE
PATTERNS IN RADIATION ONCOLOGY IN WA G. Halkett
RADIATION EYE DOSE MEASUREMENTS FOR STAFF WITHIN
THE CATH LAB D. Hadaya
11:15 REAL-TIME PERSONAL MONITORING IN INTERVENTIONAL LABORATORIES
L. Biffin
USING EPIDS FOR ROUTINE LINAC QA P. Rowshanfarzad
11:30
A COMPARISON OF MEASUREMENT ACCURACY OF 4DCT VS. IN-ROOM
STEREOSCOPIC KV-IMAGER FOR IMPLANTED FIDUCIAL MARKERS IN LUNG AND LIVER
TUMOURS C. Wen
INTERNATIONAL BEST PRACTICE FOR RADIATION PROTECTION OF THE
PATIENT IN MEDICAL IMAGING IN AN AUSTRALIAN CONTEXT
A. Wallace
11:45
IMAGE GUIDANCE FOR EXTRACRANIAL STEREOTACTIC RADIOTHERAPY OF LUNG
CANCERS USING ENDOBRONCHIALLY IMPLANTED FIDUCIAL MARKERS
N. Hardcastle
RADIOLOGY SPECIALITY GROUP MEETING
ARPANSA MEGAVOLTAGE ELECTRON BEAM CALIBRATION SERVICE
C. Oliver
12:00
DEVELOPMENT OF A SOFTWARE TOOL TO ASSESS RESPIRATORY MOTION TRACES FOR
MOTION COMPENSATION STRATEGIES IN RADIOTHERAPY
M. Whitaker
THE AUSTRLIAN CLINCIAL DOSIMETERY
SERVICE AT THREE YEARS. J. Lehmann
EPSM Perth 2013 — Excellence through Innovation and Professional Development
14
12:15
A COMPARISON OF 3D ULTRASOUND AND IMPLANTED GOLD MARKER SEEDS FOR
ONLINE PROSTATE IGRT J. Lane
VALIDATION OF THE OCTAVIUS 4D DOSIMETRIC SYSTEM FOR VMAT
VERIFICATION S. Arumugam
12:30 LUNCH BREAK (Grand River Ballroom)
13:00 POSTER VIEWING SESSION I (Poster Hall)
Golden Ballroom SouthChair: E. Claridge Mackonis
Golden Ballroom Centre
Chair: M. House/R. Franich
Golden Ballroom North
Chair: R. Smith
13:30
TREATMENT AND PLANNING QUALITY ASSURANCE IN THE CONTEXT OF A
RADIOTHERAPY TRIAL: ARE THE RESULTS REFLECTED IN TOXICITY OUTCOMES?
M. Ebert
REFLECTIVE PRACTICE TO ASSESS THE IMPLEMENTATION OF A RADIATION
THERAPY CLINICAL ORIENTATION PROGRAM FOR TRAINEE RADIATION
ONCOLOGY MEDICAL PHYSICISTS M. West
EYE PLAQUE DOSE VERIFICATION USING SOLID STATE DETECTORS
T. Jarema
13:45
MEDIASTINAL RADIOTHERAPY FOR LYMPHOMA: BREAST DOSE REDUCTION BY
BREAST REPOSITIONING P. Lonski
USING 2D AND FULLY IMMERSIVE 3D VIRTUAL REALITY LINACS TO
ENHANCE MEDICAL PHYSICS TEACHING. C. Roenn
A PROCESS FOR ADEQUATELY COMBINING HIGH-DOSE-RATE BRACHYTHERAPY AND EXTERNAL BEAM RADIOTHERAPY DATA
USING DEFORMABLE IMAGE REGISTRATION C. Moulton
14:00
RAPID LEARNING IN PRACTICE: AUSTRALIAN VALIDATION OF A EUROPEAN PREDICTION
MODEL FOR H&N CANCER. M. Bailey
ACPSEM MEDICAL PHYSICS CERTIFICATION - A REPORT ON PROGRESS TO INTERNATIONAL
RECOGNITION L. Oliver
DOSE AND SPECTRAL DISTRIBUTION OF NEUTRON INDUCED GAMMA RADIATION
IN MEDICAL LINEAR ACCELERATORS S. Keehan
14:15
METHODS OF DERIVATION OF CUTPOINTS FOR GI TOXICITY: ANALYSIS OF THE RADAR
PROSTATE RADIOTHERAPY TRIAL M. Ebert
STATUS OF THE ACPSEM RADIATION ONCOLOGY MEDICAL PHYSICS
TRAINING EDUCATION AND ASSESSMENT PROGRAM
G. Warr
AUTOMATIC EPID-BASED FIDUCIAL MARKER DETECTION FOR TIME-RESOLVED TUMOUR MOTION ANALYSIS IN DYNAMIC-
IMRT AND VMAT DELIVERIES T. Fuangrod
14:30
A NATIONAL VMAT AUDIT: CREDENTIALING SITES TO USE VMAT IN MULTI-CENTRE
CLINICAL TRIALS W. Hackworth
ACPSEM E-LEARNING SYSTEM – INNOVATION IN EDUCATION AND
PROFESSIONAL DEVELOPMENT FOR MEDICAL PHYSICISTS
A. Perkins
3-DIMENSIONAL MODELLING OF THE EXTERNAL EAR: SOLUTION TO IMPROVE OUTCOMES IN EAR RECONSTRUCTION
SURGERY P. Liu
14:45
DESIGN AND METHODOLOGY OF A PROSPECTIVE TRIAL TO IMPROVE THE
UNDERSTANDING OF KIDNEY RADIATION DOSE RESPONSE J. Lopez Gaitan
THE ACADEMIC MEDICAL PHYSICS UNIVERSITY NETWORK: INITIAL
ACTIVITY AND PROGRESS R. Franich
NOVEL BIOMIMETIC STENT-GRAFT DESIGN FOR AORTIC ANEURYSM TREATMENT
C. Singh
15:00
A 3-DIMENSIONAL TREATMENT PLANNING TEST FOR CREDENTIALING VMAT IN CLINICAL
TRIALS D. Wilkinson
E-LEARNING FOR CPD H. Round
SEMI-AUTOMATIC QUALITY ASSURANCE (SAQA) MATLAB SCRIPT FOR ACR MRI
PHANTOM J. Sun
15:15
DATA MINING FOR PREDICTION OF OUTCOMES IN LUNG CANCER PATIENTS
TREATED WITH RADIOTHERAPY. M. Bailey
ASSESSING WHOLE BREAST INTER-OBSERVER DELINEATION UNCERTAINTY IN
SPHERICAL COORDINATES L. Bell
15:30 AFTERNOON TEA (Grand River Ballroom)
Golden Ballroom SouthChair: N. Suchowerska
Golden Ballroom Centre Golden Ballroom North
Chair: D. Butler
16:00
FIRST DEMONSTRATION OF KILOVOLTAGE INTRAFRACTION MONITORING FOR GATED
PROSTATE RAPIDARC J. Booth
UNIVERSITY SPECIALITY GROUP MEETING
PERFORMANCE OF ARPANSA REFERENCE CHAMBERS FOR DIRECT CALIBRATION IN
LINAC PHOTONS G. Ramanathan
EPSM Perth 2013 — Excellence through Innovation and Professional Development
15

16:15
CAN PRE TREATMENT BLADDER ULTRASOUND IMPROVE ACCURACY OF PROSTATE BED
RADIOTHERAPY? A. Haworth
ARPANSA CO-60 TELETHERAPY SOURCE: 3
YEARS AFTER SOURCE REPLACEMENT C. Oliver
16:30
ESTABLISHING TUMOUR TRACKING ACCURACY IN FREE-BREATHING RESPIRATORY
GATED SBRT OF LUNG AND LIVER CANCERS C. Wen
COMMISSIONING OF A NEW COMMERCIAL PLASTIC SCINTILLATOR SYSTEM FOR
RADIOTHERAPY J. Morales
16:45QUANTIFYING CHANGE IN LUNG PERFUSION
OVER THE COURSE OF RADIOTHERAPY N. Hardcastle
EVALUATION OF THE IMPACT OF TOMOTHERAPY PLANNING PARAMETERS ON PLAN QUALITY FOR NASOPHARYNX
CANCERSS. Deshpande
17:00
DEVELOPMENT AND VALIDATION OF AN IN-HOUSE SEED TRACKING SOFTWARE TOOL FOR ONLINE TARGET POSITIONAL
VERIFICATION S. Arumugam
17:15
HOW DO DIFFERENT IMAGE GUIDED RADIOTHERAPY SYSTEMS COMPARE?
A QUANTITATIVE STUDY FOR PROSTATE TREATMENTS USING AN ANTHROPOMORPHIC PHANTOM
J. Hatton
17:30RISKS AND BENEFITS OF IMAGING IN BREAST
RADIOTHERAPY D. Basaula
TUESDAY 5th NOVEMBER 2013 - DAY TWO7:30 DIMP TEAP MEETING (Golden Ballroom Centre)
7:45 RO SPECIALITY GROUP MEETING (Golden Ballroom North)
8:15 REGISTRATION (Foyer 2, Functions & Events Floor, Pan Pacific)
Golden Ballroom SouthChair: M. Whittaker
Golden Ballroom Centre
Chair: J. Lane
Golden Ballroom North
Chair: N. Hardcastle
8:45
GETTING READY FOR ION BEAM THERAPY IN AUSTRIA - BUILDING UP RESEARCH IN
PARALLEL WITH A FACILITY: THE MUW EXPERIENCE
D. Georg
PROGRESS TOWARDS MRI-ALONE RADIATION THERAPY TREATMENT
PLANNING J. Dowling
TEMPORAL DNA METHYLATION RESPONSES IN DNA REPEAT ELEMENTS AFTER LOW OR
HIGH DOSES OF X-RAYS P. Sykes
9:00
9:15
MEASURING PERFORMANCE OF DEFORMABLE IMAGE REGISTRATION
IN RADIOTHERAPY APPLICATIONS AND CONSIDERATIONS FOR CLINICAL
IMPLEMENTATION J. Sykes
COMPARISON OF THE PERFORMANCE OF VARIOUS CT RESPIRATORY MONITORING
DEVICES J. Moorrees
9:30
SHIFT IN ABSORBED DOSE WHEN ADOPTING MONTE CARLO KQ FACTORS
OR DIRECT CALIBRATION COEFFICIENTS IN TRS-398 D. Butler
HOW FAST IS FLATTENING FILTER FREE IN PRACTICE? VMAT FFF BEAMS FOR HYPO–
AND CONVENTIONAL FRACTIONATION J. Barber
EPSM Perth 2013 — Excellence through Innovation and Professional Development
16
9:45SURFACE DOSIMETRY FOR VERY SMALL
X-RAY J. Morales
BRACHYTHERAPY IN PAPUA NEW GUINEA
S. Downes
CALIBRATION OF TLD700:LIF FOR CLINICAL RADIOTHERAPY BEAM MODALITIES & VERIFICATION OF A HIGH DOSE RATE
BRACHYTHERAPY TREATMENT PLANNING SYSTEM J. Rijken
10:00 MORNING TEA (Grand River Ballroom)
Golden Ballroom SouthChair: J. Kenny
Golden Ballroom Centre
Chair: R. Day
Golden Ballroom North
Chair: J. Atkinson
10:30A NATIONAL DOSIMETRY AUDIT OF VMAT
AND TOMOTHERAPY IN THE UK C. Clark
MEDICAL DEVICE INNOVATION – WHY IS IT SO HARD?
K. Reynolds
A MICROSCOPE IN A NEEDLE - NEW TECHNIQUES TO VIEW DISEASE
R. McLaughlin
10:45
11:00
THE INFLUENCE OF HIGH MODULATION ON DELIVERY ACCURACY FOR VMAT SABR
BEAMS J. Barber
AN UNOBTRUSIVE SYSTEM FOR MONITORING WHEELCHAIR BATTERY
USE K. Pasumarthy
A 256-CHANNEL RETINAL IMPLANT H. Meffin
11:15
COMMISSIONING A DMLC TRACKING SYSTEM FOR CLINICAL PROSTATE VMAT
TREATMENTS J. Booth
MEASURING TKR ALIGNMENT WITH THE PERTH CT PROTOCOL: INFLUENCE OF FEMORAL AND TIBIAL ROTATION
AT 1 YEAR POST SURGERY K. Sloan
11:30 MELBOURNE CUP LUNCH BREAK SPONSORED BY BRAINLAB (Grand River Ballroom)
Golden Ballroom SouthChair: P. Metcalf
Golden Ballroom Centre
Chair: S. Eberl
Golden Ballroom North
Chair: S. Woodings
13:00
CALIBRATION OF TREATMENT TIME INTENSITY MODULATED EPID IMAGES FOR
ANATOMICAL IMAGING M. Al-roumi
MOLECULAR IMAGING - OPPORTUNITIES AND OBSTACLES
R. Francis
MRI FOR RADIATION TREATMENT PLANNING G. Liney
13:15
AUTOMATED ANALYSIS OF DYNALOG FILES FOR ADVANCED RADIOTHERAPY
TREATMENT VERIFICATION J. Hughes
13:30
COMPARISON OF BLADDER DOSIMETRIC INDICES FOR MODELLING THE INCIDENCE
OF ACUTE URINARY TOXICITY: AN ANALYSIS OF DATA FROM THE RADAR RADIOTHERAPY
TRIAL N. Yahya
BETA AMYLOID IMAGING FOR THE EARLY DIAGNOSIS OF ALZEIMER’S
DISEASES. Rainey-Smith
VALIDATING A MONTE CARLO LINAC MODEL: HOW GOOD IS GOOD?
T. Wright
13:45A SIMPLE METHOD TO PREDICT 2D EPID
TRANSIT DOSE Y. Tan
MATHEMATICAL MODEL DEVELOPMENT FOR EVALUATION OF CURRENT CLINICAL TARGET VOLUME (CTV) DEFINITION OF
GLIOBLASTOMA USING GEANT4 F. Moghaddasi
14:00A PRACTICAL AND THEORETICAL
DEFINITION OF ‘SMALL FIELD’ P. Charles
ACCELERATOR PRODUCTION OF RADIOISOTOPES – CHALLENGES AND
OPPORTUNITIES S. Smith
VERIFICATION OF RADIOTHERAPY TREATMENTS INVOLVING THE ENHANCED
DYNAMIC WEDGE: EPID MEASUREMENT AND MONTE-CARLO SIMULATION
A. Fielding
14:15
A FRAME-BASED METHOD TO CORRECT EPID ENERGY RESPONCE FOR PORTAL
DOSIMTERY B. Zwan
EFFECTS OF MAXIMUM MLC SPEED AND MAXIMUM DOSE RATE CONSTRAINTS ON
VMAT PLAN QUALITY, EFFICIENCY AND ACCURACY
N. Campbell
EPSM Perth 2013 — Excellence through Innovation and Professional Development
17

14:30
MONTE CARO SIMULATIONS OF SMALL FIELD OUTPUT FACTORS IN SOLID
PHANTOMS S. Smith
A DICOM APPLICATION FOR MEDICAL PHYSICIST
S. Seneviratne
PROSTATE RADIOTHERAPY TREATMENT PLAN QUALITY: EFFECTS OF HIP PROSTHESES
T. Kairn
14:45
DEFORMABLE IMAGE REGISTRATION BASED DOSE ACCUMULATION METHODS FOR
KIDNEY ARC THERAPY J. Supple
LOCAL EXPERIENCE OF ESTABLISHING QUALITY CONTROL PROGRAMME
FOR INSTRUMENTATIONS IN NUCLEAR MEDICINE
J. Tse
END-TO-END TESTING FOR CLINICAL IMPLEMENTATION OF PROSTATE MRI-
SIMULATION J. Sun
15:00PHOTONUCLEAR ACTIVATION OF
PROSTHETIC HIPS IN RADIOTHERAPY S. Keehan
IMAGING YTTRIUM-90 BREMSSTRAHLUNG WITH SPECT
A. Slattery
BRAINLAB IPLAN TREATMENT PLANNING SYSTEM FOR ELEKTA AXESSE
K. Biggerstaff
15:15
AN ALTERNATIVE MATERIAL DEFINITION SCHEME FOR MONTE CARLO
RADIOTHERAPY DOSE CALCULATION J. Zhu
HILSON PERFUSION INDEX FOR RENAL TRANSPLANT
S. Seneviratne
VERIFICATION OF COUCH MODELLING IN TOMOTHERAPY PLANNING
S. Deshpande
15:30 AFTERNOON TEA (Grand River Ballroom)
Golden Ballroom SouthChair: J. Booth
Golden Ballroom CentreGolden Ballroom North
Chair: Y. Sivashunmugam
16:00A DIODE FOR CORRECTION-LESS SMALL
FIELD OUTPUT FACTOR MEASUREMENTS P. Charles
NM SPECIALITY GROUP MEETING
QUANTITATIVE ANALYSIS OF VARIOUS SINGLE SEQUENCE MR IMAGING PLANES FOR HDR
BRACHYTHERAPY TREATMENT PLANNING OF CERVIX CANCER
C. Dempsey
16:15
A METHOD FOR JAW DETECTION AND TRACKING DURING IMRT AND VMAT
TREATMENT DELIVERY USING CINE-EPID T. Fuangrod
PATIENT SPECIFIC VERIFICATION OF ROPES I-125 EYE PLAQUE WITH TLD-100 MICRO-
CUBES K. Kandasamy
16:30
EPID-BASED MEASUREMENT OF MLC TRAJECTORIES FOR DOSE
RECONSTRUCTION IN RIGIDLY MOVING TARGETS B. Zwan
THE CURRENT STATE OF AUSTRALASIAN MRI-BASED TREATMENT PLANNING FOR
HDR BRACHYTHERAPY OF CERVIX CANCER AND COMPARISON WITH INTERNATIONAL
CLINICAL DATA C. Dempsey
16:45
IN VIVO MEASUREMENTS OF THE RECTAL WALL DURING HELICAL TOMOTHERAPY
USING MOSKIN DETECTORS S. Handel
BOOST FOCAL THERAPY FOR PROSTATE CANCER USING I-125, BIOLOGICAL IMAGING
AND RADIOBIOLOGICAL INDICES A. Haworth
17:00
ANALYTICAL MODELLING AND SIMULATION OF A DOUBLE CONE PINHOLE FOR
REAL TIME IN-BODY IMAGING OF HDR BRACHYTHERAPY SOURCE
S. Alnaghy
THE EFFECT OF PROSTATIC CALCIFICATIONS ON LOW DOSE RATE BRACHYTHERAPY DOSIMETRY: A MONTE CARLO STUDY
D. Cutajar
17:15
CHARACTERISATION OF A HIGH SPATIAL RESOLUTION MULTI-STRIP DETECTOR
(SERIAL DOSE MAGNIFYING GLASS) FOR DOSE PROFILING
M. Newall
COMMISSIONING OF A DEDICATED MRI SIMULATOR IN A RADIOTHERAPY
DEPARTMENTG. Liney
17:30
QUANTIFYING PREDICTED DOSIMETRIC CHANGES WHEN RANDOM ERRORS ARE INTRODUCED TO IMRT AND VMAT LINAC
DELIVERY C. Pagulayan
PLANCHECKER: A SOFTWARE SYSTEM FOR COMPREHENSIVE CHECKING OF
RADIOTHERAPY PLANSS. Arumgam
18:00 ACPSEM AGM (Golden Ballroom Centre)
EPSM Perth 2013 — Excellence through Innovation and Professional Development
18

WEDNESDAY 6th NOVEMBER 2013 - DAY THREE7:45 RO TEAP ASSESSMENT WORKSHOP (Golden Ballroom North)
8:00 RADIATION PROTECTION SPECIALITY GROUP MEETING (Golden Ballroom Centre)
8:30 REGISTRATION (Foyer 2, Functions & Events Floor, Pan Pacific)
Golden Ballroom SouthChair: M Bailey
Golden Ballroom Centre
Chair: C. Storm
Golden Ballroom North
Chair: C. Dempsey
9:00CURRENT STATUS OF IMRT VERIFICATION
IN THE UK C. Clark
CT DOSE: NEW TECHNOLOGIES AND NEW PERSPECTIVES
J. Kofler
ASSESSING OCCUPATIONAL EXPOSURES TO PHYSICAL AGENTS
L. Fritschi
9:15
9:30
FIRST EXPERIMENT OF ADAPTATION TO INTRAFRACTION TUMOUR DEFORMATION
USING A MULTI-LEAF COLLIMATOR Y. Ge
THE AUSTRALIAN DIAGNOSTIC REFERENCE LEVEL SERVICE - WHAT
WE HAVE LEARNT SO FAR AND HOW TO USE DRLS NOW WE HAVE THEM
A. Hayton
CHARACTERISATION OF SMALL-FIELD STEREOTACTIC RADIOSURGERY BEAMS WITH
MODERN DETECTORS. M. Tyler
9:45 ISOCENTRE MOVEMENT OF A NOVALIS TX
AND ITS IMPLICATIONS E. Claridge Mackonis
10:00IMAGING DOSE OPTIMISATION IN
RADIOTHERAPY J. Morton
RADIATION DOSE SURVEY OF NEONATES AT THE CANBERRA
HOSPITAL D. Hadaya
THE IMPORTANCE OF ACCURATE BEAM DATA MEASUREMENT FOR SRT/SRS TREATMENT
PLANNING T. Kairn
10:15 MORNING TEA (Grand River Ballroom)
Golden Ballroom SouthChair: K Harrison
Golden Ballroom Centre
Chair: A. Wallace
Golden Ballroom North
Chair: C. Lee
10:45
CURRENT STATUS OF PRODUCTION AND APPLICATION OF ALPHA EMITTING
RADIOISOTOPES S. Smith
DOSE COMPARISON OF X-RAY AND LOW DOSE CT PROCEDURES
C. Leatherday
FLATTENING FILTER FREE BEAMS FOR SBRT. C. Hansen
11:00
THE REDUCTION OF DOSE TO BREAST TISSUE DURING MULTI-SLICE CT EXAMINATIONS USING BISMUTH BREAST SHIELDS, MANUAL MA
REDUCTION AND DOSE MODULATION TECHNOLOGIES
C. Storm
A STUDY OF DUAL VACUUM IMMOBILISATION TO MINIMISE KIDNEY MOTION
M. Whitaker
11:15
CLINICAL PREPARATION FOR SCANNED PROTON AND CARBON ION THERAPY: DOSIMETRY OF TARGETING
UNCERTAINTIES. F. Ammazzalorso
DAILY CT NOISE AND UNIFORMITY QUALITY CONTROL PROGRAM
A. Perdomo
IN-HOUSE IMRT TREATMENT PLAN VERIFICATION AT THE ILLAWARRA CANCER
CARE CENTRE: A MONTE CARLO/DICOM BASED SYSTEM
B. Oborn
11:30
THE USE OF A NOVEL TRANSMISSION DETECTOR TO PERFORM IN-VIVO
MEASUREMENTS, WITHOUT THE NEED FOR ANY PREPARATION TIME ON THE LINAC
D. Johnson
EXPERIENCES DURING ACCEPTANCE TESTING OF A CT MACHINE - DOSE
DETERMINATION USING AAPM TG111 USING COMMON NON-TRADIATIONAL RADIOTHERAPY
EQUIPMENT L. Munoz
EPSM Perth 2013 — Excellence through Innovation and Professional Development
19
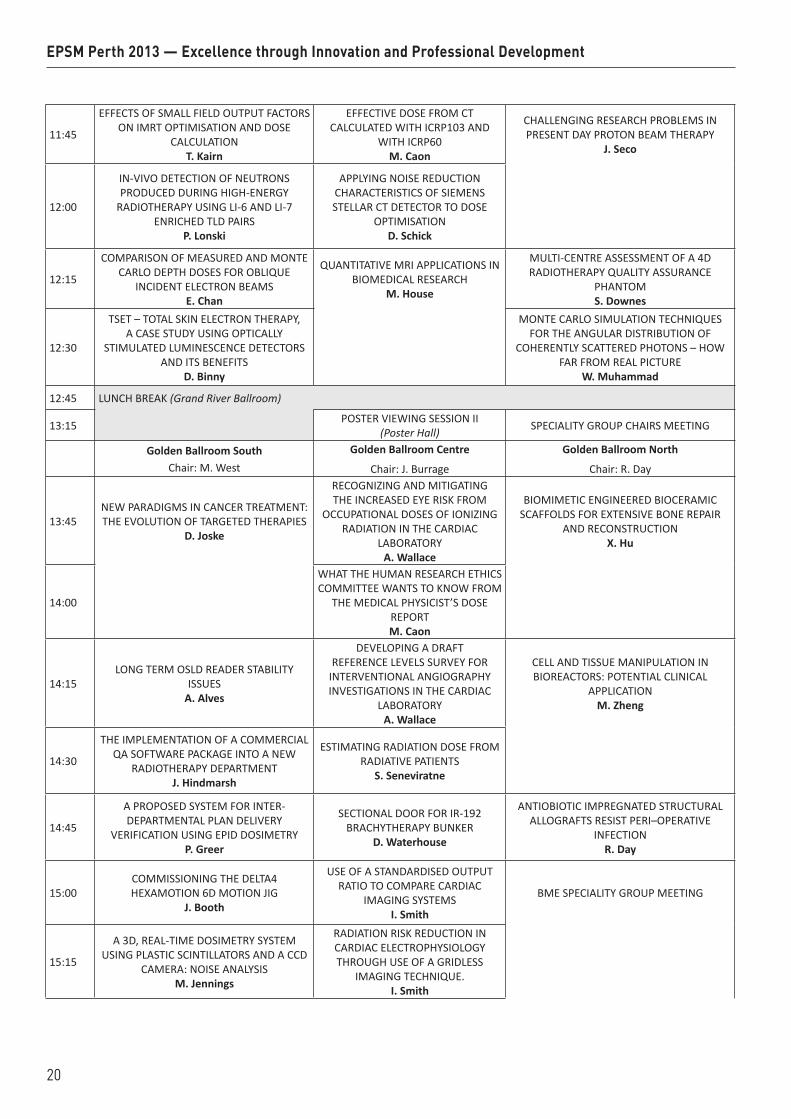
11:45
EFFECTS OF SMALL FIELD OUTPUT FACTORS ON IMRT OPTIMISATION AND DOSE
CALCULATION T. Kairn
EFFECTIVE DOSE FROM CT CALCULATED WITH ICRP103 AND
WITH ICRP60 M. Caon
CHALLENGING RESEARCH PROBLEMS IN PRESENT DAY PROTON BEAM THERAPY
J. Seco
12:00
IN-VIVO DETECTION OF NEUTRONS PRODUCED DURING HIGH-ENERGY
RADIOTHERAPY USING LI-6 AND LI-7 ENRICHED TLD PAIRS
P. Lonski
APPLYING NOISE REDUCTION CHARACTERISTICS OF SIEMENS STELLAR CT DETECTOR TO DOSE
OPTIMISATION D. Schick
12:15
COMPARISON OF MEASURED AND MONTE CARLO DEPTH DOSES FOR OBLIQUE
INCIDENT ELECTRON BEAMS E. Chan
QUANTITATIVE MRI APPLICATIONS IN BIOMEDICAL RESEARCH
M. House
MULTI-CENTRE ASSESSMENT OF A 4D RADIOTHERAPY QUALITY ASSURANCE
PHANTOM S. Downes
12:30
TSET – TOTAL SKIN ELECTRON THERAPY, A CASE STUDY USING OPTICALLY
STIMULATED LUMINESCENCE DETECTORS AND ITS BENEFITS
D. Binny
MONTE CARLO SIMULATION TECHNIQUES FOR THE ANGULAR DISTRIBUTION OF
COHERENTLY SCATTERED PHOTONS – HOW FAR FROM REAL PICTURE
W. Muhammad
12:45 LUNCH BREAK (Grand River Ballroom)
13:15 POSTER VIEWING SESSION II (Poster Hall) SPECIALITY GROUP CHAIRS MEETING
Golden Ballroom SouthChair: M. West
Golden Ballroom Centre
Chair: J. Burrage
Golden Ballroom North
Chair: R. Day
13:45NEW PARADIGMS IN CANCER TREATMENT: THE EVOLUTION OF TARGETED THERAPIES
D. Joske
RECOGNIZING AND MITIGATING THE INCREASED EYE RISK FROM
OCCUPATIONAL DOSES OF IONIZING RADIATION IN THE CARDIAC
LABORATORY A. Wallace
BIOMIMETIC ENGINEERED BIOCERAMIC SCAFFOLDS FOR EXTENSIVE BONE REPAIR
AND RECONSTRUCTION X. Hu
14:00
WHAT THE HUMAN RESEARCH ETHICS COMMITTEE WANTS TO KNOW FROM
THE MEDICAL PHYSICIST’S DOSE REPORT M. Caon
14:15LONG TERM OSLD READER STABILITY
ISSUES A. Alves
DEVELOPING A DRAFT REFERENCE LEVELS SURVEY FOR
INTERVENTIONAL ANGIOGRAPHY INVESTIGATIONS IN THE CARDIAC
LABORATORY A. Wallace
CELL AND TISSUE MANIPULATION IN BIOREACTORS: POTENTIAL CLINICAL
APPLICATION M. Zheng
14:30
THE IMPLEMENTATION OF A COMMERCIAL QA SOFTWARE PACKAGE INTO A NEW
RADIOTHERAPY DEPARTMENT J. Hindmarsh
ESTIMATING RADIATION DOSE FROM RADIATIVE PATIENTS
S. Seneviratne
14:45
A PROPOSED SYSTEM FOR INTER-DEPARTMENTAL PLAN DELIVERY
VERIFICATION USING EPID DOSIMETRY P. Greer
SECTIONAL DOOR FOR IR-192 BRACHYTHERAPY BUNKER
D. Waterhouse
ANTIOBIOTIC IMPREGNATED STRUCTURAL ALLOGRAFTS RESIST PERI–OPERATIVE
INFECTION R. Day
15:00COMMISSIONING THE DELTA4 HEXAMOTION 6D MOTION JIG
J. Booth
USE OF A STANDARDISED OUTPUT RATIO TO COMPARE CARDIAC
IMAGING SYSTEMS I. Smith
BME SPECIALITY GROUP MEETING
15:15
A 3D, REAL-TIME DOSIMETRY SYSTEM USING PLASTIC SCINTILLATORS AND A CCD
CAMERA: NOISE ANALYSIS M. Jennings
RADIATION RISK REDUCTION IN CARDIAC ELECTROPHYSIOLOGY THROUGH USE OF A GRIDLESS
IMAGING TECHNIQUE. I. Smith
EPSM Perth 2013 — Excellence through Innovation and Professional Development
20
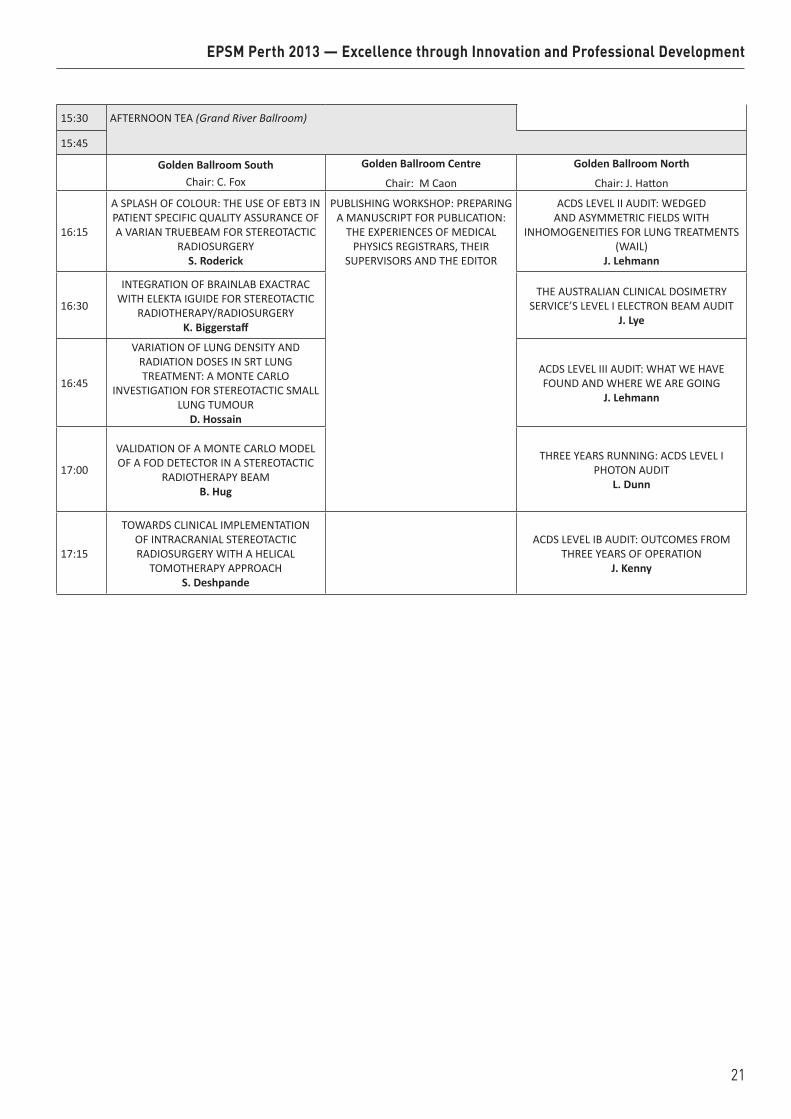
15:30 AFTERNOON TEA (Grand River Ballroom)
15:45
Golden Ballroom SouthChair: C. Fox
Golden Ballroom Centre
Chair: M Caon
Golden Ballroom North
Chair: J. Hatton
16:15
A SPLASH OF COLOUR: THE USE OF EBT3 IN PATIENT SPECIFIC QUALITY ASSURANCE OF A VARIAN TRUEBEAM FOR STEREOTACTIC
RADIOSURGERY S. Roderick
PUBLISHING WORKSHOP: PREPARING A MANUSCRIPT FOR PUBLICATION:
THE EXPERIENCES OF MEDICAL PHYSICS REGISTRARS, THEIR
SUPERVISORS AND THE EDITOR
ACDS LEVEL II AUDIT: WEDGED AND ASYMMETRIC FIELDS WITH
INHOMOGENEITIES FOR LUNG TREATMENTS (WAIL)
J. Lehmann
16:30
INTEGRATION OF BRAINLAB EXACTRAC WITH ELEKTA IGUIDE FOR STEREOTACTIC
RADIOTHERAPY/RADIOSURGERY K. Biggerstaff
THE AUSTRALIAN CLINICAL DOSIMETRY
SERVICE’S LEVEL I ELECTRON BEAM AUDIT J. Lye
16:45
VARIATION OF LUNG DENSITY AND RADIATION DOSES IN SRT LUNG TREATMENT: A MONTE CARLO
INVESTIGATION FOR STEREOTACTIC SMALL LUNG TUMOUR
D. Hossain
ACDS LEVEL III AUDIT: WHAT WE HAVE FOUND AND WHERE WE ARE GOING
J. Lehmann
17:00
VALIDATION OF A MONTE CARLO MODEL OF A FOD DETECTOR IN A STEREOTACTIC
RADIOTHERAPY BEAM B. Hug
THREE YEARS RUNNING: ACDS LEVEL I
PHOTON AUDIT L. Dunn
17:15
TOWARDS CLINICAL IMPLEMENTATION OF INTRACRANIAL STEREOTACTIC RADIOSURGERY WITH A HELICAL
TOMOTHERAPY APPROACH S. Deshpande
ACDS LEVEL IB AUDIT: OUTCOMES FROM THREE YEARS OF OPERATION
J. Kenny
EPSM Perth 2013 — Excellence through Innovation and Professional Development
21

THURSDAY 7th NOVEMBER 2013 - DAY FOUR8:30 REGISTRATION (Foyer 2, Functions & Events Floor, Pan Pacific)
9:00 INTERNATIONAL DAY OF MEDICAL PHYSICS (Golden Ballroom North/Centre)
10:15 MORNING TEA (Poster Hall)
Golden Ballroom SouthChair: A. Campbell
Golden Ballroom North/CentreChair: S. Downes
10:45
QUANTITATIVE CHARACTERISATION OF THE X-RAY BEAM AT THE AUSTRALIAN SYNCHROTRON IMAGING & MEDICAL
BEAMLINE (IMBL) A. Stevenson
THE PHOTONUCLEAR EFFECT M. Taylor
11:00SYNCHROTRON X-RAY BEAMS FOR MEDICAL PHYSICS
RESEARCH C. Hall
11:15CALORIMETRY ON THE AUSTRALIAN SYNCHROTON
IMAGING AND MEDICAL BEAMLINEP. Harty
HOW TO FUSE THE OLD WITH THE NEW: AN UNIQUE APPROACH TO VAGINAL MOULD BRACHYTHERAPY
S. Nilsson
11:30INVESTIGATION OF ENERGY DEPOSITION BY ALPHA
PARTICLES USING OF TIMEPIX DETECTOR R. AL Darwish
RADIOBIOLOGICAL EVALUATION OF TWO INVERSE PLANNING OPTIMISATION ALGORITHMS FOR PROSTATE HDR BRACHYTHERAPY
V. Panettieri
11:45FREEZING HAS NO NOTICEABLE EFFECT ON CORTICAL
BONE STRENGTH: THE FINAL CONFRONTATION R. Day
DOSIMETRIC EVALUATION OF MED3633 103PA SOURCE MODEL BY GEANT4
H. Round
12:00 Conference Closing (Golden Ballroom North/Centre)
12:30 Lunch (Poster Hall)
EPSM Perth 2013 — Excellence through Innovation and Professional Development
22

EPSM 2013 Perth Nov 3-7 2013 23

24 Perth Nov 3-7 2013 EPSM 2013
EPSM 2013 Perth Nov 3-7 2013 25
THE CHALLENGES OF RECONCILING LOW DOSE RADIOBIOLOGY WITH RADIATION PROTECTION P.J. Sykes Flinders Centre for Innovation in Cancer, Flinders University and Medical Centre, Adeaide, South
Australia.
Most of our radiobiology knowledge comes from studies using high doses of radiation. Current radiation protection is based on epidemiology at high dose exposure. The vast majority of the population are never exposed to high dose radiation. In contrast, with new and emerging diagnostic, industrial and security related procedures, more and more people are exposed to low or very low doses of radiation. It is now clear that the biological responses of cells and organisms after low dose radiation exposure are different to the responses after high dose radiation. Low dose radiation phenomena such as radio-adaptive responses and bystander effects do not strictly conform to the theory behind current radiation risk regulation. The biological mechanisms of adaptive responses and bystander effects have been an active area of study over recent years but still remain to be fully elucidated. Study of the mechanism of such responses after very low dose exposure poses many technical and interpretive challenges. Some of the major outstanding questions related to biological responses to low dose radiation will be addressed, and the approaches that are currently being taken to further our knowledge in these areas will be discussed.
EPSM-1257 Mon 4th Nov 09:15 Golden Ballroom Radiation Safety
26 Perth Nov 3-7 2013 EPSM 2013
STEREOTACTIC ABLATIVE BODY RADIOTHERAPY (SABR): COMPARING PHOTON AND PROTON TECHNIQUES J. Seco Department of Radiation Oncology, Harvard Medical School and Massachusetts General Hospital, Boston, MA 02114, USA.
Stereotactic ablative body radiotherapy (SABR) delivers high "ablative" doses with high precision in a shorter amount of time than traditional radiation treatments. SABR has unique biological characteristics leading to high rates of tumor control and sparing of healthy organs. SABR in the lung is usually used for medically inoperable lung patients with no nodal involvement and a primary target with diameter of less than 5cm. Daily image guidance is fundamental to guarantee accurate delivery of the radiation dose and typically there are 3-5 fractions per treatment course, where dose per fraction varies from 12 Gy to 18 Gy per fraction. SABR can be traditionally given using either proton or photon beam therapy. We will inter-compare proton therapy with photon therapy providing a review of the advantages and disadvantages of each modality.
EPSM-1252 Mon 4th Nov 10:30 Golden Ballroom South Radiotherapy
EPSM 2013 Perth Nov 3-7 2013 27
DETERMINING CURRENT WORKFORCE PATTERNS IN RADIATION ONCOLOGY IN WA G.K.B. Halkett1, J. McKay2
1Faculty of Health Sciences, Curtin University. 2Discipline of Medical Imaging, Faculty of Science and Engineering, Curtin University.
INTRODUCTION: Key issues influencing trends within the radiation therapy workforce include:
1) Recruitment: lack of people filling university places and local training in Western Australia (WA); knowledge of radiation therapy and medical physics as a career option; lack of career pathways and difficulties recruiting appropriately qualified overseas professionals.
2) Retention: workplace environment; professional advancement (career options, continuing professional development opportunities, research capabilities); personal influences (e.g. family commitments).
Turnover of RTs, including public and private facilities, is approximately 20% annually and WA struggles to attract and retain radiation oncology professionals. Anecdotal evidence suggests difficulty in attracting all types of radiation therapy professionals to WA is attributable to location, lack of opportunities for further study and career advancement. There has been a lack of research on workforce issues in radiation oncology generally and so little is known on how workforce environment is influencing RTs to leave the workforce. This research is particularly important for the sustainability of the WA workforce because both public and private service providers currently lack workforce capacity and RT and ROMP numbers to staff their departments.
AIMS AND RESEARCH QUESTIONS: The overall aim of this research is to develop an understanding of current workforce patterns in WA and to identify opportunities, career pathways and facilities that are likely to attract radiation oncology professionals to WA. The following research questions will be addressed:
What workforce patterns currently exist in radiation oncology in WA, compared to the rest of Australia? 1. What opportunities, career pathways and facilities would attract radiation oncology professionals to
work in WA? 2. What current gaps exist in international radiation therapy and medical physics education programs
which limits their employment in Australia? 3. What training could be provided to enable more overseas trained professionals to practice in
Australia?
STUDY DESIGN AND INSTRUMENTS: A mixed method approach is being used to address these research questions.
Phase 1: Online Workforce Sustainability in Radiation Oncology survey.
Phase 2: Interviews with internationally trained RTs and ROMPs, Australian trained RTs and ROMPs, ROs, and international qualification assessors.
Phase 3: Focus groups with ROMPs.
OUTCOMES: This research will inform the development of a long term strategic plan for the radiation oncology workforce of WA. Furthermore, it is likely to be used to inform workforce planning Australia wide.
ACKNOWLEDGEMENTS: This project is funded by the Australian Government Department of Health and Ageing. It is being conducted by a collaborative team from Curtin University, Radiation Oncology at Sir Charles Gairdner Hospital and Genesis Cancer Care, Western Australia.
EPSM-1238 Mon 4th Nov 11:00 Golden Ballroom South Radiotherapy
28 Perth Nov 3-7 2013 EPSM 2013
A COMPARISON OF MEASUREMENT ACCURACY OF 4DCT VS. IN-ROOM STEREOSCOPIC KV-IMAGER FOR IMPLANTED FIDUCIAL MARKERS IN LUNG AND LIVER TUMOURS C. Wen1, R. Smith1,2, A. Seeley1, J. Ruben1, I. Porter1, T. Ackerly1 1 William Buckland Radiotherapy Centre, The Alfred Hospital, Melbourne, Australia. 2 School of Applied Sciences and Health Innovations Research Institute, RMIT University, Melbourne,
Australia.
INTRODUCTION: Accurate measurement of tumour motion is important for gated SBRT treatment planning and delivery for lung and liver cancers. At the William Buckland Radiotherapy Centre, both 4DCT (GE LightSpeedTM) and an in-room stereoscopic kV imager (BrainLAB ExacTracTM) are able to determine the tumour motion amplitude and frequency based on an implanted fiducial marker. This study aims to compare the tumour tracking accuracies provided by those two methods using a marker imbedded in a dynamic gating phantom.
METHODS: A fiducial marker (VisicoilTM) was imbedded in a Perspex block mounted on a 1D motion phantom (BrainLAB ExacTracTM Gating Phantom) driven by sinusoidal traces of known amplitudes. This assembly was 4DCT scanned at slice thickness of 2.5 mm and marker amplitude was measured from a 10-phase-binned temporal-sorted dataset. Measurements of marker positions were repeated on the in-room stereoscopic imager using three sets of paired images then the peak-to-trough distance was calculated for the same phantom setup.
RESULTS: For programmed marker amplitudes of 10, 20 and 29 mm, the 4DCT method reported the amplitude as 7.9, 18.1 and 26.6 mm when marker moved along superior-inferior (S-I) direction, and 9.1, 18.8 and 27.2 mm respectively for marker moving left-and-right. By using stereoscopic kV imaging method, the corresponding S-I amplitudes were measured as 10.4, 20.1 and 30.8 mm for an identical phantom setup.
DISCUSSION & CONCLUSIONS: This study indicated that large slice thickness degraded the measuring accuracy of a tumour moving in S-I direction when 4DCT was used which has a tendency of under reporting the actual amplitude of the tumour. In contrast, measurements made with the stereoscopic imaging method have overestimated the amplitude of the marker. It is clear from this study that the accuracy of determining marker/tumour motion amplitude with the stereoscopic kV imager is superior to the 4DCT determination.
EPSM-1041 Mon 4th Nov 11:30 Golden Ballroom South Radiotherapy
EPSM 2013 Perth Nov 3-7 2013 29
IMAGE GUIDANCE FOR EXTRACRANIAL STEREOTACTIC RADIOTHERAPY OF LUNG CANCERS USING ENDOBRONCHIALLY IMPLANTED FIDUCIAL MARKERS T. Kron1,3, D. Steinfort2,3, B. Chesson1, S. Siva1,3, L. Irving2,3, D. Ball1,3 1Peter Mac Callum Cancer Centre, East Melbourne, Victoria, Australia. 2Royal Melbourne Hospital, Parkville, Victoria, Australia. 3University of Melbourne, Parkville, Victoria, Australia.
INTRODUCTION: Stereotactic radiotherapy is a high-dose precision technique necessitating accurate target visualisation. While cone beam computed tomography (CBCT) is an option to visualise lung tumours based on three dimensional soft tissue contrast, CBCT acquisition is time consuming and cannot be taken during the treatment delivery itself. Percutaneous insertion of fiducials for image guidance is associated with significant risk of morbidity, particularly pneumothorax. As such, we have investigated the use of fiducial markers implanted through minimally invasive bronchoscopy.
METHODS: In this ethics board approved prospective study two types of fiducial markers were implanted endobronchially in four patients undergoing radical radiation treatment for non-small cell lung cancer (two using VisicoilTM linear fiducial 10x0.75mm marker, two using SuperDimension® superLock™ 2-band 13x0.9mm markers). The bronchoscopic implantation was performed under conscious sedation using radial probe endobronchial ultrasound and fluoroscopic guidance to achieve tumour localization and placement within/adjacent to peripheral lung tumours. Patients had a time resolved 4D CT (Philips Brilliance™ with bellows system) scan for treatment planning and after completion of treatment to investigate marker movement. Throughout treatment delivery MV electronic portal images (EPI) were acquired as well a kV planar and CBCT (Varian Medical System) images.
RESULTS: Four patients with NSCLC underwent bronchoscopic implantation of fiducial markers. Confirmation of tumour localization was achieved with EBUS in all four patients. In one patient two markers were placed in adjacent airways and the remainder had a single marker placed within/adjacent to their peripheral tumour. No complications related to bronchoscopy or marker implantation were observed. No marker migration was observed over the treatment time for both marker types. Both types of markers were clearly visible in planar kV images; however, in EPI the markers could only be detected in selected beam directions where bony interference was minimal. While diagnostic CT scanning was able to demonstrate the markers in great clarity, they caused significant image artefacts in CBCT. The tumour (and therefore fiducial) motion pattern influenced the severity and type of artefact. Due to small numbers no differences between the suitability of the two marker types could be established.
DISCUSSION & CONCLUSIONS: Our preliminary experience indicates bronchsocopic implantation of fiducial markers is safe, and that it is achievable with a high degree of accuracy on initial imaging, and stability on subsequent in-treatment imaging. The choice of marker is a compromise trying to minimise CBCT artefacts while allowing visualisation in EPI imaging which would be an ideal tool to verify gated radiotherapy delivery.
ACKNOWLEDGEMENT: The Visicoil markers were kindly provided to us by Grant Owen from Robertson Medical Resources.
EPSM-1063 Mon 4th Nov 11:45 Golden Ballroom South Radiotherapy
30 Perth Nov 3-7 2013 EPSM 2013
DEVELOPMENT OF A SOFTWARE TOOL TO ASSESS RESPIRATORY MOTION TRACES FOR MOTION COMPENSATION STRATEGIES IN RADIOTHERAPY M. Whitaker1, J. Whitaker, R. Franich2, T. Kron2,3 1Department of Radiation Oncology, Royal Prince Alfred Hospital, Sydney, New South Wales. 2School of Applied Sciences, RMIT University, Melbourne, Victoria. 3Department of Physical Sciences, Peter MacCallum Cancer Centre, Melbourne, Victoria.
INTRODUCTION: Treatment doses for cancer are frequently escalated to take advantage of highly conformal treatment techniques. However respiratory motion affects the position of many tumour treatment volumes and surrounding organs at risk (OAR), resulting in a geographical miss of the tumour or over-treatment of an OAR during treatment. An internal target volume is often used to encompass the full range of motion of the treatment volume, although this may decrease the utilisation of dose escalation. Quantifying the motion caused by respiration can assist in the decision-making processes, including whether or not to use motion management techniques such as gated treatment, or whether the respiratory motion at treatment is consistent with the motion detected during the initial planning CT. A software tool was developed to expedite the analysis of a motion trace in order to assist in the decision-making process.
METHODS: Four parameters were used to characterise the motion trace: frequency of breathing, amplitude, asymmetry and a moving baseline. These four algorithms were programmed using Matlab. The software was designed to allow input from various sources, and to allow the user to set the time period for testing as well as the level of the low-pass filter in order to disregard noisy signals such as small coughs or hiccups. The results are presented as a mean, minimum and maximum for each parameter and reproducibility of each throughout the trace is represented by the standard deviation and standard error of the mean. For the initial testing of the software, the breathing traces from three healthy volunteers and seven patients were analysed, with a total of 59 breathing traces of 60 s duration or greater. The traces were evaluated for intra- and inter-fraction variations. The software was further tested for accuracy and reproducibility in the calculations, as well as time period and sampling rate.
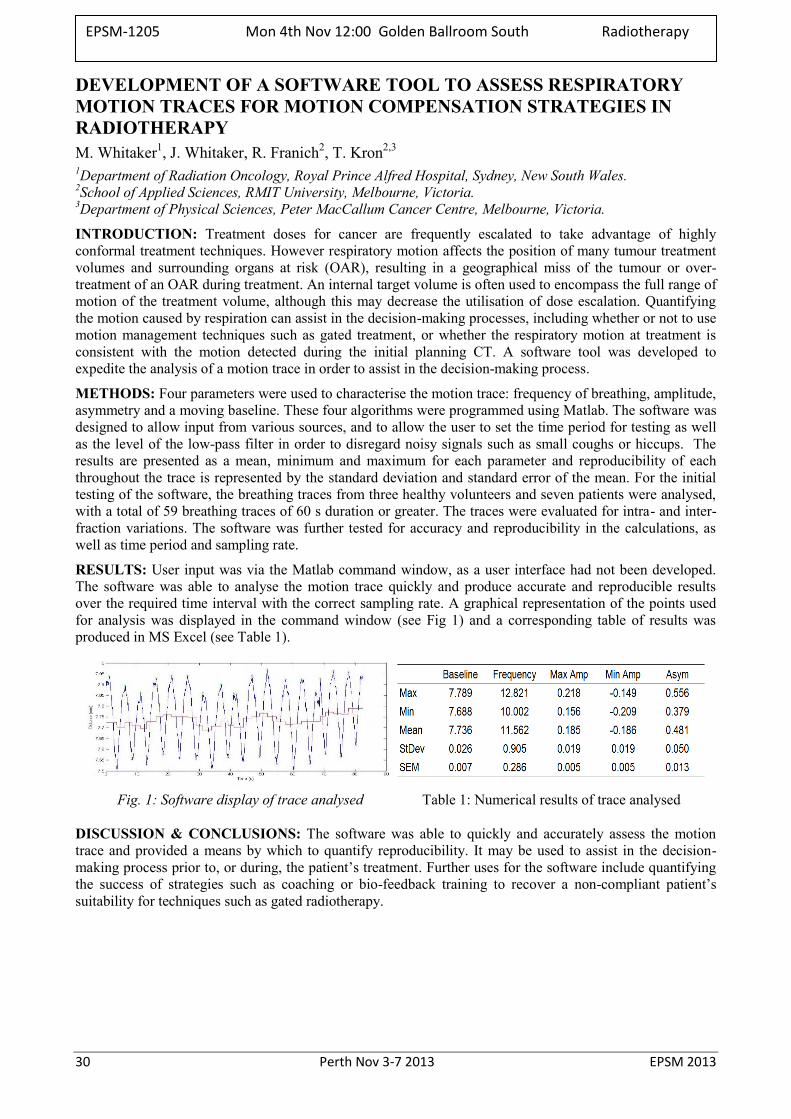
RESULTS: User input was via the Matlab command window, as a user interface had not been developed. The software was able to analyse the motion trace quickly and produce accurate and reproducible results over the required time interval with the correct sampling rate. A graphical representation of the points used for analysis was displayed in the command window (see Fig 1) and a corresponding table of results was produced in MS Excel (see Table 1).
Fig. 1: Software display of trace analysed Table 1: Numerical results of trace analysed
DISCUSSION & CONCLUSIONS: The software was able to quickly and accurately assess the motion trace and provided a means by which to quantify reproducibility. It may be used to assist in the decision-making process prior to, or during, the patient’s treatment. Further uses for the software include quantifying the success of strategies such as coaching or bio-feedback training to recover a non-compliant patient’s suitability for techniques such as gated radiotherapy.
EPSM-1205 Mon 4th Nov 12:00 Golden Ballroom South Radiotherapy
EPSM 2013 Perth Nov 3-7 2013 31
Mean difference in cm (US-MS)Patient LR DIFF AP DIFF SI DIFF 3D DIFF
1 -0.11 -0.07 -0.05 0.53
2 0.01 -0.05 -0.18 0.48
3 0.49 0.06 -0.32 0.79
4 -0.16 -0.22 0.05 0.48
5 0.31 -0.26 -0.30 0.66
6 -0.42 -0.31 0.17 0.94
7 -0.37 -0.30 -0.39 0.88
8 -0.20 0.01 -0.26 0.82
9 0.07 -0.11 -0.56 0.96
10 -0.07 -0.12 -0.03 0.48
11 -0.08 -0.16 0.04 0.68
12 0.53 0.29 0.31 1.03
13 0.12 0.64 -0.12 0.87
14 0.09 0.45 -0.24 0.68
15 -0.11 0.55 -0.04 0.78
16 -0.30 0.09 0.09 0.50
17 -0.11 0.05 0.02 0.40
18 -0.02 -0.03 0.19 0.49
19 -0.21 0.42 -0.62 0.95
20 -0.02 0.19 0.36 0.66
MEAN -0.03 0.06 -0.09 0.70
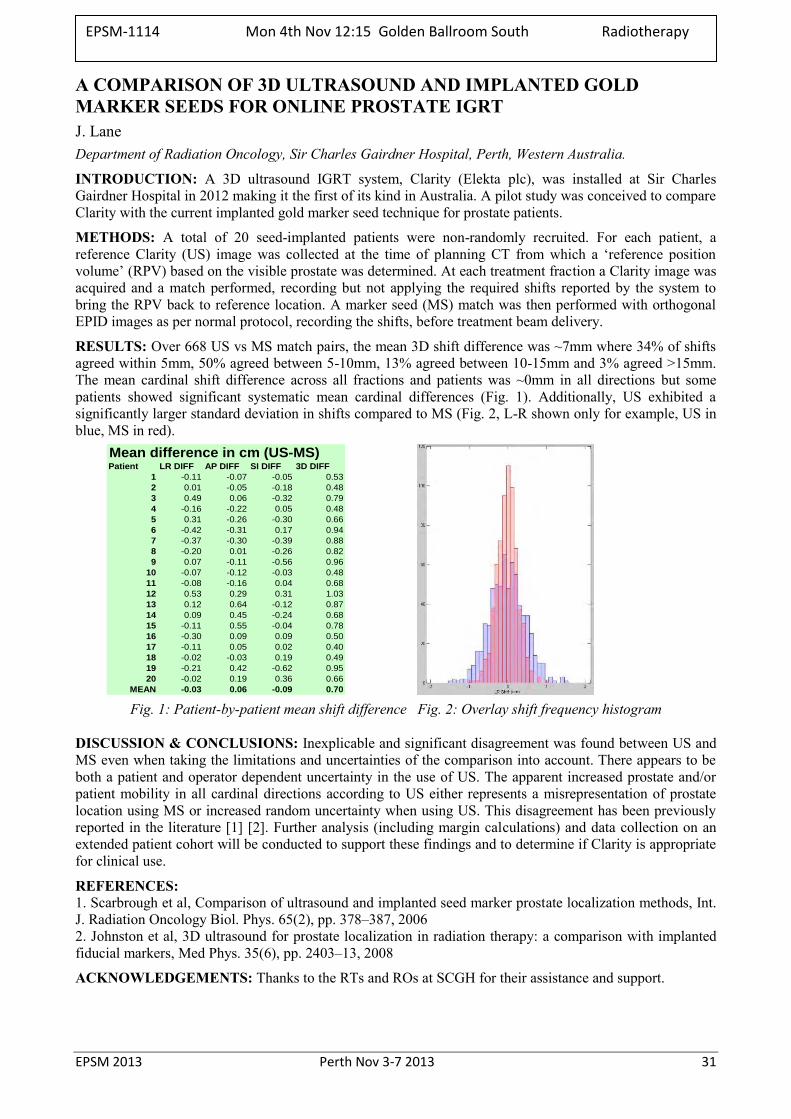
A COMPARISON OF 3D ULTRASOUND AND IMPLANTED GOLD MARKER SEEDS FOR ONLINE PROSTATE IGRT J. Lane Department of Radiation Oncology, Sir Charles Gairdner Hospital, Perth, Western Australia.
INTRODUCTION: A 3D ultrasound IGRT system, Clarity (Elekta plc), was installed at Sir Charles Gairdner Hospital in 2012 making it the first of its kind in Australia. A pilot study was conceived to compare Clarity with the current implanted gold marker seed technique for prostate patients.
METHODS: A total of 20 seed-implanted patients were non-randomly recruited. For each patient, a reference Clarity (US) image was collected at the time of planning CT from which a ‘reference position volume’ (RPV) based on the visible prostate was determined. At each treatment fraction a Clarity image was acquired and a match performed, recording but not applying the required shifts reported by the system to bring the RPV back to reference location. A marker seed (MS) match was then performed with orthogonal EPID images as per normal protocol, recording the shifts, before treatment beam delivery.
RESULTS: Over 668 US vs MS match pairs, the mean 3D shift difference was ~7mm where 34% of shifts agreed within 5mm, 50% agreed between 5-10mm, 13% agreed between 10-15mm and 3% agreed >15mm. The mean cardinal shift difference across all fractions and patients was ~0mm in all directions but some patients showed significant systematic mean cardinal differences (Fig. 1). Additionally, US exhibited a significantly larger standard deviation in shifts compared to MS (Fig. 2, L-R shown only for example, US in blue, MS in red).
Fig. 1: Patient-by-patient mean shift difference Fig. 2: Overlay shift frequency histogram
DISCUSSION & CONCLUSIONS: Inexplicable and significant disagreement was found between US and MS even when taking the limitations and uncertainties of the comparison into account. There appears to be both a patient and operator dependent uncertainty in the use of US. The apparent increased prostate and/or patient mobility in all cardinal directions according to US either represents a misrepresentation of prostate location using MS or increased random uncertainty when using US. This disagreement has been previously reported in the literature [1] [2]. Further analysis (including margin calculations) and data collection on an extended patient cohort will be conducted to support these findings and to determine if Clarity is appropriate for clinical use.
REFERENCES: 1. Scarbrough et al, Comparison of ultrasound and implanted seed marker prostate localization methods, Int. J. Radiation Oncology Biol. Phys. 65(2), pp. 378–387, 2006 2. Johnston et al, 3D ultrasound for prostate localization in radiation therapy: a comparison with implanted fiducial markers, Med Phys. 35(6), pp. 2403–13, 2008
ACKNOWLEDGEMENTS: Thanks to the RTs and ROs at SCGH for their assistance and support.
EPSM-1114 Mon 4th Nov 12:15 Golden Ballroom South Radiotherapy
32 Perth Nov 3-7 2013 EPSM 2013
CT QUALITY ASSURANCE: EXPERIENCE & TRENDS IN THE UNITED STATES J. Kofler Department of Radiology, Mayo Clinic, Rochester, MN, USA
The acquisition and analysis of quality assurance (QA) measurements is a long-accepted practice of assessing that imaging equipment is functioning within predetermined specifications and is essential for delivering acceptable image quality and radiation dose in computed tomography (CT). One challenge with a CT QA program is determining which tests, and which combination of scan parameters, provide data that are practical to acquire and yet relevant to patient care and safety. This presentation addresses a range of issues associated with this challenge based on long-term experience at a large medical facility in the United States. Superimposed over this discussion are the rules and recommendations of various US regulating and accreditation organizations, which can have a significant impact on the magnitude and efficacy of a CT QA program. General trends in QA requirements for CT facilities in the US suggest a continued increase in resources may be necessary to support CT imaging equipment.
EPSM-1254 Mon 4th Nov 10:30 Golden Ballroom Centre Diagnostic Radiology
EPSM 2013 Perth Nov 3-7 2013 33
RADIATION EYE DOSE MEASUREMENTS FOR STAFF WITHIN THE CATH LAB D. Hadaya1, D. McLean1, A. Farshid2, L. Divorty2 1Medical Physics department, The Canberra Hospital, Garran, ACT, 2605. 2Cardiology department, The Canberra Hospital, Garran, ACT, 2605.
INTRODUCTION: With the increased evidence of the sensitivity of the eye to radiation effects, the International Commission on Radiological Protection (ICRP) has recently reduced the radiation eye dose limit from 150 mSv to 20 mSv per year [1]. Consequently, an eye dose assessment was conducted within the Cardiac Catheterisation Laboratory to inform staff of the typical current radiation exposure to the eye for comparison to the ICRP limit.
METHOD: The dose to the eye from radiation due to interventional cardiac procedures was approximated using calibrated 100H TLDs for 34 days. The TLDs were placed within ‘EYE-D’ holders that simulate Hp(3) conditions and placed on the edge of the left eye for all persons but outside of lead glasses if worn. Within this period of time extensive information was collected for each examination where the TLDs were worn including, patient size and medical condition, staff classification, position in room and use of eye protection and procedural information, such as examination undertaken, kerma air product (KAP) and cumulative air kerma (CAK) etc.
RESULTS: A total of 201 procedures were conducted and recorded on a Philips Allura Xper FD series and GE INNOVA 2000. The data integrity was carefully checked. The highest staff eye readings of 819 uSv and 949 uSv, which represent 49% and 57% of the monthly dose limits, were for a medical staff member and fellow respectively. Lead glasses were worn 0% and 100% of the time respectively for the medical officer and fellow. Consequently, the fellow would have received an eye dose considerably less than their dose reading. It was shown that nursing staff, who may typically not wear any protective lead glasses were capable of receiving significant eye dose of up to 15% of their monthly dose limit.
CONCLUSION: Demonstration that eye lens radiation dose levels are non negligible in a cardiac catherisation laboratory, is an important tool occupation dose reduction which can contribute to better use of radiation protection equipment and the optimisation of examination techniques for all staff members.
REFERENCES: 1. International Commission on Radiological Protection (2011), Statement on Tissue Reactions, ICRP ref
4825-3093-1464.
EPSM-1096 Mon 4th Nov 11:00 Golden Ballroom Centre Radiology Physics
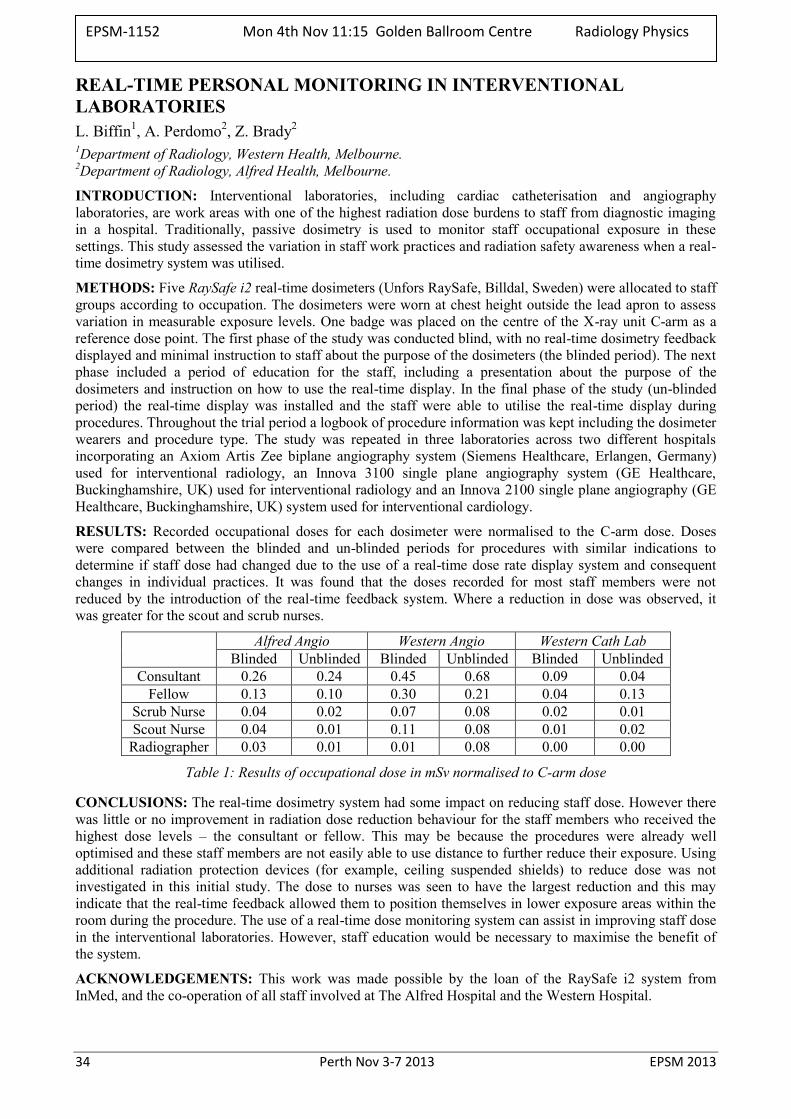
34 Perth Nov 3-7 2013 EPSM 2013
REAL-TIME PERSONAL MONITORING IN INTERVENTIONAL LABORATORIES L. Biffin1, A. Perdomo2, Z. Brady2 1Department of Radiology, Western Health, Melbourne. 2Department of Radiology, Alfred Health, Melbourne.
INTRODUCTION: Interventional laboratories, including cardiac catheterisation and angiography laboratories, are work areas with one of the highest radiation dose burdens to staff from diagnostic imaging in a hospital. Traditionally, passive dosimetry is used to monitor staff occupational exposure in these settings. This study assessed the variation in staff work practices and radiation safety awareness when a real-time dosimetry system was utilised.
METHODS: Five RaySafe i2 real-time dosimeters (Unfors RaySafe, Billdal, Sweden) were allocated to staff groups according to occupation. The dosimeters were worn at chest height outside the lead apron to assess variation in measurable exposure levels. One badge was placed on the centre of the X-ray unit C-arm as a reference dose point. The first phase of the study was conducted blind, with no real-time dosimetry feedback displayed and minimal instruction to staff about the purpose of the dosimeters (the blinded period). The next phase included a period of education for the staff, including a presentation about the purpose of the dosimeters and instruction on how to use the real-time display. In the final phase of the study (un-blinded period) the real-time display was installed and the staff were able to utilise the real-time display during procedures. Throughout the trial period a logbook of procedure information was kept including the dosimeter wearers and procedure type. The study was repeated in three laboratories across two different hospitals incorporating an Axiom Artis Zee biplane angiography system (Siemens Healthcare, Erlangen, Germany) used for interventional radiology, an Innova 3100 single plane angiography system (GE Healthcare, Buckinghamshire, UK) used for interventional radiology and an Innova 2100 single plane angiography (GE Healthcare, Buckinghamshire, UK) system used for interventional cardiology.
RESULTS: Recorded occupational doses for each dosimeter were normalised to the C-arm dose. Doses were compared between the blinded and un-blinded periods for procedures with similar indications to determine if staff dose had changed due to the use of a real-time dose rate display system and consequent changes in individual practices. It was found that the doses recorded for most staff members were not reduced by the introduction of the real-time feedback system. Where a reduction in dose was observed, it was greater for the scout and scrub nurses.
Alfred Angio Western Angio Western Cath Lab
Blinded Unblinded Blinded Unblinded Blinded Unblinded Consultant 0.26 0.24 0.45 0.68 0.09 0.04
Fellow 0.13 0.10 0.30 0.21 0.04 0.13 Scrub Nurse 0.04 0.02 0.07 0.08 0.02 0.01 Scout Nurse 0.04 0.01 0.11 0.08 0.01 0.02
Radiographer 0.03 0.01 0.01 0.08 0.00 0.00
Table 1: Results of occupational dose in mSv normalised to C-arm dose
CONCLUSIONS: The real-time dosimetry system had some impact on reducing staff dose. However there was little or no improvement in radiation dose reduction behaviour for the staff members who received the highest dose levels – the consultant or fellow. This may be because the procedures were already well optimised and these staff members are not easily able to use distance to further reduce their exposure. Using additional radiation protection devices (for example, ceiling suspended shields) to reduce dose was not investigated in this initial study. The dose to nurses was seen to have the largest reduction and this may indicate that the real-time feedback allowed them to position themselves in lower exposure areas within the room during the procedure. The use of a real-time dose monitoring system can assist in improving staff dose in the interventional laboratories. However, staff education would be necessary to maximise the benefit of the system.
ACKNOWLEDGEMENTS: This work was made possible by the loan of the RaySafe i2 system from InMed, and the co-operation of all staff involved at The Alfred Hospital and the Western Hospital.
EPSM-1152 Mon 4th Nov 11:15 Golden Ballroom Centre Radiology Physics
EPSM 2013 Perth Nov 3-7 2013 35
INTERNATIONAL BEST PRACTICE FOR RADIATION PROTECTION OF THE PATIENT IN MEDICAL IMAGING IN AN AUSTRALIAN CONTEXT A.B. Wallace Medical Imaging Section, Australian Radiation Protection & Nuclear Safety Agency, Yallambie, Australia.
INTRODUCTION: The fundamental components of a successful program for radiation protection of the patient in medical imaging are based on Justification and Optimisation [1]. A review of how these components are implemented in Australian medical imaging indicates that international best practice is not being met.
DISCUSSION: Justification should ensure that any activity that gives rise to radiation risks must yield an overall benefit [2]. In medical imaging, justification should be based on adequate referrer knowledge of radiation risk and benefit, access to referral guidelines or appropriateness criteria, the provision of an adequate referral form and the service provider/radiologist reviewing the referral for appropriateness as the final gatekeeper.
Optimisation of protection requires that the highest level of safety can reasonably be achieved [2]. In medical imaging, optimisation is concerned with gaining the maximum benefit from the radiation activity whilst ensuring the harm caused is minimised. It requires the balancing of radiation dose and diagnostic image quality for the imaging task under consideration. Successful implementation requires expert advice, a rigorous methodology, an ongoing iterative program embedded within a program of clinical audit.
The above requirements are multidisciplinary, complex and require constant attention. This presentation will review each component and discuss the success of their implementation in Australian medical imaging.
REFERENCES: 1. ICRP. (2007) The 2007 Recommendations of the International Commission on Radiological
Protection. ICRP publication 103. Elsevier UK. 2. IAEA. (2011) Radiation Protection and Safety of Radiation Sources: International Basic Safety
Standards - Interim Edition. General Safety Requirements Part 3 (Interim). IAEA Vienna.
EPSM-1085 Mon 4th Nov 11:30 Golden Ballroom Centre Radiation Protection
36 Perth Nov 3-7 2013 EPSM 2013
FLATTENING FILTER FREE PHOTO BEAMS - DOSIMETRIC CHARACTERISTICS AND CLINICAL IMPLICATIONS D. Georg1,2, W. Lechner1,2, G. Kragl1 1Department of Radiation Oncology; Medical University Vienna / AKH Wien; Austria. 2Christian Doppler Laboratory for Medical Radiation Research for Radiation Oncology; Medical University
of Vienna; Austria.
INTRODUCTION: Flattening filters (FF) have been considered as an integral part of the treatment head of a medical accelerator for more than 50 years. The reasons for the longstanding use are, however, historical ones. Advanced treatment techniques, such as stereotactic radiotherapy or intensity modulated radiotherapy have stimulated the interest in operating linear accelerators in a flattening filter free (FFF) mode.
METHODS: Dosimetric data including depth dose, profiles, output factors and phantom scatter factors from 6MV and 10 MV photon beams provided by an Elekta linac - operated with and without flattening filter - were determined for commissioning the TPS Monaco. In flattening filter free (FFF) mode a 2 mm thick copper filter was placed into the beam to stabilize it. Additional measurements of leaf transmission, leakage radiation and surface dose were performed, as well as HVL measurements as a function of emission angle in order to characterise beam softening as a function of off-axis radius from the central axis. With respect to small field dosimetry, output factors of 6 MV and 10 MV FF- and FFF-beams were measured with 14 different online detectors using field sizes between 10x10 cm² and 0.6x0.6 cm² at a depth of 5 cm of water and a SSD of 95 cm. Alanine pellets with a diameter of 5 mm and 2.5 mm were used as reference dosimeters for field sizes down to 1.2x1.2 cm² and 0.6x0.6 cm², respectively. The reading of all detectors was corrected for volume averaging effects and the ratio of output factors measured with the online detectors to output factors measured with alanine were evaluated (henceforth referred to as dose response ratio). Treatment plan quality was assessed for SBRT and IMRT, also including Pareto optimal front approaches. In addition peripheral doses were determined for typical IMRT and SBRT treatment plans. Finally, from a radiation protection point of view photon dose rates were measured outside the treatment room and results obtained for flattened and unflattened beams were compared.
RESULTS: These dosimetric characteristics of FFF beams have an effect on treatment delivery, patient comfort, dose calculation accuracy, beam matching, absorbed dose determination, treatment planning, machine specific quality assurance, imaging, and radiation protection. When considering conventional C-arm linacs in a FFF mode, results on treatment planning studies on SBRT and IMRT indicated the same or improved treatment plan quality. Using unflattened beams results in a reduction of treatment head leakage by 52% for 6 and 65% for 10 MV. Thus, peripheral doses were in general smaller for treatment plans calculated with unflattened beams. For small field dosimetry, the dose response ratios of two different shielded diodes measured with 10 MV FF-beams deviated substantially compared to FFF-beams (2% to 3% at a field size of 0.6x0.6 cm²). This difference was less pronounced for 6MV FF- and FFF-beams. For all other detectors the response ratios of FF- and FFF-beams showed no significant difference. The softer photon spectra of unflattened beams have implications on radiation protection, i.e. shielding requirements of a treatment room. Drawbacks of FFF beams are the increased surface dose and the increased scatter within the patient. For an adequate dimensioning of treatment vault shielding our experimental and theoretical results showed that unflattened photon beams require less shielding than flattened ones.
DISCUSSION & CONCLUSIONS: Due to the convincing arguments of removing the FF, it is expected that advanced photon beam therapy will be largely based on FFF beams in the near future. Several aspects related to standardization, dosimetry, treatment plan optimization and radiobiology need to be addressed in more detail in order to facilitate the clinical implementation of unflattened beams.
ACKNOWLEDGEMENTS: The financial support by the Federal Ministry of Economy, Family and Youth and the National Foundation for Research, Technology and Development, Austria, is gratefully acknowledged.
EPSM-1250 Mon 4th Nov 10:30 Golden Ballroom North Radiotherapy
EPSM 2013 Perth Nov 3-7 2013 37
USING EPIDS FOR ROUTINE LINAC QA P. Rowshanfarzad School of Physics, University of Western Australia, Perth, WA.
In recent years, there has been a tendency in radiotherapy centres toward filmless practice. As a result, physicists need to consider suitable tools to replace traditionally-used films for linac QA. There are many issues involved with the application of films: they are expensive and occupy space. Using films for QA is time-consuming, since they need setup for measurements and require processing and digitizing. The processor maintenance and chemicals are costly too. There have been many studies on phasing out films and replacing them with easier, more convenient QA methods.
Electronic portal imaging devices (EPIDs) have proved to be reliable tools for machine QA. They are included in the structure of all modern linacs, do not require any difficult setup procedure (which saves a considerable amount of time), provide two-dimensional arrays of reproducible high-resolution data. Images are already in digital (DICOM) format and no processing or digitization is required. EPIDs can be simply and quickly calibrated and image enhancement can be easily performed. The imager rotates with the gantry, and is thus always perpendicular to the beam. This is particularly important for QA of arc treatments (e.g. VMAT). Images can be acquired in integrated or cine (movie) mode, depending on the QA application. EPIDs are tolerant to high doses of radiation and their application imposes no additional cost to the system.
The only extra requirement for application of EPIDs as a flawless linac QA tool would be the availability of suitable analysis software. Physicists may develop the analytical methods or purchase commercial software.
This presentation will review some of the methods to use EPIDs as routine QA tools for reliable evaluation of the linac mechanical performance as well as some beam parameters to suit the rapidly evolving radiotherapy techniques.
EPSM-1226 Mon 4th Nov 11:15 Golden Ballroom North Radiotherapy
38 Perth Nov 3-7 2013 EPSM 2013
ARPANSA MEGAVOLTAGE ELECTRON BEAM CALIBRATION SERVICE C. Oliver, D. Butler Radiotherapy Section, Medical Radiation Services Branch, ARPANSA, 619 Lower Plenty Rd, Yallambie, VIC
3085.
INTRODUCTION: ARPANSA does not currently maintain a primary standard for megavoltage electron beams and thus the ideal case of an electron dosimetry chamber being calibrated in a number of reference electron beams is not possible in Australia. Electron beam dosimetry is traceable to a chamber calibration in a Co-60 photon beam. TRS-398 [1] provides a pathway to measure clinical electron beams using a cylindrical (R50 ≥ 4 g cm-2) or plane-parallel (R50 ≥ 1g cm-2) chamber and its ND,w,Co-60 calibration factor. However, the preferred method for dosimetry of clinical electron beams is using a plane-parallel chamber that has been cross calibrated against a cylindrical chamber in a high energy clinical electron beam. This method generally results in a determination of absorbed dose to water that is more reliable that that achieved by the use of a plane parallel chamber directly calibrated in Co-60 and its uncertainty is quoted as 1.6% [1]. ARPANSA is now preparing to provide an electron cross calibration service.
METHODS: The cross calibration of a number of ARPANSA Roos chambers and an Advanced Markus chamber has been thoroughly tested as well as a select number of trial client calibrations. A client chamber can be calibrated against the client Farmer chamber, an ARPANSA Farmer chamber or a cross calibrated ARPANSA parallel plate chamber. Reproducibility, settling times, polarity and recombination effects have been studied. The effect of electron beam cross calibration energy, field size and the use of an external monitor as recommended by TRS-398 [1] during the cross calibration have also been investigated. Measurements comparing cross calibration in a water phantom and solid water have also been performed.
RESULTS: The calibration coefficients obtained via cross calibration against an ARPANSA calibrated Farmer chamber have been compared with those obtained by direct and cross calibration against an electron chamber calibrated against an electron primary standard at the National Physical Laboratory in the UK. The average variation over the eight ARPANSA electron beams was 1.1% with the largest difference being 1.5%.
DISCUSSION & CONCLUSIONS: ARPANSA will provide a service to cross calibrate client electron chambers in an ARPANSA electron beam. If the clinic provides R50 values for their electron beams clinic specific calibration factors will be provided. This aims to improve the uniformity and consistency of electron beam dosimetry in Australia.
REFERENCES: 1. IAEA, Absorbed dose determination in external beam radiotherapy: An international code of practice for dosimetry based on standards of absorbed dose to water, Vol.398 of Technical Report Series (IAEA, Vienna, 2001).
EPSM-1120 Mon 4th Nov 11:45 Golden Ballroom North Radiotherapy
EPSM 2013 Perth Nov 3-7 2013 39
THE AUSTRLIAN CLINCIAL DOSIMETERY SERVICE AT THREE YEARS: NO BREAD CRUMBS I.M. Williams1,2, J. Lehmann1,2, J.E. Lye1, J.W. Kenny1,3, A.D.C. Alves1
1Australian Clinical Dosimetry Service, Yallambie,Victoria Australia. 2School of Applied Sciences, RMIT University, Melbourne, Victoria, Australia. 3Radiation Oncology Queensland, Toowoomba, Queensland, Australia.
INTRODUCTION: The Australian Clinical Dosimetry Service, ACDS, will have been operational for nearly three years by the end of 2013. In the three years of operation the service has audited nearly every linear accelerator in Australia at least once. The audit program has uncovered a number of issues at facilities around the country and has provided advice to reduce the clinical risk associated with these issues. The ACDS now needs to plan for the future while maintaining its critical services.
METHODS: The scope of work for the three year ACDS trial was delineated by a Memorandum of Understanding, MoU, between the Department of Health and Ageing, DoHA, and the Australian Radiation Protection and Nuclear Safety Agency, ARPANSA. The MoU required that the ACDS develop and deliver Level I, II and III audits to the Australian radiation oncology providers, gaining enough audit data for statistically significant findings [1, 2]. Urgent requests from senior Medical Physicists led to the development and deployment of a Level Ib on-site audit to provide higher accuracy dosimetry for new linear accelerators, particularly in geographically isolated areas.
RESULTS: An initial review of the audit outcomes demonstrates that the dosimetric accuracy of radiation oncology in Australia is of high quality as all clinically employed linear accelerators treatment beams Passed the basic dosimetry, Level I, audit. However, recommendations were made to a number of facilities which received Pass:Optimal and Pass:Action Level outcomes . The Level II and III audits uncovered issues at a few facilities, leading to both Pass:Action Level and Fail outcomes. Most of these outcomes were resolved on-site by attributing causality to a previously unidentified issue. A few audits required further follow-up including re-auditing at a different level, analysis of previous independent audit outcomes and in a few cases, clinical review.
DISCUSSION & CONCLUSIONS: The ACDS’s success was assisted by a highly prescriptive reporting regime to DoHA. While the level of oversight was time consuming, it both assisted and ensured that the ACDS developed plans and an audit schedule extending years into the future. The level of planning meant that the ACDS was continually reviewing progress against the MoU targets, and could modify the work plan as required. This was particularly important in the last half of the trial period when considerable time was required to finalise the Level II audit.
Without confusing anecdote and data, the ACDS makes the following recommendations based on observations, audit outcomes and perceived risk:
1. The barometer is the most likely equipment based source of dosimetric inaccuracy in Australia.
2. Staff turnover engenders legacy issues, especially out-of-date protocols, which can be the root cause of dosimetric and equipment problems.
The previous three years have demonstrated that an independent audit service has real value to the Australian public and radiation oncology professionals.
REFERENCES: 1. T. Kron et al., Int. J. Radiation Oncology Biol. Phys., Vol. 52, No. 2, pp. 566–579, 2002 2. I.M. Williams et al., Australas Phys Eng Sci Med, 35:407–411, 2012.
ACKNOWLEDGEMENTS: The Australian Clinical Dosimetry Service is a joint initiative between the Department of Health and Ageing and the Australian Radiation Protection and Nuclear Safety Agency.
EPSM-1139 Mon 4th Nov 12:00 Golden Ballroom North Radiotherapy
40 Perth Nov 3-7 2013 EPSM 2013
VALIDATION OF THE OCTAVIUS 4D DOSIMETRIC SYSTEM FOR VMAT VERIFICATION S. Arumugam1, A. Xing1, T. Young1, L. Holloway1,2,3,4
1Liverpool and Macarthur cancer therapy centres and Ingham Institute, Liverpool Hospital, NSW, Sydney, Australia.
2Institute of Medical Physics, School of Physics, University of Sydney, Sydney, NSW, Australia. 3Centre for Medical Radiation Physics, University of Wollongong, Wollongong, NSW, Australia. 4South Western Sydney Clinical School, University of New South Wales, Sydney, NSW, Australia.
INTRODUCTION: The planning and delivery of Volumetric Modulated Arc Therapy (VMAT) is highly complex compared to conventional Intensity Modulated Radiation Therapy (IMRT). 3D dosimetric verification is recommended to ensure the accuracy of VMAT plans[1]. Recently new electronic dosimetric systems that provide quasi 3D dosimetric information have been introduced commercially. Octavius 4D (PTW, Germany) is one such system, it consists of a cylindrical phantom with a 2D ion chamber array insert. The cylindrical phantom rotates in synchrony with the linear accelerator gantry. The measurement plane of the detector array coincides with the axis of rotation of the cylinder and is always perpendicular to beam axis. The 3D dose of the delivered treatment is predicted by the system from the measured data and user supplied percentage depth dose (pdd) information of the radiation beam. In this work we present a validation of this system for VMAT verification.
METHODS: All dose measurements were performed using a 6MV photon beam from an Elekta Synergy accelerator and the Pinnacle treatment planning system was used to generate treatment plans. The accuracy of Octavius predicted 3D dose was systematically verified in the following four scenarios: 1.Single static fields for field size ranging from 3x3 cm2 to 26x26cm2; 2. Conformal plans with multiple fields; 3.Arcs with field sizes ranging from 5x5 cm2 to 25x25cm2 and 4. Clinical VMAT plans.The 3D dose matrices from the Octavius system and Pinnacle TPS were compared using 3D gamma (γ) analysis with 2%/2mm and 3%/3mm criteria.
RESULTS: Static fields dose comparison showed mean (SD) γ pass rates of 73.7(7.1) % and 86.0(6.7) % with 2%/2mm and 3%/3mm tolerance respectively. The majority of the failed pixels were observed in the penumbra region due to the volume averaging of the relatively large detector size. The conformal and arc treatments showed mean γ pass rates of 82.7(15.2) % and 93.21(6.5) % with 2%/2mm and 3%/3mm tolerance respectively. The verification of clinical VMAT plans showed mean γ pass rates of 84.7(2) % and 95.2(2) % with 2%/2mm and 3%/3mm tolerance respectively.
DISCUSSION & CONCLUSIONS: The Octavius 4D system has been shown to accurately predict 3D dose based on measurement and pdd information. However, due to the coarse resolution of the detectors and a relatively large detector size failed pixels were observed on the penumbra region of the conventional treatment fields and high dose gradient region of VMAT arcs. Generally verification of clinical VMAT plans showed clinically acceptable γ pass rates.
REFERENCES: 1. G. A. Ezzell, J. M. Galvin, D. Low, J. R. Palta, I. Rosen, M. B. Sharpe, P. Xia, Y. Xiao, L. Xing and
X. Y. Cedric 2003 Med. Phys. 30 2089
ACKNOWLEDGEMENTS: The authors are thankful to Mr Peter Douglas, Nucletron Pvt Ltd, Australia for lending the Octavius 4D system to carryout this project.
EPSM-1158 Mon 4th Nov 12:15 Golden Ballroom North Radiotherapy
EPSM 2013 Perth Nov 3-7 2013 41
TREATMENT AND PLANNING QUALITY ASSURANCE IN THE CONTEXT OF A RADIOTHERAPY TRIAL: ARE THE RESULTS REFLECTED IN TOXICITY OUTCOMES? M.A. Ebert1,2, R. Kearvell1, A. Haworth3,4, M. Bulsara5, A. Kennedy1, S. Richardson1, M. Krawiec1, D.J. Joseph1, J.W. Denham6
1Radiation Oncology,Sir Charles Gairdner Hospital, Perth, Western Australia. 2School of Physics, University of Western Australia, Perth, Western Australia. 3Department of Physical Sciences, Peter MacCallum Cancer Centre, Victoria. 4Sir Peter MacCallum Department of Oncology, University of Melbourne, Victoria. 5School of Health Sciences, University of Notre Dame, Fremantle, Western Australia. 6School of Medicine and Population Health, University of Newcastle, New South Wales.
INTRODUCTION: Quality assurance (QA) of radiotherapy planning and delivery are perceived as being of importance to the efficacy of a clinical trial and for ensuring maximum study power. Such QA requires extensive financial and human resources and infrastructure. After having invested considerable relevant resources to the undertaking of the TROG 03.04 RADAR trial, we wished to determine if the results of QA activities were reflected in trial outcomes. With rectal toxicity data available for an extensive follow-up period, this was used as the first test of the impact of trial QA.
METHODS: RADAR recruited 1071 participants from 23 centres during 2003-2008, of which data for 754 participants was available for this study. To support the RADAR trial, QA activities were undertaken providing several principal variables for evaluating against rectal toxicity:
A pre-trial patient set-up study provided a ranking from lowest to highest setup uncertainty across participating centres (CSetupRank).
A level III dosimetry audit which provided two measured of dosimetric uncertainty at the posterior of the prostate and anterior wall of the rectum (CPostProst and CRectWall).
A review of all participant planning data providing indication of number of minor and major protocol variations at the levels of each centre (CVar) and each participant (PVar).
The number of patients accrued per centre (CAccrual) was considered as another variable. In addition, we examined the influence of rectal outlining compliance on resulting toxicities. Toxicity measures included LENT-SOMA scaled clinician-reported symptoms and patient-reported symptoms using the EORTC QLQ-PR25 questionnaire. The impact of variables on toxicity, assessed as ‘acute’ or the peak or mean score over the whole follow-up period (median 72 months) was assessed by univariate and multivariate logistic regression.
RESULTS: Mean late score was the toxicity measure that most significantly correlated with the variables. On univariate analysis, toxicities tended to increase with increasing CAccrual and increasing CRectWall. CSetupRank had minimal impact on toxicity incidence as did PVar. Increasing CVar led to some minor increase in toxicity. Patient-assessed toxicity showed little correlation with QA factors. On multivariate analysis, CAccrual and CVar were the variables that most consistently correlated with clinical outcome but only for clinician-reported scores suggesting a strong clinician bias in toxicity reporting. Odds-ratios and regression coefficients from analysis of rectal outlining all indicate a trend of increased toxicity when rectal definition was not as per protocol guidelines, relative to rectal definitions that were as per protocol guidelines.
DISCUSSION & CONCLUSIONS: This study has shown some relatively tenuous relationships between QA activities and the impact on toxicity. This is not unexpected as QA activities were initiated to ensure reduced and consistent toxicities. It is likely that a conclusion regarding the impact of QA could only be obtained from a controlled trial of QA vs non-QA, which is ethically unreasonable. For now we strongly support the inclusion of QA activities for ensuring the highest quality outcomes data.
ACKNOWLEDGEMENTS: This study was supported by National Health and Medical Research Council grant APP1006447.
EPSM-1014 Mon 4th Nov 13:30 Golden Ballroom South Radiotherapy
42 Perth Nov 3-7 2013 EPSM 2013
MEDIASTINAL RADIOTHERAPY FOR LYMPHOMA: BREAST DOSE REDUCTION BY BREAST REPOSITIONING T. Kron1,2, C.J. Hornby1, E. Muir1, A. Wirth1 1Peter Mac Callum Cancer Centre, East Melbourne, Victoria, Australia. 2University of Melbourne, Parkville, Victoria, Australia.
INTRODUCTION: Mediastinal irradiation is an important component in the management of lymphoma patients. However, the risk of radiation-induced secondary breast cancer is not negligible particularly for younger patients.. The aims of this pilot study were to investigate the feasibility of repositioning the breasts in female patients using a thermoplastic drape, and to assess the consequent dose reduction, using in vivo dosimetry.
METHODS: Ten consecutive female patients undergoing antereo-postero radiation fields to the mediastinum for lymphoma were enrolled. A thermoplastic breast repositioning ‘drape’ was manufactured prior to a planning CT scan being performed. Patients were CT scanned with the thermoplastic shell in place and measurements to the nipple and breast tissue were recorded and photographs taken. A second set of measurements was taken with the shell off and the breasts in their natural position. Standard planning (Varian Eclipse) was employed using the CT and repositioning drape with involved field AP-PA radiation beams conformally shielded. On day one of treatment patients were set-up and treated without the thermoplastic drape. Thermoluminescence dosimeters (LiF TLD100) were placed at the medial edge, nipple and lateral edge of the breast tissue. For the 2nd and subsequent fractions treatment was delivered with breasts repositioned utilising the drape and TLD measurements repeated on day 2 and 3.
RESULTS: The drape moved the breast tissue infero-laterally by an average of 2.8 +/- 1.6 (1SD) cm. The average breast dose reduction across all patients and measurement locations was 7% between repositioned and normal breast position (not statistically significant). However, in individual patients the dose reduction could be more than a factor of two at selected locations, particularly in high dose regions. When considering only measurement locations which received a dose of 4Gy or more over the whole course of treatment, the overall reduction was found to be 28% approaching statistical significance.
There was good correlation between repositioning distance and dose reduction between left and right breast in the same patient but our study failed to demonstrate a correlation between the distance and dose reduction overall. We also found that dose reduction due to repositioning was greater with larger field sizes in the medial measurement position, a trend that diminished towards lateral locations. Agreement between calculated and measured dose was generally poor but improved for higher doses.
DISCUSSION & CONCLUSIONS: Our preliminary experience indicates that breast repositioning in lymphoma patients using a thermoplastic drape is feasible and well tolerated. Although measured dose reductions to breast tissue were relatively small, every effort should be made to reduce the risk of secondary cancers in relatively young patients with excellent long-term survival.
EPSM-1072 Mon 4th Nov 13:45 Golden Ballroom South Radiotherapy
EPSM 2013 Perth Nov 3-7 2013 43
RAPID LEARNING IN PRACTICE: AUSTRALIAN VALIDATION OF A EUROPEAN PREDICTION MODEL FOR H&N CANCER M. Bailey1, M. Carolan1, A. Miller1, A. George2, G. Goozee2, L. Holloway2, D. Thwaites3, A. Dekker1,2,3,4 1Illawarra Cancer Care Centre, Wollongong, NSW, Australia. 2Cancer Therapy Centre, Liverpool Hospital, NSW, Australia. 3Institute of Medical Physics, School of Physics, University of Sydney, NSW, Australia. 4Maastricht Radiation Oncology (MAASTRO), Maastricht, The Netherlands.
INTRODUCTION: In rapid learning, data from routine patients from many institutions are combined to extract and update knowledge, such as prediction models. But the sharing of routine clinical data is hampered by political, administrative, ethical and technical barriers. The aim of this work is to describe an approach that has overcome these barriers and show an example of a rapid learning application in head and neck cancer.
METHODS: An Australian-European rapid learning collaboration community was formed, co-ordinated by the University of Sydney. Data extraction and mining tools were installed at Liverpool Hospital and Illawarra Cancer Care Centre as well as at a European centre (MAASTRO Clinic, The Netherlands). Using solely open source tools (Kettle, PostgreSQL, DCM4CHEE, CTP) diagnostic, imaging, RT planning, treatment and outcome data are extracted from local data sources, de-identified and stored in a semantic interoperable data warehouse inside each hospital. This approach met three high level requirements: a) individual patient data never leaves the institute, b) analysis comes to the data, is transparent and is statistical in nature, and c) full semantic interoperability is achieved for all patients with limited resources. The system was used to learn a prediction model for two-year survival of laryngeal cancer patients treated with radiation therapy based on European routine patients data (n=994) and to validate this model in routine data from Australia (n=150) without data leaving the individual institutions.
RESULTS: The system was implemented in 10 weeks in the Australian institutes. The laryngeal survival model successfully identified high and low risk groups in the Australian patient population using as input parameters Age, Gender, T-Stage, N-Stage, Tumour location, Hemoglobin levels and Radiation Dose.
DISCUSSION & CONCLUSIONS: A rapid learning community is feasible if it is supported by a system that addresses administrative, ethical, political and technical barriers to sharing data. As an example of rapid learning, a prediction model for survival in laryngeal cancer patients learned in one member was successfully validated in another institute across continents without data leaving the individual institutes. Future work focuses on using the data from all institutes to learn the prediction model. This is expected to make the model more generalizable to different patient populations that exist at different institutes.
ACKNOWLEDGEMENTS: DoHA BARO scheme.
EPSM-1133 Mon 4th Nov 14:00 Golden Ballroom South Radiotherapy
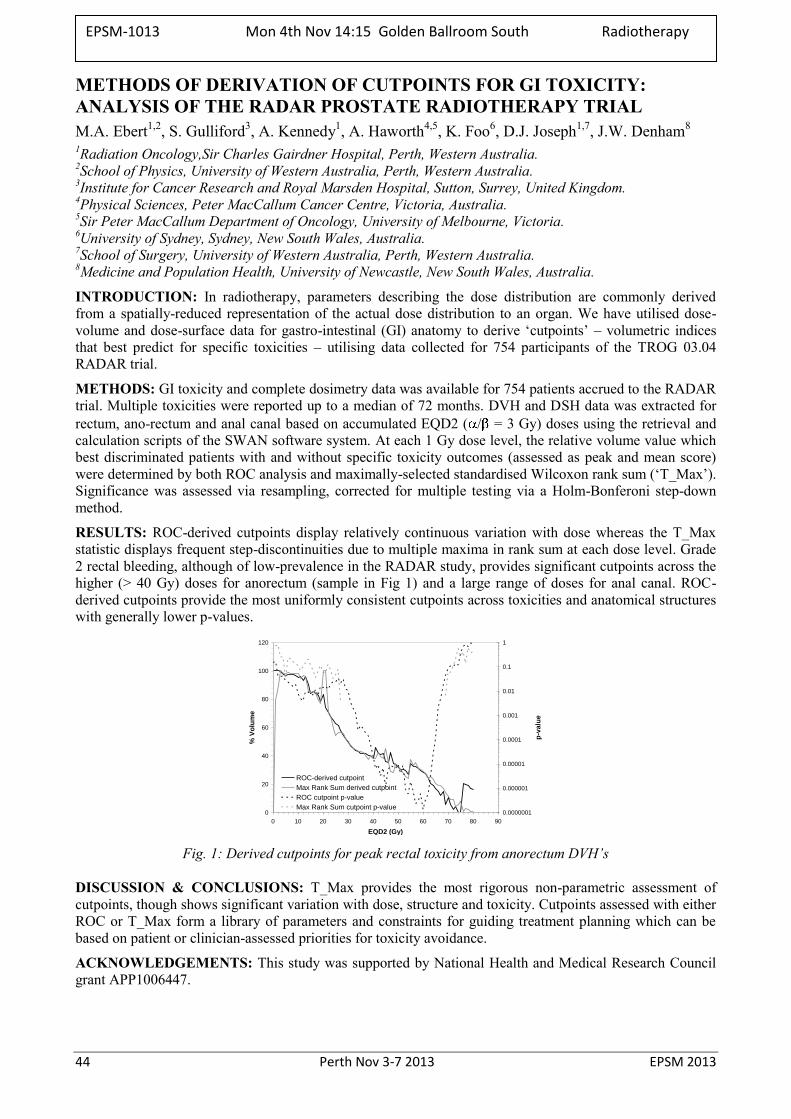
44 Perth Nov 3-7 2013 EPSM 2013
METHODS OF DERIVATION OF CUTPOINTS FOR GI TOXICITY: ANALYSIS OF THE RADAR PROSTATE RADIOTHERAPY TRIAL M.A. Ebert1,2, S. Gulliford3, A. Kennedy1, A. Haworth4,5, K. Foo6, D.J. Joseph1,7, J.W. Denham8
1Radiation Oncology,Sir Charles Gairdner Hospital, Perth, Western Australia. 2School of Physics, University of Western Australia, Perth, Western Australia. 3Institute for Cancer Research and Royal Marsden Hospital, Sutton, Surrey, United Kingdom. 4Physical Sciences, Peter MacCallum Cancer Centre, Victoria, Australia. 5Sir Peter MacCallum Department of Oncology, University of Melbourne, Victoria. 6University of Sydney, Sydney, New South Wales, Australia. 7School of Surgery, University of Western Australia, Perth, Western Australia. 8Medicine and Population Health, University of Newcastle, New South Wales, Australia.
INTRODUCTION: In radiotherapy, parameters describing the dose distribution are commonly derived from a spatially-reduced representation of the actual dose distribution to an organ. We have utilised dose-volume and dose-surface data for gastro-intestinal (GI) anatomy to derive ‘cutpoints’ – volumetric indices that best predict for specific toxicities – utilising data collected for 754 participants of the TROG 03.04 RADAR trial.
METHODS: GI toxicity and complete dosimetry data was available for 754 patients accrued to the RADAR trial. Multiple toxicities were reported up to a median of 72 months. DVH and DSH data was extracted for rectum, ano-rectum and anal canal based on accumulated EQD2 ( / = 3 Gy) doses using the retrieval and calculation scripts of the SWAN software system. At each 1 Gy dose level, the relative volume value which best discriminated patients with and without specific toxicity outcomes (assessed as peak and mean score) were determined by both ROC analysis and maximally-selected standardised Wilcoxon rank sum (‘T_Max’). Significance was assessed via resampling, corrected for multiple testing via a Holm-Bonferoni step-down method.
RESULTS: ROC-derived cutpoints display relatively continuous variation with dose whereas the T_Max statistic displays frequent step-discontinuities due to multiple maxima in rank sum at each dose level. Grade 2 rectal bleeding, although of low-prevalence in the RADAR study, provides significant cutpoints across the higher (> 40 Gy) doses for anorectum (sample in Fig 1) and a large range of doses for anal canal. ROC-derived cutpoints provide the most uniformly consistent cutpoints across toxicities and anatomical structures with generally lower p-values.
0
20
40
60
80
100
120
0 10 20 30 40 50 60 70 80 90
EQD2 (Gy)
% V
olu
me
0.0000001
0.000001
0.00001
0.0001
0.001
0.01
0.1
1
p-v
alu
e
ROC-derived cutpoint
Max Rank Sum derived cutpoint
ROC cutpoint p-value
Max Rank Sum cutpoint p-value
Fig. 1: Derived cutpoints for peak rectal toxicity from anorectum DVH’s
DISCUSSION & CONCLUSIONS: T_Max provides the most rigorous non-parametric assessment of cutpoints, though shows significant variation with dose, structure and toxicity. Cutpoints assessed with either ROC or T_Max form a library of parameters and constraints for guiding treatment planning which can be based on patient or clinician-assessed priorities for toxicity avoidance.
ACKNOWLEDGEMENTS: This study was supported by National Health and Medical Research Council grant APP1006447.
EPSM-1013 Mon 4th Nov 14:15 Golden Ballroom South Radiotherapy
EPSM 2013 Perth Nov 3-7 2013 45
A NATIONAL VMAT AUDIT: CREDENTIALING SITES TO USE VMAT IN MULTI-CENTRE CLINICAL TRIALS W. Hackworth1, D. Wilkinson2, J. Kenny3, T. Eade4, C.H. Clark5,6, A. Haworth1,7 1Peter MacCallum Cancer Centre, Melbourne, Victoria. 2Illawarra Cancer Care Centre Wollongong, New South Wales. 3Radiation Oncology Queensland, Toowoomba, Queensland. 4Northern Sydney Cancer Centre, Royal North Shore Hospital, St Leonard, New South Wales. 5Royal Surrey County Hospital, Guildford, UK. 6National Physical Laboratory, London, UK. 7University of Melbourne, Melbourne, Victoria.
INTRODUCTION: Clinical trial QA programs are designed to minimise the possibility of systematic discrepancies in treatment delivery between participating institutions. For clinical trials that incorporate new or complex treatment technology or techniques it is commonly expected that each clinical trial site will participate in an external dosimetry audit. Such audits are costly, time consuming and need dedicated physicists with expertise with new or complex treatment technology or techniques to execute the audits. In this project we ask: can an appropriately executed, patient specific QA program replace an external dosimetry audit for clinical trials incorporating volumetric modulated arc therapy (VMAT) techniques?
METHODS: An Octavius 4D phantom with a 2D array insert has been made available for this project. Commissioning of the phantom has commenced with site visits scheduled for the final quarter of 2013. In collaboration with The UK National Cancer Research Institute (NCRI) Radiotherapy Trials Quality Assurance (RTTQA) group [1], clinical trial centres are required to create treatment plans for a “demanding” test case and a typical clinical plan. Prior to the site visit, these plans are validated using the in-house QA program.
RESULTS: The series of UK studies (utilising the Octavius II phantom), determined the 2D-array was sensitive to dose discrepancies and suitable for the purpose of the proposed audit. Previous experience with fixed gantry angle IMRT QA within TROG clinical trials has demonstrated a wide range of practices for in-house patient specific QA procedures. However, in an external audit of 19 centres, Healy at al. [2] reported all centres were able to deliver the dose at the isocentre within 3% of the planned dose, and gamma analysis pass rate greater than 90% with a 5%3 mm criterion was achieved for all centres in a plane through the isocentre, and in 18 centres, in a plane posterior to the isocentre.
DISCUSSION & CONCLUSIONS: The uptake of VMAT techniques in Australia has been relatively slow but is expected to increase as evidence for the benefits of this technique are demonstrated. Whilst the IMRT audit of Healy et al [2] demonstrated excellent standards in treatment delivery for this complex technique, Williams et al [3] have reported a number of dosimetric discrepancies requiring further investigation in the process of conducting Level I and II audits. Based on the evidence so far, it would appear that external dosimetry audits play an important role in identifying dosimetric issues that may lead to systematic discrepancies in treatment delivery between centres participating in clinical trials. However, the proposed audit aims to investigate the value of conducting a VMAT end-to-end external dosimetry audit in comparison with acceptance of Level I/II audits to complement the centre’s own on-house patient specific QA program.
REFERENCES: 1. Hussein, M., et al (2013). Radiother Oncol. in press 2. Healy, B., et al. (2013). Med Phys, 40, 071706. 3. Williams, I., et al (2012). Australas Phys Eng Sci Med, 35, 407-11.
ACKNOWLEDGEMENTS: We would like to thank Nucletron Pty Ltd for the loan of the phantom, The TROG office (in particular J.Hatton) and Prof T Kron for their support of this project, and The UK audit group for sharing their documentation and experience in conducting a similar project.
EPSM-1110 Mon 4th Nov 14:30 Golden Ballroom South Radiotherapy
46 Perth Nov 3-7 2013 EPSM 2013
DESIGN AND METHODOLOGY OF A PROSPECTIVE TRIAL TO IMPROVE THE UNDERSTANDING OF KIDNEY RADIATION DOSE RESPONSE J. Lopez Gaitan1,2, M.A. Ebert1,2, M. House1, P. Robins3, J. Boucek3, B. O’Mara3, P. Podias2, G. Waters2, S. Bydder2, T. Leong4, J. Chu4, M. Hofman5, N.A. Spry2,6 1School of Physics, The University of Western Australia, Perth, Australia. 2Department of Radiation Oncology, Sir Charles Gairdner Hospital, Perth, Australia. 3Department of Nuclear Medicine, Sir Charles Gairdner Hospital, Perth, Australia. 4Department of Radiation Oncology, Peter MacCallum Cancer Centre, Melbourne, Australia. 5Centre for Cancer Imaging, Peter MacCallum Cancer Centre, Melbourne, Australia.
6School of Medicine and Pharmacology, The University of Western Australia, Perth, Australia.
INTRODUCTION: The kidneys are a principal dose-limiting organ in radiotherapy for upper abdominal cancers. Our current understanding of kidney dose response and tolerance is limited and this is hindering efforts to introduce advanced radiotherapy techniques for upper-abdominal cancers. More precise dose-volume response models that allow direct correlation of delivered radiation dose with spatio-temporal changes in kidney function may improve radiotherapy treatment planning for upper-abdominal tumours [1]. The aim of this study is to utilise radiotherapy and combined anatomical/functional imaging data to allow direct correlation of radiation dose with spatio-temporal changes in kidney function. The data can then be used to develop a more precise dose-volume response model which has the potential to optimise and individualise upper abdominal radiotherapy plans.
METHODS: The Radiotherapy of Abdomen with Precise Renal Assessment with SPECT/CT Imaging (RAPRASI) is an observational clinical research study being conducted at Sir Charles Gairdner Hospital (SCGH) in Perth, and the Peter MacCallum Cancer Centre (PMCC) in Melbourne. Eligible patients are those with upper gastrointestinal cancer, without metastatic disease, undergoing conformal radiotherapy that will involve incidental radiation to one or both kidneys. For each patient, total kidney function is being assessed before commencement of radiotherapy treatment and then at 4, 12, 26, 52 and 78 weeks after the first radiotherapy fraction, using two procedures: a Glomerular Filtration Rate (GFR) measurement using the 51Cr-ethylenediamine tetra-acetic acid (EDTA) clearance; and a regional kidney perfusion measurement assessing renal uptake of 99mTc-dimercaptosuccinic acid (DMSA), imaged with a Single Photon Emission Computed Tomography / Computed Tomography (SPECT/CT) system. The CT component of the SPECT/CT provides the anatomical reference of the kidney’s position. The data is intended to reveal changes in regional kidney function over the study period after the radiotherapy. The SPECT/CT scans, co-registered with the radiotherapy treatment plan, will provide spatial correlation between the radiation dose and regional renal function as assessed by SPECT/CT. From this correlation, renal response patterns will likely be identified with the purpose of developing a predictive model.
DISCUSSION & CONCLUSIONS: The project has commenced recruitment and a limited amount of patient data has been collected. Recruitment has been challenging due to patients typically being at an advanced stage, combined with the challenge of repeated hospital visits for follow-up studies. Tools are under development to derive the correlation of regional functional kidney changes with planned radiotherapy dose. There are no conclusions yet, but the data obtained from this project will guide decision making in treatment planning for upper-abdominal radiotherapy.
REFERENCES: 1. Dawson LA et al: Radiation-Associated Kidney Injury. Int. J. Radiat. Oncol. Biol. Phys. 2010, 76(3, Supplement 1):S108-S115.
ACKNOWLEDGEMENTS: RAPRASI is funded by Priority-driven Collaborative Cancer Research Scheme (PdCCRs) grant 10027005 from Cancer Australia and the Australian Commonwealth Department of Health and Ageing, Radiation Oncology Section.
EPSM-1239 Mon 4th Nov 14:45 Golden Ballroom South Radiotherapy
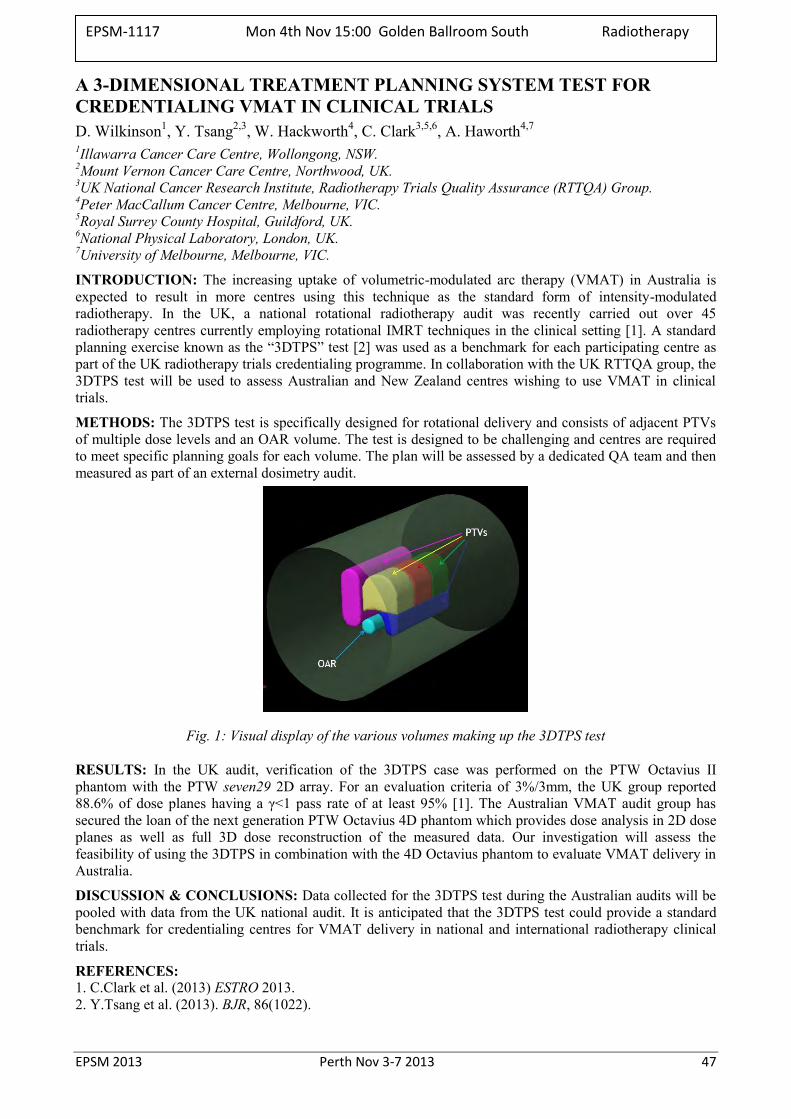
EPSM 2013 Perth Nov 3-7 2013 47
A 3-DIMENSIONAL TREATMENT PLANNING SYSTEM TEST FOR CREDENTIALING VMAT IN CLINICAL TRIALS D. Wilkinson1, Y. Tsang2,3, W. Hackworth4, C. Clark3,5,6, A. Haworth4,7
1Illawarra Cancer Care Centre, Wollongong, NSW. 2Mount Vernon Cancer Care Centre, Northwood, UK. 3UK National Cancer Research Institute, Radiotherapy Trials Quality Assurance (RTTQA) Group. 4Peter MacCallum Cancer Centre, Melbourne, VIC. 5Royal Surrey County Hospital, Guildford, UK. 6National Physical Laboratory, London, UK. 7University of Melbourne, Melbourne, VIC.
INTRODUCTION: The increasing uptake of volumetric-modulated arc therapy (VMAT) in Australia is expected to result in more centres using this technique as the standard form of intensity-modulated radiotherapy. In the UK, a national rotational radiotherapy audit was recently carried out over 45 radiotherapy centres currently employing rotational IMRT techniques in the clinical setting [1]. A standard planning exercise known as the “3DTPS” test [2] was used as a benchmark for each participating centre as part of the UK radiotherapy trials credentialing programme. In collaboration with the UK RTTQA group, the 3DTPS test will be used to assess Australian and New Zealand centres wishing to use VMAT in clinical trials.
METHODS: The 3DTPS test is specifically designed for rotational delivery and consists of adjacent PTVs of multiple dose levels and an OAR volume. The test is designed to be challenging and centres are required to meet specific planning goals for each volume. The plan will be assessed by a dedicated QA team and then measured as part of an external dosimetry audit.
Fig. 1: Visual display of the various volumes making up the 3DTPS test
RESULTS: In the UK audit, verification of the 3DTPS case was performed on the PTW Octavius II phantom with the PTW seven29 2D array. For an evaluation criteria of 3%/3mm, the UK group reported 88.6% of dose planes having a γ<1 pass rate of at least 95% [1]. The Australian VMAT audit group has secured the loan of the next generation PTW Octavius 4D phantom which provides dose analysis in 2D dose planes as well as full 3D dose reconstruction of the measured data. Our investigation will assess the feasibility of using the 3DTPS in combination with the 4D Octavius phantom to evaluate VMAT delivery in Australia.
DISCUSSION & CONCLUSIONS: Data collected for the 3DTPS test during the Australian audits will be pooled with data from the UK national audit. It is anticipated that the 3DTPS test could provide a standard benchmark for credentialing centres for VMAT delivery in national and international radiotherapy clinical trials.
REFERENCES: 1. C.Clark et al. (2013) ESTRO 2013. 2. Y.Tsang et al. (2013). BJR, 86(1022).
EPSM-1117 Mon 4th Nov 15:00 Golden Ballroom South Radiotherapy
48 Perth Nov 3-7 2013 EPSM 2013
DATA MINING FOR PREDICTION OF OUTCOMES IN LUNG CANCER PATIENTS TREATED WITH RADIOTHERAPY L. Holloway1, A. George1, G. Goozee1, M. Bailey2, M. Carolan2, A. Miller2, D. Thwaites3, A. Dekker1,2,3,4 1Cancer Therapy Centre, Liverpool Hospital, NSW, Australia. 2Illawarra Cancer Care Centre, Wollongong, NSW, Australia. 3Institute of Medical Physics, School of Physics, University of Sydney, NSW, Australia. 4Maastricht Radiation Oncology (MAASTRO), Maastricht, The Netherlands.
INTRODUCTION: Individualized cancer care requires an accurate estimate of outcomes for personalized treatment options. For lung cancer treated with radiation therapy these include the radiation dose, fractionation, chemotherapy regimen as well as a number of advanced treatment techniques such as IGRT, respiratory gating, IMRT, SBRT and perhaps in future protons, MRI guided therapy etc.. However there are currently no validated tools that can reliably support physicians and patients when making a decision for a given treatment. The aim of this study is to mine data from previously treated lung cancer patients both from Europe and Australia to learn and validate a prediction model for outcomes after radiation therapy.
METHODS: As a pilot for a NSW wide rapid learning healthcare network, data extraction and mining tools have been installed at Liverpool Hospital and Illawarra Cancer Care Centre as well as at a European centre (MAASTRO Clinic, The Netherlands). These tools are all open source and, when combined in a rapid learning system, can extract, de-identify and store diagnostic, imaging, radiotherapy planning, treatment and outcome data from local data sources. From this data, prediction models can be learned using machine learning approaches such as Bayesian Networks and Support Vector Machines, without the need for patient data to leave the hospital.
RESULTS: As a demonstrator for this approach, a previously published lung cancer survival prediction model (see www.predictcancer.org) created using European data was validated in Australian routine patient data from two radiotherapy departments. A novel outcome prediction model was created from the patient data of one Australian centre and subsequently validated in another Australian and an European centre.
DISCUSSION & CONCLUSIONS: A rapid learning network that mines historical data for prediction of outcomes in new patients is possible while preserving patient privacy and each hospital’s control of their own data. The models learned from data mining are better than physicians in predicting outcomes.
ACKNOWLEDGEMENTS: DoHA BARO scheme.
EPSM-1132 Mon 4th Nov 15:15 Golden Ballroom South Other
EPSM 2013 Perth Nov 3-7 2013 49
REFLECTIVE PRACTICE TO ASSESS THE IMPLEMENTATION OF A RADIATION THERAPY CLINICAL ORIENTATION PROGRAM FOR TRAINEE RADIATION ONCOLOGY MEDICAL PHYSICISTS M. West1, J. Besson1, T. Bui1, J. Hume1, N. Battersby1, M. Mauro1, C. Brady2, A. Dry3 1Princess Alexandra Hospital, Ipswich Road, Woolloongabba, Queensland, Australia. 2Radiation Oncology Mater Centre, South Brisbane, Queensland, Australia. 3Royal Brisbane and Women’s Hospital, Hurston, Queensland, Australia.
INTRODUCTION: The use of reflective practice in clinical education, particularly in observational and experiential learning, is established [1,2,3,4] as a valuable tool for developing healthcare professionals.
This work reports on our experience adopting this technique for a cohort of trainee radiation oncology medical physicists (ROMPs) fulfilling requirements for the Australasian College of Physical Scientists and Engineers in Medicine’s (ACPSEM) Training Education and Assessment Program (TEAP) [5].
METHODS: The TEAP Syllabus was used to plan semi-structured clinical placements for ROMP trainees at the Princess Alexandra Hospital and Royal Brisbane and Women’s Hospital, Brisbane. Reflective prompts were provided to the trainees to elucidate intended learning outcomes when observing Radiation Therapy (RT) practice in treatment simulation, planning and delivery.
The success of the placements was assessed from the reflective summaries for the trainees and through anonymous survey of trainees and participating RT supervisors (clinical educators, senior radiation therapists).
RESULTS: Reflective summaries of the trainees suggest a significant benefit to their understanding of patient-related clinical experiences. The trainee ROMPs also reflected on an improved understanding of how their role as qualified ROMPs fit into the multidisciplinary context of cancer care. Surveys of the two groups suggest greater inter-professional awareness leading to an increased mutual respect. RTs identified time constraints and a desire for providing opportunity for ROMPs to see greater variety of treatment techniques.
DISCUSSION & CONCLUSIONS: The authors feel this has contributed to positive workflow improvement with potential benefits for patient care. The surveys also suggest room for improvement for future cohorts of trainees with ROMPs highlighting an interest in pursuing more treatment planning experiences.
This preliminary work has shown the value of the clinical introduction module in TEAP for producing rounded ROMP professionals as well as reflective practice as a validation tool for this educational design.
REFERENCES: 1. Mann K., Gordon J., MacLeod A., Reflection and reflective practice in health professions education:
a systematic review, Adv in Health Sci Educ 2009, 14:595-621 2. Grierson L., Barry M., Kapralos B., Carnahan H., Dubrowski A., The role of collaborative
interactivity in the observational practice of clinical skills, Medical Education 2012, 46:409-416 3. Sandars J., The use of reflection in medical education: AMEE Guide No. 44, Association of Medical
Education in Europe 2010, United Kingdom. 4. Epp S., The value of reflective journaling in undergraduate nursing education: A literature review,
International Journal of Nursing Studies 2008, 45:1379-1388. 5. ACPSEM, Training, Education and Assessment Program for Radiation Oncology Medical Physics,
Australasian College of Physical Scientists and Engineers in Medicine 2012, Mascot Sydney.
ACKNOWLEDGEMENTS: Participating Radiation Therapist Supervisors, specifically Majella Russo and Ryan Smith at the Princess Alexandra Hospital.
EPSM-1099 Mon 4th Nov 13:30 Golden Ballroom Centre Education
50 Perth Nov 3-7 2013 EPSM 2013
USING 2D AND FULLY IMMERSIVE 3D VIRTUAL REALITY LINACS TO ENHANCE MEDICAL PHYSICS TEACHING C. Hansen1, P. Wilson2, J. O’Byrne3, Y. Jimenez4, D. Thwaites1 1Institute of Medical Physics, School of Physics, University of Sydney, NSW 2Medical Physics, Royal Adelaide Hospital, Universities of Adelaide and South Australia 3Sydney Univ Physics Education Research Group, School of Physics, Univ. Sydney, NSW 4Radiation Oncology School, University of Sydney, NSW
INTRODUCTION: Traditionally the practical teaching/demonstrating to medical physics masters students on how linacs operate and how radiation therapy is delivered is done on site in radiation oncology departments, often after hours and adding a burden to hard-pressed clinical ROMPs. If the basics could be taken back into the universities this would be an efficient and effective teaching tool, allowing students more time to interact with systems and at the same time removing workload from clinical staff. However the universities dont have clinical linacs. Or do they? Each Australian RT School has been provided with (or access to) a VERT* 3D immersive virtual reality linear accelerator simulated system and a number of 2D licences for additional teaching purposes; and in addition a 0.5FTE VERT RT academic, also via DoHA BARO funding. Initial work has been carried out to test the value of using these systems for medical physics teaching.
METHODS: Within the context of the Medical Physics University Network (MPUN, a BARO funded project linking the 6 universities that provide medical physics masters programs), a number of 2D licences have been acquired for use in the 4 institutions that have access to an RT School with a VERT system. The other two universities will access these facilities at one of the other institutions. The 2D licenses are an additional licence for the existing overall 2D/3D system and can be used in normal classrooms, as well using the fully 3D system. The MPUN funding also provided a 0.5FTE education/network medical physics academic post to each university; and they are working with their local RT VERT link person to explore the potential of VERT to enhance the MMedPhys teaching and student experience. The VERT modules and facilities have been explored and aligned with the possible areas of teaching in the MMedPhys courses that they can contribute to. A limited set of pilot modules have been developed and tested with Masters student cohorts, to assess their impact, making use of the Sydney University Physics Education Research group’s validated approaches and tools for this, including before and after surveys and questionaires to students.
RESULTS: The VERT systems include 3D simulated virtual reality clinical linac operation, using very cool virtual reality goggles and a full simulation of a treatment room, couch, linac, etc. which can be switched between realistic (real room filmed) Varian and Elekta machines; a full 3D CT anatomy ‘patient’; DICOM plan transfer (thus linking to treatment planning practicals); treatment delivery (including of IMRT, VMAT, etc); simulation of a range of errors in treatment and their identification and effects; and a ‘physics module’ which provides virtual reality water tank measurements, chamber calibration, beam calibration and a range of QA procedures. The initial developed modules include linac operation and delivering plans the students have developed in local TPSs practicals. The application of the assessment tools to evaluate engagement of the students and their learning outcomes was shown to be valid, but the tools are currently under further modification to fit the exact scenarios.
DISCUSSION & CONCLUSIONS: The assessed facilities are valuable for medical physics teaching and learning. The range of VERT facilities can enhance teaching of various parts of the radiation oncology medical physics syllabus. Teachers and students engage enthusiastically with the system. Collaboration of Medical Physics and RT lecturers is synergistically valuable. This approach has significant potential to take load off the clinical workforce (although real-life experience is also required) and also to greatly enhance students learning and understanding. Further exploration and development of this approach is recommended.
*Vertual Ltd, Hull, UK
ACKNOWLEDGEMENTS: DoHA BARO scheme
EPSM-1202 Mon 4th Nov 13:45 Golden Ballroom Centre Education
EPSM 2013 Perth Nov 3-7 2013 51
ACPSEM MEDICAL PHYSICS CERTIFICATION – A REPORT ON PROGRESS TO INTERNATIONAL RECOGNITION L. Oliver Institute of Medical Physics, Department of Physics, University of Sydney, Sydney, NSW.
INTRODUCTION: Many Australian and New Zealand medical physicists have worked overseas at some time in their career. Some of the more common reasons are to seek further experience and knowledge, obtain formal medical physics qualifications and training, pursue research opportunities and, as a long term goal, use the experience for progression in their future career. It was initially a means of gaining professional recognition. When ACPSEM implemented the training, education and assessment programs (TEAP) and certification examinations for therapy physics in 2003, and for imaging physics since, then the need to obtain overseas experience has become less obvious. Nevertheless, it is an important option to have readily available.
Governments and the general public in most countries are now much more aware of the need for proper standards of TEAP and Certification. The requirements to practice as a qualified medical physicist have tightened considerably and it is no longer as easy to arrange work in overseas countries.
METHODS: This presentation provides a progress report on the ACPSEM work carried out during the last 3 years related to international certification. This includes:
a) establishing a level of understanding of medical physics certification between the ACPSEM and the UK, USA and Canada and;
b) the work of the IOMP to establish a register of approved certification programs administered by the International Medical Physics Certification Board (IMPCB).
RESULTS: Changes in legislative requirements, registration and the fragmentation of bodies responsible for TEAP and certification have made the UK and American tasks more difficult than was first anticipated. The current situation and progress will be reported. ACPSEM is establishing guidelines for any of our certified medical physicists seeking employment in these countries. The ACPSEM is also actively involved in establishing an IOMP procedure for the auditing and assessment of certification programs organised by a country or region. Oliver [1] proposed a plan of action for the IMPCB at the 2012 International Medical Physics and Biomedical Engineering Congress in Beijing. Since then, the IOMP has indicated its interest in the review and audit of the ACPSEM TEAP and Certification programs [2]. The experience gained from the ACPSEM assessment would greatly assist the IMPCB accreditation and certification task groups to establish an international equivalent assessment procedure.
DISCUSSION & CONCLUSIONS: It is important that the medical physics community is aware of the current status, the initiatives underway and the difficulties encountered in establishing a more efficient, transparent international network for certified medical physicists.
REFERENCES: 1. L.D. Oliver. International Medical Physics Certification: But what else is needed for International
acceptance? World Congress on Medical Physics and Biomedical Engineering May 26-31, 2012, Beijing, China, IFMBE Proceedings Volume 39, 2013, pp. 1679-1682.
2. W. Beckham, B. Gerbi, D. Pearson, Report to ACPSEM and Department of Health and Ageing, Commonwealth Government: International Panel Review of the ACPSEM TEAP training Scheme, June 2013.
ACKNOWLEDGEMENTS: This work was part of a ROSTAMP grant to the ACPSEM from the Department of Health and Ageing, the Commonwealth Government.
EPSM-1092 Mon 4th Nov 14:00 Golden Ballroom Centre Education

52 Perth Nov 3-7 2013 EPSM 2013
STATUS OF THE ACPSEM RADIATION ONCOLOGY MEDICAL PHYSICS TRAINING EDUCATION AND ASSESSMENT PROGRAM G. Warr, A. Perkins, C. Irle, S. Day, A. Wong, R. Cruz, G. Barbaro Australasian College of Physical Scientists & Engineers in Medicin, NSW, Australia.
INTRODUCTION: The ACPSEM Radiation Oncology Medical Physics (ROMP) Training Education and Assessment Program (TEAP) is a structured, supervised clinical training program for working trainees, which also supports them to complete an appropriate postgraduate degree. It was established to provide high quality and consistent training to Australasian medical physicists to meet the current and anticipated workforce shortages of qualified medical physicists [1, 2].
DISCUSSION: ROMP TEAP continued to strengthen throughout 2013. There are now 34 accredited training centres, 7 accredited universities and 101 registrars in the program and there are 52 graduates of the program, with 30 graduates expected in 2013. The program is heavily reliant on Australian Government funding, however the Allen Consulting Group’s report [3] commissioned this year provides recommendations on ways to diversify the funding base for the program to ensure its sustainability into the future. Major developments in the program in 2013 have been aligned with deliverables under the extension of the Australian Government Department of Health and Ageing Radiation Oncology Strengthening the Australian Medical Physics (RO-STAMP) workforce grant. These include: Accreditation of new and, as required, re-accreditation of existing training centres and universities in the
program Recruitment and training of assessors to perform registrar annual progress reviews Development of a comprehensive implementation plan for the TEAP Review recommendations Implementation of the program’s Clinical Training Guide in the progressive assessment framework Redevelopment of the Clinical Training Guide as an eLearning program Development and delivery of national and state supervisor training and support workshops Development of an e-learning system including web-based learning resources and delivery of on-line
lecture series Implementation of a system for assessment and certification of overseas trained medical physicists Progress on mutual recognition of qualified medical physicists Review of the TEAP program by an international team of radiation oncology medical physics training
program experts from USA, Canada and the UK.
An overview of the status of the program and these developments will be given.
CONCLUSIONS: The ACPSEM ROMP TEAP program is well established and continues to strengthen and provide qualified medical physicists for the Australasian workforce. It will need to build on this success and expand to meet the workforce demands.
REFERENCES: 1. Planning for the Best: the Tripartite National Strategic Plan for Radiation Oncology (Australia) 2012-
2022. www.radiationoncology.com.au. 2. Allen Consulting Group (2012), Projecting the radiation oncology workforce, Input to the Tripartite
National Strategic Plan For Radiation Oncology in Australia, Report to The Royal Australian and New Zealand College of Radiologists.
3. Allen Consulting Group (2013), Strengthening the Australian Medical Physics Profession: Analysis of the sustainability of TEAP for ROMPs and evaluation of ROSTAMP, Report to the Australasian College of Physical Scientists & Engineers in Medicine.
ACKNOWLEDGEMENTS: This Project is funded by the Australian Government Department of Health and Ageing.
EPSM-1107 Mon 4th Nov 14:15 Golden Ballroom Centre Education

EPSM 2013 Perth Nov 3-7 2013 53
ACPSEM E-LEARNING SYSTEM – INNOVATION IN EDUCATION AND PROFESSIONAL DEVELOPMENT FOR MEDICAL PHYSICISTS A. Perkins, C. Irle, G. Warr, S. Day, A. Wong Australasian College of Physical Scientists and Engineers in Medicine, Sydney, New South Wales.
INTRODUCTION: In recent years, online learning management systems, (commonly referred to as LMS) have become increasingly popular in the educational field. LMS offers many advantages for the training and professional development of medical physicists. Training materials and learning resources can be made available 24 hours a day to those who need them regardless of their geographical location. This is particularly valuable for the ACPSEM, with a relatively small number of members spread over a wide geographical range in Australia and New Zealand. The ACPSEM’s e-learning platform was established in 2009 using the Moodle LMS, and has been extensively developed in the past two years. This presentation will illustrate some of the key features of the e-learning system already available to ACPSEM members and registrars.
SUMMARY: Key components of the e-learning system to be described during this presentation include:
For TEAP registrars, the Online Progress Tracker and Online Clinical Training Guide to monitor progress through their training. Registrars can upload training evidence for review by clinical supervisors, examiners, assessors and ACPSEM office staff. Registrars can also access learning resources and training activities for key competencies.
For TEAP supervisors, access to information about clinical supervision, forums for communication with other supervisors and access to materials and learning activities from TEAP Supervisors’ Workshops.
For ACPSEM members, the CPD area, which includes online quizzes, recorded presentations from workshops and webinars.
For members of ACPSEM committees, forums and wiki sites for collaborative projects and access to shared files, meeting minutes and policies.
DISCUSSION & CONCLUSIONS: The ACPSEM e-learning system offers an ever-increasing range of facilities and resources for registrars, supervisors and members. The system allows information and resources to be easily shared by people at different geographic locations. It can be customized to meet the needs of the ACPSEM, ensuring that information is readily available to those who need it, while restricting access to confidential information. The system offers the chance to increase efficiency through reducing the need for paper based records and email correspondence.
REFERENCES: 1. https://moodle.org/
ACKNOWLEDGEMENTS: This Project is funded by the Australian Government Department of Health and Ageing
EPSM-1089 Mon 4th Nov 14:30 Golden Ballroom Centre Education
54 Perth Nov 3-7 2013 EPSM 2013
THE ACADEMIC MEDICAL PHYSICS UNIVERSITY NETWORK: INITIAL ACTIVITY AND PROGRESS D. Thwaites1, R. Franich2, M. Carolan3, A. Fielding4, M. House5, Z. Kuncic1, P. Metcalfe6, J. Pollard7, A. Rosenfeld6 1Institute of Medical Physics, School of Physics, University of Sydney, NSW, Australia. 2Medical Physics, School of Appl.Sciences, Royal Melbourne Institute of Technology, VIC, Australia. 3Illawarra Cancer Care Centre, Wollongong, NSW, Australia. 4Chem. Physics and Mech. Eng. School, Queensland University of Technology, Brisbane, Australia. 5Medical Physics, School of Physics, University of Western Australia, Perth, Australia. 6Centre for Medical Radiation Physics, Sch. Eng.Physics, University of Wollongong, NSW, Australia. 7Medical Physics, School of Chemistry and Physics, University of Adelaide, SA, Australia.
INTRODUCTION: A new national inter-university collaborative grouping was presented at EPSM 2012. It has close linkage to the ACPSEM University Working group, but independently represents the universities. Its core membership comprises the post-graduate Medical Physics program co-ordinators from the 6 Australian universities that provide Masters courses in Medical Physics. Its objectives include efficient development and usage of resources; collaborative proposals, bids and actions in academic Medical Physics; and support of and interfacing to clinical training and research. It aims to increase the capacity and development of national Medical Physics structures and systems at the academic level and thereby support the medical physics workforce. As this is a BARO (Better Access to Radiation Oncology) supported initiative, the main thrust is towards ROMP areas of interest, but the group would also consider extending this to other areas.
METHODS: The group successfully bid for two DoHA BARO grants; the first re networked university activities, including developing novel shared-resource teaching packages, eg using the VERT system; developing web-based information resources for use by students, medical physics registrars and as a resource for practising physicist CPD (linking into other CPD systems, eg Cancer Australia, ACPSEM); outreach to schools and undergraduates re medical physics careers and compilation of national medical physics student/graduate statistics. It provided 0.5 FTE of a post over 2 years to each university (generally being used as 1 FTE over one year). The second grant has pump-primed the creation of conjoint ‘clinical translational research’ posts between the universities and partner hospitals and also has provided 0.5 FTE posts to each of the 6 universities over 2 years. The grants have leveraged additional money from the universities themselves and from partner hospitals to create a number of such posts around the country.
RESULTS: The BARO funding timeline is from June 2012- June2014. However the sign-offs on contracts and the recruitment and appointment time of mainly overseas appointees has meant that the first post-holders began work in late Feb 2013 and posts are still being appointed to. Currently there are 11 such appointees, with a likely 25+ posts over the 2 years of current funding, with individuals having periods in Australia of 2 - 24 months (median duration is 12 months). Posts will continue beyond June 2014 using the leveraged funds. In general the conjoint research posts are bringing in expertise on various forms of advanced treatment and are working with hospitals in these areas; projects include VMAT, SBRT, 4D RT, implementation of FFF beams, DIR, health technology assessment, complex treatment planning, imaging in radiation oncology, etc.
DISCUSSION & CONCLUSIONS: The current development status of these initiatives is such that it can be predicted the programs will have a significant impact on research and development in a range of hospitals, in supporting registrar training and in the teaching and information resources available nationally. The project summary provides current information to the profession and gives the basis for discussion of the issues, the potential from these activities and possible longer-term sustainability.
ACKNOWLEDGEMENTS: DoHA BARO scheme.
EPSM-1113 Mon 4th Nov 14:45 Golden Ballroom Centre Education
EPSM 2013 Perth Nov 3-7 2013 55
E-LEARNING FOR CPD FOR MEDICAL PHYSICISTS W. H. Round School of Engneering, University of Waikato, Hamilton, New Zealand.
INTRODUCTION: The internet is increasingly being used for as a platform for providing learning opportunities to meet medical physicists’ continuing professional development (CPD) needs. But as a profession we do not take full advantage of its capabilities with only a few medical physicists’ professional organisations (MPPOs) providing educational on-line material suitable for CPD.
METHODS: An on-line search was carried out of all the web site of MPPOs in the International Organization of Medical Physics. Those sites that were not in English were translated with Google Translator. Those MPPOs that had educational material that was made available only to its members, or who made it generally available for payment of a fee were approached for permission to access the material. The surveyed material was collated and reviewed. Also all open-access medical physics journals were surveyed.
RESULTS: Apart from the well-known Emerald and EMIT sites, there was surprisingly little e-learning material to be found. The AAPM provides excellent resources to its members and to non-members who wish to pay for access. The ACPSEM contribution to e-learning is also notable and is developing strongly. The Biomedical Imaging and Interventional Journal site also contains a lot of materials. But the lack of material to be found elsewhere was quite disappointing and that which is available is quite hard to find.
DISCUSSION & CONCLUSIONS: As a profession we have not taken full advantage of the possibilities that it provides for giving access to our members for CPD. The material can be hard to find or has restricted access. There is no one central site where the material can be found and accessed easily and without cost. The establishment of such a site would require significant sponsorship for its establishment and maintenance. However, such a site would be a global asset and could coordinate the production of medical physics e-learning materials for CPD.
EPSM-1138 Mon 4th Nov 15:00 Golden Ballroom Centre Education
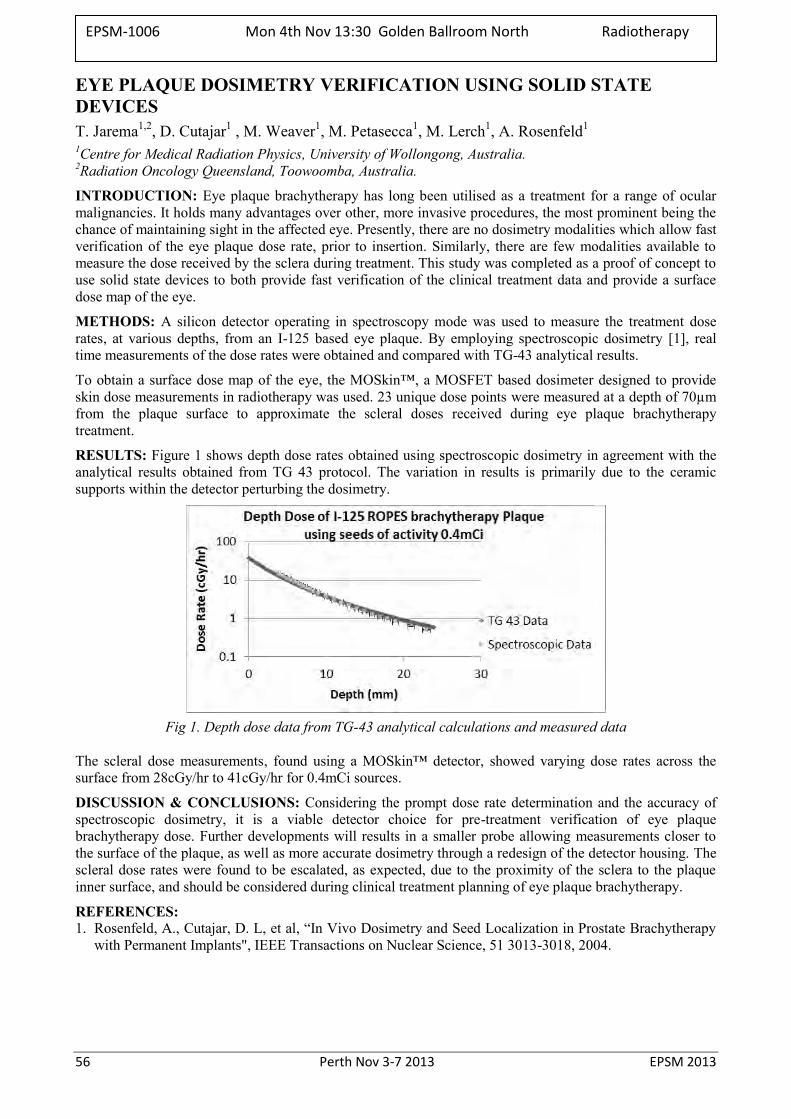
56 Perth Nov 3-7 2013 EPSM 2013
EYE PLAQUE DOSIMETRY VERIFICATION USING SOLID STATE DEVICES T. Jarema1,2, D. Cutajar1 , M. Weaver1, M. Petasecca1, M. Lerch1, A. Rosenfeld1
1Centre for Medical Radiation Physics, University of Wollongong, Australia. 2Radiation Oncology Queensland, Toowoomba, Australia.
INTRODUCTION: Eye plaque brachytherapy has long been utilised as a treatment for a range of ocular malignancies. It holds many advantages over other, more invasive procedures, the most prominent being the chance of maintaining sight in the affected eye. Presently, there are no dosimetry modalities which allow fast verification of the eye plaque dose rate, prior to insertion. Similarly, there are few modalities available to measure the dose received by the sclera during treatment. This study was completed as a proof of concept to use solid state devices to both provide fast verification of the clinical treatment data and provide a surface dose map of the eye.
METHODS: A silicon detector operating in spectroscopy mode was used to measure the treatment dose rates, at various depths, from an I-125 based eye plaque. By employing spectroscopic dosimetry [1], real time measurements of the dose rates were obtained and compared with TG-43 analytical results.
To obtain a surface dose map of the eye, the MOSkin™, a MOSFET based dosimeter designed to provide skin dose measurements in radiotherapy was used. 23 unique dose points were measured at a depth of 70µm from the plaque surface to approximate the scleral doses received during eye plaque brachytherapy treatment.
RESULTS: Figure 1 shows depth dose rates obtained using spectroscopic dosimetry in agreement with the analytical results obtained from TG 43 protocol. The variation in results is primarily due to the ceramic supports within the detector perturbing the dosimetry.
Fig 1. Depth dose data from TG-43 analytical calculations and measured data
The scleral dose measurements, found using a MOSkin™ detector, showed varying dose rates across the surface from 28cGy/hr to 41cGy/hr for 0.4mCi sources.
DISCUSSION & CONCLUSIONS: Considering the prompt dose rate determination and the accuracy of spectroscopic dosimetry, it is a viable detector choice for pre-treatment verification of eye plaque brachytherapy dose. Further developments will results in a smaller probe allowing measurements closer to the surface of the plaque, as well as more accurate dosimetry through a redesign of the detector housing. The scleral dose rates were found to be escalated, as expected, due to the proximity of the sclera to the plaque inner surface, and should be considered during clinical treatment planning of eye plaque brachytherapy.
REFERENCES: 1. Rosenfeld, A., Cutajar, D. L, et al, “In Vivo Dosimetry and Seed Localization in Prostate Brachytherapy
with Permanent Implants", IEEE Transactions on Nuclear Science, 51 3013-3018, 2004.
EPSM-1006 Mon 4th Nov 13:30 Golden Ballroom North Radiotherapy
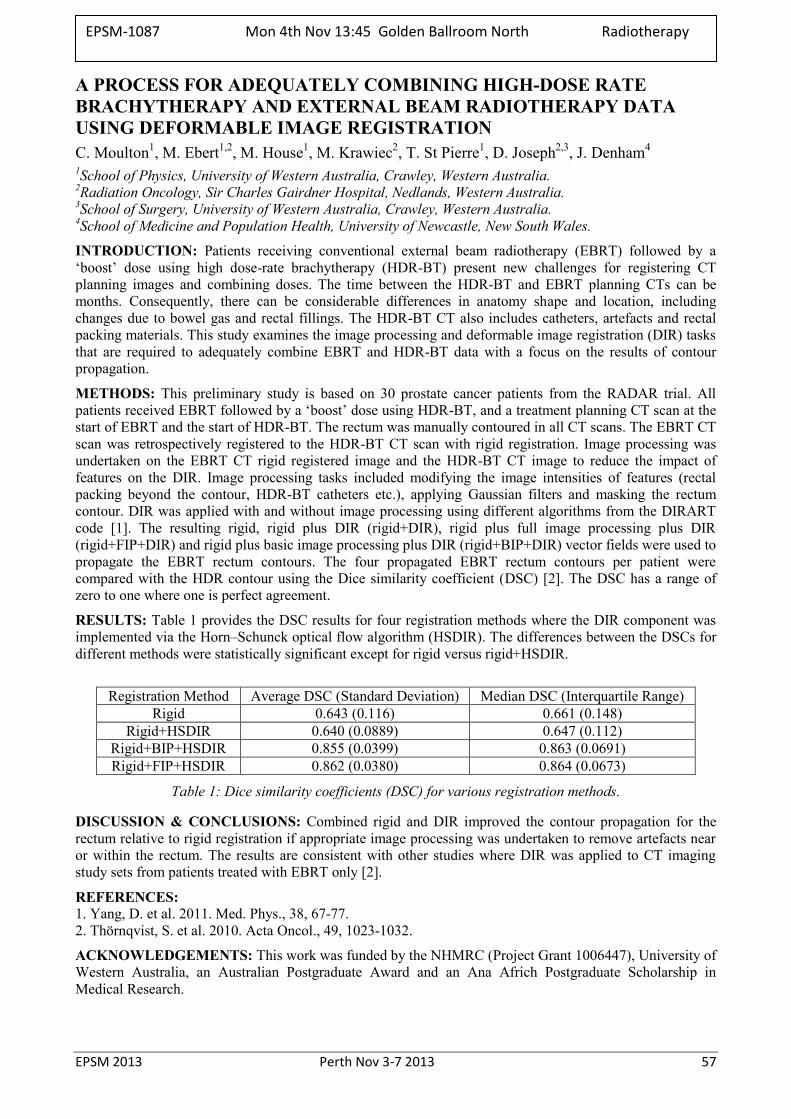
EPSM 2013 Perth Nov 3-7 2013 57
A PROCESS FOR ADEQUATELY COMBINING HIGH-DOSE RATE BRACHYTHERAPY AND EXTERNAL BEAM RADIOTHERAPY DATA USING DEFORMABLE IMAGE REGISTRATION C. Moulton1, M. Ebert1,2, M. House1, M. Krawiec2, T. St Pierre1, D. Joseph2,3, J. Denham4 1School of Physics, University of Western Australia, Crawley, Western Australia. 2Radiation Oncology, Sir Charles Gairdner Hospital, Nedlands, Western Australia. 3School of Surgery, University of Western Australia, Crawley, Western Australia. 4School of Medicine and Population Health, University of Newcastle, New South Wales.
INTRODUCTION: Patients receiving conventional external beam radiotherapy (EBRT) followed by a ‘boost’ dose using high dose-rate brachytherapy (HDR-BT) present new challenges for registering CT planning images and combining doses. The time between the HDR-BT and EBRT planning CTs can be months. Consequently, there can be considerable differences in anatomy shape and location, including changes due to bowel gas and rectal fillings. The HDR-BT CT also includes catheters, artefacts and rectal packing materials. This study examines the image processing and deformable image registration (DIR) tasks that are required to adequately combine EBRT and HDR-BT data with a focus on the results of contour propagation.
METHODS: This preliminary study is based on 30 prostate cancer patients from the RADAR trial. All patients received EBRT followed by a ‘boost’ dose using HDR-BT, and a treatment planning CT scan at the start of EBRT and the start of HDR-BT. The rectum was manually contoured in all CT scans. The EBRT CT scan was retrospectively registered to the HDR-BT CT scan with rigid registration. Image processing was undertaken on the EBRT CT rigid registered image and the HDR-BT CT image to reduce the impact of features on the DIR. Image processing tasks included modifying the image intensities of features (rectal packing beyond the contour, HDR-BT catheters etc.), applying Gaussian filters and masking the rectum contour. DIR was applied with and without image processing using different algorithms from the DIRART code [1]. The resulting rigid, rigid plus DIR (rigid+DIR), rigid plus full image processing plus DIR (rigid+FIP+DIR) and rigid plus basic image processing plus DIR (rigid+BIP+DIR) vector fields were used to propagate the EBRT rectum contours. The four propagated EBRT rectum contours per patient were compared with the HDR contour using the Dice similarity coefficient (DSC) [2]. The DSC has a range of zero to one where one is perfect agreement.
RESULTS: Table 1 provides the DSC results for four registration methods where the DIR component was implemented via the Horn–Schunck optical flow algorithm (HSDIR). The differences between the DSCs for different methods were statistically significant except for rigid versus rigid+HSDIR.
Registration Method Average DSC (Standard Deviation) Median DSC (Interquartile Range)
Rigid 0.643 (0.116) 0.661 (0.148) Rigid+HSDIR 0.640 (0.0889) 0.647 (0.112)
Rigid+BIP+HSDIR 0.855 (0.0399) 0.863 (0.0691) Rigid+FIP+HSDIR 0.862 (0.0380) 0.864 (0.0673)
Table 1: Dice similarity coefficients (DSC) for various registration methods.
DISCUSSION & CONCLUSIONS: Combined rigid and DIR improved the contour propagation for the rectum relative to rigid registration if appropriate image processing was undertaken to remove artefacts near or within the rectum. The results are consistent with other studies where DIR was applied to CT imaging study sets from patients treated with EBRT only [2].
REFERENCES: 1. Yang, D. et al. 2011. Med. Phys., 38, 67-77. 2. Thörnqvist, S. et al. 2010. Acta Oncol., 49, 1023-1032.
ACKNOWLEDGEMENTS: This work was funded by the NHMRC (Project Grant 1006447), University of Western Australia, an Australian Postgraduate Award and an Ana Africh Postgraduate Scholarship in Medical Research.
EPSM-1087 Mon 4th Nov 13:45 Golden Ballroom North Radiotherapy
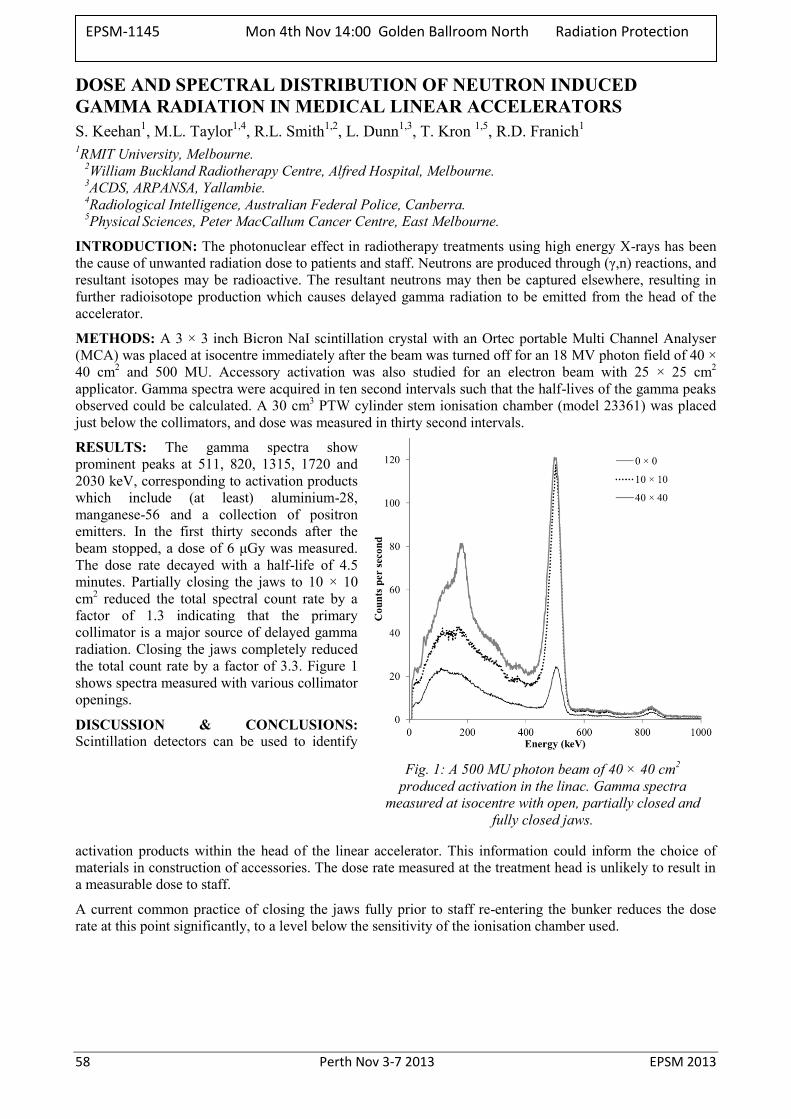
58 Perth Nov 3-7 2013 EPSM 2013
DOSE AND SPECTRAL DISTRIBUTION OF NEUTRON INDUCED GAMMA RADIATION IN MEDICAL LINEAR ACCELERATORS S. Keehan1, M.L. Taylor1,4, R.L. Smith1,2, L. Dunn1,3, T. Kron 1,5, R.D. Franich1
1RMIT University, Melbourne. 2William Buckland Radiotherapy Centre, Alfred Hospital, Melbourne. 3ACDS, ARPANSA, Yallambie. 4Radiological Intelligence, Australian Federal Police, Canberra. 5Physical Sciences, Peter MacCallum Cancer Centre, East Melbourne.
INTRODUCTION: The photonuclear effect in radiotherapy treatments using high energy X-rays has been the cause of unwanted radiation dose to patients and staff. Neutrons are produced through (γ,n) reactions, and resultant isotopes may be radioactive. The resultant neutrons may then be captured elsewhere, resulting in further radioisotope production which causes delayed gamma radiation to be emitted from the head of the accelerator.
METHODS: A 3 × 3 inch Bicron NaI scintillation crystal with an Ortec portable Multi Channel Analyser (MCA) was placed at isocentre immediately after the beam was turned off for an 18 MV photon field of 40 × 40 cm2 and 500 MU. Accessory activation was also studied for an electron beam with 25 × 25 cm2 applicator. Gamma spectra were acquired in ten second intervals such that the half-lives of the gamma peaks observed could be calculated. A 30 cm3 PTW cylinder stem ionisation chamber (model 23361) was placed just below the collimators, and dose was measured in thirty second intervals.
RESULTS: The gamma spectra show prominent peaks at 511, 820, 1315, 1720 and 2030 keV, corresponding to activation products which include (at least) aluminium-28, manganese-56 and a collection of positron emitters. In the first thirty seconds after the beam stopped, a dose of 6 μGy was measured. The dose rate decayed with a half-life of 4.5 minutes. Partially closing the jaws to 10 × 10 cm2 reduced the total spectral count rate by a factor of 1.3 indicating that the primary collimator is a major source of delayed gamma radiation. Closing the jaws completely reduced the total count rate by a factor of 3.3. Figure 1 shows spectra measured with various collimator openings.
DISCUSSION & CONCLUSIONS: Scintillation detectors can be used to identify
activation products within the head of the linear accelerator. This information could inform the choice of materials in construction of accessories. The dose rate measured at the treatment head is unlikely to result in a measurable dose to staff.
A current common practice of closing the jaws fully prior to staff re-entering the bunker reduces the dose rate at this point significantly, to a level below the sensitivity of the ionisation chamber used.
Fig. 1: A 500 MU photon beam of 40 × 40 cm2 produced activation in the linac. Gamma spectra
measured at isocentre with open, partially closed and fully closed jaws.
EPSM-1145 Mon 4th Nov 14:00 Golden Ballroom North Radiation Protection
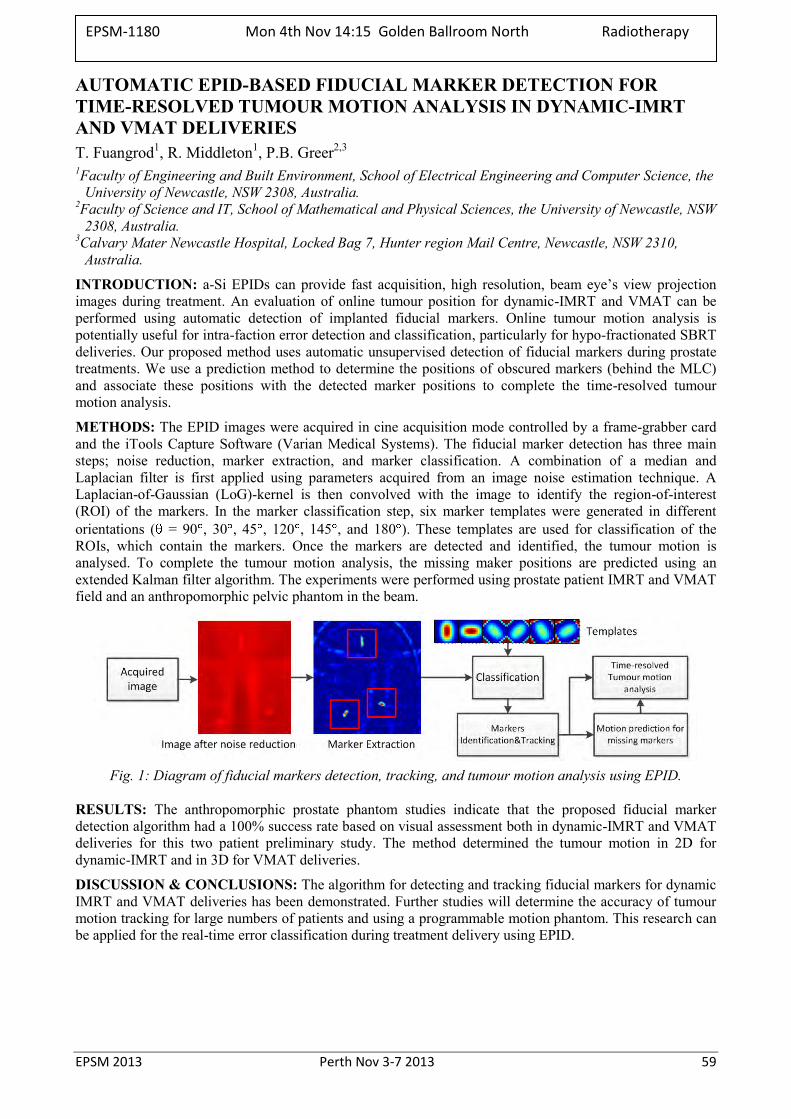
EPSM 2013 Perth Nov 3-7 2013 59
AUTOMATIC EPID-BASED FIDUCIAL MARKER DETECTION FOR TIME-RESOLVED TUMOUR MOTION ANALYSIS IN DYNAMIC-IMRT AND VMAT DELIVERIES T. Fuangrod1, R. Middleton1, P.B. Greer2,3 1Faculty of Engineering and Built Environment, School of Electrical Engineering and Computer Science, the
University of Newcastle, NSW 2308, Australia. 2Faculty of Science and IT, School of Mathematical and Physical Sciences, the University of Newcastle, NSW
2308, Australia. 3Calvary Mater Newcastle Hospital, Locked Bag 7, Hunter region Mail Centre, Newcastle, NSW 2310,
Australia.
INTRODUCTION: a-Si EPIDs can provide fast acquisition, high resolution, beam eye’s view projection images during treatment. An evaluation of online tumour position for dynamic-IMRT and VMAT can be performed using automatic detection of implanted fiducial markers. Online tumour motion analysis is potentially useful for intra-faction error detection and classification, particularly for hypo-fractionated SBRT deliveries. Our proposed method uses automatic unsupervised detection of fiducial markers during prostate treatments. We use a prediction method to determine the positions of obscured markers (behind the MLC) and associate these positions with the detected marker positions to complete the time-resolved tumour motion analysis.
METHODS: The EPID images were acquired in cine acquisition mode controlled by a frame-grabber card and the iTools Capture Software (Varian Medical Systems). The fiducial marker detection has three main steps; noise reduction, marker extraction, and marker classification. A combination of a median and Laplacian filter is first applied using parameters acquired from an image noise estimation technique. A Laplacian-of-Gaussian (LoG)-kernel is then convolved with the image to identify the region-of-interest (ROI) of the markers. In the marker classification step, six marker templates were generated in different orientations ( = 90 , 30 , 45 , 120 , 145 , and 180 ). These templates are used for classification of the ROIs, which contain the markers. Once the markers are detected and identified, the tumour motion is analysed. To complete the tumour motion analysis, the missing maker positions are predicted using an extended Kalman filter algorithm. The experiments were performed using prostate patient IMRT and VMAT field and an anthropomorphic pelvic phantom in the beam.
Fig. 1: Diagram of fiducial markers detection, tracking, and tumour motion analysis using EPID.
RESULTS: The anthropomorphic prostate phantom studies indicate that the proposed fiducial marker detection algorithm had a 100% success rate based on visual assessment both in dynamic-IMRT and VMAT deliveries for this two patient preliminary study. The method determined the tumour motion in 2D for dynamic-IMRT and in 3D for VMAT deliveries.
DISCUSSION & CONCLUSIONS: The algorithm for detecting and tracking fiducial markers for dynamic IMRT and VMAT deliveries has been demonstrated. Further studies will determine the accuracy of tumour motion tracking for large numbers of patients and using a programmable motion phantom. This research can be applied for the real-time error classification during treatment delivery using EPID.
EPSM-1180 Mon 4th Nov 14:15 Golden Ballroom North Radiotherapy
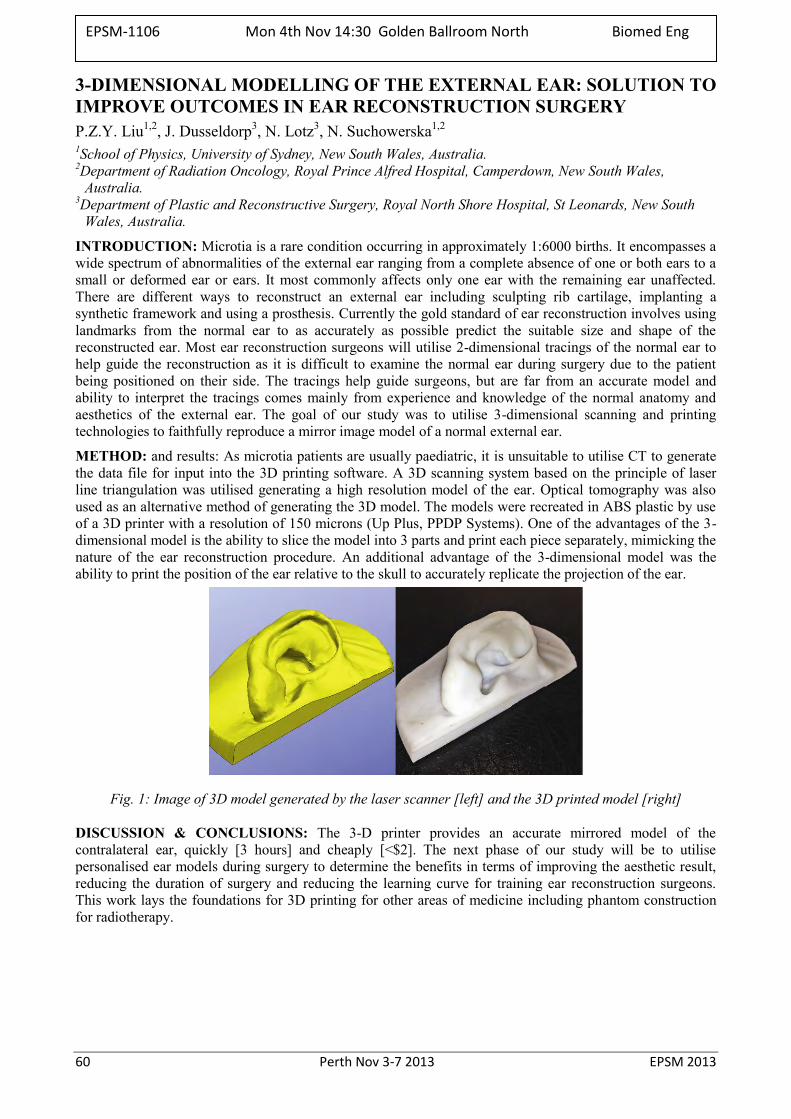
60 Perth Nov 3-7 2013 EPSM 2013
3-DIMENSIONAL MODELLING OF THE EXTERNAL EAR: SOLUTION TO IMPROVE OUTCOMES IN EAR RECONSTRUCTION SURGERY P.Z.Y. Liu1,2, J. Dusseldorp3, N. Lotz3, N. Suchowerska1,2
1School of Physics, University of Sydney, New South Wales, Australia. 2Department of Radiation Oncology, Royal Prince Alfred Hospital, Camperdown, New South Wales,
Australia. 3Department of Plastic and Reconstructive Surgery, Royal North Shore Hospital, St Leonards, New South
Wales, Australia.
INTRODUCTION: Microtia is a rare condition occurring in approximately 1:6000 births. It encompasses a wide spectrum of abnormalities of the external ear ranging from a complete absence of one or both ears to a small or deformed ear or ears. It most commonly affects only one ear with the remaining ear unaffected. There are different ways to reconstruct an external ear including sculpting rib cartilage, implanting a synthetic framework and using a prosthesis. Currently the gold standard of ear reconstruction involves using landmarks from the normal ear to as accurately as possible predict the suitable size and shape of the reconstructed ear. Most ear reconstruction surgeons will utilise 2-dimensional tracings of the normal ear to help guide the reconstruction as it is difficult to examine the normal ear during surgery due to the patient being positioned on their side. The tracings help guide surgeons, but are far from an accurate model and ability to interpret the tracings comes mainly from experience and knowledge of the normal anatomy and aesthetics of the external ear. The goal of our study was to utilise 3-dimensional scanning and printing technologies to faithfully reproduce a mirror image model of a normal external ear.
METHOD: and results: As microtia patients are usually paediatric, it is unsuitable to utilise CT to generate the data file for input into the 3D printing software. A 3D scanning system based on the principle of laser line triangulation was utilised generating a high resolution model of the ear. Optical tomography was also used as an alternative method of generating the 3D model. The models were recreated in ABS plastic by use of a 3D printer with a resolution of 150 microns (Up Plus, PPDP Systems). One of the advantages of the 3-dimensional model is the ability to slice the model into 3 parts and print each piece separately, mimicking the nature of the ear reconstruction procedure. An additional advantage of the 3-dimensional model was the ability to print the position of the ear relative to the skull to accurately replicate the projection of the ear.
Fig. 1: Image of 3D model generated by the laser scanner [left] and the 3D printed model [right]
DISCUSSION & CONCLUSIONS: The 3-D printer provides an accurate mirrored model of the contralateral ear, quickly [3 hours] and cheaply [<$2]. The next phase of our study will be to utilise personalised ear models during surgery to determine the benefits in terms of improving the aesthetic result, reducing the duration of surgery and reducing the learning curve for training ear reconstruction surgeons. This work lays the foundations for 3D printing for other areas of medicine including phantom construction for radiotherapy.
EPSM-1106 Mon 4th Nov 14:30 Golden Ballroom North Biomed Eng
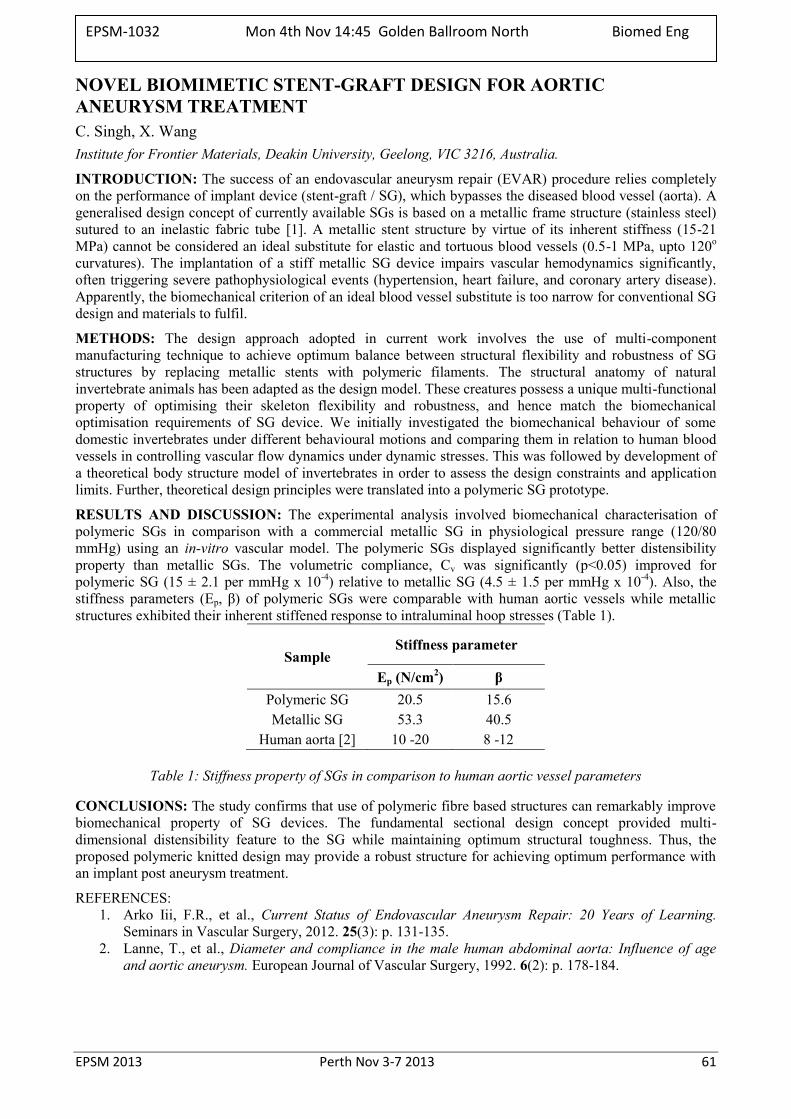
EPSM 2013 Perth Nov 3-7 2013 61
NOVEL BIOMIMETIC STENT-GRAFT DESIGN FOR AORTIC ANEURYSM TREATMENT C. Singh, X. Wang Institute for Frontier Materials, Deakin University, Geelong, VIC 3216, Australia.
INTRODUCTION: The success of an endovascular aneurysm repair (EVAR) procedure relies completely on the performance of implant device (stent-graft / SG), which bypasses the diseased blood vessel (aorta). A generalised design concept of currently available SGs is based on a metallic frame structure (stainless steel) sutured to an inelastic fabric tube [1]. A metallic stent structure by virtue of its inherent stiffness (15-21 MPa) cannot be considered an ideal substitute for elastic and tortuous blood vessels (0.5-1 MPa, upto 120o curvatures). The implantation of a stiff metallic SG device impairs vascular hemodynamics significantly, often triggering severe pathophysiological events (hypertension, heart failure, and coronary artery disease). Apparently, the biomechanical criterion of an ideal blood vessel substitute is too narrow for conventional SG design and materials to fulfil.
METHODS: The design approach adopted in current work involves the use of multi-component manufacturing technique to achieve optimum balance between structural flexibility and robustness of SG structures by replacing metallic stents with polymeric filaments. The structural anatomy of natural invertebrate animals has been adapted as the design model. These creatures possess a unique multi-functional property of optimising their skeleton flexibility and robustness, and hence match the biomechanical optimisation requirements of SG device. We initially investigated the biomechanical behaviour of some domestic invertebrates under different behavioural motions and comparing them in relation to human blood vessels in controlling vascular flow dynamics under dynamic stresses. This was followed by development of a theoretical body structure model of invertebrates in order to assess the design constraints and application limits. Further, theoretical design principles were translated into a polymeric SG prototype.
RESULTS AND DISCUSSION: The experimental analysis involved biomechanical characterisation of polymeric SGs in comparison with a commercial metallic SG in physiological pressure range (120/80 mmHg) using an in-vitro vascular model. The polymeric SGs displayed significantly better distensibility property than metallic SGs. The volumetric compliance, Cv was significantly (p<0.05) improved for polymeric SG (15 ± 2.1 per mmHg x 10-4) relative to metallic SG (4.5 ± 1.5 per mmHg x 10-4). Also, the stiffness parameters (Ep, β) of polymeric SGs were comparable with human aortic vessels while metallic structures exhibited their inherent stiffened response to intraluminal hoop stresses (Table 1).
Sample Stiffness parameter
Ep (N/cm2) β Polymeric SG 20.5 15.6 Metallic SG 53.3 40.5
Human aorta [2] 10 -20 8 -12
Table 1: Stiffness property of SGs in comparison to human aortic vessel parameters
CONCLUSIONS: The study confirms that use of polymeric fibre based structures can remarkably improve biomechanical property of SG devices. The fundamental sectional design concept provided multi-dimensional distensibility feature to the SG while maintaining optimum structural toughness. Thus, the proposed polymeric knitted design may provide a robust structure for achieving optimum performance with an implant post aneurysm treatment.
REFERENCES: 1. Arko Iii, F.R., et al., Current Status of Endovascular Aneurysm Repair: 20 Years of Learning.
Seminars in Vascular Surgery, 2012. 25(3): p. 131-135. 2. Lanne, T., et al., Diameter and compliance in the male human abdominal aorta: Influence of age
and aortic aneurysm. European Journal of Vascular Surgery, 1992. 6(2): p. 178-184.
EPSM-1032 Mon 4th Nov 14:45 Golden Ballroom North Biomed Eng
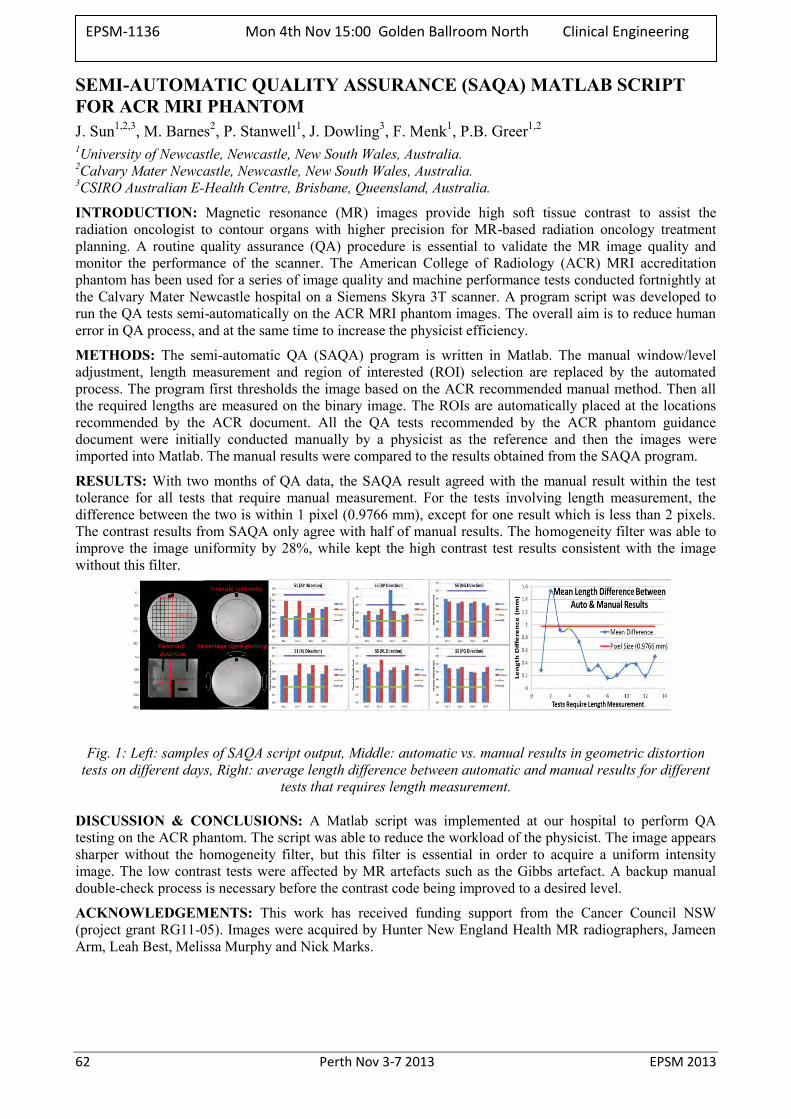
62 Perth Nov 3-7 2013 EPSM 2013
SEMI-AUTOMATIC QUALITY ASSURANCE (SAQA) MATLAB SCRIPT FOR ACR MRI PHANTOM J. Sun1,2,3, M. Barnes2, P. Stanwell1, J. Dowling3, F. Menk1, P.B. Greer1,2 1University of Newcastle, Newcastle, New South Wales, Australia. 2Calvary Mater Newcastle, Newcastle, New South Wales, Australia. 3CSIRO Australian E-Health Centre, Brisbane, Queensland, Australia.
INTRODUCTION: Magnetic resonance (MR) images provide high soft tissue contrast to assist the radiation oncologist to contour organs with higher precision for MR-based radiation oncology treatment planning. A routine quality assurance (QA) procedure is essential to validate the MR image quality and monitor the performance of the scanner. The American College of Radiology (ACR) MRI accreditation phantom has been used for a series of image quality and machine performance tests conducted fortnightly at the Calvary Mater Newcastle hospital on a Siemens Skyra 3T scanner. A program script was developed to run the QA tests semi-automatically on the ACR MRI phantom images. The overall aim is to reduce human error in QA process, and at the same time to increase the physicist efficiency.
METHODS: The semi-automatic QA (SAQA) program is written in Matlab. The manual window/level adjustment, length measurement and region of interested (ROI) selection are replaced by the automated process. The program first thresholds the image based on the ACR recommended manual method. Then all the required lengths are measured on the binary image. The ROIs are automatically placed at the locations recommended by the ACR document. All the QA tests recommended by the ACR phantom guidance document were initially conducted manually by a physicist as the reference and then the images were imported into Matlab. The manual results were compared to the results obtained from the SAQA program.
RESULTS: With two months of QA data, the SAQA result agreed with the manual result within the test tolerance for all tests that require manual measurement. For the tests involving length measurement, the difference between the two is within 1 pixel (0.9766 mm), except for one result which is less than 2 pixels. The contrast results from SAQA only agree with half of manual results. The homogeneity filter was able to improve the image uniformity by 28%, while kept the high contrast test results consistent with the image without this filter.
Fig. 1: Left: samples of SAQA script output, Middle: automatic vs. manual results in geometric distortion tests on different days, Right: average length difference between automatic and manual results for different
tests that requires length measurement.
DISCUSSION & CONCLUSIONS: A Matlab script was implemented at our hospital to perform QA testing on the ACR phantom. The script was able to reduce the workload of the physicist. The image appears sharper without the homogeneity filter, but this filter is essential in order to acquire a uniform intensity image. The low contrast tests were affected by MR artefacts such as the Gibbs artefact. A backup manual double-check process is necessary before the contrast code being improved to a desired level.
ACKNOWLEDGEMENTS: This work has received funding support from the Cancer Council NSW (project grant RG11-05). Images were acquired by Hunter New England Health MR radiographers, Jameen Arm, Leah Best, Melissa Murphy and Nick Marks.
EPSM-1136 Mon 4th Nov 15:00 Golden Ballroom North Clinical Engineering
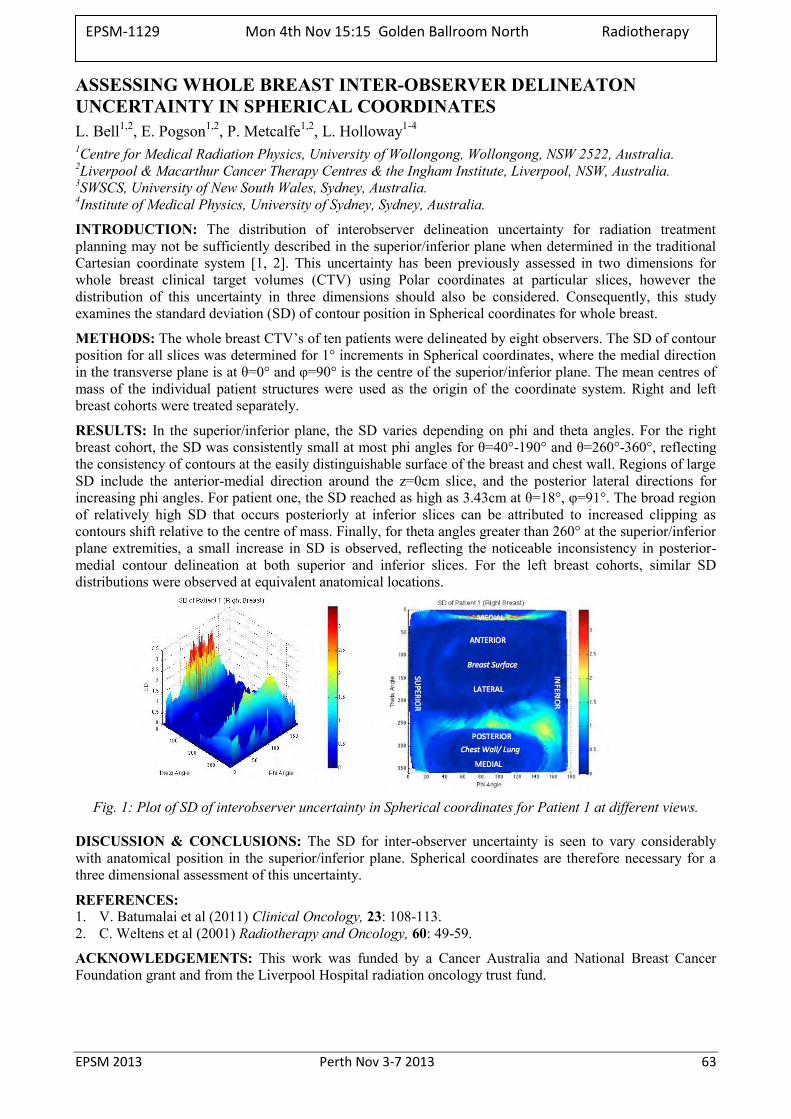
EPSM 2013 Perth Nov 3-7 2013 63
ASSESSING WHOLE BREAST INTER-OBSERVER DELINEATON UNCERTAINTY IN SPHERICAL COORDINATES L. Bell1,2, E. Pogson1,2, P. Metcalfe1,2, L. Holloway1-4 1Centre for Medical Radiation Physics, University of Wollongong, Wollongong, NSW 2522, Australia. 2Liverpool & Macarthur Cancer Therapy Centres & the Ingham Institute, Liverpool, NSW, Australia. 3SWSCS, University of New South Wales, Sydney, Australia. 4Institute of Medical Physics, University of Sydney, Sydney, Australia.
INTRODUCTION: The distribution of interobserver delineation uncertainty for radiation treatment planning may not be sufficiently described in the superior/inferior plane when determined in the traditional Cartesian coordinate system [1, 2]. This uncertainty has been previously assessed in two dimensions for whole breast clinical target volumes (CTV) using Polar coordinates at particular slices, however the distribution of this uncertainty in three dimensions should also be considered. Consequently, this study examines the standard deviation (SD) of contour position in Spherical coordinates for whole breast.
METHODS: The whole breast CTV’s of ten patients were delineated by eight observers. The SD of contour position for all slices was determined for 1° increments in Spherical coordinates, where the medial direction in the transverse plane is at θ=0° and φ=90° is the centre of the superior/inferior plane. The mean centres of mass of the individual patient structures were used as the origin of the coordinate system. Right and left breast cohorts were treated separately.
RESULTS: In the superior/inferior plane, the SD varies depending on phi and theta angles. For the right breast cohort, the SD was consistently small at most phi angles for θ=40°-190° and θ=260°-360°, reflecting the consistency of contours at the easily distinguishable surface of the breast and chest wall. Regions of large SD include the anterior-medial direction around the z=0cm slice, and the posterior lateral directions for increasing phi angles. For patient one, the SD reached as high as 3.43cm at θ=18°, φ=91°. The broad region of relatively high SD that occurs posteriorly at inferior slices can be attributed to increased clipping as contours shift relative to the centre of mass. Finally, for theta angles greater than 260° at the superior/inferior plane extremities, a small increase in SD is observed, reflecting the noticeable inconsistency in posterior-medial contour delineation at both superior and inferior slices. For the left breast cohorts, similar SD distributions were observed at equivalent anatomical locations.
Fig. 1: Plot of SD of interobserver uncertainty in Spherical coordinates for Patient 1 at different views.
DISCUSSION & CONCLUSIONS: The SD for inter-observer uncertainty is seen to vary considerably with anatomical position in the superior/inferior plane. Spherical coordinates are therefore necessary for a three dimensional assessment of this uncertainty.
REFERENCES: 1. V. Batumalai et al (2011) Clinical Oncology, 23: 108-113. 2. C. Weltens et al (2001) Radiotherapy and Oncology, 60: 49-59.
ACKNOWLEDGEMENTS: This work was funded by a Cancer Australia and National Breast Cancer Foundation grant and from the Liverpool Hospital radiation oncology trust fund.
EPSM-1129 Mon 4th Nov 15:15 Golden Ballroom North Radiotherapy
64 Perth Nov 3-7 2013 EPSM 2013
FIRST DEMONSTRATION OF KILOVOLTAGE INTRAFRACTION MONITORING FOR GATED PROSTATE RAPIDARC™ J.T. Booth1,2, J.A. Ng2,3, R. O’Brien3, P. Poulsen4, T. Eade1, A. Kneebone1, Z. Kuncic2, P.J. Keall3
1Northern Sydney Cancer Centre, Royal North Shore Hospital, Sydney, NSW. 2Institute of Medical Physics, School of Physics, University of Sydney, Sydney, NSW. 3Radiation Physics Laboratory, Sydney Medical School, University of Sydney, Sydney, NSW. 4Department of
Medical Physics and Oncology, Aarhus University Hospital, Aarhus, Denmark.
INTRODUCTION: We have developed a novel real-time tumour localization modality known as Kilovoltage Intrafraction Monitoring (KIM) [1]. KIM has been demonstrated for post-treatment analysis but has yet to be used for real-time treatment adaptation. This study aims to demonstrate the feasibility of KIM for gated prostate RapidArc™ in a 30 patient clinical trial.
METHODS: The KIM process entails using the kV imager during treatment to determine the 3D target position by building and updating a 2D to 3D motion correlation model. The correlation model is initially built during a 60º pre-treatment kV fluoroscopic arc before being applied during RapidArc™ treatment with concurrent fluoroscopy to determine the real-time 3D trajectory of fiducial markers in the prostate. A threshold of 3mm/5s will be used to gate the beam followed by couch correction. Feasibility of the real-time KIM process will be determined using three metrics; geometric accuracy of the ‘gated’ treatment fields, dosimetric accuracy of the delivered dose using daily dose reconstruction of that day’s treatment [2], and the estimated radiobiological impact assessed using Tumour Control Probability and Rectal Complication Probability as surrogate clinical endpoints based on delivered dose distributions. The acute and late toxicity and clinical outcomes will be monitored and compared to recent historical controls.
RESULTS: End-to-end tests in phantom have been successfully executed with gating triggered and remote couch motion executed. All in-house software and hardware are available for use. Geometric accuracy of KIM was determined to be 0.46±0.58mm [1] in an offline study. Target underdoses are estimated to be reduced from up to 30% without gated KIM to less than 4% with gated KIM. The study is currently in ethics review and governance review to follow.
DISCUSSION & CONCLUSIONS: We present the study design for feasibility of KIM monitoring for gated RapidArc™. With the only addition to a modern linac being the KIM software, this method of motion management is highly accessible, accurate and useful.
REFERENCES: 1. Ng, et al.(2012) Kilovoltage intrafraction monitoring for prostate intensity modulated arc therapy: first clinical results, Int J Radiat Oncol Biol Phys, 84(5) 2. Poulsen, et al. (2012), A method of dose reconstruction for moving targets compatible with dynamic treatments, Med Phys, 39(10)
ACKNOWLEDGEMENTS: this work is partially funded by an NHMRC Australia Fellowship, US NIH R01 93626 and a Varian Medical Systems collaborative research agreement.
EPSM-1187 Mon 4th Nov 16:00 Golden Ballroom South Radiotherapy
EPSM 2013 Perth Nov 3-7 2013 65
CAN PRE TREATMENT BLADDER ULTRASOUND IMPROVE ACCURACY OF PROSTATE BED RADIOTHERAPY? A. Haworth1,2, A. Paneghel1, M. Bressel1, D. Pham1, K.H. Tai1, R. Oates1, J. Gawthrop1, A. Cray1, N. Hardcastle1, F. Foroudi1 1The Peter MacCallum Cancer Centre, Melbourne, VIC, Australia. 2University of Melbourne, Melbourne, VIC, Australia.
INTRODUCTION: Our goal is to evaluate the benefit of incorporating daily ultrasound scanning of the bladder to reduce the effects of volume deformation due to variations in bladder filling prior to prostate bed radiotherapy. The primary aim of the project was to confirm that the coverage of the PTV with the 95% isodose was within tolerance when the ultrasound determined bladder volume was within patient specific limits.
METHODS: CBCT images were acquired on 10 occasions during the course of treatment to assess systematic changes in rectal or bladder volume as part of a standard off-line IGRT protocol. In the 24 patient intervention study, carried out at 4 Peter Mac campuses, patients were scanned with the ultrasound device prior to treatment. When bladder volumes were outside the specified limits, patients were asked to drink more water or void as appropriate until the volume was within tolerance, with a limit of three attempts to adjust the volume. Immediately following the ultrasound scan the patients were imaged using daily kV imaging and weekly kVCBCT. For 15 patients, the CTV and PTV was delineated on the CBCTs (10 for each patient). The CBCT and ultrasound defined bladder volumes were compared. In addition, the percentage of the PTV receiving 95% of the prescribed dose was calculated based on the CBCT volumes.
RESULTS: A total of 668 sets of ultrasound scans were acquired from 24 patients. Daily scanning (with or without CBCT) was carried out at 2 Peter Mac campuses, with the remaining 2 campuses scanning only on the days CBCT were acquired. 76% of patients found to have bladder volumes outside a 100 cc tolerance (relative to the bladder volume at simulation) were able to satisfactorily adjust their bladder volumes on demand. In 10% of scans, the target bladder volume could not be achieved within 3 attempts of volume adjustment. 10% of bladder volumes were outside of tolerance due to patient non-compliance (i.e. the patient felt he was unable, or declined the request to adjust his bladder volume). Comparing the bladder volumes with the CBCT data revealed that the bladder scanner correctly predicted that the target volume would be accurately targeted, using previously defined surrogate end-points [1-2] in 78% of treatment fractions. This prediction rate increased to 87% when data from patients with very large bladders was excluded. The CBCT defined volumes were on average 18% larger than the ultrasound defined volumes (SD 27%). Preliminary review of the isodose distributions superimposed on the weekly CBCT scans suggests coverage of the intended PTV with the 95% isodose does not appear to be highly correlated with the ultrasound or CBCT defined bladder volume. Consistency in the delineation of the prostate bed target volume on CBCT is challenging and methods to automate the process are currently under investigation.
CONCLUSION: A simple hand-held ultrasound bladder scanner provides a practical, in-expensive, on-line solution that has the potential to confirm that the bladder volume is within acceptable, patient-specific limits prior to treatment delivery. Confirming this leads to improved coverage of the target volume is challenging due to the uncertainties in defining the target volume on CBCT and is the subject of our on-going investigations.
REFERENCES: 1. Haworth A, et al. (2009) Verification of target position in the post-prostatectomy cancer patient
using cone beam CT. J Med Imaging Radiat Oncol, 53. 212-20. 2. Tran PK, et al. (2009) Prospective development of an individualised predictive model for treatment
coverage using offline cone beam computed tomography surrogate measures in post-prostatectomy radiotherapy. J Med Imaging Radiat Oncol, 53. 574-80.
ACKNOWLEDGEMENTS: The authors acknowledge the financial support of the Peter MacCallum Cancer Centre Foundation for this project.
EPSM-1065 Mon 4th Nov 16:15 Golden Ballroom South Radiotherapy
66 Perth Nov 3-7 2013 EPSM 2013
ESTABLISHING TUMOUR TRACKING ACCURACY IN FREE-BREATHING RESPIRATORY GATED SBRT OF LUNG AND LIVER CANCERS C. Wen, T. Ackerly William Buckland Radiotherapy Centre, The Alfred Hospital, Melbourne, VIC 3004 Australia.
INTRODUCTION: A hypo-fractionated free-breathing gated SBRT treatment of lung and liver cancers was commissioned at the William Buckland Radiotherapy Centre, The Alfred Hospital in Melbourne Australia. This presentation is a phantom study in establishing tumour-tracking accuracy under clinical conditions using implanted fiducial marker.
METHODS: A VisicoilTM gold marker embedded in tissue-equivalent material amounted on a 1D dynamic phantom (Brainlab ET Gating PhantomTM) travelled in synchronization with a patient’s breathing trace recorded by an infrared camera (VisionRT GateCTTM) and was treated with the Brainlab ExacTracTM system. The marker was set to simulate a tumour moving in superior-inferior (S-I) direction measured through a clinical study. The on-treatment tumour tracking accuracy was determined using GafchromicTM RT-QA film by varying beam-on gate width and the amplitude of marker.
RESULTS: For tumour moving along S-I direction at amplitudes of 10, 20 and 29 mm, with gate widths set at 50%, 25% and 20% of corresponding full amplitude of external surrogate, the implanted marker was tracked with an uncertainty ≤ 1.5 mm to its planned position using GafchromicTM films.
DISCUSSION & CONCLUSIONS: It is clear that the moving marker representing a lung tumour in real clinical case has been accurately tracked during the free-breathing amplitude gated SBRT delivery. Both the breathing trace and three-dimensional marker/tumour motions were measured from clinical studies. However, the marker motion was reduced to S-I direction only limited by the capacity of phantom used and no out-of-phase between internal marker and external surrogate was assumed.
REFERENCES: 1. Tenn S E, Solberg T D and Medin P M (2005) Targeting accuracy of an image guided gating system
for stereotactic body radiotherapy Phys. Med. Biol. 50 5443–62 2. Seppenwoolde Y, Shirato H, Kitamura K, Shimizu S, van Herk M, Lebesque J V and Miyasaka K
(2002) Precise and real-time measurement of 3D tumor motion in lung due to breathing and heartbeat, measured during radiotherapy Int. J. Radiation Oncology Biol. Phys. 53(4) 822–34.
3. Ackerly T, Lancaster C M, Geso M and Roxby K J (2011) Clinical accuracy of ExacTrac intracranial frameless stereotactic system: paradigm shift to fractionation Med. Phys. 38 (9) 5040-8.
ACKNOWLEDGEMENTS: This work was supported in part by the Peter Hay foundation and the Department of Heath Victoria, Australia.
EPSM-1042 Mon 4th Nov 16:30 Golden Ballroom South Radiotherapy
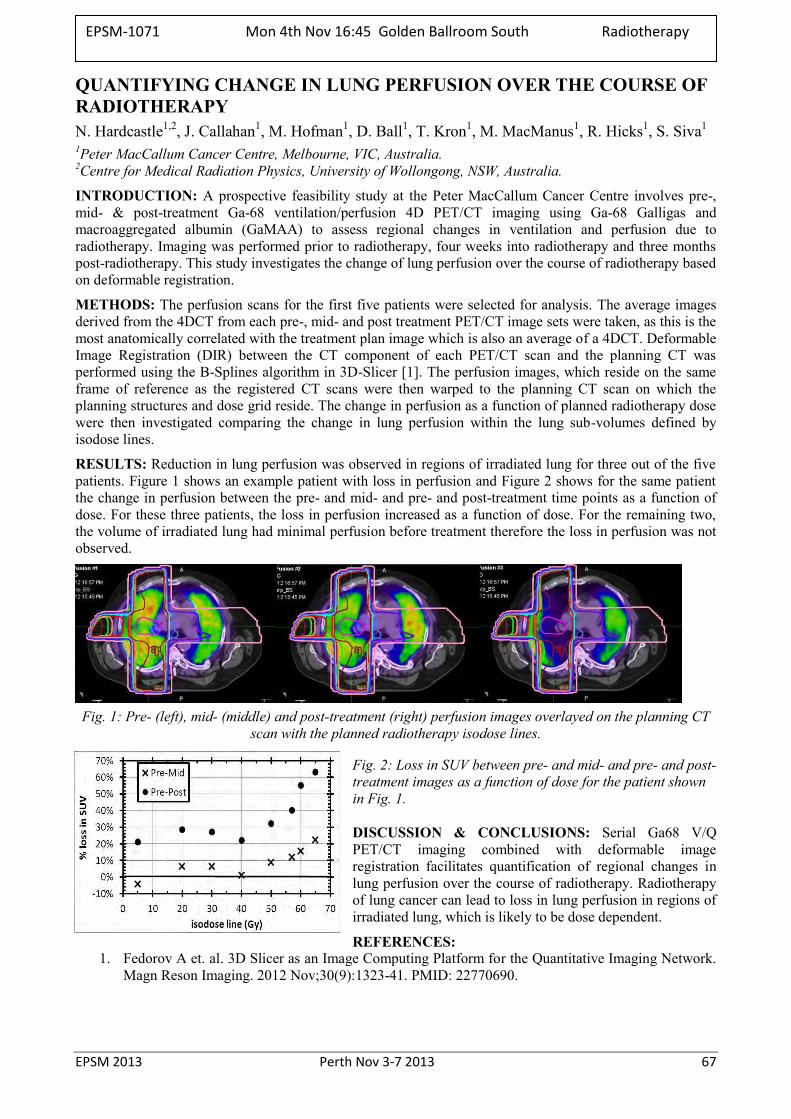
EPSM 2013 Perth Nov 3-7 2013 67
QUANTIFYING CHANGE IN LUNG PERFUSION OVER THE COURSE OF RADIOTHERAPY N. Hardcastle1,2, J. Callahan1, M. Hofman1, D. Ball1, T. Kron1, M. MacManus1, R. Hicks1, S. Siva1 1Peter MacCallum Cancer Centre, Melbourne, VIC, Australia. 2Centre for Medical Radiation Physics, University of Wollongong, NSW, Australia.
INTRODUCTION: A prospective feasibility study at the Peter MacCallum Cancer Centre involves pre-, mid- & post-treatment Ga-68 ventilation/perfusion 4D PET/CT imaging using Ga-68 Galligas and macroaggregated albumin (GaMAA) to assess regional changes in ventilation and perfusion due to radiotherapy. Imaging was performed prior to radiotherapy, four weeks into radiotherapy and three months post-radiotherapy. This study investigates the change of lung perfusion over the course of radiotherapy based on deformable registration.
METHODS: The perfusion scans for the first five patients were selected for analysis. The average images derived from the 4DCT from each pre-, mid- and post treatment PET/CT image sets were taken, as this is the most anatomically correlated with the treatment plan image which is also an average of a 4DCT. Deformable Image Registration (DIR) between the CT component of each PET/CT scan and the planning CT was performed using the B-Splines algorithm in 3D-Slicer [1]. The perfusion images, which reside on the same frame of reference as the registered CT scans were then warped to the planning CT scan on which the planning structures and dose grid reside. The change in perfusion as a function of planned radiotherapy dose were then investigated comparing the change in lung perfusion within the lung sub-volumes defined by isodose lines.
RESULTS: Reduction in lung perfusion was observed in regions of irradiated lung for three out of the five patients. Figure 1 shows an example patient with loss in perfusion and Figure 2 shows for the same patient the change in perfusion between the pre- and mid- and pre- and post-treatment time points as a function of dose. For these three patients, the loss in perfusion increased as a function of dose. For the remaining two, the volume of irradiated lung had minimal perfusion before treatment therefore the loss in perfusion was not observed.
Fig. 1: Pre- (left), mid- (middle) and post-treatment (right) perfusion images overlayed on the planning CT
scan with the planned radiotherapy isodose lines.
Fig. 2: Loss in SUV between pre- and mid- and pre- and post-treatment images as a function of dose for the patient shown in Fig. 1.
DISCUSSION & CONCLUSIONS: Serial Ga68 V/Q PET/CT imaging combined with deformable image registration facilitates quantification of regional changes in lung perfusion over the course of radiotherapy. Radiotherapy of lung cancer can lead to loss in lung perfusion in regions of irradiated lung, which is likely to be dose dependent.
REFERENCES: 1. Fedorov A et. al. 3D Slicer as an Image Computing Platform for the Quantitative Imaging Network.
Magn Reson Imaging. 2012 Nov;30(9):1323-41. PMID: 22770690.
EPSM-1071 Mon 4th Nov 16:45 Golden Ballroom South Radiotherapy
68 Perth Nov 3-7 2013 EPSM 2013
DEVELOPMEN AND VALIDATION OF AN IN-HOUSE SEED TRACKING SOFTWARE TOOL FOR ONLINE TARGET POSITIONAL VERIFICATION S. Arumugam1, A. Xing1, L. Holloway1,2,3,4
1Liverpool and Macarthur cancer therapy centres and Ingham Institute, Liverpool Hospital, NSW, Sydney, Australia.
2Institute of Medical Physics, School of Physics, University of Sydney, Sydney, NSW, Australia. 3Centre for Medical Radiation Physics, University of Wollongong, Wollongong, NSW, Australia. 4South Western Sydney Clinical School, University of New South Wales, Sydney, NSW, Australia.
INTRODUCTION: Accurate positioning of the target volume during treatment is paramount for Stereotactic Body Radiation Therapy (SBRT). In this work we present the development of an in-house software tool to verify seed position in kV planar images acquired during treatment delivery.
METHODS: An Elekta-Synergy accelerator with kV imaging (XVI) capability was used in this study. In-house software was developed in Matlab to perform the following three functions: 1. Detect seed positions in kV planar images acquired using XVI. 2. Predict seed positions in the planar view at any gantry angle from the 3D seed coordinates, 3.Report the difference between CT planned and actual isocentre co-ordinates as determined from the planar images.
The performance of the software was verified using an anthropomorphic phantom implanted with three Civco gold seeds in the prostate. A SBRT prostate VMAT plan with 4 arcs was generated on the CT data set of the phantom. Using XVI 8 planar images were manually acquired during the delivery of each arc. The images were analysed by the software to determine the difference between planned and set isocentre positions.
RESULTS: The software successfully detects the seed position in planar image acquired at various gantry angles. The difference between predicted and detected seed positions was within ± 1mm. The calculated and planned isocentre positions agreed within ± 1mm based on the seed positions at various gantry angles.
DISCUSSION & CONCLUSIONS: The developed software shown to accurately detect seed positions in kV planar images. This has the potential application of monitoring target position during treatment delivery in linear accelerator based SBRT.
EPSM-1134 Mon 4th Nov 17:00 Golden Ballroom South Radiotherapy
EPSM 2013 Perth Nov 3-7 2013 69
HOW DO DIFFERENT IMAGE GUIDED RADIOTHERAPY SYSTEMS COMPARE? A QUANTITATIVE STUDY FOR PROSTATE TREATMENTS USING AN ANTHROPOMORPHIC PHANTOM J. Hatton1,2, M. Crain1, T. Kron3,4 1Trans-Tasman Radiation Oncology Group (TROG), Newcastle, NSW. 2University of Newcastle, Newcastle, NSW. 3Peter McCallum Cancer Centre, Melbourne, Victoria. 4RMIT, Melbourne, Victoria.
INTRODUCTION: Image Guided Radiation Therapy (IGRT) relates the radiation beam with the patient geometry acquired at the point of treatment delivery, aiming to ensure geometric and dosimetric accuracy of radiation delivery. IGRT uses two imaging approaches:
1. Orthogonal kV X-ray images with the implantation of fiducial markers into the target.
2. Volumetric 3D imaging of the target area using Cone Beam Computerised Technology (CBCT), providing detailed information about the target and surrounding critical structures: rectum and bladder.
Despite common assumptions that these two methods give similar results, there is no multi-centre published quantified evidence to support their equivalence. This multi-centre study aims to compare the two methods of target localisation by quantifying the accuracy of prostate position at each treatment, relative to the treatment plan. The study will cover all image guided equipment from each of the manufacturers with installations in Australia and New Zealand.
METHODS: The anthropomorphic Virtual Human Male phantom (CIRS Inc, Norfolk, Virginia, USA) has been modified to TROG design with interchangeable anatomical prostate inserts with and without fiducials. A third insert is drilled for the cc13 ionisation chamber, and a film cassette allows planar dose to be measured at any given rotation angle about the superior-inferior axis.
TROG staff will visit fifteen centres, covering IGRT equipment from all the manufacturers. The phantom will be set up by local staff following local protocol. TROG staff will make known shifts, and local staff will follow IGRT protocol to assess the shift and make corrections to the phantom position. The measured shift is recorded as is the residual error after movement. All results will be compared and stratified against technique and local protocol.
RESULTS: Currently six site visits have been made. All results show agreement within 1 mm between known shifts and measured values. The IGRT technique used depended on installed equipment and ease of workflow.
DISCUSSION & CONCLUSIONS: The initial results support the conclusion that all IGRT techniques show excellent alignment of the target volume against treatment plan, ensuring accurate daily radiation dose delivery irrespective of the IGRT method used.
ACKNOWLEDGEMENTS: This work was made possible by sponsorship from CMS Alphatech and Elekta.
EPSM-1163 Mon 4th Nov 17:15 Golden Ballroom South Radiotherapy
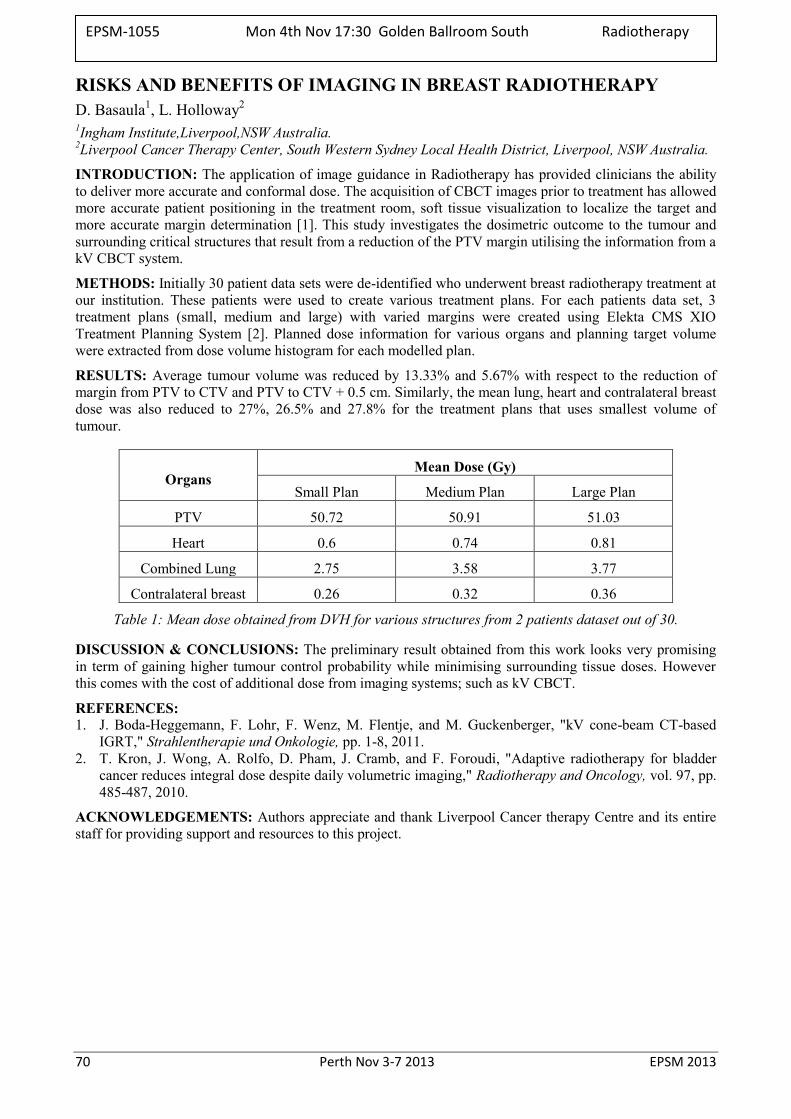
70 Perth Nov 3-7 2013 EPSM 2013
RISKS AND BENEFITS OF IMAGING IN BREAST RADIOTHERAPY D. Basaula1, L. Holloway2 1Ingham Institute,Liverpool,NSW Australia. 2Liverpool Cancer Therapy Center, South Western Sydney Local Health District, Liverpool, NSW Australia.
INTRODUCTION: The application of image guidance in Radiotherapy has provided clinicians the ability to deliver more accurate and conformal dose. The acquisition of CBCT images prior to treatment has allowed more accurate patient positioning in the treatment room, soft tissue visualization to localize the target and more accurate margin determination [1]. This study investigates the dosimetric outcome to the tumour and surrounding critical structures that result from a reduction of the PTV margin utilising the information from a kV CBCT system.
METHODS: Initially 30 patient data sets were de-identified who underwent breast radiotherapy treatment at our institution. These patients were used to create various treatment plans. For each patients data set, 3 treatment plans (small, medium and large) with varied margins were created using Elekta CMS XIO Treatment Planning System [2]. Planned dose information for various organs and planning target volume were extracted from dose volume histogram for each modelled plan.
RESULTS: Average tumour volume was reduced by 13.33% and 5.67% with respect to the reduction of margin from PTV to CTV and PTV to CTV + 0.5 cm. Similarly, the mean lung, heart and contralateral breast dose was also reduced to 27%, 26.5% and 27.8% for the treatment plans that uses smallest volume of tumour.
Organs Mean Dose (Gy)
Small Plan Medium Plan Large Plan
PTV 50.72 50.91 51.03
Heart 0.6 0.74 0.81
Combined Lung 2.75 3.58 3.77
Contralateral breast 0.26 0.32 0.36
Table 1: Mean dose obtained from DVH for various structures from 2 patients dataset out of 30.
DISCUSSION & CONCLUSIONS: The preliminary result obtained from this work looks very promising in term of gaining higher tumour control probability while minimising surrounding tissue doses. However this comes with the cost of additional dose from imaging systems; such as kV CBCT.
REFERENCES: 1. J. Boda-Heggemann, F. Lohr, F. Wenz, M. Flentje, and M. Guckenberger, "kV cone-beam CT-based
IGRT," Strahlentherapie und Onkologie, pp. 1-8, 2011. 2. T. Kron, J. Wong, A. Rolfo, D. Pham, J. Cramb, and F. Foroudi, "Adaptive radiotherapy for bladder
cancer reduces integral dose despite daily volumetric imaging," Radiotherapy and Oncology, vol. 97, pp. 485-487, 2010.
ACKNOWLEDGEMENTS: Authors appreciate and thank Liverpool Cancer therapy Centre and its entire staff for providing support and resources to this project.
EPSM-1055 Mon 4th Nov 17:30 Golden Ballroom South Radiotherapy
EPSM 2013 Perth Nov 3-7 2013 71
PERFORMANCE OF ARPANSA REFERENCE CHAMBERS FOR DIRECT CALIBRATION IN LINAC PHOTONS G. Ramanathan, P.D. Harty, C.P. Oliver, D.J. Butler
Radiotherapy Section, Medical Radiation Services Branch, ARPANSA, 619 Lower Plenty Rd, Yallambie, VIC 3085.
INTRODUCTION: ARPANSA calibrates therapy level ionization chambers, a vital step in ensuring the required accuracy of dose delivery to cancer patients in Australia. Presently the calibrations are done using Co-60 and the physicists in radiotherapy centres are advised to use the beam energy correction factors (kQ) from IAEA TRS-398 [1] corresponding to the energy of the photon beam and the type of ion chamber being used. In order to reduce the uncertainties associated with this method ARPANSA has developed a direct calibration method in which the ion chambers will be calibrated directly in high energy photons from an Elekta Synergy Linac. This paper reports the performance results of ARPANSA reference chambers against which the user chambers will be calibrated.
METHODS: The reference chambers studied are of the types NE 2611A and NE 2571. The characteristics studied are: time required to achieve stability after applying the polarising voltage to the chambers, ion recombination correction for different dose-rates and polarity correction. The absorbed dose to water calibration factors of these chambers in calibration against the ARPANSA primary standard calorimeter was studied over a period of more than 6 months. The use of a thimble chamber in addition to the external beam monitor to account for the day-to-day variations in the linac output during calibration was also studied.
RESULTS: The NE 2611A ion chambers require 15-20 minutes whereas NE 2571 require ~30 minutes to achieve stability after the polarising voltage is applied. These results agree with the published results for similar chambers in international literature. The standard deviation of the mean in the absorbed dose to water calibration factors for NE 2571 chambers have been found to be better than 0.05% over a period of 6 months. The NE 2611A has a slightly larger variation. We found that the external beam monitor is able to correct the linac beam variations during the day while the thimble chamber is able to correct for day-to-day variations which provides consistent behaviour over the 6 month period.
DISCUSSION & CONCLUSIONS: The NE 2611A and NE 2571 chambers are suitable reference chambers for a direct calibration service.
REFERENCE: 1. P. Andreo et al.,“Absorbed dose determination in external beam radiotherapy: An international code
of practice for dosimetry based on standards of absorbed dose to water, Technical Report Series No. 398 (International Atomic Energy Agency, Vienna, Austria, 2000).
EPSM-1081 Mon 4th Nov 16:00 Golden Ballroom North Radiotherapy
72 Perth Nov 3-7 2013 EPSM 2013
ARPANSA CO-60 TELETHERAPY SOURCE: 3 YEARS AFTER SOURCE REPLACEMENT C. Oliver, D. Butler Radiotherapy Section, Medical Radiation Services Branch, ARPANSA, 619 Lower Plenty Rd, Yallambie, VIC
3085.
INTRODUCTION: ARPANSA maintains a Co-60 teletherapy source to calibrate clinical dosemeters. Co-60 ND,w calibration factors, coupled with an appropriate protocol such as TRS-398 [1], allow the realisation of absorbed dose in clinical therapy accelerator beams. In 2010 ARPANSA replaced its Co-60 source with an Eldorado head and 140TBq Co-60 source. After 3 years most Australian clinical dosemeters have been calibrated in the new source due to the generally accepted calibration interval of 3 years.
METHODS: Calibration factors Nk, and ND,w measured with the new and old sources have been compared for clinical and ARPANSA quality control chambers in reference conditions. A number of comparisons have been completed with international laboratories traceable to foreign primary standards since the source replacement using transfer chambers. These include NMIJ (Japan), MD Anderson (US), NRC (Canada) and the BIPM (France). ARPANSA derived calibration factors are also compared to factors supplied by secondary standards laboratories when new chambers are sent to ARPANSA for calibration for the first time.
RESULTS: The variation in ND,w and Nk calibration factors for client and ARPANSA secondary standard chambers pre and post Co-60 source replacement is generally less than 0.5%. This provides confidence in the calibration procedures and the calorimetry and ionometry which underpin these values. The difference between ARPANSA and PTW ND,w factors (traceable to the German primary standard) for new chambers is generally less than 0.3%. The bilateral comparisons preformed in Co-60 via transfer chambers generally show agreement less than the standard uncertainty in the measurement.
DISCUSSION & CONCLUSIONS: Regular quality control measurements are necessary to ensure consistency of the dissemination of the absorbed dose and air kerma standards for Co-60. The replacement of the ARPANSA Co-60 source had the potential to introduce differences in the supplied calibration factors. Comparison of Co-60 calibration factors before and after source replacement, in conjunction with regular international comparisons, provide confidence in the measurements performed at ARPANSA and enable dosimetry in Australia to be consistent with the international radiotherapy community.
REFERENCES: 1. IAEA, Absorbed dose determination in external beam radiotherapy: An international code of practice for dosimetry based on standards of absorbed dose to water, Vol.398 of Technical Report Series (IAEA, Vienna, 2001).
EPSM-1119 Mon 4th Nov 16:15 Golden Ballroom North Radiotherapy
EPSM 2013 Perth Nov 3-7 2013 73
COMMISSIONING OF A NEW COMMERCIAL PLASTIC SCINTILLATOR SYSTEM FOR RADIOTHERAPY J. Morales1,2, R. Hill1, S. Crowe2, J. Trapp2
1Department of Radiation Oncology, Royal Prince Alfred Hospital, Camperdown, NSW. 2Department of Physics, Queensland University of Technology, QLD.
INTRODUCTION: Since 1992 there have been several articles published on research on Plastic Scintillators for use in radiotherapy. Plastic Scintillators are said to be tissue equivalent, temperature independent and dose rate independent [1]. Although their properties were found to be promising for measurements in megavoltage x-ray beams there were some technical difficulties with regards to its commercialisation. Standard Imaging has produced the first commercial system which is now available for use in a clinical setting. The Exradin W1 Scintilator device uses a dual fibre system where one fibre is connected to the Plastic Scintillator and the other fibre only measures Cerenkov radiation [2]. This paper presents results obtained during commissioning of this dosimeter system.
METHODS: All tests were performed on a Novalis Tx linear accelerator equipped with a 6MV SRS photon beam and conventional 6 and 18 MV x-ray beams. The following measurements were performed in a Virtual Water phantom at a depth of dose maximum.
Linearity: The dose delivered was varied between 0.2 – 3.0 Gy for the same field conditions.
Dose Rate dependence: For this test the repetition rate of the linac was varied between 100 to 1000 MU/min. A nominal dose of 1.0 Gy was delivered for each rate.
Reproducibility: A total of 5 irradiations for the same setup.
RESULTS: The W1 detector gave a highly linear relationship between dose and the number of Monitor Units delivered for a 10×10 cm2 field size at a SSD of 100 cm. The linearity was within 1 % for the high dose end and about 2% for the very low dose end. For the dose rate dependence, the dose measured as a function of repetition the rate (100 to 1000 MU/min) gave a maximum deviation of 0.9%. The reproducibility was found to be better than 0.5%.
DISCUSSION & CONCLUSIONS: The results for this system look promising so far being a new dosimetry system available for clinical use. However, further investigation is needed to produce a full characterisation prior to use in megavoltage x-ray beams.
REFERENCES: 1. A.S. Beddar, T.R. Mackie, and F.H. Attix (1992) Water-equivalent plastic scintillation detectors for high-
energy beam dosimetry Phys. Med. Biol. 37, 1901-1913. 2. M. Guillot, L. Gingras, L. Archambault (2011) Spectral method for the correction of the Cerenkov light
effect in plastic scintialltion detectors: A comparison study of calibration procedures and validation in Cerenkov light-dominate situations Med. Phys. 38 (4), 2140-2150.
EPSM-1221 Mon 4th Nov 16:30 Golden Ballroom North Radiotherapy
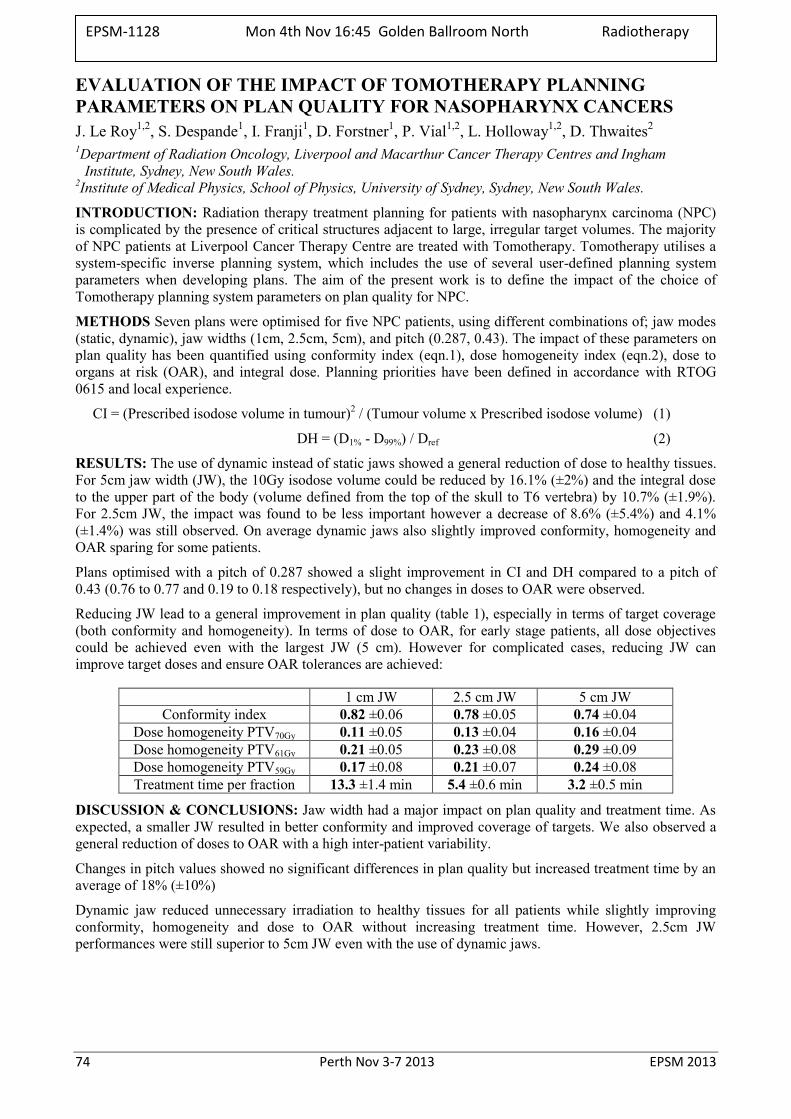
74 Perth Nov 3-7 2013 EPSM 2013
EVALUATION OF THE IMPACT OF TOMOTHERAPY PLANNING PARAMETERS ON PLAN QUALITY FOR NASOPHARYNX CANCERS J. Le Roy1,2, S. Despande1, I. Franji1, D. Forstner1, P. Vial1,2, L. Holloway1,2, D. Thwaites2
1Department of Radiation Oncology, Liverpool and Macarthur Cancer Therapy Centres and Ingham Institute, Sydney, New South Wales.
2Institute of Medical Physics, School of Physics, University of Sydney, Sydney, New South Wales.
INTRODUCTION: Radiation therapy treatment planning for patients with nasopharynx carcinoma (NPC) is complicated by the presence of critical structures adjacent to large, irregular target volumes. The majority of NPC patients at Liverpool Cancer Therapy Centre are treated with Tomotherapy. Tomotherapy utilises a system-specific inverse planning system, which includes the use of several user-defined planning system parameters when developing plans. The aim of the present work is to define the impact of the choice of Tomotherapy planning system parameters on plan quality for NPC.
METHODS Seven plans were optimised for five NPC patients, using different combinations of; jaw modes (static, dynamic), jaw widths (1cm, 2.5cm, 5cm), and pitch (0.287, 0.43). The impact of these parameters on plan quality has been quantified using conformity index (eqn.1), dose homogeneity index (eqn.2), dose to organs at risk (OAR), and integral dose. Planning priorities have been defined in accordance with RTOG 0615 and local experience.
CI = (Prescribed isodose volume in tumour)2 / (Tumour volume x Prescribed isodose volume) (1)
DH = (D1% - D99%) / Dref (2)
RESULTS: The use of dynamic instead of static jaws showed a general reduction of dose to healthy tissues. For 5cm jaw width (JW), the 10Gy isodose volume could be reduced by 16.1% (±2%) and the integral dose to the upper part of the body (volume defined from the top of the skull to T6 vertebra) by 10.7% (±1.9%). For 2.5cm JW, the impact was found to be less important however a decrease of 8.6% (±5.4%) and 4.1% (±1.4%) was still observed. On average dynamic jaws also slightly improved conformity, homogeneity and OAR sparing for some patients.
Plans optimised with a pitch of 0.287 showed a slight improvement in CI and DH compared to a pitch of 0.43 (0.76 to 0.77 and 0.19 to 0.18 respectively), but no changes in doses to OAR were observed.
Reducing JW lead to a general improvement in plan quality (table 1), especially in terms of target coverage (both conformity and homogeneity). In terms of dose to OAR, for early stage patients, all dose objectives could be achieved even with the largest JW (5 cm). However for complicated cases, reducing JW can improve target doses and ensure OAR tolerances are achieved:
1 cm JW 2.5 cm JW 5 cm JW Conformity index 0.82 ±0.06 0.78 ±0.05 0.74 ±0.04
Dose homogeneity PTV70Gy 0.11 ±0.05 0.13 ±0.04 0.16 ±0.04 Dose homogeneity PTV61Gy 0.21 ±0.05 0.23 ±0.08 0.29 ±0.09 Dose homogeneity PTV59Gy 0.17 ±0.08 0.21 ±0.07 0.24 ±0.08 Treatment time per fraction 13.3 ±1.4 min 5.4 ±0.6 min 3.2 ±0.5 min
DISCUSSION & CONCLUSIONS: Jaw width had a major impact on plan quality and treatment time. As expected, a smaller JW resulted in better conformity and improved coverage of targets. We also observed a general reduction of doses to OAR with a high inter-patient variability.
Changes in pitch values showed no significant differences in plan quality but increased treatment time by an average of 18% (±10%)
Dynamic jaw reduced unnecessary irradiation to healthy tissues for all patients while slightly improving conformity, homogeneity and dose to OAR without increasing treatment time. However, 2.5cm JW performances were still superior to 5cm JW even with the use of dynamic jaws.
EPSM-1128 Mon 4th Nov 16:45 Golden Ballroom North Radiotherapy
EPSM 2013 Perth Nov 3-7 2013 75
GETTING READY FOR ION BEAM THERAPY IN AUSTRIA - BUILDING UP RESEARCH IN PARALLEL WITH A FACILITY: THE MUW EXPERIENCE D. Georg1,2 1Department of Radiation Oncology; Medical University Vienna / AKH Wien; Austria. 2Christian Doppler Laboratory for Medical Radiation Research for Radiation Oncology; Medical University
of Vienna; Austria
INTRODUCTION: With the clinical implementation of advanced treatment techniques in external beam therapy and brachytherapy during the last decade, it was obvious to benchmark the most advanced treatment techniques with conventional beam qualities against proton therapy. Consequently, proton therapy became a “natural” research topic at the Medical University Vienna. On the other hand the Department of Radiation Oncology was a key partner for the Austrian MedAustron ion beam cancer treatment and research facility from the beginning. With participation in EC funded ion-beam projects and nationally funded projects where ion beam therapy is a major research pillar, (e.g. the recently established Christian Doppler Laboratory for Medical Radiation Research for Radiation Oncology) ion beam research activities were started in parallel with the design and construction of the center in Wiener Neustadt. Currently, the following projects listed below are pursued, mostly in close collaboration between the Medical University of Vienna and the MedAustron ion beam center.
METHODS: The current medical radiation physics research activities comprise: (1) Dose calculation and optimization: Ion beam centers focus mostly on proton and carbon ion therapy. However, there are other ion species with great potential for clinical applications. Helium ions are under investigation and a pencil beam model has been developed, that is currently implemented in a treatment planning system. (2) Treatment planning and treatment plan robustness: In ion beam therapy organ motion and anatomic changes are especially important since variations in heterogeneity along the beam path have a significant impact on range. Ongoing research focuses on the assessment of treatment plan robustness against these temporal variations. (3) Image guided and adaptive ion beam therapy: Accounting for temporal variations of the anatomy during radiotherapy, both during (intra-fraction variations) and between fractions (inter-fraction variations), and taking into account temporal variations in tumor biology, is considered to be another key issues for ion beam therapy. Ongoing research activities focus on ultrafast image registration and deformable registration for adaptive radiotherapy. A rather new research field is the exploration of multimodality and multi-parametric functional imaging for dose painting with scanned ion beams. (4) On-line verification of ion beam delivery: Positron emission tomography (PET) verification is the only clinically approved in-vivo and in-situ method to monitor ion beam dose application. So far research was performed to test the applicability of a commonly used algorithm from image registration for an automated and objective comparison of in-beam PET data to overcome the outdated practice of visual inspection of PET images. More recently prompt gammas are also explored for on-line verification of ion beam delivery. (5) Basic and applied dosimetry: An end-to-end procedure was designed and successfully tested in both scanned proton and carbon ion beams, which may also serve as a dosimetric credentialing procedure for clinical trials in the future.
DISCUSSION & CONCLUSIONS: Once being operational with beam time and accessible for researchers, the MedAustron facility will offer outstanding research opportunities in many aspects. For that reason building up multidisciplinary research expertise – in a preparatory phase - in parallel with the design and construction of the MedAustron facility is and was considered to be of outmost importance. During the last years ion beam research including medical radiation physics and radiobiology could be successfully initiated at the Medical University of Vienna.
ACKNOWLEDGEMENTS: The financial support by the Federal Ministry of Economy, Family and Youth and the National Foundation for Research, Technology and Development is gratefully acknowledged.
EPSM-1251 Tue 5th Nov 08:45 Golden Ballroom South Radiotherapy
76 Perth Nov 3-7 2013 EPSM 2013
SHIFT IN ABSORBED DOSE WHEN ADOPTING MONTE CARLO KQ FACTORS OR DIRECT CALIBRATION COEFFICIENTS IN TRS-398 D. Butler, A. Cole, P. Harty, J. Lye, C. Oliver, G. Ramanathan, D. Webb, T. Wright Radiotherapy Section, Medical Radiation Services Branch, ARPANSA, 619 Lower Plenty Rd, Yallambie, VIC
3085.
INTRODUCTION: TRS-398[1] is the protocol for external beam dosimetry currently recommended by the ACPSEM for the calibration of linac output in Australia. Since the introduction of this protocol, all such calibrations have been based on an ionisation chamber calibrated in 60Co. TRS-398 provides energy correction factors, kQ, to obtain the response of the chamber in the linac beam.
Recently these energy correction factors for photon beams have been re-calculated by Muir et al [2]. Muir used the EGSnrc Monte Carlo code system and detailed models of the chambers, resulting in a lower uncertainty than the analytical calculations used in TRS-398. The values are for the most part lower than the ones in TRS-398 and in better agreement with directly measured kQ’s around the world.
TRS-398 recommends the use of a chamber calibrated directly in a linac beam. ARPANSA has recently established a calibration service for megavoltage photon beams, with a view to reducing the uncertainty in clinical linac calibrations. In order to adopt the new service, users need to know the size of the expected shift in dose, and the improvement in uncertainty.
METHODS: We calculate the change in the chamber calibration coefficient at the user quality ND,w,Q, which would arise by (i) using the Muir Monte Carlo kQ factors with TRS-398 or (ii) using an ARPANSA direct calibration coefficient with TRS-398. We performed the calculation for chamber types which are most commonly used in Australia, for three beam qualities (6, 10 and 18 MV). The results are also compared against published measurements of kQ from around the world.
RESULTS: For the NE 2571 chamber type, the Monte Carlo kQ factors of Muir are (0.2%, 0.5%, 0.7%) lower than TRS-398 values at TPR20,10 values of (0.673, 0.734, 0.777) corresponding to ARPANSA’s nominal beam potentials of (6 MV, 10 MV, 18 MV). The direct calibration coefficients for this chamber type as measured by ARPANSA are lower than TRS-398 by (0.4%, 1.0%, 1.1%). These percentage changes correspond to the differences that would be seen in the clinic when adopting Muir’s Monte Carlo kQ factors, or ARPANSA’s direct calibration coefficients, respectively.
The standard uncertainty in the absorbed dose calibration coefficient at the user quality for each method was calculated to be 1.1% (using TRS-398 and an ARPANSA 60Co calibration), 0.6% (for TRS-398 with an ARPANSA 60Co calibration and Muir’s Monte Carlo kQ factors) and 0.5% (for TRS-398 and ARPANSA’s direct calibration).
The results are plotted against international measurements of the NE 2571 chamber type.
DISCUSSION & CONCLUSIONS: The changes in clinical doses and the associated uncertainties have been determined for the NE 2571 chamber type for two situations (i) the use of Muir Monte Carlo kQ factors with TRS-398, and (ii) the use of an ARPANSA direct calibration with TRS-398.
REFERENCES: 1. IAEA, Absorbed dose determination in external beam radiotherapy: An international code of
practice for dosimetry based on standards of absorbed dose to water, Vol.398 of Technical Report Series (IAEA, Vienna, 2001).
2. B. R. Muir and D. W. O. Rogers, “Monte Carlo calculations of kQ, the beam quality conversion factor,” Med. Phys. 37, 5939–5950 (2010).
EPSM-1067 Tue 5th Nov 09:30 Golden Ballroom South Radiotherapy
EPSM 2013 Perth Nov 3-7 2013 77
SURFACE DOSIMETRY FOR VERY SMALL X-RAY BEAMS J. Morales1,2, R. Hill1, S. Crowe2, J. Trapp2
1Department of Radiation Oncology, Royal Prince Alfred Hospital, Camperdown, NSW. 2Department of Physics, Queensland University of Technology, QLD.
INTRODUCTION: The dose to skin surface is an important factor for many radiotherapy treatment techniques. It is known that TPS predicted surface doses can be significantly different from actual ICRP skin doses as defined at 70 µm. A number of methods have been implemented for the accurate determination of surface dose including use of specific dosimeters such as TLDs and radiochromic film as well as Monte Carlo calculations.
Stereotactic radiosurgery involves delivering very high doses per treatment fraction using small x-ray fields. To date, there has been limited data on surface doses for these very small field sizes. The purpose of this work is to evaluate surface doses by both measurements and Monte Carlo calculations for very small field sizes.
METHODS: All measurements were performed on a Novalis Tx linear accelerator which has a 6MV SRS x-ray beam mode which uses a specially thin flattening filter. Beam collimation was achieved by circular cones with apertures that gave field sizes ranging from 4 – 30 mm at the isocentre. The relative surface doses were measured using Gafchromic EBT3 film which has the active layer at a depth similar to the ICRP skin dose depth.
Monte Carlo calculations were performed using the BEAMnrc/EGSnrc Monte Carlo codes (V4 r225). The specifications of the linear accelerator, including the collimator, were provided by the manufacturer. Optimisation of the incident x-ray beam was achieved by an iterative adjustment of the energy, spatial distribution and radial spread of the incident electron beam striking the target. The energy cutoff parameters were PCUT = 0.01 MeV and ECUT = 0.700 MeV. Directional bremsstrahlung splitting was switched on for all BEAMnrc calculations. Relative surface doses were determined in a layer defined in a water phantom of the same thickness and depth as compared to the active later in the film.
RESULTS: Measured surface doses using the EBT3 film varied between 13 – 16% for the different cones with an uncertainty of 3%. Monte Carlo calculated surface doses were in agreement to better than 2% to the measured doses for all the treatment cones.
DISCUSSION & CONCLUSIONS: This work has shown the consistency of surface dose measurements using EBT3 film with Monte Carlo predicted values within the uncertainty of the measurements. As such, EBT3 film is recommended for in-vivo surface dose measurements.
REFERENCES: 1. S. Devic, J. Seuntjens, W. Abdel-Rahman, M. Evans, M. Olivares and E. B. Podgorsak, "Accurate skin dose measurements using radiochromic film in clinical applications," Med. Phys. 33, 1116-1124 (2006). 2. J. Kim, R. Hill, Z. Kuncic, “Practical considerations for reporting surface dose in external beam radiotherapy: a 6 MV X-ray beam study”, Australas. Phys. Eng. Sci. Med. 35, 271-282 (2012).
EPSM-1220 Tue 5th Nov 09:45 Golden Ballroom South Radiotherapy
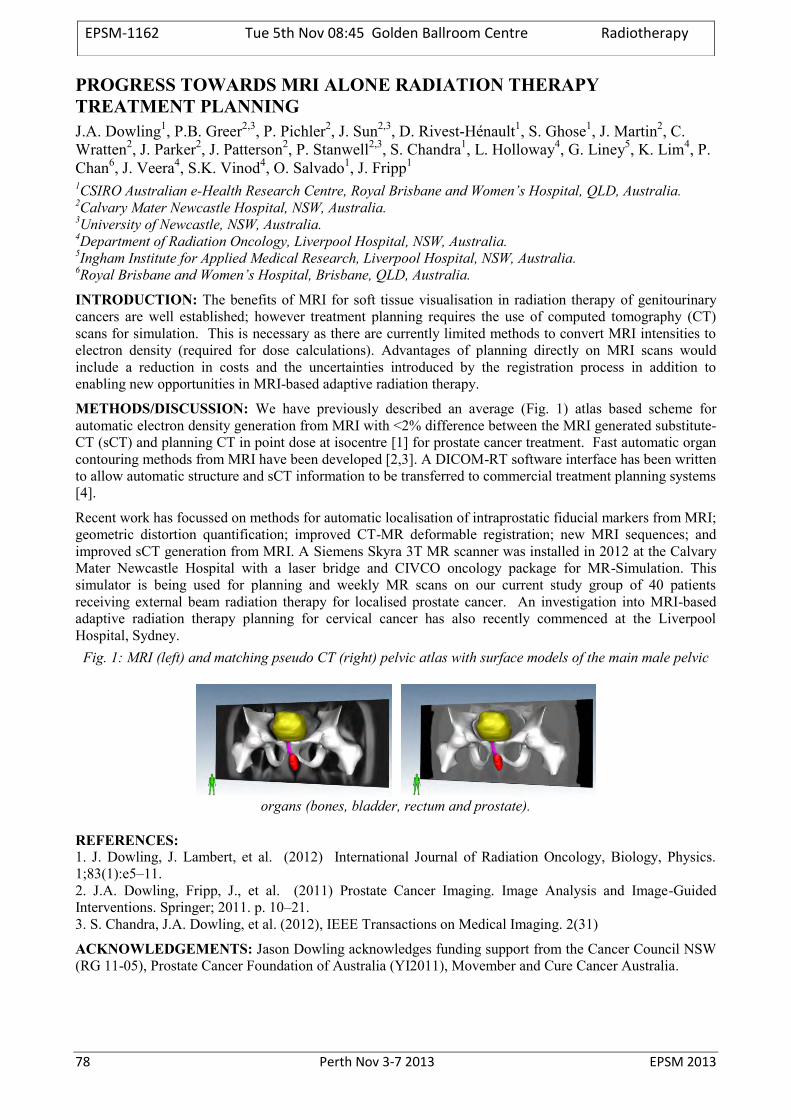
78 Perth Nov 3-7 2013 EPSM 2013
PROGRESS TOWARDS MRI ALONE RADIATION THERAPY TREATMENT PLANNING J.A. Dowling1, P.B. Greer2,3, P. Pichler2, J. Sun2,3, D. Rivest-Hénault1, S. Ghose1, J. Martin2, C. Wratten2, J. Parker2, J. Patterson2, P. Stanwell2,3, S. Chandra1, L. Holloway4, G. Liney5, K. Lim4, P. Chan6, J. Veera4, S.K. Vinod4, O. Salvado1, J. Fripp1
1CSIRO Australian e-Health Research Centre, Royal Brisbane and Women’s Hospital, QLD, Australia. 2Calvary Mater Newcastle Hospital, NSW, Australia. 3University of Newcastle, NSW, Australia. 4Department of Radiation Oncology, Liverpool Hospital, NSW, Australia. 5Ingham Institute for Applied Medical Research, Liverpool Hospital, NSW, Australia. 6Royal Brisbane and Women’s Hospital, Brisbane, QLD, Australia.
INTRODUCTION: The benefits of MRI for soft tissue visualisation in radiation therapy of genitourinary cancers are well established; however treatment planning requires the use of computed tomography (CT) scans for simulation. This is necessary as there are currently limited methods to convert MRI intensities to electron density (required for dose calculations). Advantages of planning directly on MRI scans would include a reduction in costs and the uncertainties introduced by the registration process in addition to enabling new opportunities in MRI-based adaptive radiation therapy.
METHODS/DISCUSSION: We have previously described an average (Fig. 1) atlas based scheme for automatic electron density generation from MRI with <2% difference between the MRI generated substitute-CT (sCT) and planning CT in point dose at isocentre [1] for prostate cancer treatment. Fast automatic organ contouring methods from MRI have been developed [2,3]. A DICOM-RT software interface has been written to allow automatic structure and sCT information to be transferred to commercial treatment planning systems [4].
Recent work has focussed on methods for automatic localisation of intraprostatic fiducial markers from MRI; geometric distortion quantification; improved CT-MR deformable registration; new MRI sequences; and improved sCT generation from MRI. A Siemens Skyra 3T MR scanner was installed in 2012 at the Calvary Mater Newcastle Hospital with a laser bridge and CIVCO oncology package for MR-Simulation. This simulator is being used for planning and weekly MR scans on our current study group of 40 patients receiving external beam radiation therapy for localised prostate cancer. An investigation into MRI-based adaptive radiation therapy planning for cervical cancer has also recently commenced at the Liverpool Hospital, Sydney.
Fig. 1: MRI (left) and matching pseudo CT (right) pelvic atlas with surface models of the main male pelvic
organs (bones, bladder, rectum and prostate).
REFERENCES: 1. J. Dowling, J. Lambert, et al. (2012) International Journal of Radiation Oncology, Biology, Physics. 1;83(1):e5–11. 2. J.A. Dowling, Fripp, J., et al. (2011) Prostate Cancer Imaging. Image Analysis and Image-Guided Interventions. Springer; 2011. p. 10–21. 3. S. Chandra, J.A. Dowling, et al. (2012), IEEE Transactions on Medical Imaging. 2(31)
ACKNOWLEDGEMENTS: Jason Dowling acknowledges funding support from the Cancer Council NSW (RG 11-05), Prostate Cancer Foundation of Australia (YI2011), Movember and Cure Cancer Australia.
EPSM-1162 Tue 5th Nov 08:45 Golden Ballroom Centre Radiotherapy
EPSM 2013 Perth Nov 3-7 2013 79
MEASURING PERFORMANCE OF DEFORMABLE IMAGE REGISTRATION IN RADIOTHERAPY APPLICATIONS AND CONSIDERATIONS FOR CLINICAL IMPLEMENTATION J.R. Sykes1,2,3,4, D. Thwaites2 1St James’s Institute of Oncology, Leeds Teaching Hospitals Trust, Leeds, UK. 2Institute of Medical Physics, School of Physics, University of Sydney, Sydney, NSW, Australia. 3Crown Princess Mary Cancer Centre, Westmead, NSW, Australia. 4Nepean Cancer Care Centre, Kingswood, NSW, Australia.
The role of deformable image registration (DIR) in radiotherapy (RT) practise is likely to increase greatly over the coming years. DIR has applications in multi-modality imaging for treatment planning, atlas based segmentation, adaptive radiotherapy and dose accumulation. Until recently the clinical implementation of these algorithms has been the reserve of radiotherapy centres with strong academic links and research pedigree. However, recently, software systems, which include DIR algorithms, have become commercially available which enables the clinical implementation of DIR for RT applications. There are hundreds of publications on DIR with algorithms designed or tailored for specific applications. The commercial solutions tend to use one or a select few algorithms for use in all RT applications irrespective of the anatomical site. There is therefore, a need to understand the performance limitations of these algorithms across the large range of RT applications and anatomical sites and the impact that these uncertainties have on the overall RT process. In addition, there is also a need to develop multi-disciplinary expertise in the visual verification of DIR and develop the skills to implement quantitative methods to measure the algorithms performance.
As with all new technologies introduced into clinical practice the clinical medical physicist has a lead role to ensure the benefits of the technology are realised safely and efficiently. To illustrate the issues and techniques that can be employed as clinical physicists, examples of validation of deformable image registration for research studies and commissioning prior to clinical implementation at St James’s Institute of Oncology in Leeds, UK are discussed. This includes 1) the use of multi-modality imaging in target and normal tissue definition in head and neck patients, 2) atlas based segmentation of normal tissues and target volumes in prostate and 3) head and neck patients and adaption of contours in head and neck for IMRT replanning. In addition, progress on the implementation of deformable image registration for a number of research and clinical applications at the Crown Princess Mary Cancer Centre and the Nepean Cancer Care Centre will be reported.
EPSM-1080 Tue 5th Nov 09:15 Golden Ballroom Centre Radiotherapy
80 Perth Nov 3-7 2013 EPSM 2013
BRACHYTHERAPY IN PAPUA NEW GUINEA S. Downes1 , T. Knittel
1 Department of Radiation Oncology, Prince of Wales Hospital, Randwick, NSW 2031.
INTRODUCTION: It has now been five years since the Papua New Guinea (PNG) National Cancer Treatment Centre became operational again. In 2013, significant developments continue to occur. A reconditioned Nucletron Selectron low dose rate (LDR) afterloading brachytherapy unit with Caesium-137 for the treatment of gynaecological cancers has now been commissioned and is due to deliver brachytherapy again in August for the first time since before 1998. Remote terminal access is now available via broadband internet that allows physicists and radiation therapists to see and control the treatment planning systems from their hospitals in Australia. A review of radiotherapy and cancer services in PNG was recently undertaken by members of Faculty of Radiation Oncology, Royal Australian and New Zealand College of Radiologists. A further IAEA Programme of Action for Cancer Therapy (PACT) mission is also planned for later this year which is a direct result of Papua New Guinea’s recent member status with the IAEA.
METHODS: Training of staff in the planning and delivery of brachytherapy at the cancer centre is currently ongoing. Training will be greatly boosted by the remote terminal access for local staff. A number of recommendations were made in the RANZCR review in regard to staffing levels, equipment needs and the establishment of a twinning arrangement with an Australian hospital.
DISCUSSION AND CONCLUSIONS: The PNG National Cancer Treatment Centre struggles in a number of areas but is still operating and continuing to treat patients and has expanded to now deliver brachytherapy which can greatly improve tumour control for gynaecological cancer patients. Training will be paramount to ensure brachytherapy is delivered safely and measures have been implemented to ensure this occurs. This and a further summary of other activities will be presented.
EPSM-1157 Tue 5th Nov 09:45 Golden Ballroom Centre Radiotherapy
EPSM 2013 Perth Nov 3-7 2013 81
TEMPORAL DNA METHYLATION RESPONSES IN DNA REPEAT ELEMENTS AFTER LOW OR HIGH DOSES OF X-RAYS P.J. Sykes Flinders Centre for Innovation in Cancer, Flinders University and Medical Centre, Adelaide,South Australia
The effects of ionising radiation on DNA methylation are of importance due to the role that DNA methylation plays in maintaining genome stability and the presence of aberrant DNA methylation in many cancers. There is limited evidence that radiation-sensitivity may influence the modulation of DNA methylation by ionising radiation, resulting in a loss of methylation. There is also evidence suggesting that ageing-induced losses in DNA methylation can contribute to increased genomic instability and cancer in humans. While high doses of ionising radiation increase DNA damage and genomic instability, exposure to low doses has been shown to reduce genomic instability and ageing-induced DNA damage.
There are many repeat element DNA sequences spread throughout the genome which are important in maintaining genome stability. These repeat elements are usually highly methylated to prevent chromosomal rearrangements. We developed a sensitive and quantitative real-time high-resolution-melt polymerase chain reaction assay to study the methylation status of repeat elements after low and high dose irradiation. Using this assay we studied temporal responses of DNA repeat methylation levels to high dose X-radiation exposure (1 Gy) using 3 strains of mice with different radio-sensitivities. All strains exhibited the same early response however by approximately 1 week following exposure the responses to the irradiation differed and this was influenced by the type of repeat element, the tissue analysed and the sex of the animal. We also performed temporal studies on mice exposed to a number of low doses of radiation (0.01 mGy – 10 mGy) as well as a longitudinal study after a single low dose (10 mGy) exposure where methylation status was monitored in peripheral blood over a period of 420 days at which stage the mice had reached old age. No changes in repeat element DNA methylation levels due to radiation exposure were observed. In fact, the data suggested that responses related to the stress associated with the irradiation procedure itself (sham-irradiation) has a greater effect on DNA methylation than a single whole body low dose of radiation.
While the exact mechanism and biological outcome of the changes in DNA methylation observed here are still to be elucidated, these results provide the first evidence that radiation exposure elicits time-dependent changes in the methylation of repeat elements that are influenced by the genetic background and sex of the mice, the type of repeat element investigated, and also indicates that changes may not be persistent. These types of experiments enable a more detailed understanding of short- and long-term effects of different doses of radiation on the genome which will provide insights into the molecular mechanisms involved in response to radiation exposure.
EPSM-1256 Tue 5th Nov 08:45 Golden Ballroom North Radiation Safety
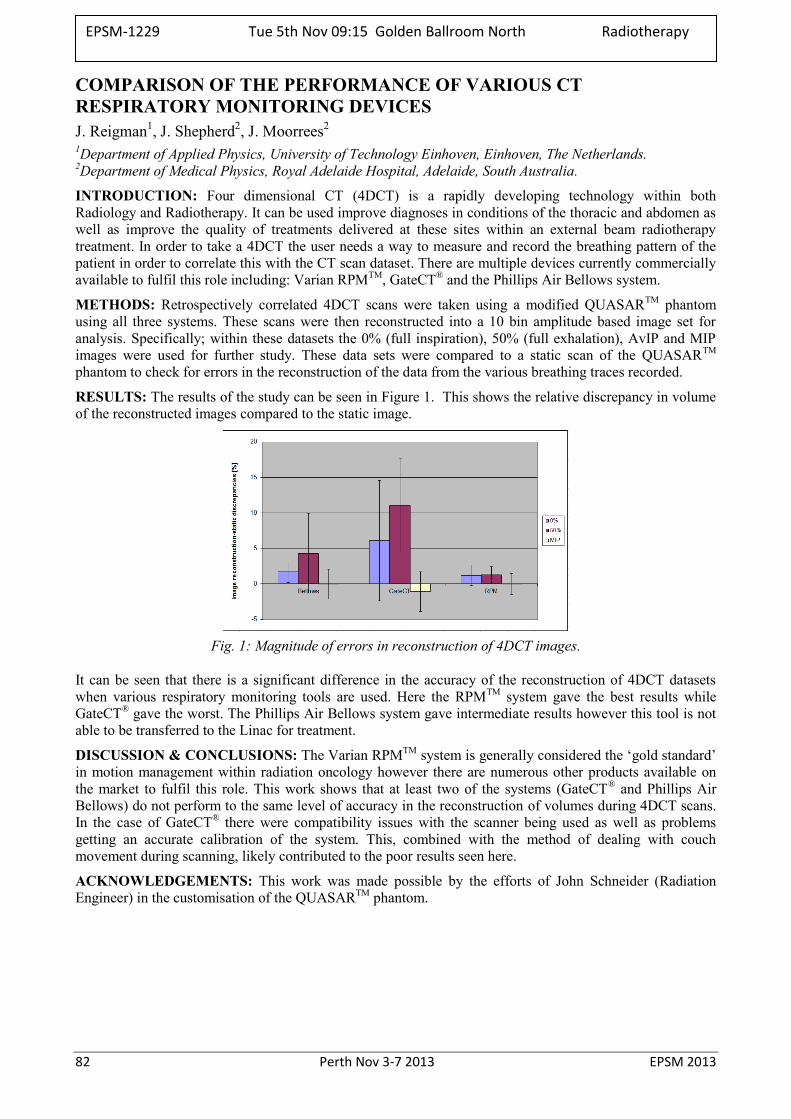
82 Perth Nov 3-7 2013 EPSM 2013
COMPARISON OF THE PERFORMANCE OF VARIOUS CT RESPIRATORY MONITORING DEVICES J. Reigman1, J. Shepherd2, J. Moorrees2
1Department of Applied Physics, University of Technology Einhoven, Einhoven, The Netherlands. 2Department of Medical Physics, Royal Adelaide Hospital, Adelaide, South Australia.
INTRODUCTION: Four dimensional CT (4DCT) is a rapidly developing technology within both Radiology and Radiotherapy. It can be used improve diagnoses in conditions of the thoracic and abdomen as well as improve the quality of treatments delivered at these sites within an external beam radiotherapy treatment. In order to take a 4DCT the user needs a way to measure and record the breathing pattern of the patient in order to correlate this with the CT scan dataset. There are multiple devices currently commercially available to fulfil this role including: Varian RPMTM, GateCT® and the Phillips Air Bellows system.
METHODS: Retrospectively correlated 4DCT scans were taken using a modified QUASARTM phantom using all three systems. These scans were then reconstructed into a 10 bin amplitude based image set for analysis. Specifically; within these datasets the 0% (full inspiration), 50% (full exhalation), AvIP and MIP images were used for further study. These data sets were compared to a static scan of the QUASARTM phantom to check for errors in the reconstruction of the data from the various breathing traces recorded.
RESULTS: The results of the study can be seen in Figure 1. This shows the relative discrepancy in volume of the reconstructed images compared to the static image.
Fig. 1: Magnitude of errors in reconstruction of 4DCT images.
It can be seen that there is a significant difference in the accuracy of the reconstruction of 4DCT datasets when various respiratory monitoring tools are used. Here the RPMTM system gave the best results while GateCT® gave the worst. The Phillips Air Bellows system gave intermediate results however this tool is not able to be transferred to the Linac for treatment.
DISCUSSION & CONCLUSIONS: The Varian RPMTM system is generally considered the ‘gold standard’ in motion management within radiation oncology however there are numerous other products available on the market to fulfil this role. This work shows that at least two of the systems (GateCT® and Phillips Air Bellows) do not perform to the same level of accuracy in the reconstruction of volumes during 4DCT scans. In the case of GateCT® there were compatibility issues with the scanner being used as well as problems getting an accurate calibration of the system. This, combined with the method of dealing with couch movement during scanning, likely contributed to the poor results seen here.
ACKNOWLEDGEMENTS: This work was made possible by the efforts of John Schneider (Radiation Engineer) in the customisation of the QUASARTM phantom.
EPSM-1229 Tue 5th Nov 09:15 Golden Ballroom North Radiotherapy
EPSM 2013 Perth Nov 3-7 2013 83
HOW FAST IS FLATTENING FILTER FREE IN PRACTICE? VMAT FFF BEAMS FOR HYPO– AND CONVENTIONAL FRACTIONATION J. Barber1,2, J. Foo1, S. Yau1, S. White1, J. Luo1, J. Phan1, J. Sykes1,2,3, L. Holloway2, D. Thwaites2 1Department of Radiation Oncology, Nepean Cancer Care Centre, Sydney, NSW, Australia. 2Institute of Medical Physics, School of Physics, University of Sydney, Sydney, NSW, Australia. 3St James’s Institute of Oncology, Leeds Teaching Hospitals NHS Trust, Leeds, United Kingdom.
INTRODUCTION: Flattening Filter Free linac beams (FFF) can achieve delivered dose rates of 3-4 times faster than flattened linac beams (FF). Volumetric Arc Modulated Arc Therapy (VMAT) also decreases overall treatment time compared to IMRT or conformal radiation therapy. The combination of FFF and VMAT can potentially reduce treatment times further. Here we present the reduction in treatment time for a sample of varying MLC complexity and dose fractionation used clinically in our centre.
METHODS: A series of 12 VMAT plans were optimised for both FF and FFF beams using Pinnacle 9.2 for an Elekta Agility MLC. The plans included conventional 2 Gy/fraction head-and-neck and prostate, and hypofractionated 8 – 12 Gy/fraction lung and spine. Three combinations were investigated: (1) FF-planned, FF-delivered, (2) FF-planned, FFF-delivered and (3) FFF-planned, FFF-delivered. Delivery times and mean dose rates were recorded.
RESULTS: For hypo-fractionated cases, delivering the same plan with and without a flattening filter – combinations (1) and (2) – showed a mean dose rate increase of 136% by using FFF, or mean time saving of 232 seconds. For conventional fractionation, the same plan showed a mean dose rate increase 23% by using FFF, or mean time savings of 15 seconds.
For the realistic clinical case where plans are optimised for each beam energy – deliveries (1) and (3) – the mean dose rate increase was 147% for hypofractionation and 25% for conventional fractionation by using FFF. The mean reduction in beam-on time was 117 seconds for hypofractionation and 4 seconds for conventional fractionation.
DISCUSSION & CONCLUSIONS: The gains in treatment time from using FFF are distinct between fractionation schemes, but no distinction is observed based on plan complexity. All beams were delivered faster by simply changing from FF to FFF. But when a plan is re-optimised for FFF beam characteristics (e.g., non-uniform profile) to the same clinical objectives, there was negligible benefit for the delivery of conventional 2 Gy doses. However, a significant reduction in beam-on time of approximately 60% was seen for all hypofractionation beams that were re-optimised. This distinction is also observed in the mean dose rate compared to the nominal FFF dose rate – 30% for conventional fractionation and 83% for hypofractionation. While FFF does not speed up conventional fractionation VMAT plans, it does significantly speed up hypofractionated VMAT plans, which should reduce potential intrafraction errors.
ACKNOWLEDGEMENTS: The authors would like to acknowledge Elekta for providing the FFF option under a research agreement.
EPSM-1179 Tue 5th Nov 09:30 Golden Ballroom North Radiotherapy
84 Perth Nov 3-7 2013 EPSM 2013
CALIBRATION OF TLD700:LIF FOR CLINICAL RADIOTHERAPY BEAM MODALITIES & VERIFICATION OF A HIGH DOSE RATE BRACHYTHERAPY TREATMENT PLANNING SYSTEM J. Rijken1, W. Harriss2, J. Lawson2 1School of Chemistry and Physics, The University of Adelaide, Adelaide, South Australia. 2Department of Medical Physics, Royal Adelaide Hospital, Adelaide, South Australia.
INTRODUCTION: When heated, lithium fluoride that has been exposed to ionising radiation emits light proportional to its dose, in a phenomenon known as thermoluminescence. This phenomenon has applications in dose measurement for research, clinical treatment and personal dose monitoring. The energy dependence of lithium fluoride thermoluminescent dosimetres (TLDs) is not constant, however. Lithium fluoride thermoluminescent dosimeters therefore need to be calibrated for different energy spectra, in order to be used clinically. This effect was investigated for TLD700:LiF chips for a range of clinical beams: linear accelerator electron and x ray beams, superficial x rays and an Iridium-192 brachytherapy source. Once calibrated, the TLD chips were used to verify the accuracy of the high dose rate brachytherapy treatment planning system, Oncentra Prostate.
METHODS: TLD700:LiF chips were exposed to known doses of radiation from nominal 6 MV and 23 MV photon beams as well as nominal 6 MeV, 9 MeV, 12 MeV, 16 MeV and 20 MeV electron beams from a linear accelerator. The TLDs were read and the response of each beam was normalised and compared to that of the 6 MV beam. The TLDs were also exposed to a series of known doses from a superficial x ray machine with peak energies of 30 kVp, 40 kVp, 50 kVp, 80 kVp, 100 kVp, 120 kVp and 150 kVp. The response of these was similarly compared to the response of the 6 MV beam with equivalent dose.
The TLDs were then calibrated for exposure to an Iridium-192 source, used for high dose rate brachytherapy. To do this, the dose was determined by a Monte Carlo simulation of the experimental setup using the package GEANT4. The TLDs were exposed to the source in air and at varying depths in water. The response for each of these scenarios was compared to the response of the 6 MV beam. The calibrated TLDs were finally used to verify Oncentra Prostate by exposing them within a water phantom. A realistic prostate treatment plan was created on a reconstructed ultrasound image data set of the phantom. The treatment plan was delivered to the phantom with the TLD chips at known locations. The dose from the TLDs was compared to the simulated dose from Oncentra Prostate.
RESULTS: Relative to the response to the 6 MV beam, TLDs under-respond by approximately 4% for electron beam energies and by approximately 3% for the 23 MV photon beam. An over-response of up to approximately 54% was observed for SXR beams with peak energies between 40 and 150 kV. The TLD700 chips over-responded by approximately 30% when exposed to the gamma spectrum of Iridium-192 in air and approximately 22% in water for distances greater than 30 mm from the source. The TLDs used to verify Oncentra Prostate differed to the simulated dose given by the treatment planning system by 2.033%±9.847%. This result is within the error of the TLD calibration and is reasonable for brachytherapy.
DISCUSSION & CONCLUSIONS: The energy dependence of TLD700:LiF has now been determined for a wide range of clinical radiotherapy beam modalities and the high dose rate brachytherapy treatment planning system, Oncentra Prostate, has been accurately and independently verified.
EPSM-1053 Tue 5th Nov 09:45 Golden Ballroom North Radiotherapy
EPSM 2013 Perth Nov 3-7 2013 85
A NATIONAL DOSIMETRY AUDIT OF VMAT AND TOMOTHERAPY IN THE UK C.H. Clark1,2,3,4, M. Hussein1,4, Y. Tsang3,5, R. Thomas2, C. Gouldstone2, D. Maughan2, J. Snaith2, S. Bolton6,7, D. Wilkinson3,5, L. Ciurlionis3,5, G. Bass2, R. Nutbrown2, K. Venables3,5, A. Nisbet1,4
1 Royal Surrey County Hospital, Guildford, UK; 2 National Physical Laboratory, London, UK; 3
Radiotherapy Trials QA Group, UK; 4 University of Surrey, Guildford, UK; 5 Mount Vernon Hospital, Northwood, UK; 6 IPEM Interdepartmental Audit Group; 7 Christie Hospital, Manchester, UK
Considerable advances are being made in the technology for planning and delivery of cancer treatment which necessitates both regular quality assurance and audit. Radiotherapy dosimetry audits allow for the testing of procedures and the identification of errors. Since the introduction of commercial volumetric modulated arc radiotherapy (VMAT) in 2008 there has been a fast uptake of complex rotational radiotherapy (RRT) technology. A survey of 62 UK cancer centres in July 2010 indicated that around 30% were treating with some form of RRT (Varian RapidArc, Elekta VMAT or Helical Tomotherapy), and that this would increase to 50% by the end of 2011. This rapid uptake led to the need for a national audit for RRT.
Conventional audit methods such as individual ionization chamber point dose and film measurements are time consuming. Therefore, a novel methodology was required in order to perform a large-scale dosimetry audit of RRT. The introduction of various commercial 2D and 3D ionization chamber or diode detector arrays has allowed for absolute dose verification with near real time results. This has led to a wide uptake of these devices to replace point dose and film dosimetry and to facilitate QA streamlining. However, arrays are limited by their spatial resolution which may affect the sensitivity of the gamma index analysis [1]. This work evaluated and developed a methodology for using a commercial detector array for a dosimetry audit of RRT [2], and subsequently carried out a national audit of VMAT and Tomotherapy.
The methodology was developed by evaluating the system in 10 UK centres that had already begun treating with RRT. These centres were visited from June 2011 to October 2011 and were 5 Varian RapidArc, 2 Elekta VMAT, and 3 Helical Tomotherapy centres. The UK IMRT credentialing program module was used which included a virtual phantom with pre-created planning volumes that has been validated by users of all three RRT modalities [3]. Each centre created a plan on the virtual phantom and also chose a clinical trial planning exercise.
Measurements were performed on both plans in the PTW Octavius II phantom using the PTW 2D-Array seven29, PTW Semiflex 0.125cm3 ionization chambers, Gafchromic-EBT2 film and alanine pellets. All verification plans were created on CT scans of the Octavius to produce predicted doses. For comparison of 2D-Array and film planes against the planning system, the gamma-index (γ) method of evaluation was used with a 20% threshold. Relative comparisons were performed for film using OmniPro-I'mRT v1.7, and absolute comparisons for the 2D-Array using Verisoft v4.1. The data showed that the 2D-Array gives results which are well correlated to those from ion chambers, alanine and film, which are currently used in dosimetry audits and hence it was feasible to use a commercial detector array for a national RRT audit.
Subsequently a further 27 UK cancer centres, took part in the main RRT audit and were visited between November 2011 - June 2013. Overall this audit has included 26 x Varian (22 Eclipse, 2 OMP, 2 Pinnacle), 13 x Elekta (7 Monaco, 4 OMP, 2 Pinnacle), and 6 x Helical Tomotherapy. Every centre was visited to make measurements on the 3DTPS and clinical plans using a PTW Octavius II phantom with the PTW seven29 2D Array.
A national audit of rotational radiotherapy has been undertaken in the UK. The audit has shown that TPS modelling and delivery for VMAT and Tomotherapy can achieve high levels of analysed planes achieving more than 95% pass rates for gamma parameters of 3%/3mm, thus achieving accurate implementation. 1 Hussein et al R&O in press; 2 Hussein et al R&O in press, DOI: http://dx.doi.org/10.1016/j.radonc.2013.05.027. 3 Tsang et al BJR 2013:86:20120315
EPSM-1248 Tue 5th Nov 10:30 Golden Ballroom South Diagnostic Radiology
86 Perth Nov 3-7 2013 EPSM 2013
THE INFLUENCE OF HIGH MODULATION ON DELIVERY ACCURACY FOR VMAT SABR BEAMS J. Barber1,2, S. Yau1, S. White1, J. Sykes1,2,6, S. Arumugam3, L. Holloway2-5, D. Thwaites2 1Department of Radiation Oncology, Nepean Cancer Care Centre, Sydney, NSW, Australia. 2Institute of Medical Physics, School of Physics, University of Sydney, Sydney, NSW, Australia. 3Liverpool and Macarthur cancer therapy centres and Ingham Institute, Liverpool Hospital, Sydney, NSW,
Australia. 4Centre for Medical Radiation Physics, University of Wollongong, Wollongong, NSW, Australia. 5South Western Sydney Clinical School, University of New South Wales, Sydney, NSW, Australia. 6St James’s Institute of Oncology, Leeds Teaching Hospitals NHS Trust, Leeds, United Kingdom.
INTRODUCTION: Using volumetric modulation arc therapy (VMAT) to deliver stereotactic ablative body radiotherapy (SABR) can significantly reduce delivery time, which can beneficially reduce intra-fraction errors. The level of beam modulation in these cases can result in large differences between measured and calculated dose. An investigation of planning system modelling parameters indicated highly modulated plans to be very sensitive to the MLC round end offset table. The table was modified to investigate its impact on measured plan deviation.
METHODS: A retrospective series of VMAT plans were selected based on a modulation index considering dose, dose rate and MLC leaf changes. These plans were calculated in Pinnacle 9.2; initially, using an established Elekta Agility MLC model. They were then recalculated with beam models using round end offset tables with incremental offsets. Each plan was verified against measurement using a Delta4 array and the standard metrics (gamma index, mean dose error) used to evaluate each beam model.
RESULTS: Agreement of measured and calculated dose on the initial model was found to be proportional to the modulation index. Poor agreement was observed in spine VMAT SABR plans with an average gamma index (3%, 2mm) pass rate of 73.4%, compared to 99.5% for lung VMAT SABR plans, which typically have low modulation. By methodically varying parameters in the beam model, a small systematic offset in the round end offset table (0.5 mm) compared to the initial model was found to improve agreement of calculated and measured plans – including cases with global under-dose of approximately 5%. Using the adjusted beam model, gamma index pass rates improved to 97.1% and 100.0% for spine and lung respectively. By using the adjusted beam model on these complex cases, and re-optimising, it was possible to achieve clinically acceptable plans with verification results in line with less modulated cases. The measurements were repeated with ionisation chamber and radiochromic film with equivalent results.
DISCUSSION & CONCLUSIONS: The error in the initial round end offsets was much less than the dose grid resolution, yet as it affected the penumbral region of each control point, large dose changes resulted. Highly modulated arc plans effectively consist of a sum of penumbral regions, and large systematic dose differences could result even though standard (low modulation) VMAT plan measurements agree very well with calculated plans. This indicates the importance of MLC calibration and modelling for highly modulated treatments. It also demonstrates how patient-specific QA can be used as a feedback mechanism for refining clinical processes.
EPSM-1108 Tue 5th Nov 11:00 Golden Ballroom South Radiotherapy
EPSM 2013 Perth Nov 3-7 2013 87
COMMISSIONING A DMLC TRACKING SYSTEM FOR CLINICAL PROSTATE VMAT TREATMENTS J.T. Booth1,2, E. Colvill1,3, R. O’Brien3, P.J. Keall3 1Northern Sydney Cancer Centre, Royal North Shore Hospital, St Leonards, New South Wales. 2Institute of Medical Physics, School of Physics, University of Sydney, Sydney, New South Wales. 3Radiation Physics Lab, School of Medicine, University of Sydney, Sydney, New South Wales.
INTRODUCTION: DMLC tracking allows the MLC to follow a tumour surrogate tracking signal, such as RPM block or Calypso beacons, as the treatment is delivered. This is to ensure tumour dose coverage and potentially leads to reduced margins (and decreased organ at risk doses), and/or higher tumour doses (with equal or lower dose to the organs at risk). A DMLC tracking system comprises the tracking signal, MLC controller, and dynamic MLC. DMLC tracking systems have been demonstrated in phantom studies for conformal, IMRT and IMAT delivery, utilising a range of tumour position surrogates. With the prospect of introducing the first clinical study utilising DMLC tracking, we aim to investigate its safety using an established framework.
METHODS: The DMLC tracking system used consists of the Varian Real-time Position Management (RPM) tracking signal, the University of Sydney tracking MLC controller and a Varian Trilogy with Millennium MLC. The DMLC tracking system is used with RapidArc delivery. The framework developed by Sawant et al. [1] using Failure Mode and Effects Analysis (FMEA) to develop commissioning and QA tests for DMLC tracking is used. We evaluate system latency, coordinate system transfer and dosimetric accuracy with tracking, as well as the system response under anomalous conditions using Varian RPM position information. We have further refined the processes and QA to enhance the safety of the DMLC tracking system. All developed tests will be re-evaluated with the Calypso system ahead of treating our first patient.
RESULTS: The commissioning uncovered several bugs in the DMLC tracking software that were fixed. Interlocks were added to stop the radiation beam for issues such as the tracked target moving beneath a static jaw. The scale and coordinate system tests passed. System latency with RPM is measured at 533ms which is double the reported value using Calypso. Dosimetric accuracy of DMLC tracking is dependent on the latency and currently evaluation shows lower gamma pass rates than the original treatment plan.
DISCUSSION & CONCLUSIONS: A commissioning framework has been implemented for RPM--guided DMLC tracking for use ahead of the Calypso-guided DMLC study for prostate RapidArc.
REFERNCES: 1. A. Sawant, S. Dietrich, M. Svatos, P.J. Keall. 2010 Failure Mode and effect analysis-based quality assurance for dynamic MLC tracking systems. Med.Phys. 37(12):6466-6479.
ACKNOWLEDGEMENTS: This work was made possible through an NHMRC Australia Fellowship, US NIH R01 93626 and a Varian Medical Systems Collaborative agreement.
EPSM-1183 Tue 5th Nov 11:15 Golden Ballroom South Radiotherapy
88 Perth Nov 3-7 2013 EPSM 2013
MEDICAL DEVICE INNOVATION – WHY IS IT SO HARD? K.J. Reynolds The Medical Device Research Institute, Flinders University, South Australia
Biomedical engineering, a unique mix of engineering, medicine and science, is arguably one of the fastest growing branch of engineering globally. Biomedical engineers develop new devices, algorithms, and technologies that improve medical practice and health care delivery. Some notable examples include the heart pacemaker, artificial hip, and cochlear implant.
The ageing demographic means that the demand for medical devices and for technologies to assist with independent living will continue to grow steadily. But while Australia is well placed to expand its involvement in the sector, and in particular in the rapidly developing Asian market, the process of product development is fraught with potential obstacles. The medical device industry consists primarily of small companies focused on one or two innovative products. With the current economic and funding environment, there are increasing challenges for small companies to engage in research and innovation. Meanwhile our research programs are generally technology driven rather than market or end-user driven.
In her seminar, Karen will describe some of the biomedical engineering research activity being undertaken in South Australia, and will provide an insight into her experiences in running the Medical Device Partnering Program (MDPP), an innovative model for industry-institutional engagement and collaborative product development.
EPSM-1241 Tue 5th Nov 10:30 Golden Ballroom Centre Biomed Eng
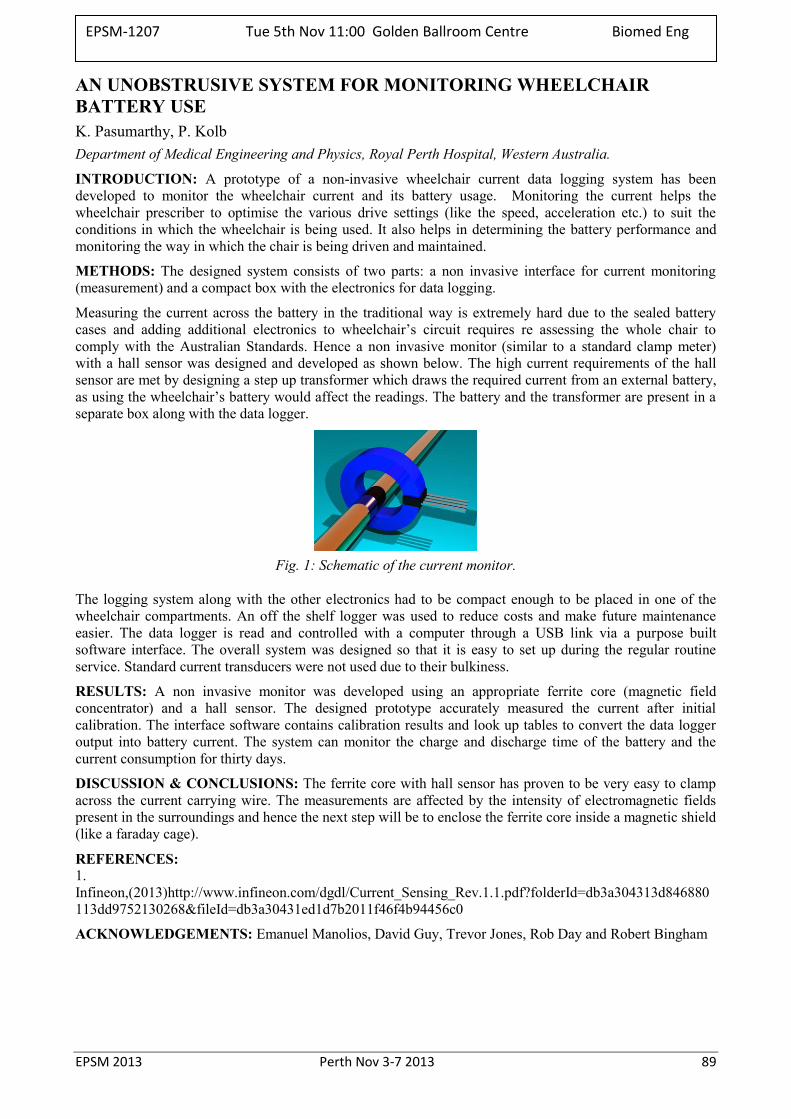
EPSM 2013 Perth Nov 3-7 2013 89
AN UNOBSTRUSIVE SYSTEM FOR MONITORING WHEELCHAIR BATTERY USE K. Pasumarthy, P. Kolb Department of Medical Engineering and Physics, Royal Perth Hospital, Western Australia.
INTRODUCTION: A prototype of a non-invasive wheelchair current data logging system has been developed to monitor the wheelchair current and its battery usage. Monitoring the current helps the wheelchair prescriber to optimise the various drive settings (like the speed, acceleration etc.) to suit the conditions in which the wheelchair is being used. It also helps in determining the battery performance and monitoring the way in which the chair is being driven and maintained.
METHODS: The designed system consists of two parts: a non invasive interface for current monitoring (measurement) and a compact box with the electronics for data logging.
Measuring the current across the battery in the traditional way is extremely hard due to the sealed battery cases and adding additional electronics to wheelchair’s circuit requires re assessing the whole chair to comply with the Australian Standards. Hence a non invasive monitor (similar to a standard clamp meter) with a hall sensor was designed and developed as shown below. The high current requirements of the hall sensor are met by designing a step up transformer which draws the required current from an external battery, as using the wheelchair’s battery would affect the readings. The battery and the transformer are present in a separate box along with the data logger.
Fig. 1: Schematic of the current monitor.
The logging system along with the other electronics had to be compact enough to be placed in one of the wheelchair compartments. An off the shelf logger was used to reduce costs and make future maintenance easier. The data logger is read and controlled with a computer through a USB link via a purpose built software interface. The overall system was designed so that it is easy to set up during the regular routine service. Standard current transducers were not used due to their bulkiness.
RESULTS: A non invasive monitor was developed using an appropriate ferrite core (magnetic field concentrator) and a hall sensor. The designed prototype accurately measured the current after initial calibration. The interface software contains calibration results and look up tables to convert the data logger output into battery current. The system can monitor the charge and discharge time of the battery and the current consumption for thirty days.
DISCUSSION & CONCLUSIONS: The ferrite core with hall sensor has proven to be very easy to clamp across the current carrying wire. The measurements are affected by the intensity of electromagnetic fields present in the surroundings and hence the next step will be to enclose the ferrite core inside a magnetic shield (like a faraday cage).
REFERENCES: 1. Infineon,(2013)http://www.infineon.com/dgdl/Current_Sensing_Rev.1.1.pdf?folderId=db3a304313d846880113dd9752130268&fileId=db3a30431ed1d7b2011f46f4b94456c0
ACKNOWLEDGEMENTS: Emanuel Manolios, David Guy, Trevor Jones, Rob Day and Robert Bingham
EPSM-1207 Tue 5th Nov 11:00 Golden Ballroom Centre Biomed Eng
90 Perth Nov 3-7 2013 EPSM 2013
MEASURING TKR ALIGNMENT WITH THE PERTH CT PROTOCOL: INFLUENCE OF FEMORAL AND TIBIAL ROTATION AT 1 YEAR POST SURGERY K. Sloan, T. Bucher, R. Beaver JRAC, Elective Orthopaedics, Royal Perth Hospital, Perth,Western Australia.
INTRODUCTION: Alignment of TKR is now being examined as a factor in poor outcomes, particularly rotation [1, 2] using techniques similar to the Perth CT protocol. Many of these studies do not define the accuracy of the technique. We aimed to define the intra and inter-observer reliability of the Perth CT protocol. We then examined the relationship between rotation of the femoral and tibial components and functional outcome at 1 year post surgery.
METHODS: Reliability- Two radiographers experienced in using the Perth CT protocol measured 10 CT scans twice, randomly presented one week apart. Using an Anova, variance components were separated and error expressed as 95% confidence limits. Within measurer error varied from +/-2.0 to +/- 3.4 degrees, while the between measurer error ranged from +/-2.0 to +/-5 degrees. Work was done to improve instructions and selection of anatomical landmarks. The study was repeated with 5 CT scans and the same radiographers. The within measurer error improved to less than +/- 2.0 degrees for most variables while the between measurer error was found to be less than +/- 3 degrees.
Outcome Study- We examined 346 patient CT scans, measured by a single radiographer. These patients had variable surgeons and implants, but mobile bearing knees were removed. Rotation of the femoral and tibial components (error +/-1.5 degrees) were compared with the knee society score (knee and function components), range of motion (ROM), and pain at 1 year. Patients were divided into 2 groups, moderate/severe pain and no pain and rotation compared using t tests. The data were also examined using femoral or tibial internal rotation as the dividing variable, reflecting current research findings [1, 2].
RESULTS: Regarding both femoral and tibial rotation there was no difference between the 2 pain groups (p=0.6,0.16), although there was a tendency for the pain group to have greater tibial internal rotation. Patients were divided into 2 groups for femoral rotation using 2 degrees internal rotation as the threshold, followed by 3 degrees. There was no significant differences (p=0.9,0.3) between groups. Patients were divided into 2 groups for tibial rotation, starting at 2 degrees internal rotation, until 18 degrees, when numbers became too small. Large significant differences were found in the KSS (knee component) and ROM between 7-9 degrees (p=0.001,0.000). The differences tailed off each side of this threshold. There was no difference in the functional KSS component.
DISCUSSION & CONCLUSIONS: In this study we have been unable to correlate femoral alignment with pain, ROM and KSS. However ROM and KSS are significantly influenced by internal tibial rotation, particularly after 7-9 degrees, although clinically the differences are small. A larger percentage of those patients in the pain group had internal rotation greater than 9 degrees but the relationship is not linear. Outcome after TKR remains multi-factorial and rotational alignment should be used with caution when accessing revision options.
REFERENCES: 1. Nicoll D and Rowley D, "Internal rotational error of the tibial component is a major cause of pain after total knee replacement", JBJS vol 92-B, No 9, Sept 2010. 2. Pietsch M and Hofman S, "Isolated internal malrotation of the femoral component in total knee arthroplasty". Knee Surg Sports Traumatol Arthrosc, 20(6):1057-63, June 2012
EPSM-1227 Tue 5th Nov 11:15 Golden Ballroom Centre Other

EPSM 2013 Perth Nov 3-7 2013 91
A MICROSCOPE IN A NEEDLE – NEW TECHNIQUES TO VIEW DISEASE R.A. McLaughlin1, D. Lorenser1, B.C. Quirk1, L. Scolaro1, X. Yang1, K.M. Kennedy1, D.D. Sampson1,2 1Optical + Biomedical Engineering Laboratory, School of Electrical, Electronic and Computer Engineering,
University of Western Australia, Perth, Western Australia. 2Centre for Microscopy, Characterisation and Analysis, University of Western Australia, Perth, Western
Australia.
INTRODUCTION: Disease changes both the microscopic structure and optical properties of tissue. Optical imaging techniques, such as optical coherence tomography (OCT), have the potential to provide high resolution images of diseased tissue in vivo. However, OCT has a very limited image penetration depth in tissue, typically only 2-3mm. We have developed a miniaturised OCT probe, small enough to be encased within a hypodermic needle, which can be inserted into previously inaccessible regions of the body to obtain high resolution optical images: a ‘microscope-in-a-needle’.
METHODS: The all-fibre focusing optics comprises well-controlled lengths of gradient-index (GRIN) and no-core fibre, fused to the end of a length of single-mode fibre [1]. Fig. 1(a) shows one of our recent designs [2], and Fig 1(b) shows a photo of a completed probe. We have assessed these probes in a number of tissues, including breast cancer and lung tissue.
RESULTS: Fig 1(c) shows an image acquired from within an ex vivo human mastectomy sample, showing the boundary of a tumour. Fig. 1(d) shows the correlated histology image obtained from the same location [3]. Note the distinction between the solid tumour tissue, and the honeycomb structure of the adjacent normal adipose tissue.
Fig. 1: (a) Needle probe schematic. (b) Photo of a completed needle probe. (c) OCT image of a breast
tumour sample; and (d) the correlated histology image from the same location. Adapted from [3].
DISCUSSION & CONCLUSIONS: We have demonstrated the ability of these probes to image the boundary of tumour tissue in ex vivo human breast samples; to acquire images of alveoli structures in isolated animal lung samples; and to obtain dynamic image sequences of lung tissue during simulated respiration [4]. We have recently developed a multi-modal probe, capable of simultaneously acquiring both an OCT image and a fluorescent image [5], and are currently exploring the in vivo translation of these probes.
REFERENCES: 1. Lorenser et al. (2011) Optics Lett., 36(19):3894-3896. 2. Scolaro et al. (2012) Optics Lett., 37(24):5247-5249. 3. McLaughlin et al. (2012) IEEE J. Selected Topics in Quantum Electronics, 18(3):1184-1191. 4. McLaughlin et al. (2012) J. Appl. Physiol. 113(6):967-974. 5. Lorenser et al. (2013) Optics Lett. 38(3):266-268.
ACKNOWLEDGEMENT: R.A. McLaughlin is funded by a fellowship from Cancer Council WA.
EPSM-1077 Tue 5th Nov 10:30 Golden Ballroom North Biomed Eng
92 Perth Nov 3-7 2013 EPSM 2013
A 256-CHANNEL RETINAL IMPLANT H. Meffin Victorian Research Laboratory, National ICT Australia. Neuroengineering Laboratory, Department of Electrical & Electronic Engineering, The University of
Melbourne. The Centre for Neural Engineering, The University of Melbourne.
An overview of the retinal implant research program of Bionic Vision Australia will be presented with a focus on recent results. Retinal implants aim to restore some level of functional vision to patients with degenerative retinal diseases such as retinitis pigmentosa via electrical stimulation of surviving neurons. An update on results from three patients implanted with a 24-channel prototype device will be briefly given. The majority of the talk will focus on the next generation “high-acuity” device containing 256 electrodes. The intraocular device comprises a diamond, 256-channel electrode array ball bonded to a stimulator chip which is in turn encapsulated in a thin hermetic diamond case. Hermetic feed-throughs through the case connect the chip to a helical leadwire that exits the eye in order to power the device and to provide a two-way communication link. Previously at EPSM, I have described novel features of the high density diamond electrode array. In this talk I will focus on:
1. Reporting the successful benchtop testing of the intraocular stimulator chip. This chip has 256 independent stimulators in a 3 mm x 3 mm area, providing the flexibility to stimulate with near arbitrary spatial patterns.
2. Results on hermetic welding of the diamond box that encapsulates the electronics, including biocompatibility and longevity.
3. Results comparing two methods for fixing the device to the retina: 1) A retinal tack that is inserted through the device into the retina; and 2) A system that uses magnets placed on either side of the retina.
EPSM-1222 Tue 5th Nov 11:00 Golden Ballroom North Biomed Eng
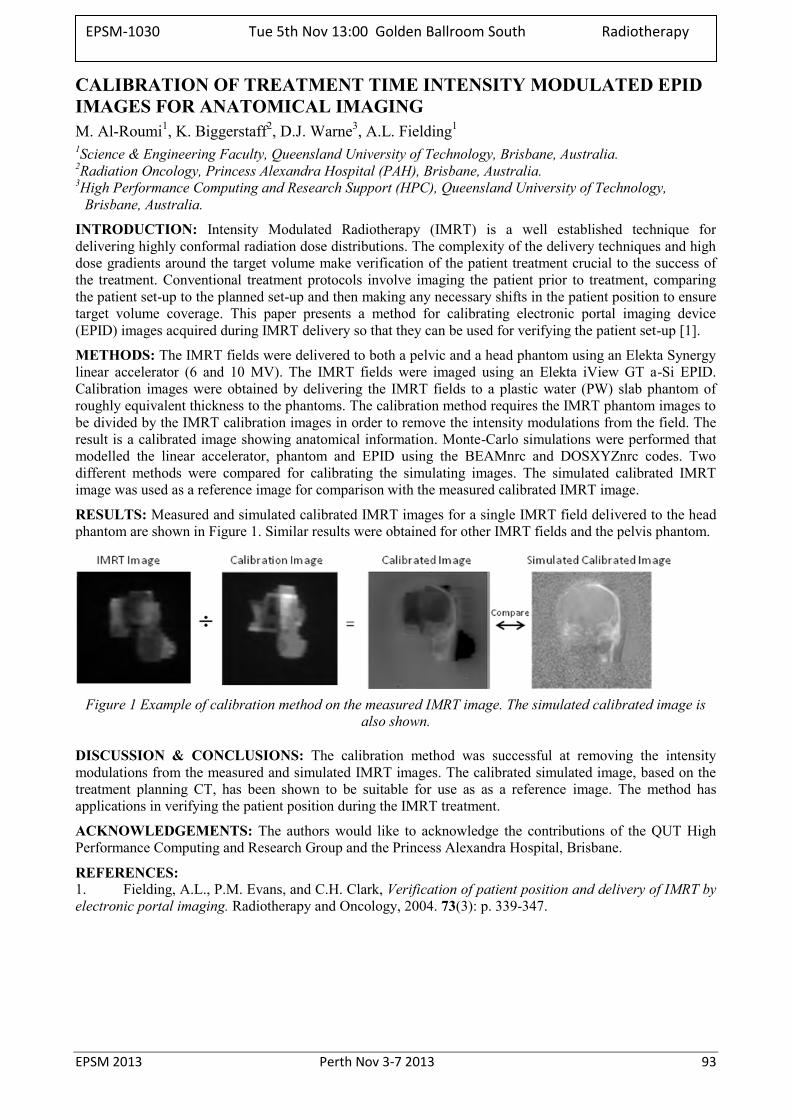
EPSM 2013 Perth Nov 3-7 2013 93
CALIBRATION OF TREATMENT TIME INTENSITY MODULATED EPID IMAGES FOR ANATOMICAL IMAGING M. Al-Roumi1, K. Biggerstaff2, D.J. Warne3, A.L. Fielding1 1Science & Engineering Faculty, Queensland University of Technology, Brisbane, Australia. 2Radiation Oncology, Princess Alexandra Hospital (PAH), Brisbane, Australia. 3High Performance Computing and Research Support (HPC), Queensland University of Technology,
Brisbane, Australia.
INTRODUCTION: Intensity Modulated Radiotherapy (IMRT) is a well established technique for delivering highly conformal radiation dose distributions. The complexity of the delivery techniques and high dose gradients around the target volume make verification of the patient treatment crucial to the success of the treatment. Conventional treatment protocols involve imaging the patient prior to treatment, comparing the patient set-up to the planned set-up and then making any necessary shifts in the patient position to ensure target volume coverage. This paper presents a method for calibrating electronic portal imaging device (EPID) images acquired during IMRT delivery so that they can be used for verifying the patient set-up [1].
METHODS: The IMRT fields were delivered to both a pelvic and a head phantom using an Elekta Synergy linear accelerator (6 and 10 MV). The IMRT fields were imaged using an Elekta iView GT a-Si EPID. Calibration images were obtained by delivering the IMRT fields to a plastic water (PW) slab phantom of roughly equivalent thickness to the phantoms. The calibration method requires the IMRT phantom images to be divided by the IMRT calibration images in order to remove the intensity modulations from the field. The result is a calibrated image showing anatomical information. Monte-Carlo simulations were performed that modelled the linear accelerator, phantom and EPID using the BEAMnrc and DOSXYZnrc codes. Two different methods were compared for calibrating the simulating images. The simulated calibrated IMRT image was used as a reference image for comparison with the measured calibrated IMRT image.
RESULTS: Measured and simulated calibrated IMRT images for a single IMRT field delivered to the head phantom are shown in Figure 1. Similar results were obtained for other IMRT fields and the pelvis phantom.
Figure 1 Example of calibration method on the measured IMRT image. The simulated calibrated image is
also shown.
DISCUSSION & CONCLUSIONS: The calibration method was successful at removing the intensity modulations from the measured and simulated IMRT images. The calibrated simulated image, based on the treatment planning CT, has been shown to be suitable for use as as a reference image. The method has applications in verifying the patient position during the IMRT treatment.
ACKNOWLEDGEMENTS: The authors would like to acknowledge the contributions of the QUT High Performance Computing and Research Group and the Princess Alexandra Hospital, Brisbane.
REFERENCES: 1. Fielding, A.L., P.M. Evans, and C.H. Clark, Verification of patient position and delivery of IMRT by electronic portal imaging. Radiotherapy and Oncology, 2004. 73(3): p. 339-347.
EPSM-1030 Tue 5th Nov 13:00 Golden Ballroom South Radiotherapy
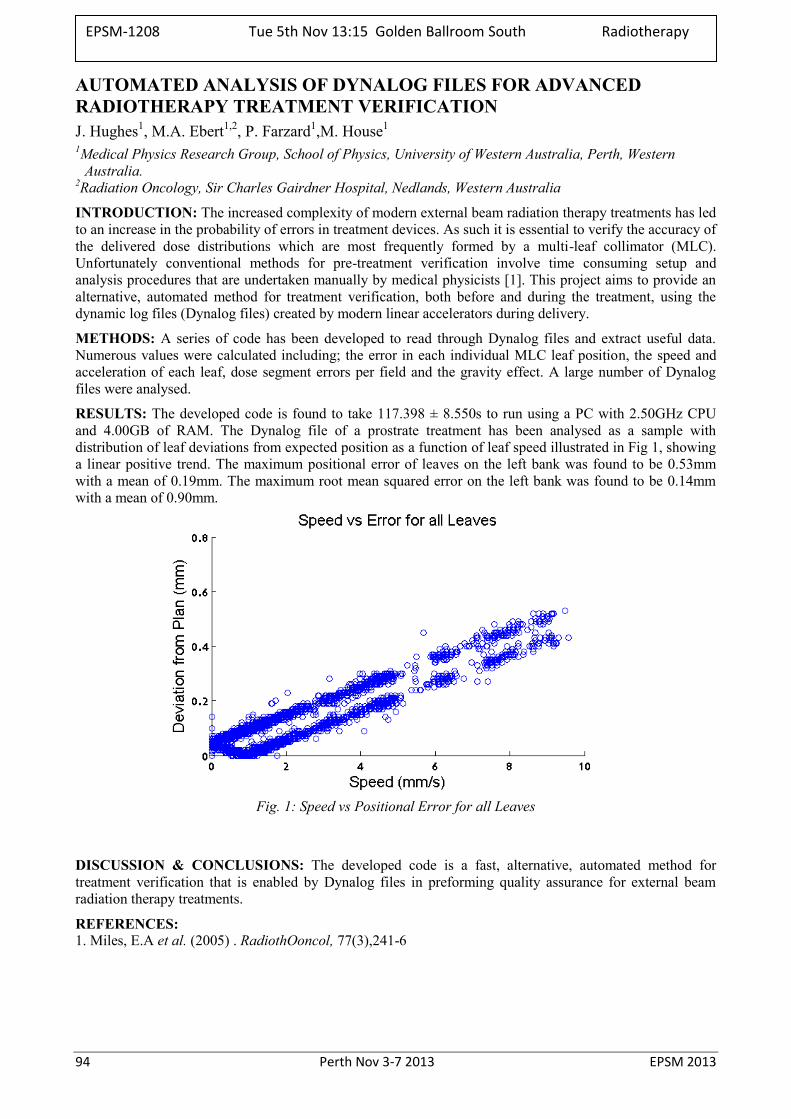
94 Perth Nov 3-7 2013 EPSM 2013
AUTOMATED ANALYSIS OF DYNALOG FILES FOR ADVANCED RADIOTHERAPY TREATMENT VERIFICATION J. Hughes1, M.A. Ebert1,2, P. Farzard1,M. House1 1Medical Physics Research Group, School of Physics, University of Western Australia, Perth, Western
Australia. 2Radiation Oncology, Sir Charles Gairdner Hospital, Nedlands, Western Australia
INTRODUCTION: The increased complexity of modern external beam radiation therapy treatments has led to an increase in the probability of errors in treatment devices. As such it is essential to verify the accuracy of the delivered dose distributions which are most frequently formed by a multi-leaf collimator (MLC). Unfortunately conventional methods for pre-treatment verification involve time consuming setup and analysis procedures that are undertaken manually by medical physicists [1]. This project aims to provide an alternative, automated method for treatment verification, both before and during the treatment, using the dynamic log files (Dynalog files) created by modern linear accelerators during delivery.
METHODS: A series of code has been developed to read through Dynalog files and extract useful data. Numerous values were calculated including; the error in each individual MLC leaf position, the speed and acceleration of each leaf, dose segment errors per field and the gravity effect. A large number of Dynalog files were analysed.
RESULTS: The developed code is found to take 117.398 ± 8.550s to run using a PC with 2.50GHz CPU and 4.00GB of RAM. The Dynalog file of a prostrate treatment has been analysed as a sample with distribution of leaf deviations from expected position as a function of leaf speed illustrated in Fig 1, showing a linear positive trend. The maximum positional error of leaves on the left bank was found to be 0.53mm with a mean of 0.19mm. The maximum root mean squared error on the left bank was found to be 0.14mm with a mean of 0.90mm.
Fig. 1: Speed vs Positional Error for all Leaves
DISCUSSION & CONCLUSIONS: The developed code is a fast, alternative, automated method for treatment verification that is enabled by Dynalog files in preforming quality assurance for external beam radiation therapy treatments.
REFERENCES: 1. Miles, E.A et al. (2005) . RadiothOoncol, 77(3),241-6
EPSM-1208 Tue 5th Nov 13:15 Golden Ballroom South Radiotherapy
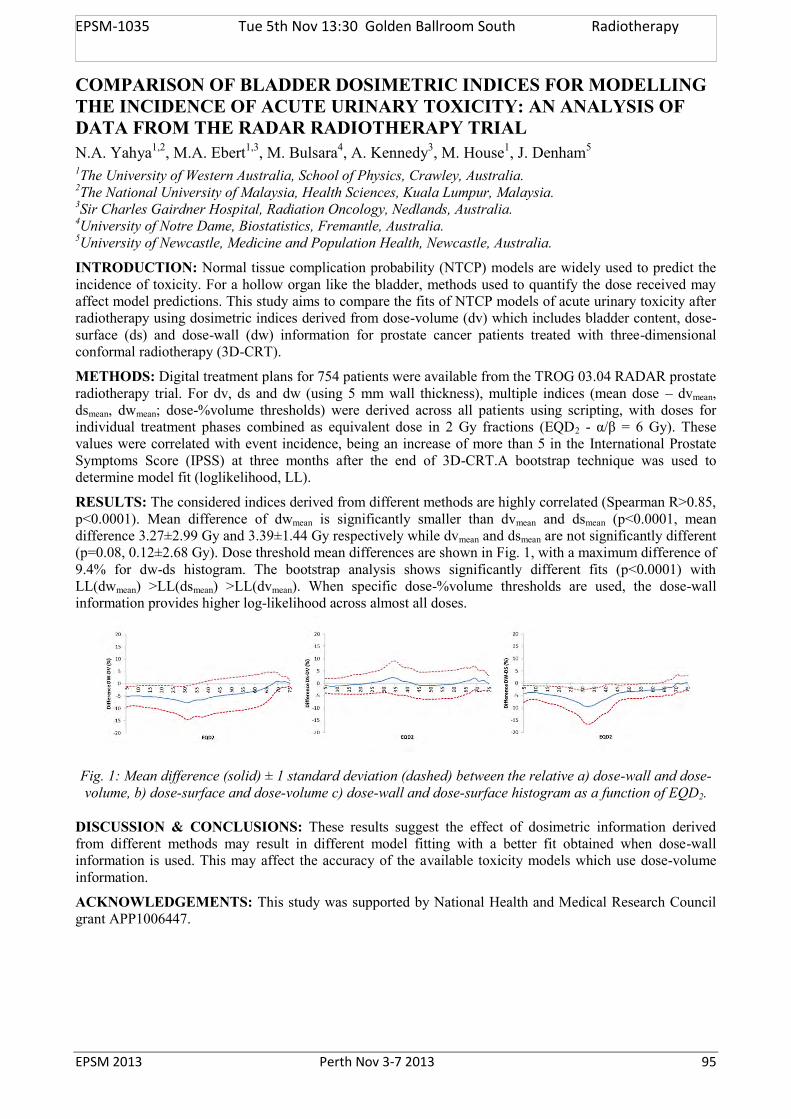
EPSM 2013 Perth Nov 3-7 2013 95
COMPARISON OF BLADDER DOSIMETRIC INDICES FOR MODELLING THE INCIDENCE OF ACUTE URINARY TOXICITY: AN ANALYSIS OF DATA FROM THE RADAR RADIOTHERAPY TRIAL N.A. Yahya1,2, M.A. Ebert1,3, M. Bulsara4, A. Kennedy3, M. House1, J. Denham5
1The University of Western Australia, School of Physics, Crawley, Australia. 2The National University of Malaysia, Health Sciences, Kuala Lumpur, Malaysia. 3Sir Charles Gairdner Hospital, Radiation Oncology, Nedlands, Australia. 4University of Notre Dame, Biostatistics, Fremantle, Australia. 5University of Newcastle, Medicine and Population Health, Newcastle, Australia.
INTRODUCTION: Normal tissue complication probability (NTCP) models are widely used to predict the incidence of toxicity. For a hollow organ like the bladder, methods used to quantify the dose received may affect model predictions. This study aims to compare the fits of NTCP models of acute urinary toxicity after radiotherapy using dosimetric indices derived from dose-volume (dv) which includes bladder content, dose-surface (ds) and dose-wall (dw) information for prostate cancer patients treated with three-dimensional conformal radiotherapy (3D-CRT).
METHODS: Digital treatment plans for 754 patients were available from the TROG 03.04 RADAR prostate radiotherapy trial. For dv, ds and dw (using 5 mm wall thickness), multiple indices (mean dose – dvmean, dsmean, dwmean; dose-%volume thresholds) were derived across all patients using scripting, with doses for individual treatment phases combined as equivalent dose in 2 Gy fractions (EQD2 - α/β = 6 Gy). These values were correlated with event incidence, being an increase of more than 5 in the International Prostate Symptoms Score (IPSS) at three months after the end of 3D-CRT.A bootstrap technique was used to determine model fit (loglikelihood, LL).
RESULTS: The considered indices derived from different methods are highly correlated (Spearman R>0.85, p<0.0001). Mean difference of dwmean is significantly smaller than dvmean and dsmean (p<0.0001, mean difference 3.27±2.99 Gy and 3.39±1.44 Gy respectively while dvmean and dsmean are not significantly different (p=0.08, 0.12±2.68 Gy). Dose threshold mean differences are shown in Fig. 1, with a maximum difference of 9.4% for dw-ds histogram. The bootstrap analysis shows significantly different fits (p<0.0001) with LL(dwmean) >LL(dsmean) >LL(dvmean). When specific dose-%volume thresholds are used, the dose-wall information provides higher log-likelihood across almost all doses.
Fig. 1: Mean difference (solid) ± 1 standard deviation (dashed) between the relative a) dose-wall and dose-volume, b) dose-surface and dose-volume c) dose-wall and dose-surface histogram as a function of EQD2.
DISCUSSION & CONCLUSIONS: These results suggest the effect of dosimetric information derived from different methods may result in different model fitting with a better fit obtained when dose-wall information is used. This may affect the accuracy of the available toxicity models which use dose-volume information.
ACKNOWLEDGEMENTS: This study was supported by National Health and Medical Research Council grant APP1006447.
EPSM-1035 Tue 5th Nov 13:30 Golden Ballroom South Radiotherapy
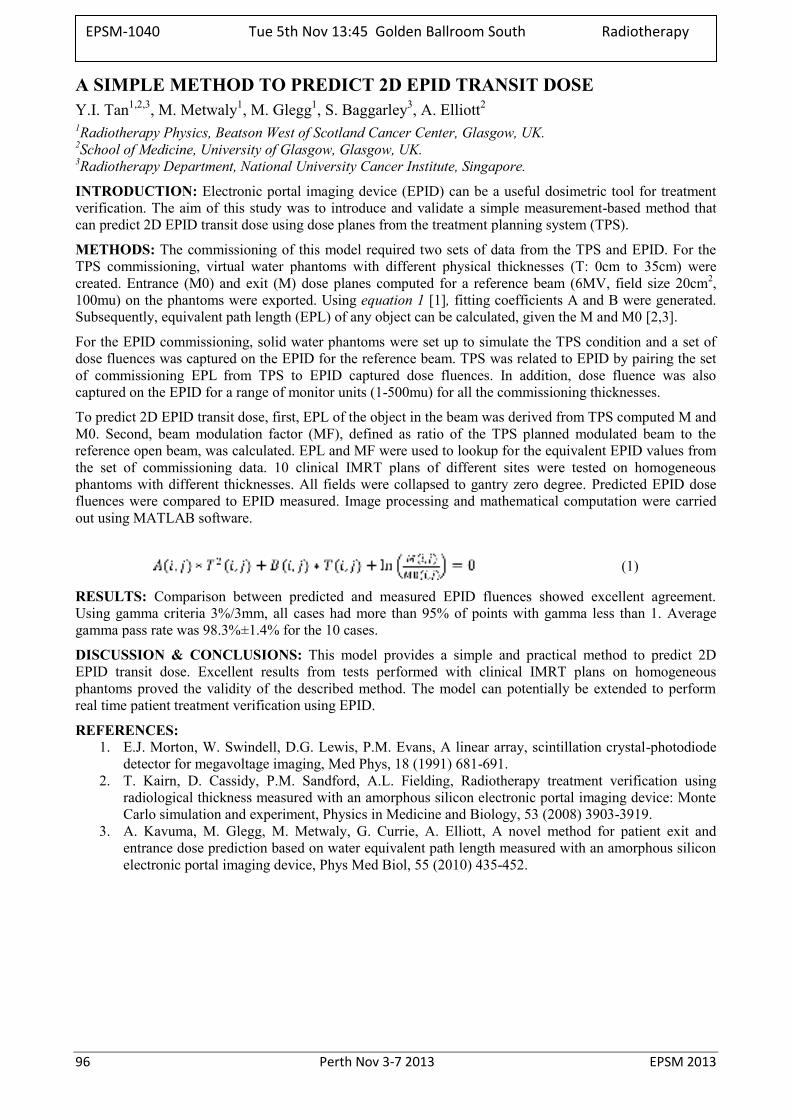
96 Perth Nov 3-7 2013 EPSM 2013
A SIMPLE METHOD TO PREDICT 2D EPID TRANSIT DOSE Y.I. Tan1,2,3, M. Metwaly1, M. Glegg1, S. Baggarley3, A. Elliott2 1Radiotherapy Physics, Beatson West of Scotland Cancer Center, Glasgow, UK. 2School of Medicine, University of Glasgow, Glasgow, UK. 3Radiotherapy Department, National University Cancer Institute, Singapore.
INTRODUCTION: Electronic portal imaging device (EPID) can be a useful dosimetric tool for treatment verification. The aim of this study was to introduce and validate a simple measurement-based method that can predict 2D EPID transit dose using dose planes from the treatment planning system (TPS).
METHODS: The commissioning of this model required two sets of data from the TPS and EPID. For the TPS commissioning, virtual water phantoms with different physical thicknesses (T: 0cm to 35cm) were created. Entrance (M0) and exit (M) dose planes computed for a reference beam (6MV, field size 20cm2, 100mu) on the phantoms were exported. Using equation 1 [1], fitting coefficients A and B were generated. Subsequently, equivalent path length (EPL) of any object can be calculated, given the M and M0 [2,3].
For the EPID commissioning, solid water phantoms were set up to simulate the TPS condition and a set of dose fluences was captured on the EPID for the reference beam. TPS was related to EPID by pairing the set of commissioning EPL from TPS to EPID captured dose fluences. In addition, dose fluence was also captured on the EPID for a range of monitor units (1-500mu) for all the commissioning thicknesses.
To predict 2D EPID transit dose, first, EPL of the object in the beam was derived from TPS computed M and M0. Second, beam modulation factor (MF), defined as ratio of the TPS planned modulated beam to the reference open beam, was calculated. EPL and MF were used to lookup for the equivalent EPID values from the set of commissioning data. 10 clinical IMRT plans of different sites were tested on homogeneous phantoms with different thicknesses. All fields were collapsed to gantry zero degree. Predicted EPID dose fluences were compared to EPID measured. Image processing and mathematical computation were carried out using MATLAB software.
(1)
RESULTS: Comparison between predicted and measured EPID fluences showed excellent agreement. Using gamma criteria 3%/3mm, all cases had more than 95% of points with gamma less than 1. Average gamma pass rate was 98.3%±1.4% for the 10 cases.
DISCUSSION & CONCLUSIONS: This model provides a simple and practical method to predict 2D EPID transit dose. Excellent results from tests performed with clinical IMRT plans on homogeneous phantoms proved the validity of the described method. The model can potentially be extended to perform real time patient treatment verification using EPID.
REFERENCES: 1. E.J. Morton, W. Swindell, D.G. Lewis, P.M. Evans, A linear array, scintillation crystal-photodiode
detector for megavoltage imaging, Med Phys, 18 (1991) 681-691. 2. T. Kairn, D. Cassidy, P.M. Sandford, A.L. Fielding, Radiotherapy treatment verification using
radiological thickness measured with an amorphous silicon electronic portal imaging device: Monte Carlo simulation and experiment, Physics in Medicine and Biology, 53 (2008) 3903-3919.
3. A. Kavuma, M. Glegg, M. Metwaly, G. Currie, A. Elliott, A novel method for patient exit and entrance dose prediction based on water equivalent path length measured with an amorphous silicon electronic portal imaging device, Phys Med Biol, 55 (2010) 435-452.
EPSM-1040 Tue 5th Nov 13:45 Golden Ballroom South Radiotherapy
EPSM 2013 Perth Nov 3-7 2013 97
A PRACTICAL AND THEORETICAL DEFINITION OF ‘SMALL FIELD’ P.H. Charles1, G. Cranmer-Sargison2,3, S.B. Crowe1, T. Kairn1,4, D.I. Thwaites3,5, J.V. Trapp1 1Science and engineering faculty, Queensland University of Technology, Brisbane, Queensland. 2Department of Medical Physics, Saskatchewan Cancer Agency, Saskatoon, Canada. 3Academic Unit of Medical Physics, Faculty of Medicine and Health, University of Leeds, UK. 4Premion Cancer Care, Brisbane, Queensland. 5Institute of Medical Physics, School of Physics, University of Sydney, New South Wales.
INTRODUCTION: The consistency of measuring small field output factors is greatly increased by reporting the measured dosimetric field size of each factor, as opposed to simply stating the nominal field size1 and therefore requires the measurement of cross-axis profiles in a water tank. However, this makes output factor measurements time consuming. This project establishes at which field size the accuracy of output factors are not affected by the use of potentially inaccurate nominal field sizes, which we believe establishes a practical working definition of a ‘small’ field. The physical components of the radiation beam that contribute to the rapid change in output factor at small field sizes are examined in detail. The physical interaction that dominates the cause of the rapid dose reduction is quantified, and leads to the establishment of a theoretical definition of a ‘small’ field.
METHODS: Current recommendations suggest that radiation collimation systems and isocentre defining lasers should both be calibrated to permit a maximum positioning uncertainty of 1 mm2. The proposed practical definition for small field sizes is as follows: if the output factor changes by ±1.0 % given a change in either field size or detector position of up to ±1 mm then the field should be considered small. Monte Carlo modelling was used to simulate output factors of a 6 MV photon beam for square fields with side lengths from 4.0 mm to 20.0 mm in 1.0 mm increments. The dose was scored to a 0.5 mm wide and 2.0 mm deep cylindrical volume of water within a cubic water phantom, at a depth of 5 cm and SSD of 95 cm. The maximum difference due to a collimator error of +1 mm was found by comparing the output factors of adjacent field sizes. The output factor simulations were repeated 1 mm off-axis to quantify the effect of detector misalignment. Further simulations separated the total output factor into collimator scatter factor and phantom scatter factor. The collimator scatter factor was further separated into primary source occlusion effects and ‘traditional’ effects (a combination of flattening filter and jaw scatter etc). The phantom scatter was separated in photon scatter and electronic disequilibrium. Each of these factors was plotted as a function of field size in order to quantify how each affected the change in small field size.
RESULTS: The use of our practical definition resulted in field sizes of 15 mm or less being characterised as 'small'. The change in field size had a greater effect than that of detector misalignment. For field sizes of 12 mm or less, electronic disequilibrium was found to cause the largest change in dose to the central axis (d = 5 cm). Source occlusion also caused a large change in output factor for field sizes less than 8 mm.
DISCUSSION & CONCLUSIONS: The measurement of cross-axis profiles are only required for output factor measurements for field sizes of 15 mm or less (for a 6 MV beam on Varian iX linear accelerator). This is expected to be dependent on linear accelerator spot size and photon energy. While some electronic disequilibrium was shown to occur at field sizes as large as 30 mm (the ‘traditional’ definition of small field3), it has been shown that it does not cause a greater change than photon scatter until a field size of 12 mm, at which point it becomes by far the most dominant effect.
REFERENCES: 1. G. Granmer-Sargison et al (2013) A methodological approach to reporting corrected small field relative outputs., Submitted for publication. 2. E. Klein et al (2009) Medical Physics 36(9): 4197-4212. 3. I. Das et al (2008) Medical Physics 35(1): 206-215.
ACKNOWLEDGEMENTS: This study was supported by the Australian Research Council, the Wesley Research Institute, Premion and the Queensland University of Technology (QUT), through linkage grant number LP110100401. Computational resources and services used in this work were provided by the HPC and Research Support Unit, QUT.
EPSM-1091 Tue 5th Nov 14:00 Golden Ballroom South Radiotherapy
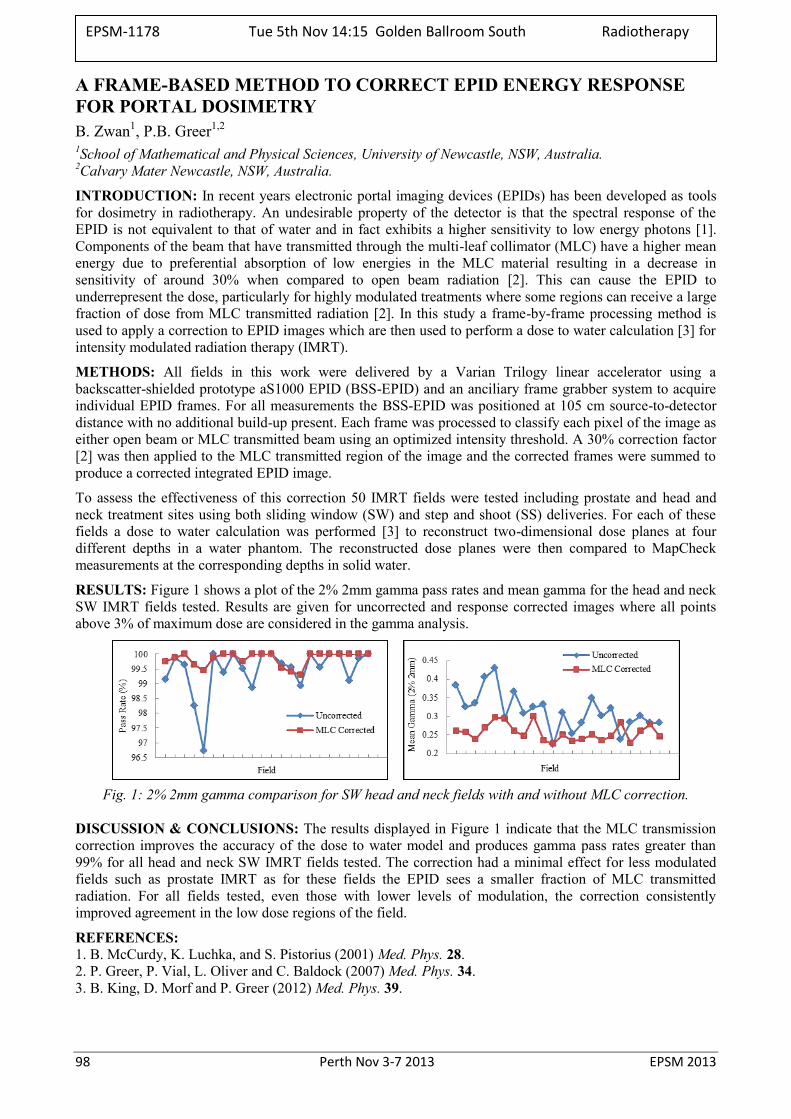
98 Perth Nov 3-7 2013 EPSM 2013
A FRAME-BASED METHOD TO CORRECT EPID ENERGY RESPONSE FOR PORTAL DOSIMETRY B. Zwan1, P.B. Greer1,2
1School of Mathematical and Physical Sciences, University of Newcastle, NSW, Australia. 2Calvary Mater Newcastle, NSW, Australia.
INTRODUCTION: In recent years electronic portal imaging devices (EPIDs) has been developed as tools for dosimetry in radiotherapy. An undesirable property of the detector is that the spectral response of the EPID is not equivalent to that of water and in fact exhibits a higher sensitivity to low energy photons [1]. Components of the beam that have transmitted through the multi-leaf collimator (MLC) have a higher mean energy due to preferential absorption of low energies in the MLC material resulting in a decrease in sensitivity of around 30% when compared to open beam radiation [2]. This can cause the EPID to underrepresent the dose, particularly for highly modulated treatments where some regions can receive a large fraction of dose from MLC transmitted radiation [2]. In this study a frame-by-frame processing method is used to apply a correction to EPID images which are then used to perform a dose to water calculation [3] for intensity modulated radiation therapy (IMRT).
METHODS: All fields in this work were delivered by a Varian Trilogy linear accelerator using a backscatter-shielded prototype aS1000 EPID (BSS-EPID) and an anciliary frame grabber system to acquire individual EPID frames. For all measurements the BSS-EPID was positioned at 105 cm source-to-detector distance with no additional build-up present. Each frame was processed to classify each pixel of the image as either open beam or MLC transmitted beam using an optimized intensity threshold. A 30% correction factor [2] was then applied to the MLC transmitted region of the image and the corrected frames were summed to produce a corrected integrated EPID image.
To assess the effectiveness of this correction 50 IMRT fields were tested including prostate and head and neck treatment sites using both sliding window (SW) and step and shoot (SS) deliveries. For each of these fields a dose to water calculation was performed [3] to reconstruct two-dimensional dose planes at four different depths in a water phantom. The reconstructed dose planes were then compared to MapCheck measurements at the corresponding depths in solid water.
RESULTS: Figure 1 shows a plot of the 2% 2mm gamma pass rates and mean gamma for the head and neck SW IMRT fields tested. Results are given for uncorrected and response corrected images where all points above 3% of maximum dose are considered in the gamma analysis.
Fig. 1: 2% 2mm gamma comparison for SW head and neck fields with and without MLC correction.
DISCUSSION & CONCLUSIONS: The results displayed in Figure 1 indicate that the MLC transmission correction improves the accuracy of the dose to water model and produces gamma pass rates greater than 99% for all head and neck SW IMRT fields tested. The correction had a minimal effect for less modulated fields such as prostate IMRT as for these fields the EPID sees a smaller fraction of MLC transmitted radiation. For all fields tested, even those with lower levels of modulation, the correction consistently improved agreement in the low dose regions of the field.
REFERENCES: 1. B. McCurdy, K. Luchka, and S. Pistorius (2001) Med. Phys. 28. 2. P. Greer, P. Vial, L. Oliver and C. Baldock (2007) Med. Phys. 34. 3. B. King, D. Morf and P. Greer (2012) Med. Phys. 39.
EPSM-1178 Tue 5th Nov 14:15 Golden Ballroom South Radiotherapy
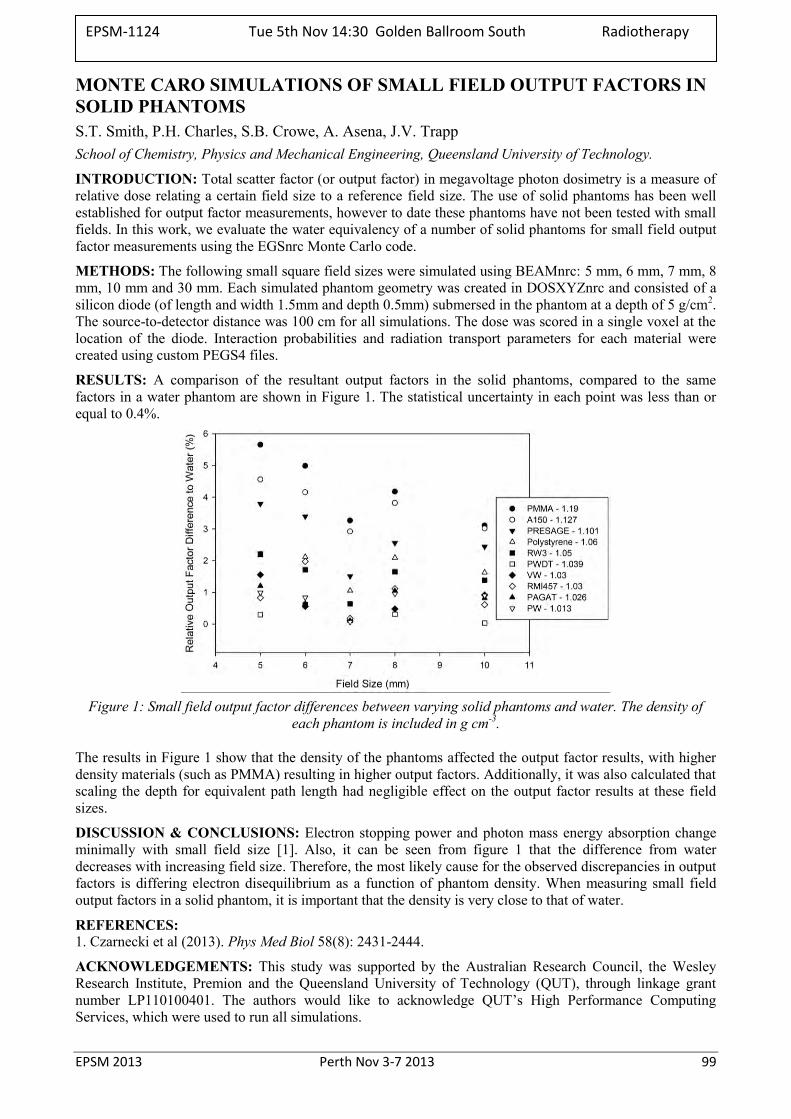
EPSM 2013 Perth Nov 3-7 2013 99
MONTE CARO SIMULATIONS OF SMALL FIELD OUTPUT FACTORS IN SOLID PHANTOMS S.T. Smith, P.H. Charles, S.B. Crowe, A. Asena, J.V. Trapp
School of Chemistry, Physics and Mechanical Engineering, Queensland University of Technology.
INTRODUCTION: Total scatter factor (or output factor) in megavoltage photon dosimetry is a measure of relative dose relating a certain field size to a reference field size. The use of solid phantoms has been well established for output factor measurements, however to date these phantoms have not been tested with small fields. In this work, we evaluate the water equivalency of a number of solid phantoms for small field output factor measurements using the EGSnrc Monte Carlo code.
METHODS: The following small square field sizes were simulated using BEAMnrc: 5 mm, 6 mm, 7 mm, 8 mm, 10 mm and 30 mm. Each simulated phantom geometry was created in DOSXYZnrc and consisted of a silicon diode (of length and width 1.5mm and depth 0.5mm) submersed in the phantom at a depth of 5 g/cm2. The source-to-detector distance was 100 cm for all simulations. The dose was scored in a single voxel at the location of the diode. Interaction probabilities and radiation transport parameters for each material were created using custom PEGS4 files.
RESULTS: A comparison of the resultant output factors in the solid phantoms, compared to the same factors in a water phantom are shown in Figure 1. The statistical uncertainty in each point was less than or equal to 0.4%.
Figure 1: Small field output factor differences between varying solid phantoms and water. The density of
each phantom is included in g cm-3.
The results in Figure 1 show that the density of the phantoms affected the output factor results, with higher density materials (such as PMMA) resulting in higher output factors. Additionally, it was also calculated that scaling the depth for equivalent path length had negligible effect on the output factor results at these field sizes.
DISCUSSION & CONCLUSIONS: Electron stopping power and photon mass energy absorption change minimally with small field size [1]. Also, it can be seen from figure 1 that the difference from water decreases with increasing field size. Therefore, the most likely cause for the observed discrepancies in output factors is differing electron disequilibrium as a function of phantom density. When measuring small field output factors in a solid phantom, it is important that the density is very close to that of water.
REFERENCES: 1. Czarnecki et al (2013). Phys Med Biol 58(8): 2431-2444.
ACKNOWLEDGEMENTS: This study was supported by the Australian Research Council, the Wesley Research Institute, Premion and the Queensland University of Technology (QUT), through linkage grant number LP110100401. The authors would like to acknowledge QUT’s High Performance Computing Services, which were used to run all simulations.
EPSM-1124 Tue 5th Nov 14:30 Golden Ballroom South Radiotherapy
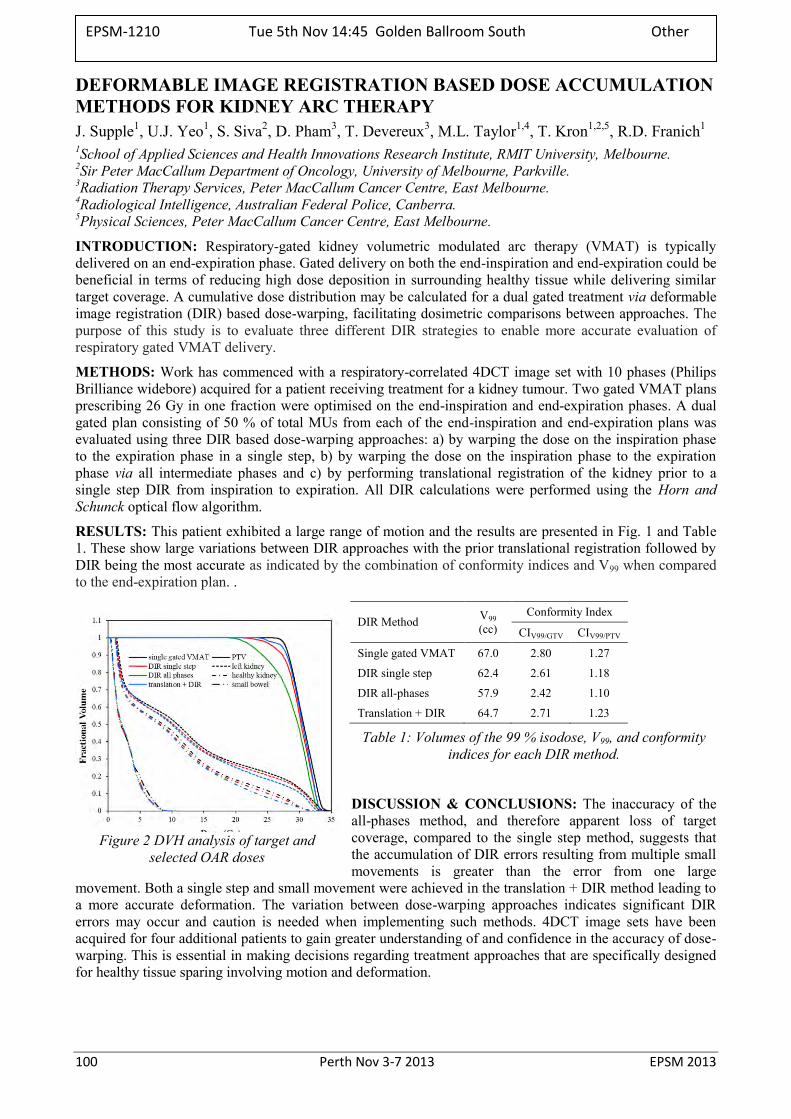
100 Perth Nov 3-7 2013 EPSM 2013
DEFORMABLE IMAGE REGISTRATION BASED DOSE ACCUMULATION METHODS FOR KIDNEY ARC THERAPY J. Supple1, U.J. Yeo1, S. Siva2, D. Pham3, T. Devereux3, M.L. Taylor1,4, T. Kron1,2,5, R.D. Franich1 1School of Applied Sciences and Health Innovations Research Institute, RMIT University, Melbourne. 2Sir Peter MacCallum Department of Oncology, University of Melbourne, Parkville. 3Radiation Therapy Services, Peter MacCallum Cancer Centre, East Melbourne. 4Radiological Intelligence, Australian Federal Police, Canberra. 5Physical Sciences, Peter MacCallum Cancer Centre, East Melbourne.
INTRODUCTION: Respiratory-gated kidney volumetric modulated arc therapy (VMAT) is typically delivered on an end-expiration phase. Gated delivery on both the end-inspiration and end-expiration could be beneficial in terms of reducing high dose deposition in surrounding healthy tissue while delivering similar target coverage. A cumulative dose distribution may be calculated for a dual gated treatment via deformable image registration (DIR) based dose-warping, facilitating dosimetric comparisons between approaches. The purpose of this study is to evaluate three different DIR strategies to enable more accurate evaluation of respiratory gated VMAT delivery.
METHODS: Work has commenced with a respiratory-correlated 4DCT image set with 10 phases (Philips Brilliance widebore) acquired for a patient receiving treatment for a kidney tumour. Two gated VMAT plans prescribing 26 Gy in one fraction were optimised on the end-inspiration and end-expiration phases. A dual gated plan consisting of 50 % of total MUs from each of the end-inspiration and end-expiration plans was evaluated using three DIR based dose-warping approaches: a) by warping the dose on the inspiration phase to the expiration phase in a single step, b) by warping the dose on the inspiration phase to the expiration phase via all intermediate phases and c) by performing translational registration of the kidney prior to a single step DIR from inspiration to expiration. All DIR calculations were performed using the Horn and Schunck optical flow algorithm.
RESULTS: This patient exhibited a large range of motion and the results are presented in Fig. 1 and Table 1. These show large variations between DIR approaches with the prior translational registration followed by DIR being the most accurate as indicated by the combination of conformity indices and V99 when compared to the end-expiration plan. .
DIR Method
V99 (cc)
Conformity Index
CIV99/GTV CIV99/PTV
Single gated VMAT 67.0 2.80 1.27
DIR single step 62.4 2.61 1.18
DIR all-phases 57.9 2.42 1.10
Translation + DIR 64.7 2.71 1.23
Table 1: Volumes of the 99 % isodose, V99, and conformity indices for each DIR method.
DISCUSSION & CONCLUSIONS: The inaccuracy of the all-phases method, and therefore apparent loss of target coverage, compared to the single step method, suggests that the accumulation of DIR errors resulting from multiple small movements is greater than the error from one large
movement. Both a single step and small movement were achieved in the translation + DIR method leading to a more accurate deformation. The variation between dose-warping approaches indicates significant DIR errors may occur and caution is needed when implementing such methods. 4DCT image sets have been acquired for four additional patients to gain greater understanding of and confidence in the accuracy of dose-warping. This is essential in making decisions regarding treatment approaches that are specifically designed for healthy tissue sparing involving motion and deformation.
Figure 2 DVH analysis of target and selected OAR doses
EPSM-1210 Tue 5th Nov 14:45 Golden Ballroom South Other
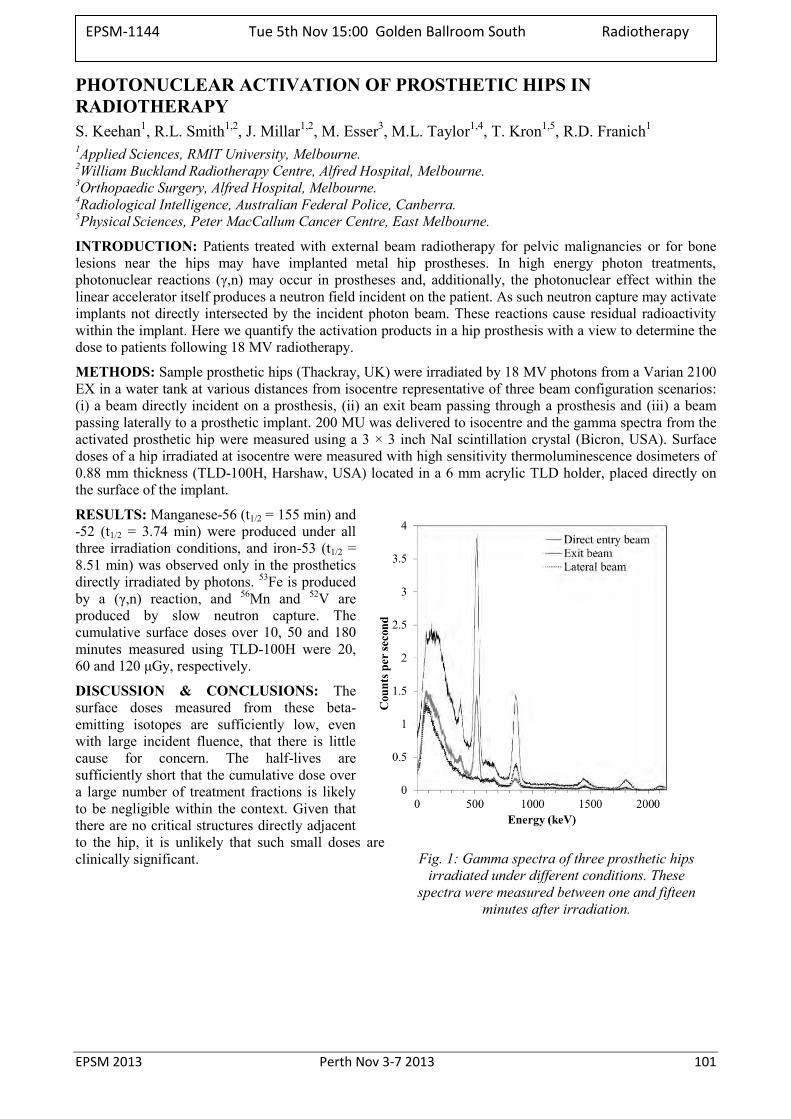
EPSM 2013 Perth Nov 3-7 2013 101
PHOTONUCLEAR ACTIVATION OF PROSTHETIC HIPS IN RADIOTHERAPY S. Keehan1, R.L. Smith1,2, J. Millar1,2, M. Esser3, M.L. Taylor1,4, T. Kron1,5, R.D. Franich1 1Applied Sciences, RMIT University, Melbourne. 2William Buckland Radiotherapy Centre, Alfred Hospital, Melbourne. 3Orthopaedic Surgery, Alfred Hospital, Melbourne. 4Radiological Intelligence, Australian Federal Police, Canberra. 5Physical Sciences, Peter MacCallum Cancer Centre, East Melbourne.
INTRODUCTION: Patients treated with external beam radiotherapy for pelvic malignancies or for bone lesions near the hips may have implanted metal hip prostheses. In high energy photon treatments, photonuclear reactions (γ,n) may occur in prostheses and, additionally, the photonuclear effect within the linear accelerator itself produces a neutron field incident on the patient. As such neutron capture may activate implants not directly intersected by the incident photon beam. These reactions cause residual radioactivity within the implant. Here we quantify the activation products in a hip prosthesis with a view to determine the dose to patients following 18 MV radiotherapy.
METHODS: Sample prosthetic hips (Thackray, UK) were irradiated by 18 MV photons from a Varian 2100 EX in a water tank at various distances from isocentre representative of three beam configuration scenarios: (i) a beam directly incident on a prosthesis, (ii) an exit beam passing through a prosthesis and (iii) a beam passing laterally to a prosthetic implant. 200 MU was delivered to isocentre and the gamma spectra from the activated prosthetic hip were measured using a 3 × 3 inch NaI scintillation crystal (Bicron, USA). Surface doses of a hip irradiated at isocentre were measured with high sensitivity thermoluminescence dosimeters of 0.88 mm thickness (TLD-100H, Harshaw, USA) located in a 6 mm acrylic TLD holder, placed directly on the surface of the implant.
RESULTS: Manganese-56 (t1/2 = 155 min) and -52 (t1/2 = 3.74 min) were produced under all three irradiation conditions, and iron-53 (t1/2 = 8.51 min) was observed only in the prosthetics directly irradiated by photons. 53Fe is produced by a (γ,n) reaction, and 56Mn and 52V are produced by slow neutron capture. The cumulative surface doses over 10, 50 and 180 minutes measured using TLD-100H were 20, 60 and 120 μGy, respectively.
DISCUSSION & CONCLUSIONS: The surface doses measured from these beta-emitting isotopes are sufficiently low, even with large incident fluence, that there is little cause for concern. The half-lives are sufficiently short that the cumulative dose over a large number of treatment fractions is likely to be negligible within the context. Given that there are no critical structures directly adjacent to the hip, it is unlikely that such small doses are clinically significant. Fig. 1: Gamma spectra of three prosthetic hips
irradiated under different conditions. These spectra were measured between one and fifteen
minutes after irradiation.
EPSM-1144 Tue 5th Nov 15:00 Golden Ballroom South Radiotherapy
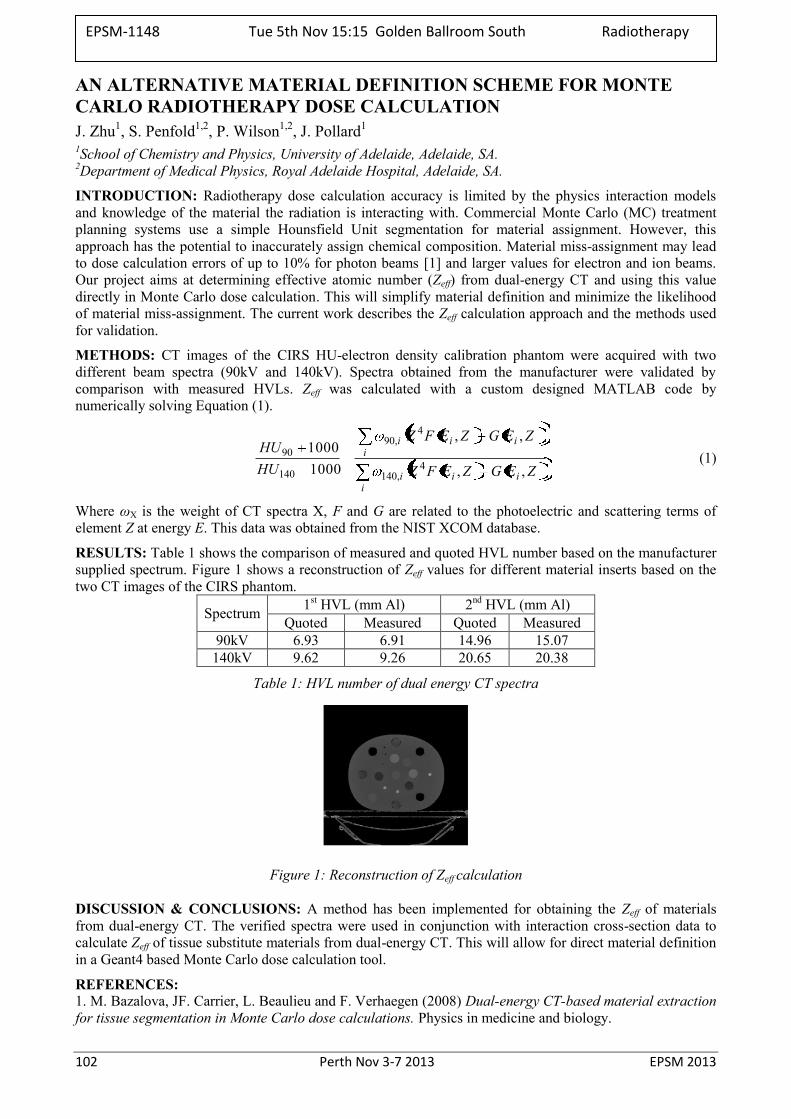
102 Perth Nov 3-7 2013 EPSM 2013
AN ALTERNATIVE MATERIAL DEFINITION SCHEME FOR MONTE CARLO RADIOTHERAPY DOSE CALCULATION J. Zhu1, S. Penfold1,2, P. Wilson1,2, J. Pollard1
1School of Chemistry and Physics, University of Adelaide, Adelaide, SA. 2Department of Medical Physics, Royal Adelaide Hospital, Adelaide, SA.
INTRODUCTION: Radiotherapy dose calculation accuracy is limited by the physics interaction models and knowledge of the material the radiation is interacting with. Commercial Monte Carlo (MC) treatment planning systems use a simple Hounsfield Unit segmentation for material assignment. However, this approach has the potential to inaccurately assign chemical composition. Material miss-assignment may lead to dose calculation errors of up to 10% for photon beams [1] and larger values for electron and ion beams. Our project aims at determining effective atomic number (Zeff) from dual-energy CT and using this value directly in Monte Carlo dose calculation. This will simplify material definition and minimize the likelihood of material miss-assignment. The current work describes the Zeff calculation approach and the methods used for validation.
METHODS: CT images of the CIRS HU-electron density calibration phantom were acquired with two different beam spectra (90kV and 140kV). Spectra obtained from the manufacturer were validated by comparison with measured HVLs. Zeff was calculated with a custom designed MATLAB code by numerically solving Equation (1).
iiii
iiii
ZEGZEFZ
ZEGZEFZ
HUHU
,,
,,
10001000
4,140
4,90
140
90 (1)
Where ωX is the weight of CT spectra X, F and G are related to the photoelectric and scattering terms of element Z at energy E. This data was obtained from the NIST XCOM database.
RESULTS: Table 1 shows the comparison of measured and quoted HVL number based on the manufacturer supplied spectrum. Figure 1 shows a reconstruction of Zeff values for different material inserts based on the two CT images of the CIRS phantom.
Spectrum 1st HVL (mm Al) 2nd HVL (mm Al) Quoted Measured Quoted Measured
90kV 6.93 6.91 14.96 15.07 140kV 9.62 9.26 20.65 20.38
Table 1: HVL number of dual energy CT spectra
Figure 1: Reconstruction of Zeff calculation
DISCUSSION & CONCLUSIONS: A method has been implemented for obtaining the Zeff of materials from dual-energy CT. The verified spectra were used in conjunction with interaction cross-section data to calculate Zeff of tissue substitute materials from dual-energy CT. This will allow for direct material definition in a Geant4 based Monte Carlo dose calculation tool.
REFERENCES: 1. M. Bazalova, JF. Carrier, L. Beaulieu and F. Verhaegen (2008) Dual-energy CT-based material extraction for tissue segmentation in Monte Carlo dose calculations. Physics in medicine and biology.
EPSM-1148 Tue 5th Nov 15:15 Golden Ballroom South Radiotherapy
EPSM 2013 Perth Nov 3-7 2013 103
MOLECULAR IMAGING - OPPORTUNITIES AND OBSTACLES R.J. Francis1,2 1 School of Medicine and Pharmacology, University of Western Australia, Perth, Western Australia 2 Department of Nuclear Medicine, Sir Charles Gairdner Hospital, Perth, Western Australia.
Molecular imaging with novel PET tracers is in a phase of unprecedented growth and innovation. Promising new probes have been developed to image biological processes (eg: metabolism, hypoxia and proliferation) and cellular or extracellular targets (HER 2, SSR, VEGF). Molecular imaging has the potential to characterise disease biology, identify targets for therapy and to monitor therapeutic interventions. Research is rapidly growing in both the clinical and preclinical settings.
There is enormous opportunity for PET in research; however there are challenges in translating PET with novel tracers into clinical care. The challenge going forward will be to gain a greater understanding of how PET imaging with novel tracers can contribute to personalised patient care and better patient outcomes. Robust clinical trials and harmonised imaging techniques are essential to this process. Despite these obstacles, molecular imaging using a range of PET tracers has a promising future.
EPSM-1246 Tue 5th Nov 13:00 Golden Ballroom Centre Imaging
104 Perth Nov 3-7 2013 EPSM 2013
BETA AMYLOID IMAGING FOR THE EARLY DIAGNOSIS OF ALZHEIMER’S DISEASE S.R. Rainey-Smith1,2, Kevin Taddei1,2, David Ames3,4, S Lance Macaulay5, Colin L Masters6, Christopher C Rowe7, Ralph N Martins1,2 1 School of Medical Sciences, Edith Cowan University, Joondalup, Western Australia. 2 Sir James McCusker Alzheimer's Disease Research Unit, Nedlands, Western Australia. 3 Department of Psychiatry, University of Melbourne, Melbourne, Victoria. 4 National Ageing Research Institute, Parkville, Victoria. 5 CSIRO Preventative Health Flagship, Parkville, Victoria. 6 Florey Institute for Neurosciences and Mental Health, University of Melbourne, Victoria. 7 Austin Health, Department of Nuclear Medicine and Centre for PET, Heidelberg, Victoria.
INTRODUCTION: Cerebral amyloid deposition is a pathological hallmark of Alzheimer’s disease (AD). Previously, observation of this hallmark has only been possible following post-mortem examination of the brain. Advancements in neuroimaging however, have enabled visualisation of amyloid in the brain of living individuals. This has facilitated understanding of the rate at which brain amyloid accumulates and how this correlates with cognitive measures and other blood-based biological markers.
METHODS: Participants from the Australian Imaging, Biomarkers and Lifestyle (AIBL) study of ageing comprising of healthy controls, patients with mild cognitive impairment (MCI), and patients with AD were assessed at enrolment and every subsequent 18 months. At each visit, participants underwent neuropsychological examination, Magnetic Resonance Imaging (MRI), and an amyloid ligand positron emission tomography (PET) scan. Amyloid burden was expressed as amyloid ligand standardised uptake value ratio (SUVR) with the cerebellar cortex as reference region. An SUVR of 1·5 was used to discriminate high from low amyloid burdens. The slope of the regression plots over 3-5 years was used to estimate rates of change for amyloid deposition, MRI volumetrics, and cognition.
RESULTS: Longitudinal data from AIBL [1] has established that amyloid accumulation precedes the appearance of brain atrophy (detected by MRI) and symptoms of Alzheimer’s disease by more than a decade and that this accumulation can be detected and tracked with amyloid PET imaging. Furthermore, AIBL has shown that 25% of cognitively normal elderly individuals with a positive amyloid PET scan decline and meet criteria for MCI or AD within 3 years. In those with subtle episodic memory impairment, but not meeting criteria for MCI, this rate increased to 50%. AIBL has also shown that individuals with MCI and a positive amyloid scan have a 70-80% chance of dementia within 3 years.
DISCUSSION & CONCLUSIONS: There is now little doubt that individuals with an amyloid positive PET scan are on a trajectory towards development of dementia due to AD and this has led to the formation of the new diagnostic categories of preclinical AD [2] and prodromal AD [3,4] to aid the development of early intervention and prevention of Alzheimer’s dementia. Strategies to reduce PET-determined brain amyloid deposition and/or increase amyloid clearance are under development.
REFERENCES: [1] Villemagne et al., Aβ deposition, neurodegeneration and cognitive decline in sporadic Alzheimer’s disease: a prospective cohort study. Lancet Neurology 2013 doi.org/10.1016/S1474-4422(13)70044-9
[2] Sperling et al., (2011) Toward defining the preclinical stages of Alzheimer's disease: Recommendations from the National Institute on Aging-Alzheimer's Association workgroups on diagnostic guidelines for Alzheimer's disease. Alzheimers Dement 7:280-292. [3] Dubois et al., (2010) Revising the definition of Alzheimer's disease: a new lexicon. Lancet Neurol 9:1118-1127. [4] Dubois et al., (2007) Research criteria for the diagnosis of Alzheimer's disease: revising the NINCDS-ADRDA criteria. Lancet Neurol 6:734-746.
ACKNOWLEDGEMENTS: AIBL is a large collaborative study and a complete list of contributors can be found at www.aibl.csiro.au/. AIBL is part funded by a grant from the Science and Industry Endowment Fund. We thank all who took part in the study.
EPSM-1244 Tue 5th Nov 13:30 Golden Ballroom Centre Alzheimers
EPSM 2013 Perth Nov 3-7 2013 105
ACCELERATOR PRODUCTION OF RADIOISOTOPES – CHALLENGES AND OPPORTUNITIES S. Smith Collider Accelerator Department, Brookhaven National Laboratory, Upton NY, USA
Today, accelerator technology has provided instruments capable of producing a range of particle types and energies at increased beam currents and overall reliability. Coupled with advances in the design of target systems and separation processes makes for a very exciting field to research the production of radioisotopes. An overview of the current use of accelerators for the production of radioisotopes for medical, industrial and environmental applications will be presented. Smith will outline her experience in the use of moderate and high-energy protons for optimizing the production of 67Cu for radiotherapeutic applications.
EPSM-1260 Tue 5th Nov 14:00 Golden Ballroom Centre PreClinical Imaging
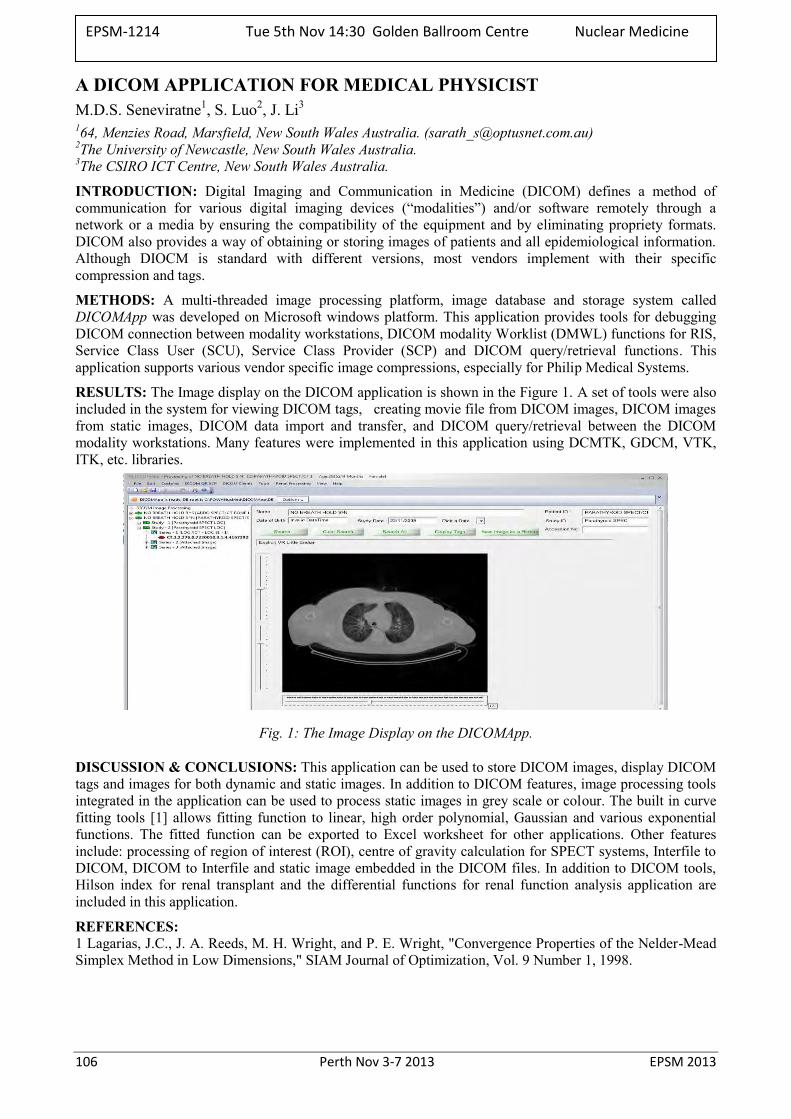
106 Perth Nov 3-7 2013 EPSM 2013
A DICOM APPLICATION FOR MEDICAL PHYSICIST M.D.S. Seneviratne1, S. Luo2, J. Li3
164, Menzies Road, Marsfield, New South Wales Australia. ([email protected]) 2The University of Newcastle, New South Wales Australia. 3The CSIRO ICT Centre, New South Wales Australia.
INTRODUCTION: Digital Imaging and Communication in Medicine (DICOM) defines a method of communication for various digital imaging devices (“modalities”) and/or software remotely through a network or a media by ensuring the compatibility of the equipment and by eliminating propriety formats. DICOM also provides a way of obtaining or storing images of patients and all epidemiological information. Although DIOCM is standard with different versions, most vendors implement with their specific compression and tags.
METHODS: A multi-threaded image processing platform, image database and storage system called DICOMApp was developed on Microsoft windows platform. This application provides tools for debugging DICOM connection between modality workstations, DICOM modality Worklist (DMWL) functions for RIS, Service Class User (SCU), Service Class Provider (SCP) and DICOM query/retrieval functions. This application supports various vendor specific image compressions, especially for Philip Medical Systems.
RESULTS: The Image display on the DICOM application is shown in the Figure 1. A set of tools were also included in the system for viewing DICOM tags, creating movie file from DICOM images, DICOM images from static images, DICOM data import and transfer, and DICOM query/retrieval between the DICOM modality workstations. Many features were implemented in this application using DCMTK, GDCM, VTK, ITK, etc. libraries.
Fig. 1: The Image Display on the DICOMApp.
DISCUSSION & CONCLUSIONS: This application can be used to store DICOM images, display DICOM tags and images for both dynamic and static images. In addition to DICOM features, image processing tools integrated in the application can be used to process static images in grey scale or colour. The built in curve fitting tools [1] allows fitting function to linear, high order polynomial, Gaussian and various exponential functions. The fitted function can be exported to Excel worksheet for other applications. Other features include: processing of region of interest (ROI), centre of gravity calculation for SPECT systems, Interfile to DICOM, DICOM to Interfile and static image embedded in the DICOM files. In addition to DICOM tools, Hilson index for renal transplant and the differential functions for renal function analysis application are included in this application.
REFERENCES: 1 Lagarias, J.C., J. A. Reeds, M. H. Wright, and P. E. Wright, "Convergence Properties of the Nelder-Mead Simplex Method in Low Dimensions," SIAM Journal of Optimization, Vol. 9 Number 1, 1998.
EPSM-1214 Tue 5th Nov 14:30 Golden Ballroom Centre Nuclear Medicine
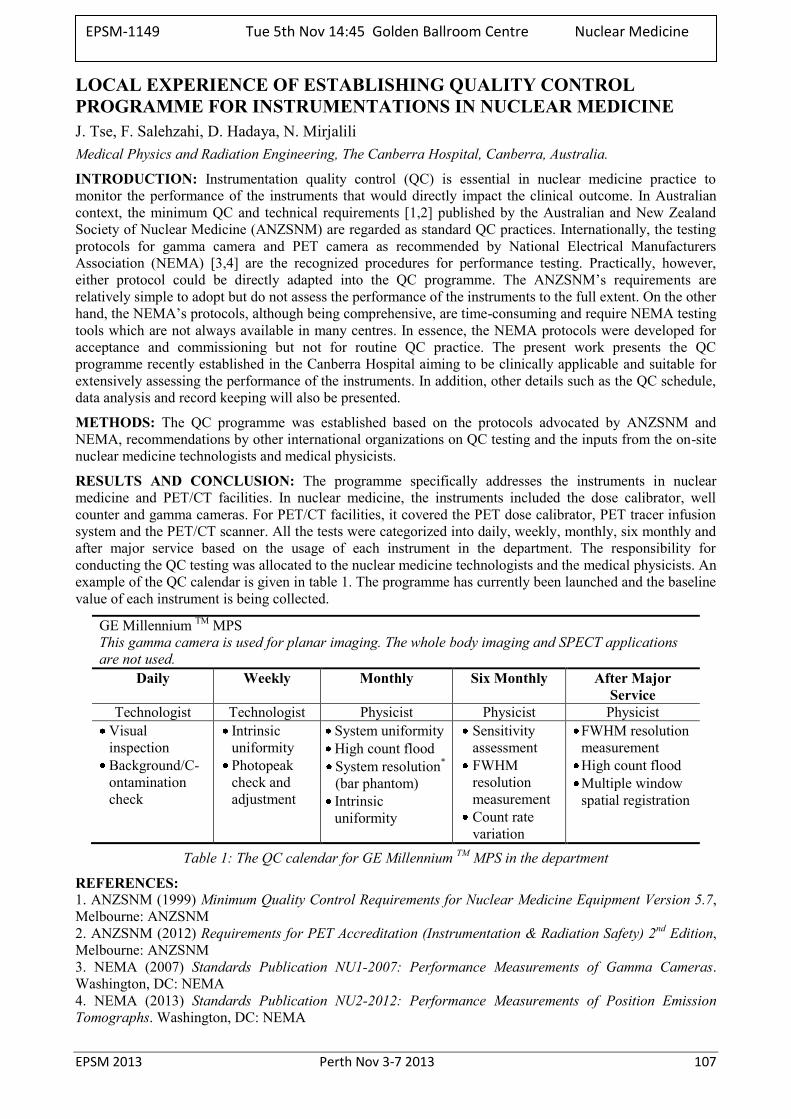
EPSM 2013 Perth Nov 3-7 2013 107
LOCAL EXPERIENCE OF ESTABLISHING QUALITY CONTROL PROGRAMME FOR INSTRUMENTATIONS IN NUCLEAR MEDICINE J. Tse, F. Salehzahi, D. Hadaya, N. Mirjalili Medical Physics and Radiation Engineering, The Canberra Hospital, Canberra, Australia.
INTRODUCTION: Instrumentation quality control (QC) is essential in nuclear medicine practice to monitor the performance of the instruments that would directly impact the clinical outcome. In Australian context, the minimum QC and technical requirements [1,2] published by the Australian and New Zealand Society of Nuclear Medicine (ANZSNM) are regarded as standard QC practices. Internationally, the testing protocols for gamma camera and PET camera as recommended by National Electrical Manufacturers Association (NEMA) [3,4] are the recognized procedures for performance testing. Practically, however, either protocol could be directly adapted into the QC programme. The ANZSNM’s requirements are relatively simple to adopt but do not assess the performance of the instruments to the full extent. On the other hand, the NEMA’s protocols, although being comprehensive, are time-consuming and require NEMA testing tools which are not always available in many centres. In essence, the NEMA protocols were developed for acceptance and commissioning but not for routine QC practice. The present work presents the QC programme recently established in the Canberra Hospital aiming to be clinically applicable and suitable for extensively assessing the performance of the instruments. In addition, other details such as the QC schedule, data analysis and record keeping will also be presented.
METHODS: The QC programme was established based on the protocols advocated by ANZSNM and NEMA, recommendations by other international organizations on QC testing and the inputs from the on-site nuclear medicine technologists and medical physicists.
RESULTS AND CONCLUSION: The programme specifically addresses the instruments in nuclear medicine and PET/CT facilities. In nuclear medicine, the instruments included the dose calibrator, well counter and gamma cameras. For PET/CT facilities, it covered the PET dose calibrator, PET tracer infusion system and the PET/CT scanner. All the tests were categorized into daily, weekly, monthly, six monthly and after major service based on the usage of each instrument in the department. The responsibility for conducting the QC testing was allocated to the nuclear medicine technologists and the medical physicists. An example of the QC calendar is given in table 1. The programme has currently been launched and the baseline value of each instrument is being collected.
GE Millennium TM MPS This gamma camera is used for planar imaging. The whole body imaging and SPECT applications are not used.
Daily Weekly Monthly Six Monthly After Major Service
Technologist Technologist Physicist Physicist Physicist Visual inspection Background/C-ontamination check
Intrinsic uniformity Photopeak check and adjustment
System uniformity High count flood System resolution* (bar phantom) Intrinsic uniformity
Sensitivity assessment FWHM resolution measurement Count rate variation
FWHM resolution measurement High count flood Multiple window spatial registration
Table 1: The QC calendar for GE Millennium TM MPS in the department
REFERENCES: 1. ANZSNM (1999) Minimum Quality Control Requirements for Nuclear Medicine Equipment Version 5.7, Melbourne: ANZSNM 2. ANZSNM (2012) Requirements for PET Accreditation (Instrumentation & Radiation Safety) 2nd Edition, Melbourne: ANZSNM 3. NEMA (2007) Standards Publication NU1-2007: Performance Measurements of Gamma Cameras. Washington, DC: NEMA 4. NEMA (2013) Standards Publication NU2-2012: Performance Measurements of Position Emission Tomographs. Washington, DC: NEMA
EPSM-1149 Tue 5th Nov 14:45 Golden Ballroom Centre Nuclear Medicine
108 Perth Nov 3-7 2013 EPSM 2013
IMAGING YTTRIUM-90 BREMSSTRAHLUNG WITH SPECT A. Slattery, A. Young Diagnostic Imaging Services, St. Vincent’s Hospital, Sydney.
INTRODUCTION: Yttrium-90 is commonly used in targeted radionuclide therapy (TRT) where its characteristic half-life, beta range and lack of concomitant gamma emissions are ideally suited for therapeutic applications. One increasingly prevalent application is the use of yttrium-90 microsphere radioembolization in the treatment of unresectable liver malignancies. Following radioembolization, single-photon emission computed tomography (SPECT) is used to visualise the distribution of the microspheres and determine any instances of extra-hepatic uptake. Yttrium-90 is a pure β- emitter, with SPECT imaging being achieved by acquiring the bremsstrahlung radiation emitted from the patient. The quality of images obtained from SPECT is typically poor and given the complexity of factors associated with imaging bremsstrahlung radiation including the broad continuous distribution of emitted photon energies, lack of discernible peak energy and geometry-dependent considerations, acquisition parameters vary substantially between individual sites, vendors and imaging systems. The body of work being presented here details a series of experiments which were conducted to determine the optimal acquisition settings for acquiring yttrium-90 bremsstrahlung using the Discovery 670NM imaging system (GE Healthcare).
METHODS: A series of experiments were conducted to measure different image quality metrics related to the contrast, sensitivity, uniformity and spatial resolution exhibited by yttrium-90 sources under a variety of different energy windows, energy peaks and collimator configurations. The yttrium-90 sources used in these experiments were prepared by dissolving residual SIR-Spheres Microspheres (SIRTEX) doses with 10M solutions of hydrochloric acid over a period of several hours, after which 10µm PVDF membrane syringe-driven filter units were employed to ensure undissolved microspheres were not introduced into the experimental setups. The resulting solutions were then tested in a variety of lines, water phantoms and refillable flood sheets to gauge the image quality of the Discovery 670NM imaging system. After a series of tomographic and static images were acquired, the images were subsequently analysed using the MATLAB (MathWorks) programming environment with the sensitivity (CPMMBq-1), FWHM spatial resolution (mm), uniformity (%) and contrast (%) calculated using automated scripts for each configuration.
RESULTS: 1.The medium-energy collimators were found to be superior to high-energy collimators for all the quality metrics tested. While the low-energy collimators demonstrated higher spatial resolution and sensitivity compared with the medium-energy collimators, they suffered from poor contrast and uniformity responses primarily due to pronounced septal penetration. 2. The 90keV peak conferred the highest sensitivity whereas the 75keV peak conferred highest resolution. Uniformity and contrast were similar for both peak energies. 3. Sensitivity and contrast improved with the use of increasingly wider energy windows. For most configurations, the highest resolution occurred with energy windows between 30% and 40%. Uniformity did not differ significantly for all energy windows.
DISCUSSION & CONCLUSIONS: Medium-energy collimators may provide optimal image quality for acquiring yttrium-90 bremsstrahlung with the Discovery 670NM imaging system in patients. This is currently being investigated.
EPSM-1206 Tue 5th Nov 15:00 Golden Ballroom Centre Nuclear Medicine
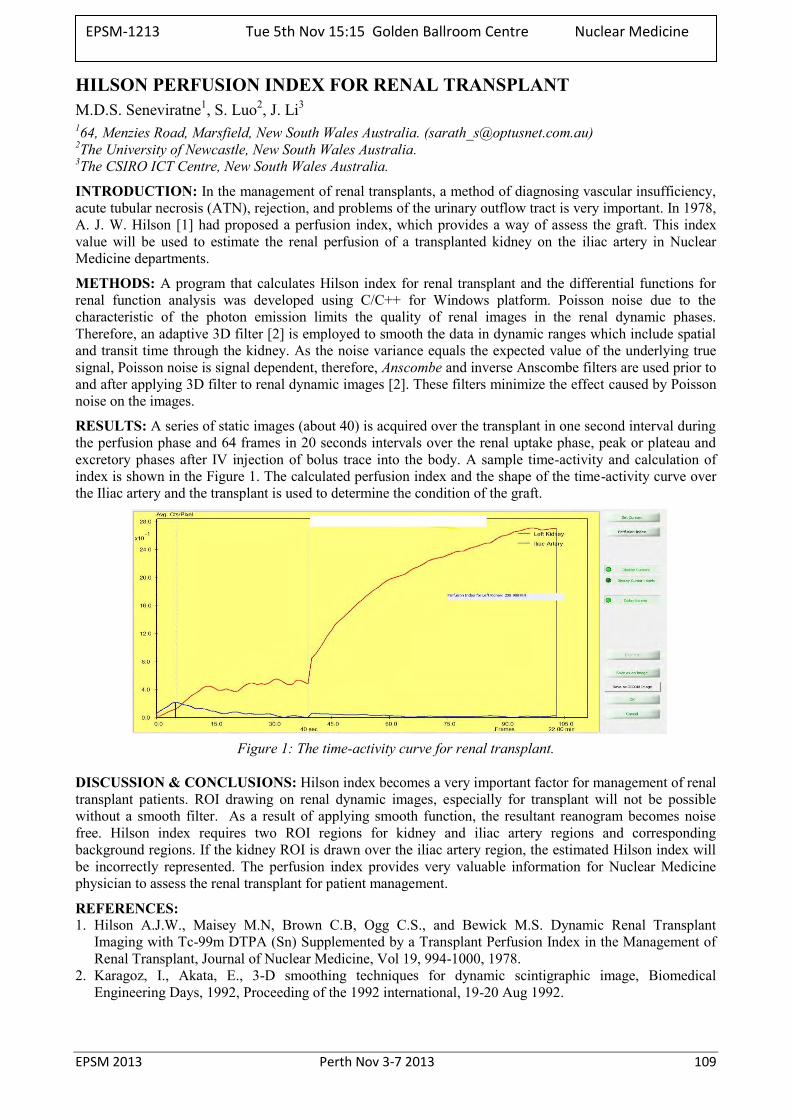
EPSM 2013 Perth Nov 3-7 2013 109
HILSON PERFUSION INDEX FOR RENAL TRANSPLANT M.D.S. Seneviratne1, S. Luo2, J. Li3
164, Menzies Road, Marsfield, New South Wales Australia. ([email protected]) 2The University of Newcastle, New South Wales Australia. 3The CSIRO ICT Centre, New South Wales Australia.
INTRODUCTION: In the management of renal transplants, a method of diagnosing vascular insufficiency, acute tubular necrosis (ATN), rejection, and problems of the urinary outflow tract is very important. In 1978, A. J. W. Hilson [1] had proposed a perfusion index, which provides a way of assess the graft. This index value will be used to estimate the renal perfusion of a transplanted kidney on the iliac artery in Nuclear Medicine departments.
METHODS: A program that calculates Hilson index for renal transplant and the differential functions for renal function analysis was developed using C/C++ for Windows platform. Poisson noise due to the characteristic of the photon emission limits the quality of renal images in the renal dynamic phases. Therefore, an adaptive 3D filter [2] is employed to smooth the data in dynamic ranges which include spatial and transit time through the kidney. As the noise variance equals the expected value of the underlying true signal, Poisson noise is signal dependent, therefore, Anscombe and inverse Anscombe filters are used prior to and after applying 3D filter to renal dynamic images [2]. These filters minimize the effect caused by Poisson noise on the images.
RESULTS: A series of static images (about 40) is acquired over the transplant in one second interval during the perfusion phase and 64 frames in 20 seconds intervals over the renal uptake phase, peak or plateau and excretory phases after IV injection of bolus trace into the body. A sample time-activity and calculation of index is shown in the Figure 1. The calculated perfusion index and the shape of the time-activity curve over the Iliac artery and the transplant is used to determine the condition of the graft.
Figure 1: The time-activity curve for renal transplant.
DISCUSSION & CONCLUSIONS: Hilson index becomes a very important factor for management of renal transplant patients. ROI drawing on renal dynamic images, especially for transplant will not be possible without a smooth filter. As a result of applying smooth function, the resultant reanogram becomes noise free. Hilson index requires two ROI regions for kidney and iliac artery regions and corresponding background regions. If the kidney ROI is drawn over the iliac artery region, the estimated Hilson index will be incorrectly represented. The perfusion index provides very valuable information for Nuclear Medicine physician to assess the renal transplant for patient management.
REFERENCES: 1. Hilson A.J.W., Maisey M.N, Brown C.B, Ogg C.S., and Bewick M.S. Dynamic Renal Transplant
Imaging with Tc-99m DTPA (Sn) Supplemented by a Transplant Perfusion Index in the Management of Renal Transplant, Journal of Nuclear Medicine, Vol 19, 994-1000, 1978.
2. Karagoz, I., Akata, E., 3-D smoothing techniques for dynamic scintigraphic image, Biomedical Engineering Days, 1992, Proceeding of the 1992 international, 19-20 Aug 1992.
EPSM-1213 Tue 5th Nov 15:15 Golden Ballroom Centre Nuclear Medicine
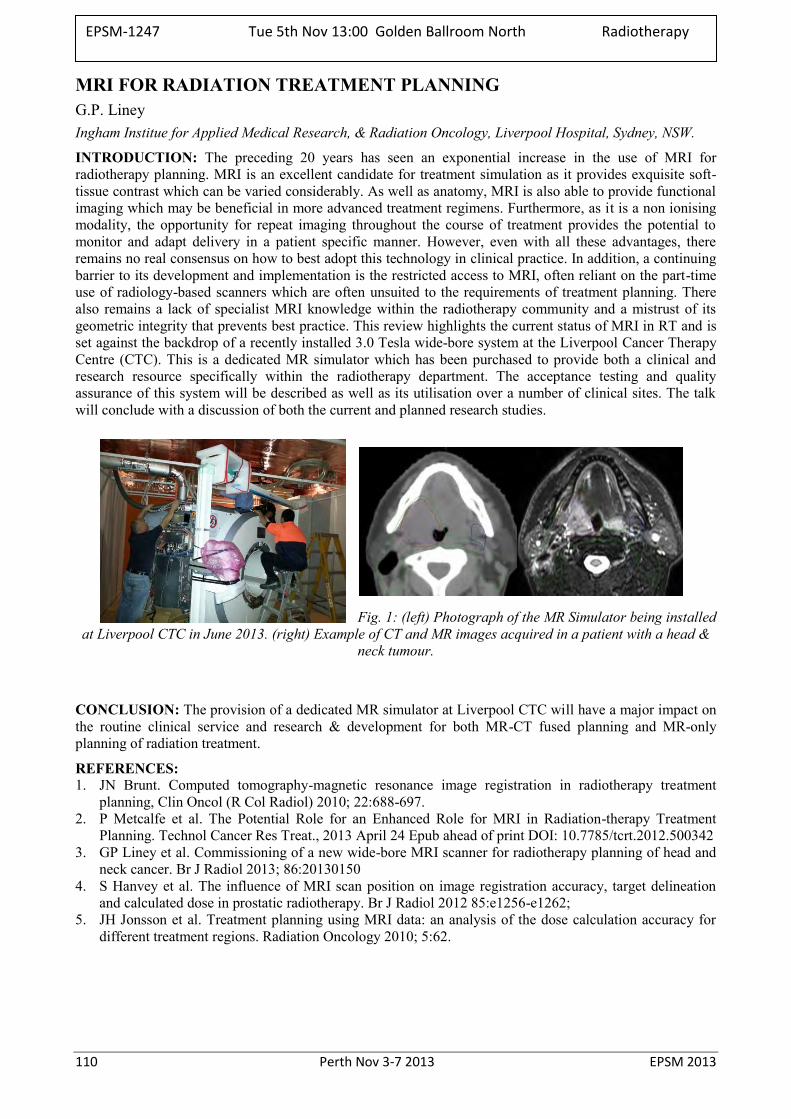
110 Perth Nov 3-7 2013 EPSM 2013
MRI FOR RADIATION TREATMENT PLANNING G.P. Liney Ingham Institue for Applied Medical Research, & Radiation Oncology, Liverpool Hospital, Sydney, NSW.
INTRODUCTION: The preceding 20 years has seen an exponential increase in the use of MRI for radiotherapy planning. MRI is an excellent candidate for treatment simulation as it provides exquisite soft-tissue contrast which can be varied considerably. As well as anatomy, MRI is also able to provide functional imaging which may be beneficial in more advanced treatment regimens. Furthermore, as it is a non ionising modality, the opportunity for repeat imaging throughout the course of treatment provides the potential to monitor and adapt delivery in a patient specific manner. However, even with all these advantages, there remains no real consensus on how to best adopt this technology in clinical practice. In addition, a continuing barrier to its development and implementation is the restricted access to MRI, often reliant on the part-time use of radiology-based scanners which are often unsuited to the requirements of treatment planning. There also remains a lack of specialist MRI knowledge within the radiotherapy community and a mistrust of its geometric integrity that prevents best practice. This review highlights the current status of MRI in RT and is set against the backdrop of a recently installed 3.0 Tesla wide-bore system at the Liverpool Cancer Therapy Centre (CTC). This is a dedicated MR simulator which has been purchased to provide both a clinical and research resource specifically within the radiotherapy department. The acceptance testing and quality assurance of this system will be described as well as its utilisation over a number of clinical sites. The talk will conclude with a discussion of both the current and planned research studies.
Fig. 1: (left) Photograph of the MR Simulator being installed at Liverpool CTC in June 2013. (right) Example of CT and MR images acquired in a patient with a head &
neck tumour.
CONCLUSION: The provision of a dedicated MR simulator at Liverpool CTC will have a major impact on the routine clinical service and research & development for both MR-CT fused planning and MR-only planning of radiation treatment.
REFERENCES: 1. JN Brunt. Computed tomography-magnetic resonance image registration in radiotherapy treatment
planning, Clin Oncol (R Col Radiol) 2010; 22:688-697. 2. P Metcalfe et al. The Potential Role for an Enhanced Role for MRI in Radiation-therapy Treatment
Planning. Technol Cancer Res Treat., 2013 April 24 Epub ahead of print DOI: 10.7785/tcrt.2012.500342 3. GP Liney et al. Commissioning of a new wide-bore MRI scanner for radiotherapy planning of head and
neck cancer. Br J Radiol 2013; 86:20130150 4. S Hanvey et al. The influence of MRI scan position on image registration accuracy, target delineation
and calculated dose in prostatic radiotherapy. Br J Radiol 2012 85:e1256-e1262; 5. JH Jonsson et al. Treatment planning using MRI data: an analysis of the dose calculation accuracy for
different treatment regions. Radiation Oncology 2010; 5:62.
EPSM-1247 Tue 5th Nov 13:00 Golden Ballroom North Radiotherapy
EPSM 2013 Perth Nov 3-7 2013 111
VALIDATING A MONTE CARLO LINAC MODEL: HOW GOOD IS GOOD? T. Wright1,2, J. Lye1, D. Butler1, G. Ramanathan1, P. Harty1, C. Oliver1, A. Cole1, D. Webb1 1Australian Radiation Protection and Nuclear Safety Agency, Yallambie, Victoria, Australia. 2University of Adelaide, Adelaide, South Australia, Australia.
INTRODUCTION: ARPANSA’s direct primary calibration service for megavoltage energies will use a Monte Carlo calculated ratio to convert the absorbed dose measured in a graphite calorimeter to absorbed dose to water ([Dg/Dw]MC). The calibration service will be offered at the three beam energies most commonly used in Australia. The overall calibration uncertainty should be less than 1% (k=1), so the model must be extensively validated and the uncertainties accurately determined to ensure a tight calibration uncertainty can be achieved.
METHODS: The medical standards linac, an Elekta Synergy, is modelled using the EGSnrc user code BEAMnrc. The dose is scored in a phantom using DOSXYZnrc for dose distributions and the BLOCK and FLATFILT component modules of BEAMnrc for the calculation of the [Dg/Dw]MC conversion ratio. The model is validated by comparing to measured beam data. PDDs are corrected for depth-dependent recombination and compared for a 10x10 cm2 field in water and graphite phantoms. Profiles at multiple depths in a water phantom are compared for 10x10 cm2 and 30x30 cm2 fields.
A fast method is presented for determining the optimum electron energy in the model. The influence of the flattening filter density is examined. A theoretical investigation has been performed to assess the significance of a PDD mismatch on the dose calculated at a point in the phantom.
RESULTS: The model of the ARPANSA linac has been validated and [Dg/Dw]MC calculated for three beam energies. The conversion ratios [Dg/Dw]MC were found to be 0.9616, 0.9404 and 0.9252 for the 6 MV, 10 MV and 18 MV beams respectively. Depth-dependent recombination correction is shown to be important in validating the modelled PDDs against measurements. The requirement for PDDs in multiple phantom materials for model validation with high accuracy is demonstrated.
DISCUSSION & CONCLUSIONS: The conversion ratios have been calculated with overall direct calibration uncertainties in ND,w,Q of 0.5% (k=1) for 6 MV and 18 MV and 0.6% (k=1) for 10 MV beams.
ACKNOWLEDGEMENTS: Monte Carlo calculations were performed using the eResearch SA supercomputer.
EPSM-1069 Tue 5th Nov 13:30 Golden Ballroom North Radiotherapy
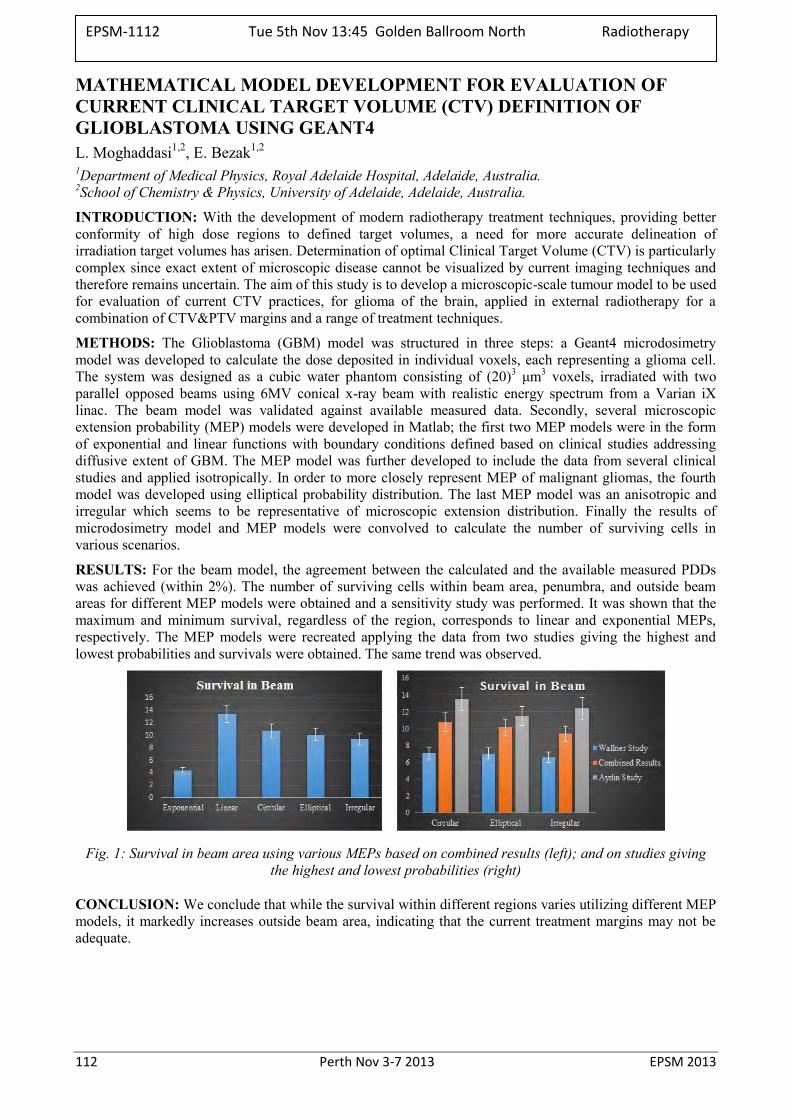
112 Perth Nov 3-7 2013 EPSM 2013
MATHEMATICAL MODEL DEVELOPMENT FOR EVALUATION OF CURRENT CLINICAL TARGET VOLUME (CTV) DEFINITION OF GLIOBLASTOMA USING GEANT4 L. Moghaddasi1,2, E. Bezak1,2
1Department of Medical Physics, Royal Adelaide Hospital, Adelaide, Australia. 2School of Chemistry & Physics, University of Adelaide, Adelaide, Australia.
INTRODUCTION: With the development of modern radiotherapy treatment techniques, providing better conformity of high dose regions to defined target volumes, a need for more accurate delineation of irradiation target volumes has arisen. Determination of optimal Clinical Target Volume (CTV) is particularly complex since exact extent of microscopic disease cannot be visualized by current imaging techniques and therefore remains uncertain. The aim of this study is to develop a microscopic-scale tumour model to be used for evaluation of current CTV practices, for glioma of the brain, applied in external radiotherapy for a combination of CTV&PTV margins and a range of treatment techniques.
METHODS: The Glioblastoma (GBM) model was structured in three steps: a Geant4 microdosimetry model was developed to calculate the dose deposited in individual voxels, each representing a glioma cell. The system was designed as a cubic water phantom consisting of (20)3 μm3 voxels, irradiated with two parallel opposed beams using 6MV conical x-ray beam with realistic energy spectrum from a Varian iX linac. The beam model was validated against available measured data. Secondly, several microscopic extension probability (MEP) models were developed in Matlab; the first two MEP models were in the form of exponential and linear functions with boundary conditions defined based on clinical studies addressing diffusive extent of GBM. The MEP model was further developed to include the data from several clinical studies and applied isotropically. In order to more closely represent MEP of malignant gliomas, the fourth model was developed using elliptical probability distribution. The last MEP model was an anisotropic and irregular which seems to be representative of microscopic extension distribution. Finally the results of microdosimetry model and MEP models were convolved to calculate the number of surviving cells in various scenarios.
RESULTS: For the beam model, the agreement between the calculated and the available measured PDDs was achieved (within 2%). The number of surviving cells within beam area, penumbra, and outside beam areas for different MEP models were obtained and a sensitivity study was performed. It was shown that the maximum and minimum survival, regardless of the region, corresponds to linear and exponential MEPs, respectively. The MEP models were recreated applying the data from two studies giving the highest and lowest probabilities and survivals were obtained. The same trend was observed.
Fig. 1: Survival in beam area using various MEPs based on combined results (left); and on studies giving the highest and lowest probabilities (right)
CONCLUSION: We conclude that while the survival within different regions varies utilizing different MEP models, it markedly increases outside beam area, indicating that the current treatment margins may not be adequate.
EPSM-1112 Tue 5th Nov 13:45 Golden Ballroom North Radiotherapy
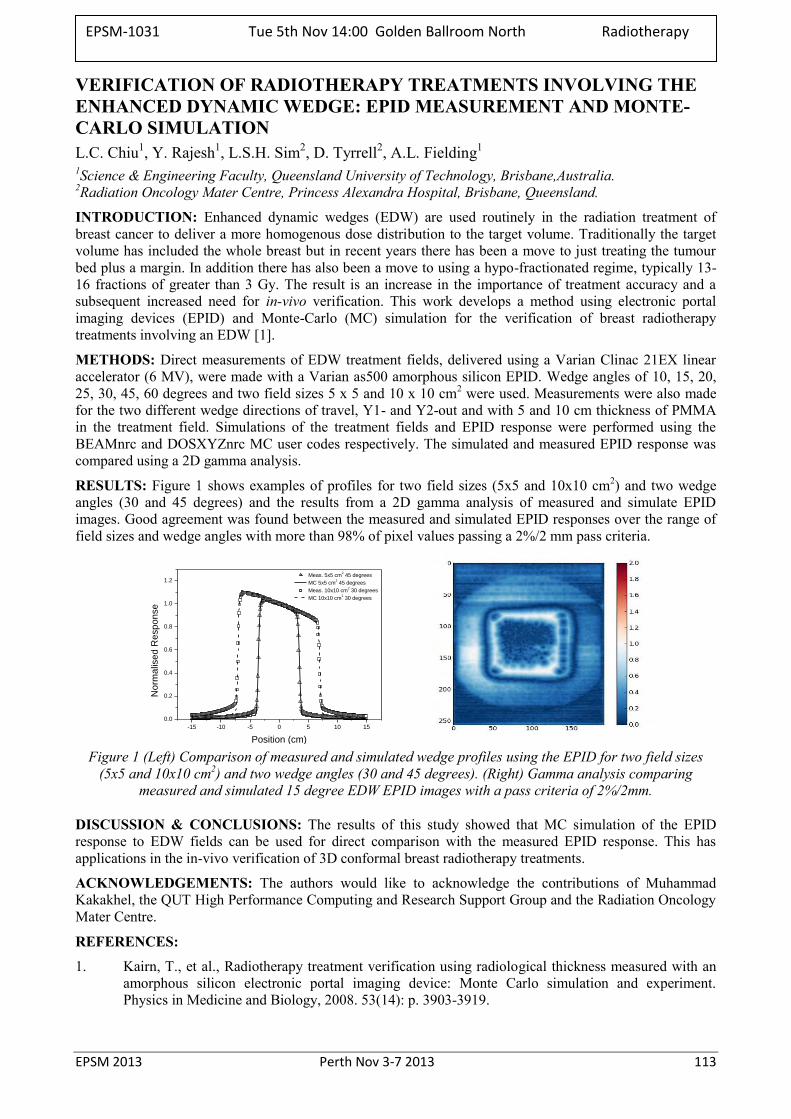
EPSM 2013 Perth Nov 3-7 2013 113
VERIFICATION OF RADIOTHERAPY TREATMENTS INVOLVING THE ENHANCED DYNAMIC WEDGE: EPID MEASUREMENT AND MONTE-CARLO SIMULATION L.C. Chiu1, Y. Rajesh1, L.S.H. Sim2, D. Tyrrell2, A.L. Fielding1 1Science & Engineering Faculty, Queensland University of Technology, Brisbane,Australia. 2Radiation Oncology Mater Centre, Princess Alexandra Hospital, Brisbane, Queensland.
INTRODUCTION: Enhanced dynamic wedges (EDW) are used routinely in the radiation treatment of breast cancer to deliver a more homogenous dose distribution to the target volume. Traditionally the target volume has included the whole breast but in recent years there has been a move to just treating the tumour bed plus a margin. In addition there has also been a move to using a hypo-fractionated regime, typically 13- 16 fractions of greater than 3 Gy. The result is an increase in the importance of treatment accuracy and a subsequent increased need for in-vivo verification. This work develops a method using electronic portal imaging devices (EPID) and Monte-Carlo (MC) simulation for the verification of breast radiotherapy treatments involving an EDW [1].
METHODS: Direct measurements of EDW treatment fields, delivered using a Varian Clinac 21EX linear accelerator (6 MV), were made with a Varian as500 amorphous silicon EPID. Wedge angles of 10, 15, 20, 25, 30, 45, 60 degrees and two field sizes 5 x 5 and 10 x 10 cm2 were used. Measurements were also made for the two different wedge directions of travel, Y1- and Y2-out and with 5 and 10 cm thickness of PMMA in the treatment field. Simulations of the treatment fields and EPID response were performed using the BEAMnrc and DOSXYZnrc MC user codes respectively. The simulated and measured EPID response was compared using a 2D gamma analysis.
RESULTS: Figure 1 shows examples of profiles for two field sizes (5x5 and 10x10 cm2) and two wedge angles (30 and 45 degrees) and the results from a 2D gamma analysis of measured and simulate EPID images. Good agreement was found between the measured and simulated EPID responses over the range of field sizes and wedge angles with more than 98% of pixel values passing a 2%/2 mm pass criteria.
-15 -10 -5 0 5 10 15
0.0
0.2
0.4
0.6
0.8
1.0
1.2
Meas. 5x5 cm2 45 degrees
MC 5x5 cm2 45 degrees
Meas. 10x10 cm2 30 degrees
MC 10x10 cm2 30 degrees
No
rma
lise
d R
esp
on
se
Position (cm) Figure 1 (Left) Comparison of measured and simulated wedge profiles using the EPID for two field sizes
(5x5 and 10x10 cm2) and two wedge angles (30 and 45 degrees). (Right) Gamma analysis comparing measured and simulated 15 degree EDW EPID images with a pass criteria of 2%/2mm.
DISCUSSION & CONCLUSIONS: The results of this study showed that MC simulation of the EPID response to EDW fields can be used for direct comparison with the measured EPID response. This has applications in the in-vivo verification of 3D conformal breast radiotherapy treatments.
ACKNOWLEDGEMENTS: The authors would like to acknowledge the contributions of Muhammad Kakakhel, the QUT High Performance Computing and Research Support Group and the Radiation Oncology Mater Centre.
REFERENCES:
1. Kairn, T., et al., Radiotherapy treatment verification using radiological thickness measured with an amorphous silicon electronic portal imaging device: Monte Carlo simulation and experiment. Physics in Medicine and Biology, 2008. 53(14): p. 3903-3919.
EPSM-1031 Tue 5th Nov 14:00 Golden Ballroom North Radiotherapy
114 Perth Nov 3-7 2013 EPSM 2013
EFFECTS OF MODULATION CONSTRAINTS ON VMAT PLAN QUALITY, ACCURACY AND EFFICIENCY N. Campbell, G. Bengua
Regional Blood and Cancer services, Auckland City Hospital, Auckland, New Zealand.
INTRODUCTION: This work investigated the effect of varying the maximum MLC speed and maximum dose rate on the quality, efficiency and accuracy of the treatment plans.
METHODS: The Pinnacle3 SmartArc treatment planning software was used to generate plans on prostate and head and neck (H&N) sites. A range of maximum MLC leaf speeds (0.55cm/s to 2.20cm/s) and maximum dose rates (200MU/min to 600MU/min) restrictions were applied to each plan to investigate the effect the treatment quality, efficiency and accuracy. Each plan had their MU per fraction, delivery time, mean dose rate and leaf speed analysed. The DVH data was used in the assessment of the conformity, homogeneity and plan quality. The treatments were delivered on Varian iX accelerator equipped with 120-leaf millennium MLC. Quality assurance measurements were performed using the ArcCHECK™ 3D diode array and results were assessed based on gamma analysis of dose fluence maps, beam delivery statistics and Dynalog data.
RESULTS & DISCUSSION: The number of VMAT fields was found to be a key factor in how significant the maximum MLC leaf speed affected the plan parameters investigated. Single arc treatments were shown to have lower MU, dose rate and plan quality, while also exhibiting a slight increase in estimated delivery time. For dual arc treatments, MU, delivery time, dose rate and plan quality were largely independent of the maximum MLC speed allowed. The QA showed that higher MLC leaf speeds were prone to an increase in the discrepancy between planned and delivered CP fluence and higher MLC positioning errors. None of these were at a clinically significant level, and the overall a fluence distribution and point dose comparisons were independent of maximum MLC leaf speed.
The only clinically significant effect that modulation of the maximum dose rate had was on the delivery time. Lower maximum dose rates resulted in longer treatment delivery, which is an important consideration in minimising the intra-fractional motion during treatment.
CONCLUSIONS: The results of the MLC leaf speed evaluation showed that the lower the maximum leaf speed the more accurate the delivered treatment, but the quality of the plan is also reduced. This indicates that there could be an optimum maximum MLC leaf speed the produces high quality plans that can be accurately delivery. Based on this work a maximum MLC leaf speed of 1.38cm/s was shown to have no reduction in plan quality but did show improved delivery accuracy. There was no justification found for reducing the maximum dose rate below the recommended 600MU/min.
EPSM-1131 Tue 5th Nov 14:15 Golden Ballroom North Radiotherapy
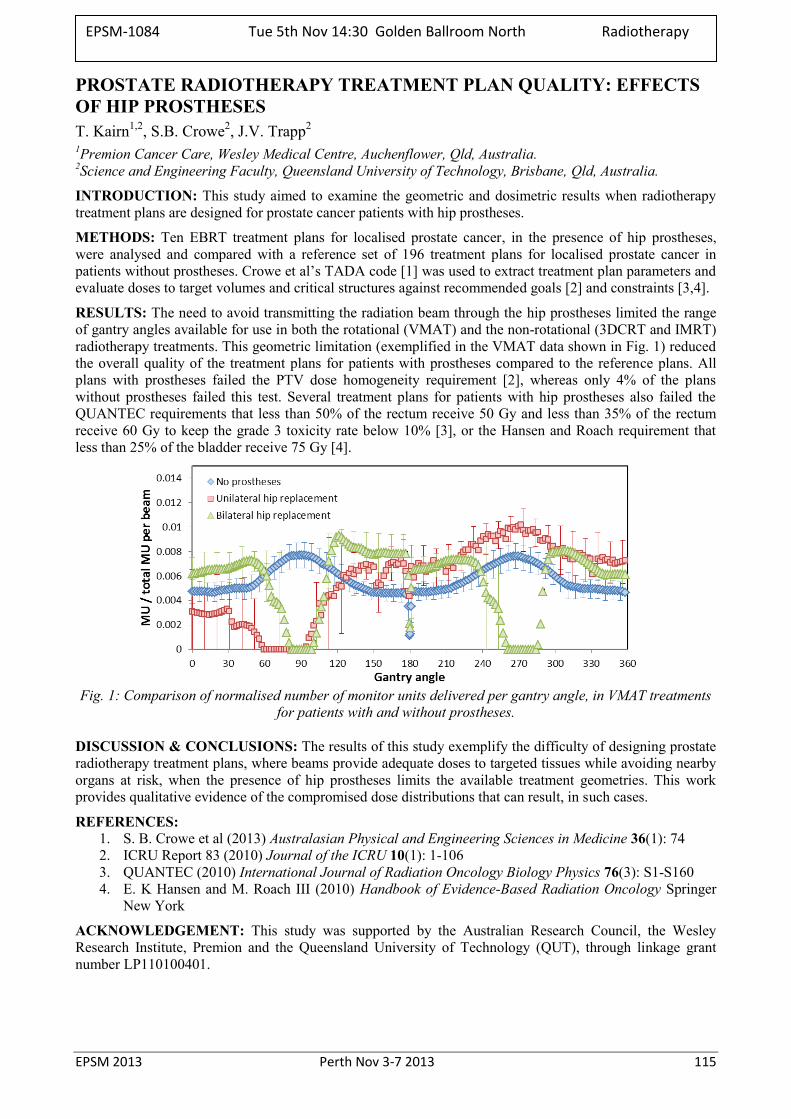
EPSM 2013 Perth Nov 3-7 2013 115
PROSTATE RADIOTHERAPY TREATMENT PLAN QUALITY: EFFECTS OF HIP PROSTHESES T. Kairn1,2, S.B. Crowe2, J.V. Trapp2 1Premion Cancer Care, Wesley Medical Centre, Auchenflower, Qld, Australia. 2Science and Engineering Faculty, Queensland University of Technology, Brisbane, Qld, Australia.
INTRODUCTION: This study aimed to examine the geometric and dosimetric results when radiotherapy treatment plans are designed for prostate cancer patients with hip prostheses.
METHODS: Ten EBRT treatment plans for localised prostate cancer, in the presence of hip prostheses, were analysed and compared with a reference set of 196 treatment plans for localised prostate cancer in patients without prostheses. Crowe et al’s TADA code [1] was used to extract treatment plan parameters and evaluate doses to target volumes and critical structures against recommended goals [2] and constraints [3,4].
RESULTS: The need to avoid transmitting the radiation beam through the hip prostheses limited the range of gantry angles available for use in both the rotational (VMAT) and the non-rotational (3DCRT and IMRT) radiotherapy treatments. This geometric limitation (exemplified in the VMAT data shown in Fig. 1) reduced the overall quality of the treatment plans for patients with prostheses compared to the reference plans. All plans with prostheses failed the PTV dose homogeneity requirement [2], whereas only 4% of the plans without prostheses failed this test. Several treatment plans for patients with hip prostheses also failed the QUANTEC requirements that less than 50% of the rectum receive 50 Gy and less than 35% of the rectum receive 60 Gy to keep the grade 3 toxicity rate below 10% [3], or the Hansen and Roach requirement that less than 25% of the bladder receive 75 Gy [4].
Fig. 1: Comparison of normalised number of monitor units delivered per gantry angle, in VMAT treatments
for patients with and without prostheses.
DISCUSSION & CONCLUSIONS: The results of this study exemplify the difficulty of designing prostate radiotherapy treatment plans, where beams provide adequate doses to targeted tissues while avoiding nearby organs at risk, when the presence of hip prostheses limits the available treatment geometries. This work provides qualitative evidence of the compromised dose distributions that can result, in such cases.
REFERENCES: 1. S. B. Crowe et al (2013) Australasian Physical and Engineering Sciences in Medicine 36(1): 74 2. ICRU Report 83 (2010) Journal of the ICRU 10(1): 1-106 3. QUANTEC (2010) International Journal of Radiation Oncology Biology Physics 76(3): S1-S160 4. E. K Hansen and M. Roach III (2010) Handbook of Evidence-Based Radiation Oncology Springer
New York
ACKNOWLEDGEMENT: This study was supported by the Australian Research Council, the Wesley Research Institute, Premion and the Queensland University of Technology (QUT), through linkage grant number LP110100401.
EPSM-1084 Tue 5th Nov 14:30 Golden Ballroom North Radiotherapy
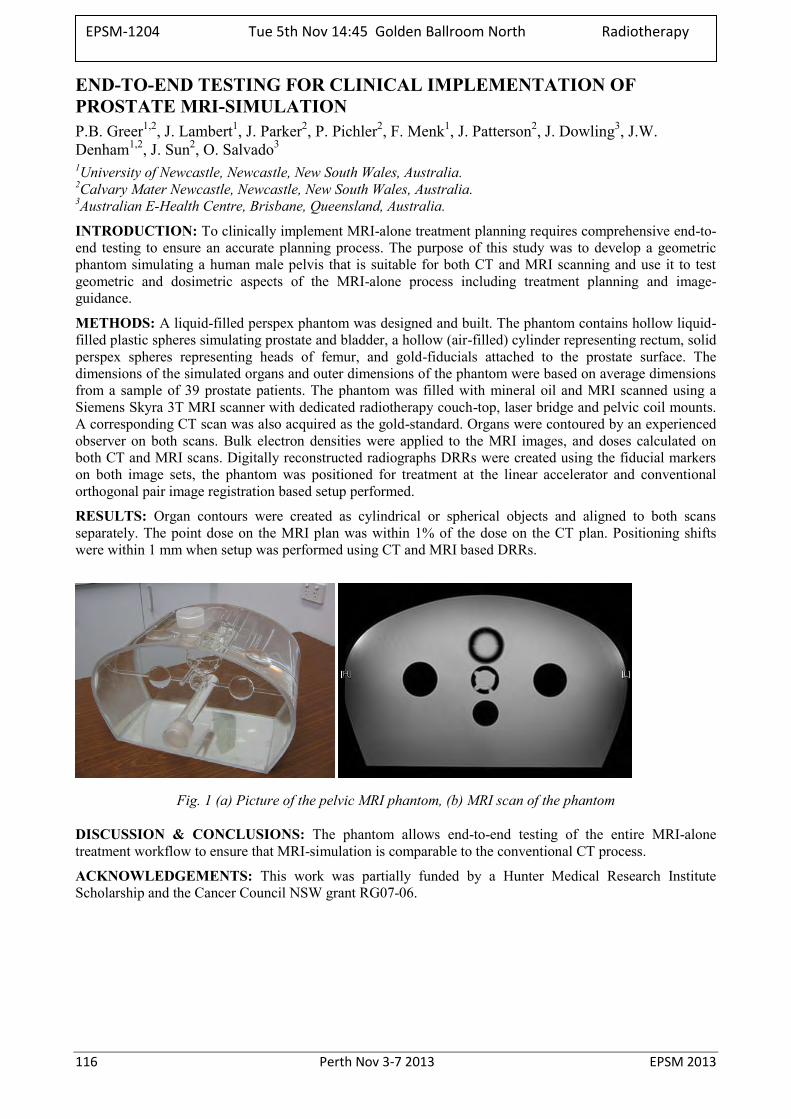
116 Perth Nov 3-7 2013 EPSM 2013
END-TO-END TESTING FOR CLINICAL IMPLEMENTATION OF PROSTATE MRI-SIMULATION P.B. Greer1,2, J. Lambert1, J. Parker2, P. Pichler2, F. Menk1, J. Patterson2, J. Dowling3, J.W. Denham1,2, J. Sun2, O. Salvado3 1University of Newcastle, Newcastle, New South Wales, Australia. 2Calvary Mater Newcastle, Newcastle, New South Wales, Australia. 3Australian E-Health Centre, Brisbane, Queensland, Australia.
INTRODUCTION: To clinically implement MRI-alone treatment planning requires comprehensive end-to-end testing to ensure an accurate planning process. The purpose of this study was to develop a geometric phantom simulating a human male pelvis that is suitable for both CT and MRI scanning and use it to test geometric and dosimetric aspects of the MRI-alone process including treatment planning and image-guidance.
METHODS: A liquid-filled perspex phantom was designed and built. The phantom contains hollow liquid-filled plastic spheres simulating prostate and bladder, a hollow (air-filled) cylinder representing rectum, solid perspex spheres representing heads of femur, and gold-fiducials attached to the prostate surface. The dimensions of the simulated organs and outer dimensions of the phantom were based on average dimensions from a sample of 39 prostate patients. The phantom was filled with mineral oil and MRI scanned using a Siemens Skyra 3T MRI scanner with dedicated radiotherapy couch-top, laser bridge and pelvic coil mounts. A corresponding CT scan was also acquired as the gold-standard. Organs were contoured by an experienced observer on both scans. Bulk electron densities were applied to the MRI images, and doses calculated on both CT and MRI scans. Digitally reconstructed radiographs DRRs were created using the fiducial markers on both image sets, the phantom was positioned for treatment at the linear accelerator and conventional orthogonal pair image registration based setup performed.
RESULTS: Organ contours were created as cylindrical or spherical objects and aligned to both scans separately. The point dose on the MRI plan was within 1% of the dose on the CT plan. Positioning shifts were within 1 mm when setup was performed using CT and MRI based DRRs.
Fig. 1 (a) Picture of the pelvic MRI phantom, (b) MRI scan of the phantom
DISCUSSION & CONCLUSIONS: The phantom allows end-to-end testing of the entire MRI-alone treatment workflow to ensure that MRI-simulation is comparable to the conventional CT process.
ACKNOWLEDGEMENTS: This work was partially funded by a Hunter Medical Research Institute Scholarship and the Cancer Council NSW grant RG07-06.
EPSM-1204 Tue 5th Nov 14:45 Golden Ballroom North Radiotherapy
EPSM 2013 Perth Nov 3-7 2013 117
BRAINLAB IPLAN TREATMENT PLANNING SYSTEM FOR ELEKTA AXESSE K. Biggerstaff, B. Harris, P. O’Connor, J. Boyd, P. Hanlon
Department of Radiation Oncology, Princess Alexandra Hospital, Brisbane, Queensland.
INTRODUCTION: An Elekta Axesse linear accelerator (Elekta Oncology Systems, Crawley, UK) 6 MV photon model was commissioned in the BrainLab iPlan treatment planning system (Brainlab, Feldkirchen, Germany) to plan dedicated stereotactic radiosurgery/therapy (SRS/RT) treatments. The system has the capacity to deliver conformal, dynamic and circular arcs, IMRT and hybrid arcs. For stereotactic treatments, it is crucial that the absolute dose and geometrical accuracy are within acceptable limits.
METHODS: The iPlan Pencil Beam Convolution algorithm for the Elekta Axesse was commissioned for field sizes from 8 8 to 80 80 mm2. The required data was collected using a vertically orientated 0.015cm3 volume Pinpoint chamber (PTW, Freiburg, Germany). Cross-axis, inline profiles and output factor measurements were measured in a scanning water tank.
CT and patient data transfer tests, dose accuracy in tissue inhomogeneities and general clinical tests were conducted following recommendations from TRS 430 [1] and TecDoc 1583 [2]. The Lucy phantom (Standard Imaging, Michigan, USA) was used to test the image fusion capabilities of iPlan between CT and MRI datasets [3]. The same phantom was also used for verification of patient treatment plans, which were performed with image guidance using the ExacTrac image guidance system (Brainlab, Feldkirchen, Germany). GafChromic Film (International Specialty Products, New Jersey, USA) was the chosen dosimeter due to its high spatial resolution and accuracy at small field sizes. A 95% pass rate of a 3% / 1 mm gamma criterion was considered an acceptable result. The measured and calculated attenuation through the Elekta evo iBeam couch top, BrainLab immobilisation mask system and BrainLab array frame for infra-red detection were also compared. iPlan’s ability to account for attenuators were determined by orientation of the treatment unit such that a 2.4 2.4cm2 field was perpendicular to the surface of the attenuator
RESULTS: For square fields with sides 8 to 80 mm, the dose calculated and measured in water agreed to within 1%. In the inhomogeneous bone slab the dose calculated and measured for field sizes 16 × 16 to 80 80 mm2 agreed to within 2%. Several conformal and dynamic arcs were measured and analysed with the OmniPro I’mRT software (IBA Dosimetry, Schwarzenbruck, Germany) and found to meet the gamma criterion pass rate. iPlan calculated the dose through the tested attenuators accurately to within 1 %.
DISCUSSION & CONCLUSIONS: Ion chamber measurements were not used for patient dose points as even with a PTW Pinpoint chamber the sensitive volume was often spanning the field penumbra. Film was chosen for its dual assessment of dose and geometric accuracy, particularly as the Lucy phantom film holder has 5 metal spikes to punch holes for film registration. These spikes allow reproducible phantom positioning using the Exactrac positioning system, and the holes in the film allow assessment of the geometrical accuracy of the treatment delivery. Although discrepancies of up to 7% were found through the tip of the Elekta evo iBeam couch top extension at high skimming angles, typical clinical treatments are arcs spanning up to 180 degrees, therefore attenuation through these will have insignificant impact on overall dose distribution.
REFERENCES: 1. TRS 430 International Atomic Energy Agency (2004) Technical Report Series 430 Commissioning
and Quality Assurance of Computerized Planning Systems for Radiation Treatment of Cancer, IAEA, Vienna.
2. International Atomic Energy Agency (2008) TECDOC 1583 Commissioning of Radiotherapy Treatment Planning Systems: Testing for Typical External Beam Treatment Techniques, IAEA, Vienna.
3. Hancock S. S. (2008) “End-to-End Radiosurgery tests with Lucy® Phantom, Southeast Missouri Hospital, Missouri, USA.
EPSM-1127 Tue 5th Nov 15:00 Golden Ballroom North Radiotherapy
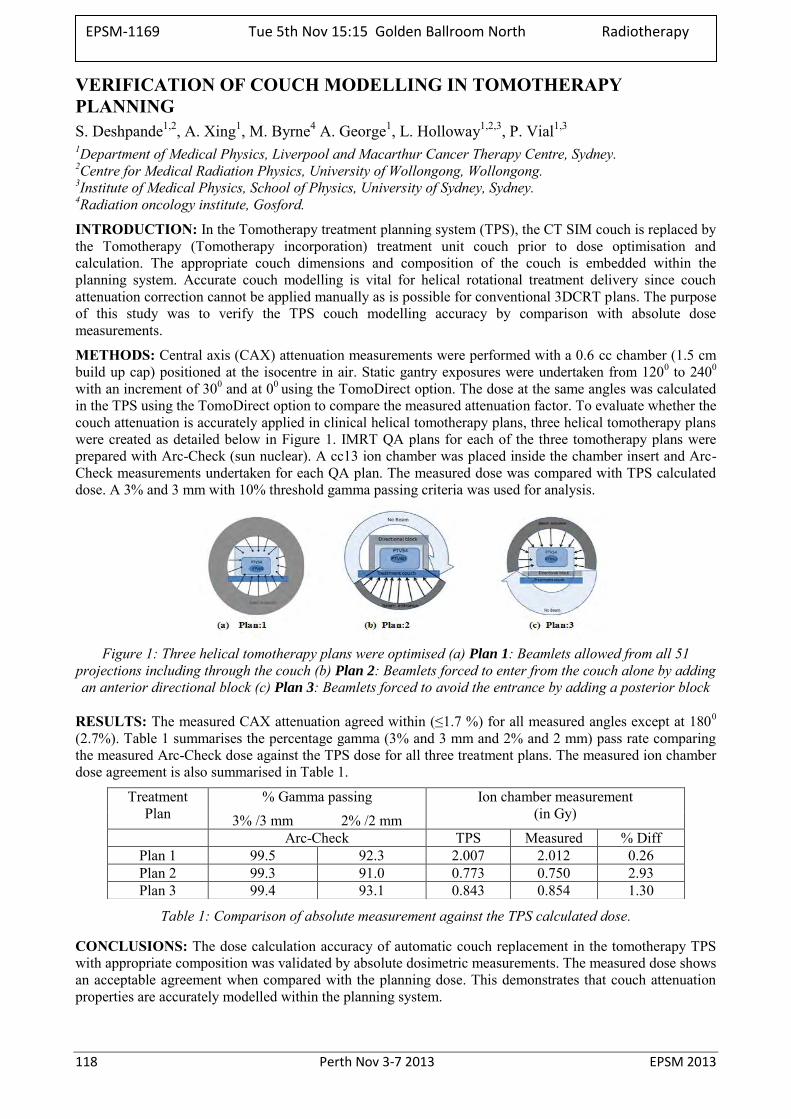
118 Perth Nov 3-7 2013 EPSM 2013
VERIFICATION OF COUCH MODELLING IN TOMOTHERAPY PLANNING S. Deshpande1,2, A. Xing1, M. Byrne4 A. George1, L. Holloway1,2,3, P. Vial1,3 1Department of Medical Physics, Liverpool and Macarthur Cancer Therapy Centre, Sydney. 2Centre for Medical Radiation Physics, University of Wollongong, Wollongong. 3Institute of Medical Physics, School of Physics, University of Sydney, Sydney. 4Radiation oncology institute, Gosford.
INTRODUCTION: In the Tomotherapy treatment planning system (TPS), the CT SIM couch is replaced by the Tomotherapy (Tomotherapy incorporation) treatment unit couch prior to dose optimisation and calculation. The appropriate couch dimensions and composition of the couch is embedded within the planning system. Accurate couch modelling is vital for helical rotational treatment delivery since couch attenuation correction cannot be applied manually as is possible for conventional 3DCRT plans. The purpose of this study was to verify the TPS couch modelling accuracy by comparison with absolute dose measurements.
METHODS: Central axis (CAX) attenuation measurements were performed with a 0.6 cc chamber (1.5 cm build up cap) positioned at the isocentre in air. Static gantry exposures were undertaken from 1200 to 2400 with an increment of 300 and at 00 using the TomoDirect option. The dose at the same angles was calculated in the TPS using the TomoDirect option to compare the measured attenuation factor. To evaluate whether the couch attenuation is accurately applied in clinical helical tomotherapy plans, three helical tomotherapy plans were created as detailed below in Figure 1. IMRT QA plans for each of the three tomotherapy plans were prepared with Arc-Check (sun nuclear). A cc13 ion chamber was placed inside the chamber insert and Arc-Check measurements undertaken for each QA plan. The measured dose was compared with TPS calculated dose. A 3% and 3 mm with 10% threshold gamma passing criteria was used for analysis.
Figure 1: Three helical tomotherapy plans were optimised (a) Plan 1: Beamlets allowed from all 51
projections including through the couch (b) Plan 2: Beamlets forced to enter from the couch alone by adding an anterior directional block (c) Plan 3: Beamlets forced to avoid the entrance by adding a posterior block
RESULTS: The measured CAX attenuation agreed within (≤1.7 %) for all measured angles except at 1800 (2.7%). Table 1 summarises the percentage gamma (3% and 3 mm and 2% and 2 mm) pass rate comparing the measured Arc-Check dose against the TPS dose for all three treatment plans. The measured ion chamber dose agreement is also summarised in Table 1.
Table 1: Comparison of absolute measurement against the TPS calculated dose.
CONCLUSIONS: The dose calculation accuracy of automatic couch replacement in the tomotherapy TPS with appropriate composition was validated by absolute dosimetric measurements. The measured dose shows an acceptable agreement when compared with the planning dose. This demonstrates that couch attenuation properties are accurately modelled within the planning system.
Treatment Plan
% Gamma passing Ion chamber measurement (in Gy) 3% /3 mm 2% /2 mm
Arc-Check TPS Measured % Diff Plan 1 99.5 92.3 2.007 2.012 0.26 Plan 2 99.3 91.0 0.773 0.750 2.93 Plan 3 99.4 93.1 0.843 0.854 1.30
EPSM-1169 Tue 5th Nov 15:15 Golden Ballroom North Radiotherapy
EPSM 2013 Perth Nov 3-7 2013 119
A DIODE FOR CORRECTION-LESS SMALL FIELD OUTPUT FACTOR MEASUREMENTS P.H. Charles1, G. Cranmer-Sargison2,3, S.B. Crowe1, T. Kairn1,4, D.I. Thwaites3,5, J.V. Trapp1 1Science and engineering faculty, Queensland University of Technology, Brisbane, Queensland. 2Department of Medical Physics, Saskatchewan Cancer Agency, Saskatoon, Canada. 3Academic Unit of Medical Physics, Faculty of Medicine and Health, University of Leeds, UK. 4Premion Cancer Care, Brisbane, Queensland. 5Institute of Medical Physics, School of Physics, University of Sydney, New South Wales.
INTRODUCTION: Due to their high spatial resolution diodes are often used for small field relative output factor measurements. However, a field size specific correction factor1 is required and corrects for diode detector over-response at small field sizes. A recent Monte Carlo based study has shown that it is possible to design a diode detector that produces measured relative output factors that are equivalent to those in water. This is accomplished by introducing an air gap at the upstream end of the diode2. The aim of this study was to physically construct this diode by placing an ‘air cap’ on the end of a commercially available diode (the PTW 60016 electron diode). The output factors subsequently measured with the new diode design were compared to current benchmark small field output factor measurements.
METHODS: A water-tight ‘cap’ was constructed so that it could be placed over the upstream end of the diode. The cap was able to be offset from the end of the diode, thus creating an air gap. The air gap width was the same as the diode width (7 mm) and the thickness of the air gap could be varied. Output factor measurements were made using square field sizes of side length from 5 mm to 50 mm, using a 6 MV photon beam. The set of output factor measurements were repeated with the air gap thickness set to 0, 0.5, 1.0 and 1.5 mm. The optimal air gap thickness was found in a similar manner to that proposed by Charles et al2. An IBA stereotactic field diode, corrected using Monte Carlo calculated kq,clin,kq,msr values3 was used as the gold standard.
RESULTS: The optimal air thickness required for the PTW 60016 electron diode was 1.0 mm. This was close to the Monte Carlo predicted value of 1.15 mm2. The sensitivity of the new diode design was independent of field size (kq,clin,kq,msr = 1.000 at all field sizes) to within 1 %.
DISCUSSION & CONCLUSIONS: The work of Charles et al2 has been proven experimentally. An existing commercial diode has been converted into a correction-less small field diode by the simple addition of an ‘air cap’. The method of applying a cap to create the new diode leads to the diode being dual purpose, as without the cap it is still an unmodified electron diode.
REFERENCES: 1. R. Alfonso et al (2008). Medical Physics 35(11): 5179-5186 2. P. Charles et al (2013). Phys Med Biol 58(13): 4501-4512 3. G. Granmer-Sargison et al (2011). Medical Physics 38(12): 6592-6602
ACKNOWLEDGEMENTS: This study was supported by the Australian Research Council, the Wesley Research Institute, Premion and the Queensland University of Technology (QUT), through linkage grant number LP110100401. The authors would like to thank Trent Aland for assistance with measurements and Greg Pedrazzini for the construction of the air cap.
EPSM-1093 Tue 5th Nov 16:00 Golden Ballroom South Radiotherapy
120 Perth Nov 3-7 2013 EPSM 2013
A METHOD FOR JAW DETECTION AND TRACKING DURING IMRT AND VMAT TREATMENT DELIVERY USING CINE-EPID T. Fuangrod1, P. Rowshanfazad2, P.B. Greer3,4, R. Middleton1 1Faculty of Engineering and Built Environment, School of Electrical Engineering and Computer Science, the
University of Newcastle, NSW 2308, Australia. 2School of Physics, University of Western Australia, Crawley, WA 6009, Australia. 3Faculty of Science and IT, School of Mathematical and Physical Sciences, the University of Newcastle, NSW
2308, Australia. 4Department of Radiation Oncology, Calvary Mater Newcastle Hospital, Locked Bag 7, Hunter Region Mail
Centre, Newcastle, NSW 2310, Australia.
INTRODUCTION: In modern radiation therapy, the shape of the radiation field is controlled using three collimator systems in the linear accelerator (linac) head: the primary collimator, the secondary collimator (independent jaws), and the multi-leaf collimator (MLC). An incorrect jaw position setup can lead to errors in the delivered dose during treatment. In addition, the Varian TrueBeam linac (VMS, Palo Alto, CA, USA) allows the jaws to be moved dynamically (jaw tracking) while the beam is on to minimize the MLC interleaf leakage and transmission. Even though routine QA is recommended to ensure that the linac performs correctly, errors in jaw positioning have still occurred where the actual jaw positions differed from the intended positions without warning to the operator [1]. Therefore, jaw position measurement during treatment is desirable. However the jaw edges are very low contrast in the images as the beam has already been attenuated by the MLC and the edge regions are affected by EPID scatter from the MLC defined field. In this work, a method was developed for detecting jaw position and verifying jaw tracking using cine-EPID images while the beam in on and the jaws are positioned behind the MLCs. The method is applicable to both static jaw IMRT and tracking jaw VMAT treatments performed with a TrueBeam linac.
METHODS: The jaw detection and tracking algorithm consists of five main steps. Firstly, the EPID scatter was removed from the image using a kernel deconvolution to enhance the jaw edge. A global threshold level was then applied using a histogram clustering technique. Either optimal histogram clustering or k-mean clustering techniques were used depending on the histogram distribution. The threshold level was then used to classify each pixel of the image as either under the jaws or under the MLC. In addition, the collimator angle was automatically detected and used to rotate the image to zero degrees. This rotation allows the jaw positions to be determined using vertical and horizontal projection profiles. The algorithm was tested for static jaw IMRT fields of varying sizes by comparison to the planned field sizes and for a TrueBeam jaw tracking VMAT field. Cine-EPID images were acquired for each delivery with a Varian aS1000 system with a frame-rate of frames per second. The jaw positions were detected using 3 frames averaging.
RESULTS: The detected jaw positions yielded a detection accuracy of ±1 mm RMS error (maximum error 1.5 mm) for static jaw treatments and ±1.5 mm RMS error (maximum error 3 mm) for tracking jaw
treatments. Our automatic jaw detection algorithm took approximately 1.02±0.06 seconds with the standard hardware (Intel Core i5, 2.5GHz CPU, 8 GB RAM, and a 64-bit operating system) using in-house developed MATLAB software.
DISCUSSION & CONCLUSIONS: The algorithm for detecting and tracking jaw position during IMRT and VMAT deliveries has been demonstrated. This method is designed as an intra-fractional verification tool in modern radiation therapy and may be applied to detect the position of static jaws or verify the position of tracking jaws in more complex treatments.
REFERENCES: 1. V.M.S. Australasia, "Incorrect Position Readout Values Caused by Failure of Position Readout
Feedback," Reference/ FSCA Identifier: CP-06611 (2011).
ACKNOWLEDGEMENTS: Images acquired with the TrueBeam linac were kindly provided by Dr William Ansbacher, BC Cancer Agency, Canada.
EPSM-1177 Tue 5th Nov 16:15 Golden Ballroom South Radiotherapy
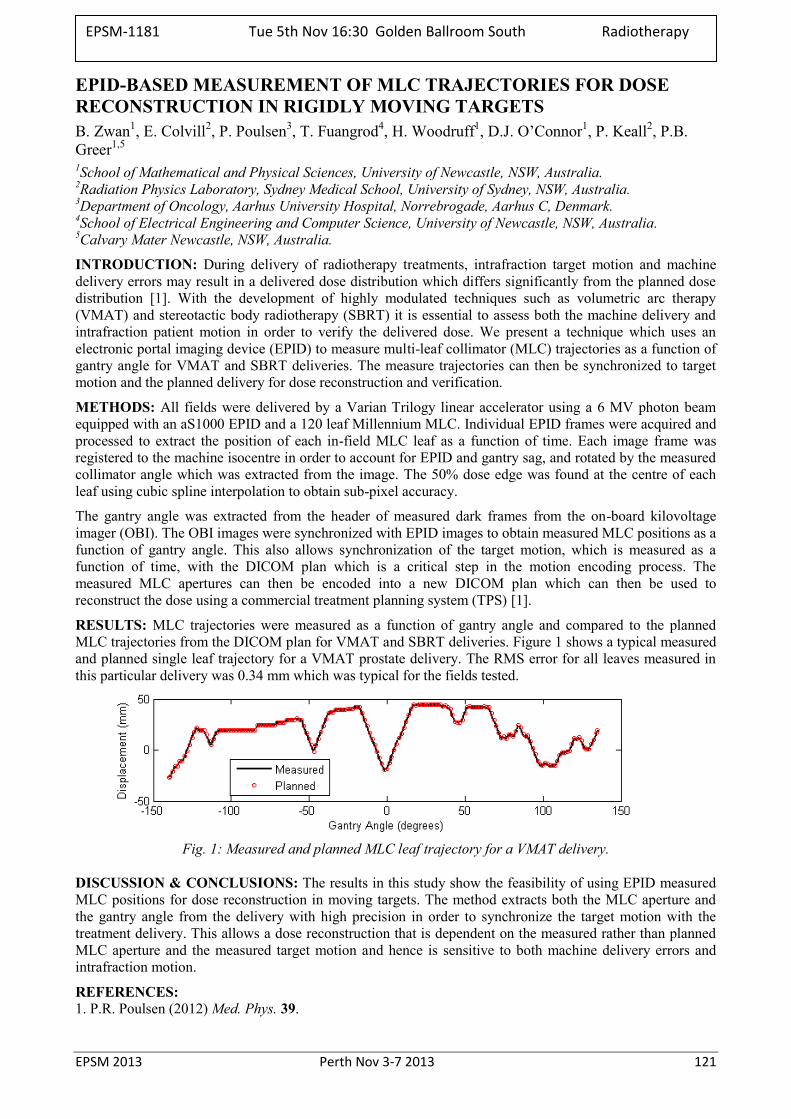
EPSM 2013 Perth Nov 3-7 2013 121
EPID-BASED MEASUREMENT OF MLC TRAJECTORIES FOR DOSE RECONSTRUCTION IN RIGIDLY MOVING TARGETS B. Zwan1, E. Colvill2, P. Poulsen3, T. Fuangrod4, H. Woodruff1, D.J. O’Connor1, P. Keall2, P.B. Greer1,5
1School of Mathematical and Physical Sciences, University of Newcastle, NSW, Australia. 2Radiation Physics Laboratory, Sydney Medical School, University of Sydney, NSW, Australia. 3Department of Oncology, Aarhus University Hospital, Norrebrogade, Aarhus C, Denmark. 4School of Electrical Engineering and Computer Science, University of Newcastle, NSW, Australia. 5Calvary Mater Newcastle, NSW, Australia.
INTRODUCTION: During delivery of radiotherapy treatments, intrafraction target motion and machine delivery errors may result in a delivered dose distribution which differs significantly from the planned dose distribution [1]. With the development of highly modulated techniques such as volumetric arc therapy (VMAT) and stereotactic body radiotherapy (SBRT) it is essential to assess both the machine delivery and intrafraction patient motion in order to verify the delivered dose. We present a technique which uses an electronic portal imaging device (EPID) to measure multi-leaf collimator (MLC) trajectories as a function of gantry angle for VMAT and SBRT deliveries. The measure trajectories can then be synchronized to target motion and the planned delivery for dose reconstruction and verification.
METHODS: All fields were delivered by a Varian Trilogy linear accelerator using a 6 MV photon beam equipped with an aS1000 EPID and a 120 leaf Millennium MLC. Individual EPID frames were acquired and processed to extract the position of each in-field MLC leaf as a function of time. Each image frame was registered to the machine isocentre in order to account for EPID and gantry sag, and rotated by the measured collimator angle which was extracted from the image. The 50% dose edge was found at the centre of each leaf using cubic spline interpolation to obtain sub-pixel accuracy.
The gantry angle was extracted from the header of measured dark frames from the on-board kilovoltage imager (OBI). The OBI images were synchronized with EPID images to obtain measured MLC positions as a function of gantry angle. This also allows synchronization of the target motion, which is measured as a function of time, with the DICOM plan which is a critical step in the motion encoding process. The measured MLC apertures can then be encoded into a new DICOM plan which can then be used to reconstruct the dose using a commercial treatment planning system (TPS) [1].
RESULTS: MLC trajectories were measured as a function of gantry angle and compared to the planned MLC trajectories from the DICOM plan for VMAT and SBRT deliveries. Figure 1 shows a typical measured and planned single leaf trajectory for a VMAT prostate delivery. The RMS error for all leaves measured in this particular delivery was 0.34 mm which was typical for the fields tested.
Fig. 1: Measured and planned MLC leaf trajectory for a VMAT delivery.
DISCUSSION & CONCLUSIONS: The results in this study show the feasibility of using EPID measured MLC positions for dose reconstruction in moving targets. The method extracts both the MLC aperture and the gantry angle from the delivery with high precision in order to synchronize the target motion with the treatment delivery. This allows a dose reconstruction that is dependent on the measured rather than planned MLC aperture and the measured target motion and hence is sensitive to both machine delivery errors and intrafraction motion.
REFERENCES: 1. P.R. Poulsen (2012) Med. Phys. 39.
EPSM-1181 Tue 5th Nov 16:30 Golden Ballroom South Radiotherapy
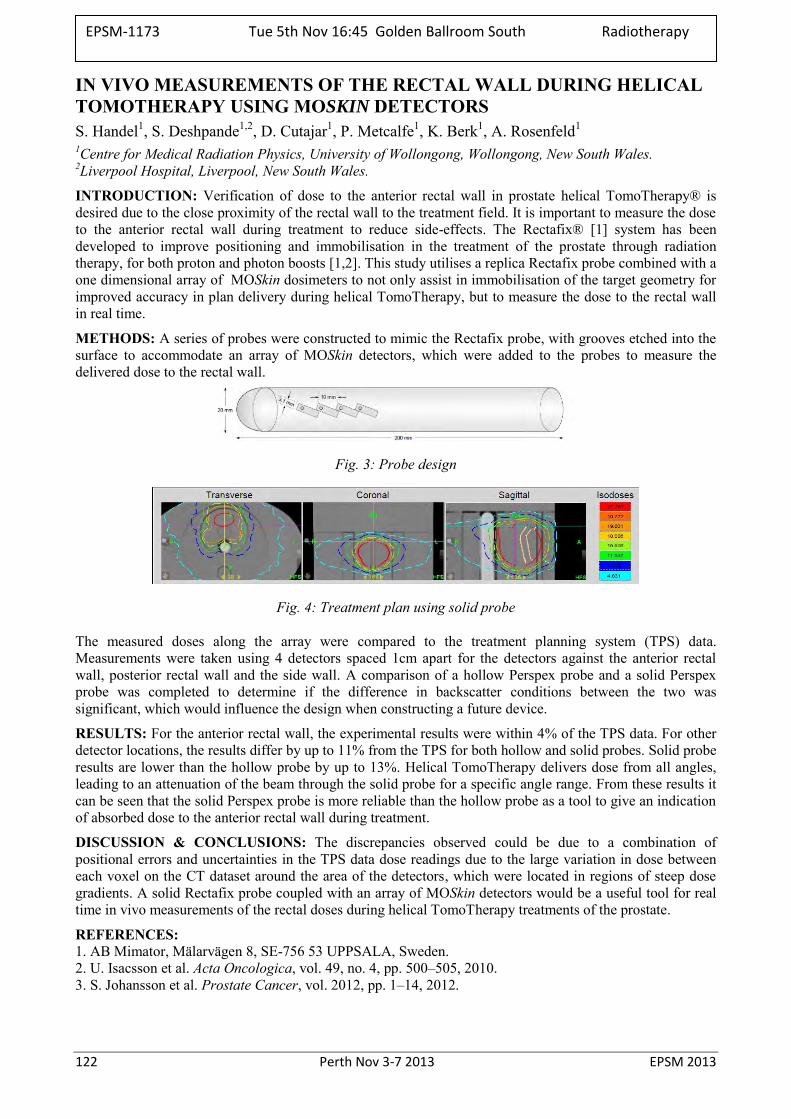
122 Perth Nov 3-7 2013 EPSM 2013
IN VIVO MEASUREMENTS OF THE RECTAL WALL DURING HELICAL TOMOTHERAPY USING MOSKIN DETECTORS S. Handel1, S. Deshpande1,2, D. Cutajar1, P. Metcalfe1, K. Berk1, A. Rosenfeld1 1Centre for Medical Radiation Physics, University of Wollongong, Wollongong, New South Wales. 2Liverpool Hospital, Liverpool, New South Wales.
INTRODUCTION: Verification of dose to the anterior rectal wall in prostate helical TomoTherapy® is desired due to the close proximity of the rectal wall to the treatment field. It is important to measure the dose to the anterior rectal wall during treatment to reduce side-effects. The Rectafix® [1] system has been developed to improve positioning and immobilisation in the treatment of the prostate through radiation therapy, for both proton and photon boosts [1,2]. This study utilises a replica Rectafix probe combined with a one dimensional array of MOSkin dosimeters to not only assist in immobilisation of the target geometry for improved accuracy in plan delivery during helical TomoTherapy, but to measure the dose to the rectal wall in real time.
METHODS: A series of probes were constructed to mimic the Rectafix probe, with grooves etched into the surface to accommodate an array of MOSkin detectors, which were added to the probes to measure the delivered dose to the rectal wall.
Fig. 3: Probe design
Fig. 4: Treatment plan using solid probe
The measured doses along the array were compared to the treatment planning system (TPS) data. Measurements were taken using 4 detectors spaced 1cm apart for the detectors against the anterior rectal wall, posterior rectal wall and the side wall. A comparison of a hollow Perspex probe and a solid Perspex probe was completed to determine if the difference in backscatter conditions between the two was significant, which would influence the design when constructing a future device.
RESULTS: For the anterior rectal wall, the experimental results were within 4% of the TPS data. For other detector locations, the results differ by up to 11% from the TPS for both hollow and solid probes. Solid probe results are lower than the hollow probe by up to 13%. Helical TomoTherapy delivers dose from all angles, leading to an attenuation of the beam through the solid probe for a specific angle range. From these results it can be seen that the solid Perspex probe is more reliable than the hollow probe as a tool to give an indication of absorbed dose to the anterior rectal wall during treatment.
DISCUSSION & CONCLUSIONS: The discrepancies observed could be due to a combination of positional errors and uncertainties in the TPS data dose readings due to the large variation in dose between each voxel on the CT dataset around the area of the detectors, which were located in regions of steep dose gradients. A solid Rectafix probe coupled with an array of MOSkin detectors would be a useful tool for real time in vivo measurements of the rectal doses during helical TomoTherapy treatments of the prostate.
REFERENCES: 1. AB Mimator, Mälarvägen 8, SE-756 53 UPPSALA, Sweden. 2. U. Isacsson et al. Acta Oncologica, vol. 49, no. 4, pp. 500–505, 2010. 3. S. Johansson et al. Prostate Cancer, vol. 2012, pp. 1–14, 2012.
EPSM-1173 Tue 5th Nov 16:45 Golden Ballroom South Radiotherapy
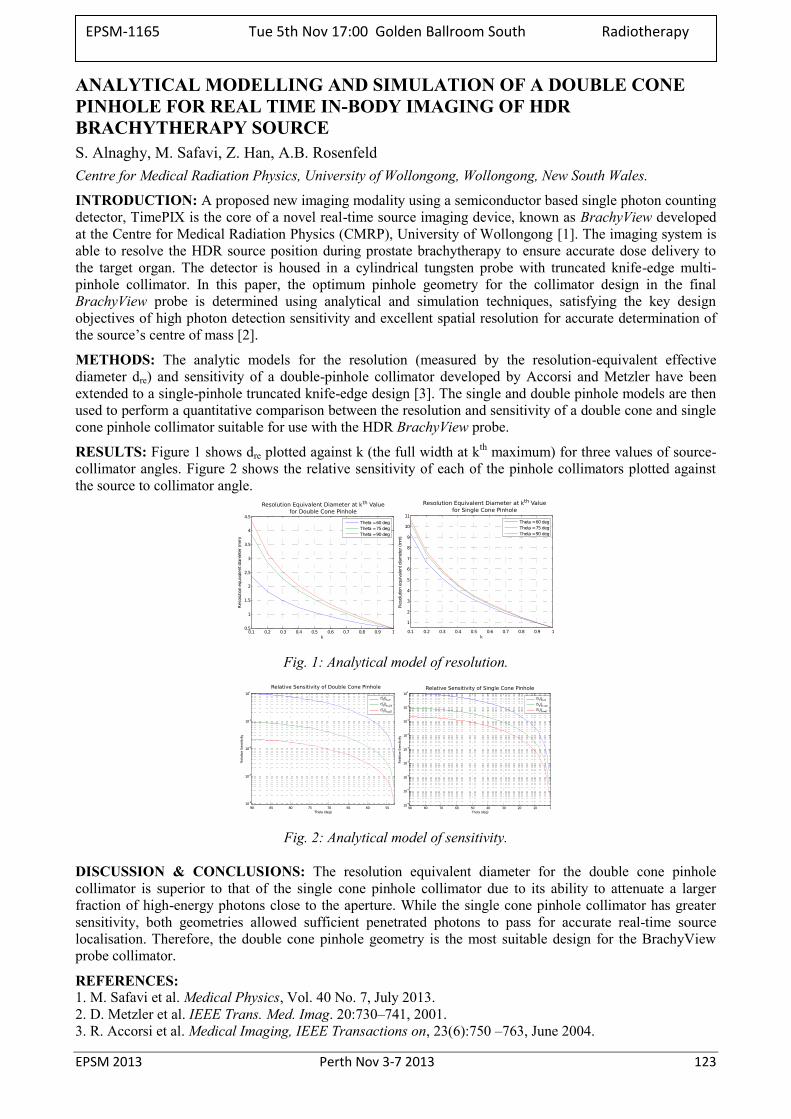
EPSM 2013 Perth Nov 3-7 2013 123
ANALYTICAL MODELLING AND SIMULATION OF A DOUBLE CONE PINHOLE FOR REAL TIME IN-BODY IMAGING OF HDR BRACHYTHERAPY SOURCE S. Alnaghy, M. Safavi, Z. Han, A.B. Rosenfeld Centre for Medical Radiation Physics, University of Wollongong, Wollongong, New South Wales.
INTRODUCTION: A proposed new imaging modality using a semiconductor based single photon counting detector, TimePIX is the core of a novel real-time source imaging device, known as BrachyView developed at the Centre for Medical Radiation Physics (CMRP), University of Wollongong [1]. The imaging system is able to resolve the HDR source position during prostate brachytherapy to ensure accurate dose delivery to the target organ. The detector is housed in a cylindrical tungsten probe with truncated knife-edge multi-pinhole collimator. In this paper, the optimum pinhole geometry for the collimator design in the final BrachyView probe is determined using analytical and simulation techniques, satisfying the key design objectives of high photon detection sensitivity and excellent spatial resolution for accurate determination of the source’s centre of mass [2].
METHODS: The analytic models for the resolution (measured by the resolution-equivalent effective diameter dre) and sensitivity of a double-pinhole collimator developed by Accorsi and Metzler have been extended to a single-pinhole truncated knife-edge design [3]. The single and double pinhole models are then used to perform a quantitative comparison between the resolution and sensitivity of a double cone and single cone pinhole collimator suitable for use with the HDR BrachyView probe.
RESULTS: Figure 1 shows dre plotted against k (the full width at kth maximum) for three values of source-collimator angles. Figure 2 shows the relative sensitivity of each of the pinhole collimators plotted against the source to collimator angle.
Fig. 1: Analytical model of resolution.
Fig. 2: Analytical model of sensitivity.
DISCUSSION & CONCLUSIONS: The resolution equivalent diameter for the double cone pinhole collimator is superior to that of the single cone pinhole collimator due to its ability to attenuate a larger fraction of high-energy photons close to the aperture. While the single cone pinhole collimator has greater sensitivity, both geometries allowed sufficient penetrated photons to pass for accurate real-time source localisation. Therefore, the double cone pinhole geometry is the most suitable design for the BrachyView probe collimator.
REFERENCES: 1. M. Safavi et al. Medical Physics, Vol. 40 No. 7, July 2013. 2. D. Metzler et al. IEEE Trans. Med. Imag. 20:730–741, 2001. 3. R. Accorsi et al. Medical Imaging, IEEE Transactions on, 23(6):750 –763, June 2004.
EPSM-1165 Tue 5th Nov 17:00 Golden Ballroom South Radiotherapy
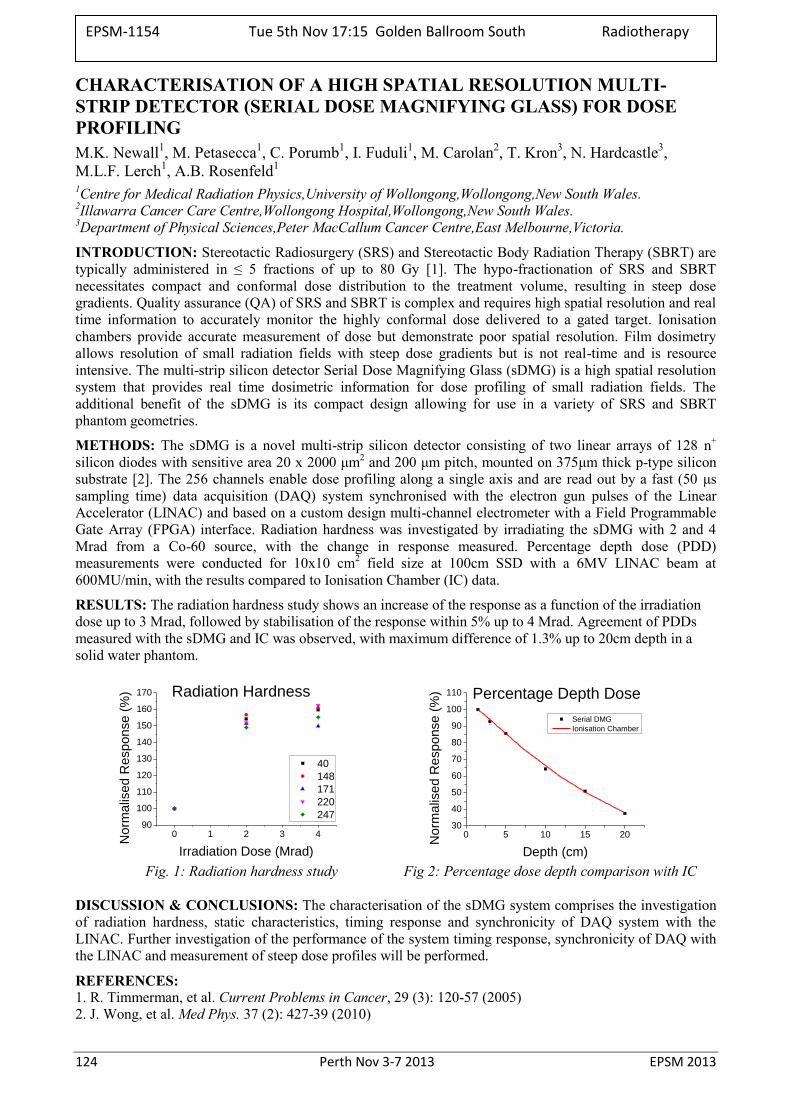
124 Perth Nov 3-7 2013 EPSM 2013
CHARACTERISATION OF A HIGH SPATIAL RESOLUTION MULTI-STRIP DETECTOR (SERIAL DOSE MAGNIFYING GLASS) FOR DOSE PROFILING M.K. Newall1, M. Petasecca1, C. Porumb1, I. Fuduli1, M. Carolan2, T. Kron3, N. Hardcastle3, M.L.F. Lerch1, A.B. Rosenfeld1 1Centre for Medical Radiation Physics,University of Wollongong,Wollongong,New South Wales.
2Illawarra Cancer Care Centre,Wollongong Hospital,Wollongong,New South Wales. 3Department of Physical Sciences,Peter MacCallum Cancer Centre,East Melbourne,Victoria.
INTRODUCTION: Stereotactic Radiosurgery (SRS) and Stereotactic Body Radiation Therapy (SBRT) are typically administered in ≤ 5 fractions of up to 80 Gy [1]. The hypo-fractionation of SRS and SBRT necessitates compact and conformal dose distribution to the treatment volume, resulting in steep dose gradients. Quality assurance (QA) of SRS and SBRT is complex and requires high spatial resolution and real time information to accurately monitor the highly conformal dose delivered to a gated target. Ionisation chambers provide accurate measurement of dose but demonstrate poor spatial resolution. Film dosimetry allows resolution of small radiation fields with steep dose gradients but is not real-time and is resource intensive. The multi-strip silicon detector Serial Dose Magnifying Glass (sDMG) is a high spatial resolution system that provides real time dosimetric information for dose profiling of small radiation fields. The additional benefit of the sDMG is its compact design allowing for use in a variety of SRS and SBRT phantom geometries.
METHODS: The sDMG is a novel multi-strip silicon detector consisting of two linear arrays of 128 n+ silicon diodes with sensitive area 20 x 2000 μm2 and 200 μm pitch, mounted on 375μm thick p-type silicon substrate [2]. The 256 channels enable dose profiling along a single axis and are read out by a fast (50 μs sampling time) data acquisition (DAQ) system synchronised with the electron gun pulses of the Linear Accelerator (LINAC) and based on a custom design multi-channel electrometer with a Field Programmable Gate Array (FPGA) interface. Radiation hardness was investigated by irradiating the sDMG with 2 and 4 Mrad from a Co-60 source, with the change in response measured. Percentage depth dose (PDD) measurements were conducted for 10x10 cm2 field size at 100cm SSD with a 6MV LINAC beam at 600MU/min, with the results compared to Ionisation Chamber (IC) data.
RESULTS: The radiation hardness study shows an increase of the response as a function of the irradiation dose up to 3 Mrad, followed by stabilisation of the response within 5% up to 4 Mrad. Agreement of PDDs measured with the sDMG and IC was observed, with maximum difference of 1.3% up to 20cm depth in a solid water phantom.
0 1 2 3 490
100
110
120
130
140
150
160
170
40
148
171
220
247
No
rma
lise
d R
esp
on
se
(%
)
Irradiation Dose (Mrad)
Radiation Hardness
0 5 10 15 20
30
40
50
60
70
80
90
100
110
Norm
alis
ed R
esponse (
%)
Depth (cm)
Serial DMG
Ionisation Chamber
Percentage Depth Dose
Fig. 1: Radiation hardness study Fig 2: Percentage dose depth comparison with IC
DISCUSSION & CONCLUSIONS: The characterisation of the sDMG system comprises the investigation of radiation hardness, static characteristics, timing response and synchronicity of DAQ system with the LINAC. Further investigation of the performance of the system timing response, synchronicity of DAQ with the LINAC and measurement of steep dose profiles will be performed.
REFERENCES: 1. R. Timmerman, et al. Current Problems in Cancer, 29 (3): 120-57 (2005) 2. J. Wong, et al. Med Phys. 37 (2): 427-39 (2010)
EPSM-1154 Tue 5th Nov 17:15 Golden Ballroom South Radiotherapy
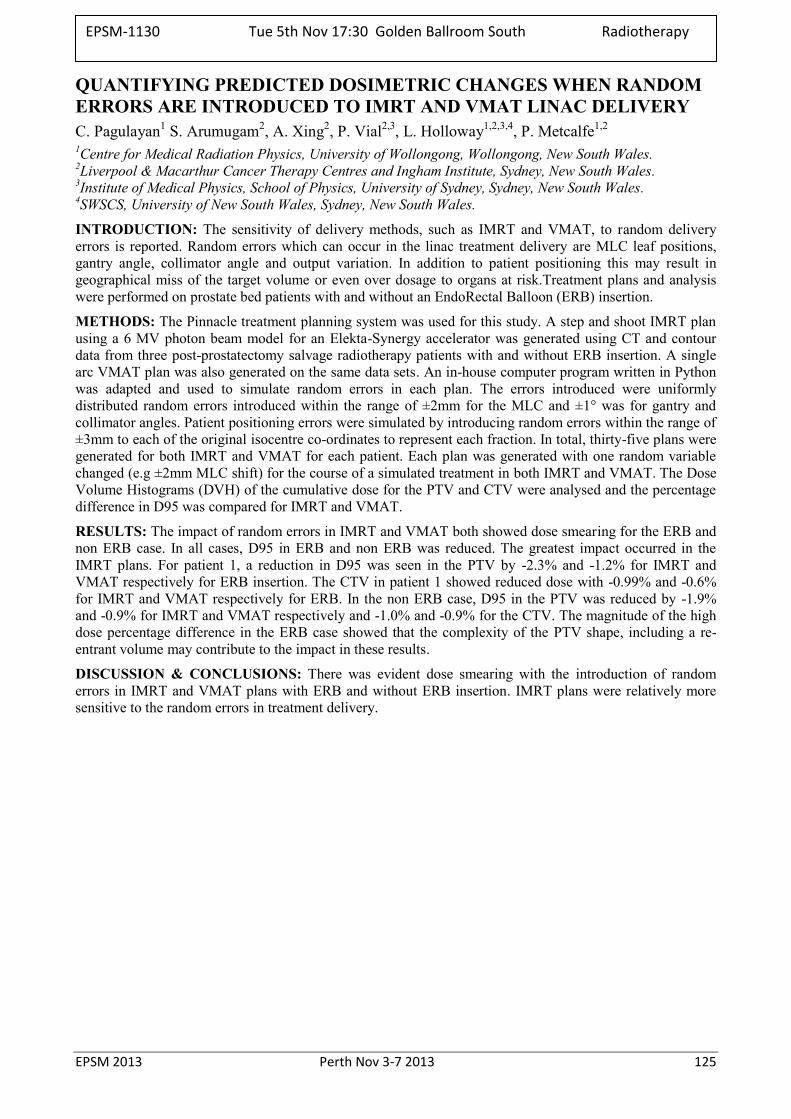
EPSM 2013 Perth Nov 3-7 2013 125
QUANTIFYING PREDICTED DOSIMETRIC CHANGES WHEN RANDOM ERRORS ARE INTRODUCED TO IMRT AND VMAT LINAC DELIVERY C. Pagulayan1 S. Arumugam2, A. Xing2, P. Vial2,3, L. Holloway1,2,3,4, P. Metcalfe1,2 1Centre for Medical Radiation Physics, University of Wollongong, Wollongong, New South Wales. 2Liverpool & Macarthur Cancer Therapy Centres and Ingham Institute, Sydney, New South Wales. 3Institute of Medical Physics, School of Physics, University of Sydney, Sydney, New South Wales. 4SWSCS, University of New South Wales, Sydney, New South Wales.
INTRODUCTION: The sensitivity of delivery methods, such as IMRT and VMAT, to random delivery errors is reported. Random errors which can occur in the linac treatment delivery are MLC leaf positions, gantry angle, collimator angle and output variation. In addition to patient positioning this may result in geographical miss of the target volume or even over dosage to organs at risk.Treatment plans and analysis were performed on prostate bed patients with and without an EndoRectal Balloon (ERB) insertion.
METHODS: The Pinnacle treatment planning system was used for this study. A step and shoot IMRT plan using a 6 MV photon beam model for an Elekta-Synergy accelerator was generated using CT and contour data from three post-prostatectomy salvage radiotherapy patients with and without ERB insertion. A single arc VMAT plan was also generated on the same data sets. An in-house computer program written in Python was adapted and used to simulate random errors in each plan. The errors introduced were uniformly distributed random errors introduced within the range of ±2mm for the MLC and ±1° was for gantry and collimator angles. Patient positioning errors were simulated by introducing random errors within the range of ±3mm to each of the original isocentre co-ordinates to represent each fraction. In total, thirty-five plans were generated for both IMRT and VMAT for each patient. Each plan was generated with one random variable changed (e.g ±2mm MLC shift) for the course of a simulated treatment in both IMRT and VMAT. The Dose Volume Histograms (DVH) of the cumulative dose for the PTV and CTV were analysed and the percentage difference in D95 was compared for IMRT and VMAT.
RESULTS: The impact of random errors in IMRT and VMAT both showed dose smearing for the ERB and non ERB case. In all cases, D95 in ERB and non ERB was reduced. The greatest impact occurred in the IMRT plans. For patient 1, a reduction in D95 was seen in the PTV by -2.3% and -1.2% for IMRT and VMAT respectively for ERB insertion. The CTV in patient 1 showed reduced dose with -0.99% and -0.6% for IMRT and VMAT respectively for ERB. In the non ERB case, D95 in the PTV was reduced by -1.9% and -0.9% for IMRT and VMAT respectively and -1.0% and -0.9% for the CTV. The magnitude of the high dose percentage difference in the ERB case showed that the complexity of the PTV shape, including a re-entrant volume may contribute to the impact in these results.
DISCUSSION & CONCLUSIONS: There was evident dose smearing with the introduction of random errors in IMRT and VMAT plans with ERB and without ERB insertion. IMRT plans were relatively more sensitive to the random errors in treatment delivery.
EPSM-1130 Tue 5th Nov 17:30 Golden Ballroom South Radiotherapy
126 Perth Nov 3-7 2013 EPSM 2013
QUANTITATIVE ANALYSIS OF VARIOUS SINGLE SEQUENCE MR IMAGING PLANES FOR HDR BRACHYTHERAPY TREATMENT PLANNING OF CERVIX CANCER C. Dempsey1,2, J. Arm3, A. Capp1,4, G. Govindarajulu1, P. O’Brien1,4 1Department of Radiation Oncology, Calvary Mater Newcastle Hospital, Newcastle, Australia. 2School of Health Sciences, University of Newcastle, Newcastle, Australia. 3Hunter New England Imaging, Newcastle, Australia. 4School of Medicine and Public Health, University of Newcastle, Newcastle, Australia.
INTRODUCTION: Currently, magnetic resonance (MR) imaging can easily be incorporated into a high dose rate (HDR) brachytherapy treatment plan due to the lack of inhomogeneity correction in commercial treatment planning systems. This allows a vast improvement to visualise the target tissue than traditional CT-based planning methods and introduces the ability to optimise dose to a planning target volume (PTV) rather than customary geometrical dose points.
AIM: To determine the most favorable single magnetic resonance (MR) imaging sequence for 3D planning of HDR brachytherapy treatments. Emphasis was placed on generating a single image set in order to reduce scanning time and motion artifacts. The optimal image set could then be used for contouring the tumour and organs at risk (OAR), for applicator reconstruction and also treatment optimization.
MATERIALS AND METHODS: A 3T (Skyra, Siemens Healthcare AG, Germany) MR imaging system with an 18 channel body matrix coil was used for generating HDR cervix brachytherapy planning images. Seven T2-weighted Turbo Spin Echo (TSE) sequences were acquired in different planes. These were based on sagittal, transverse (axial) and oblique planes tilted to correspond to the treatment applicator. Both 3D and contiguous 2D scans were considered. Slice thickness was minimised in order to produce the highest quality reconstruction in the brachytherapy treatment planning system and parallel imaging techniques were employed to reduce the scan duration to acceptable limits. Each image set was assessed for total scanning time, applicator visualisation and usefulness in tumour localization. Tumour visualisation was compared via quantitative analysis of high-risk clinical target volumes (HR CTVs) contoured in the treatment planning system by 3 different brachytherapy Radiation Oncologists.
RESULTS: Inter-observer HR CTV consistency was generally poor, with the average standard deviation of contoured HR CTV volumes exceeding 29%. The preferred primary imaging plane was determined to be axial rather than sagittal for the ease of imaging handling for planning purposes. The intra-observer difference in HR CTV volumes between 2D and 3D axial image sets was low at an average of 6% standard deviation for each observer. A 2D axial ‘double oblique’ (oriented both in the plane of the intrauterine tube (ant-post) and the tandem or ring (laterally)) sequence was found to produce the best inter-observer consistency (10% standard deviation) and also required the least image manipulation.
CONCLUSION: A contiguous 2D sequence based on an axial T2-weighted turbo-spin-echo (TSE) sequence that is orientated in the plane of the treatment applicator (axial double oblique) was found to be the most useful in allowing accurate tumour and OAR determination whilst allowing applicator reconstruction and treatment optimisation. The ability to contour in the same image plane as the applicator without having to manually adjust the image set in the treatment planning system was an additional benefit. By using this sequence, any inconsistencies due to patient motion between imaging series, can be eliminated.
EPSM-1094 Tue 5th Nov 16:00 Golden Ballroom North Radiotherapy
EPSM 2013 Perth Nov 3-7 2013 127
VERIFICATION OF ROPES I-125 EYE PLAQUES WITH TLD-100 MICRO-CUBES K. Kandasamy, J. Poder, S. Fisher Department of Radiation Oncology, Prince of Wales Hospital, Sydney, New South Wales.
INTRODUCTION: I-125 ROPES eye plaques are routinely used at the Prince of Wales hospital in the treatment of choroidal melanoma. Depending on the size of the tumour, the prescription dose to the tumour apex is delivered using 10, 15 or 18 mm diameter plaques loaded with 4, 10 or 14 Iodine-125 model 6711 OncuraSeeds (Oncura, Arlington Heights, IL, USA). These seeds are either of the same activity or of a combination of activities arranged around the plaque in a set orientation. Current international recommendations for patient specific QA requires the eye plaques to be checked visually prior to insertion [1]. However this does not provide any dosimetric verification as seeds of varying activity are identical upon visual inspection.
The aim of this investigation is to develop a TLD based pre-implant QA test to detect potential eye plaque packing errors. Dosimetric verification is of particular importance when a combination of seed activities is used to achieve the desired doses in the larger plaques. The feasibility of using TLD micro-cubes to measure the dose to a prescription point is tested in this study.
METHODS: A ROPES 15mm eye plaque was loaded with ten I-125 seeds. The plaque was packed and placed upon an in-house designed eye phantom constructed of Solid WaterTM RMI 457 (Gammex-RMI, Nottingham, UK). The phantom was then placed atop of a Solid Water block containing a single TLD-100 micro-cube (Thermo Fisher Scientific, Waltham, MA, USA), with the top surface of the TLD positioned at a depth of 4 mm. Multiple packing arrangements using a combination of different seed activities were tested. The measurements were repeated three times for each packing arrangement. The plaques were left on the TLDs for approximately 1-2 hrs depending on the activity and combination of seeds. The micro-cubes were calibrated using an x-ray beam of 75 kVp, and effective energy of 30 keV, which is comparable to the 28.37 keV weighted mean energy of the model 6711 I-125 seed.
The BEBIG Plaque Simulator planning system (Eckert & Ziegler BEBIG, Berlin, Germany) was used to calculate the dose delivered at the depth of the TLD for the loading patterns tested. The start and finish times for the measurements were recorded and entered into the TPS. The reporting point of the calculation was set at 4.5 mm depth in the eye to correct for the 0.5 mm effective depth of the micro-cubes. The TPS calculations were then compared against the micro-cube measurements.
RESULTS: The TPS calculations showed the TLDs had been irradiated with doses in the range of 120 - 250 cGy. Solid Water is known to underestimate the dose to water by 4.3 % [2]. Applying a correction factor for the Solid Water to the measurements, the mean absolute percentage deviation between the TPS calculations and the TLD measurements was 2.5%. The largest deviation was 14 cGy (5.3%).
DISCUSSION & CONCLUSIONS: The preliminary results indicate TLD Micro-cubes are a viable and expedient method for verifying dose under an I-125 eye plaque. The ability to use this phantom setup to detect gross errors in seed selection during plaque packing has been verified. Further investigation into reducing exposure time, methods of maintaining a sterile work environment and the effects positional accuracy and incorrect placement of the seeds within the plaque should be conducted prior to the adoption of this technique as routine quality assurance check.
REFERENCES: 1. S. Chui-Tsao, M.A. Astrahan, P.T. Finger, “Dosimetry of I-125 and Pd-103 COMS eye plaques for intraocular tumors: Report of Task Group 129 by the AAPM and ABS,” Med. Phys. 39, 6161 (2012). 2. J.F. Williamson, "Comparison of measured and calculated dose rates in water near I-125 and Ir-192 seeds," Med. Phys. 18, 776-786 (1991)
EPSM-1170 Tue 5th Nov 16:15 Golden Ballroom North Radiotherapy
128 Perth Nov 3-7 2013 EPSM 2013
THE CURRENT STATE OF AUSTRALASIAN MRI-BASED TREATMENT PLANNING FOR HDR BRACHYTHERAPY OF CERVIX CANCER AND COMPARISON WITH INTERNATIONAL CLINICAL DATA C. Dempsey1,2, S. Dempsey2, C. Kirisits3 1Department of Radiation Oncology, Calvary Mater Newcastle Hospital, Newcastle, NSW, Australia. 2School of Health Sciences, University of Newcastle, NSW, Australia. 3Department of Radiation Oncology, Medical University of Vienna, Austria.
INTRODUCTION: In the past decade, the evolution of high dose rate (HDR) brachytherapy treatment planning has progressed from using 2-dimensional, digitised radiographs with point dose prescriptions, to 3-dimensional, image-guided, volume-based dose prescriptions. Recommendations and protocols arising from both Europe and the US has driven these shifts, and international clinical trials are currently being conducted to provide greater data in order to evaluate the effectiveness of these new systems. The largest study currently being undertaken is the EMBRACE study, with over 900 registered patients, in conjunction with retroEMBRACE (with 796 patient data sets collected). Unfortunately there are no centres from Australasia that are participating within these studies.
PRIMARY OBJECTIVE: To survey Australasian centres in order to determine what proportion of these are using magnetic resonance imaging (MRI) for HDR brachytherapy treatment planning of cervix cancer, and to compare dose-volume histogram (DVH) data for several patients from each of these centres with that of the EMBRACE and retroEMBRACE patient cohort.
METHODS: Each centre that agreed to complete the survey was asked to provide prescription information and clinical DVH data sets incorporating the high-risk clinical target volume (HR CTV), bladder and rectum for 5 de-identified patients.
Volumes, prescriptions and dose indices as included in the EMBRACE study, were calculated and compared within single centres, across all Australasian centres and also with data generated by the EMBRACE and retroEMBRACE group.
DISCUSSION & CONCLUSIONS: Quality improvement in HDR brachytherapy incorporates validation of new treatment regimes through analysis and comparison of both past (retroEMBRACE) and present (EMBRACE) patient outcomes. The health system in Australasia has similarities with both the European and North American structures, however there are also distinct differences. It is important that clinical audits are conducted that reflect not only a world-wide perspective but also incorporates local facilities and protocols. This study will provide a summary of Australasian treatment practices with the bigger-picture being compared with international observations. This can then be used to help generate recommendations that adhere to international guidelines but suit local conditions.
ACKNOWLEDGEMENTS: This work has had ethics approval through the University of Newcastle.
EPSM-1062 Tue 5th Nov 16:30 Golden Ballroom North Radiotherapy
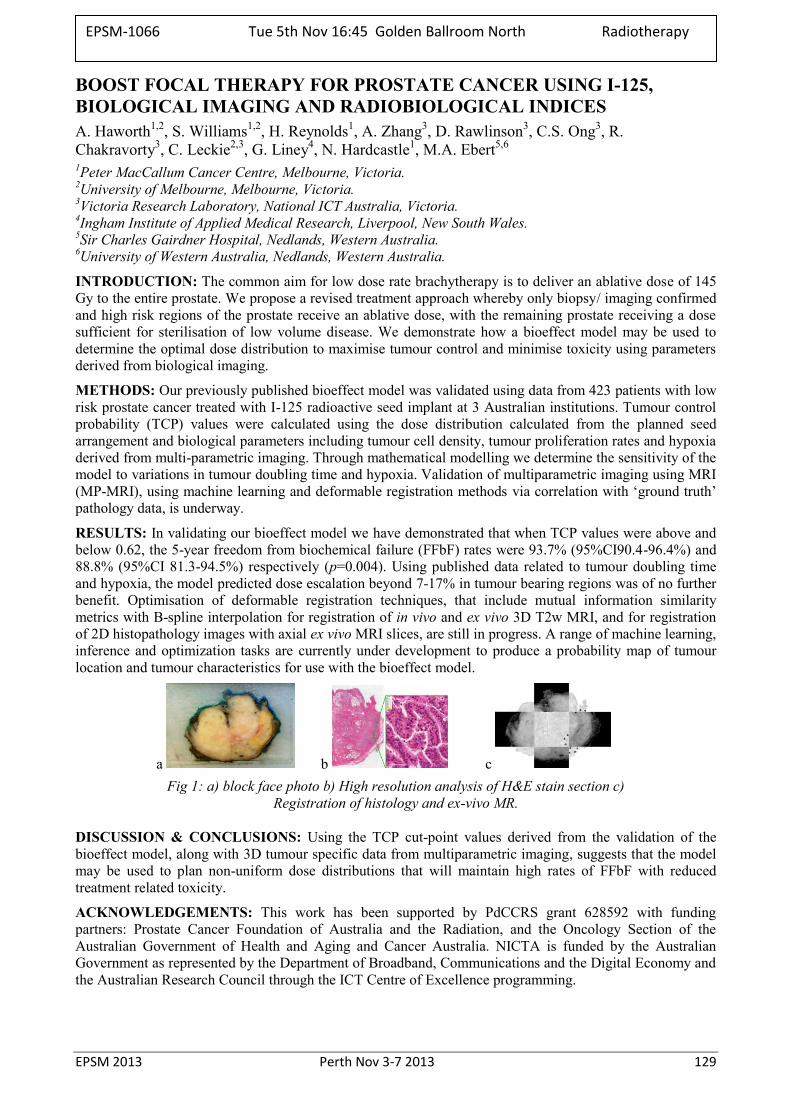
EPSM 2013 Perth Nov 3-7 2013 129
BOOST FOCAL THERAPY FOR PROSTATE CANCER USING I-125, BIOLOGICAL IMAGING AND RADIOBIOLOGICAL INDICES A. Haworth1,2, S. Williams1,2, H. Reynolds1, A. Zhang3, D. Rawlinson3, C.S. Ong3, R. Chakravorty3, C. Leckie2,3, G. Liney4, N. Hardcastle1, M.A. Ebert5,6 1Peter MacCallum Cancer Centre, Melbourne, Victoria. 2University of Melbourne, Melbourne, Victoria. 3Victoria Research Laboratory, National ICT Australia, Victoria. 4Ingham Institute of Applied Medical Research, Liverpool, New South Wales. 5Sir Charles Gairdner Hospital, Nedlands, Western Australia. 6University of Western Australia, Nedlands, Western Australia.
INTRODUCTION: The common aim for low dose rate brachytherapy is to deliver an ablative dose of 145 Gy to the entire prostate. We propose a revised treatment approach whereby only biopsy/ imaging confirmed and high risk regions of the prostate receive an ablative dose, with the remaining prostate receiving a dose sufficient for sterilisation of low volume disease. We demonstrate how a bioeffect model may be used to determine the optimal dose distribution to maximise tumour control and minimise toxicity using parameters derived from biological imaging.
METHODS: Our previously published bioeffect model was validated using data from 423 patients with low risk prostate cancer treated with I-125 radioactive seed implant at 3 Australian institutions. Tumour control probability (TCP) values were calculated using the dose distribution calculated from the planned seed arrangement and biological parameters including tumour cell density, tumour proliferation rates and hypoxia derived from multi-parametric imaging. Through mathematical modelling we determine the sensitivity of the model to variations in tumour doubling time and hypoxia. Validation of multiparametric imaging using MRI (MP-MRI), using machine learning and deformable registration methods via correlation with ‘ground truth’ pathology data, is underway.
RESULTS: In validating our bioeffect model we have demonstrated that when TCP values were above and below 0.62, the 5-year freedom from biochemical failure (FFbF) rates were 93.7% (95%CI90.4-96.4%) and 88.8% (95%CI 81.3-94.5%) respectively (p=0.004). Using published data related to tumour doubling time and hypoxia, the model predicted dose escalation beyond 7-17% in tumour bearing regions was of no further benefit. Optimisation of deformable registration techniques, that include mutual information similarity metrics with B-spline interpolation for registration of in vivo and ex vivo 3D T2w MRI, and for registration of 2D histopathology images with axial ex vivo MRI slices, are still in progress. A range of machine learning, inference and optimization tasks are currently under development to produce a probability map of tumour location and tumour characteristics for use with the bioeffect model.
a b c Fig 1: a) block face photo b) High resolution analysis of H&E stain section c)
Registration of histology and ex-vivo MR.
DISCUSSION & CONCLUSIONS: Using the TCP cut-point values derived from the validation of the bioeffect model, along with 3D tumour specific data from multiparametric imaging, suggests that the model may be used to plan non-uniform dose distributions that will maintain high rates of FFbF with reduced treatment related toxicity.
ACKNOWLEDGEMENTS: This work has been supported by PdCCRS grant 628592 with funding partners: Prostate Cancer Foundation of Australia and the Radiation, and the Oncology Section of the Australian Government of Health and Aging and Cancer Australia. NICTA is funded by the Australian Government as represented by the Department of Broadband, Communications and the Digital Economy and the Australian Research Council through the ICT Centre of Excellence programming.
EPSM-1066 Tue 5th Nov 16:45 Golden Ballroom North Radiotherapy
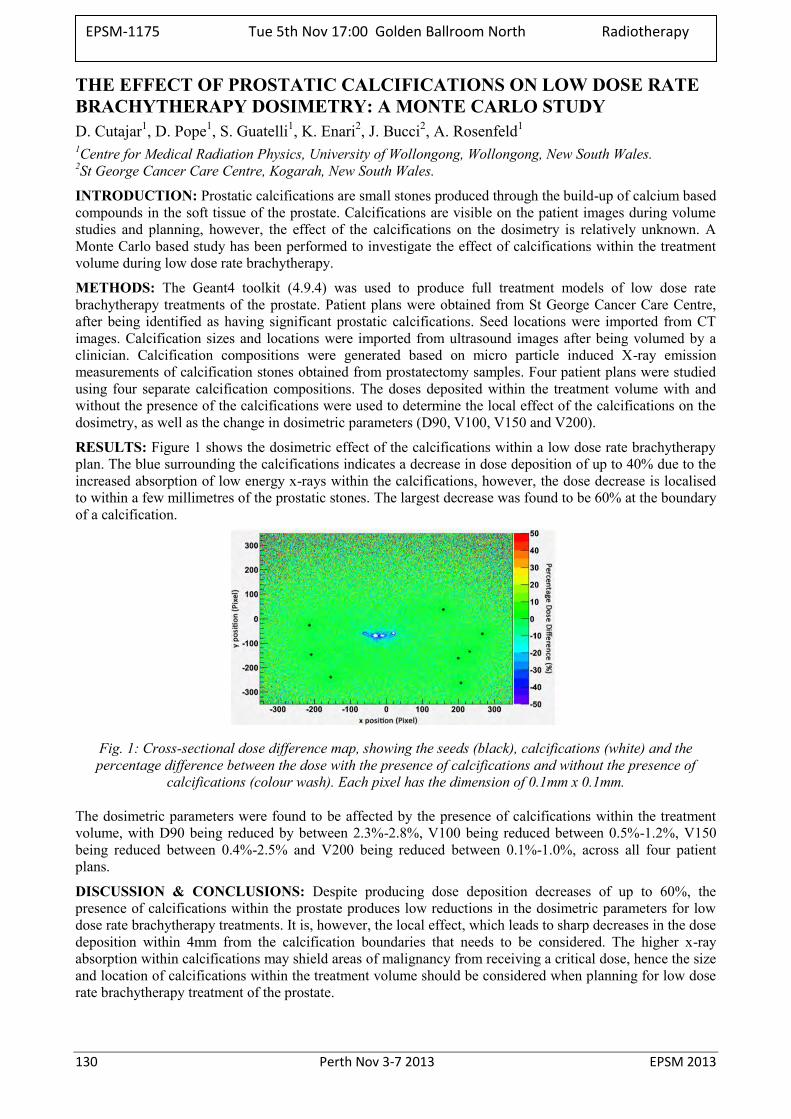
130 Perth Nov 3-7 2013 EPSM 2013
THE EFFECT OF PROSTATIC CALCIFICATIONS ON LOW DOSE RATE BRACHYTHERAPY DOSIMETRY: A MONTE CARLO STUDY D. Cutajar1, D. Pope1, S. Guatelli1, K. Enari2, J. Bucci2, A. Rosenfeld1 1Centre for Medical Radiation Physics, University of Wollongong, Wollongong, New South Wales. 2St George Cancer Care Centre, Kogarah, New South Wales.
INTRODUCTION: Prostatic calcifications are small stones produced through the build-up of calcium based compounds in the soft tissue of the prostate. Calcifications are visible on the patient images during volume studies and planning, however, the effect of the calcifications on the dosimetry is relatively unknown. A Monte Carlo based study has been performed to investigate the effect of calcifications within the treatment volume during low dose rate brachytherapy.
METHODS: The Geant4 toolkit (4.9.4) was used to produce full treatment models of low dose rate brachytherapy treatments of the prostate. Patient plans were obtained from St George Cancer Care Centre, after being identified as having significant prostatic calcifications. Seed locations were imported from CT images. Calcification sizes and locations were imported from ultrasound images after being volumed by a clinician. Calcification compositions were generated based on micro particle induced X-ray emission measurements of calcification stones obtained from prostatectomy samples. Four patient plans were studied using four separate calcification compositions. The doses deposited within the treatment volume with and without the presence of the calcifications were used to determine the local effect of the calcifications on the dosimetry, as well as the change in dosimetric parameters (D90, V100, V150 and V200).
RESULTS: Figure 1 shows the dosimetric effect of the calcifications within a low dose rate brachytherapy plan. The blue surrounding the calcifications indicates a decrease in dose deposition of up to 40% due to the increased absorption of low energy x-rays within the calcifications, however, the dose decrease is localised to within a few millimetres of the prostatic stones. The largest decrease was found to be 60% at the boundary of a calcification.
Fig. 1: Cross-sectional dose difference map, showing the seeds (black), calcifications (white) and the percentage difference between the dose with the presence of calcifications and without the presence of
calcifications (colour wash). Each pixel has the dimension of 0.1mm x 0.1mm.
The dosimetric parameters were found to be affected by the presence of calcifications within the treatment volume, with D90 being reduced by between 2.3%-2.8%, V100 being reduced between 0.5%-1.2%, V150 being reduced between 0.4%-2.5% and V200 being reduced between 0.1%-1.0%, across all four patient plans.
DISCUSSION & CONCLUSIONS: Despite producing dose deposition decreases of up to 60%, the presence of calcifications within the prostate produces low reductions in the dosimetric parameters for low dose rate brachytherapy treatments. It is, however, the local effect, which leads to sharp decreases in the dose deposition within 4mm from the calcification boundaries that needs to be considered. The higher x-ray absorption within calcifications may shield areas of malignancy from receiving a critical dose, hence the size and location of calcifications within the treatment volume should be considered when planning for low dose rate brachytherapy treatment of the prostate.
EPSM-1175 Tue 5th Nov 17:00 Golden Ballroom North Radiotherapy
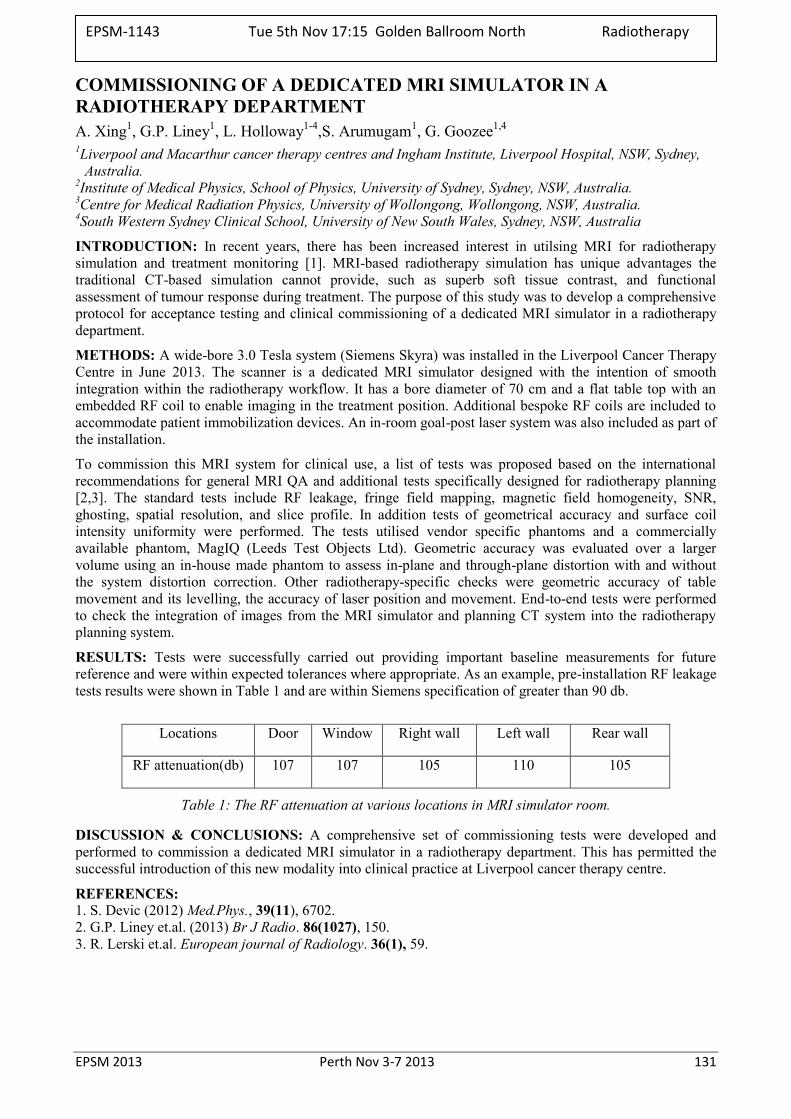
EPSM 2013 Perth Nov 3-7 2013 131
COMMISSIONING OF A DEDICATED MRI SIMULATOR IN A RADIOTHERAPY DEPARTMENT A. Xing1, G.P. Liney1, L. Holloway1-4,S. Arumugam1, G. Goozee1,4 1Liverpool and Macarthur cancer therapy centres and Ingham Institute, Liverpool Hospital, NSW, Sydney,
Australia. 2Institute of Medical Physics, School of Physics, University of Sydney, Sydney, NSW, Australia. 3Centre for Medical Radiation Physics, University of Wollongong, Wollongong, NSW, Australia. 4South Western Sydney Clinical School, University of New South Wales, Sydney, NSW, Australia
INTRODUCTION: In recent years, there has been increased interest in utilsing MRI for radiotherapy simulation and treatment monitoring [1]. MRI-based radiotherapy simulation has unique advantages the traditional CT-based simulation cannot provide, such as superb soft tissue contrast, and functional assessment of tumour response during treatment. The purpose of this study was to develop a comprehensive protocol for acceptance testing and clinical commissioning of a dedicated MRI simulator in a radiotherapy department.
METHODS: A wide-bore 3.0 Tesla system (Siemens Skyra) was installed in the Liverpool Cancer Therapy Centre in June 2013. The scanner is a dedicated MRI simulator designed with the intention of smooth integration within the radiotherapy workflow. It has a bore diameter of 70 cm and a flat table top with an embedded RF coil to enable imaging in the treatment position. Additional bespoke RF coils are included to accommodate patient immobilization devices. An in-room goal-post laser system was also included as part of the installation.
To commission this MRI system for clinical use, a list of tests was proposed based on the international recommendations for general MRI QA and additional tests specifically designed for radiotherapy planning [2,3]. The standard tests include RF leakage, fringe field mapping, magnetic field homogeneity, SNR, ghosting, spatial resolution, and slice profile. In addition tests of geometrical accuracy and surface coil intensity uniformity were performed. The tests utilised vendor specific phantoms and a commercially available phantom, MagIQ (Leeds Test Objects Ltd). Geometric accuracy was evaluated over a larger volume using an in-house made phantom to assess in-plane and through-plane distortion with and without the system distortion correction. Other radiotherapy-specific checks were geometric accuracy of table movement and its levelling, the accuracy of laser position and movement. End-to-end tests were performed to check the integration of images from the MRI simulator and planning CT system into the radiotherapy planning system.
RESULTS: Tests were successfully carried out providing important baseline measurements for future reference and were within expected tolerances where appropriate. As an example, pre-installation RF leakage tests results were shown in Table 1 and are within Siemens specification of greater than 90 db.
Locations Door Window Right wall Left wall Rear wall
RF attenuation(db) 107 107 105 110 105
Table 1: The RF attenuation at various locations in MRI simulator room.
DISCUSSION & CONCLUSIONS: A comprehensive set of commissioning tests were developed and performed to commission a dedicated MRI simulator in a radiotherapy department. This has permitted the successful introduction of this new modality into clinical practice at Liverpool cancer therapy centre.
REFERENCES: 1. S. Devic (2012) Med.Phys., 39(11), 6702. 2. G.P. Liney et.al. (2013) Br J Radio. 86(1027), 150. 3. R. Lerski et.al. European journal of Radiology. 36(1), 59.
EPSM-1143 Tue 5th Nov 17:15 Golden Ballroom North Radiotherapy
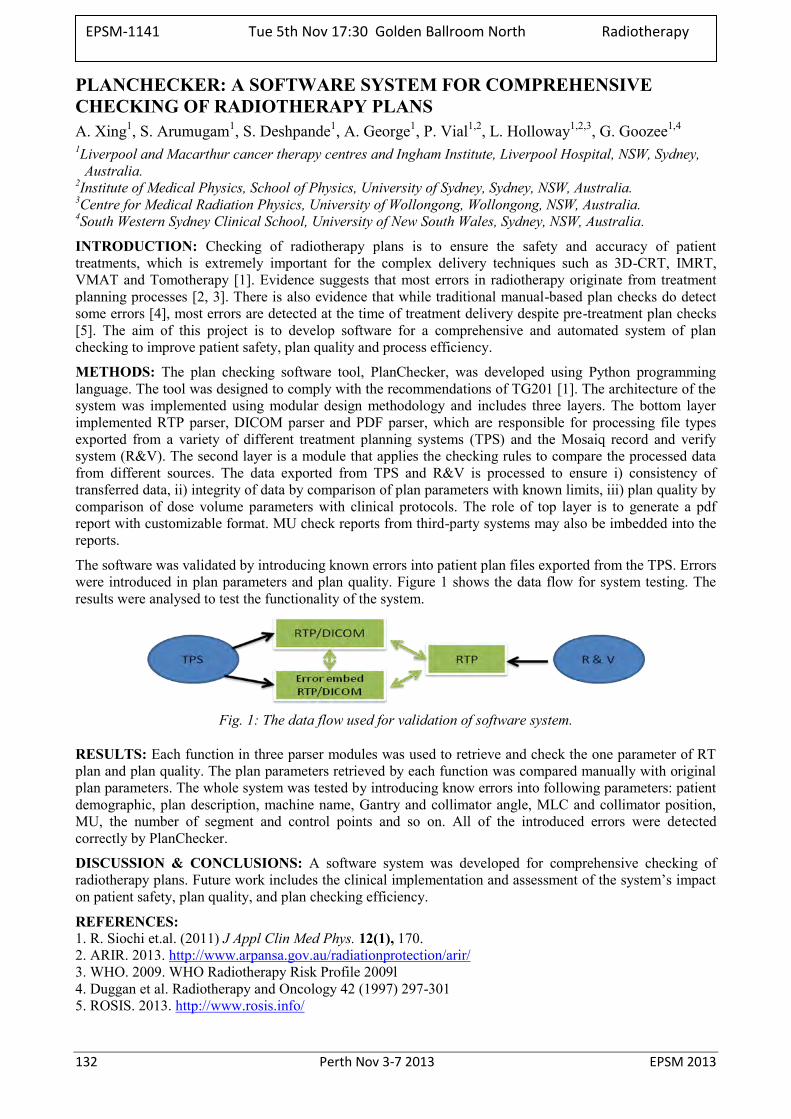
132 Perth Nov 3-7 2013 EPSM 2013
PLANCHECKER: A SOFTWARE SYSTEM FOR COMPREHENSIVE CHECKING OF RADIOTHERAPY PLANS A. Xing1, S. Arumugam1, S. Deshpande1, A. George1, P. Vial1,2, L. Holloway1,2,3, G. Goozee1,4 1Liverpool and Macarthur cancer therapy centres and Ingham Institute, Liverpool Hospital, NSW, Sydney,
Australia. 2Institute of Medical Physics, School of Physics, University of Sydney, Sydney, NSW, Australia. 3Centre for Medical Radiation Physics, University of Wollongong, Wollongong, NSW, Australia. 4South Western Sydney Clinical School, University of New South Wales, Sydney, NSW, Australia.
INTRODUCTION: Checking of radiotherapy plans is to ensure the safety and accuracy of patient treatments, which is extremely important for the complex delivery techniques such as 3D-CRT, IMRT, VMAT and Tomotherapy [1]. Evidence suggests that most errors in radiotherapy originate from treatment planning processes [2, 3]. There is also evidence that while traditional manual-based plan checks do detect some errors [4], most errors are detected at the time of treatment delivery despite pre-treatment plan checks [5]. The aim of this project is to develop software for a comprehensive and automated system of plan checking to improve patient safety, plan quality and process efficiency.
METHODS: The plan checking software tool, PlanChecker, was developed using Python programming language. The tool was designed to comply with the recommendations of TG201 [1]. The architecture of the system was implemented using modular design methodology and includes three layers. The bottom layer implemented RTP parser, DICOM parser and PDF parser, which are responsible for processing file types exported from a variety of different treatment planning systems (TPS) and the Mosaiq record and verify system (R&V). The second layer is a module that applies the checking rules to compare the processed data from different sources. The data exported from TPS and R&V is processed to ensure i) consistency of transferred data, ii) integrity of data by comparison of plan parameters with known limits, iii) plan quality by comparison of dose volume parameters with clinical protocols. The role of top layer is to generate a pdf report with customizable format. MU check reports from third-party systems may also be imbedded into the reports.
The software was validated by introducing known errors into patient plan files exported from the TPS. Errors were introduced in plan parameters and plan quality. Figure 1 shows the data flow for system testing. The results were analysed to test the functionality of the system.
Fig. 1: The data flow used for validation of software system.
RESULTS: Each function in three parser modules was used to retrieve and check the one parameter of RT plan and plan quality. The plan parameters retrieved by each function was compared manually with original plan parameters. The whole system was tested by introducing know errors into following parameters: patient demographic, plan description, machine name, Gantry and collimator angle, MLC and collimator position, MU, the number of segment and control points and so on. All of the introduced errors were detected correctly by PlanChecker.
DISCUSSION & CONCLUSIONS: A software system was developed for comprehensive checking of radiotherapy plans. Future work includes the clinical implementation and assessment of the system’s impact on patient safety, plan quality, and plan checking efficiency.
REFERENCES: 1. R. Siochi et.al. (2011) J Appl Clin Med Phys. 12(1), 170. 2. ARIR. 2013. http://www.arpansa.gov.au/radiationprotection/arir/ 3. WHO. 2009. WHO Radiotherapy Risk Profile 2009l 4. Duggan et al. Radiotherapy and Oncology 42 (1997) 297-301 5. ROSIS. 2013. http://www.rosis.info/
EPSM-1141 Tue 5th Nov 17:30 Golden Ballroom North Radiotherapy
EPSM 2013 Perth Nov 3-7 2013 133
RADIATION ONCOLOGY TEAP ASSESSMENT WORKSHOP A. Perkins1, G. Warr1 1 Australasian College of Physical Scientists and Engineers in Medicine, Sydney, New South Wales
This workshop is for ROMP TEAP registrars, particularly for those who are preparing for the written, Part A or Part B examinations. Clinical supervisors and trainers are also welcome to attend.
Examiners from the Radiation Oncology Certification Panel will be present to provide tips on how to achieve success in TEAP examinations and to answer registrars’ questions. The content of the workshop will be similar to that of the TEAP Exam Preparation Workshop held at EPSM 2012.
EPSM-1262 Wed 6th Nov 07:45 Golden Ballroom North
134 Perth Nov 3-7 2013 EPSM 2013
CURRENT STATUS OF IMRT VERIFICATION IN THE UK C. Clark1,2,3, S. Zaman3, J. Cashmore4 1Royal Surrey County Hospital, Guildford. 2National Physical Laboratory. 3University of Surrey. 4Queen Elizabeth Hospital Birmingham.
The provision of IMRT in the UK has improved from around 2% of patients in 2008 to around an estimated 15% in 2012. The objective of this survey was to determine how each centre currently carries out the quality assurance (QA) processes for these IMRT treatments. For the purposes of this survey IMRT is defined as inverse planned treatments and includes linac based, Tomotherapy and Cyberknife delivery. The aim was to collect information on equipment, approach and tolerances as well as how QA approaches may change in the future. The survey was web based, however a word version was also available. Questions were divided into the following categories: Background and equipment, machine tolerance and QA, machine based verification, software based verification, future plans.
57 responses were received from 53 centres (4 centres answered separately for different systems). All centres use 6MV with 27% also using 8, 10 or 15MV. 41% use dynamic delivery, 48% use step and shoot and 35% use VMAT with 11% using Tomotherapy. 82% are limiting the numbers they treat with 45% receiving extra funding for IMRT. 42% have developed their own tests for commissioning and QA. 100% perform machine based measurements to check IMRT plans with 66% measuring both point doses and dose distributions and the main burden falling on physics staff (94%). 74% perform machine based measurements for every patient, and 49% have changed their plan based on the results of the QA measurements.
63% perform software based calculations to check IMRT plans, with 88% being point doses, 3% being dose distributions only and 9% being both. However 97% have never changed a plan based on the results of the calculated IMRT check. 73% of these calculations are performed by physicists with the remaining being undertaken by dosimetrists. 87% report that they intend to change their QA processes in the near future with 41% being who does the QA, 51% changing to a different measurement, 56% reducing the number of measurements and 41% stopping doing measurements altogether.
All centres currently include machine based measurements in their QA processes. This is time consuming, taking up to 30 minutes per patient, even when batched. The majority have already started looking at other techniques and the trend is towards reduction of measurements and sharing of workload.
EPSM-1249 Wed 6th Nov 09:00 Golden Ballroom South Diagnostic Radiology
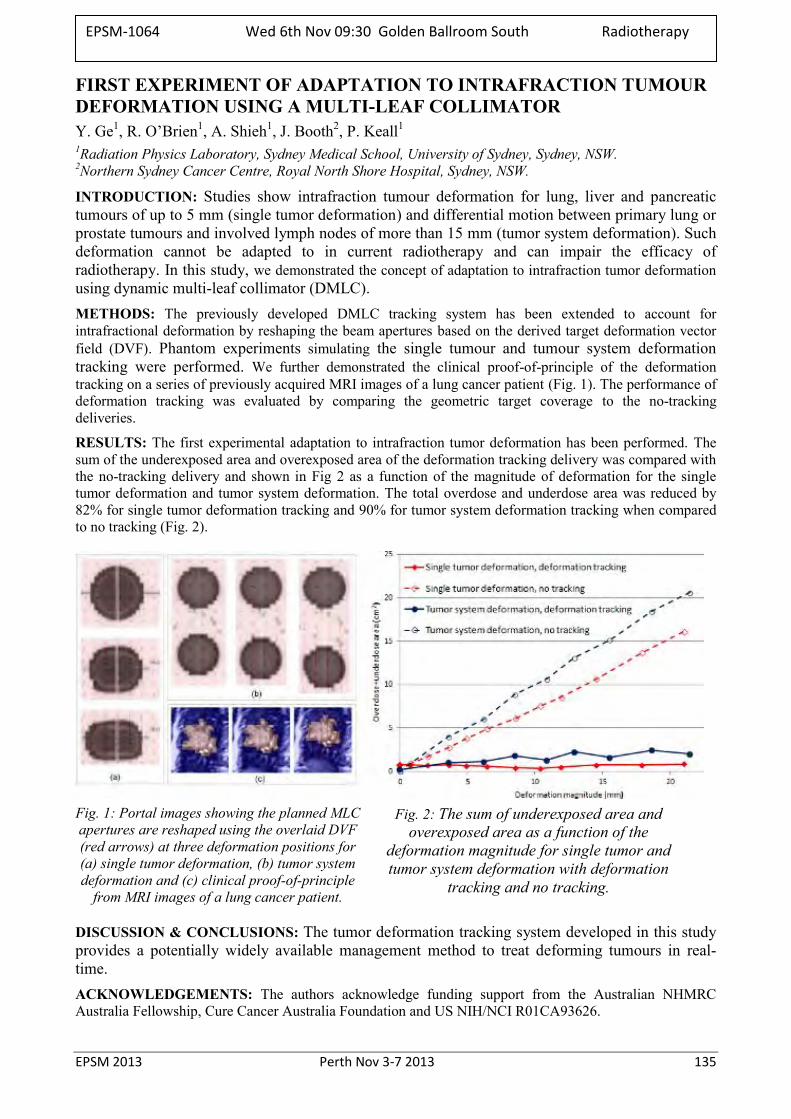
EPSM 2013 Perth Nov 3-7 2013 135
FIRST EXPERIMENT OF ADAPTATION TO INTRAFRACTION TUMOUR DEFORMATION USING A MULTI-LEAF COLLIMATOR Y. Ge1, R. O’Brien1, A. Shieh1, J. Booth2, P. Keall1 1Radiation Physics Laboratory, Sydney Medical School, University of Sydney, Sydney, NSW. 2Northern Sydney Cancer Centre, Royal North Shore Hospital, Sydney, NSW.
INTRODUCTION: Studies show intrafraction tumour deformation for lung, liver and pancreatic tumours of up to 5 mm (single tumor deformation) and differential motion between primary lung or prostate tumours and involved lymph nodes of more than 15 mm (tumor system deformation). Such deformation cannot be adapted to in current radiotherapy and can impair the efficacy of radiotherapy. In this study, we demonstrated the concept of adaptation to intrafraction tumor deformation using dynamic multi-leaf collimator (DMLC). METHODS: The previously developed DMLC tracking system has been extended to account for intrafractional deformation by reshaping the beam apertures based on the derived target deformation vector field (DVF). Phantom experiments simulating the single tumour and tumour system deformation tracking were performed. We further demonstrated the clinical proof-of-principle of the deformation tracking on a series of previously acquired MRI images of a lung cancer patient (Fig. 1). The performance of deformation tracking was evaluated by comparing the geometric target coverage to the no-tracking deliveries.
RESULTS: The first experimental adaptation to intrafraction tumor deformation has been performed. The sum of the underexposed area and overexposed area of the deformation tracking delivery was compared with the no-tracking delivery and shown in Fig 2 as a function of the magnitude of deformation for the single tumor deformation and tumor system deformation. The total overdose and underdose area was reduced by 82% for single tumor deformation tracking and 90% for tumor system deformation tracking when compared to no tracking (Fig. 2).
Fig. 1: Portal images showing the planned MLC apertures are reshaped using the overlaid DVF (red arrows) at three deformation positions for (a) single tumor deformation, (b) tumor system deformation and (c) clinical proof-of-principle
from MRI images of a lung cancer patient.
Fig. 2: The sum of underexposed area and overexposed area as a function of the
deformation magnitude for single tumor and tumor system deformation with deformation
tracking and no tracking.
DISCUSSION & CONCLUSIONS: The tumor deformation tracking system developed in this study provides a potentially widely available management method to treat deforming tumours in real-time. ACKNOWLEDGEMENTS: The authors acknowledge funding support from the Australian NHMRC Australia Fellowship, Cure Cancer Australia Foundation and US NIH/NCI R01CA93626.
EPSM-1064 Wed 6th Nov 09:30 Golden Ballroom South Radiotherapy
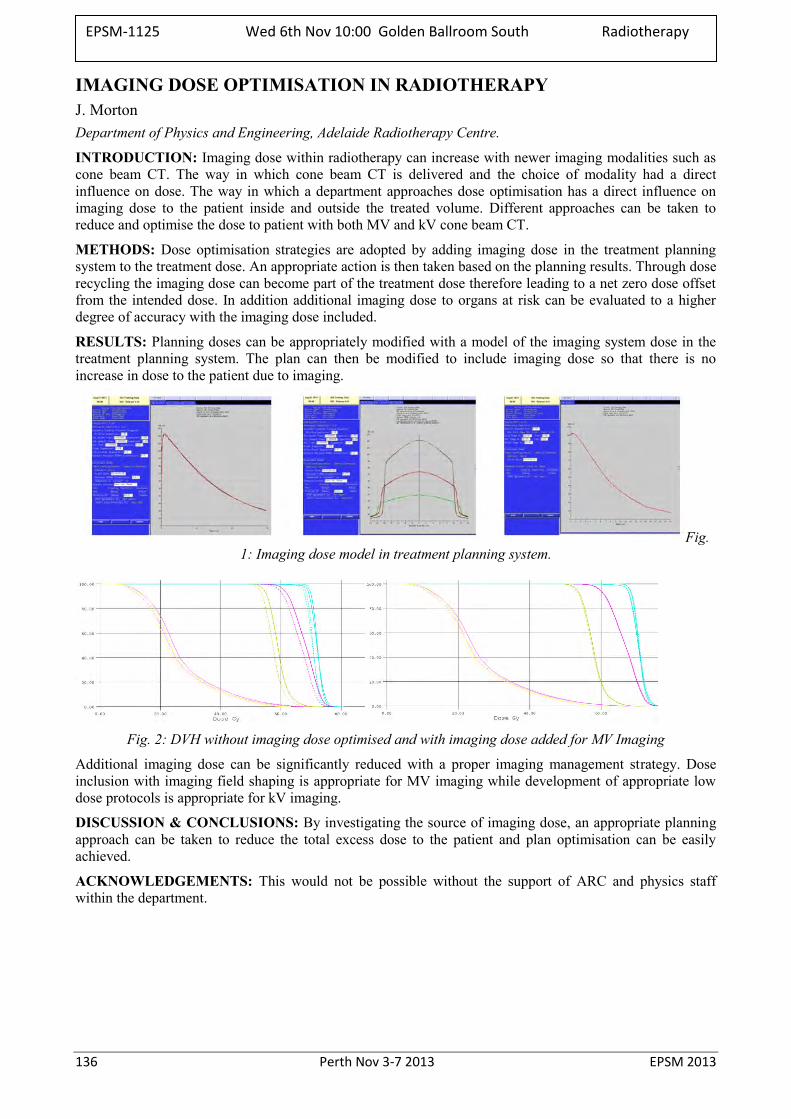
136 Perth Nov 3-7 2013 EPSM 2013
IMAGING DOSE OPTIMISATION IN RADIOTHERAPY J. Morton Department of Physics and Engineering, Adelaide Radiotherapy Centre.
INTRODUCTION: Imaging dose within radiotherapy can increase with newer imaging modalities such as cone beam CT. The way in which cone beam CT is delivered and the choice of modality had a direct influence on dose. The way in which a department approaches dose optimisation has a direct influence on imaging dose to the patient inside and outside the treated volume. Different approaches can be taken to reduce and optimise the dose to patient with both MV and kV cone beam CT.
METHODS: Dose optimisation strategies are adopted by adding imaging dose in the treatment planning system to the treatment dose. An appropriate action is then taken based on the planning results. Through dose recycling the imaging dose can become part of the treatment dose therefore leading to a net zero dose offset from the intended dose. In addition additional imaging dose to organs at risk can be evaluated to a higher degree of accuracy with the imaging dose included.
RESULTS: Planning doses can be appropriately modified with a model of the imaging system dose in the treatment planning system. The plan can then be modified to include imaging dose so that there is no increase in dose to the patient due to imaging.
Fig. 1: Imaging dose model in treatment planning system.
Fig. 2: DVH without imaging dose optimised and with imaging dose added for MV Imaging
Additional imaging dose can be significantly reduced with a proper imaging management strategy. Dose inclusion with imaging field shaping is appropriate for MV imaging while development of appropriate low dose protocols is appropriate for kV imaging.
DISCUSSION & CONCLUSIONS: By investigating the source of imaging dose, an appropriate planning approach can be taken to reduce the total excess dose to the patient and plan optimisation can be easily achieved.
ACKNOWLEDGEMENTS: This would not be possible without the support of ARC and physics staff within the department.
EPSM-1125 Wed 6th Nov 10:00 Golden Ballroom South Radiotherapy
EPSM 2013 Perth Nov 3-7 2013 137
CT DOSE: NEW TECHNOLOGIES AND NEW PERSPECTIVES J. Kofler Department of Radiology, Mayo Clinic, Rochester, MN, USA
In recent years there has been much attention paid to the radiation doses delivered by diagnostic medical CT exams. This has stimulated significant progress in dose reduction technologies and has promoted an extended effort by the imaging community to reduce the dose levels of CT imaging procedures. However, it has also created a radiation phobia related to CT imaging among the general population, which has had negative consequences for patient care. This presentation includes a discussion of CT doses and the associated risks from the perspective of the patient, along with several case studies. Additionally, these issues are addressed from the perspective of the scientist, including dose calculations and a relative interpretation of risk and benefit. New and potential dose reduction technologies that continue to increase the benefit-to-risk ratio of CT imaging are also discussed.
EPSM-1255 Wed 6th Nov 09:00 Golden Ballroom Centre Diagnostic Radiology
138 Perth Nov 3-7 2013 EPSM 2013
THE AUSTRALIAN NATIONAL DIAGNOSTIC REFERENCE LEVEL SERVICE – WHAT WE HAVE LEARNT SO FAR AND HOW TO USE DRLS NOW WE HAVE THEM A. Hayton, A. Wallace, P. Marks, P. Thomas, P. Johnston Australian Radiation Protection and Nuclear Safety Agency, 619 Lower Plenty Road, Yallambie, Victoria.
The annual per caput dose to the Australian population as a result of diagnostic imaging has increased significantly over the last twenty years, largely due to the increased use of Computed Tomography (CT). While CT is a valuable imaging tool the associated patient radiation doses are comparatively high, making optimisation all the more important.
ARPANSA developed the Australian National Diagnostic Reference Level (DRL) Service with two purposes in mind. Firstly, to provide practices with a means of comparing their doses to those of their peers and secondly, to use the data collect to calculate and update national DRLs for Australia. Data collected in the initial period of the service showed a wide range of doses for similar protocols illustrating the need for widespread optimisation.
Using data collected in the initial period of the service DRLs were established for six common adult CT protocols which were published in 2012. Paediatric DRLs for three common protocols were also established during 2012 using data obtained from a RANZCR Quality Use of Diagnostic Imaging program.
The Australian National DRL service is an ongoing free service in its third year of operation which allows comparison of data sets from two discrete calendar year periods. During 2012 the number of practices registered to use the service and the number of total surveys completed by practices approximately doubled compared to 2011. Initial analysis of these two data sets shows agreement with the DRL values calculated but a wide range of doses for each protocol is also consistent for both years.
This talk will cover the concept of DRLs, why we needed them and why they are important, and an analysis of the data collected so far.
EPSM-1026 Wed 6th Nov 09:30 Golden Ballroom Centre Radiology Physics
EPSM 2013 Perth Nov 3-7 2013 139
RADIATION DOSE SURVEY OF NEONATES AT THE CANBERRA HOSPITAL D. Hadaya1, D. McLean1, A. Morris2, K. Munstermann3 1Medical Physics department, The Canberra Hospital, Garran, ACT, 2605. 2Medical Imaging department, The Canberra Hospital, Garran, ACT, 2605. 3NICU, The Canberra Hospital, Garran, ACT, 2605.
INTRODUCTION: It is known that the very young are especially sensitive to radiation and that babies in the neonate intensive care unit (NICU) may receive a large number of x-ray examinations. Consequently a patient radiation dose survey for NICU was conducted to inform imaging technique optimisation and assist in appropriate patient dose information.
METHODS: Radiographic parameters such as kV, mAs, focus to skin distance (FSD), field size, and patient parameters such as size and gestational age, were collected for the various x-ray examinations over a three month period within the NICU. The radiation output of the mobile x-ray unit used was calibrated as well as the attenuation properties of incubators. The entrance surface kerma (Ks) per x-ray examination was calculated and compared to international guidelines.
RESULTS: There was significant variation in radiographic parameters within examination types, with no correlation to patient size or gestational age. The main contributor to patient dose was FSD, which ranged from 42 to 105 cm. Extremely low weight neonatal patients (<1000g) received the largest average Ks, where 50% of the x-ray examinations had a FSD of less than 80cm. Investigation of annual records revealed that for the maximum number of x-ray examinations undertaken (44) the effective dose would be in the order of 0.6mSv.
DISCUSSION AND CONCLUSION: Typical results were similar to those reported in STUK [1] and well below the European commission reference levels [2]; however there is extensive opportunity for technique optimisation and education of radiographers, staff specialists and nurses.
REFERENCES: 1. A. Kettunen, (2004), Radiation Dose and Radiation risk to foetuses and newborns during x-ray examinations, STUK, Finland. 2. European Commission (1996), European Guidelines on Quality Criteria for Diagnostic radiographic Images in Paediatrics, Report EUR 16261EN, Luxembourg.
EPSM-1097 Wed 6th Nov 10:00 Golden Ballroom Centre Radiology Physics

140 Perth Nov 3-7 2013 EPSM 2013
ASSESSING OCCUPATIONAL EXPOSURES TO PHYSICAL AGENTS L. Fritschi Western Australian Institute for Medical Research, The University of Western Australia, Perth, Western
Australia.
INTRODUCTION: In epidemiological studies, we often need to determine how much exposure to chemical or physical hazards occurred in workplaces years or decades ago. The agents we might be interested in include ionizing or non-ionizing radiation, noise, or physical exertion and often there are no measurements available for use.
METHODS: Epidemiologists use a range of different approaches to classify people into exposure groups, such as job title, self-report by the worker, or expert review of job histories. This presentation will describe how we assess exposure to physical agents and the limitations and advantages of the different methods. Examples from our case-control study of breast cancer and our national survey of exposure to carcinogens will be used to illustrate the methods and results we can obtain.
RESULTS: Our case-control study of breast cancer found that about 7.3% of cases and 6.3% of controls had been ever potentially exposed to ionizing radiation at work sometime during their work career, giving an odds ratio of 1.16 (95% CI 0.87-1.56). Our national survey found that about 2.7% of the working population (95%CI 2.2-3.4) are potentially exposed to ionizing radiation at work. This equates to about 128, 000 people.
DISCUSSION & CONCLUSIONS: Engineers and physical scientists, who are used to accuracy to many decimal points, may be shocked by the assumptions and simplifications that we make in classifying exposure, and we welcome suggestions for ways we can improve our methods.
ACKNOWLEDGEMENTS: Lin Fritschi is supported by fellowships from the National Health and Medical Research Council and Cancer Council Western Australia
EPSM-1258 Wed 6th Nov 09:00 Golden Ballroom North Carcinogenisis
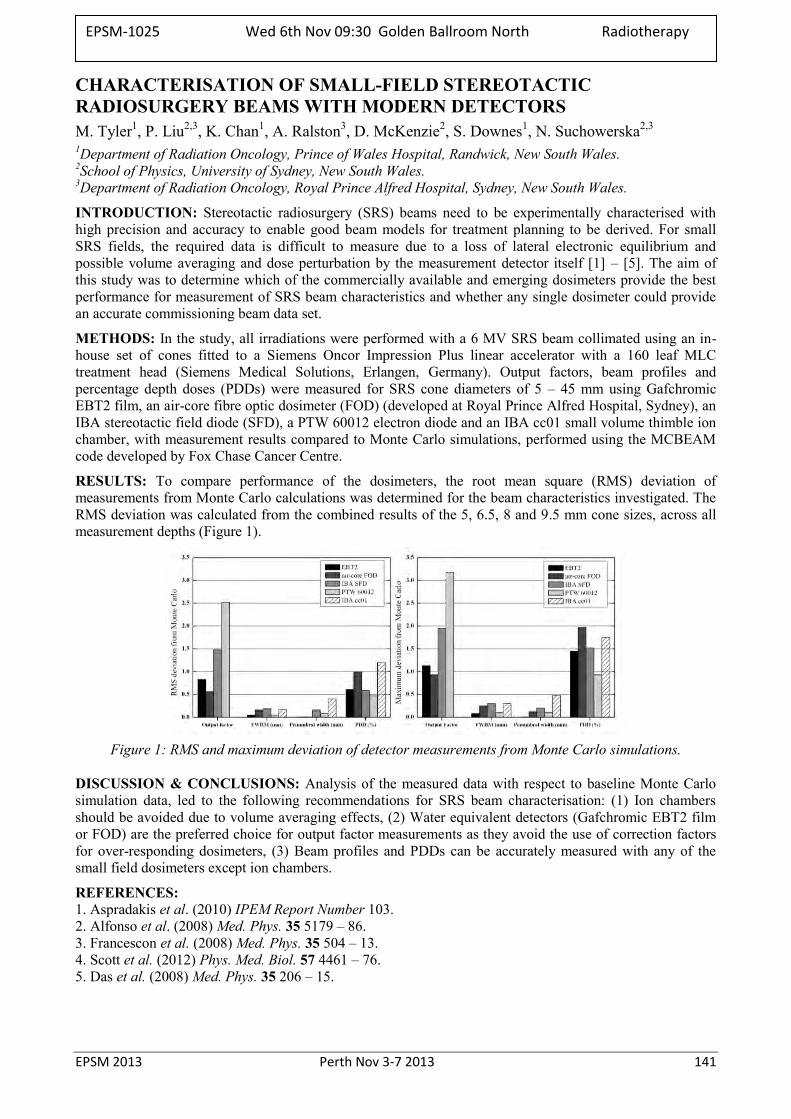
EPSM 2013 Perth Nov 3-7 2013 141
CHARACTERISATION OF SMALL-FIELD STEREOTACTIC RADIOSURGERY BEAMS WITH MODERN DETECTORS M. Tyler1, P. Liu2,3, K. Chan1, A. Ralston3, D. McKenzie2, S. Downes1, N. Suchowerska2,3 1Department of Radiation Oncology, Prince of Wales Hospital, Randwick, New South Wales. 2School of Physics, University of Sydney, New South Wales. 3Department of Radiation Oncology, Royal Prince Alfred Hospital, Sydney, New South Wales.
INTRODUCTION: Stereotactic radiosurgery (SRS) beams need to be experimentally characterised with high precision and accuracy to enable good beam models for treatment planning to be derived. For small SRS fields, the required data is difficult to measure due to a loss of lateral electronic equilibrium and possible volume averaging and dose perturbation by the measurement detector itself [1] – [5]. The aim of this study was to determine which of the commercially available and emerging dosimeters provide the best performance for measurement of SRS beam characteristics and whether any single dosimeter could provide an accurate commissioning beam data set.
METHODS: In the study, all irradiations were performed with a 6 MV SRS beam collimated using an in-house set of cones fitted to a Siemens Oncor Impression Plus linear accelerator with a 160 leaf MLC treatment head (Siemens Medical Solutions, Erlangen, Germany). Output factors, beam profiles and percentage depth doses (PDDs) were measured for SRS cone diameters of 5 – 45 mm using Gafchromic EBT2 film, an air-core fibre optic dosimeter (FOD) (developed at Royal Prince Alfred Hospital, Sydney), an IBA stereotactic field diode (SFD), a PTW 60012 electron diode and an IBA cc01 small volume thimble ion chamber, with measurement results compared to Monte Carlo simulations, performed using the MCBEAM code developed by Fox Chase Cancer Centre.
RESULTS: To compare performance of the dosimeters, the root mean square (RMS) deviation of measurements from Monte Carlo calculations was determined for the beam characteristics investigated. The RMS deviation was calculated from the combined results of the 5, 6.5, 8 and 9.5 mm cone sizes, across all measurement depths (Figure 1).
Figure 1: RMS and maximum deviation of detector measurements from Monte Carlo simulations.
DISCUSSION & CONCLUSIONS: Analysis of the measured data with respect to baseline Monte Carlo simulation data, led to the following recommendations for SRS beam characterisation: (1) Ion chambers should be avoided due to volume averaging effects, (2) Water equivalent detectors (Gafchromic EBT2 film or FOD) are the preferred choice for output factor measurements as they avoid the use of correction factors for over-responding dosimeters, (3) Beam profiles and PDDs can be accurately measured with any of the small field dosimeters except ion chambers.
REFERENCES: 1. Aspradakis et al. (2010) IPEM Report Number 103. 2. Alfonso et al. (2008) Med. Phys. 35 5179 – 86. 3. Francescon et al. (2008) Med. Phys. 35 504 – 13. 4. Scott et al. (2012) Phys. Med. Biol. 57 4461 – 76. 5. Das et al. (2008) Med. Phys. 35 206 – 15.
EPSM-1025 Wed 6th Nov 09:30 Golden Ballroom North Radiotherapy
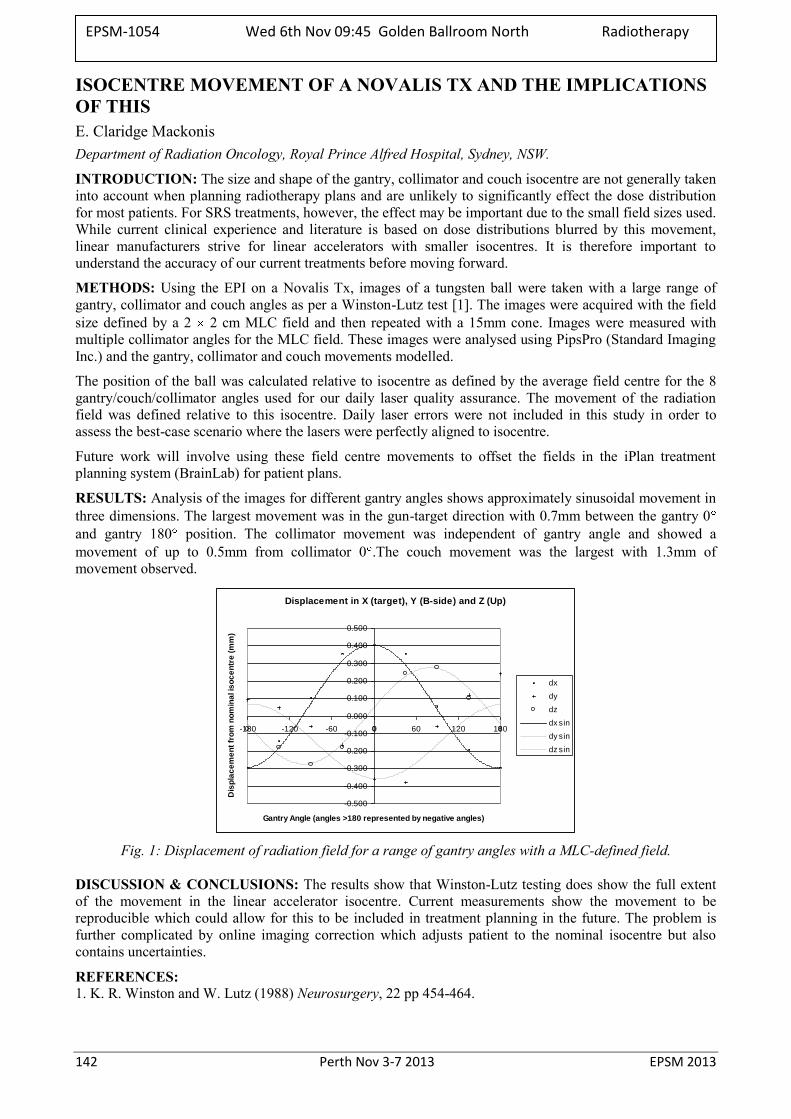
142 Perth Nov 3-7 2013 EPSM 2013
ISOCENTRE MOVEMENT OF A NOVALIS TX AND THE IMPLICATIONS OF THIS E. Claridge Mackonis Department of Radiation Oncology, Royal Prince Alfred Hospital, Sydney, NSW.
INTRODUCTION: The size and shape of the gantry, collimator and couch isocentre are not generally taken into account when planning radiotherapy plans and are unlikely to significantly effect the dose distribution for most patients. For SRS treatments, however, the effect may be important due to the small field sizes used. While current clinical experience and literature is based on dose distributions blurred by this movement, linear manufacturers strive for linear accelerators with smaller isocentres. It is therefore important to understand the accuracy of our current treatments before moving forward.
METHODS: Using the EPI on a Novalis Tx, images of a tungsten ball were taken with a large range of gantry, collimator and couch angles as per a Winston-Lutz test [1]. The images were acquired with the field size defined by a 2 2 cm MLC field and then repeated with a 15mm cone. Images were measured with multiple collimator angles for the MLC field. These images were analysed using PipsPro (Standard Imaging Inc.) and the gantry, collimator and couch movements modelled.
The position of the ball was calculated relative to isocentre as defined by the average field centre for the 8 gantry/couch/collimator angles used for our daily laser quality assurance. The movement of the radiation field was defined relative to this isocentre. Daily laser errors were not included in this study in order to assess the best-case scenario where the lasers were perfectly aligned to isocentre.
Future work will involve using these field centre movements to offset the fields in the iPlan treatment planning system (BrainLab) for patient plans.
RESULTS: Analysis of the images for different gantry angles shows approximately sinusoidal movement in three dimensions. The largest movement was in the gun-target direction with 0.7mm between the gantry 0 and gantry 180 position. The collimator movement was independent of gantry angle and showed a movement of up to 0.5mm from collimator 0 .The couch movement was the largest with 1.3mm of movement observed.
Displacement in X (target), Y (B-side) and Z (Up)
-0.500
-0.400
-0.300
-0.200
-0.100
0.000
0.100
0.200
0.300
0.400
0.500
-180 -120 -60 0 60 120 180
Gantry Angle (angles >180 represented by negative angles)
Dis
pla
ce
me
nt
fro
m n
om
ina
l is
oc
en
tre
(m
m)
dx
dy
dz
dx sin
dy sin
dz sin
Fig. 1: Displacement of radiation field for a range of gantry angles with a MLC-defined field.
DISCUSSION & CONCLUSIONS: The results show that Winston-Lutz testing does show the full extent of the movement in the linear accelerator isocentre. Current measurements show the movement to be reproducible which could allow for this to be included in treatment planning in the future. The problem is further complicated by online imaging correction which adjusts patient to the nominal isocentre but also contains uncertainties.
REFERENCES: 1. K. R. Winston and W. Lutz (1988) Neurosurgery, 22 pp 454-464.
EPSM-1054 Wed 6th Nov 09:45 Golden Ballroom North Radiotherapy
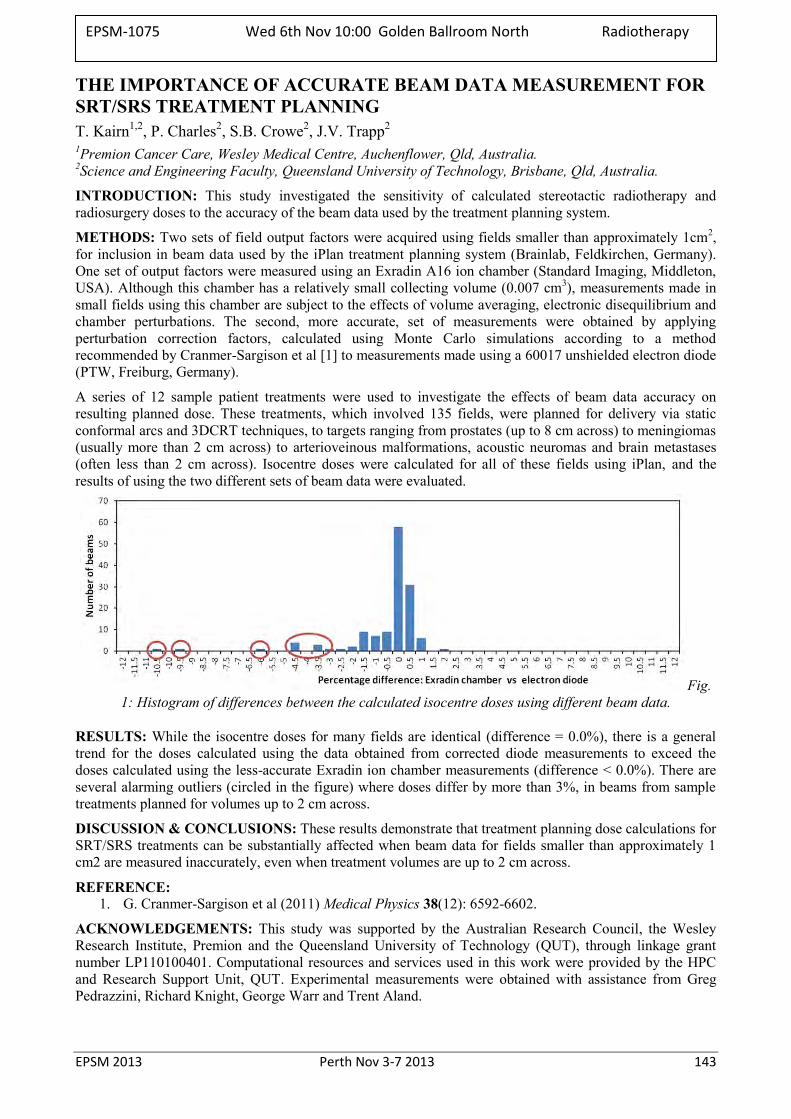
EPSM 2013 Perth Nov 3-7 2013 143
THE IMPORTANCE OF ACCURATE BEAM DATA MEASUREMENT FOR SRT/SRS TREATMENT PLANNING T. Kairn1,2, P. Charles2, S.B. Crowe2, J.V. Trapp2 1Premion Cancer Care, Wesley Medical Centre, Auchenflower, Qld, Australia. 2Science and Engineering Faculty, Queensland University of Technology, Brisbane, Qld, Australia.
INTRODUCTION: This study investigated the sensitivity of calculated stereotactic radiotherapy and radiosurgery doses to the accuracy of the beam data used by the treatment planning system.
METHODS: Two sets of field output factors were acquired using fields smaller than approximately 1cm2, for inclusion in beam data used by the iPlan treatment planning system (Brainlab, Feldkirchen, Germany). One set of output factors were measured using an Exradin A16 ion chamber (Standard Imaging, Middleton, USA). Although this chamber has a relatively small collecting volume (0.007 cm3), measurements made in small fields using this chamber are subject to the effects of volume averaging, electronic disequilibrium and chamber perturbations. The second, more accurate, set of measurements were obtained by applying perturbation correction factors, calculated using Monte Carlo simulations according to a method recommended by Cranmer-Sargison et al [1] to measurements made using a 60017 unshielded electron diode (PTW, Freiburg, Germany).
A series of 12 sample patient treatments were used to investigate the effects of beam data accuracy on resulting planned dose. These treatments, which involved 135 fields, were planned for delivery via static conformal arcs and 3DCRT techniques, to targets ranging from prostates (up to 8 cm across) to meningiomas (usually more than 2 cm across) to arterioveinous malformations, acoustic neuromas and brain metastases (often less than 2 cm across). Isocentre doses were calculated for all of these fields using iPlan, and the results of using the two different sets of beam data were evaluated.
Fig. 1: Histogram of differences between the calculated isocentre doses using different beam data.
RESULTS: While the isocentre doses for many fields are identical (difference = 0.0%), there is a general trend for the doses calculated using the data obtained from corrected diode measurements to exceed the doses calculated using the less-accurate Exradin ion chamber measurements (difference < 0.0%). There are several alarming outliers (circled in the figure) where doses differ by more than 3%, in beams from sample treatments planned for volumes up to 2 cm across.
DISCUSSION & CONCLUSIONS: These results demonstrate that treatment planning dose calculations for SRT/SRS treatments can be substantially affected when beam data for fields smaller than approximately 1 cm2 are measured inaccurately, even when treatment volumes are up to 2 cm across.
REFERENCE: 1. G. Cranmer-Sargison et al (2011) Medical Physics 38(12): 6592-6602.
ACKNOWLEDGEMENTS: This study was supported by the Australian Research Council, the Wesley Research Institute, Premion and the Queensland University of Technology (QUT), through linkage grant number LP110100401. Computational resources and services used in this work were provided by the HPC and Research Support Unit, QUT. Experimental measurements were obtained with assistance from Greg Pedrazzini, Richard Knight, George Warr and Trent Aland.
EPSM-1075 Wed 6th Nov 10:00 Golden Ballroom North Radiotherapy
144 Perth Nov 3-7 2013 EPSM 2013
CURRENT STATUS OF PRODUCTION AND APPLICATION OF ALPHA EMITTING RADIOISOTOPES S. Smith Collider Accelerator Department, Brookhaven National Laboratory, Upton NY, USA
The challenges in the production and application of alpha radioisotopes, such as Bismuth-213 (213Bi), Actinium-225 (225Ac) and Astatine-211 (211At) continues to be overcome. Nuclear science advisory committee (NSAC) identified 225Ac as the number one priority for the Department of Energy of Nuclear Physics, Isotope Program. Currently 225Ac is produced by decay of the long-lived Thorium-229 (229Th) extracted from 233U stockpile. A collaborative project between three major DOE radioisotope programs, Los Alamos National Laboratory (LANL) Brookhaven National Laboratory (BNL) and Oak Ridge National Laboratory (ORNL) is exploring the development of a viable direct production route for 225Ac. This talk will give an overview of the advances in the production and application of alpha emitting isotopes in targeted radiotherapy.
EPSM-1259 Wed 6th Nov 10:45 Golden Ballroom South PreClinical Imaging
EPSM 2013 Perth Nov 3-7 2013 145
CLINICAL PREPARATION FOR SCANNED PROTON AND CARBON ION THERAPY: DOSIMETRY OF TARGETING UNCERTAINTIES F. Ammazzalorso, A. Santiago, U. Jelen Department of Radiotherapy and Radiation Oncology – Particle Therapy Center, University of Marburg,
Marburg, Germany.
INTRODUCTION: As part of the clinical preparation for the upcoming clinical opening of a scanned proton and carbon ion center on the medical campus of the University of Marburg, a systematic dosimetric study was carried out to investigate the effects of and the potential countermeasures against delivery-time targeting uncertainties in four indications: skull-base, head-and-neck, prostate and lung.
METHODS: For all cases, scanned particle therapy plans were prepared with the TRiP98 planning system [1]. Delivery-time dosimetry was obtained recomputing the plans on patient geometries (obtained from photon treatments) in which uncertainties were either captured or simulated. Similarly, for each indication, potential countermeasures were evaluated. Results were analyzed with trip2png [2], comparing dose distributions, DVHs and relevant dosimetric indexes, reported as population median (min-max), e.g. the V95% (prescription dose percent received by 95% of volume) and the homogeneity index (HI). In the skull, rigid setup errors (≤2mm) in proton and carbon ion plans were simulated for 15 patients by displacing the planning CT and the potential benefits of robust planning and the averaging effects of fractionation were assessed. In head-and-neck cases, repeat CTs of 7 patients were used to simulate the effects on proton treatments of three different daily patient positioning strategies (based on fiducial markers, average anatomy and tumor region) and compare them with the case of photon intensity modulated radiotherapy (IMRT). For the prostate, the effects of inter- and intra-fraction motion on carbon ion treatments were instead investigated using CTs of 12 patients, coupled with clinical setup accuracy data (inter) and prostate trajectories recorded with implanted transponders (intra). For lung treatments, the suitability of high-frequency jet ventilation for proton therapy was assessed using planning and verification CTs of 11 radiosurgery patients.
RESULTS: All indications were affected to a variable degree by geometrical and/or anatomical uncertainties and the investigated countermeasures were in general effective in ensuring clinically acceptable target coverage. In the skull region, small rigid setup errors decreased planned carbon ion fraction PTV V95% (≥95%) of lateral-opposed-field plans to 90.1(84.3-95.1)%. Clinical target coverage could be reestablished through fractionation (random errors) and robust beam selection. For head-and-neck cases, the PTV V95% of 97.1(94.9-97.8)% decreased to 94.2(82.7-96.4)%-95.1(94.8-97.8)%, for different patient repositioning approaches. Such loss was only slightly higher than with IMRT, while absolute HI values were always better for particle treatments, i.e. steeper target gradients were preserved. In prostate cases inter-fraction displacement could be fully managed by either sufficiently large safety margins and/or application of target-based positioning, reaching delivery-time CTV V98%>95.0-98.0%, for different margins. Intra-fraction prostate motion and its interplay with beam scanning lead to a CTV V95% between 82.4(60.7-97.5)% and 96.0(66.6-100.0)%, depending on motion characteristics, and could instead be fully managed only through intra-beam motion compensation. For lung treatments, with high-frequency jet ventilation, PTV V95% was 97.4(74.5-99.6)% in the recomputed plans. In 2 cases the clinical objective (PTV V95%>95%) was not reached, which could be attributed to poor beam entrance channel reproducibility.
DISCUSSION & CONCLUSIONS: Delivery-time geometrical and anatomical uncertainties are a relevant factor for the safe delivery of scanned particle therapy. The investigated countermeasures were in general effective in ensuring clinically acceptable target coverage, reinstating the dosimetric advantage of particle therapy, and will be part of the clinical protocols of our facility, which will give particular importance to preventive solutions (state-of-the-art immobilization and imaging, physiological organ motion reduction strategies and robust planning approaches).
REFERENCES: 1. M. Krämer et al (2000) Treatment planning for heavy-ion radiotherapy: physical beam model and
dose optimization, Phys. Med. Biol. 45:3299–3317. 2. F. Ammazzalorso et al (2013) A free software display and analysis tool for photon and particle
radiotherapy dose distributions, 52nd Annual Conference of the PTCOG, P302.
EPSM-1044 Wed 6th Nov 11:15 Golden Ballroom South Radiotherapy
146 Perth Nov 3-7 2013 EPSM 2013
THE USE OF A NOVEL TRANSMISSION DETECTOR TO PERFORM IN-VIVO MEASUREMENTS, WITHOUT THE NEED FOR ANY PREPARATION TIME ON THE LINAC D. Johnson1, S. Weston1, V. Cosgrove1, D. Thwaites2
1Department of Medical Physics, St James’ Hospital,Leeds, England. 2Institute of Medical Physics, School of Physics, University of Sydney, Australia.
INTRODUCTION: The DAVID is an optically-transparent, 2-D transmission detector. It consists of two PMMA sheets enclosing a vented air gap containing a series of collection wires. The wires are aligned with direction of MLC leaf travel and are held at a potential relative to the plates. The device is MLC specific such that each wire is aligned with an individual MLC leaf pair [1]. The signal at each wire is proportional to the radiation fluence through the associated leaf pair, plus scatter, mainly from inside the PMMA, as a consequence of fluence through adjacent leaf apertures. For standard in-vivo verification, on-treatment signals are referenced to baseline values recorded at pre-treatment verification, requiring linac time and staff resources. A new approach is suggested here for direct in-vivo verification, based on independent check-software information to predict the DAVID signals, to be used as reference for the subsequent on-treatment measurements. The aim is to quality assure the whole process, including treatment planning system and plan, plan transfer to the delivery system and treatment delivery, without requiring additional linac time. The algorithm development to predict the DAVID signal is presented here.
METHODS: The lateral response from primary and scattered radiation was characterised, defining the lateral response function. Convolution of the lateral response function with the leaf separation matrix, allowing for penumbral corrections, results in the predicted signal. This relatively simple model (requiring 5 fit parameters to establish the model for a given DAVID/MLC system) was applied to 10 clinical head-and-neck IMRT plans. To account for variation in output, each plan was delivered three times and the average signal, for each wire, for each beam, was compared to the predicted signals. 5% of the maximum signal for each beam was used as a tolerance to compare the measured and predicted signals. Differences larger than this resulted in a failed delivery for that beam.
RESULTS: All but three of the 50 beams passed, in the case of the three failing beams, one wire in the penumbral region had failed. Inspection of the results by a trained person would lead them to conclude that the treatment had been delivered correctly. The algorithm could detect artificially-induced 4.5% changes in MU delivery.
DISCUSSION & CONCLUSIONS: Further testing is on-going for induced MLC position errors. This fast and relatively simple algorithm predicts the DAVID responses with a sufficient accuracy to detect significant errors in clinical treatment deliver and enables in-vivo verification of IMRT dose-delivery without requiring separate pre-treatment linac time.
REFERENCE: 1. Poppe, B., et al.(2006), DAVID - a translucent multi-wire transmission ionization chamber for in vivo
verification of IMRT and conformal irradiation techniques. Physics in Medicine and Biology, 2006. 51(5): p. 1237-1248.
ACKNOWLEDGEMENTS: This work was done as part of a PhD funded by PTW.
EPSM-1046 Wed 6th Nov 11:30 Golden Ballroom South Radiotherapy
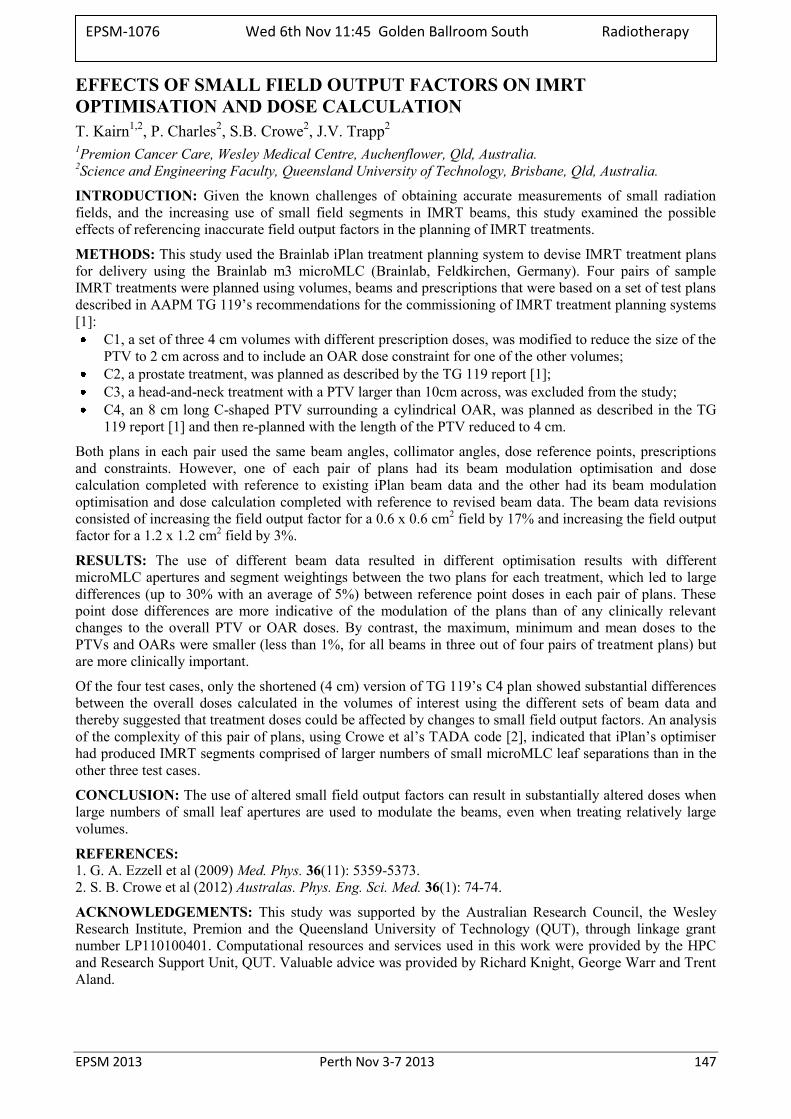
EPSM 2013 Perth Nov 3-7 2013 147
EFFECTS OF SMALL FIELD OUTPUT FACTORS ON IMRT OPTIMISATION AND DOSE CALCULATION T. Kairn1,2, P. Charles2, S.B. Crowe2, J.V. Trapp2 1Premion Cancer Care, Wesley Medical Centre, Auchenflower, Qld, Australia. 2Science and Engineering Faculty, Queensland University of Technology, Brisbane, Qld, Australia.
INTRODUCTION: Given the known challenges of obtaining accurate measurements of small radiation fields, and the increasing use of small field segments in IMRT beams, this study examined the possible effects of referencing inaccurate field output factors in the planning of IMRT treatments.
METHODS: This study used the Brainlab iPlan treatment planning system to devise IMRT treatment plans for delivery using the Brainlab m3 microMLC (Brainlab, Feldkirchen, Germany). Four pairs of sample IMRT treatments were planned using volumes, beams and prescriptions that were based on a set of test plans described in AAPM TG 119’s recommendations for the commissioning of IMRT treatment planning systems [1]:
C1, a set of three 4 cm volumes with different prescription doses, was modified to reduce the size of the PTV to 2 cm across and to include an OAR dose constraint for one of the other volumes;
C2, a prostate treatment, was planned as described by the TG 119 report [1]; C3, a head-and-neck treatment with a PTV larger than 10cm across, was excluded from the study; C4, an 8 cm long C-shaped PTV surrounding a cylindrical OAR, was planned as described in the TG
119 report [1] and then re-planned with the length of the PTV reduced to 4 cm.
Both plans in each pair used the same beam angles, collimator angles, dose reference points, prescriptions and constraints. However, one of each pair of plans had its beam modulation optimisation and dose calculation completed with reference to existing iPlan beam data and the other had its beam modulation optimisation and dose calculation completed with reference to revised beam data. The beam data revisions consisted of increasing the field output factor for a 0.6 x 0.6 cm2 field by 17% and increasing the field output factor for a 1.2 x 1.2 cm2 field by 3%.
RESULTS: The use of different beam data resulted in different optimisation results with different microMLC apertures and segment weightings between the two plans for each treatment, which led to large differences (up to 30% with an average of 5%) between reference point doses in each pair of plans. These point dose differences are more indicative of the modulation of the plans than of any clinically relevant changes to the overall PTV or OAR doses. By contrast, the maximum, minimum and mean doses to the PTVs and OARs were smaller (less than 1%, for all beams in three out of four pairs of treatment plans) but are more clinically important.
Of the four test cases, only the shortened (4 cm) version of TG 119’s C4 plan showed substantial differences between the overall doses calculated in the volumes of interest using the different sets of beam data and thereby suggested that treatment doses could be affected by changes to small field output factors. An analysis of the complexity of this pair of plans, using Crowe et al’s TADA code [2], indicated that iPlan’s optimiser had produced IMRT segments comprised of larger numbers of small microMLC leaf separations than in the other three test cases.
CONCLUSION: The use of altered small field output factors can result in substantially altered doses when large numbers of small leaf apertures are used to modulate the beams, even when treating relatively large volumes.
REFERENCES: 1. G. A. Ezzell et al (2009) Med. Phys. 36(11): 5359-5373. 2. S. B. Crowe et al (2012) Australas. Phys. Eng. Sci. Med. 36(1): 74-74.
ACKNOWLEDGEMENTS: This study was supported by the Australian Research Council, the Wesley Research Institute, Premion and the Queensland University of Technology (QUT), through linkage grant number LP110100401. Computational resources and services used in this work were provided by the HPC and Research Support Unit, QUT. Valuable advice was provided by Richard Knight, George Warr and Trent Aland.
EPSM-1076 Wed 6th Nov 11:45 Golden Ballroom South Radiotherapy
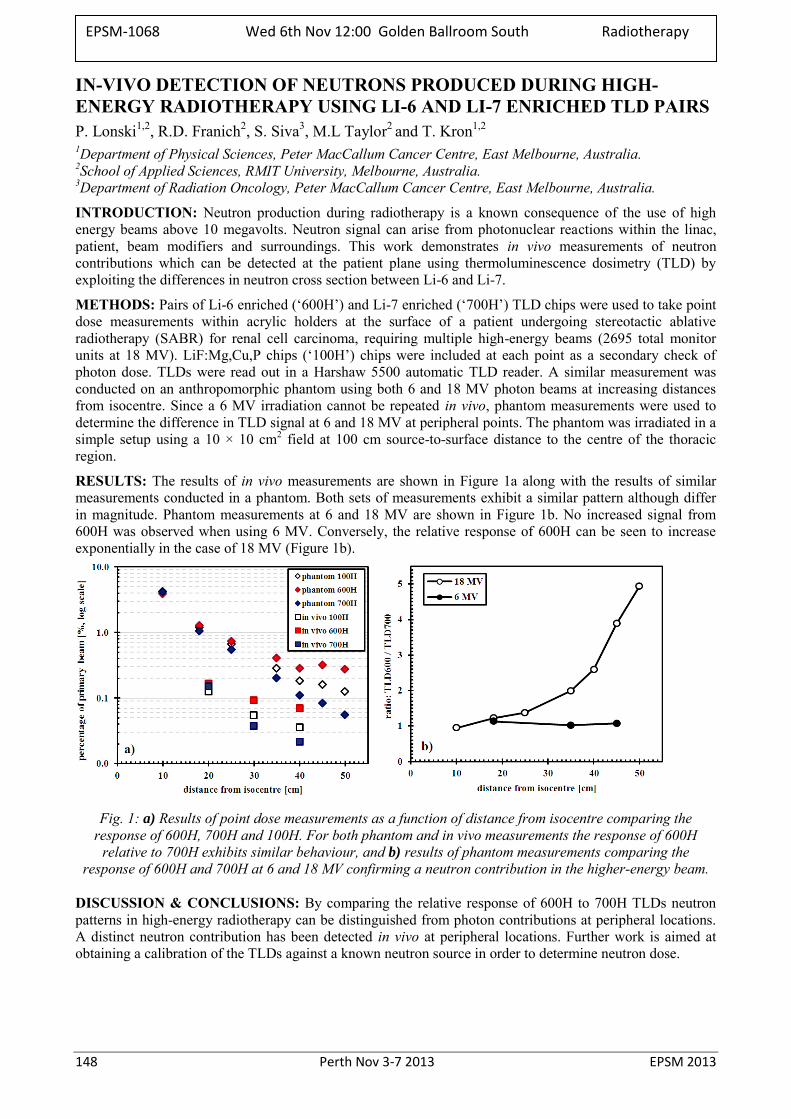
148 Perth Nov 3-7 2013 EPSM 2013
IN-VIVO DETECTION OF NEUTRONS PRODUCED DURING HIGH-ENERGY RADIOTHERAPY USING LI-6 AND LI-7 ENRICHED TLD PAIRS P. Lonski1,2, R.D. Franich2, S. Siva3, M.L Taylor2 and T. Kron1,2 1Department of Physical Sciences, Peter MacCallum Cancer Centre, East Melbourne, Australia. 2School of Applied Sciences, RMIT University, Melbourne, Australia. 3Department of Radiation Oncology, Peter MacCallum Cancer Centre, East Melbourne, Australia.
INTRODUCTION: Neutron production during radiotherapy is a known consequence of the use of high energy beams above 10 megavolts. Neutron signal can arise from photonuclear reactions within the linac, patient, beam modifiers and surroundings. This work demonstrates in vivo measurements of neutron contributions which can be detected at the patient plane using thermoluminescence dosimetry (TLD) by exploiting the differences in neutron cross section between Li-6 and Li-7.
METHODS: Pairs of Li-6 enriched (‘600H’) and Li-7 enriched (‘700H’) TLD chips were used to take point dose measurements within acrylic holders at the surface of a patient undergoing stereotactic ablative radiotherapy (SABR) for renal cell carcinoma, requiring multiple high-energy beams (2695 total monitor units at 18 MV). LiF:Mg,Cu,P chips (‘100H’) chips were included at each point as a secondary check of photon dose. TLDs were read out in a Harshaw 5500 automatic TLD reader. A similar measurement was conducted on an anthropomorphic phantom using both 6 and 18 MV photon beams at increasing distances from isocentre. Since a 6 MV irradiation cannot be repeated in vivo, phantom measurements were used to determine the difference in TLD signal at 6 and 18 MV at peripheral points. The phantom was irradiated in a simple setup using a 10 × 10 cm2 field at 100 cm source-to-surface distance to the centre of the thoracic region.
RESULTS: The results of in vivo measurements are shown in Figure 1a along with the results of similar measurements conducted in a phantom. Both sets of measurements exhibit a similar pattern although differ in magnitude. Phantom measurements at 6 and 18 MV are shown in Figure 1b. No increased signal from 600H was observed when using 6 MV. Conversely, the relative response of 600H can be seen to increase exponentially in the case of 18 MV (Figure 1b).
Fig. 1: a) Results of point dose measurements as a function of distance from isocentre comparing the
response of 600H, 700H and 100H. For both phantom and in vivo measurements the response of 600H relative to 700H exhibits similar behaviour, and b) results of phantom measurements comparing the
response of 600H and 700H at 6 and 18 MV confirming a neutron contribution in the higher-energy beam.
DISCUSSION & CONCLUSIONS: By comparing the relative response of 600H to 700H TLDs neutron patterns in high-energy radiotherapy can be distinguished from photon contributions at peripheral locations. A distinct neutron contribution has been detected in vivo at peripheral locations. Further work is aimed at obtaining a calibration of the TLDs against a known neutron source in order to determine neutron dose.
EPSM-1068 Wed 6th Nov 12:00 Golden Ballroom South Radiotherapy
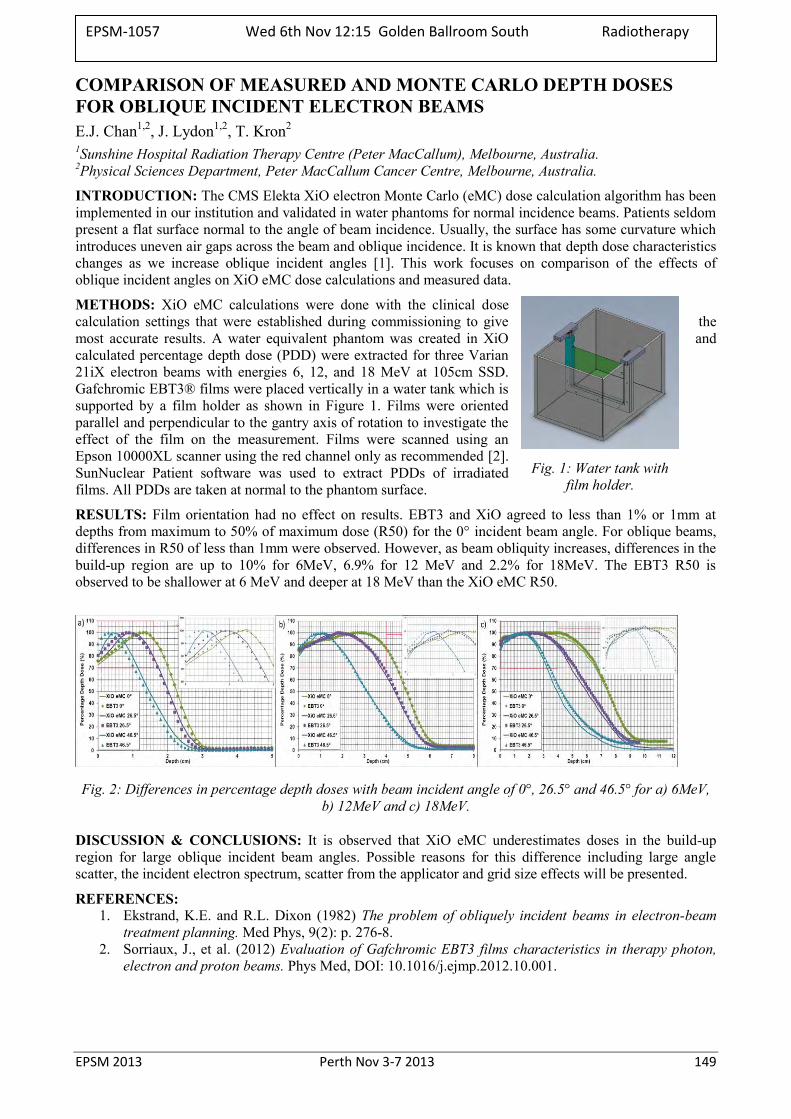
EPSM 2013 Perth Nov 3-7 2013 149
Fig. 1: Water tank with film holder.
COMPARISON OF MEASURED AND MONTE CARLO DEPTH DOSES FOR OBLIQUE INCIDENT ELECTRON BEAMS E.J. Chan1,2, J. Lydon1,2, T. Kron2
1Sunshine Hospital Radiation Therapy Centre (Peter MacCallum), Melbourne, Australia. 2Physical Sciences Department, Peter MacCallum Cancer Centre, Melbourne, Australia.
INTRODUCTION: The CMS Elekta XiO electron Monte Carlo (eMC) dose calculation algorithm has been implemented in our institution and validated in water phantoms for normal incidence beams. Patients seldom present a flat surface normal to the angle of beam incidence. Usually, the surface has some curvature which introduces uneven air gaps across the beam and oblique incidence. It is known that depth dose characteristics changes as we increase oblique incident angles [1]. This work focuses on comparison of the effects of oblique incident angles on XiO eMC dose calculations and measured data.
METHODS: XiO eMC calculations were done with the clinical dose calculation settings that were established during commissioning to give the most accurate results. A water equivalent phantom was created in XiO and calculated percentage depth dose (PDD) were extracted for three Varian 21iX electron beams with energies 6, 12, and 18 MeV at 105cm SSD. Gafchromic EBT3® films were placed vertically in a water tank which is supported by a film holder as shown in Figure 1. Films were oriented parallel and perpendicular to the gantry axis of rotation to investigate the effect of the film on the measurement. Films were scanned using an Epson 10000XL scanner using the red channel only as recommended [2]. SunNuclear Patient software was used to extract PDDs of irradiated films. All PDDs are taken at normal to the phantom surface.
RESULTS: Film orientation had no effect on results. EBT3 and XiO agreed to less than 1% or 1mm at depths from maximum to 50% of maximum dose (R50) for the 0° incident beam angle. For oblique beams, differences in R50 of less than 1mm were observed. However, as beam obliquity increases, differences in the build-up region are up to 10% for 6MeV, 6.9% for 12 MeV and 2.2% for 18MeV. The EBT3 R50 is observed to be shallower at 6 MeV and deeper at 18 MeV than the XiO eMC R50.
Fig. 2: Differences in percentage depth doses with beam incident angle of 0°, 26.5° and 46.5° for a) 6MeV, b) 12MeV and c) 18MeV.
DISCUSSION & CONCLUSIONS: It is observed that XiO eMC underestimates doses in the build-up region for large oblique incident beam angles. Possible reasons for this difference including large angle scatter, the incident electron spectrum, scatter from the applicator and grid size effects will be presented.
REFERENCES: 1. Ekstrand, K.E. and R.L. Dixon (1982) The problem of obliquely incident beams in electron-beam
treatment planning. Med Phys, 9(2): p. 276-8. 2. Sorriaux, J., et al. (2012) Evaluation of Gafchromic EBT3 films characteristics in therapy photon,
electron and proton beams. Phys Med, DOI: 10.1016/j.ejmp.2012.10.001.
EPSM-1057 Wed 6th Nov 12:15 Golden Ballroom South Radiotherapy
150 Perth Nov 3-7 2013 EPSM 2013
TSET – TOTAL SKIN ELECTRON THERAPY, A CASE STUDY USING OPTICALLY STIMULATED LUMINESCENCE DETECTORS AND ITS BENEFITS D. Binny1, C. Lancaster1, P. Back1, G. Pratt2
1 Medical Physicist, Cancer Care Services, Royal Brisbane and Womens Hospital (RBWH) 2 Radiation Oncologist, Cancer Care Services, RBWH
INTRODUCTION: TSET is a specialized technique adopted at the RBWH for the treatment of cutaneous T-cell lymphoma [1] Mycosis fungoides is usually treated by electrons and is a condition of slow proliferating non Hodgkin’s lymphoma that infiltrates the epidermis and generally manifests as erythroderma [2].
METHOD: The TSET technique aims to treat the entire skin uniformly to a limited depth than can range between 0.5 cm upto 3 cm. The technique used is the modified Stanford six dual field technique which consists of 12 cycles, each of which includes six different patient positions (Anterior, Left Post Oblique, Right Post Oblique, Posterior, Left Anterior Oblique and Right Anterior Oblique). Optically stimulated luminescence detectors (OSLDs) have been adopted from the traditionally used thermoluminescent detectors (TLDs) due to their easier handling, faster readout and annealing times and better response during in vivo measurements. The patient considered for this case study was monitored using OSLDs throughout the treatment to verify dose distribution with the treatment prescription decided by the radiation oncologist (RO). A Varian Clinac 2300ex model linear accelerator is used as the treatment machine at the RBWH that is capable of delivering 6 MeV high dose rate electrons (HDRE). Two beams one angled superiorly and the other inferiorly each at approximately 20 degrees from the beam centre line are used during treatment such that the vertical midline of the patient is the centre of the 50% overlap without undue photon contamination.
CONCLUSION AND RESULTS: Although various reports of commissioning [3] HDRE beams for TSET show surface dose uniformity within +10 in the plane perpendicular to the central axis for adult patient dimensions, there are many locations which have exceeded this uniformity criterion due to primarily surface irregularities, surface cavities and patient body shadowing effects. Surface cavities can receive lower doses than flat or convex surfaces, while higher doses may occur in areas with body protrusions [2]. Due to the infrequent use of this treatment technique it is important, as part of the QA protocol, to verify any changes in the system over time which would affect the patient dose, including the absolute output calibration.
REFERENCES: 1. AAPM Report 23, Task Group 30, C. J. Karzmark, et al : Total Skin Electron Therapy: Technique And
Dosimetry: American Association of Physicists in Medicine; 1987. 2. F Lansigan, J Choi,F Foss: Cutaneous T-cell Lymphoma Hematol Oncol Clin N Am 22 (2008) ©
Elsevier Inc. 3. Khan FM: Electron beam therapy. In The Physics of Radiation Therapy. 4th edition. Philadelphia, PA:
Lippincott Williams & Wilkins; 2009:299-306. 4. Qinan Bao, Brian A Hrycushko et.al A technique for paediatric total skin electron irradiation. Radiation
Oncol 2012, 7:40.
ACKNOWLEDGEMENTS: The authors would like to thank Nancy Yu from physics who has assisted with the calibration of the OSLD detectors and Radiation Therapists at CCS RBWH for their immense support during this case study.
EPSM-1109 Wed 6th Nov 12:30 Golden Ballroom South Radiotherapy
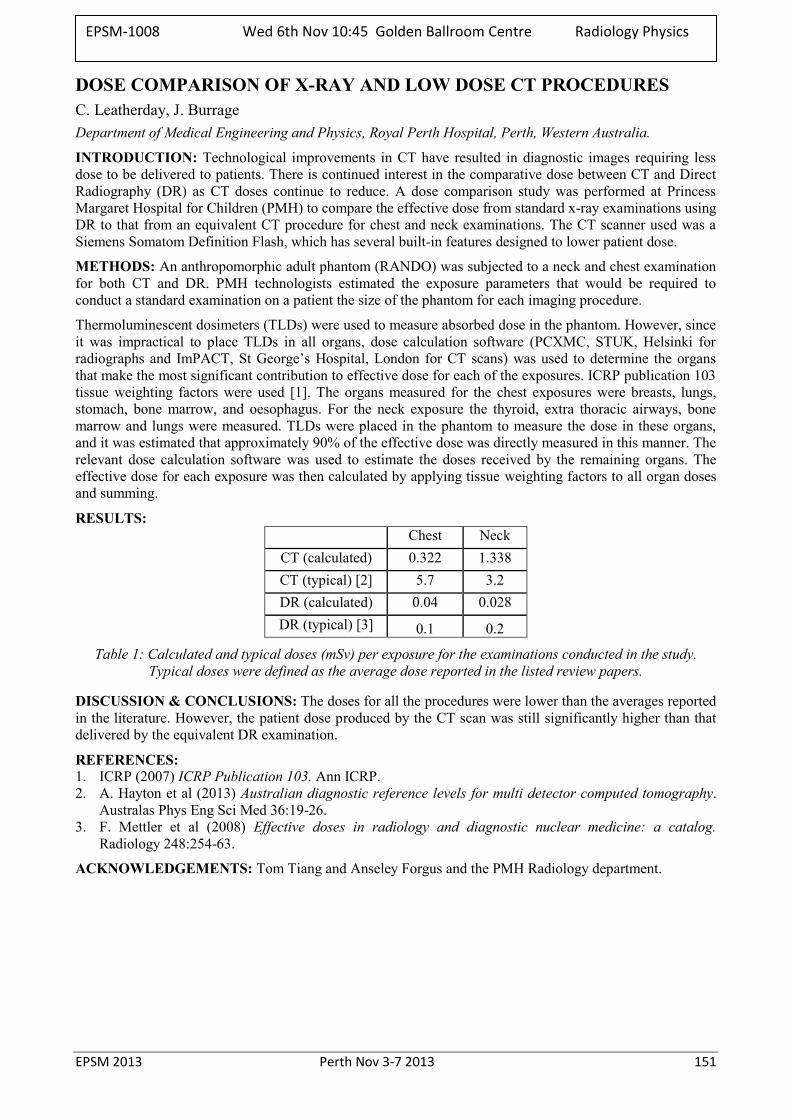
EPSM 2013 Perth Nov 3-7 2013 151
DOSE COMPARISON OF X-RAY AND LOW DOSE CT PROCEDURES C. Leatherday, J. Burrage Department of Medical Engineering and Physics, Royal Perth Hospital, Perth, Western Australia.
INTRODUCTION: Technological improvements in CT have resulted in diagnostic images requiring less dose to be delivered to patients. There is continued interest in the comparative dose between CT and Direct Radiography (DR) as CT doses continue to reduce. A dose comparison study was performed at Princess Margaret Hospital for Children (PMH) to compare the effective dose from standard x-ray examinations using DR to that from an equivalent CT procedure for chest and neck examinations. The CT scanner used was a Siemens Somatom Definition Flash, which has several built-in features designed to lower patient dose.
METHODS: An anthropomorphic adult phantom (RANDO) was subjected to a neck and chest examination for both CT and DR. PMH technologists estimated the exposure parameters that would be required to conduct a standard examination on a patient the size of the phantom for each imaging procedure.
Thermoluminescent dosimeters (TLDs) were used to measure absorbed dose in the phantom. However, since it was impractical to place TLDs in all organs, dose calculation software (PCXMC, STUK, Helsinki for radiographs and ImPACT, St George’s Hospital, London for CT scans) was used to determine the organs that make the most significant contribution to effective dose for each of the exposures. ICRP publication 103 tissue weighting factors were used [1]. The organs measured for the chest exposures were breasts, lungs, stomach, bone marrow, and oesophagus. For the neck exposure the thyroid, extra thoracic airways, bone marrow and lungs were measured. TLDs were placed in the phantom to measure the dose in these organs, and it was estimated that approximately 90% of the effective dose was directly measured in this manner. The relevant dose calculation software was used to estimate the doses received by the remaining organs. The effective dose for each exposure was then calculated by applying tissue weighting factors to all organ doses and summing.
RESULTS: Chest Neck
CT (calculated) 0.322 1.338 CT (typical) [2] 5.7 3.2 DR (calculated) 0.04 0.028 DR (typical) [3] 0.1 0.2
Table 1: Calculated and typical doses (mSv) per exposure for the examinations conducted in the study. Typical doses were defined as the average dose reported in the listed review papers.
DISCUSSION & CONCLUSIONS: The doses for all the procedures were lower than the averages reported in the literature. However, the patient dose produced by the CT scan was still significantly higher than that delivered by the equivalent DR examination.
REFERENCES: 1. ICRP (2007) ICRP Publication 103. Ann ICRP. 2. A. Hayton et al (2013) Australian diagnostic reference levels for multi detector computed tomography.
Australas Phys Eng Sci Med 36:19-26. 3. F. Mettler et al (2008) Effective doses in radiology and diagnostic nuclear medicine: a catalog.
Radiology 248:254-63.
ACKNOWLEDGEMENTS: Tom Tiang and Anseley Forgus and the PMH Radiology department.
EPSM-1008 Wed 6th Nov 10:45 Golden Ballroom Centre Radiology Physics
152 Perth Nov 3-7 2013 EPSM 2013
THE REDUCTION OF DOSE TO BREAST TISSUE DURING MULTI-SLICE CT EXAMINATIONS USING BISMUTH BREAST SHIELDS, MANUAL MA REDUCTION AND DOSE MODULATION C. Storm1, J. Atkinson2, R. Price2, P. Deb1 1RMIT University, School of Applied Sciences, Melbourne, Victoria. 2Medical Technology & Physics Department, Sir Charles Gairdner Hospital, Nedlands, Western Australia.
INTRODUCTION: This study utilised a novel geometric phantom that allowed rapid modification of the size of the breasts. This phantom made it possible to analyse the effectiveness of various dose reduction techniques, under a variety of different circumstances for patients ranging from paediatric to larger breasted patients. Doses were accurately measured throughout the entire breast and chest area using over 300 individual TLD crystals, providing comprehensive dose contour maps for CT scanning of the chest area. The aim of this study was to determine suitable methods in which breast dose could be reduced, whilst still maintaining a suitable image quality for the regions of interest.
METHODS: A geometrical Perspex phantom was constructed, with multiple attachments to simulate different breast sizes. The phantom and attachments were designed to hold multiple TLD-100 crystals in order to create the dose contour profile. Repeated measurements were then undertaken on a Philips 64 Slice MDCT to compare the ability of Bismuth Breast Shields to reduce dose for different sized breasts. Two additional dose reduction modalities were also studied: automated dose modulation, and manual reduction of the tube current.
RESULTS: The efficiency of Bismuth Breast Shields was investigated and it was found that an average dose reduction of 21% for small sized breasts and up to 44% for larger breasts could be achieved. A maximum dose reduction of 57% was found, which confirms the manufacturer’s claim. The breast shields created additional quantitative noise in the diagnostic regions of interest and qualitative noise in the form of streaking or beam hardening artefacts. The study found that lower breast doses could be achieved for a consistent noise value by simply manually reducing the tube mA.
Dose modulation on the Philips 64 CT scanner was also found to be an effective way to reduce the breast dose. Reduction in dose of between 40% and 50% was achieved, depending on the type of dose modulation used. Dose modulation, coupled with the breast shield, created an even greater dose reduction. Certain techniques provided reduction of almost 80% in breast dose, though this was coupled with a significant increase in noise.
DISCUSSION & CONCLUSIONS: Based on the findings in this study, a definitive position cannot be taken on the clinical use of bismuth breast shields without further analysis of acceptable levels of noise. Other methods are already available to operators that provide lower levels of noise in the clinical regions of interest, with equivalent levels of dose reduction to the breast tissue.
EPSM-1020 Wed 6th Nov 11:00 Golden Ballroom Centre Radiology Physics
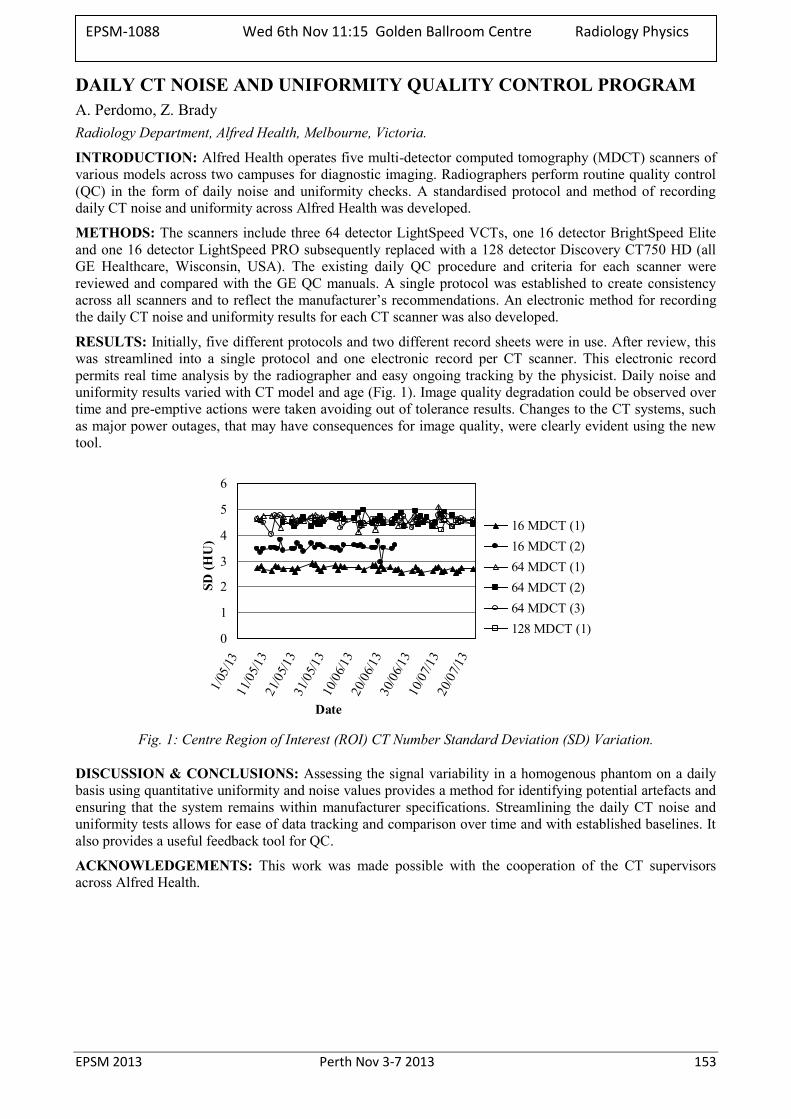
EPSM 2013 Perth Nov 3-7 2013 153
DAILY CT NOISE AND UNIFORMITY QUALITY CONTROL PROGRAM A. Perdomo, Z. Brady Radiology Department, Alfred Health, Melbourne, Victoria.
INTRODUCTION: Alfred Health operates five multi-detector computed tomography (MDCT) scanners of various models across two campuses for diagnostic imaging. Radiographers perform routine quality control (QC) in the form of daily noise and uniformity checks. A standardised protocol and method of recording daily CT noise and uniformity across Alfred Health was developed.
METHODS: The scanners include three 64 detector LightSpeed VCTs, one 16 detector BrightSpeed Elite and one 16 detector LightSpeed PRO subsequently replaced with a 128 detector Discovery CT750 HD (all GE Healthcare, Wisconsin, USA). The existing daily QC procedure and criteria for each scanner were reviewed and compared with the GE QC manuals. A single protocol was established to create consistency across all scanners and to reflect the manufacturer’s recommendations. An electronic method for recording the daily CT noise and uniformity results for each CT scanner was also developed.
RESULTS: Initially, five different protocols and two different record sheets were in use. After review, this was streamlined into a single protocol and one electronic record per CT scanner. This electronic record permits real time analysis by the radiographer and easy ongoing tracking by the physicist. Daily noise and uniformity results varied with CT model and age (Fig. 1). Image quality degradation could be observed over time and pre-emptive actions were taken avoiding out of tolerance results. Changes to the CT systems, such as major power outages, that may have consequences for image quality, were clearly evident using the new tool.
0
1
2
3
4
5
6
1/05
/1311
/05/1
321
/05/1
331
/05/1
310
/06/1
320
/06/1
330
/06/1
310
/07/1
320
/07/1
3
Date
SD (H
U)
16 MDCT (1)16 MDCT (2)64 MDCT (1)64 MDCT (2)64 MDCT (3)128 MDCT (1)
Fig. 1: Centre Region of Interest (ROI) CT Number Standard Deviation (SD) Variation.
DISCUSSION & CONCLUSIONS: Assessing the signal variability in a homogenous phantom on a daily basis using quantitative uniformity and noise values provides a method for identifying potential artefacts and ensuring that the system remains within manufacturer specifications. Streamlining the daily CT noise and uniformity tests allows for ease of data tracking and comparison over time and with established baselines. It also provides a useful feedback tool for QC.
ACKNOWLEDGEMENTS: This work was made possible with the cooperation of the CT supervisors across Alfred Health.
EPSM-1088 Wed 6th Nov 11:15 Golden Ballroom Centre Radiology Physics
154 Perth Nov 3-7 2013 EPSM 2013
EXPERIENCES DURING ACCEPTANCE TESTING OF A CT MACHINE: DOSE DETERMINATION USING AAPM TG111 USING COMMON NON-TRADIATIONAL RADIOTHERAPY EQUIPMENT L. Munoz Adelaide Radiotherapy Centre, Adelaide, South Australia.
INTRODUCTION: Establishing sound dose optimization for computed tomography (CT) imaging scans is important in diagnostic imaging and radiotherapy departments. When considering dose delivered to a patient, a metric known as the computed tomography dose index (CTDI) has been used to estimate the dose delivered during an image set acquisition. The traditional articles of measurement for CTDI100, namely a 100mm pencil ion chamber and associated regular right angle polymethyl methacrylate (PMMA) dosimetry cylinders are used for acquiring dose across a single axial scan. Physicists without the traditional articles of measurement can confidently determine dose using the AAPM Task Group 111: Comprehensive Methodology for the Evaluation of Radiation Dose in X-ray Computed Tomography [1]. This task group report can be used to investigate CT dose with regular radiotherapy equipment. The CT dose measurement was completed using a common small volume ionization chamber and anthropomorphic radiotherapy phantom.
METHODS: An anthropomorphic phantom was used to establish dose equilibrium along its length for a number of imaging protocols on a Siemens Emotion 16 slice CT machine. Results were compared with reported CTDIvol doses on the console to ensure delivered doses were within manufacturer’s specifications. Measurements were made with and without dose reduction algorithms to validate reported dose reductions applied to the inhomogeneous phantom. Free in air dose equilibrium was also acquired to establish a reference measurement for future quality control tests.
RESULTS: Results gathered from the procedure were within 20% of console reported doses [2].
DISCUSSION & CONCLUSIONS: The determination of dose within an anthropomorphic phantom using a small volume ion chamber was conducted and confidence was established in using non-traditional methods of acquiring dose using AAPM TG111: Comprehensive Methodology for the Evaluation of Radiation Dose in X-ray Computed Tomography.
REFERENCES: 1. AAPM Report No. 111: Comprehensive Methodology for the Evaluation of Radiation Dose in X-Ray Computed Tomography: Report of AAPM Task Group 111: The Future of CT Dosimetry. American Association of Physicists in Medicine (AAPM) Task Group; 2010. 2. AAPM Report No. 66: Quality assurance for computed-tomography simulators and the computed tomography - simulation process: Report of the AAPM Radiation Therapy Committee Task Group No. 66: American Association of Physicists in Medicine (AAPM) Task Group; 2003.p 2763
ACKNOWLEDGEMENTS: I would like to acknowledge the support from Jason Morton, Senior Physicist at Adelaide Radiotherapy Centre.
EPSM-1103 Wed 6th Nov 11:30 Golden Ballroom Centre Radiology Physics
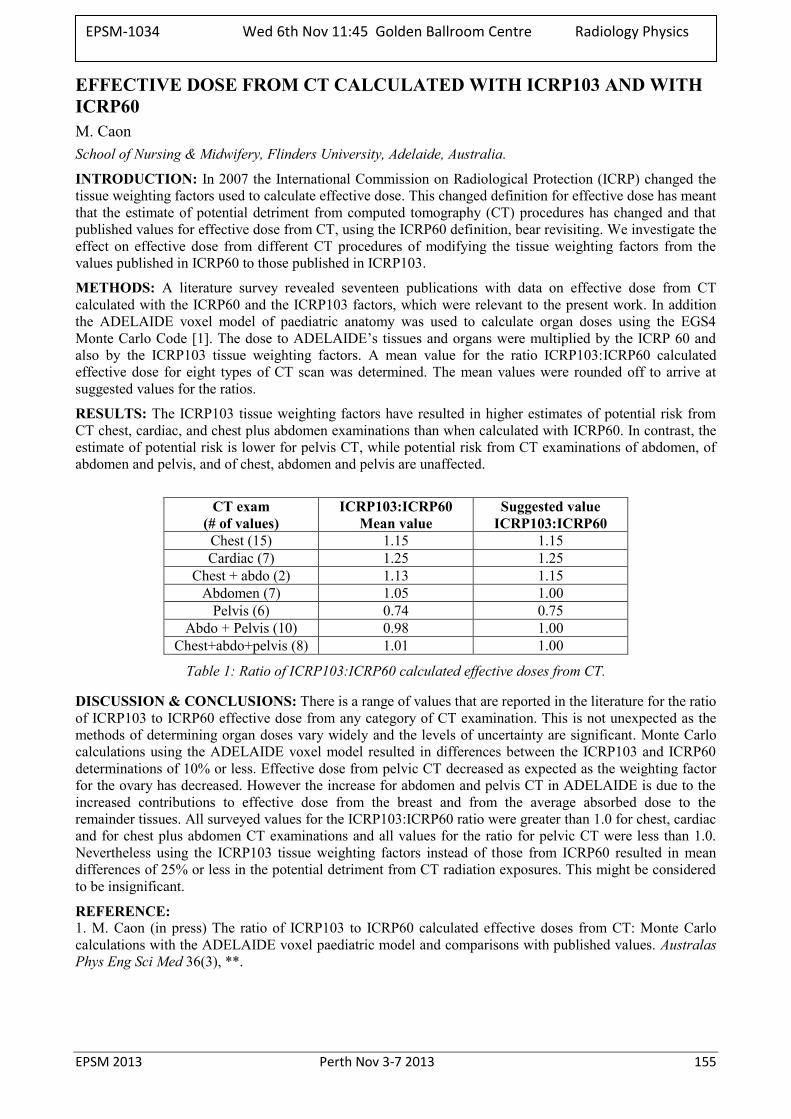
EPSM 2013 Perth Nov 3-7 2013 155
EFFECTIVE DOSE FROM CT CALCULATED WITH ICRP103 AND WITH ICRP60 M. Caon School of Nursing & Midwifery, Flinders University, Adelaide, Australia.
INTRODUCTION: In 2007 the International Commission on Radiological Protection (ICRP) changed the tissue weighting factors used to calculate effective dose. This changed definition for effective dose has meant that the estimate of potential detriment from computed tomography (CT) procedures has changed and that published values for effective dose from CT, using the ICRP60 definition, bear revisiting. We investigate the effect on effective dose from different CT procedures of modifying the tissue weighting factors from the values published in ICRP60 to those published in ICRP103.
METHODS: A literature survey revealed seventeen publications with data on effective dose from CT calculated with the ICRP60 and the ICRP103 factors, which were relevant to the present work. In addition the ADELAIDE voxel model of paediatric anatomy was used to calculate organ doses using the EGS4 Monte Carlo Code [1]. The dose to ADELAIDE’s tissues and organs were multiplied by the ICRP 60 and also by the ICRP103 tissue weighting factors. A mean value for the ratio ICRP103:ICRP60 calculated effective dose for eight types of CT scan was determined. The mean values were rounded off to arrive at suggested values for the ratios.
RESULTS: The ICRP103 tissue weighting factors have resulted in higher estimates of potential risk from CT chest, cardiac, and chest plus abdomen examinations than when calculated with ICRP60. In contrast, the estimate of potential risk is lower for pelvis CT, while potential risk from CT examinations of abdomen, of abdomen and pelvis, and of chest, abdomen and pelvis are unaffected.
CT exam
(# of values) ICRP103:ICRP60
Mean value Suggested value
ICRP103:ICRP60 Chest (15) 1.15 1.15 Cardiac (7) 1.25 1.25
Chest + abdo (2) 1.13 1.15 Abdomen (7) 1.05 1.00
Pelvis (6) 0.74 0.75 Abdo + Pelvis (10) 0.98 1.00
Chest+abdo+pelvis (8) 1.01 1.00
Table 1: Ratio of ICRP103:ICRP60 calculated effective doses from CT.
DISCUSSION & CONCLUSIONS: There is a range of values that are reported in the literature for the ratio of ICRP103 to ICRP60 effective dose from any category of CT examination. This is not unexpected as the methods of determining organ doses vary widely and the levels of uncertainty are significant. Monte Carlo calculations using the ADELAIDE voxel model resulted in differences between the ICRP103 and ICRP60 determinations of 10% or less. Effective dose from pelvic CT decreased as expected as the weighting factor for the ovary has decreased. However the increase for abdomen and pelvis CT in ADELAIDE is due to the increased contributions to effective dose from the breast and from the average absorbed dose to the remainder tissues. All surveyed values for the ICRP103:ICRP60 ratio were greater than 1.0 for chest, cardiac and for chest plus abdomen CT examinations and all values for the ratio for pelvic CT were less than 1.0. Nevertheless using the ICRP103 tissue weighting factors instead of those from ICRP60 resulted in mean differences of 25% or less in the potential detriment from CT radiation exposures. This might be considered to be insignificant.
REFERENCE: 1. M. Caon (in press) The ratio of ICRP103 to ICRP60 calculated effective doses from CT: Monte Carlo calculations with the ADELAIDE voxel paediatric model and comparisons with published values. Australas Phys Eng Sci Med 36(3), **.
EPSM-1034 Wed 6th Nov 11:45 Golden Ballroom Centre Radiology Physics
156 Perth Nov 3-7 2013 EPSM 2013
APPLYING NOISE REDUCTION CHARACTERISTICS OF SIEMENS STELLAR CT DETECTOR TO DOSE OPTIMISATION D. Schick Biomedical Technology Services (BTS), Princess Alexandra Hospital, Brisbane, Queensland.
INTRODUCTION: Substantial cooperative work between BTS physics and Princess Alexandra Hospital (PAH) Radiology department staff has been previously undertaken in an effort to optimise scan protocols on the Siemens Definition Flash scanner installed in the Emergency Department (ED). A new Flash scanner with Stellar Detector has recently been installed in the medical imaging (MI) area at PAH. Siemens claims noise reduction (principally electronic) associated with this new system1. Initially, protocols were directly transferred from the ED to the MI scanner however it was thought that the lower detector noise may provide opportunity for radiation dose reduction without increased image noise on the new system. Given that image noise is mainly governed by the effective mAs of the scan, and that the Siemens Quality Reference mAs (QRef) determines this noise level, the main question to be answered from this experimental work was, “what change to QRef will result in the same image noise on the new MI scanner as is currently achieved on the ED scanner?”.
METHODS: Three (3) cylindrical water phantoms of 24, 32, and 40cm diameter respectively were sourced from Radiation Oncology at PAH (Toshiba Aquilion scanner). These phantom sizes were deemed to represent a relatively small, average and large sized patient’s body. Each water phantom was imaged in the ED and MI scanners using various protocols (varied slice thickness, FBP vs iterative, and kernel changes) and at a range of QRef values. Noise was measured as the standard deviation of HU values in a 2cm diameter circular ROI at image centre.
Preliminary investigations were performed at a range of fixed effective mAs settings so as to show noise changes solely associated with system detector differences. Subsequently measurements were extended to examine the noise versus QRef relationships so as to guide protocol modification.
RESULTS: Image noise is reduced with the Stellar Detector. The effect is more significant for low dose protocols where electronic noise dominates. The lower noise facilitates a dose reduction of about 20% via QRef reduction for body scan protocols with existing QRef less than about 200mAs. The lower electronic noise benefit extends to higher QRef values for larger simulated patients. Axial slice spatial resolution is not affected.
DISCUSSION & CONCLUSIONS: CT vendors regularly claim that they have introduced technology facilitating substantial radiation dose reductions. The placement of two systems of the same model at PAH, with the key difference between systems being essentially limited to a detector bank upgrade provided a unique opportunity to characterise and make use of (for dose optimisation) this new technology. In this case, the dose reduction potential can be simply realised by adjustment of a single AEC parameter (20% reduction of QRef). Further work is required to examine dose reduction potential for head scans.
REFERENCE: 1. S. Ulzheimer and J. Freund (2012). The Stellar Detector, Siemens Medical Solutions White Paper. Available at usa.healthcare.siemens.com.
EPSM-1101 Wed 6th Nov 12:00 Golden Ballroom Centre Radiology Physics

EPSM 2013 Perth Nov 3-7 2013 157
QUANTITATIVE MRI APPLICATIONS IN BIOMEDICAL RESEARCH M.J. House School of Physics, The University of Western Australia, Perth, Western Australia.
ABSTRACT: Magnetic Resonance Imaging (MRI) is an incredibly versatile imaging modality stemming from the wide range of approaches that can be applied to generate image contrast. While qualitative imaging is common in clinical MRI, increasingly quantitative methods capable of measuring molecular tissue properties are being exploited. In this seminar I will present an overview of my research focusing on the application of quantitative MRI approaches in biomedical research.
The seminar will comprise two themes: 1) Quantification based on in-situ/natural physical properties related to disease This topic will look at ways to measure and map the distribution of:
IRON in the Alzheimer’s disease brain and in the heart of transfused patients (exploiting T2 dephasing). [1-4]
FAT in the liver (exploiting chemical shift). [5] FIBROSIS in the liver using a multipronged approach (exploiting diffusion effects, texture analysis,
dynamic contrast). 2) Quantification and monitoring based on synthetic imaging agents (Iron oxides, manganese)
Cell tracking studies. [6] Biodistribution of therapeutics in a pre-clinical (Guinea pig) model of heart disease. [7] Monitoring diffusion processes via a manganese agent. Dynamic processes associated with magnetic nanoparticles. [8,9]
REFERENCES: 1. House MJ, St Pierre TG, Foster JK, Martins RN, Clarnette R (2006) Quantitative MR Imaging R2
relaxometry in elderly participants reporting memory loss. American Journal of Neuroradiology 27: 430-439.
2. House MJ, St Pierre TG, Kowdley KV, Montine T, Connor J, et al. (2007) Correlation of proton transverse relaxation rates (R2) with iron concentrations in postmortem brain tissue from Alzheimer's disease patients. Magnetic Resonance in Medicine 57: 172-180.
3. House MJ, St Pierre TG, McLean C (2008) 1.4 T study of proton magnetic relaxation rates, iron concentrations and plaque burden in Alzheimer's disease and control post-mortem brain tissue. Magnetic Resonance in Medicine 60: 41-52.
4. Carpenter J-P, He T, Kirk P, Roughton M, Anderson LJ, et al. (2011) On T2* Magnetic Resonance and Cardiac Iron. Circulation 123: 1519-1528.
5. House MJ, Gan EK, Adams LA, Ayonrinde OT, Bangma SJ, et al. (2013) Diagnostic Performance of a Rapid Magnetic Resonance Imaging Method of Measuring Hepatic Steatosis. PLoS ONE 8: e59287.
6. Weis C, Blank F, West A, Black G, Woodward RC, et al. (2013) Labeling of cancer cells with magnetic nanoparticles for magnetic resonance imaging. Magnetic Resonance in Medicine In Press.
7. Clemons TD, Viola HM, House MJ, Iyer KS, Hool LC (2013) Examining Efficacy of “TAT-less” Delivery of a Peptide against the L-Type Calcium Channel in Cardiac Ischemia–Reperfusion Injury. ACS Nano 7: 2212-2220.
8. Saville SL, Woodward RC, House MJ, Tokarev A, Hammers J, et al. (2013) The effect of magnetically induced linear aggregates on proton transverse relaxation rates of aqueous suspensions of polymer coated magnetic nanoparticles. Nanoscale 5: 2152-2163.
9. Balasubramaniam S, Pothayee N, Lin Y, House M, Woodward RC, et al. (2011) Poly(N-isopropylacrylamide)-Coated Superparamagnetic Iron Oxide Nanoparticles: Relaxometric and Fluorescence Behavior Correlate to Temperature-Dependent Aggregation. Chemistry of Materials 23: 3348-3356.
EPSM-1043 Wed 6th Nov 12:15 Golden Ballroom Centre Radiology Physics
158 Perth Nov 3-7 2013 EPSM 2013
FLATTENING FILTER FREE BEAMS FOR SBRT C.R. Hansen1,4, A. Bertelsen1, R.L. Christiansen1, O. Hansen3, C. Brink1,2, D.I. Thwaites4 1Laboratory of Radiation Physics, Odense University Hospital, Denmark. 2Institute of Clinical Research, University of Southern Denmark, Odense, Denmark. 3Department of Oncology, Odense University Hospital, Odense, Denmark. 4Institute of Medical Physics, School of Physics, University of Sydney, Sydney, Australia.
INTRODUCTION: Use of Stereotactic Body Radiation Therapy (SBRT) is becoming more widespread. The high doses and few fractions present new challenges since random uncertainties may translate into systematic uncertainties e.g. setup errors. Even intra-fractional uncertainties can translate into a systematic error for treatment courses of few fractions. Flattening Filter Free beams (FFF) have the potential to reduce the delivery time compared to conventional flattened beams (FB). The current study investigates their potential in reducing the delivery time and compares agreement between delivered and planned doses for both FB and FFF.
METHODS: The study included all 21 (12 male and 9 female) SBRT patients treated in the first half of 2013 at Odense University Hospital. The inclusion criteria were single target and prescription dose of 66 Gy in 3 fractions. Median age of the patients was 73 years (57-85). Tumour stage of the patients were 9 at T1, 9 at T2 and 3 at T3.
All patients were re-planned in Pinnacle ver. 9.2 for the Versa HD Elekta accelerator. The same optimisation criteria were used for both FB and FFF. All plans consisted of dual VMAT arcs, to accommodate re-imaging midway through the delivery; the first arc covering 200 degrees and the second 180 degrees, both restricted to the ipsilateral lung. Calibrated at D100, the dose rates were 4.65 Gy/min and 12.90 Gy/min for FB and FFF, respectively; (at Dmax ~5.6 Gy/min and ~15.50 Gy/min).
All treatment plan deliveries were measured using the Sun Nuclear ArcCheck phantom and analysed using a 3% and 3 mm gamma analysis between planned and measured doses Beam on times were recorded for each beam.
All uncertainties are stated as one standard deviation.
RESULTS: The treatment times were reduced significantly for the FFF treatments. The average beam on time was 382 ± 30 sec and 148 ± 12 sec for FB and FFF, respectively. The MU per plan was statistically significantly lower for the FFF plans; however the difference is of little clinical relevance (2877±231 MU vs. 2841±237).
The gamma analysis showed good agreement between planned and delivered doses for both FB and FFF plans. The average 3%/3mm pass rates were 99.3±1.0% for FB and 98.0±1.1% for FFF. A paired Wilcoxon Signed-Ranks Test showed FB to have a statically significant higher pass rate. However all plans passed the 95% pass rate criteria.
DISCUSSION & CONCLUSIONS: The FFF SBRT treatment reduces the beam on time, on average by 233 sec. (61% reduction of the initial delivery time). This time reduction could remove the need for dual arc, since the risk of intra-fractional setup uncertainties is significantly reduced, which would improve the SBRT work flow even further. The treatment delivery was shown to be of high accuracy.
ACKNOWLEDGEMENTS: This work was supported by DoHA, BARO (Department of Health and Ageing, Better Access to Radiation Oncology), Region of Southern Denmark, CIRRO (The Lundbeck Foundation Centre for Interventional Research in Radiation Oncology) and DSKO (Danish Society for Clinical Oncology).
EPSM-1061 Wed 6th Nov 10:45 Golden Ballroom North Radiotherapy
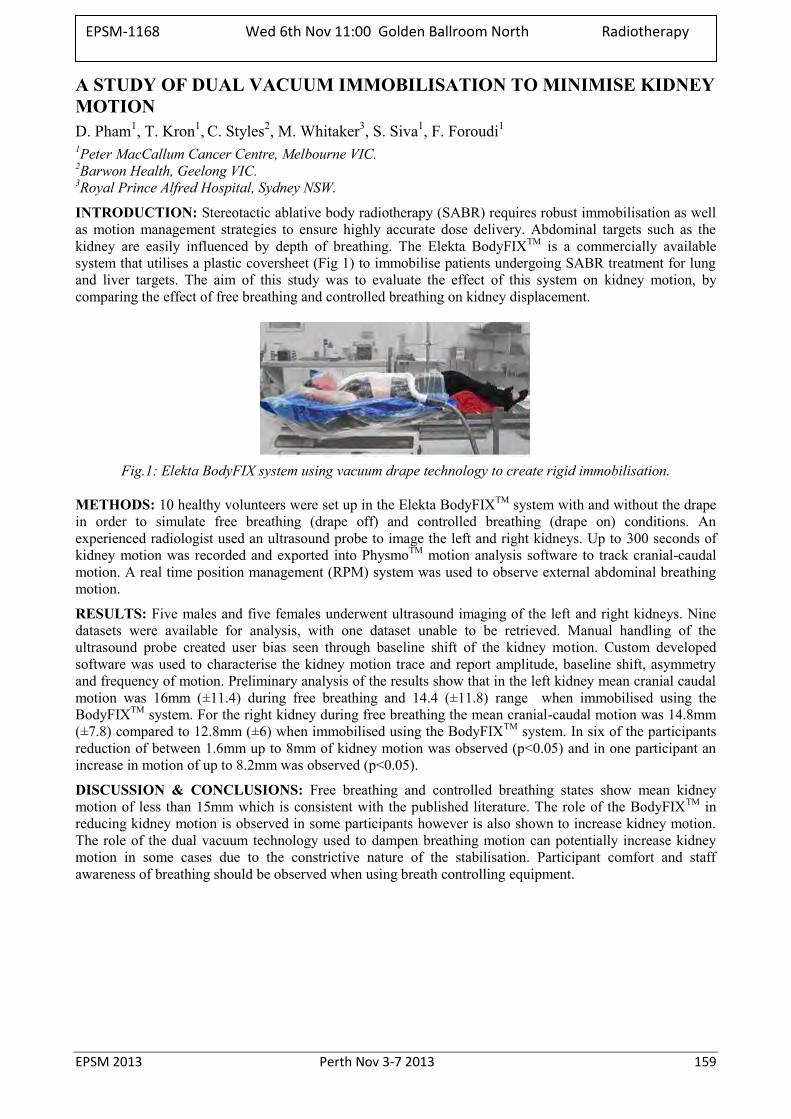
EPSM 2013 Perth Nov 3-7 2013 159
A STUDY OF DUAL VACUUM IMMOBILISATION TO MINIMISE KIDNEY MOTION D. Pham1, T. Kron1, C. Styles2, M. Whitaker3, S. Siva1, F. Foroudi1 1Peter MacCallum Cancer Centre, Melbourne VIC. 2Barwon Health, Geelong VIC. 3Royal Prince Alfred Hospital, Sydney NSW.
INTRODUCTION: Stereotactic ablative body radiotherapy (SABR) requires robust immobilisation as well as motion management strategies to ensure highly accurate dose delivery. Abdominal targets such as the kidney are easily influenced by depth of breathing. The Elekta BodyFIXTM is a commercially available system that utilises a plastic coversheet (Fig 1) to immobilise patients undergoing SABR treatment for lung and liver targets. The aim of this study was to evaluate the effect of this system on kidney motion, by comparing the effect of free breathing and controlled breathing on kidney displacement.
Fig.1: Elekta BodyFIX system using vacuum drape technology to create rigid immobilisation.
METHODS: 10 healthy volunteers were set up in the Elekta BodyFIXTM system with and without the drape in order to simulate free breathing (drape off) and controlled breathing (drape on) conditions. An experienced radiologist used an ultrasound probe to image the left and right kidneys. Up to 300 seconds of kidney motion was recorded and exported into PhysmoTM motion analysis software to track cranial-caudal motion. A real time position management (RPM) system was used to observe external abdominal breathing motion.
RESULTS: Five males and five females underwent ultrasound imaging of the left and right kidneys. Nine datasets were available for analysis, with one dataset unable to be retrieved. Manual handling of the ultrasound probe created user bias seen through baseline shift of the kidney motion. Custom developed software was used to characterise the kidney motion trace and report amplitude, baseline shift, asymmetry and frequency of motion. Preliminary analysis of the results show that in the left kidney mean cranial caudal motion was 16mm (±11.4) during free breathing and 14.4 (±11.8) range when immobilised using the BodyFIXTM system. For the right kidney during free breathing the mean cranial-caudal motion was 14.8mm (±7.8) compared to 12.8mm (±6) when immobilised using the BodyFIXTM system. In six of the participants reduction of between 1.6mm up to 8mm of kidney motion was observed (p<0.05) and in one participant an increase in motion of up to 8.2mm was observed (p<0.05).
DISCUSSION & CONCLUSIONS: Free breathing and controlled breathing states show mean kidney motion of less than 15mm which is consistent with the published literature. The role of the BodyFIXTM in reducing kidney motion is observed in some participants however is also shown to increase kidney motion. The role of the dual vacuum technology used to dampen breathing motion can potentially increase kidney motion in some cases due to the constrictive nature of the stabilisation. Participant comfort and staff awareness of breathing should be observed when using breath controlling equipment.
EPSM-1168 Wed 6th Nov 11:00 Golden Ballroom North Radiotherapy
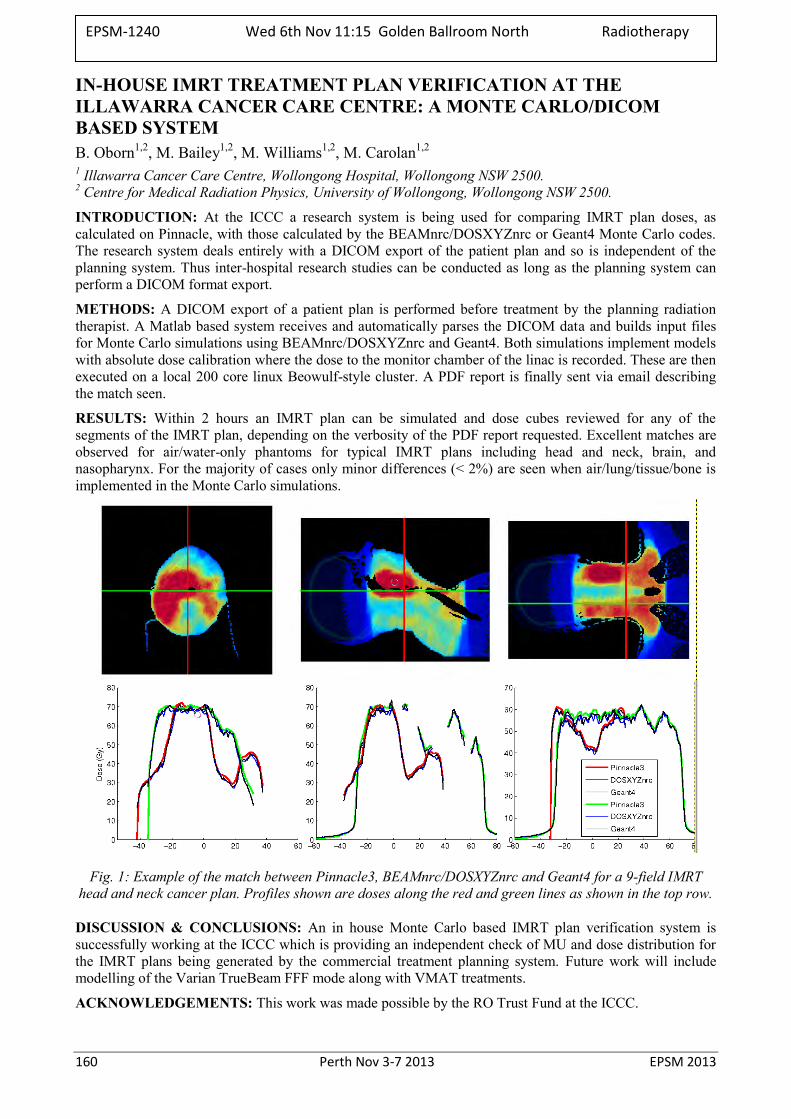
160 Perth Nov 3-7 2013 EPSM 2013
IN-HOUSE IMRT TREATMENT PLAN VERIFICATION AT THE ILLAWARRA CANCER CARE CENTRE: A MONTE CARLO/DICOM BASED SYSTEM B. Oborn1,2, M. Bailey1,2, M. Williams1,2, M. Carolan1,2 1 Illawarra Cancer Care Centre, Wollongong Hospital, Wollongong NSW 2500. 2 Centre for Medical Radiation Physics, University of Wollongong, Wollongong NSW 2500.
INTRODUCTION: At the ICCC a research system is being used for comparing IMRT plan doses, as calculated on Pinnacle, with those calculated by the BEAMnrc/DOSXYZnrc or Geant4 Monte Carlo codes. The research system deals entirely with a DICOM export of the patient plan and so is independent of the planning system. Thus inter-hospital research studies can be conducted as long as the planning system can perform a DICOM format export.
METHODS: A DICOM export of a patient plan is performed before treatment by the planning radiation therapist. A Matlab based system receives and automatically parses the DICOM data and builds input files for Monte Carlo simulations using BEAMnrc/DOSXYZnrc and Geant4. Both simulations implement models with absolute dose calibration where the dose to the monitor chamber of the linac is recorded. These are then executed on a local 200 core linux Beowulf-style cluster. A PDF report is finally sent via email describing the match seen.
RESULTS: Within 2 hours an IMRT plan can be simulated and dose cubes reviewed for any of the segments of the IMRT plan, depending on the verbosity of the PDF report requested. Excellent matches are observed for air/water-only phantoms for typical IMRT plans including head and neck, brain, and nasopharynx. For the majority of cases only minor differences (< 2%) are seen when air/lung/tissue/bone is implemented in the Monte Carlo simulations.
Fig. 1: Example of the match between Pinnacle3, BEAMnrc/DOSXYZnrc and Geant4 for a 9-field IMRT head and neck cancer plan. Profiles shown are doses along the red and green lines as shown in the top row.
DISCUSSION & CONCLUSIONS: An in house Monte Carlo based IMRT plan verification system is successfully working at the ICCC which is providing an independent check of MU and dose distribution for the IMRT plans being generated by the commercial treatment planning system. Future work will include modelling of the Varian TrueBeam FFF mode along with VMAT treatments.
ACKNOWLEDGEMENTS: This work was made possible by the RO Trust Fund at the ICCC.
EPSM-1240 Wed 6th Nov 11:15 Golden Ballroom North Radiotherapy
EPSM 2013 Perth Nov 3-7 2013 161
CHALLENGING RESEARCH PROBLEMS IN PRESENT DAY PROTON BEAM THERAPY J. Seco Department of Radiation Oncology, Harvard Medical School and Massachusetts General Hospital, Boston,
MA 02114, USA.
Proton beam radiotherapy offers many advantageous relative to standard photon beam therapy, of which the biggest is the significant sparing of organs surrounding the tumour to un-needed radiation. However, several major research issues still remain in proton beam radiotherapy. Proton range uncertainties have been the dominant research interest in the past 20years. Several factors contribute to proton range uncertainties such as i) inaccurate proton stopping power estimates from X-ray CT, ii) tumour motion, iii) inaccuracies in the commercial dose algorithms, etc, and no one solution exists at present that can resolve all these issues.
In the past 5 years, proton research has mainly focused on trying to reduce proton range uncertainties in patients by using various types of imaging technologies such as i) positron emission tomography, PET, ii) proton CT, iii) prompt gamma imaging, iv) magnetic resonance imaging, MRI, v) implanted detectors, etc. We will present the various approaches and discuss how these can potentially be developed and implemented in a proton therapy clinic. We will also discuss future challenging research problems that remain in proton radiotherapy.
EPSM-1253 Wed 6th Nov 11:45 Golden Ballroom North Radiotherapy
162 Perth Nov 3-7 2013 EPSM 2013
MULTI-CENTRE ASSESSMENT OF A 4D RADIOTHERAPY QUALITY ASSURANCE PHANTOM M. Kafrouni1,2,3, S. Downes1, S. Corde1, D. Thwaites2 1Department of Radiation Oncology, Prince of Wales hospital, Randwick, NSW, Australia. 2Institute of Medical Physics, School of Physics, University of Sydney, Sydney, NSW, Australia. 3Faculté de médecine, Université Paris Sud (Paris XI), France.
INTRODUCTION: A dynamic thorax or ‘respiratory’ phantom was designed and constructed in-house for commissioning and quality assurance of hypo-fractionated 4D lung treatments at the Prince of Wales Hospital (POWH), Randwick, NSW. The aim of this study was to assess the application of the quality assurance procedure and phantom to the motion management techniques of other hospitals which use differing methods of simulation, planning, image guidance and treatment delivery.
METHODS: The respiratory phantom was taken to five radiotherapy departments in NSW where the imaging, planning and treatment were performed according to the local 4D protocols. Doses were measured using a small volume cc04 ionisation chamber (Scanditronix/Wellhofer®) for up to twelve treatment plans combining three breathing rates (9, 14 and 24 bpm) and four motion amplitudes (0.5, 0.9, 1.9 and 2.8 cm) for the small Solid Water™ tumour moving in the cranio-caudal direction. The types of CT scanners used in the study were a Philips (Brilliance Big Bore®), Toshiba (Aquilion™ large bore), and General Electric (Lightspeed®) using the Varian Real-time Position Management™ system, while planning was performed with the Varian Eclipse™ (AAA v11.0.31, v10.0.28), Philips ADAC Pinnacle® (v9.2) and Elekta CMS XiO® (v4.6) systems. Delivery of treatment to the respiratory phantom was made with Elekta (Axesse™ and Synergy®) and Varian (True Beam™ and and NovalisTM) linacs for conformal and VMAT plans.
RESULTS: For all the measurements performed in the different hospitals, the differences between planned and measured point doses were found to be less than 4% which is the limit of the accepted tolerance for 4D treatments [1], i.e. 2% above the limit for stationary ion chamber measurements. Amplitudes and speed of tumour movements did not influence these differences in any of the tested scenarios.
DISCUSSION & CONCLUSIONS: Preliminary results indicate the in-house respiratory phantom was used successfully to perform 4D commissioning and end-to-end quality assurance for different combinations of radiotherapy equipment. The phantom is versatile, modular and cost effective for commissioning and QA of 4D techniques that could also be used for patient specific validation of 4D hypo-fractionated lung treatment plans.
REFERENCES: 1. Report of TG 147 (2012) Quality assurance for non-radiographic radiotherapy localization and positioning systems, AAPM.
ACKNOWLEDGEMENTS: DoHA BARO scheme.
EPSM-1122 Wed 6th Nov 12:15 Golden Ballroom North Radiotherapy
EPSM 2013 Perth Nov 3-7 2013 163
MONTE CARLO SIMULATION TECHNIQUES FOR THE ANGULAR DISTRIBUTION OF COHERENTLY SCATTERED PHOTONS – HOW FAR FROM REAL PHYSICAL MODEL W. Muhammad1,2, S.H. Lee3, S. Maeng3
1Department of Physics, Kyungpook National University, Daegu 702-701, Republic of Korea. 2Department of Medical Physics, Institute of Nuclear Medicine Oncology and Radiotherapy (INOR),
Abbottabad, Pakistan. 3School of Energy Engineering, Kyungpook National University, Daegu 702-701, Republic of Korea.
INTRODUCTION: The application of Rayleigh (coherent) scattering of photons is important in the fields of medical physics and radiation protection domains for quite long time [1,2]. Several Monte Carlo based models, implemented in general purpose Monte Carlo systems for the simulation of coherently scattered photons are available [3-6].
METHODS: These Monte Carlo based models are quantitatively evaluated with respect to the current available state-of-the-art theoretical knowledge and experimental data retrieved from the literature [4,5]. Some of these models are currently implemented in general purpose Monte Carlo systems i.e. GEANT4, MCNP etc. some have been implemented and evaluated for the first time in this study for possible use in Monte Carlo particle transport [6,7].
RESULTS: The results showed that, the Rayleigh scattering in these famous codes is using only real part of the Atomic form factor (i.e. Relativistic Form Factors or Modified Form Factors while ignoring Anomalous Scattering Factors). However, the model based on complex atomic form factors for the Monte Carlo sampling of the coherent scattering has produced an improved and fairly good approximation very near to the corresponding experimental and SM results.
DISCUSSION & CONCLUSIONS: Evaluations of the computational performance of these various simulation algorithms are reported along with the analysis of their physics capabilities. The comparison and evaluation identifies that the model based on complex atomic form factors as the one best reproducing experimental measurements and related scattering matrix (SM) calculations. Furthermore, some extra scientific information in the Monte Carlo sampling of coherent scattering of the photons can be retrieved by using the complex atomic form factors.
REFERENCES: 1. S. C. Roy, L. Kissel. R. H. Pratt (1999), Elastic scattering of photons. Radiation Physics and Chemistry
56: 3-26. 2. S. C. Roy R. H. Pratt L. Kissel (1993) Rayleigh scattering by energetic photons: Development of theory
and current status. Radiation Physics and Chemistry 41: 725-738. 3. X-5 TMC (2003) MCNP — A General Monte Carlo N-Particle Transport Code, Version 5. Los Alamos
National Laboratory. 4. M. Batič, G. Hoff, M. G. Pia, and P. Saracco, (2012), Photon elastic scattering simulation: validation and
improvements to Geant4, IEEE Trans. Nucl. Sci. 59(4) 1636-1664. 5. R. H. Pratt, L. Kissel, P. M. J. Bergstrom (1994) New relativistic S-matrix results for scattering -- beyond
the usual anomalous factors/beyond impulse approximation. In: Materlik G SCFK, editor. Resonant Anomalous X-Ray Scattering. Amsterdam: Elsevier Science. pp. 9-33.
6. W. Muhammad and S. H. Lee (2013) Source of statistical noises in the Monte Carlo sampling techniques for coherently scattered photons. Journal of Radiation Research 54: 190-201.
7. W. Muhammad and S.H. Lee (2013) Impact of anomalous effects on the angular distribution of coherently scattered photons using Monte Carlo simulation. Acta Crystallographica Section A: Foundations of Crystallography 69: 297-308.
ACKNOWLEDGEMENTS: This research was financially supported by the Ministry of Education (MOE) and National Research Foundation of Korea (NRF) through the Human Resource Training Project for Regional Innovation (2012H1B8A2026280).
EPSM-1095 Wed 6th Nov 12:30 Golden Ballroom North Other
164 Perth Nov 3-7 2013 EPSM 2013
NEW PARADIGMS IN CANCER TREATMENT: THE EVOLUTION OF TARGETED THERAPIES D.J.L. Joske1 2 1 Haematology Department, Sir Charles Gairdner Hospital, Perth, Western Australia 6009 2 Clinical Professor of Medicine, University of Western Australia, Western Australia 6009.
INTRODUCTION: Mainstream cancer care has evolved. Traditionally, treatment focused on eradication of tumour through surgery, chemotherapy or radiotherapy (“cut, poison or burn”). Multi-modality therapy integrated these in increasingly complex ways, e.g. in pre-operative radiotherapy for colorectal carcinomas. Recently however, new innovative approaches, targeting cancer cells in various ways, offer the promise of better results with fewer side effects.
METHODS: The cancer target may be cell surface molecules, intracellular proteins, or nucleic acids. Examples to be presented include the extraordinary story of Imatinib (Glivec) in the treatment of chronic myeloid leukaemia (CML); the use of monoclonal antibodies for B-cell lympho-proliferative disorders; and the use of these linked to a dose of radionucleotide (radiolabelled rituximab).
CML was the first human cancer linked to an acquired chromosomal abnormality, subsequently shown to be a reciprocal translocation between chromosomes 9 and 22. The resulting fusion gene product, BCR-ABL, was shown to be the causative agent of the disease. CML has an incidence in Australia of some 200 new cases per year and more than 1300 prevalent cases. Treatment with imatinib powerful vindicates the concept of rational, gene-targeted drug design. Five-year published experience with imatinib at 400mg orally daily demonstrates 89% overall survival and an estimated 93% freedom from disease progression. And yet the development of this drug was nearly aborted by the pharmaceutical company involved, until its Managing Director over-ruled his Board.
The monoclonal antibody rituximab has proven extraordinarily efficacious in the treatment of cancers of the B-lymphocyte, including follicular non-Hodgkin lymphoma (NHL), diffuse large B-cell NHL, and chronic lymphocytic leukaemia. Diffuse large B-cell NHL was the first NHL for which cures were demonstrated with CHOP in 1976. Attempts at improving cure rates with intensified chemotherapy were fruitless; the breakthrough was to add rituximab. Rituximab binds to CD20, a pan-B-cell antigen expressed at most stages of B cell development and in high density on the surface of these tumour cells.
Linking rituximab to a dose of radioactivity targets radiotherapy in vivo to the malignant cell, as has been done with the commercial preparations Bexxar and Zevallin. Locally, an in-house preparation at Fremantle Hospital in Western Australia has been in use. The rationale and results with this approach will also be presented.
There is also increasing focus upon the person in whom cancer has developed, recognizing individual variations in chemotherapeutic drug metabolism and capacity for restoring tumour immune surveillance through novel means such as dendritic cell priming and vaccination strategies. Interplay between mood, personality type, immune function and hard cancer out-comes is under study. Microarray technology has discovered insights into tumour cell pathways that may be amenable to targeted interruption. Thus, many believe we are moving towards a new era of individually stratified therapy which will require new standards of proof of efficacy, replacing our prior reliance upon randomised controlled clinical trials. In haematological oncology, several new classes of drugs, all active against a variety of leukaemias and lymphomas, are under intensive investigation and international collaboration is needed to bring these new drugs to the bedside as quickly as possible.
REFERENCES: 1. Joske DJL, Rao A, Kristjanson L. Critical review of Complementary therapies in haemato-oncology. Int
Med J 2006 36 479-586. 2. Joske DJL. Chronic myeloid leukaemia: the evolution of gene-targeted therapy. Med J Aust. 2008 Sep
1;189(5):277-82. 3. Joske DJL. Integrated care for cancer: the SolarisCare experience. In Olver, I, Robotin M (Eds).
Perspectives on Complementary and Alternative Medicines. Cancer Council Australia, Imperial College Press, Sydney 2012.
EPSM-1245 Wed 6th Nov 13:45 Golden Ballroom South Haematology
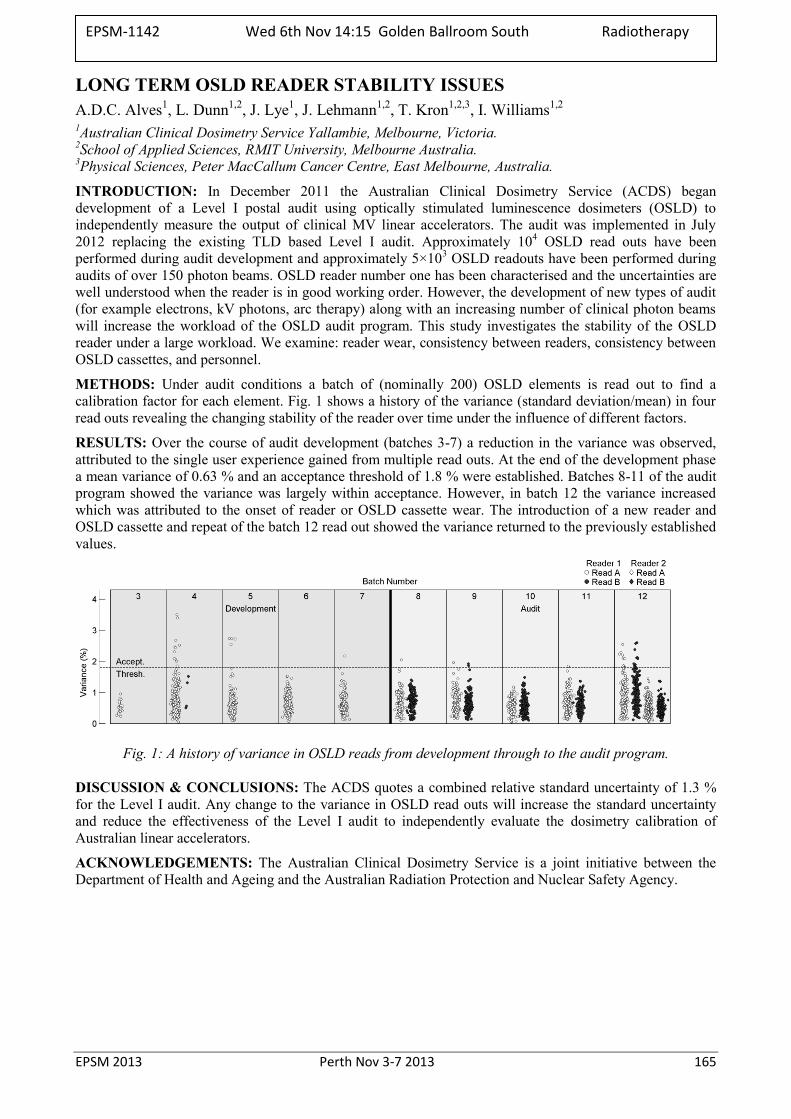
EPSM 2013 Perth Nov 3-7 2013 165
LONG TERM OSLD READER STABILITY ISSUES A.D.C. Alves1, L. Dunn1,2, J. Lye1, J. Lehmann1,2, T. Kron1,2,3, I. Williams1,2 1Australian Clinical Dosimetry Service Yallambie, Melbourne, Victoria. 2School of Applied Sciences, RMIT University, Melbourne Australia. 3Physical Sciences, Peter MacCallum Cancer Centre, East Melbourne, Australia.
INTRODUCTION: In December 2011 the Australian Clinical Dosimetry Service (ACDS) began development of a Level I postal audit using optically stimulated luminescence dosimeters (OSLD) to independently measure the output of clinical MV linear accelerators. The audit was implemented in July 2012 replacing the existing TLD based Level I audit. Approximately 104 OSLD read outs have been performed during audit development and approximately 5×10³ OSLD readouts have been performed during audits of over 150 photon beams. OSLD reader number one has been characterised and the uncertainties are well understood when the reader is in good working order. However, the development of new types of audit (for example electrons, kV photons, arc therapy) along with an increasing number of clinical photon beams will increase the workload of the OSLD audit program. This study investigates the stability of the OSLD reader under a large workload. We examine: reader wear, consistency between readers, consistency between OSLD cassettes, and personnel.
METHODS: Under audit conditions a batch of (nominally 200) OSLD elements is read out to find a calibration factor for each element. Fig. 1 shows a history of the variance (standard deviation/mean) in four read outs revealing the changing stability of the reader over time under the influence of different factors.
RESULTS: Over the course of audit development (batches 3-7) a reduction in the variance was observed, attributed to the single user experience gained from multiple read outs. At the end of the development phase a mean variance of 0.63 % and an acceptance threshold of 1.8 % were established. Batches 8-11 of the audit program showed the variance was largely within acceptance. However, in batch 12 the variance increased which was attributed to the onset of reader or OSLD cassette wear. The introduction of a new reader and OSLD cassette and repeat of the batch 12 read out showed the variance returned to the previously established values.
Fig. 1: A history of variance in OSLD reads from development through to the audit program.
DISCUSSION & CONCLUSIONS: The ACDS quotes a combined relative standard uncertainty of 1.3 % for the Level I audit. Any change to the variance in OSLD read outs will increase the standard uncertainty and reduce the effectiveness of the Level I audit to independently evaluate the dosimetry calibration of Australian linear accelerators.
ACKNOWLEDGEMENTS: The Australian Clinical Dosimetry Service is a joint initiative between the Department of Health and Ageing and the Australian Radiation Protection and Nuclear Safety Agency.
EPSM-1142 Wed 6th Nov 14:15 Golden Ballroom South Radiotherapy
166 Perth Nov 3-7 2013 EPSM 2013
THE IMPLEMENTATION OF A COMMERCIAL QA SOFTWARE PACKAGE INTO A NEW RADIOTHERAPY DEPARTMENT J. Hindmarsh, E. Seymour, R. David, C. Lee
Department of Medical Physics, Central Coast Cancer Centre, Gosford, New South Wales.
INTRODUCTION: ATLAS QA (Sun Nuclear, Melbourne, Fl) is a software package designed to support the QA requirements of linear accelerators. The new Central Coast Cancer Centre (CCCC), officially opened in March 2013, is using this software to store and review QA results on a single database which is advantageous for record keeping in a busy paperless department. Our aim is to extend the ATLAS QA functionality to incorporate the QA requirements of all radiation apparatus and dosimetry equipment at the CCCC into the one software package.
METHODS: A ‘machine’ has been created in ATLAS QA for each radiation apparatus at CCCC. This includes two Varian C-series linear accelerators (Varian Medical Systems, Palo Alto, Ca), an Xstrahl 300 kilovoltage x-ray therapy system (Xstrahl, Surrey) and a Philips Brilliance CT Big Bore Oncology (Philips International, Amsterdam). ATLAS QA is designed to interface with the Daily QA3 check device (Sun Nuclear, Melbourne, Fl), which measures the constancy of output, symmetry, flatness, field size and beam quality, and is used as part of the daily QA of the two linear accelerators and Xstrahl unit. The additional daily QA test results including the safety, imaging, optical and mechanical tests, are also entered into the software and can be reviewed at any time on any computer on the network with the software installed.
For monthly and annual QA, ATLAS QA has a spread sheet functionality based on Excel (Microsoft, Redmond, WA) that enables the user to design their own test record sheets according to individual needs. These spread sheets are also able to be integrated with any of the Sun Nuclear profiler devices, MapCHECK 2, Tomodose and Doselab Pro(Mobius Medical Systems, Houston, Tx) using XML files. The results collected by these devices and software packages can be collated and reviewed in a single database. The spread sheet functionality records results which can be referenced to baseline values. The software also provides a set of sheets based on the AAPM’s TG-142 protocol that can be used if a centre did not want to create its own.
ATLAS QA is also used for the scheduling, recording and tracking of dosimetry equipment and Treatment Planning System (TPS) QA, although it was not designed for this application. ‘Machines’ have been created within ATLAS QA for ‘dosimetry equipment’ and ‘Eclipse TPS’. Faults, errors, servicing and updates can be recorded in the maintenance log and attachments can be added, replacing the need for log books for these purposes.
RESULTS: ATLAS QA has been used to record the results of the daily QA tests for all the ionizing apparatus at CCCC since their clinical release. For Monthly QA, spread sheets for specific tests and purposes have been created. These include sheets to record beam output, beam characteristics, imaging and MLC QA evaluation. The spread sheets for the monthly QA of the kV and CT units are in the process of being established. Strontium-90 QA of ionisation chamber and electrometer combinations will also be recorded in the ATLAS QA.
DISCUSSION & CONCLUSIONS: Our clinical experience has found ATLAS QA to be a useful database program that can be used to record and track daily, monthly and annual QA of the major equipment within a radiation oncology department. The software allows the flexibility to design and schedule a wide range of tests and has proved to be a convenient and robust application, strengthening the department’s document control and quality management procedures.
EPSM-1153 Wed 6th Nov 14:30 Golden Ballroom South Radiotherapy
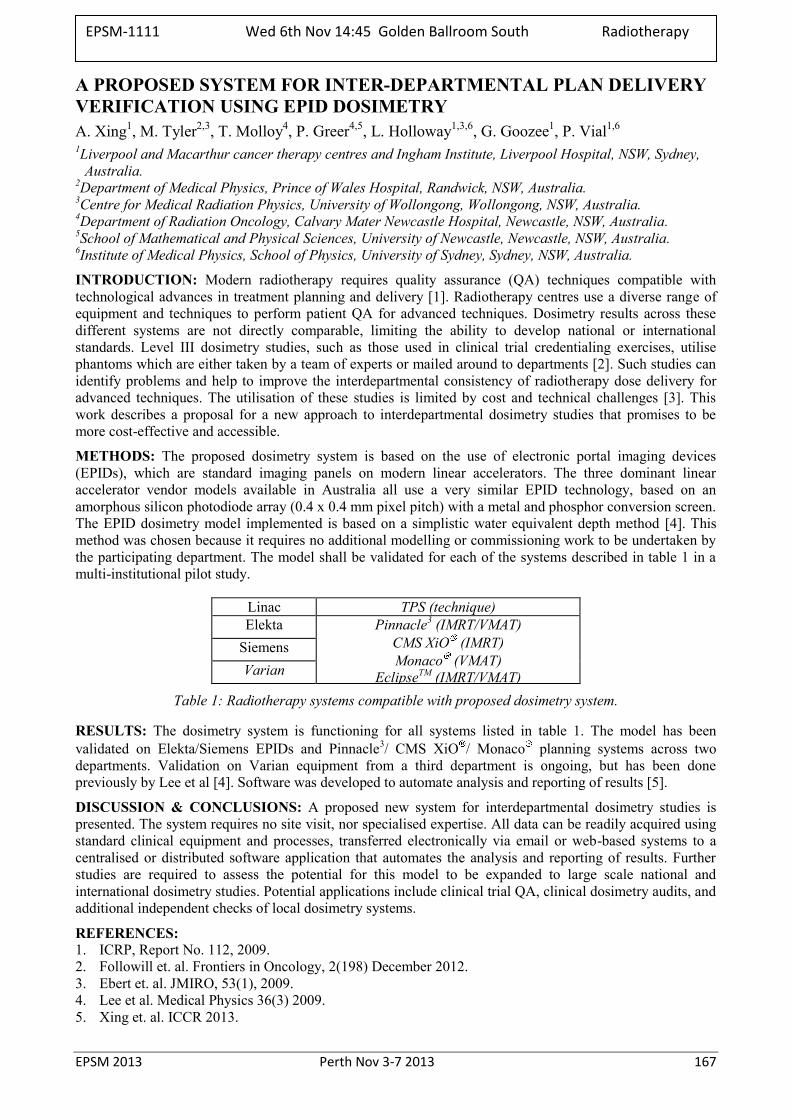
EPSM 2013 Perth Nov 3-7 2013 167
A PROPOSED SYSTEM FOR INTER-DEPARTMENTAL PLAN DELIVERY VERIFICATION USING EPID DOSIMETRY A. Xing1, M. Tyler2,3, T. Molloy4, P. Greer4,5, L. Holloway1,3,6, G. Goozee1, P. Vial1,6 1Liverpool and Macarthur cancer therapy centres and Ingham Institute, Liverpool Hospital, NSW, Sydney,
Australia. 2Department of Medical Physics, Prince of Wales Hospital, Randwick, NSW, Australia. 3Centre for Medical Radiation Physics, University of Wollongong, Wollongong, NSW, Australia. 4Department of Radiation Oncology, Calvary Mater Newcastle Hospital, Newcastle, NSW, Australia. 5School of Mathematical and Physical Sciences, University of Newcastle, Newcastle, NSW, Australia. 6Institute of Medical Physics, School of Physics, University of Sydney, Sydney, NSW, Australia.
INTRODUCTION: Modern radiotherapy requires quality assurance (QA) techniques compatible with technological advances in treatment planning and delivery [1]. Radiotherapy centres use a diverse range of equipment and techniques to perform patient QA for advanced techniques. Dosimetry results across these different systems are not directly comparable, limiting the ability to develop national or international standards. Level III dosimetry studies, such as those used in clinical trial credentialing exercises, utilise phantoms which are either taken by a team of experts or mailed around to departments [2]. Such studies can identify problems and help to improve the interdepartmental consistency of radiotherapy dose delivery for advanced techniques. The utilisation of these studies is limited by cost and technical challenges [3]. This work describes a proposal for a new approach to interdepartmental dosimetry studies that promises to be more cost-effective and accessible.
METHODS: The proposed dosimetry system is based on the use of electronic portal imaging devices (EPIDs), which are standard imaging panels on modern linear accelerators. The three dominant linear accelerator vendor models available in Australia all use a very similar EPID technology, based on an amorphous silicon photodiode array (0.4 x 0.4 mm pixel pitch) with a metal and phosphor conversion screen. The EPID dosimetry model implemented is based on a simplistic water equivalent depth method [4]. This method was chosen because it requires no additional modelling or commissioning work to be undertaken by the participating department. The model shall be validated for each of the systems described in table 1 in a multi-institutional pilot study.
Linac TPS (technique) Elekta Pinnacle3 (IMRT/VMAT)
CMS XiO (IMRT) Monaco (VMAT)
EclipseTM (IMRT/VMAT)
Siemens Varian
Table 1: Radiotherapy systems compatible with proposed dosimetry system.
RESULTS: The dosimetry system is functioning for all systems listed in table 1. The model has been validated on Elekta/Siemens EPIDs and Pinnacle3/ CMS XiO / Monaco planning systems across two departments. Validation on Varian equipment from a third department is ongoing, but has been done previously by Lee et al [4]. Software was developed to automate analysis and reporting of results [5].
DISCUSSION & CONCLUSIONS: A proposed new system for interdepartmental dosimetry studies is presented. The system requires no site visit, nor specialised expertise. All data can be readily acquired using standard clinical equipment and processes, transferred electronically via email or web-based systems to a centralised or distributed software application that automates the analysis and reporting of results. Further studies are required to assess the potential for this model to be expanded to large scale national and international dosimetry studies. Potential applications include clinical trial QA, clinical dosimetry audits, and additional independent checks of local dosimetry systems.
REFERENCES: 1. ICRP, Report No. 112, 2009. 2. Followill et. al. Frontiers in Oncology, 2(198) December 2012. 3. Ebert et. al. JMIRO, 53(1), 2009. 4. Lee et al. Medical Physics 36(3) 2009. 5. Xing et. al. ICCR 2013.
EPSM-1111 Wed 6th Nov 14:45 Golden Ballroom South Radiotherapy
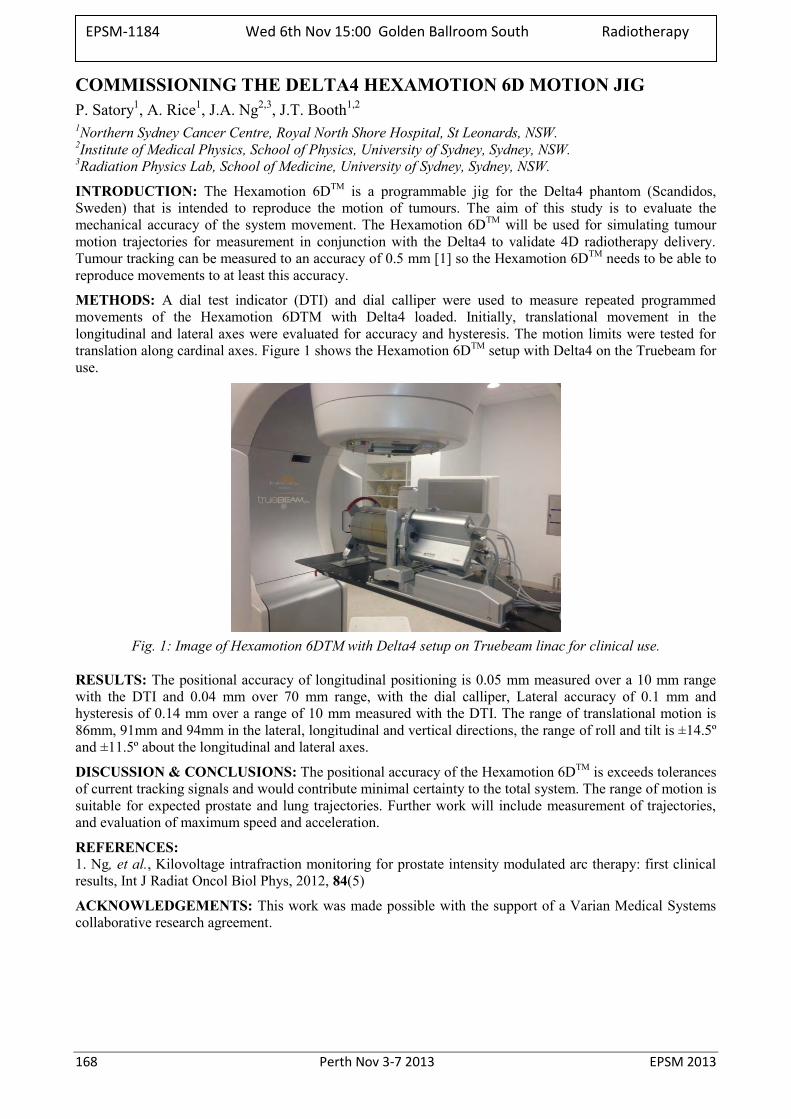
168 Perth Nov 3-7 2013 EPSM 2013
COMMISSIONING THE DELTA4 HEXAMOTION 6D MOTION JIG P. Satory1, A. Rice1, J.A. Ng2,3, J.T. Booth1,2
1Northern Sydney Cancer Centre, Royal North Shore Hospital, St Leonards, NSW. 2Institute of Medical Physics, School of Physics, University of Sydney, Sydney, NSW. 3Radiation Physics Lab, School of Medicine, University of Sydney, Sydney, NSW.
INTRODUCTION: The Hexamotion 6DTM is a programmable jig for the Delta4 phantom (Scandidos, Sweden) that is intended to reproduce the motion of tumours. The aim of this study is to evaluate the mechanical accuracy of the system movement. The Hexamotion 6DTM will be used for simulating tumour motion trajectories for measurement in conjunction with the Delta4 to validate 4D radiotherapy delivery. Tumour tracking can be measured to an accuracy of 0.5 mm [1] so the Hexamotion 6DTM needs to be able to reproduce movements to at least this accuracy.
METHODS: A dial test indicator (DTI) and dial calliper were used to measure repeated programmed movements of the Hexamotion 6DTM with Delta4 loaded. Initially, translational movement in the longitudinal and lateral axes were evaluated for accuracy and hysteresis. The motion limits were tested for translation along cardinal axes. Figure 1 shows the Hexamotion 6DTM setup with Delta4 on the Truebeam for use.
Fig. 1: Image of Hexamotion 6DTM with Delta4 setup on Truebeam linac for clinical use.
RESULTS: The positional accuracy of longitudinal positioning is 0.05 mm measured over a 10 mm range with the DTI and 0.04 mm over 70 mm range, with the dial calliper, Lateral accuracy of 0.1 mm and hysteresis of 0.14 mm over a range of 10 mm measured with the DTI. The range of translational motion is 86mm, 91mm and 94mm in the lateral, longitudinal and vertical directions, the range of roll and tilt is ±14.5º and ±11.5º about the longitudinal and lateral axes.
DISCUSSION & CONCLUSIONS: The positional accuracy of the Hexamotion 6DTM is exceeds tolerances of current tracking signals and would contribute minimal certainty to the total system. The range of motion is suitable for expected prostate and lung trajectories. Further work will include measurement of trajectories, and evaluation of maximum speed and acceleration.
REFERENCES: 1. Ng, et al., Kilovoltage intrafraction monitoring for prostate intensity modulated arc therapy: first clinical results, Int J Radiat Oncol Biol Phys, 2012, 84(5)
ACKNOWLEDGEMENTS: This work was made possible with the support of a Varian Medical Systems collaborative research agreement.
EPSM-1184 Wed 6th Nov 15:00 Golden Ballroom South Radiotherapy
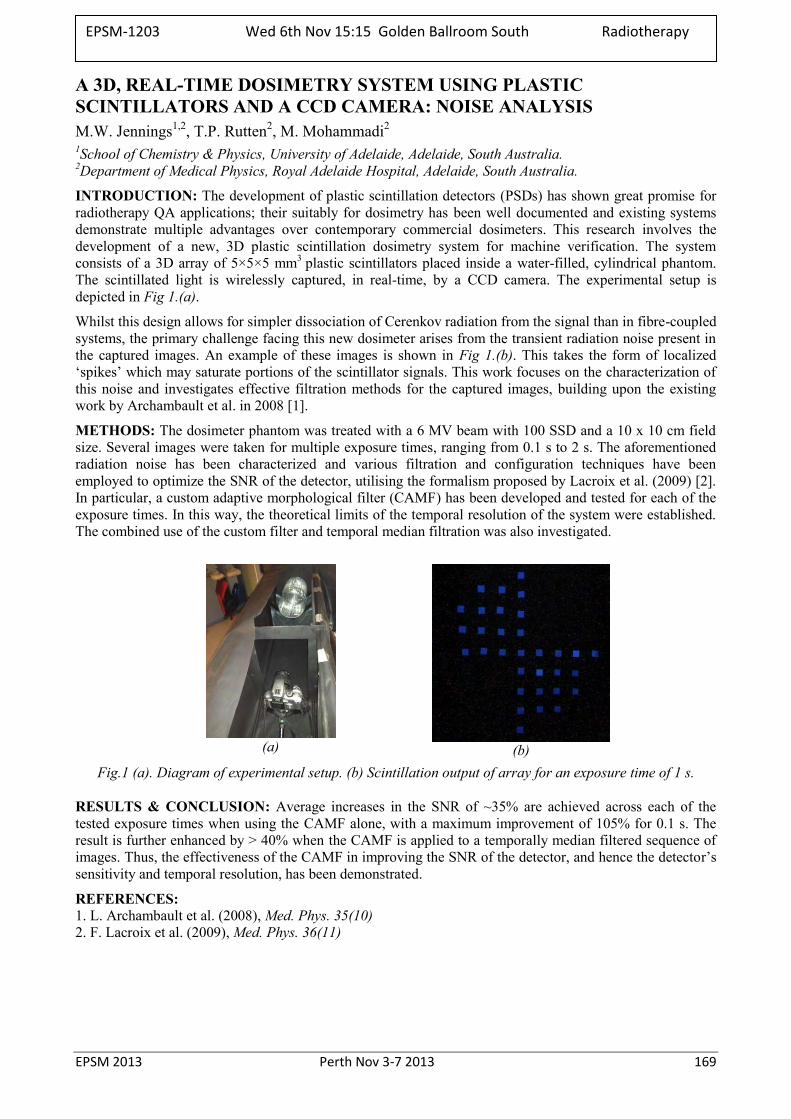
EPSM 2013 Perth Nov 3-7 2013 169
A 3D, REAL-TIME DOSIMETRY SYSTEM USING PLASTIC SCINTILLATORS AND A CCD CAMERA: NOISE ANALYSIS M.W. Jennings1,2, T.P. Rutten2, M. Mohammadi2 1School of Chemistry & Physics, University of Adelaide, Adelaide, South Australia. 2Department of Medical Physics, Royal Adelaide Hospital, Adelaide, South Australia.
INTRODUCTION: The development of plastic scintillation detectors (PSDs) has shown great promise for radiotherapy QA applications; their suitably for dosimetry has been well documented and existing systems demonstrate multiple advantages over contemporary commercial dosimeters. This research involves the development of a new, 3D plastic scintillation dosimetry system for machine verification. The system consists of a 3D array of 5×5×5 mm3 plastic scintillators placed inside a water-filled, cylindrical phantom. The scintillated light is wirelessly captured, in real-time, by a CCD camera. The experimental setup is depicted in Fig 1.(a).
Whilst this design allows for simpler dissociation of Cerenkov radiation from the signal than in fibre-coupled systems, the primary challenge facing this new dosimeter arises from the transient radiation noise present in the captured images. An example of these images is shown in Fig 1.(b). This takes the form of localized ‘spikes’ which may saturate portions of the scintillator signals. This work focuses on the characterization of this noise and investigates effective filtration methods for the captured images, building upon the existing work by Archambault et al. in 2008 [1].
METHODS: The dosimeter phantom was treated with a 6 MV beam with 100 SSD and a 10 x 10 cm field size. Several images were taken for multiple exposure times, ranging from 0.1 s to 2 s. The aforementioned radiation noise has been characterized and various filtration and configuration techniques have been employed to optimize the SNR of the detector, utilising the formalism proposed by Lacroix et al. (2009) [2]. In particular, a custom adaptive morphological filter (CAMF) has been developed and tested for each of the exposure times. In this way, the theoretical limits of the temporal resolution of the system were established. The combined use of the custom filter and temporal median filtration was also investigated.
(a)
(b) Fig.1 (a). Diagram of experimental setup. (b) Scintillation output of array for an exposure time of 1 s.
RESULTS & CONCLUSION: Average increases in the SNR of ~35% are achieved across each of the tested exposure times when using the CAMF alone, with a maximum improvement of 105% for 0.1 s. The result is further enhanced by > 40% when the CAMF is applied to a temporally median filtered sequence of images. Thus, the effectiveness of the CAMF in improving the SNR of the detector, and hence the detector’s sensitivity and temporal resolution, has been demonstrated.
REFERENCES: 1. L. Archambault et al. (2008), Med. Phys. 35(10) 2. F. Lacroix et al. (2009), Med. Phys. 36(11)
EPSM-1203 Wed 6th Nov 15:15 Golden Ballroom South Radiotherapy
170 Perth Nov 3-7 2013 EPSM 2013
RECOGNIZING AND MITIGATING THE INCREASED EYE RISK FROM OCCUPATIONAL DOSES OF IONIZING RADIATION IN THE CARDIAC LABORATORY A.B. Wallace Medical Imaging Section, Australian Radiation Protection & Nuclear Safety Agency, Yallambie, Australia.
INTRODUCTION: The International Commission on Radiological Protection (ICRP) have recently recommended that the occupational dose limit to the lens of the eye be reduced by a factor of approximately 7 times, from 150 mSv per annum to 20 mSv per annum.
DISCUSSION: This reduction has been based on epidemiological evidence of increased risk of paranuclear dot opacities in some occupationally employed groups. It is recognised that operators in angiography procedures may reach this eye dose level in the course of a year’s practice.
It is now strongly recommended that operators use the appropriate personal protective equipment that should be available in all interventional laboratories and be knowledgeable of basic radiation protection strategies for themselves and their staff.
This talk will present the rationale for the new ICRP recommendations, implications for the Australian regulatory environment and a review of best practice for radiation protection of staff in the procedure room.
EPSM-1029 Wed 6th Nov 13:45 Golden Ballroom Centre Radiation Protection
EPSM 2013 Perth Nov 3-7 2013 171
WHAT THE HUMAN RESEARCH ETHICS COMMITTEE WANTS TO KNOW FROM THE MEDICAL PHYSICIST’S DOSE REPORT M. Caon School of Nursing & Midwifery, Flinders University, Adelaide, Australia.
INTRODUCTION: Drug manufacturing companies sponsor international, multicentre clinical trials on human patients to investigate the safety and efficacy of their new drug. Often the trial involves a cancer therapy and efficacy is assessed by measuring tumor size in CT images from examinations taken at intervals of 6 to 8 weeks. The frequency of imaging may be “standard of care” or in some cases in addition to standard care. Usually the research participants, the members of the HREC, the study sponsors and the investigating physicians will know very little about radiation, and are unaware of ARPANSA’s RPS8. Usually the radiation risk statement in the information supplied to participants contains factual errors and omissions [1]. Usually the sponsor/investigator does not provide a medical physicist’s dose report until asked and does not provide a statement that the imaging site is involved in a quality assurance program.
MEDICAL PHYSICIST’S REPORT: The Dose Report prepared for the HREC should contain the type of CT examination(s) and nuclear med. imaging to be performed; the span of anatomy to be scanned; the number of CT phases (with/without contrast). The number of CT examinations to be performed (or performed in a year), how many of these examinations are standard of care and how many are for research purposes only. Radiation exposures that are standard of care do not require radiation risk statements or dose calculations – only the extra examinations for the purposes of research require consideration by the HREC.
The report should confirm the examinations that are standard of care; assess the suitability of the imaging site; present an estimate of dose; state the level of societal benefit to be derived from the study; state that the dose is medically acceptable (or otherwise); and state any restrictions (eg age) to be observed. The physicist should provide a radiation risk statement for inclusion in the participant information.
RADIATION RISK STATEMENT: Statements of radiation-related risk are not required for trials where the participants are patients with a very short life expectancy (say < 2 years) such as patients with advanced non-small cell lung cancer. However life expectancy should be taken into account when drafting a statement. For example, if the prospect of surviving for ten years is low, as for patients with (say) diffuse large B-cell lymphoma, then the potential radiation-induction of cancer is not of concern. However if the median length of survival is considerable, for example 18 years as for stage III Hodgkin lymphoma (and the level of non-standard care imaging is extensive), then it could be recommended that participants be restricted to those over 40 or over 50 years of age.
The physicist should read the radiation information and the risk statement provided in the participant information to ensure that the information about medical imaging is scientifically accurate and understandable to a reader without a physics background (and conforms to the guidelines in ARPANSA RPS8).
DISCUSSION & CONCLUSIONS: The medical physicist should aim to provide their expert guidance to the HREC in the dose report. They should take the opportunity to comment on the number of procedures that are considered to be standard care, and comment on the quality assurance programme of the imaging facility. They could suggest any prudent age restrictions to be applied on the participants, and should provide a radiation risk statement for publication in the participant information. Finally, state that, in your opinion, there is no reason why the study should not proceed (if indeed this is the case).
REFERENCES: 1. M. Caon (2008) Radiation information and informed consent for clinical trials. J. Radiol. Prot. 28, 415–422.
EPSM-1033 Wed 6th Nov 14:00 Golden Ballroom Centre Radiation Protection
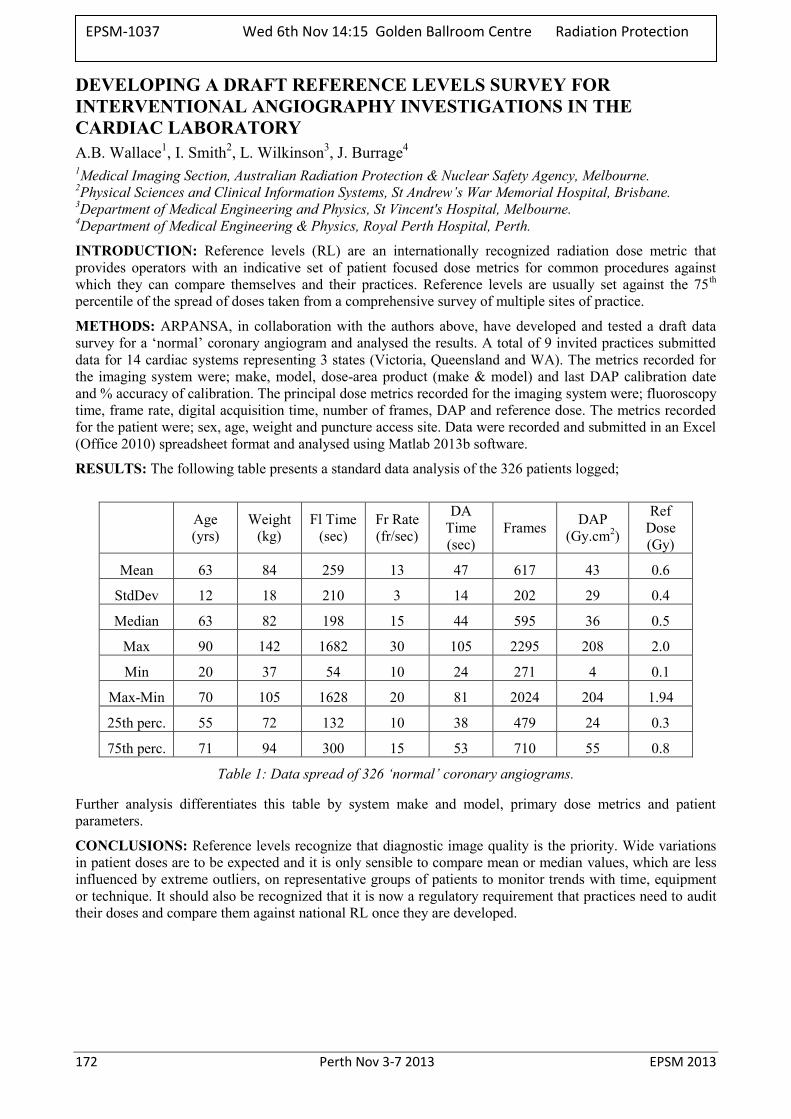
172 Perth Nov 3-7 2013 EPSM 2013
DEVELOPING A DRAFT REFERENCE LEVELS SURVEY FOR INTERVENTIONAL ANGIOGRAPHY INVESTIGATIONS IN THE CARDIAC LABORATORY A.B. Wallace1, I. Smith2, L. Wilkinson3, J. Burrage4
1Medical Imaging Section, Australian Radiation Protection & Nuclear Safety Agency, Melbourne. 2Physical Sciences and Clinical Information Systems, St Andrew’s War Memorial Hospital, Brisbane. 3Department of Medical Engineering and Physics, St Vincent's Hospital, Melbourne. 4Department of Medical Engineering & Physics, Royal Perth Hospital, Perth.
INTRODUCTION: Reference levels (RL) are an internationally recognized radiation dose metric that provides operators with an indicative set of patient focused dose metrics for common procedures against which they can compare themselves and their practices. Reference levels are usually set against the 75th percentile of the spread of doses taken from a comprehensive survey of multiple sites of practice.
METHODS: ARPANSA, in collaboration with the authors above, have developed and tested a draft data survey for a ‘normal’ coronary angiogram and analysed the results. A total of 9 invited practices submitted data for 14 cardiac systems representing 3 states (Victoria, Queensland and WA). The metrics recorded for the imaging system were; make, model, dose-area product (make & model) and last DAP calibration date and % accuracy of calibration. The principal dose metrics recorded for the imaging system were; fluoroscopy time, frame rate, digital acquisition time, number of frames, DAP and reference dose. The metrics recorded for the patient were; sex, age, weight and puncture access site. Data were recorded and submitted in an Excel (Office 2010) spreadsheet format and analysed using Matlab 2013b software.
RESULTS: The following table presents a standard data analysis of the 326 patients logged;
Age (yrs)
Weight (kg)
Fl Time (sec)
Fr Rate (fr/sec)
DA Time (sec)
Frames DAP (Gy.cm2)
Ref Dose (Gy)
Mean 63 84 259 13 47 617 43 0.6
StdDev 12 18 210 3 14 202 29 0.4
Median 63 82 198 15 44 595 36 0.5
Max 90 142 1682 30 105 2295 208 2.0
Min 20 37 54 10 24 271 4 0.1
Max-Min 70 105 1628 20 81 2024 204 1.94
25th perc. 55 72 132 10 38 479 24 0.3
75th perc. 71 94 300 15 53 710 55 0.8
Table 1: Data spread of 326 ‘normal’ coronary angiograms.
Further analysis differentiates this table by system make and model, primary dose metrics and patient parameters.
CONCLUSIONS: Reference levels recognize that diagnostic image quality is the priority. Wide variations in patient doses are to be expected and it is only sensible to compare mean or median values, which are less influenced by extreme outliers, on representative groups of patients to monitor trends with time, equipment or technique. It should also be recognized that it is now a regulatory requirement that practices need to audit their doses and compare them against national RL once they are developed.
EPSM-1037 Wed 6th Nov 14:15 Golden Ballroom Centre Radiation Protection
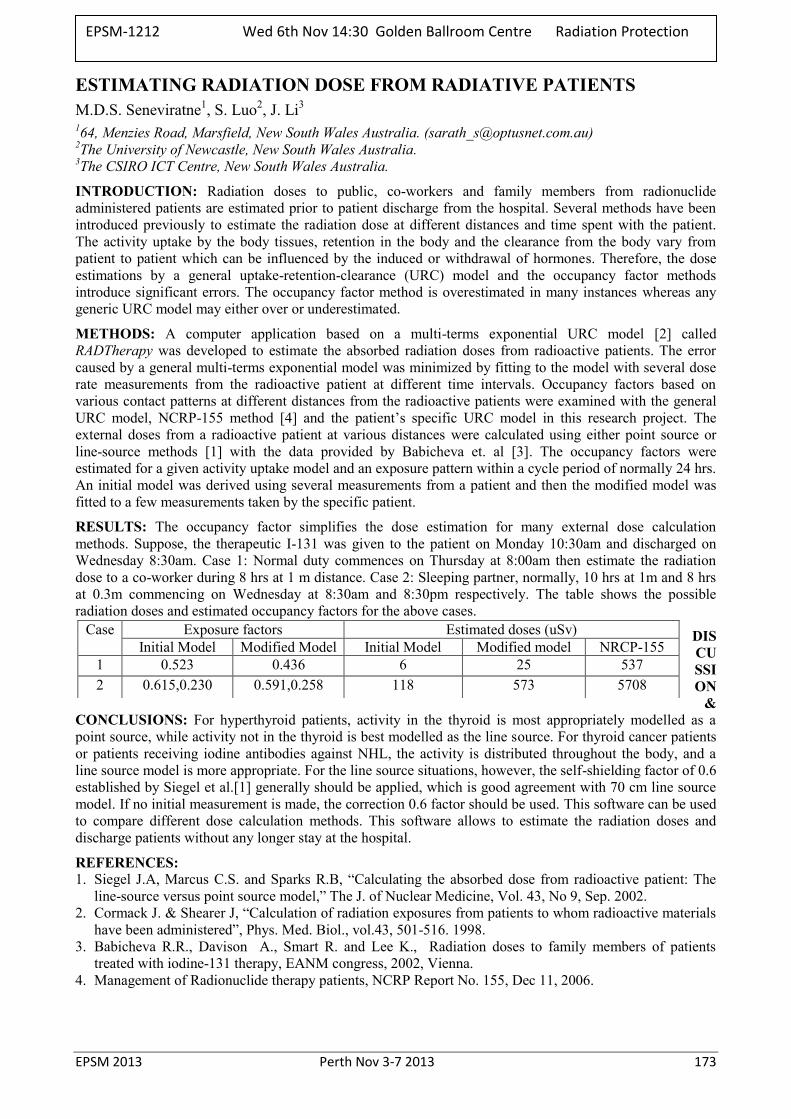
EPSM 2013 Perth Nov 3-7 2013 173
ESTIMATING RADIATION DOSE FROM RADIATIVE PATIENTS M.D.S. Seneviratne1, S. Luo2, J. Li3
164, Menzies Road, Marsfield, New South Wales Australia. ([email protected]) 2The University of Newcastle, New South Wales Australia. 3The CSIRO ICT Centre, New South Wales Australia.
INTRODUCTION: Radiation doses to public, co-workers and family members from radionuclide administered patients are estimated prior to patient discharge from the hospital. Several methods have been introduced previously to estimate the radiation dose at different distances and time spent with the patient. The activity uptake by the body tissues, retention in the body and the clearance from the body vary from patient to patient which can be influenced by the induced or withdrawal of hormones. Therefore, the dose estimations by a general uptake-retention-clearance (URC) model and the occupancy factor methods introduce significant errors. The occupancy factor method is overestimated in many instances whereas any generic URC model may either over or underestimated.
METHODS: A computer application based on a multi-terms exponential URC model [2] called RADTherapy was developed to estimate the absorbed radiation doses from radioactive patients. The error caused by a general multi-terms exponential model was minimized by fitting to the model with several dose rate measurements from the radioactive patient at different time intervals. Occupancy factors based on various contact patterns at different distances from the radioactive patients were examined with the general URC model, NCRP-155 method [4] and the patient’s specific URC model in this research project. The external doses from a radioactive patient at various distances were calculated using either point source or line-source methods [1] with the data provided by Babicheva et. al [3]. The occupancy factors were estimated for a given activity uptake model and an exposure pattern within a cycle period of normally 24 hrs. An initial model was derived using several measurements from a patient and then the modified model was fitted to a few measurements taken by the specific patient.
RESULTS: The occupancy factor simplifies the dose estimation for many external dose calculation methods. Suppose, the therapeutic I-131 was given to the patient on Monday 10:30am and discharged on Wednesday 8:30am. Case 1: Normal duty commences on Thursday at 8:00am then estimate the radiation dose to a co-worker during 8 hrs at 1 m distance. Case 2: Sleeping partner, normally, 10 hrs at 1m and 8 hrs at 0.3m commencing on Wednesday at 8:30am and 8:30pm respectively. The table shows the possible radiation doses and estimated occupancy factors for the above cases.
DISCUSSION
& CONCLUSIONS: For hyperthyroid patients, activity in the thyroid is most appropriately modelled as a point source, while activity not in the thyroid is best modelled as the line source. For thyroid cancer patients or patients receiving iodine antibodies against NHL, the activity is distributed throughout the body, and a line source model is more appropriate. For the line source situations, however, the self-shielding factor of 0.6 established by Siegel et al.[1] generally should be applied, which is good agreement with 70 cm line source model. If no initial measurement is made, the correction 0.6 factor should be used. This software can be used to compare different dose calculation methods. This software allows to estimate the radiation doses and discharge patients without any longer stay at the hospital.
REFERENCES: 1. Siegel J.A, Marcus C.S. and Sparks R.B, “Calculating the absorbed dose from radioactive patient: The
line-source versus point source model,” The J. of Nuclear Medicine, Vol. 43, No 9, Sep. 2002. 2. Cormack J. & Shearer J, “Calculation of radiation exposures from patients to whom radioactive materials
have been administered”, Phys. Med. Biol., vol.43, 501-516. 1998. 3. Babicheva R.R., Davison A., Smart R. and Lee K., Radiation doses to family members of patients
treated with iodine-131 therapy, EANM congress, 2002, Vienna. 4. Management of Radionuclide therapy patients, NCRP Report No. 155, Dec 11, 2006.
Case Exposure factors Estimated doses (uSv) Initial Model Modified Model Initial Model Modified model NRCP-155
1 0.523 0.436 6 25 537 2 0.615,0.230 0.591,0.258 118 573 5708
EPSM-1212 Wed 6th Nov 14:30 Golden Ballroom Centre Radiation Protection
174 Perth Nov 3-7 2013 EPSM 2013
SECTIONAL DOOR FOR IR-192 BRACHYTHERAPY BUNKER D. Miller1, D.K. Waterhouse2, P. Lanzon2, J. Prunster2 1DSM Consulting Engineers, Perth, Western Australia. 2Department of Radiation Oncology, Sir Charles Gairdner Hospital, Perth, Western Australia.
INTRODUCTION: SCGH recently completed construction of a new Ir-192 (370 keV) high dose-rate brachytherapy bunker in its new Cancer Centre. The setup and reproducible positioning accuracy of the door were specified to be 1 mm, with particular attention paid to minimising gaps between the walls and the door, and the floor and the door. Installation of the bunker door, weighing approximately 4.5 tonnes, was made challenging by the long delivery pathway (97 metres) on a lino-covered suspended floor slab, with numerous 90 degree turns.
METHODS: Brachytherapy has a high clinical workload at SCGH, and design limits were based upon an anticipated workload of 7.69 x 10⁴ µGym2/week. The shielding was designed to comply with Schedule I of the Radiation Safety (General) Regulations 1983-2004 and the shielding dose constraints adopted by the Radiological Council in Western Australia [1], that are based upon ICRP 60 [2]. Scope of Works documentation was prepared in consultation with end users. Particulars of the door, a support and motion system, and an electrical control system were specified. The door was constructed from bulk Pb (TVL = 16 mm for Ir-192), molten and cast into six steel casings (leaves) that were transported separately to site and welded together once installed. Each leaf weighed approximately 750kg. To eliminate inter-leaf leakage, a 6mm stepped joint was included on the machined mating surfaces. The door was suspended on a linear rail and bearing system. To ensure sufficient rigidity, the rail was fixed to 2 x 310UB steel beams stacked one atop the other.
RESULTS: The Pb section of the door is 2110 x 1750 x 72 mm. The door is 115 mm thick, including 72 mm Pb, 2 x 6 mm steel casing + melamine board cladding, and is suspended approximately 4 mm above the floor. There was a 35 mm gap (by design) between wall and door when closed. As part of the design, lead strips were incorporated into the door trim to reduce the 35 mm gap to 5mm, and to compensate for the reduced apparent concrete thickness at the edges of the door frame. With a 10.6 Ci Ir-192 source exposed at a typical treatment location within the bunker, the measured instantaneous dose rates behind the door and at critical points around the door were well below the Council Regulation limits. No increase in dose rate was observed at the leaf joints.
DISCUSSION & CONCLUSIONS: Innovative design made transport and installation of the new Ir-192 brachytherapy bunker door at SCGH efficient and cost-effective. The door’s construction and the motion system that was employed enabled installation with minimal spacing between the door and bunker walls, and the bunker floor. The reduction of gap dimensions contributed to the reduced radiation leakage achieved around the door.
REFERENCES: 1. Radiation Safety (General) Regulations 1983, WA 2010. Available from: http://www.slp.wa.gov.au/Index.html 2. International Commission on Radiation Protection. 1990 Recommendations of the International Commission on Radiation Protection. 1991; ICRP Publication 60. Ann. ICRP 21 (1-3).
EPSM-1225 Wed 6th Nov 14:45 Golden Ballroom Centre Radiation Protection
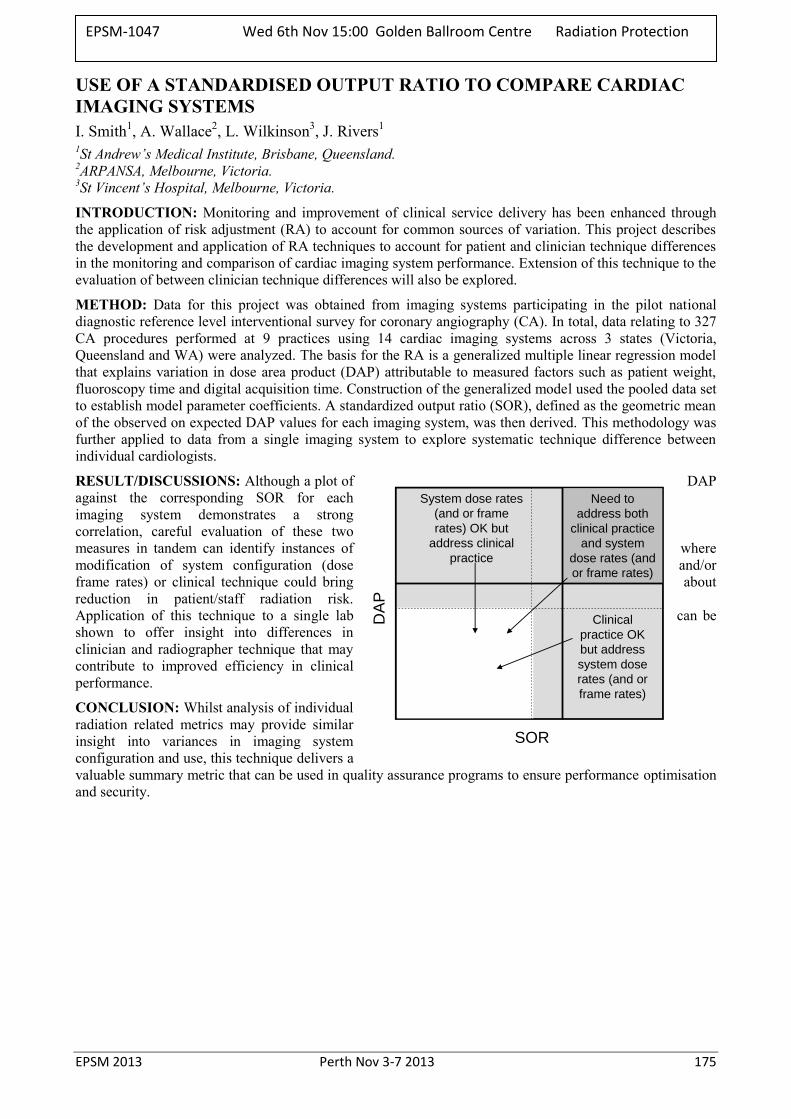
EPSM 2013 Perth Nov 3-7 2013 175
USE OF A STANDARDISED OUTPUT RATIO TO COMPARE CARDIAC IMAGING SYSTEMS I. Smith1, A. Wallace2, L. Wilkinson3, J. Rivers1 1St Andrew’s Medical Institute, Brisbane, Queensland. 2ARPANSA, Melbourne, Victoria. 3St Vincent’s Hospital, Melbourne, Victoria.
INTRODUCTION: Monitoring and improvement of clinical service delivery has been enhanced through the application of risk adjustment (RA) to account for common sources of variation. This project describes the development and application of RA techniques to account for patient and clinician technique differences in the monitoring and comparison of cardiac imaging system performance. Extension of this technique to the evaluation of between clinician technique differences will also be explored.
METHOD: Data for this project was obtained from imaging systems participating in the pilot national diagnostic reference level interventional survey for coronary angiography (CA). In total, data relating to 327 CA procedures performed at 9 practices using 14 cardiac imaging systems across 3 states (Victoria, Queensland and WA) were analyzed. The basis for the RA is a generalized multiple linear regression model that explains variation in dose area product (DAP) attributable to measured factors such as patient weight, fluoroscopy time and digital acquisition time. Construction of the generalized model used the pooled data set to establish model parameter coefficients. A standardized output ratio (SOR), defined as the geometric mean of the observed on expected DAP values for each imaging system, was then derived. This methodology was further applied to data from a single imaging system to explore systematic technique difference between individual cardiologists.
RESULT/DISCUSSIONS: Although a plot of DAP against the corresponding SOR for each imaging system demonstrates a strong correlation, careful evaluation of these two measures in tandem can identify instances of where modification of system configuration (dose and/or frame rates) or clinical technique could bring about reduction in patient/staff radiation risk. Application of this technique to a single lab can be shown to offer insight into differences in clinician and radiographer technique that may contribute to improved efficiency in clinical performance.
CONCLUSION: Whilst analysis of individual radiation related metrics may provide similar insight into variances in imaging system configuration and use, this technique delivers a valuable summary metric that can be used in quality assurance programs to ensure performance optimisation and security.
SOR
System dose rates
(and or frame
rates) OK but
address clinical
practice
Need to
address both
clinical practice
and system
dose rates (and
or frame rates)
DA
P
Clinical
practice OK
but address
system dose
rates (and or
frame rates)
EPSM-1047 Wed 6th Nov 15:00 Golden Ballroom Centre Radiation Protection
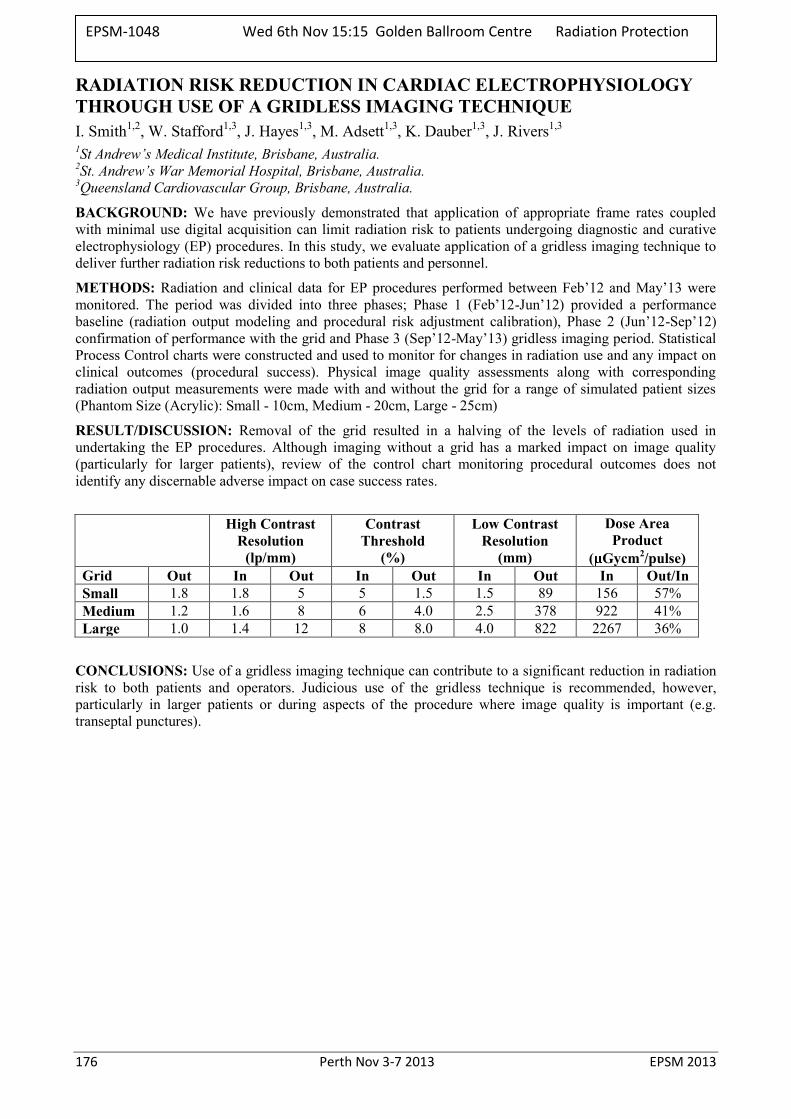
176 Perth Nov 3-7 2013 EPSM 2013
RADIATION RISK REDUCTION IN CARDIAC ELECTROPHYSIOLOGY THROUGH USE OF A GRIDLESS IMAGING TECHNIQUE I. Smith1,2, W. Stafford1,3, J. Hayes1,3, M. Adsett1,3, K. Dauber1,3, J. Rivers1,3 1St Andrew’s Medical Institute, Brisbane, Australia. 2St. Andrew’s War Memorial Hospital, Brisbane, Australia. 3Queensland Cardiovascular Group, Brisbane, Australia.
BACKGROUND: We have previously demonstrated that application of appropriate frame rates coupled with minimal use digital acquisition can limit radiation risk to patients undergoing diagnostic and curative electrophysiology (EP) procedures. In this study, we evaluate application of a gridless imaging technique to deliver further radiation risk reductions to both patients and personnel.
METHODS: Radiation and clinical data for EP procedures performed between Feb’12 and May’13 were monitored. The period was divided into three phases; Phase 1 (Feb’12-Jun’12) provided a performance baseline (radiation output modeling and procedural risk adjustment calibration), Phase 2 (Jun’12-Sep’12) confirmation of performance with the grid and Phase 3 (Sep’12-May’13) gridless imaging period. Statistical Process Control charts were constructed and used to monitor for changes in radiation use and any impact on clinical outcomes (procedural success). Physical image quality assessments along with corresponding radiation output measurements were made with and without the grid for a range of simulated patient sizes (Phantom Size (Acrylic): Small - 10cm, Medium - 20cm, Large - 25cm)
RESULT/DISCUSSION: Removal of the grid resulted in a halving of the levels of radiation used in undertaking the EP procedures. Although imaging without a grid has a marked impact on image quality (particularly for larger patients), review of the control chart monitoring procedural outcomes does not identify any discernable adverse impact on case success rates.
High Contrast Resolution
(lp/mm)
Contrast Threshold
(%)
Low Contrast Resolution
(mm)
Dose Area Product
( Gycm2/pulse) Grid Out In Out In Out In Out In Out/In Small 1.8 1.8 5 5 1.5 1.5 89 156 57% Medium 1.2 1.6 8 6 4.0 2.5 378 922 41% Large 1.0 1.4 12 8 8.0 4.0 822 2267 36%
CONCLUSIONS: Use of a gridless imaging technique can contribute to a significant reduction in radiation risk to both patients and operators. Judicious use of the gridless technique is recommended, however, particularly in larger patients or during aspects of the procedure where image quality is important (e.g. transeptal punctures).
EPSM-1048 Wed 6th Nov 15:15 Golden Ballroom Centre Radiation Protection
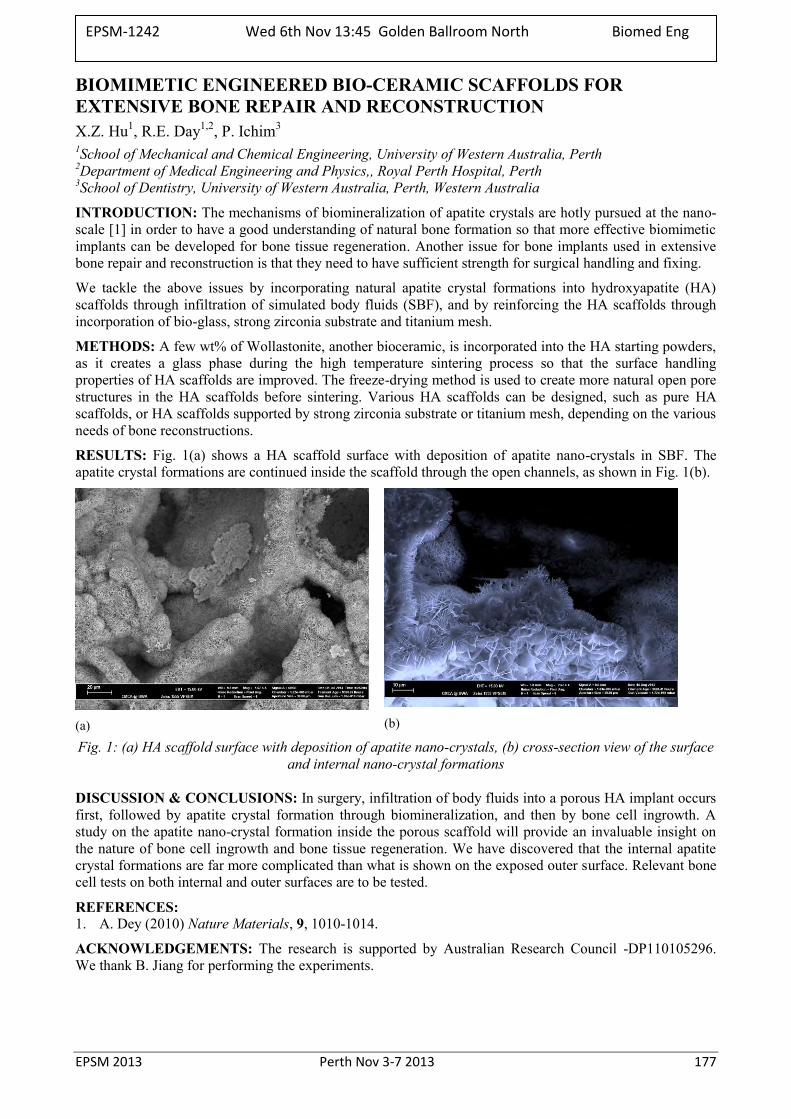
EPSM 2013 Perth Nov 3-7 2013 177
BIOMIMETIC ENGINEERED BIO-CERAMIC SCAFFOLDS FOR EXTENSIVE BONE REPAIR AND RECONSTRUCTION X.Z. Hu1, R.E. Day1,2, P. Ichim3 1School of Mechanical and Chemical Engineering, University of Western Australia, Perth 2Department of Medical Engineering and Physics,, Royal Perth Hospital, Perth 3School of Dentistry, University of Western Australia, Perth, Western Australia
INTRODUCTION: The mechanisms of biomineralization of apatite crystals are hotly pursued at the nano-scale [1] in order to have a good understanding of natural bone formation so that more effective biomimetic implants can be developed for bone tissue regeneration. Another issue for bone implants used in extensive bone repair and reconstruction is that they need to have sufficient strength for surgical handling and fixing.
We tackle the above issues by incorporating natural apatite crystal formations into hydroxyapatite (HA) scaffolds through infiltration of simulated body fluids (SBF), and by reinforcing the HA scaffolds through incorporation of bio-glass, strong zirconia substrate and titanium mesh.
METHODS: A few wt% of Wollastonite, another bioceramic, is incorporated into the HA starting powders, as it creates a glass phase during the high temperature sintering process so that the surface handling properties of HA scaffolds are improved. The freeze-drying method is used to create more natural open pore structures in the HA scaffolds before sintering. Various HA scaffolds can be designed, such as pure HA scaffolds, or HA scaffolds supported by strong zirconia substrate or titanium mesh, depending on the various needs of bone reconstructions.
RESULTS: Fig. 1(a) shows a HA scaffold surface with deposition of apatite nano-crystals in SBF. The apatite crystal formations are continued inside the scaffold through the open channels, as shown in Fig. 1(b).
(a)
(b)
Fig. 1: (a) HA scaffold surface with deposition of apatite nano-crystals, (b) cross-section view of the surface and internal nano-crystal formations
DISCUSSION & CONCLUSIONS: In surgery, infiltration of body fluids into a porous HA implant occurs first, followed by apatite crystal formation through biomineralization, and then by bone cell ingrowth. A study on the apatite nano-crystal formation inside the porous scaffold will provide an invaluable insight on the nature of bone cell ingrowth and bone tissue regeneration. We have discovered that the internal apatite crystal formations are far more complicated than what is shown on the exposed outer surface. Relevant bone cell tests on both internal and outer surfaces are to be tested.
REFERENCES: 1. A. Dey (2010) Nature Materials, 9, 1010-1014.
ACKNOWLEDGEMENTS: The research is supported by Australian Research Council -DP110105296. We thank B. Jiang for performing the experiments.
EPSM-1242 Wed 6th Nov 13:45 Golden Ballroom North Biomed Eng
178 Perth Nov 3-7 2013 EPSM 2013
CELL AND TISSUE MANIPULATION IN BIOREACTORS: POTENTIAL CLINICAL APPLICATION M.H. Zheng Centre for Orthopaedic Research, School of Surgery, The University of Western Australia, Crawley, Western
Australia.
INTRODUCTION: Tendons are mechanical tissue connecting muscle and bone. Recent studies on pathological processes of tendon injury demonstrated that depletion of the tenocyte population in end stage tendinopathy occurs due to apoptotic and autophagic cell death. The underlying pathology of tendon promoted us to develop bioreactors for cell tissue manipulation and a clinical trial of autologous tenocyte injection (ATI) in tendionopathy.
METHODS: We have developed a mechanical device enabling the delivery of tensile loading to cells and tissues in cell culture incubators. We used a rabbit model of Achilles tendinopathy to examine the impact of programmable mechanical stimulation of tendon. We then examined the impact of biological factors including mechanical loading and cell supplementation on tendon repair. A clinical trial was also conducted in patients with tennis elbow by injecting the patient’s own tenocytes (ATI) after in-vitro manipulation.
RESULTS: Rabbit tendons with 3% of cyclic tensile loading had moderate matrix deterioration and elevated expression levels of MMP-1, 3, and 12, whilst an excessive loading regime of 9% caused massive rupture of collagen bundles. However, 6% of cyclic tensile strain was able to maintain both the structural integrity and cellular function. Our data indicated that an optimal programmable mechanical stimulation (PMS) is required to maintain the tendon homeostasis and there is only a narrow range of tensile strain that can induce anabolic action. On the other hand, patients treated with ATI demonstrated an improvement in mean visual analog scale scores, from a maximum pain score from 5.94 at the initial assessment to 0.76 at 12 months (P < 0.001). Mean quick Disabilities of the Arm, Shoulder and Hand (QuickDASH) and grip strength scores also significantly improved over the 12-month follow-up (QuickDASH score, 45.88 [baseline] to 3.84; grip strength, 20.17 kgF [baseline] to 37.38 kgF; P < 0.001). With use of a validated MRI scoring system, the grade of tendinopathy at the common extensor origin improved significantly by 12 months (P < 0.001). One patient elected to proceed to surgery 3 months after ATI following re-injury at work.
DISCUSSION & CONCLUSIONS: The current study suggests that ATI may be used after the failure of other treatments but before surgery in patients with severe chronic tendon degeneration. Mechanical stimulation by means of excise should be integrated with other biological treatments to maximize the anabolic impact on tendon repair.
CONFLICT OF INTEREST: M.H.Z. holds stock in Orthocell Pty Ltd and received a consulting fee from Orthocell for research and development. Orthocell supplied the ATI used in the trial. The work is supported by an ARC linkage grant.
ACKNOWLEDGMENT: MHZ would like to thank Tao Wang; Bill Breidahl; Katherine E. Mackie; Zhen Lin; An Qin; Jimin Chen; David Lloyd, David Smith and Allan Wang.
EPSM-1243 Wed 6th Nov 14:15 Golden Ballroom North Biomed Eng
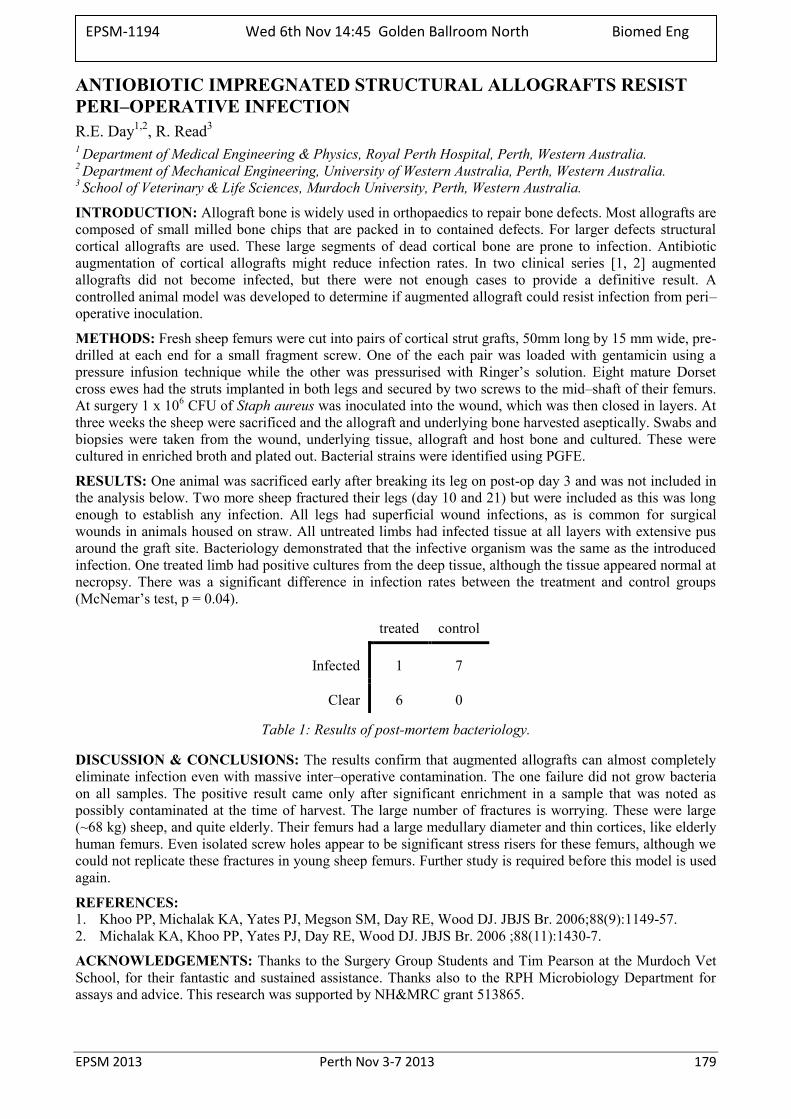
EPSM 2013 Perth Nov 3-7 2013 179
ANTIOBIOTIC IMPREGNATED STRUCTURAL ALLOGRAFTS RESIST PERI–OPERATIVE INFECTION R.E. Day1,2, R. Read3 1 Department of Medical Engineering & Physics, Royal Perth Hospital, Perth, Western Australia. 2 Department of Mechanical Engineering, University of Western Australia, Perth, Western Australia. 3 School of Veterinary & Life Sciences, Murdoch University, Perth, Western Australia.
INTRODUCTION: Allograft bone is widely used in orthopaedics to repair bone defects. Most allografts are composed of small milled bone chips that are packed in to contained defects. For larger defects structural cortical allografts are used. These large segments of dead cortical bone are prone to infection. Antibiotic augmentation of cortical allografts might reduce infection rates. In two clinical series [1, 2] augmented allografts did not become infected, but there were not enough cases to provide a definitive result. A controlled animal model was developed to determine if augmented allograft could resist infection from peri–operative inoculation.
METHODS: Fresh sheep femurs were cut into pairs of cortical strut grafts, 50mm long by 15 mm wide, pre-drilled at each end for a small fragment screw. One of the each pair was loaded with gentamicin using a pressure infusion technique while the other was pressurised with Ringer’s solution. Eight mature Dorset cross ewes had the struts implanted in both legs and secured by two screws to the mid–shaft of their femurs. At surgery 1 x 10⁶ CFU of Staph aureus was inoculated into the wound, which was then closed in layers. At three weeks the sheep were sacrificed and the allograft and underlying bone harvested aseptically. Swabs and biopsies were taken from the wound, underlying tissue, allograft and host bone and cultured. These were cultured in enriched broth and plated out. Bacterial strains were identified using PGFE.
RESULTS: One animal was sacrificed early after breaking its leg on post-op day 3 and was not included in the analysis below. Two more sheep fractured their legs (day 10 and 21) but were included as this was long enough to establish any infection. All legs had superficial wound infections, as is common for surgical wounds in animals housed on straw. All untreated limbs had infected tissue at all layers with extensive pus around the graft site. Bacteriology demonstrated that the infective organism was the same as the introduced infection. One treated limb had positive cultures from the deep tissue, although the tissue appeared normal at necropsy. There was a significant difference in infection rates between the treatment and control groups (McNemar’s test, p = 0.04).
treated control
Infected 1 7
Clear 6 0
Table 1: Results of post-mortem bacteriology.
DISCUSSION & CONCLUSIONS: The results confirm that augmented allografts can almost completely eliminate infection even with massive inter–operative contamination. The one failure did not grow bacteria on all samples. The positive result came only after significant enrichment in a sample that was noted as possibly contaminated at the time of harvest. The large number of fractures is worrying. These were large (~68 kg) sheep, and quite elderly. Their femurs had a large medullary diameter and thin cortices, like elderly human femurs. Even isolated screw holes appear to be significant stress risers for these femurs, although we could not replicate these fractures in young sheep femurs. Further study is required before this model is used again.
REFERENCES: 1. Khoo PP, Michalak KA, Yates PJ, Megson SM, Day RE, Wood DJ. JBJS Br. 2006;88(9):1149-57. 2. Michalak KA, Khoo PP, Yates PJ, Day RE, Wood DJ. JBJS Br. 2006 ;88(11):1430-7.
ACKNOWLEDGEMENTS: Thanks to the Surgery Group Students and Tim Pearson at the Murdoch Vet School, for their fantastic and sustained assistance. Thanks also to the RPH Microbiology Department for assays and advice. This research was supported by NH&MRC grant 513865.
EPSM-1194 Wed 6th Nov 14:45 Golden Ballroom North Biomed Eng
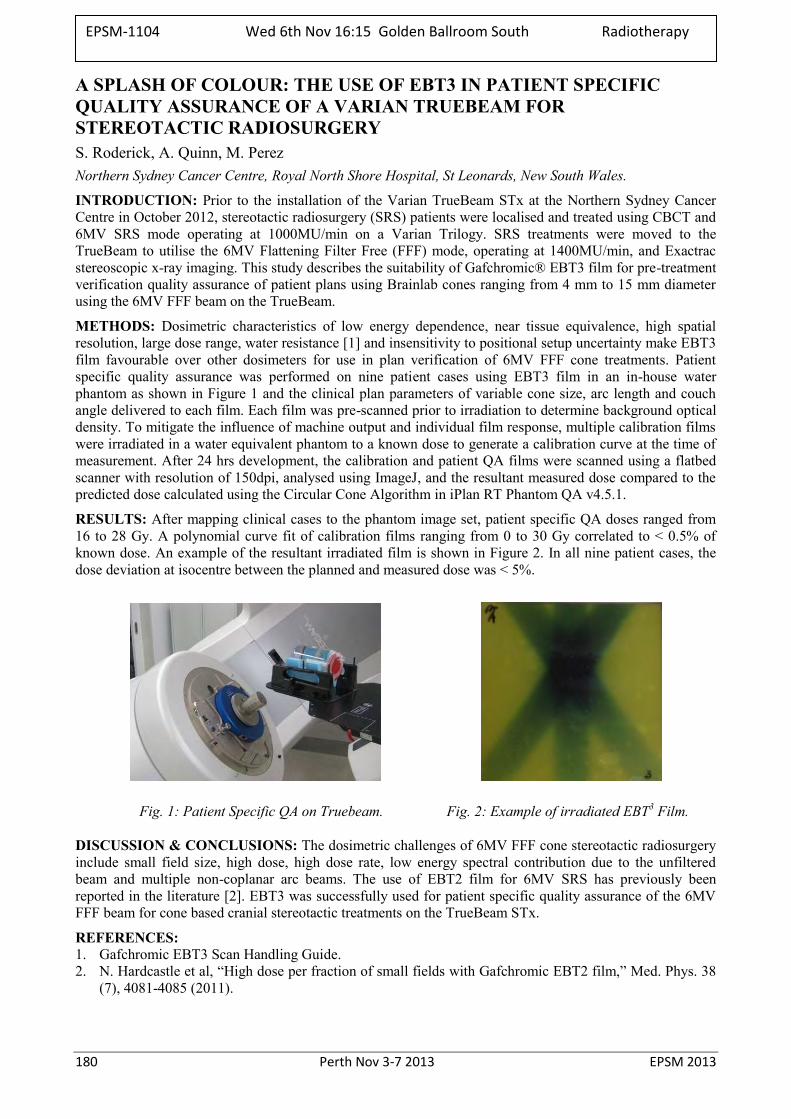
180 Perth Nov 3-7 2013 EPSM 2013
A SPLASH OF COLOUR: THE USE OF EBT3 IN PATIENT SPECIFIC QUALITY ASSURANCE OF A VARIAN TRUEBEAM FOR STEREOTACTIC RADIOSURGERY S. Roderick, A. Quinn, M. Perez Northern Sydney Cancer Centre, Royal North Shore Hospital, St Leonards, New South Wales.
INTRODUCTION: Prior to the installation of the Varian TrueBeam STx at the Northern Sydney Cancer Centre in October 2012, stereotactic radiosurgery (SRS) patients were localised and treated using CBCT and 6MV SRS mode operating at 1000MU/min on a Varian Trilogy. SRS treatments were moved to the TrueBeam to utilise the 6MV Flattening Filter Free (FFF) mode, operating at 1400MU/min, and Exactrac stereoscopic x-ray imaging. This study describes the suitability of Gafchromic® EBT3 film for pre-treatment verification quality assurance of patient plans using Brainlab cones ranging from 4 mm to 15 mm diameter using the 6MV FFF beam on the TrueBeam.
METHODS: Dosimetric characteristics of low energy dependence, near tissue equivalence, high spatial resolution, large dose range, water resistance [1] and insensitivity to positional setup uncertainty make EBT3 film favourable over other dosimeters for use in plan verification of 6MV FFF cone treatments. Patient specific quality assurance was performed on nine patient cases using EBT3 film in an in-house water phantom as shown in Figure 1 and the clinical plan parameters of variable cone size, arc length and couch angle delivered to each film. Each film was pre-scanned prior to irradiation to determine background optical density. To mitigate the influence of machine output and individual film response, multiple calibration films were irradiated in a water equivalent phantom to a known dose to generate a calibration curve at the time of measurement. After 24 hrs development, the calibration and patient QA films were scanned using a flatbed scanner with resolution of 150dpi, analysed using ImageJ, and the resultant measured dose compared to the predicted dose calculated using the Circular Cone Algorithm in iPlan RT Phantom QA v4.5.1.
RESULTS: After mapping clinical cases to the phantom image set, patient specific QA doses ranged from 16 to 28 Gy. A polynomial curve fit of calibration films ranging from 0 to 30 Gy correlated to < 0.5% of known dose. An example of the resultant irradiated film is shown in Figure 2. In all nine patient cases, the dose deviation at isocentre between the planned and measured dose was < 5%.
Fig. 1: Patient Specific QA on Truebeam. Fig. 2: Example of irradiated EBT3 Film.
DISCUSSION & CONCLUSIONS: The dosimetric challenges of 6MV FFF cone stereotactic radiosurgery include small field size, high dose, high dose rate, low energy spectral contribution due to the unfiltered beam and multiple non-coplanar arc beams. The use of EBT2 film for 6MV SRS has previously been reported in the literature [2]. EBT3 was successfully used for patient specific quality assurance of the 6MV FFF beam for cone based cranial stereotactic treatments on the TrueBeam STx.
REFERENCES: 1. Gafchromic EBT3 Scan Handling Guide. 2. N. Hardcastle et al, “High dose per fraction of small fields with Gafchromic EBT2 film,” Med. Phys. 38
(7), 4081-4085 (2011).
EPSM-1104 Wed 6th Nov 16:15 Golden Ballroom South Radiotherapy
EPSM 2013 Perth Nov 3-7 2013 181
INTEGRATION OF BRAINLAB EXACTRAC WITH ELEKTA IGUIDE FOR STEREOTACTIC RADIOTHERAPY/RADIOSURGERY K. Biggerstaff, P. Hanlon Department of Radiation Oncology, Princess Alexandra Hospital, Brisbane, Queensland.
INTRODUCTION: An Elekta Axesse linear accelerator (Elekta Oncology Systems, Crawley, UK) was used for stereotactic radiotherapy (SRT) with both the HexaPOD 6DOF couch iGUIDE (Medical Intelligence GmbH, Schwabmünchen, Germany) and the ExacTrac 6.0 (Brainlab, Feldkirchen, Germany) imaging systems used in combination for image guidance. The HexaPOD 6DOF couch was used rather than the ExacTrac® Robotic Patient Alignment couch top that is standardly used as part of the BrainLab system. Both iGUIDE and ExacTrac use a monoscopic infra-red position detection system. ExacTrac also incorporates a stereoscopic x-ray imaging system that is fixed to the room, allowing positional verification at all couch angles. SRT treatments were planned using the iPlan planning system (Brainlab, Feldkirchen, Germany).
Several tests were developed to ensure the coincidence of the radiation, patient localization and image guidance isocentres were within a 1mm tolerance of each other [1]. Due to the novel combination of the two IGRT systems, movements determined by the ExacTrac system must be initialised via manual entry into the iGUIDE HexaPOD control system. Tests to ensure the coincidence of coordinate systems, and that demanded movements matched the detected movements were repeated using both manual and automatic fusion between the reconstructed stereoscopic radiographs and the captured x-ray image. The quality of x-ray images were also tested using an anthropomorphic head phantom.
METHODS: The MV isocentre location was determined using the standard calibration procedure for the Elekta X-ray Volume Imager (XVI) [2]. The iGUIDE infra-red, ExacTrac infra-red and ExacTrac x-ray isocentres were then calibrated to this location. To verify the calibration, the ball bearing used for calibration was imaged again and analysed using the Detect Winston-Lutz Pointer test in verification tools of the ExacTrac system. Translating the ball bearing known distances allowed verification of the both absolute distance and direction. The consistency in detection involves the use of the automatic fusion algorithm which was activated repeatedly to measure its reproducibility and uncertainty. Jin et. al. (2008) describes these tests in further detail [3].
RESULTS: Using the unique image guidance combination described above, a ball bearing both at the isocentre and displaced a known value from the isocentre, was able to bedetected and shifted back to the isocentre to within 0.2 mm.
DISCUSSION & CONCLUSIONS: The co-ordinate and labelling systems were not consistent between the ExacTrac and iGUIDE systems, nor did the systems communicate, so care was required when transcribing and validating the required shifts. iGUIDE accounts for this by requiring the shift be entered twice before a movement can be enabled. If an incorrect movement is activated, ExacTrac will show that the expected movement has not occurred, giving an extra layer of redundancy. Care must also be taken to image only at set gantry and collimator angles or the gantry and/or EPID panel can block the ExacTrac x-ray source. Imaging panels were also seen to influence the accuracy of the IR system.
The ExacTrac IGRT system has been successfully integrated into the Elekta Axesse linac with iGUIDE HexaPOD 6DOF couch, allowing for the validation of positioning for couch rotations necessary for SRS.
REFERENCES: 1. Schell et. al. (1995) AAPM Report No 54. Stereotactic Radiosurgery American Association of
Physicists in Medicine, American Institute of Physics, NY. 2. Sharpe et. al. (2006) The Stability of Mechanical Calibration for a kV Cone Beam Computed
Tomography System Integrated with Linear Accelerator Medical Physics, 33 (1) p136. 3. Jin et. al. (2008) Use of the BrainLab ExacTrac X-ray 6D System for Image-Guided Radiotherapy
Medical Dosimetry 33(2) p124.
EPSM-1126 Wed 6th Nov 16:30 Golden Ballroom South Radiotherapy
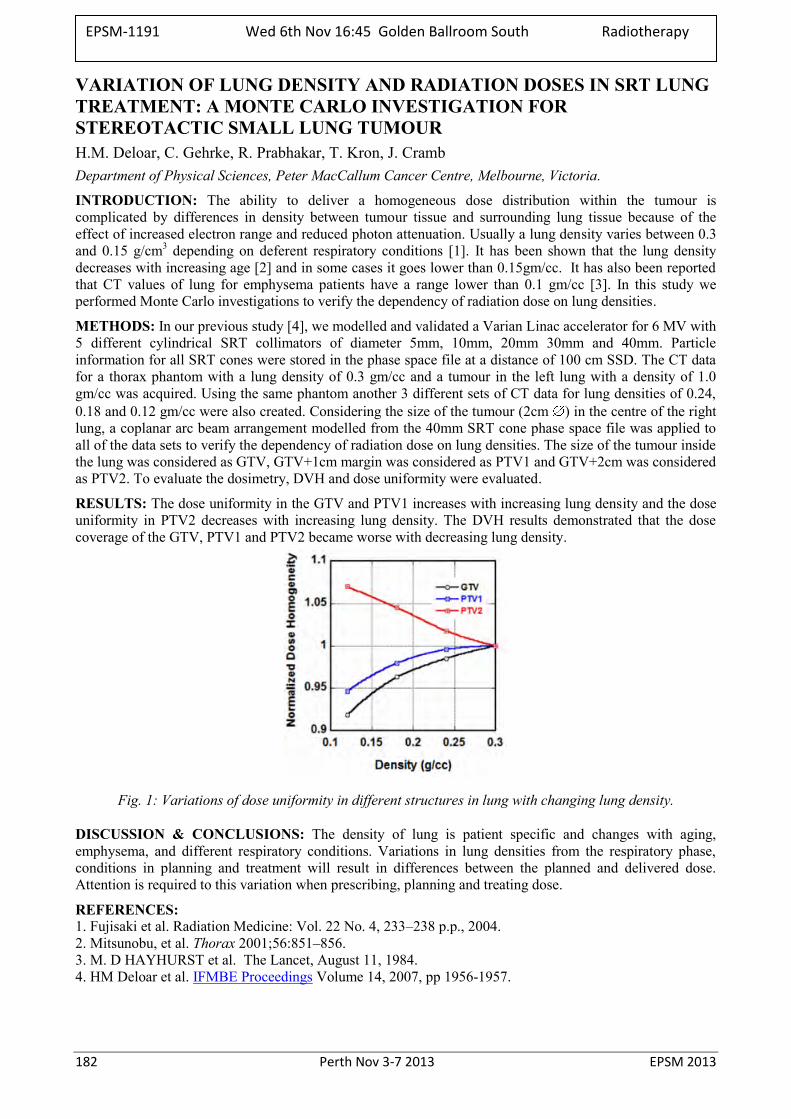
182 Perth Nov 3-7 2013 EPSM 2013
VARIATION OF LUNG DENSITY AND RADIATION DOSES IN SRT LUNG TREATMENT: A MONTE CARLO INVESTIGATION FOR STEREOTACTIC SMALL LUNG TUMOUR H.M. Deloar, C. Gehrke, R. Prabhakar, T. Kron, J. Cramb Department of Physical Sciences, Peter MacCallum Cancer Centre, Melbourne, Victoria.
INTRODUCTION: The ability to deliver a homogeneous dose distribution within the tumour is complicated by differences in density between tumour tissue and surrounding lung tissue because of the effect of increased electron range and reduced photon attenuation. Usually a lung density varies between 0.3 and 0.15 g/cm3 depending on deferent respiratory conditions [1]. It has been shown that the lung density decreases with increasing age [2] and in some cases it goes lower than 0.15gm/cc. It has also been reported that CT values of lung for emphysema patients have a range lower than 0.1 gm/cc [3]. In this study we performed Monte Carlo investigations to verify the dependency of radiation dose on lung densities.
METHODS: In our previous study [4], we modelled and validated a Varian Linac accelerator for 6 MV with 5 different cylindrical SRT collimators of diameter 5mm, 10mm, 20mm 30mm and 40mm. Particle information for all SRT cones were stored in the phase space file at a distance of 100 cm SSD. The CT data for a thorax phantom with a lung density of 0.3 gm/cc and a tumour in the left lung with a density of 1.0 gm/cc was acquired. Using the same phantom another 3 different sets of CT data for lung densities of 0.24, 0.18 and 0.12 gm/cc were also created. Considering the size of the tumour (2cm ) in the centre of the right lung, a coplanar arc beam arrangement modelled from the 40mm SRT cone phase space file was applied to all of the data sets to verify the dependency of radiation dose on lung densities. The size of the tumour inside the lung was considered as GTV, GTV+1cm margin was considered as PTV1 and GTV+2cm was considered as PTV2. To evaluate the dosimetry, DVH and dose uniformity were evaluated.
RESULTS: The dose uniformity in the GTV and PTV1 increases with increasing lung density and the dose uniformity in PTV2 decreases with increasing lung density. The DVH results demonstrated that the dose coverage of the GTV, PTV1 and PTV2 became worse with decreasing lung density.
Fig. 1: Variations of dose uniformity in different structures in lung with changing lung density.
DISCUSSION & CONCLUSIONS: The density of lung is patient specific and changes with aging, emphysema, and different respiratory conditions. Variations in lung densities from the respiratory phase, conditions in planning and treatment will result in differences between the planned and delivered dose. Attention is required to this variation when prescribing, planning and treating dose.
REFERENCES: 1. Fujisaki et al. Radiation Medicine: Vol. 22 No. 4, 233–238 p.p., 2004. 2. Mitsunobu, et al. Thorax 2001;56:851–856. 3. M. D HAYHURST et al. The Lancet, August 11, 1984. 4. HM Deloar et al. IFMBE Proceedings Volume 14, 2007, pp 1956-1957.
EPSM-1191 Wed 6th Nov 16:45 Golden Ballroom South Radiotherapy
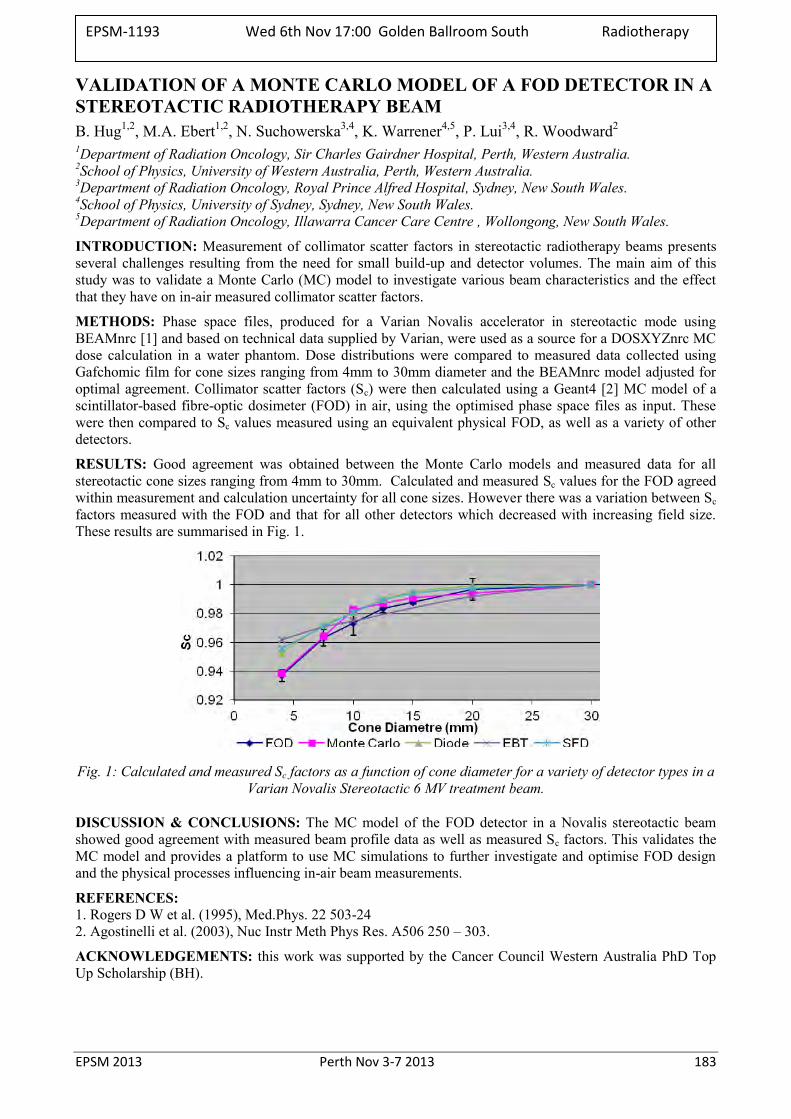
EPSM 2013 Perth Nov 3-7 2013 183
VALIDATION OF A MONTE CARLO MODEL OF A FOD DETECTOR IN A STEREOTACTIC RADIOTHERAPY BEAM B. Hug1,2, M.A. Ebert1,2, N. Suchowerska3,4, K. Warrener4,5, P. Lui3,4, R. Woodward2 1Department of Radiation Oncology, Sir Charles Gairdner Hospital, Perth, Western Australia. 2School of Physics, University of Western Australia, Perth, Western Australia. 3Department of Radiation Oncology, Royal Prince Alfred Hospital, Sydney, New South Wales. 4School of Physics, University of Sydney, Sydney, New South Wales. 5Department of Radiation Oncology, Illawarra Cancer Care Centre , Wollongong, New South Wales.
INTRODUCTION: Measurement of collimator scatter factors in stereotactic radiotherapy beams presents several challenges resulting from the need for small build-up and detector volumes. The main aim of this study was to validate a Monte Carlo (MC) model to investigate various beam characteristics and the effect that they have on in-air measured collimator scatter factors.
METHODS: Phase space files, produced for a Varian Novalis accelerator in stereotactic mode using BEAMnrc [1] and based on technical data supplied by Varian, were used as a source for a DOSXYZnrc MC dose calculation in a water phantom. Dose distributions were compared to measured data collected using Gafchomic film for cone sizes ranging from 4mm to 30mm diameter and the BEAMnrc model adjusted for optimal agreement. Collimator scatter factors (Sc) were then calculated using a Geant4 [2] MC model of a scintillator-based fibre-optic dosimeter (FOD) in air, using the optimised phase space files as input. These were then compared to Sc values measured using an equivalent physical FOD, as well as a variety of other detectors.
RESULTS: Good agreement was obtained between the Monte Carlo models and measured data for all stereotactic cone sizes ranging from 4mm to 30mm. Calculated and measured Sc values for the FOD agreed within measurement and calculation uncertainty for all cone sizes. However there was a variation between Sc factors measured with the FOD and that for all other detectors which decreased with increasing field size. These results are summarised in Fig. 1.
Fig. 1: Calculated and measured Sc factors as a function of cone diameter for a variety of detector types in a
Varian Novalis Stereotactic 6 MV treatment beam.
DISCUSSION & CONCLUSIONS: The MC model of the FOD detector in a Novalis stereotactic beam showed good agreement with measured beam profile data as well as measured Sc factors. This validates the MC model and provides a platform to use MC simulations to further investigate and optimise FOD design and the physical processes influencing in-air beam measurements.
REFERENCES: 1. Rogers D W et al. (1995), Med.Phys. 22 503-24 2. Agostinelli et al. (2003), Nuc Instr Meth Phys Res. A506 250 – 303.
ACKNOWLEDGEMENTS: this work was supported by the Cancer Council Western Australia PhD Top Up Scholarship (BH).
EPSM-1193 Wed 6th Nov 17:00 Golden Ballroom South Radiotherapy
184 Perth Nov 3-7 2013 EPSM 2013
TOWARDS CLINICAL IMPLEMENTATION OF INTRACRANIAL STEREOTACTIC RADIOSURGERY WITH A HELICAL TOMOTHERAPY APPROACH S. Deshpande1-3, M.G. Jameson1-3, A. George1, I. Franji1, C. Ochoa1, S. Watt1,2, E.S. Koh1,5, P. Vial1,2,4, L. Holloway1-5 1Liverpool and Macarthur Cancer Therapy Centres. 2Ingham Institute, Sydney. 3Centre for Medical Radiation Physics, University of Wollongong, Wollongong. 4Institute of Medical Physics, School of Physics, University of Sydney, Sydney. 5SWSCS, University of New South Wales, NSW.
INTRODUCTION: Previous authors have demonstrated dose distributions comparable to more traditional techniques for stereotactic radiosurgery and radiotherapy (SRS/SRT) using the more advanced helical tomotherapy (HT) system1,2. However an assessment of the final delivered dose considering variation in planning techniques, dose prescription, MVCT online registration, margin recipes and dose gradient at the edge of the PTV has not been presented. The present study aims assess of these parameters within the clinical implementation of SRS/SRT treatment with helical tomotherapy.
METHODS: An end to end test was performed with the geometric Stereotactic phantom (INTEGRA neuroscience). The phantom with relocatable frame (Radionics) was scanned in the CT simulator and a Tomotherapy plan was created. The phantom was imaged with MVCT with no additional weight and 80 kg and 100 kg additional weight to verify the ability of correcting table sag error. To assess the planning technique, anthropomorphic head phantom CT images were used with 2 FOV settings (30 and 50 cm) to consider variation of the calculation grid (dependent on the CT FOV). Five different target contours (0.81cc – 5.32cc) of various shapes that simulate the different clinical scenarios as well as OAR and planning volumes (rings) were generated. Plans were created with different pitch, dose prescription and modulation factor for each clinical scenario. The plan quality was compared with conformity index (CI), homogeneity index (HI) as specified by RTOG2 criteria as well as dose fall-off. Linac rotational output variation with time was also studied for beam on time ranging 5 - 20 minutes.
RESULTS: The greatest table sag at the treatment plane was 4-5 mm for 100kg additional weight. Considering correction of couch sag by vertical and longitudinal motion, including use of the day-day relocatable frame placement, the registration error and residual error of couch movement after table shift correction, a conservative 2 mm margin was determined. The CT simulator 30 cm FOV was found to be useful to achieve the desirable dose falloff outside the target volume. A realistic dose falloff of 50% of prescription dose was found to 8-9 mm for the 6.25 mm MLC width. A pitch of 0.16-0.17 and a modulation factor 1.6-1.8 with 80 % of dose prescription was found to be optimal for achieving an acceptable dose distribution and beam on time. The CI was found to be 1.10-1.37 and HI was found to be 1.25-1.30. The helical rotational output dropped by ≥2% if the beam on time exceeded 8.5 min. Therefore it is recommended to split the treatment time whenever the total beam on exceeds above 8.5 minutes to maintain dosimetry within 2%.
CONCLUSIONS: With above dosimetric parameters established and QA facets undertaken, our department is now positioned for the successful clinical implementation of helical tomotherapy for stereotactic radiosurgery delivery. The dosimetric measurement and impact of roll error on dosimetric planning and treatment delivery is under further investigation.
REFERENCES: 1. S. Yartsev et al. Radiotherapy and Oncology 74 (2005) 49–52. 2. T Kumar JACMP 2010, 11(4) 27-40 3. E.Shaw Int.J. Radiation Oncology Biol.Phys. Vol. 27(3) 1231-1239
EPSM-1172 Wed 6th Nov 17:15 Golden Ballroom South Radiotherapy
EPSM 2013 Perth Nov 3-7 2013 185
PREPARING A MANUSCRIPT FOR PUBLICATION: THE EXPERIENCES OF MEDICAL PHYSICS REGISTRARS, THEIR SUPERVISORS AND THE EDITOR M. Caon1 , P. Greer2 , MP. Registrars 1 School of Nursing & Midwifery, Flinders University, Adelaide, Australia. 2 Radiation Oncology Department, Calvary Mater Hospital, Newcastle, Australia.
This workshop is intended to be a relaxed and participatory discussion about the process of preparing a manuscript for submission to a scientific journal. Speakers, whose task it is to stimulate discussion with workshop attendees, will include the editor of APESM (Martin), a supervisor of medical physics registrars (Peter), medical physics registrars (current or recently completed) and workshop attendees may raise issues, put forward their observations and ask questions as they arise.
Topics for discussion will be (but are not limited to):
The experience of medical physics registrars in preparing a manuscript for publication (drafting it, liasing with other authors and their supervisor, submitting it, responding to reviewer comments etc).
The role of the supervisor in assisting a registrar prepare their work for publication.
How the Journal Editor processes a newly submitted manuscript.
EPSM-1261 Wed 6th Nov 16:15 Golden Ballroom Centre
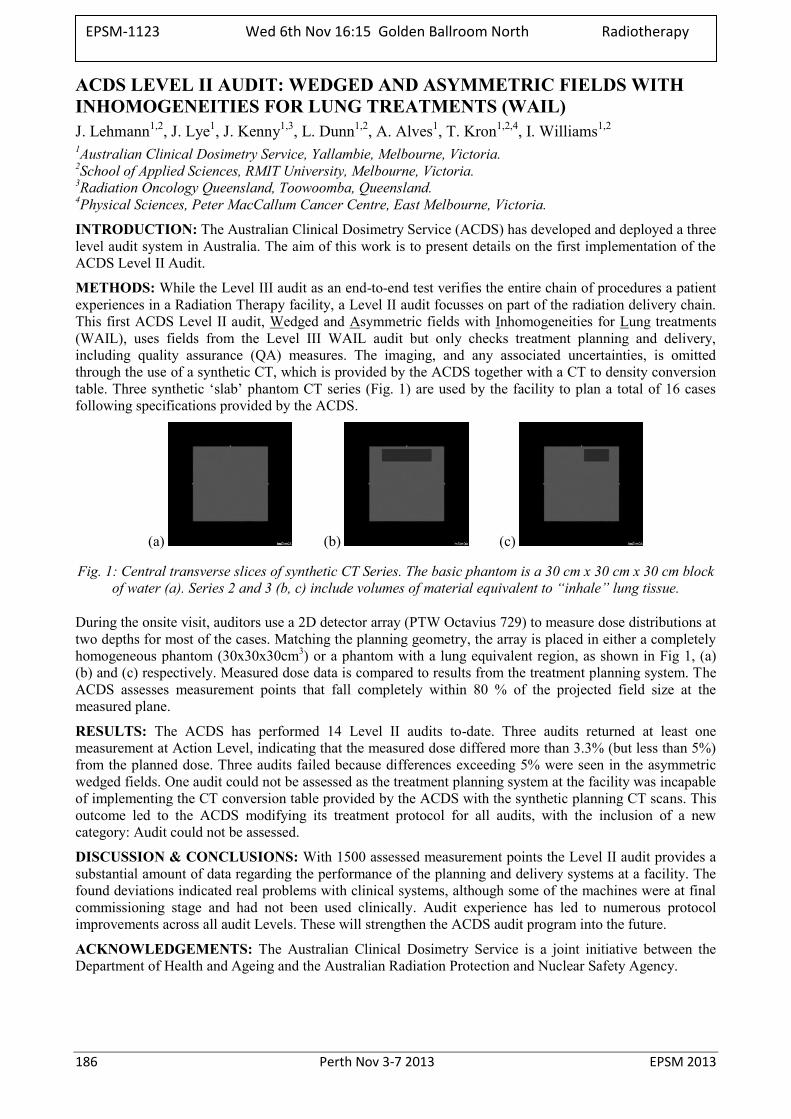
186 Perth Nov 3-7 2013 EPSM 2013
ACDS LEVEL II AUDIT: WEDGED AND ASYMMETRIC FIELDS WITH INHOMOGENEITIES FOR LUNG TREATMENTS (WAIL) J. Lehmann1,2, J. Lye1, J. Kenny1,3, L. Dunn1,2, A. Alves1, T. Kron1,2,4, I. Williams1,2 1Australian Clinical Dosimetry Service, Yallambie, Melbourne, Victoria. 2School of Applied Sciences, RMIT University, Melbourne, Victoria. 3Radiation Oncology Queensland, Toowoomba, Queensland. 4Physical Sciences, Peter MacCallum Cancer Centre, East Melbourne, Victoria.
INTRODUCTION: The Australian Clinical Dosimetry Service (ACDS) has developed and deployed a three level audit system in Australia. The aim of this work is to present details on the first implementation of the ACDS Level II Audit.
METHODS: While the Level III audit as an end-to-end test verifies the entire chain of procedures a patient experiences in a Radiation Therapy facility, a Level II audit focusses on part of the radiation delivery chain. This first ACDS Level II audit, Wedged and Asymmetric fields with Inhomogeneities for Lung treatments (WAIL), uses fields from the Level III WAIL audit but only checks treatment planning and delivery, including quality assurance (QA) measures. The imaging, and any associated uncertainties, is omitted through the use of a synthetic CT, which is provided by the ACDS together with a CT to density conversion table. Three synthetic ‘slab’ phantom CT series (Fig. 1) are used by the facility to plan a total of 16 cases following specifications provided by the ACDS.
(a) (b) (c)
Fig. 1: Central transverse slices of synthetic CT Series. The basic phantom is a 30 cm x 30 cm x 30 cm block of water (a). Series 2 and 3 (b, c) include volumes of material equivalent to “inhale” lung tissue.
During the onsite visit, auditors use a 2D detector array (PTW Octavius 729) to measure dose distributions at two depths for most of the cases. Matching the planning geometry, the array is placed in either a completely homogeneous phantom (30x30x30cm3) or a phantom with a lung equivalent region, as shown in Fig 1, (a) (b) and (c) respectively. Measured dose data is compared to results from the treatment planning system. The ACDS assesses measurement points that fall completely within 80 % of the projected field size at the measured plane.
RESULTS: The ACDS has performed 14 Level II audits to-date. Three audits returned at least one measurement at Action Level, indicating that the measured dose differed more than 3.3% (but less than 5%) from the planned dose. Three audits failed because differences exceeding 5% were seen in the asymmetric wedged fields. One audit could not be assessed as the treatment planning system at the facility was incapable of implementing the CT conversion table provided by the ACDS with the synthetic planning CT scans. This outcome led to the ACDS modifying its treatment protocol for all audits, with the inclusion of a new category: Audit could not be assessed.
DISCUSSION & CONCLUSIONS: With 1500 assessed measurement points the Level II audit provides a substantial amount of data regarding the performance of the planning and delivery systems at a facility. The found deviations indicated real problems with clinical systems, although some of the machines were at final commissioning stage and had not been used clinically. Audit experience has led to numerous protocol improvements across all audit Levels. These will strengthen the ACDS audit program into the future.
ACKNOWLEDGEMENTS: The Australian Clinical Dosimetry Service is a joint initiative between the Department of Health and Ageing and the Australian Radiation Protection and Nuclear Safety Agency.
EPSM-1123 Wed 6th Nov 16:15 Golden Ballroom North Radiotherapy
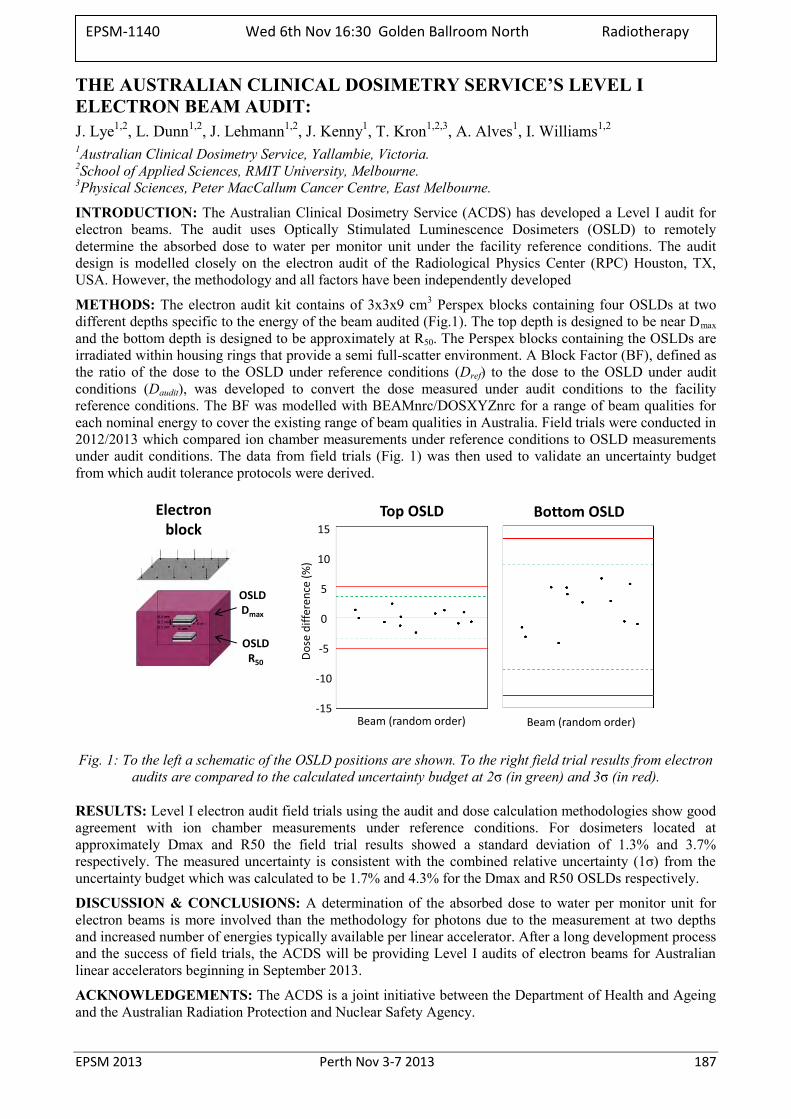
EPSM 2013 Perth Nov 3-7 2013 187
THE AUSTRALIAN CLINICAL DOSIMETRY SERVICE’S LEVEL I ELECTRON BEAM AUDIT: J. Lye1,2, L. Dunn1,2, J. Lehmann1,2, J. Kenny1, T. Kron1,2,3, A. Alves1, I. Williams1,2 1Australian Clinical Dosimetry Service, Yallambie, Victoria. 2School of Applied Sciences, RMIT University, Melbourne. 3Physical Sciences, Peter MacCallum Cancer Centre, East Melbourne.
INTRODUCTION: The Australian Clinical Dosimetry Service (ACDS) has developed a Level I audit for electron beams. The audit uses Optically Stimulated Luminescence Dosimeters (OSLD) to remotely determine the absorbed dose to water per monitor unit under the facility reference conditions. The audit design is modelled closely on the electron audit of the Radiological Physics Center (RPC) Houston, TX, USA. However, the methodology and all factors have been independently developed
METHODS: The electron audit kit contains of 3x3x9 cm3 Perspex blocks containing four OSLDs at two different depths specific to the energy of the beam audited (Fig.1). The top depth is designed to be near Dmax and the bottom depth is designed to be approximately at R50. The Perspex blocks containing the OSLDs are irradiated within housing rings that provide a semi full-scatter environment. A Block Factor (BF), defined as the ratio of the dose to the OSLD under reference conditions (Dref) to the dose to the OSLD under audit conditions (Daudit), was developed to convert the dose measured under audit conditions to the facility reference conditions. The BF was modelled with BEAMnrc/DOSXYZnrc for a range of beam qualities for each nominal energy to cover the existing range of beam qualities in Australia. Field trials were conducted in 2012/2013 which compared ion chamber measurements under reference conditions to OSLD measurements under audit conditions. The data from field trials (Fig. 1) was then used to validate an uncertainty budget from which audit tolerance protocols were derived.
15
10
5
0
-5
-10
-15
Do
se d
iffe
ren
ce (
%)
Beam (random order) Beam (random order)
Top OSLD Bottom OSLDElectronblock
OSLDDmax
OSLDR50
Fig. 1: To the left a schematic of the OSLD positions are shown. To the right field trial results from electron audits are compared to the calculated uncertainty budget at 2σ (in green) and 3σ (in red).
RESULTS: Level I electron audit field trials using the audit and dose calculation methodologies show good agreement with ion chamber measurements under reference conditions. For dosimeters located at approximately Dmax and R50 the field trial results showed a standard deviation of 1.3% and 3.7% respectively. The measured uncertainty is consistent with the combined relative uncertainty (1σ) from the uncertainty budget which was calculated to be 1.7% and 4.3% for the Dmax and R50 OSLDs respectively.
DISCUSSION & CONCLUSIONS: A determination of the absorbed dose to water per monitor unit for electron beams is more involved than the methodology for photons due to the measurement at two depths and increased number of energies typically available per linear accelerator. After a long development process and the success of field trials, the ACDS will be providing Level I audits of electron beams for Australian linear accelerators beginning in September 2013.
ACKNOWLEDGEMENTS: The ACDS is a joint initiative between the Department of Health and Ageing and the Australian Radiation Protection and Nuclear Safety Agency.
EPSM-1140 Wed 6th Nov 16:30 Golden Ballroom North Radiotherapy
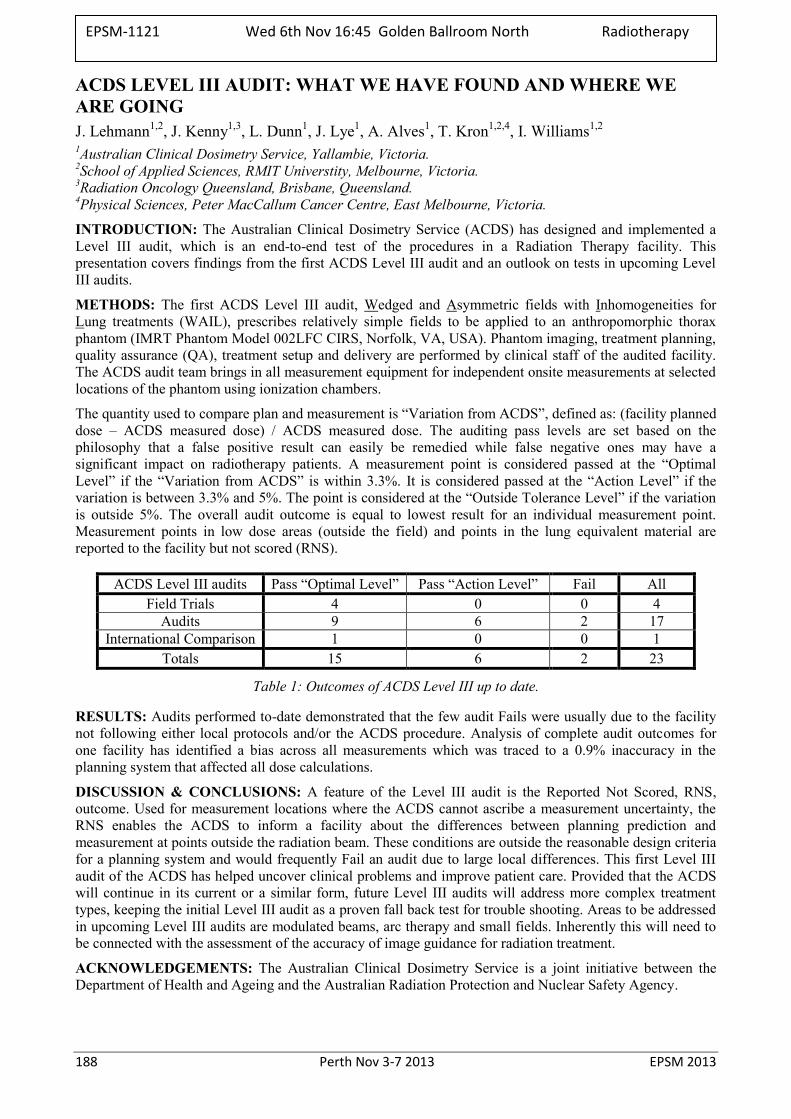
188 Perth Nov 3-7 2013 EPSM 2013
ACDS LEVEL III AUDIT: WHAT WE HAVE FOUND AND WHERE WE ARE GOING J. Lehmann1,2, J. Kenny1,3, L. Dunn1, J. Lye1, A. Alves1, T. Kron1,2,4, I. Williams1,2 1Australian Clinical Dosimetry Service, Yallambie, Victoria. 2School of Applied Sciences, RMIT Universtity, Melbourne, Victoria. 3Radiation Oncology Queensland, Brisbane, Queensland. 4Physical Sciences, Peter MacCallum Cancer Centre, East Melbourne, Victoria.
INTRODUCTION: The Australian Clinical Dosimetry Service (ACDS) has designed and implemented a Level III audit, which is an end-to-end test of the procedures in a Radiation Therapy facility. This presentation covers findings from the first ACDS Level III audit and an outlook on tests in upcoming Level III audits.
METHODS: The first ACDS Level III audit, Wedged and Asymmetric fields with Inhomogeneities for Lung treatments (WAIL), prescribes relatively simple fields to be applied to an anthropomorphic thorax phantom (IMRT Phantom Model 002LFC CIRS, Norfolk, VA, USA). Phantom imaging, treatment planning, quality assurance (QA), treatment setup and delivery are performed by clinical staff of the audited facility. The ACDS audit team brings in all measurement equipment for independent onsite measurements at selected locations of the phantom using ionization chambers.
The quantity used to compare plan and measurement is “Variation from ACDS”, defined as: (facility planned dose – ACDS measured dose) / ACDS measured dose. The auditing pass levels are set based on the philosophy that a false positive result can easily be remedied while false negative ones may have a significant impact on radiotherapy patients. A measurement point is considered passed at the “Optimal Level” if the “Variation from ACDS” is within 3.3%. It is considered passed at the “Action Level” if the variation is between 3.3% and 5%. The point is considered at the “Outside Tolerance Level” if the variation is outside 5%. The overall audit outcome is equal to lowest result for an individual measurement point. Measurement points in low dose areas (outside the field) and points in the lung equivalent material are reported to the facility but not scored (RNS).
ACDS Level III audits Pass “Optimal Level” Pass “Action Level” Fail All Field Trials 4 0 0 4
Audits 9 6 2 17 International Comparison 1 0 0 1
Totals 15 6 2 23
Table 1: Outcomes of ACDS Level III up to date.
RESULTS: Audits performed to-date demonstrated that the few audit Fails were usually due to the facility not following either local protocols and/or the ACDS procedure. Analysis of complete audit outcomes for one facility has identified a bias across all measurements which was traced to a 0.9% inaccuracy in the planning system that affected all dose calculations.
DISCUSSION & CONCLUSIONS: A feature of the Level III audit is the Reported Not Scored, RNS, outcome. Used for measurement locations where the ACDS cannot ascribe a measurement uncertainty, the RNS enables the ACDS to inform a facility about the differences between planning prediction and measurement at points outside the radiation beam. These conditions are outside the reasonable design criteria for a planning system and would frequently Fail an audit due to large local differences. This first Level III audit of the ACDS has helped uncover clinical problems and improve patient care. Provided that the ACDS will continue in its current or a similar form, future Level III audits will address more complex treatment types, keeping the initial Level III audit as a proven fall back test for trouble shooting. Areas to be addressed in upcoming Level III audits are modulated beams, arc therapy and small fields. Inherently this will need to be connected with the assessment of the accuracy of image guidance for radiation treatment.
ACKNOWLEDGEMENTS: The Australian Clinical Dosimetry Service is a joint initiative between the Department of Health and Ageing and the Australian Radiation Protection and Nuclear Safety Agency.
EPSM-1121 Wed 6th Nov 16:45 Golden Ballroom North Radiotherapy
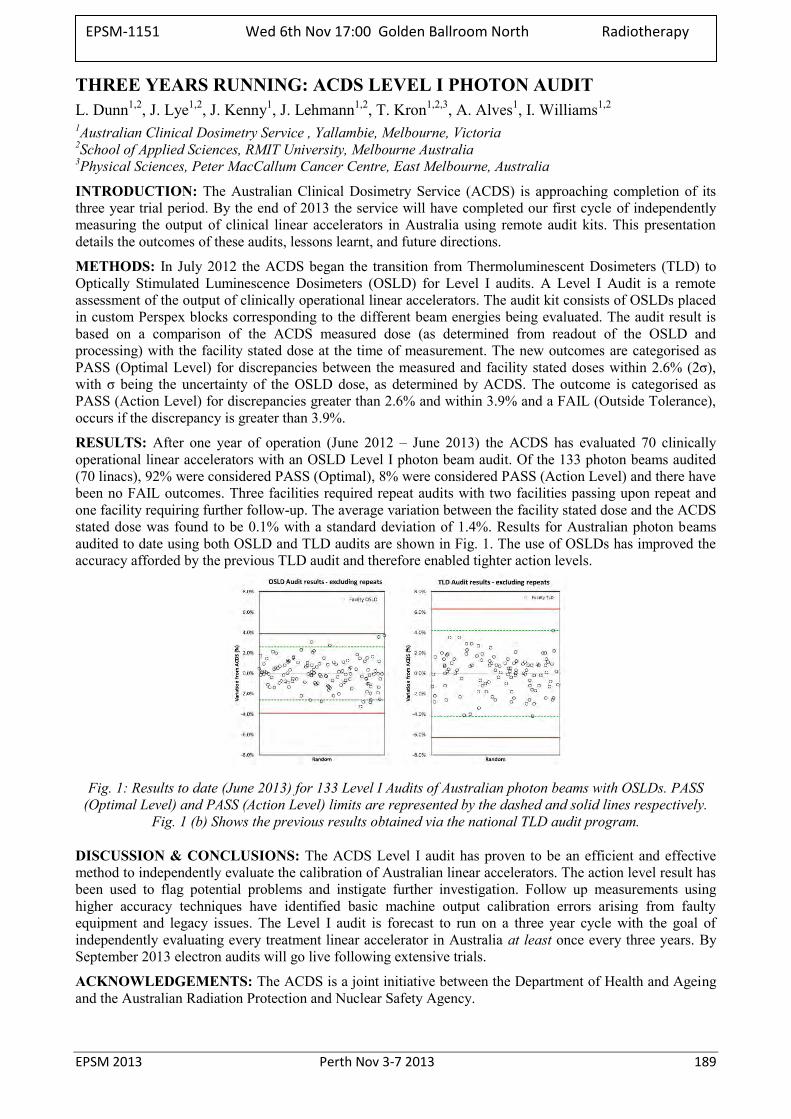
EPSM 2013 Perth Nov 3-7 2013 189
THREE YEARS RUNNING: ACDS LEVEL I PHOTON AUDIT L. Dunn1,2, J. Lye1,2, J. Kenny1, J. Lehmann1,2, T. Kron1,2,3, A. Alves1, I. Williams1,2 1Australian Clinical Dosimetry Service , Yallambie, Melbourne, Victoria 2School of Applied Sciences, RMIT University, Melbourne Australia 3Physical Sciences, Peter MacCallum Cancer Centre, East Melbourne, Australia
INTRODUCTION: The Australian Clinical Dosimetry Service (ACDS) is approaching completion of its three year trial period. By the end of 2013 the service will have completed our first cycle of independently measuring the output of clinical linear accelerators in Australia using remote audit kits. This presentation details the outcomes of these audits, lessons learnt, and future directions.
METHODS: In July 2012 the ACDS began the transition from Thermoluminescent Dosimeters (TLD) to Optically Stimulated Luminescence Dosimeters (OSLD) for Level I audits. A Level I Audit is a remote assessment of the output of clinically operational linear accelerators. The audit kit consists of OSLDs placed in custom Perspex blocks corresponding to the different beam energies being evaluated. The audit result is based on a comparison of the ACDS measured dose (as determined from readout of the OSLD and processing) with the facility stated dose at the time of measurement. The new outcomes are categorised as PASS (Optimal Level) for discrepancies between the measured and facility stated doses within 2.6% (2σ), with σ being the uncertainty of the OSLD dose, as determined by ACDS. The outcome is categorised as PASS (Action Level) for discrepancies greater than 2.6% and within 3.9% and a FAIL (Outside Tolerance), occurs if the discrepancy is greater than 3.9%.
RESULTS: After one year of operation (June 2012 – June 2013) the ACDS has evaluated 70 clinically operational linear accelerators with an OSLD Level I photon beam audit. Of the 133 photon beams audited (70 linacs), 92% were considered PASS (Optimal), 8% were considered PASS (Action Level) and there have been no FAIL outcomes. Three facilities required repeat audits with two facilities passing upon repeat and one facility requiring further follow-up. The average variation between the facility stated dose and the ACDS stated dose was found to be 0.1% with a standard deviation of 1.4%. Results for Australian photon beams audited to date using both OSLD and TLD audits are shown in Fig. 1. The use of OSLDs has improved the accuracy afforded by the previous TLD audit and therefore enabled tighter action levels.
Fig. 1: Results to date (June 2013) for 133 Level I Audits of Australian photon beams with OSLDs. PASS (Optimal Level) and PASS (Action Level) limits are represented by the dashed and solid lines respectively.
Fig. 1 (b) Shows the previous results obtained via the national TLD audit program.
DISCUSSION & CONCLUSIONS: The ACDS Level I audit has proven to be an efficient and effective method to independently evaluate the calibration of Australian linear accelerators. The action level result has been used to flag potential problems and instigate further investigation. Follow up measurements using higher accuracy techniques have identified basic machine output calibration errors arising from faulty equipment and legacy issues. The Level I audit is forecast to run on a three year cycle with the goal of independently evaluating every treatment linear accelerator in Australia at least once every three years. By September 2013 electron audits will go live following extensive trials.
ACKNOWLEDGEMENTS: The ACDS is a joint initiative between the Department of Health and Ageing and the Australian Radiation Protection and Nuclear Safety Agency.
EPSM-1151 Wed 6th Nov 17:00 Golden Ballroom North Radiotherapy
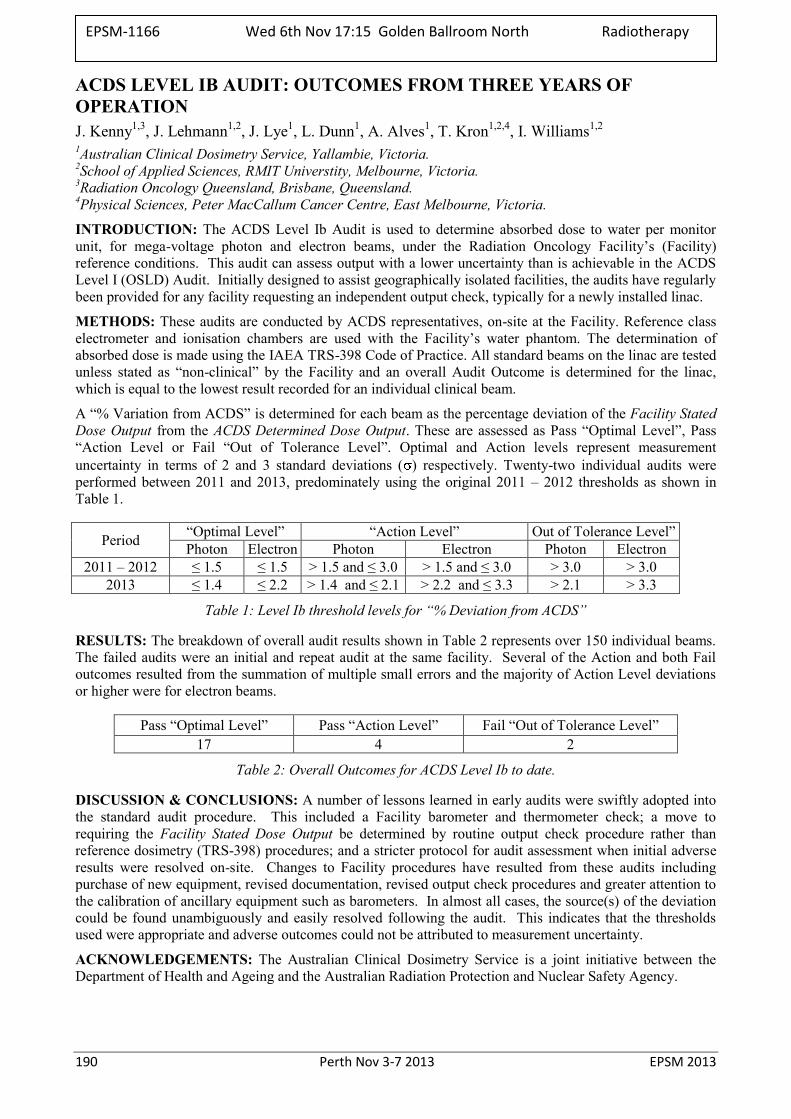
190 Perth Nov 3-7 2013 EPSM 2013
ACDS LEVEL IB AUDIT: OUTCOMES FROM THREE YEARS OF OPERATION J. Kenny1,3, J. Lehmann1,2, J. Lye1, L. Dunn1, A. Alves1, T. Kron1,2,4, I. Williams1,2 1Australian Clinical Dosimetry Service, Yallambie, Victoria. 2School of Applied Sciences, RMIT Universtity, Melbourne, Victoria. 3Radiation Oncology Queensland, Brisbane, Queensland. 4Physical Sciences, Peter MacCallum Cancer Centre, East Melbourne, Victoria.
INTRODUCTION: The ACDS Level Ib Audit is used to determine absorbed dose to water per monitor unit, for mega-voltage photon and electron beams, under the Radiation Oncology Facility’s (Facility) reference conditions. This audit can assess output with a lower uncertainty than is achievable in the ACDS Level I (OSLD) Audit. Initially designed to assist geographically isolated facilities, the audits have regularly been provided for any facility requesting an independent output check, typically for a newly installed linac.
METHODS: These audits are conducted by ACDS representatives, on-site at the Facility. Reference class electrometer and ionisation chambers are used with the Facility’s water phantom. The determination of absorbed dose is made using the IAEA TRS-398 Code of Practice. All standard beams on the linac are tested unless stated as “non-clinical” by the Facility and an overall Audit Outcome is determined for the linac, which is equal to the lowest result recorded for an individual clinical beam.
A “% Variation from ACDS” is determined for each beam as the percentage deviation of the Facility Stated Dose Output from the ACDS Determined Dose Output. These are assessed as Pass “Optimal Level”, Pass “Action Level or Fail “Out of Tolerance Level”. Optimal and Action levels represent measurement uncertainty in terms of 2 and 3 standard deviations ( ) respectively. Twenty-two individual audits were performed between 2011 and 2013, predominately using the original 2011 – 2012 thresholds as shown in Table 1.
Period “Optimal Level” “Action Level” Out of Tolerance Level” Photon Electron Photon Electron Photon Electron
2011 – 2012 ≤ 1.5 ≤ 1.5 > 1.5 and ≤ 3.0 > 1.5 and ≤ 3.0 > 3.0 > 3.0 2013 ≤ 1.4 ≤ 2.2 > 1.4 and ≤ 2.1 > 2.2 and ≤ 3.3 > 2.1 > 3.3
Table 1: Level Ib threshold levels for “% Deviation from ACDS”
RESULTS: The breakdown of overall audit results shown in Table 2 represents over 150 individual beams. The failed audits were an initial and repeat audit at the same facility. Several of the Action and both Fail outcomes resulted from the summation of multiple small errors and the majority of Action Level deviations or higher were for electron beams.
Pass “Optimal Level” Pass “Action Level” Fail “Out of Tolerance Level” 17 4 2
Table 2: Overall Outcomes for ACDS Level Ib to date.
DISCUSSION & CONCLUSIONS: A number of lessons learned in early audits were swiftly adopted into the standard audit procedure. This included a Facility barometer and thermometer check; a move to requiring the Facility Stated Dose Output be determined by routine output check procedure rather than reference dosimetry (TRS-398) procedures; and a stricter protocol for audit assessment when initial adverse results were resolved on-site. Changes to Facility procedures have resulted from these audits including purchase of new equipment, revised documentation, revised output check procedures and greater attention to the calibration of ancillary equipment such as barometers. In almost all cases, the source(s) of the deviation could be found unambiguously and easily resolved following the audit. This indicates that the thresholds used were appropriate and adverse outcomes could not be attributed to measurement uncertainty.
ACKNOWLEDGEMENTS: The Australian Clinical Dosimetry Service is a joint initiative between the Department of Health and Ageing and the Australian Radiation Protection and Nuclear Safety Agency.
EPSM-1166 Wed 6th Nov 17:15 Golden Ballroom North Radiotherapy
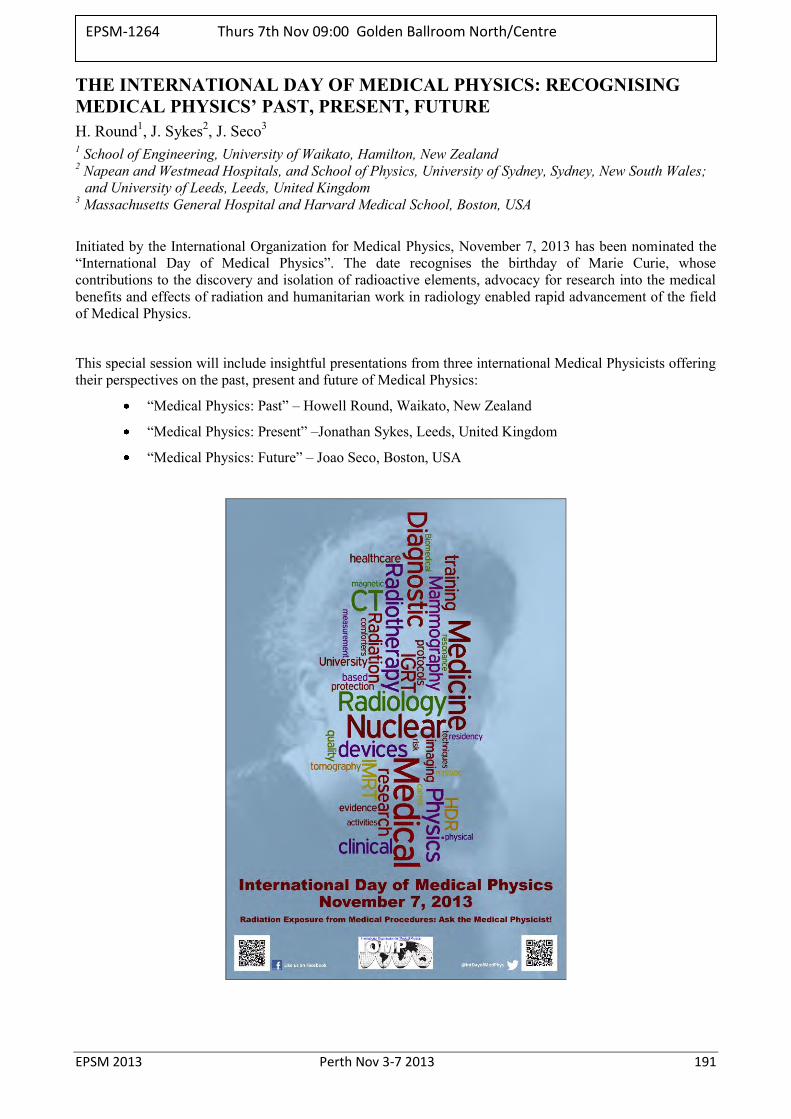
EPSM 2013 Perth Nov 3-7 2013 191
THE INTERNATIONAL DAY OF MEDICAL PHYSICS: RECOGNISING MEDICAL PHYSICS’ PAST, PRESENT, FUTURE H. Round1, J. Sykes2, J. Seco3
1 School of Engineering, University of Waikato, Hamilton, New Zealand 2 Napean and Westmead Hospitals, and School of Physics, University of Sydney, Sydney, New South Wales;
and University of Leeds, Leeds, United Kingdom 3 Massachusetts General Hospital and Harvard Medical School, Boston, USA
Initiated by the International Organization for Medical Physics, November 7, 2013 has been nominated the “International Day of Medical Physics”. The date recognises the birthday of Marie Curie, whose contributions to the discovery and isolation of radioactive elements, advocacy for research into the medical benefits and effects of radiation and humanitarian work in radiology enabled rapid advancement of the field of Medical Physics.
This special session will include insightful presentations from three international Medical Physicists offering their perspectives on the past, present and future of Medical Physics:
“Medical Physics: Past” – Howell Round, Waikato, New Zealand
“Medical Physics: Present” –Jonathan Sykes, Leeds, United Kingdom
“Medical Physics: Future” – Joao Seco, Boston, USA
EPSM-1264 Thurs 7th Nov 09:00 Golden Ballroom North/Centre
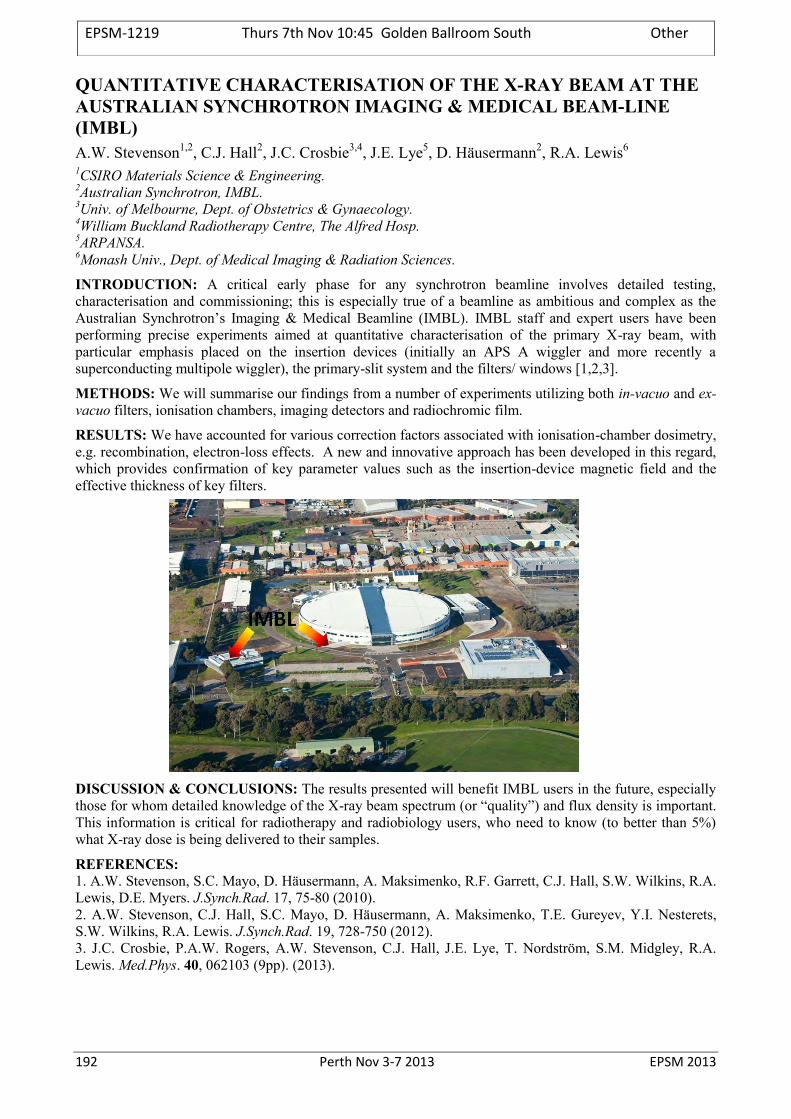
192 Perth Nov 3-7 2013 EPSM 2013
QUANTITATIVE CHARACTERISATION OF THE X-RAY BEAM AT THE AUSTRALIAN SYNCHROTRON IMAGING & MEDICAL BEAM-LINE (IMBL) A.W. Stevenson1,2, C.J. Hall2, J.C. Crosbie3,4, J.E. Lye5, D. Häusermann2, R.A. Lewis6 1CSIRO Materials Science & Engineering. 2Australian Synchrotron, IMBL. 3Univ. of Melbourne, Dept. of Obstetrics & Gynaecology. 4William Buckland Radiotherapy Centre, The Alfred Hosp. 5ARPANSA. 6Monash Univ., Dept. of Medical Imaging & Radiation Sciences.
INTRODUCTION: A critical early phase for any synchrotron beamline involves detailed testing, characterisation and commissioning; this is especially true of a beamline as ambitious and complex as the Australian Synchrotron’s Imaging & Medical Beamline (IMBL). IMBL staff and expert users have been performing precise experiments aimed at quantitative characterisation of the primary X-ray beam, with particular emphasis placed on the insertion devices (initially an APS A wiggler and more recently a superconducting multipole wiggler), the primary-slit system and the filters/ windows [1,2,3].
METHODS: We will summarise our findings from a number of experiments utilizing both in-vacuo and ex-vacuo filters, ionisation chambers, imaging detectors and radiochromic film.
RESULTS: We have accounted for various correction factors associated with ionisation-chamber dosimetry, e.g. recombination, electron-loss effects. A new and innovative approach has been developed in this regard, which provides confirmation of key parameter values such as the insertion-device magnetic field and the effective thickness of key filters.
DISCUSSION & CONCLUSIONS: The results presented will benefit IMBL users in the future, especially those for whom detailed knowledge of the X-ray beam spectrum (or “quality”) and flux density is important. This information is critical for radiotherapy and radiobiology users, who need to know (to better than 5%) what X-ray dose is being delivered to their samples.
REFERENCES: 1. A.W. Stevenson, S.C. Mayo, D. Häusermann, A. Maksimenko, R.F. Garrett, C.J. Hall, S.W. Wilkins, R.A. Lewis, D.E. Myers. J.Synch.Rad. 17, 75-80 (2010). 2. A.W. Stevenson, C.J. Hall, S.C. Mayo, D. Häusermann, A. Maksimenko, T.E. Gureyev, Y.I. Nesterets, S.W. Wilkins, R.A. Lewis. J.Synch.Rad. 19, 728-750 (2012). 3. J.C. Crosbie, P.A.W. Rogers, A.W. Stevenson, C.J. Hall, J.E. Lye, T. Nordström, S.M. Midgley, R.A. Lewis. Med.Phys. 40, 062103 (9pp). (2013).
EPSM-1219 Thurs 7th Nov 10:45 Golden Ballroom South Other
EPSM 2013 Perth Nov 3-7 2013 193
SYNCHROTRON X-RAY BEAMS FOR MEDICAL PHYSICS RESEARCH C. Hall1, D. Häusermann1, A. Maksimenko1, A. Stevenson1,3, K. Siu1,2, J. Pearson1,2 1The Australian Synchrotron, Imaging and Medical Beam Line, 800 Blackburn Rd, Clayton VIC 3168. 2Monash University, Monash Biomedical Imaging, Clayton, VIC 3800. 3CSIRO, Materials Science and Engineering, Private Bag 33, Clayton Sth VIC 3169.
INTRODUCTION: The brightness, bandwidth, coherence, and polarisation of synchrotron x-ray beams make them a useful tool for both x-ray radiography and radiotherapy research. Such beams are generated using storage ring accelerators. Large scale facilities are usually built as part of national scientific infrastructure. Amongst the world's synchrotron light source laboratories there are only a few examples in the world of dedicated instruments working in the field of medical physics. The Imaging and Medical beam line (IMBL) at the Australian Synchrotron is just such a purpose built facility [1].
DESCRIPTION: IMBL was designed and built explicitly to investigate ways to use the unique qualities of synchrotron x-ray beam for medical research. The beam line has three radiation enclosures for experiments which cover use in a wide range of studies, from broad bandwidth, fine structured beam radio-biology projects, to monochromatic (narrow bandwidth) large animal pre-clinical and clinical human imaging.
The highly collimated nature of the beams allows spatial modulation with feature sizes down to the ~10 micron scale. The adjustable power can provide dose rates of kiloGrays per second. High lateral and transverse coherence is achievable and allows phase contrast planar imaging and computed tomography (CT) to be explored in bio-medical radiography. IMBL's bright beams can also be exploited for dynamic x-ray imaging with frame rates of ~10s of milliseconds. The stable and well understood nature of the generation of synchrotron light from a storage ring also gives these beams the potential for accurate dosimetric investigations, and instrument characterisation in the kilovoltage photon range.
This presentation describes the status of the IMBL facility, its current use, and future prospects.
REFERENCE: 1. D. Hausermann et al (2010) The Imaging and Medical Beam Line at the Australian Synchrotron, American Institute of Physics Proceedings, 1266, p3-9.
EPSM-1182 Thurs 7th Nov 11:00 Golden Ballroom South Biomed Eng
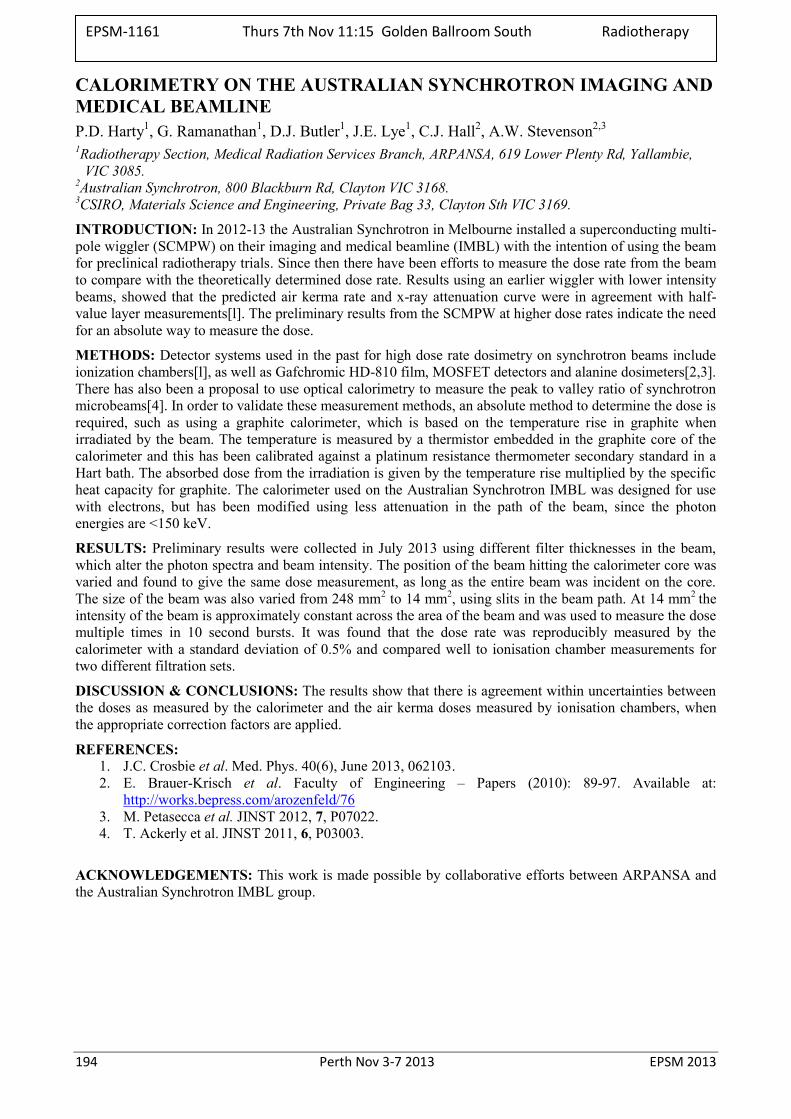
194 Perth Nov 3-7 2013 EPSM 2013
CALORIMETRY ON THE AUSTRALIAN SYNCHROTRON IMAGING AND MEDICAL BEAMLINE P.D. Harty1, G. Ramanathan1, D.J. Butler1, J.E. Lye1, C.J. Hall2, A.W. Stevenson2,3 1Radiotherapy Section, Medical Radiation Services Branch, ARPANSA, 619 Lower Plenty Rd, Yallambie,
VIC 3085. 2Australian Synchrotron, 800 Blackburn Rd, Clayton VIC 3168. 3CSIRO, Materials Science and Engineering, Private Bag 33, Clayton Sth VIC 3169.
INTRODUCTION: In 2012-13 the Australian Synchrotron in Melbourne installed a superconducting multi-pole wiggler (SCMPW) on their imaging and medical beamline (IMBL) with the intention of using the beam for preclinical radiotherapy trials. Since then there have been efforts to measure the dose rate from the beam to compare with the theoretically determined dose rate. Results using an earlier wiggler with lower intensity beams, showed that the predicted air kerma rate and x-ray attenuation curve were in agreement with half-value layer measurements[l]. The preliminary results from the SCMPW at higher dose rates indicate the need for an absolute way to measure the dose.
METHODS: Detector systems used in the past for high dose rate dosimetry on synchrotron beams include ionization chambers[l], as well as Gafchromic HD-810 film, MOSFET detectors and alanine dosimeters[2,3]. There has also been a proposal to use optical calorimetry to measure the peak to valley ratio of synchrotron microbeams[4]. In order to validate these measurement methods, an absolute method to determine the dose is required, such as using a graphite calorimeter, which is based on the temperature rise in graphite when irradiated by the beam. The temperature is measured by a thermistor embedded in the graphite core of the calorimeter and this has been calibrated against a platinum resistance thermometer secondary standard in a Hart bath. The absorbed dose from the irradiation is given by the temperature rise multiplied by the specific heat capacity for graphite. The calorimeter used on the Australian Synchrotron IMBL was designed for use with electrons, but has been modified using less attenuation in the path of the beam, since the photon energies are <150 keV.
RESULTS: Preliminary results were collected in July 2013 using different filter thicknesses in the beam, which alter the photon spectra and beam intensity. The position of the beam hitting the calorimeter core was varied and found to give the same dose measurement, as long as the entire beam was incident on the core. The size of the beam was also varied from 248 mm2 to 14 mm2, using slits in the beam path. At 14 mm2 the intensity of the beam is approximately constant across the area of the beam and was used to measure the dose multiple times in 10 second bursts. It was found that the dose rate was reproducibly measured by the calorimeter with a standard deviation of 0.5% and compared well to ionisation chamber measurements for two different filtration sets.
DISCUSSION & CONCLUSIONS: The results show that there is agreement within uncertainties between the doses as measured by the calorimeter and the air kerma doses measured by ionisation chambers, when the appropriate correction factors are applied.
REFERENCES: 1. J.C. Crosbie et al. Med. Phys. 40(6), June 2013, 062103. 2. E. Brauer-Krisch et al. Faculty of Engineering – Papers (2010): 89-97. Available at:
http://works.bepress.com/arozenfeld/76 3. M. Petasecca et al. JINST 2012, 7, P07022. 4. T. Ackerly et al. JINST 2011, 6, P03003.
ACKNOWLEDGEMENTS: This work is made possible by collaborative efforts between ARPANSA and the Australian Synchrotron IMBL group.
EPSM-1161 Thurs 7th Nov 11:15 Golden Ballroom South Radiotherapy
EPSM 2013 Perth Nov 3-7 2013 195
INVESTIGATION OF ENERGY DEPOSITION BY ALPHA PARTICLES USING OF TIMEPIX DETECTOR R. AL Darwish, E. Bezak, M. Mohammadi Department of Medical Physics, Royal Adelaide Hospital and School of Chemistry and Physics, University
of Adelaide.
INTRODUCTION: Timepix detector, Amsterdam Scientific Instruments, is a novel microdosimeter capable of recording information about particle energy deposited in a small volume/area of the material (approximately 55 μm2). It consists of a semiconductor layer divided into a pixel array which is bump-bonded to an electronics integrated layer [1-3]. Timepix offers detection, imaging and tomography functions as it can measure and discriminate particle energy.
The main aim of this work is to use Timepix in Time over Threshold mode (TOT mode) to detect and measure the energy deposition of alpha particles emitted from Thorium-227 and Americium-241.
METHODS: Timepix detector, calibrated in a TOT mode connected to SoPhy program, was used in the current work. Several alpha particle emitters (pure Th-227, Th-227 with daughters (the main daughter product is 223Ra) and Am-241) with energies between 5.03 - 6.04 MeV (Th-227) and between 4.76 and 5.54 MeV (Am-241), were positioned at a distance of 2.5 cm from the detector. Alpha particle spectrum was recorded by Timepix. The spectrum was also measured using number of 10 μm thick Myler foil layers positioned between the source and the detector (i.e. serving as energy attenuators). Between 1800 and 180,000 frames were taken in acquisition time from 0.01 to 1 second per frame to measure the alpha particle energy spectra.
RESULTS: Alpha particle energy spectra of two radioactive materials (Th-227 and Am-241) have been recorded using Timepix in TOT mode. The results gave information about the energy level, thickness of the stopping material (i.e. Myler foil). The spectra were analysed and compared with the known spectra from literature. Fig. 1 shows centres of accepted pixel clusters of alpha particles for Th-227 with its daughters.
Fig. 1: The centres of accepted pixel clusters of alpha particles for Th-227 with its daughters.
DISCUSSION & CONCLUSIONS: Timepix radiation detector is suitable to detect and measure alpha particles as well as to measure energy loss of alpha particles in thin materials.
Our future work will focus on the clinical radiation oncology usage of Timepix, namely for dose determination in targeted alpha therapy. Using Timepix, this work is expected to assess the dose distribution at a cellular level, due to irradiation using alpha particles produced from Thorium-227.
REFERENCES: 1. Medipix, (2013) http://medipix.web.cern.ch/medipix/. 2. J. Jakubek (2008) Pixel detectors for imaging with heavy charged particles., Nuclear Instruments and Methods in Physics Research Section A: Accelerators, Spectrometers, Detectors and Associated Equipment. 3. J. Vallerga (2008) High-resolution UV, alpha and neutron imaging with the Timepix CMOS readout., Nuclear Instruments and Methods in Physics Research Section A: Accelerators, Spectrometers, Detectors and Associated Equipment.
EPSM-1156 Thurs 7th Nov 11:30 Golden Ballroom South Other
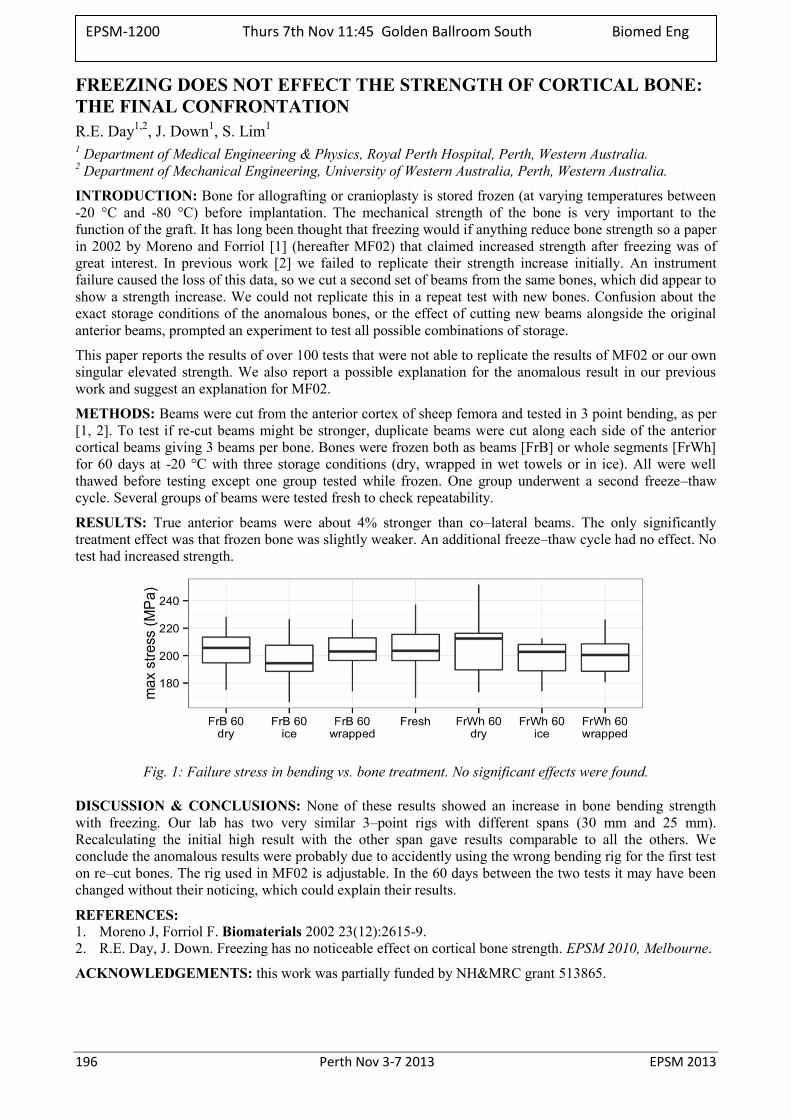
196 Perth Nov 3-7 2013 EPSM 2013
FREEZING DOES NOT EFFECT THE STRENGTH OF CORTICAL BONE: THE FINAL CONFRONTATION R.E. Day1,2, J. Down1, S. Lim1 1 Department of Medical Engineering & Physics, Royal Perth Hospital, Perth, Western Australia. 2 Department of Mechanical Engineering, University of Western Australia, Perth, Western Australia.
INTRODUCTION: Bone for allografting or cranioplasty is stored frozen (at varying temperatures between -20 °C and -80 °C) before implantation. The mechanical strength of the bone is very important to the function of the graft. It has long been thought that freezing would if anything reduce bone strength so a paper in 2002 by Moreno and Forriol [1] (hereafter MF02) that claimed increased strength after freezing was of great interest. In previous work [2] we failed to replicate their strength increase initially. An instrument failure caused the loss of this data, so we cut a second set of beams from the same bones, which did appear to show a strength increase. We could not replicate this in a repeat test with new bones. Confusion about the exact storage conditions of the anomalous bones, or the effect of cutting new beams alongside the original anterior beams, prompted an experiment to test all possible combinations of storage.
This paper reports the results of over 100 tests that were not able to replicate the results of MF02 or our own singular elevated strength. We also report a possible explanation for the anomalous result in our previous work and suggest an explanation for MF02.
METHODS: Beams were cut from the anterior cortex of sheep femora and tested in 3 point bending, as per [1, 2]. To test if re-cut beams might be stronger, duplicate beams were cut along each side of the anterior cortical beams giving 3 beams per bone. Bones were frozen both as beams [FrB] or whole segments [FrWh] for 60 days at -20 °C with three storage conditions (dry, wrapped in wet towels or in ice). All were well thawed before testing except one group tested while frozen. One group underwent a second freeze–thaw cycle. Several groups of beams were tested fresh to check repeatability.
RESULTS: True anterior beams were about 4% stronger than co–lateral beams. The only significantly treatment effect was that frozen bone was slightly weaker. An additional freeze–thaw cycle had no effect. No test had increased strength.
Fig. 1: Failure stress in bending vs. bone treatment. No significant effects were found.
DISCUSSION & CONCLUSIONS: None of these results showed an increase in bone bending strength with freezing. Our lab has two very similar 3–point rigs with different spans (30 mm and 25 mm). Recalculating the initial high result with the other span gave results comparable to all the others. We conclude the anomalous results were probably due to accidently using the wrong bending rig for the first test on re–cut bones. The rig used in MF02 is adjustable. In the 60 days between the two tests it may have been changed without their noticing, which could explain their results.
REFERENCES: 1. Moreno J, Forriol F. Biomaterials 2002 23(12):2615-9. 2. R.E. Day, J. Down. Freezing has no noticeable effect on cortical bone strength. EPSM 2010, Melbourne.
ACKNOWLEDGEMENTS: this work was partially funded by NH&MRC grant 513865.
EPSM-1200 Thurs 7th Nov 11:45 Golden Ballroom South Biomed Eng
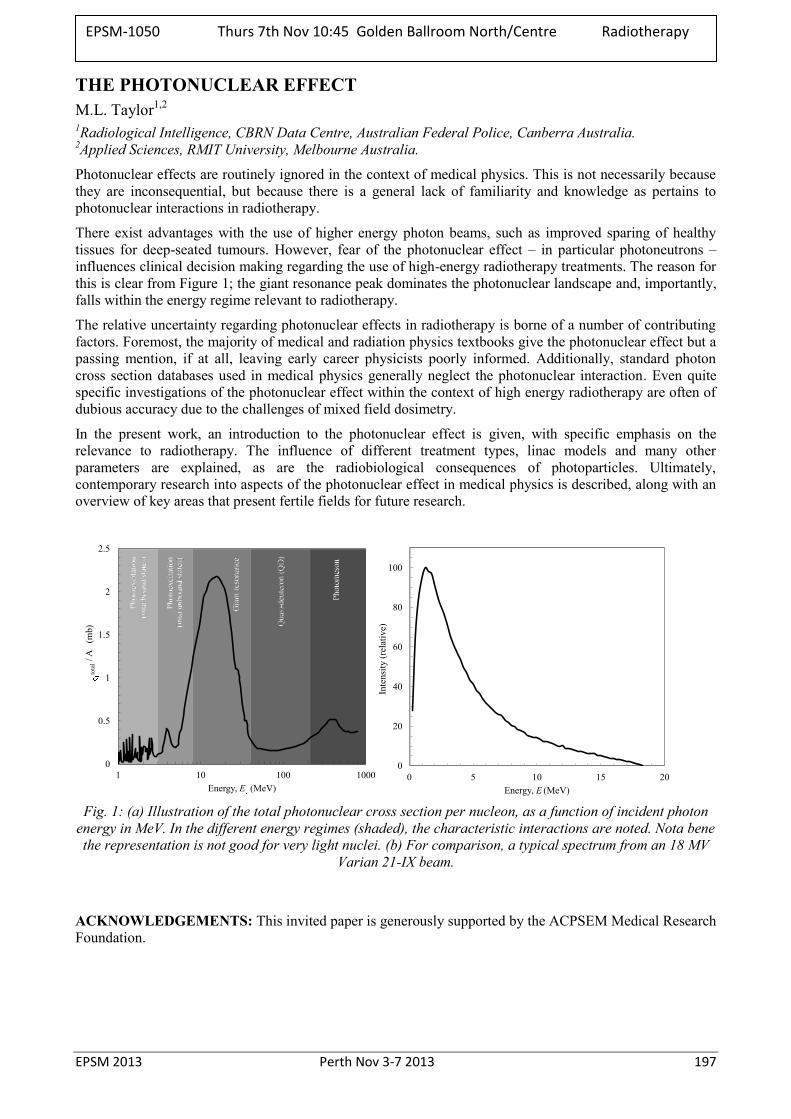
EPSM 2013 Perth Nov 3-7 2013 197
THE PHOTONUCLEAR EFFECT M.L. Taylor1,2 1Radiological Intelligence, CBRN Data Centre, Australian Federal Police, Canberra Australia. 2Applied Sciences, RMIT University, Melbourne Australia.
Photonuclear effects are routinely ignored in the context of medical physics. This is not necessarily because they are inconsequential, but because there is a general lack of familiarity and knowledge as pertains to photonuclear interactions in radiotherapy.
There exist advantages with the use of higher energy photon beams, such as improved sparing of healthy tissues for deep-seated tumours. However, fear of the photonuclear effect – in particular photoneutrons – influences clinical decision making regarding the use of high-energy radiotherapy treatments. The reason for this is clear from Figure 1; the giant resonance peak dominates the photonuclear landscape and, importantly, falls within the energy regime relevant to radiotherapy.
The relative uncertainty regarding photonuclear effects in radiotherapy is borne of a number of contributing factors. Foremost, the majority of medical and radiation physics textbooks give the photonuclear effect but a passing mention, if at all, leaving early career physicists poorly informed. Additionally, standard photon cross section databases used in medical physics generally neglect the photonuclear interaction. Even quite specific investigations of the photonuclear effect within the context of high energy radiotherapy are often of dubious accuracy due to the challenges of mixed field dosimetry.
In the present work, an introduction to the photonuclear effect is given, with specific emphasis on the relevance to radiotherapy. The influence of different treatment types, linac models and many other parameters are explained, as are the radiobiological consequences of photoparticles. Ultimately, contemporary research into aspects of the photonuclear effect in medical physics is described, along with an overview of key areas that present fertile fields for future research.
Fig. 1: (a) Illustration of the total photonuclear cross section per nucleon, as a function of incident photon
energy in MeV. In the different energy regimes (shaded), the characteristic interactions are noted. Nota bene the representation is not good for very light nuclei. (b) For comparison, a typical spectrum from an 18 MV
Varian 21-IX beam.
ACKNOWLEDGEMENTS: This invited paper is generously supported by the ACPSEM Medical Research Foundation.
0
0.5
1
1.5
2
2.5
1 10 100 1000
tota
l/ A
(m
b)
Energy, E (MeV)
0
20
40
60
80
100
0 5 10 15 20
Inte
nsity
(rel
ativ
e)
Energy, E (MeV)
EPSM-1050 Thurs 7th Nov 10:45 Golden Ballroom North/Centre Radiotherapy
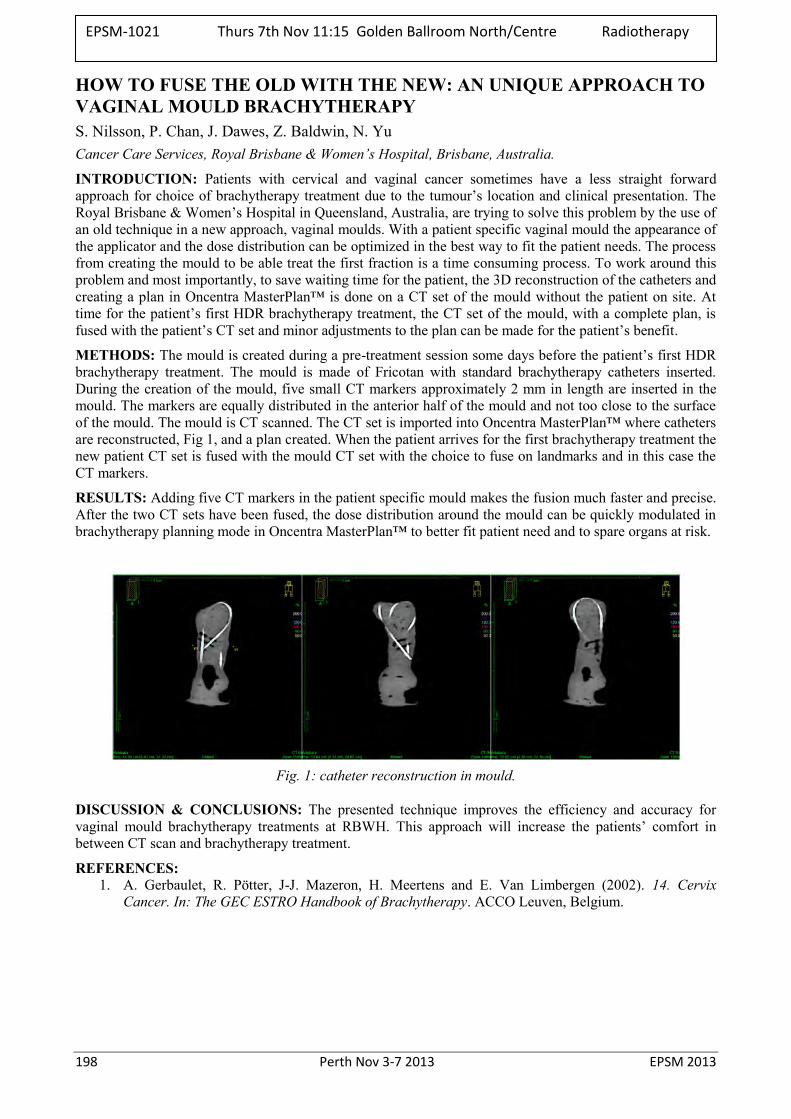
198 Perth Nov 3-7 2013 EPSM 2013
HOW TO FUSE THE OLD WITH THE NEW: AN UNIQUE APPROACH TO VAGINAL MOULD BRACHYTHERAPY S. Nilsson, P. Chan, J. Dawes, Z. Baldwin, N. Yu Cancer Care Services, Royal Brisbane & Women’s Hospital, Brisbane, Australia.
INTRODUCTION: Patients with cervical and vaginal cancer sometimes have a less straight forward approach for choice of brachytherapy treatment due to the tumour’s location and clinical presentation. The Royal Brisbane & Women’s Hospital in Queensland, Australia, are trying to solve this problem by the use of an old technique in a new approach, vaginal moulds. With a patient specific vaginal mould the appearance of the applicator and the dose distribution can be optimized in the best way to fit the patient needs. The process from creating the mould to be able treat the first fraction is a time consuming process. To work around this problem and most importantly, to save waiting time for the patient, the 3D reconstruction of the catheters and creating a plan in Oncentra MasterPlan™ is done on a CT set of the mould without the patient on site. At time for the patient’s first HDR brachytherapy treatment, the CT set of the mould, with a complete plan, is fused with the patient’s CT set and minor adjustments to the plan can be made for the patient’s benefit.
METHODS: The mould is created during a pre-treatment session some days before the patient’s first HDR brachytherapy treatment. The mould is made of Fricotan with standard brachytherapy catheters inserted. During the creation of the mould, five small CT markers approximately 2 mm in length are inserted in the mould. The markers are equally distributed in the anterior half of the mould and not too close to the surface of the mould. The mould is CT scanned. The CT set is imported into Oncentra MasterPlan™ where catheters are reconstructed, Fig 1, and a plan created. When the patient arrives for the first brachytherapy treatment the new patient CT set is fused with the mould CT set with the choice to fuse on landmarks and in this case the CT markers.
RESULTS: Adding five CT markers in the patient specific mould makes the fusion much faster and precise. After the two CT sets have been fused, the dose distribution around the mould can be quickly modulated in brachytherapy planning mode in Oncentra MasterPlan™ to better fit patient need and to spare organs at risk.
Fig. 1: catheter reconstruction in mould.
DISCUSSION & CONCLUSIONS: The presented technique improves the efficiency and accuracy for vaginal mould brachytherapy treatments at RBWH. This approach will increase the patients’ comfort in between CT scan and brachytherapy treatment.
REFERENCES: 1. A. Gerbaulet, R. Pötter, J-J. Mazeron, H. Meertens and E. Van Limbergen (2002). 14. Cervix
Cancer. In: The GEC ESTRO Handbook of Brachytherapy. ACCO Leuven, Belgium.
EPSM-1021 Thurs 7th Nov 11:15 Golden Ballroom North/Centre Radiotherapy
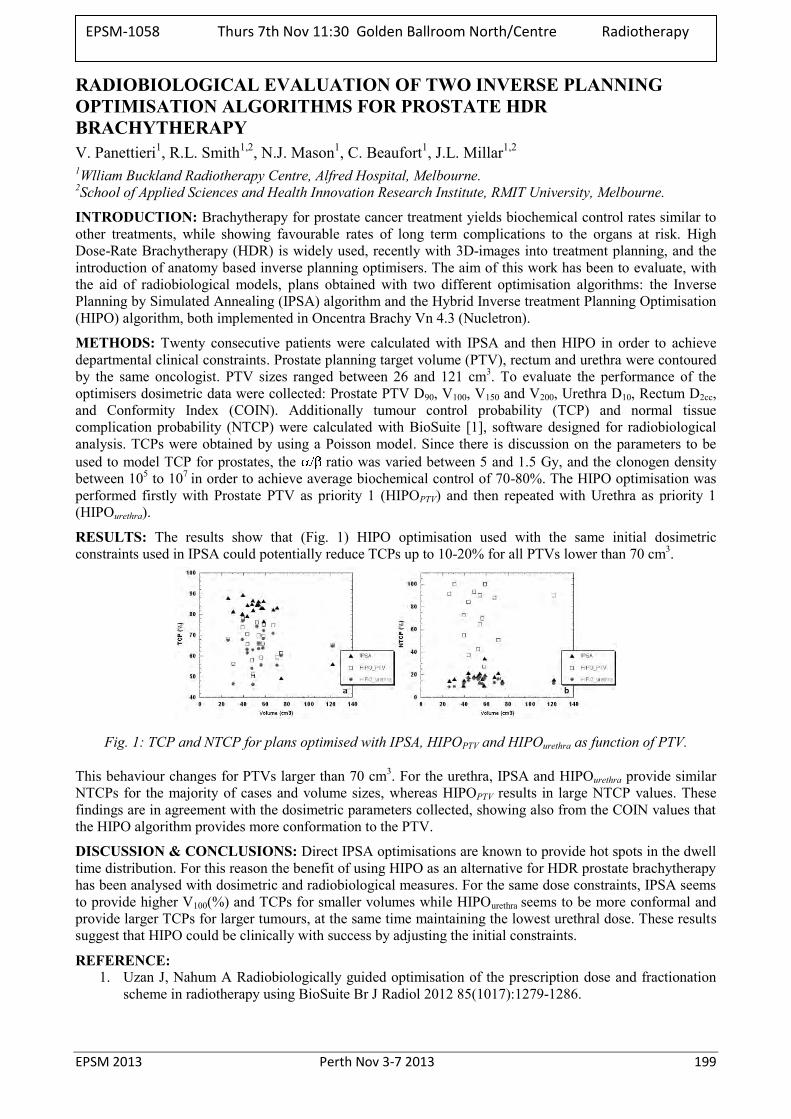
EPSM 2013 Perth Nov 3-7 2013 199
RADIOBIOLOGICAL EVALUATION OF TWO INVERSE PLANNING OPTIMISATION ALGORITHMS FOR PROSTATE HDR BRACHYTHERAPY V. Panettieri1, R.L. Smith1,2, N.J. Mason1, C. Beaufort1, J.L. Millar1,2 1Wlliam Buckland Radiotherapy Centre, Alfred Hospital, Melbourne. 2School of Applied Sciences and Health Innovation Research Institute, RMIT University, Melbourne.
INTRODUCTION: Brachytherapy for prostate cancer treatment yields biochemical control rates similar to other treatments, while showing favourable rates of long term complications to the organs at risk. High Dose-Rate Brachytherapy (HDR) is widely used, recently with 3D-images into treatment planning, and the introduction of anatomy based inverse planning optimisers. The aim of this work has been to evaluate, with the aid of radiobiological models, plans obtained with two different optimisation algorithms: the Inverse Planning by Simulated Annealing (IPSA) algorithm and the Hybrid Inverse treatment Planning Optimisation (HIPO) algorithm, both implemented in Oncentra Brachy Vn 4.3 (Nucletron).
METHODS: Twenty consecutive patients were calculated with IPSA and then HIPO in order to achieve departmental clinical constraints. Prostate planning target volume (PTV), rectum and urethra were contoured by the same oncologist. PTV sizes ranged between 26 and 121 cm3. To evaluate the performance of the optimisers dosimetric data were collected: Prostate PTV D90, V100, V150 and V200, Urethra D10, Rectum D2cc, and Conformity Index (COIN). Additionally tumour control probability (TCP) and normal tissue complication probability (NTCP) were calculated with BioSuite [1], software designed for radiobiological analysis. TCPs were obtained by using a Poisson model. Since there is discussion on the parameters to be used to model TCP for prostates, the ratio was varied between 5 and 1.5 Gy, and the clonogen density between 105 to 107 in order to achieve average biochemical control of 70-80%. The HIPO optimisation was performed firstly with Prostate PTV as priority 1 (HIPOPTV) and then repeated with Urethra as priority 1 (HIPOurethra).
RESULTS: The results show that (Fig. 1) HIPO optimisation used with the same initial dosimetric constraints used in IPSA could potentially reduce TCPs up to 10-20% for all PTVs lower than 70 cm3.
Fig. 1: TCP and NTCP for plans optimised with IPSA, HIPOPTV and HIPOurethra as function of PTV.
This behaviour changes for PTVs larger than 70 cm3. For the urethra, IPSA and HIPOurethra provide similar NTCPs for the majority of cases and volume sizes, whereas HIPOPTV results in large NTCP values. These findings are in agreement with the dosimetric parameters collected, showing also from the COIN values that the HIPO algorithm provides more conformation to the PTV.
DISCUSSION & CONCLUSIONS: Direct IPSA optimisations are known to provide hot spots in the dwell time distribution. For this reason the benefit of using HIPO as an alternative for HDR prostate brachytherapy has been analysed with dosimetric and radiobiological measures. For the same dose constraints, IPSA seems to provide higher V100(%) and TCPs for smaller volumes while HIPOurethra seems to be more conformal and provide larger TCPs for larger tumours, at the same time maintaining the lowest urethral dose. These results suggest that HIPO could be clinically with success by adjusting the initial constraints.
REFERENCE: 1. Uzan J, Nahum A Radiobiologically guided optimisation of the prescription dose and fractionation
scheme in radiotherapy using BioSuite Br J Radiol 2012 85(1017):1279-1286.
EPSM-1058 Thurs 7th Nov 11:30 Golden Ballroom North/Centre Radiotherapy
200 Perth Nov 3-7 2013 EPSM 2013
DOSIMETRIC EVALUATION OF MED3633 103PA SOURCE MODEL BY GEANT4 C.Z. Uche1,2, W.H. Round1, M.J. Cree1 1School of Engineering, University of Waikato, Hamilton, New Zealand. 2Department of Medical Physics, University of Heidelberg, Mannheim, Germany.
INTRODUCTION: One major factor hindering the accurate calculation of dose distribution in breast brachytherapy is the effect of breast tissue heterogeneity, which is composed of glandular and adipose tissues, as well as the surrounding air in the lungs. This factor was investigated in the treated region for selected brachytherapy seeds. This study presents our dosimetric evaluation of a MED3633 103Pa brachytherapy source by GEANT4 technique.
METHODS: The Geant4 simulation toolkit was used to compute the dose distribution of a MED3633 103Pd source located at the centre of a 30 cm × 30 cm × 30 cm water phantom cube. The percentage depth dose (PDD) along the transverse axis of the source was calculated, allowing the isodose curves for 100%, 50% and 25% PDD to be computed. Recommended dosimetry parameters by TG-43 protocol such as the anisotropy function were also calculated for comparison purposes.
RESULTS: The results show that our method could calculate dose deposition in high gradient regions, near the source, accurately. In general, the isodose curves obtained were in good agreement with previous published results. Also, the anisotropy function values compare well with earlier published data (within 5% uncertainty difference) and seem more physically realistic than some previous data.
DISCUSSION & CONCLUSIONS: The level of accuracy of the obtained results should be adequate for clinical calculations in the treated region.
EPSM-1217 Thurs 7th Nov 11:45 Golden Ballroom North/Centre Radiotherapy

EPSM 2013 Perth Nov 3-7 2013 201

202 Perth Nov 3-7 2013 EPSM 2013
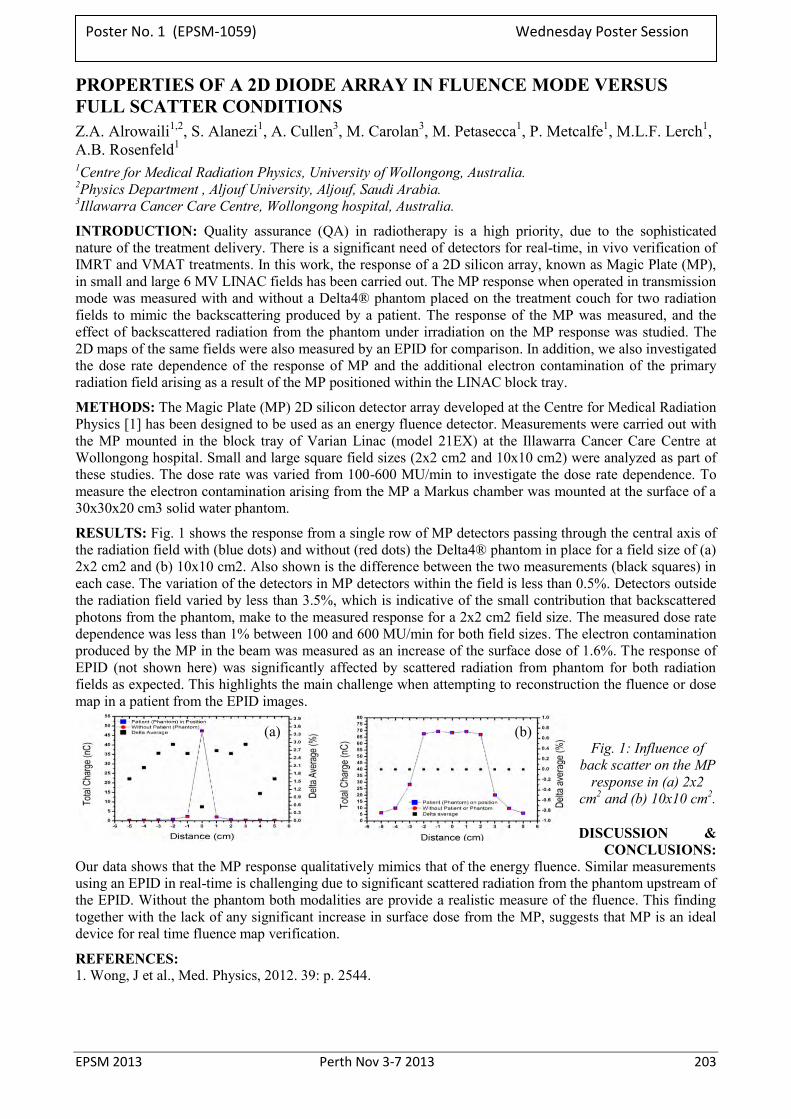
EPSM 2013 Perth Nov 3-7 2013 203
PROPERTIES OF A 2D DIODE ARRAY IN FLUENCE MODE VERSUS FULL SCATTER CONDITIONS
Z.A. Alrowaili1,2, S. Alanezi1, A. Cullen3, M. Carolan3, M. Petasecca1, P. Metcalfe1, M.L.F. Lerch1, A.B. Rosenfeld1 1Centre for Medical Radiation Physics, University of Wollongong, Australia. 2Physics Department , Aljouf University, Aljouf, Saudi Arabia. 3Illawarra Cancer Care Centre, Wollongong hospital, Australia.
INTRODUCTION: Quality assurance (QA) in radiotherapy is a high priority, due to the sophisticated nature of the treatment delivery. There is a significant need of detectors for real-time, in vivo verification of IMRT and VMAT treatments. In this work, the response of a 2D silicon array, known as Magic Plate (MP), in small and large 6 MV LINAC fields has been carried out. The MP response when operated in transmission mode was measured with and without a Delta4® phantom placed on the treatment couch for two radiation fields to mimic the backscattering produced by a patient. The response of the MP was measured, and the effect of backscattered radiation from the phantom under irradiation on the MP response was studied. The 2D maps of the same fields were also measured by an EPID for comparison. In addition, we also investigated the dose rate dependence of the response of MP and the additional electron contamination of the primary radiation field arising as a result of the MP positioned within the LINAC block tray.
METHODS: The Magic Plate (MP) 2D silicon detector array developed at the Centre for Medical Radiation Physics [1] has been designed to be used as an energy fluence detector. Measurements were carried out with the MP mounted in the block tray of Varian Linac (model 21EX) at the Illawarra Cancer Care Centre at Wollongong hospital. Small and large square field sizes (2x2 cm2 and 10x10 cm2) were analyzed as part of these studies. The dose rate was varied from 100-600 MU/min to investigate the dose rate dependence. To measure the electron contamination arising from the MP a Markus chamber was mounted at the surface of a 30x30x20 cm3 solid water phantom.
RESULTS: Fig. 1 shows the response from a single row of MP detectors passing through the central axis of the radiation field with (blue dots) and without (red dots) the Delta4® phantom in place for a field size of (a) 2x2 cm2 and (b) 10x10 cm2. Also shown is the difference between the two measurements (black squares) in each case. The variation of the detectors in MP detectors within the field is less than 0.5%. Detectors outside the radiation field varied by less than 3.5%, which is indicative of the small contribution that backscattered photons from the phantom, make to the measured response for a 2x2 cm2 field size. The measured dose rate dependence was less than 1% between 100 and 600 MU/min for both field sizes. The electron contamination produced by the MP in the beam was measured as an increase of the surface dose of 1.6%. The response of EPID (not shown here) was significantly affected by scattered radiation from phantom for both radiation fields as expected. This highlights the main challenge when attempting to reconstruction the fluence or dose map in a patient from the EPID images.
Fig. 1: Influence of back scatter on the MP
response in (a) 2x2 cm2 and (b) 10x10 cm2.
DISCUSSION & CONCLUSIONS:
Our data shows that the MP response qualitatively mimics that of the energy fluence. Similar measurements using an EPID in real-time is challenging due to significant scattered radiation from the phantom upstream of the EPID. Without the phantom both modalities are provide a realistic measure of the fluence. This finding together with the lack of any significant increase in surface dose from the MP, suggests that MP is an ideal device for real time fluence map verification.
REFERENCES: 1. Wong, J et al., Med. Physics, 2012. 39: p. 2544.
(b) (a) (b)
Poster No. 1 (EPSM-1059) Wednesday Poster Session
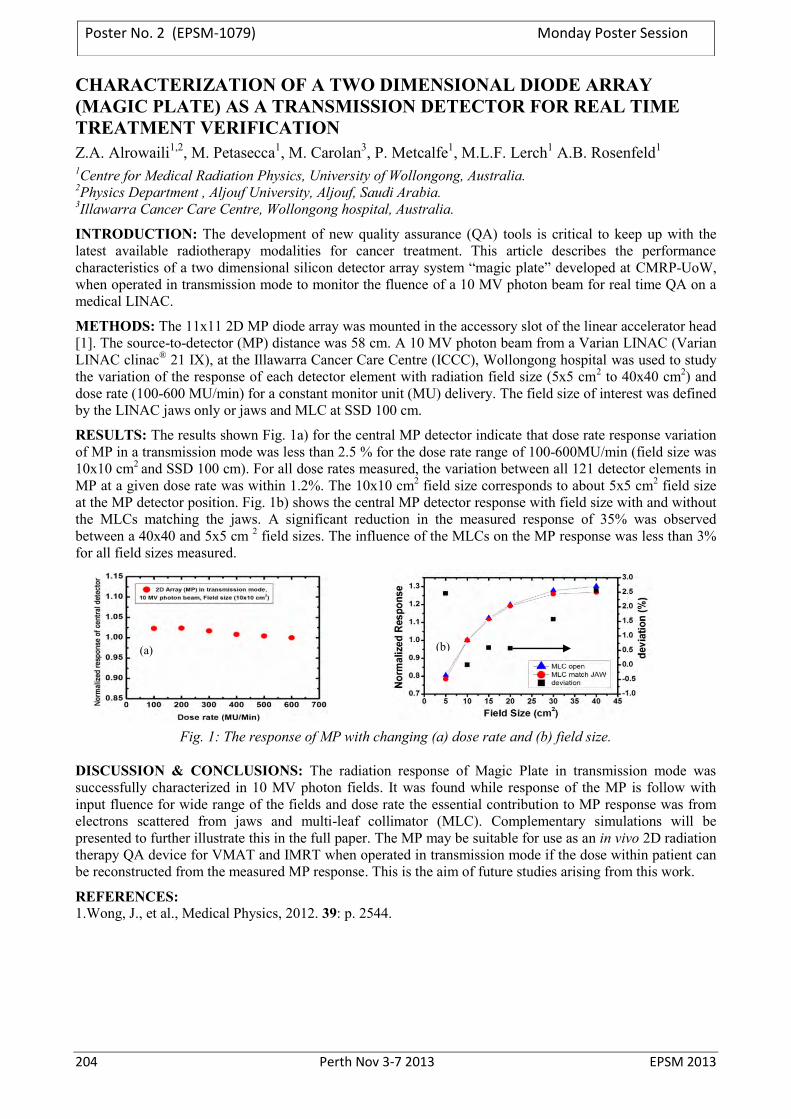
204 Perth Nov 3-7 2013 EPSM 2013
CHARACTERIZATION OF A TWO DIMENSIONAL DIODE ARRAY (MAGIC PLATE) AS A TRANSMISSION DETECTOR FOR REAL TIME TREATMENT VERIFICATION Z.A. Alrowaili1,2, M. Petasecca1, M. Carolan3, P. Metcalfe1, M.L.F. Lerch1 A.B. Rosenfeld1 1Centre for Medical Radiation Physics, University of Wollongong, Australia. 2Physics Department , Aljouf University, Aljouf, Saudi Arabia. 3Illawarra Cancer Care Centre, Wollongong hospital, Australia.
INTRODUCTION: The development of new quality assurance (QA) tools is critical to keep up with the latest available radiotherapy modalities for cancer treatment. This article describes the performance characteristics of a two dimensional silicon detector array system “magic plate” developed at CMRP-UoW, when operated in transmission mode to monitor the fluence of a 10 MV photon beam for real time QA on a medical LINAC.
METHODS: The 11x11 2D MP diode array was mounted in the accessory slot of the linear accelerator head [1]. The source-to-detector (MP) distance was 58 cm. A 10 MV photon beam from a Varian LINAC (Varian LINAC clinac® 21 IX), at the Illawarra Cancer Care Centre (ICCC), Wollongong hospital was used to study the variation of the response of each detector element with radiation field size (5x5 cm2 to 40x40 cm2) and dose rate (100-600 MU/min) for a constant monitor unit (MU) delivery. The field size of interest was defined by the LINAC jaws only or jaws and MLC at SSD 100 cm.
RESULTS: The results shown Fig. 1a) for the central MP detector indicate that dose rate response variation of MP in a transmission mode was less than 2.5 % for the dose rate range of 100-600MU/min (field size was 10x10 cm2 and SSD 100 cm). For all dose rates measured, the variation between all 121 detector elements in MP at a given dose rate was within 1.2%. The 10x10 cm2 field size corresponds to about 5x5 cm2 field size at the MP detector position. Fig. 1b) shows the central MP detector response with field size with and without the MLCs matching the jaws. A significant reduction in the measured response of 35% was observed between a 40x40 and 5x5 cm 2 field sizes. The influence of the MLCs on the MP response was less than 3% for all field sizes measured.
Fig. 1: The response of MP with changing (a) dose rate and (b) field size.
DISCUSSION & CONCLUSIONS: The radiation response of Magic Plate in transmission mode was successfully characterized in 10 MV photon fields. It was found while response of the MP is follow with input fluence for wide range of the fields and dose rate the essential contribution to MP response was from electrons scattered from jaws and multi-leaf collimator (MLC). Complementary simulations will be presented to further illustrate this in the full paper. The MP may be suitable for use as an in vivo 2D radiation therapy QA device for VMAT and IMRT when operated in transmission mode if the dose within patient can be reconstructed from the measured MP response. This is the aim of future studies arising from this work.
REFERENCES: 1.Wong, J., et al., Medical Physics, 2012. 39: p. 2544.
(a) (b)
Poster No. 2 (EPSM-1079) Monday Poster Session
EPSM 2013 Perth Nov 3-7 2013 205
AN ASSESSMENT OF IMAGE DISTORTION AND CT NUMBER ACCURACY WITHIN A WIDE-BORE CT EXTENDED FIELD OF VIEW B. Beeksma1, D. Truant1, V. Nelson1, T. Erven1, L. Holloway1,2,3,4, A. Xing1,S. Arumugam1
1Liverpool and Macarthur Cancer Therapy Centres and Ingham Institute, Liverpool Hospital, NSW, Sydney, Australia.
2Institute of Medical Physics, School of Physics, University of Sydney, Sydney, NSW, Australia. 3Centre for Medical Radiation Physics, University of Wollongong, Wollongong, NSW, Australia. 4South Western Sydney Clinical School, University of New South Wales, Sydney, NSW, Australia.
INTRODUCTION: The introduction of wide bore Computed Tomography (CT) in radiotherapy departments has made imaging of bariatric patients possible and provided increased flexibility for radiation therapy patient positioning.. With a bore size of 850 mm, the Phillips Brilliance Big Bore CT (BBCT) scanner has a maximum scan field of view (sFOV) of 600 mm. Additionally, this scanner has the capacity to reconstruct CT images at a 700mm extended field of view (eFOV). This reconstruction is achieved through data interpolation and extrapolation, using projection data acquired within the maximum sFOV. Images of objects located within this extended 100 mm reconstructed ring, may show significant distortion and dissimilarity of CT number, relative to the same objecta scan within the sFOV. This study aims to assess the extrapolation reconstruction capabilities of the BBCT outside the maximum sFOV.
METHODS: For all investigations a combination of 120 kV and 140 kV beam energies and 250 mAs and 500 mAs was used. To assess spatial distortion three phantoms were considered a 30x30x32 cm3 slab of solid water, the Gammex Electron Density CT phantom and a female anthropomorphic phantom. For each phantom scans were taken with the phantom edge extended 3 different distances beyond the sFOV into the eFOV. Reference images for the purpose of evaluating the spatial distortion of the phantoms in the eFOV were generated for the same beam parameters by positioning the phantoms centrally within the sFOV. To assess CT number accuracy various tissue equivalent materials were scanned in the eFOV and resulting CT numbers were compared to those from the same inserts scanned in the sFOV.
RESULTS: For all beam parameters and all phantom geometries, objects within the eFOV were geometrically overestimated with elongation of phantom shapes into the eFOV. The size of the object was not reduced in the eFOV for any of the considered situations. CT numbers generated in the eFOV, for tissue inserts of densities greater than lung, showed a trend of being under estimated compared to identical scans of the inserts conducted centrally within the sFOV. The difference between eFOV and sFOV CT numbers increased with insert density with the difference in eFOV and sFOV CT number variation ranging from -127 to -230 HU for soft tissue densities and -278 to -640 for bone densities. This trend reversedfor low tissue densities with the CT numbers in the eFOV being overestimated by 100 to 130 HU for lung equivalent inserts.
DISCUSSION & CONCLUSIONS: The eFOV feature provides a general visual representation of the geometry which exists outside the sFOV; however, significant image artifacts from the eFOV reconstruction alter the CT numbers and geometric contours of shapes within this region. The physical edge of any phantom considered in this study was not clearly defined within the eFOV. This has the potential to produce significant dosimetric effects, so extreme caution should be exercised prior to using this feature for radiotherapy geometry and dose determination.
Poster No. 3 (EPSM-1159) Wednesday Poster Session
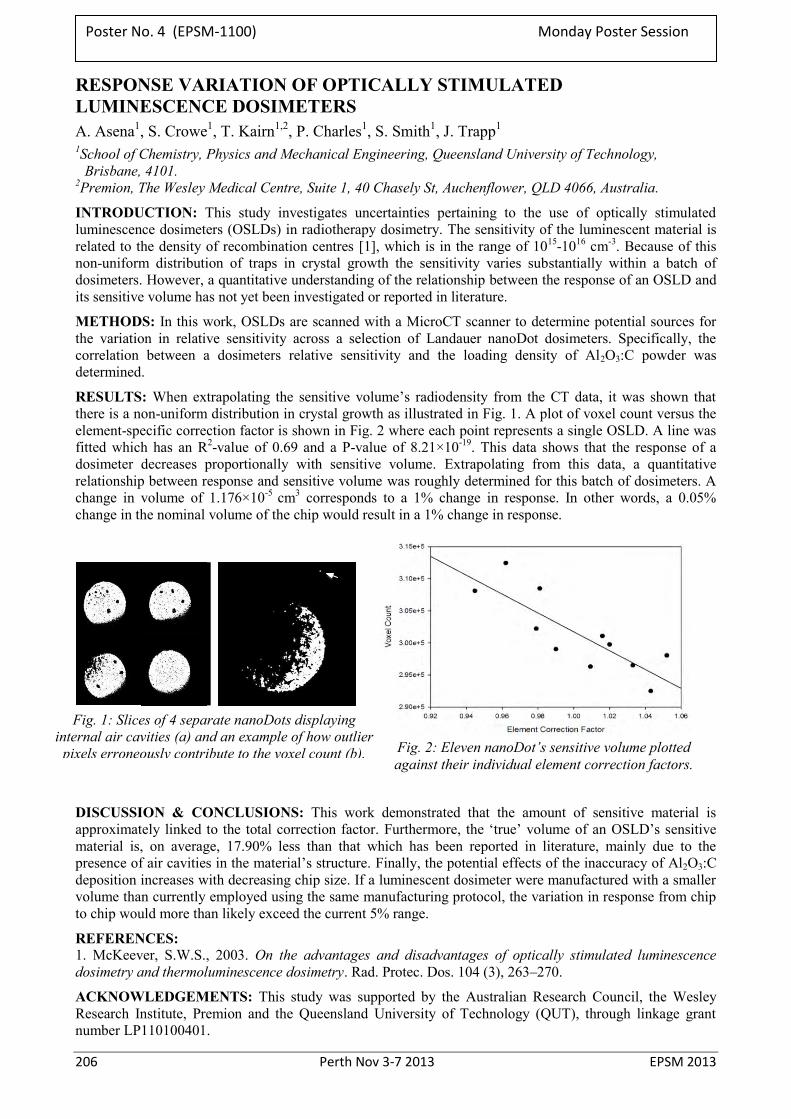
206 Perth Nov 3-7 2013 EPSM 2013
RESPONSE VARIATION OF OPTICALLY STIMULATED LUMINESCENCE DOSIMETERS A. Asena1, S. Crowe1, T. Kairn1,2, P. Charles1, S. Smith1, J. Trapp1 1School of Chemistry, Physics and Mechanical Engineering, Queensland University of Technology,
Brisbane, 4101. 2Premion, The Wesley Medical Centre, Suite 1, 40 Chasely St, Auchenflower, QLD 4066, Australia.
INTRODUCTION: This study investigates uncertainties pertaining to the use of optically stimulated luminescence dosimeters (OSLDs) in radiotherapy dosimetry. The sensitivity of the luminescent material is related to the density of recombination centres [1], which is in the range of 1015-1016 cm-3. Because of this non-uniform distribution of traps in crystal growth the sensitivity varies substantially within a batch of dosimeters. However, a quantitative understanding of the relationship between the response of an OSLD and its sensitive volume has not yet been investigated or reported in literature.
METHODS: In this work, OSLDs are scanned with a MicroCT scanner to determine potential sources for the variation in relative sensitivity across a selection of Landauer nanoDot dosimeters. Specifically, the correlation between a dosimeters relative sensitivity and the loading density of Al2O3:C powder was determined.
RESULTS: When extrapolating the sensitive volume’s radiodensity from the CT data, it was shown that there is a non-uniform distribution in crystal growth as illustrated in Fig. 1. A plot of voxel count versus the element-specific correction factor is shown in Fig. 2 where each point represents a single OSLD. A line was fitted which has an R2-value of 0.69 and a P-value of 8.21×10⁻¹⁹. This data shows that the response of a dosimeter decreases proportionally with sensitive volume. Extrapolating from this data, a quantitative relationship between response and sensitive volume was roughly determined for this batch of dosimeters. A change in volume of 1.176×10⁻⁵ cm3 corresponds to a 1% change in response. In other words, a 0.05% change in the nominal volume of the chip would result in a 1% change in response.
DISCUSSION & CONCLUSIONS: This work demonstrated that the amount of sensitive material is approximately linked to the total correction factor. Furthermore, the ‘true’ volume of an OSLD’s sensitive material is, on average, 17.90% less than that which has been reported in literature, mainly due to the presence of air cavities in the material’s structure. Finally, the potential effects of the inaccuracy of Al2O3:C deposition increases with decreasing chip size. If a luminescent dosimeter were manufactured with a smaller volume than currently employed using the same manufacturing protocol, the variation in response from chip to chip would more than likely exceed the current 5% range.
REFERENCES: 1. McKeever, S.W.S., 2003. On the advantages and disadvantages of optically stimulated luminescence dosimetry and thermoluminescence dosimetry. Rad. Protec. Dos. 104 (3), 263–270.
ACKNOWLEDGEMENTS: This study was supported by the Australian Research Council, the Wesley Research Institute, Premion and the Queensland University of Technology (QUT), through linkage grant number LP110100401.
Fig. 1: Slices of 4 separate nanoDots displaying internal air cavities (a) and an example of how outlier
pixels erroneously contribute to the voxel count (b).
Fig. 2: Eleven nanoDot’s sensitive volume plotted against their individual element correction factors.
Poster No. 4 (EPSM-1100) Monday Poster Session
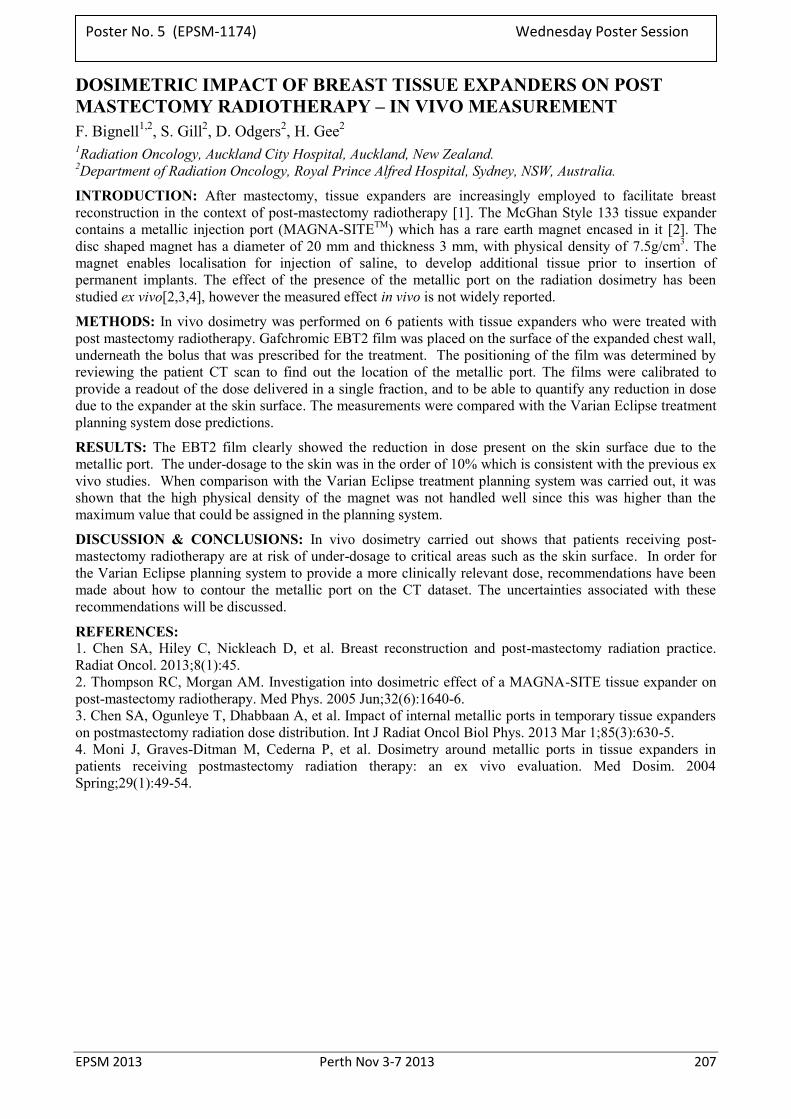
EPSM 2013 Perth Nov 3-7 2013 207
DOSIMETRIC IMPACT OF BREAST TISSUE EXPANDERS ON POST MASTECTOMY RADIOTHERAPY – IN VIVO MEASUREMENT F. Bignell1,2, S. Gill2, D. Odgers2, H. Gee2 1Radiation Oncology, Auckland City Hospital, Auckland, New Zealand. 2Department of Radiation Oncology, Royal Prince Alfred Hospital, Sydney, NSW, Australia.
INTRODUCTION: After mastectomy, tissue expanders are increasingly employed to facilitate breast reconstruction in the context of post-mastectomy radiotherapy [1]. The McGhan Style 133 tissue expander contains a metallic injection port (MAGNA-SITETM) which has a rare earth magnet encased in it [2]. The disc shaped magnet has a diameter of 20 mm and thickness 3 mm, with physical density of 7.5g/cm3. The magnet enables localisation for injection of saline, to develop additional tissue prior to insertion of permanent implants. The effect of the presence of the metallic port on the radiation dosimetry has been studied ex vivo[2,3,4], however the measured effect in vivo is not widely reported.
METHODS: In vivo dosimetry was performed on 6 patients with tissue expanders who were treated with post mastectomy radiotherapy. Gafchromic EBT2 film was placed on the surface of the expanded chest wall, underneath the bolus that was prescribed for the treatment. The positioning of the film was determined by reviewing the patient CT scan to find out the location of the metallic port. The films were calibrated to provide a readout of the dose delivered in a single fraction, and to be able to quantify any reduction in dose due to the expander at the skin surface. The measurements were compared with the Varian Eclipse treatment planning system dose predictions.
RESULTS: The EBT2 film clearly showed the reduction in dose present on the skin surface due to the metallic port. The under-dosage to the skin was in the order of 10% which is consistent with the previous ex vivo studies. When comparison with the Varian Eclipse treatment planning system was carried out, it was shown that the high physical density of the magnet was not handled well since this was higher than the maximum value that could be assigned in the planning system.
DISCUSSION & CONCLUSIONS: In vivo dosimetry carried out shows that patients receiving post-mastectomy radiotherapy are at risk of under-dosage to critical areas such as the skin surface. In order for the Varian Eclipse planning system to provide a more clinically relevant dose, recommendations have been made about how to contour the metallic port on the CT dataset. The uncertainties associated with these recommendations will be discussed.
REFERENCES: 1. Chen SA, Hiley C, Nickleach D, et al. Breast reconstruction and post-mastectomy radiation practice. Radiat Oncol. 2013;8(1):45. 2. Thompson RC, Morgan AM. Investigation into dosimetric effect of a MAGNA-SITE tissue expander on post-mastectomy radiotherapy. Med Phys. 2005 Jun;32(6):1640-6. 3. Chen SA, Ogunleye T, Dhabbaan A, et al. Impact of internal metallic ports in temporary tissue expanders on postmastectomy radiation dose distribution. Int J Radiat Oncol Biol Phys. 2013 Mar 1;85(3):630-5. 4. Moni J, Graves-Ditman M, Cederna P, et al. Dosimetry around metallic ports in tissue expanders in patients receiving postmastectomy radiation therapy: an ex vivo evaluation. Med Dosim. 2004 Spring;29(1):49-54.
Poster No. 5 (EPSM-1174) Wednesday Poster Session
208 Perth Nov 3-7 2013 EPSM 2013
CALYPSO-GUIDED DMLC TRACKING CLINICAL TRIAL FOR PROSTATE RAPIDARC J.T. Booth1,2, E. Colvill1,3, T. Eade1, A. Kneebone1, R. O’Brien3, P.J. Keall3 1Northern Sydney Cancer Centre, Royal North Shore Hospital, St Leonards, New South Wales. 2Institute of Medical Physics, School of Physics, University of Sydney, Sydney, New South Wales. 3Radiation Physics Lab, School of Medicine, University of Sydney, Sydney, New South Wales.
INTRODUCTION: DMLC tracking allows the MLC to follow a tumour surrogate tracking signal, such as RPM block or Calypso beacons, as the treatment is delivered. This is to ensure tumour dose coverage and potentially leads to reduced margins (and decreased organ at risk doses), and/or higher tumour doses (with equal or lower organ at risk doses). We have shown tumour motion can cause underdoses of 30% to PTV D95 and estimate that DMLC tracking can reduce errors to less than 3% [1]. DMLC tracking systems have been developed over the last 14 years and have been demonstrated in phantom studies for conformal, IMRT and IMAT delivery, utilising a range of tumour position surrogates. The aim of this study is to demonstrate the feasibility of Calypso guided-DMLC tracking with prostate RapidArc in a 30 patient clinical trial, translating from benchtop to bedside.
METHODS: Patients with early stage prostate carcinoma will be treated with local standard fractionation (80Gy/40#) and margins (7mm/5mm posteriorly). Feasibility will be determined using three metrics; geometric accuracy of the 'tracked' treatment fields, dosimetric accuracy of the delivered dose using daily reconstruction of that days treatment based on dynalog files, and the estimated radiobiological impact assessed using Tumour Control Probability and Rectal Complication Probability as surrogate clinical endpoints based on delivered dose distributions. The acute and late toxicity and clinical outcomes will be monitored and compared to recent historical controls.
RESULTS: The DMLC tracking system has been validated using a Calypso simulator provided by the Vendor connected to the University of Sydney tracking MLC controller and in practise using Varian RPM input for end-to-end testing of the treatment process. The study has ethics approval and governance approval is pending, recruitment is expected to begin in September.
DISCUSSION & CONCLUSIONS: The first in world clinical use of Calypso-guided DMLC tracking will be demonstrated in Australia in 2013.
REFERENCES: 1.Colvill E, Ng JA, Worm ES, Poulsen PR, Keall PJ, Booth JT (2013) Dose reconstruction for 4-dimensional prostate radiotherapy. AAPM Annual Meeting; Indeanopolis, USA.
ACKNOWLEDGEMENTS: this work is made possible through an NHMRC Australia Fellowship, US NIH R01 93626 and a Varian Medical Systems research collaboration agreement.
Poster No. 6 (EPSM-1185) Monday Poster Session
EPSM 2013 Perth Nov 3-7 2013 209
APPLICATION OF TG-100 TO A NOVEL INTRAFRACTION MONITORING SYSTEM J.T. Booth1,2, J.A. Ng2,3, R. O’Brien3 , P. Poulsen4, T. Eade1, A. Kneebone1, Z. Kuncic2, P.J. Keall3
1Northern Sydney Cancer Centre, Royal North Shore Hospital, Sydney, NSW. 2Institute of Medical Physics, School of Physics, University of Sydney, Sydney, NSW. 3Radiation Physics Laboratory, Sydney Medical School, University of Sydney, Sydney, NSW. 4Department of
Medical Physics and Oncology, Aarhus University Hospital, Aarhus, Denmark.
INTRODUCTION: The AAPM Task Group 100 (TG-100) reports on the application of risk analysis methods to Radiation Therapy Quality Assurance [1]. We utilise these tools to develop a Process Map, Fault Tree and perform Failure Mode and Effect Analysis (FMEA) for Kilovoltage Intra-treatment Monitoring (KIM), which ultimately leads to a commissioning and quality assurance portfolio.
METHODS: We apply the methods of TG-100 to KIM for gated prostate RapidArc. The KIM process involves a number of extra steps. These extra steps are required during plan preparation, but predominantly occur during treatment delivery when fluoroscopic x-rays are used prior to and during RapidArc delivery. These fluoroscopic images are collected in dedicated in-house software for fiducial segmentation, fiducial centroid localisation, real-time trajectory plotting and positional tolerance monitoring. The process map is developed to rationalise the standard and non-standard processes within KIM. The fault tree illustrates the potential errors that can occur during the KIM process. FMEA formalises the hazards as probability of occurrence, severity and detectability scores (each 0-10, where 10 is the highest). The product of these scores gives the risk probability number, and those over 125 require mitigation steps, such as quality assurance tests or process revision.
RESULTS: We show how the TG100 toolset can be applied to emerging techniques and the further testing required complimenting the standard TG-142 test set. The FMEA was applied at two levels; as a tool for continual process improvement for software development and within the complete KIM process. A total of 16 failure modes have been identified. The highest failure modes changed dramatically during development phases of implementation. As the process evolved exclusion criteria were implemented and the software enhanced. Some of the failure modes include incorrect segmentation, software crash, prostate motion during pre-treatment arc or between dual arc delivery and couch shift data entry error by Staff.
DISCUSSION & CONCLUSIONS: TG-100 provides valuable tools for assessing and developing QA processes in radiotherapy. The tools and the outcome of their use are closely related to the exact process and needs reconsideration as each variable in the process evolves.
REFERENCES: S.Huq, B.A.Fraass, P.B. Dunscombe, J.P.Gibbons, G.S.Ibbott, A.J.Mundt, S.Mutic, J.R.Palta, F.Rath, B.Thomadsen, J.F.Williamson, E.D.Yorke. (2013) Application of risk analysis methods to Radiation Therapy Quality Management: Report of AAPM TG100 of the Therapy Physics Committee of the AAPM. College Park, MD:AAPM, 2013
ACKNOWLEDGEMENTS: this work was made possible by an NHMRC Australia Fellowship, US NIH R01 93626 and a Varian Medical Systems collaborative research agreement.
Poster No. 7 (EPSM-1186) Wednesday Poster Session
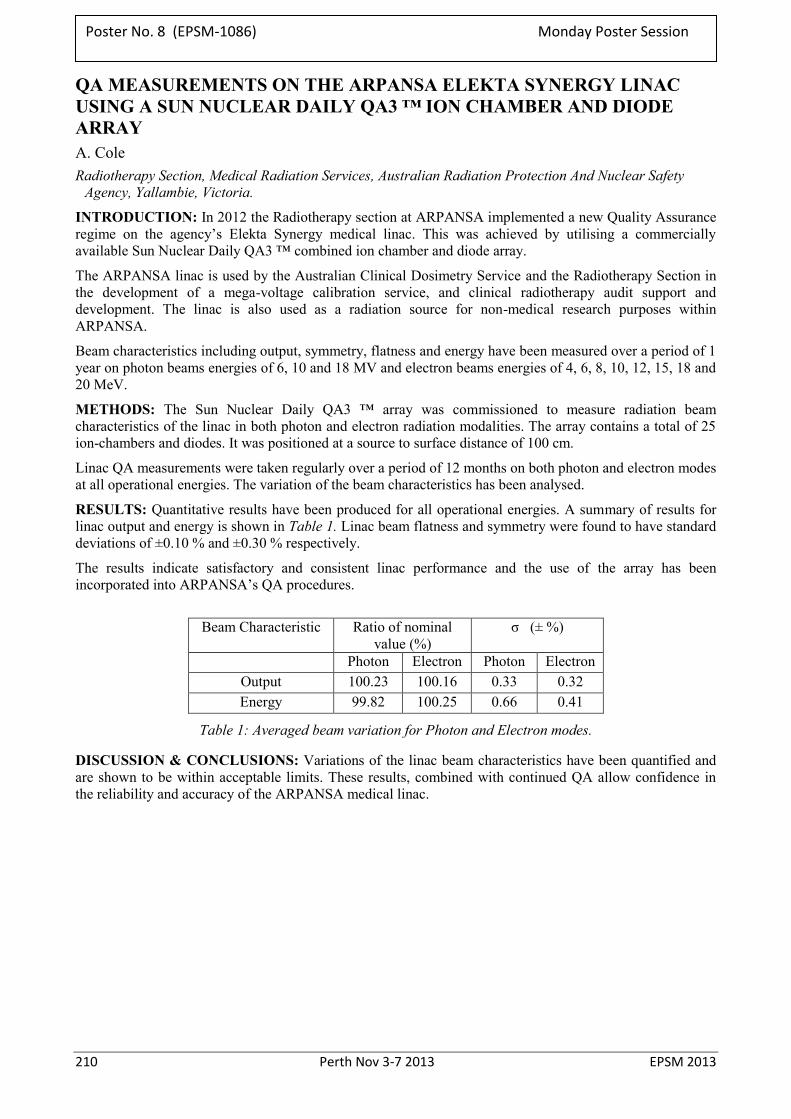
210 Perth Nov 3-7 2013 EPSM 2013
QA MEASUREMENTS ON THE ARPANSA ELEKTA SYNERGY LINAC USING A SUN NUCLEAR DAILY QA3 ™ ION CHAMBER AND DIODE ARRAY A. Cole Radiotherapy Section, Medical Radiation Services, Australian Radiation Protection And Nuclear Safety
Agency, Yallambie, Victoria.
INTRODUCTION: In 2012 the Radiotherapy section at ARPANSA implemented a new Quality Assurance regime on the agency’s Elekta Synergy medical linac. This was achieved by utilising a commercially available Sun Nuclear Daily QA3 ™ combined ion chamber and diode array.
The ARPANSA linac is used by the Australian Clinical Dosimetry Service and the Radiotherapy Section in the development of a mega-voltage calibration service, and clinical radiotherapy audit support and development. The linac is also used as a radiation source for non-medical research purposes within ARPANSA.
Beam characteristics including output, symmetry, flatness and energy have been measured over a period of 1 year on photon beams energies of 6, 10 and 18 MV and electron beams energies of 4, 6, 8, 10, 12, 15, 18 and 20 MeV.
METHODS: The Sun Nuclear Daily QA3 ™ array was commissioned to measure radiation beam characteristics of the linac in both photon and electron radiation modalities. The array contains a total of 25 ion-chambers and diodes. It was positioned at a source to surface distance of 100 cm.
Linac QA measurements were taken regularly over a period of 12 months on both photon and electron modes at all operational energies. The variation of the beam characteristics has been analysed.
RESULTS: Quantitative results have been produced for all operational energies. A summary of results for linac output and energy is shown in Table 1. Linac beam flatness and symmetry were found to have standard deviations of ±0.10 % and ±0.30 % respectively.
The results indicate satisfactory and consistent linac performance and the use of the array has been incorporated into ARPANSA’s QA procedures.
Beam Characteristic Ratio of nominal
value (%) σ (± %)
Photon Electron Photon Electron Output 100.23 100.16 0.33 0.32 Energy 99.82 100.25 0.66 0.41
Table 1: Averaged beam variation for Photon and Electron modes.
DISCUSSION & CONCLUSIONS: Variations of the linac beam characteristics have been quantified and are shown to be within acceptable limits. These results, combined with continued QA allow confidence in the reliability and accuracy of the ARPANSA medical linac.
Poster No. 8 (EPSM-1086) Monday Poster Session
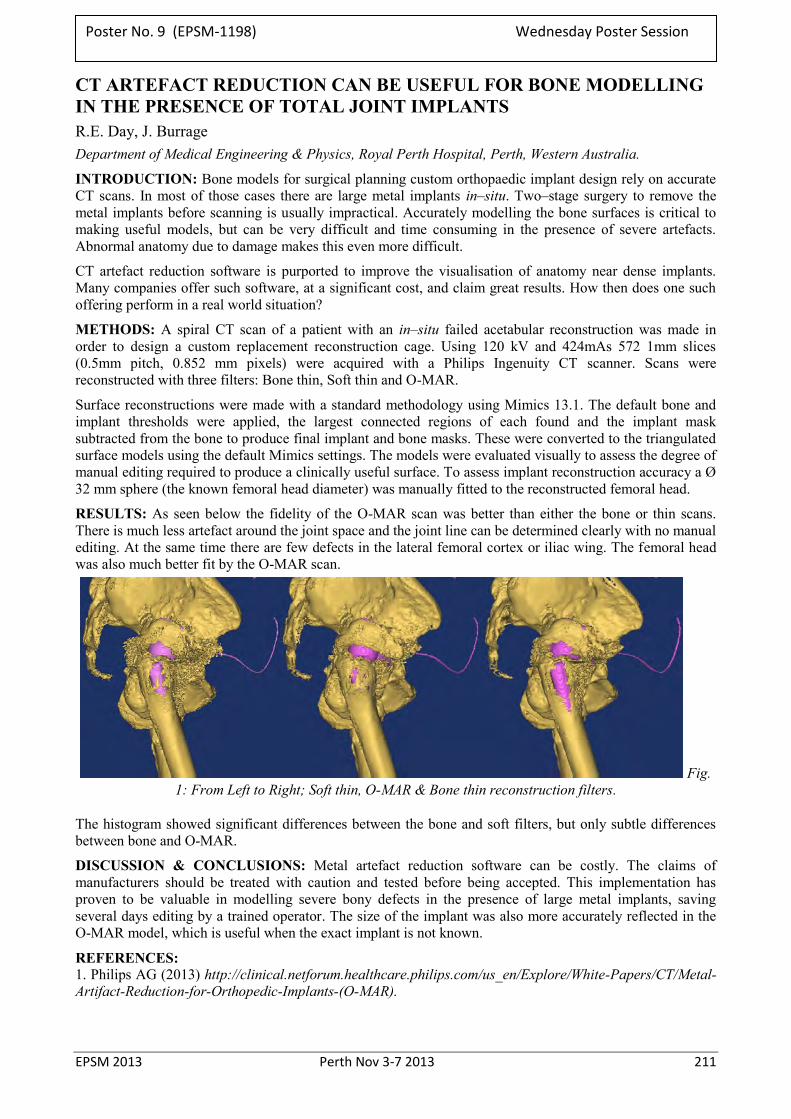
EPSM 2013 Perth Nov 3-7 2013 211
CT ARTEFACT REDUCTION CAN BE USEFUL FOR BONE MODELLING IN THE PRESENCE OF TOTAL JOINT IMPLANTS R.E. Day, J. Burrage Department of Medical Engineering & Physics, Royal Perth Hospital, Perth, Western Australia.
INTRODUCTION: Bone models for surgical planning custom orthopaedic implant design rely on accurate CT scans. In most of those cases there are large metal implants in–situ. Two–stage surgery to remove the metal implants before scanning is usually impractical. Accurately modelling the bone surfaces is critical to making useful models, but can be very difficult and time consuming in the presence of severe artefacts. Abnormal anatomy due to damage makes this even more difficult.
CT artefact reduction software is purported to improve the visualisation of anatomy near dense implants. Many companies offer such software, at a significant cost, and claim great results. How then does one such offering perform in a real world situation?
METHODS: A spiral CT scan of a patient with an in–situ failed acetabular reconstruction was made in order to design a custom replacement reconstruction cage. Using 120 kV and 424mAs 572 1mm slices (0.5mm pitch, 0.852 mm pixels) were acquired with a Philips Ingenuity CT scanner. Scans were reconstructed with three filters: Bone thin, Soft thin and O-MAR.
Surface reconstructions were made with a standard methodology using Mimics 13.1. The default bone and implant thresholds were applied, the largest connected regions of each found and the implant mask subtracted from the bone to produce final implant and bone masks. These were converted to the triangulated surface models using the default Mimics settings. The models were evaluated visually to assess the degree of manual editing required to produce a clinically useful surface. To assess implant reconstruction accuracy a Ø 32 mm sphere (the known femoral head diameter) was manually fitted to the reconstructed femoral head.
RESULTS: As seen below the fidelity of the O-MAR scan was better than either the bone or thin scans. There is much less artefact around the joint space and the joint line can be determined clearly with no manual editing. At the same time there are few defects in the lateral femoral cortex or iliac wing. The femoral head was also much better fit by the O-MAR scan.
Fig. 1: From Left to Right; Soft thin, O-MAR & Bone thin reconstruction filters.
The histogram showed significant differences between the bone and soft filters, but only subtle differences between bone and O-MAR.
DISCUSSION & CONCLUSIONS: Metal artefact reduction software can be costly. The claims of manufacturers should be treated with caution and tested before being accepted. This implementation has proven to be valuable in modelling severe bony defects in the presence of large metal implants, saving several days editing by a trained operator. The size of the implant was also more accurately reflected in the O-MAR model, which is useful when the exact implant is not known.
REFERENCES: 1. Philips AG (2013) http://clinical.netforum.healthcare.philips.com/us_en/Explore/White-Papers/CT/Metal-Artifact-Reduction-for-Orthopedic-Implants-(O-MAR).
Poster No. 9 (EPSM-1198) Wednesday Poster Session
212 Perth Nov 3-7 2013 EPSM 2013
THEORETICAL ESTIMATION OF RBE IN LOW-KV INTRAOPERATIVE RADIOTHERAPY: DERIVATION OF SECONDARY ELECTRON SPECTRA B.B. Dhal1, M. Ebert1,2 B. Reniers3, F. Verhaegen3, M. House1
1Department of Physics, The University of Western Australia, 35 Stirling Highway, Crawley, Perth, WA 6009.
2Department of Radiation Oncology, Sir Charles Gairdner Hospital, Hospital Avenue, Nedland, Perth, WA 6009.
3Maastro Clinic, Dr Tanslaan 12, 6229ET Maastricht, The Netherlands.
INTRODUCTION: Track structure simulation confirms that low energy electrons are the prime cause of double strand breaks (DSBs) and lethal cell damage in the treatments such as targeted intraoperative radiation therapy [1]. Higher relative biological effectiveness (RBE) has been attributed to low energy electrons compared to other high energy radiations (neutrons, photons and higher charged particles) [2]. Modelling the biological effect of targeted intraoperative radiotherapy involves simulation of lethal cell damage with these low energy electrons as the main cause of double strand breaks. While scoring the low energy electrons is an intricate issue of such a simulation, addition of low energy auger electrons (below 1 keV) is also important. We intend to understand the validity of this method through theoretical studies comparing the established Linear- Quadratic (LQ) model with experimental observations. The modelling of radiation dose delivered at a point is the starting point for subsequent Monte Carlo DNA damage [3] simulation.
METHODS: Direct spectral measurement of the Intrabeam source (Photoelectron corporation, CA) without an applicator attached was performed with a high resolution Schottky CdTe spectrometer (XR-100T, AMPTEK Inc., Bedford MA). Due to distortion by the response function of CdTe crystals, the measured spectrum was compared with a set of simulated or measured spectra at various grid energies by using stripping methods as discussed in Maeda et al [4]. Air corrections were made by using the mass attenuation coefficients using NIST data tables [5]. The corrected spectrum was used as an input for an EGSnrc Monte Carlo simulation [6] using realistic representation of the Intrabeam applicators. This simulation was used to score the spectra of secondary electrons generated in a 5 mm shell in breast tissue surrounding the applicator surface. Auger electron lines below 1 keV were manually added to the electron spectra as described in [7].
RESULTS: Measured Intrabeam X-ray spectra were comparable to those previously published (e.g. [8]). The stripping correction led to shifting of characteristic peak energies and had the most significant impact at low energies. Via the EGSnrc simulation we have been able to estimate Compton and photoelectron spectra in breast tissue as a function of device applicator size.
DISCUSSION & CONCLUSIONS: By combining measured spectra of X-rays from the Intrabeam source with Monte Carlo simulation of their subsequent transport in applicator and breast material, we have been able to derive the spectra of secondary electrons as generated in the region of breast tissue adjacent to the applicator. These spectra will be used to inform Monte Carlo damage simulation code in order to determine the relative RBE as a function of applicator size which, combined with theoretical DSB repair, will be compared with experimental measurements.
REFERENCES: 1. H. Nikjoo et al (2006) Radiation Measurement, 41, 1052-74. 2. H. Nikjoo et al (2001) Radiation Research, 156, 577-583 3. H. Enderling et al (2006) Journal of Theoretical Biology, 241, 158-171. 4. K. Maeda et al (2005), Med. Phys. 32, 1542-1547. 5. M.J. Berger et al, http://www.nist.gov/pml/data/xcom/ 6. V. A. Semeneko et al (2004), Radiation Research, 161, 451-457 7. D. Liu et al, Phys. Med. Bio. (2008), 53, 61-75 8. J. Beatty et al, Med Phys. (1996), 23, 53-62
ACKNOWLEDGEMENTS: BB Dhal acknowledges the help and support of scholarship from Department of Health, Government of Western Australia.
Poster No. 10 (EPSM-1236) Monday Poster Session
EPSM 2013 Perth Nov 3-7 2013 213
COMPARISON OF POLYMER-BASED AND GOLD FIDUCIAL MARKERS FOR IMAGE GUIDED PROSTATE RADIOTHERAPY E.B. Estoesta1, V. Cawood1, D. Latty1, B. Sikimeti1, J. Sykes1,2,3, A. Hayden1 1 Crown Princess Mary Cancer Centre, Westmead, NSW, Australia 2 Institute of Medical Physics, School of Physics, University of Sydney, Sydney, NSW, Australia 3 Nepean Cancer Care Centre, Kingswood, NSW, Australia
INTRODUCTION Recently, a new polymer-based fiducial marker (PolymarkTM supplied by NL-TEC, Willetton, WA) for image guided prostate radiotherapy has become available. This study aimed to compare qualitatively the visibility and image quality of plastic markers on scans from a conventional CT, linac based kilovoltage Cone Beam CT (kV-CBCT) and kilovoltage radiographic imaging (kV-planar) relative to a standard gold marker. This work also compares the CT numbers and electron densities of the two markers from conventional CT images.
MATERIALS AND METHODS: Polymer and gold markers were embedded in the prostate region of a RANDO® phantom. Images from a conventional CT, kV-CBCT and kV-planar were obtained using standard imaging protocols for prostate radiotherapy. Visibility of the markers and presence of any artefacts were noted qualitatively on the images. The conventional CT images were exported to Eclipse® treatment planning system to obtain the CT numbers of these markers and extract their corresponding electron densities.
RESULTS: There were minimal image artefacts on the conventional CT scan of the plastic marker compared to the obvious streak artefacts with the gold marker. The plastic marker had a CT number of 1517 HU (density ≈1.991 g-cm-3) while the gold marker was 3071 HU (density ≈ 3.061 g- cm-3). The plastic marker had a slightly higher density than cortical bone. Both markers were visible in the kV-CBCT images and similar to CT, streak artefacts were minimal around the plastic marker. The plastic marker was distinctly less visible in the kV-planar image and window level adjustments were required to improve its visibility.
CONCLUSION: Polymer-based implanted markers can be used as an alternative to gold seeds for use as fiducial markers in kV based image guided prostate radiotherapy. Artefacts on conventional CT scans are virtually eliminated with their use. However, since their density is close to bone, polymer markers should be used with caution when calcifications are also present in close proximity.
Poster No. 11 (EPSM-1263) Wednesday Poster Session
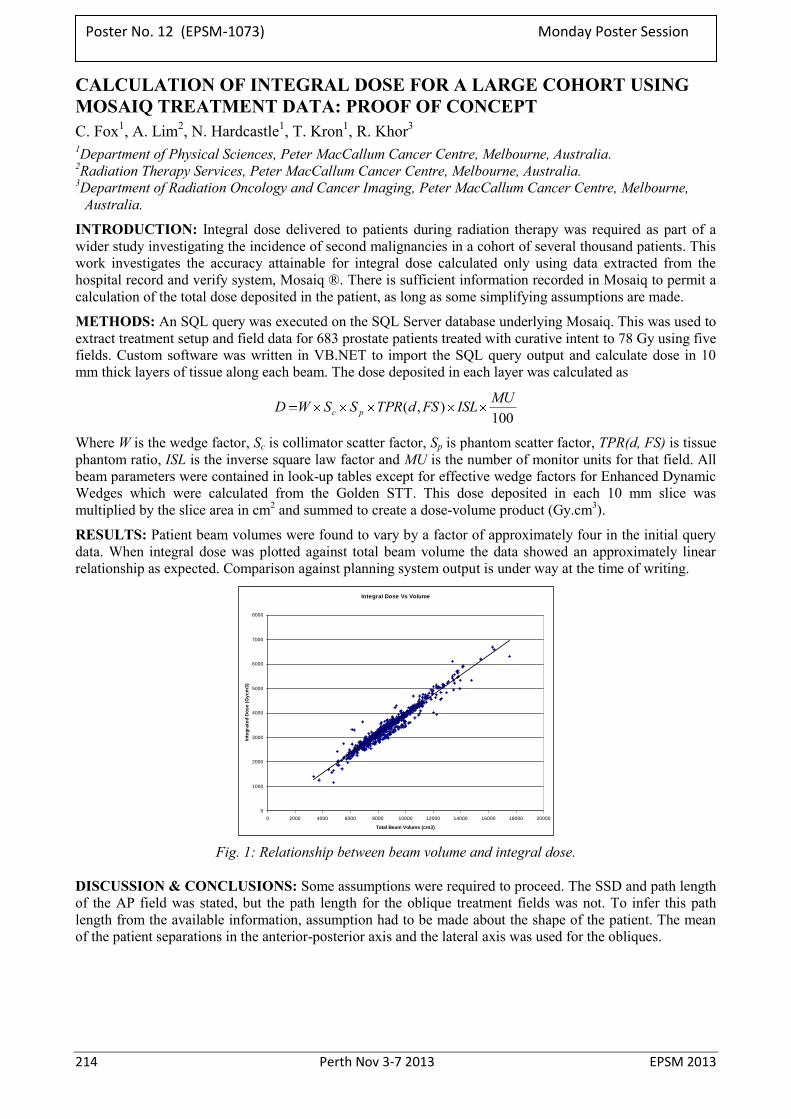
214 Perth Nov 3-7 2013 EPSM 2013
CALCULATION OF INTEGRAL DOSE FOR A LARGE COHORT USING MOSAIQ TREATMENT DATA: PROOF OF CONCEPT C. Fox1, A. Lim2, N. Hardcastle1, T. Kron1, R. Khor3 1Department of Physical Sciences, Peter MacCallum Cancer Centre, Melbourne, Australia. 2Radiation Therapy Services, Peter MacCallum Cancer Centre, Melbourne, Australia. 3Department of Radiation Oncology and Cancer Imaging, Peter MacCallum Cancer Centre, Melbourne,
Australia.
INTRODUCTION: Integral dose delivered to patients during radiation therapy was required as part of a wider study investigating the incidence of second malignancies in a cohort of several thousand patients. This work investigates the accuracy attainable for integral dose calculated only using data extracted from the hospital record and verify system, Mosaiq ®. There is sufficient information recorded in Mosaiq to permit a calculation of the total dose deposited in the patient, as long as some simplifying assumptions are made.
METHODS: An SQL query was executed on the SQL Server database underlying Mosaiq. This was used to extract treatment setup and field data for 683 prostate patients treated with curative intent to 78 Gy using five fields. Custom software was written in VB.NET to import the SQL query output and calculate dose in 10 mm thick layers of tissue along each beam. The dose deposited in each layer was calculated as
100),( MUISLFSdTPRSSWD pc
Where W is the wedge factor, Sc is collimator scatter factor, Sp is phantom scatter factor, TPR(d, FS) is tissue phantom ratio, ISL is the inverse square law factor and MU is the number of monitor units for that field. All beam parameters were contained in look-up tables except for effective wedge factors for Enhanced Dynamic Wedges which were calculated from the Golden STT. This dose deposited in each 10 mm slice was multiplied by the slice area in cm2 and summed to create a dose-volume product (Gy.cm3).
RESULTS: Patient beam volumes were found to vary by a factor of approximately four in the initial query data. When integral dose was plotted against total beam volume the data showed an approximately linear relationship as expected. Comparison against planning system output is under way at the time of writing.
Integral Dose Vs Volume
0
1000
2000
3000
4000
5000
6000
7000
8000
0 2000 4000 6000 8000 10000 12000 14000 16000 18000 20000
Total Beam Volume (cm3)
Inte
gra
ted
Do
se
(G
yc
m3
)
Fig. 1: Relationship between beam volume and integral dose.
DISCUSSION & CONCLUSIONS: Some assumptions were required to proceed. The SSD and path length of the AP field was stated, but the path length for the oblique treatment fields was not. To infer this path length from the available information, assumption had to be made about the shape of the patient. The mean of the patient separations in the anterior-posterior axis and the lateral axis was used for the obliques.
Poster No. 12 (EPSM-1073) Monday Poster Session
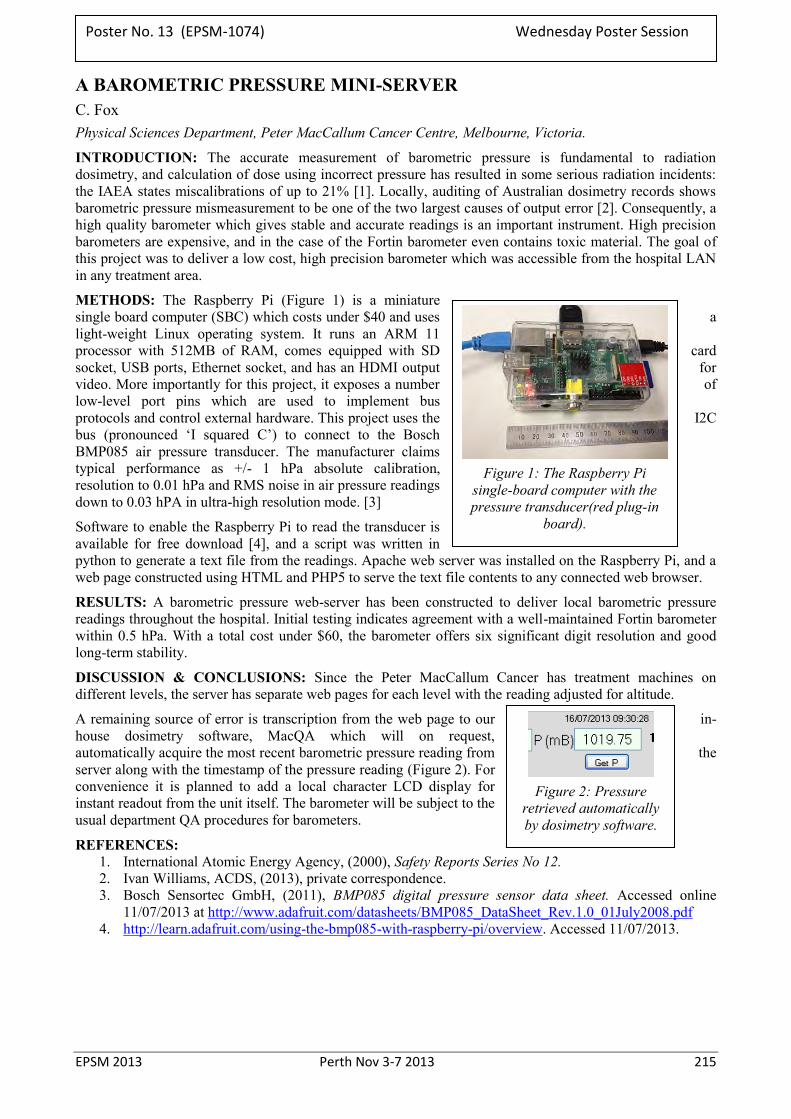
EPSM 2013 Perth Nov 3-7 2013 215
A BAROMETRIC PRESSURE MINI-SERVER C. Fox Physical Sciences Department, Peter MacCallum Cancer Centre, Melbourne, Victoria.
INTRODUCTION: The accurate measurement of barometric pressure is fundamental to radiation dosimetry, and calculation of dose using incorrect pressure has resulted in some serious radiation incidents: the IAEA states miscalibrations of up to 21% [1]. Locally, auditing of Australian dosimetry records shows barometric pressure mismeasurement to be one of the two largest causes of output error [2]. Consequently, a high quality barometer which gives stable and accurate readings is an important instrument. High precision barometers are expensive, and in the case of the Fortin barometer even contains toxic material. The goal of this project was to deliver a low cost, high precision barometer which was accessible from the hospital LAN in any treatment area.
METHODS: The Raspberry Pi (Figure 1) is a miniature single board computer (SBC) which costs under $40 and uses a light-weight Linux operating system. It runs an ARM 11 processor with 512MB of RAM, comes equipped with SD card socket, USB ports, Ethernet socket, and has an HDMI output for video. More importantly for this project, it exposes a number of low-level port pins which are used to implement bus protocols and control external hardware. This project uses the I2C bus (pronounced ‘I squared C’) to connect to the Bosch BMP085 air pressure transducer. The manufacturer claims typical performance as +/- 1 hPa absolute calibration, resolution to 0.01 hPa and RMS noise in air pressure readings down to 0.03 hPA in ultra-high resolution mode. [3]
Software to enable the Raspberry Pi to read the transducer is available for free download [4], and a script was written in python to generate a text file from the readings. Apache web server was installed on the Raspberry Pi, and a web page constructed using HTML and PHP5 to serve the text file contents to any connected web browser.
RESULTS: A barometric pressure web-server has been constructed to deliver local barometric pressure readings throughout the hospital. Initial testing indicates agreement with a well-maintained Fortin barometer within 0.5 hPa. With a total cost under $60, the barometer offers six significant digit resolution and good long-term stability.
DISCUSSION & CONCLUSIONS: Since the Peter MacCallum Cancer has treatment machines on different levels, the server has separate web pages for each level with the reading adjusted for altitude.
A remaining source of error is transcription from the web page to our in-house dosimetry software, MacQA which will on request, automatically acquire the most recent barometric pressure reading from the server along with the timestamp of the pressure reading (Figure 2). For convenience it is planned to add a local character LCD display for instant readout from the unit itself. The barometer will be subject to the usual department QA procedures for barometers.
REFERENCES: 1. International Atomic Energy Agency, (2000), Safety Reports Series No 12. 2. Ivan Williams, ACDS, (2013), private correspondence. 3. Bosch Sensortec GmbH, (2011), BMP085 digital pressure sensor data sheet. Accessed online
11/07/2013 at http://www.adafruit.com/datasheets/BMP085_DataSheet_Rev.1.0_01July2008.pdf 4. http://learn.adafruit.com/using-the-bmp085-with-raspberry-pi/overview. Accessed 11/07/2013.
Figure 1: The Raspberry Pi
single-board computer with the pressure transducer(red plug-in
board).
Figure 2: Pressure
retrieved automatically by dosimetry software.
Poster No. 13 (EPSM-1074) Wednesday Poster Session
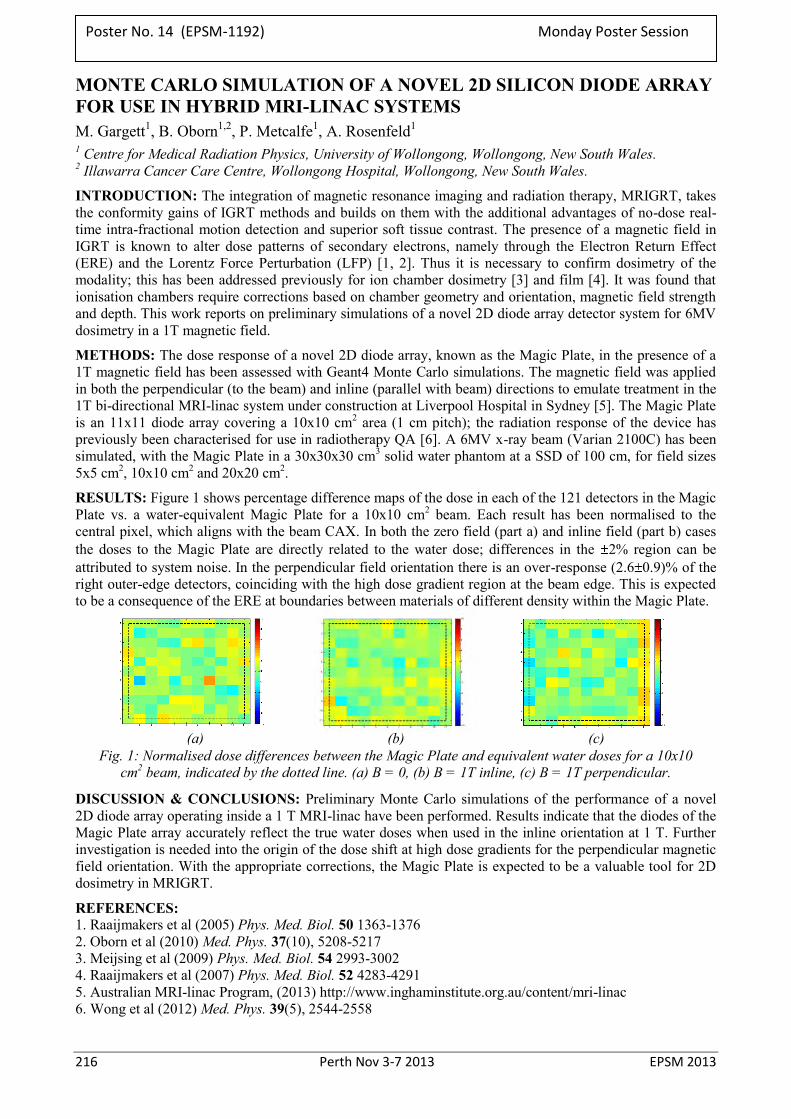
216 Perth Nov 3-7 2013 EPSM 2013
MONTE CARLO SIMULATION OF A NOVEL 2D SILICON DIODE ARRAY FOR USE IN HYBRID MRI-LINAC SYSTEMS M. Gargett1, B. Oborn1,2, P. Metcalfe1, A. Rosenfeld1 1 Centre for Medical Radiation Physics, University of Wollongong, Wollongong, New South Wales. 2 Illawarra Cancer Care Centre, Wollongong Hospital, Wollongong, New South Wales.
INTRODUCTION: The integration of magnetic resonance imaging and radiation therapy, MRIGRT, takes the conformity gains of IGRT methods and builds on them with the additional advantages of no-dose real-time intra-fractional motion detection and superior soft tissue contrast. The presence of a magnetic field in IGRT is known to alter dose patterns of secondary electrons, namely through the Electron Return Effect (ERE) and the Lorentz Force Perturbation (LFP) [1, 2]. Thus it is necessary to confirm dosimetry of the modality; this has been addressed previously for ion chamber dosimetry [3] and film [4]. It was found that ionisation chambers require corrections based on chamber geometry and orientation, magnetic field strength and depth. This work reports on preliminary simulations of a novel 2D diode array detector system for 6MV dosimetry in a 1T magnetic field.
METHODS: The dose response of a novel 2D diode array, known as the Magic Plate, in the presence of a 1T magnetic field has been assessed with Geant4 Monte Carlo simulations. The magnetic field was applied in both the perpendicular (to the beam) and inline (parallel with beam) directions to emulate treatment in the 1T bi-directional MRI-linac system under construction at Liverpool Hospital in Sydney [5]. The Magic Plate is an 11x11 diode array covering a 10x10 cm2 area (1 cm pitch); the radiation response of the device has previously been characterised for use in radiotherapy QA [6]. A 6MV x-ray beam (Varian 2100C) has been simulated, with the Magic Plate in a 30x30x30 cm3 solid water phantom at a SSD of 100 cm, for field sizes 5x5 cm2, 10x10 cm2 and 20x20 cm2.
RESULTS: Figure 1 shows percentage difference maps of the dose in each of the 121 detectors in the Magic Plate vs. a water-equivalent Magic Plate for a 10x10 cm2 beam. Each result has been normalised to the central pixel, which aligns with the beam CAX. In both the zero field (part a) and inline field (part b) cases the doses to the Magic Plate are directly related to the water dose; differences in the 2% region can be attributed to system noise. In the perpendicular field orientation there is an over-response (2.6 0.9)% of the right outer-edge detectors, coinciding with the high dose gradient region at the beam edge. This is expected to be a consequence of the ERE at boundaries between materials of different density within the Magic Plate.
(a) (b) (c) Fig. 1: Normalised dose differences between the Magic Plate and equivalent water doses for a 10x10
cm2 beam, indicated by the dotted line. (a) B = 0, (b) B = 1T inline, (c) B = 1T perpendicular.
DISCUSSION & CONCLUSIONS: Preliminary Monte Carlo simulations of the performance of a novel 2D diode array operating inside a 1 T MRI-linac have been performed. Results indicate that the diodes of the Magic Plate array accurately reflect the true water doses when used in the inline orientation at 1 T. Further investigation is needed into the origin of the dose shift at high dose gradients for the perpendicular magnetic field orientation. With the appropriate corrections, the Magic Plate is expected to be a valuable tool for 2D dosimetry in MRIGRT.
REFERENCES: 1. Raaijmakers et al (2005) Phys. Med. Biol. 50 1363-1376 2. Oborn et al (2010) Med. Phys. 37(10), 5208-5217 3. Meijsing et al (2009) Phys. Med. Biol. 54 2993-3002 4. Raaijmakers et al (2007) Phys. Med. Biol. 52 4283-4291 5. Australian MRI-linac Program, (2013) http://www.inghaminstitute.org.au/content/mri-linac 6. Wong et al (2012) Med. Phys. 39(5), 2544-2558
Poster No. 14 (EPSM-1192) Monday Poster Session
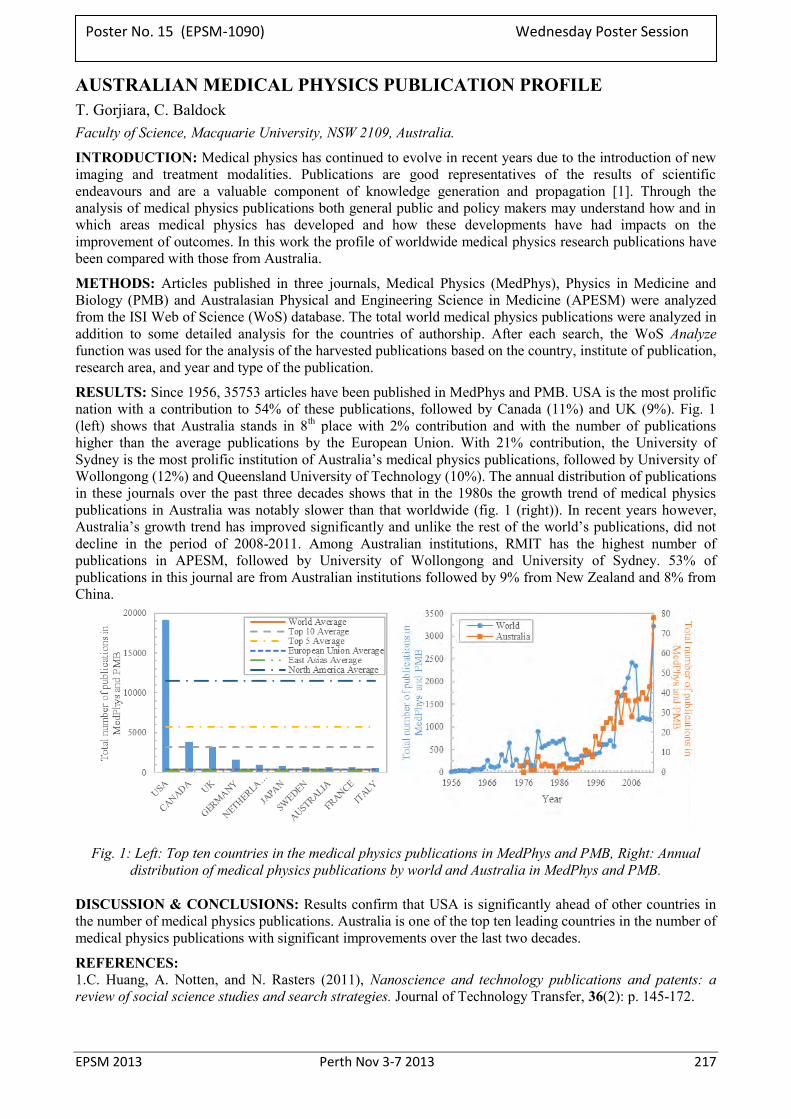
EPSM 2013 Perth Nov 3-7 2013 217
AUSTRALIAN MEDICAL PHYSICS PUBLICATION PROFILE T. Gorjiara, C. Baldock Faculty of Science, Macquarie University, NSW 2109, Australia.
INTRODUCTION: Medical physics has continued to evolve in recent years due to the introduction of new imaging and treatment modalities. Publications are good representatives of the results of scientific endeavours and are a valuable component of knowledge generation and propagation [1]. Through the analysis of medical physics publications both general public and policy makers may understand how and in which areas medical physics has developed and how these developments have had impacts on the improvement of outcomes. In this work the profile of worldwide medical physics research publications have been compared with those from Australia.
METHODS: Articles published in three journals, Medical Physics (MedPhys), Physics in Medicine and Biology (PMB) and Australasian Physical and Engineering Science in Medicine (APESM) were analyzed from the ISI Web of Science (WoS) database. The total world medical physics publications were analyzed in addition to some detailed analysis for the countries of authorship. After each search, the WoS Analyze function was used for the analysis of the harvested publications based on the country, institute of publication, research area, and year and type of the publication.
RESULTS: Since 1956, 35753 articles have been published in MedPhys and PMB. USA is the most prolific nation with a contribution to 54% of these publications, followed by Canada (11%) and UK (9%). Fig. 1 (left) shows that Australia stands in 8th place with 2% contribution and with the number of publications higher than the average publications by the European Union. With 21% contribution, the University of Sydney is the most prolific institution of Australia’s medical physics publications, followed by University of Wollongong (12%) and Queensland University of Technology (10%). The annual distribution of publications in these journals over the past three decades shows that in the 1980s the growth trend of medical physics publications in Australia was notably slower than that worldwide (fig. 1 (right)). In recent years however, Australia’s growth trend has improved significantly and unlike the rest of the world’s publications, did not decline in the period of 2008-2011. Among Australian institutions, RMIT has the highest number of publications in APESM, followed by University of Wollongong and University of Sydney. 53% of publications in this journal are from Australian institutions followed by 9% from New Zealand and 8% from China.
Fig. 1: Left: Top ten countries in the medical physics publications in MedPhys and PMB, Right: Annual distribution of medical physics publications by world and Australia in MedPhys and PMB.
DISCUSSION & CONCLUSIONS: Results confirm that USA is significantly ahead of other countries in the number of medical physics publications. Australia is one of the top ten leading countries in the number of medical physics publications with significant improvements over the last two decades.
REFERENCES: 1.C. Huang, A. Notten, and N. Rasters (2011), Nanoscience and technology publications and patents: a review of social science studies and search strategies. Journal of Technology Transfer, 36(2): p. 145-172.
Poster No. 15 (EPSM-1090) Wednesday Poster Session
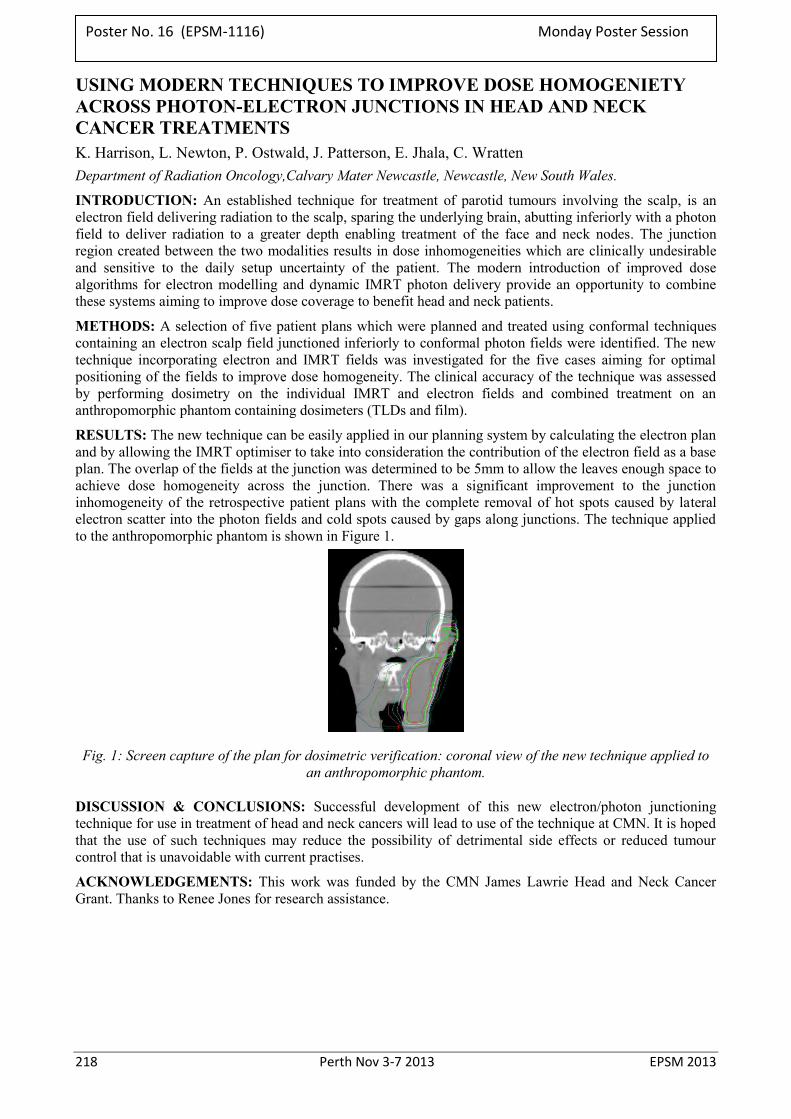
218 Perth Nov 3-7 2013 EPSM 2013
USING MODERN TECHNIQUES TO IMPROVE DOSE HOMOGENIETY ACROSS PHOTON-ELECTRON JUNCTIONS IN HEAD AND NECK CANCER TREATMENTS K. Harrison, L. Newton, P. Ostwald, J. Patterson, E. Jhala, C. Wratten Department of Radiation Oncology,Calvary Mater Newcastle, Newcastle, New South Wales.
INTRODUCTION: An established technique for treatment of parotid tumours involving the scalp, is an electron field delivering radiation to the scalp, sparing the underlying brain, abutting inferiorly with a photon field to deliver radiation to a greater depth enabling treatment of the face and neck nodes. The junction region created between the two modalities results in dose inhomogeneities which are clinically undesirable and sensitive to the daily setup uncertainty of the patient. The modern introduction of improved dose algorithms for electron modelling and dynamic IMRT photon delivery provide an opportunity to combine these systems aiming to improve dose coverage to benefit head and neck patients.
METHODS: A selection of five patient plans which were planned and treated using conformal techniques containing an electron scalp field junctioned inferiorly to conformal photon fields were identified. The new technique incorporating electron and IMRT fields was investigated for the five cases aiming for optimal positioning of the fields to improve dose homogeneity. The clinical accuracy of the technique was assessed by performing dosimetry on the individual IMRT and electron fields and combined treatment on an anthropomorphic phantom containing dosimeters (TLDs and film).
RESULTS: The new technique can be easily applied in our planning system by calculating the electron plan and by allowing the IMRT optimiser to take into consideration the contribution of the electron field as a base plan. The overlap of the fields at the junction was determined to be 5mm to allow the leaves enough space to achieve dose homogeneity across the junction. There was a significant improvement to the junction inhomogeneity of the retrospective patient plans with the complete removal of hot spots caused by lateral electron scatter into the photon fields and cold spots caused by gaps along junctions. The technique applied to the anthropomorphic phantom is shown in Figure 1.
Fig. 1: Screen capture of the plan for dosimetric verification: coronal view of the new technique applied to an anthropomorphic phantom.
DISCUSSION & CONCLUSIONS: Successful development of this new electron/photon junctioning technique for use in treatment of head and neck cancers will lead to use of the technique at CMN. It is hoped that the use of such techniques may reduce the possibility of detrimental side effects or reduced tumour control that is unavoidable with current practises.
ACKNOWLEDGEMENTS: This work was funded by the CMN James Lawrie Head and Neck Cancer Grant. Thanks to Renee Jones for research assistance.
Poster No. 16 (EPSM-1116) Monday Poster Session
EPSM 2013 Perth Nov 3-7 2013 219
IS THERE A RELATIONSHIP BETWEEN PATIENT WEIGHT OR HEIGHT AND CT DOSE? A. Harvey1, T. Greig1, B. Khoo1, J. Atkinson1, P. Muir2 1 Department of Medical Technology and Physics, Sir Charles Gairdner Hospital, Perth, Western Australia. 2 Department of Radiology, Sir Charles Gairdner Hospital, Perth, Western Australia.
INTRODUCTION: The ARPANSA Code of Practice for Radiation Protection in the Medical Applications of Ionizing Radiation (2008) [1] requires that radiation doses received by patients for diagnostic purposes are periodically compared with diagnostic reference levels (DRLs). The first modality to be surveyed was multi-detector CT, to obtain typical radiation doses for a set of standard CT imaging procedures. Initially, the ARPANSA National DRL survey requested patient height, weight and width, along with other radiation dose parameters. Collecting the patient data such as patient’s weight, height and width may be difficult for radiographers in a clinical setting. More recently, the ARPANSA National DRL survey has only requested patient weight, along with other radiation dose parameters, which is more clinically relevant.
METHODS: During May 2010, radiographers agreed to record patient height and weight at the time of the CT scan and enter the data into appropriate fields on the control workstation. It was previously agreed that no patient height or weight data would be necessary for CT scans of the head. The height and weight values were either: measured by the radiographer using scales and measuring devices provided to them, obtained by asking the patient what their height and weight was, or by examining the patient’s notes. This data, along with the relevant radiation dose data, was later extracted from the DICOM information by a software package written in-house.
RESULTS: During May 2010, data was recorded for 1443 CT scans from the two CT scanners in Radiology. Patient height and weight data was extracted for 529 of these CT scans. Patient height and patient weight was compared with the average CTDIvol and total dose length product (DLP) for each scan. There was a weak correlation between patient weight and average CTDIvol and total DLP for CT scans. However, no relationship between patient height and average CTDIvol or total DLP for CT scans was observed.
DISCUSSION & CONCLUSIONS: Since there was no relationship between patient height and average CTDIvol or total DLP, there was no need to include height information in the ARPANSA National DRL surveys. Patient weight is an easy to acquire measurement, and by not having the need to record patient height, reduces to the workload to radiographers during data collection periods for the National DRL surveys, without affecting the quality of the data.
REFERENCES: 1. ARPANSA (2008) Code of Practice for Radiation Protection in the Medical Applications of Ionizing
Radiation.
ACKNOWLEDGEMENTS: We would like to acknowledge the efforts of Peter Muir, Neil Hicks and Anne Winsor, along with all the radiographers who participated in the data collection, for taking a real interest in this work, and their enthusiasm in reducing CT patient dose.
Poster No. 17 (EPSM-1231) Wednesday Poster Session
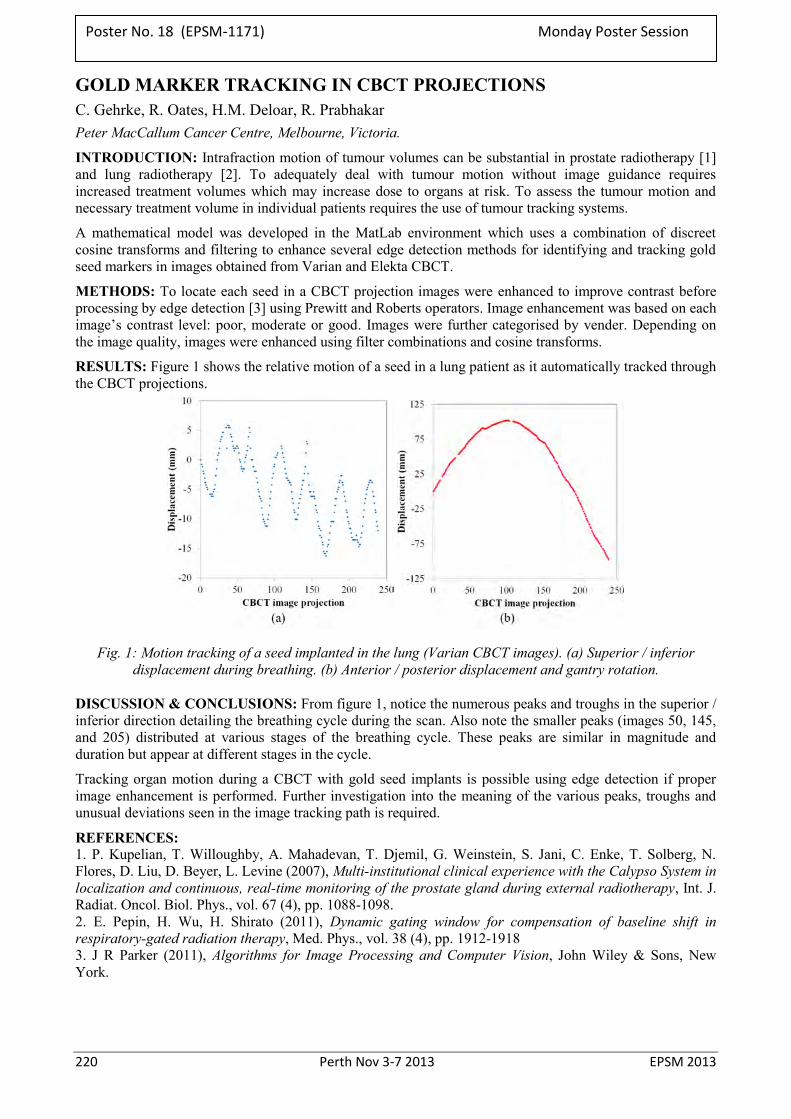
220 Perth Nov 3-7 2013 EPSM 2013
GOLD MARKER TRACKING IN CBCT PROJECTIONS C. Gehrke, R. Oates, H.M. Deloar, R. Prabhakar Peter MacCallum Cancer Centre, Melbourne, Victoria.
INTRODUCTION: Intrafraction motion of tumour volumes can be substantial in prostate radiotherapy [1] and lung radiotherapy [2]. To adequately deal with tumour motion without image guidance requires increased treatment volumes which may increase dose to organs at risk. To assess the tumour motion and necessary treatment volume in individual patients requires the use of tumour tracking systems.
A mathematical model was developed in the MatLab environment which uses a combination of discreet cosine transforms and filtering to enhance several edge detection methods for identifying and tracking gold seed markers in images obtained from Varian and Elekta CBCT.
METHODS: To locate each seed in a CBCT projection images were enhanced to improve contrast before processing by edge detection [3] using Prewitt and Roberts operators. Image enhancement was based on each image’s contrast level: poor, moderate or good. Images were further categorised by vender. Depending on the image quality, images were enhanced using filter combinations and cosine transforms.
RESULTS: Figure 1 shows the relative motion of a seed in a lung patient as it automatically tracked through the CBCT projections.
Fig. 1: Motion tracking of a seed implanted in the lung (Varian CBCT images). (a) Superior / inferior displacement during breathing. (b) Anterior / posterior displacement and gantry rotation.
DISCUSSION & CONCLUSIONS: From figure 1, notice the numerous peaks and troughs in the superior / inferior direction detailing the breathing cycle during the scan. Also note the smaller peaks (images 50, 145, and 205) distributed at various stages of the breathing cycle. These peaks are similar in magnitude and duration but appear at different stages in the cycle.
Tracking organ motion during a CBCT with gold seed implants is possible using edge detection if proper image enhancement is performed. Further investigation into the meaning of the various peaks, troughs and unusual deviations seen in the image tracking path is required.
REFERENCES: 1. P. Kupelian, T. Willoughby, A. Mahadevan, T. Djemil, G. Weinstein, S. Jani, C. Enke, T. Solberg, N. Flores, D. Liu, D. Beyer, L. Levine (2007), Multi-institutional clinical experience with the Calypso System in localization and continuous, real-time monitoring of the prostate gland during external radiotherapy, Int. J. Radiat. Oncol. Biol. Phys., vol. 67 (4), pp. 1088-1098. 2. E. Pepin, H. Wu, H. Shirato (2011), Dynamic gating window for compensation of baseline shift in respiratory-gated radiation therapy, Med. Phys., vol. 38 (4), pp. 1912-1918 3. J R Parker (2011), Algorithms for Image Processing and Computer Vision, John Wiley & Sons, New York.
Poster No. 18 (EPSM-1171) Monday Poster Session
EPSM 2013 Perth Nov 3-7 2013 221
RECOMMEDATIONS FOR A DIGITAL RADIOGRAPHIC DETECTOR QUALITY ASSURANCE PROGRAM T. Ireland, M. Irvine Biomedical Technology Services, Queensland Health, Fortitude Valley, QLD, 4006.
INTRODUCTION: With the current preference for digital radiographic detectors in modern radiology facilities there has been increasing demand for a comprehensive quality assurance program to ensure that digital radiography technology is able to consistently meet a facility’s clinical requirements. Presented is a quality assurance program that outlines a time efficient and cost effective procedure for performance testing of digital radiographic detectors to be performed at acceptance of a new system with continuing annual observation.
METHODS: Digital radiographic performance testing has been trialled on three different digital detector systems and over 15 separate detectors. Performance tests include; image retention, detector response (pixel value - dose linearity), exposure index accuracy, image uniformity, artifact evaluation and quantitative image quality analysis (Modulation Transfer Function (MTF), Normalised Noise Power Spectrum (NNPS) and Detective Quantum Efficiency (DQE)) for the detector alone and for the system.
RESULTS: It is shown that where testing is possible on modern detector systems, performance testing has been completed and tolerances are proposed that may be applicable to a properly performing digital radiographic detector. Expected results for each test criteria are described and experimental results are presented.
DISCUSSION: Rationales and practical suggestions are provided for the presented performance tests and tolerance values.
CONCLUSIONS: The 15 detectors tested were found to generally be within the specified/recommended tolerances with a few exceptions. The QA program recommended would be relatively easily implemented at sites utilising digital radiography, if local medical physics support is available.
Poster No. 19 (EPSM-1070) Wednesday Poster Session
222 Perth Nov 3-7 2013 EPSM 2013
ASSESSING DYNAMIC FLUOROSCOPIC IMAGE QUALITY IN TELEHEALTH APPLICATIONS: ADAPTATION OF THE NEMA XR 21 CARDIOVASULAR FLUOROSCOPIC BENCHMARKING PHANTOM C.L. Burns1, B. Keir2, E.C. Ward3,4, A.J. Hill4, L. Porter5, N. Phillips5
1Speech Pathology and Audiology Department, Royal Brisbane and Women’s Hospital, Department of Health, Queensland.
2Biomedical Technology Services, Health Services Support Agency, Department of Health, Queensland. 3Centre for Functioning and Health Research, Department of Health, Queensland. 4School of Health & Rehabilitation Sciences, The University of Queensland. 5Medical Imaging Department, Royal Brisbane and Women’s Hospital, Department of Health, Queensland.
INTRODUCTION: Videofluoroscopic swallow studies require the acquisition of high speed dynamic radiological images to support accurate Speech Pathology assessment and diagnosis of swallowing disorders. With the increasing application of telehealth in radiology, evaluating fluorscopic images quality across new technology and networks demands collaboration between speech pathologists and Diagnositic Imaging Medical Physics (DIMPs) to guide system development and clinical implementation. This study describes a process for evaluating fluoroscopic image quality using the NEMA XR 21 Cardiovascular Fluoroscopic Benchmarking Phantom for data both in-room and transferred across a secure telehealth network within the Royal Brisbane and Women’s Hospital.
METHODS: The equipment tested included a multi-purpose digital fluoroscopy system (Siemens Artis Zee MP) connected to 1) a Digital Swallowing Workstation (KayPentax), and 2) range of telehealth units. The telehealth units comprised of standard videoconferencing equipment utilised within the Department of Health (Queensland) connected via the Statewide Telehealth Network.
Prior to commencement of the dynamic image quality evaluation, each of the display monitors were assessed and calibrated (where achievable) to ensure accurate baseline data could be established. This process also assisted in evaluating connectivity and performance of the in-room and networked telehealth units.
A dynamic image quality evaluation of the fluoroscopic system, Digital Swallowing Workstation and telehealth units was conducted concurrently using the NEMA XR 21 Cardiovascular Fluoroscopic Benchmarking Phantom. During the testing, image quality metrics were scored for all systems including the evaluation of generated images across a range of telehealth codecs operating at varying network speeds.
RESULTS: Degradation on phantom generated images was measured quantitatively and qualitatively to highlight differences in performance between in-room equipment and networked telehealth systems. Correlations between test images and clinical recordings were then made to determine the sensitivity of the phantom in predicting degradation of videofluoroscopic image quality across the tested equipment.
DISCUSSION & CONCLUSIONS: This study demonstrates the adaptation of an existing test protocol to evaluate dynamic image quality over a telehealth system. These outcomes have assisted in determining the feasibility of conducting fluoroscopic studies via telehealth and guided the choice of telehealth technology to optimise image quality.
Poster No. 20 (EPSM-1235) Monday Poster Session
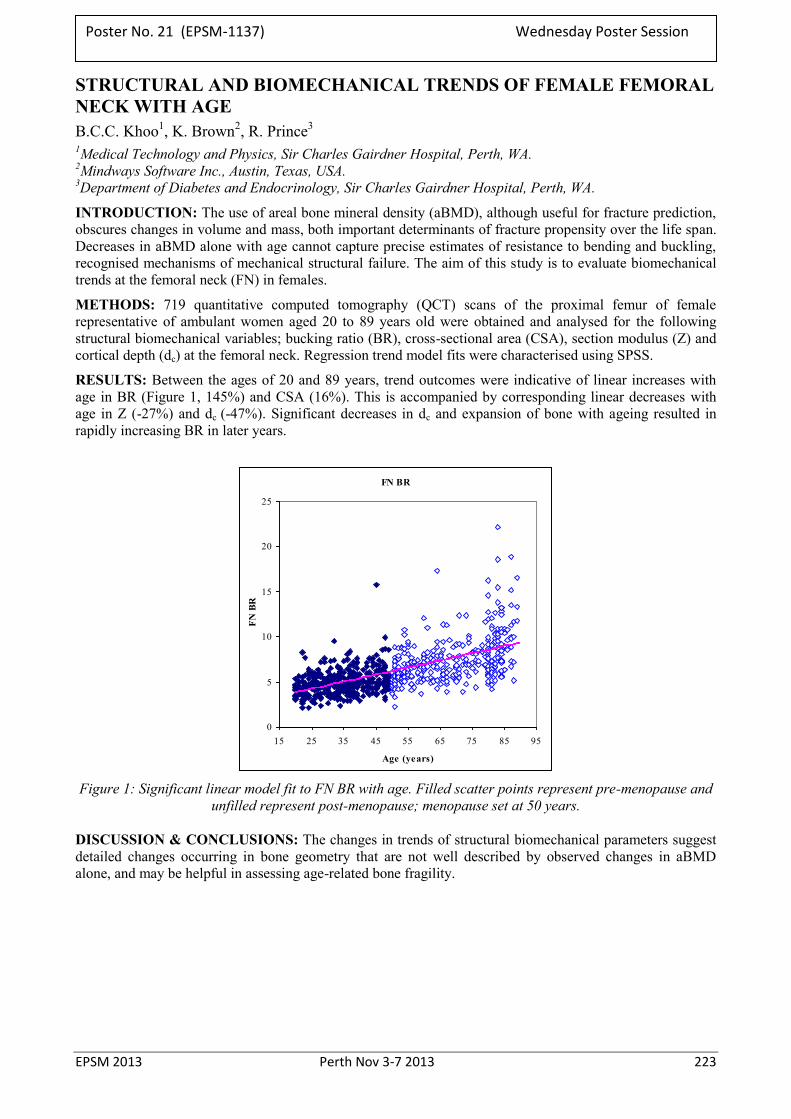
EPSM 2013 Perth Nov 3-7 2013 223
STRUCTURAL AND BIOMECHANICAL TRENDS OF FEMALE FEMORAL NECK WITH AGE B.C.C. Khoo1, K. Brown2, R. Prince3
1Medical Technology and Physics, Sir Charles Gairdner Hospital, Perth, WA. 2Mindways Software Inc., Austin, Texas, USA. 3Department of Diabetes and Endocrinology, Sir Charles Gairdner Hospital, Perth, WA.
INTRODUCTION: The use of areal bone mineral density (aBMD), although useful for fracture prediction, obscures changes in volume and mass, both important determinants of fracture propensity over the life span. Decreases in aBMD alone with age cannot capture precise estimates of resistance to bending and buckling, recognised mechanisms of mechanical structural failure. The aim of this study is to evaluate biomechanical trends at the femoral neck (FN) in females.
METHODS: 719 quantitative computed tomography (QCT) scans of the proximal femur of female representative of ambulant women aged 20 to 89 years old were obtained and analysed for the following structural biomechanical variables; bucking ratio (BR), cross-sectional area (CSA), section modulus (Z) and cortical depth (dc) at the femoral neck. Regression trend model fits were characterised using SPSS.
RESULTS: Between the ages of 20 and 89 years, trend outcomes were indicative of linear increases with age in BR (Figure 1, 145%) and CSA (16%). This is accompanied by corresponding linear decreases with age in Z (-27%) and dc (-47%). Significant decreases in dc and expansion of bone with ageing resulted in rapidly increasing BR in later years.
FN BR
0
5
10
15
20
25
15 25 35 45 55 65 75 85 95
Age (years)
FN B
R
Figure 1: Significant linear model fit to FN BR with age. Filled scatter points represent pre-menopause and
unfilled represent post-menopause; menopause set at 50 years.
DISCUSSION & CONCLUSIONS: The changes in trends of structural biomechanical parameters suggest detailed changes occurring in bone geometry that are not well described by observed changes in aBMD alone, and may be helpful in assessing age-related bone fragility.
Poster No. 21 (EPSM-1137) Wednesday Poster Session
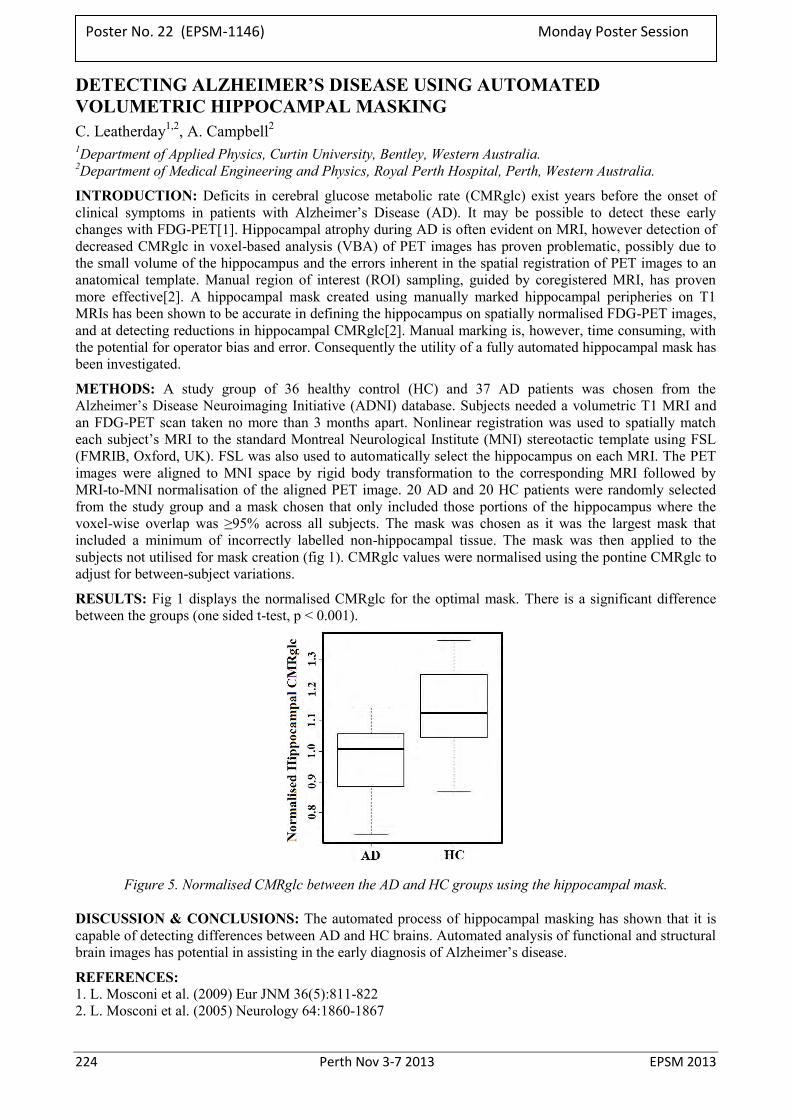
224 Perth Nov 3-7 2013 EPSM 2013
DETECTING ALZHEIMER’S DISEASE USING AUTOMATED VOLUMETRIC HIPPOCAMPAL MASKING C. Leatherday1,2, A. Campbell2 1Department of Applied Physics, Curtin University, Bentley, Western Australia. 2Department of Medical Engineering and Physics, Royal Perth Hospital, Perth, Western Australia.
INTRODUCTION: Deficits in cerebral glucose metabolic rate (CMRglc) exist years before the onset of clinical symptoms in patients with Alzheimer’s Disease (AD). It may be possible to detect these early changes with FDG-PET[1]. Hippocampal atrophy during AD is often evident on MRI, however detection of decreased CMRglc in voxel-based analysis (VBA) of PET images has proven problematic, possibly due to the small volume of the hippocampus and the errors inherent in the spatial registration of PET images to an anatomical template. Manual region of interest (ROI) sampling, guided by coregistered MRI, has proven more effective[2]. A hippocampal mask created using manually marked hippocampal peripheries on T1 MRIs has been shown to be accurate in defining the hippocampus on spatially normalised FDG-PET images, and at detecting reductions in hippocampal CMRglc[2]. Manual marking is, however, time consuming, with the potential for operator bias and error. Consequently the utility of a fully automated hippocampal mask has been investigated.
METHODS: A study group of 36 healthy control (HC) and 37 AD patients was chosen from the Alzheimer’s Disease Neuroimaging Initiative (ADNI) database. Subjects needed a volumetric T1 MRI and an FDG-PET scan taken no more than 3 months apart. Nonlinear registration was used to spatially match each subject’s MRI to the standard Montreal Neurological Institute (MNI) stereotactic template using FSL (FMRIB, Oxford, UK). FSL was also used to automatically select the hippocampus on each MRI. The PET images were aligned to MNI space by rigid body transformation to the corresponding MRI followed by MRI-to-MNI normalisation of the aligned PET image. 20 AD and 20 HC patients were randomly selected from the study group and a mask chosen that only included those portions of the hippocampus where the voxel-wise overlap was ≥95% across all subjects. The mask was chosen as it was the largest mask that included a minimum of incorrectly labelled non-hippocampal tissue. The mask was then applied to the subjects not utilised for mask creation (fig 1). CMRglc values were normalised using the pontine CMRglc to adjust for between-subject variations.
RESULTS: Fig 1 displays the normalised CMRglc for the optimal mask. There is a significant difference between the groups (one sided t-test, p < 0.001).
Figure 5. Normalised CMRglc between the AD and HC groups using the hippocampal mask.
DISCUSSION & CONCLUSIONS: The automated process of hippocampal masking has shown that it is capable of detecting differences between AD and HC brains. Automated analysis of functional and structural brain images has potential in assisting in the early diagnosis of Alzheimer’s disease.
REFERENCES: 1. L. Mosconi et al. (2009) Eur JNM 36(5):811-822 2. L. Mosconi et al. (2005) Neurology 64:1860-1867
Poster No. 22 (EPSM-1146) Monday Poster Session
EPSM 2013 Perth Nov 3-7 2013 225
CLINICAL IMPLEMENTATION OF THE NEW SRS AND SBRT NOVALIS TECHNOLOGY; EPWORTH HEALTHCARE COMMISSIONING AND STANDARD OF USE EXPERIENCE M.A. Hegazy, R. Li Epworth Health Care,VIC, Australia
INTRODUCTION: The Novalis Tx is a powerful radiosurgery system that offers a versatile combination of advanced technologies for the treatment of tumours and other anatomical targets. With the Novalis Tx radiosurgery platform, Epworth offers state-of-the-art, non-invasive treatment for a wide range of malignancies and other potentially debilitating conditions, without harming nearby healthy tissue and without involving traditional surgery.
Novalis Tx is equipped with Varians RapidArc radiotherapy technology. The Novalis Tx platform includes three imaging modalities for pinpointing the tumour and positioning the patient with high precision - an On-Board Imaging device (OBI), ExacTrac room-based image-guidance system provides continual imaging during treatment to detect movement and support robotic adjustments in patient positioning in six dimensions, and electronic portal imaging device (EPID). These methods allow for protection of surrounding healthy tissues while enabling clinicians to concentrate higher, more effective doses on tumours.
Novalis Tx will offer treatment options for an extremely wide range of indications such as malignant and benign lesions, brain metastases, arteriovascular malformations, and functional lesions. It features very high dose delivery rates, which means that treatments can be delivered very rapidly. Novalis Tx also offers dynamic fine beam shaping and non-invasive, precise frameless patient positioning for rapid and comfortable treatments.
OBJECTIVES: The target of this study was to evaluate the performance of our hospital Epworth’s new Novalis Tx by performing comprehensive measurements and testing of the new technology linear accelerator, and to develop technical guidelines for commissioning from the acceptance testing to clinical treatment. The Novalis Tx linear accelerator is equipped with, among other features, a high-definition MLC (HD120) with 2.5 mm central leaves, a 6D robotic couch, an optical guidance positioning system, as well as X-ray-based image guidance tools to provide high accuracy radiation delivery for SRS and SBRT procedures.
METHODS: In this study we will present an extensive tests and measurements for each of the facility options available in our new machine, and analysed the clinical data collected in our Epworth radiation oncology department as well as presenting a technical guidelines in this focusing on methods of data collection and efficiency, OBI, HD 120 MLC, ExacTrac X-ray, and 6D robotic. Our measurements will be collected using different types of ion chambers including Pin Point, diodes and Farmer type chambers for small field and large field data measurements.
RESULTS: Full beam characteristics data measurement will be presented using small detectors with small field sizes 3x3 and less. OBI data specifications will be presented as well as the CBCT tests. Also comprehensive tests will be presented in order of MLC commissioning including light field /Radiation field alignment, Winston Lutz test and Picket Fence test. EBT2 Film tests will be presented to confirm the Linac isocenter accuracy and to confirm as well the radiation treatment delivery dose is matching the planned and prescribed dose.
CONCLUSION: Setting technical guidelines for our new technology Novalise Tx from start to end is highly required to our practice and to gain and exchange the experience with others.
Establishing a full QA program for HD120 MLC, OBI, CBCT, and IGRT facilities available in our new machine increase the safety of use and achieve the international standard of care and patient satisfaction.
Developing our clinical protocols, methods and guidelines of Novalis Tx clinical use and treatment for SRS and SBRT based on Epworth clinical circumstances and patients standard of care.
Poster No. 23 (EPSM-1004) Wednesday Poster Session
226 Perth Nov 3-7 2013 EPSM 2013
PERSONAL RADIATION MONITORING SYSTEM INNEFICIENCIES: A COMPARISON IN SERVICE PROVISION S. Lummis
Department of Medical Technology and Physics, Sir Charles Gairdner Hospital, Perth, Western Australia.
BACKGROUND: A Personal Radiation Monitoring System’s (PRMS) purpose is to provide a means for radiation workers, their employers and regulatory authority to monitor exposure levels of radiation to ensure employee safety. Regulatory limits are set following the recommendations of the International Commission on Radiological Protection. The potential for biological detriment caused by radiation in extreme cases has lead to a precautionary approach when working with ionising radiation. The linear no threshold model for stochastic effects is utilised to determine exposure trigger limits. Evidence from tissue reactions following ionising radiation exposure have also been incorporated into setting occupational exposure limits. The perceived risk varies considerably between individuals and almost never approaches regulatory limits within hospital environment; however PRMS is peace of mind and has proven valuable in identifying incidents of irregular or increased exposures and in establishing best work practices by the application of ALARA (As Low As Reasonably Achievable) principle.
At Sir Charles Gairdner Hospital PRMS service is aided by three competing vendors; A, B, C. These vendors deliver thermo-luminescent detectors (TLD) and optically stimulated luminescence detectors (OSL). Vendors A, B and C provide for over 20 different departments and deliver badges for close to 800 staff in our hospital. The allocation of these badges is overseen by the Hospital’s Personal Radiation Monitoring Officer (PRMO) and each department is organised through a local PRMO. Ultimately the Hospital’s Radiation Safety Officer (and the Registrant) is responsible for reporting breaches of exposure limits to the Radiological Council in Western Australia.
METHOD: In the interest of optimizing the PRMS experience for all SCGH customers involved, the three vendors’ performances were assessed to discover if acceptable standards of service were being up-held. The three vendors were assessed on performance criteria, most notably report turn-around times. Data were initially taken from the 2012 monitoring periods. Data were assessed by vendor and by department size in determining where correlations may exist with reporting delays. Other indicators such as badge delivery delays and overall service quality were also assessed.
CONCLUSION: Generally PRMS vendors have not adhered to acceptable report time turn-around in most cases. Department size was independent of reporting time turn-around. Accountability of PRMS vendors should be continually monitored and their ‘approved vendor’ status reviewed periodically by appropriate authorities, to encourage a high level of service delivery to all Hospital staff working in a radiation environment.
ACKNOWLEDGEMENTS: This work was made possible by the excellent record keeping of Susan Edmonston-Fearn and Ana Peranovic, administrative staff of the department of Medical Technology and Physics at Sir Charles Gairdner Hospital.
Poster No. 24 (EPSM-1234) Monday Poster Session
EPSM 2013 Perth Nov 3-7 2013 227
PERFORMANCE CHARACTERISTICS OF SUN NUCLEAR IC PROFILER FOR LINAC QA D. Banjade, P. Mc Loone, P. Rampant, S. Woodings Genesis Cancer Care, Western Australia.
INTRODUCTION: The functional performance characteristics of a Sun Nuclear IC profiler has been investigated using 6 and 10 MV photon and 4 to 18 MeV electron beams from an Elekta Synergy linac. IC profiler data was compared to water tank scan data measured with the matching geometry. Measurement geometries were chosen maximise efficiency of routine quality assurance (QA) testing. Routine testing is intended to include photon and electron profile, light - radiation field coincidence and energy constancy, as recommended by QA protocols such as AAPM TG-142 [1].
METHODS: The IC profiler was set up using the steps required to set up IC profiler [2]. Initial checks of device sensitivity, backscatter dependency, field size resolution, dose linearity and stability and reproducibility were performed. The sensitivity of the IC profiler to small changes in energies, field size and beam symmetry was tested by altering the beam parameters of the linac and comparing the profiler results to water tank measurement scans.
RESULTS: The accuracy of IC profiler beam profile measurements of flatness and symmetry were found to be within 1% of water tank measurements with a reproducibility of 0.5%. Electron energy specifier R80 can be measured with 1 mm accuracy using a double wedge attachment.
DISCUSSION & CONCLUSIONS: Our result shows that the IC profiler has the ability to reproduce water measurement data with 1% accuracy, which is consistent with the results presented by other authors [3]. The IC profiler is suitable for efficient routine monthly QA and machine maintenance tests, thus a viable option for confirming Elekta linacs meet the QA tolerance levels stipulated by AAPM TG-142 and similar QA protocols.
REFERENCES: 1. Klein E.E. et al. (2009). Task Group 142 report: Quality assurance of medical accelerators. AAPM TG -
142- Med. Phys. 36 (9): 4197-4212. 2. IC PROFILER™ Reference Guide: The Waterless Water Tank IC profiler user manual. Sun Nuclear
Corporation. Document 1122011, Rev D, 27 Sep 2010. 3. Simon T. A. et al. (2010). Characterization of a multi-axis ion chamber array. Med. Phys. 37, 6101-6111.
Poster No. 25 (EPSM-1188) Wednesday Poster Session
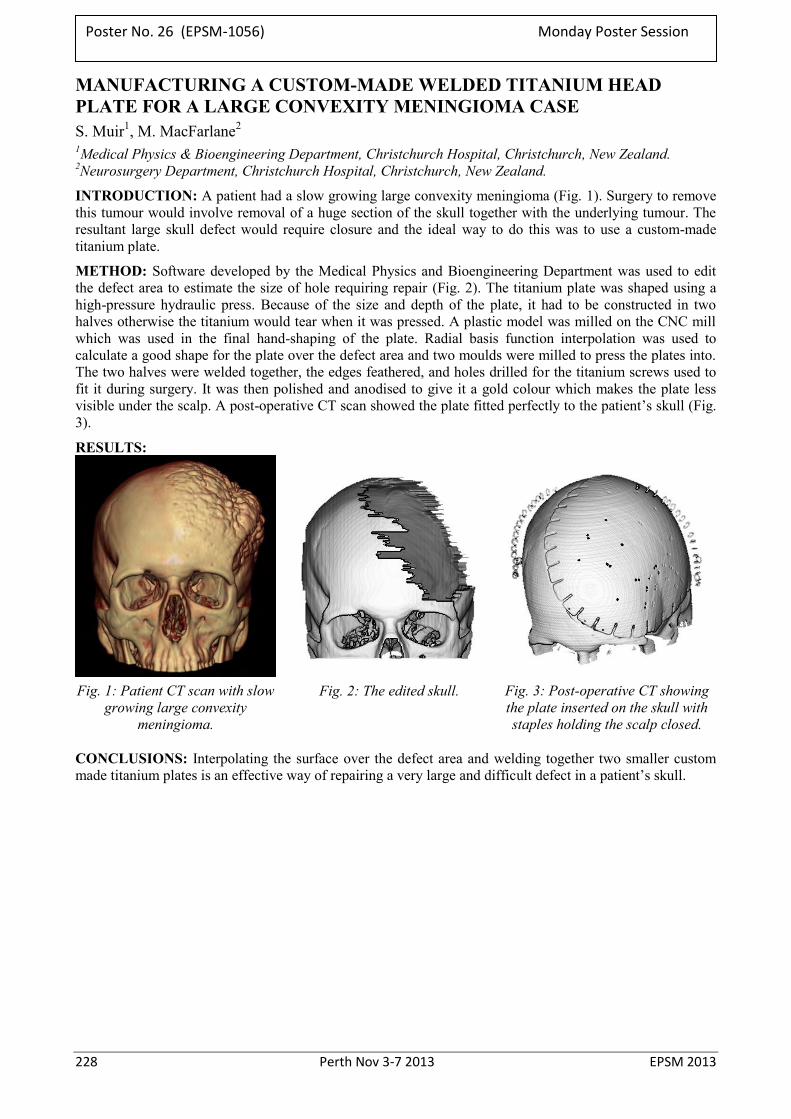
228 Perth Nov 3-7 2013 EPSM 2013
MANUFACTURING A CUSTOM-MADE WELDED TITANIUM HEAD PLATE FOR A LARGE CONVEXITY MENINGIOMA CASE S. Muir1, M. MacFarlane2 1Medical Physics & Bioengineering Department, Christchurch Hospital, Christchurch, New Zealand. 2Neurosurgery Department, Christchurch Hospital, Christchurch, New Zealand.
INTRODUCTION: A patient had a slow growing large convexity meningioma (Fig. 1). Surgery to remove this tumour would involve removal of a huge section of the skull together with the underlying tumour. The resultant large skull defect would require closure and the ideal way to do this was to use a custom-made titanium plate.
METHOD: Software developed by the Medical Physics and Bioengineering Department was used to edit the defect area to estimate the size of hole requiring repair (Fig. 2). The titanium plate was shaped using a high-pressure hydraulic press. Because of the size and depth of the plate, it had to be constructed in two halves otherwise the titanium would tear when it was pressed. A plastic model was milled on the CNC mill which was used in the final hand-shaping of the plate. Radial basis function interpolation was used to calculate a good shape for the plate over the defect area and two moulds were milled to press the plates into. The two halves were welded together, the edges feathered, and holes drilled for the titanium screws used to fit it during surgery. It was then polished and anodised to give it a gold colour which makes the plate less visible under the scalp. A post-operative CT scan showed the plate fitted perfectly to the patient’s skull (Fig. 3).
RESULTS:
Fig. 1: Patient CT scan with slow
growing large convexity meningioma.
Fig. 2: The edited skull. Fig. 3: Post-operative CT showing the plate inserted on the skull with staples holding the scalp closed.
CONCLUSIONS: Interpolating the surface over the defect area and welding together two smaller custom made titanium plates is an effective way of repairing a very large and difficult defect in a patient’s skull.
Poster No. 26 (EPSM-1056) Monday Poster Session
EPSM 2013 Perth Nov 3-7 2013 229
NEMA NU4 IMAGE QUALITY EVALUATION OF SEVERAL PET RADIOISOTOPES FOR UTILISATION IN PRECLINICAL IMAGING R. Nezich1,2, A. Reilhac3, D. Zahra3, R. Price1,2
1Radiopharmaceutical Production & Development (RAPID) Laboratory, Medical Technology and Physics, Sir Charles Gairdner Hospital, Perth, Western Australia.
2School of Physics, University of Western Australia, Perth, Western Australia. 3ANSTO Life Sciences, ANSTO, Lucas Heights, Menai NSW 2234, Australia.
INTRODUCTION: The Positron Emission Tomography (PET) isotopes F-18, C-11, Ga-68, I-124, Cu-64, Zr-89 and Ti-45 are currently being produced in Australia, with all of them except for I-124 produced in Perth at the Radiopharmaceutical Production & Development Laboratories, Sir Charles Gairdner Hospital. All have important actual or potential applications to routine clinical investigations or biomedical research. With the very recent (June 2013) introduction of small-animal microPET/CT scanning to WA (WAIMR Preclinical Cancer Imaging Facility), this palette of PET radioisotopes, with a broad range of half-lives (0.3 – 78 hours) will enable WA researchers to perform quantitative molecular imaging on a wide range of time-scales and with the whole gamut of tracers agents.
However, some of these isotopes have undesirable properties that may impact on image quality and the ability to accurately measure tracer uptake. Spatial resolution, contrast, detectability, and quantification accuracy are intrinsically limited by the positron energy, while noise and detection efficiency are influenced by the positron branching fraction and the abundance of single emissions. These degradations are particularly relevant to small-animal PET because the physical scale of biology (organs and tissues) under investigation is small compared to humans, and the administered activity is low. Hence, the capability of these radioisotopes to produce high-quality quantitative images for preclinical objectives needs to be investigated and compared.
The aim of the experiment is to evaluate and compare the image quality characteristics of the PET radioisotopes F-18, C-11, Ga-68, I-124, Cu-64, Zr-89 and Ti-45 using the NEMA NU4 image quality phantom. Since the image quality achieved in practice is also dependent on the specific PET instrumentation, these experiments will be performed with both the Siemens Inveon PET/CT (Lucas Heights, ANSTO) and the Bioscan BioPET/CT (WA, WAIMR) scanners.
METHODS: The image quality phantom described in the NEMA standard NU4-2008 will be used to assess multiple aspects of image quality when scanning under typical preclinical conditions. This includes the evaluation of partial volume effects (recovery coefficients), the accuracy of image correction procedures (spill-over ratios), and image noise.
PRELIMINARY RESULTS AND FUTURE WORK: Figure 1 shows the recovery coefficients of F-18, I-124, Cu-64 and Zr-89; obtained using the Siemens Inveon, using default acquisition parameters and reconstructed with the 2D filtered backprojection algorithm.
Future work will focus on scanning the remaining isotopes and repeating the experiment with the BioPET/CT scanner.
Fig. 1: Recovery coefficients of F-18, I-124, Cu-64 and Zr-89
Poster No. 27 (EPSM-1228) Wednesday Poster Session
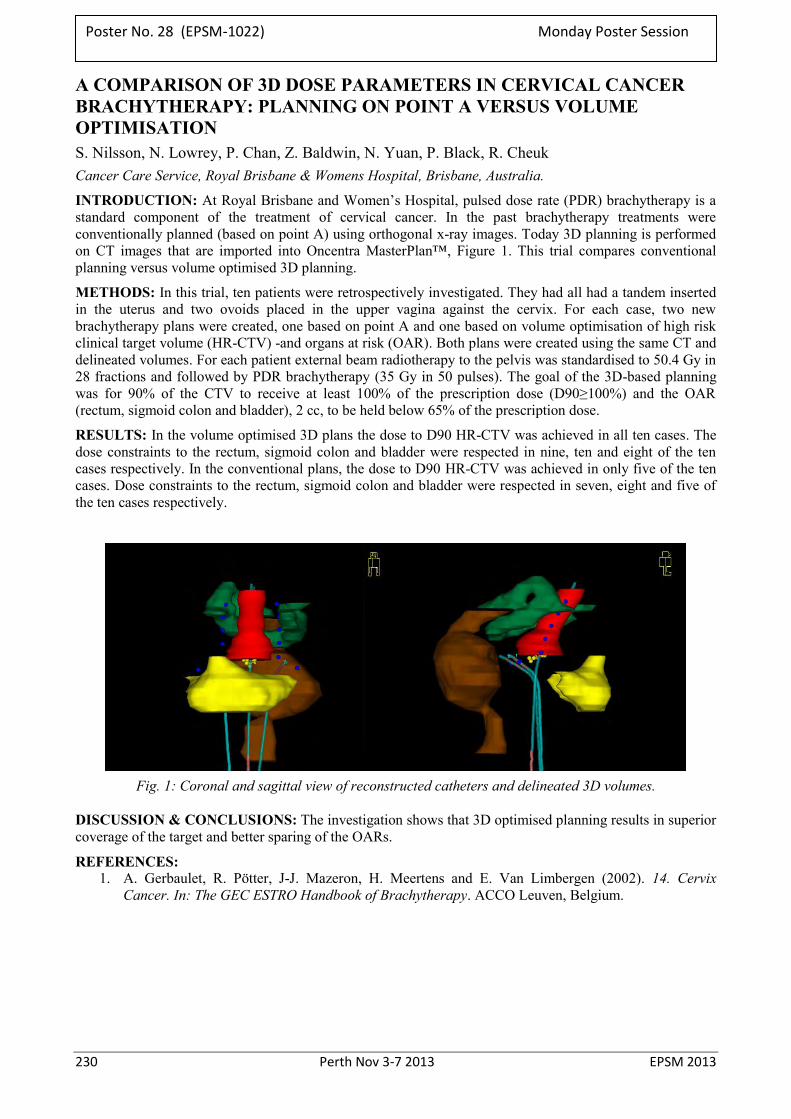
230 Perth Nov 3-7 2013 EPSM 2013
A COMPARISON OF 3D DOSE PARAMETERS IN CERVICAL CANCER BRACHYTHERAPY: PLANNING ON POINT A VERSUS VOLUME OPTIMISATION S. Nilsson, N. Lowrey, P. Chan, Z. Baldwin, N. Yuan, P. Black, R. Cheuk Cancer Care Service, Royal Brisbane & Womens Hospital, Brisbane, Australia.
INTRODUCTION: At Royal Brisbane and Women’s Hospital, pulsed dose rate (PDR) brachytherapy is a standard component of the treatment of cervical cancer. In the past brachytherapy treatments were conventionally planned (based on point A) using orthogonal x-ray images. Today 3D planning is performed on CT images that are imported into Oncentra MasterPlan™, Figure 1. This trial compares conventional planning versus volume optimised 3D planning.
METHODS: In this trial, ten patients were retrospectively investigated. They had all had a tandem inserted in the uterus and two ovoids placed in the upper vagina against the cervix. For each case, two new brachytherapy plans were created, one based on point A and one based on volume optimisation of high risk clinical target volume (HR-CTV) -and organs at risk (OAR). Both plans were created using the same CT and delineated volumes. For each patient external beam radiotherapy to the pelvis was standardised to 50.4 Gy in 28 fractions and followed by PDR brachytherapy (35 Gy in 50 pulses). The goal of the 3D-based planning was for 90% of the CTV to receive at least 100% of the prescription dose (D90≥100%) and the OAR (rectum, sigmoid colon and bladder), 2 cc, to be held below 65% of the prescription dose.
RESULTS: In the volume optimised 3D plans the dose to D90 HR-CTV was achieved in all ten cases. The dose constraints to the rectum, sigmoid colon and bladder were respected in nine, ten and eight of the ten cases respectively. In the conventional plans, the dose to D90 HR-CTV was achieved in only five of the ten cases. Dose constraints to the rectum, sigmoid colon and bladder were respected in seven, eight and five of the ten cases respectively.
Fig. 1: Coronal and sagittal view of reconstructed catheters and delineated 3D volumes.
DISCUSSION & CONCLUSIONS: The investigation shows that 3D optimised planning results in superior coverage of the target and better sparing of the OARs.
REFERENCES: 1. A. Gerbaulet, R. Pötter, J-J. Mazeron, H. Meertens and E. Van Limbergen (2002). 14. Cervix
Cancer. In: The GEC ESTRO Handbook of Brachytherapy. ACCO Leuven, Belgium.
Poster No. 28 (EPSM-1022) Monday Poster Session
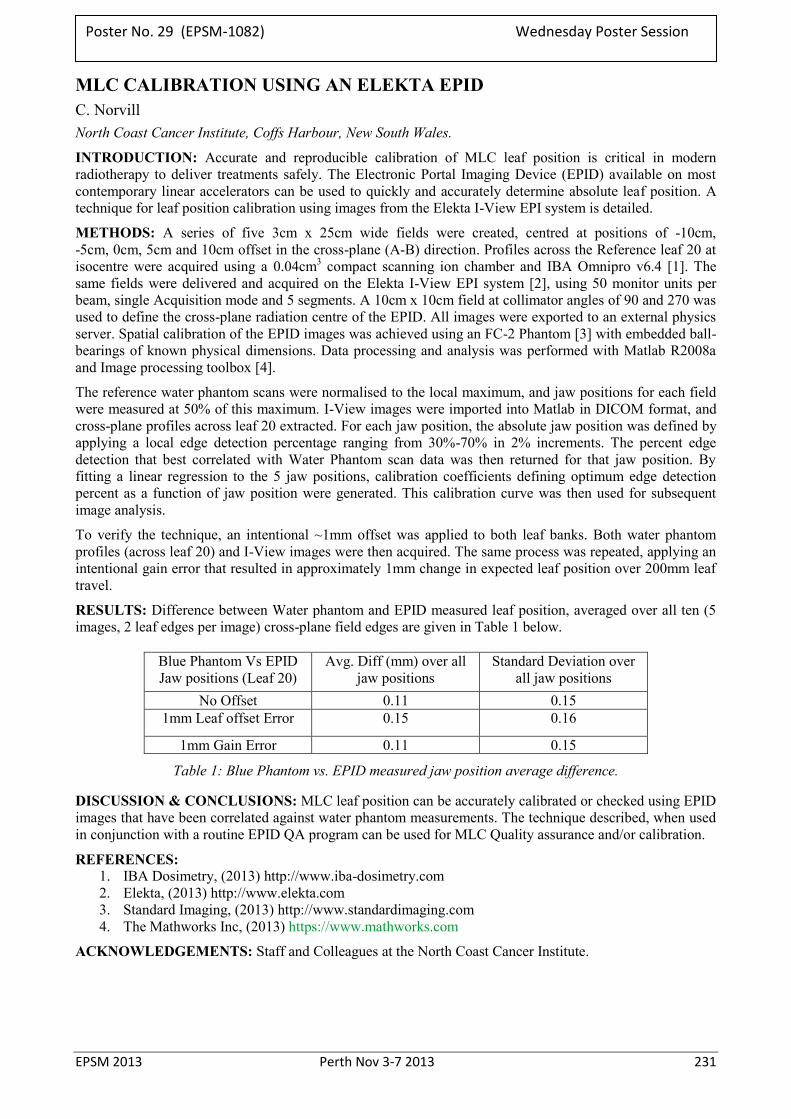
EPSM 2013 Perth Nov 3-7 2013 231
MLC CALIBRATION USING AN ELEKTA EPID C. Norvill North Coast Cancer Institute, Coffs Harbour, New South Wales.
INTRODUCTION: Accurate and reproducible calibration of MLC leaf position is critical in modern radiotherapy to deliver treatments safely. The Electronic Portal Imaging Device (EPID) available on most contemporary linear accelerators can be used to quickly and accurately determine absolute leaf position. A technique for leaf position calibration using images from the Elekta I-View EPI system is detailed.
METHODS: A series of five 3cm x 25cm wide fields were created, centred at positions of -10cm, -5cm, 0cm, 5cm and 10cm offset in the cross-plane (A-B) direction. Profiles across the Reference leaf 20 at isocentre were acquired using a 0.04cm3 compact scanning ion chamber and IBA Omnipro v6.4 [1]. The same fields were delivered and acquired on the Elekta I-View EPI system [2], using 50 monitor units per beam, single Acquisition mode and 5 segments. A 10cm x 10cm field at collimator angles of 90 and 270 was used to define the cross-plane radiation centre of the EPID. All images were exported to an external physics server. Spatial calibration of the EPID images was achieved using an FC-2 Phantom [3] with embedded ball-bearings of known physical dimensions. Data processing and analysis was performed with Matlab R2008a and Image processing toolbox [4].
The reference water phantom scans were normalised to the local maximum, and jaw positions for each field were measured at 50% of this maximum. I-View images were imported into Matlab in DICOM format, and cross-plane profiles across leaf 20 extracted. For each jaw position, the absolute jaw position was defined by applying a local edge detection percentage ranging from 30%-70% in 2% increments. The percent edge detection that best correlated with Water Phantom scan data was then returned for that jaw position. By fitting a linear regression to the 5 jaw positions, calibration coefficients defining optimum edge detection percent as a function of jaw position were generated. This calibration curve was then used for subsequent image analysis.
To verify the technique, an intentional ~1mm offset was applied to both leaf banks. Both water phantom profiles (across leaf 20) and I-View images were then acquired. The same process was repeated, applying an intentional gain error that resulted in approximately 1mm change in expected leaf position over 200mm leaf travel.
RESULTS: Difference between Water phantom and EPID measured leaf position, averaged over all ten (5 images, 2 leaf edges per image) cross-plane field edges are given in Table 1 below.
Blue Phantom Vs EPID Jaw positions (Leaf 20)
Avg. Diff (mm) over all jaw positions
Standard Deviation over all jaw positions
No Offset 0.11 0.15 1mm Leaf offset Error 0.15 0.16
1mm Gain Error 0.11 0.15
Table 1: Blue Phantom vs. EPID measured jaw position average difference.
DISCUSSION & CONCLUSIONS: MLC leaf position can be accurately calibrated or checked using EPID images that have been correlated against water phantom measurements. The technique described, when used in conjunction with a routine EPID QA program can be used for MLC Quality assurance and/or calibration.
REFERENCES: 1. IBA Dosimetry, (2013) http://www.iba-dosimetry.com 2. Elekta, (2013) http://www.elekta.com 3. Standard Imaging, (2013) http://www.standardimaging.com 4. The Mathworks Inc, (2013) https://www.mathworks.com
ACKNOWLEDGEMENTS: Staff and Colleagues at the North Coast Cancer Institute.
Poster No. 29 (EPSM-1082) Wednesday Poster Session
232 Perth Nov 3-7 2013 EPSM 2013
FIRST DECADE OF A STATE TEACHING-HOSPITAL-BASED PET RADIOPHARMACEUTICAL PRODUCTION & DEVELOPMENT FACILITY INCLUDING RADIOMETAL SOLID TARGETRY R.I. Price1,2 1Radiopharmaceutical Production & Development (RAPID) Laboratories, Medical Technology & Physics,
Sir Charles Gairdner Hospital, Perth, Western Australia. 2School of Physics, University of Western Australia, Perth, Western Australia.
INTRODUCTION: Perth, Australia is one of the world's most isolated cities. Conventional clinically-deployed PET isotopes must be synthesized and utilized locally; however this is not so for several PET radiometals. Following establishment of a sole-supplier State PET-radiopharmaceuticals service our group has seen growth from around 1760 patient-doses in 2003 to 8800 in 2012, serving 4 PET cameras (6 by mid 2013). As experienced elsewhere this is represented by 95% FDG; however 8 other radiolabels are available for the clinic, the most popular being 68Ga-octreotate and 11C-PiB.
CONTEXT: An 18/9 (proton/deuteron) MeV cyclotron plus radiopharmaceutical production laboratory was installed in Aug. 2003, without significant research capabilities (funding constraints). It has since run daily with a production record exceeding 98.5%; undergoing a major upgrade in mid-2012, converting to 18/18MeV (proton) dual-beam, plus doubling of beam-currents. This revised single unit will serve WA’s clinical PET needs for at least 4yr. Following establishment of routine service, publications by the group of the late Michael J. Welch, Washington University (plus a notable discussion with him at WTTC12, 2008) inspired our team that radiometal PET isotopes were strategically important – particularly since (at the time) no sources were readily available in Australia. Subsequent work exemplified the achievable with a cyclotron embedded in a sophisticated medical physics/engineering environment. Local development of solid-targetry engineering & chemistry has enabled quasi-routine production of 61Cu, 64Cu and 89Zr as validated products for fostering local & interstate preclinical research. Research utilizing novel radiopharmaceuticals is underway, including a first-in-human investigation using a radiometal PET labeled peptide. Collaborative opportunities (including recent commissioning of WA’s first microPET/SPECT/CT) have motivated development of adjunctive Departmental facilities for monoclonal antibody (mAb) radiolabeling, cell culture/imaging and tissue analysis.
The emerging field of ‘immuno-PET companion diagnostics’ is of particular focus, whereby a therapeutic mAb (as a tracer) is labeled with a (diagnostic) PET isotope, its dose biodistribution (plus adjunctive pharmacokinetics) determined, and then used to validate the subsequent use of the mAb (+/- coupled with a therapeutic radioisotope) in its therapeutic role.
CONCLUSION: In establishing a regional PET radiopharmaceuticals service with long term strategic objectives, many-fold increases in the palette and magnitude of services, plus R&D opportunities must be considered, given that the facility’s lifetime exceeds 25yr. Strong associations with physics/engineering expertise is as important as the obligatory ‘joined-at-the-hip’ relationship with clinical imaging services – for advancing both routine and research objectives.
Poster No. 30 (EPSM-1233) Monday Poster Session
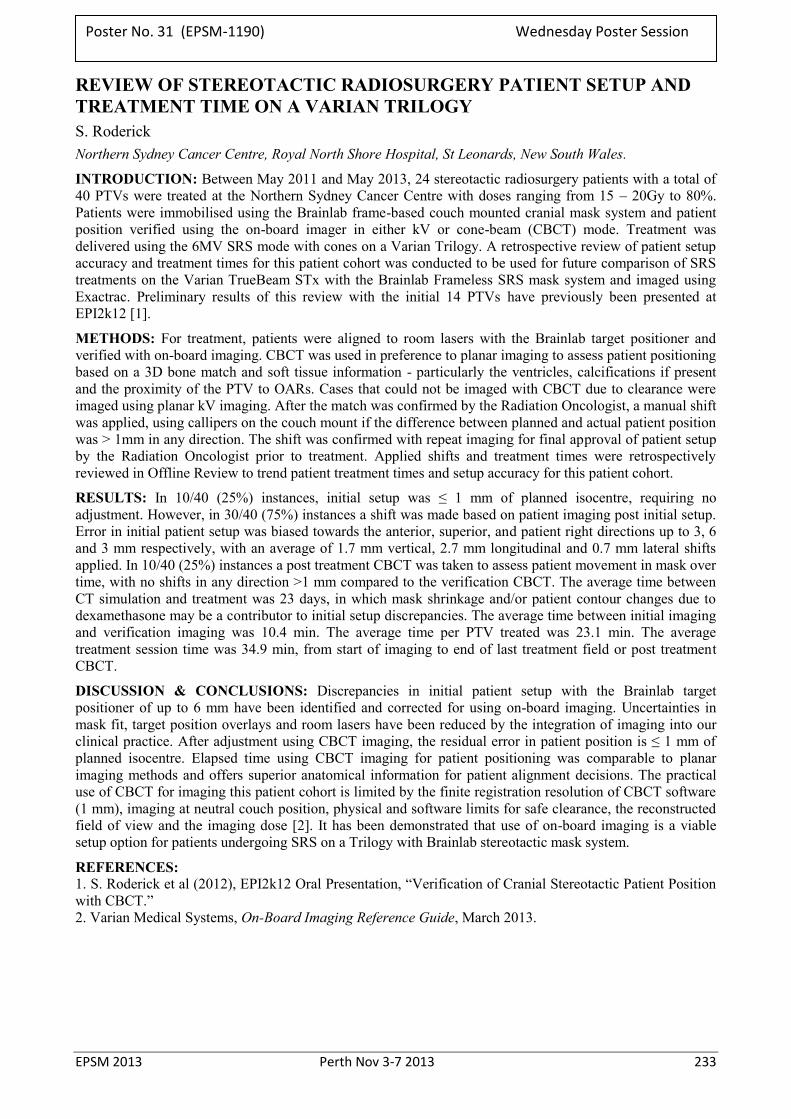
EPSM 2013 Perth Nov 3-7 2013 233
REVIEW OF STEREOTACTIC RADIOSURGERY PATIENT SETUP AND TREATMENT TIME ON A VARIAN TRILOGY S. Roderick Northern Sydney Cancer Centre, Royal North Shore Hospital, St Leonards, New South Wales.
INTRODUCTION: Between May 2011 and May 2013, 24 stereotactic radiosurgery patients with a total of 40 PTVs were treated at the Northern Sydney Cancer Centre with doses ranging from 15 – 20Gy to 80%. Patients were immobilised using the Brainlab frame-based couch mounted cranial mask system and patient position verified using the on-board imager in either kV or cone-beam (CBCT) mode. Treatment was delivered using the 6MV SRS mode with cones on a Varian Trilogy. A retrospective review of patient setup accuracy and treatment times for this patient cohort was conducted to be used for future comparison of SRS treatments on the Varian TrueBeam STx with the Brainlab Frameless SRS mask system and imaged using Exactrac. Preliminary results of this review with the initial 14 PTVs have previously been presented at EPI2k12 [1].
METHODS: For treatment, patients were aligned to room lasers with the Brainlab target positioner and verified with on-board imaging. CBCT was used in preference to planar imaging to assess patient positioning based on a 3D bone match and soft tissue information - particularly the ventricles, calcifications if present and the proximity of the PTV to OARs. Cases that could not be imaged with CBCT due to clearance were imaged using planar kV imaging. After the match was confirmed by the Radiation Oncologist, a manual shift was applied, using callipers on the couch mount if the difference between planned and actual patient position was > 1mm in any direction. The shift was confirmed with repeat imaging for final approval of patient setup by the Radiation Oncologist prior to treatment. Applied shifts and treatment times were retrospectively reviewed in Offline Review to trend patient treatment times and setup accuracy for this patient cohort.
RESULTS: In 10/40 (25%) instances, initial setup was ≤ 1 mm of planned isocentre, requiring no adjustment. However, in 30/40 (75%) instances a shift was made based on patient imaging post initial setup. Error in initial patient setup was biased towards the anterior, superior, and patient right directions up to 3, 6 and 3 mm respectively, with an average of 1.7 mm vertical, 2.7 mm longitudinal and 0.7 mm lateral shifts applied. In 10/40 (25%) instances a post treatment CBCT was taken to assess patient movement in mask over time, with no shifts in any direction >1 mm compared to the verification CBCT. The average time between CT simulation and treatment was 23 days, in which mask shrinkage and/or patient contour changes due to dexamethasone may be a contributor to initial setup discrepancies. The average time between initial imaging and verification imaging was 10.4 min. The average time per PTV treated was 23.1 min. The average treatment session time was 34.9 min, from start of imaging to end of last treatment field or post treatment CBCT.
DISCUSSION & CONCLUSIONS: Discrepancies in initial patient setup with the Brainlab target positioner of up to 6 mm have been identified and corrected for using on-board imaging. Uncertainties in mask fit, target position overlays and room lasers have been reduced by the integration of imaging into our clinical practice. After adjustment using CBCT imaging, the residual error in patient position is ≤ 1 mm of planned isocentre. Elapsed time using CBCT imaging for patient positioning was comparable to planar imaging methods and offers superior anatomical information for patient alignment decisions. The practical use of CBCT for imaging this patient cohort is limited by the finite registration resolution of CBCT software (1 mm), imaging at neutral couch position, physical and software limits for safe clearance, the reconstructed field of view and the imaging dose [2]. It has been demonstrated that use of on-board imaging is a viable setup option for patients undergoing SRS on a Trilogy with Brainlab stereotactic mask system.
REFERENCES: 1. S. Roderick et al (2012), EPI2k12 Oral Presentation, “Verification of Cranial Stereotactic Patient Position with CBCT.” 2. Varian Medical Systems, On-Board Imaging Reference Guide, March 2013.
Poster No. 31 (EPSM-1190) Wednesday Poster Session
234 Perth Nov 3-7 2013 EPSM 2013
ESTIMATION OF THYROID ACTIVITY AFTER ACCIDENTAL EXPOSURE TO I-131 T. Rourke1 E. Westcott1, B. Gault1 A. Culverson2 1 Medical Technology and Physics, Sir Charles Gairdner Hospital, Perth, Western Australia. 2 Nuclear Medicine Department, Sir Charles Gairdner Hospital, Perth, Western Australia.
INTRODUCTION: Following an incident involving exposure to an unknown amount of I-131 radioisotope in liquid iodide form, the activity retained the thyroid was measured using two methods. The activity data were acquired over the following weeks to assist in a dosimetry assessment.
METHODS: An image was taken on the day following the incident with a Siemens Symbia gamma camera, using the standard patient set up and a standard source. The activity in the thyroid was estimated from the thyroid region count statistics and the standard source region count statistics in the image data. The other method of estimating the activity in the thyroid was using an external Thermo Electron Corporation NaI scintillation probe (44B Type MS3088 probe and Mini 900 Ratemeter Type MFG017 counter). The activity was calculated from calibration data previously obtained using a Biodex Medical Thyroid Uptake Neck Phantom and geometrically identical, serial dilutions of I-131 from 0.112 kBq–288 kBq. [1]
RESULTS: The thyroid activity estimated from the image was 11 kBq, which agrees with the estimated activity of 8±3 kBq from the scintillation counter measurements. Additionally, subsequent thyroid measurements with the scintillation counter showed the activity in the thyroid decayed over several weeks, with a half life of 7.8 days, which is close to the effective half life of 7.3 days of I-131 (8.0 day physical half life and 80 day thyroid discharge half life [2]).
DISCUSSION & CONCLUSIONS: In the event of an incident involving I-131, a suitably calibrated NaI scintillation counter could give a thyroid activity estimate comparable to that obtained from imaging with a gamma camera, quickly and conveniently, even at low activities of <1 kBq [1]. Scintillation probes have been widely used for this reason in the past, though not recently due to gamma camera availability. Having a calibrated probe onsite where I-131 is used could be useful in the event of an incident, both for initial measurements and over following days or weeks, if necessary.
REFERENCES: 1. D. Ho, K. Soukos & H. Y. Yong (2010) Determination of I-131 Internal Exposure in Medical Physicists,
3rd Year Biophysics Project Poster, University of WA, Perth. 2. International Commission on Radiological Protection (1989) ICRP Publication 53: Radiation Dose to
Patients from Radiopharmaceuticals, Pergamon, Oxford.
ACKNOWLEDGEMENTS: The authors gratefully acknowledge the previous work done by 2010 UWA 3rd Year Biophysics students Diwei Ho, Karina Soukos and Hooi Yee Yong.
Poster No. 32 (EPSM-1232) Monday Poster Session
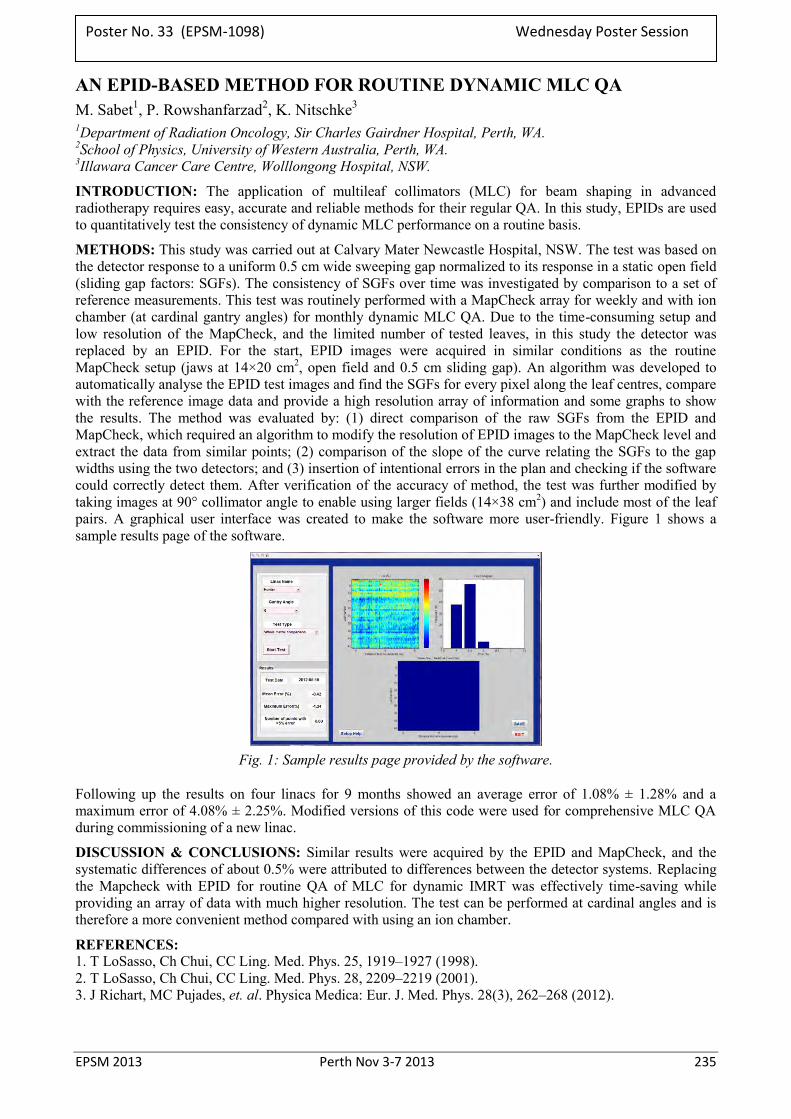
EPSM 2013 Perth Nov 3-7 2013 235
AN EPID-BASED METHOD FOR ROUTINE DYNAMIC MLC QA M. Sabet1, P. Rowshanfarzad2, K. Nitschke3 1Department of Radiation Oncology, Sir Charles Gairdner Hospital, Perth, WA. 2School of Physics, University of Western Australia, Perth, WA. 3Illawara Cancer Care Centre, Wolllongong Hospital, NSW.
INTRODUCTION: The application of multileaf collimators (MLC) for beam shaping in advanced radiotherapy requires easy, accurate and reliable methods for their regular QA. In this study, EPIDs are used to quantitatively test the consistency of dynamic MLC performance on a routine basis.
METHODS: This study was carried out at Calvary Mater Newcastle Hospital, NSW. The test was based on the detector response to a uniform 0.5 cm wide sweeping gap normalized to its response in a static open field (sliding gap factors: SGFs). The consistency of SGFs over time was investigated by comparison to a set of reference measurements. This test was routinely performed with a MapCheck array for weekly and with ion chamber (at cardinal gantry angles) for monthly dynamic MLC QA. Due to the time-consuming setup and low resolution of the MapCheck, and the limited number of tested leaves, in this study the detector was replaced by an EPID. For the start, EPID images were acquired in similar conditions as the routine MapCheck setup (jaws at 14×20 cm2, open field and 0.5 cm sliding gap). An algorithm was developed to automatically analyse the EPID test images and find the SGFs for every pixel along the leaf centres, compare with the reference image data and provide a high resolution array of information and some graphs to show the results. The method was evaluated by: (1) direct comparison of the raw SGFs from the EPID and MapCheck, which required an algorithm to modify the resolution of EPID images to the MapCheck level and extract the data from similar points; (2) comparison of the slope of the curve relating the SGFs to the gap widths using the two detectors; and (3) insertion of intentional errors in the plan and checking if the software could correctly detect them. After verification of the accuracy of method, the test was further modified by taking images at 90° collimator angle to enable using larger fields (14×38 cm2) and include most of the leaf pairs. A graphical user interface was created to make the software more user-friendly. Figure 1 shows a sample results page of the software.
Fig. 1: Sample results page provided by the software.
Following up the results on four linacs for 9 months showed an average error of 1.08% ± 1.28% and a maximum error of 4.08% ± 2.25%. Modified versions of this code were used for comprehensive MLC QA during commissioning of a new linac.
DISCUSSION & CONCLUSIONS: Similar results were acquired by the EPID and MapCheck, and the systematic differences of about 0.5% were attributed to differences between the detector systems. Replacing the Mapcheck with EPID for routine QA of MLC for dynamic IMRT was effectively time-saving while providing an array of data with much higher resolution. The test can be performed at cardinal angles and is therefore a more convenient method compared with using an ion chamber.
REFERENCES: 1. T LoSasso, Ch Chui, CC Ling. Med. Phys. 25, 1919–1927 (1998). 2. T LoSasso, Ch Chui, CC Ling. Med. Phys. 28, 2209–2219 (2001). 3. J Richart, MC Pujades, et. al. Physica Medica: Eur. J. Med. Phys. 28(3), 262–268 (2012).
Poster No. 33 (EPSM-1098) Wednesday Poster Session
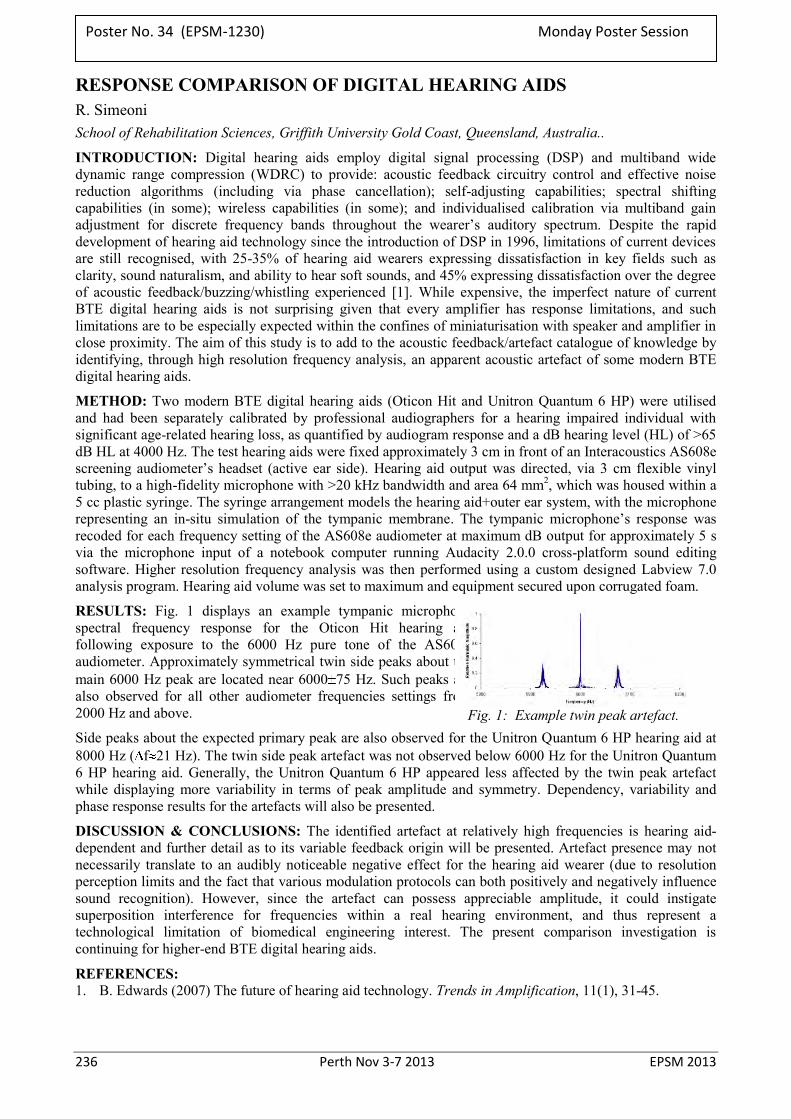
236 Perth Nov 3-7 2013 EPSM 2013
RESPONSE COMPARISON OF DIGITAL HEARING AIDS R. Simeoni School of Rehabilitation Sciences, Griffith University Gold Coast, Queensland, Australia..
INTRODUCTION: Digital hearing aids employ digital signal processing (DSP) and multiband wide dynamic range compression (WDRC) to provide: acoustic feedback circuitry control and effective noise reduction algorithms (including via phase cancellation); self-adjusting capabilities; spectral shifting capabilities (in some); wireless capabilities (in some); and individualised calibration via multiband gain adjustment for discrete frequency bands throughout the wearer’s auditory spectrum. Despite the rapid development of hearing aid technology since the introduction of DSP in 1996, limitations of current devices are still recognised, with 25-35% of hearing aid wearers expressing dissatisfaction in key fields such as clarity, sound naturalism, and ability to hear soft sounds, and 45% expressing dissatisfaction over the degree of acoustic feedback/buzzing/whistling experienced [1]. While expensive, the imperfect nature of current BTE digital hearing aids is not surprising given that every amplifier has response limitations, and such limitations are to be especially expected within the confines of miniaturisation with speaker and amplifier in close proximity. The aim of this study is to add to the acoustic feedback/artefact catalogue of knowledge by identifying, through high resolution frequency analysis, an apparent acoustic artefact of some modern BTE digital hearing aids.
METHOD: Two modern BTE digital hearing aids (Oticon Hit and Unitron Quantum 6 HP) were utilised and had been separately calibrated by professional audiographers for a hearing impaired individual with significant age-related hearing loss, as quantified by audiogram response and a dB hearing level (HL) of >65 dB HL at 4000 Hz. The test hearing aids were fixed approximately 3 cm in front of an Interacoustics AS608e screening audiometer’s headset (active ear side). Hearing aid output was directed, via 3 cm flexible vinyl tubing, to a high-fidelity microphone with >20 kHz bandwidth and area 64 mm2, which was housed within a 5 cc plastic syringe. The syringe arrangement models the hearing aid+outer ear system, with the microphone representing an in-situ simulation of the tympanic membrane. The tympanic microphone’s response was recoded for each frequency setting of the AS608e audiometer at maximum dB output for approximately 5 s via the microphone input of a notebook computer running Audacity 2.0.0 cross-platform sound editing software. Higher resolution frequency analysis was then performed using a custom designed Labview 7.0 analysis program. Hearing aid volume was set to maximum and equipment secured upon corrugated foam.
RESULTS: Fig. 1 displays an example tympanic microphone spectral frequency response for the Oticon Hit hearing aid following exposure to the 6000 Hz pure tone of the AS608e audiometer. Approximately symmetrical twin side peaks about the main 6000 Hz peak are located near 6000 75 Hz. Such peaks are also observed for all other audiometer frequencies settings from 2000 Hz and above.
Side peaks about the expected primary peak are also observed for the Unitron Quantum 6 HP hearing aid at 8000 Hz ( f 21 Hz). The twin side peak artefact was not observed below 6000 Hz for the Unitron Quantum 6 HP hearing aid. Generally, the Unitron Quantum 6 HP appeared less affected by the twin peak artefact while displaying more variability in terms of peak amplitude and symmetry. Dependency, variability and phase response results for the artefacts will also be presented.
DISCUSSION & CONCLUSIONS: The identified artefact at relatively high frequencies is hearing aid-dependent and further detail as to its variable feedback origin will be presented. Artefact presence may not necessarily translate to an audibly noticeable negative effect for the hearing aid wearer (due to resolution perception limits and the fact that various modulation protocols can both positively and negatively influence sound recognition). However, since the artefact can possess appreciable amplitude, it could instigate superposition interference for frequencies within a real hearing environment, and thus represent a technological limitation of biomedical engineering interest. The present comparison investigation is continuing for higher-end BTE digital hearing aids.
REFERENCES: 1. B. Edwards (2007) The future of hearing aid technology. Trends in Amplification, 11(1), 31-45.
Fig. 1: Example twin peak artefact.
Poster No. 34 (EPSM-1230) Monday Poster Session
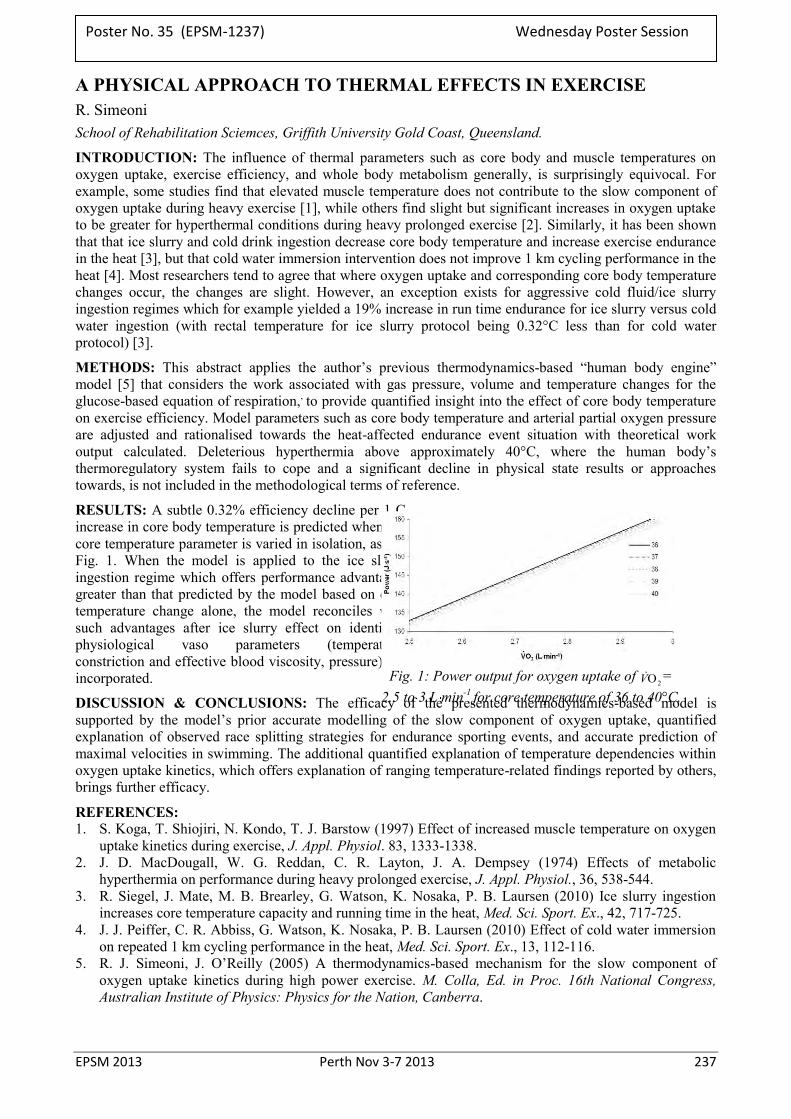
EPSM 2013 Perth Nov 3-7 2013 237
A PHYSICAL APPROACH TO THERMAL EFFECTS IN EXERCISE R. Simeoni School of Rehabilitation Sciemces, Griffith University Gold Coast, Queensland.
INTRODUCTION: The influence of thermal parameters such as core body and muscle temperatures on oxygen uptake, exercise efficiency, and whole body metabolism generally, is surprisingly equivocal. For example, some studies find that elevated muscle temperature does not contribute to the slow component of oxygen uptake during heavy exercise [1], while others find slight but significant increases in oxygen uptake to be greater for hyperthermal conditions during heavy prolonged exercise [2]. Similarly, it has been shown that that ice slurry and cold drink ingestion decrease core body temperature and increase exercise endurance in the heat [3], but that cold water immersion intervention does not improve 1 km cycling performance in the heat [4]. Most researchers tend to agree that where oxygen uptake and corresponding core body temperature changes occur, the changes are slight. However, an exception exists for aggressive cold fluid/ice slurry ingestion regimes which for example yielded a 19% increase in run time endurance for ice slurry versus cold water ingestion (with rectal temperature for ice slurry protocol being 0.32°C less than for cold water protocol) [3].
METHODS: This abstract applies the author’s previous thermodynamics-based “human body engine” model [5] that considers the work associated with gas pressure, volume and temperature changes for the glucose-based equation of respiration,, to provide quantified insight into the effect of core body temperature on exercise efficiency. Model parameters such as core body temperature and arterial partial oxygen pressure are adjusted and rationalised towards the heat-affected endurance event situation with theoretical work output calculated. Deleterious hyperthermia above approximately 40°C, where the human body’s thermoregulatory system fails to cope and a significant decline in physical state results or approaches towards, is not included in the methodological terms of reference.
RESULTS: A subtle 0.32% efficiency decline per 1 C increase in core body temperature is predicted when the core temperature parameter is varied in isolation, as per Fig. 1. When the model is applied to the ice slurry ingestion regime which offers performance advantages greater than that predicted by the model based on core temperature change alone, the model reconciles with such advantages after ice slurry effect on identified physiological vaso parameters (temperature, constriction and effective blood viscosity, pressure) are incorporated.
DISCUSSION & CONCLUSIONS: The efficacy of the presented thermodynamics-based model is supported by the model’s prior accurate modelling of the slow component of oxygen uptake, quantified explanation of observed race splitting strategies for endurance sporting events, and accurate prediction of maximal velocities in swimming. The additional quantified explanation of temperature dependencies within oxygen uptake kinetics, which offers explanation of ranging temperature-related findings reported by others, brings further efficacy.
REFERENCES: 1. S. Koga, T. Shiojiri, N. Kondo, T. J. Barstow (1997) Effect of increased muscle temperature on oxygen
uptake kinetics during exercise, J. Appl. Physiol. 83, 1333-1338. 2. J. D. MacDougall, W. G. Reddan, C. R. Layton, J. A. Dempsey (1974) Effects of metabolic
hyperthermia on performance during heavy prolonged exercise, J. Appl. Physiol., 36, 538-544. 3. R. Siegel, J. Mate, M. B. Brearley, G. Watson, K. Nosaka, P. B. Laursen (2010) Ice slurry ingestion
increases core temperature capacity and running time in the heat, Med. Sci. Sport. Ex., 42, 717-725. 4. J. J. Peiffer, C. R. Abbiss, G. Watson, K. Nosaka, P. B. Laursen (2010) Effect of cold water immersion
on repeated 1 km cycling performance in the heat, Med. Sci. Sport. Ex., 13, 112-116. 5. R. J. Simeoni, J. O’Reilly (2005) A thermodynamics-based mechanism for the slow component of
oxygen uptake kinetics during high power exercise. M. Colla, Ed. in Proc. 16th National Congress, Australian Institute of Physics: Physics for the Nation, Canberra.
Fig. 1: Power output for oxygen uptake of 2OV =
2.5 to 3 L min-1 for core temperature of 36 to 40°C.
Poster No. 35 (EPSM-1237) Wednesday Poster Session
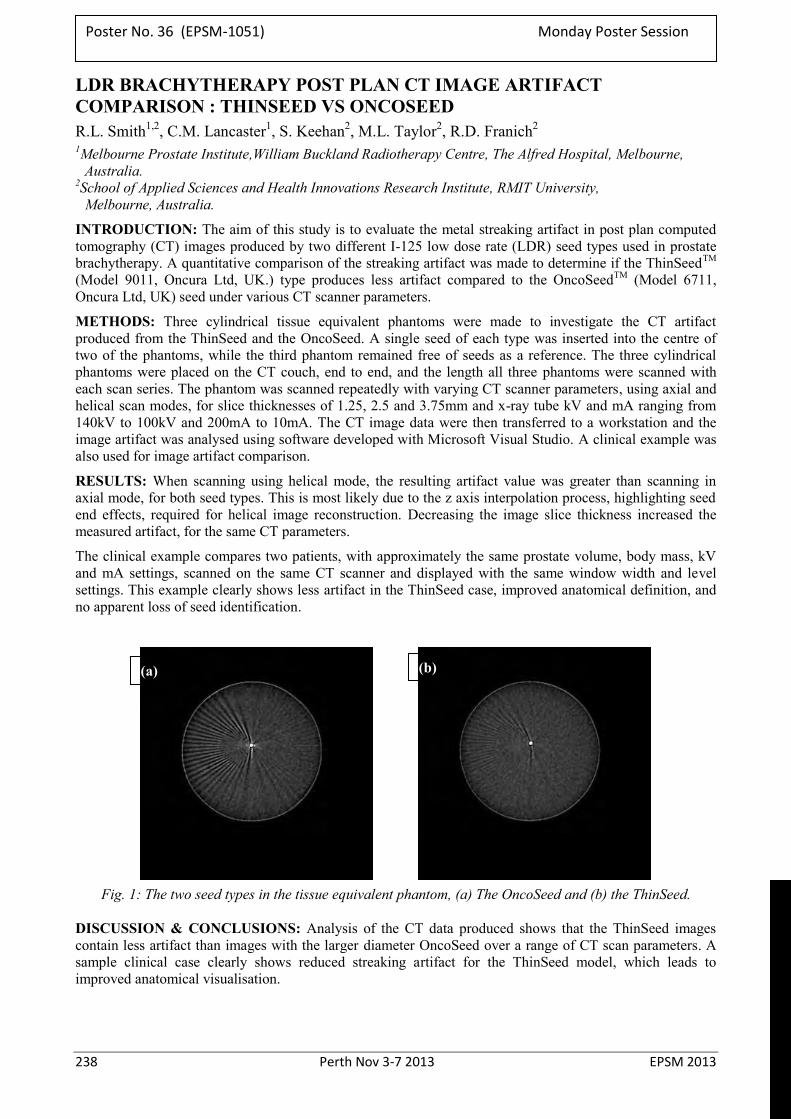
238 Perth Nov 3-7 2013 EPSM 2013
LDR BRACHYTHERAPY POST PLAN CT IMAGE ARTIFACT COMPARISON : THINSEED VS ONCOSEED R.L. Smith1,2, C.M. Lancaster1, S. Keehan2, M.L. Taylor2, R.D. Franich2 1Melbourne Prostate Institute,William Buckland Radiotherapy Centre, The Alfred Hospital, Melbourne,
Australia. 2School of Applied Sciences and Health Innovations Research Institute, RMIT University,
Melbourne, Australia.
INTRODUCTION: The aim of this study is to evaluate the metal streaking artifact in post plan computed tomography (CT) images produced by two different I-125 low dose rate (LDR) seed types used in prostate brachytherapy. A quantitative comparison of the streaking artifact was made to determine if the ThinSeedTM (Model 9011, Oncura Ltd, UK.) type produces less artifact compared to the OncoSeedTM (Model 6711, Oncura Ltd, UK) seed under various CT scanner parameters.
METHODS: Three cylindrical tissue equivalent phantoms were made to investigate the CT artifact produced from the ThinSeed and the OncoSeed. A single seed of each type was inserted into the centre of two of the phantoms, while the third phantom remained free of seeds as a reference. The three cylindrical phantoms were placed on the CT couch, end to end, and the length all three phantoms were scanned with each scan series. The phantom was scanned repeatedly with varying CT scanner parameters, using axial and helical scan modes, for slice thicknesses of 1.25, 2.5 and 3.75mm and x-ray tube kV and mA ranging from 140kV to 100kV and 200mA to 10mA. The CT image data were then transferred to a workstation and the image artifact was analysed using software developed with Microsoft Visual Studio. A clinical example was also used for image artifact comparison.
RESULTS: When scanning using helical mode, the resulting artifact value was greater than scanning in axial mode, for both seed types. This is most likely due to the z axis interpolation process, highlighting seed end effects, required for helical image reconstruction. Decreasing the image slice thickness increased the measured artifact, for the same CT parameters.
The clinical example compares two patients, with approximately the same prostate volume, body mass, kV and mA settings, scanned on the same CT scanner and displayed with the same window width and level settings. This example clearly shows less artifact in the ThinSeed case, improved anatomical definition, and no apparent loss of seed identification.
Fig. 1: The two seed types in the tissue equivalent phantom, (a) The OncoSeed and (b) the ThinSeed.
DISCUSSION & CONCLUSIONS: Analysis of the CT data produced shows that the ThinSeed images contain less artifact than images with the larger diameter OncoSeed over a range of CT scan parameters. A sample clinical case clearly shows reduced streaking artifact for the ThinSeed model, which leads to improved anatomical visualisation.
(a) (b)
Poster No. 36 (EPSM-1051) Monday Poster Session
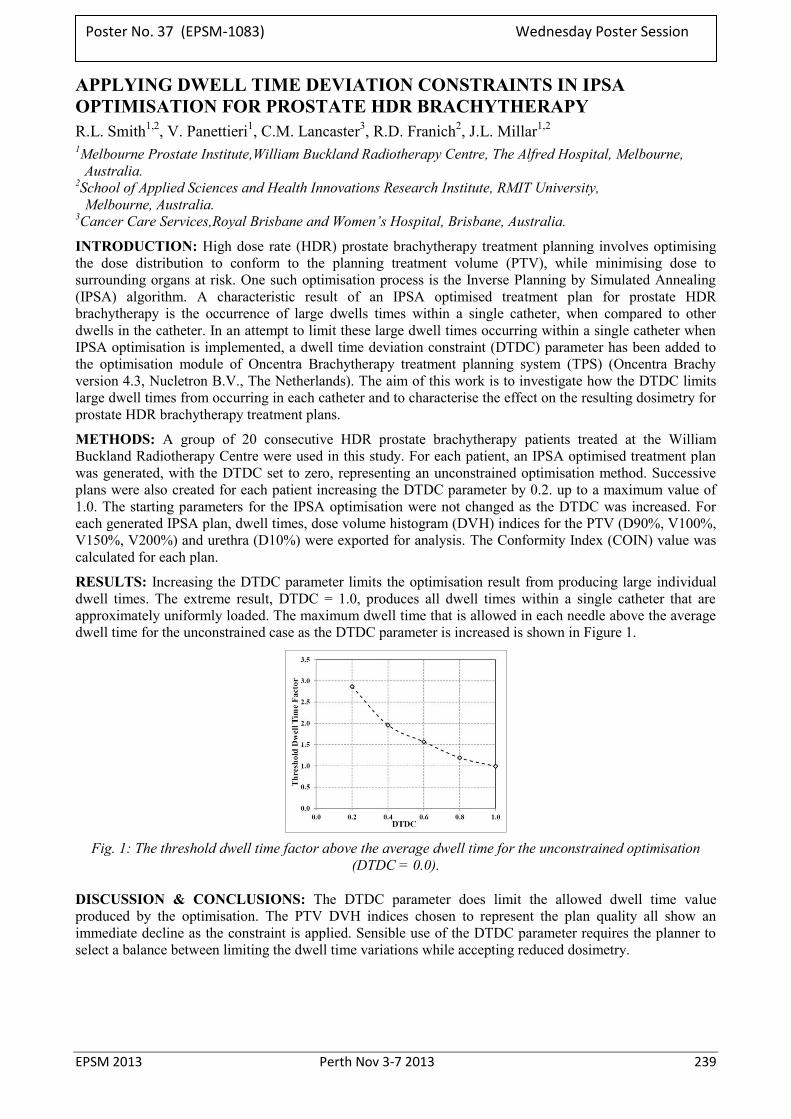
EPSM 2013 Perth Nov 3-7 2013 239
APPLYING DWELL TIME DEVIATION CONSTRAINTS IN IPSA OPTIMISATION FOR PROSTATE HDR BRACHYTHERAPY R.L. Smith1,2, V. Panettieri1, C.M. Lancaster3, R.D. Franich2, J.L. Millar1,2 1Melbourne Prostate Institute,William Buckland Radiotherapy Centre, The Alfred Hospital, Melbourne,
Australia. 2School of Applied Sciences and Health Innovations Research Institute, RMIT University,
Melbourne, Australia. 3Cancer Care Services,Royal Brisbane and Women’s Hospital, Brisbane, Australia.
INTRODUCTION: High dose rate (HDR) prostate brachytherapy treatment planning involves optimising the dose distribution to conform to the planning treatment volume (PTV), while minimising dose to surrounding organs at risk. One such optimisation process is the Inverse Planning by Simulated Annealing (IPSA) algorithm. A characteristic result of an IPSA optimised treatment plan for prostate HDR brachytherapy is the occurrence of large dwells times within a single catheter, when compared to other dwells in the catheter. In an attempt to limit these large dwell times occurring within a single catheter when IPSA optimisation is implemented, a dwell time deviation constraint (DTDC) parameter has been added to the optimisation module of Oncentra Brachytherapy treatment planning system (TPS) (Oncentra Brachy version 4.3, Nucletron B.V., The Netherlands). The aim of this work is to investigate how the DTDC limits large dwell times from occurring in each catheter and to characterise the effect on the resulting dosimetry for prostate HDR brachytherapy treatment plans.
METHODS: A group of 20 consecutive HDR prostate brachytherapy patients treated at the William Buckland Radiotherapy Centre were used in this study. For each patient, an IPSA optimised treatment plan was generated, with the DTDC set to zero, representing an unconstrained optimisation method. Successive plans were also created for each patient increasing the DTDC parameter by 0.2. up to a maximum value of 1.0. The starting parameters for the IPSA optimisation were not changed as the DTDC was increased. For each generated IPSA plan, dwell times, dose volume histogram (DVH) indices for the PTV (D90%, V100%, V150%, V200%) and urethra (D10%) were exported for analysis. The Conformity Index (COIN) value was calculated for each plan.
RESULTS: Increasing the DTDC parameter limits the optimisation result from producing large individual dwell times. The extreme result, DTDC = 1.0, produces all dwell times within a single catheter that are approximately uniformly loaded. The maximum dwell time that is allowed in each needle above the average dwell time for the unconstrained case as the DTDC parameter is increased is shown in Figure 1.
Fig. 1: The threshold dwell time factor above the average dwell time for the unconstrained optimisation
(DTDC = 0.0).
DISCUSSION & CONCLUSIONS: The DTDC parameter does limit the allowed dwell time value produced by the optimisation. The PTV DVH indices chosen to represent the plan quality all show an immediate decline as the constraint is applied. Sensible use of the DTDC parameter requires the planner to select a balance between limiting the dwell time variations while accepting reduced dosimetry.
Poster No. 37 (EPSM-1083) Wednesday Poster Session
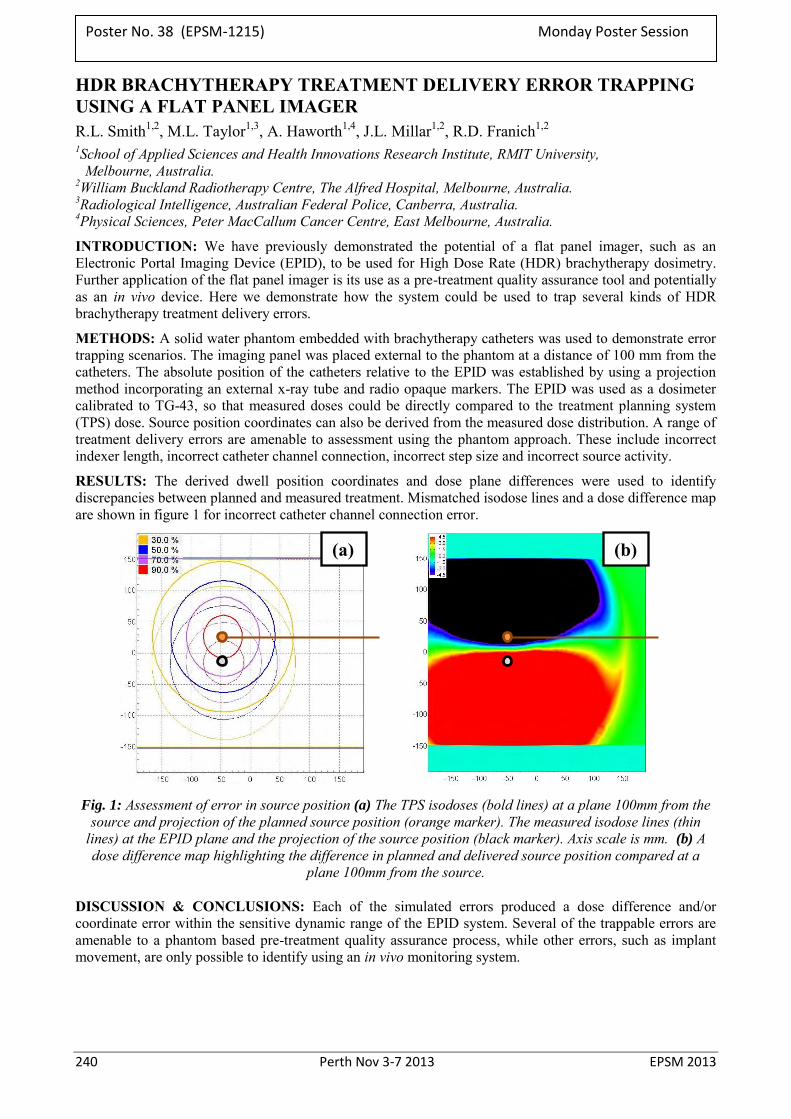
240 Perth Nov 3-7 2013 EPSM 2013
HDR BRACHYTHERAPY TREATMENT DELIVERY ERROR TRAPPING USING A FLAT PANEL IMAGER R.L. Smith1,2, M.L. Taylor1,3, A. Haworth1,4, J.L. Millar1,2, R.D. Franich1,2 1School of Applied Sciences and Health Innovations Research Institute, RMIT University,
Melbourne, Australia. 2William Buckland Radiotherapy Centre, The Alfred Hospital, Melbourne, Australia. 3Radiological Intelligence, Australian Federal Police, Canberra, Australia. 4Physical Sciences, Peter MacCallum Cancer Centre, East Melbourne, Australia.
INTRODUCTION: We have previously demonstrated the potential of a flat panel imager, such as an Electronic Portal Imaging Device (EPID), to be used for High Dose Rate (HDR) brachytherapy dosimetry. Further application of the flat panel imager is its use as a pre-treatment quality assurance tool and potentially as an in vivo device. Here we demonstrate how the system could be used to trap several kinds of HDR brachytherapy treatment delivery errors.
METHODS: A solid water phantom embedded with brachytherapy catheters was used to demonstrate error trapping scenarios. The imaging panel was placed external to the phantom at a distance of 100 mm from the catheters. The absolute position of the catheters relative to the EPID was established by using a projection method incorporating an external x-ray tube and radio opaque markers. The EPID was used as a dosimeter calibrated to TG-43, so that measured doses could be directly compared to the treatment planning system (TPS) dose. Source position coordinates can also be derived from the measured dose distribution. A range of treatment delivery errors are amenable to assessment using the phantom approach. These include incorrect indexer length, incorrect catheter channel connection, incorrect step size and incorrect source activity.
RESULTS: The derived dwell position coordinates and dose plane differences were used to identify discrepancies between planned and measured treatment. Mismatched isodose lines and a dose difference map are shown in figure 1 for incorrect catheter channel connection error.
Fig. 1: Assessment of error in source position (a) The TPS isodoses (bold lines) at a plane 100mm from the
source and projection of the planned source position (orange marker). The measured isodose lines (thin lines) at the EPID plane and the projection of the source position (black marker). Axis scale is mm. (b) A dose difference map highlighting the difference in planned and delivered source position compared at a
plane 100mm from the source.
DISCUSSION & CONCLUSIONS: Each of the simulated errors produced a dose difference and/or coordinate error within the sensitive dynamic range of the EPID system. Several of the trappable errors are amenable to a phantom based pre-treatment quality assurance process, while other errors, such as implant movement, are only possible to identify using an in vivo monitoring system.
(a) (b)
Poster No. 38 (EPSM-1215) Monday Poster Session
EPSM 2013 Perth Nov 3-7 2013 241
MR SIMULATOR COMMISSIONING FOR PELVIC RADIOTHERAPY TREATMENT PLANNING J. Sun1,2,3, J. Dowling3, P. Pichler2, J. Martin2, J. Arm2, J. Parker2, F. Menk1, P.B. Greer1,2 1University of Newcastle, Newcastle, New South Wales, Australia. 2Calvary Mater Newcastle, Newcastle, New South Wales, Australia. 3CSIRO Australian E-Health Centre, Brisbane, Queensland, Australia.
INTRODUCTION: In order to achieve MR-alone treatment planning, the patient geometry on the MR image needs to be comparable to the actual patient geometry during the treatment. Conventional MR scan protocols place the MR receiver coil directly on the patient body but this can deform the external body during the scan making the planning contour different from the actual treatment contour. The conventional table top of the MR scanner also has a soft cushion-insert which causes patient body deformation in the posterior direction. At the Calvary Mater Newcastle a Siemens Skyra 3T MR scanner was installed in 2011 with a laser bridge and CIVCO oncology package for MR-Simulation installed in May 2012. This includes a dedicated radiation therapy (RT) table-top and coil mounts. The coil mount holds the pelvic coil above the patient body so that the external contour deformation from the anterior direction can be eliminated. The hard table top is placed underneath the patient body to minimise deformation. However, the increased distance of the coil may adversely affect image quality. This study aims to determine the image quality, anatomical geometry and dosimetry effects of using these RT- dedicated devices.
METHODS: Three volunteers were scanned using the conventional setup (CS) as well as the RT-setup (RTS) using the CIVCO coil mount and table top. LFOV and SFOV turbo spin echo T2 images were acquired for each setup. The image quality of the two setups was compared in terms of signal, SNR and CNR found from regions of interest within the critical organ contours (bladder, prostate and femur). To find the effect of image quality on prostate contouring, the prostate volume on the image was compared for both setups using the student t-test. The distance between the prostate isocentre to the posterior body contour was measured to determine the effect of the external body deformation on the prostate location. A treatment plan was generated on the CS image. Then the same plan was applied onto the RTS image. By comparing these two, the dosimetric error introduced by the external body deformation can be quantified.
RESULTS: As the body-to-coil distance increased from zero to ~3-5 cm above body surface, there was a signal loss of approximately 50% and a 20-30% SNR and 7-14% CNR reduction. However, the volume of the prostate contoured on the SFOV image for all 3 volunteers did not show a significant difference in t-test for both setups (p=0.6432, α=0.05). The posterior body deformation with the CS depends on the volunteer weight and the maximum deformation ranged from 16-23 mm, for the highest volunteer weight (78 kg). The prostate anterior-posterior shift is correlated with the posterior deformation, but the relative position of the prostate to the posterior body surface is consistent (p=0.5181, α=0.05) on the soft and hard table top. There was (1.1±0.5) % prostate dose reduction in the actual dose delivery when the treatment was planned on the image compared to the RTS image.
DISCUSSION & CONCLUSIONS: In this volunteer study, we found that the CS setup resulted in external body deformation in both the anterior and posterior directions. There were reductions in image quality for the RTS, but it did not result in a significant difference on the contoured prostate volume. This result needs to be validated with a larger sample size. The prostate dose difference due to the external body deformation was about 1% of the prescribed dose. Comparing to the posterior deformation, the anterior deformation has more impact on the above dose difference.
ACKNOWLEDGEMENTS: This work has received funding support from the Cancer Council NSW (project grant RG11-05). Thanks to two radiation therapists who volunteered for this study and the radiographers assistance with scanning.
Poster No. 39 (EPSM-1167) Wednesday Poster Session
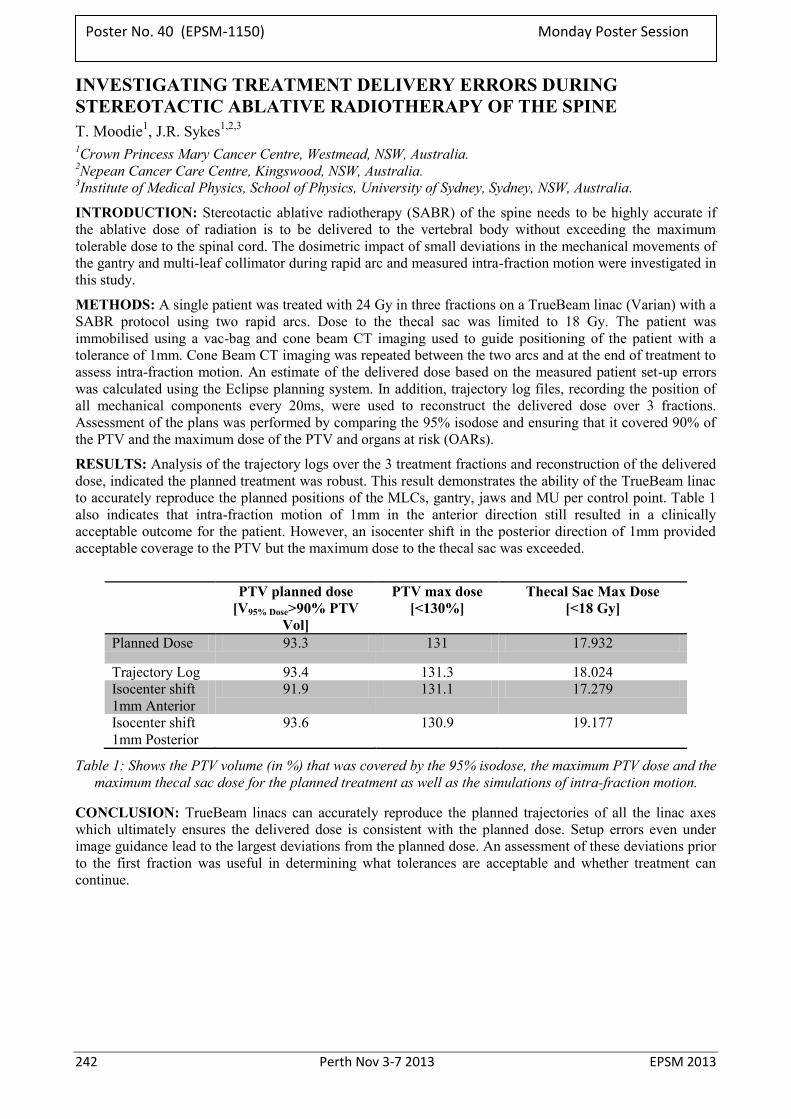
242 Perth Nov 3-7 2013 EPSM 2013
INVESTIGATING TREATMENT DELIVERY ERRORS DURING STEREOTACTIC ABLATIVE RADIOTHERAPY OF THE SPINE T. Moodie1, J.R. Sykes1,2,3 1Crown Princess Mary Cancer Centre, Westmead, NSW, Australia. 2Nepean Cancer Care Centre, Kingswood, NSW, Australia. 3Institute of Medical Physics, School of Physics, University of Sydney, Sydney, NSW, Australia.
INTRODUCTION: Stereotactic ablative radiotherapy (SABR) of the spine needs to be highly accurate if the ablative dose of radiation is to be delivered to the vertebral body without exceeding the maximum tolerable dose to the spinal cord. The dosimetric impact of small deviations in the mechanical movements of the gantry and multi-leaf collimator during rapid arc and measured intra-fraction motion were investigated in this study.
METHODS: A single patient was treated with 24 Gy in three fractions on a TrueBeam linac (Varian) with a SABR protocol using two rapid arcs. Dose to the thecal sac was limited to 18 Gy. The patient was immobilised using a vac-bag and cone beam CT imaging used to guide positioning of the patient with a tolerance of 1mm. Cone Beam CT imaging was repeated between the two arcs and at the end of treatment to assess intra-fraction motion. An estimate of the delivered dose based on the measured patient set-up errors was calculated using the Eclipse planning system. In addition, trajectory log files, recording the position of all mechanical components every 20ms, were used to reconstruct the delivered dose over 3 fractions. Assessment of the plans was performed by comparing the 95% isodose and ensuring that it covered 90% of the PTV and the maximum dose of the PTV and organs at risk (OARs).
RESULTS: Analysis of the trajectory logs over the 3 treatment fractions and reconstruction of the delivered dose, indicated the planned treatment was robust. This result demonstrates the ability of the TrueBeam linac to accurately reproduce the planned positions of the MLCs, gantry, jaws and MU per control point. Table 1 also indicates that intra-fraction motion of 1mm in the anterior direction still resulted in a clinically acceptable outcome for the patient. However, an isocenter shift in the posterior direction of 1mm provided acceptable coverage to the PTV but the maximum dose to the thecal sac was exceeded.
PTV planned dose
[V95% Dose>90% PTV Vol]
PTV max dose [<130%]
Thecal Sac Max Dose [<18 Gy]
Planned Dose 93.3 131 17.932
Trajectory Log 93.4 131.3 18.024 Isocenter shift 1mm Anterior
91.9 131.1 17.279
Isocenter shift 1mm Posterior
93.6 130.9 19.177
Table 1: Shows the PTV volume (in %) that was covered by the 95% isodose, the maximum PTV dose and the maximum thecal sac dose for the planned treatment as well as the simulations of intra-fraction motion.
CONCLUSION: TrueBeam linacs can accurately reproduce the planned trajectories of all the linac axes which ultimately ensures the delivered dose is consistent with the planned dose. Setup errors even under image guidance lead to the largest deviations from the planned dose. An assessment of these deviations prior to the first fraction was useful in determining what tolerances are acceptable and whether treatment can continue.
Poster No. 40 (EPSM-1150) Monday Poster Session
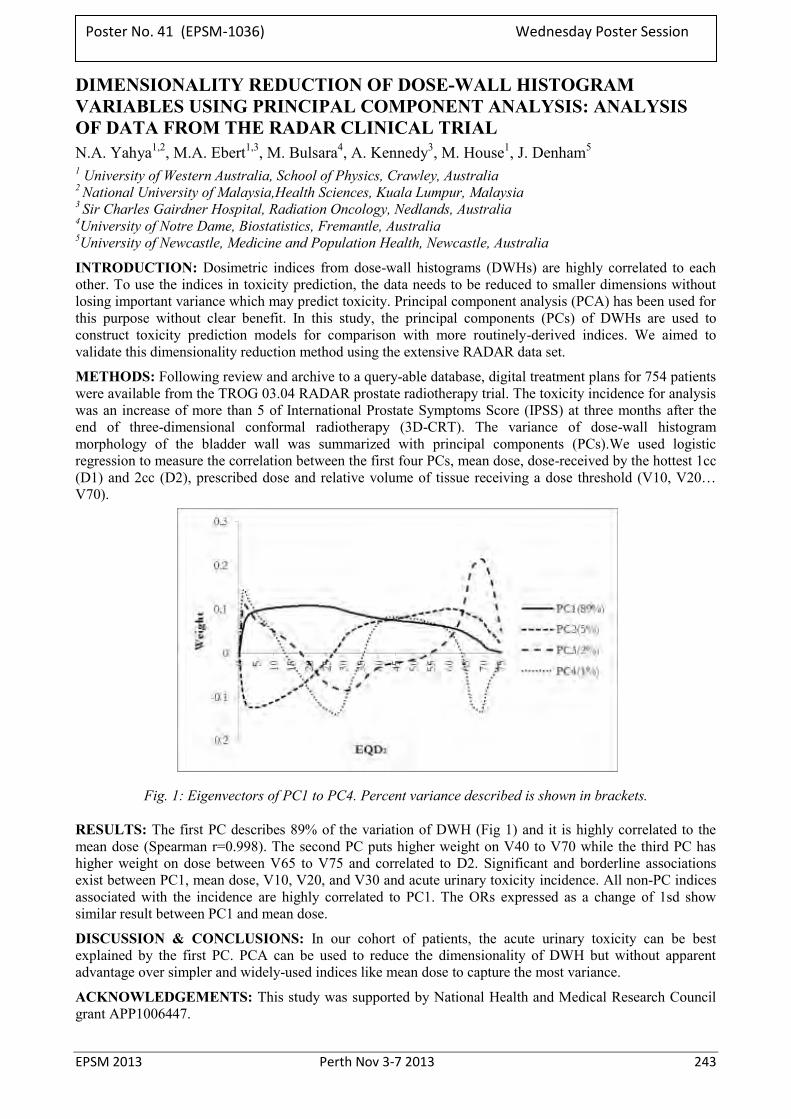
EPSM 2013 Perth Nov 3-7 2013 243
DIMENSIONALITY REDUCTION OF DOSE-WALL HISTOGRAM VARIABLES USING PRINCIPAL COMPONENT ANALYSIS: ANALYSIS OF DATA FROM THE RADAR CLINICAL TRIAL N.A. Yahya1,2, M.A. Ebert1,3, M. Bulsara4, A. Kennedy3, M. House1, J. Denham5
1 University of Western Australia, School of Physics, Crawley, Australia 2 National University of Malaysia,Health Sciences, Kuala Lumpur, Malaysia 3 Sir Charles Gairdner Hospital, Radiation Oncology, Nedlands, Australia 4University of Notre Dame, Biostatistics, Fremantle, Australia 5University of Newcastle, Medicine and Population Health, Newcastle, Australia
INTRODUCTION: Dosimetric indices from dose-wall histograms (DWHs) are highly correlated to each other. To use the indices in toxicity prediction, the data needs to be reduced to smaller dimensions without losing important variance which may predict toxicity. Principal component analysis (PCA) has been used for this purpose without clear benefit. In this study, the principal components (PCs) of DWHs are used to construct toxicity prediction models for comparison with more routinely-derived indices. We aimed to validate this dimensionality reduction method using the extensive RADAR data set.
METHODS: Following review and archive to a query-able database, digital treatment plans for 754 patients were available from the TROG 03.04 RADAR prostate radiotherapy trial. The toxicity incidence for analysis was an increase of more than 5 of International Prostate Symptoms Score (IPSS) at three months after the end of three-dimensional conformal radiotherapy (3D-CRT). The variance of dose-wall histogram morphology of the bladder wall was summarized with principal components (PCs).We used logistic regression to measure the correlation between the first four PCs, mean dose, dose-received by the hottest 1cc (D1) and 2cc (D2), prescribed dose and relative volume of tissue receiving a dose threshold (V10, V20… V70).
Fig. 1: Eigenvectors of PC1 to PC4. Percent variance described is shown in brackets.
RESULTS: The first PC describes 89% of the variation of DWH (Fig 1) and it is highly correlated to the mean dose (Spearman r=0.998). The second PC puts higher weight on V40 to V70 while the third PC has higher weight on dose between V65 to V75 and correlated to D2. Significant and borderline associations exist between PC1, mean dose, V10, V20, and V30 and acute urinary toxicity incidence. All non-PC indices associated with the incidence are highly correlated to PC1. The ORs expressed as a change of 1sd show similar result between PC1 and mean dose.
DISCUSSION & CONCLUSIONS: In our cohort of patients, the acute urinary toxicity can be best explained by the first PC. PCA can be used to reduce the dimensionality of DWH but without apparent advantage over simpler and widely-used indices like mean dose to capture the most variance.
ACKNOWLEDGEMENTS: This study was supported by National Health and Medical Research Council grant APP1006447.
Poster No. 41 (EPSM-1036) Wednesday Poster Session
244 Perth Nov 3-7 2013 EPSM 2013
COMMISSIONING LANDAUER INLIGHTTM OPTICALLY STIMULATED LUMINESCENCE DOSIMETERS FOR IN-VIVO PATIENT DOSIMETRY N. Yu, D. Binny, O. Kamst Royal Brisbane and Women’s Hospital.
INTRODUCTION: The in-vivo patient dosimetry at RBWH was primarily performed by TLDs. However they have the disadvantages of slow, single readout, fragile and difficult to handle. The new Landauer InlightTM optically stimulated luminescence dosimeter (OSLD) system has the advantages of instantaneous readout, short readout time, non-destructive readout, short annealing cycle and easy handling. Hence their implementation into routine clinical in-vivo dosimetry has greatly increased the overall efficiency of clinical work.
METHODS: The OSLDs purchased are screened nanoDots with nominal accuracy of ±2%. During commissioning, the following characteristics of the dosimeter were investigated: element correction factor, linearity, signal depletion, fading, energy and angular dependence, and annealing.
RESULTS: It was found that the sensitivity of individual OSLDs varies within 4%. The linearity curve has an R-squared of 0.9998. The signal depletion, fading, energy and angular dependence were found to be insignificant. The shortest optimal annealing time was determined to be one hour using the Gammasonics annealing lightbox.
DISCUSSION & CONCLUSIONS: The OSLD system hence successfully replaced the TLD system for clinical in-vivo dosimetry. Frequent applications include lens dose measurements, skin dose monitoring, and OAR dose reporting for clinical trials.
REFERENCES: 1. Jursinic P A. (2007) Characterisation of optically stimulated luminescent dosimeters, OSLDs, for clinical
dosimetric measurements. Med Phys, 34(12), 4594-4604. 2. Reft C S. (2009) The energy dependence and dose response of a commercial optically stimulated
luminescent detector for kilovoltage photon, megavoltage photon, and electron, proton, and carbon beams. Med Phys, 36(5), 1690-1699.
3. Kerns J R. et al. (2011) Angular dependence of the nanoDot OSL dosimeter. Med Phys. 38(7): 3955–3962.
4. Viamonte A. et al. (2008) Radiotherapy dosimetry using a commercial OSL system. Med Phys. 35(4) 1261-1266.
5. Aznar M C. et al. (2004) Real-time optical-fibre luminescence dosimetry for radiotherapy: Physical characteristics and applications in photon beams. Phys. Med. Biol. 49, 1655–1669.
6. Yukihara E G. et al. (2008) Optically stimulated luminescence (OSL) dosimetry in medicine. Phys. Med. Biol. 53 R351.
7. Omotayo A A. et al. (2012) The effect of different bleaching wavelengths on the sensitivity of Al2O3:C optically stimulated luminescence detectors (OSLDs) exposed to 6 MV photon beams. Med. Phys. 39(9), 5457-5458.
8. Paloor S. et al. (2012) SU–E–T–169: Initial Investigation into the Use of Optically Stimulated Luminescent Dosimeters (OSLDs) for In–Vivo Dosimetry of TBI Patients. Med. Phys. 39(6) 3742.
Poster No. 42 (EPSM-1015) Monday Poster Session
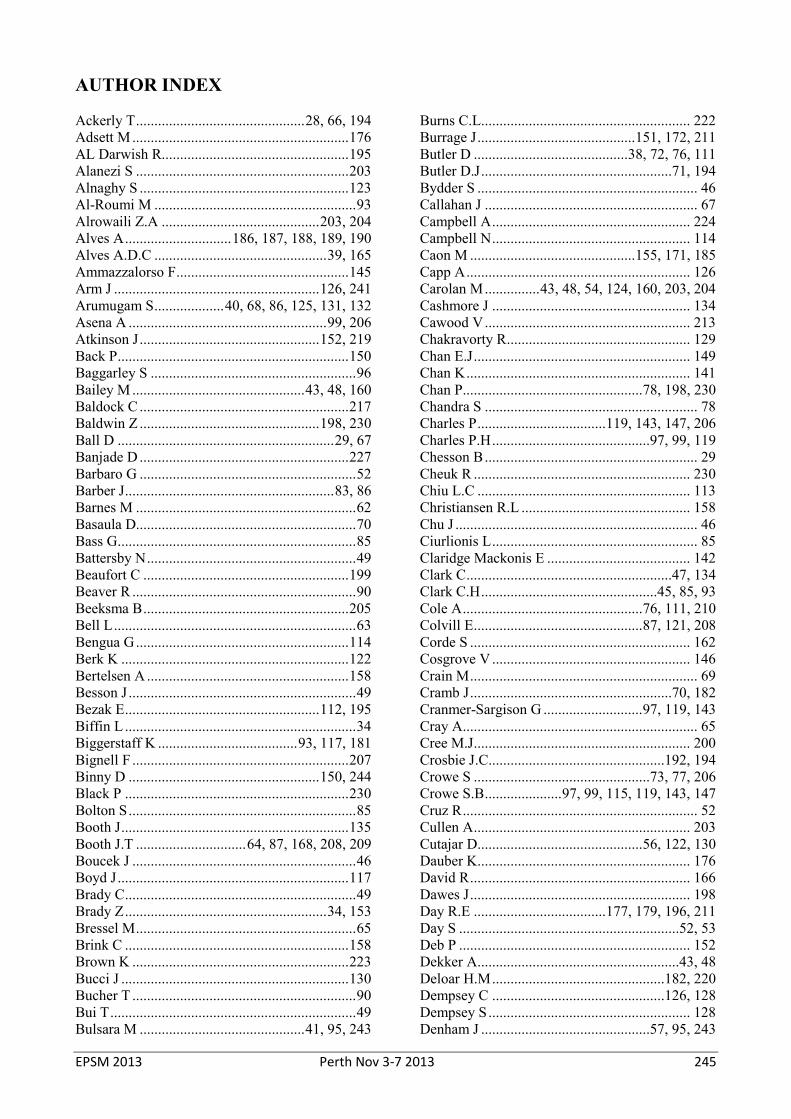
EPSM 2013 Perth Nov 3-7 2013 245
AUTHOR INDEX Ackerly T .............................................. 28, 66, 194 Adsett M ........................................................... 176 AL Darwish R................................................... 195 Alanezi S .......................................................... 203 Alnaghy S ......................................................... 123 Al-Roumi M ....................................................... 93 Alrowaili Z.A ........................................... 203, 204 Alves A ............................. 186, 187, 188, 189, 190 Alves A.D.C ............................................... 39, 165 Ammazzalorso F ............................................... 145 Arm J ........................................................ 126, 241 Arumugam S ................... 40, 68, 86, 125, 131, 132 Asena A ...................................................... 99, 206 Atkinson J ................................................. 152, 219 Back P ............................................................... 150 Baggarley S ........................................................ 96 Bailey M ............................................... 43, 48, 160 Baldock C ......................................................... 217 Baldwin Z ................................................. 198, 230 Ball D ........................................................... 29, 67 Banjade D ......................................................... 227 Barbaro G ........................................................... 52 Barber J ......................................................... 83, 86 Barnes M ............................................................ 62 Basaula D............................................................ 70 Bass G ................................................................. 85 Battersby N ......................................................... 49 Beaufort C ........................................................ 199 Beaver R ............................................................. 90 Beeksma B ........................................................ 205 Bell L .................................................................. 63 Bengua G .......................................................... 114 Berk K .............................................................. 122 Bertelsen A ....................................................... 158 Besson J .............................................................. 49 Bezak E ..................................................... 112, 195 Biffin L ............................................................... 34 Biggerstaff K ...................................... 93, 117, 181 Bignell F ........................................................... 207 Binny D .................................................... 150, 244 Black P ............................................................. 230 Bolton S .............................................................. 85 Booth J .............................................................. 135 Booth J.T .............................. 64, 87, 168, 208, 209 Boucek J ............................................................. 46 Boyd J ............................................................... 117 Brady C ............................................................... 49 Brady Z ....................................................... 34, 153 Bressel M ............................................................ 65 Brink C ............................................................. 158 Brown K ........................................................... 223 Bucci J .............................................................. 130 Bucher T ............................................................. 90 Bui T ................................................................... 49 Bulsara M ............................................. 41, 95, 243
Burns C.L ......................................................... 222 Burrage J ........................................... 151, 172, 211 Butler D .......................................... 38, 72, 76, 111 Butler D.J ....................................................71, 194 Bydder S ............................................................ 46 Callahan J .......................................................... 67 Campbell A ...................................................... 224 Campbell N ...................................................... 114 Caon M ............................................. 155, 171, 185 Capp A ............................................................. 126 Carolan M ............... 43, 48, 54, 124, 160, 203, 204 Cashmore J ...................................................... 134 Cawood V ........................................................ 213 Chakravorty R .................................................. 129 Chan E.J ........................................................... 149 Chan K ............................................................. 141 Chan P ................................................. 78, 198, 230 Chandra S .......................................................... 78 Charles P ................................... 119, 143, 147, 206 Charles P.H ...........................................97, 99, 119 Chesson B .......................................................... 29 Cheuk R ........................................................... 230 Chiu L.C .......................................................... 113 Christiansen R.L .............................................. 158 Chu J .................................................................. 46 Ciurlionis L ........................................................ 85 Claridge Mackonis E ....................................... 142 Clark C ........................................................47, 134 Clark C.H ................................................45, 85, 93 Cole A ................................................. 76, 111, 210 Colvill E .............................................. 87, 121, 208 Corde S ............................................................ 162 Cosgrove V ...................................................... 146 Crain M .............................................................. 69 Cramb J .......................................................70, 182 Cranmer-Sargison G ........................... 97, 119, 143 Cray A ................................................................ 65 Cree M.J ........................................................... 200 Crosbie J.C ................................................192, 194 Crowe S ................................................73, 77, 206 Crowe S.B ..................... 97, 99, 115, 119, 143, 147 Cruz R ................................................................ 52 Cullen A ........................................................... 203 Cutajar D ............................................. 56, 122, 130 Dauber K .......................................................... 176 David R ............................................................ 166 Dawes J ............................................................ 198 Day R.E .................................... 177, 179, 196, 211 Day S ............................................................52, 53 Deb P ............................................................... 152 Dekker A .......................................................43, 48 Deloar H.M ...............................................182, 220 Dempsey C ...............................................126, 128 Dempsey S ....................................................... 128 Denham J ..............................................57, 95, 243
246 Perth Nov 3-7 2013 EPSM 2013
Denham J.W ......................................... 41, 44, 116 Deshpande S ............................. 118, 122, 132, 184 Despande S ......................................................... 74 Devereux T ....................................................... 100 Dhal B.B ........................................................... 212 Divorty L ............................................................ 33 Dowling J...................................... 62, 78, 116, 241 Dowling J.A ........................................................ 78 Down J .............................................................. 196 Downes S ............................................ 80, 141, 162 Dry A .................................................................. 49 Dunn L ................ 58, 165, 186, 187, 188, 189, 190 Dusseldorp J ....................................................... 60 Eade T ........................................... 45, 64, 208, 209 Ebert M ............................................................... 57 Ebert M.A ........... 41, 44, 46, 94, 95, 129, 183, 243 Elliott A .............................................................. 96 Enari K ............................................................. 130 Erven T ............................................................. 205 Esser M ............................................................. 101 Estoesta E.B ...................................................... 213 Farshid A ............................................................ 33 Fielding A ........................................................... 54 Fielding A.L ......................................... 93, 96, 113 Fisher S ............................................................. 127 Foo J ................................................................... 83 Foo K .................................................................. 44 Foroudi F .............................................. 65, 70, 159 Forstner D ........................................................... 74 Fox C ........................................................ 214, 215 Francis R.J ........................................................ 103 Franich R ...................................................... 30, 54 Franich R.D ........ 58, 100, 101, 148, 238, 239, 240 Franji I ........................................................ 74, 184 Fripp J ................................................................. 78 Fritschi L .......................................................... 140 Fuangrod T ......................................... 59, 120, 121 Fuduli I ............................................................. 124 Gargett M.......................................................... 216 Gawthrop J.......................................................... 65 Ge Y ................................................................. 135 Gee H ................................................................ 207 Gehrke C ................................................... 182, 220 Georg D ........................................................ 36, 75 George A .............................. 43, 48, 118, 132, 184 Ghose S ............................................................... 78 Gill S ................................................................. 207 Glegg M .............................................................. 96 Goozee G .............................. 43, 48, 131, 132, 167 Gorjiara T ......................................................... 217 Gouldstone C ...................................................... 85 Govindarajulu G ............................................... 126 Greer P ................................................ 98, 167, 185 Greer P.B .......... 59, 62, 78, 98, 116, 120, 121, 241 Greig T ............................................................. 219 Guatelli S .......................................................... 130 Gulliford S .......................................................... 44 H W .................................................................... 55
Hackworth W ................................................45, 47 Hadaya D ............................................ 33, 107, 139 Halkett G.K.B .................................................... 27 Hall C ............................................................... 193 Hall C.J .....................................................192, 194 Han Z ............................................................... 123 Handel S .......................................................... 122 Hanlon P ...................................................117, 181 Hansen C ............................................................ 50 Hansen C.R ...................................................... 158 Hansen O ......................................................... 158 Hardcastle N ................. 65, 67, 124, 129, 180, 214 Harris B ............................................................ 117 Harrison K ....................................................... 218 Harriss W ........................................................... 84 Harty P ........................................................76, 111 Harty P.D ....................................................71, 194 Harvey A .......................................................... 219 Hatton J .............................................................. 69 Häusermann D ..........................................192, 193 Haworth A .................. 41, 44, 45, 47, 65, 129, 240 Hayden A ......................................................... 213 Hayes J ............................................................. 176 Hayton A ...................................................138, 151 Hegazy M.A ..................................................... 225 Hicks R .............................................................. 67 Hill A.J ............................................................. 222 Hill R ............................................................73, 77 Hindmarsh J ..................................................... 166 Hofman M .....................................................46, 67 Holloway L .. 40, 43, 48, 63, 68, 70, 74, 78, 83, 86,
118, 125, 131, 132, 167, 184, 205 Hornby C.J ......................................................... 42 House M ..................... 46, 54, 57, 94, 95, 212, 243 House M.J ........................................................ 157 Hu X.Z ............................................................. 177 Hug B ............................................................... 183 Hughes J ............................................................ 94 Hume J ............................................................... 49 Hussein M .......................................................... 85 Ichim P ............................................................. 177 Ireland T .......................................................... 221 Irle C .............................................................52, 53 Irvine M ........................................................... 221 Irving L .............................................................. 29 Jarema T ............................................................ 56 Jelen U ............................................................. 145 Jennings M.W .................................................. 169 Jhala E .............................................................. 218 Jimenez Y .......................................................... 50 Johnson D ........................................................ 146 Johnston P ........................................................ 138 Joseph D ............................................................ 57 Joseph D.J .....................................................41, 44 Joske D.J.L ...................................................... 164 Kafrouni M ...................................................... 162 Kairn T .................. 96, 97, 115, 119, 143, 147, 206 Kamst O ........................................................... 244
EPSM 2013 Perth Nov 3-7 2013 247
Kandasamy K ................................................... 127 Keall P ...................................................... 121, 135 Keall P.J ........................................ 64, 87, 208, 209 Kearvell R ........................................................... 41 Keehan S ............................................. 58, 101, 238 Keir B ............................................................... 222 Kennedy A ...................................... 41, 44, 95, 243 Kennedy K.M ..................................................... 91 Kenny J ....................... 45, 186, 187, 188, 189, 190 Kenny J.W .......................................................... 39 Khoo B ............................................................. 219 Khoo B.C.C ...................................................... 223 Khor R .............................................................. 214 Kirisits C ........................................................... 128 Kneebone A ........................................ 64, 208, 209 Knittel T ............................................................. 80 Kofler J ....................................................... 32, 137 Koh E.S ............................................................ 184 Kolb P ................................................................. 89 Kragl G ............................................................... 36 Krawiec M .................................................... 41, 57 Kron T ..... 29, 30, 39, 42, 58, 67, 69, 70, 100, 101,
124, 148, 149, 159, 165, 182, 186, 187, 188, 189, 190, 214
Kuncic Z ......................................... 54, 64, 77, 209 Lambert J .................................................... 78, 116 Lancaster C ....................................................... 150 Lancaster C.M .......................................... 238, 239 Lane J ................................................................. 31 Lanzon P ........................................................... 174 Latty D .............................................................. 213 Lawson J ............................................................. 84 Le Roy J .............................................................. 74 Leatherday C ............................................ 151, 224 Lechner W .......................................................... 36 Leckie C............................................................ 129 Lee C ................................................................ 166 Lee S.H ............................................................. 163 Lehmann J .......... 39, 165, 186, 187, 188, 189, 190 Leong T .............................................................. 46 Lerch M .............................................................. 56 Lerch M.L.F...................................... 124, 203, 204 Lewis R.A ......................................................... 192 Li J .................................................... 106, 109, 173 Li R ................................................................... 225 Lim A ............................................................... 214 Lim K ................................................................. 78 Lim S ................................................................ 196 Liney G ....................................................... 78, 129 Liney G.P .................................................. 110, 131 Liu P ................................................................. 141 Liu P.Z.Y ............................................................ 60 Lonski P ............................................................ 148 Lopez Gaitan J .................................................... 46 Lorenser D .......................................................... 91 Lotz N ................................................................. 60 Lowrey N .......................................................... 230 Lui P ................................................................. 183
Lummis S ......................................................... 226 Luo J .................................................................. 83 Luo S................................................. 106, 109, 173 Lydon J ............................................................ 149 Lye J ........... 76, 111, 165, 186, 187, 188, 189, 190 Lye J.E ................................................ 39, 192, 194 MacFarlane M .................................................. 228 MacManus M ..................................................... 67 Maeng S ........................................................... 163 Maksimenko A .........................................192, 193 Marks P ............................................................ 138 Martin J .......................................................78, 241 Mason N.J ........................................................ 199 Maughan D ........................................................ 85 Mauro M ............................................................ 49 Mc Loone P ..................................................... 227 McKay J ............................................................. 27 McKenzie D ..................................................... 141 McLaughlin R.A ................................................ 91 McLean D ...................................................33, 139 Meffin H ............................................................ 92 Menk F ................................................ 62, 116, 241 Metcalfe P ............. 54, 63, 122, 125, 203, 204, 216 Metwaly M ........................................................ 96 Middleton R ................................................59, 120 Millar J ............................................................. 101 Millar J.L .......................................... 199, 239, 240 Miller A ........................................................43, 48 Miller D ........................................................... 174 Mirjalili N ........................................................ 107 Moghaddasi L .................................................. 112 Mohammadi M .........................................169, 195 Molloy T .......................................................... 167 Moodie T ......................................................... 242 Moorrees J ......................................................... 82 Morales J .......................................................73, 77 Morris A .......................................................... 139 Morton J ......................................................96, 136 Moulton C .......................................................... 57 Muhammad W ................................................. 163 Muir E ................................................................ 42 Muir P .............................................................. 219 Muir S .............................................................. 228 Munoz L .......................................................... 154 Munstermann K ............................................... 139 Nelson V .......................................................... 205 Newall M.K ..................................................... 124 Newton L ......................................................... 218 Nezich R .......................................................... 229 Ng J.A ................................................. 64, 168, 209 Nilsson S ...................................................198, 230 Nisbet A ............................................................. 85 Nitschke K ....................................................... 235 Norvill C .......................................................... 231 Nutbrown R ....................................................... 85 O’Brien P ......................................................... 126 O’Brien R ............................. 64, 87, 135, 208, 209 O’Byrne J ........................................................... 50
248 Perth Nov 3-7 2013 EPSM 2013
O’Connor D.J ................................................... 121 O’Connor P ....................................................... 117 O’Mara B ............................................................ 46 Oates R ....................................................... 65, 220 Oborn B .................................................... 160, 216 Ochoa C ............................................................ 184 Odgers D ........................................................... 207 Oliver C .......................................... 38, 72, 76, 111 Oliver C.P ........................................................... 71 Oliver L ........................................................ 51, 98 Ong C.S ............................................................ 129 Ostwald P.......................................................... 218 Paneghel A.......................................................... 65 Panettieri V ............................................... 199, 239 Parker J ............................................... 78, 116, 241 Pasumarthy K ..................................................... 89 Patterson J ........................................... 78, 116, 218 Pearson J ........................................................... 193 Penfold S .......................................................... 102 Perdomo A .................................................. 34, 153 Perez M ............................................................. 180 Perkins A .............................................. 52, 53, 133 Petasecca M ........................ 56, 124, 194, 203, 204 Pham D ......................................... 65, 70, 100, 159 Phan J ................................................................. 83 Phillips N .......................................................... 222 Pichler P ............................................. 78, 116, 241 Poder J .............................................................. 127 Podias P .............................................................. 46 Pogson E ............................................................. 63 Pollard J ...................................................... 54, 102 Pope D .............................................................. 130 Porter I ................................................................ 28 Porter L ............................................................. 222 Porumb C .......................................................... 124 Poulsen P ............................................ 64, 121, 209 Prabhakar R .............................................. 182, 220 Pratt G ............................................................... 150 Price R ...................................................... 152, 229 Price R.I ............................................................ 232 Prince R ............................................................ 223 Prunster J .......................................................... 174 Quinn A ............................................................ 180 Quirk B.C ........................................................... 91 Rajesh Y ........................................................... 113 Ralston A .......................................................... 141 Ramanathan G .............................. 71, 76, 111, 194 Rampant P ........................................................ 227 Rawlinson D ..................................................... 129 Read R .............................................................. 179 Registrars MP ................................................... 185 Reigman J ........................................................... 82 Reilhac A .......................................................... 229 Reynolds H ....................................................... 129 Reynolds K.J....................................................... 88 Rice A ............................................................... 168 Richardson S ....................................................... 41 Rijken J ............................................................... 84
Rivers J .....................................................175, 176 Rivest-Hénault D ............................................... 78 Robins P ............................................................. 46 Roderick S ................................................180, 233 Rosenfeld A .......................... 54, 56, 122, 130, 216 Rosenfeld A.B .......................... 123, 124, 203, 204 Round H ........................................................... 191 Round W.H ...................................................... 200 Rowshanfarzad P ........................................37, 235 Rowshanfazad P .............................................. 120 Ruben J .............................................................. 28 Rutten T.P ........................................................ 169 Sabet M ............................................................ 235 Safavi M .......................................................... 123 Salehzahi F ...................................................... 107 Salvado O ...................................................78, 116 Sampson D.D ..................................................... 91 Santiago A ....................................................... 145 Satory P ............................................................ 168 Schick D .......................................................... 156 Scolaro L ............................................................ 91 Seco J .................................................. 26, 161, 191 Seeley A ............................................................. 28 Seneviratne M.D.S ............................ 106, 109, 173 Seymour E ....................................................... 166 Shepherd J .......................................................... 82 Shieh A ............................................................ 135 Sikimeti B ........................................................ 213 Sim L.S.H ........................................................ 113 Simeoni R .................................................236, 237 Singh C .............................................................. 61 Siu K ................................................................ 193 Siva S .................................... 29, 67, 100, 148, 159 Slattery A ......................................................... 108 Sloan K .............................................................. 90 Smith I .............................................. 172, 175, 176 Smith R .............................................................. 28 Smith R.L .................... 58, 101, 199, 238, 239, 240 Smith S ............................................. 105, 144, 206 Smith S.T ........................................................... 99 Snaith J .............................................................. 85 Spry N.A ............................................................ 46 St Pierre T .......................................................... 57 Stafford W ....................................................... 176 Stanwell P .....................................................62, 78 Steinfort D ......................................................... 29 Stevenson A ..................................................... 193 Stevenson A.W .........................................192, 194 Storm C ............................................................ 152 Styles C ............................................................ 159 Suchowerska N ................................... 60, 141, 183 Sun J ............................................. 62, 78, 116, 241 Supple J ............................................................ 100 Sykes J .......................................... 83, 86, 191, 213 Sykes J.R ....................................................79, 242 Sykes P.J .......................................................25, 81 Tai K.H .............................................................. 65 Tan Y.I ............................................................... 96
EPSM 2013 Perth Nov 3-7 2013 249
Taylor M.L ................. 58, 100, 101, 197, 238, 240 Thomas P .......................................................... 138 Thomas R............................................................ 85 Thwaites D 43, 48, 50, 54, 74, 79, 83, 86, 146, 162 Thwaites D.I ....................................... 97, 119, 158 Trapp J .................................................. 73, 77, 206 Trapp J.V ...................... 97, 99, 115, 119, 143, 147 Truant D............................................................ 205 Tsang Y ........................................................ 47, 85 Tse J .................................................................. 107 Tyler M ..................................................... 141, 167 Tyrrell D ........................................................... 113 Uche C.Z........................................................... 200 Veera J ................................................................ 78 Venables K ......................................................... 85 Verhaegen F...................................................... 212 Vial P .................... 74, 98, 118, 125, 132, 167, 184 Vinod S.K ........................................................... 78 Wallace A ................................................. 138, 175 Wallace A.B ....................................... 35, 170, 172 Wang X ............................................................... 61 Ward E.C .......................................................... 222 Warne D.J ........................................................... 93 Warr G .................................................. 52, 53, 133 Warrener K ....................................................... 183 Waterhouse D.K ............................................... 174 Waters G ............................................................. 46 Watt S ............................................................... 184 Weaver M ........................................................... 56 Webb D ....................................................... 76, 111 Wen C ........................................................... 28, 66 West M ............................................................... 49 Weston S ........................................................... 146
Whitaker J .......................................................... 30 Whitaker M .................................................30, 159 White S .........................................................83, 86 Wilkinson D ............................................45, 47, 85 Wilkinson L ..............................................172, 175 Williams I ................. 165, 186, 187, 188, 189, 190 Williams I.M ...................................................... 39 Williams M ...................................................... 160 Williams S ....................................................... 129 Wilson P .....................................................50, 102 Wirth A .............................................................. 42 Wong A .........................................................52, 53 Woodings S ...................................................... 227 Woodruff H ...................................................... 121 Woodward R .................................................... 183 Wratten C ....................................................78, 218 Wright T .....................................................76, 111 Xing A .................. 40, 68, 118, 125, 131, 132, 167 Yahya N.A ..................................................95, 243 Yang X ............................................................... 91 Yau S ............................................................83, 86 Yeo U.J ............................................................ 100 Young A .......................................................... 108 Young T ............................................................. 40 Yu N ................................................. 198, 230, 244 Yuan N ............................................................. 230 Zahra D ............................................................ 229 Zaman S ........................................................... 134 Zhang A ........................................................... 129 Zheng M.H ....................................................... 178 Zhu J ................................................................ 102 Zwan B .......................................................98, 121

250 Perth Nov 3-7 2013 EPSM 2013
EPSM 2013 Perth Nov 3-7 2013 251
POSTER LIST
Poster
Board No. Title of Presentation Presenter
Given Name Presenter
Family Name
1 PROPERTIES OF A 2D DIODE ARRAY IN FLUENCE MODE VERSUS FULL SCATTER CONDITIONS
Ziyad Alrowaili
2 CHARACTERIZATION OF A TWO DIMENSIONAL DIODE ARRAY (MAGIC PLATE) AS A TRANSMISSION DETECTOR FOR REAL TIME TREATMENT VERIFICATION
Ziyad Alrowaili
3 AN ASSESSMENT OF IMAGE DISTORTION AND CT NUMBER ACCURACY WITHIN A WIDE-BORE CT EXTENDED FIELD OF VIEW
Sankar Arumugam
4 RESPONSE VARIATION OF OPTICALLY STIMULATED LUMINESCENCE DOSIMETERS Andre Asena
5 DOSIMETRIC IMPACT OF BREAST TISSUE EXPANDERS ON POST MASTECTOMY RADIOTHERAPY – IN VIVO MEASUREMENT
Fiona Bignell
6 CALYPSO-GUIDED DMLC TRACKING CLINICAL TRIAL FOR PROSTATE RAPIDARC Jeremy Booth
7 APPLICATION OF TG-100 TO A NOVEL INTRAFRACTION MONITORING SYSTEM Jeremy Booth
8 QA MEASUREMENTS ON THE ARPANSA ELEKTA SYNERGY LINAC USING A SUN NUCLEAR DAILY QA3 ™ ION CHAMBER AND DIODE ARRAY.
Andrew Cole
9 CT ARTEFACT REDUCTION CAN BE USEFUL FOR BONE MODELLING IN THE PRESENCE OF TOTAL JOINT IMPLANTS
Robert Day
10 THEORETICAL ESTIMATION OF RBE IN LOW-KV INTRAOPERATIVE RADIOTHERAPY: DERIVATION OF SECONDARY ELECTRON SPECTRA
Bipin Dhal
11 COMPARISON OF POLYMER-BASED AND GOLD FIDUCIAL MARKERS FOR IMAGE GUIDED PROSTATE RADIOTHERAPY
Edgar Estoesta
12 INTEGRAL DOSE FROM A RECORD AND VERIFY SYSTEM FOR A LARGE COHORT: PROOF OF CONCEPT.
Chris Fox
13 A BAROMETRIC PRESSURE MINI-SERVER Chris Fox
14 MONTE CARLO SIMULATION OF A NOVEL 2D SILICON DIODE ARRAY FOR USE IN HYBRID MRI-LINAC SYSTEMS
Maegan Gargutt
15 AUSTRALIAN MEDICAL PHYSICS PUBLICATION PROFILE Tina Gorjiara
16 USING MODERN TECHNIQUES TO IMPROVE DOSE HOMOGENIETY ACROSS PHOTON-ELECTRON JUNCTIONS IN HEAD AND NECK CANCER TREATMENTS
Kristie Harrison
17 IS THERE A RELATIONSHIP BETWEEN PATIENT SIZE AND CT DOSE? Alicia Harvey
18 GOLD MARKER TRACKING IN CBCT PROJECTIONS Dolar Hossalin
19 RECOMMENDATIONS FOR A DIGITAL RADIOGRAPHIC DETECTOR QUALITY ASSURANCE PROGRAM
Timothy Ireland
20 ASSESSING DYNAMIC FLUOROSCOPIC IMAGE QUALITY IN TELEHEALTH APPLICATIONS: ADAPTATION OF THE NEMA XR 21 CARDIOVASULAR FLUOROSCOPIC BENCHMARKING PHANTOM
Benjamin Keir
21 STRUCTURAL AND BIOMECHANICAL TRENDS OF FEMALE FEMORAL NECK WITH AGE
Ben Khoo
22 DETECTING ALZHEIMER'S DISEASE USING AUTOMATED VOLUMETRIC HIPPOCAMPAL MASKING
Christopher Leatherday
23 CLINICAL IMPLEMENTATION OF THE NEW SRS AND SBRT NOVALIS TECHNOLOGY; EPWORTH HEALTHCARE COMMISSIONING AND STANDARD OF USE EXPERIENCE
Roger Li
24 PERSONAL RADIATION MONITORING SYSTEM INNEFICIENCIES: A COMPARISON IN SERVICE PROVISION
Soren Lummis
25 PERFORMANCE CHARACTERISTICS OF SUN NUCLEAR IC PROFILER FOR LINAC QA Peter McLoone
252 Perth Nov 3-7 2013 EPSM 2013
Poster Board No.
Title of Presentation Presenter Given Name
Presenter Family Name
26 MANUFACTURING A CUSTOM-MADE WELDED TITANIUM HEAD PLATE FOR A LARGE CONVEXITY MENINGIOMA CASE
Steven Muir
27 NEMA NU4 IMAGE QUALITY EVALUATION OF SEVERAL PET RADIOISOTOPES FOR UTILISATION IN PRECLINICAL IMAGING
Rik Nezich
28 A COMPARISON OF 3D DOSE PARAMETERS IN CERVICAL CANCER BRACHYTHERAPY: PLANNING ON POINT A VERSUS VOLUME OPTIMISATION.
Sanna Nilsson
29 MLC CALIBRATION USING AN ELEKTA EPID Craig Norvill
30 FIRST DECADE OF A STATE TEACHING-HOSPITAL-BASED PET RADIOPHARMACEUTICAL PRODUCTION & DEVELOPMENT FACILITY INCLUDING RADIOMETAL SOLID TARGETRY
Roger Price
31 REVIEW OF STEREOTACTIC RADIOSURGERY PATIENT SETUP AND TREATMENT TIME ON A VARIAN TRILOGY
Stephanie Roderick
32 ESTIMATION OF THYROID ACTIVITY AFTER ACCIDENTAL EXPOSURE TO I-131 Tegan Rourke
33 AN EPID-BASED METHOD FOR ROUTINE DYNAMIC MLC QA Mahsheed Sabet
34 RESPONSE COMPARISON OF DIGITAL HEARING AIDS Ricardo Joseph
Simeoni
35 A PHYSICAL APPROACH TO THERMAL EFFECTS IN EXERCISE Ricardo Joseph
Simeoni
36 LDR BRACHYTHERAPY POST PLAN CT IMAGE ARTIFACT COMPARISON : THINSEED VS ONCOSEED
Ryan Smith
37 APPLYING DWELL TIME DEVIATION CONSTRAINTS IN IPSA OPTIMISATION FOR PROSTATE HDR BRACHYTHERAPY
Ryan Smith
38 HDR BRACHYTHERAPY TREATMENT DELIVERY ERROR TRAPPING USING A FLAT PANEL IMAGER
Ryan Smith
39 MR SIMULATOR COMMISSIONING FOR PELVIC RADIOTHERAPY TREATMENT PLANNING
Jidi Sun
40 INVESTIGATING TREATMENT DELIVERY ERRORS DURING STEREOTACTIC ABLATIVE RADIOTHERAPY OF THE SPINE.
Jonathon Sykes
41 DIMENSIONALITY REDUCTION OF DOSE-WALL HISTOGRAM VARIABLES USING PRINCIPAL COMPONENT ANALYSIS: ANALYSIS OF DATA FROM THE RADAR CLINICAL TRIAL
Noorazrul Azmie
Yahya
42 COMMISSIONING LANDAUER INLIGHTTM OPTICALLY STIMULATED LUMINESCENCE DOSIMETERS FOR IN-VIVO PATIENT DOSIMETRY
Nancy Yu

EPSM Perth 2013 — Excellence through Innovation and Professional Development
23
ECLIPSE | Reduce Uncertainty
At Varian, we believe that one of the most powerful tools to fight cancer
is collaboration. Eclipse treatment planning system allows clinicians to
leverage peer-to-peer learning using a range of expert cases included in
SmartSegmentation knowledge based contouring library. Together, we can draw
on our collective energy to fight cancer and build a better future.
See us at EPSM 2013, Booth #9 & 10.
To learn more, visit varian.com/oncology or phone +61 2 9485 0111
© 2012 Varian Medical Systems, Inc. and Varian Medical Systems are registered trademarks and Eclipse is a trademark of Varian Medical Systems, Inc.
CANCER DIVIDES.WE UNITE.

EPSM Perth 2013 — Excellence through Innovation and Professional Development
24