Embed Size (px)
Citation preview
Production of Dialdehyde Cellulose and Periodate Regeneration: Towards feasible oxidation processes
Produktion av dialdehydcellulosa och återgenerering av perjodat: Mot möjliga
oxidationsprocesser
Elisabeth Höglund
Department of Engineering and Chemical Sciences
Chemistry
30 hp
Supervisors: Susanne Hansson, Stora Enso & Gunilla Carlsson, Karlstad University
Examinator: Thomas Nilsson
2015-09-25
ABSTRACT
Cellulose is an attractive raw material that has lately become more interesting thanks to its
degradability and renewability and the environmental awareness of our society. With the intention to
find new material properties and applications, studies on cellulose derivatization have increased.
Dialdehyde cellulose (DAC) is a derivative that is produced by selective cleavage of the C2-C3 bond
in an anhydroglucose unit in the cellulose chain, utilizing sodium periodate (NaIO4) that works as a
strong oxidant. At a fixed temperature, the reaction time as well as the amount of added periodate
affect the resulting aldehyde content. DAC has shown to have promising properties, and by
disintegrating the dialdehyde fibers into fibrils, thin films with extraordinary oxygen barrier at high
humidity can be achieved. Normally, barrier properties of polysccharide films deteriorate at higher
humidity due to their hygroscopic character. This DAC barrier could therefore be a potential
environmentally-friendly replacement for aluminum which is utilized in many food packages today.
The aim of this study was to investigate the possibilities to produce dialdehyde cellulose at an
industrial level, where the regeneration of consumed periodate plays a significant role to obtain a
feasible process. A screening of the periodate oxidation of cellulose containing seven experiments
was conducted by employing the program MODDE for experimental design. The reaction time was
varied between 2-8 hours and the ratio NaIO4 to fiber in was between 1-2 (w/w) for small-scale
experiments (1 g fiber), which resulted in an aldehyde content between 14-80 %. An oxidation degree
around 30 % was set as a goal, and the optimal point at a fixed temperature of 50°C was assessed to be
a ratio of 1.5 and a reaction time of 2.5 h, including 30 min of cooling. Furthermore, the MODDE
evaluation suggested that the time and quantity of added periodate equally effected the reaction. An
up-scaling of the system with 22.5 g of NaIO4 and 15 g of cellulose fibers and a total reaction time of
3h, resulted in 39 % oxidation degree and a yield of 92 %.
For the regeneration of periodate, Oxone® was tested, but too low yields were obtained. More studies
are needed in order to understand and optimize this process. Better results where gained when utilizing
a 10 % hypochlorite solution (NaOCl) that was refluxed with the filtrate from the periodate oxidation
of cellulose. A spectrophotometric method was developed to be able to quantify the amount of
periodate and thereby the amount of residual iodate (IO3-), i.e. the byproduct to oxidize back to IO4
-.
An optimization study was performed with eleven experiments with the time varying between 1-4
hours and the molar ratio of NaOCl to IO3- between 1-4. However, it was found that the residual
periodate also consumed the hypochlorite, so the real molar ratio of NaOCl to IO3- and IO4
- was only
0.38-1.52. The highest ratio of 1.52 with a reaction time of 4 h generated the highest regeneration of
81 %. From the MODDE evaluation it was suggested that the reaction time does not have as
significant effect upon the process as the amount of added NaOCl has. By optimizing this reaction
further, it should be possible to reach even more satisfying results. However, it was proved that the
precipitated product was sodium paraperiodate, Na3H2IO6, and this regenerated product was
successfully used to oxidize cellulose fibers to DAC. Surprisingly, the oxidation degree became much
higher, 43 %, despite that the same condition was employed as before, but the reason for this can be
the lower pH that was utilized. Even though there still are questions to be answered, this study has
contributed to knowledge that could be utilized to take the oxidation process closer to
industrialization.
SAMMANFATTNING
Cellulosa är en attraktiv råvara som blivit alltmer intressant tack vare dess nedbrytbarhet och
förnybarhet samt samhällets miljömedvetenhet. Med avsikt att hitta nya materialegenskaper och
applikationer har studier på derivatiseringen av cellulosa ökat. Dialdehydcellulosa (DAC) är ett derivat
som framställs genom selektiv klyvning av C2-C3-bindningen i en vattenfri glukosenhet i
cellulosakedjan där natriumperjodat (NaIO4) fungerar som ett starkt oxidationsmedel. Vid en konstant
temperatur påverkar reaktionstiden liksom mängden tillsatt perjodat det resulterande
aldehydinnehållet. DAC har visat sig ha lovande egenskaper och genom att lösa upp dialdehydfibrerna
till fibriller kan tunna filmer med en utomordentlig syrebarriär vid hög fuktighet erhållas. Normalt sett
blir den fina barriären gjord av polysackaridfilmer försämrad vid högre luftfuktighet på grund av den
hygroskopiska karaktären. Denna DAC barriär kan därför vara en potentiell och miljövänlig ersättare
till det aluminium som används i många livsmedelsförpackningar idag.
Syftet med denna studie var att undersöka möjligheterna att kunna producera dialdehydcellulosa på en
industriell nivå, där regenerering av förbrukad perjodat spelar en viktig roll för att erhålla en
genomförbar process. En screening av perjodatoxidering av cellulosa innehållande sju experiment
utfördes genom att använda programmet MODDE för experimentell design. Reaktionstiden varierade
mellan 2-8 timmar och förhållandet NaIO4 till fibrer i gram mellan 1-2 för småskaliga experiment (1 g
fiber), vilket resulterade i en aldehydhalt mellan 14-80 %. En oxidationsgrad omkring 30 % sattes som
ett mål och den optimala punkten vid en konstant temperatur av 50° C bedömdes vara ett förhållande
på 1,5 och en reaktionstid om 2,5 timmar inklusive 30 min avsvalning. Vidare föreslog MODDE-
utvärderingen att tiden och mängden tillsatt perjodat påverkade reaktionen likvärdigt. En uppskalning
av systemet med 22,5 g NaIO4 och 15 g cellulosafibrer och en total reaktionstid om 3 timmar
resulterade i en oxidationsgrad på 39 % och ett utbyte på 92 %.
För att återgenerera perjodat testades Oxone® men alltför låga utbyten erhölls. Fler studier behövs för
att förstå och optimera denna process. Bättre resultat erhölls när en 10 % hypokloritlösning (NaOCl)
användes, vilken återloppskokades med filtratet från perjodatoxideringen av cellulosa. En
spektrofotometrisk metod utvecklades för att kunna kvantifiera mängden perjodat och därmed
mängden kvarvarande jodat (IO3-), dvs. biprodukten att oxidera tillbaka till IO4
-. En optimeringsstudie
utfördes med elva experiment där tiden varierade mellan 1-4 timmar och det molära förhållandet av
NaOCl till IO3- mellan 1-4. Efter detta visade det sig att den kvarvarande perjodaten också
konsumerade hypoklorit, så det verkliga molförhållandet mellan NaOCl till IO3- och IO4
- var endast
0,38-1,52. Det högsta förhållandet 1,52 med en reaktionstid om 4 timmar genererade den högsta
återgenereringen på 81 %. Från MODDE-utvärderingen föreslogs att reaktionstiden inte har lika stor
inverkan på processen som mängden tillsatt NaOCl har. Genom att optimera denna reaktion ytterligare
bör det vara möjligt att nå än mer tillfredsställande resultat. Hur som helst bevisades det att den
utfällda produkten var natriumparaperjodat, Na3H2IO6 och denna regenererade produkt användes
framgångsrikt för att oxidera cellulosafibrer till DAC. Överraskande nog blev oxidationsgraden
mycket högre, 43 %, trots applicering av samma betingelser som tidigare, men orsaken till detta kan
vara att ett lägre pH användes. Även om det fortfarande finns frågor kvar att besvara så har denna
studie bidragit till kunskap som kan användas för att ta denna oxidationsprocess närmre
industrialisering.
ABBREVIATIONS
AC – Aldehyde content
AGU – Anhydroglucose unit
CCF – Central Composite Face-Centered
DAC – Dialdehyde cellulose
DAS – Dialdehyde starch
DI water – Deionized water
DOE – Design of Experiments
DP – Degree of polymerization
DPD - N,N-diethyl-p-phenylenediamine
PLS – Principal Component Analysis
TABLE OF CONTENTS
1. PURPOSE OF THE STUDY .............................................................................................................. 1
2. INTRODUCTION ............................................................................................................................... 2
2.1 CELLULOSE ................................................................................................................................ 2
2.1.1 Structure and Characteristics of Cellulose ............................................................................. 2
2.1.2 Modification of Cellulose ....................................................................................................... 3
2.2 DIALDEHYDE CELLULOSE ..................................................................................................... 4
2.2.1 Structure and Characteristics of Dialdehyde Cellulose .......................................................... 4
2.2.2 Processing ............................................................................................................................... 5
2.2.3 Degree of Oxidation Determination ....................................................................................... 6
2.3 REGENERATION OF PERIODATE ........................................................................................... 7
2.3.1 Sodium Hypochlorite ............................................................................................................. 7
2.3.2 Potassium Peroxymonosulfate - Oxone® ............................................................................... 7
2.3.3 Additional Recovery Methods for Periodate .......................................................................... 8
2.4 MODDE – DESIGN OF EXPERIMENTS ................................................................................. 11
3. EXPERIMENTAL ............................................................................................................................ 12
3.1 MATERIALS .............................................................................................................................. 12
3.2 METHODS .................................................................................................................................. 12
3.2.1 Periodate Oxidation of Cellulose.......................................................................................... 12
3.2.2 Regeneration of Spent Periodate by Sodium Hypochlorite .................................................. 13
3.3 CHARACTERIZATION ............................................................................................................. 14
3.3.1 Aldehyde Content Analysis .................................................................................................. 14
3.3.2 Periodate Concentration Analysis ........................................................................................ 15
3.3.3 Fourier Transform Infrared Spectrometry (FTIR) ................................................................ 15
4. RESULTS AND DISCUSSION ....................................................................................................... 16
4.1 PERIODATE OXIDATION OF CELLULOSE ......................................................................... 16
4.2 REGENERATION OF PERIODATE ......................................................................................... 19
4.2.1 Periodate Concentration Analysis ........................................................................................ 19
4.2.2 Regeneration of Periodate by Sodium Hypochlorite ............................................................ 22
4.2.3 Regeneration of Periodate by Oxone® ................................................................................. 28
4.3 OXIDATION OF CELLULOSE USING REGENERATED PARAPERIODATE .................... 30
5. CONCLUSIONS ............................................................................................................................... 31
6. FUTURE WORK .............................................................................................................................. 32
7. ACKNOWLEDGEMENTS .............................................................................................................. 33
8. REFERENCES .................................................................................................................................. 34
Appendix I
Recipe for the Calibration Curve for Spectrophotometer Analyzes
Appendix II
Filtrate Studies
Appendix III
Oxone® Pre-tests
Appendix IV
Aldehyde Content Analysis
Appendix V
Periodate Regeneration by Sodium Hypochlorite
Appendix VI
Oxidation of Cellulose Using Regenerated Periodate
Appendix VII
FTIR Analyze of Precipitated Product
Spectrophotometer Analyze of Remaining IO4-
Appendix VIII
Risk Assessments
Oxone®
Sodium hypochlorite, NaOCl
Sodium periodate, NaIO4
Hydroxylamine hydrochloride, NH2OH·HCl
N,N-Diethyl-p-phenylenediamine, DPD
1
1. PURPOSE OF THE STUDY
An aluminum film inside of food packages is the ideal barrier for oxygen and radiation, but its carbon
foot-print is high. Cellulose, on the other hand, is a renewable material and its fibrils can form films
with excellent barrier properties; however at higher relative humidity this barrier is lost. Dialdehyde
cellulose fibrils have shown to have maintained barrier properties even at higher humidity; thus, this
derivative could be a potential environmentally-friendly replacement for the aluminum used today.
In order to produce dialdehyde cellulose, sodium periodate seems to be the most suitable option to
oxidize the cellulose fibers. However, the chemical is expensive and harsh, and an optimal overall
process is necessary for it to become economically viable. The aim of this study is to investigate the
possibilities to be able to produce dialdehyde cellulose at an industrial level, where the regeneration of
consumed periodate plays a significant role to obtain a feasible process. How can this be performed on
a laboraty scale and what are the risks associated with the work? Which are the optimal parameters for
the periodate oxidation of cellulose? Can periodate be regenerated with sodium hypochlorite or
Oxone®, and successively used again for oxidation of cellulose?
.
2
2. INTRODUCTION
2.1 CELLULOSE
Cellulose is a renewable, biodegradable, and inexpensive raw material that exhibits attractive features
as a biomaterial [1]. In combination with lignin and hemicellulose, it becomes a high-strength and
durable wood material [2]. Globally, it is the most abundant natural resource, and every year, 1011-1012
tons of cellulose is estimated to be produced by primarily plants and algae through photosynthesis, i.e.
the reaction of water, sunlight, and carbon dioxide. For thousands of years, cellulose has been utilized
as a building material, in the form of timber, and for clothing, and also as an energy source [3]. Within
the forest industry, cellulose is highly consumed, but with time, less and less paper has been used in
our progressively more digitalized world, and its utilization will continue to decline. Consequently,
new cellulose-based products are investigated with the intention of finding novel application areas
other than paper and board.
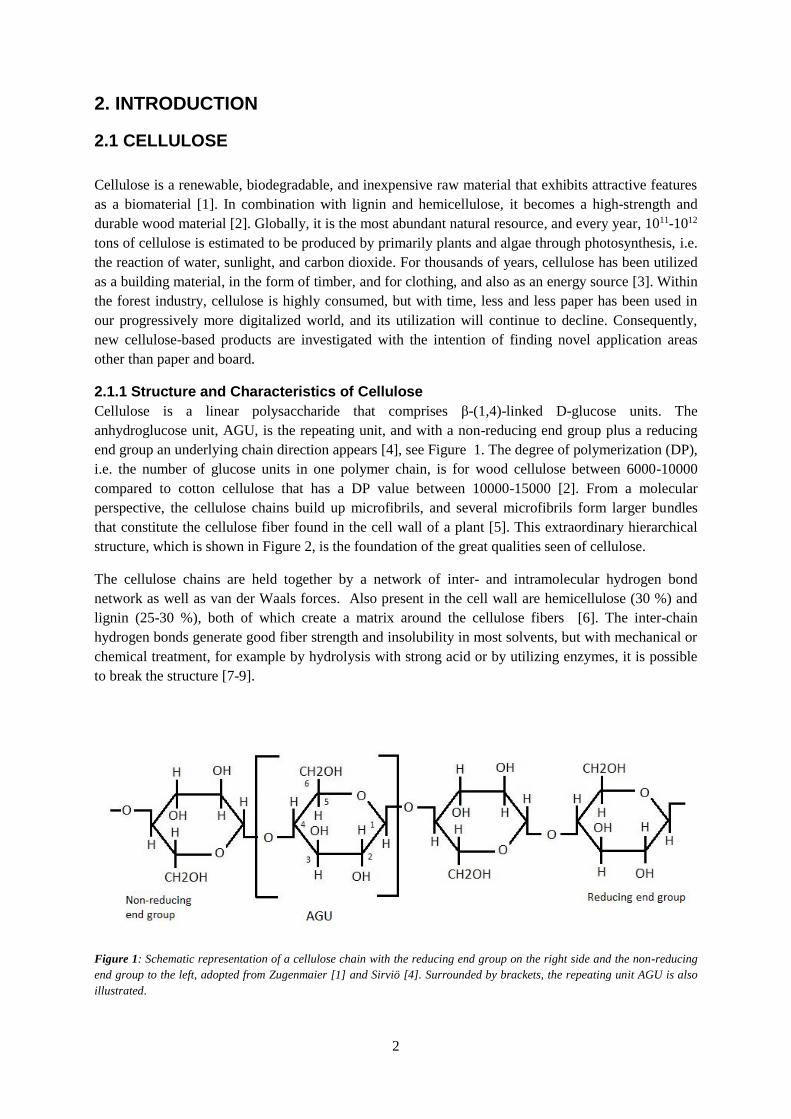
2.1.1 Structure and Characteristics of Cellulose Cellulose is a linear polysaccharide that comprises β-(1,4)-linked D-glucose units. The
anhydroglucose unit, AGU, is the repeating unit, and with a non-reducing end group plus a reducing
end group an underlying chain direction appears [4], see Figure 1. The degree of polymerization (DP),
i.e. the number of glucose units in one polymer chain, is for wood cellulose between 6000-10000
compared to cotton cellulose that has a DP value between 10000-15000 [2]. From a molecular
perspective, the cellulose chains build up microfibrils, and several microfibrils form larger bundles
that constitute the cellulose fiber found in the cell wall of a plant [5]. This extraordinary hierarchical
structure, which is shown in Figure 2, is the foundation of the great qualities seen of cellulose.
The cellulose chains are held together by a network of inter- and intramolecular hydrogen bond
network as well as van der Waals forces. Also present in the cell wall are hemicellulose (30 %) and
lignin (25-30 %), both of which create a matrix around the cellulose fibers [6]. The inter-chain
hydrogen bonds generate good fiber strength and insolubility in most solvents, but with mechanical or
chemical treatment, for example by hydrolysis with strong acid or by utilizing enzymes, it is possible
to break the structure [7-9].
Figure 1: Schematic representation of a cellulose chain with the reducing end group on the right side and the non-reducing
end group to the left, adopted from Zugenmaier [1] and Sirviö [4]. Surrounded by brackets, the repeating unit AGU is also
illustrated.
3
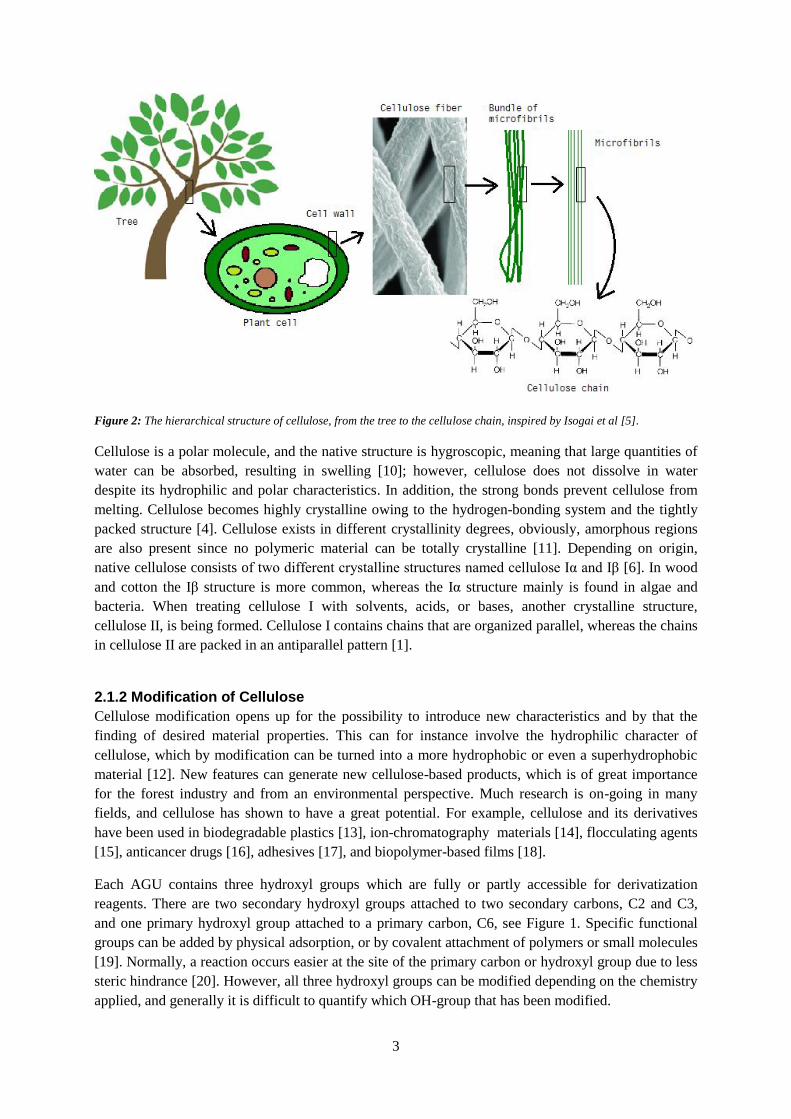
Figure 2: The hierarchical structure of cellulose, from the tree to the cellulose chain, inspired by Isogai et al [5].
Cellulose is a polar molecule, and the native structure is hygroscopic, meaning that large quantities of
water can be absorbed, resulting in swelling [10]; however, cellulose does not dissolve in water
despite its hydrophilic and polar characteristics. In addition, the strong bonds prevent cellulose from
melting. Cellulose becomes highly crystalline owing to the hydrogen-bonding system and the tightly
packed structure [4]. Cellulose exists in different crystallinity degrees, obviously, amorphous regions
are also present since no polymeric material can be totally crystalline [11]. Depending on origin,
native cellulose consists of two different crystalline structures named cellulose Iα and Iβ [6]. In wood
and cotton the Iβ structure is more common, whereas the Iα structure mainly is found in algae and
bacteria. When treating cellulose I with solvents, acids, or bases, another crystalline structure,
cellulose II, is being formed. Cellulose I contains chains that are organized parallel, whereas the chains
in cellulose II are packed in an antiparallel pattern [1].
2.1.2 Modification of Cellulose
Cellulose modification opens up for the possibility to introduce new characteristics and by that the
finding of desired material properties. This can for instance involve the hydrophilic character of
cellulose, which by modification can be turned into a more hydrophobic or even a superhydrophobic
material [12]. New features can generate new cellulose-based products, which is of great importance
for the forest industry and from an environmental perspective. Much research is on-going in many
fields, and cellulose has shown to have a great potential. For example, cellulose and its derivatives
have been used in biodegradable plastics [13], ion-chromatography materials [14], flocculating agents
[15], anticancer drugs [16], adhesives [17], and biopolymer-based films [18].
Each AGU contains three hydroxyl groups which are fully or partly accessible for derivatization
reagents. There are two secondary hydroxyl groups attached to two secondary carbons, C2 and C3,
and one primary hydroxyl group attached to a primary carbon, C6, see Figure 1. Specific functional
groups can be added by physical adsorption, or by covalent attachment of polymers or small molecules
[19]. Normally, a reaction occurs easier at the site of the primary carbon or hydroxyl group due to less
steric hindrance [20]. However, all three hydroxyl groups can be modified depending on the chemistry
applied, and generally it is difficult to quantify which OH-group that has been modified.
4
2.2 DIALDEHYDE CELLULOSE
Cellulose can be subjected to strong oxidizing agents in order to modify its properties. Depending on
the type of oxidant and reaction conditions, the oxidized cellulose may contain aldehydes, ketons or
carboxylic acid groups as substitute for the hydroxyl groups [10].
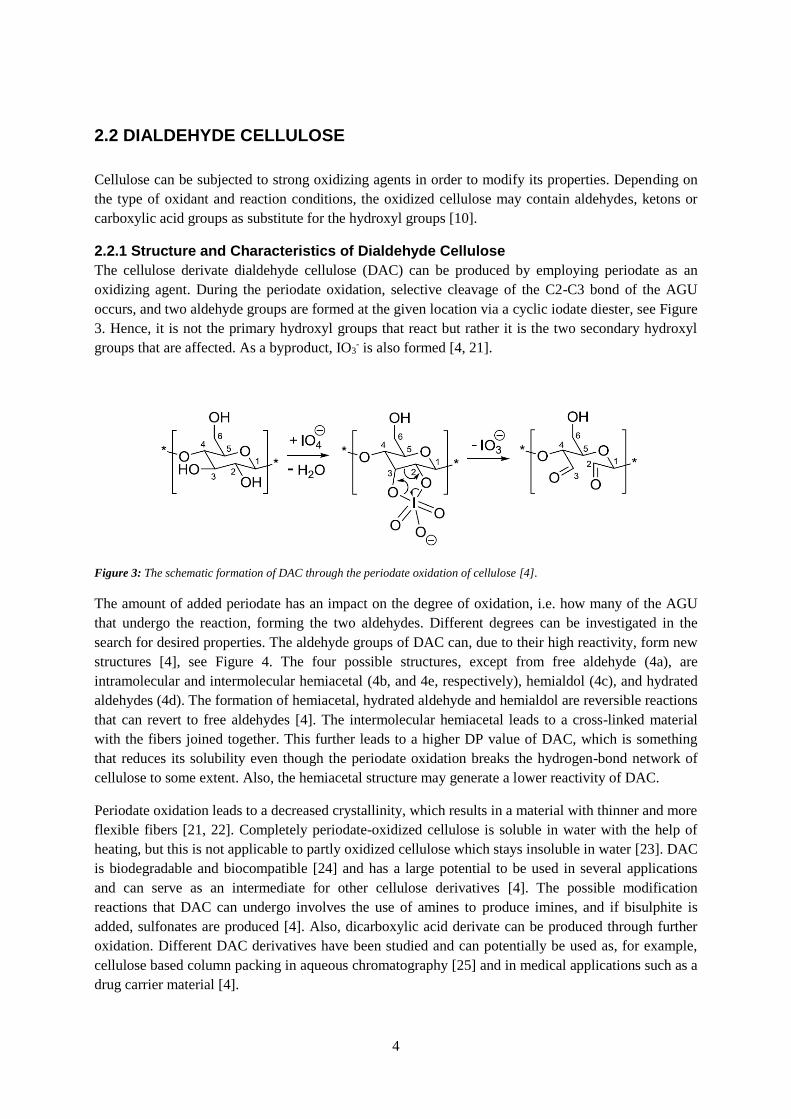
2.2.1 Structure and Characteristics of Dialdehyde Cellulose
The cellulose derivate dialdehyde cellulose (DAC) can be produced by employing periodate as an
oxidizing agent. During the periodate oxidation, selective cleavage of the C2-C3 bond of the AGU
occurs, and two aldehyde groups are formed at the given location via a cyclic iodate diester, see Figure
3. Hence, it is not the primary hydroxyl groups that react but rather it is the two secondary hydroxyl
groups that are affected. As a byproduct, IO3- is also formed [4, 21].
Figure 3: The schematic formation of DAC through the periodate oxidation of cellulose [4].
The amount of added periodate has an impact on the degree of oxidation, i.e. how many of the AGU
that undergo the reaction, forming the two aldehydes. Different degrees can be investigated in the
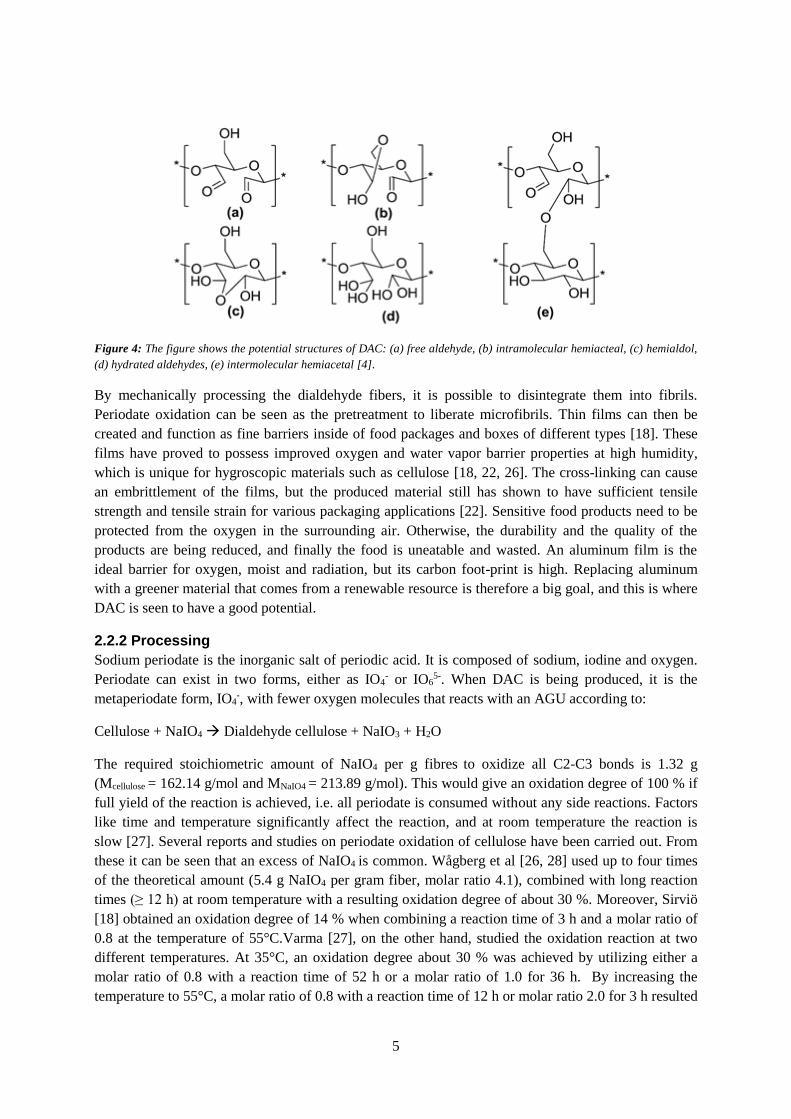
search for desired properties. The aldehyde groups of DAC can, due to their high reactivity, form new
structures [4], see Figure 4. The four possible structures, except from free aldehyde (4a), are
intramolecular and intermolecular hemiacetal (4b, and 4e, respectively), hemialdol (4c), and hydrated
aldehydes (4d). The formation of hemiacetal, hydrated aldehyde and hemialdol are reversible reactions
that can revert to free aldehydes [4]. The intermolecular hemiacetal leads to a cross-linked material
with the fibers joined together. This further leads to a higher DP value of DAC, which is something
that reduces its solubility even though the periodate oxidation breaks the hydrogen-bond network of
cellulose to some extent. Also, the hemiacetal structure may generate a lower reactivity of DAC.
Periodate oxidation leads to a decreased crystallinity, which results in a material with thinner and more
flexible fibers [21, 22]. Completely periodate-oxidized cellulose is soluble in water with the help of
heating, but this is not applicable to partly oxidized cellulose which stays insoluble in water [23]. DAC
is biodegradable and biocompatible [24] and has a large potential to be used in several applications
and can serve as an intermediate for other cellulose derivatives [4]. The possible modification
reactions that DAC can undergo involves the use of amines to produce imines, and if bisulphite is
added, sulfonates are produced [4]. Also, dicarboxylic acid derivate can be produced through further
oxidation. Different DAC derivatives have been studied and can potentially be used as, for example,
cellulose based column packing in aqueous chromatography [25] and in medical applications such as a
drug carrier material [4].
5
Figure 4: The figure shows the potential structures of DAC: (a) free aldehyde, (b) intramolecular hemiacteal, (c) hemialdol,
(d) hydrated aldehydes, (e) intermolecular hemiacetal [4].
By mechanically processing the dialdehyde fibers, it is possible to disintegrate them into fibrils.
Periodate oxidation can be seen as the pretreatment to liberate microfibrils. Thin films can then be
created and function as fine barriers inside of food packages and boxes of different types [18]. These
films have proved to possess improved oxygen and water vapor barrier properties at high humidity,
which is unique for hygroscopic materials such as cellulose [18, 22, 26]. The cross-linking can cause
an embrittlement of the films, but the produced material still has shown to have sufficient tensile
strength and tensile strain for various packaging applications [22]. Sensitive food products need to be
protected from the oxygen in the surrounding air. Otherwise, the durability and the quality of the
products are being reduced, and finally the food is uneatable and wasted. An aluminum film is the
ideal barrier for oxygen, moist and radiation, but its carbon foot-print is high. Replacing aluminum
with a greener material that comes from a renewable resource is therefore a big goal, and this is where
DAC is seen to have a good potential.
2.2.2 Processing
Sodium periodate is the inorganic salt of periodic acid. It is composed of sodium, iodine and oxygen.
Periodate can exist in two forms, either as IO4- or IO6
5-. When DAC is being produced, it is the
metaperiodate form, IO4-, with fewer oxygen molecules that reacts with an AGU according to:
Cellulose + NaIO4 Dialdehyde cellulose + NaIO3 + H2O
The required stoichiometric amount of NaIO4 per g fibres to oxidize all C2-C3 bonds is 1.32 g
(Mcellulose = 162.14 g/mol and MNaIO4 = 213.89 g/mol). This would give an oxidation degree of 100 % if
full yield of the reaction is achieved, i.e. all periodate is consumed without any side reactions. Factors
like time and temperature significantly affect the reaction, and at room temperature the reaction is
slow [27]. Several reports and studies on periodate oxidation of cellulose have been carried out. From
these it can be seen that an excess of NaIO4 is common. Wågberg et al [26, 28] used up to four times
of the theoretical amount (5.4 g NaIO4 per gram fiber, molar ratio 4.1), combined with long reaction
times (≥ 12 h) at room temperature with a resulting oxidation degree of about 30 %. Moreover, Sirviö
[18] obtained an oxidation degree of 14 % when combining a reaction time of 3 h and a molar ratio of
0.8 at the temperature of 55°C.Varma [27], on the other hand, studied the oxidation reaction at two
different temperatures. At 35°C, an oxidation degree about 30 % was achieved by utilizing either a
molar ratio of 0.8 with a reaction time of 52 h or a molar ratio of 1.0 for 36 h. By increasing the
temperature to 55°C, a molar ratio of 0.8 with a reaction time of 12 h or molar ratio 2.0 for 3 h resulted
6
in about 30 % as well, showing that the temperature greatly affect the reaction time, in combination
with the amount of NaIO4.
The temperature can, however, not be too high since the periodate is unstable and there is a risk of
decomposition and liberation of iodine from the byproduct of iodate (IO3-), especially after some time
above 55°C [27]. Addition of metal salts, like LiCl, CaCl2, and NaCl, has also been an applied step to
further improve the efficiency of the oxidation [29]; yet, a fairly low improvement was achieved: the
aldehyde content (AC) increased with 0.3 mmol/g in LiCl-assisted oxidation reactions (55°C, 1-2 h). It
was also observed that at high temperatures (85°C) and long reaction times (>2 h) periodate
decomposed when using metal salts, and LiCl actually decreased the aldehyde content.
2.2.3 Degree of Oxidation Determination
The degree of oxidation is the number of C2-C3 bonds converted into dialdehydes, based on the total
number of C2-C3 bonds. The degree of oxidation can be controlled by the added amount of periodate,
in combination with the reaction conditions [27]. Since the amount of aldehydes affect the material
properties it becomes important to be able to quantify that the desired oxidation level has been
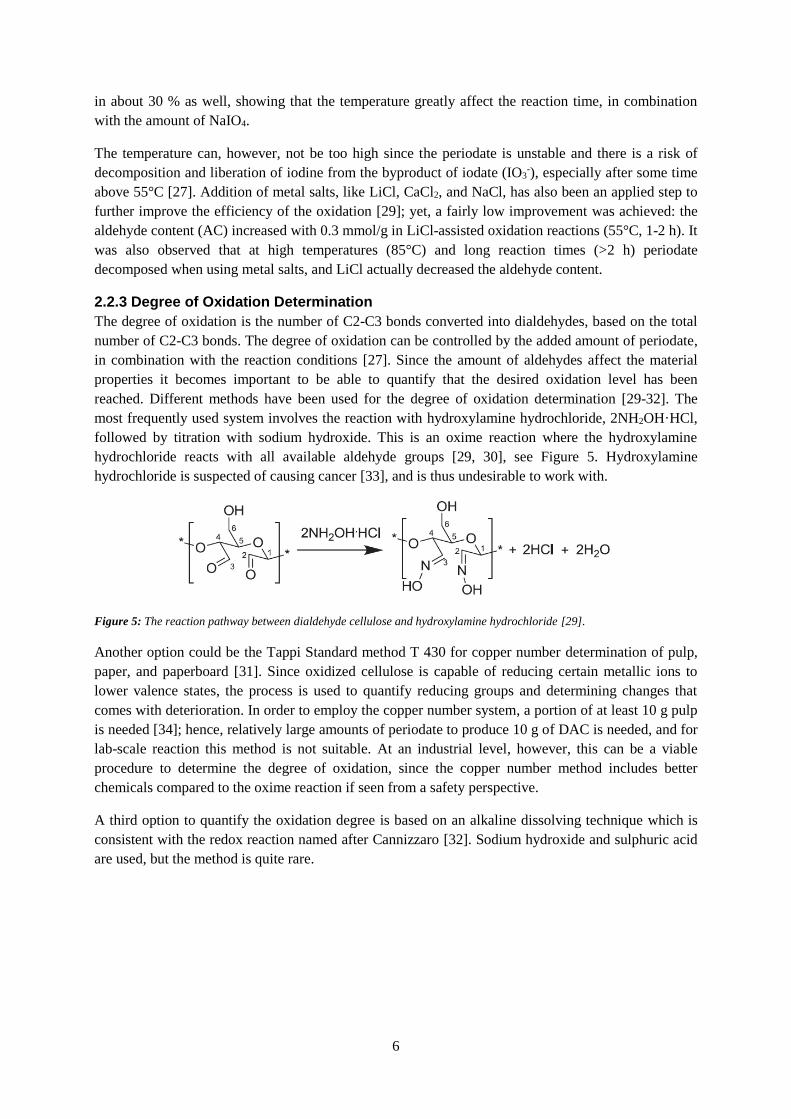
reached. Different methods have been used for the degree of oxidation determination [29-32]. The
most frequently used system involves the reaction with hydroxylamine hydrochloride, 2NH2OH·HCl,
followed by titration with sodium hydroxide. This is an oxime reaction where the hydroxylamine
hydrochloride reacts with all available aldehyde groups [29, 30], see Figure 5. Hydroxylamine
hydrochloride is suspected of causing cancer [33], and is thus undesirable to work with.
Figure 5: The reaction pathway between dialdehyde cellulose and hydroxylamine hydrochloride [29].
Another option could be the Tappi Standard method T 430 for copper number determination of pulp,
paper, and paperboard [31]. Since oxidized cellulose is capable of reducing certain metallic ions to
lower valence states, the process is used to quantify reducing groups and determining changes that
comes with deterioration. In order to employ the copper number system, a portion of at least 10 g pulp
is needed [34]; hence, relatively large amounts of periodate to produce 10 g of DAC is needed, and for
lab-scale reaction this method is not suitable. At an industrial level, however, this can be a viable
procedure to determine the degree of oxidation, since the copper number method includes better
chemicals compared to the oxime reaction if seen from a safety perspective.
A third option to quantify the oxidation degree is based on an alkaline dissolving technique which is
consistent with the redox reaction named after Cannizzaro [32]. Sodium hydroxide and sulphuric acid
are used, but the method is quite rare.
7
2.3 REGENERATION OF PERIODATE
Periodate oxidants are environmentally harmful and expensive. In order to achieve a realistic industrial
production, an efficient regeneration and recycling of the iodine byproduct is essential. When it comes
to the production of dialdehyde starch (DAS), both electrochemical methods and secondary oxidations
agents have been used to study the regeneration of a spent iodate solution [35-38]. In contrast, the
regeneration and recycling of periodate solutions in DAC production has not been studied as much.
However, the same conditions employed for DAS should be valid for the regeneration of periodate
from DAC production.
2.3.1 Sodium Hypochlorite
Sodium hypochlorite is a secondary oxidant that has been used in the regeneration process of an
aqueous periodate solution [39]. Iodate, IO3-, will be converted back to periodate according to the total
reaction of [40]:
NaOCl + NaIO3 + 2NaOH NaCl + Na3H2IO6
Periodate in the form of Na3H2IO6 is obtained as a white precipitate under alkaline conditions [41].
Na3H2IO6 is associated with several names and these are: sodium paraperiodate, sodium hydrogen
periodate, sodium triparaperiodate, and trisodium dihydrogen orthoperiodate [42]. Hereinafter, sodium
paraperiodate is used in this context.
Soluble metaperiodate is generated if the pH of the solution is lowered to 2.5 with HCl [39]. However,
by separating the precipitated powder, a clean product is easily obtained instead of being mixed in
solution with all other components. In the study of DAC done by Liimatainen et al. [39], it was shown
that a high amount of hypochlorite, NaOCl, was needed during a reaction time of 2 hours to reach a
periodate recovery of 95 %. Here, a high amount of the secondary oxidant refers to 3.3 times of
hypochlorite compared to the required stoichiometric values calculated from the spent periodate
amounts after the oxidation reaction. With a reaction time of 30 min the regeneration efficiency was
too low (62 %). The reaction needed to be performed under high temperatures, something that affects
energy consumption and cost. The highest regeneration efficiency was using filtrate from periodate
oxidation times as short as 10 and 15 min. Higher amounts of soluble impurities come due to longer
periodate reaction times, and this leads to consumption of hypochlorite in side-reactions. Hence, long
periodate oxidation times can decrease the percentage of recovered periodate [39]. Another
disadvantage using hypochlorite is the formation of chlorinated by-products [37].
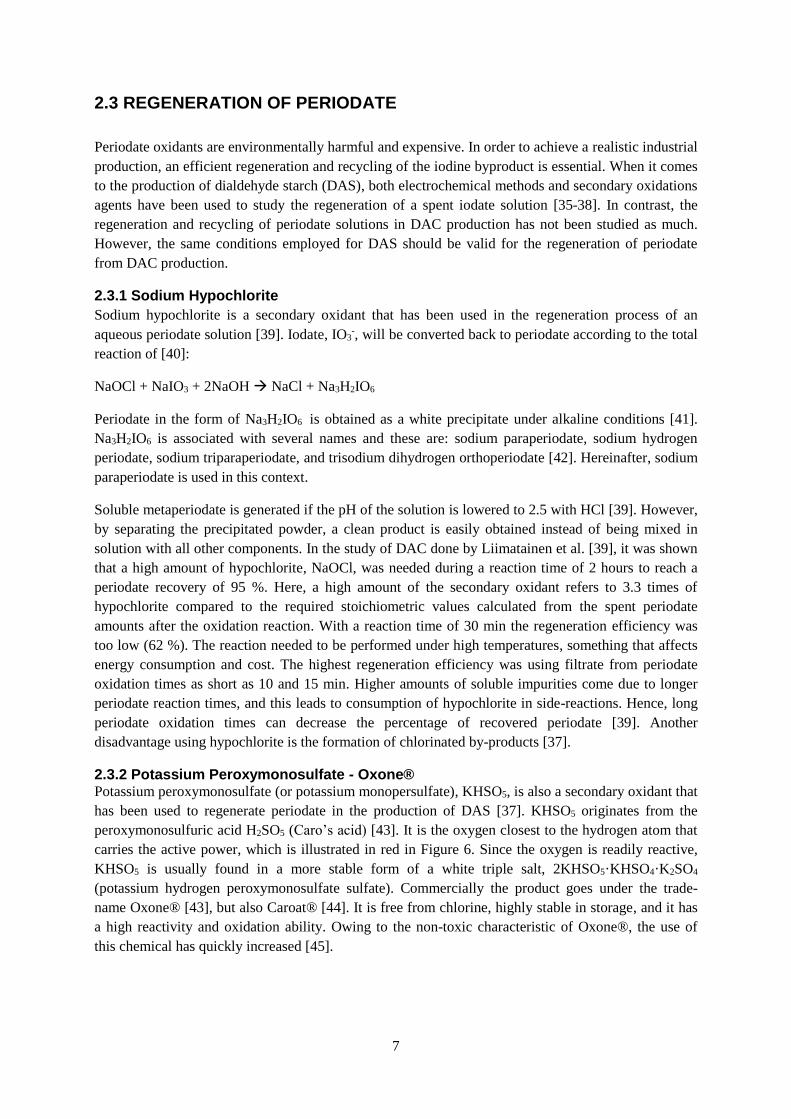
2.3.2 Potassium Peroxymonosulfate - Oxone® Potassium peroxymonosulfate (or potassium monopersulfate), KHSO5, is also a secondary oxidant that
has been used to regenerate periodate in the production of DAS [37]. KHSO5 originates from the
peroxymonosulfuric acid H2SO5 (Caro’s acid) [43]. It is the oxygen closest to the hydrogen atom that
carries the active power, which is illustrated in red in Figure 6. Since the oxygen is readily reactive,
KHSO5 is usually found in a more stable form of a white triple salt, 2KHSO5·KHSO4·K2SO4
(potassium hydrogen peroxymonosulfate sulfate). Commercially the product goes under the trade-
name Oxone® [43], but also Caroat® [44]. It is free from chlorine, highly stable in storage, and it has
a high reactivity and oxidation ability. Owing to the non-toxic characteristic of Oxone®, the use of
this chemical has quickly increased [45].
8
Figure 6: The red marked O representing the active oxygen in KHSO5 [43].
KHSO5 is used for many oxidation reactions, and it has a thermodynamic potential high enough to act
as an oxidizing agent in reactions at room temperature [43]. The standard electrode potential (E°) of
KHSO5 is 1.85 V: HSO5– + 2H++ 2e– HSO4
– + H2O. The acidic characteristic of Oxone® gives a
pH of 2.0 at 25°C for a 3 % solution. Generally, the oxidant is very stable in solid state and relatively
stable as an aqueous solution. However, if the pH is increased above 7, this stability is reduced and
about pH 9 the stability reaches its minimum [43].
In the patent by Besemer regarding the recovery process for spent periodate by Oxone® treatment, it is
suggested that at least an equimolar amount of potassium peroxymonosulfate or persulfuric acid needs
to be added to the iodate solution in order to regenerate periodate [37]. There are several advantages of
using Oxone® to regenerate periodate, the reaction can be performed under acidic conditions up to a
neutral pH, which is favorable since the solution from the oxidation process of cellulose has a low pH.
Furthermore, short regeneration times and low temperatures, 0-20°C, has been suggested, but
temperatures up to 60 °C can also be used. Another interesting feature is that Oxone® can open up the
possibility to execute the oxidation and recovery process simultaneously in a two-compartment
system, by taking advantage of that both reactions can be performed at the same conditions. With a
continuous or semicontinuous reaction the amount of periodate can significantly be reduced. When
this process was applied to iodate formed from DAS, a white precipitate was formed during the
reaction, but what this precipitate was is not evident.
As an example from Besemer’s patent, 123 g of periodate was added to a batch of 2 l water with 92.4
g of potato starch (dry weight) followed by stirring in the dark for 6 days. Thereafter, 195 g of
Oxone® was stepwise added to the sodium iodate solution to achieve regeneration of periodate from
iodate along with other iodine compounds. After every addition, pH dropped to about 4. Sodium
hydroxide solution was therefore supplemented to increase the pH to 6-7. Due to the conversion of
HSO4- to H+ and SO4
-, pH then started to decrease again. Commercial sodium iodate was also used in
small-scale to regenerate periodate by mixing 2.13 g sodium iodate (10.8 mmol) with 3.5 g Oxone®
(10.2 mmol HSO5-) for one night. After this, 2.12 g potato starch was added and the mixture stirred for
5 hours to produce dialdehyde starch using the regenerated periodate [37]. Nevertheless, no
information regarding recovery efficiency or dialdehyde content was mentioned.
To the author’s best knowledge, no further information can be attained regarding potassium
peroxymonosulfate in the periodate recovery process.
2.3.3 Additional Recovery Methods for Periodate
The spent oxidant solution after starch oxidation has been recovered by first separating the liquid
medium from the dialdehyde starch followed by the use of ozone. This treatment is preferably carried
out at a temperature between 5 and 40°C and under basic conditions where a periodate precipitate is
formed at pH > 8. If pH is above 10.5, ozone disintegrates. The importance of removing
9
contaminations, such as sugars and formic acid, from the iodate solution before implementing the
regeneration step has been observed. The concentration of the gas stream was about 4 wt % and
remaining ozone in the outflowing gas stream was destroyed using a catalyst. In one example, 80 g
(0.45 mol) HIO3 was dissolved in 1500 mL water and pH was subsequently adjusted to 8.5 followed
by supplementing the solution with water to 2 kg. Ozone (1 equivalent with respect to HIO3) was
passed through the solution for 5 hours at 35°C. After the periodate precipitate had been formed, it
was separated from the liquid and suspended in water before adjusting pH to 3. Thereafter, 374 g
potato starch was added and kept under stirring for 3 hours at 35°C, resulting in a yield of 96.6 % and
an aldehyde content of 8.0 % [41].
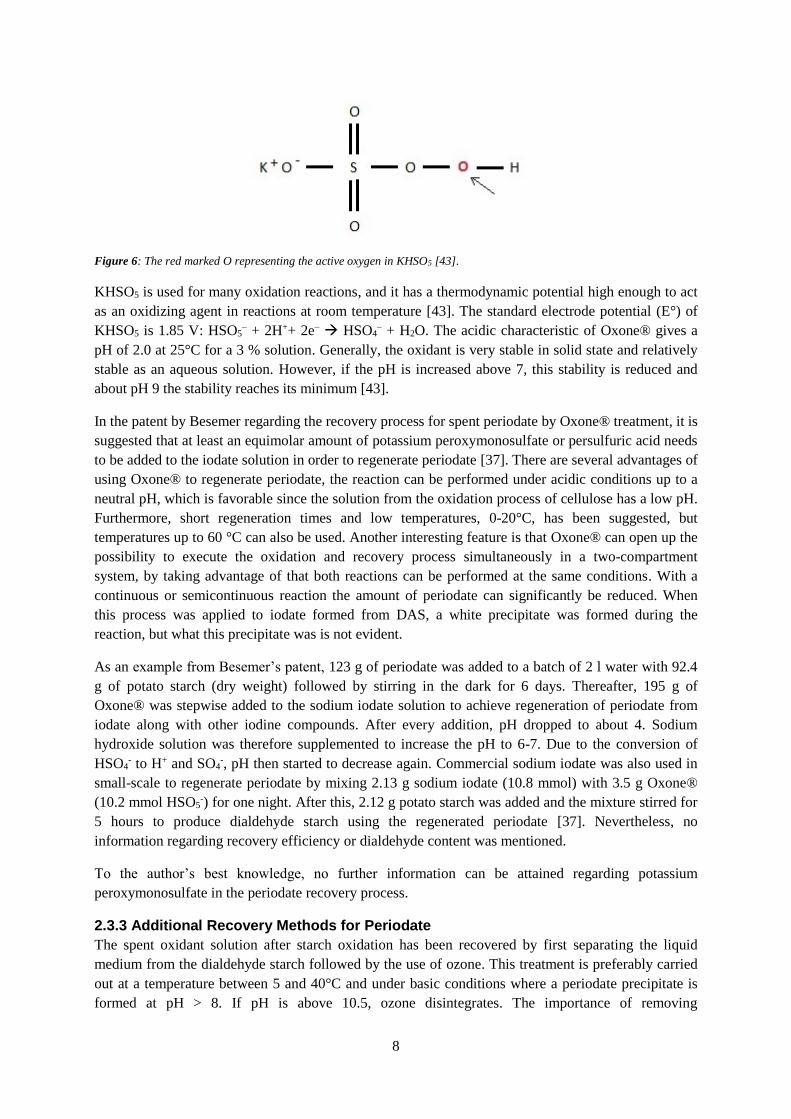
The regeneration of periodate has also been studied related to chlorination of iodide-containing waters
in the presence of CuO. It was hypothesized that CuO works as a catalyst and both CuO-HOCl and
CuO-HBr were tested in reactions with iodate, see Figure 7. Based on the reduction potentials for
bromine and chlorine in the pH range 6.6-9.6, oxidation of IO3- to IO4
- is thermodynamically possible.
Ion chromatography and scanning electron microscopy were used to measure the extent of IO4- that
was formed, and this confirmed an adsorption of IO4- to the surface of CuO. A reaction time of 60
minutes was employed, and 40 % of the iodate was oxidized to periodate [46].
Figure 7: The reaction pathway from iodate to periodate connected with CuO [46].
McGuire and Mehltretter [38] suggested another possible method for periodate recovery by using
chlorine. Chlorine reacts with sodium iodate according to:
NaIO3 + Cl2 + 4NaOH Na3H2IO6 + 2NaCl + H2O
Five small-scale oxidations of starch were performed where regenerated periodic acid was utilized.
First, sodium iodate was prepared by reacting 100 g of iodine with 125 g of sodium chlorate at a
temperature of 40-50°C for 3 h. Subsequently, 200 mL of water was added to the sodium iodate
solution and also 140 g of sodium hydroxide pellets was added. To this hot solution, 75 g of chlorine
gas was allowed to pass into the mixture for 1 h. To complete the conversion to insoluble sodium
paraperiodate, pH was adjusted to 11.5 by addition of sodium hydroxide solution. Thirdly, the reaction
was cooled to room temperature and the product was filtered and washed with cold water. The crude
precipitate was then dried at 110°C and the yield of recovered product measured to be 97 % of the
theoretical value. Some of the produced sodium paraperiodate was subsequently added to 400 ml
water and pH was adjusted to 1.5 with 75 mL of 50 wt% of sulfuric acid. The beaker was placed in a
circulating water bath and cooled to around 20°C before 68.8 g corn starch (dry basis) in 100 mL of
10
water was added to the periodic acid solution. The reaction was performed for 4 h at 32°C and the
aldehyde content was finally analyzed to at least 97 % in the experiments [38] .
The utilization of pure chemicals may not be the only optimal way to recover periodate, and
electrochemistry has been suggested as a potential technique to employ [35, 36, 47, 48]. Oxidation of
iodates can then be performed using a divided cell with a Pb-PbO2 anode and a lead cathode [47].
Another work presented is the patent by Mehltretter and William who transformed iodic acid to
periodic acid with a lead dioxide anode and a lead cathode. The oxidation of the polysaccharide
(starch, cellulose or the like) takes place with a catalytic amount of periodic acid. The amount is less
than equivalent to the polysaccharide that is being oxidized, and this is possible since periodic acid is
continuously regenerated electrolytically. The process is carried out in a two-compartment cell in
which the anolyte (the portion of the electrolyte which is on the anode side) and catholyte (the portion
of the electrolyte nearest the cathode) are separated by a porous barrier which hinders circulation of
the electrolytes. In the anolyte compartment the polysaccharide is found together with a small amount
of iodic acid (less than equivalent to the polysaccharide). The catholyte used is a dilute solution,
unreactive to the anode, such as sulfuric acid. Both the oxidation of the starch and the regeneration of
the periodic acid are carried out in the same reaction cell, an anode cell. In that way, the electrolytic
oxidation of iodic acid to periodic acid takes place and the polysaccharide is in turn being oxidized
chemically by the periodic acid. Periodic acid is then again reduced back to iodic acid and the cycle
continues [48]. Drawbacks worth to mention are that organic material can damage the electrode and
the electrode metal may contaminate the starch [41].
11
2.4 MODDE – DESIGN OF EXPERIMENTS
Design of Experiments (DOE) is a system used for creating a set of experiments that represents a
problem or a question. DOE can be used for optimization and development of different processes. The
system helps in finding optimal production conditions, and shows how different factors can be
combined in order to achieve knowledge in the experimental area of business and research. The
different purposes can be improvement of existing merchandises, development of new products, and
screening of important factors or optimization of the quality of a product [49].
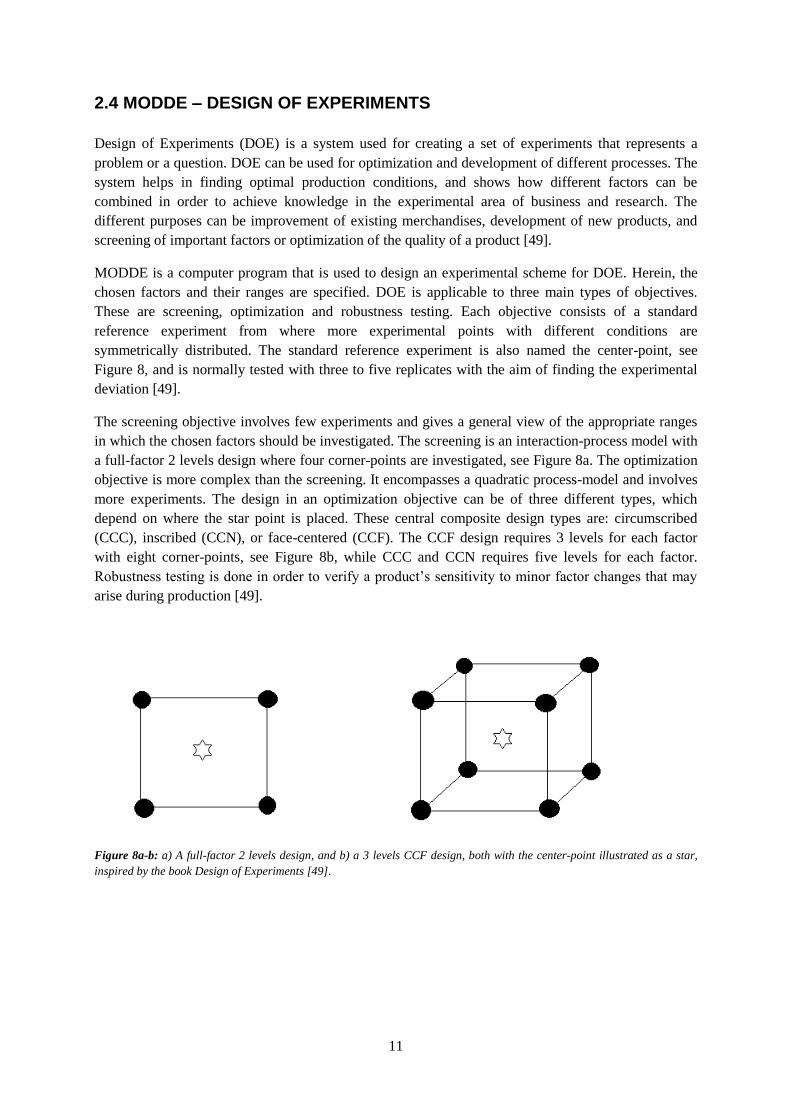
MODDE is a computer program that is used to design an experimental scheme for DOE. Herein, the
chosen factors and their ranges are specified. DOE is applicable to three main types of objectives.
These are screening, optimization and robustness testing. Each objective consists of a standard
reference experiment from where more experimental points with different conditions are
symmetrically distributed. The standard reference experiment is also named the center-point, see
Figure 8, and is normally tested with three to five replicates with the aim of finding the experimental
deviation [49].
The screening objective involves few experiments and gives a general view of the appropriate ranges
in which the chosen factors should be investigated. The screening is an interaction-process model with
a full-factor 2 levels design where four corner-points are investigated, see Figure 8a. The optimization
objective is more complex than the screening. It encompasses a quadratic process-model and involves
more experiments. The design in an optimization objective can be of three different types, which
depend on where the star point is placed. These central composite design types are: circumscribed
(CCC), inscribed (CCN), or face-centered (CCF). The CCF design requires 3 levels for each factor
with eight corner-points, see Figure 8b, while CCC and CCN requires five levels for each factor.
Robustness testing is done in order to verify a product’s sensitivity to minor factor changes that may
arise during production [49].
Figure 8a-b: a) A full-factor 2 levels design, and b) a 3 levels CCF design, both with the center-point illustrated as a star,
inspired by the book Design of Experiments [49].
12
3. EXPERIMENTAL
3.1 MATERIALS
Bleached unbeaten softwood kraft pulp (F081 Press KM8) was kindly supplied from Stora Enso AB
(Skoghall pulp mill, Sweden) and used as cellulose source. The fibers were first soaked in water for
four hours and then disintegrated in a standard disintegrator for 30 000 revolutions in 2 liter batches
(10 g/L dry basis). All calculations are based on the assumption that the fibers contain 100 %
cellulose. The chemicals used in the study during the oxidation step and the regeneration step were all
supplied by Sigma-Aldrich: Sodium metaperiodate (NaIO4; ≥99.0%), Oxone® (monopersulfate
compound), and Sodium hypochlorite solution (NaOCl; purum ~10% RT). Additional chemicals
needed for the different analytical methods were bought from Sigma-Aldrich as well: Hydroxylamine
hydrochloride (NH2OH·HCl; ReagentPlus® 99%), Methyl Orange solution (indicator 0.1 %), N,N-
Diethyl-p-phenylenediamine (DPD; 97%), and Potassium Phosphate Monobasic Anhydrous and
Sodium Phosphate Dibasic Heptahydrate. The chemicals were used as received without further
purification. Sodium hydroxide pellets (NaOH; reagent grade 99.3%) from VWR International AB
were used in order to make a 0.1 M and a 5 M NaOH-solution. 5 M HCl-solution was prepared from
fuming hydrochloric acid (HCl; 37 % for analysis EMSURE® ACS) from Merck Millipore. Sodium
paraperiodate (Na2H3IO6; ≥99.0%) from Sigma-Aldrich was used as the reference in FTIR
spectrophotometer analyses.
3.2 METHODS Prior to the laboratory work, safety aspects regarding each chemical were considered, see Risk
Assessments Appendix VIII.
3.2.1 Periodate Oxidation of Cellulose
MODDE was used to set up the conditions to perform a screening. 80 g of 1 % pulp solution (dry
content 0.8 g pulp) was transferred to a 250 mL Erlenmeyer flask. NaIO4 (0.8-1.6 g; ratio 1-2) was
added. A rubber septum with a cannula was employed to not close the system completely. The
reaction was conducted in a heated silicone oil bath under stirring with the temperature set to 50°C. To
prevent photo-induced decomposition of periodate, the system was covered with aluminum foil. The
reaction was conducted for 2-8 h and subsequently cooled down to room temperature. Thereafter, the
oxidized fibers were filtered off with a Büchner funnel and thoroughly washed six times (30 mL each
time) by stirring the fibers in water and successively filtering off the water. The filtrates, containing
NaIO3 and residual NaIO4, were saved at 4°C for further analysis of the periodate concentration. When
this was done, the filtrate was analyzed and scanned with a spectrophotometer (Evolution 201, UV-
visible, Thermo Scientific, US) between 300 and 700 nm (dilution 1:100) to check the IO4-
concentration. The mass of the oxidized cellulose, DAC, was measured with a balance (Precisa
410AM-FR, Precisa Gravimetrics AG, Switzerland) in order to calculate the yield percentage. The
oxidized product was stored at 4°C until the aldehyde content was analyzed (not for longer than 24
hours after the reaction).
3.2.1.1 MODDE 1
By utilizing MODDE, the DOE concept was used as a framework when planning the laboratory work.
A full factor (2 levels) screening was set up for the oxidation process and performed in the run order
presented in Table 1. The ratio between NaIO4 and cellulose refers to the amount used in g, for
example, 2 g NaIO4 to 1 g fiber gives the ratio of 2.
13
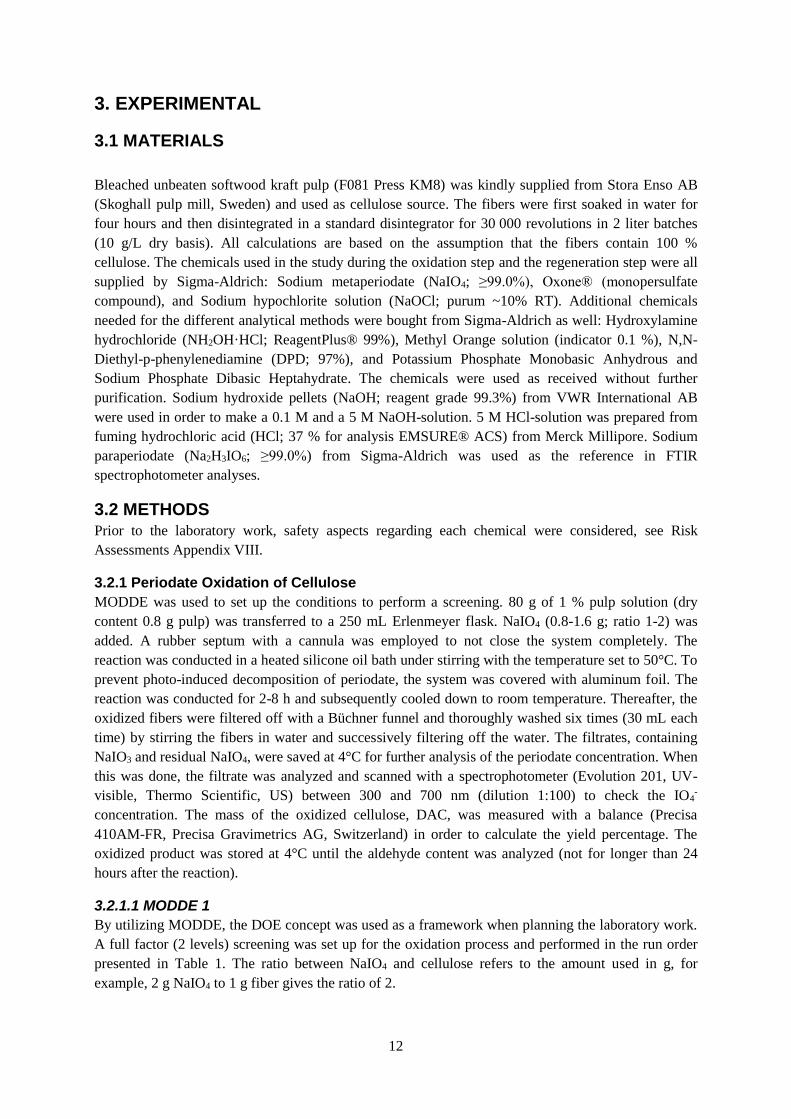
Table 1: The screening used for the periodate oxidation study made with MODDE. A constant temperature of 50°C was
applied. Ratio is based on g NaIO4 / g fiber. The experiments were performed according to run order.
Exp. No. Run
Order
Ratio in g
NaIO4/fiber
Oxidation
time (h)
1 4 1 2
2 1 2 2
3 3 1 8
4 2 2 8
5 5 1.5 5
6 6 1.5 5
7 7 1.5 5
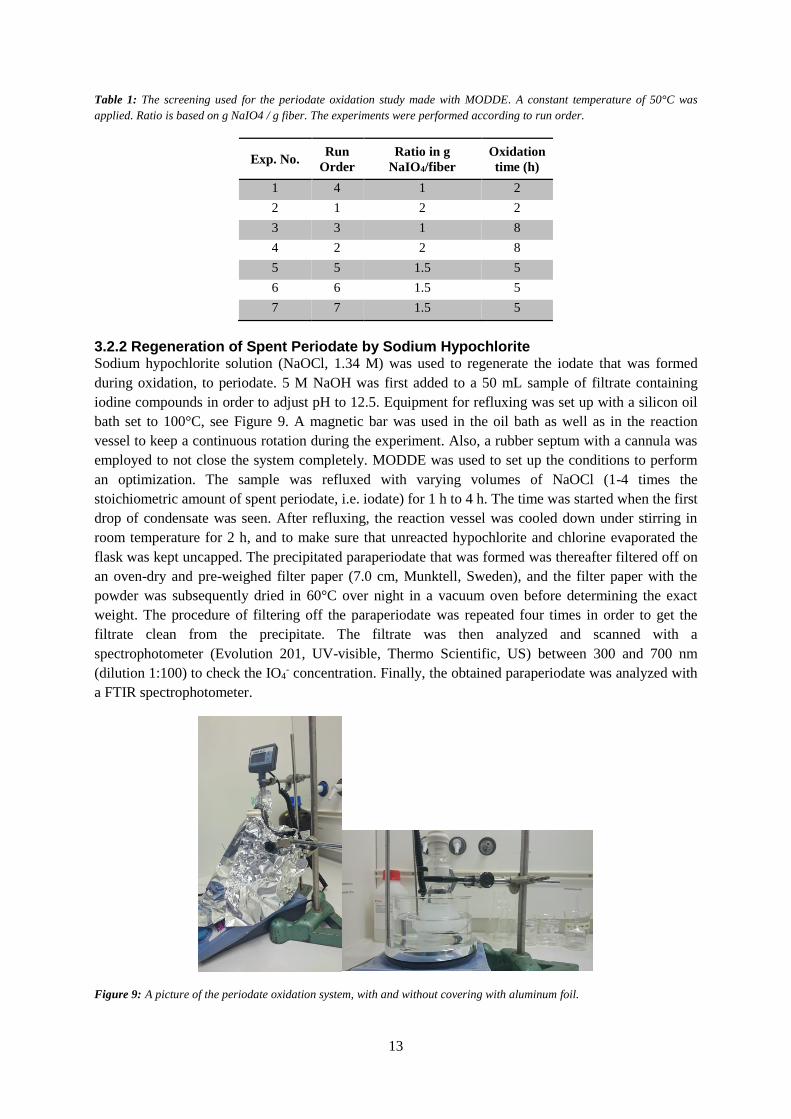
3.2.2 Regeneration of Spent Periodate by Sodium Hypochlorite Sodium hypochlorite solution (NaOCl, 1.34 M) was used to regenerate the iodate that was formed
during oxidation, to periodate. 5 M NaOH was first added to a 50 mL sample of filtrate containing
iodine compounds in order to adjust pH to 12.5. Equipment for refluxing was set up with a silicon oil
bath set to 100°C, see Figure 9. A magnetic bar was used in the oil bath as well as in the reaction
vessel to keep a continuous rotation during the experiment. Also, a rubber septum with a cannula was
employed to not close the system completely. MODDE was used to set up the conditions to perform
an optimization. The sample was refluxed with varying volumes of NaOCl (1-4 times the
stoichiometric amount of spent periodate, i.e. iodate) for 1 h to 4 h. The time was started when the first
drop of condensate was seen. After refluxing, the reaction vessel was cooled down under stirring in
room temperature for 2 h, and to make sure that unreacted hypochlorite and chlorine evaporated the
flask was kept uncapped. The precipitated paraperiodate that was formed was thereafter filtered off on
an oven-dry and pre-weighed filter paper (7.0 cm, Munktell, Sweden), and the filter paper with the
powder was subsequently dried in 60°C over night in a vacuum oven before determining the exact
weight. The procedure of filtering off the paraperiodate was repeated four times in order to get the
filtrate clean from the precipitate. The filtrate was then analyzed and scanned with a
spectrophotometer (Evolution 201, UV-visible, Thermo Scientific, US) between 300 and 700 nm
(dilution 1:100) to check the IO4- concentration. Finally, the obtained paraperiodate was analyzed with
a FTIR spectrophotometer.
Figure 9: A picture of the periodate oxidation system, with and without covering with aluminum foil.
14
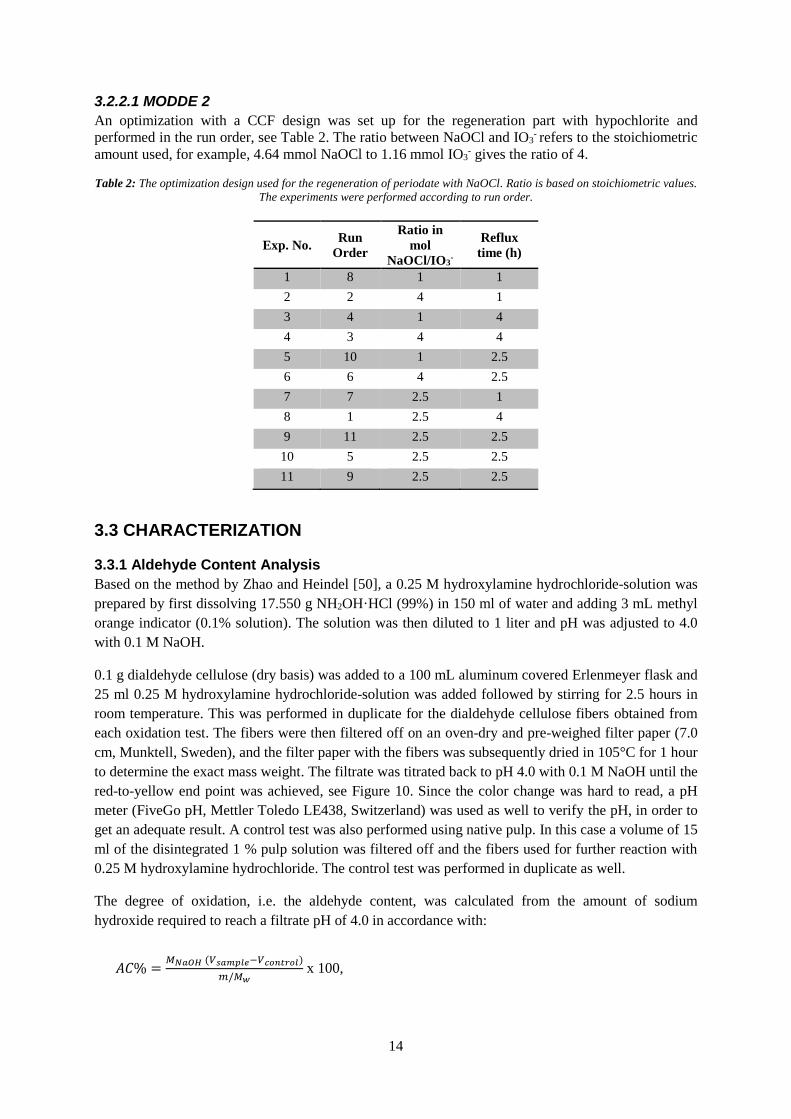
3.2.2.1 MODDE 2
An optimization with a CCF design was set up for the regeneration part with hypochlorite and
performed in the run order, see Table 2. The ratio between NaOCl and IO3- refers to the stoichiometric
amount used, for example, 4.64 mmol NaOCl to 1.16 mmol IO3- gives the ratio of 4.
Table 2: The optimization design used for the regeneration of periodate with NaOCl. Ratio is based on stoichiometric values.
The experiments were performed according to run order.
Exp. No. Run
Order
Ratio in
mol
NaOCl/IO3-
Reflux
time (h)
1 8 1 1
2 2 4 1
3 4 1 4
4 3 4 4
5 10 1 2.5
6 6 4 2.5
7 7 2.5 1
8 1 2.5 4
9 11 2.5 2.5
10 5 2.5 2.5
11 9 2.5 2.5
3.3 CHARACTERIZATION
3.3.1 Aldehyde Content Analysis
Based on the method by Zhao and Heindel [50], a 0.25 M hydroxylamine hydrochloride-solution was
prepared by first dissolving 17.550 g NH2OH·HCl (99%) in 150 ml of water and adding 3 mL methyl
orange indicator (0.1% solution). The solution was then diluted to 1 liter and pH was adjusted to 4.0
with 0.1 M NaOH.
0.1 g dialdehyde cellulose (dry basis) was added to a 100 mL aluminum covered Erlenmeyer flask and
25 ml 0.25 M hydroxylamine hydrochloride-solution was added followed by stirring for 2.5 hours in
room temperature. This was performed in duplicate for the dialdehyde cellulose fibers obtained from
each oxidation test. The fibers were then filtered off on an oven-dry and pre-weighed filter paper (7.0
cm, Munktell, Sweden), and the filter paper with the fibers was subsequently dried in 105°C for 1 hour
to determine the exact mass weight. The filtrate was titrated back to pH 4.0 with 0.1 M NaOH until the
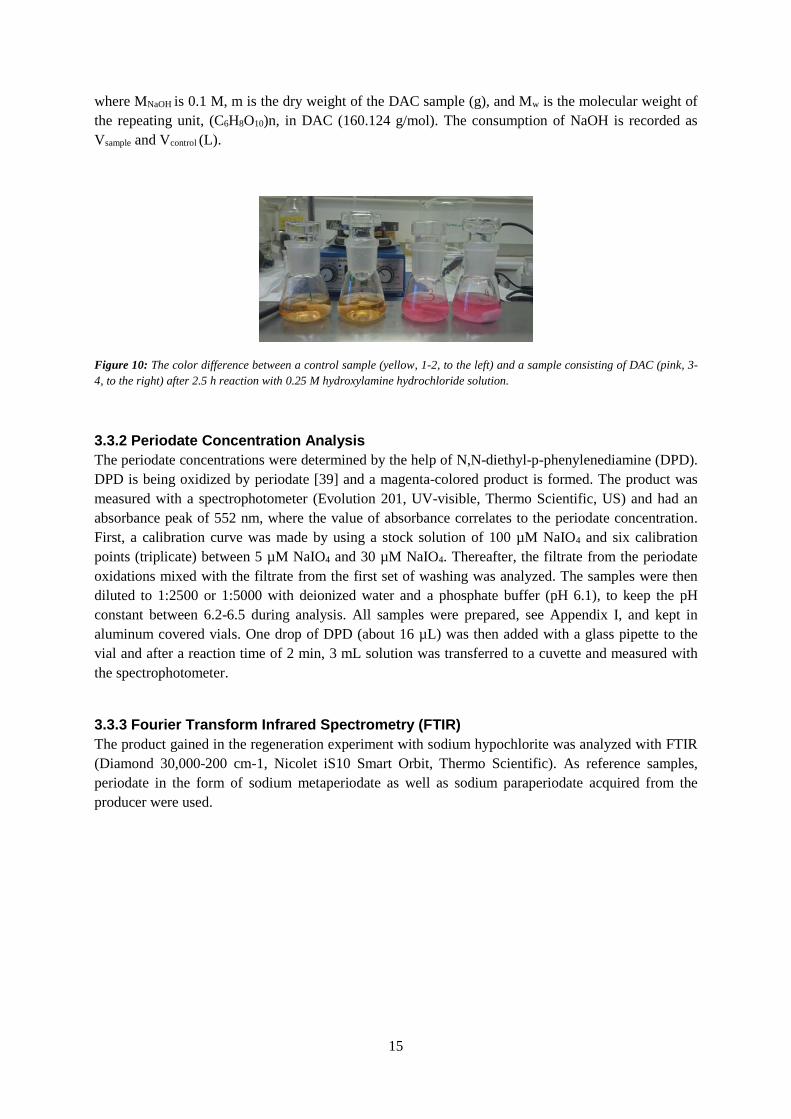
red-to-yellow end point was achieved, see Figure 10. Since the color change was hard to read, a pH
meter (FiveGo pH, Mettler Toledo LE438, Switzerland) was used as well to verify the pH, in order to
get an adequate result. A control test was also performed using native pulp. In this case a volume of 15
ml of the disintegrated 1 % pulp solution was filtered off and the fibers used for further reaction with
0.25 M hydroxylamine hydrochloride. The control test was performed in duplicate as well.
The degree of oxidation, i.e. the aldehyde content, was calculated from the amount of sodium
hydroxide required to reach a filtrate pH of 4.0 in accordance with:
𝐴𝐶% =𝑀𝑁𝑎𝑂𝐻 (𝑉𝑠𝑎𝑚𝑝𝑙𝑒−𝑉𝑐𝑜𝑛𝑡𝑟𝑜𝑙)
𝑚/𝑀𝑤 x 100,
15
where MNaOH is 0.1 M, m is the dry weight of the DAC sample (g), and Mw is the molecular weight of
the repeating unit, (C6H8O10)n, in DAC (160.124 g/mol). The consumption of NaOH is recorded as
Vsample and Vcontrol (L).
Figure 10: The color difference between a control sample (yellow, 1-2, to the left) and a sample consisting of DAC (pink, 3-
4, to the right) after 2.5 h reaction with 0.25 M hydroxylamine hydrochloride solution.
3.3.2 Periodate Concentration Analysis
The periodate concentrations were determined by the help of N,N-diethyl-p-phenylenediamine (DPD).
DPD is being oxidized by periodate [39] and a magenta-colored product is formed. The product was
measured with a spectrophotometer (Evolution 201, UV-visible, Thermo Scientific, US) and had an
absorbance peak of 552 nm, where the value of absorbance correlates to the periodate concentration.
First, a calibration curve was made by using a stock solution of 100 µM NaIO4 and six calibration
points (triplicate) between 5 µM NaIO4 and 30 µM NaIO4. Thereafter, the filtrate from the periodate
oxidations mixed with the filtrate from the first set of washing was analyzed. The samples were then
diluted to 1:2500 or 1:5000 with deionized water and a phosphate buffer (pH 6.1), to keep the pH
constant between 6.2-6.5 during analysis. All samples were prepared, see Appendix I, and kept in
aluminum covered vials. One drop of DPD (about 16 µL) was then added with a glass pipette to the
vial and after a reaction time of 2 min, 3 mL solution was transferred to a cuvette and measured with
the spectrophotometer.
3.3.3 Fourier Transform Infrared Spectrometry (FTIR)
The product gained in the regeneration experiment with sodium hypochlorite was analyzed with FTIR
(Diamond 30,000-200 cm-1, Nicolet iS10 Smart Orbit, Thermo Scientific). As reference samples,
periodate in the form of sodium metaperiodate as well as sodium paraperiodate acquired from the
producer were used.
16
4. RESULTS AND DISCUSSION
4.1 PERIODATE OXIDATION OF CELLULOSE
The periodate oxidation of cellulose was performed with a 1 % pulp solution, employing tap water, in
reaction with sodium metaperiodate as the only added chemical. This small-scale experiment is aiming
to be kept as simple as possible to be able to execute the process at an industrial level.
The screening option in MODDE is normally used in the beginning of an experimental procedure, and
this type of DOE was here chosen to verify earlier results and to get a better understanding of the
oxidation process factors at the temperature of 50°C. A higher temperature was not chosen due to the
possible risk of periodate decomposition and subsequent complications in estimating the correct
amount of consumed periodate. The aldehyde content (AC) was measured by the use of a 0.25 M
hydroxylamine hydrochloride solution following titration according to the method described in section
3.3.1. The results from the periodate oxidation of cellulose is presented in Table 3. In the chosen
screening design the center-point was tested three times with a resulting average AC of 48 to 52 %. In
the other four tests the aldehyde content varied between 14 and 80 %. Worth noting is also that the
highly oxidized fibers from experiment number 4 was slightly different from the rest. The material
was looser and had almost a plastic feeling. This can most probably be explained by the high aldehyde
content. Overall, the mass yield of DAC was above 93 %, and in three experiments as high as 98-100
%, see Table 3. This proves that a small amount of material was lost throughout the experiments.
Table 3: The results on the average AC from the periodate oxidation of cellulose. Ratio is based on g NaIO4 / g fiber. The
experiments were performed in run order. For more exact calculations see Appendix IV.
Exp. No. Run
Order
Ratio in g
NaIO4/cellulose
Reaction
time (h)
Average
AC (%)
Yield
(%)
1 4 1 2 14 -
2 1 2 2 34 -
3 3 1 8 38 100
4 2 2 8 80 93
5 5 1.5 5 52 94
6 6 1.5 5 50 100
7 7 1.5 5 48 98
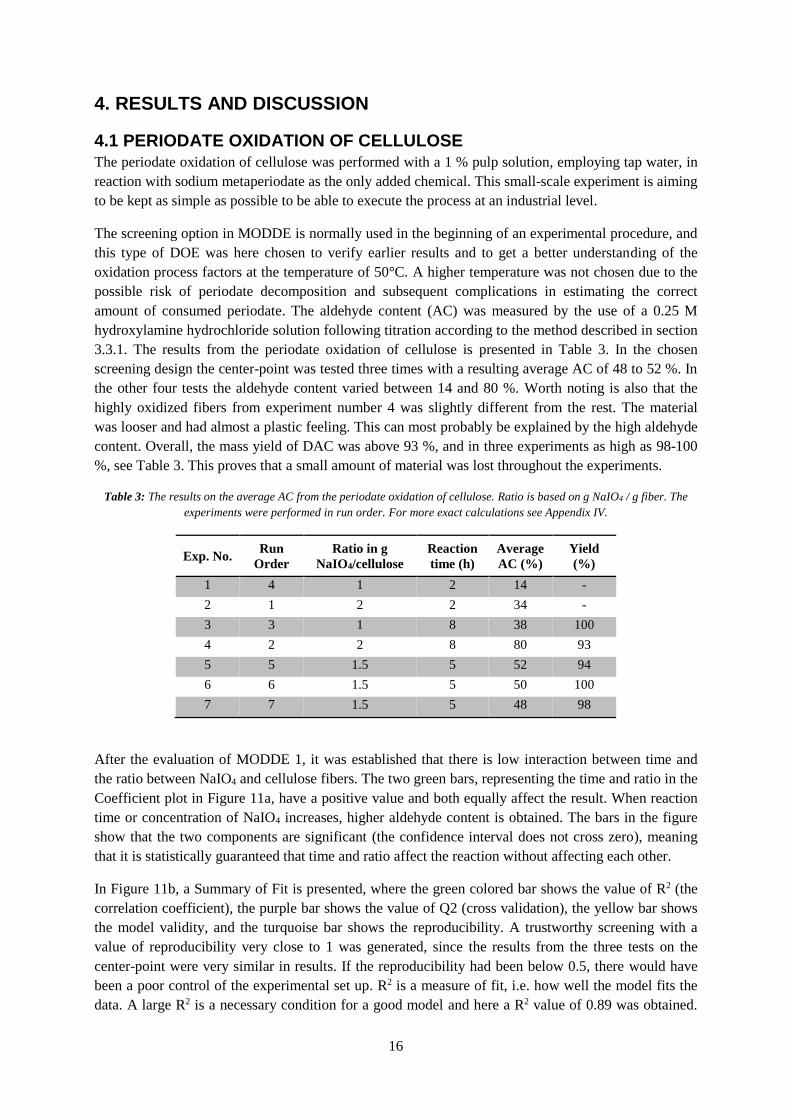
After the evaluation of MODDE 1, it was established that there is low interaction between time and
the ratio between NaIO4 and cellulose fibers. The two green bars, representing the time and ratio in the
Coefficient plot in Figure 11a, have a positive value and both equally affect the result. When reaction
time or concentration of NaIO4 increases, higher aldehyde content is obtained. The bars in the figure
show that the two components are significant (the confidence interval does not cross zero), meaning
that it is statistically guaranteed that time and ratio affect the reaction without affecting each other.
In Figure 11b, a Summary of Fit is presented, where the green colored bar shows the value of R2 (the
correlation coefficient), the purple bar shows the value of Q2 (cross validation), the yellow bar shows
the model validity, and the turquoise bar shows the reproducibility. A trustworthy screening with a
value of reproducibility very close to 1 was generated, since the results from the three tests on the
center-point were very similar in results. If the reproducibility had been below 0.5, there would have
been a poor control of the experimental set up. R2 is a measure of fit, i.e. how well the model fits the
data. A large R2 is a necessary condition for a good model and here a R2 value of 0.89 was obtained.
17
Q2 expresses how well the model predicts new data. It is the percent of the variation of the response
predicted by the model according to cross validation. The closer the green and purple bars are to 1 the
better the model. Q2 had a value of 0.80 with two PLS-components in this model (PLS = Principal
Component Analysis). A high Q2 value validates that a useful method has been obtained, which is the
case in this study of periodate oxidation. Furthermore, the yellow pile in this evaluation is fairly low,
0.11. A model validity bar of 1 represents a perfect model. When the model validity bar is below 0.25
there is a lack of fit. If one value is taken away, the model simply breaks. However, the lack of fit can
either be true or artificial. Usually when having a true lack of fit, both R2 and Q2 will be small. R2 and
Q2 are not small in these results; thereby, the lack of fit is artificial. In this case a screening design was
chosen and the lowest amount of tests was performed. One value cannot be taken away since there are
only four investigated corner-points. This is probably the reason why this yellow bar is so low and
why an artificial lack of fit was acquired. Most likely, a better result with higher model validity would
have been achieved if more tests had been done or if the optimization design option had been chosen.
A better model validity would have given an even better Q2 value as well.
Figure 11a-b: a) Coefficient plot - The two bars, ratio and time, affect the reaction equally. b) Summary of fit with four bars.
Green = R2: 0.89, purple = Q2: 0.80, yellow = model validity with an artificial lack of fit: 0.11, and turquoise =
reproducibility: 0.99.
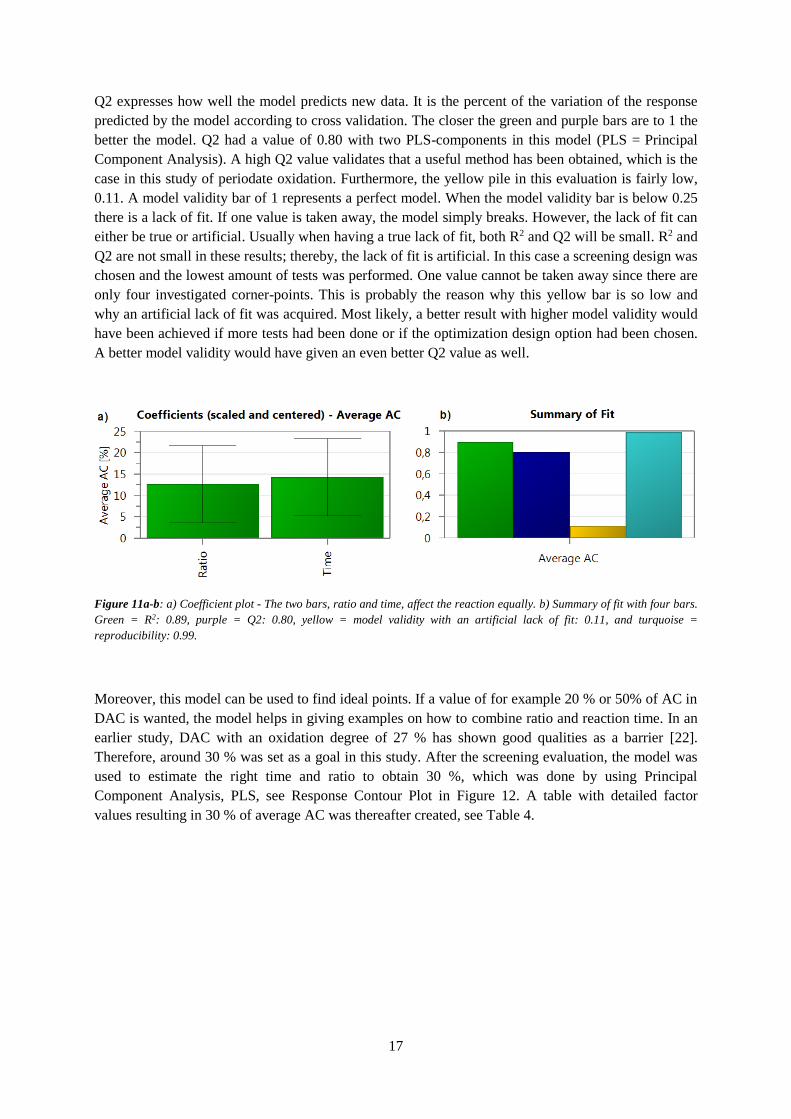
Moreover, this model can be used to find ideal points. If a value of for example 20 % or 50% of AC in
DAC is wanted, the model helps in giving examples on how to combine ratio and reaction time. In an
earlier study, DAC with an oxidation degree of 27 % has shown good qualities as a barrier [22].
Therefore, around 30 % was set as a goal in this study. After the screening evaluation, the model was
used to estimate the right time and ratio to obtain 30 %, which was done by using Principal
Component Analysis, PLS, see Response Contour Plot in Figure 12. A table with detailed factor
values resulting in 30 % of average AC was thereafter created, see Table 4.
18
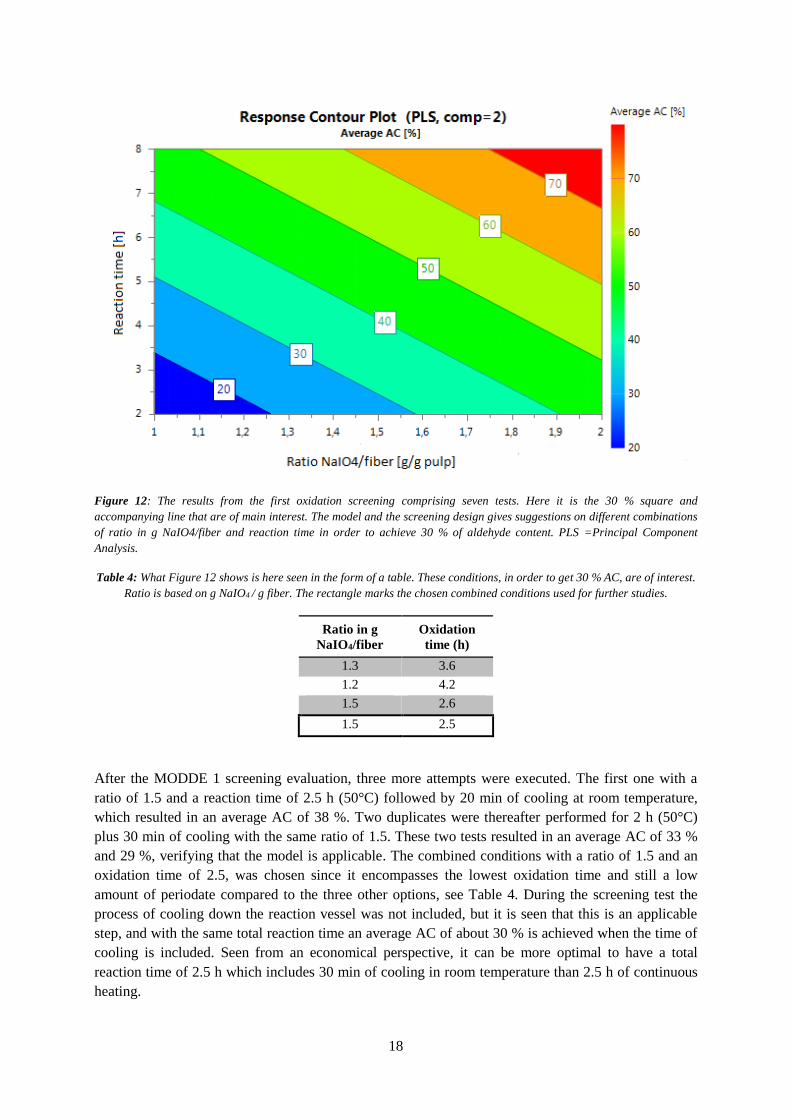
Figure 12: The results from the first oxidation screening comprising seven tests. Here it is the 30 % square and
accompanying line that are of main interest. The model and the screening design gives suggestions on different combinations
of ratio in g NaIO4/fiber and reaction time in order to achieve 30 % of aldehyde content. PLS =Principal Component
Analysis.
Table 4: What Figure 12 shows is here seen in the form of a table. These conditions, in order to get 30 % AC, are of interest.
Ratio is based on g NaIO4 / g fiber. The rectangle marks the chosen combined conditions used for further studies.
Ratio in g
NaIO4/fiber
Oxidation
time (h)
1.3 3.6
1.2 4.2
1.5 2.6
1.5 2.5
After the MODDE 1 screening evaluation, three more attempts were executed. The first one with a
ratio of 1.5 and a reaction time of 2.5 h (50°C) followed by 20 min of cooling at room temperature,
which resulted in an average AC of 38 %. Two duplicates were thereafter performed for 2 h (50°C)
plus 30 min of cooling with the same ratio of 1.5. These two tests resulted in an average AC of 33 %
and 29 %, verifying that the model is applicable. The combined conditions with a ratio of 1.5 and an
oxidation time of 2.5, was chosen since it encompasses the lowest oxidation time and still a low
amount of periodate compared to the three other options, see Table 4. During the screening test the
process of cooling down the reaction vessel was not included, but it is seen that this is an applicable
step, and with the same total reaction time an average AC of about 30 % is achieved when the time of
cooling is included. Seen from an economical perspective, it can be more optimal to have a total
reaction time of 2.5 h which includes 30 min of cooling in room temperature than 2.5 h of continuous
heating.
19
The stoichiometric amount of NaIO4 needed to oxidize 1 g of cellulose fibers is 1.32 g. In this study,
1.5 g of NaIO4 was added to 1 g of cellulose fibers, which corresponds to a molar ratio of 1.1. With 1.1
times the stoichiometric amount of sodium metaperiodate, an aldehyde content of 30 % was achieved
with a total reaction time of 2.5 h. Compared to earlier studies the result differs. For example, in
Varma’s study a molar ratio of 0.8 needed 12 h to reach an AC of 30 % at the temperature of 55° [27],
which is a significantly longer reaction time. In the study done by Sirviö et al. [18], a molar ratio of
0.8 generated an AC of only 14 % after 3 h at 55°C. In this study a 14 % AC was already reached after
2 h with a molar ratio of 0.8 (Table 3, Exp. No. 1). One possible explanation can be that different
cellulose materials with more or less accessible fibers have been utilized. In the study by Varma [27],
cellulose powder, not fresh cellulose fibers, was used. Sirviö et al. [18], on the other hand, used dried
sheets from bleached birch, which is different from the material used in this study as well.
A small scale-up reaction was performed with 15 g of cellulose fibers with a ratio of 1.5 and a total
reaction time of 3 h (1.5 h at 50°C plus 1.5 h of cooling at room temperature), resulting in an average
AC of 39 %. This result is comparable to the first test in this report that was done after the MODDE 1
evaluation (where a total reaction time of 2 h 50 min gave an average AC of 38 %), suggesting that a
scale-up at this level works and generates similar results. However, the yield was slightly decreased to
92 %. Still, these results are promising compared to earlier published work, where the yield has been
in the range of 80-85 % [28].
4.2 REGENERATION OF PERIODATE
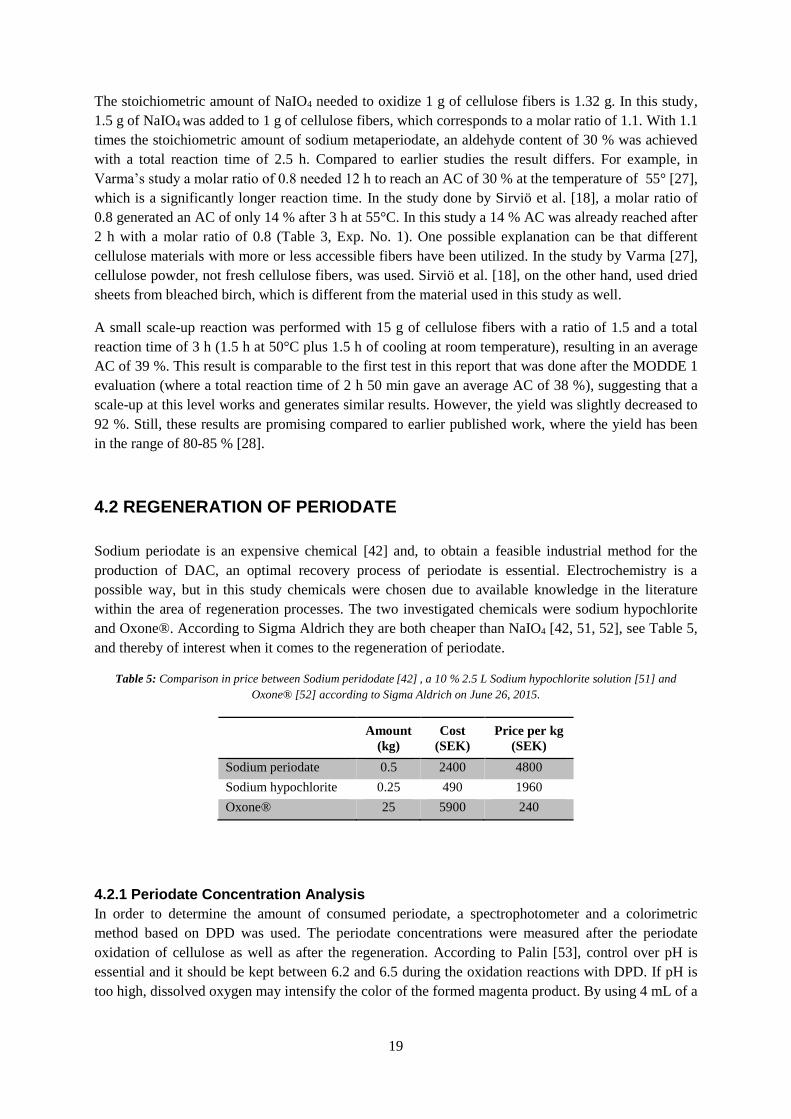
Sodium periodate is an expensive chemical [42] and, to obtain a feasible industrial method for the
production of DAC, an optimal recovery process of periodate is essential. Electrochemistry is a
possible way, but in this study chemicals were chosen due to available knowledge in the literature
within the area of regeneration processes. The two investigated chemicals were sodium hypochlorite
and Oxone®. According to Sigma Aldrich they are both cheaper than NaIO4 [42, 51, 52], see Table 5,
and thereby of interest when it comes to the regeneration of periodate.
Table 5: Comparison in price between Sodium peridodate [42] , a 10 % 2.5 L Sodium hypochlorite solution [51] and
Oxone® [52] according to Sigma Aldrich on June 26, 2015.
Amount
(kg)
Cost
(SEK)
Price per kg
(SEK)
Sodium periodate 0.5 2400 4800
Sodium hypochlorite 0.25 490 1960
Oxone® 25 5900 240
4.2.1 Periodate Concentration Analysis
In order to determine the amount of consumed periodate, a spectrophotometer and a colorimetric
method based on DPD was used. The periodate concentrations were measured after the periodate
oxidation of cellulose as well as after the regeneration. According to Palin [53], control over pH is
essential and it should be kept between 6.2 and 6.5 during the oxidation reactions with DPD. If pH is
too high, dissolved oxygen may intensify the color of the formed magenta product. By using 4 mL of a
20
phosphate buffer solution (pH 6.1) out of 10 mL in total, the pH was kept at a stable level; however,
the pH increased at the addition of DPD, but it was kept below 6.5.
Furthermore, the longer reaction time, the more intense the magenta color got. The article written by
Liimatainen et al. [39] lacks information on how much DPD that was added, as well as for how long
the diluted filtrate (consisting of IO3- and IO4
-) reacted with DPD before carrying out the absorbance
measurements. In experiments for the determination of chlorine concentration in water, DPD has been
used and the colored product allowed to develop for 10 min [54]. In combination with hydrogen
peroxide and DPD the absorbance was measured after a reaction time of 1 min in the study by Chang
et al [55]. Luo et al. [56], on the other hand, concluded that the reaction is optimized at 2 min after
having performed studies on the effects of operation parameters on the determination of H2O2.
However, if the same reaction time always is applied the results become correct relative to each other.
The reaction time was decided to be 2 min for all spectrophotometric experiments in this study.
Nevertheless, a deeper study on this colorimetric method could gain even better and more correct
results.
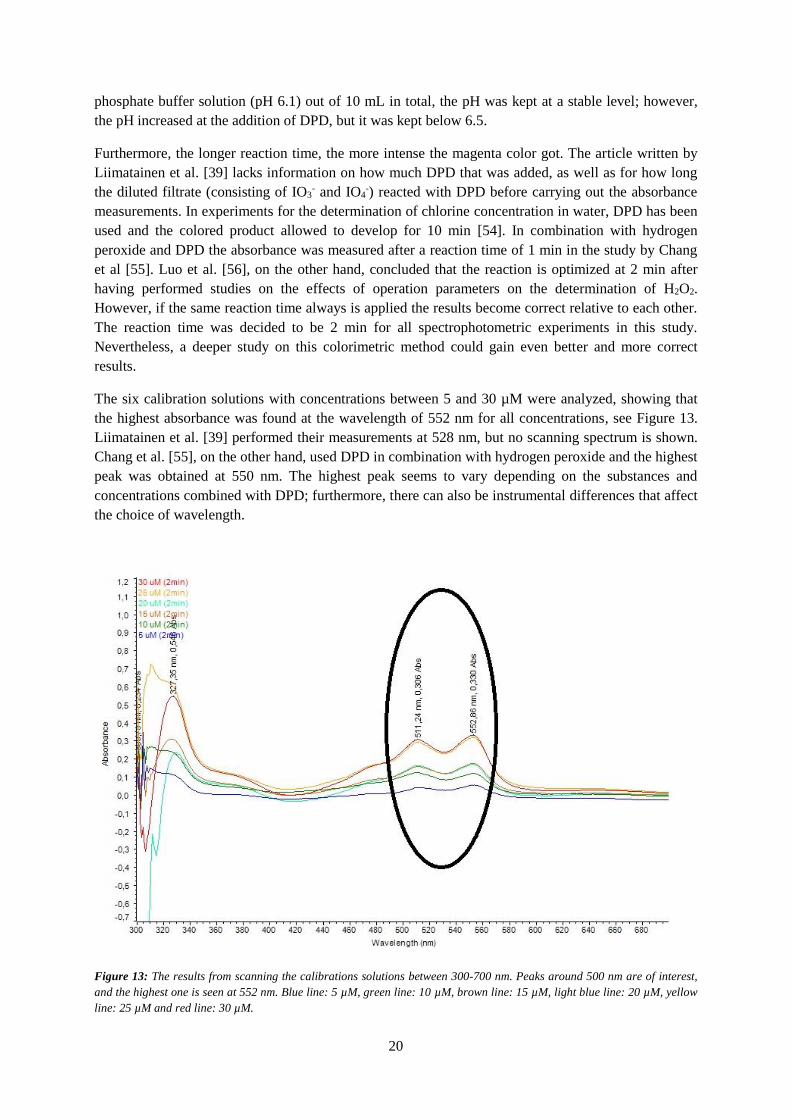
The six calibration solutions with concentrations between 5 and 30 µM were analyzed, showing that
the highest absorbance was found at the wavelength of 552 nm for all concentrations, see Figure 13.
Liimatainen et al. [39] performed their measurements at 528 nm, but no scanning spectrum is shown.
Chang et al. [55], on the other hand, used DPD in combination with hydrogen peroxide and the highest
peak was obtained at 550 nm. The highest peak seems to vary depending on the substances and
concentrations combined with DPD; furthermore, there can also be instrumental differences that affect
the choice of wavelength.
Figure 13: The results from scanning the calibrations solutions between 300-700 nm. Peaks around 500 nm are of interest,
and the highest one is seen at 552 nm. Blue line: 5 µM, green line: 10 µM, brown line: 15 µM, light blue line: 20 µM, yellow
line: 25 µM and red line: 30 µM.
21
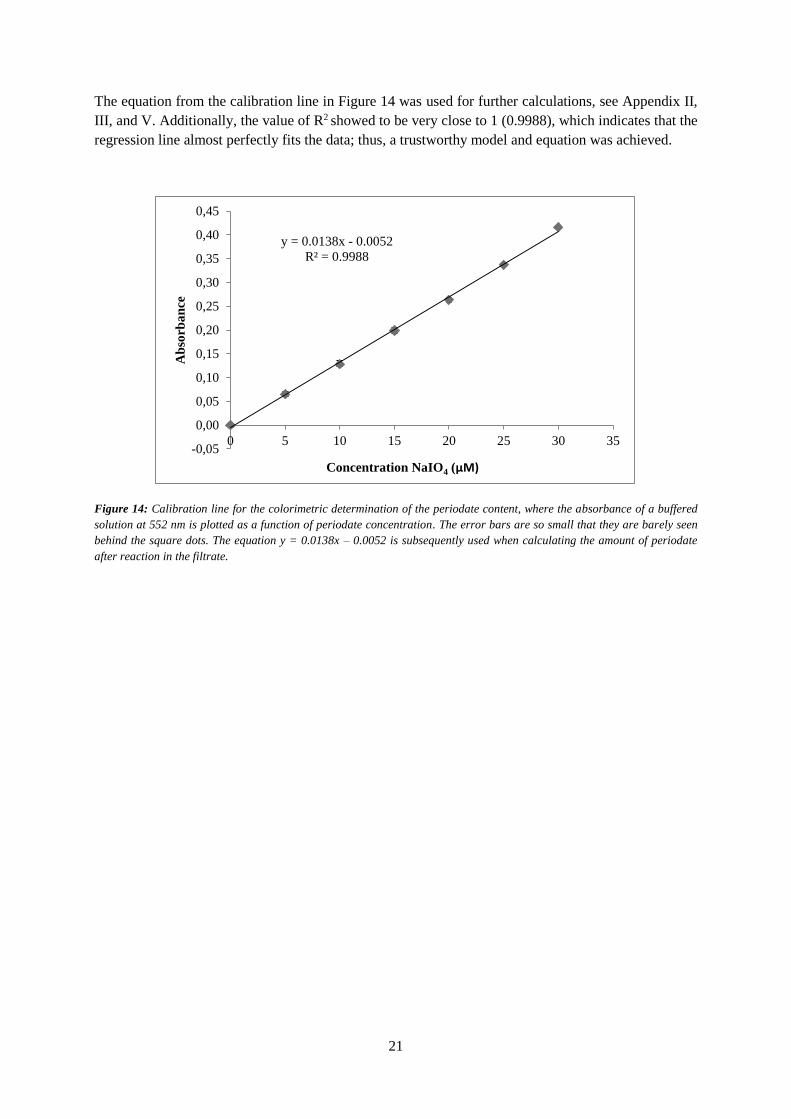
The equation from the calibration line in Figure 14 was used for further calculations, see Appendix II,
III, and V. Additionally, the value of R2 showed to be very close to 1 (0.9988), which indicates that the
regression line almost perfectly fits the data; thus, a trustworthy model and equation was achieved.
Figure 14: Calibration line for the colorimetric determination of the periodate content, where the absorbance of a buffered
solution at 552 nm is plotted as a function of periodate concentration. The error bars are so small that they are barely seen
behind the square dots. The equation y = 0.0138x – 0.0052 is subsequently used when calculating the amount of periodate
after reaction in the filtrate.
y = 0.0138x - 0.0052
R² = 0.9988
-0,05
0,00
0,05
0,10
0,15
0,20
0,25
0,30
0,35
0,40
0,45
0 5 10 15 20 25 30 35
Ab
sorb
an
ce
Concentration NaIO4 (μM)
22
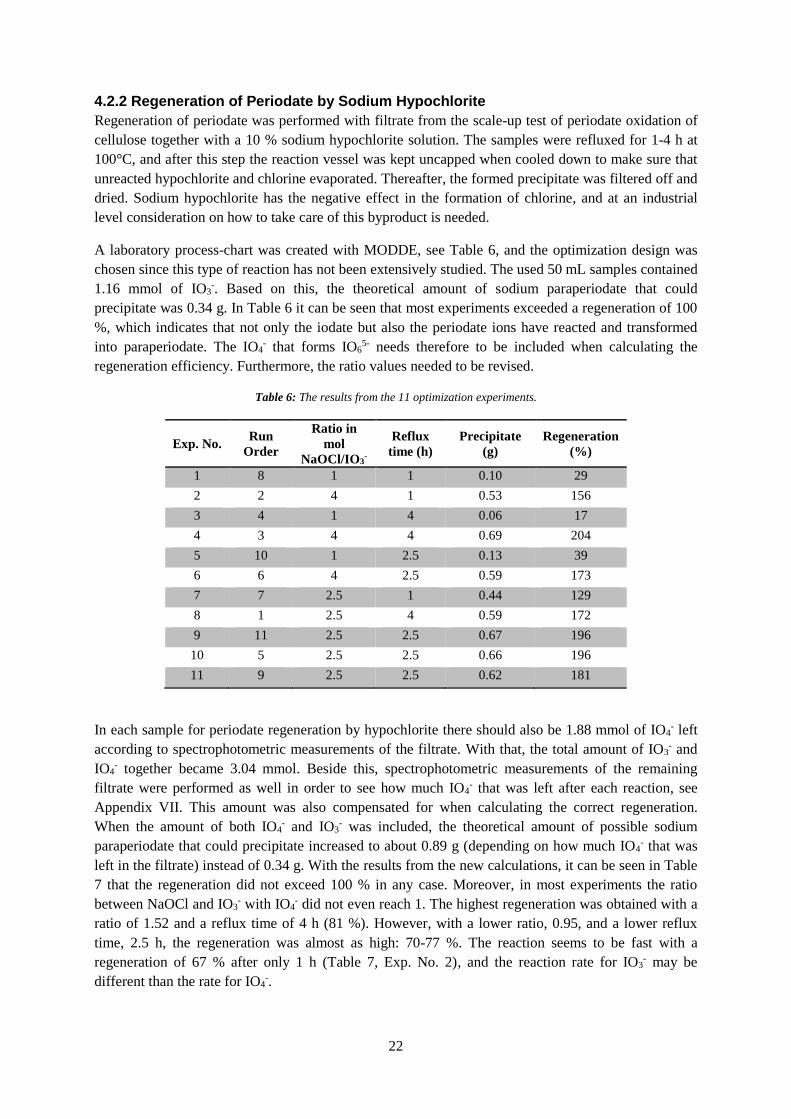
4.2.2 Regeneration of Periodate by Sodium Hypochlorite
Regeneration of periodate was performed with filtrate from the scale-up test of periodate oxidation of
cellulose together with a 10 % sodium hypochlorite solution. The samples were refluxed for 1-4 h at
100°C, and after this step the reaction vessel was kept uncapped when cooled down to make sure that
unreacted hypochlorite and chlorine evaporated. Thereafter, the formed precipitate was filtered off and
dried. Sodium hypochlorite has the negative effect in the formation of chlorine, and at an industrial
level consideration on how to take care of this byproduct is needed.
A laboratory process-chart was created with MODDE, see Table 6, and the optimization design was
chosen since this type of reaction has not been extensively studied. The used 50 mL samples contained
1.16 mmol of IO3-. Based on this, the theoretical amount of sodium paraperiodate that could
precipitate was 0.34 g. In Table 6 it can be seen that most experiments exceeded a regeneration of 100
%, which indicates that not only the iodate but also the periodate ions have reacted and transformed
into paraperiodate. The IO4- that forms IO6
5- needs therefore to be included when calculating the
regeneration efficiency. Furthermore, the ratio values needed to be revised.
Table 6: The results from the 11 optimization experiments.
Exp. No. Run
Order
Ratio in
mol
NaOCl/IO3-
Reflux
time (h)
Precipitate
(g)
Regeneration
(%)
1 8 1 1 0.10 29
2 2 4 1 0.53 156
3 4 1 4 0.06 17
4 3 4 4 0.69 204
5 10 1 2.5 0.13 39
6 6 4 2.5 0.59 173
7 7 2.5 1 0.44 129
8 1 2.5 4 0.59 172
9 11 2.5 2.5 0.67 196
10 5 2.5 2.5 0.66 196
11 9 2.5 2.5 0.62 181
In each sample for periodate regeneration by hypochlorite there should also be 1.88 mmol of IO4- left
according to spectrophotometric measurements of the filtrate. With that, the total amount of IO3- and
IO4- together became 3.04 mmol. Beside this, spectrophotometric measurements of the remaining
filtrate were performed as well in order to see how much IO4- that was left after each reaction, see
Appendix VII. This amount was also compensated for when calculating the correct regeneration.
When the amount of both IO4- and IO3
- was included, the theoretical amount of possible sodium
paraperiodate that could precipitate increased to about 0.89 g (depending on how much IO4- that was
left in the filtrate) instead of 0.34 g. With the results from the new calculations, it can be seen in Table
7 that the regeneration did not exceed 100 % in any case. Moreover, in most experiments the ratio
between NaOCl and IO3- with IO4
- did not even reach 1. The highest regeneration was obtained with a
ratio of 1.52 and a reflux time of 4 h (81 %). However, with a lower ratio, 0.95, and a lower reflux
time, 2.5 h, the regeneration was almost as high: 70-77 %. The reaction seems to be fast with a
regeneration of 67 % after only 1 h (Table 7, Exp. No. 2), and the reaction rate for IO3- may be
different than the rate for IO4-.
23
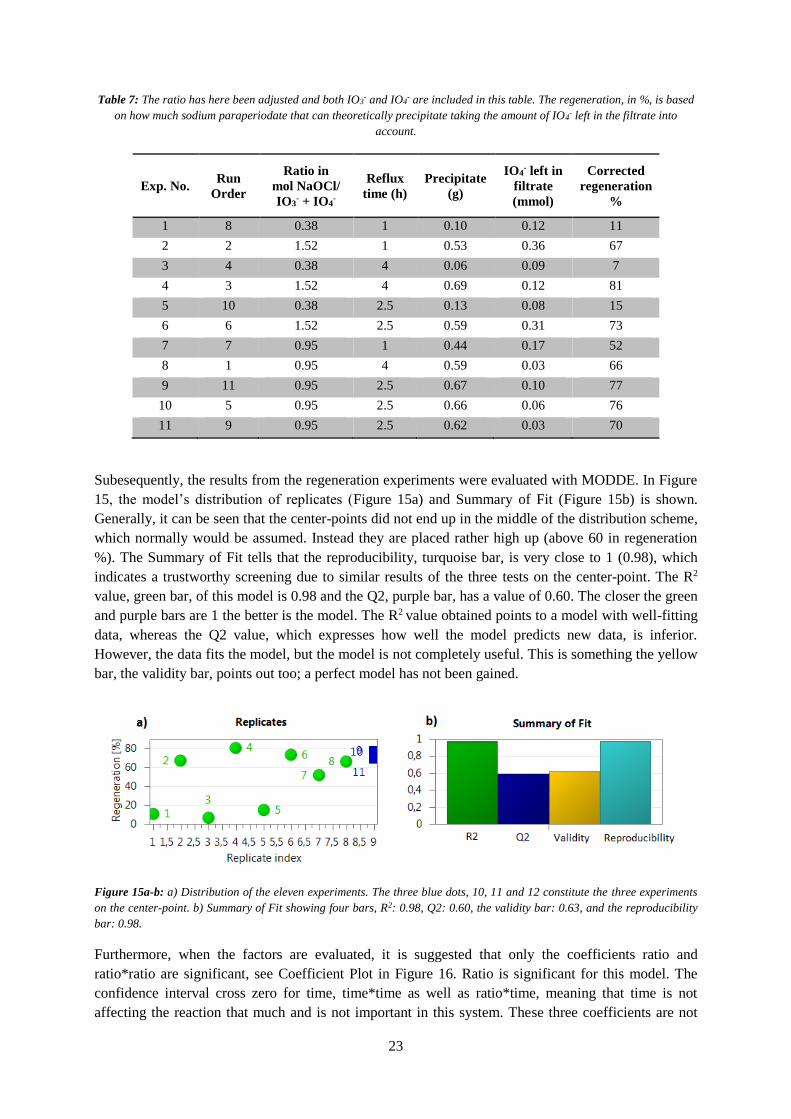
Table 7: The ratio has here been adjusted and both IO3- and IO4
- are included in this table. The regeneration, in %, is based
on how much sodium paraperiodate that can theoretically precipitate taking the amount of IO4- left in the filtrate into
account.
Exp. No. Run
Order
Ratio in
mol NaOCl/
IO3- + IO4
-
Reflux
time (h)
Precipitate
(g)
IO4- left in
filtrate
(mmol)
Corrected
regeneration
%
1 8 0.38 1 0.10 0.12 11
2 2 1.52 1 0.53 0.36 67
3 4 0.38 4 0.06 0.09 7
4 3 1.52 4 0.69 0.12 81
5 10 0.38 2.5 0.13 0.08 15
6 6 1.52 2.5 0.59 0.31 73
7 7 0.95 1 0.44 0.17 52
8 1 0.95 4 0.59 0.03 66
9 11 0.95 2.5 0.67 0.10 77
10 5 0.95 2.5 0.66 0.06 76
11 9 0.95 2.5 0.62 0.03 70
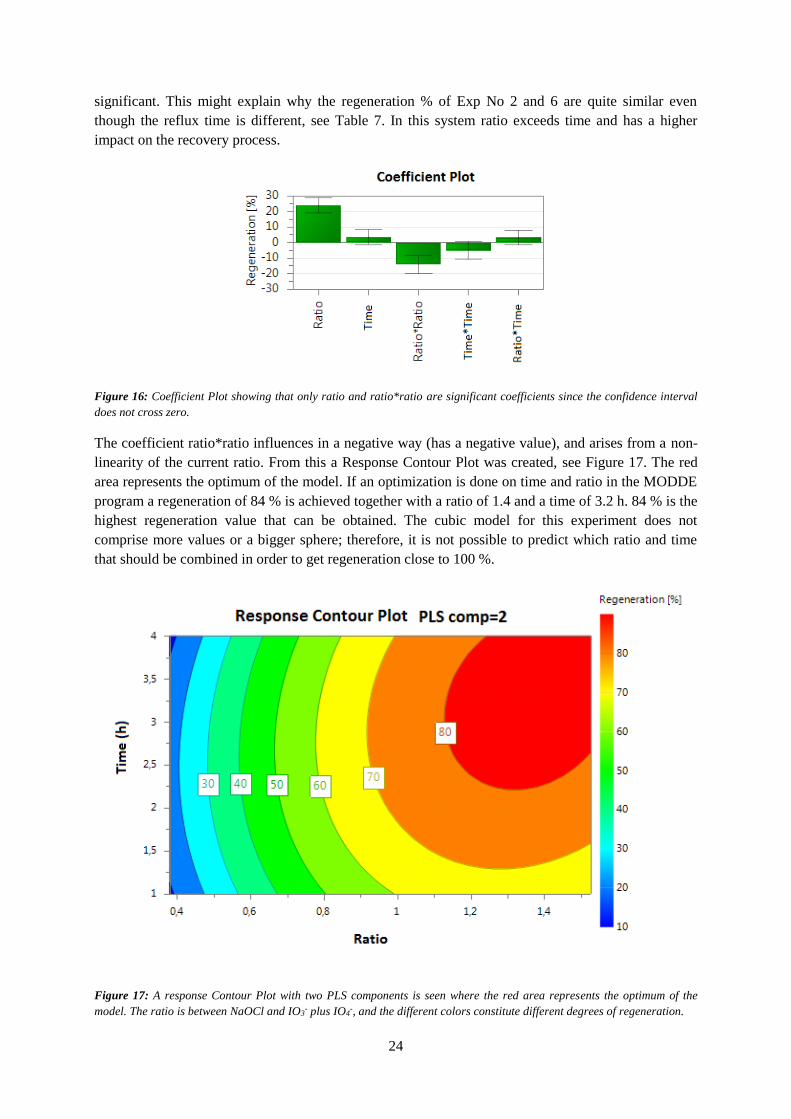
Subesequently, the results from the regeneration experiments were evaluated with MODDE. In Figure
15, the model’s distribution of replicates (Figure 15a) and Summary of Fit (Figure 15b) is shown.
Generally, it can be seen that the center-points did not end up in the middle of the distribution scheme,
which normally would be assumed. Instead they are placed rather high up (above 60 in regeneration
%). The Summary of Fit tells that the reproducibility, turquoise bar, is very close to 1 (0.98), which
indicates a trustworthy screening due to similar results of the three tests on the center-point. The R2
value, green bar, of this model is 0.98 and the Q2, purple bar, has a value of 0.60. The closer the green
and purple bars are 1 the better is the model. The R2 value obtained points to a model with well-fitting
data, whereas the Q2 value, which expresses how well the model predicts new data, is inferior.
However, the data fits the model, but the model is not completely useful. This is something the yellow
bar, the validity bar, points out too; a perfect model has not been gained.
Figure 15a-b: a) Distribution of the eleven experiments. The three blue dots, 10, 11 and 12 constitute the three experiments
on the center-point. b) Summary of Fit showing four bars, R2: 0.98, Q2: 0.60, the validity bar: 0.63, and the reproducibility
bar: 0.98.
Furthermore, when the factors are evaluated, it is suggested that only the coefficients ratio and
ratio*ratio are significant, see Coefficient Plot in Figure 16. Ratio is significant for this model. The
confidence interval cross zero for time, time*time as well as ratio*time, meaning that time is not
affecting the reaction that much and is not important in this system. These three coefficients are not
24
significant. This might explain why the regeneration % of Exp No 2 and 6 are quite similar even
though the reflux time is different, see Table 7. In this system ratio exceeds time and has a higher
impact on the recovery process.
Figure 16: Coefficient Plot showing that only ratio and ratio*ratio are significant coefficients since the confidence interval
does not cross zero.
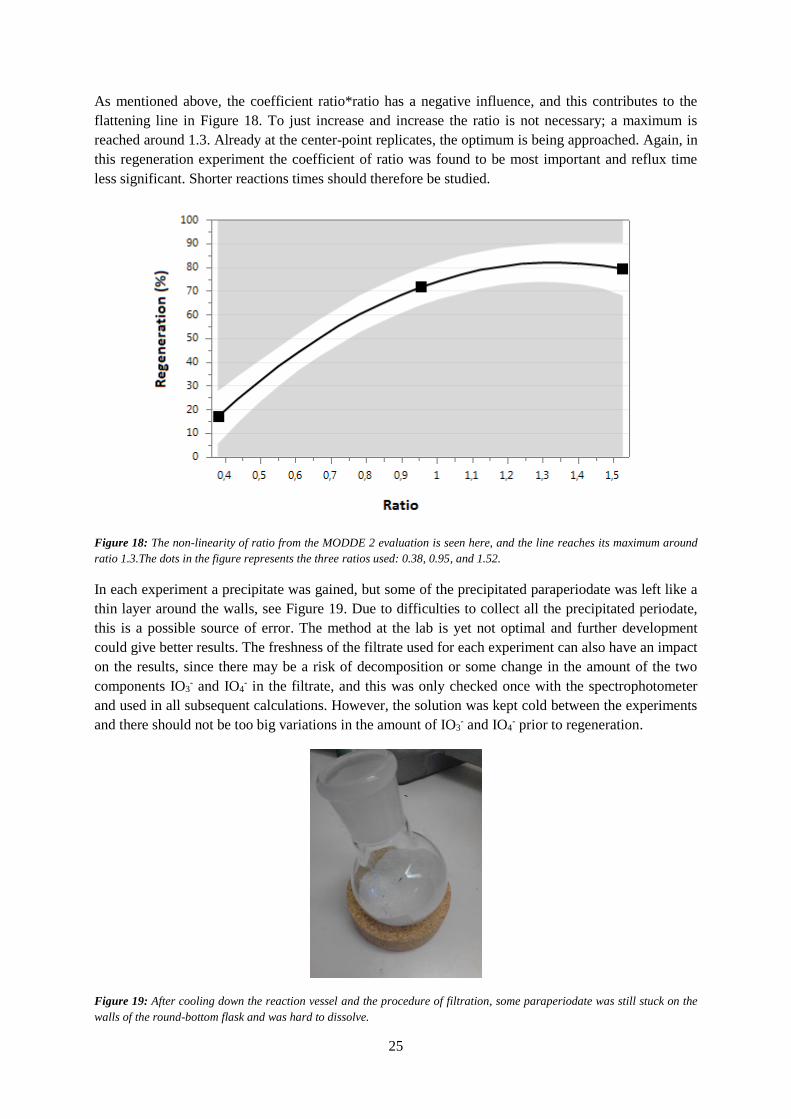
The coefficient ratio*ratio influences in a negative way (has a negative value), and arises from a non-
linearity of the current ratio. From this a Response Contour Plot was created, see Figure 17. The red
area represents the optimum of the model. If an optimization is done on time and ratio in the MODDE
program a regeneration of 84 % is achieved together with a ratio of 1.4 and a time of 3.2 h. 84 % is the
highest regeneration value that can be obtained. The cubic model for this experiment does not
comprise more values or a bigger sphere; therefore, it is not possible to predict which ratio and time
that should be combined in order to get regeneration close to 100 %.
Figure 17: A response Contour Plot with two PLS components is seen where the red area represents the optimum of the
model. The ratio is between NaOCl and IO3- plus IO4
-, and the different colors constitute different degrees of regeneration.
25
As mentioned above, the coefficient ratio*ratio has a negative influence, and this contributes to the
flattening line in Figure 18. To just increase and increase the ratio is not necessary; a maximum is
reached around 1.3. Already at the center-point replicates, the optimum is being approached. Again, in
this regeneration experiment the coefficient of ratio was found to be most important and reflux time
less significant. Shorter reactions times should therefore be studied.
Figure 18: The non-linearity of ratio from the MODDE 2 evaluation is seen here, and the line reaches its maximum around
ratio 1.3.The dots in the figure represents the three ratios used: 0.38, 0.95, and 1.52.
In each experiment a precipitate was gained, but some of the precipitated paraperiodate was left like a
thin layer around the walls, see Figure 19. Due to difficulties to collect all the precipitated periodate,
this is a possible source of error. The method at the lab is yet not optimal and further development
could give better results. The freshness of the filtrate used for each experiment can also have an impact
on the results, since there may be a risk of decomposition or some change in the amount of the two
components IO3- and IO4
- in the filtrate, and this was only checked once with the spectrophotometer
and used in all subsequent calculations. However, the solution was kept cold between the experiments
and there should not be too big variations in the amount of IO3- and IO4
- prior to regeneration.
Figure 19: After cooling down the reaction vessel and the procedure of filtration, some paraperiodate was still stuck on the
walls of the round-bottom flask and was hard to dissolve.
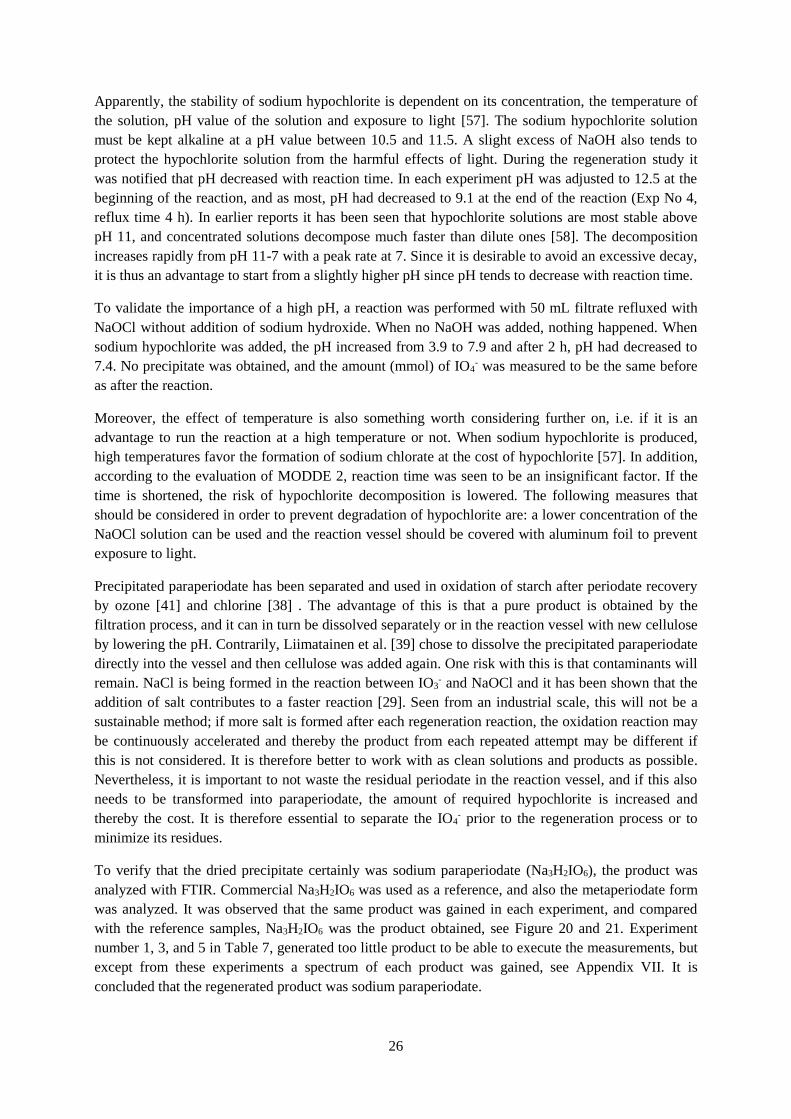
26
Apparently, the stability of sodium hypochlorite is dependent on its concentration, the temperature of
the solution, pH value of the solution and exposure to light [57]. The sodium hypochlorite solution
must be kept alkaline at a pH value between 10.5 and 11.5. A slight excess of NaOH also tends to
protect the hypochlorite solution from the harmful effects of light. During the regeneration study it
was notified that pH decreased with reaction time. In each experiment pH was adjusted to 12.5 at the
beginning of the reaction, and as most, pH had decreased to 9.1 at the end of the reaction (Exp No 4,
reflux time 4 h). In earlier reports it has been seen that hypochlorite solutions are most stable above
pH 11, and concentrated solutions decompose much faster than dilute ones [58]. The decomposition
increases rapidly from pH 11-7 with a peak rate at 7. Since it is desirable to avoid an excessive decay,
it is thus an advantage to start from a slightly higher pH since pH tends to decrease with reaction time.
To validate the importance of a high pH, a reaction was performed with 50 mL filtrate refluxed with
NaOCl without addition of sodium hydroxide. When no NaOH was added, nothing happened. When
sodium hypochlorite was added, the pH increased from 3.9 to 7.9 and after 2 h, pH had decreased to
7.4. No precipitate was obtained, and the amount (mmol) of IO4- was measured to be the same before
as after the reaction.
Moreover, the effect of temperature is also something worth considering further on, i.e. if it is an
advantage to run the reaction at a high temperature or not. When sodium hypochlorite is produced,
high temperatures favor the formation of sodium chlorate at the cost of hypochlorite [57]. In addition,
according to the evaluation of MODDE 2, reaction time was seen to be an insignificant factor. If the
time is shortened, the risk of hypochlorite decomposition is lowered. The following measures that
should be considered in order to prevent degradation of hypochlorite are: a lower concentration of the
NaOCl solution can be used and the reaction vessel should be covered with aluminum foil to prevent
exposure to light.
Precipitated paraperiodate has been separated and used in oxidation of starch after periodate recovery
by ozone [41] and chlorine [38] . The advantage of this is that a pure product is obtained by the
filtration process, and it can in turn be dissolved separately or in the reaction vessel with new cellulose
by lowering the pH. Contrarily, Liimatainen et al. [39] chose to dissolve the precipitated paraperiodate
directly into the vessel and then cellulose was added again. One risk with this is that contaminants will
remain. NaCl is being formed in the reaction between IO3- and NaOCl and it has been shown that the
addition of salt contributes to a faster reaction [29]. Seen from an industrial scale, this will not be a
sustainable method; if more salt is formed after each regeneration reaction, the oxidation reaction may
be continuously accelerated and thereby the product from each repeated attempt may be different if
this is not considered. It is therefore better to work with as clean solutions and products as possible.
Nevertheless, it is important to not waste the residual periodate in the reaction vessel, and if this also
needs to be transformed into paraperiodate, the amount of required hypochlorite is increased and
thereby the cost. It is therefore essential to separate the IO4- prior to the regeneration process or to
minimize its residues.
To verify that the dried precipitate certainly was sodium paraperiodate (Na3H2IO6), the product was
analyzed with FTIR. Commercial Na3H2IO6 was used as a reference, and also the metaperiodate form
was analyzed. It was observed that the same product was gained in each experiment, and compared
with the reference samples, Na3H2IO6 was the product obtained, see Figure 20 and 21. Experiment
number 1, 3, and 5 in Table 7, generated too little product to be able to execute the measurements, but
except from these experiments a spectrum of each product was gained, see Appendix VII. It is
concluded that the regenerated product was sodium paraperiodate.
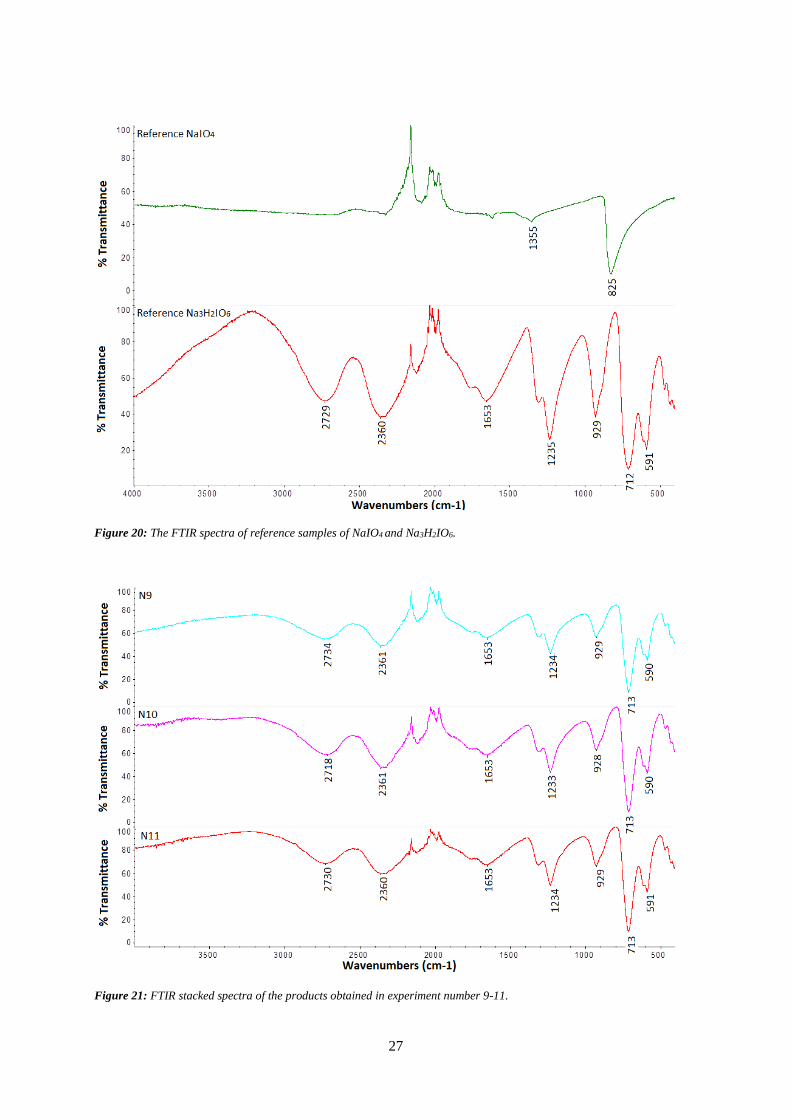
27
Figure 20: The FTIR spectra of reference samples of NaIO4 and Na3H2IO6.
Figure 21: FTIR stacked spectra of the products obtained in experiment number 9-11.
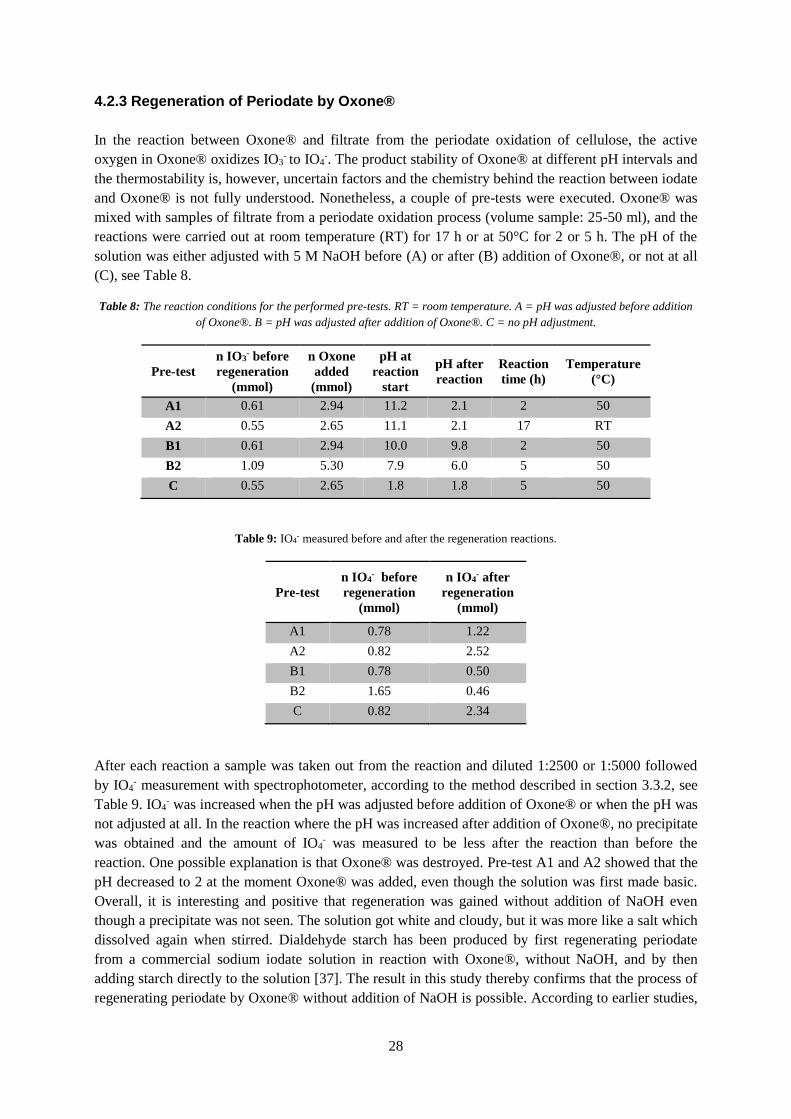
28
4.2.3 Regeneration of Periodate by Oxone®
In the reaction between Oxone® and filtrate from the periodate oxidation of cellulose, the active
oxygen in Oxone® oxidizes IO3- to IO4
-. The product stability of Oxone® at different pH intervals and
the thermostability is, however, uncertain factors and the chemistry behind the reaction between iodate
and Oxone® is not fully understood. Nonetheless, a couple of pre-tests were executed. Oxone® was
mixed with samples of filtrate from a periodate oxidation process (volume sample: 25-50 ml), and the
reactions were carried out at room temperature (RT) for 17 h or at 50°C for 2 or 5 h. The pH of the
solution was either adjusted with 5 M NaOH before (A) or after (B) addition of Oxone®, or not at all
(C), see Table 8.
Table 8: The reaction conditions for the performed pre-tests. RT = room temperature. A = pH was adjusted before addition
of Oxone®. B = pH was adjusted after addition of Oxone®. C = no pH adjustment.
Pre-test
n IO3- before
regeneration
(mmol)
n Oxone
added
(mmol)
pH at
reaction
start
pH after
reaction
Reaction
time (h)
Temperature
(°C)
A1 0.61 2.94 11.2 2.1 2 50
A2 0.55 2.65 11.1 2.1 17 RT
B1 0.61 2.94 10.0 9.8 2 50
B2 1.09 5.30 7.9 6.0 5 50
C 0.55 2.65 1.8 1.8 5 50
Table 9: IO4- measured before and after the regeneration reactions.
Pre-test
n IO4- before
regeneration
(mmol)
n IO4- after
regeneration
(mmol)
A1 0.78 1.22
A2 0.82 2.52
B1 0.78 0.50
B2 1.65 0.46
C 0.82 2.34
After each reaction a sample was taken out from the reaction and diluted 1:2500 or 1:5000 followed
by IO4- measurement with spectrophotometer, according to the method described in section 3.3.2, see
Table 9. IO4- was increased when the pH was adjusted before addition of Oxone® or when the pH was
not adjusted at all. In the reaction where the pH was increased after addition of Oxone®, no precipitate
was obtained and the amount of IO4- was measured to be less after the reaction than before the
reaction. One possible explanation is that Oxone® was destroyed. Pre-test A1 and A2 showed that the
pH decreased to 2 at the moment Oxone® was added, even though the solution was first made basic.
Overall, it is interesting and positive that regeneration was gained without addition of NaOH even
though a precipitate was not seen. The solution got white and cloudy, but it was more like a salt which
dissolved again when stirred. Dialdehyde starch has been produced by first regenerating periodate
from a commercial sodium iodate solution in reaction with Oxone®, without NaOH, and by then
adding starch directly to the solution [37]. The result in this study thereby confirms that the process of
regenerating periodate by Oxone® without addition of NaOH is possible. According to earlier studies,

29
paraperiodate needs a basic environment in order to precipitate, like the product did in reaction with
hypochlorite. A possible alternative would be to repeatedly during the reaction add some NaOH to
keep a basic pH, which Besemer did when he kept pH between 6-8 [37], to be able to separate and
obtain a clean product.
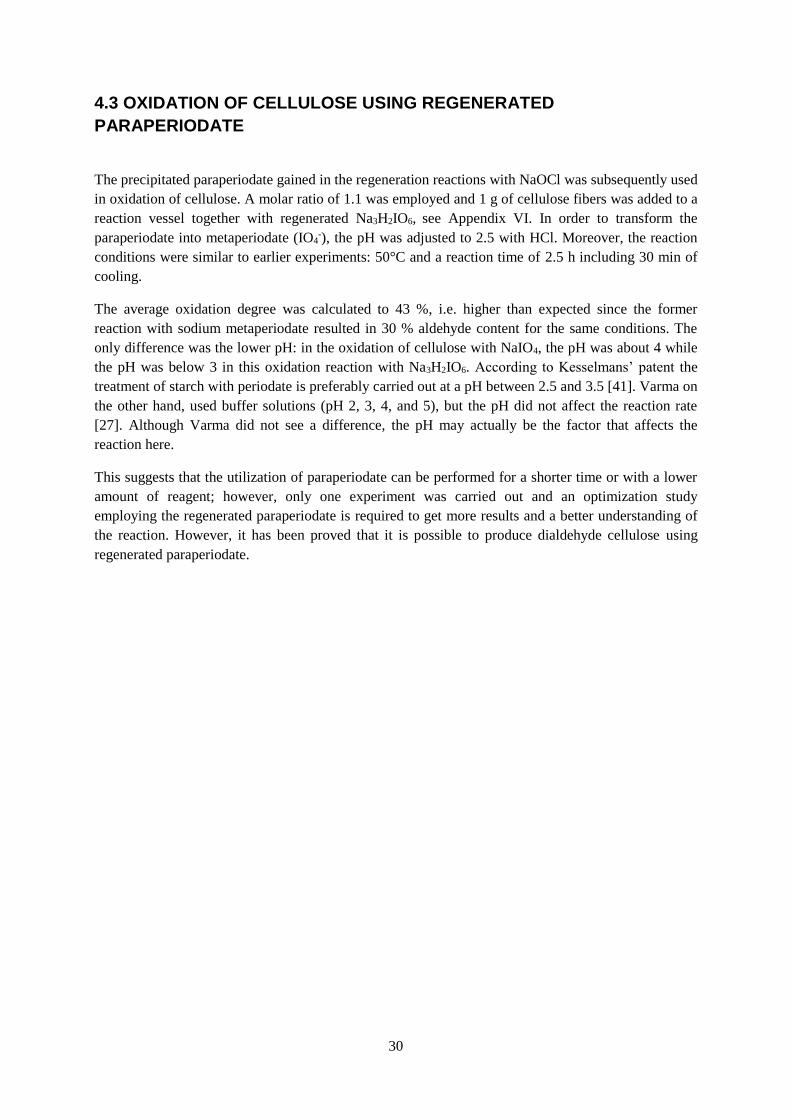
30
4.3 OXIDATION OF CELLULOSE USING REGENERATED
PARAPERIODATE
The precipitated paraperiodate gained in the regeneration reactions with NaOCl was subsequently used
in oxidation of cellulose. A molar ratio of 1.1 was employed and 1 g of cellulose fibers was added to a
reaction vessel together with regenerated Na3H2IO6, see Appendix VI. In order to transform the
paraperiodate into metaperiodate (IO4-), the pH was adjusted to 2.5 with HCl. Moreover, the reaction
conditions were similar to earlier experiments: 50°C and a reaction time of 2.5 h including 30 min of
cooling.
The average oxidation degree was calculated to 43 %, i.e. higher than expected since the former
reaction with sodium metaperiodate resulted in 30 % aldehyde content for the same conditions. The
only difference was the lower pH: in the oxidation of cellulose with NaIO4, the pH was about 4 while
the pH was below 3 in this oxidation reaction with Na3H2IO6. According to Kesselmans’ patent the
treatment of starch with periodate is preferably carried out at a pH between 2.5 and 3.5 [41]. Varma on
the other hand, used buffer solutions (pH 2, 3, 4, and 5), but the pH did not affect the reaction rate
[27]. Although Varma did not see a difference, the pH may actually be the factor that affects the
reaction here.
This suggests that the utilization of paraperiodate can be performed for a shorter time or with a lower
amount of reagent; however, only one experiment was carried out and an optimization study
employing the regenerated paraperiodate is required to get more results and a better understanding of
the reaction. However, it has been proved that it is possible to produce dialdehyde cellulose using
regenerated paraperiodate.
31
5. CONCLUSIONS
In this study, cellulose was oxidized by sodium metaperiodate at a set temperature of 50°C but with
different ratios of NaIO4 and reaction times to find the optimum reaction parameters. The aimed
oxidation degree of 30 % was achieved at the ratio of 1.5 (g NaIO4 per g fiber) and a reaction time of
2.5 h. High yields were obtained, and as most between 98-100 %. From the MODDE evaluation it was
also statistically guaranteed that time and ratio affect the reaction without affecting each other.
Filtrate from the periodate oxidation was further used in regeneration reactions with either sodium
hypochlorite or Oxone®. However, an optimization of the reaction was only performed with
hypochlorite; and, the highest regeneration obtained then was 81 % using a molar ratio of 1.52 (NaOCl
to IO3- and IO4
- together) and a reflux time of 4 h. According to the MODDE model, it was showed
that the time factor was less significant than the ratio factor, and when applying a ratio of 0.95 and a
reaction time of 2.5 h, a regeneration of 77 % was gained. A higher recovery percentage is desirable,
and therefore a new optimization would be of interest using a higher ratio and shorter reaction times. It
was observed that IO4- left in the filtrate also contributed to the gained amount of product. With IR it
was confirmed that the IO65- obtained was Na3H2IO6.
In order to recover periodate, Oxone® was also tested. The reactions were carried out at a molar ratio
around 5, and at room temperature for 17 h or at 50°C for 2 or 5 h. It was shown that the IO4-
concentration increased in the reaction vessel when the pH was adjusted before addition of Oxone®
and when pH was not adjusted at all. In the reaction where pH was increased after addition of
Oxone®, no regeneration was achieved, which probably depends on that the oxidizing agent was
destroyed. Further evaluation of this process is needed to reach results as good, or preferably better,
than the recovery that was attained with sodium hypochlorite.
The Na3H2IO6 obtained in the experiments with sodium hypochlorite, was utilized in a new oxidation
experiment with cellulose, employing the same optimized reaction condition as before except that the
pH was lowered to 2.5 to transform the IO65- into IO4
-. Yet, the oxidation degree became much higher,
43 % compared to 30 % that was achieved when the pH was 4, verifying that dialdehyde cellulose can
successfully be produced by employing regenerated paraperiodate.
32
6. FUTURE WORK
Some additional work is needed to be able to get a deeper understanding about the periodate oxidation
and its regeneration to get closer to an industrial implementation:
A proper study of the up-scaling of the periodate oxidation of cellulose should be performed
to study the impact when going from g to kg before getting up to ton-scale production. Also,
safety aspects need to be addressed.
New optimization of the regeneration reaction, where the quantity of IO4- from start is taken
into consideration with correct calculated ratios. Shorter time intervals should also be studied.
An optimization of the reaction between cellulose and the precipitated paraperiodate at pH 2.5
should be investigated to see how the reaction is affected when using Na3H2IO6 as a starting
material instead of NaIO4. As a comparison, a reaction with NaIO4 should be performed at pH
2.5 as well. Another option could also be to transform the IO65- to IO4
- prior to the oxidation
reaction.
Oxone® should be studied more in order to understand the reaction pathway better and to gain
an optimal process.
Other chemical processes or an electrochemical process should be investigated and
considered.

33
7. ACKNOWLEDGEMENTS
This diploma thesis has been conducted in the framework of VINN Excellence Center BiMaC
Innovation. All work has been performed at Stora Enso Research Center Karlstad, where I have had a
very nice and instructive time. Many thanks to the whole company for making it possible for students
to take part in real projects outside of the university buildings!
To my supervisor Susanne Hansson, Stora Enso RCK, who has taught me a lot within the area of
chemistry: Thank you so much for feedback, ideas, support, and knowledge, as well as the great
laughs during tea breaks. Susanne, you have done a massive job with me as an apprentice, and I have
always felt so welcome and appreciated. Thank you for believing in me and good luck with your first
and awaited child!
I would also like to thank MariAnn Norborg for introducing me to MODDE, and to Raija Badenlid,
who taught me about MODDE and its applications when evaluating the results. And also to Anders
Brolin and Lars Axrup: thank you for fruitful discussions and inputs.
A warm thanks to everyone who helped me at the laboratory, and especially to Robert Wissler who
could always answer my questions and supported me with important information about routines and
equipment. I would also like to give my thanks to Larisa Ten who was working with me during parts
of the laboratory experiments.
One teacher from Karlstad University that has followed me during these years is Gunilla Carlsson. I
am very happy for everything you have contributed with, the knowledge and support you have
provided me with during this master thesis as well as during earlier courses in chemistry. Thank you
for accepting my wish of having you as my supervisor also in this project.
I would also like to thank Emelie Glenne, my friend from the university time; Peter Sjönneby,
laboratory technician; and, Elin Andersson, who shared the same office with me these path months. To
all three of you: thank you for interesting conversations, help, and nice lunch breaks that have kept me
motivated, happy, and strong.
At last but not least, to my family: I love you ALL! Thanks to my mother who let me stay in the house
again and supplied me with food in stressful times, to my oldest brother who supported me in taking
the right decision when I was about to choose project for my master thesis, and to my boyfriend
Mikael for being there for me and putting up with me during the time of long distance relationship.
And finally, thank you dad for teaching me about the forest industry before I even knew I would come
to enjoy chemistry.
With love,
Elisabeth
34
8. REFERENCES
[1] P. Zugenmaier, "Materials of cellulose derivatives and fiber-reinforced cellulose-
polypropylene composites: Characterization and application," Pure and Applied Chemistry,
vol. 78, pp. 1843-1855, 2006.
[2] P. Zugenmaier, Crystalline Cellulose and Derivatives: Characterization and Structures.
Berlin, Heidelberg: Springer-Verlag, 2008.
[3] D. W. O'Connell, C. Birkinshaw, and T. F. O'Dwyer, "Heavy metal adsorbents prepared from
the modification of cellulose: A review," Bioresource Technology, vol. 99, pp. 6709-6724,
2008.
[4] J. Sirviö, "Dialdehyde cellulose (DAC): Advanced periodate oxidation of birch cellulose and
further derivatization to be used in flocculation application," Doctoral Thesis, University of
Oulu, 2011.
[5] A. Isogai, T. Saito, and H. Fukuzuma, "TEMPO-oxidized cellulose nanofibers," Nanoscale,
vol. 3, pp. 71-85, 2011.
[6] A.-C. Albertsson, Introduktion till Polymerteknologi. Stockholm: Instutionen för Pappers- och
massateknik, KTH, 2001.
[7] O. Dahlman, A. Jacobs, A. Liljenberg, and A. Ismail Olsson, "Analysis of carbohydrates in
wood and pulps employing enzymatic hydrolysis and subsequent capillary zone
electrophoresis," Journal of Chromatography A, vol. 891, pp. 157-174, 2000.
[8] J. Sjöberg, A. Potthast, T. Rosenau, P. Kosma, and H. Sixta, "Cross-Sectional Analysis of the
Polysaccharide Composition in Cellulosic Fiber Materials by Enzymatic Peeling/ High-
Performance Capillary Zone Electrophoresis," Biomacromolecules, vol. 6, pp. 3146-3151,
2005.
[9] E. Höglund, "A comparison of industrial and laboratory-cooked pulp with different analytical
methods - including practical method formation of enzymatic hydrolysis of pulp fibers,"
Bachelor, Faculty of Health, Science and Technology, University of Karlstad, Karlstad, 2014.
[10] FiberSource and A. F. M. Association. (2015, February 25). Cellulose. Available:
http://www.fibersource.com/f-tutor/cellulose.htm
[11] L. H. Sperling, Introduction to Physical Polymer Science, 4 ed. Hoboken, New Jersey: John
Wiley & Sons, Inc, 2006.
[12] D. Nyström, J. Lindqvist, and E. Östmark, "Superhydrophobic and Self-Cleaning Bio-Fiber
Surfaces via ATRP and Subsequent Postfunctionalization," ACS Applied Materials and
Interfaces, vol. 1, pp. 816-823, 2009.
[13] C. Conterno, "Biodegradable plastic material based on cellulose acetate and relative end-
products," EP2599827 A1, 2013.
[14] HarvardApparatus. (2015, February 26). Guide to Ion-Exchange Chromatography. Available:
http://www.harvardapparatus.com/downloads/Ion%20Exchange%20Chroma%20SpinColumn
%20Guide.pdf
[15] A. Hebeish, A. Higazy, A. El-Shafei, and S. Sharaf, "Synthesis of carboxymethyl cellulose
(CMC) and starch-based hybrids and their applications in flocculation and sizing,"
Carbohydrate polymers, vol. 79, pp. 60-69, 2010.
[16] R. Elumalai, S. Patil, N. Maliyakkal, A. Rangarajan, P. Kondaiah, and A. Raichur. (2015,
February 26). Protamine-carboxymethyl cellulose magnetic nanocapsules for enhanced
delivery of anticancer drugs against drug resistant cancers. Available:
http://www.ncbi.nlm.nih.gov/pubmed/25659647
[17] C. Felby, J. Hassingboe, and M. Lund, "Pilot-scale production of fiberboards made by laccase
oxidized wood fibers: board properties and evidence for cross-linking of lignin," Enzyme and
Microbial Technology, vol. 31, pp. 736-741, 2002.
[18] J. A. Sirviö, A. Kolehmainen, M. Visanko, H. Liimatainen, J. Ninimäki, and O. E. O. Hormi,
"Strong, Self-Standing Oxygen Barrier Films from Nanocelluloses Modified with
35
Regioselective Oxidative Treatments," ACS Applied Materials & Interfaces, vol. 6, pp. 14384-
14390, 2014.
[19] M. N. Belgacem and A. Gandini, "Surface Modification of Cellulose Fibres," in Monomers,
Polymers and Composites from Renewable Resources, ed, 2008, pp. 385-400.
[20] J. E. McMurry, Organic Chemistry, 8 ed.: Brooks/Cole, 2012.
[21] U.-J. Kim, S. Kuga, M. Wada, T. Okano, and T. Kondo, "Periodate Oxidation of Crystalline
Cellulose," Biomacromolecules, vol. 1, pp. 488-492, 2000.
[22] P. Larsson, J. Kochumalayil, and L. Wågberg, "Oxygen and water vapour barrier films with
low moisture sensitivity fabricated from self-crosslinking fibrillated cellulose," 15th
Fundamental Research Symposium, Cambridge, 2013.
[23] U.-J. Kim, M. Wada, and S. Kuga, "Solubilization of dialdehyde cellulose by hot water,"
Carbohydrate Polymers, vol. 56, pp. 7-10, 2004.
[24] V. Kumar, "Cellulose membranes for biogradable scaffolds," WO 2003020191 A1, 2002.
[25] U.-J. Kim and S. Kuga, "Thermal decomposition of dialdehyde cellulose and its nitrogen-
containing derivatives," Thermochimica Acta, vol. 369, pp. 79-85, 2001.
[26] P. A. Larsson, L. A. Berglund, and L. Wågberg, "Ductile All-Cellulose Nanocomposite Films
Fabricated from Core–Shell Structured Cellulose Nanofibrils," Biomacromolecules, vol. 15,
pp. 2218-2223, 2014/06/09 2014.
[27] A. J. Varma and M. P. Kulkarni, "Oxidation of cellulose under controlled conditions,"
Polymer Degradation and Stability, vol. 77, pp. 25-27, // 2002.
[28] P. Larsson, L. Berglund, and L. Wågberg, "Highly ductile fibres and sheets by core-shell
structuring of the cellulose nanofibrils," Cellulose, vol. 21, pp. 323-333, 2014/02/01 2014.
[29] J. Sirvio, U. Hyvakko, H. Liimatainen, J. Niinimaki, and O. Hormi, "Periodate oxidation of
cellulose at elevated temperatures using metal salts as cellulose activators," Carbohydrate
Polymers, vol. 83, pp. 1293-1297, 2011.
[30] P. A. Larsson, M. Gimåker, and L. Wågberg, "The influence of periodate oxidation on the
moisture sorptivity and dimensional stability of paper," Cellulose, vol. 15, pp. 837-847, 2008.
[31] X. Liu, L. Wang, X. Song, H. Song, J. R. Zhao, and S. Wang, "A kinetic model for oxidative
degradation of bagasse pulp fiber by sodium periodate," Carbohydrate Polymers, vol. 90, pp.
218-223, 2012.
[32] X. Wang, G. Fang, C. Hu, and T. Du, "Application of Ultrasonic Waves in Activation of
Microcrystalline Cellulose," Journal of Applied Polymer Science, vol. 109, pp. 2762-2767,
2008.
[33] Sigma-Aldrich, "Safety Data Sheet: Hydroxylamine hydrochloride," in
http://www.sigmaaldrich.com/MSDS/MSDS/DisplayMSDSPage.do?country=SE&language=E
N-
generic&productNumber=159417&brand=SIAL&PageToGoToURL=http%3A%2F%2Fwww
.sigmaaldrich.com%2Fcatalog%2Fproduct%2Fsial%2F159417%3Flang%3Den, ed, 2014.
[34] Tappi, Tappi Test Methods 1992-1993: T430. Atlanta: Tappi Press, 1992.
[35] H. F. Conway and V. E. Sohns, "A Simple Pilot-Plant Electrolytic Cell for Producing
Dialdehyde Starch," Journal of Industrial and Engineering Chemistry, vol. 51, pp. 637-638,
1959.
[36] V. F. Pfeifer, V. E. Sohns, H. F. Conway, E. B. Lancaster, S. Dabic, and E. L. J. Griffin,
"Two-Stage Process for Dialdehyde Starch Using Electrolytic Regeneration of Periodic Acid,"
Journal of Industrial and Engineering Chemistry, vol. 52, pp. 201-206, 1960.
[37] A. Besemer, "Recovery process for spent periodate," 00204482.4, 2002.
[38] T. A. McGuire and C. L. Mehltretter, "Chemical Process for Making Dialdehyde Starch," Die
Stärke/Starch, vol. 23, pp. 42-45, 1971.
[39] H. Liimatainen, J. Sirviö, H. Pajari, O. Hormi, and J. Niinimäki, "Regeneration and Recycling
of Aqueous Periodate Solution in Dialdehyde Cellulose Production," Journal of Wood
Chemistry and Technology, vol. 33, pp. 258-266, 2013/12/01 2013.
[40] M. W. Lister and P. Rosenblum, "The oxidation of nitrite and iodate ions by hypochlorite
ions," Canadian Journal of Chemistry, vol. 39, pp. 1645-1651, 1961.
[41] R. Kesselmans, "A method for the oxidation of starch with periodate," WO1998027118 A1,
1998.
36
[42] Sigma-Aldrich. (2015, June 2). Sodium periodate. Available:
http://www.sigmaaldrich.com/catalog/search?interface=All&term=sodium%20periodate&N=
0&focus=product⟨=en®ion=SE
[43] DuPont. (2015, April 22). DuPont™ Oxone® monopersulfate compound. Available:
http://www2.dupont.com/Oxone/en_US/index.html
[44] U. Initiators. (2015, April 22). Potassium peroxymonosulfate. Available: http://www.united-
initiators.com/products/details/potassium-peroxymonosulfate/
[45] OrgChem-Portal. (2015, April 24). Oxone. Available: http://www.organic-
chemistry.org/chemicals/oxidations/oxone-potassiumperoxomonosulfate.shtm
[46] C. Liu, E. Salhi, J.-P. Croué, and U. von Gunten, "Chlorination of Iodide-Containing Waters
in the Presence of CuO: Formation of Periodate," Environmental Science & Technology, vol.
48, pp. 13173-13180, 2014.
[47] F. N. Khan, R. Jayakumar, and C. N. Pillai, "Electrolytic oxidative cleavage by
electrogenerated periodate," Journal of Molecular Catlysis A: chemical, vol. 195, pp. 139-145,
2003.
[48] C. L. Mehltretter and D. William, "Electrolytic preparation of periodate oxypolysaccharides,"
US2648629 A, 1953.
[49] L. Eriksson, E. Johansson, N. Kettaneh-Wold, C. Wikström, and S. Wold, Design of
Experiments: Principles and Applications, 3 ed. Umeå: Umetrics, 2008.
[50] H. Zhao and N. D. Heindel, "Determination of Degree of Substitution of Formyl Groups in
Polyaldehyde Dextran by the Hydroxylamine Hydrochloride Method," Pharmaceutical
Research, vol. 8, pp. 400-402, 1991.
[51] Sigma-Aldrich. (2015, June 26). Sodium Hypochlorite Solution. Available:
http://www.sigmaaldrich.com/catalog/product/sial/71696?lang=en®ion=SE
[52] Sigma-Aldrich. (2015, June 25). Oxone. Available:
http://www.sigmaaldrich.com/catalog/product/sial/228036?lang=en®ion=SE
[53] A. T. Palin, "Methods for the determination, in water, of free and combined available chlorine,
chlorine dioxide and chlorite, bromine, iodine, and ozone, using diethyl-p-phenylene diamine
(DPD)," J Inst Water Eng, vol. 21, pp. 37-547, 1967.
[54] CSUStanislaus. (2015, June 15). The Determination of Chlorine Concentration in Water.
Available: http://wwwchem.csustan.edu/consumer/chlorine/chlorine.htm
[55] Q. Chang, K. Deng, L. Zhu, G. Jiang, C. Yu, and H. Tang, "Determination of hydrogen
peroxide with the aid of peroxidase-like Fe3O4 magnetic nanoparticles as the catalyst,"
Microchim Acta, vol. 165, pp. 299-305, 2009.
[56] W. Luo, M. E. Abbas, L. Zhu, K. Deng, and H. Tang, "Rapid quantitative determination of
hydrogen peroxide by oxidation decolorization of methyl orange using a Fenton reaction
system," Analytica Chimica Acta, vol. 629, pp. 1-5, 2008.
[57] Forceflow. (2015, June 23). Stability of sodium hypochlorite solutions. Available:
http://www.forceflow.com/hypochlorite/PioneerHypo.pdf
[58] S. Frais, Y.-L. Ng, and K. Gulabivala, "Some factors effecting the concentration of available
chlorine in commercial sources of sodium hypochlorite," International Endodontic Journal,
vol. 34, pp. 206-215, 2001.
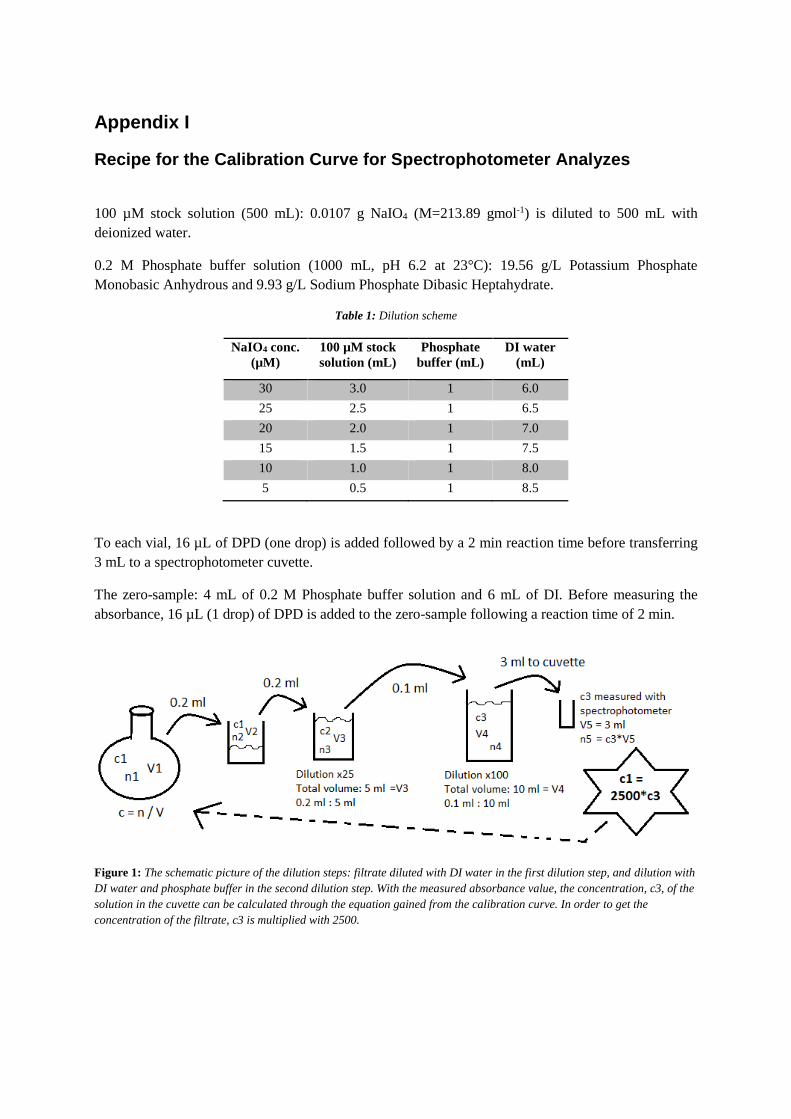
Appendix I
Recipe for the Calibration Curve for Spectrophotometer Analyzes
100 µM stock solution (500 mL): 0.0107 g NaIO4 (M=213.89 gmol-1) is diluted to 500 mL with
deionized water.
0.2 M Phosphate buffer solution (1000 mL, pH 6.2 at 23°C): 19.56 g/L Potassium Phosphate
Monobasic Anhydrous and 9.93 g/L Sodium Phosphate Dibasic Heptahydrate.
Table 1: Dilution scheme
NaIO4 conc.
(µM)
100 µM stock
solution (mL)
Phosphate
buffer (mL)
DI water
(mL)
30 3.0 1 6.0
25 2.5 1 6.5
20 2.0 1 7.0
15 1.5 1 7.5
10 1.0 1 8.0
5 0.5 1 8.5
To each vial, 16 µL of DPD (one drop) is added followed by a 2 min reaction time before transferring
3 mL to a spectrophotometer cuvette.
The zero-sample: 4 mL of 0.2 M Phosphate buffer solution and 6 mL of DI. Before measuring the
absorbance, 16 µL (1 drop) of DPD is added to the zero-sample following a reaction time of 2 min.
Figure 1: The schematic picture of the dilution steps: filtrate diluted with DI water in the first dilution step, and dilution with
DI water and phosphate buffer in the second dilution step. With the measured absorbance value, the concentration, c3, of the
solution in the cuvette can be calculated through the equation gained from the calibration curve. In order to get the
concentration of the filtrate, c3 is multiplied with 2500.
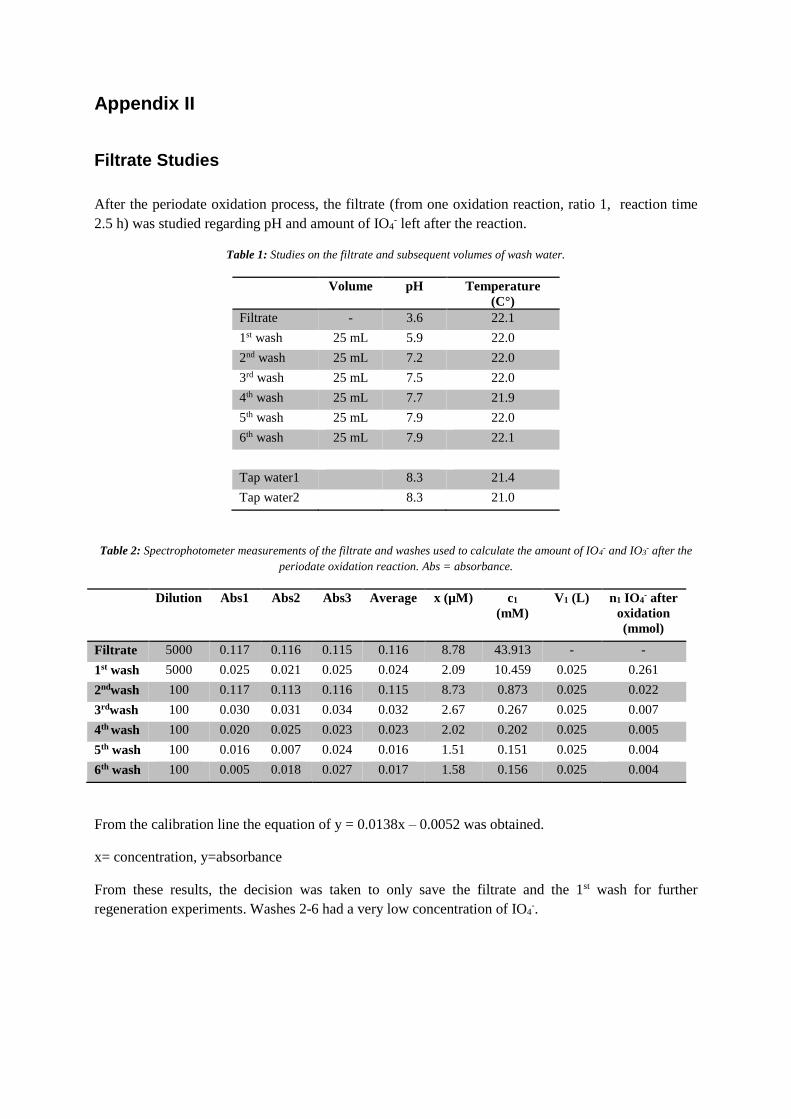
Appendix II
Filtrate Studies
After the periodate oxidation process, the filtrate (from one oxidation reaction, ratio 1, reaction time
2.5 h) was studied regarding pH and amount of IO4- left after the reaction.
Table 1: Studies on the filtrate and subsequent volumes of wash water.
Volume pH Temperature
(C°)
Filtrate - 3.6 22.1
1st wash 25 mL 5.9 22.0
2nd wash 25 mL 7.2 22.0
3rd wash 25 mL 7.5 22.0
4th wash 25 mL 7.7 21.9
5th wash 25 mL 7.9 22.0
6th wash 25 mL 7.9 22.1
Tap water1 8.3 21.4
Tap water2 8.3 21.0
Table 2: Spectrophotometer measurements of the filtrate and washes used to calculate the amount of IO4- and IO3
- after the
periodate oxidation reaction. Abs = absorbance.
Dilution Abs1 Abs2 Abs3 Average x (µM) c1
(mM)
V1 (L) n1 IO4- after
oxidation
(mmol)
Filtrate 5000 0.117 0.116 0.115 0.116 8.78 43.913 - -
1st wash 5000 0.025 0.021 0.025 0.024 2.09 10.459 0.025 0.261
2ndwash 100 0.117 0.113 0.116 0.115 8.73 0.873 0.025 0.022
3rdwash 100 0.030 0.031 0.034 0.032 2.67 0.267 0.025 0.007
4th wash 100 0.020 0.025 0.023 0.023 2.02 0.202 0.025 0.005
5th wash 100 0.016 0.007 0.024 0.016 1.51 0.151 0.025 0.004
6th wash 100 0.005 0.018 0.027 0.017 1.58 0.156 0.025 0.004
From the calibration line the equation of y = 0.0138x – 0.0052 was obtained.
x= concentration, y=absorbance
From these results, the decision was taken to only save the filtrate and the 1st wash for further
regeneration experiments. Washes 2-6 had a very low concentration of IO4-.
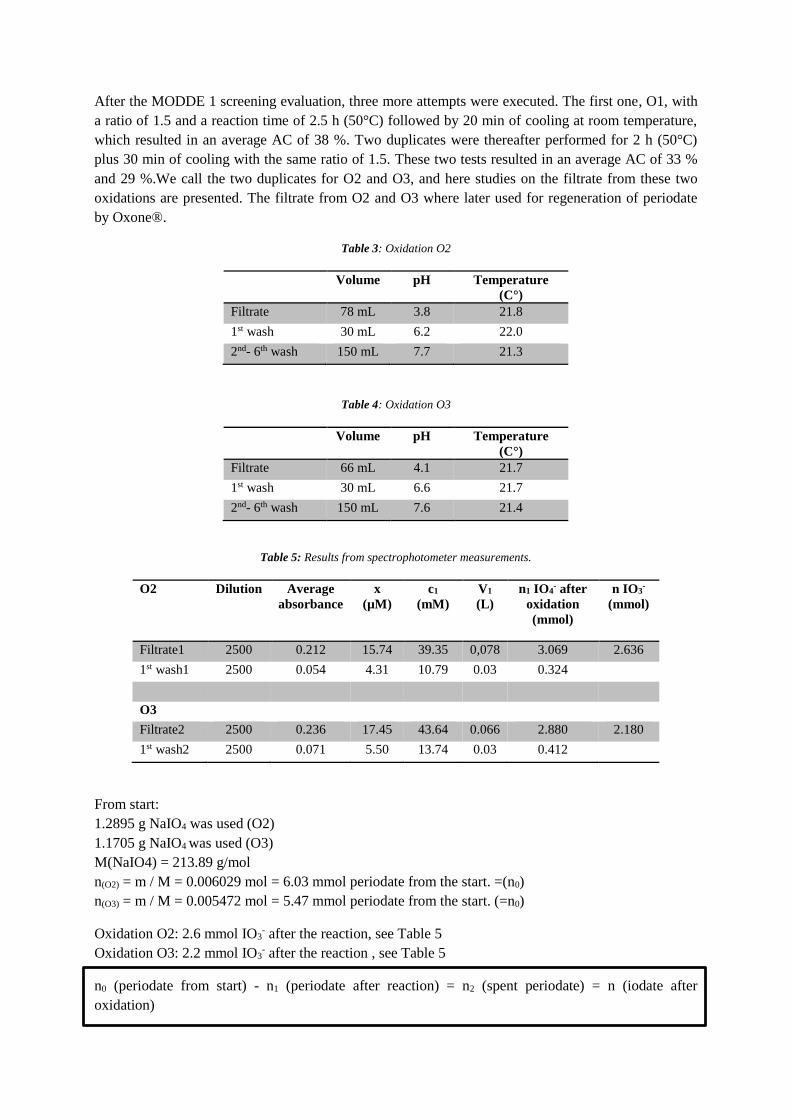
After the MODDE 1 screening evaluation, three more attempts were executed. The first one, O1, with
a ratio of 1.5 and a reaction time of 2.5 h (50°C) followed by 20 min of cooling at room temperature,
which resulted in an average AC of 38 %. Two duplicates were thereafter performed for 2 h (50°C)
plus 30 min of cooling with the same ratio of 1.5. These two tests resulted in an average AC of 33 %
and 29 %.We call the two duplicates for O2 and O3, and here studies on the filtrate from these two
oxidations are presented. The filtrate from O2 and O3 where later used for regeneration of periodate
by Oxone®.
Table 3: Oxidation O2
Volume pH Temperature
(C°)
Filtrate 78 mL 3.8 21.8
1st wash 30 mL 6.2 22.0
2nd- 6th wash 150 mL 7.7 21.3
Table 4: Oxidation O3
Volume pH Temperature
(C°)
Filtrate 66 mL 4.1 21.7
1st wash 30 mL 6.6 21.7
2nd- 6th wash 150 mL 7.6 21.4
Table 5: Results from spectrophotometer measurements.
O2 Dilution Average
absorbance
x
(µM)
c1
(mM)
V1
(L)
n1 IO4- after
oxidation
(mmol)
n IO3-
(mmol)
Filtrate1 2500 0.212 15.74 39.35 0,078 3.069 2.636
1st wash1 2500 0.054 4.31 10.79 0.03 0.324
O3
Filtrate2 2500 0.236 17.45 43.64 0.066 2.880 2.180
1st wash2 2500 0.071 5.50 13.74 0.03 0.412
From start:
1.2895 g NaIO4 was used (O2)
1.1705 g NaIO4 was used (O3)
M(NaIO4) = 213.89 g/mol
n(O2) = m / M = 0.006029 mol = 6.03 mmol periodate from the start. =(n0)
n(O3) = m / M = 0.005472 mol = 5.47 mmol periodate from the start. (=n0)
Oxidation O2: 2.6 mmol IO3- after the reaction, see Table 5
Oxidation O3: 2.2 mmol IO3- after the reaction , see Table 5
n0 (periodate from start) - n1 (periodate after reaction) = n2 (spent periodate) = n (iodate after
oxidation)
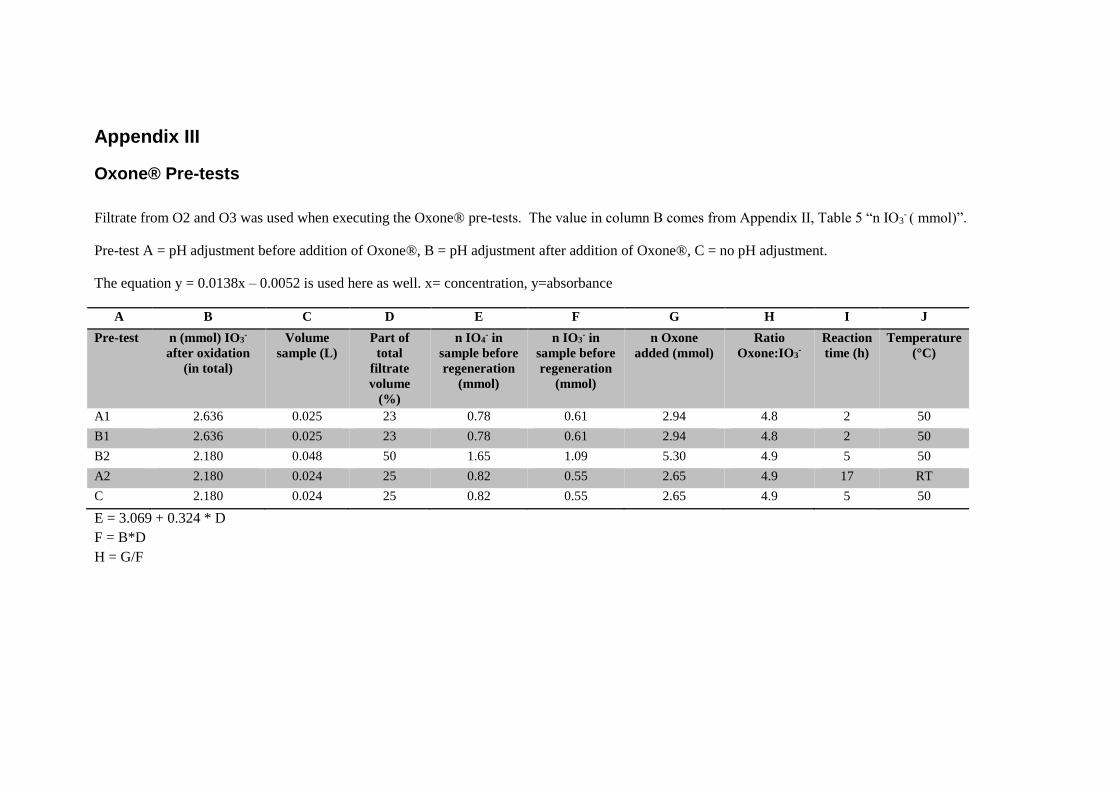
Appendix III
Oxone® Pre-tests
Filtrate from O2 and O3 was used when executing the Oxone® pre-tests. The value in column B comes from Appendix II, Table 5 “n IO3
- ( mmol)”.
Pre-test A = pH adjustment before addition of Oxone®, B = pH adjustment after addition of Oxone®, C = no pH adjustment.
The equation y = 0.0138x – 0.0052 is used here as well. x= concentration, y=absorbance
A B C D E F G H I J
Pre-test n (mmol) IO3-
after oxidation
(in total)
Volume
sample (L)
Part of
total
filtrate
volume
(%)
n IO4- in
sample before
regeneration
(mmol)
n IO3- in
sample before
regeneration
(mmol)
n Oxone
added (mmol)
Ratio
Oxone:IO3-
Reaction
time (h)
Temperature
(°C)
A1 2.636 0.025 23 0.78 0.61 2.94 4.8 2 50
B1 2.636 0.025 23 0.78 0.61 2.94 4.8 2 50
B2 2.180 0.048 50 1.65 1.09 5.30 4.9 5 50
A2 2.180 0.024 25 0.82 0.55 2.65 4.9 17 RT
C 2.180 0.024 25 0.82 0.55 2.65 4.9 5 50
E = 3.069 + 0.324 * D
F = B*D
H = G/F
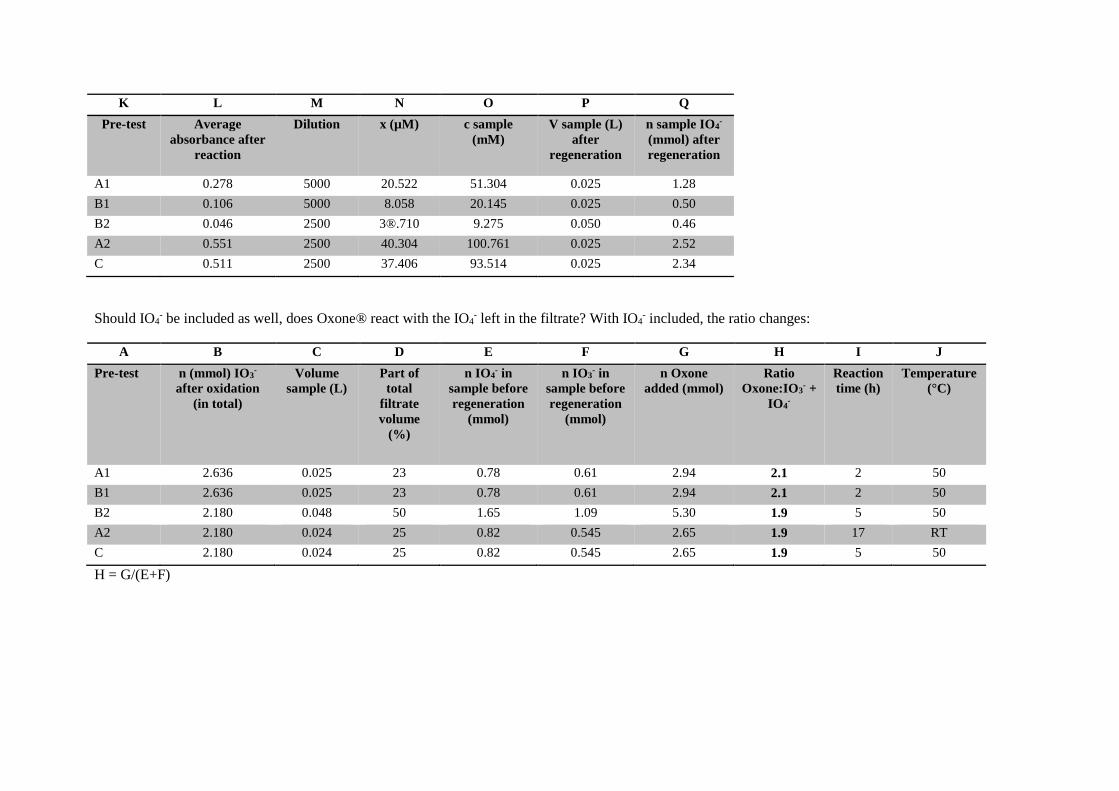
K L M N O P Q
Pre-test Average
absorbance after
reaction
Dilution x (µM) c sample
(mM)
V sample (L)
after
regeneration
n sample IO4-
(mmol) after
regeneration
A1 0.278 5000 20.522 51.304 0.025 1.28
B1 0.106 5000 8.058 20.145 0.025 0.50
B2 0.046 2500 3®.710 9.275 0.050 0.46
A2 0.551 2500 40.304 100.761 0.025 2.52
C 0.511 2500 37.406 93.514 0.025 2.34
Should IO4- be included as well, does Oxone® react with the IO4
- left in the filtrate? With IO4- included, the ratio changes:
A B C D E F G H I J
Pre-test n (mmol) IO3-
after oxidation
(in total)
Volume
sample (L)
Part of
total
filtrate
volume
(%)
n IO4- in
sample before
regeneration
(mmol)
n IO3- in
sample before
regeneration
(mmol)
n Oxone
added (mmol)
Ratio
Oxone:IO3- +
IO4-
Reaction
time (h)
Temperature
(°C)
A1 2.636 0.025 23 0.78 0.61 2.94 2.1 2 50
B1 2.636 0.025 23 0.78 0.61 2.94 2.1 2 50
B2 2.180 0.048 50 1.65 1.09 5.30 1.9 5 50
A2 2.180 0.024 25 0.82 0.545 2.65 1.9 17 RT
C 2.180 0.024 25 0.82 0.545 2.65 1.9 5 50
H = G/(E+F)
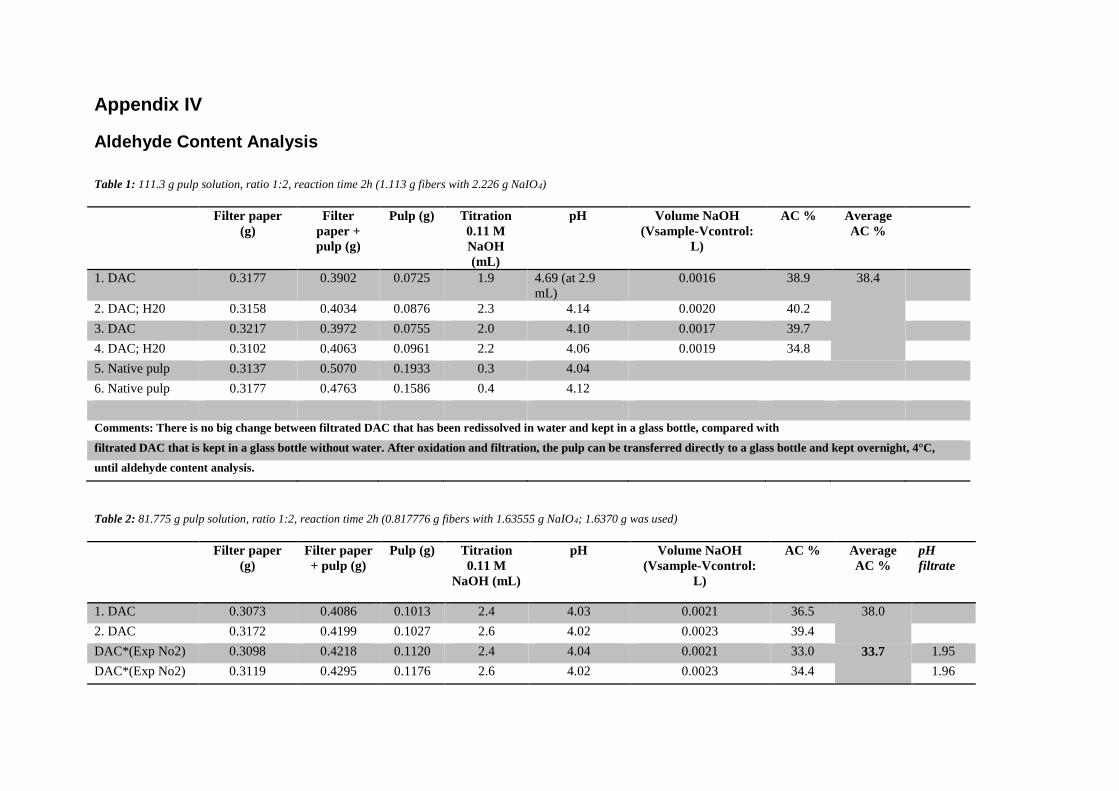
Appendix IV
Aldehyde Content Analysis
Table 1: 111.3 g pulp solution, ratio 1:2, reaction time 2h (1.113 g fibers with 2.226 g NaIO4)
Filter paper
(g)
Filter
paper +
pulp (g)
Pulp (g) Titration
0.11 M
NaOH
(mL)
pH Volume NaOH
(Vsample-Vcontrol:
L)
AC % Average
AC %
1. DAC 0.3177 0.3902 0.0725 1.9 4.69 (at 2.9
mL)
0.0016 38.9 38.4
2. DAC; H20 0.3158 0.4034 0.0876 2.3 4.14 0.0020 40.2
3. DAC 0.3217 0.3972 0.0755 2.0 4.10 0.0017 39.7
4. DAC; H20 0.3102 0.4063 0.0961 2.2 4.06 0.0019 34.8
5. Native pulp 0.3137 0.5070 0.1933 0.3 4.04
6. Native pulp 0.3177 0.4763 0.1586 0.4 4.12
Comments: There is no big change between filtrated DAC that has been redissolved in water and kept in a glass bottle, compared with filtrated DAC that is kept in a glass bottle without water. After oxidation and filtration, the pulp can be transferred directly to a glass bottle and kept overnight, 4°C,
until aldehyde content analysis.
Table 2: 81.775 g pulp solution, ratio 1:2, reaction time 2h (0.817776 g fibers with 1.63555 g NaIO4; 1.6370 g was used)
Filter paper
(g)
Filter paper
+ pulp (g)
Pulp (g) Titration
0.11 M
NaOH (mL)
pH Volume NaOH
(Vsample-Vcontrol:
L)
AC % Average
AC %
pH
filtrate
1. DAC 0.3073 0.4086 0.1013 2.4 4.03 0.0021 36.5 38.0
2. DAC 0.3172 0.4199 0.1027 2.6 4.02 0.0023 39.4
DAC*(Exp No2) 0.3098 0.4218 0.1120 2.4 4.04 0.0021 33.0 33.7 1.95
DAC*(Exp No2) 0.3119 0.4295 0.1176 2.6 4.02 0.0023 34.4 1.96
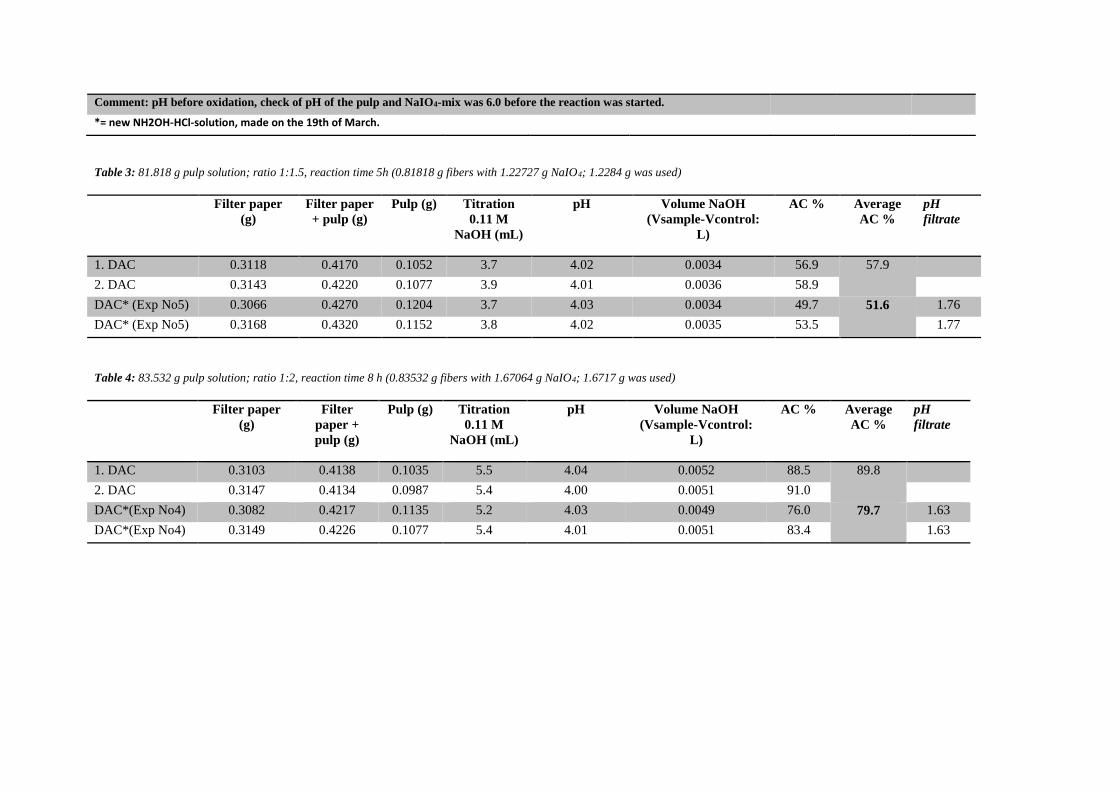
Comment: pH before oxidation, check of pH of the pulp and NaIO4-mix was 6.0 before the reaction was started. *= new NH2OH-HCl-solution, made on the 19th of March.
Table 3: 81.818 g pulp solution; ratio 1:1.5, reaction time 5h (0.81818 g fibers with 1.22727 g NaIO4; 1.2284 g was used)
Filter paper
(g)
Filter paper
+ pulp (g)
Pulp (g) Titration
0.11 M
NaOH (mL)
pH Volume NaOH
(Vsample-Vcontrol:
L)
AC % Average
AC %
pH
filtrate
1. DAC 0.3118 0.4170 0.1052 3.7 4.02 0.0034 56.9 57.9
2. DAC 0.3143 0.4220 0.1077 3.9 4.01 0.0036 58.9
DAC* (Exp No5) 0.3066 0.4270 0.1204 3.7 4.03 0.0034 49.7 51.6 1.76
DAC* (Exp No5) 0.3168 0.4320 0.1152 3.8 4.02 0.0035 53.5 1.77
Table 4: 83.532 g pulp solution; ratio 1:2, reaction time 8 h (0.83532 g fibers with 1.67064 g NaIO4; 1.6717 g was used)
Filter paper
(g)
Filter
paper +
pulp (g)
Pulp (g) Titration
0.11 M
NaOH (mL)
pH Volume NaOH
(Vsample-Vcontrol:
L)
AC % Average
AC %
pH
filtrate
1. DAC 0.3103 0.4138 0.1035 5.5 4.04 0.0052 88.5 89.8
2. DAC 0.3147 0.4134 0.0987 5.4 4.00 0.0051 91.0
DAC*(Exp No4) 0.3082 0.4217 0.1135 5.2 4.03 0.0049 76.0 79.7 1.63
DAC*(Exp No4) 0.3149 0.4226 0.1077 5.4 4.01 0.0051 83.4 1.63
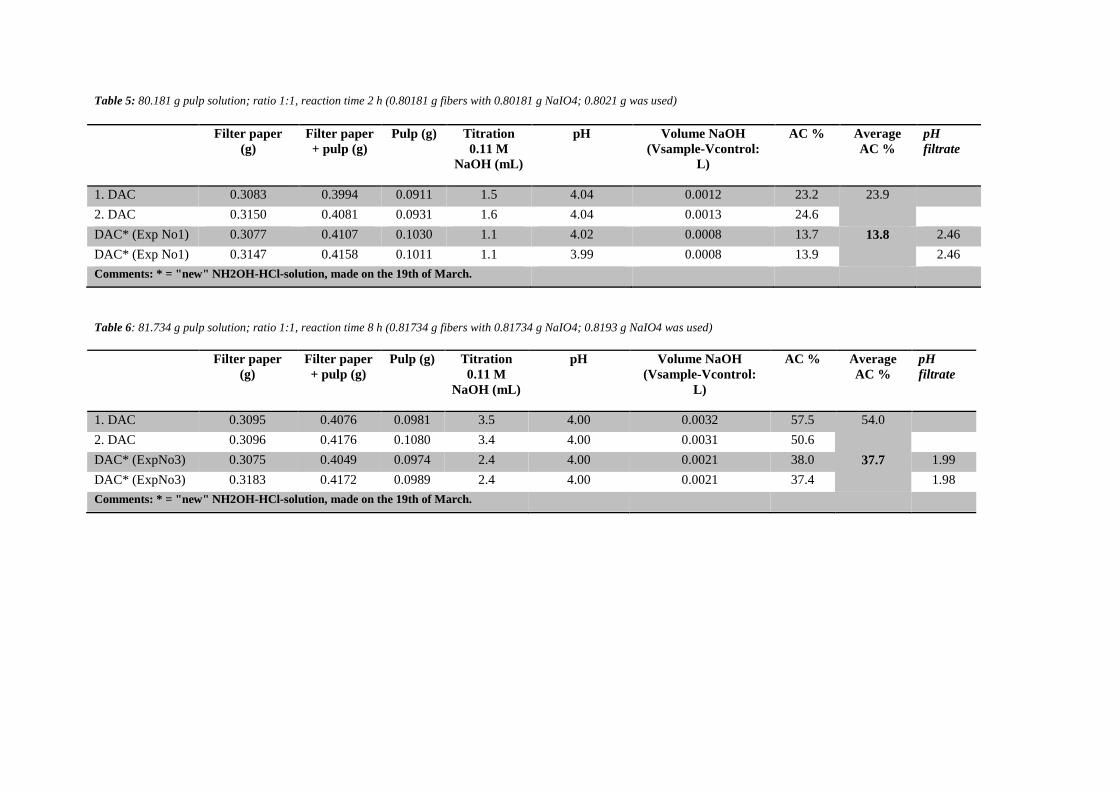
Table 5: 80.181 g pulp solution; ratio 1:1, reaction time 2 h (0.80181 g fibers with 0.80181 g NaIO4; 0.8021 g was used)
Filter paper
(g)
Filter paper
+ pulp (g)
Pulp (g) Titration
0.11 M
NaOH (mL)
pH Volume NaOH
(Vsample-Vcontrol:
L)
AC % Average
AC %
pH
filtrate
1. DAC 0.3083 0.3994 0.0911 1.5 4.04 0.0012 23.2 23.9
2. DAC 0.3150 0.4081 0.0931 1.6 4.04 0.0013 24.6
DAC* (Exp No1) 0.3077 0.4107 0.1030 1.1 4.02 0.0008 13.7 13.8 2.46
DAC* (Exp No1) 0.3147 0.4158 0.1011 1.1 3.99 0.0008 13.9 2.46
Comments: * = "new" NH2OH-HCl-solution, made on the 19th of March.
Table 6: 81.734 g pulp solution; ratio 1:1, reaction time 8 h (0.81734 g fibers with 0.81734 g NaIO4; 0.8193 g NaIO4 was used)
Filter paper
(g)
Filter paper
+ pulp (g)
Pulp (g) Titration
0.11 M
NaOH (mL)
pH Volume NaOH
(Vsample-Vcontrol:
L)
AC % Average
AC %
pH
filtrate
1. DAC 0.3095 0.4076 0.0981 3.5 4.00 0.0032 57.5 54.0
2. DAC 0.3096 0.4176 0.1080 3.4 4.00 0.0031 50.6
DAC* (ExpNo3) 0.3075 0.4049 0.0974 2.4 4.00 0.0021 38.0 37.7 1.99
DAC* (ExpNo3) 0.3183 0.4172 0.0989 2.4 4.00 0.0021 37.4 1.98
Comments: * = "new" NH2OH-HCl-solution, made on the 19th of March.
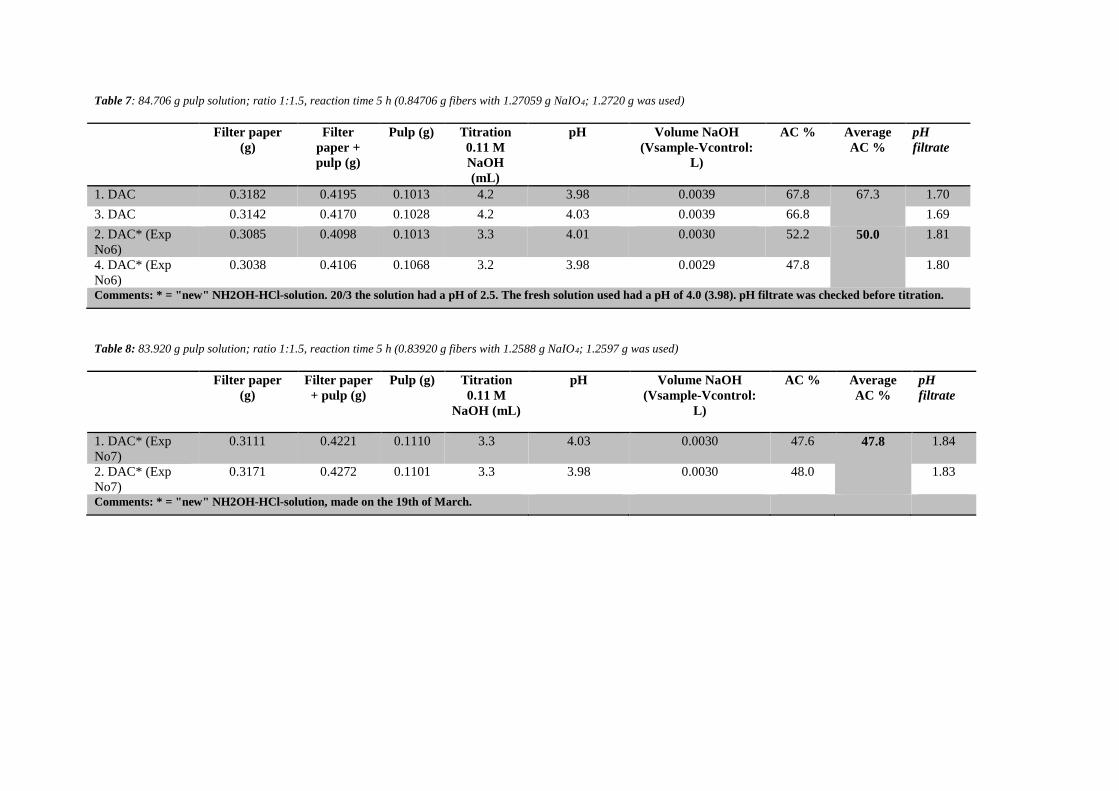
Table 7: 84.706 g pulp solution; ratio 1:1.5, reaction time 5 h (0.84706 g fibers with 1.27059 g NaIO4; 1.2720 g was used)
Filter paper
(g)
Filter
paper +
pulp (g)
Pulp (g) Titration
0.11 M
NaOH
(mL)
pH Volume NaOH
(Vsample-Vcontrol:
L)
AC % Average
AC %
pH
filtrate
1. DAC 0.3182 0.4195 0.1013 4.2 3.98 0.0039 67.8 67.3 1.70
3. DAC 0.3142 0.4170 0.1028 4.2 4.03 0.0039 66.8 1.69
2. DAC* (Exp
No6)
0.3085 0.4098 0.1013 3.3 4.01 0.0030 52.2 50.0 1.81
4. DAC* (Exp
No6)
0.3038 0.4106 0.1068 3.2 3.98 0.0029 47.8 1.80
Comments: * = "new" NH2OH-HCl-solution. 20/3 the solution had a pH of 2.5. The fresh solution used had a pH of 4.0 (3.98). pH filtrate was checked before titration.
Table 8: 83.920 g pulp solution; ratio 1:1.5, reaction time 5 h (0.83920 g fibers with 1.2588 g NaIO4; 1.2597 g was used)
Filter paper
(g)
Filter paper
+ pulp (g)
Pulp (g) Titration
0.11 M
NaOH (mL)
pH Volume NaOH
(Vsample-Vcontrol:
L)
AC % Average
AC %
pH
filtrate
1. DAC* (Exp
No7)
0.3111 0.4221 0.1110 3.3 4.03 0.0030 47.6 47.8 1.84
2. DAC* (Exp
No7)
0.3171 0.4272 0.1101 3.3 3.98 0.0030 48.0 1.83
Comments: * = "new" NH2OH-HCl-solution, made on the 19th of March.
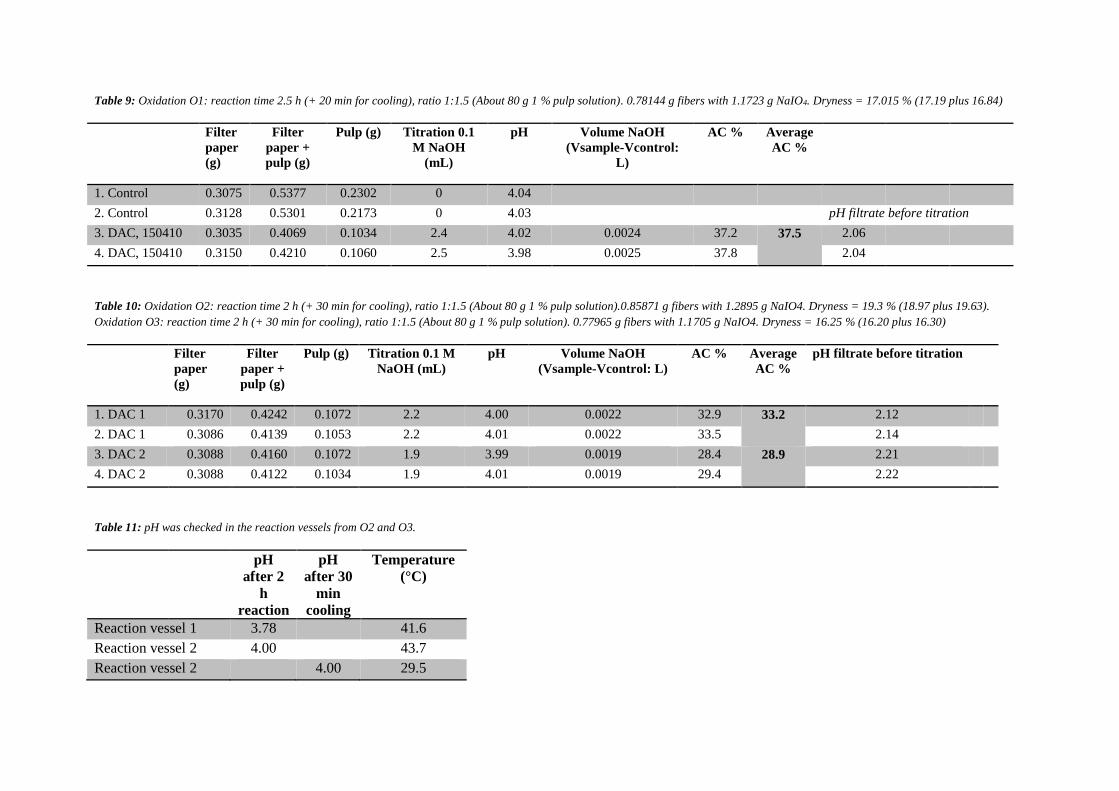
Table 9: Oxidation O1: reaction time 2.5 h (+ 20 min for cooling), ratio 1:1.5 (About 80 g 1 % pulp solution). 0.78144 g fibers with 1.1723 g NaIO4. Dryness = 17.015 % (17.19 plus 16.84)
Filter
paper
(g)
Filter
paper +
pulp (g)
Pulp (g) Titration 0.1
M NaOH
(mL)
pH Volume NaOH
(Vsample-Vcontrol:
L)
AC % Average
AC %
1. Control 0.3075 0.5377 0.2302 0 4.04
2. Control 0.3128 0.5301 0.2173 0 4.03 pH filtrate before titration
3. DAC, 150410 0.3035 0.4069 0.1034 2.4 4.02 0.0024 37.2 37.5 2.06
4. DAC, 150410 0.3150 0.4210 0.1060 2.5 3.98 0.0025 37.8 2.04
Table 10: Oxidation O2: reaction time 2 h (+ 30 min for cooling), ratio 1:1.5 (About 80 g 1 % pulp solution).0.85871 g fibers with 1.2895 g NaIO4. Dryness = 19.3 % (18.97 plus 19.63).
Oxidation O3: reaction time 2 h (+ 30 min for cooling), ratio 1:1.5 (About 80 g 1 % pulp solution). 0.77965 g fibers with 1.1705 g NaIO4. Dryness = 16.25 % (16.20 plus 16.30)
Filter
paper
(g)
Filter
paper +
pulp (g)
Pulp (g) Titration 0.1 M
NaOH (mL)
pH Volume NaOH
(Vsample-Vcontrol: L)
AC % Average
AC %
pH filtrate before titration
1. DAC 1 0.3170 0.4242 0.1072 2.2 4.00 0.0022 32.9 33.2 2.12 2. DAC 1 0.3086 0.4139 0.1053 2.2 4.01 0.0022 33.5 2.14 3. DAC 2 0.3088 0.4160 0.1072 1.9 3.99 0.0019 28.4 28.9 2.21 4. DAC 2 0.3088 0.4122 0.1034 1.9 4.01 0.0019 29.4 2.22
Table 11: pH was checked in the reaction vessels from O2 and O3.
pH
after 2
h
reaction
pH
after 30
min
cooling
Temperature
(°C)
Reaction vessel 1 3.78 41.6
Reaction vessel 2 4.00 43.7
Reaction vessel 2 4.00 29.5
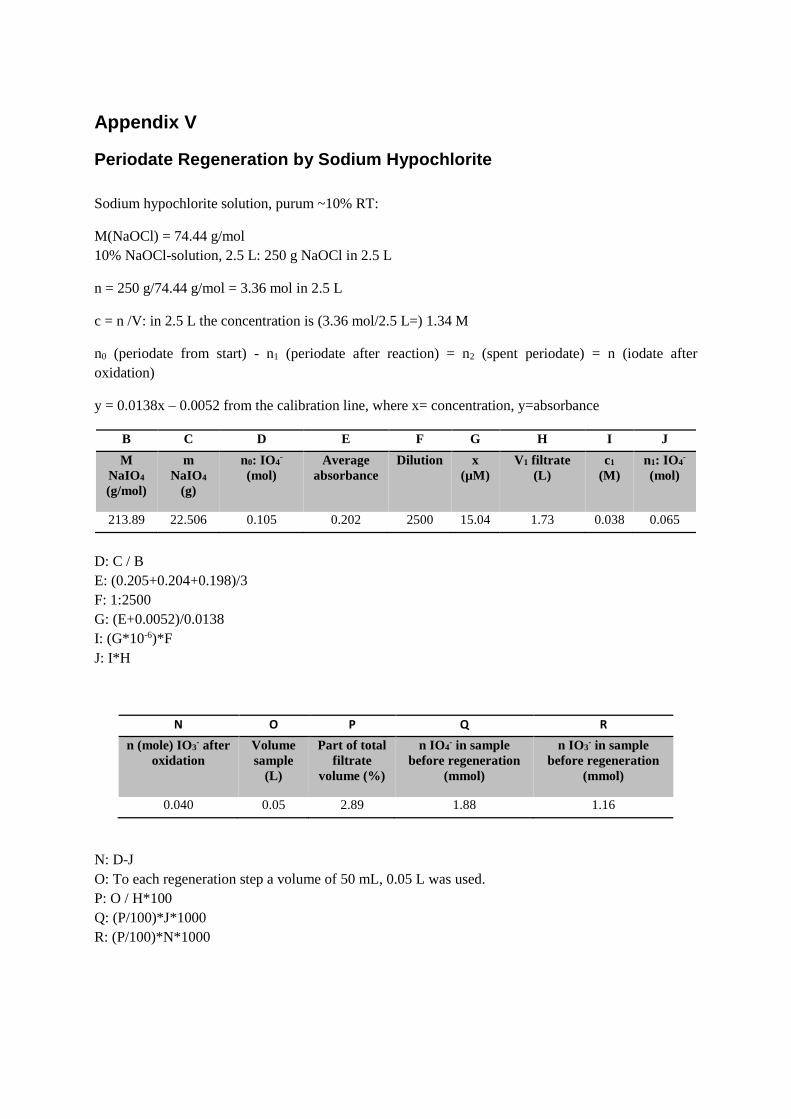
Appendix V
Periodate Regeneration by Sodium Hypochlorite
Sodium hypochlorite solution, purum ~10% RT:
M(NaOCl) = 74.44 g/mol
10% NaOCl-solution, 2.5 L: 250 g NaOCl in 2.5 L
n = 250 g/74.44 g/mol = 3.36 mol in 2.5 L
c = n /V: in 2.5 L the concentration is (3.36 mol/2.5 L=) 1.34 M
n0 (periodate from start) - n1 (periodate after reaction) = n2 (spent periodate) = n (iodate after
oxidation)
y = 0.0138x – 0.0052 from the calibration line, where x= concentration, y=absorbance
B C D E F G H I J
M
NaIO4
(g/mol)
m
NaIO4
(g)
n0: IO4-
(mol)
Average
absorbance
Dilution x
(µM)
V1 filtrate
(L)
c1
(M)
n1: IO4-
(mol)
213.89 22.506 0.105 0.202 2500 15.04 1.73 0.038 0.065
D: C / B
E: (0.205+0.204+0.198)/3
F: 1:2500
G: (E+0.0052)/0.0138
I: (G*10-6)*F
J: I*H
N O P Q R
n (mole) IO3- after
oxidation
Volume
sample
(L)
Part of total
filtrate
volume (%)
n IO4- in sample
before regeneration
(mmol)
n IO3- in sample
before regeneration
(mmol)
0.040 0.05 2.89 1.88 1.16
N: D-J
O: To each regeneration step a volume of 50 mL, 0.05 L was used.
P: O / H*100
Q: (P/100)*J*1000
R: (P/100)*N*1000
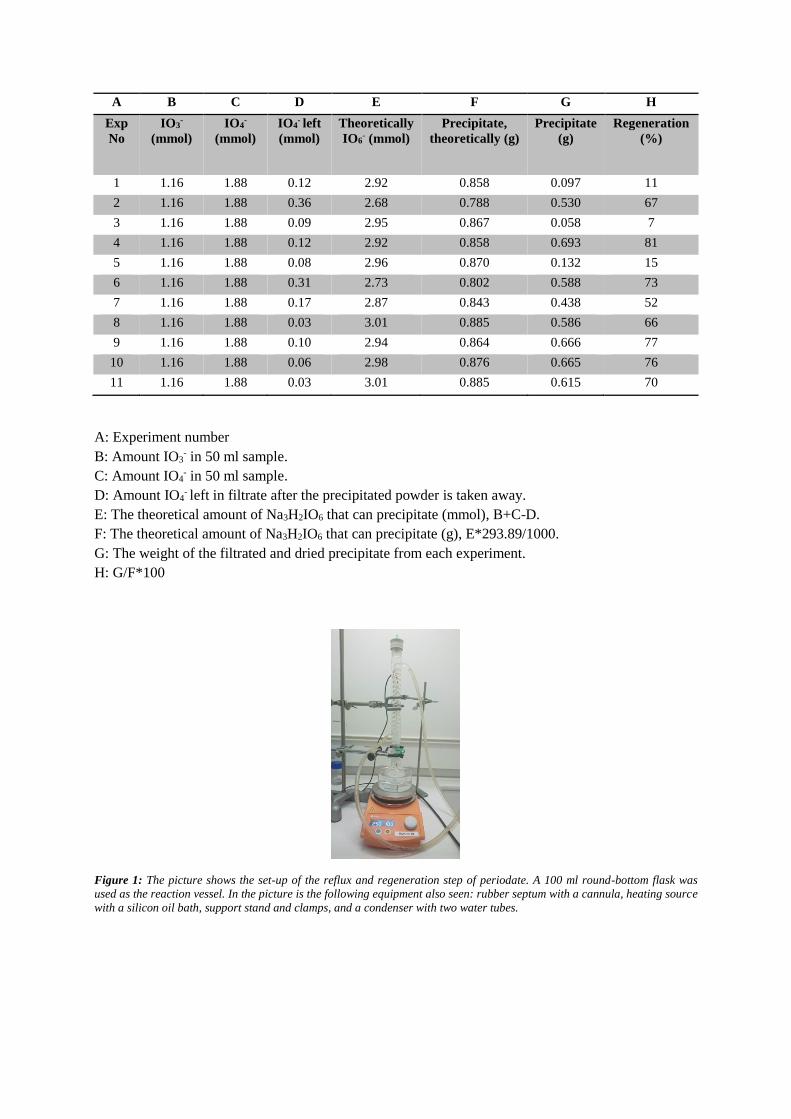
A B C D E F G H
Exp
No
IO3-
(mmol)
IO4-
(mmol)
IO4- left
(mmol)
Theoretically
IO6- (mmol)
Precipitate,
theoretically (g)
Precipitate
(g)
Regeneration
(%)
1 1.16 1.88 0.12 2.92 0.858 0.097 11
2 1.16 1.88 0.36 2.68 0.788 0.530 67
3 1.16 1.88 0.09 2.95 0.867 0.058 7
4 1.16 1.88 0.12 2.92 0.858 0.693 81
5 1.16 1.88 0.08 2.96 0.870 0.132 15
6 1.16 1.88 0.31 2.73 0.802 0.588 73
7 1.16 1.88 0.17 2.87 0.843 0.438 52
8 1.16 1.88 0.03 3.01 0.885 0.586 66
9 1.16 1.88 0.10 2.94 0.864 0.666 77
10 1.16 1.88 0.06 2.98 0.876 0.665 76
11 1.16 1.88 0.03 3.01 0.885 0.615 70
A: Experiment number
B: Amount IO3- in 50 ml sample.
C: Amount IO4- in 50 ml sample.
D: Amount IO4- left in filtrate after the precipitated powder is taken away.
E: The theoretical amount of Na3H2IO6 that can precipitate (mmol), B+C-D.
F: The theoretical amount of Na3H2IO6 that can precipitate (g), E*293.89/1000.
G: The weight of the filtrated and dried precipitate from each experiment.
H: G/F*100
Figure 1: The picture shows the set-up of the reflux and regeneration step of periodate. A 100 ml round-bottom flask was
used as the reaction vessel. In the picture is the following equipment also seen: rubber septum with a cannula, heating source
with a silicon oil bath, support stand and clamps, and a condenser with two water tubes.
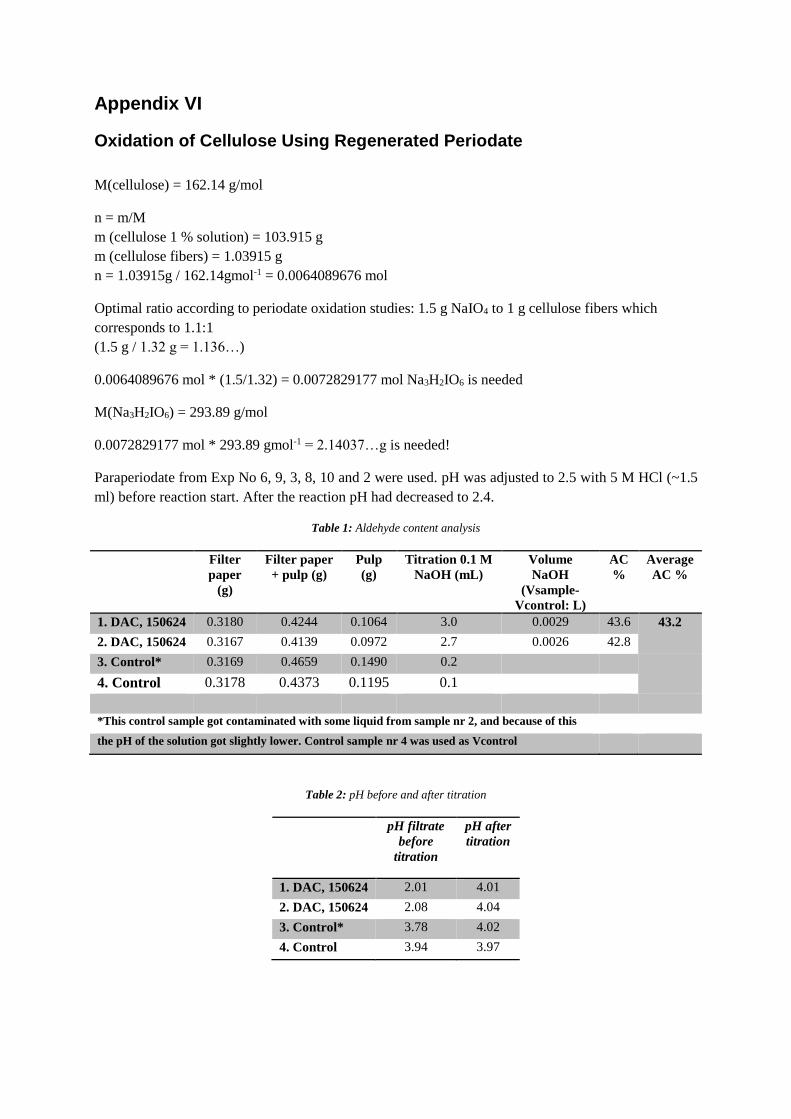
Appendix VI
Oxidation of Cellulose Using Regenerated Periodate
M(cellulose) = 162.14 g/mol
n = m/M
m (cellulose 1 % solution) = 103.915 g
m (cellulose fibers) = 1.03915 g
n = 1.03915g / 162.14gmol-1 = 0.0064089676 mol
Optimal ratio according to periodate oxidation studies: 1.5 g NaIO4 to 1 g cellulose fibers which
corresponds to 1.1:1
(1.5 g / 1.32 g = 1.136…)
0.0064089676 mol * (1.5/1.32) = 0.0072829177 mol Na3H2IO6 is needed
M(Na3H2IO6) = 293.89 g/mol
0.0072829177 mol * 293.89 gmol-1 = 2.14037…g is needed!
Paraperiodate from Exp No 6, 9, 3, 8, 10 and 2 were used. pH was adjusted to 2.5 with 5 M HCl (~1.5
ml) before reaction start. After the reaction pH had decreased to 2.4.
Table 1: Aldehyde content analysis
Filter
paper
(g)
Filter paper
+ pulp (g)
Pulp
(g)
Titration 0.1 M
NaOH (mL)
Volume
NaOH
(Vsample-
Vcontrol: L)
AC
%
Average
AC %
1. DAC, 150624 0.3180 0.4244 0.1064 3.0 0.0029 43.6 43.2
2. DAC, 150624 0.3167 0.4139 0.0972 2.7 0.0026 42.8
3. Control* 0.3169 0.4659 0.1490 0.2
4. Control 0.3178 0.4373 0.1195 0.1
*This control sample got contaminated with some liquid from sample nr 2, and because of this
the pH of the solution got slightly lower. Control sample nr 4 was used as Vcontrol
Table 2: pH before and after titration
pH filtrate
before
titration
pH after
titration
1. DAC, 150624 2.01 4.01
2. DAC, 150624 2.08 4.04
3. Control* 3.78 4.02
4. Control 3.94 3.97
Appendix VII
FTIR Analyze of Precipitated Product Stacked spectra from FTIR analysis of the reference products (NaIO4 and Na3H2IO6) and obtained products, precipitates, from the regeneration experiments
with hypochlorite.
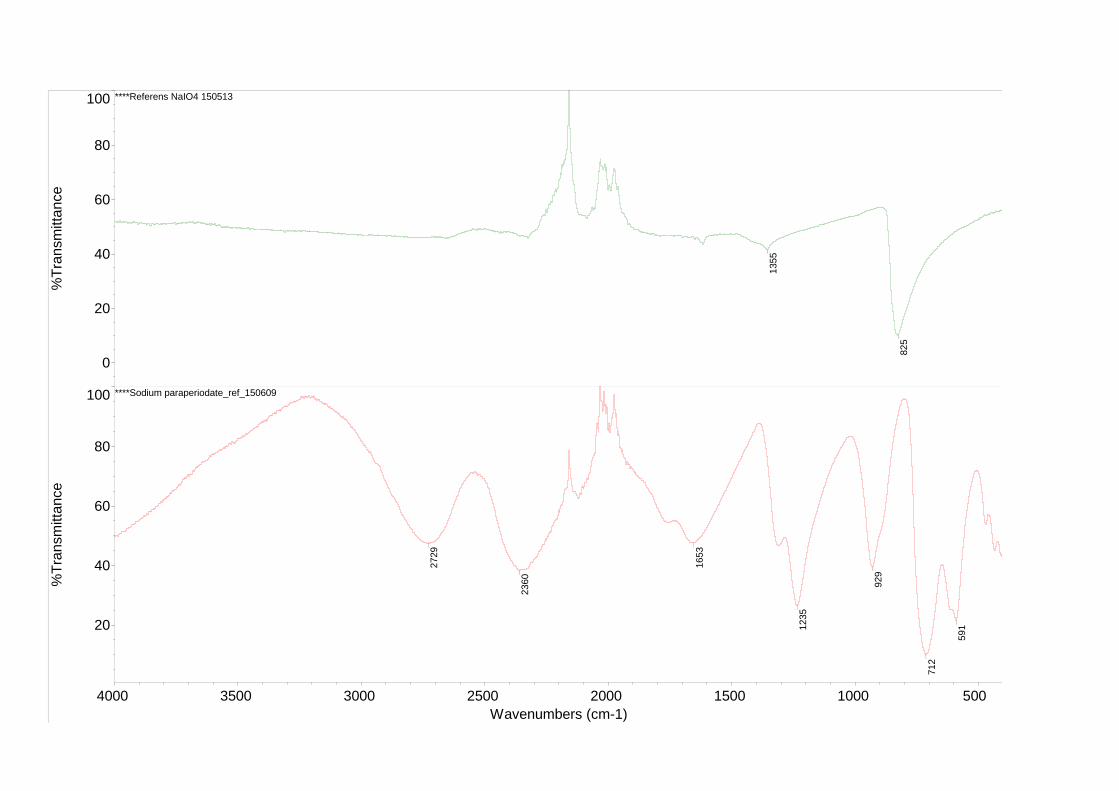
825
1355
****Referens NaIO4 150513
0
20
40
60
80
100
%T
ransm
itta
nce
406
591
712
929
1235
1653
2360
2729
****Sodium paraperiodate_ref_150609
20
40
60
80
100
%T
ransm
itta
nce
500 1000 1500 2000 2500 3000 3500 4000
Wavenumbers (cm-1)
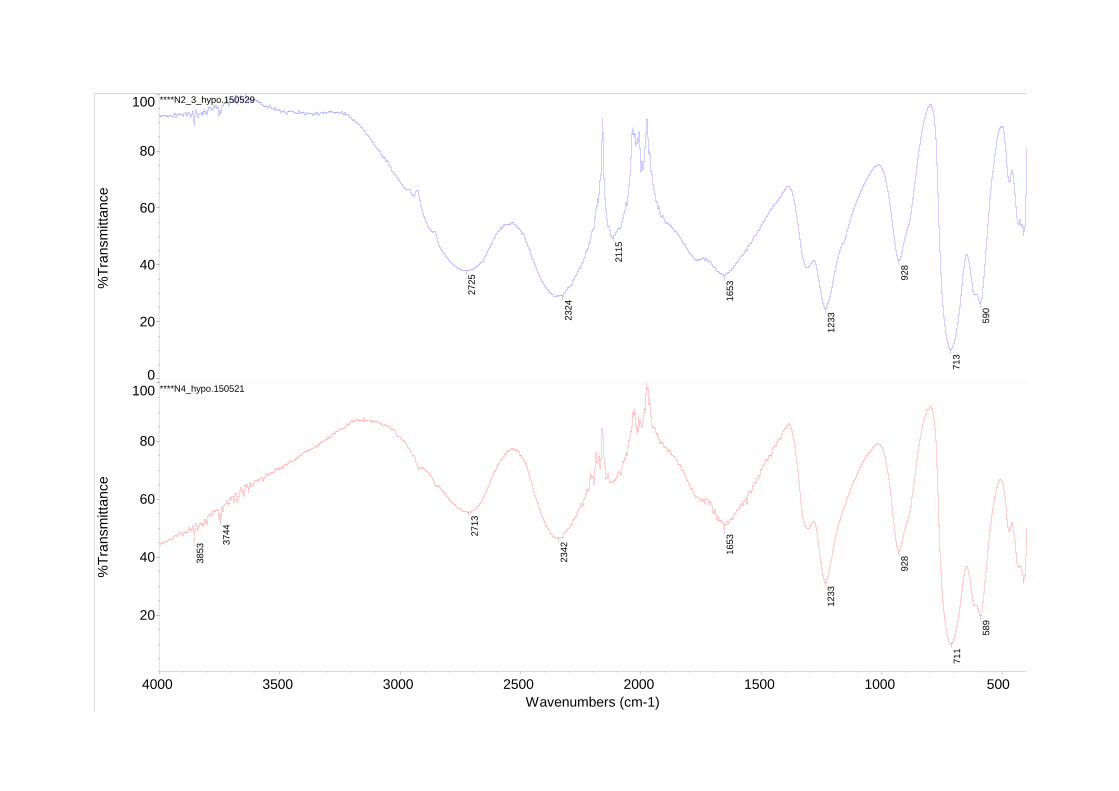
409
590
713
928
1233
1653
2115
2324
2725
****N2_3_hypo.150529
0
20
40
60
80
100%
Tra
nsm
itta
nce
409
589
711
928
1233
1653
2342
2713
3744
3853
****N4_hypo.150521
20
40
60
80
100
%T
ransm
itta
nce
500 1000 1500 2000 2500 3000 3500 4000
Wavenumbers (cm-1)
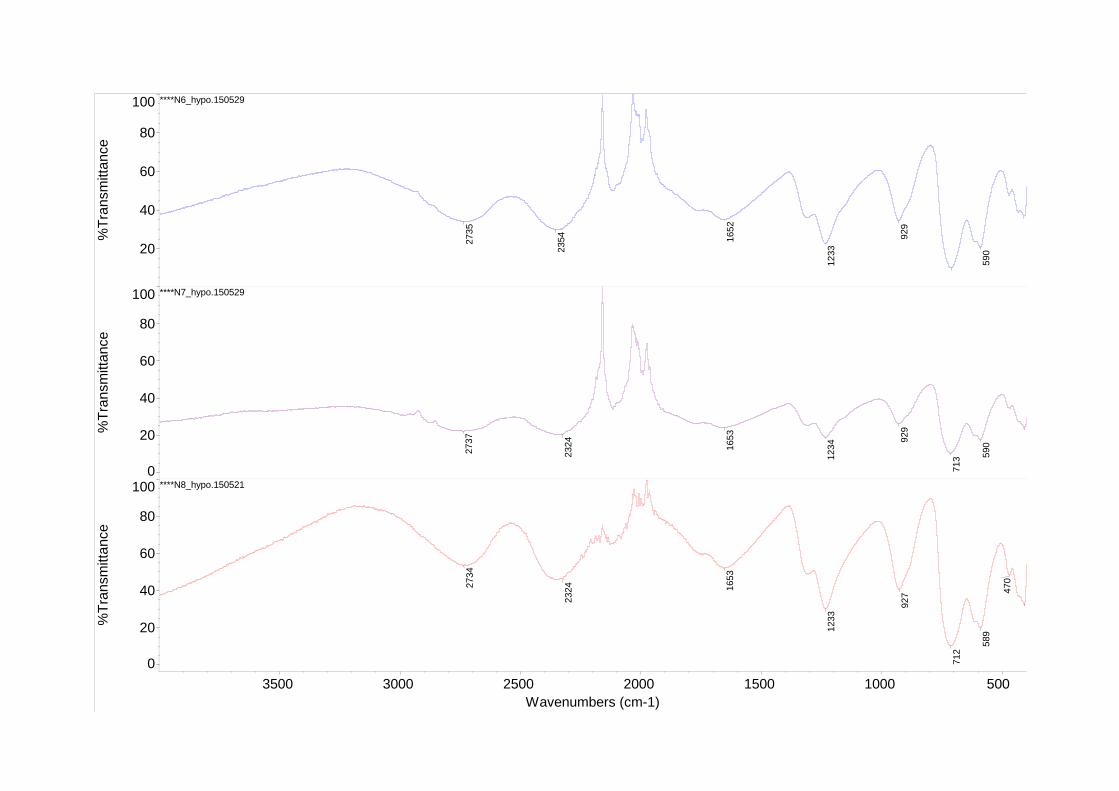
409
590
929
1233
1652
2354
2735
****N6_hypo.150529
20
40
60
80
100%
Tra
nsm
itta
nce
409
590
713
929
1234
1653
2324
2737
****N7_hypo.150529
0
20
40
60
80
100
%T
ransm
itta
nce
406
470
589
712
927
1233
1653
23242734
****N8_hypo.150521
0
20
40
60
80
100
%T
ransm
itta
nce
500 1000 1500 2000 2500 3000 3500
Wavenumbers (cm-1)
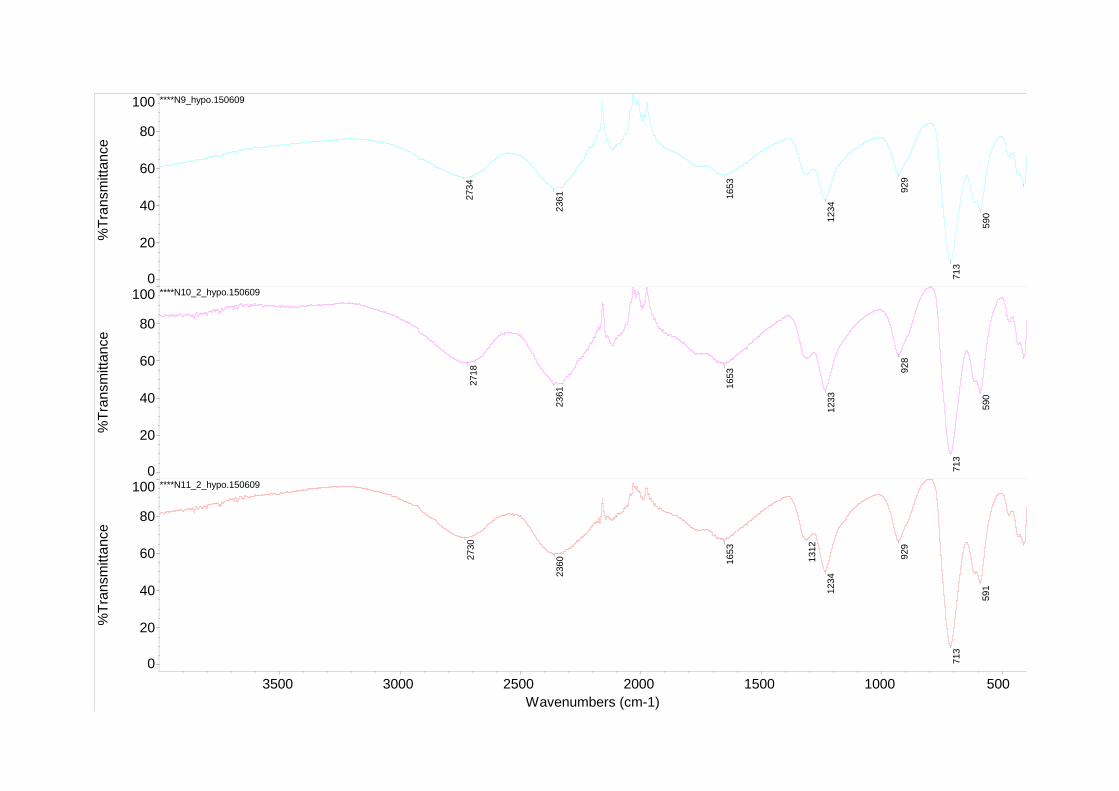
410
590
713
929
1234
1653
23612734
****N9_hypo.150609
0
20
40
60
80
100%
Tra
nsm
itta
nce
410
590
713
928
1233
1653
2361
2718
****N10_2_hypo.150609
0
20
40
60
80
100
%T
ransm
itta
nce
410
591
713
929
1234
1312
1653
23602
730
****N11_2_hypo.150609
0
20
40
60
80
100
%T
ransm
itta
nce
500 1000 1500 2000 2500 3000 3500
Wavenumbers (cm-1)
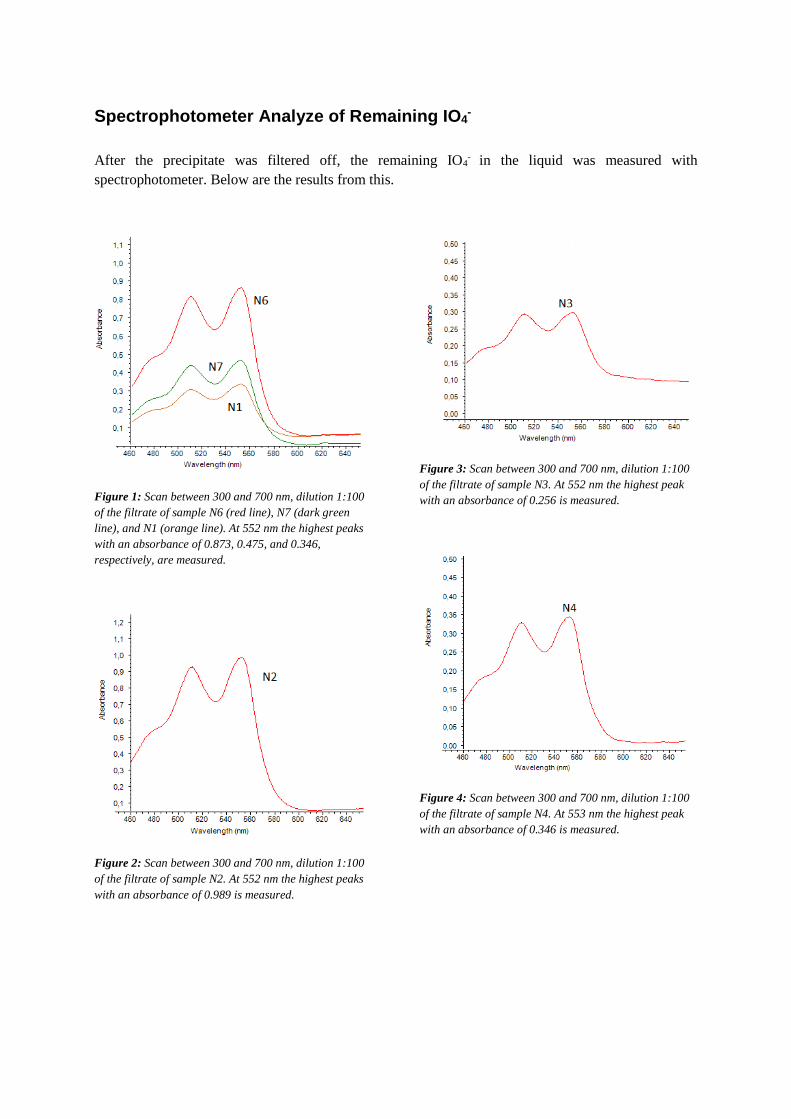
Spectrophotometer Analyze of Remaining IO4-
After the precipitate was filtered off, the remaining IO4- in the liquid was measured with
spectrophotometer. Below are the results from this.
Figure 1: Scan between 300 and 700 nm, dilution 1:100
of the filtrate of sample N6 (red line), N7 (dark green
line), and N1 (orange line). At 552 nm the highest peaks
with an absorbance of 0.873, 0.475, and 0.346,
respectively, are measured.
Figure 2: Scan between 300 and 700 nm, dilution 1:100
of the filtrate of sample N2. At 552 nm the highest peaks
with an absorbance of 0.989 is measured.
Figure 3: Scan between 300 and 700 nm, dilution 1:100
of the filtrate of sample N3. At 552 nm the highest peak
with an absorbance of 0.256 is measured.
Figure 4: Scan between 300 and 700 nm, dilution 1:100
of the filtrate of sample N4. At 553 nm the highest peak
with an absorbance of 0.346 is measured.
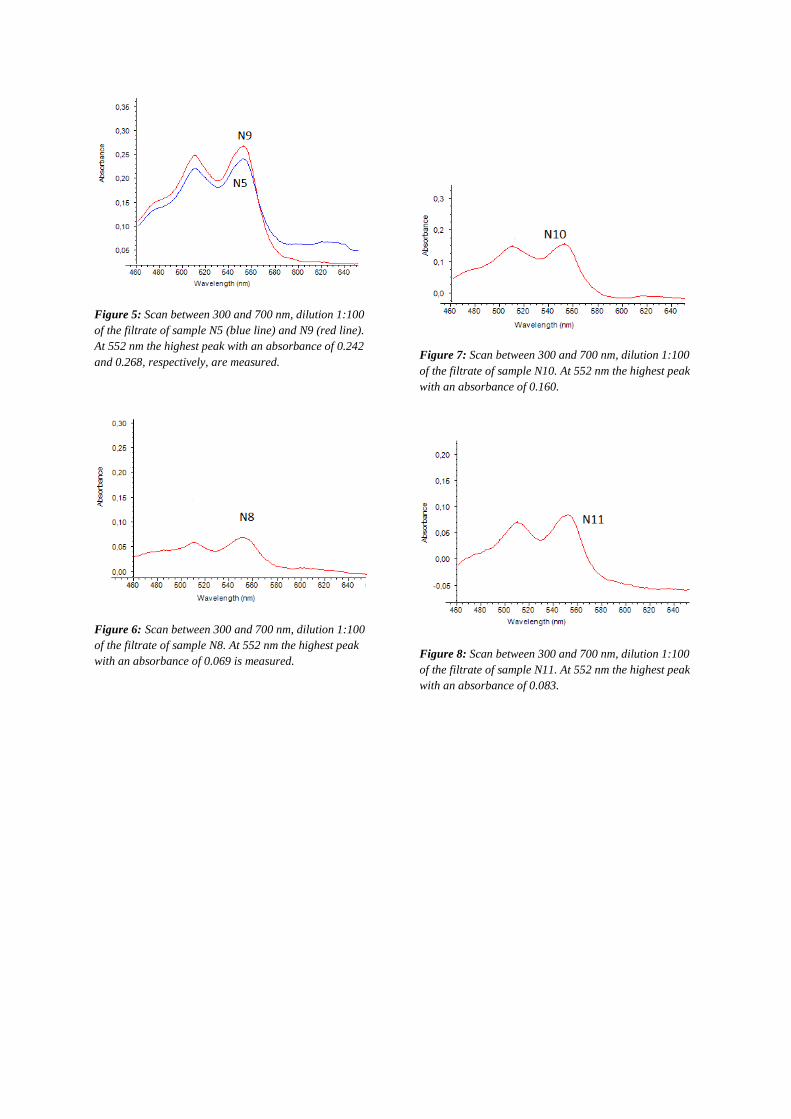
Figure 5: Scan between 300 and 700 nm, dilution 1:100
of the filtrate of sample N5 (blue line) and N9 (red line).
At 552 nm the highest peak with an absorbance of 0.242
and 0.268, respectively, are measured.
Figure 6: Scan between 300 and 700 nm, dilution 1:100
of the filtrate of sample N8. At 552 nm the highest peak
with an absorbance of 0.069 is measured.
Figure 7: Scan between 300 and 700 nm, dilution 1:100
of the filtrate of sample N10. At 552 nm the highest peak
with an absorbance of 0.160.
Figure 8: Scan between 300 and 700 nm, dilution 1:100
of the filtrate of sample N11. At 552 nm the highest peak
with an absorbance of 0.083.

Appendix VIII
Risk Assessments
Oxone®
Method/ Task Source of Risk Health / Accident
(What could
happen?) Precautions
1. Handling, such as
weighing and addition
of the chemical to the
reaction vessel.
Oxone® is oxidizing May intensify fire. Can
in contact with
combustible material
cause fire.
Keep separated from
clothing / combustible
materials. Small
amounts are handled!
(<5g). Store in a cool,
dry, well-ventilated
place. Store in a clean
cabinet adjacent to the
hood. Use a special lab
coat of inflammable
material if possible!
The chemical is
corrosive, harmful and
irritating.
Spill can cause severe
skin burns and eye
damage. Spill can
cause serious skin
reaction and irritate the
respiratory system.
Avoid breathing dust.
Avoid wiping spills
with paper. Wear
protective gloves/
protective clothing/ eye
protection. Work
should be done in a
fume hood with proper
ventilation. Clean the
fume hood regularly to
avoid spreading of
dust.
2. Transport of
Oxone® from / to
storage
Container me be
dropped and fall to the
ground and result in
spreading of the
chemical outside of the
lab.
Spills on the floor,
spreading of powder /
dust. Corrosive effect
on skin that comes in
contact with the
chemical.
Chemical is stored in a
plastic jar (100 grams),
reduced risk of
breaking. Store in
connection to fume
hood. During
transportation, make
sure the can is tightly
closed.
3. Disposal Collection of waste for
disposal. Prevent
discharge into the
sewage system.
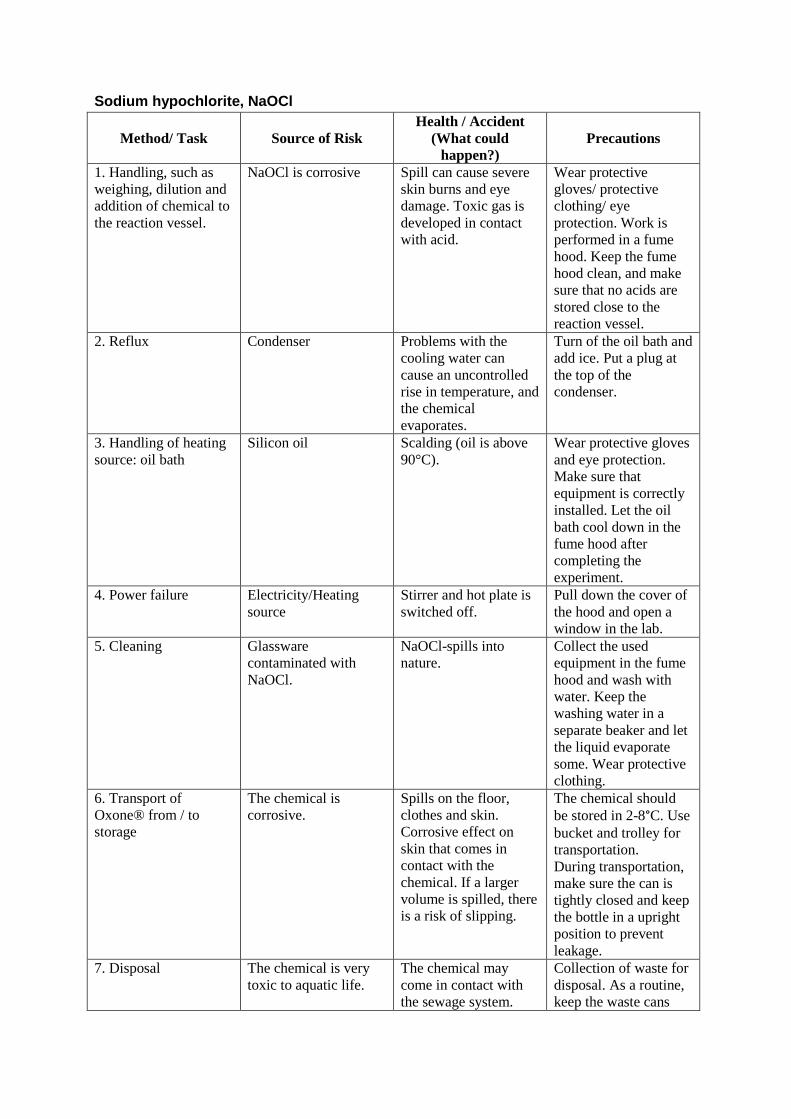
Sodium hypochlorite, NaOCl
Method/ Task Source of Risk Health / Accident
(What could
happen?) Precautions
1. Handling, such as
weighing, dilution and
addition of chemical to
the reaction vessel.
NaOCl is corrosive Spill can cause severe
skin burns and eye
damage. Toxic gas is
developed in contact
with acid.
Wear protective
gloves/ protective
clothing/ eye
protection. Work is
performed in a fume
hood. Keep the fume
hood clean, and make
sure that no acids are
stored close to the
reaction vessel.
2. Reflux Condenser Problems with the
cooling water can
cause an uncontrolled
rise in temperature, and
the chemical
evaporates.
Turn of the oil bath and
add ice. Put a plug at
the top of the
condenser.
3. Handling of heating
source: oil bath
Silicon oil Scalding (oil is above
90°C).
Wear protective gloves
and eye protection.
Make sure that
equipment is correctly
installed. Let the oil
bath cool down in the
fume hood after
completing the
experiment.
4. Power failure Electricity/Heating
source
Stirrer and hot plate is
switched off.
Pull down the cover of
the hood and open a
window in the lab.
5. Cleaning Glassware
contaminated with
NaOCl.
NaOCl-spills into
nature.
Collect the used
equipment in the fume
hood and wash with
water. Keep the
washing water in a
separate beaker and let
the liquid evaporate
some. Wear protective
clothing.
6. Transport of
Oxone® from / to
storage
The chemical is
corrosive.
Spills on the floor,
clothes and skin.
Corrosive effect on
skin that comes in
contact with the
chemical. If a larger
volume is spilled, there
is a risk of slipping.
The chemical should
be stored in 2-8°C. Use
bucket and trolley for
transportation.
During transportation,
make sure the can is
tightly closed and keep
the bottle in a upright
position to prevent
leakage.
7. Disposal The chemical is very
toxic to aquatic life.
The chemical may
come in contact with
the sewage system.
Collection of waste for
disposal. As a routine,
keep the waste cans

separated and keep
only the actual can and
chemicals in the fume
hood that is needed for
the experiment at the
moment.

Sodium periodate, NaIO4
Method/ Task Source of Risk Illness / Accident
(What could
happen?) Precautions
1. Handling, such as
weighing and addition
of the chemical to the
reaction vessel.
NaIO4 is a strong
oxidizer
May intensify fire. Can
in contact with
combustible material
cause fire. May cause
explosion.
Keep separated from
clothing / combustible
materials. Small
amounts are handled!
(<5g). Store in a cool,
dark, dry, and well-
ventilated place. Store
in a clean cabinet
adjacent to the hood.
Use a special lab coat
of inflammable
material if possible!
The chemical is
corrosive and toxic
Spill can cause severe
skin burns and eye
damage. Spill can
cause damage to
organs (thymus gland)
through prolonged or
repeated exposure.
All work is done in a
fume hood.
Wear lab coat, eye
protection and
protective gloves. For
spills on the lab coat /
clothes / skin, wash
immediately with
water and soap. For
spills, use cloth for
drying up, not paper. If
swallowed, do not
induce vomiting. Clean
the fume hood each
morning. Weighing is
performed close to the
fume hood; short
distance for
transporting the NaIO4-
powder.
2. Handling of silicone
bath
Silicone oil Burn injury due to hot
silicone oil. The oil
may splash.
Wear protective gloves
and eye protection.
Also, let the oil bath
cool down before
moving it somewhere.
2. Transport of NaIO4
from / to storage
Container me be
dropped and fall to the
ground and result in
spreading of the
chemical outside of the
lab.
Spills on the floor,
spreading of powder.
Corrosive effect on
skin that comes in
contact with the
chemical.
Use bucket/trolley for
transportation. Store in
connection to fume
hood in order to reduce
risk of injury during
transportation.
3. Cleaning Glassware
contaminated with
NaIO4
NaIO4-spills into
nature.
Collect the used
equipment in the fume
hood and wash with
water. Keep the
washing water in a
separate beaker and let
the liquid evaporate

some. Wear protective
clothing.
4. Disposal Chemical is very toxic
to aquatic life.
Collection of waste for
disposal. Prevent
discharge into the
sewage system.
5. Generally Mark the chemicals,
keep chemicals
separated and make
sure staff is well aware
of eventual risks by
using some type of
sign during
experiment.
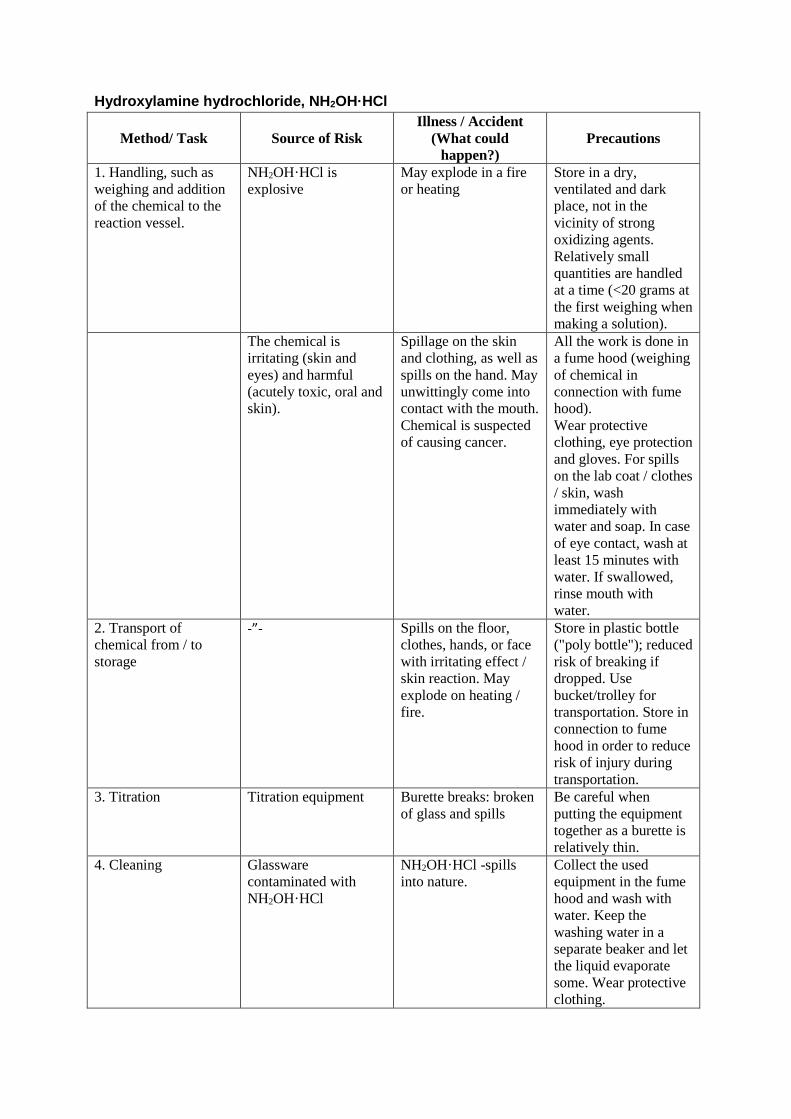
Hydroxylamine hydrochloride, NH2OH·HCl
Method/ Task Source of Risk Illness / Accident
(What could
happen?) Precautions
1. Handling, such as
weighing and addition
of the chemical to the
reaction vessel.
NH2OH·HCl is
explosive
May explode in a fire
or heating
Store in a dry,
ventilated and dark
place, not in the
vicinity of strong
oxidizing agents.
Relatively small
quantities are handled
at a time (<20 grams at
the first weighing when
making a solution).
The chemical is
irritating (skin and
eyes) and harmful
(acutely toxic, oral and
skin).
Spillage on the skin
and clothing, as well as
spills on the hand. May
unwittingly come into
contact with the mouth.
Chemical is suspected
of causing cancer.
All the work is done in
a fume hood (weighing
of chemical in
connection with fume
hood).
Wear protective
clothing, eye protection
and gloves. For spills
on the lab coat / clothes
/ skin, wash
immediately with
water and soap. In case
of eye contact, wash at
least 15 minutes with
water. If swallowed,
rinse mouth with
water.
2. Transport of
chemical from / to
storage
-”- Spills on the floor,
clothes, hands, or face
with irritating effect /
skin reaction. May
explode on heating /
fire.
Store in plastic bottle
("poly bottle"); reduced
risk of breaking if
dropped. Use
bucket/trolley for
transportation. Store in
connection to fume
hood in order to reduce
risk of injury during
transportation.
3. Titration Titration equipment Burette breaks: broken
of glass and spills
Be careful when
putting the equipment
together as a burette is
relatively thin.
4. Cleaning Glassware
contaminated with
NH2OH·HCl
NH2OH·HCl -spills
into nature.
Collect the used
equipment in the fume
hood and wash with
water. Keep the
washing water in a
separate beaker and let
the liquid evaporate
some. Wear protective
clothing.

5. Disposal Chemical is very toxic
to aquatic life with
long lasting effetcs.
Collection of waste for
disposal. Prevent
discharge into the
sewage system.

N,N-Diethyl-p-phenylenediamine, DPD
Method/ Task Source of Risk Illness / Accident
(What could
happen?) Precautions
1. Handling, such as
weighing and addition
of the chemical to the
reaction vessel.
NH2OH·HCl is
corrosive
Spills on clothing and
skin
Wear gloves, lab coat
and eye protection.
Work is done in a fume
hood. Very small
amounts are handled.
The chemical is toxic Ingestion Wear gloves. Avoid
touching your face.
Wash hands carefully
before leaving the lab.
If swallowed,
immediately contact
the poison central or
doctor. Do NOT
induce vomiting.
2. Generally Store in cool place.
Keep container tightly
closed in a dry and
well-ventilated place.
Opened containers
must be carefully
resealed and kept
upright to prevent
leakage. Air and light
sensitive. Do not store
near strong oxidants or
strong acids. Mark
chemicals during work,
apply cabinet
separation when
working with other
chemicals at the same
time.
3. Transport of
chemical from / to
storage
Chemical, when being
transported
Spills on the floor,
clothing and skin with
corrosive effect. The
glass bottle can break
if dropped.
Transport glass bottle
gently, preferably in
bucket if there is a
large bottle.
If spills on clothing,
skin, wash with soap
and water.
4. Disposal Collection of waste for
disposal.