Embed Size (px)
Citation preview

ARTICLE IN PRESS
NDT&E International 43 (2010) 334–342
Contents lists available at ScienceDirect
NDT&E International
0963-86
doi:10.1
n Corr
E-m
soldovie
journal homepage: www.elsevier.com/locate/ndteint
Processing strategies for high-resolution GPR concrete inspections
Johannes Hugenschmidt a,n, Alexis Kalogeropoulos a, Francesco Soldovieri b, Giancarlo Prisco b
a Empa, Swiss Federal Laboratories for Materials Testing and Research, Ueberlandstrasse 129, 8600 Duebendorf, Switzerlandb IREA, Istituto per il Rilevamento Elettromagnetico dell’Ambiente, Consiglio Nazionale delle Ricerche, Via Diocleziano 328, 80124 Naples, Italy
a r t i c l e i n f o
Article history:
Received 15 September 2009
Received in revised form
1 February 2010
Accepted 28 February 2010Available online 4 March 2010
Keywords:
GPR
Concrete
High-resolution
Data processing
Inversion
95/$ - see front matter & 2010 Elsevier Ltd. A
016/j.ndteint.2010.02.002
esponding author. Tel.: +41 44 823 43 18.
ail addresses: johannes.hugenschmidt@empa.
[email protected] (F. Soldovieri).
a b s t r a c t
A high-resolution multi-sensor and multi-polarization Ground Penetrating Radar (GPR) dataset was
acquired on a concrete retaining wall. This dataset was characterised as a low pass filter with the help of
a moving window spectral analysis. In order to examine the benefits and limits of innovative processing
strategies, the dataset was processed with three different methods: classical 2-D processing, full 3-D
processing followed by data fusion and inverse scattering followed by data fusion. A comparison of the
results for two layers of rebar present in the wall shows that the innovative approaches improve the
results for near surface structures when compared to classical 2-D processing. For deeper structures,
the benefits of the innovative approaches are limited because of the low pass properties of the concrete.
& 2010 Elsevier Ltd. All rights reserved.
1. Introduction
In many cases, concrete structures contain a complex interiorof rebar, tendons, rock anchors and/or additional fixtures. Thus,three-dimensional Ground Penetrating Radar (GPR) surveys areoften a necessity to obtain a clear visualization of the interior of astructure. The acquisition of three-dimensional datasets is ademanding task that has to be carried out on objects as differentas retaining walls, bridge decks or piles and requires highaccuracy of positioning. In addition, the directionality and sizeof the acquired datasets pose a challenge in terms of dataprocessing strategies.
Several authors have suggested acquisition and processingstrategies for high-resolution GPR data acquired on concrete.Hugenschmidt and Mastrangelo [1] and Hugenschmidt andKalogeropoulos [2] describe the acquisition and processing ofpseudo 3-D data from retaining walls at a Swiss motorway byexploiting single polarized antennas. Kohl et al. [4] describethe fusion of radar data with different polarizations and thecombination with ultrasonic data. Langenberg et al. [5] describea unified theory of modeling and imaging with electromagneticand elastic waves for the non-destructive testing ofconcrete. Capizzi and Cosentino [6] investigate different dipoleconfigurations in experimental tests using longish objects in ahomogeneous medium. Sbartai et al. [7] suggest the use of an
ll rights reserved.
ch (J. Hugenschmidt),
artificial neural network for solving the inverse problem related toradar data acquired on reinforced concrete. The application of aninverse scattering algorithm to radar data acquired on reinforcedconcrete is suggested by Soldovieri et al. [8–11]. In fact, theadoption of a linear inverse scattering approach based on asimplified model of the electromagnetic scattering permits manyapplicative advantages in terms of fast and effective processing.This is very suitable to perform high-resolution imaging usinglarge datasets in quasi real time [10].
In this paper, we deal with the inspection of a retaining wall[2] by adopting an advanced data acquisition apparatus able toproduce 3-D high-resolution multi-polarization datasets, thanksto the simultaneous exploitation of two antennas with differentorientations. The adoption of strategies based on signal processingtechniques and an inverse approach, able to exploit in an effectiveway the diversity in the polarization, makes it possible to map thetwo layers of rebar embedded in the wall.
In particular, the dataset was processed with three differentapproaches, classical 2-D processing, 3-D processing followed bydata fusion and inverse scattering followed by data fusion. Thispaper presents the data acquisition and the three processingstrategies together with their results. The comparison of theseresults for two layers of rebar leads to conclusions concerning thedata acquisition and processing of high resolution GPR surveys.
Therefore, the paper is organized as follows. Section 2 isdevoted to the description of the inspected wall, data acquisitionand a description of the acquired dataset. In Section 3, the threeprocessing strategies are briefly depicted by referring to 2-Dreconstructions of vertical profiles. In Section 4 the performancesof the proposed strategies are compared in terms of 3-D

ARTICLE IN PRESS
J. Hugenschmidt et al. / NDT&E International 43 (2010) 334–342 335
representations by considering the top and a deeper layer of rebar.The most important conclusions are summarized in Section 5.
Fig. 2. Retaining wall, simplified plan compiled from several original building plans.
2. Data acquisition
Data were acquired on a retaining wall near Empa, Switzerland(Fig. 1) along vertical lines. The concrete wall (Fig. 2) increases inthickness from top to bottom and contains two layers of rebar withoverlaps near the top and the bottom of the wall. Vertical bars havea nominal diameter of 0.016 m and a distance of 0.2 m betweensingle bars. Horizontal bars have a diameter of 0.012 m and adistance of 0.15 m. In addition, there are distance pieces with adiameter of 0.014 m connecting the two layers of rebar. Only oneside of the wall is accessible as the other side is hidden by ground.
The equipment used consisted of a GSSI SIR-20 radar unit, twoGSSI model 5100 antennas and an acquisition apparatus devel-oped at Empa for data acquisition on retaining walls [1,2]. Theapparatus consists of a ladder like guiding system for the antennabox, a rail system sitting on the coping of the wall for lateraldisplacement and an electric motor for moving the antenna box upand down. The desired positioning accuracy of 0.01 m is achievedby the combination of a survey wheel controlling the verticalposition, the rail system for an accurate position of the top of theapparatus and an electronic protractor system for the verticalalignment of the guiding system and thus the path of the antennabox. The centre frequency of the antennas as examined by Empa ina laboratory experiment [3] is 1.25 GHz in air. Both antennas wereplaced in the same antenna box, recording simultaneously. Theantennas were orientated with horizontal and vertical E-fields(Fig. 3), thus permitting multi-polarization measurements.
The acquisition parameters for single antennas can besummarized as follows:
�
Trace length: 15 ns � Samples per trace: 512 � Traces per meter: 400 � Line spacing: 0.01 m � Transmitter–receiver offset: 0.06 m � Data processing during acquisition: noneThe coordinate system used throughout this paper is presentedin Fig. 4, with X and Y being parallel to the front of the wall. Alldata were acquired moving the antenna box along the X-axis fromthe top to the bottom of the wall. This is due to the acquisition
Fig. 1. Retaining wall with acquisition apparatus.
Fig. 3. Antenna box.
apparatus, which is designed for the acquisition along verticallines parallel to the X-axis. The dataset acquired for this studycovers 1.40 m in the Y-direction corresponding to 141 single linesand 2.42 m in the X-direction for each antenna.
A comparison between the raw datasets collected with the twoantenna polarizations on the same line is presented in Figs. 5 and6. As expected, the antenna with the horizontal E-field is able todetect reflections in terms of hyperbolae mainly from horizontal(parallel to the Y-axis) bars whereas the antenna with the verticalE-field maps mainly vertical (parallel to the X-axis) bars (arrowsin Fig. 6). In order to further characterize the data, a movingwindow spectral analysis was applied to the two datasets shownin Figs. 5 and 6. The moving window spectral analysis computes

ARTICLE IN PRESS
Fig. 4. Coordinate system.
T
X
Fig. 5. Raw dataset, horizo
T
X
Fig. 6. Raw dataset, vertic
J. Hugenschmidt et al. / NDT&E International 43 (2010) 334–342336
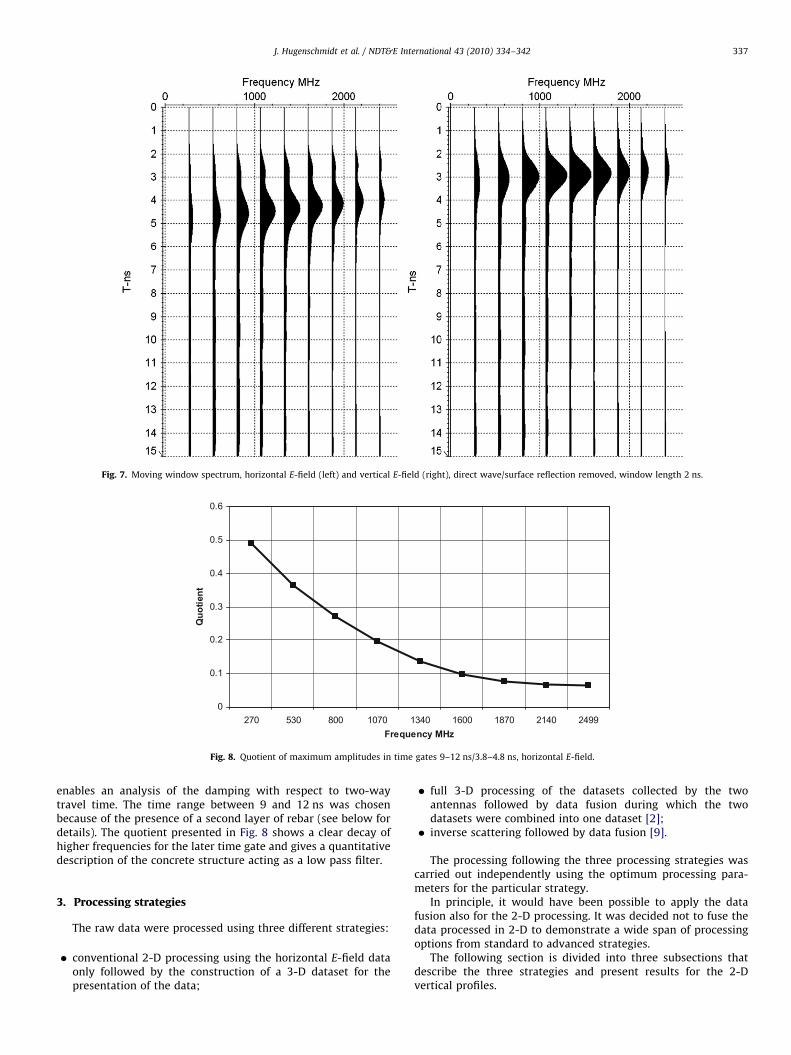
amplitude spectra within time windows of a defined length viaFast-Fourier-Transform (FFT). The time window is moved alongthe single traces and the result of the FFT is assigned to thesample in the centre of the window. Following this the amplitudespectra of all traces are added together. Before the computation ofthe moving window spectrum the direct wave/surface reflectionwas removed from the data. A time window of 2 ns was used. Theresult is shown in Fig. 7 for the horizontal E-field data (left) andthe vertical E-field data (right). In order to improve thecomprehensibility of the figures, the sum of a range of 262 MHzwas grouped together in one trace. In the spectrum of thehorizontal E-field data, all frequencies shown have theirmaximum between 4.0 and 5 ns. This is due to the fact that thiscorresponds to the reflections from the top layer of rebar. Lookingat the quotients of the maximum amplitudes between 9 and 12 nsdivided by the maximum amplitudes between 3.8 and 4.8 ns
ntal E-field, y¼0.37 m.
al E-field, y¼0.37 m.
ARTICLE IN PRESS
Fig. 7. Moving window spectrum, horizontal E-field (left) and vertical E-field (right), direct wave/surface reflection removed, window length 2 ns.
0
0.1
0.2
0.3
0.4
0.5
0.6
270 530 800 1070 1340 1600 1870 2140 2499Frequency MHz
Quo
tient
Fig. 8. Quotient of maximum amplitudes in time gates 9–12 ns/3.8–4.8 ns, horizontal E-field.
J. Hugenschmidt et al. / NDT&E International 43 (2010) 334–342 337
enables an analysis of the damping with respect to two-waytravel time. The time range between 9 and 12 ns was chosenbecause of the presence of a second layer of rebar (see below fordetails). The quotient presented in Fig. 8 shows a clear decay ofhigher frequencies for the later time gate and gives a quantitativedescription of the concrete structure acting as a low pass filter.
3. Processing strategies
The raw data were processed using three different strategies:
�
conventional 2-D processing using the horizontal E-field dataonly followed by the construction of a 3-D dataset for thepresentation of the data;�
full 3-D processing of the datasets collected by the twoantennas followed by data fusion during which the twodatasets were combined into one dataset [2]; � inverse scattering followed by data fusion [9].The processing following the three processing strategies wascarried out independently using the optimum processing para-meters for the particular strategy.
In principle, it would have been possible to apply the datafusion also for the 2-D processing. It was decided not to fuse thedata processed in 2-D to demonstrate a wide span of processingoptions from standard to advanced strategies.
The following section is divided into three subsections thatdescribe the three strategies and present results for the 2-Dvertical profiles.

ARTICLE IN PRESS
J. Hugenschmidt et al. / NDT&E International 43 (2010) 334–342338
3.1. 2-D processing
The 2-D processing sequence was carried out using REFLEXWsoftware from Sandmeier scientific software [12,13]. Only datafrom the antenna with the horizontal E-field were used andprocessed with the following processing sequence:
�
band-pass filter applied in the frequency domain; � correction of surface reflection/direct wave to time zero; � Kirchhoff migration assuming a dielectric permittivity of 6.25; � background removal; � gain.In addition all datasets were cut to the same length in theX-direction and time to facilitate the construction of the 3-Ddataset. In Fig. 9 a vertical profile of the processed datasetcorresponding to the raw data in Fig. 5 is presented. Whencomparing the processed data to the raw data it can bee seen thatthe signal to noise ratio has been improved and the diffractionhyperbolae caused by the rebar running in the Y-direction(horizontal bars) have been collapsed into dots.
3.2. 3-D processing and data fusion
This processing strategy was implemented in three steps. First,2-D processing was applied to each line acquired in theX-direction of the two datasets, then data were combined intotwo 3-D datasets (one for each antenna) for 3-D migration [12,13]and finally the two datasets were merged line by line. The 2-Dprocessing was applied line by line to the datasets of bothantennas using REFLEXW software. The processing sequenceconsisted of a time shift, a Dewow (mean subtraction) filter, gaincorrection, background removal, spiking-deconvolution and anF-K filter. Deconvolution was applied mainly to increase resolu-tion. The filter was calculated using a recursive autocorrelationalgorithm (Levinson) on part of the traces (0–13 ns). This filterwas then convolved with the original traces with 50% white noiseadded.
Following 2-D processing, lines were merged into the 3-Ddatasets separately for the two antennas. The data were migratedin 3-D using Stolt’s algorithm and a signal velocity of 0.105 m/ns.
For the fusion of the two migrated datasets, three differentstrategies were tested. As the maximum and average algorithms
Fig. 9. Dataset after 2-D processing
described by Kohl et al. [4] did not produce satisfactory results,the datasets were decomposed into five frequency ranges with thehelp of a Coiflet wavelet and fused as described by Hugenschmidtand Kalogeropoulos [2]. To achieve this, each trace was decom-posed into sub-spaces using finite time, oscillating, zero meansignals called wavelets [14]. Numerous wavelets types arementioned in the literature. After testing several families ofwavelets (Daubechies, Symlets, Coiflets, Haar) it was concludedthat Coiflet wavelets gave the best result. This is because,according to the literature, the shape of the wavelet should beas close as possible to the shape of the emitted radar pulse [15].Then the corresponding sub-spaces from both traces (with thedifferent antenna orientations) were merged using the waveletfusion algorithm, which can be considered as computing theaverage for the low frequency components and the maximum forthe high frequency components. This was followed by thereconstruction of the fused traces using the inverse wavelettransform. In Fig. 10 the fused dataset corresponding to the rawdatasets in Figs. 5 and 6 is presented.
3.3. Inverse scattering and data fusion
In order to tackle the 3-D inverse scattering problem, a 2-Dslice based inversion approach [9] was applied separately to thetwo datasets acquired with the two antennas:
�
, ho
Step 0: Preprocessing.
� Step 1: Tomographic reconstruction of the 2-D datasets.Following steps 0 and 1, data were transferred from 2-D to 3-D.
�
Step 2: Superimposition and interpolation of the 2-D tomo-graphic reconstructions to obtain the 3-D representation. � Step 3: The final 3-D reconstruction was obtained by fusing thetwo 3-D single polarization antenna results using a maximumalgorithm.
During step 0, the data were prepared for the tomographicreconstruction. First, the first part of the time domain tracescorresponding to direct waves and surface reflections were set tozero. Then, data were transformed to the frequency domainbefore the inversion algorithm was applied [8–11].
rizontal E-field, y¼0.37 m

ARTICLE IN PRESS
Fig. 10. Dataset after 3-D processing and data fusion, horizontal and vertical E-field, y¼0.37 m.
m0 0.5 1 1.5 2 2.5
0
0.2
0.4
Fig. 11. Dataset after inverse scattering and data fusion, horizontal and vertical
E-field, y¼0.37 m.
Y, 1.40m
J. Hugenschmidt et al. / NDT&E International 43 (2010) 334–342 339
During step 1, a microwave tomography based approach ableto give focalized 2-D images of the rebar was applied to the twotimes 141 datasets. The algorithm is based on a linear model Bornapproximation for the electromagnetic scattering (neglecting themutual interactions between the targets supposed invariant alongthe impinging/recording polarization direction) and works in thefrequency domain. The result is given in terms of the modulus ofthe contrast function that accounts for the difference between thedielectric and conductive properties of the targets and those ofthe host medium (concrete hosting rebar). The regions where themodulus of the contrast function is significantly different fromzero account for the presence, location and geometry of the buriedtargets. It is worthy noting that the adoption of a Born modelinversion scheme allows one to detect, localize and determine thegeometry of an object also in the case of strong scattering (forwhich the Born model does not hold in principle), as already shownby a large number of numerical and realistic experiments [10,11].
The parameters used for the reconstruction are listed below:
�
model relative dielectric permittivity of the concrete: 9; � model Conductivity of the concrete: 0.001 S/m; � frequency band: 500–1500 MHz; �X, 2.40m
frequency step: 50 MHz (21 frequencies exploited in theinversion); � investigation domain: 1.0 m (horizontal) and 0.02–0.52 m(depth).
The fusion of the two 3-D datasets (step 3) was carried out byusing the maximum value of modulus of the contrast function ofthe two separate 3-D reconstructed datasets. In Fig. 11, a sectionof the inverted and fused dataset corresponding to the rawdatasets in Fig. 5 and Fig. 6 is presented.
Fig. 12. time slice, t¼1.45–1.95 ns, 2-D processing.
4. 3D results
This section shows and compares the reconstruction results ofthe three strategies in terms of 3-D pseudo representations. Inparticular, the section is divided in two subsections related to theinvestigation of two different layers of rebar. One of those layers isat shallow depth (top layer) and a second layer is at greater andvarying depth (second layer of rebar).
4.1. Top layer of rebar
The results of the 2-D processing are presented as a time-sliceand a 3-D cube in Figs. 12 and 13, respectively. The horizontal

ARTICLE IN PRESS
Y
X
T
Fig. 13. Data cube 0–4 ns, 2-D processing.
X, 2.60m
Y, 1.40m
Fig. 14. time slice, t¼1.45–2.08 ns, 3-D processing and data fusion.
Y
X
T
Fig. 15. Fused dataset after 3-D processing and data fusion, 0.5–3.5 ns.
X, 2.60m
Y, 1.40m
Fig. 16. Depth slice, depth¼6 cm, inverse scattering and data fusion.
Y
XZ
Fig. 17. Data cube, 0.0–0.5 m., inverse scattering and data fusion.
J. Hugenschmidt et al. / NDT&E International 43 (2010) 334–342340
rebar (rebar in Y-direction) is mapped reasonably whereas thevertical bars (bars in X-direction) are of low amplitude and poorlyresolved. This is due to the fact that only the antenna with thehorizontal E-field (E-field in Y-direction) was used and that datawere migrated only in the X-direction.
In Figs. 14 and 15 the data after 3-D processing and data fusionare presented. When comparing Figs. 12–14, the most obviousdifference is related to the vertical (X-direction) rebars, which arenow mapped with a similar quality as the horizontal bars due totrue three-dimensional migration and the exploitation of themulti-polarization data. In addition, increased reflectionamplitudes are perceptible in the top and bottom sections ofthe wall and an additional reflection, most likely caused by adistance piece, becomes visible (arrow).
The combination of inverse scattering and data fusion leads tothe result presented in Figs. 16 and 17. In the depth slicepresentation of the dataset, the reconstruction of the vertical andhorizontal bars is of the same quality and an improvement of theimage quality at the top and bottom sections of the wall is

ARTICLE IN PRESS
Fig. 18. Raw dataset, horizontal E-field, y¼0.37 m, with position of time slice (white line).
Fig. 19. time slice, 4.0–8.8 ns, 2-D processing.
Fig. 20. Data cube 4.5–8.0 ns, 2-D processing.
Fig. 21. Timeslice, 4.0–8.8 ns, 3-D processing and data fusion.
J. Hugenschmidt et al. / NDT&E International 43 (2010) 334–342 341
evident. Accordingly, the rebar appears clearer and better focusedand the reason for the increased reflection amplitudes visible inthe top section of Fig. 14 becomes obvious.
4.2. Second layer of rebar
In Fig. 18 the raw dataset recorded with the horizontal E-fieldat position y¼0.37 m is presented. The white line dipping from
t¼7.0 ns at x¼0.00 m to t¼11.8 ns at x¼2.40 m shows thesuspected position of a second layer of rebar (see also Figs. 5 and 9for comparison). This suspected position shifts to t¼4.0 ns atx¼0.00 m and t¼8.8 ns at x¼2.40 m for the processed datasetbecause of the correction of the surface reflection/direct wave totime zero during 2-D processing. Plotting a time slice followingthis line using the data that were processed with the 2-Dprocessing sequence results in Fig. 19. When comparing thistime-slice to the time-slice showing the top layer of rebar (Fig. 12)it is obvious that resolution and focus have decreased. However, itis still possible to make out the horizontal bars of the second layerof rebar. This is confirmed by the presentation of the data cube in

ARTICLE IN PRESS
Fig. 22. Depth slice, 0.18–0.40 m, inverse scattering and data fusion.
J. Hugenschmidt et al. / NDT&E International 43 (2010) 334–342342
Fig. 20 where, despite the presence of noise, the horizontal barsare clearly visible.
In Fig. 21 the time-slice after 3-D processing and data fusioncorresponding to the dipping line in Fig. 18 is presented. Whencomparing this result with the result for the top layer it becomesobvious that the signal/noise ratio has decreased significantly.Both vertical and horizontal bars can be made out. In additionthere is an increased response from the points where vertical andhorizontal bars are crossing because of the constructiveinterference of the data from the two antenna orientations.
In Fig. 22 a depth a slice after inverse scattering and datafusion is shown for the second layer of rebar. Again, the signal/noise ratio has decreased significantly when compared to theresult of the top layer (Fig. 16) but both horizontal and verticalbars can still be made out.
5. Summary and conclusions
A multi-sensor, multi-polarization dataset was acquired on aconcrete retaining wall. The decay of higher amplitudes withincreasing two-way travel time was demonstrated, thuscharacterizing the concrete structure as a low pass filter.
The dataset was processed using three different approaches:classical 2-D processing followed by the construction of a 3-Ddata cube, full 3-D processing followed by data fusion and inversescattering followed by data fusion.
The 2-D processing using the data from one antenna onlyprovided for the top layer of rebar a detailed mapping of thehorizontal rebar and a low amplitude and low focus result forthe vertical bars.
The 3-D processing followed by data fusion resulted in acomplete map of both, horizontal and vertical rebars for the toplayer of rebar.
The inverse scattering approach followed by data fusionprovided for the top layer of rebar a complete map of both,horizontal and vertical rebars. In addition, the reason forincreased reflection amplitudes in some areas was elucidated.
All three processing approaches produced a result of lowerquality for the second layer of rebar. It is assumed this is mainlydue to the fact that the concrete structure acts as a low pass filterfor increased two-way travel time and because of the maskingeffect of the top layer of rebar. In other words, the result for thesecond layer of rebar shows rather the limits of the dataset thanthe limit of the different processing algorithms.
Acknowledgements
Special thanks to Roman Mastrangelo, formerly Empa, for hissupport during data acquisition and to the building department ofthe city of Duebendorf for providing the original building plansof the wall.
References
[1] Hugenschmidt J. , Mastrangelo R.. The inspection of large retaining wallsusing GPR. In: Proceedings of the fourtth international workshop on advancedground penetrating radar, 27–29 June 2007 , Naples, Italy, 2007. p. 267–71.
[2] Hugenschmidt J, Kalogeropoulos A. The inspection of retaining walls usingGPR. Journal of Applied Geophysics 2009;67:335–44.
[3] Hugenschmidt: Multi-Offset-Analysis for man-made structures. In: GPR 2000,Proceedings of the eighth international conference on ground penetratingradar, 23–26 May 2000, Gold Coast, Australia, 2000. p. 414–20.
[4] Kohl Ch., Krause M, Maierhofer Ch., Mayer K., Wostmann J., Wiggenhauser H.3D-visualisation of NDT-data using data fusion technique. In: Proceedings ofthe international symposium on destructive testing in civil engineering,16–19 September 2003, Berlin, Germany, 2003.
[5] Langenberg KJ, Mayer K, Marklein R. Nondestructive testing of concrete withelectromagnetic and elastic waves; modeling and imaging. Cement &Concrete Composites 2006;28:370–83.
[6] Capizzi P, Cosentino PL. GPR multi-component data analysisNear SurfaceGeophysics 2008;6:87–95.
[7] Sbartai ZM, Viriyametanont K, Laurens S. NDE of reinforced concrete—inver-sion of GPR data using neural approach. In: Proceedings of the 12thinternational conference on ground penetrating radar, 16–19 June 2008,Birmingham, UK, 2008.
[8] Soldovieri F, Prisco G, Hugenschmidt J. Microwave tomography for GPRdiagnostics of reinforced concrete.In: Proceedings of the European microwaveweek 2009, September 28–October 2, Rome, Italy, 2009.
[9] Solimene R, Soldovieri F, Prisco G, Pierri R. Three-dimensional microwavetomography by a 2-D slice-based reconstruction algorithm. IEEE Geoscienceand Remote Sensing Letters 2007;4(4):556–60.
[10] Soldovieri F, Persico R, Utsi E, Utsi V. The application of inverse scatteringtechniques with ground penetrating radar to the problem of rebar location inconcrete. NDT&E International 2006;39:602–7.
[11] Soldovieri F, Hugenschmidt J, Persico R, Leone G. A linear inverse scatteringalgorithm for realistic GPR applications. Near Surface Geophysics 2007;5(1):29–42.
[12] Reflexw manual ver. 4.5 from 24.07.2007. Sandmeier scientific software,Karlsruhe, Germany.
[13] Yilmaz O. Seismic Data Processing. Tulsa, USA: Society of ExplorationGeophysicists; 1987.
[14] Mallat S. A theory for multiresolution signal decomposition: the waveletrepresentation. IEEE Transaction. On Pattern Analysis and MachineIntelligence 1989;11(7):674–93.
[15] Perrin S, Bibaut A, Duflos E, Vanheeghe P. Use of wavelets for ground-penetrating radar signal analysis and multisensor fusion in the frame oflandmines detection. IEEE International Conference on Systems, Man, andCybernetics 2000;4:2940–5.


