Embed Size (px)
Citation preview

HAL Id: tel-01127232https://tel.archives-ouvertes.fr/tel-01127232
Submitted on 7 Mar 2015
HAL is a multi-disciplinary open accessarchive for the deposit and dissemination of sci-entific research documents, whether they are pub-lished or not. The documents may come fromteaching and research institutions in France orabroad, or from public or private research centers.
L’archive ouverte pluridisciplinaire HAL, estdestinée au dépôt et à la diffusion de documentsscientifiques de niveau recherche, publiés ou non,émanant des établissements d’enseignement et derecherche français ou étrangers, des laboratoirespublics ou privés.
Processing of natural rubber composites and blends :relation between structure and properties
Subhan Salaeh
To cite this version:Subhan Salaeh. Processing of natural rubber composites and blends : relation between structure andproperties. Materials Science [cond-mat.mtrl-sci]. Université Claude Bernard - Lyon I; Prince ofSongkla University, 2014. English. �NNT : 2014LYO10141�. �tel-01127232�
THESIS
Presented in
PRINCE OF SONGKLA UNIVERSITY (PSU) – PATTANI (THAILAND)
and
UNIVERSITY CLAUDE BERNARD LYON 1 (UCBL) – VILLEURBANNE (FRANCE)
for obtaining
DOCTOR OF PHILOSOPHY
Speciality « POLYMERS TECHNOLOGY » and
DOCTORAL DEGREE
Speciality « INNOVATIVE MATERIALS »
(Arrêté du 7 Août 2006)
Defense of the thesis is proposed on 4 July 2014
By
Mr. Subhan SALAEH
Processing of Natural Rubber Composites and Blends:
Relation between Structure and Properties
Thesis supervisors: Charoen Nakason / Philippe Cassagnau
Co-advisor: Gisèle Boiteux
JURY:
Prof. Dr. Suda KIATKAMJORNWONG Chulalongkorn University Reviewer
Prof. Dr. René MULLER Université de Strasbourg Reviewer
Assoc. Prof. Dr. Charoen NAKASON Prince of Songkla University Supervisor
Prof. Dr. Philippe CASSAGNAU Université Lyon1 Supervisor
Dr. Gisèle BOITEUX Université Lyon1 Co-advisor
Assoc. Prof. Azizon KAESAMAN Prince of Songkla University Examiner
Copyright of Prince of Songkla University and University Claude Bernard Lyon 1
Year 2014N° d’ordre : 141-2014
THESE
Présentée devant
L’UNIVERSITE PRINCE DE SONGKLA (PSU) – PATTANI (THAILAND)
et
L’UNIVERSITE CLAUDE BERNARD LYON 1 (UCBL) – VILLEURBANNE (FRANCE)
pour l’obtention du DIPLOME de
DOCTEUR EN PHILOSOPIE
Spécialité « TECHNOLOGIE DE POLYMERE » et du
DIPLOME DE DOCTORAT
Spécialité « MATERIAUX INNOVANTS »
(Arrêté du 7 Août 2006)
Soutenance proposée le 4 Juillet 2014
Par
Mr. Subhan SALAEH
Elaboration des Composites et Mélanges à base de
Caoutchouc Naturel: Relations Structure – Propriétés
Directeurs de thèse: Charoen Nakason / Philippe Cassagnau
Co-directeur: Gisèle Boiteux
JURY:
Prof. Dr. Suda KIATKAMJORNWONG Chulalongkorn University Rapporteur
Prof. Dr. René MULLER Université de Strasbourg Rapporteur
Assoc. Prof. Dr. Charoen NAKASON Prince of Songkla University Directeur
Prof. Dr. Philippe CASSAGNAU Université Lyon1 Directeur
Dr. Gisèle BOITEUX Université Lyon1 Co-directeur
Assoc. Prof. Azizon KAESAMAN Prince of Songkla University Examinateur
Droit d'auteur de l'Université Prince de Songkla et de l'Université Claude Bernard Lyon 1
Année 2014N° d’ordre : 141-2014
UNIVERSITE CLAUDE BERNARD - LYON 1
Président de l’Université
Vice-président du Conseil d’Administration
Vice-président du Conseil des Etudes et de la Vie Universitaire
Vice-président du Conseil Scientifique
Directeur Général des Services
M. François-Noël GILLY
M. le Professeur Hamda BEN HADID
M. le Professeur Philippe LALLE
M. le Professeur Germain GILLET
M. Alain HELLEU
COMPOSANTES SANTE
Faculté de Médecine Lyon Est – Claude Bernard
Faculté de Médecine et de Maïeutique Lyon Sud – Charles Mérieux
Faculté d’Odontologie
Institut des Sciences Pharmaceutiques et Biologiques
Institut des Sciences et Techniques de la Réadaptation
Département de formation et Centre de Recherche en Biologie
Humaine
Directeur : M. le Professeur J. ETIENNE
Directeur : Mme la Professeure C. BURILLON
Directeur : M. le Professeur D. BOURGEOIS
Directeur : Mme la Professeure C. VINCIGUERRA
Directeur : M. le Professeur Y. MATILLON
Directeur : Mme. la Professeure A-M. SCHOTT
COMPOSANTES ET DEPARTEMENTS DE SCIENCES ET TECHNOLOGIE
Faculté des Sciences et Technologies
Département Biologie
Département Chimie Biochimie
Département GEP
Département Informatique
Département Mathématiques
Département Mécanique
Département Physique
UFR Sciences et Techniques des Activités Physiques et Sportives
Observatoire des Sciences de l’Univers de Lyon
Polytech Lyon
Ecole Supérieure de Chimie Physique Electronique
Institut Universitaire de Technologie de Lyon 1
Institut Universitaire de Formation des Maîtres
Institut de Science Financière et d'Assurances
Directeur : M. F. DE MARCHI
Directeur : M. le Professeur F. FLEURY
Directeur : Mme Caroline FELIX
Directeur : M. Hassan HAMMOURI
Directeur : M. le Professeur S. AKKOUCHE
Directeur : M. Georges TOMANOV
Directeur : M. le Professeur H. BEN HADID
Directeur : M. Jean-Claude PLENET
Directeur : M. Y. VANPOULLE
Directeur : M. B. GUIDERDONI
Directeur : M. P. FOURNIER
Directeur : M. G. PIGNAULT
Directeur : M. C. VITON
Directeur : M. A. MOUGNIOTTE
Directeur : M. N. LEBOISNE
Thesis Title Processing of Natural Rubber Composites and Blends: Relation
between Structure and Properties
Author Mr. Subhan Salaeh
Major Program Polymer Technology
Major Advisors:
………………………………………….
(Assoc. Prof. Dr. Charoen Nakason)
………………………………................
(Prof. Dr. Philippe Cassagnau)
Co-advisor:
………………………………………….
(Dr. Gisèle Boiteux)
Examining Committee:
……………………………..…....Chairperson
(Prof. Dr. Suda Kiatkamjornwong)
……………………………..…....
(Assoc. Prof. Dr. Charoen Nakason)
……………………………..…....
(Prof. Dr. Philippe Cassagnau)
……………………………..…....
(Dr. Gisèle Boiteux)
……………………………..…....
(Prof. Dr. René Muller)
……………………………..…....
(Assoc. Prof. Azizon Kaesaman)
The Graduate School, Prince of Songkla University has approved this thesis as
fulfillment of the requirements for the Degree of Doctor of Philosophy in Polymer
Technology.
………………………………………….
(Assoc. Prof. Dr. Teerapol Srichana)
Dean of Graduate School
This is to certify that the work here submitted is the result of the candidate’s own
investigation. Due acknowledgement has been made of any assistance received.
………………………………………….Signature
(Assoc. Prof. Dr. Charoen Nakason)
Major Advisor
………………………………………….Signature
(Mr. Subhan Salaeh)
Candidate

I hereby certify that work has not already been accepted in substance for any degree,
and is not being concurrently submitted in candidature for any degree.
………………………………………….Signature
(Mr. Subhan Salaeh)
Candidate

ชื่อวิทยานิพนธ การแปรรูปยางธรรมชาติคอมพอสิตและเบลนด: ความสัมพันธระหวางโครงสรางกับสมบัติ
ผูเขียน นายสุบฮาน สาและ สาขาวิชา เทคโนโลยีพอลิเมอร ปการศึกษา 2556
บทคัดยอ ศึกษาอิทธิพลของโครงสรางโมกุลยางธรรมชาติ (NR) และยางธรรมชาติอิพอกไซด
(ENR) ตอสมบัติ พบวาการมีหมูอิพอกไซดอยูในยาง ENR ทําใหมีการปรับปรุงสมบัติเชิงกล เชน มอดุลัสและความตานทานตอแรงดึง นอกจากนี้สมบัติไดอิเล็กทริกไดแสดงใหเห็นถึงการนําไฟฟาที่ความถี่ต่ําและอุณหภูมิสูง ยางท่ีมีหมูอิพอกไซด 50 โมล% (ENR-50) มีคาการนําไฟฟาและคา permittivity สูงที่สุด ดังนั้นจึงนํายาง ENR-50 ไปใชในการเตรียมคอมพอสิตที่ใชแบเรียมไททาเนตและเขมาดําเปนตัวเติม ซึ่งพบวาคา permittivity และคาการนําไฟฟาสูงขึ้นตามปริมาณตัวเติมที่ใสลงไป ที่ปริมาณ 50%โดยปริมาตรของแบเรียมไททาเนตในยางใหคา permittivity สูงถึง 48.7 ในขณะเดียวกันก็พบวาการเตรียม ENR-50 คอมพอสิตที่ใชเขมาดํามี percolation threshold ที่ 6.3 vol% ของเขมาดํา สําหรับการศึกษาการเปลี่ยนแปลงของสัณฐานวิทยาและความเขากันไดของพอลิเมอรเบลนดระหวางพอลิไวนิลลิดีนฟลูออไรด (PVDF) กับยาง ENR พบวา สัณฐานวิทยาของพอลิเมอรที่เตรียมไดขึ้นอยูกับปริมาณหมูอิพอกไซดในยาง ENR และอัตราสวนการเบลนด อัตราสวนการเบลนดในชวง 40 ถึง 60% โดยน้ําหนักของยาง ENR-50 ใหลักษณะสัณฐานวิทยาแบบวัฏภาครวม (co-continuous) นอกจากนี้ผลการทดสอบจากสมบัติพลวัตเชิงกลและสมบัติไดอิเล็กทริกแสดงใหเห็นถึงความเขากันไดบางสวน (partial miscibility) ทายที่สุดน้ีไดเตรียมคอมพอสิตจากพอลิเมอรเบลนดที่เติมแบเรียมไททาเนต สัณฐานวิทยาของคอมโพสิทที่เตรียมไดนั้น พบวาแบเรียมไททาเนตกระจายตัวในเฟสยางเปนหลัก อยางไรก็ตามการเติมแบเรียมไททาเนตหลังจากการวัลคาไนซแบบไดนามิกสทําใหแบเรียมไททาเนตกระจายตัวในเฟสพอลิไวนิลลิดีนฟลูออไรด (PVDF) และที่ผิวประจัญ (interface) นอกจากนี้คอมพอสิตที่เตรียมจากเทอรโมพลาสติกวัลคาไนซของ PVDF/ENR-50 ที่อัตราสวนการเบลนดที่ 80/20 ใหคา permittivity ที่สูง
คําสําคัญ: ยางธรรมชาติ ยางธรรมชาติอิพอกไซด แบเรียมไททาเนต พอลิไวนิลลิดีนฟลูออไรด พอลิเมอรเบลนด การเบลนดดวยเทคนิควัลคาไนซแบบไดนามิก

Thesis Title Processing of Natural Rubber Composites and Blends: Relation
between Structure and Properties
Author Mr. Subhan Salaeh
Major Program Polymer Technology
Academic Year 2013
ABSTRACT
Natural rubber (NR) and epoxidized natural rubber (ENR) were chosen to study
the composites and blends of polymers. The presence of epoxide group caused to
improve the mechanical properties in terms of modulus and tensile strength. Furthermore,
dielectric spectroscopy revealed that ENR showed conductivity process at low frequency
and high temperature. Epoxidized natural rubber containing 50 mol% of epoxide group or
ENR-50 exhibited the highest dielectric permittivity and electrical conductivity. Therefore,
ENR-50 was then selected to prepare polymer composite filled with barium titanate (BT)
and carbon black (CB) particles. The permittivity and conductivity of the composites
increased with the volume content of the fillers. The BT/ENR-50 composites reached a
high permittivity of 4 8 . 7 for addition of 50 vol% BT. Meanwhile, CB/ENR-50 composite
reached percolation threshold at 6 .3 vol% of CB. The phase development and miscibility
of poly(vinylidene fluoride) (PVDF)/epoxidixed natural rubber (ENR) blends were then
investigated. It was also found that phase structure depended on epoxidation level and
blend compositions. The blend exhibited a co-continuous phase morphology in the region
of 40 to 60 wt% of ENR-50. Furthermore, the results from dynamic mechanical and
dielectric analysis revealed that these blends present a partial miscibility. Finally, the
composites based on binary blends of PVDF/ENR-50 containing BT were prepared. The
study of the morphologies revealed that BT was dispersed in ENR-50 phase in the case
of simple blend. However, the addition of BT after dynamic vulcanization induced
localization of BT in PVDF phase and at interface. The highest increment of permittivity
can be observed for the composite based on dynamically cured PVDF/ENR-50 (80/20)
blend.
Key words: natural rubber, epoxidized natural rubber, barium titanate, poly(vinylidene
fluoride), polymer blends, dynamically cured blends
Titre Elaboration de Composites et Mélanges à base de Caoutchouc Naturel:
Relations Structure-Propriétés Auteur Mr. Subhan Salaeh Programme Technologie de polymère
Année 2013
RÉSUMÉ
Le caoutchouc naturel (NR) et l e caoutchouc époxydé (ENR) ont constitué la base
de cette étude consacrée à l’étude des composites et mélanges de polymères. La présence
du groupe époxyde a conduit à une amélioration des propriétés mécaniques de ces
formulations en termes de module et de la résistance à la traction. De plus, l’utilisation de
la spectroscopie diélectrique a révélé que les ENRs présentent une conductivité plus élevée
que le NR à basse fréquence et à haute température. En particulier, le caoutchouc naturel
époxidé contenant 50 mol% de groupes époxyde ENR-50 présente des conductivités et
permittivités les plus élevées. Par conséquent, ce dernier a été choisi pour préparer des
composites polymères en incorporant des particules de titanate de barium (BT) et de noir
de carbone (CB). Les résultats montrent que la permittivité et conductivité des composites
élaborés augmentent avec le taux d'incorporation de ces charges. Par exemple, les
composites BT/ENR-50 atteignent une permittivité élevée 48.7 pour 50 vol% de BT. De plus,
les composites CB/ENR-50 présentent un seuil de percolation de 6.3 vol% de CB. Enfin les
mélanges à base de poly(fluorure de vinylidène) (PVDF) et d’ENR ont été étudiés. Il a été
observé que la morphologie de ces mélanges dépend du degré d’époxydation du caoutchouc
naturel et bien entendu de la composition du mélange. Une morphologie co-continue peut
être observée dans l’intervalle 40 et 60% en masse d’ENR-50. En outre, les résultats issus
d’analyses dynamiques mécanique et diélectrique montrent que ces mélanges présentent
une miscibilité partielle. Enfin, des composites à base de ces mélanges binaires PVDF/ENR-
50 contenant BT ont été préparés. L’étude des morphologies a révélé que les particules de
BT étaient dispersées dans la phase d’ENR-50 pour le mélange classique. Cependant, les
particules de BT sont localisées à l'interface et dans la phase PVDF pour le mélange réticulé
dynamiquement. En termes de propriétés, la permittivité plus élevée est obtenue pour le
mélange PVDF/ENR-50 (80/20) ayant été réticulé dynamiquement.
Mots clés: caoutchouc naturel, caoutchouc naturel époxydé, titanate de barium, poly
(fluorure de vinylidène), mélange de polymères, réticulation dynamique.
ACKNOWLEDGEMENTS
I would like to thank many people who have helped me directly or indirectly in this
thesis over a few past years.
First of all, I would first like to express my deep gratitude to my supervisor, Assoc.
Prof. Dr. Charoen Nakason and Prof. Dr. Philippe Cassagnau, my co-advisor, Dr. Gisèle
Boiteux for their helpful support, and the opportunity to study under their supervisions.
They have coached me in completion of this thesis and gave all means necessary for the
realization of this thesis. Their skills and experience in leadership have been a great help
for the completion of this thesis. Working with them was very pleasant and I have learned
a lot over the years, both scientific and human levels. Also, they have helped me for life
experience in Lyon. First meeting at Lyon-Saint Exupéry Airport remain a great memory
for me. Thank you again to them for their encouragement and all proofreading of articles,
presentations and thesis chapters.
My thanks are then directed to Prof. Dr. Suda Kiatkamjornwong and Prof. Dr.
René Muller for giving me the honor to report this thesis. I also thank Assoc. Prof. Azizon
Kaesaman who has been examiner of this study.
This work was financial supported by the Thailand Research Fund (TRF) through
the Royal Golden Royal Golden Jubilee Ph.D. Program (Grant No. PHD/0245/2549),
French Embassy in Thailand and graduate school of Prince of Songkla University. They
have been made this research possible.
I also thank all the lecturers and staffs in Department of Rubber Technology and
Polymer Science, Pattani, Thailand for teaching me the basic of rubber and polymer
science which is useful knowledge for this thesis. I would like to thank to Dr. Sitisaiyidah
Saiwari and Dr. Methakarn Jarnthong for their proofreading. Sincere thanks are also
extended to all technician in the lab namely Absorn Jongrakwattana, Inyars Kama, Somkid
Srisuwan, Siradanai Sulung and Haseumah Deoraot for their invaluable service and
advice. Thanks to all my best colleagues in rubber and polymer technology program who
I have met since the beginning of my studies. Their good humor and kindness have made
life in the lab more enjoyable. All the best moments with them are always in my memory.
I also would like to express my thanks to permanent staffs in IMP@Lyon1
especially Olivier Gain, Pierre Alcouffe, Thiery Tamet, Flovien Melis, Sylvie Novat, Ali
Haddane and others for their invaluable service and assistance. Also, I will not forget to
thank friends who I have met there. I would like to thank to Volodymyr Levchenko,
Muhammad Jouni, Anna Lakowska and Anna Marzec for being best friends and also
helping me to do research experiment in the lab. Their discussions related to electrical
properties of polymer composite is very helpful. Thank you all friends in IMP@Lyon1,
Romina, Samir, Sofiane, Mikaël, Marine, Elodie, Imen, Afef, Fatima, Antony, Nicolas and
Brice for their friendship and humor. All people in IMP@Lyon actively participated to make
my exciting life in France very happy. They always teach French language during my stay
in Lyon.
These acknowledgments would not be complete without a thought my family. I
want to especially express my deep gratitude to my dearest parents, Makorsee Salaeh
and Sujanya Salaeh for their endless support. They have always been there for me during
all these years of study and encouraged me to finish PhD study. A big thank to my wife,
Maisaro for her support and love in me. It was because of strong support of my family
and wife that I am able to complete my PhD work.
MERCI à TOUTES et à TOUS
Subhan SALAEH
CONTENTS
ABSTRACT (THAI)…………………………………………………………….…………....
ABSTRACT (ENGLISH)………………………………………………….…………….......
ABSTRACT (FRENCH).………………………………………….……….………………..
ACKNOWLEDGEMENTS.……………………………………….…………………….…..
CONTENTS.………………………………………………………..…………………….…..
LIST OF TABLES………………………………………………………………...……........
LIST OF FIGURES……………………………………………………………….……........
LIST OF ABBREVIATIONS…...………………………………………...…….……….…..
LIST OF SYMBOLS……....………………………………………………………………...
CHAPTER 1: Introduction…………………………………………………….….…….
1.1 Introduction………………………………………………………………………...
1.2 Scope of thesis…………………………………………….……………..............
1.3 The aim of thesis…………………………………….……………………….…..
1.4 Novelty of the work……………………………………………………………….
1.5 The thesis outline……………...………………………………………………….
CHAPTER 2: Literature Review……………………………………………………….
2.1 Polymer composites………………………………………………………………
2.1.1 Ceramic-polymer composites…………………………………………..
2.1.2 Conductive polymer composites……………………………………….
2.2 Thermoplastic elastomer blends………………………………………………..
2.2.1 The miscibility of polymer blend……………………………………….
2.2.2 Simple blend…………………………………………………………......
2.2.3 Thermoplastic vulcanizate………………………………………………
2.3 Binary polymer composites………………………………………………………
2.3.1 Filler localization………………………………………………………...
6
7
8
9
11
16
19
28
31
33
33
35
36
36
37
39
39
40
44
50
50
53
54
56
56

2.3.2 Compatibilization effect of particles……………………………………
2.4 Natural rubber……………………………………………………………………..
2.4.1 Epoxidized natural rubber………………………………………………
2.4.2 Composites and polymer blends based on ENR……………………
2.5 Poly(vinylidene fluoride)………………………………………………………….
2.5.1 Composites and polymer blends based on PVDF…………………..
2.6 Conclusions………………………………………………………………………..
2.7 References………………………………………………………………………...
CHAPTER 3: Materials and Experiment Methodology…………….…………......
3.1 Materials……………………………………………………………………………
3.2 Experimental procedure………………………………………………………….
3.2.1 Preparation of natural rubber vulcanizate…………………………….
3.2.2 Preparation of barium titanate………………………………………….
3.2.3 Preparation of BT/ENR-50 and CB/ENR-50 composites..………….
3.2.4 Preparation of PVDF/ENR simple blends..…………………………...
3.2.5 Preparation of BT/PVDF/ENR-50 composites………………………..
3.3 Testing and characterization.........................................................................
3.3.1 Cure characteristic……………………………………………………….
3.3.2 Morphological properties………………………………………………..
3.3.3 Mechanical properties…………………………………………………..
3.3.4 Differential scanning calorimetry analysis…………………………….
3.3.5 Dynamic mechanical analysis………………………………………….
3.3.6 Dielectric analysis………………………………………………………..
3.4 References…………………………………………………………………………
CHAPTER 4: Characterization of Natural Rubber and Epoxidized
Natural Rubber.................................................................................
4.1 Introduction………………………………………………………………………...
4.2 Effect of natural rubber types on properties of vulcanizate………………….
4.2.1 Cure characteristic.………………………………………………………
4.2.2 Mechanical properties…………………………………………………...
59
60
61
62
63
64
65
66
77
77
80
80
80
81
82
83
85
85
86
88
91
92
93
97
99
99 100 100 101

4.2.3 Dynamic mechanical analysis…………………………………………. 102 4.2.4 Dielectric analysis………………………………………………………..
4.3 Conclusions………………………………………………………………………..
4.4 References…………………………………………………………………………
CHAPTER 5: Flexible Ceramic-Polymer Composites based on BT/ENR-50
Composites…..................................................................................
5.1 Introduction………………………………………………………………………...
5.2 Barium titanate characterization………………………………………………...
5.2.1 XRD pattern………………………………………………………………
5.2.2 Microstructure of barium titanate………………………………………
5.2.3 Dielectric properties……………………………………………………..
5.3 Effect of BT loading level on properties of BT/ENR-50 composites………..
5.3.1 Cure characteristic..……………………………………………………..
5.3.2 Morphological properties………………………………………………..
5.3.3 Mechanical properties…………………………………………………...
5.3.4 Dynamic mechanical analysis………………………………………….
5.3.5 Dielectric analysis………………………………………………………..
5.4 Conclusions………………………………………………………………………..
5.5 References…………………………………………………………………………
CHAPTER 6: Conductive Elastomer Composites based on
CB/ENR-50 Composites……………………………………………....
6.1 Introduction………………………………………………………………………...
6.2 Effect of different carbon black structure and content on
properties of carbon black filled ENR-50 composites…………………………
6.2.1 Cure characteristic..……………………………………………………...
6.2.2 Mechanical properties…………………………………………………...
6.2.3 Dynamic mechanical analysis………………………………………….
6.2.4 Electrical properties……………………………………………………...
6.3 Conclusions………………………………………………………………………..
6.4 References…………………………………………………………………………
104 115 116
121
121
122
122
123
124
125
125
126
128
130
132
143
144
149
149
150
150
152
157
160
167
168
CHAPTER 7: Phase Development and Miscibility of PVDF/ENR-50 Simple
Blends…………………………………………………………………….
7.1 Introduction………………………………………………………………………...
7.2 Effect of difference epoxidation level in ENR on the properties of
PVDF/ENR simple blend…………………………………………………………
7.2.1 Morphological properties………………………………………………..
7.2.2 Mechanical properties…………………………………………………...
7.2.3 Differential scanning calorimetry……………………………………….
7.2.4 Dynamic mechanical analysis……………...…………………………..
7.2.5 Consideration of physical properties improvement………………….
7.2.6 Dielectric analysis…………………………………….………………….
7.3 The effect of blend composition on the properties of
PVDF/ENR-50 simple blend……………………………………………………..
7.3.1 Morphological properties………………………………………………..
7.3.2 Mechanical properties…………………………………………………...
7.3.3 Differential scanning calorimetry……………………………………….
7.3.4 Dynamic mechanical analysis………………………………………….
7.3.5 Dielectric analysis………………………………………………………..
7.4 Conclusions………………………………………………………………………..
7.5 References…………………………………………………………………………
CHAPTER 8: Selective Localization of Barium Titanate in PVDF/ENR-50
Blends…………................................................................................
8.1 Introduction………………………………………………………………………...
8.2 Effect of barium titanate in the simple and dynamically vulcanized
PVDF/ENR-50 blends……………..……………………………………………..
8.2.1 Morphological properties………………………………………………..
8.2.2 Mechanical properties…………………………………………….…….
8.2.3 Dynamic mechanical analysis………………………………………….
8.2.4 Dielectric properties……………………………………………………..
173
173
175
175
177
178
180
183
185
191
191
192
196
198
202
207
209
215
215
216
216
224
227
230

8.3 Effect of barium titanate loading in dyncamically vulcanized
PVDF/ENR-50 blend……………………………………………………………...
8.3.1 Morphological properties………………………………………………..
8.3.2 Mechanical properties…………………………………………………..
8.3.3 Dynamic mechanical analysis………………………………………….
8.3.4 Dielectric properties……………………………………………………..
8.4 Conclusions………………………………………………………………………..
8.5 References…………………………………………………………………………
CHAPTER 9: General Conclusion………….………………………………………...
APPENDIX……………………………………………………………………………………
CURRICULUM VITAE………………………………………………………………………
234
234
236
238
241
245
246
249
253
275

LIST OF TABLES
Tables Page
CHAPTER 2: Literature Review……………………………………………………….
2.1 Dielectric constant ( ) and loss tangent (tan ) of some polymers...……...
2.2 The dielectric permittivity of 0-3 ceramic polymer composites. The value
with “~” is obtained from graphical representations……………....................
2.3 Properties of selected CBs for electric conductivity…………………………..
CHAPTER 3: Materials and Experiment Methodology…………………..............
3.1 Characteristics of used carbon black…………………………………………...
3.2 Compounding formulation used to prepare rubber vulcanizate……………..
3.3 Composition of simple and dynamically cured PVDF/ENR-50 blends
with addition of BT………………………………………………………………...
3.4 Composition of dynamically cured PVDF/ENR-50 blend with various BT loadings.……………………………………………………………................
3.5 Dimensions of dumbell test specimens………………………………………...
CHAPTER 4: Characterization of natural rubber and epoxidized
natural rubber..................................................................................
4.1 Cure characteristic of NR, ENR-25 and ENR-50 compounds……………....
4.2 Mechanical properties of NR, ENR-25 and ENR-50 gum vulcanizates…….
4.3 Storage modulus and tan of NR, ENR-25 and ENR-50 gum
vulcanizates………………………………………………………………………..
4.4 Fitting parameters of VFT equation to the experimental data……………....
4.5 Dielectric properties at frequency 1 kHz of NR, ENR-25 and ENR-50
vulcanizates………………………………………………………………………..
39
40
44
48
77
79
80
84
85
90
99
100
102
103
107
110

Tables Page
CHAPTER 5: Flexible Ceramic-Polymer Composites based on BT/ENR-50
Composites…..................................................................................
5.1 Cure characteristic of BT/ENR-50 composites with various BT
loadings…......................................................................................................
5.2 Mechanical properties of BT/ENR-50 composites with various BT
loadings…………………………………………………………………………….
5.3 Storage modulus (EE ) and loss tangent (tan ) of BT/ENR-50 with
various BT loadings……………………………………………………………….
5.4 Permittivity ( ), loss factor ( ) and loss tangent (tan ) at fixed
frequency 1 kHz of BT/ENR-50 composites with various BT loadings..…...
5.5 Fitting parameters of VFT and Arrhenius equations to the experimental
data…………………………………………………………………………………
CHAPTER 6: Conductive Elastomer Composites based on CB/ENR-50
Composites……………………………………………………………...
6.1 Cure characteristic of HAF and ECF filled ENR-50 composites…………....
6.2 Young’s modulus (E), tensile strength ( B), elongation at break ( B)
and hardness of HAF/ENR-50 and ECF/ENR-50 composites………………
6.3 Storage modulus (EE ) and loss tangent (tan ) of HAF/ENR-50 and
ECF/ENR-50 composites with various CB loadings………...........................
6.4 DC conductivity values obtained from the power law fitting curves of the
conductivity plots………………………………………………………………….
CHAPTER 7: Phase Development and Miscibility of PVDF/ENR-50 Simple
Blends…………………………………………………………………….
7.1 Solubility parameter of PVDF, ENR-25 and ENR-50…………………………
7.2 Mechanical properties of PVDF, PVDF/ENR-25 and PVDF/ENR-50
blends………………………………………………………………………………
7.3 Thermal characteristic of PVDF and its blend during cooling and heating
sweeps………………………………………………………………….................
121
126
129
132
136
143
149
151
152
158
164
173
176
178
179
Tables Page
7.4 Dynamic mechanical properties of PVDF and its blends…………………….
7.5 Fitting parameters for PVDF, ENR-25, ENR-50 and their blends................
7.6 Fitting parameters of conductivity process for PVDF, ENR-25, ENR-50
and their blends……………………………………………………………………
7.7 Mechanical properties of PVDF/ENR-50 blend with different blend
proportions.....................................................................................................
7.8 Thermal characteristic of PVDF/ENR-50 blends with different
compositions..……………………………………………………………………...
7.9 Storage modulus (EE ) and loss tangent (tan ) of PVDF/ENR-50 blends
with various blend compositions………………..............................................
7.10 Fitting parameter for glass-rubber transition and conductivity peaks of
PVDF/ENR-50 blends with various blend ratios………….............................
CHAPTER 8: Selective Localization of Barium Titanate in PVDF/ENR-50
Blends…………................................................................................
8.1 Mechanical properties of simple and dynamically cured PVDF/ENR-50
blends without and with 5 vol% BT……………………………………………..
8.2 Dynamic mechanical properties of simple and dynamically cured
PVDF/ENR-50 blends without and with 5 vol% BT…………………………..
8.3 Permittivity ( ), loss factor ( ) and loss tangent (tan ) at frequency
1 kHz of simple and dynamically cured PVDF/ENR-50 blends with and
without BT………………………………………………………..........................
8.4 Mechanical properties of dynamically cured PVDF/ENR-50 blend
with various amounts of BT……………………………………………………...
8.5 Dynamic mechanical properties of dynamically cured PVDF/ENR-50
blend with various amounts of BT………………………………………………
8.6 Permittivity ( ), loss factor ( ) and loss tangent (tan ) at frequency
1 kHz of dynamically cured PVDF/ENR-50 blend with various BT
loadings ……………………………………………………………………………
182
188
190
194
197
200
207
215
226
230
232
238
240
243
LIST OF FIGURES
Figures Page
CHAPTER 2: Literature Review……………………………………………………….
2.1 (a) Cubic perovskite-type structure ABO3 (b) another view of
the ABO3 structure…………………………………………………………….…..
2.2 Connectivity of constituent phases in piezoelectric ceramic–polymer
composites……………………………………………………………………..…..
2.3 Dependence of electrical conductivity ( ) on the volume fraction ( ) of
conductive fillers…………………………………………………………..………
2.4 Structure of carbon black……………………………………..…………….……
2.5 Schematic of the concept of CB structure and surface area………………..
2.6 (a) Interface between the carbon black filler and the polymer. (b) A
schematic diagram of the physical network in a carbon black filled
elastomer…….……………………………………………………………………..
2.7 Formation mechanism of the morphology in the polymer blends…………..
2.8 The evolution of the morphology of simple blend with different
blend compositions………………………………………………………………..
2.9 Schematic diagram of morphology transformation during the dynamic
vulcanization of polymer blends…………………………….............................
2.10 Selective localization of particles in polymer blends..………………………...
2.11 The mechanism for epoxidation of natural rubber………………………….…
2.12 Chemical structure of PVDF……………………………………………………..
CHAPTER 3: Materials and Experiment Methodology……………………………
3.1 Molecular structure of HRJ-10518………………………………………………
3.2 Mixing torque-time graph for PVDF/ENR simple blend………………………
3.3 Mixing torque-time graph for dynamically cured PVDF/ENR-50 blends
with different methods to introduce BT particles in the blends ………..…...
3.4 Torque as function of time during the vulcanization……………………….....
39
41
42
45
47
47
49
52
53
55
56
61
63
77
79
83
84
86
Figures Page
3.5 Schematic diagram of the various signals generated by the interaction of
the electron beam with the sample……………………………………………..
3.6 Typical stress–strain curve for polymeric materials…………………………..
3.7 Standard die shape for cutting dumbbell specimens………………..………..
3.8 Schematic presentation of the (a) frequency and (b) temperature
dependences of and for typical dielectric relaxation in polymers……..
CHAPTER 4: Characterization of Natural Rubber and Epoxidized
Natural Rubber..................................................................................
4.1 Rheograph of gum vulcanizates of NR, ENR-25 and ENR-50 at 160°C…..
4.2 Stress-strain curves of NR, ENR-25 and ENR-50 gum vulcanizates………
4.3 Temperature dependence of EE and tan of NR, ENR-25 and
ENR-50 gum vulcanizates………………………………………………………..
4.4 Temperature dependence of (a) and (b) of vulcanized NR at
several frequencies ( ) 1, ( ) 10, ( ) 100, ( ) 1k and ( ) 10k Hz……….
4.5 Temperature dependence of (a) and (b) of vulcanized ENR-25 at
several frequencies ( ) 1, ( ) 10, ( ) 100, ( ) 1k and ( ) 10k Hz……….
4.6 Temperature dependence of (a) and (b) of vulcanized ENR-50 at
several frequencies ( ) 1, ( ) 10, ( ) 100, ( ) 1k and ( ) 10k Hz……….
4.7 Chemical structure and dipole moment of poly(cis-1,4-isoprene)…………..
4.8 Relaxation time at maximum of for -relaxation of NR, ENR-25
and ENR-50 as a function of reciprocal temperature. Solid line
represent the overall best fits according to Equation 3.20…………………..
4.9 Temperature dependence of tan of NR, ENR-25 and ENR-50
vulcanizates obtained from DMA and DEA techniques at frequency
1 Hz…………………………………………………………………………………
4.10 Frequency dependence of (a) and (b) of NR, ENR-25 and
ENR-50 vulcanizates at room temperature…………………….......................
4.11 Temperature dependence of MM of (a) NR, (b) ENR-25 and (c) ENR-50
vulcanizates at several frequencies ( ) 1, ( ) 10, ( ) 100, ( ) 1k
and ( ) 10k Hz ……………………………………………………………………
87
88
90
95
99
101
102
103
105
105
106
106
107
109
110
112
Figures Page
4.12 Frequency dependence of MM of NR, ENR-25 and ENR-50 vulcanizates...
4.13 Frequency dependence of AC conductivity of NR, ENR-25 and ENR-50
vulcanizates..…………………………………………………………..................
4.14 Relaxation time at maximum of MM for conduction process of NR,
ENR-25 and ENR-50 as a function of reciprocal temperature. Solid
line represent the overall best fits according to Equation 3.19……………..
CHAPTER 5: Flexible Ceramic-Polymer Composites based on BT/ENR-50
Composites…..................................................................................
5.1 XRD patterns of mixed BaCO3+TiO2 and BaTiO3…………………………….
5.2 (a) SEM micrograph and (b) particle size distribution of BT powders….…..
5.3 Permittivity ( ), loss factor ( ) and loss tangent (tan ) as function
of frequency of synthesized barium titanate…………………………………..
5.4 Rheographs of BT/ENR-50 composites with various BT loadings………….
5.5 SEM micrographs of BT/ENR-50 composites with various BT loadings
(a) 0, (b) 5, (c) 10, (d) 15, (e) 20, (f) 30, (g) 40 and (h) 50 vol%................
5.6 Enlarged SEM micrographs of BT/ENR-50 composites with (a) 10
and (b) 50 vol% of BT……………………………………………………………
5.7 Stress-strain curves of BT/ENR-50 composites with various BT
loadings…………………………………………………………………………….
5.8 Tensile strength and elongation at break as a function of BT loading
in BT/ENR-50 composites……………………………………………………….
5.9 Temperature dependence of EE and tan of BT/ENR-50 composites
with various BT loadings………………..........................................................
5.10 Temperature dependence of (a) and (b) of BT/ENR-50 composite
with 10 vol% BT at several frequencies ( ) 1, ( ) 10, ( ) 100, ( ) 1k
and ( ) 10k Hz…………………………………………………………………….
5.11 Temperature dependence of (a) and (b) of BT/ENR-50 composite
with 20 vol% BT at several frequencies ( ) 1, ( ) 10, ( ) 100, ( ) 1k
and ( ) 10k Hz…………………………………………………………………….
113
114
115
121
123
123
124
126
127
128
129
130
131
133
133
Figures Page
5.12 Temperature dependence of (a) and (b) of BT/ENR-50 composite
with 30 vol% BT at several frequencies ( ) 1, ( ) 10, ( ) 100, ( ) 1k
and ( ) 10k Hz…………………………………………………………………….
5.13 Temperature dependence of (a) and (b) of BT/ENR-50 composite
with 50 vol% BT at several frequencies ( ) 1, ( ) 10, ( ) 100, ( ) 1k
and ( ) 10k Hz…………………………………………………………………….
5.14 Frequency dependence of (a) and (b) of BT/ENR-50 composites
with various BT loadings ………………………………………………………..
5.15 Schematic representations the structure of ceramic-polymer composite….
5.16 Experimental and theoretical values from different models of permittivity
(at 1 kHz) of composite as a function of BT content in BT/ENR-50
composites…………………………………………………………………………
5.17 Unit cell representations for composites (a) 0-3 connectivity (b) 3-3
connectivity and (c) containing both 0-3 and 3-3 connectivity………………
5.18 Temperature dependence of MM of ENR-50 composites with (a) 10,
(b) 20, (c) 30 and (d) 50 vol% BT at ( ) 1, ( ) 10, ( ) 100, ( ) 1k
and ( ) 10k Hz …………………………………………………………………...
5.19 Frequency dependence of MM of BT/ENR-50 composites with various
BT loadings………………………………………………………………………..
5.20 Relaxation time of -process and conduction process as a function
of reciprocal temperature for BT/ENR-50 composites with various
amounts of BT. Dash and solid lines represent the overall best fits
according to Equation 3.19 and 3.20, respectively……………….…………..
134
134
135
136
138
139
140
141
142

Figures Page
CHAPTER 6: Conductive Elastomer Composites based on CB/ENR-50
Composites……………………………………………………………...
6.1 Rheographs of (a) HAF and (b) ECF filled ENR-50 at various CB
loading levels………………………………………………………………………
6.2 Stress-strain curves of (a) HAF and (b) ECF filled ENR-50 with various
HAF and ECF loadings…………………………………………………………..
6.3 (a) Tensile strength and (b) elongation at break as a function of CB
loading in ENR-50 vulcanizates…………………………………………………
6.4 Vulcanizate properties as a function of the extent of vulcanization………..
6.5 Kraus plot of HAF and ECF filled ENR-50…………………………………….
6.6 The physical network of (a) HAF and (b) ECF in rubber…………………….
6.7 (a) Young’s modulus and (b) hardness versus CB loading in ENR-50……
6.8 Temperature dependence of EE and tan of (a) HAF and (b) ECF filled
ENR-50 at various HAF and ECF loadings……………………………………
6.9 (a) EE at -60 and 25°C and (b) glass transition temperature as a
function of CB content in HAF/ENR-50 and ECF/ENR-50 composites……
6.10 Dielectric permittivity ( ) at room temperature as a function of frequency
for (a) HAF/ENR-50 (b) ECF/ENR-50 composites……………………………
6.11 Dielectric loss factor ( ) at room temperature as a function of frequency
for (a) HAF/ENR-50 (b) ECF/ENR-50 composites …………………………..
6.12 AC conductivity at room temperature as a function of frequency for (a)
HAF and (b) ECF filled ENR-50 vulcanizate with various CB loading
levels. The solid line is a fit of Equation 6.3…………………………………..
6.13 DC conductivity ( DC) versus CB loading levels of HAF and ECF
composites.....................................................................................................
6.14 The formation of conductive network of two different CB structures.……...
6.15 The conductivity for ENR-50 filled with HAF and ECF as function of
(p-pc)…..........................................................................................................
149
151
152
154
154
155
156
157
159
159
161
162
163
165
166
167
Figures Page
CHAPTER 7: Phase Development and Miscibility of PVDF/ENR-50 Simple
Blends…………………………………………………………………….
7.1 SEM micrographs of (a) PVDF/ENR-25 and (b) PVDF/ENR-50
blends……………………………………………………………………………….
7.2 Stress-strain curves of PVDF, PVDF/ENR-25 and PVDF/ENR-50 blends...
7.3 DSC (a) cooling and (b) heating sweeps for PVDF, PVDF/ENR-25
and PVDF/ENR-50 blends……………………………………………………….
7.4 Temperature dependence of EE and tan of PVDF at 1 Hz……………….
7.5 Temperature dependence of EE and tan of PVDF, PVDF/ENR-25
and PVDF/ENR-50………………………………………………………………..
7.6 Schematic diagram of morphology of compatibilized PVDF/ENR blends….
7.7 Proposed mechanism for interfacial reaction between PVDF and ENR…...
7.8 Infrared spectra of neat ENR-25, ENR-50, PVDF, extracted ENR-25
and extracted ENR-50……………………………………………………………
7.9 Temperature dependence of (a) and (b) of PVDF at several
frequencies ( ) 1, ( ) 10, ( ) 100, ( ) 1k and ( ) 10k Hz…………………
7.10 Temperature dependence of (a) and (b) of PVDF/ENR-25 blend
at several frequencies ( ) 1, ( ) 10, ( ) 100, ( ) 1k and ( ) 10k Hz……
7.11 Temperature dependence of (a) and (b) of PVDF/ENR-50 blend at
several frequencies ( ) 1, ( ) 10, ( ) 100, ( ) 1k and ( ) 10k Hz……….
7.12 Activation plot for segmental motion (square symbols) of PVDF,
ENR-25 and ENR-50 and -relaxation (circle symbols) of PVDF………….
7.13 Temperature dependence of MM of (a) PVDF (b) PVDF/ENR-25
and (c) PVDF/ENR-50 at several frequencies ( ) 1 Hz, ( ) 10 Hz,
( ) 100 Hz, ( ) 1 kHz and ( ) 10 kHz………………………………………...
7.14 Activation plot for conductivity process for ENR-25, ENR-50 and
their blends…………………………………………………………………….......
7.15 SEM micrographs of PVDF/ENR-50 simple blend with different blend
ratios (a) 80/20, (b) 70/30, (c) 60/40, (d) 50/50, (e) 40/60, (f) 30/70
and (g) 20/80………………………………………………………………………
173
176
178
179
180
182
183
184
185
186
187
187
188
189
190
192
Figures Page
7.16 Stress-strain curves of PVDF/ENR-50 blend with different blend ratios...…
7.17 Mechanical properties as a function of ENR-50 content in
PVDF/ENR-50 simple blends..…………………………………………………..
7.18 DSC (a) cooling and (b) heating sweeps for PVDF/ENR-50 blends...……..
7.19 Thermal characteristics from DSC curves as a function of ENR-50
content……………………………………………………………………………...
7.20 Temperature dependence of EE and tan for PVDF/ENR-50 blend with
different blend ratios ……………………………………………………………..
7.21 Glass transition temperature (Tg) of PVDF and ENR-50 phases as a
function of ENR-50 content in PVDF/ENR-50 blend………………………....
7.22 Storage modulus and tan as a function of ENR-50 content in
PVDF/ENR-50 blends…………………………………………………………….
7.23 Temperature dependence of (a) and (b) of 80/20 PVDF/ENR-50
blend at frequency ( ) 1, ( ) 10, ( ) 100, ( ) 1k and ( ) 10k Hz………..
7.24 Temperature dependence of (a) and (b) of 30/70 PVDF/ENR-50
blend at frequency ( ) 1, ( ) 10, ( ) 100, ( ) 1k and ( ) 10k Hz………..
7.25 Temperature dependence of tan obtained from DMA and DEA for
the blend with different blend compositions…………………………………
7.26 Temperature dependence of MM of (a) 80/20 and (b) 30/70 PVDF/ENR-
50 blends at several frequency ( ) 1, ( ) 10, ( ) 100, ( ) 1k and
( ) 10k Hz……………………………………………………………..................
7.27 Relaxation time of glass rubber transitions and conductivity process
as a function of reciprocal temperature for PVDF/ENR-50 blends with
various blend ratios.………………………………………………………...........
194
195
197
198
199
201
202
203
203
204
205
206
Figures Page
CHAPTER 8: Selective Localization of Barium Titanate in PVDF/ENR-50
Blends…………................................................................................
8.1 SEM micrographs of PVDF/ENR-50 simple blends (a) 80/20-0BT,
(b) 80/20-5BT, (c) 50/50-0BT and (d) 50/50-5BT…………………………….
8.2 Mixing torque of pure PVDF and ENR-50 at a rotor speed 50 rpm
and temperature 180°C………………………………………………………….
8.3 Schematic diagram illustration of selective localization of BT in
PVDF/ENR-50 simple blends……………………………………………………
8.4 SEM micrographs of dynamically cured PVDF/ENR-50 blend at
blend ratio (a) 80/20 and (b) 50/50…………………………………………….
8.5 SEM micrographs of dynamically cured PVDF/ENR-50 blend containing
5 vol% BT prepared by BDV method with (a and c) PVDF/ENR-50 =
80/20 and (b and d) PVDF/ENR-50 = 50/50………………………………….
8.6 SEM micrographs of dynamically cured PVDF/ENR-50 blend containing
5 vol% BT prepared by ADV method for (a) PVDF/ENR-50 = 80/20 and
(b) PVDF/ENR-50 = 50/50………………………………………………………
8.7 Schematic diagram for dynamically cured of BT/PVDF/ENR-50 blend
prepared by BDV method………………………………………………………..
8.8 Schematic diagram for dynamically cured of BT/PVDF/ENR-50 blend
prepared by ADV method………………………………………………………..
8.9 Stress-strain curves of (a) simple and (b) dynamically cured PVDF/ENR-
50 blends with and without BT at 80/20 and 50/50 blend ratios.…………..
8.10 Temperature dependence of EE and tan of 80/20 PVDF/ENR-50
(a) simple blend and (b) dynamically cured blend with and without BT…...
8.11 Temperature dependence of EE and tan of 50/50 PVDF/ENR-50
(a) simple blend and (b) dynamically cured blend with and without BT…...
8.12 Frequency dependence of (a, b) and (c, d) at room temperature
of simple blends (SB) and dynamically cured PVDF/ENR-50 blends (DV)
with the blend ratios of (a, c) 80/20 and (b, d) 50/50……………………….. 8.13 Loss factor ( ) of PVDF and ENR-50 at room temperature………………..
215
217
218
219
220
221
222
223
224
225
227
228
231
233
Figures Page
8.14 Permittivity ( ) at 1 kHz of PVDF/ENR-50 (a) simple blend and
(b) dynamically cured blend with and without BT…………………………….
8.15 SEM micrographs of dynamically cured PVDF/ENR-50 blend containing
various amounts of BT……………………………..…………………………….
8.16 Stress-strain curves of dynamically cured PVDF/ENR-50 blend with
blend ratios of (a) 80/20 and (b) 50/50 containing various BT loadings…..
8.17 (a) Tensile strength and (b) elongation at break of dynamically cured
80/20 and 50/50 PVDF/ENR-50 blend containing various BT loadings..….
8.18 Temperature dependence of EE and tan of dynamically cured (a) 80/20
and (b) 50/50 PVDF/ENR-50 blends with various BT loadings……….…....
8.19 Relative storage modulus at 25°C as a function of BT loading…………….
8.20 Frequency dependence of and at room temperature of dynamically
cured PVDF/ENR-50 blends with various BT loadings ……........................
8.21 (a) Permittivity (b) loss factor and (c) loss tangent at frequency 1 kHz of
dynamically cured PVDF/ENR-50 blends as a function of BT loading…….
233
235
237
237
240
241
243
244
LIST OF ABBREVIATIONS
Abbreviations Description
AC Alternative current
ACM Acrylic rubber
ADS Air dried sheets
ADV After dynamic vulcanization
ASTM American Society for Testing and Materials
ATR-FTIR Attenuated total reflectance-Fourier transform infrared
BaCO3 Barium carbonate
BaTiO3 Barium titanate
BDS Broadband dielectric spectroscopy
BDV Before dynamic vulcanization
BET Brunauer–Emmett–Teller theory
BSE Back-scattering electron
BN-BT Bismuth sodium barium titanate
BT Barium titanate
CB Carbon black
CCB Conductive carbon black
CNT Carbon nanotube
CPC Conductive polymer composites
CR Chloroprene rubber
CRI Cure rate index
DBP Dibutyl phthalate
DC Direct current
DEA Dielectric analysis
DMA Dynamic mechanical analysis
DMF Dimethylformamide
DSC Differential scanning calorimeter
Abbreviations Description
DV Dynamically vulcanized blend
ECF Extra conductive furnace
EMA Ethylene methyl acrylate
ENR Epoxidized natural rubber
EPDM Ethylene propylene diene rubber
EPR Ethylene propylene rubber
ETD Everhart-Thornley detector
EVA Ethylene vinyl acetate
FTIR Fourier transform infrared
FWHM Full width at half maximum
HAF High abrasion furnace
JCPDS Joint committee on powder diffraction standards
LEDPNR Deproteinized epoxidized natural rubber
MBT Mercaptobenzothiazole
MEMS Microelectromechanical systems
MLCC Multi-layer ceramics capacitors
MNR Maleated natural rubber
MWCNT Multiwall carbon nanotube
MWS Maxwell-Wagner-Sillars
NBR Acrylonitrile butadiene rubber
NMR Nuclear magnetic resonance
NR Natural rubber
PA-6 Polyamide-6
PA-12 Polyamide-12
PBT Poly(butylene terephthalate)
PbO Lead oxide
PCL Poly( -caprolactone)
PE Polyethylene
PEI Polyetherimide
Abbreviations Description
Phr Part per hundred
PLA Polylactide
PLLA Poly(L-lactide)
PMMA Poly(methyl methacrylate)
PMN-PT Lead magnesium niobate-lead titanate
PP Polypropylene
PS Polystyrene
PT Lead titanate
PU Polyurethane
PVA Poly(vinyl alcohol)
PVC Poly(vinyl chloride)
PVDF Poly(vinylidene fluoride)
P(VDF-HFP) Poly[(vinylidene fluoride)-co-hexafluoro-propylene)] P(VDF-TrFE) poly[(vinylidene fluoride)-co-trifluoroethylene]
PZT Lead zirconate titanate
SB Simple blends
SE Secondary electron
SEM Scanning electron microscope
TEM Transmission electron microscope
TiO2 Titanium(IV) oxide
TPE Thermoplastic elastomers
TPNR Thermoplastic natural rubber
TPO Thermoplastic polyolefin
TPU Thermoplastic polyurethane
TPV Thermoplastic vulcanizates
vCD Low voltage high contrast detector
VFT Vogel-Fulcher-Talmann
XRD X-ray diffraction technique
ZnO Zinc oxide

LIST OF SYMBOLS
Symbols Description Unit
Flory-Huggins interaction parameter -
Solubility parameter MPa
Strain at break (elongation at break) %
Dielectric permittivity of ceramic -
Dielectric permittivity of composite -
Dielectric permittivity of polymer -
Complex permittivity -
Dielectric permittivity (dielectric constant) -
Dielectric loss -
Dielectric loss due to conduction loss -
Dielectric loss due to dipole orientation -
Dielectric loss due to interfacial polarization -
Vacuum permittivity (8.854x10⁻¹² F/m) F/m
Interfacial tension mN/m Dispersive part of surface tensions mN/m Polar part of surface tensions mN/m
c percolation threshold vol%
Volume fraction of filler vol%
Density g/cm3
AC conductivity S/cm
Stress at break (Tensile strength) MPa
Conductivity of the conductive filler S/cm
DC conductivity S/cm
Effective conductivity of the composite S/cm
Conductivity of the polymer S/cm
Relaxation time s
Angular frequency rad/s
Symbols Description Unit
Activation temperature K
Capacitance F
Young’s modulus MPa
Activation energy eV
Storage modulus MPa
Loss modulus MPa
Force at break N
Free energy of mixing - Change in enthalpy of mixing J
Melting enthalpy of sample J/g
Theoretical enthalpy for 100 % crystalline J/g Boltzmann constant (8.617 x 10⁻⁵ eV/K) eV/K
Initial length mm
Change in length mm
Complex electric modulus -
Real part of electric modulus -
Imaginary part of electric modulus -
Maximum torque dN.m
Torque difference or delta torque dN.m Minimum torque dN.m
Filler concentration phr
percolation threshold phr
Gas constant J/K.mol
Change in entropy of mixing J/K
Loss tangent -
Optimum time min
Crystallization temperature °C
Melting temperature °C
Glass transition temperature °C
Scorch time min
CHAPTER 1
INTRODUCTION
The research described here was performed according to the frame work
“Agreement for international joint supervision of a thesis” between the Prince of Songkla
University (PSU, Thailand) and the University Claude Bernard Lyon 1 (UCBL, France).
The research was performed in a collaboration between Department of Rubber
Technology and Polymer Science, Faculty of Science and Technology, Prince of Songkla
University (PSU, Thailand) and Le laboratoire IMP@Lyon1 (Ingénierie des Matériaux
Polymères), UMR CNRS 5223, University Claude Bernard Lyon 1 (UCBL, France) with
the financial support of the Royal Golden Jubilee Ph.D. Program (Grant No.
PHD/0245/2549) and French Embassy in Thailand.
1.1 Introduction
Natural rubber (NR) based on the Hevea brasiliensis is an attractive material
with the most valuable elastomer and a renewable resource. NR molecular chain consists
of cis-1,4-polyisoprene which exhibit interesting physical properties, excellent flexibility
and high mechanical strength. This is due to the ability to crystallize under stretching,
leading to be typically used in industrial applications. However, NR contains conjugated
double bonds with low polarity. Therefore, application of natural rubber is limited, mainly
due to degradation and incompatibility of natural rubber with other materials. That is, NR
has to be mixed with fillers and other polymers. To overcome these limitations, double
bonds in NR molecules are replaced by polar functional groups. This causes to
improvement of several properties while retaining the inherent excellent physical
properties of NR. The modification leads to extending the usage of NR in many fields
such as composites and blends. Epoxidized natural rubber (ENR) is one of the modified
natural rubber by reacting NR with peracid in a latex state. The presence of epoxide
groups in ENR molecules would improve the drawback of unmodified NR such as
enhanced polarity and compatibility with other polar materials, good oil resistance and
low air permeability. Therefore, the use of epoxidized natural rubber instead of unmodified
NR would be of interest in elaboration of polymer composites and polymer blends.
In recent years, polymer composites and polymer blends have been used
extensively in various applications. Addition of filler into polymeric matrix and blending of
polymers are well-established ways to improve the properties which cannot be achieved
from the individual component. It is an effective cost and economic approach to produce
a new material with desired properties.
Carbon black and silica are the most widely used fillers in thermoplastic and
rubber industries to significantly improve modulus, tensile strength, tear resistance,
abrasion resistance and dynamic mechanical properties. Recently, developments of
polymer composites with high permittivity and high conductivity are attracting for electrical
application. Such materials could be fabricated by using high permittivity ceramic and
conductive fillers in the polymer matrix. Polymer composite based on ceramic has
infrequently been reported and interested. Ceramic-polymer composite is a combination
of inorganic piezoelectric ceramic and flexible polymer to form flexible piezoelectric
composite. This provides unique material which exhibit high permittivity, low dielectric loss
and good flexibility. Among ferroelectric ceramic, barium titanate (BaTiO3) has been
extensively employed as a ceramic filler as it can induce high permittivity in composite
films. Meanwhile, the use of conductive filler such as carbon black can improve electrical conductivity when the filler concentration reach percolation threshold. At this
concentration, the conductive cluster is connected as three-dimensional network in
polymer matrix.
The blending of polymer has been studied extensively over the past decades in
order to achieve a set of desired properties and high performances for specific
applications. The thermoplastic elastomeric combination is an interesting and new class
of material, so-called “Thermoplastic Elastomer” (TPE). The TPE consists of a rigid
thermoplastic phase and a soft elastomer phase, resulting in a combination of the
excellent elastic properties of rubber with melt processability of thermoplastic. The
properties of TPE based on plastic-rubber blend depend on phase morphology and
miscibility between two phases, mainly due to phase separation of the blend. There are
two types of blending technique to prepare TPE: simple blend and dynamic vulcanization.
The simple blend (SB) means blending of plastic and rubber without cross-linker. The
dynamic vulcanization is a blend with cross-linker to vulcanize rubber phase during melt
mixing. The thermoplastic elastomer prepared by dynamic vulcanization is usually called
thermoplastic vulcanizate (TPV).
1.2 Scope of thesis
The present work was focused on studying structure-properties relationship of
the natural rubber filled with ceramic and carbon black fillers as well as thermoplastic
elastomer based on blending of epoxidized natural rubber and poly(vinylidene fluoride).
The research work was divided into two stages.
The first stage was to prepared gum and composite of natural rubber
vulcanizate. Unmodified natural rubber and epoxidized natural rubber (ENR) were chosen
to study molecular mobility and dielectric properties. The presence of polarity functional
groups were speculated to affect the molecular dynamic of natural rubber. Furthermore,
the enhancement for dielectric permittivity of epoxidized natural rubber was investigated
by incorporation of barium titanate. Conductive elastomer composite based on epoxidized
natural rubber was also prepared to obtain the conductive composite with high mechanical
properties and low percolation threshold.
The second stage was to study blending of poly(vinylidene fluoride) (PVDF) and
epoxidized natural rubber (ENR). The PVDF was chosen due to high dielectric constant
of PVDF but the ENR was contributed to good compatibility with polar polymers. Effects
of epoxidation level in ENR molecules and blend proportion on phase development and
miscibility of thermoplastic elastomer were investigated. Furthermore, composite based
on binary blend of PVDF/ENR-50 containing BT particles were also studied. The objective
for incorporation of BT in the blend was to understand the selective localization of BT
particle in the simple and dynamically cured PVDF/ENR-50 blends.
1.3 The aim of thesis
The aim of this research work was to develop a novel natural rubber composite
based on ferroelectric ceramic and conductive carbon black, and a novel natural rubber
blend based on fluoro-polymer by an understanding of the structure-properties
relationship. The main aims of the project as listed follows:
1. To study influence of epoxide level in ENR molecules compared
with unmodified natural rubber on vulcanizate properties.
2. To study influence of volume fraction for barium titanate on vulcanizate
properties of epoxidized natural rubber (ENR-50) composite.
3. To study influence of surface area and structure of carbon black on
reinforcement and formation of conductive path in the ENR-50 matrix.
4. To study influence of epoxide level in ENR molecules and blend proportion
on various properties of PVDF/ENRs simple blend.
5. To study selective localization of barium titanate particles in simple blend
and dynamically cure PVDF/ENR-50 blends with difference blend ratio.
6. To study influence of processing condition of dynamic vulcanization on
selective localization of barium titanate particles in dynamically cure
PVDF/ENR-50 blend.
7. To study influence of barium titanate loading on various properties of
dynamically cure PVDF/ENR-50 blends.
1.4 Novelty of the work
- The molecular mobility and dynamic process of epoxidized natural rubber
have been revealed by dielectric analysis. That is, the epoxide groups in the ENR
significantly affected dielectric properties of ENR sample.
- The introduction of barium titanate (BT) particles in epoxidized natural
rubber (ENR-50) resulted in an increase of dielectric permittivity as high as ceramic-
polymer composite elsewhere in literature.
- Conductive elastomer composite based on extra conductive carbon black
and epoxidized natural rubber with lowering percolation threshold was observed.

- Thermoplastic elastomer based on poly(vinylidene fluoride) and
epoxidized natural rubber blend was prepared which found to be as a compatibilized
blend.
- BT particles were incorporated into thermoplastic elastomer blend and the
selective localization of BT in the blend is caused by kinetic effect and mixing sequence.
1.5 The thesis outline
This present thesis is concerned with the studies of the composites and blends
based on natural rubber. The thesis is divided into several chapters which are structured
to bring forth the structure-processing-property relationships, as follows:
Chapter 2 provides the theoretical background and fundamental understanding
of ceramic-polymer composites, conductive polymer composites and thermoplastic-
elastomer blends, particularly those forms using multiphase polymer matrices. The
chapter also presents an introduction of natural rubber, epoxidized natural rubber,
poly(vinylidene fluoride) and their composites and blends.
Chapter 3 describes the materials and experimental procedure that are used
throughout the study. The material fabrication and characterization methods are
presented. Also, the regarding microstructure analysis of the fabricated composites and
blends study structure-properties relationship are described.
Chapter 4 discusses influence of epoxidation level in epoxidized natural rubber
on the gum vulcanizate properties in terms of cure characteristic, mechanical properties,
dynamic mechanical properties and dielectric analysis.
Chapter 5 describe the properties of flexible high permittivity materials based
on ceramic-polymer composites of barium titanate (BT) and epoxidized natural rubber
with 50 mol% epoxide (ENR-50). Mixture of BT and ENR-50 was prepared by melt mixing
process to obtain the ceramic-polymer composites with 0-3 connectivity. The dielectric
behavior of the composites with different proportions of the ceramic-polymer phases has
been studied. The relative permittivity from the experiment was compared to the
theoretical models. Furthermore, morphological, static and dynamic mechanical properties
of the composites are discussed.
Chapter 6 is devoted to characterization of carbon black/epoxidized natural
rubber composite with two types of carbon black. The role of surface area and structure
of carbon black to form bound rubber at carbon black surface are related to mechanical
properties (i.e., Young’s modulus, tensile strength and elongation at break). The electrical
properties of the conductive composites were also investigated over a wide ranges of
composition. Influence of two different types of carbon black structures on percolation
threshold of CB/ENR-50 composites was also discussed.
Chapter 7 describes the preparation of thermoplastic elastomer based
poly(vinylidene fluoride) (PVDF) and epoxidized natural rubber blend. This deals with
PVDF/ENRs simple blend using two different epoxide contents in ENR molecules (i.e., 25
and 50 mol%) with the same blend proportion (50/50). The effect of epoxidation level in
ENR on morphological and other related properties is focused. Then, ENR-50 was
selected to prepare PVDF/ENR-50 simple blend with different blend proportions. The
phase development and miscibility of the blends are discussed.
Chapter 8 discusses the simple blend and dynamically vulcanized PVDF/ENR-
50 blends containing BT particles by first focusing on selective localization of barium
titanate particles (5 vol%) in the simple and dynamically vulcanized blends. The selective
localization of particles are strongly dependent on viscosity of the blend components. Two
different mixing sequences were exploited in dynamically cured blend. The morphological
properties of the blend were also affected by localization of BT in the blend which was
investigated by scanning electron microscopy (SEM). The dynamically vulcanized
PVDF/ENR-50 blend with different volume fractions of BT is described in terms of
morphological, mechanical, dynamic mechanical and dielectric properties of binary
polymer composite.
CHAPTER 2
LITERATURE REVIEW
2.1 Polymer composites
Polymer composites are commonly defined as heterogeneous system of
polymers containing inorganic or organic filler in various forms (i.e., spherical and fiber)
with either micro or nano in size. The fillers are embedded into polymer to form material
which consists of two or more components. This causes modifying of properties for
individual component which provides opportunity to prepare new application and
commercial value [1]. In the last decade, polymer composites are attractive materials and
they have been intensively studied due to light weight, ease of processability and excellent
properties. In fact, there are several reasons to apply fillers and reinforcements into the
viscoelastic polymer materials. Firstly, incorporation of filler into polymer in order to
upgrade product performance, including physical properties (i.e., conductivity, dielectric
constant and density), mechanical properties (i.e., strength and modulus), rheological
properties (i.e., viscosity and viscoelasticity). Polymer composites are widely used in
several applications such as automotive, tires, packaging and electronic product [2, 3].
Incorporation of filler in polymer has been prepared and studied in the past for reinforcing
polymer and elastomer. A variety of theoretical and experimental studies have been
reported on the reinforcement effect in terms of macroscopic mechanical properties [4].
For example, reinforcement effect of carbon black and silica, the most commonly used
reinforcing fillers, led to the development of many high engineering performance products
for elastomers and plastic industries [2, 5-9]. Secondly, fillers are used for economic
reason which is to reduce the cost of production [2, 3].
Recently, there has been an increasing interest in the preparation of polymer
composites for electronic applications with high dielectric permittivity. These composite
offers high and predictable dielectric permittivity, low dielectric loss, mechanical flexibility

as well as easy fabrication [4, 10]. Generally, polymers are materials with low dielectric
permittivity ( = 2 to 10) [10], as summarized in Table 2.1. They do not meet the
application requirements of high capacity, especially non polar polymer which has no
permanent dipole moments. The improvement in dielectric permittivity of polymer can be
obtained by mixing the insulating polymer with high permittivity ceramics fillers ( 1000
to 2000) and very low loss factor (i.e., barium titanate (BT) [11], bismuth sodium barium
titanate [12] and lead zirconate titanate (PZT)) [13] etc. Another approach to increase
permittivity of polymer is to utilize conductive fillers such as carbon black, metal particle
and carbon nanotube. However, this approach gets very high dielectric loss because the
filler particles can easily form a conductive path in the composite. Conductive polymer
composites (CPC) can be obtained when the filler concentration approaches the
percolation threshold [14].
Table 2.1 Dielectric constant ( ) and loss tangent (tan ) of some polymers Polymers Frequency tan Ref.
Poly(vinylidene fluoride) PVDF 1 kHz 10.5 0.026 [15]
Poly(vinylidene fluoride-co-trifluoro ethylene) a 1 kHz 11.0 0.184 [12] Polyethylene (PE) 1 MHz 2.3 0.0001 [16]
Epoxy* - 4.2 0.0082 [17]
Nylon-6 (PA6) 1 kHz 8.0 0.10 [18]
Natural rubber (NR) 1 kHz 2.7 0.002 [19]
Ethylene propylene rubber (EPR) 1 kHz 3.2 0.0066 [19]
Chloroprene rubber (CR) 1 kHz 6.5 0.03 [19]
Polyurethane (PU) 1 kHz 5.0 0.015 [19] a P(VDF-TrFE) VDF/TrFE : 70/30 mol%, * no record of frequency
2.1.1 Ceramic-polymer composites
Nowadays, ceramic-polymer composites have been developed to improve
dielectric permittivity of the individual polymers because they generally suffer from low
dielectric permittivity. However, they are easily processed with high ability to stretch [4,
10]. These types of composites are possible to combine desirable characteristics such as
mechanical flexibility, chemical stability and processing possibilities of the polymer and
the high dielectric constant (permittivity), piezoelectricity and stiffness of ceramics [20-22].
2.1.1.1 Ferroelectric ceramics
Ferroelectric ceramics were first discovered in the early 1940s with the discovery
of high dielectric constant in barium titanate. Ferroelectric materials have permanent
dipoles that usually interact to give a polarization in the absence of an applied electric
field. They do not lose all of their ionic polarization when the field is removed due to the
coupling between adjacent dipoles. This behavior is a key role for the ferroelectricity.
While paraelectric materials cannot be left with a residual polarization once the field is
removed due to the lack of mobile charged atoms. Ferroelectric ceramic based on
perovskite structure is the most important category i.e., Barium titanate (BaTiO3, BT), lead
zirconate titanate (PZT) and lead titanate [23, 24]. Barium titanate is the first compound
with formula ABO3, which called peroskite mineral which exhibits ferroelectic behavior.
The other ceramics in the perovskite families include SrTiO3, PbTiO3 and KNbO3. The
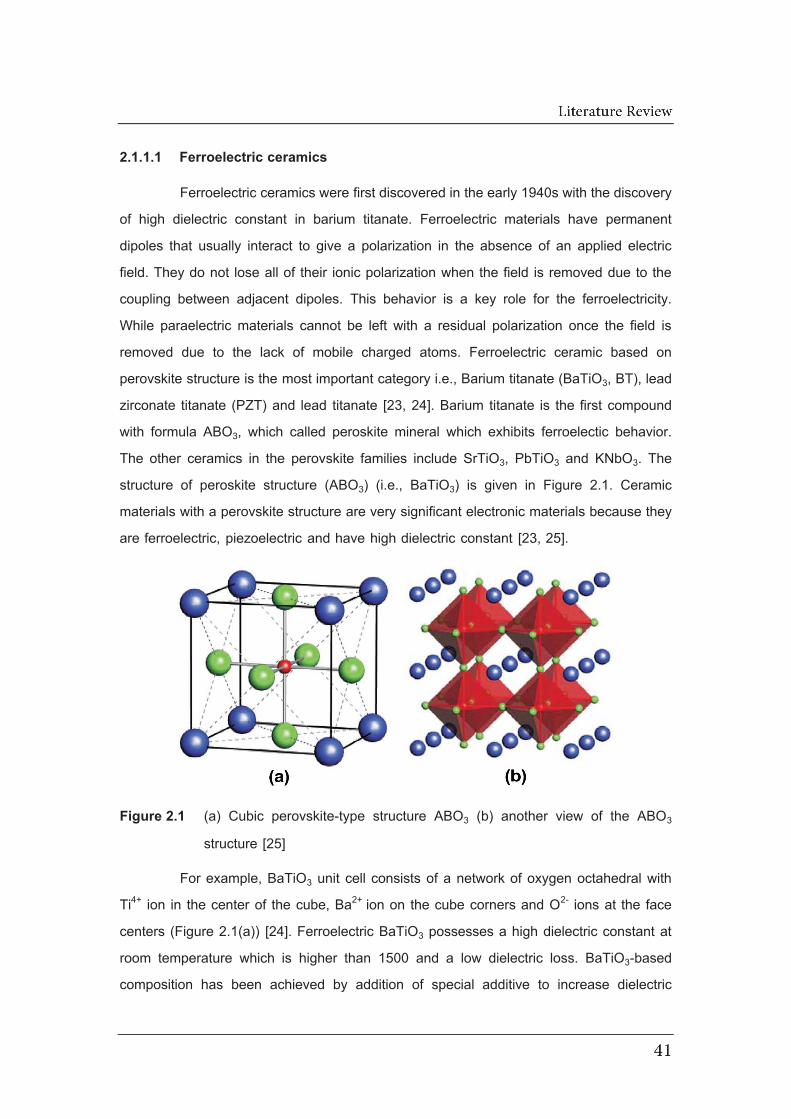
structure of peroskite structure (ABO3) (i.e., BaTiO3) is given in Figure 2.1. Ceramic
materials with a perovskite structure are very significant electronic materials because they
are ferroelectric, piezoelectric and have high dielectric constant [23, 25].
Figure 2.1 (a) Cubic perovskite-type structure ABO3 (b) another view of the ABO3
structure [25]
For example, BaTiO3 unit cell consists of a network of oxygen octahedral with
Ti4+ ion in the center of the cube, Ba2+ ion on the cube corners and O2- ions at the face
centers (Figure 2.1(a)) [24]. Ferroelectric BaTiO3 possesses a high dielectric constant at
room temperature which is higher than 1500 and a low dielectric loss. BaTiO3-based
composition has been achieved by addition of special additive to increase dielectric
constant in the range of 100000. Because of these good characteristics, BT nowadays
has become more and more important ceramics materials [24, 25].
2.1.1.2 Connectivity of ceramic and polymer in composites
In order to meet desired properties of ceramic-polymer composites, it is usually
not only means to choose the appropriate pair materials in a particular way, but their
properties are also governed by the composite structure arrangement or connectivity
concept. The connectivity of the two-component composites with planar interfaces was
first introduced by Newnham et al. [26]. Connectivity concept describes the spatial
arrangement of two components in a composite and each phase could be self-connected
in either one, two or three dimensions. Two digits of - were used to indicate phase
connectivity of ceramic-polymer composites. The first digit refers to the number of
directions in which the piezoelectrically active phase (filler) and the second shows the
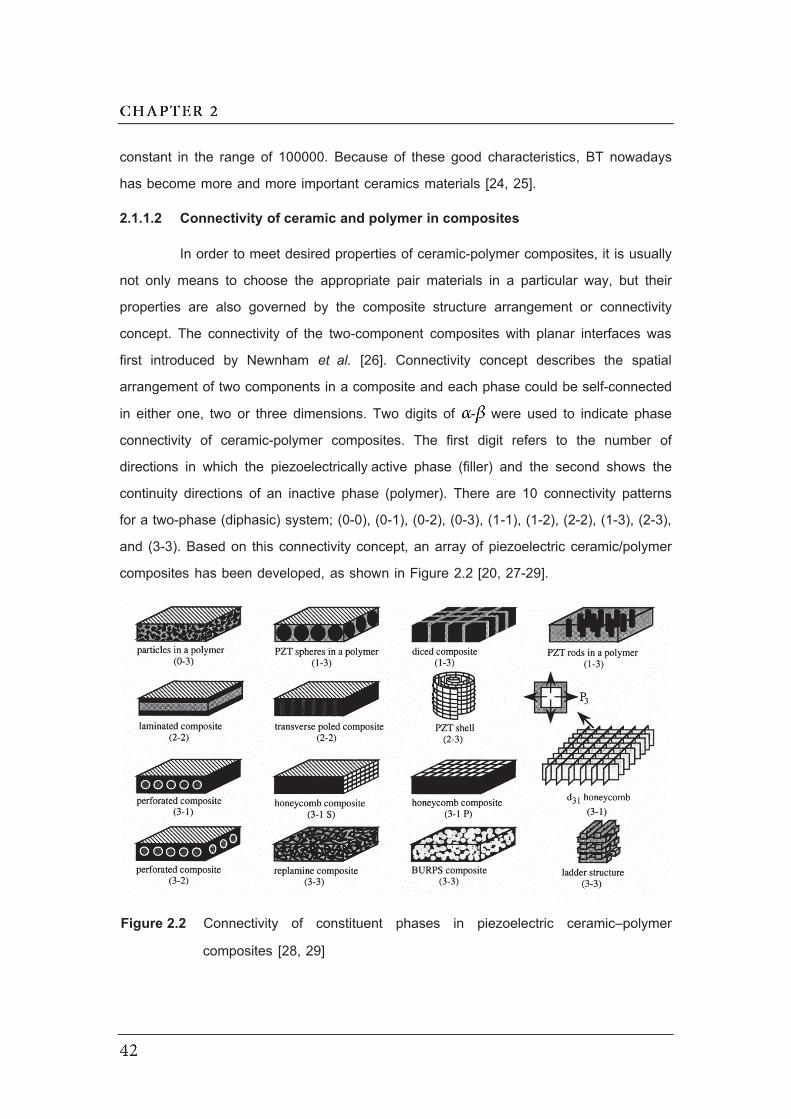
continuity directions of an inactive phase (polymer). There are 10 connectivity patterns
for a two-phase (diphasic) system; (0-0), (0-1), (0-2), (0-3), (1-1), (1-2), (2-2), (1-3), (2-3),
and (3-3). Based on this connectivity concept, an array of piezoelectric ceramic/polymer
composites has been developed, as shown in Figure 2.2 [20, 27-29].
Figure 2.2 Connectivity of constituent phases in piezoelectric ceramic–polymer
composites [28, 29]

2.1.1.3 0-3 connectivity composite and their fabrication
The 0-3 composite consists of random ceramic particles embedded in the three-
dimensionally connected polymer matrix. This connectivity can be easily prepared and is
one of the most common composites type. Its ease fabrication in a variety of forms
including large flexible sheets allows mass production at a relatively low cost [11, 20, 27,
28]. The compounding can be prepared by first melting or softening polymer in a hot
rolling machine. Ceramic powder is then gradually added during mixing until a reasonable
blend is obtained. This composite can also be prepared through the solution containing
polymer and ceramic with dispersed using an ultrasonic homogenizer. The composite film
is finally fabricated by casting and then evaporation solution of mixture on the plates [20].
There are several reports on the dielectric properties of ceramic–polymer
composites. Poly(vinylidene fluoride) or (PVDF) [11, 30-32] and its copolymer i.e.,
poly(vinylidene fluoride-co-trifluoroethylene) or P(VDF-TrFE) [12, 33] and poly(vinylidene
fluoride-co-hexafluoro-propylene) or P(VDF-HFP) [13, 34, 35] have been recognized as
the polymer matrix due to their relatively high dielectric and piezoelectric properties.
Dielectric properties of the composites have been studied in order to establish the mixing
rules of the dielectric activity of the composites which is dependent on the volumetric
fraction. Mao et al. [11] demonstrated that dielectric permittivity of BT/PVDF reached a
maximum value of 93 by using the particle size around 80-100 nm and 60 vol% of BT.
Dang et al. [30] studied 0-3 BT/PVDF nanocomposites which were prepared via natural
adsorption on the dielectric properties of the system. The dielectric permittivity of
nanocomposites was found to increase with increasing loading of barium titanate. The
dielectric permittivity of the composite with 50 vol% of BT measured at 1 kHz was 40.74.
Furthermore, a relative high permittivity of 5000 has been reported by Ghallabi et al. [36]
for addition of BT and multiwall carbon nanotubes (MWCNT) into PVDF matrix. This
material is a good candidate for embedded capacitor applications. Wegener et al. [13]
prepared 0-3 PZT/P(VDF-HFP) composites by solvent casting method. The improvement
in permittivity and piezoelectric coefficient were observed with incorporation of PZT. The
maximum of both values was 64.2 (0.58 PZT) and 11.3 pCN-1 (0.48 PZT), respectively.
Besides, the ceramic-polymer composite based soft elastomer was also studied by using
silicone rubber as polymer matrix. Gallone et al. [37] studied on dielectric and mechanical
properties of lead magnesium niobate–lead titanate (PMN-PT)/silicone rubber. The
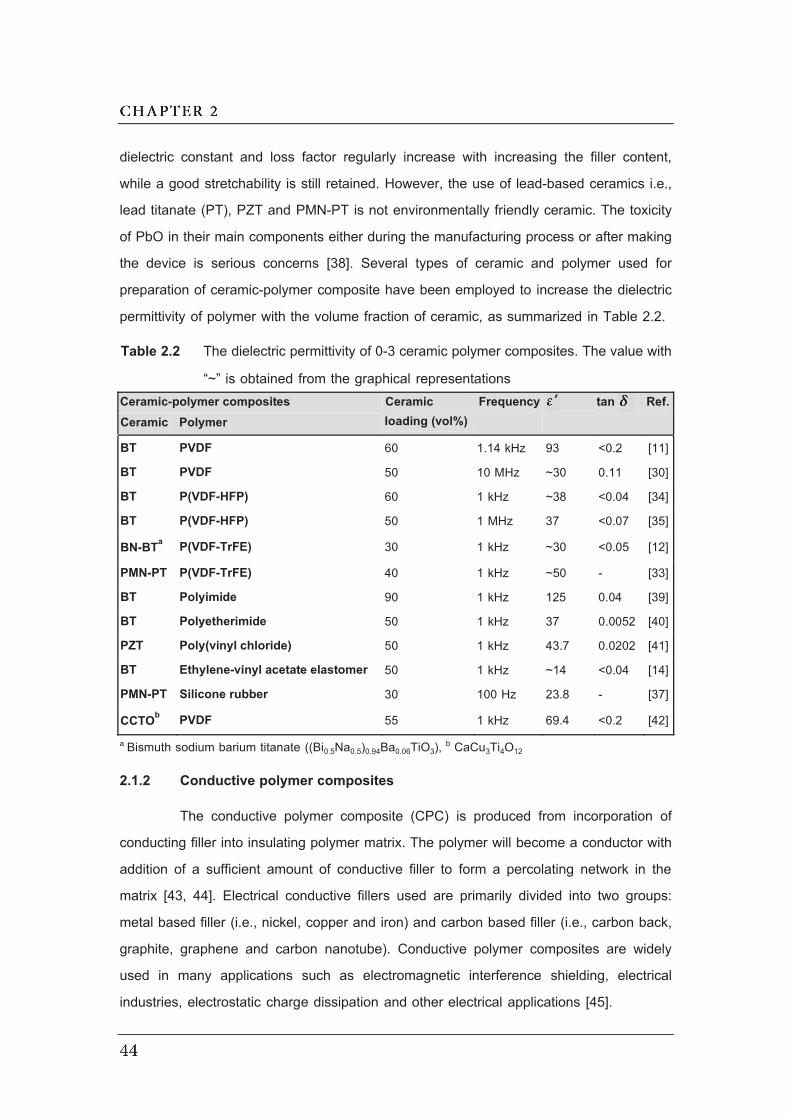
dielectric constant and loss factor regularly increase with increasing the filler content,
while a good stretchability is still retained. However, the use of lead-based ceramics i.e.,
lead titanate (PT), PZT and PMN-PT is not environmentally friendly ceramic. The toxicity
of PbO in their main components either during the manufacturing process or after making
the device is serious concerns [38]. Several types of ceramic and polymer used for
preparation of ceramic-polymer composite have been employed to increase the dielectric
permittivity of polymer with the volume fraction of ceramic, as summarized in Table 2.2.
Table 2.2 The dielectric permittivity of 0-3 ceramic polymer composites. The value with
“~” is obtained from the graphical representations Ceramic-polymer composites Ceramic
loading (vol%) Frequency tan Ref.
Ceramic Polymer
BT PVDF 60 1.14 kHz 93 <0.2 [11]
BT PVDF 50 10 MHz ~30 0.11 [30]
BT P(VDF-HFP) 60 1 kHz ~38 <0.04 [34]
BT P(VDF-HFP) 50 1 MHz 37 <0.07 [35]
BN-BTa P(VDF-TrFE) 30 1 kHz ~30 <0.05 [12]
PMN-PT P(VDF-TrFE) 40 1 kHz ~50 - [33]
BT Polyimide 90 1 kHz 125 0.04 [39]
BT Polyetherimide 50 1 kHz 37 0.0052 [40]
PZT Poly(vinyl chloride) 50 1 kHz 43.7 0.0202 [41]
BT Ethylene-vinyl acetate elastomer 50 1 kHz ~14 <0.04 [14]
PMN-PT Silicone rubber 30 100 Hz 23.8 - [37]
CCTOb PVDF 55 1 kHz 69.4 <0.2 [42] a Bismuth sodium barium titanate ((Bi0.5Na0.5)0.94Ba0.06TiO3), b CaCu3Ti4O12
2.1.2 Conductive polymer composites
The conductive polymer composite (CPC) is produced from incorporation of
conducting filler into insulating polymer matrix. The polymer will become a conductor with
addition of a sufficient amount of conductive filler to form a percolating network in the
matrix [43, 44]. Electrical conductive fillers used are primarily divided into two groups:
metal based filler (i.e., nickel, copper and iron) and carbon based filler (i.e., carbon back,
graphite, graphene and carbon nanotube). Conductive polymer composites are widely
used in many applications such as electromagnetic interference shielding, electrical
industries, electrostatic charge dissipation and other electrical applications [45].
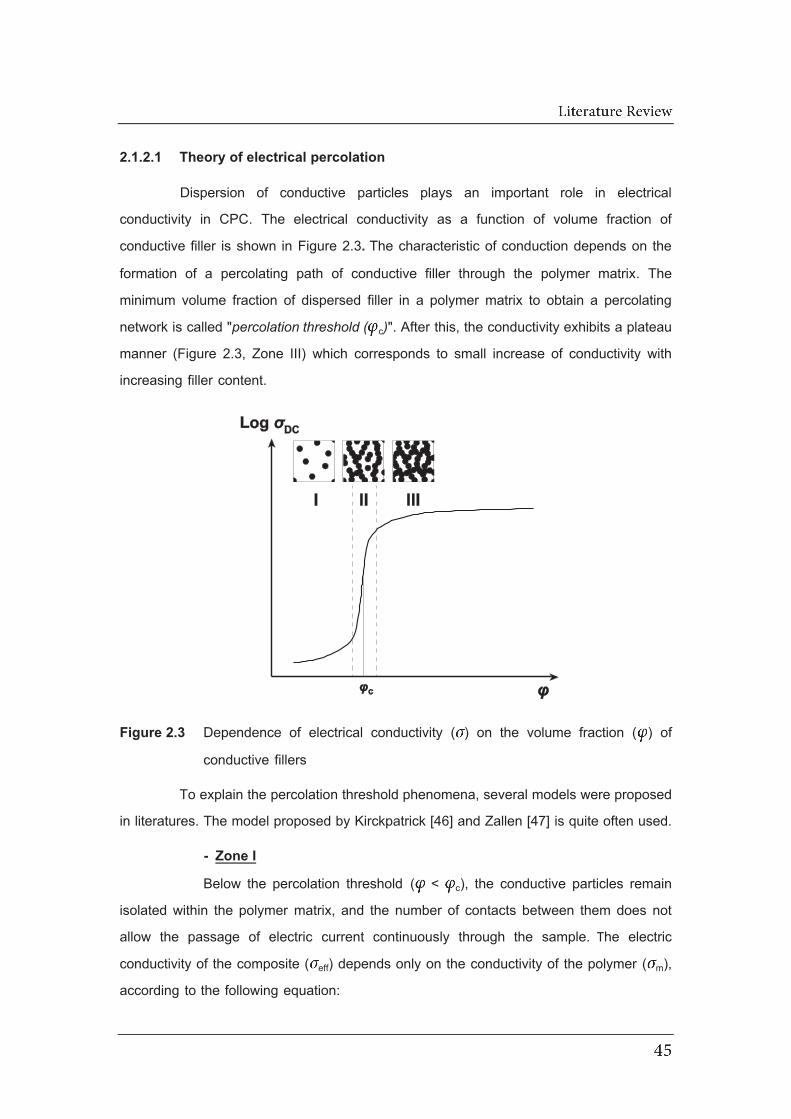
2.1.2.1 Theory of electrical percolation
Dispersion of conductive particles plays an important role in electrical
conductivity in CPC. The electrical conductivity as a function of volume fraction of
conductive filler is shown in Figure 2.3. The characteristic of conduction depends on the
formation of a percolating path of conductive filler through the polymer matrix. The
minimum volume fraction of dispersed filler in a polymer matrix to obtain a percolating
network is called "percolation threshold (( c)". After this, the conductivity exhibits a plateau
manner (Figure 2.3, Zone III) which corresponds to small increase of conductivity with
increasing filler content.
Figure 2.3 Dependence of electrical conductivity ( ) on the volume fraction ( ) of
conductive fillers
To explain the percolation threshold phenomena, several models were proposed
in literatures. The model proposed by Kirckpatrick [46] and Zallen [47] is quite often used.
- Zone I
Below the percolation threshold ( < c), the conductive particles remain
isolated within the polymer matrix, and the number of contacts between them does not
allow the passage of electric current continuously through the sample. The electric
conductivity of the composite ( eff) depends only on the conductivity of the polymer ( m),
according to the following equation:
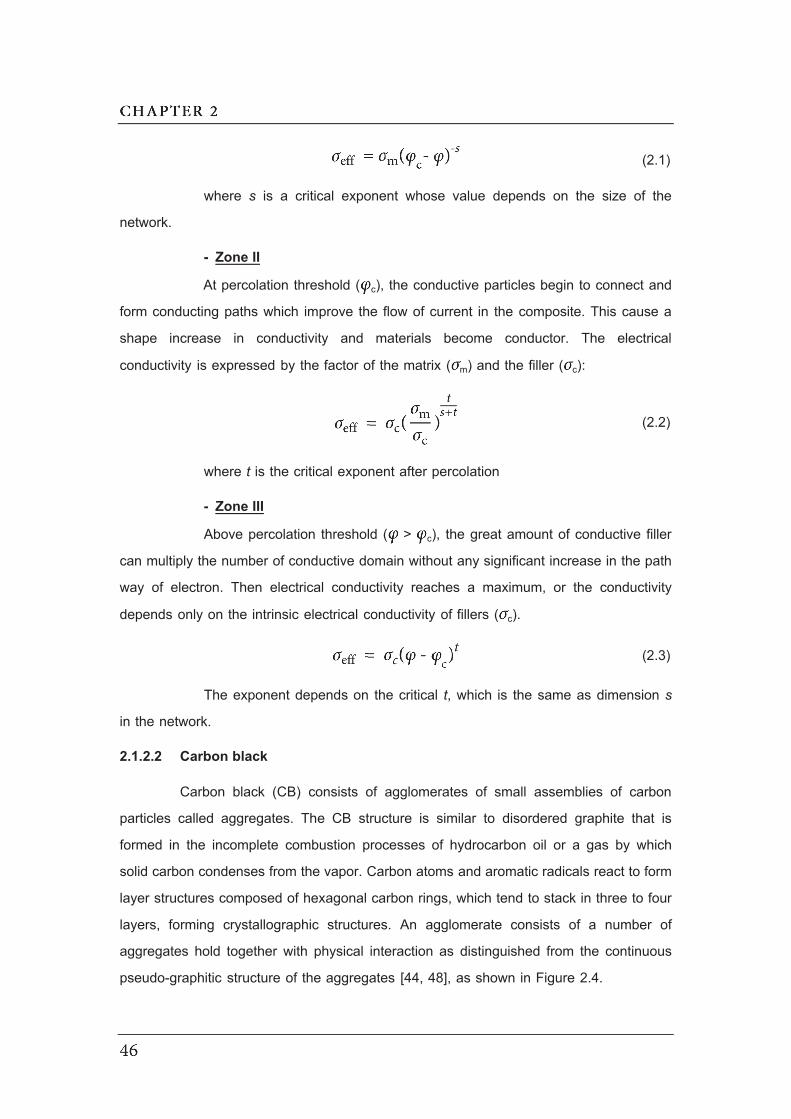
where s is a critical exponent whose value depends on the size of the
network.
- Zone II
At percolation threshold ( c), the conductive particles begin to connect and
form conducting paths which improve the flow of current in the composite. This cause a
shape increase in conductivity and materials become conductor. The electrical
conductivity is expressed by the factor of the matrix ( m) and the filler ( c):
where t is the critical exponent after percolation
- Zone III
Above percolation threshold ( > c), the great amount of conductive filler
can multiply the number of conductive domain without any significant increase in the path
way of electron. Then electrical conductivity reaches a maximum, or the conductivity
depends only on the intrinsic electrical conductivity of fillers ( c).
The exponent depends on the critical t, which is the same as dimension s
in the network.
2.1.2.2 Carbon black
Carbon black (CB) consists of agglomerates of small assemblies of carbon
particles called aggregates. The CB structure is similar to disordered graphite that is
formed in the incomplete combustion processes of hydrocarbon oil or a gas by which
solid carbon condenses from the vapor. Carbon atoms and aromatic radicals react to form
layer structures composed of hexagonal carbon rings, which tend to stack in three to four
layers, forming crystallographic structures. An agglomerate consists of a number of
aggregates hold together with physical interaction as distinguished from the continuous
pseudo-graphitic structure of the aggregates [44, 48], as shown in Figure 2.4.
(2.1)
(2.2)
(2.3)
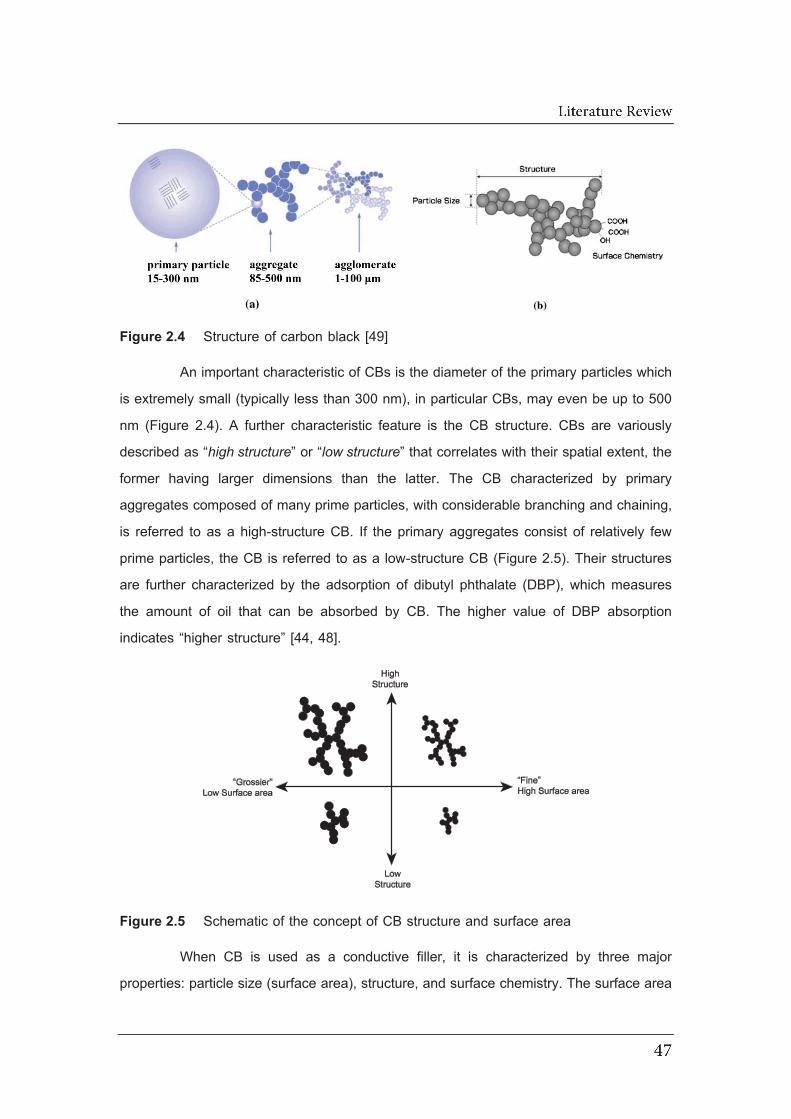
Figure 2.4 Structure of carbon black [49]
An important characteristic of CBs is the diameter of the primary particles which
is extremely small (typically less than 300 nm), in particular CBs, may even be up to 500
nm (Figure 2.4). A further characteristic feature is the CB structure. CBs are variously
described as “high structure” or “low structure” that correlates with their spatial extent, the
former having larger dimensions than the latter. The CB characterized by primary
aggregates composed of many prime particles, with considerable branching and chaining,
is referred to as a high-structure CB. If the primary aggregates consist of relatively few
prime particles, the CB is referred to as a low-structure CB (Figure 2.5). Their structures
are further characterized by the adsorption of dibutyl phthalate (DBP), which measures
the amount of oil that can be absorbed by CB. The higher value of DBP absorption
indicates “higher structure” [44, 48].
Figure 2.5 Schematic of the concept of CB structure and surface area
When CB is used as a conductive filler, it is characterized by three major
properties: particle size (surface area), structure, and surface chemistry. The surface area
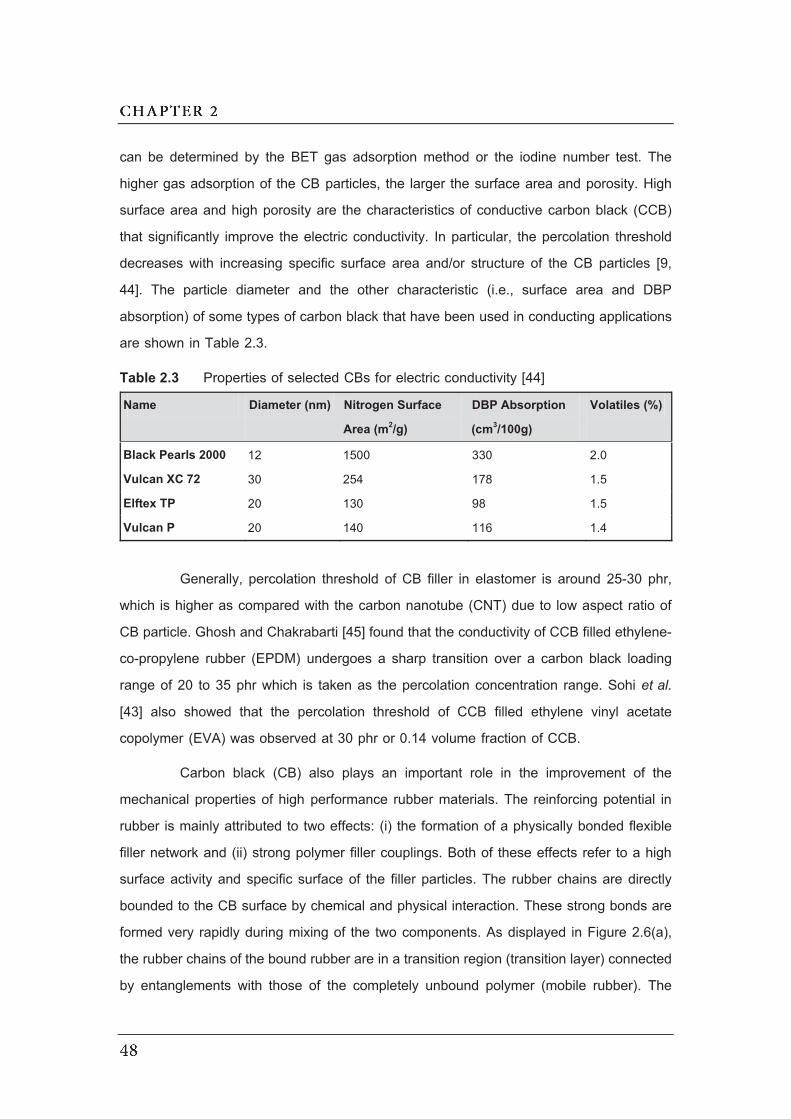
can be determined by the BET gas adsorption method or the iodine number test. The
higher gas adsorption of the CB particles, the larger the surface area and porosity. High
surface area and high porosity are the characteristics of conductive carbon black (CCB)
that significantly improve the electric conductivity. In particular, the percolation threshold
decreases with increasing specific surface area and/or structure of the CB particles [9,
44]. The particle diameter and the other characteristic (i.e., surface area and DBP
absorption) of some types of carbon black that have been used in conducting applications
are shown in Table 2.3.
Table 2.3 Properties of selected CBs for electric conductivity [44]
Name Diameter (nm) Nitrogen Surface
Area (m2/g) DBP Absorption
(cm3/100g)
Volatiles (%)
Black Pearls 2000 12 1500 330 2.0
Vulcan XC 72 30 254 178 1.5
Elftex TP 20 130 98 1.5
Vulcan P 20 140 116 1.4
Generally, percolation threshold of CB filler in elastomer is around 25-30 phr,
which is higher as compared with the carbon nanotube (CNT) due to low aspect ratio of
CB particle. Ghosh and Chakrabarti [45] found that the conductivity of CCB filled ethylene-
co-propylene rubber (EPDM) undergoes a sharp transition over a carbon black loading
range of 20 to 35 phr which is taken as the percolation concentration range. Sohi et al.
[43] also showed that the percolation threshold of CCB filled ethylene vinyl acetate
copolymer (EVA) was observed at 30 phr or 0.14 volume fraction of CCB.
Carbon black (CB) also plays an important role in the improvement of the
mechanical properties of high performance rubber materials. The reinforcing potential in
rubber is mainly attributed to two effects: (i) the formation of a physically bonded flexible
filler network and (ii) strong polymer filler couplings. Both of these effects refer to a high
surface activity and specific surface of the filler particles. The rubber chains are directly
bounded to the CB surface by chemical and physical interaction. These strong bonds are
formed very rapidly during mixing of the two components. As displayed in Figure 2.6(a),
the rubber chains of the bound rubber are in a transition region (transition layer) connected
by entanglements with those of the completely unbound polymer (mobile rubber). The

mobility of polymer segments is greatly restricted near the surface of filler [8, 9, 50]. The
polymer chains have been highly immobilized with thicknesses of the bound rubber layers
around 0.7 nm surrounding the CB particles [51]. The fillers covered by the immobilized
rubber interface, can be considered as physical cross-links. This provides network chains
for the rubber matrix in the proximity of carbon black particles [8, 52], as shown in Figure
2.6(b).
Figure 2.6 (a) Interface between the carbon black and the polymer [51]. (b) A schematic
diagram of the physical network in a carbon black filled elastomer [52].
The mobility of the polymer chains is restricted to some extent due to filler-
polymer interaction, depending on type of the polymers and fillers, and fillers distance
which is mainly controlled by the specific surface area and filler loading [50]. The amount
of immobilized rubber increases with the increasing content of carbon black. Stronger
polymer-filler interaction would result in a thicker rubber shell for small particle-sized CB
which is in combination with a larger interfacial area in the unit volume compound at the
same loading. This gives more immobilized rubber shell in comparison with large particle-
sized CB. It is well established that the immobilized rubber content of higher-structure
carbon black is significantly higher than its low-structure counterpart. This is probably due
to high structure CB is certainly related to the increased polymer-filler interfacial area and
greater adsorption ability of the freshly built surface during mixing [53].
2.2 Thermoplastic elastomer blends
Blending of polymers is an attractive way to develop new material by combining
two or more polymers in order to combine important characteristics of individual polymers,
resulting in improvements in mechanical strength, toughness, thermal stability, aging
resistance, etc [54, 55]. However, the difference in molecular structure and affinity of
blend component results in the immiscible blend. This has been recognized to cause both
inferior mechanical properties such as poor tensile strength, elongation at break and
compression set. For the immiscible blend, the blend morphology determines the physical
properties of the blend. The miscibility of the blend component is an important factor to
proper control the blend morphology which plays an important role in controlling the final
properties of the blend.
2.2.1 The miscibility of polymer blend
Basically, the interpenetration of polymer chains at the interfaces is very low
due to large interfacial tension or poor adhesion between two phases, resulting in a
macroscopic phase separation between the components. The concept of miscibility is
connected to the second law of thermodynamics, through the variation of free energy of
mixing GM, which is defined as follows [56]:
where HM is the change in enthalpy of mixing and SM is the change in entropy of
mixing and T is absolute temperature. For the miscibility of the mixture, it is necessary
that GM is negative ( GM < 0).
For polymer blends, the free energy of mixing is given by;
where R is the gas constant, i is volume fraction of component i, Ni is degree of
polymerization for component i and ij is Flory interaction parameter.
(2.4)
(2.5)
SM ; trends to 0 HM
Polymers generally have high degree of polymerization, Ni, and high molecular
weight. This contributes that SM is small and close to zero in most cases. When they
are blended together to form a blend, therefore, a phase-separated blend in terms of
thermodynamic occurs. Miscibility is an exception and exists only for very few polymer
combinations. The interaction parameter 12, can be determined by using solubility
parameters [57-59]:
where R is the gas constant, V is volume and i is solubility parameter of component i.
The enthalpy of mixing is expressed as follows by the energetic interactions between the
blend components:
Then, the enthalpic contribution part can be calculated through the difference in
solubility parameter of blend component [58, 60]:
For better miscibility, the polymers should have similar solubility parameters.
This is in accordance with the general rule that chemical and structural similarity favors
solubility. The difference in the solubility parameters 12 must be that < 0.2 (J/cm3)1/2
for mixing to take place on a molecular level [59, 61].
The miscibility can be achieved through stabilization of the morphology by using
compatibilizer or reactive blending. They can produce specific interaction such as covalent
bond or ionic bond formation at interface, or by attractive intermolecular interaction, e.g.,
dipole-dipole, ion-dipole, charge-transfer, H-bonding, van der Waals forces, etc. These
interactions promote interfacial adhesion and stabilize phase morphology. Thus, the
compatibilization either by compatibilizing agent and reactive blending can promote
optimum particle size formation of dispersed phase and prevent phase coalescence of
the dispersed phase during blending [56, 62], as shown in Figure 2.7.
(2.6)
(2.7)
(2.8)
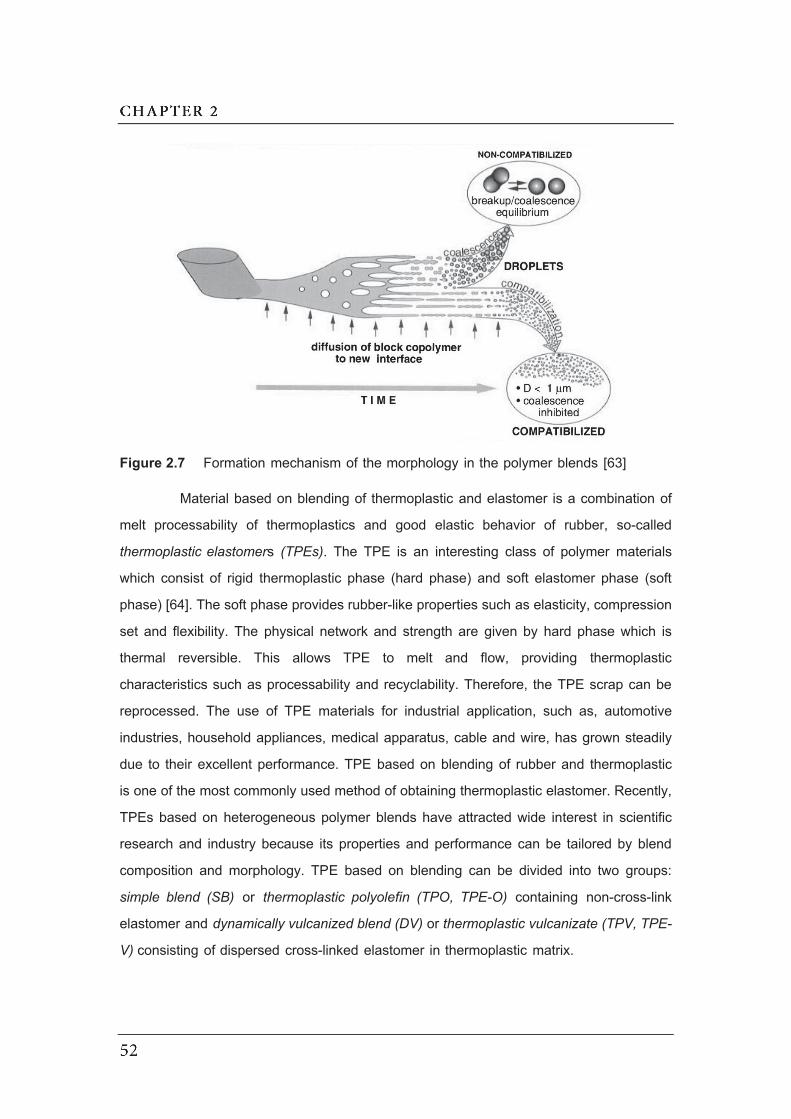
Figure 2.7 Formation mechanism of the morphology in the polymer blends [63]
Material based on blending of thermoplastic and elastomer is a combination of
melt processability of thermoplastics and good elastic behavior of rubber, so-called
thermoplastic elastomers (TPEs). The TPE is an interesting class of polymer materials
which consist of rigid thermoplastic phase (hard phase) and soft elastomer phase (soft
phase) [64]. The soft phase provides rubber-like properties such as elasticity, compression
set and flexibility. The physical network and strength are given by hard phase which is
thermal reversible. This allows TPE to melt and flow, providing thermoplastic
characteristics such as processability and recyclability. Therefore, the TPE scrap can be
reprocessed. The use of TPE materials for industrial application, such as, automotive
industries, household appliances, medical apparatus, cable and wire, has grown steadily
due to their excellent performance. TPE based on blending of rubber and thermoplastic
is one of the most commonly used method of obtaining thermoplastic elastomer. Recently,
TPEs based on heterogeneous polymer blends have attracted wide interest in scientific
research and industry because its properties and performance can be tailored by blend
composition and morphology. TPE based on blending can be divided into two groups:
simple blend (SB) or thermoplastic polyolefin (TPO, TPE-O) containing non-cross-link
elastomer and dynamically vulcanized blend (DV) or thermoplastic vulcanizate (TPV, TPE-
V) consisting of dispersed cross-linked elastomer in thermoplastic matrix.

2.2.2 Simple blend
Simple blend thermoplastic elastomer can be prepared by melt mixing of the
elastomer and thermoplastic without cross-linker. They are heterogeneous blend or
phase-separated system due to their large interfacial tension and different affinity.
Differently possible morphologies can be observed in a two-phase system, as shown in
Figure 2.8. This depends on blend composition, viscosity ratio, elasticity ratio and
interfacial tension.
Figure 2.8 The evolution of the morphology of simple blend with different blend
compositions
At a low concentration of the minor phase, the dispersion of minority in the
matrix is observed (Figure 2.8(a)). When quantity of the dispersed fraction increases, the
morphology changes from a dispersion of spherical drops in the matrix to interconnected
drops (Figure 2.8(b)). Increasing amount of the minor phase causes the first phase
inversion and there is no dispersed phase in the blend and the two phases become co-
continuous (Figure 2.8(c)). Further increases in the minor phase, the second phase
inversion occurs in which the minor phase becomes a matrix while the major phase
becomes a dispersed phase (Figure 2.8(d) and (e)). However, the co-continuous structure
provides the material with characteristics of thermoplastic elastomer based on the simple
blend. This can be explained in the terms of properties of the blend. In the case of a
dispersed elastomer in a continuous hard phase, the properties of the blend are
dominated by the plastic phase. Therefore, a brittle and tough polymer blends are
obtained. The co-continuous structure yields the product with characteristic of TPE that
offers strength and processability and the continuous soft phase offers the flexibility. While
a hard plastic dispersed in an elastomer phase, the blend has very low strength because
of the unvulcanized rubber and this blend is not strong enough for practical application.
2.2.3 Thermoplastic vulcanizate
Thermoplastic vulcanizates (TPVs) are prepared by a dynamic vulcanization
technique by adding curative during a mixing operation. The TPVs consist of dispersion
of vulcanized rubber domains in thermoplastic matrix, which differs from the simple
blends. The dynamic vulcanization occurs through two stages: first, a blending step
without crosslinking or simple blend, and second, a superimposed cross-linking and
mixing steps. The viscosity plays a significant role on formation of TPV morphology. When
the degree of vulcanization is high, the rubber particles may be broken into micron size
of elastomeric particles. The dynamic vulcanization of rubber phase in the plastic matrix
leads to formation of materials with improved properties of high elasticity, while
thermoplastic phase provides the melt processing. The varieties of TPVs have already
found commercial applications, especially in the automotive sector [59, 65, 66].
In the first blending step, the morphology of both phases changes to co-
continuous structure (Figure 2.9(a)). The continuous mixing leads to formation of smaller
grains of co-continuous structure under the action of shear and elongational stresses on
a highly viscous co-continuous structure (Figure 2.9(b)). After addition of curatives,
viscosity of the rubber phase quickly increases and the co-continuous structure is
deformed by shearing process (Figure 2.9(c)). The break-up mechanism of the highly
deformed co-continuous structure happens after the blend reached a critical stress from
increased viscosity, which results in dispersion of the cross-linked rubber phase in the
thermoplastic matrix. With the high amount of crosslinks in rubber, the rubber phase will
break up into a finely dispersed particles morphology (Figure 2.9(d) and (e)) [59, 66, 67].
This is the moment where the co-continuous morphology is transformed into a dispersed-
matrix phase, which depends on blend composition, viscosity and elasticity ratio,
processing condition and cross-linking condition. Therefore, TPV morphology typically
consists of the cross-linked rubber particles finely dispersed in the thermoplastic matrix.
However, at high content of rubber phase or rubber-rich TPV, the cross-linking is
insufficient to enforce phase inversion and it is commonly difficult to separate rubber
particles in rubber-rich TPV.
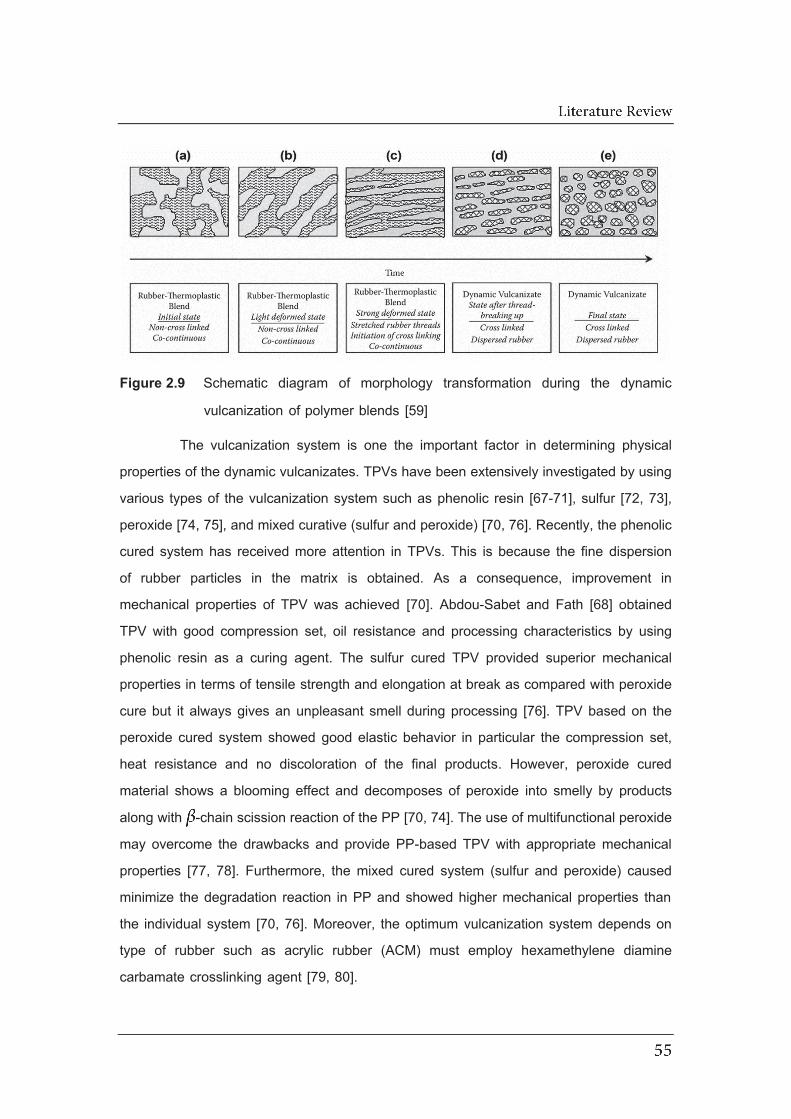
Figure 2.9 Schematic diagram of morphology transformation during the dynamic
vulcanization of polymer blends [59]
The vulcanization system is one the important factor in determining physical
properties of the dynamic vulcanizates. TPVs have been extensively investigated by using
various types of the vulcanization system such as phenolic resin [67-71], sulfur [72, 73],
peroxide [74, 75], and mixed curative (sulfur and peroxide) [70, 76]. Recently, the phenolic
cured system has received more attention in TPVs. This is because the fine dispersion
of rubber particles in the matrix is obtained. As a consequence, improvement in
mechanical properties of TPV was achieved [70]. Abdou-Sabet and Fath [68] obtained
TPV with good compression set, oil resistance and processing characteristics by using
phenolic resin as a curing agent. The sulfur cured TPV provided superior mechanical
properties in terms of tensile strength and elongation at break as compared with peroxide
cure but it always gives an unpleasant smell during processing [76]. TPV based on the
peroxide cured system showed good elastic behavior in particular the compression set,
heat resistance and no discoloration of the final products. However, peroxide cured
material shows a blooming effect and decomposes of peroxide into smelly by products
along with -chain scission reaction of the PP [70, 74]. The use of multifunctional peroxide
may overcome the drawbacks and provide PP-based TPV with appropriate mechanical
properties [77, 78]. Furthermore, the mixed cured system (sulfur and peroxide) caused
minimize the degradation reaction in PP and showed higher mechanical properties than
the individual system [70, 76]. Moreover, the optimum vulcanization system depends on
type of rubber such as acrylic rubber (ACM) must employ hexamethylene diamine
carbamate crosslinking agent [79, 80].
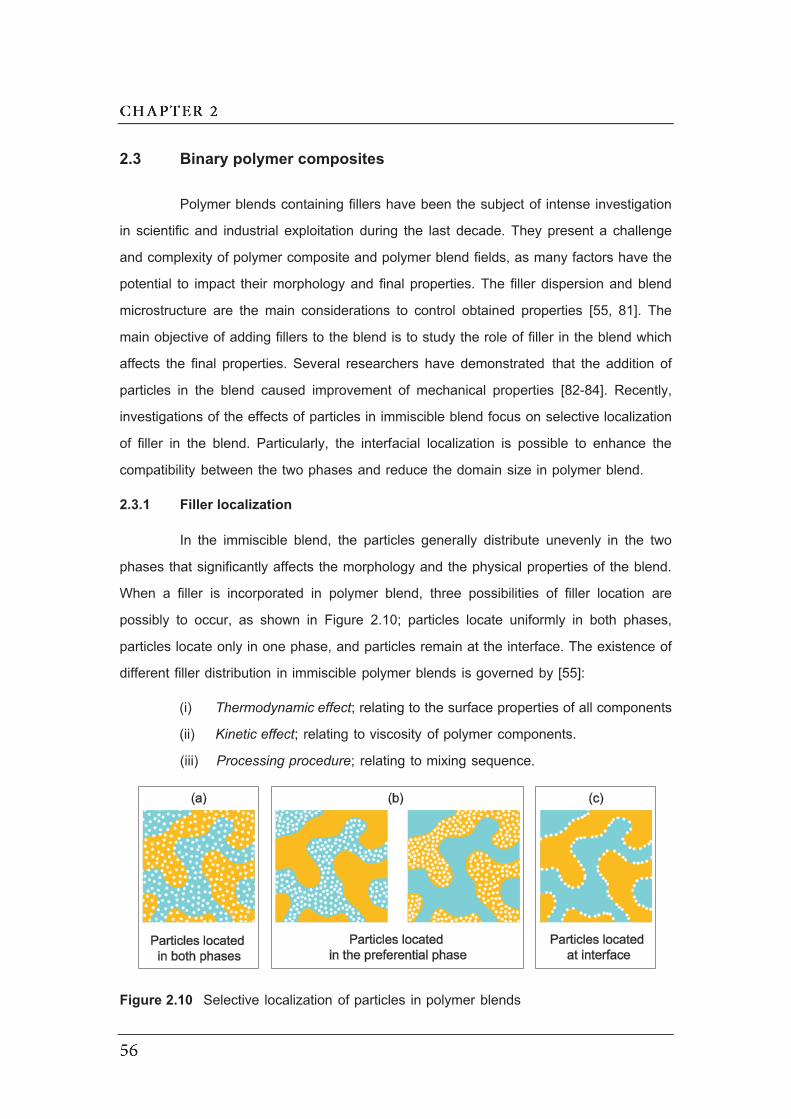
2.3 Binary polymer composites
Polymer blends containing fillers have been the subject of intense investigation
in scientific and industrial exploitation during the last decade. They present a challenge
and complexity of polymer composite and polymer blend fields, as many factors have the
potential to impact their morphology and final properties. The filler dispersion and blend
microstructure are the main considerations to control obtained properties [55, 81]. The
main objective of adding fillers to the blend is to study the role of filler in the blend which
affects the final properties. Several researchers have demonstrated that the addition of
particles in the blend caused improvement of mechanical properties [82-84]. Recently,
investigations of the effects of particles in immiscible blend focus on selective localization
of filler in the blend. Particularly, the interfacial localization is possible to enhance the
compatibility between the two phases and reduce the domain size in polymer blend.
2.3.1 Filler localization
In the immiscible blend, the particles generally distribute unevenly in the two
phases that significantly affects the morphology and the physical properties of the blend.
When a filler is incorporated in polymer blend, three possibilities of filler location are
possibly to occur, as shown in Figure 2.10; particles locate uniformly in both phases,
particles locate only in one phase, and particles remain at the interface. The existence of
different filler distribution in immiscible polymer blends is governed by [55]:
(i) Thermodynamic effect; relating to the surface properties of all components
(ii) Kinetic effect; relating to viscosity of polymer components.
(iii) Processing procedure; relating to mixing sequence.
Figure 2.10 Selective localization of particles in polymer blends
2.3.1.1 Thermodynamic effect
When fillers are introduced into a polymer blend, they generally tend to migrate
to the phase which have the better affinity, in a thermodynamic sense. The affinity
between filler and polymer is considered by using the concept of surface tension, which
contributes to the localization of the filler in the blend [55]. Sumita et al. [85] applied the
wettability coefficient to predict the phase for which the filler would have the greatest
affinity. This coefficient reflects the ability of filler to be wetted by one or the other of the
polymer phases. The wetting can be calculated from the following equation [86, 87];
where filler-2 and filler-1 are the interfacial tension between filler and polymer 2, and
between filler and polymer 1, 1-2 is the interfacial tension between polymer 1 and polymer
2. The localization of filler depends on the value of , three cases are possible.
- If > 1, the filler preferentially locates in the polymer 1
- If < -1, the filler preferentially locates in the polymer 2
- If -1 < < 1, the filler locates at interface between two phases
The values of interfacial tensions of component can be evaluated by using the
Harmonic-mean equation [87]:
where i is the surface tension of component i,
id and
ip are the dispersive and polar
part of surface tension of component i, respectively.
Experimentally, the localization of silica particles in polystyrene (PS) and
polypropylene (PP) blends [88] and in EVA/PP blends [89] have been successfully
predicted by wetting coefficient. Wetting parameter ( ) is equal to 4.87 and 8.0 for the
hydrophilic silica in PS/PP and EVA/PP, respectively. Therefore, the particles should be
preferentially located in the PS and EVA. These predictions are confirmed by transmission
electron microscopy. Martin et al. [90] also studied the localization of silica in PP/EPDM
blends. It was found that hydrophilic silica particles migrate within the elastomeric phase,
(2.9)
(2.10)
whereas hydrophobic particles can be found at the interface and EPDM phase. The good
agreements between thermodynamic prediction and morphology observation of particle
localization in the immiscible blend were also observed in the blending of polylactide
(PLA) and poly( -caprolactone) (PCL) containing organoclay [91] and in the blending of
polypropylene (PP) and poly(ethylene terephthalate) (PET) with organoclay [92].
2.3.1.2 Kinetic factor
Surface tension has been an important parameter of the blend components to
control the location of particles in the two phases. That is, fillers should localize within the
phase which has the largest affinity. However, the localization of filler does not only
depends on interfacial energy of polymer and filler. In some cases, the physical properties
of polymer contribute to selective localization of filler in the blend. This factor is classified
as “kinetic effect”, which is directly related to the shear viscosity of polymer during the
blends. When the difference of viscosity of polymer is very large, the filler is preferentially
located within the lower viscosity polymer [55, 86]. Wu et al. [91] found that the selective
localization of clay in the blend of polylactide/poly( -caprolactone) or PLA/PCL agrees
with thermodynamically prediction. In TEM observation of CNT, it located in the PCL
phase. However, this is contrary to the thermodynamically prediction because high
viscosity ratio between PLA and PCL is the dominant driving force of the PCL localization
despite higher affinity to the PLA phase. However, with reduced viscosity ratios, the
thermodynamical aspects become the dominant role, and the CNTs change their
localization from the PCL to the PLA phase. It is noted that the viscosity effect dominate
only when small difference of affinity between two polymers and filler is encountered.
Particle-polymer affinity is considered as the dominate factor only when the viscosity ratio
of both polymer phase is nearly one [86, 93].
2.3.1.3 Processing factor
Processing factor related to the sequence of addition of the component. There
are three main mixing procedures which are commonly used in the literatures [55, 86].
First, the most commonly method is incorporation of the two polymers and filler together
in the mixing. The second method is mixing of two polymers prior to adding filler in the
blender. The third method is preparation of filler masterbatch in one polymer before mixing
with the second polymer. Shi et al. [87] prepared CNT/EVA and CNT/poly(L-lactide)
(PLLA) master batches for diluting in PLLA and EVA, respectively. The result showed that
CNT located in EVA phase when using CNT/EVA master batch even the proposed
thermodynamic prediction resulted in a localization of CNTs in PLLA phase. The
localization at interface of CNTs was observed if CNT/PLLA master batch was used. This
is attributed to high viscosity of PLLA, which led to preventing the migration of particles
into PLLA phase. They also found that the localization of CNTs at interface results in
lower electrical resistivity than the localization in the one phase. Baudouin et al. [94]
observed that morphology of the polyamide/ethylene and methyl acrylate or PA/EMA
blend filled with MWCNT depended on the mixing sequence. MWCNTs should be
localized at the interface between both polymers as predicted by thermodynamics.
However, the MWCNTs are localized in the PA phase when they are premixed with the
PA and they are localized at the interface when MWCNTs are premixed with EMA. There
are two possible reasons, either the system did not reach the thermodynamic equilibrium
or the thermodynamic is modified during the premixing step. This indicates that the mixing
sequence play a role for to localization of particle in immiscible blends.
2.3.2 Compatibilization effect of particles
It has been well-known that the compatibilization of multi-phases can be
achieved by using block copolymer to act as emulsifier in the blend, leading to an
improved dispersion and the interfacial adhesion between two immiscible polymers. In
addition, the use of nanoparticles in polymer blend can act as compatibilizing agents with
reducing domain size in immiscible polymer blends. The fillers presented at the interface
between two phases are evident compatibilizing effect for using filler as compatibilizer.
This also enhances the interfacial adhesion which is very important for mechanical
properties of the blend. Elias et al. [81] introduced nano-silica in PP/EVA to study domain
size of polymer blend. A significant reduction of the EVA droplet size was observed in the
presence of hydrophilic and hydrophobic silica. The volume droplet radius decreases from
2.2 m to nearly 0.5 m for filled blends with 3 wt% silica. Hong et al. [95] also found that
the domain size PE phase in polybutylene terephthalate (PBT)-rich blend was reduced
upon addition of organoclay in PBT/PE blend. The localization of organoclay at the
interface hydrodynamically stabilized the blend morphology by suppressing the
coalescence of the droplet. However, in the PBT/clay droplet, the domain size tends to
increase with increasing addition of organoclay, because the likelihood of breakup of the
droplets against hydrodynamic force is decreased by the consequent reduction in
deformability of the droplets. The reduction in domain size in the blend containing carbon
nanotube was also reported by Wu et al. [83]. With addition of MWCNT in PCL/PLA blend,
the size of the discrete PLA domain was reduced remarkably. The interface localization
of MWCNT can improve mechanical properties of immiscible PCL/PLA blend. Bitinis et al.
[96] reported that organoclay preferentially located at the polymer interface in the PLA/NR
blend. This localization of organoclay acted as compatibilisers for the blend, which prevent
the coalescence of NR droplets.
2.4 Natural rubber
Europeans discovered the use of rubber in Central American and South
American Indians in the sixteenth and seventeenth centuries. The first scientific study of
rubber was undertaken by Charles de la Condamine, when he encountered it during his
trip to Peru in 1735. He also creates the French word rubber from the "cao-tchu" which
means "wood crying” for Indian expression. The tree called Hevea brasiliensis is the
world’s number one source for natural rubber (NR) which has unique in its chemical
structure and cannot be replaced by synthetic rubber. Nowadays, NR is the most well-
known rubber and exhibits an excellent in mechanical properties, including good
resilience, very low heat build-up, good electrical insulation and good resistance to
abrasion, tear and fatigue. Consequently, it is a strategically important raw material used
in tire, automotive, adhesive, footwear and other typical elastomer applications including
medical devices. NR molecules can crystallize when stretched, so-called stress-induced
crystallization due to high degree of stereo-regularity in NR structure. This contributes to
enhance modulus on the stretching process. However, like most of hydrocarbon diene-
based rubbers, NR is easily attacked by ozone and organic solvent, being unsuitable
properties in specific industrial applications [97]. Therefore, it is well established that the
properties of rubber can be improved either by chemically modifying or blending with
specific elastomer or polymer. Modification of natural rubber by introducing new atom can
be prepared such as epoxidized natural rubber (ENR), chlorinated natural rubber,
maleated natural rubber (MNR) and natural rubber grafted polystyrene as well as
changing of intermolecular chain of NR without new atom such as hydrogenated natural
rubber [98].

2.4.1 Epoxidized natural rubber
The epoxidation of NR and unsaturated polymer was stated to increase solvent
resistance and mechanical properties. It is one of the most promising methods to modify
chemical structure of polydiene by transforming double bond into epoxy-group. The in situ
epoxidation of NR latex using peracid with elevated temperature to yield epoxidized
natural rubber (ENR) [99], as shown in Figure 2.11. The epoxidation method commonly
used today is addition of formic acid and hydrogen peroxide to form performic acid in situ
in the latex solution. The relative low cost of reagents and latex state reaction make
epoxidation is an attractive route for rubber modification.
Figure 2.11 The mechanism for epoxidation of natural rubber [100]
Two grades of commercially available ENR have 25 mol % and 50 mol% of
modification. The properties of natural rubber are changed gradually as one increases
the degree of epoxidation. The glass transition temperature increased linearly with
increasing of epoxidation level. Gelling [99] reported that every mole percent increase in
epoxidation, the glass trasition temperature increased by 0.93°C. The modification of
epoxy-group into NR molecular also improves oil resistance and low permeability of gas.
The presence of oxirane ring in ENR significantly increases polarity and solubility
parameter, which are important factors for oil resistance and compatibility in polymer
having polar groups [98]. The solubility parameters of NR and ENR with 25 and 50 mo%
epoxide are reported as 16.5, 17.4, and 18.2 (J/cm3)1/2, respectively [101, 102].
Furthermore, The ENR is one of the modified natural rubber which retains strain-induced
crystallization process for excellent physical properties. A strain induced crystallization of
ENRs remains almost constant up to 50 mol% of epoxidation level. This is explained by
the fact that ENRs are stereoregular, the cis configuration being preserved during the
epoxidation process. It is also reported that oil resistance of ENR-50 in hydrocarbon fluid
is between polychloroprene (CR) and acrylonitrile butadiene rubber (NBR). Hence, the
ENR-50 can be used to replace NBR in many applications such as oil suction hose, seals,
oil-well pipe protectors and so on [98, 99].
2.4.2 Composites and polymer blends based on ENR
ENR consists of epoxide groups which are reactive to polar functional group of
filler. Thus, ENR is widely used in polymer composite to improve mechanical properties
and dispersion of filler [103]. It is well-known that ENR has the ability to be reinforced
with silica and carbon black due to the chemical bond formation between epoxy group in
ENR and functional group on surface of silica and carbon black. This leads to increases
storage modulus, which corresponds to restricted movement of polymer chain at filler
surface [104].
Blending of thermoplastic and natural rubber is well known to prepare
thermoplastic natural rubber (TPNR) materials [105]. A variety of thermoplastics have
been selected to blend with NR and its modified forms (i.e., MNR and ENR). These are
polypropylene (PP) [69, 70, 77], polyethylene (PE) [106, 107], poly(vinyl chloride) (PVC)
[108], poly(methylmethacrylate) (PMMA) [72], polyamide (PA) [109] and thermoplastic
polyurethane (TPU) [ 1 1 0 , 1 1 1 ] . The TPNR based on ENR has been demonstrated to
improve compatibility with polar polymer and its oil resistance. Narathichat et al. [109]
prepared the reactive blending of ENR with Nylon-12. The strong interaction between
epoxide group in ENR and polar functional group in Nylon-12 leads to enhanced
mechanical properties and obtained finer grain morphology as compared with the use of
unmodified natural rubber. Kalkornsurapranee et al. [110] reported that the blending of
ENR and PU exhibited excellent in oil and heat resistance as compared with super TPV
and EPDM/PP TPV in the market.
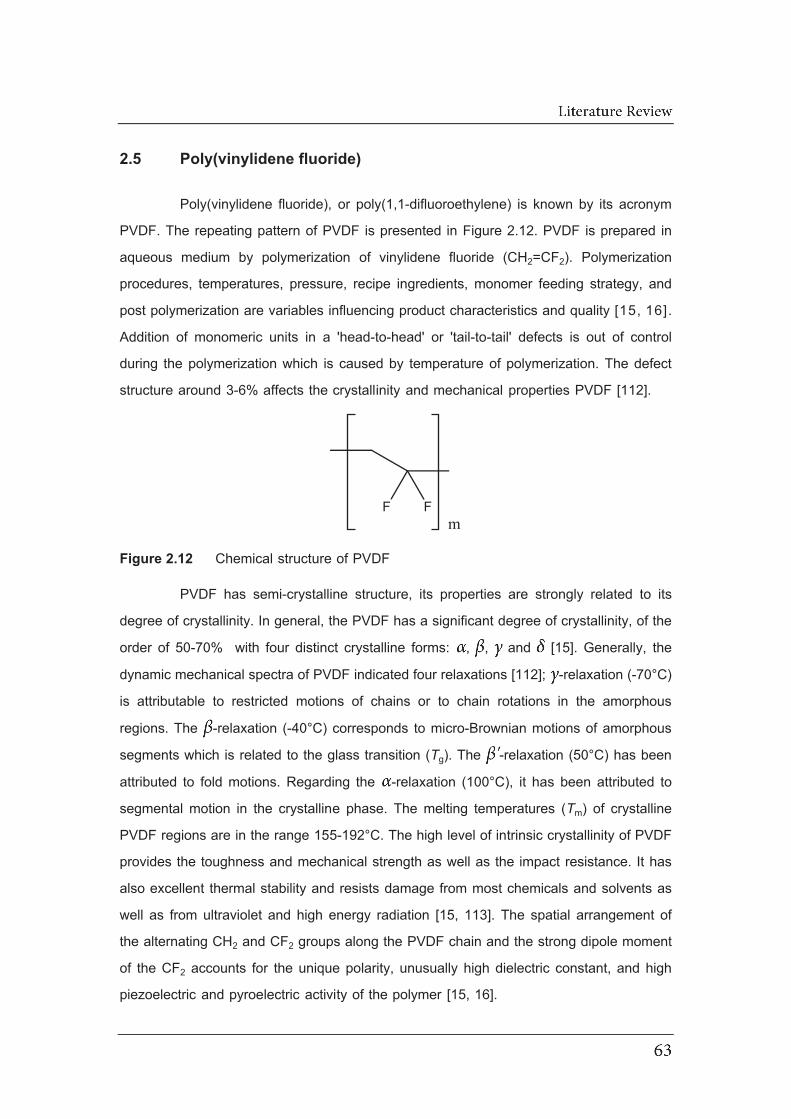
2.5 Poly(vinylidene fluoride)
Poly(vinylidene fluoride), or poly(1,1-difluoroethylene) is known by its acronym
PVDF. The repeating pattern of PVDF is presented in Figure 2.12. PVDF is prepared in
aqueous medium by polymerization of vinylidene fluoride (CH2=CF2). Polymerization
procedures, temperatures, pressure, recipe ingredients, monomer feeding strategy, and
post polymerization are variables influencing product characteristics and quality [15, 16]. Addition of monomeric units in a 'head-to-head' or 'tail-to-tail' defects is out of control
during the polymerization which is caused by temperature of polymerization. The defect
structure around 3-6% affects the crystallinity and mechanical properties PVDF [112].
Figure 2.12 Chemical structure of PVDF
PVDF has semi-crystalline structure, its properties are strongly related to its
degree of crystallinity. In general, the PVDF has a significant degree of crystallinity, of the
order of 50-70% with four distinct crystalline forms: , , and [15]. Generally, the
dynamic mechanical spectra of PVDF indicated four relaxations [112]; -relaxation (-70°C)
is attributable to restricted motions of chains or to chain rotations in the amorphous
regions. The -relaxation (-40°C) corresponds to micro-Brownian motions of amorphous
segments which is related to the glass transition (Tg). The -relaxation (50°C) has been
attributed to fold motions. Regarding the -relaxation (100°C), it has been attributed to
segmental motion in the crystalline phase. The melting temperatures (Tm) of crystalline
PVDF regions are in the range 155-192°C. The high level of intrinsic crystallinity of PVDF
provides the toughness and mechanical strength as well as the impact resistance. It has
also excellent thermal stability and resists damage from most chemicals and solvents as
well as from ultraviolet and high energy radiation [15, 113]. The spatial arrangement of
the alternating CH2 and CF2 groups along the PVDF chain and the strong dipole moment
of the CF2 accounts for the unique polarity, unusually high dielectric constant, and high
piezoelectric and pyroelectric activity of the polymer [15, 16].
2.5.1 Composites and polymer blends based on PVDF
PVDF and its copolymer have been extensively used for composites and blend
because of its potential applications to high dielectric permittivity, and unique piezoelectric,
and ferroelectric properties. As mentioned above, a lot of investigations have been
focused on the development of polymer/ceramics composites by using ferroelectric
ceramics as fillers in PVDF to increase dielectric permittivity of composite [11, 30, 32].
Incorporation of other types of fillers into PVDF matrix has been studied with the objective
to improve its properties, such as mechanical and thermal properties. Priya and Jog [114]
prepared PVDF/clay nanocomposite by melt intercalation with organophilic clay. The
addition of clay significantly enhanced rate of crystallization and storage modulus. He et
al. [115] reported that incorporation of graphite in PVDF might act as a nucleating agent
and accelerated the overall non-isothermal crystallization process of PVDF. The storage
modulus and the dielectric constant of the composites increased linearly with graphite
concentration.
PVDF exhibits thermodynamic compatibility with other polymers and blends of
PVDF with various other homopolymers were extensively investigated. It has been
reported that PVDF was miscible with polymethylmethacrylate (PMMA) [116, 117].
Pimbert et al. [117] revealed miscibility of PVDF/PMMA which is confirmed by DSC and
DMA. They supposed that specific interaction between PMMA and PVDF were consistent
with strong dipole-dipole interaction between the carbonyl group of PMMA and ‘acidic’
hydrogen atom in PVDF. PVDF was also used to prepare thermoplastic elastomer blend
including simple blend and dynamically vulcanized blend. Li et al. [79] prepared
thermoplastic elastomer based on PVDF/ACM blend which showed only one glass
transition temperature due to single-phase nature. It was also found that thermoplastic
elastomer based on PVDF/ACM blends showed excellent elongation at break, strain
recovery, and heat and oil resistances. Wang et al. [113] studied the blends of
poly(vinylidene fluoride) (PVDF) and silicone rubber, which were prepared through
dynamic vulcanization. It was found that the cross-linked spherical SR particles with an
average diameter of 2-4 m formed a “network” in the PVDF continuous phase.
2.6 Conclusions
The first part of this literature review indicates the importance of polymer
composites which are widely used in many applications. The incorporation of fillers in
polymer can achieve higher levels of performance than those of the unfilled matrix
(increased modulus, increased strength, increased conductivity and increased
permittivity). Recently, the preparation of polymer composites for electronic applications
has received great interest. The improvement of dielectric permittivity and electrical
conductivity can be obtained by using ceramic and carbon black as fillers, respectively.
The challenge is to increase permittivity and reduce percolation threshold of composites
as much as possible for financial reasons and physical properties.
The second part shows the advantage of thermoplastic elastomer (TPE) blends
for being good elasticity and processability. The simple blend can be prepared by melt
mixing of the elastomer and thermoplastic without cross-linker whereas the preparation
of thermoplastic vulcanizates uses cross-linker during blending process. Their properties
mainly depended on phase development and miscibility of the blend. The TPE based on
natural rubber has been studied extensively over the past decades, which is well known
as thermoplastic natural rubber (TPNR). Furthermore, the addition of filler in immiscible
blends is considered to bring new properties to the material. Many researchers
demonstrated that the particles distribute unevenly in binary system. Three possibilities
of filler location are possibly to occur in the blends. That is, particles locate uniformly in
both phase, particles locate only in one phase and particles remain at the interface.
Selective localization of filler in the blend requires a good understanding, which is govern
by thermodynamic effect, kinetic effect and processing procedure. It would be interesting
to study incorporation of particles in immiscible blends. Particularly, interfacial localization
caused improvement compatibility and mechanical properties of the blends.

2.7 References
[1] Xanthos, M. 2010. Polymers and polymer composites, in Functional Fillers for
Plastics, M. Xanthos, ed. Wiley-VCH Verlag GmbH & Co. KGaA, Weinheim.
[2] Leblanc, J.L. 2009. Filled Polymers: Science and Industrial Applications. CRC
Press, Boca Raton.
[3] Tjong, S.C. 2006. Structural and mechanical properties of polymer
nanocomposites. Mater. Sci. Eng. R. 53, 73-197.
[4] Abraham, R., Thomas, S.P., Kuryan, S., Isac, J., Varughese, K.T. and Thomas,
S. 2009. Mechanical properties of ceramic-polymer nanocomposites. Express
Polym. Lett. 3, 177-189.
[5] Choi, S.S. and Kim, I.S. 2002. Filler-polymer interactions in filled polybutadiene
compounds. Eur. Polym. J. 38, 1265-1269.
[6] Luo, Y.Y., Wang, Y.Q., Zhong, J.P., He, C.Z., Li, Y.Z. and Peng, Z. 2011.
Interaction between fumed-silica and epoxidized natural rubber. J. Inorg.
Organomet. P. 21, 777-783.
[7] Ten Brinke, J.W., Litvinov, V.M., Wijnhoven, J.E.G.J. and Noordermeer, J.W.M.
2002. Interactions of Stober silica with natural rubber under the influence of
coupling agents, studied by 1H NMR T2 relaxation analysis. Macromolecules. 35,
10026-10037.
[8] Litvinov, V.M., Orza, R.A., Klüppel, M., Van Duin, M. and Magusin, P.C.M.M.
2011. Rubber-filler interactions and network structure in relation to stress-strain
behavior of vulcanized, carbon Black filled EPDM. Macromolecules. 44, 4887-
4900.
[9] Klüppel, M., Schroüder, A. and Heinrich, G. 2007. Carbon black, in Physical
Properties of Polymers Handbook, J.E. Mark, ed. Springer, New York.
[10] Dang, Z.M., Yuan, J.K., Zha, J.W., Zhou, T., Li, S.T. and Hu, G.H. 2012.
Fundamentals, processes and applications of high-permittivity polymer matrix
composites. Prog. Mater. Sci. 57, 660-723.
[11] Mao, Y.P., Mao, S.Y., Ye, Z.G., Xie, Z.X. and Zheng, L.S. 2010. Size-
dependences of the dielectric and ferroelectric properties of BaTiO3/polyvinylidene
fluoride nanocomposites. J. Appl. Phys. 108, 014102.

[12] Wang, X.X., Lam, K.H., Tang, X.G. and Chan, H.L.W. 2004. Dielectric
characteristics and polarization response of lead-free ferroelectric
(Bi0.5Na0.5)0.94Ba0.06TiO3-P(VDF-TrFE) 0-3 composites. Solid State Commun. 130,
695-699.
[13] Wegener, M. and Arlt, K. 2008. PZT/P(VDF-HFP) 0-3 composites as solvent-cast
thin films: preparation, structure and piezoelectric properties. J. Phys. D: Appl.
Phys. 41, 165409.
[14] Huang, X., Xie, L., Jiang, P., Wang, G. and Liu, F. 2009. Electrical, thermophysical
and micromechanical properties of ethylene-vinyl acetate elastomer composites
with surface modified BaTiO3 nanoparticles. J. Phys. D: Appl. Phys. 42, 245407.
[15] Ameduri, B. 2009. From vinylidene fluoride (VDF) to the applications of VDF-
containing polymers and copolymers: recent developments and future trends.
Chem. Rev. 109, 6632-6686.
[16] Mark, H.F. 2007. Encyclopedia of Polymer Science and Technology. 3rd ed. Wiley-
Interscience, New York.
[17] Ramajo, L., Reboredo, M. and Castro, M. 2005. Dielectric response and relaxation
phenomena in composites of epoxy resin with BaTiO3 particles. Compos. Part A:
Appl. S. 36, 1267-1274.
[18] Shonaike, G.O. 2003. Gas Barrier properties of polymeric materials, in Advanced
Polymeric Materials : Structure Property Relationships, G.O. Shonaike and S.G.
Advani, eds. CRC Press, Boca Raton.
[19] Nam, J.D., Choi, H.R., Koo, J.C., Lee, Y.K. and Kim, K.J. 2007. Dielectric
elastomers for artificial muscles, in Electroactive Polymers for Robotic Applications:
Artificial Muscles and Sensors, K.J. Kim and S. Tadokoro, eds. Springer, London.
[20] Dias, C.J. and Das-Gupta, D.K. 1996. Inorganic ceramic/polymer ferroelectric
composite electrets. IEEE T. Dielect. El. In. 3, 706-734.
[21] Dias, C.J., Igreja, R., Marat-Mendes, R., Inacio, P., Marat-Mendes, J.N. and Das-
Gupta, D.K. 2004. Recent advances in ceramic-polymer composite electrets. IEEE
T. Dielect. El. In. 11, 35-40.
[22] Sebastian, M.T. and Jantunen, H. 2010. Polymer-ceramic composites of 0-3
connectivity for circuits in electronics: a review. Int. J. Appl. Ceram. Technol. 7,
415-434.

[23] Carter, C.B. and Norton, M.G. 2007. Ceramic Materials: Science and Engineering.
Springer, New York.
[24] Haertling, G.H. 1999. Ferroelectric ceramics: history and technology. J. Am.
Ceram. Soc. 82, 797-818.
[25] Vijatovic, M.M., Bobic, J.D. and Stojanovic, B.D. 2008. History and challenges of
barium titanate: part I. Sci. Sinter. 40, 155-165.
[26] Newnham, R.E., Skinner, D.P. and Cross, L.E. 1978. Connectivity and
piezoelectric-pyroelectric composites. Mater. Res. Bull. 13, 525-536.
[27] Topolov, V.Y. and Bowen, C.R. 2008. Electromechanical Properties in Composites
based on Ferroelectrics. Springer, London.
[28] Tressler, J.F., Alkoy, S., Dogan, A. and Newnham, R.E. 1999. Functional
composites for sensors, actuators and transducers. Compos. Part A: Appl. S. 30,
477-482.
[29] Tressler, J.F., Alkoy, S. and Newnham, R.E. 1998. Piezoelectric sensors and
sensor materials. J. Electroceram. 2, 257-272.
[30] Dang, Z.M., Wang, H.Y., Zhang, Y.H. and Qi, J.Q. 2005. Morphology and dielectric
property of homogenous BaTiO3/PVDF nanocomposites prepared via the natural
adsorption action of nanosized BaTiO3. Macromol. Rapid Commun. 26, 1185-
1189.
[31] Li, Y.C., Tjong, S.C. and Li, R.K.Y. 2011. Dielectric properties of binary
polyvinylidene fluoride/barium titanate nanocomposites and their nanographite
doped hybrids. Express Polym. Lett. 5, 526-534.
[32] Chanmal, C.V. and Jog, J.P. 2008. Dielectric relaxations in PVDF/BaTiO3
nanocomposites. Express Polym. Lett. 2, 294-301.
[33] Lam, K.H. and Chan, H.L.W. 2005. Piezoelectric and pyroelectric properties of
65PMN-35PT/P(VDF-TrFE) 0-3 composites. Compos. Sci. Technol. 65, 1107-
1111.
[34] Kim, P., Doss, N.M., Tillotson, J.P., Hotchkiss, P.J., Pan, M.J., Marder, S.R., Li,
J., Calame, J.P. and Perry, J.W. 2009. High energy density nanocomposites based
on surface-modified BaTiO3 and a ferroelectric polymer. ACS Nano. 3, 2581-2592.

[35] Kim, P., Jones, S.C., Hotchkiss, P.J., Haddock, J.N., Kippelen, B., Marder, S.R.
and Perry, J.W. 2007. Phosphonic acid-modiried barium titanate polymer
nanocomposites with high permittivity and dielectric strength. Adv. Mater. 19, 1001-
1005.
[36] Ghallabi, Z., Arous, M., Kallel, A., Royaud, I., Boiteux, G. and Seytre, G. 2010.
Giant permittivity in three-phase PVDF composites. in Proceedings of the 2010
IEEE International Conference on Solid Dielectrics, ICSD 2010. 1-3.
[37] Gallone, G., Carpi, F., De Rossi, D., Levita, G. and Marchetti, A. 2007. Dielectric
constant enhancement in a silicone elastomer filled with lead magnesium niobate-
lead titanate. Mater. Sci. Eng., C. 27, 110-116.
[38] Lau, S.T., Cheng, C.H., Choy, S.H., Lin, D.M., Kwok, K.W. and Chan, H.L.W.
2008. Lead-free ceramics for pyroelectric applications. J. Appl. Phys. 103.
[39] Devaraju, N.G., Kim, E.S. and Lee, B.I. 2005. The synthesis and dielectric study
of BaTiO3/polyimide nanocomposite films. Microelectron. Eng. 82, 71-83.
[40] Choudhury, A. 2010. Dielectric and piezoelectric properties of
polyetherimide/BaTiO3 nanocomposites. Mater. Chem. Phys. 121, 280-285.
[41] Xiaofang, L., Chuanxi, X., Huajun, S., Lijie, D., Rui, L. and Yang, L. 2005.
Characterization of PZT/PVC composites added with carbon black. J. Wuhan Univ.
Technol.-Mat. Sci. Edit. 20, 60-64.
[42] Thomas, P., Varughese, K.T., Dwarakanath, K. and Varma, K.B.R. 2010.
Dielectric properties of poly(vinylidene fluoride)/CaCu3Ti4O12 composites. Compos.
Sci. Technol. 70, 539-545.
[43] Sohi, N.J.S., Bhadra, S. and Khastgir, D. 2011. The effect of different carbon fillers
on the electrical conductivity of ethylene vinyl acetate copolymer-based composites
and the applicability of different conductivity models. Carbon. 49, 1349-1361.
[44] Huang, J.C. 2002. Carbon black filled conducting polymers and polymer blends.
Adv. Polym. Tech. 21, 299-313.
[45] Ghosh, P. and Chakrabarti, A. 2000. Conducting carbon black filled EPDM
vulcanizates: assessment of dependence of physical and mechanical properties
and conducting character on variation of filler loading. Eur. Polym. J. 36, 1043-
1054.
[46] Kirkpatrick, S. 1973. Percolation and conduction. Rev. Mod. Phys. 45, 574-588.

[47] Zallen, R. 1983. The Physics of Amorphous Solids. John Wiley & Sons, New
York.
[48] Davidson, T. 2010. Conductive and magnetic fillers, in Functional Fillers for
Plastics, M. Xanthos, ed. Wiley-VCH Verlag GmbH & Co. KGaA, Weinheim.
[49] Samarzija-Jovanovic, S., Jovanovic, V., Markovic, G. and Marinovic-Cincovic, M.
2009. The effect of different types of carbon blacks on the rheological and thermal
properties of acrylonitrile butadiene rubber. J. Therm. Anal. Calorim. 98, 275-283.
[50] Fröhlich, J., Niedermeier, W. and Luginsland, H.D. 2005. The effect of filler–filler
and filler–elastomer interaction on rubber reinforcement. Compos. Part A: Appl. S.
36, 449-460.
[51] Heinrich, G. and Vilgis, T.A. 1993. Contribution of entanglements to the mechanical
properties of carbon black-filled polymer networks. Macromolecules. 26, 1109-
1119.
[52] Litvinov, V.M. and Steeman, P.A.M. 1999. EPDM-carbon black interactions and
the reinforcement mechanisms, as studied by low-resolution 1H NMR.
Macromolecules. 32, 8476-8490.
[53] Wang, M.-J. 1998. Effect of polymer-filler and filler-filler interactions on dynamic
properties of filled vulcanizates. Rubber Chem. Technol. 71, 520-589.
[54] Utracki, L.A. 2002. Introduction to polymer blends, in Polymer Blends Handbook,
L.A. Utracki, ed. Springer, Dordrecht.
[55] Bailly, M. and Kontopoulou, M. 2010. Nanocomposite blends containing
polyolefins, in Advances in Polyolefin Nanocomposites, V. Mittal, ed. CRC Press,
Boca Raton.
[56] White, J.L. and Yang, J. 2007. Miscibility and characteristics of polyolefin blends,
in Polyolefin Blends, D. Nwabunma and T. Kyu, eds. John Wiley & Sons, New
Jersey.
[57] Mohanty, S., Nando, G.B., Vijayan, K. and Neelakanthan, N.R. 1996. Mechanical
and dynamic mechanical properties of miscible blends of epoxidized natural rubber
and poly(ethylene-co-acrylic acid). Polymer. 37, 5387-5394.
[58] Utracki, L.A. 2003. Thermodynamics of polymer blends, in Polymer Blends
Handbook, L.A. Utracki, ed. Springer, Dordrecht.
[59] Radusch, H.-J. 2005. Phase morphology of dynamically vulcanized thermoplastic
vulcanizates, in Micro- and Nanostructured Multiphase Polymer Blend Systems, S.
Thomas, G. Groeninckx and C. Harrats, eds. CRC Press, Boca Raton.
[60] Zeng, W., Du, Y., Xue, Y. and Frisch, H.L. 2007. Solubility parameters, in Physical
Properties of Polymers Handbook, J.E. Mark, ed. Springer, New York.
[61] Xavier, S.F. 2003. Properties and performance of polymer blends, in Polymer
Blends Handbook, L.A. Utracki, ed. Springer, Dordrecht.
[62] Brown, S.B. 2002. Reactive compatibilization of polymer blends, in Polymer Blends
Handbook, L.A. Utracki, ed. Springer, Dordrecht, The Netherlands.
[63] Macosko, C.W., Guégan, P., Khandpur, A.K., Nakayama, A., Marechal, P. and
Inoue, T. 1996. Compatibilizers for melt blending: premade block copolymers.
Macromolecules. 29, 5590-5598.
[64] Holden, G. and Quirk, R.P. 2004. Thermoplastic Elastomers. Hanser, New York.
[65] Bhadane, P.A., Virgilio, N., Favis, B.D., Champagne, M.F., Huneault, M.A. and
Tofan, F. 2006. Effect of dynamic vulcanization on co-continuous morphology.
AlChE J. 52, 3411-3420.
[66] Martin, G., Barrès, C., Sonntag, P., Garois, N. and Cassagnau, P. 2009.
Morphology development in thermoplastic vulcanizates (TPV): Dispersion
mechanisms of a pre-crosslinked EPDM phase. Eur. Polym. J. 45, 3257-3268.
[67] Antunes, C.F., Machado, A.V. and Van Duin, M. 2011. Morphology development
and phase inversion during dynamic vulcanisation of EPDM/PP blends. Eur. Polym.
J. 47, 1447-1459.
[68] Abdou-Sabet, S., Puydak, R.C. and Rader, C.P. 1996. Dynamically vulcanized
thermoplastic elastomers. Rubber Chem. Technol. 69, 476-494.
[69] Nakason, C. and Kaewsakul, W. 2010. Influence of oil contents in dynamically
cured natural rubber and polypropylene blends. J. Appl. Polym. Sci. 115, 540-548.
[70] Nakason, C., Worlee, A. and Salaeh, S. 2008. Effect of vulcanization systems on
properties and recyclability of dynamically cured epoxidized natural
rubber/polypropylene blends. Polym. Test. 27, 858-869.
[71] Machado, A. and Van Duin, M. 2005. Dynamic vulcanisation of EPDM/PE-based
thermoplastic vulcanisates studied along the extruder axis. Polymer. 46, 6575-
6586.
[72] Nakason, C., Tobprakhon, A. and Kaesarnan, A. 2005. Thermoplastic
vulcanizates based on poly(methyl methacrylate)/epoxidized natural rubber blends:
mechanical, thermal, and morphological properties. J. Appl. Polym. Sci. 98, 1251-
1261.
[73] Mousa, A., Ishiaku, U.S. and Mohd Ishak, Z.A. 2000. Rheological properties of
dynamically vulcanized poly(vinyl chloride)/epoxidized natural rubber thermoplastic
elastomers: effect of processing variables. Polym. Test. 19, 193-204.
[74] Thitithammawong, A., Nakason, C., Sabakaro, K. and Noordermeer, J.W.M. 2007.
Thermoplastic vulcanizates based on epoxidized natural rubber/polypropylene
blends: Selection of optimal peroxide type and concentration in relation to mixing
conditions. Eur. Polym. J. 43, 4008-4018.
[75] Mani, S., Cassagnau, P., Bousmina, M. and Chaumont, P. 2011. Morphology
development in novel composition of thermoplastic vulcanizates based on
PA12/PDMS reactive blends. Macromol. Mater. Eng. 296, 909-920.
[76] Nakason, C., Wannavilai, P. and Kaesaman, A. 2006. Effect of vulcanization
system on properties of thermoplastic vulcanizates based on epoxidized natural
rubber/polypropylene blends. Polym. Test. 25, 34-41.
[77] Thitithammawong, A., Nakason, C., Sahakaro, K. and Noordermeer, J.W.M. 2009.
Multifunctional peroxide as alternative crosslink agents for dynamically vulcanized
epoxidized natural rubber/polypropylene blends. J. Appl. Polym. Sci. 111, 819-
825.
[78] Babu, R.R., Singha, N.K. and Naskar, K. 2009. Dynamically vulcanized blends of
polypropylene and ethylene octene copolymer: influence of various coagents on
mechanical and morphological characteristics. J. Appl. Polym. Sci. 113, 3207-
3221.
[79] Li, Y., Oono, Y., Kadowaki, Y., Inoue, T., Nakayama, K. and Shimizu, H. 2006. A
novel thermoplastic elastomer by reaction-induced phase decomposition from a
miscible polymer blend. Macromolecules. 39, 4195-4201.
[80] Jha, A., Dutta, B. and Bhowmick, A.K. 1999. Effect of fillers and plasticizers on the
performance of novel heat and oil-resistant thermoplastic elastomers from nylon-6
and acrylate rubber blends. J. Appl. Polym. Sci. 74, 1490-1501.

[81] Elias, L., Fenouillot, F., Majeste, J.C., Alcouffe, P. and Cassagnau, P. 2008.
Immiscible polymer blends stabilized with nano-silica particles: rheology and
effective interfacial tension. Polymer. 49, 4378-4385.
[82] Lee, S.H., Kontopoulou, M. and Park, C.B. 2010. Effect of nanosilica on the co-
continuous morphology of polypropylene/polyolefin elastomer blends. Polymer. 51,
1147-1155.
[83] Wu, D.F., Zhang, Y.S., Zhang, M. and Yu, W. 2009. Selective localization of
multiwalled carbon nanotubes in poly(( -caprolactone)/polylactide blend.
Biomacromolecules. 10, 417-424.
[84] Calcagno, C.I.W., Mariani, C.M., Teixeira, S.R. and Mauler, R.S. 2008. The role
of the MMT on the morphology and mechanical properties of the PP/PET blends.
Compos. Sci. Technol. 68, 2193-2200.
[85] Sumita, M., Sakata, K., Asai, S., Miyasaka, K. and Nakagawa, H. 1991. Dispersion
of fillers and the electrical conductivity of polymer blends filled with carbon black.
Polym. Bull. 25, 265-271.
[86] Fenouillot, F., Cassagnau, P. and Majeste, J.C. 2009. Uneven distribution of
nanoparticles in immiscible fluids: morphology development in polymer blends.
Polymer. 50, 1333-1350.
[87] Shi, Y.Y., Yang, J.H., Huang, T., Zhang, N., Chen, C. and Wang, Y. 2013.
Selective localization of carbon nanotubes at the interface of poly(L-
lactide)/Ethylene-co-vinyl acetate resulting in lowered electrical resistivity. Compos.
Part B: Eng. 55, 463-469.
[88] Elias, L., Fenouillot, F., Majeste, J.C. and Cassagnau, P. 2007. Morphology and
rheology of immiscible polymer blends filled with silica nanoparticles. Polymer. 48,
6029-6040.
[89] Elias, L., Fenouillot, F., Majeste, J.C., Martin, G. and Cassagnau, P. 2008.
Migration of nanosilica particles in polymer blends. J. Polym. Sci. Pol. Phys. 46,
1976-1983.
[90] Martin, G., Barres, C., Sonntag, P., Garois, N. and Cassagnau, P. 2009. Co-
continuous morphology and stress relaxation behaviour of unfilled and silica filled
PP/EPDM blends. Mater. Chem. Phys. 113, 889-898.
[91] Wu, D.F., Lin, D.P., Zhang, J., Zhou, W.D., Zhang, M., Zhang, Y.S., Wang, D.M.
and Lin, B.L. 2011. Selective localization of nanofillers: effect on morphology and
crystallization of PLA/PCL blends. Macromol. Chem. Phys. 212, 613-626.
[92] Entezam, M., Khonakdar, H.A., Yousefi, A.A., Jafari, S.H., Wagenknecht, U. and
Heinrich, G. 2013. Dynamic and transient shear start-up flow experiments for
analyzing nanoclay localization in PP/PET blends: correlation with microstructure.
Macromol. Mater. Eng. 298, 113-126.
[93] Feng, J.Y., Chan, C.M. and Li, J.X. 2003. A method to control the dispersion of
carbon black in an immiscible polymer blend. Polym. Eng. Sci. 43, 1058-1063.
[94] Baudouin, A.C., Bailly, C. and Devaux, J. 2010. Interface localization of carbon
nanotubes in blends of two copolymers. Polym. Degrad. Stab. 95, 389-398.
[95] Hong, J.S., Namkung, H., Ahn, K.H., Lee, S.J. and Kim, C. 2006. The role of
organically modified layered silicate in the breakup and coalescence of droplets in
PBT/PE blends. Polymer. 47, 3967-3975.
[96] Bitinis, N., Verdejo, R., Maya, E.M., Espuche, E., Cassagnau, P. and Lopez-
Manchado, M.A. 2012. Physicochemical properties of organoclay filled polylactic
acid/natural rubber blend bionanocomposites. Compos. Sci. Technol. 72, 305-313.
[97] Cardarelli, F. 2008. Materials Handbook: A Concise Desktop Reference. Springer,
New York.
[98] Baker, C.S.L. 2001. Modified natural rubber, in Handbook of Elastomers, A.K.
Bhownick and H.L. Stephens, eds. Marcel Dekker, New York.
[99] Gelling, I.R. 1991. Epoxidised natural rubber. J. Nat. Rubber Res. 6, 21.
[100] Hashim, A.S. and Kohjiya, S. 1993. Preparation and properties of epoxidized
natural rubber. Kaut. Gummi Kunstst. 46, 208.
[101] Brydson, J.A. 1988. Rubbery Materials and Their Compounds. Springer, London.
[102] Chee, K.K. 1995. Solubility parameters of polymers from swelling measurements
at 60oC. J. Appl. Polym. Sci. 58, 2057-2062.
[103] Rajasekar, R., Pal, K., Heinrich, G., Das, A. and Das, C.K. 2009. Development of
nitrile butadiene rubber-nanoclay composites with epoxidized natural rubber as
compatibilizer. Mater. Design. 30, 3839-3845.

[104] Manna, A.K., De, P.P., Tripathy, D.K. and De, S.K. 1998. Hysteresis and strain-
dependent dynamic mechanical properties of epoxidized natural rubber filled with
surface-oxidized carbon black. J. Appl. Polym. Sci. 70, 723-730.
[105] Ibrahim, A. and Dahlan, M. 1998. Thermoplastic natural rubber blends. Prog.
Polym. Sci. 23, 665-706.
[106] Pechurai, W., Nakason, C. and Sahakaro, K. 2008. Thermoplastic natural rubber
based on oil extended NR and HDPE blends: blend compatibilizer, phase inversion
composition and mechanical properties. Polym. Test. 27, 621-631.
[107] Pichaiyut, S., Nakason, C., Kaesaman, A. and Kiatkamjornwong, S. 2008.
Influences of blend compatibilizers on dynamic, mechanical, and morphological
properties of dynamically cured maleated natural rubber and high-density
polyethylene blends. Polym. Test. 27, 566-580.
[108] Varughese, K.T., Nando, G.B., De, P.P. and De, S.K. 1988. Miscible blends from
rigid poly(vinyl chloride) and epoxidized natural rubber. J. Mater. Sci. 23, 3894-
3902.
[109] Narathichat, M., Kummerlöwe, C., Vennemann, N., Sahakaro, K. and Nakason,
C. 2012. Influence of epoxide level and reactive blending on properties of
epoxidized natural rubber and nylon-12 blends. Adv. Polym. Tech. 31, 118-129.
[110] Kalkornsurapranee, E., Nakason, C., Kummerlöwe, C. and Vennemann, N. 2013.
Development and preparation of high-performance thermoplastic vulcanizates
based on blends of natural rubber and thermoplastic polyurethanes. J. Appl. Polym.
Sci. 128, 2358-2367.
[111] Pichaiyut, S., Nakason, C. and Vennemann, N. 2012. Thermoplastic elastomers-
based natural rubber and thermoplastic polyurethane blends. Iran Polym. J. 21,
65-79.
[112] Lovinger, A.J. 1982. Poly(vinylidene fluoride), in Developments in Crystalline
Polymers, D.C. Bassett, ed. Applied Science Publishers, London.
[113] Wang, Y.P., Fang, L.M., Xu, C.H., Chen, Z.H. and Chen, Y.K. 2013. Preparation
and properties of dynamically cured poly(vinylidene fluoride)/silicone rubber blends.
Polym. Test. 32, 1072-1078.
[114] Priya, L. and Jog, J.P. 2002. Poly(vinylidene fluoride)/clay nanocomposites
prepared by melt intercalation: crystallization and dynamic mechanical behavior
studies. J. Polym. Sci., Part B: Polym. Phys. 40, 1682-1689.
[115] He, F.A., Fan, J.T. and Lau, S.T. 2008. Thermal, mechanical, and dielectric
properties of graphite reinforced poly(vinylidene fluoride) composites. Polym. Test.
27, 964-970.
[116] Sy, J.W. and Mijovic, J. 2000. Reorientational dynamics of poly(vinylidene
fluoride)/poly(methyl methacrylate) blends by broadband dielectric relaxation
spectroscopy. Macromolecules. 33, 933-946.
[117] Pimbert, S., Avignon-Poquillon, L. and Levesque, G. 2002. Calorimetric study of
fluorinated methacrylic and vinyl polymer blends: part 2: correlation between
miscibility, chemical structure and 12 interaction parameter in binary systems.
Polymer. 43, 3295-3302.
CHAPTER 3
MATERIALS AND EXPERIMENT METHODOLOGY
This chapter provides information on the materials used, as well as descriptions
of sample preparations and the characterization techniques used throughout the project.
The section covering sample preparation is divided into two sections; natural rubber
vulcanizates and PVDF/ENR blends.
3.1 Materials
The thesis work involves rubber vulcanizates and blends of poly(vinylidene
fluoride) (PVDF) and epoxidized natural rubber (ENR). The details of materials used in
this study are listed below:
3.1.1 Natural rubber
Natural rubber (NR) in the form of air dried sheet (ADS) was used to prepare
rubber vulcanizate. It was manufactured by a local factory, Khuan Pun Tae Farmer
Cooperation, Phattalung, Thailand.
3.1.2 Epoxidized natural rubber
Epoxidized natural rubber (ENR) with two levels of epoxidation in the ENR (i.e.,
25 and 50 mol% epoxide or ENR-25 and ENR-50, respectively) were used to prepare
rubber vulcanizate and used as blend component in PVDF/ENR blends. ENR-25 and
ENR-50 are available in commercial grade as Epoxyprene 25 and Epoxypene 50,
respectively. They were manufactured by Muang Mai Guthrie, Phuket, Thailand.
3.1.3 Poly(vinylidene fluoride)
Homopolymer poly(vinylidene fluoride) or PVDF, KYNAR 740 in the form of
pellet was used as a blend component in PVDF/ENR blends. The specific gravity of PVDF
was 1.78 g/cm3 and melting temperature 168°C. It was purchased from Arkema Inc.,
France.
3.1.4 Zinc oxide
Zinc oxide (ZnO) was used as an activator in sulfur vulcanization system. It is
a white powder with a density of 5.606 g/cm³ and a melting point of 419°C. It was
manufactured by Metoxide Thailand Co., Ltd., Pathumthani, Thailand.
3.1.5 Stearic acid
Stearic acid (C18H36O2) was used as an activator in sulfur vulcanization system.
It is a waxy white solid with a density, melting point and boiling point of 0.847 g/cm3,
69.6°C and 383°C, respectively. It was manufactured by Imperial Chemical Co., Ltd.,
Pathumthani, Thailand.
3.1.6 Mercaptobenzothaizole
Mercaptobenzothiazole (MBT), Perkasit MBT, was used as an accelerator in
sulfur vulcanization system. It is a cream color powder with a density of 1.52 g/cm3 and
was manufactured by Flexsys, Termoli, Italy.
3.1.7 Sulfur
Sulfur was used as a vulcanizing agent. It is a yellow powder with a density of
2.00 g/cm3. It was manufactured by Ajax Chemicals Pty. Co., Ltd., Sydney, Australia,
Thailand.
3.1.8 Phenolic resin
Phenolic resin, HRJ-10518 was used as vulcanizing agent in phenolic cure
system to perform dynamic vulcanization in PVDF/ENR blends. It contains 6-9% active
hydroxymethyl (methylol) groups with a density of 1.05 g/cm3. It was manufactured by the
Schenectady International Inc., New York, USA. The molecular structure of HRJ-10518 is
shown in Figure 3.1.
3.1.9 Titanium(IV) oxide
Titanium(IV) oxide (TiO2) was used to prepare barium titanate. It is white powder
form with a density of 3.9 g/cm3. It was manufactured by Fluka Co. Ltd, Switzerland.

Figure 3.1 Molecular structure of HRJ-10518
3.1.10 Barium carbonate
Barium carbonate (BaCO3) was used to prepare barium titanate with solid state
technique. It is a white powder with a density of 4.29 g/cm3. It was manufactured by Ajax
Finechem Pty Ltd., Australia.
3.1.11 Carbon black
Carbon black (CB) with two different surface areas and structures was used to
prepare conductive ENR-50 composite. These are high abrasion furnace (HAF) and extra
conductive furnace (ECF). HAF in a trade name of Thaiblack N330 was manufactured by
Thai Carbon Black Public Co., Ltd, Ang Thong, Thailand. ECF in a trade name of Vulcan
XC72R was manufactured by Cabot Corporation, Texas, USA. The characteristics of HAF
and ECF are summarized in Table 3.1.
Table 3.1 Characteristics of used carbon black
Carbon black Diameter
(nm)
Iodine adsorption
(mg/g) Nitrogen Surface Area
(m2/g)
DBP Absorption
(cm3/100g)
HAF 29 82 80 102
ECF 30 235 254 192
3.1.12 Barium titanate
Barium titanate (BaTiO3 or BT) is a ferroelectric ceramic, which was used as
filler in PVDF/ENR blend. It is a white powder with a density of 5.85 g/cm3. It was
manufactured by Alfa Aesar GmbH & Co. KG, Germany.
3.2 Experimental procedure
3.2.1 Preparation of natural rubber vulcanizate
The three types of natural rubbers (i.e., NR, ENR-25 and ENR-50) were cross-
linked with sulfur vulcanization system to study effect of epoxidation level on cure
characteristic, mechanical properties, dynamic mechanical properties and dielectric
properties. Mixing process was carried out using Brabender Plasticoder PLE 331
(Brabender OHG Duisburg, Germany) with a mixing chamber of 80 cm3 at 60°C and a
rotor speed of 60 rpm. The compounding formulation is shown in Table 3.2. NR was first
masticated for 5 min. Zinc oxide and stearic acid were then added and mixed for 2 and
1 min, respectively. After dumping the mixes out of the mixing chamber, MBT and sulfur
were added, respectively and mixed using a two-roll mill for 1 and 2 min, respectively.
The rubber compound was then sheeted out and left at room temperature for 12 h before
testing and vulcanizing.
Table 3.2 Compounding formulation used to prepare rubber vulcanizate
Ingredients Quantities (phr)
Rubbera 100
ZnO 0.6
Stearic acid 0.5
MBT 0.5
Sulfur 3.5 a NR, ENR-25 and ENR-50, phr = Parts per Hundred of Rubber
3.2.2 Preparation of barium titanate
There are several techniques available in the literature for ceramic preparation.
The mechanical method (i.e., solid state reaction) is one of the successful methods for a
large-scale production of bulk ceramic powders because of its low cost and easy
adaptability. In this work, barium titanate was prepared by using the mixed oxide process
i.e., high temperature solid state reaction techniques. This is a conventional method in
which oxides and carbonates are used as precursors. Barium titanate (BaTiO3) was
synthesized by the conventional solid state reactions of BaCO3|TiO2, consisting of the
following steps. Starting materials (i.e., BaCO3|TiO2) were first weighed with a molar ratio

of 1:1. They were then incorporated into a 1 liter ball-mill jar and thoroughly mixed for 1
min. Isopropanol was used as a medium in the system. It was added until 75 vol% of the
jar. The mixing was continued for 5 min. The mixture was then ball-milled for another 24
h using zirconia balls with a half capacity of the jar. Isopropanol was thereafter separated
by rotary evaporator. The remaining product was then dried at 120°C for 12 h in a hot air
oven. The mixed powder was then ground, sieved through 120 mesh screen, and then
incorporated into the alumina crucible. Calcination was then performed at 1100°C for 2 h
in the muffle furnace (Thermolyne 6000 furnace, Barnstead International, Dubuque, USA).
The structural characterization and particles size of barium titanate were studied by X-ray
diffraction technique (XRD), dielectric spectroscopy and particle size analysis. The
calcined powders were mixed with poly(vinyl alcohol) (PVA) as a binder and were then
pressed into cylindrical pellets of 16 mm in diameter and 1-2 mm thick under a uniaxial
pressure. The pellets were then sintered for 4 h at 1300°C in air atmosphere. PVA Binder
removal was carried out by heating the pellets at 550°C for 1 h. These pellets were then
sintered at 1300°C for 4 hr dwell time with a heating/cooling rate of 5°C/min. The sintered
pellets were polished by using fine-grit sandpaper. The both sides of pellet were painted
with silver paste and cured at 600°C for 30 min to form perfect electrodes on the sample
surfaces. Dielectric properties of specimens were characterized at room temperature.
3.2.3 Preparation of BT/ENR-50 and CB/ENR-50 composites
BT/ENR-50 and CB/ENR-50 composites were prepared in an internal mixer
with 80 cm3 capacity (Brabender Plasticorder, model PLE331, Brabender OHG Duisburg,
Germany), at 60°C with a rotor speed of 60 rpm. The influence of BT loading (i.e., 0, 5,
10, 15, 20, 30, 40 and 50 vol%) and CB loading (i.e., 0, 5, 10, 15, 20, 25, 30, 40, 50 and
60 phr) on the properties of composites was studied. Two types of CB (i.e., HAF and
ECF) were used in this investigation. The conversion from volume to weight of BT in
ENR-50 can be expressed by:
where mc is weight of BT, mp is weight of ENR-50, ρc is density of BT (5.85), ρp is density
of ENR-50 (0.97) and φ is volume faction of BT.
(3.1)
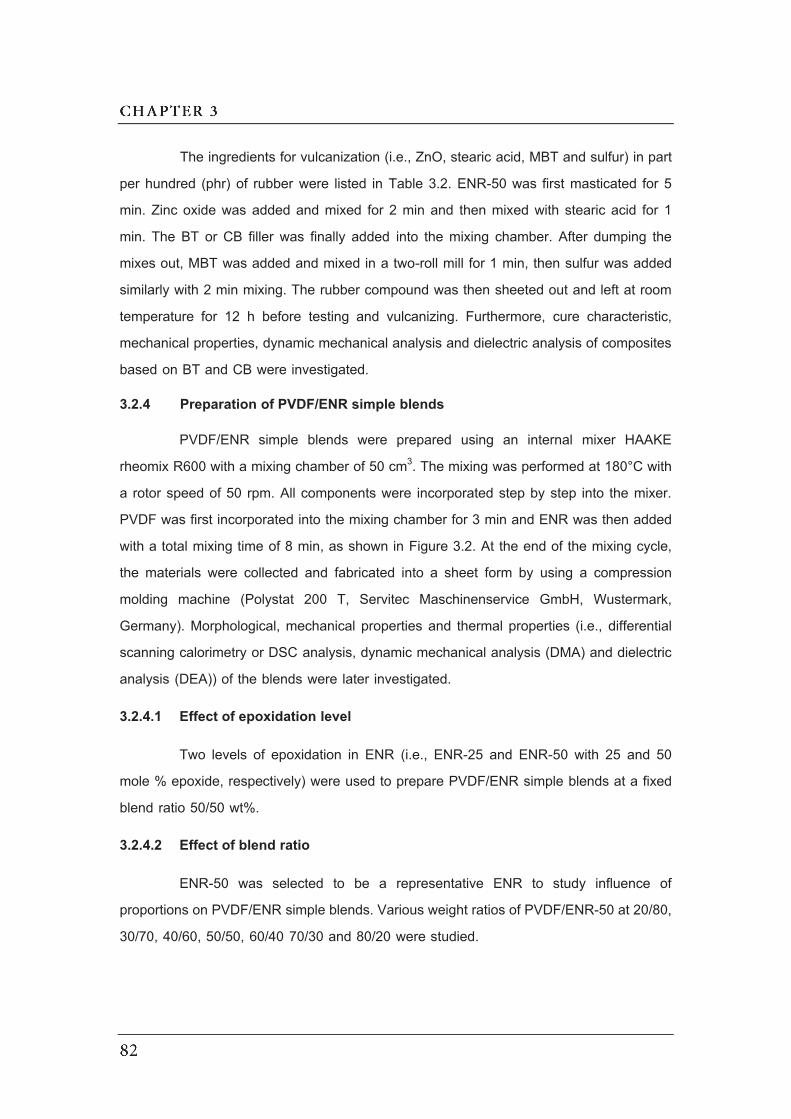
The ingredients for vulcanization (i.e., ZnO, stearic acid, MBT and sulfur) in part
per hundred (phr) of rubber were listed in Table 3.2. ENR-50 was first masticated for 5
min. Zinc oxide was added and mixed for 2 min and then mixed with stearic acid for 1
min. The BT or CB filler was finally added into the mixing chamber. After dumping the
mixes out, MBT was added and mixed in a two-roll mill for 1 min, then sulfur was added
similarly with 2 min mixing. The rubber compound was then sheeted out and left at room
temperature for 12 h before testing and vulcanizing. Furthermore, cure characteristic,
mechanical properties, dynamic mechanical analysis and dielectric analysis of composites
based on BT and CB were investigated.
3.2.4 Preparation of PVDF/ENR simple blends
PVDF/ENR simple blends were prepared using an internal mixer HAAKE
rheomix R600 with a mixing chamber of 50 cm3. The mixing was performed at 180°C with
a rotor speed of 50 rpm. All components were incorporated step by step into the mixer.
PVDF was first incorporated into the mixing chamber for 3 min and ENR was then added
with a total mixing time of 8 min, as shown in Figure 3.2. At the end of the mixing cycle,
the materials were collected and fabricated into a sheet form by using a compression
molding machine (Polystat 200 T, Servitec Maschinenservice GmbH, Wustermark,
Germany). Morphological, mechanical properties and thermal properties (i.e., differential
scanning calorimetry or DSC analysis, dynamic mechanical analysis (DMA) and dielectric
analysis (DEA)) of the blends were later investigated.
3.2.4.1 Effect of epoxidation level
Two levels of epoxidation in ENR (i.e., ENR-25 and ENR-50 with 25 and 50
mole % epoxide, respectively) were used to prepare PVDF/ENR simple blends at a fixed
blend ratio 50/50 wt%.
3.2.4.2 Effect of blend ratio
ENR-50 was selected to be a representative ENR to study influence of
proportions on PVDF/ENR simple blends. Various weight ratios of PVDF/ENR-50 at 20/80,
30/70, 40/60, 50/50, 60/40 70/30 and 80/20 were studied.
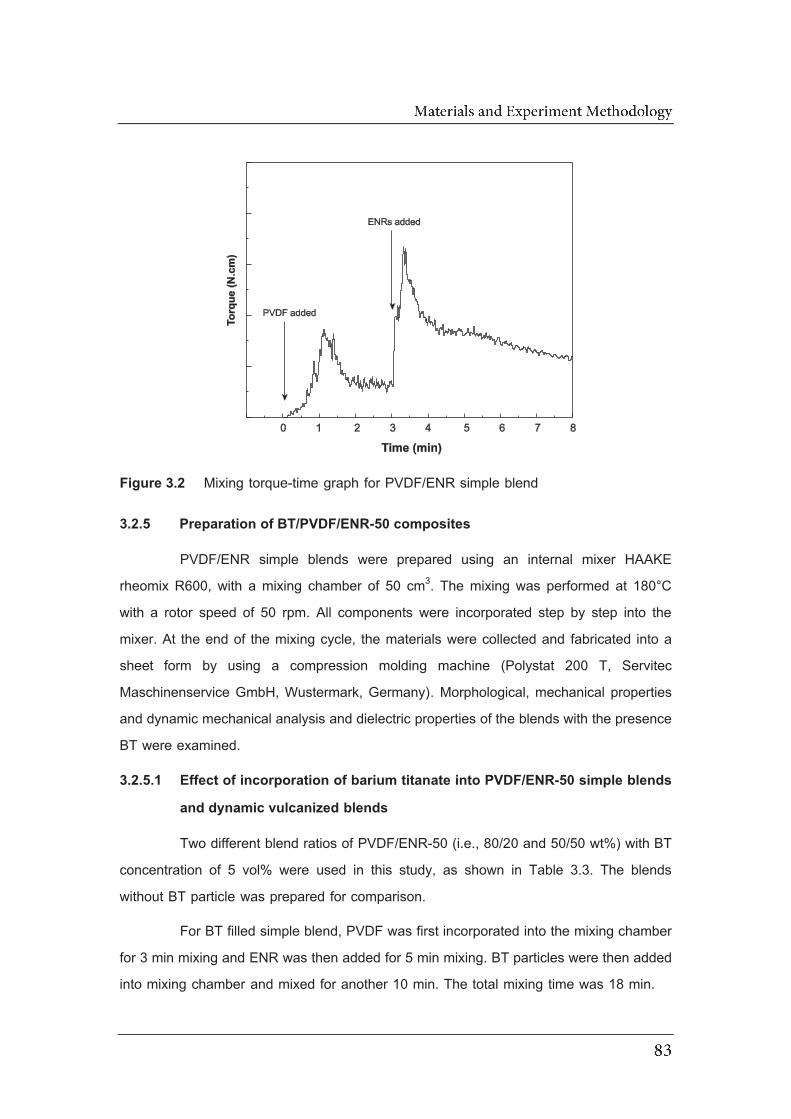
Figure 3.2 Mixing torque-time graph for PVDF/ENR simple blend
3.2.5 Preparation of BT/PVDF/ENR-50 composites
PVDF/ENR simple blends were prepared using an internal mixer HAAKE
rheomix R600, with a mixing chamber of 50 cm3. The mixing was performed at 180°C
with a rotor speed of 50 rpm. All components were incorporated step by step into the
mixer. At the end of the mixing cycle, the materials were collected and fabricated into a
sheet form by using a compression molding machine (Polystat 200 T, Servitec
Maschinenservice GmbH, Wustermark, Germany). Morphological, mechanical properties
and dynamic mechanical analysis and dielectric properties of the blends with the presence
BT were examined.
3.2.5.1 Effect of incorporation of barium titanate into PVDF/ENR-50 simple blends
and dynamic vulcanized blends
Two different blend ratios of PVDF/ENR-50 (i.e., 80/20 and 50/50 wt%) with BT
concentration of 5 vol% were used in this study, as shown in Table 3.3. The blends
without BT particle was prepared for comparison.
For BT filled simple blend, PVDF was first incorporated into the mixing chamber
for 3 min mixing and ENR was then added for 5 min mixing. BT particles were then added
into mixing chamber and mixed for another 10 min. The total mixing time was 18 min.
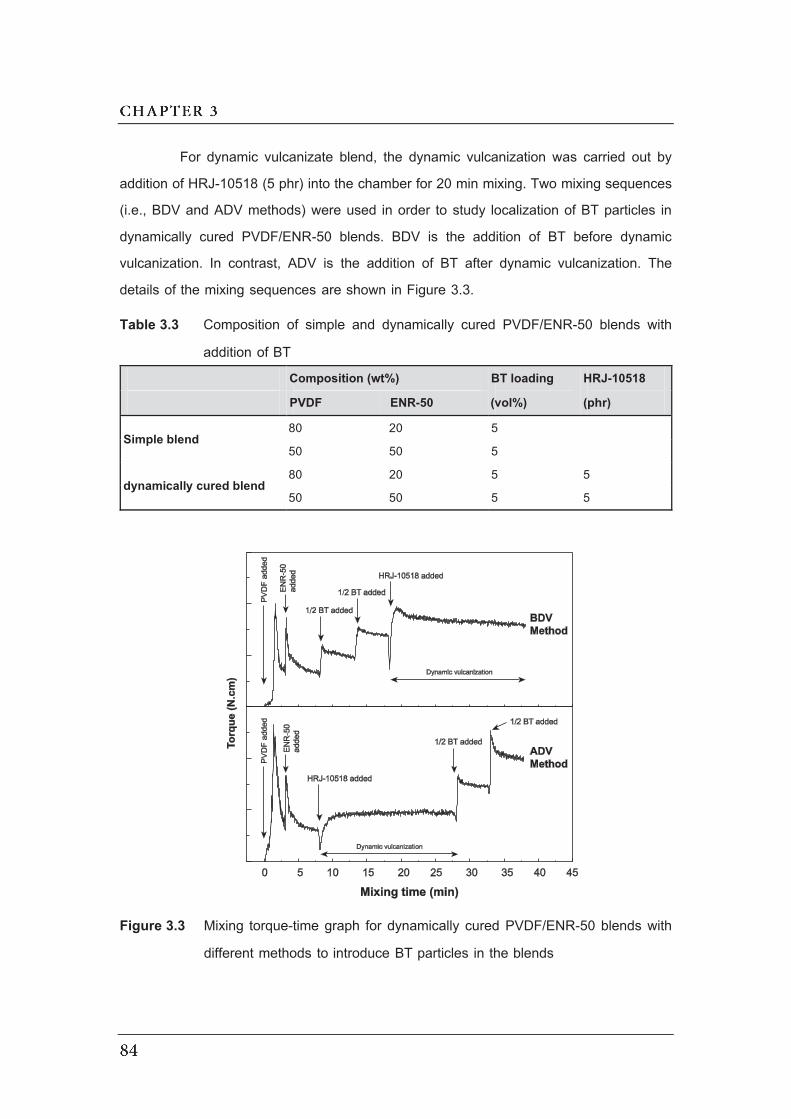
For dynamic vulcanizate blend, the dynamic vulcanization was carried out by
addition of HRJ-10518 (5 phr) into the chamber for 20 min mixing. Two mixing sequences
(i.e., BDV and ADV methods) were used in order to study localization of BT particles in
dynamically cured PVDF/ENR-50 blends. BDV is the addition of BT before dynamic
vulcanization. In contrast, ADV is the addition of BT after dynamic vulcanization. The
details of the mixing sequences are shown in Figure 3.3.
Table 3.3 Composition of simple and dynamically cured PVDF/ENR-50 blends with
addition of BT
Composition (wt%) BT loading
(vol%)
HRJ-10518
(phr) PVDF ENR-50
Simple blend 80 20 5
50 50 5
dynamically cured blend 80 20 5 5
50 50 5 5
Figure 3.3 Mixing torque-time graph for dynamically cured PVDF/ENR-50 blends with
different methods to introduce BT particles in the blends
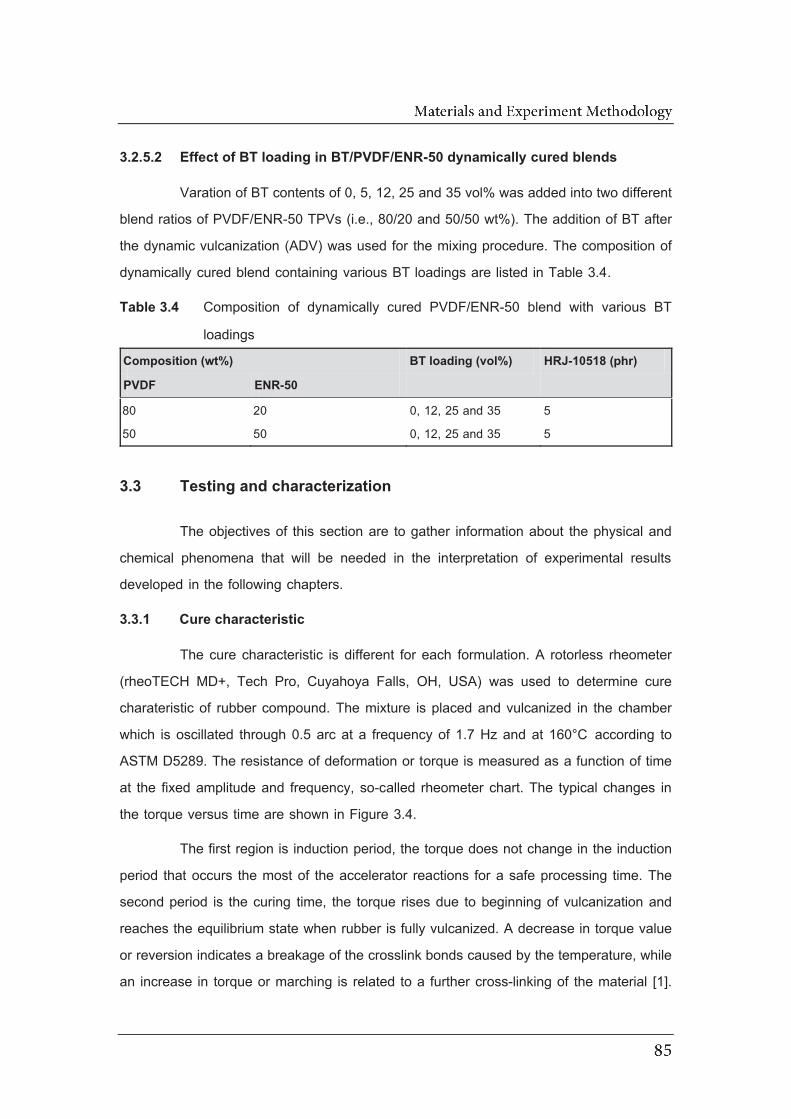
3.2.5.2 Effect of BT loading in BT/PVDF/ENR-50 dynamically cured blends
Varation of BT contents of 0, 5, 12, 25 and 35 vol% was added into two different
blend ratios of PVDF/ENR-50 TPVs (i.e., 80/20 and 50/50 wt%). The addition of BT after
the dynamic vulcanization (ADV) was used for the mixing procedure. The composition of
dynamically cured blend containing various BT loadings are listed in Table 3.4.
Table 3.4 Composition of dynamically cured PVDF/ENR-50 blend with various BT
loadings
Composition (wt%) BT loading (vol%) HRJ-10518 (phr)
PVDF ENR-50
80 20 0, 12, 25 and 35 5
50 50 0, 12, 25 and 35 5
3.3 Testing and characterization
The objectives of this section are to gather information about the physical and
chemical phenomena that will be needed in the interpretation of experimental results
developed in the following chapters.
3.3.1 Cure characteristic
The cure characteristic is different for each formulation. A rotorless rheometer
(rheoTECH MD+, Tech Pro, Cuyahoya Falls, OH, USA) was used to determine cure
charateristic of rubber compound. The mixture is placed and vulcanized in the chamber
which is oscillated through 0.5 arc at a frequency of 1.7 Hz and at 160°C according to
ASTM D5289. The resistance of deformation or torque is measured as a function of time
at the fixed amplitude and frequency, so-called rheometer chart. The typical changes in
the torque versus time are shown in Figure 3.4.
The first region is induction period, the torque does not change in the induction
period that occurs the most of the accelerator reactions for a safe processing time. The
second period is the curing time, the torque rises due to beginning of vulcanization and
reaches the equilibrium state when rubber is fully vulcanized. A decrease in torque value
or reversion indicates a breakage of the crosslink bonds caused by the temperature, while
an increase in torque or marching is related to a further cross-linking of the material [1].

From rheometer chart, it can be characterized a minimum torque (ML), a maximum torque
(MH), and delta torque (MH – ML). Furthermore, scorch time (ts1) is the time required for
the onset of crosslink formation. This is generally taken as a time for one-point rise from
minimum torque. The optimum cure time (tc90) is determined based on the time to develop
90% of the difference in force or torque from the minimum to the maximum, as calculated
according to Equation 3.2. Cure rate index were calculated using Equation 3.3.
and
Figure 3.4 Torque as a function of time during vulcanization
3.3.2 Morphological properties
The scanning electron microscopy is a very useful technique based on the
principle of electron-matter interactions. An electron beam is used to excite the atoms in
the surface of the sample. The interaction of the beam results mainly in an emission of
secondary electrons, backscattered electron and X-ray emitted by the surface, as shown
in Figure 3.5. They are collected and then analyzed by different detectors for
reconstructing a topographical image of the surface studied.
(3.2)
(3.3)
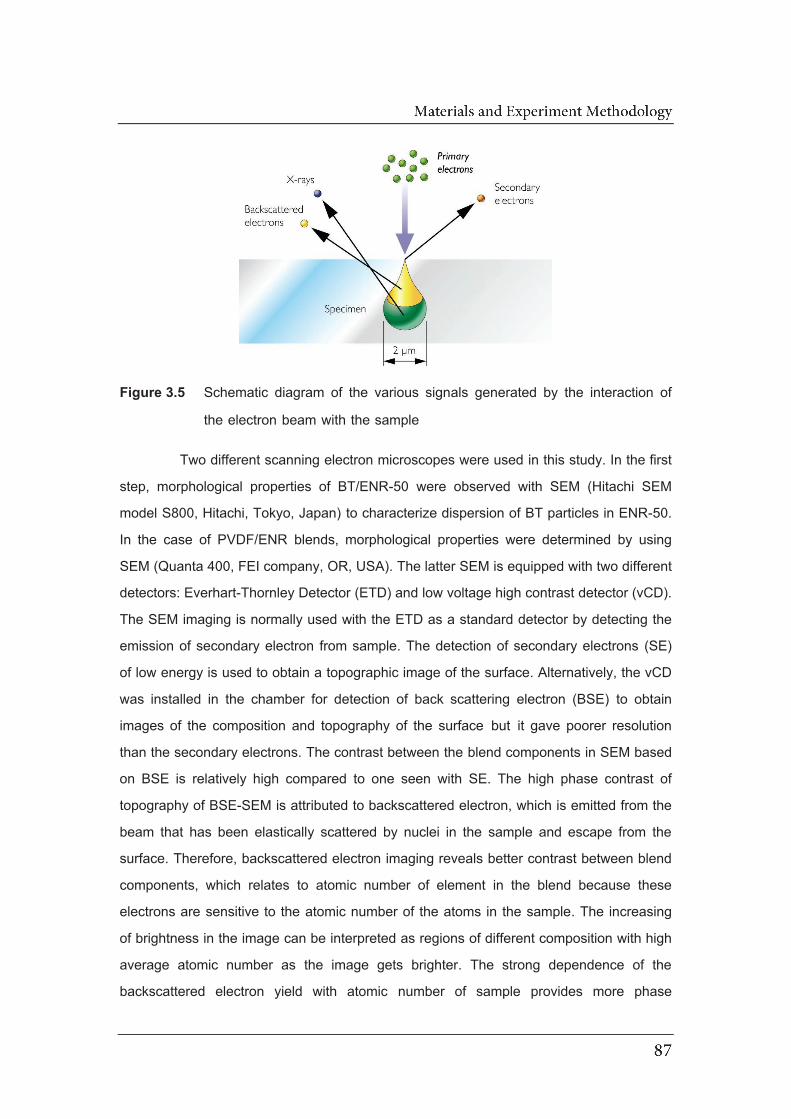
Figure 3.5 Schematic diagram of the various signals generated by the interaction of
the electron beam with the sample
Two different scanning electron microscopes were used in this study. In the first
step, morphological properties of BT/ENR-50 were observed with SEM (Hitachi SEM
model S800, Hitachi, Tokyo, Japan) to characterize dispersion of BT particles in ENR-50.
In the case of PVDF/ENR blends, morphological properties were determined by using
SEM (Quanta 400, FEI company, OR, USA). The latter SEM is equipped with two different
detectors: Everhart-Thornley Detector (ETD) and low voltage high contrast detector (vCD).
The SEM imaging is normally used with the ETD as a standard detector by detecting the
emission of secondary electron from sample. The detection of secondary electrons (SE)
of low energy is used to obtain a topographic image of the surface. Alternatively, the vCD
was installed in the chamber for detection of back scattering electron (BSE) to obtain
images of the composition and topography of the surface but it gave poorer resolution
than the secondary electrons. The contrast between the blend components in SEM based
on BSE is relatively high compared to one seen with SE. The high phase contrast of
topography of BSE-SEM is attributed to backscattered electron, which is emitted from the
beam that has been elastically scattered by nuclei in the sample and escape from the
surface. Therefore, backscattered electron imaging reveals better contrast between blend
components, which relates to atomic number of element in the blend because these
electrons are sensitive to the atomic number of the atoms in the sample. The increasing
of brightness in the image can be interpreted as regions of different composition with high
average atomic number as the image gets brighter. The strong dependence of the
backscattered electron yield with atomic number of sample provides more phase
information about the composition and surface topography as compared with secondary
electron [2].
In all cases, the samples are cryo-fractured after immersion in liquid nitrogen.
The fractured surface of rubber composites and PVDF/ENR-50 TPV are metallized with
a thin layer of gold without extraction. However, the cryo-fractured PVDF/ENR simple
blends were immersed in toluene for 72 h to extracted ENR phase in the blend, which
contains ENR concentration lower than 60 wt%. When ENR-50 becomes the matrix, it is
impossible to extract ENR-50 phase. Thus, dimethylformamide (DMF) was used to extract
PVDF phase for ENR-50-rich blend. The samples were then dried under vacuum to
remove the selective solvent.
3.3.3 Mechanical properties
3.3.3.1 Tensile properties
The purpose of the tensile tests is to determine the breaking strength and
elongation at break of a material. This allows to evaluate and compare the mechanical
behavior of various polymer composites and blends. Schematic tensile stress-strain
behavior of polymeric materials is shown in Figure 3.6.
Figure 3.6 Typical stress–strain curve for polymeric materials

The polymeric material deforms irreversibly and non-linear function in the
applied stress. The Hooke’s law is valid only in a so-called linear region and reversible
deformation curve [3]. Thus, the slope of the uniaxial stress-strain (response in the linear
region is Young's modulus (also called modulus of elasticity (E)). The value is determined
by calculating the slope of the stress-strain curve in the elastic area, The Young's modulus
(E) is obtained as follows:
where is stress, is strain, F is force (N), A is cross-section area (mm2), L0 is initial
length (mm) and L is change in length (mm).
The stress at break ( B) or tensile strength is calculated in units of force at
break (FB) per initial cross-setion area (A) of test specimen as follows:
Elongation at break ( B) is the percentage elongation at the rupture of the test
piece, expressed as change in length ( L) at the rupture compared to initial length (L):
The stress-strain curves of rubber vulcanizate were measured from the dumb-
bell shaped specimens of ASTM die type C, with a universal tensile testing machine
(Hounsfield Tensometer, model H 10KS, Hounsfield Test Equipment Surrey, U.K.). The
grip separation speed was set at 500 mm/min and initial gauge length was 25 mm,
following the American standards (ASTM D412), as shown in Figure 3.7 and Table 3.5.
Tensile testing is performed by elongating a specimen and measuring the load carried by
the specimen. Tensile properties can be extracted from the stress-strain curve.
Mechanical behavior of the simple blend and dynamically cured of PVDF/ENR
blend was measured with a universal tensile testing machine (MTS Q test 25, MTS
Systems Corporation, North Carolina, USA). The grip separation speed was set at 500
mm/min, following the French standards (NFT 51 034), as shown in Figure 3.7 and Table
3.5.
(3.4)
(3.6)
(3.5)

Figure 3.7 Standard die shape for cutting dumbbell specimens
Table 3.5 Dimensions of dumbbell test specimens
Positions Dimension (mm)
ASTM D412 NFT 51 034
A: Overall length 115 50 (±2.00)
B: Width of narrow parallel 6 (±0.05) 4 (±0.10)
C: Width at ends 25 (±1.00) 8.5 (±1.00)
D: Thickness 2.0 (±1.00) 1.5 to 3
L: Gauge length 25 (±0.25) 10
R: Large radius 25 (±2.0) 10
3.3.3.2 Tension set
Tension set is the extent to which a specimen is permanently deformed after
being stretched at a specified amount (typically 100% elongation) for a short time (10
min). After 10 min of elongation, the specimens are allowed to relax for 10 min. After the
10 min retraction, tension set is measured from the distance between bench marks and
expressed as a percentage of a final distance between the bench marks after 10 min to
original distance on the specimens as follows:
where L is final distance between the bench marks after 10 min retraction (mm) and L0
is original distance between the bench marks (mm).
(3.7)

3.3.3.3 Hardness
Hardness test method is based on the penetration of a specific type of indenter
when forced into the material under specified conditions. The indentation hardness is
inversely related to the penetration and is dependent on the elastic modulus and
viscoelastic behavior of the material. The test result is influenced by orientation, residual
stresses and morphology (supermolecular structure, filler and reinforcement) [3].
Hardness of the sample in this study was measured using an indentation
durometer shore A, according to ASTM 2240. The dimension of test specimen was at
least 6.0 mm in thickness. The test was performed at room temperature. Five
measurements at different positions on the same specimen were carried out and
arithmetic mean of the five values were reported.
3.3.4 Differential scanning calorimetry analysis
Differential scanning calorimetry (DSC) is a technique that measures the
difference in heat flow rate between a substance and a reference as a function of time
and temperature. This technique can determine various characteristic temperatures, heat
capacity, melting and crystallization temperatures, and heat of fusion, as well as the
various thermal parameters of chemical reactions at constant heating or cooling rates [4].
A DSC system consists of a sample holder and a reference which are connected with a
separate heater. In order to maintain at the same temperature, the difference in thermal
power uptake between the sample and reference pans is measured and plotted as a
function of temperature or time. When specific heat capacity of a sample changes, more
(in endothermic processes) or less (in exothermic processes) heating power is transferred
to the sample to avoid difference in temperature.
In this study, differential scanning calorimeter (DSC 2920 TA instrument, New
Castle, DE, USA) was used to determine crystallization temperature (Tc) and melting
temperature (Tm) of PVDF and its blends. The sample (around 10 mg) was sealed in
aluminum hermetic pan. The sample was first heated to 200°C to eliminate possible
thermal-mechanical histories. Measurements were carried out under helium gas
atmosphere at a scanning rate of 10°C/min in the temperature range -90 to 200°C. The
crystallization temperature (Tc) and melting temperature (Tm) were determined by cooling

and heating thermograms, respectively. The degree of crystallinity (Xc) of PVDF in the
blend has been quantitatively calculated with the following formula:
where Hm is melting enthalpy of the sample, H0 the theoretical enthalpy for 100%
crystalline PVDF (104.5 J/g) [5], mc is weight of the sample and mp is weight of PVDF in
the blends.
3.3.5 Dynamic mechanical properties
The dynamic mechanical analysis (DMA) is used to study the viscoelastic
properties of a material by measuring the dynamic modulus properties as a function of
time and temperature. A sinusoidal strain is applied on the sample, (or stress ) and
the corresponding stress, (or strain, ) developed was measured. Due to the phase ( )
shift between stress and strain, the strain and stress can be written as [3, 6].
and
Accordingly, the dynamic behavior of a polymer material can be expressed by
complex modulus (E*) which may be divided into real and imaginary components:
*
where a real part (EE ) and an imaginary part (EE ) can be distinguished:
and
The real part (EE ) is known as the storage modulus and is a measure of the
elastic character or solid-like nature of the material. The imaginary part (EE ) or the loss
modulus is a measure of the viscous character and is related to energy dissipated during
oscilation period.
(3.9)
(3.10)
(3.11)
(3.12)
(3.8)

Alternatively the material damping coefficient or loss tangent (tan ) can be
calculated by:
Dynamic mechanical analysis of natural rubber composites and blends were
characterized using a TA instrument dynamic mechanical analyzer (DMA; model Q800
New Castle, DE, USA). The storage modulus (EE ) and tan were measured in a tension
mode under the test temperature range of -90 to 100°C at a frequency of 1 Hz under
stream of liquid nitrogen. The glass transition temperature was evaluated from the
maximum position peak in tan versus temperature plots.
3.3.6 Dielectric analysis
The term dielectric analysis (DEA) refers to a group of techniques that measure
changes in different physical properties, such as polarization, permittivity, and
conductivity, with temperature or frequency. The reorientation of dipoles and the
translational diffusion of charged particles in an oscillating electric field provide the basis
of the analysis based on alternating current (AC) dielectric methods [3, 7].
The electrical properties of dielectric materials, placed between the two
electrodes, and a sinusoidal voltage is applied to one of the electrodes. The capacitance
(C) is related to the quantity of storage charges:
where is the relative permittivity or the dielectric constant, where 0 is the vacuum
permittivity (8.854x10⁻¹² F/m).
The dielectric constant or permittivity is related to polarization ability by an
applied electric field to dielectric materials. The relationship between the induced dielectric
polarization density (P) and electric field (E) are defined by following equation:
*
where * is complex permittivity of the investigated materials which can be divided into
a real part ( ) and an imaginary part ( ) of the dielectric permittivity:
(3.14)
(3.15)
(3.13)
where is proportional to the energy reversibly stored per period in the materials, also
known as the relative dielectric permittivity. is proportional to the energy dissipation per
period, also known as the dielectric loss. Furthermore, the tangent of the phase angle
between applied voltage and resulting current also term dissipation factor, result from:
where tan is a factor which provides information on the energy loss and is highly
dependent on physical conditions of the insulating material.
3.3.6.1 Polarization in polymer
The polymers are polarizable insulating materials. The polarization is the result
of load distribution mechanisms under the influence of an electric field. There are different
types of polarization along the polar or nonpolar character of the material and depending
on the frequency of the applied electric field stress. The total polarization can usually be
mainly divided into three parts: electronic, atomic and orientation (or dipole) [8], which will
depend on the applied frequency and temperature. Frequency and temperature
dependence of dielectric permittivity and loss in the presence of different polarizability are
shown in Figure 3.8.
(i) Electronic polarization results from the deformation of the electron cloud
around the core with respect to the positive nucleus of any atom by the
applied field.
(ii) Atomic polarization relates to the movement of ions and molecules. When
applying the electric field induces a dipole, the atoms move relative to
each other, giving rise to an atomic polarization.
(iii) Orientation polarization is found in certain molecules having a permanent
electric dipole moment that can change orientation in an applied electric
field.
At very low frequency and high temperature, the polarization processes are
additionally obscured by the effect of interfacial polarization and conduction
(3.17)
(3.16)

(iv) The interfacial polarization or Maxwell-Wagner-Sillars (MWS) is due to
impurities and lattice defects which introduce discontinuities polarization.
This type of bias occurs when the material has several phases of different
conductivity and permittivity.
(v) Conductivity originates from charge carrier mobility in the system at a low
frequency and high temperature. This can be considered as a DC
conduction.
Figure 3.8 Schematic presentation of the (a) frequency and (b) temperature
dependences of and for typical dielectric relaxation in polymers [7]
(a)
(b)
Generally, interfacial polarization is masked by conduction at lower frequencies
and high temperature. McCrum et al. [9] introduced the electric modulus formalism to
overcome this difficulty in evaluating interfacial polarization. Complex electric modulus M*
is defined as the reciprocal of the complex relative permittivity:
*
The M" plots effectively suppress large contributions of non-local relaxations at
low frequencies. Very important is the suppression of the strong DC conductivity signal,
appearing in the spectrum.
3.3.6.2 Dielectric relaxation
The relaxation phenomena are generally accelerated by increasing of
temperature (in isothermal plot) and frequency (in isochronal plot). In the polymers, the
temperature dependence of the relaxation time not only depends on the nature of
relaxation but also depend on the temperature and frequency range studied. Two types
of behavior are generally observed in the analysis of molecular mobility of polymers [7].
When relaxing entities associated with relaxation mode are small (fashion
secondary), the temperature dependence of log ( ) is a linear function of 1/T, it follows
Arrhenius’s law [10].
where 0 is the pre-exponential factor, Ea is the activation energy and k is the Boltzmann
constant (8.617 x 10⁻⁵ eV/K) and T is the absolute temperature
For the main mode of relaxation associated with glass rubber transition (Tg), the
dependence temperature log ( ) is a non-linear function of 1/T leading to the equation of
Vogel-Fulcher-Talmann (VFT) [10-12].
where B is an activation temperature with units of temperature and T0 is Vogel
temperature which is generally 30-70 K below Tg.
(3.18)
(3.19)
(3.20)
The temperature dependence of permittivity ( ) and loss factor ( ) of rubber
vulcanizates and polymer blends were performed by using dielectric analyzer (DEA) from
TA instrument (model DEA 2970, New Castle, DE, USA). The samples were measured
between the ceramic parallel plate with the diameter of 25 mm and thickness around 1
mm. The experiment procedures were performed at various frequencies in the
temperature range -90 to 150°C with a heating rate of 3°C. The DEA cell was purged
with nitrogen gas.
The frequency dependence of permittivity ( ) and loss factor ( ) of rubber
vulcanizates and polymer blends were performed by using broadband dielectric
spectroscopy (BDS) (Novocontrol, Germany). The samples were measured between two
electrodes with the diameter of 30 mm and thickness around 1 mm. The experiment
procedures was performed at room temperature in the frequency range 10-1 to 107 Hz.
Both sides of a sample were coated with circular 30 mm diameter aluminum electrodes
by vacuum evaporation and deposition.
3.4 References
[1] Coran, A.Y. 1995. Vulcanization: conventional and dynamic. Rubber Chem.
Technol. 68, 351-375.
[2] Sawyer, L.C., Grubb, D.T. and Meyers, G.F. 2008. Polymer Microscopy. Springer,
New York. 568.
[3] Grellmann, W. and Seidler, S. 2007. Polymer Testing. Hanser, Munich.
[4] Menczel, J.D., Judovits, L., Prime, R.B., Bair, H.E., Reading, M. and Swier, S.
2009. Differential scanning calorimetry (DSC), in Thermal Analysis of Polymers:
Fundamentals and Applications, J.D. Menczel and R.B. Prime, eds. John Wiley &
Sons, New Jersey.
[5] Xia, Q., Zhao, X.J., Chen, S.J., Ma, W.Z., Zhang, J. and Wang, X.L. 2010. Effect
of solution-blended poly (styrene-co-acrylonitrile) copolymer on crystallization of
poly (vinylidene fluoride). Express Polym. Lett. 4, 284-291.
[6] Chartoff, R.P., Menczel, J.D. and Dillman, S.H. 2009. Dynamic mechanical
analysis (DMA), in Thermal Analysis of Polymers: Fundamentals and Applications,
J.D. Menczel and R.B. Prime, eds. John Wiley & Sons, New Jersey.

[7] Vassilikou-Dova, A. and Kalogeras, I.M. 2009. Dielectric analysis (DEA), in
Thermal Analysis of Polymers: Fundamentals and Applications, J.D. Menczel and
R.B. Prime, eds. John Wiley & Sons, New Jersey.
[8] Kao, K.-C. 2004. Dielectric Phenomena in Solids: with Emphasis on Physical
Concepts of Electronic Processes. Academic Press, San Diego.
[9] MacCrum, N.G., Read, B.E. and Williams, G. 1967. Anelastic and Dielectric Effects
in Polymeric Solids. Dover Publications, New York.
[10] Nikaj, E., Stevenson-Royaud, I., Seytre, G., David, L. and Espuche, E. 2010.
Dielectric properties of polyamide 6-montmorillonite nanocomposites. J. Non-Cryst.
Solids. 356, 589-596.
[11] Pluta, M., Jeszka, J.K. and Boiteux, G. 2007. Polylactide/montmorillonite
nanocomposites: Structure, dielectric, viscoelastic and thermal properties. Eur.
Polym. J. 43, 2819-2835.
[12] Hernández, M., Carretero-González, J., Verdejo, R., Ezquerra, T.A. and López-
Manchado, M.A. 2010. Molecular dynamics of natural rubber/layered silicate
nanocomposites as studied by dielectric relaxation spectroscopy. Macromolecules.
43, 643-651.

CHAPTER 4
CHARACTERIZATION OF NATURAL RUBBER AND
EPOXIDIZED NATURAL RUBBER
4.1 Introduction
Natural rubber (NR) or cis-1,4-polyisoprene is a renewable source material used
in tremendous quantities by the medical, transportation, and defense industries because
it has excellent mechanical properties such as elasticity, resilience and abrasion
resistance. The excellence in mechanical properties of NR resulted from strain-induced
crystallization with increasing modulus on the stretching process [1, 2]. However, they are
easily attacked by oxidizing reagent, highly sensitive to sunlight exposure and they have
also poor chemical resistance to petroleum. These drawbacks are major obstruction for
using NR in many industrial applications. Thus, NR has been chemically modified to
improve these properties [3]. One of well-known alternative method for modification of
diene polymer through double bond is epoxidation. Epoxidized natural rubber (ENR) is
obtained from using hydrogen peroxide and formic acid with elevated temperature to NR
latex. The properties of NR are significant improved with degree of epoxidation. The
presence of epoxide groups in rubber molecules increases solvent resistance, wear
resistance and mechanical properties and decrease air permeability [4, 5]. Besides, the
ENR containing 50 mol% of epoxide group or ENR-50 is still a strain-induced crystallizable
rubber for giving high tensile strength and elongation at break.
In this chapter, the influence of epoxide groups in natural rubber on cure
characteristic, mechanical, dynamic mechanical and dielectric properties was studied.
Two types of epoxidized natural rubber (ENR) with 25 and 50 mol% epoxide or ENR-25
and ENR-50, respectively, were used in this study in comparison with the virgin natural
rubber (NR) without modification.

4.2 Effect of natural rubber types on properties of vulcanizate
The three types of natural rubber vulcanizate (i.e., NR, ENR-25 and ENR-50)
were prepared using methodology described in section 3.2.1. Curing characteristic, static
and dynamic mechanical properties, and dielectric analysis were then investigated.
4.2.1 Cure characteristic
The curing characteristic of elastomer yields cross-link behavior at certain curing
temperature. Figure 4.1 shows the rheograph of three types of natural based rubbers:
NR, ENR-25 and ENR-50. The plateau curing curve was observed in the gum compound
of unmodified NR but reversion phenomenon (i.e., decreasing of torque with increasing
testing time) was observed in the ENR gum compounds. This is attributed to breakdown
of monosulfidic and ether linkages, which contributes to the higher reversion in the ENR
networks [6]. The scorch time, cure time, cure rate index, maximum torque, minimum
torque and delta torque are obtained from the curing curve of elastomer. Cure
characteristics of three types of rubbers are summarized in Table 4.1. It is seen that the
ENR compounds showed shorter cure and scorch times but higher cure rate index
compared to the NR compound. This may be attributed to higher reactivity of the double
bonds adjacent to the epoxide groups in the ENR molecules [7, 8]. Furthermore, the delta
torque increased with increasing epoxide groups in the ENR molecules. The delta torque
typically relates to crosslink density in the rubber vulcanizate [9]. This indicates that ENRs
have higher crosslink density than NR vulcanizate. The high cross-link density of ENRs
is attributed to acidic byproducts containing sulfur, which induce epoxide ring-opening
reactions via ether crosslinks [9, 10].
Table 4.1 Cure characteristic of NR, ENR-25 and ENR-50 compounds
Properties Type of NR
NR ENR-25 ENR-50
Min. torque, ML (dN.m) 1.70 1.12 1.37
Max. torque, MH (dN.m) 8.80 14.69 15.41
ΔΔ Torque, MH - ML (dN.m) 7.11 13.58 14.05
Scorch time, ts1 (min) 1.00 0.43 0.43
Cure time, t90 (min) 7.00 2.67 2.57
Cure rate index, (CRI) 16.67 44.64 46.73
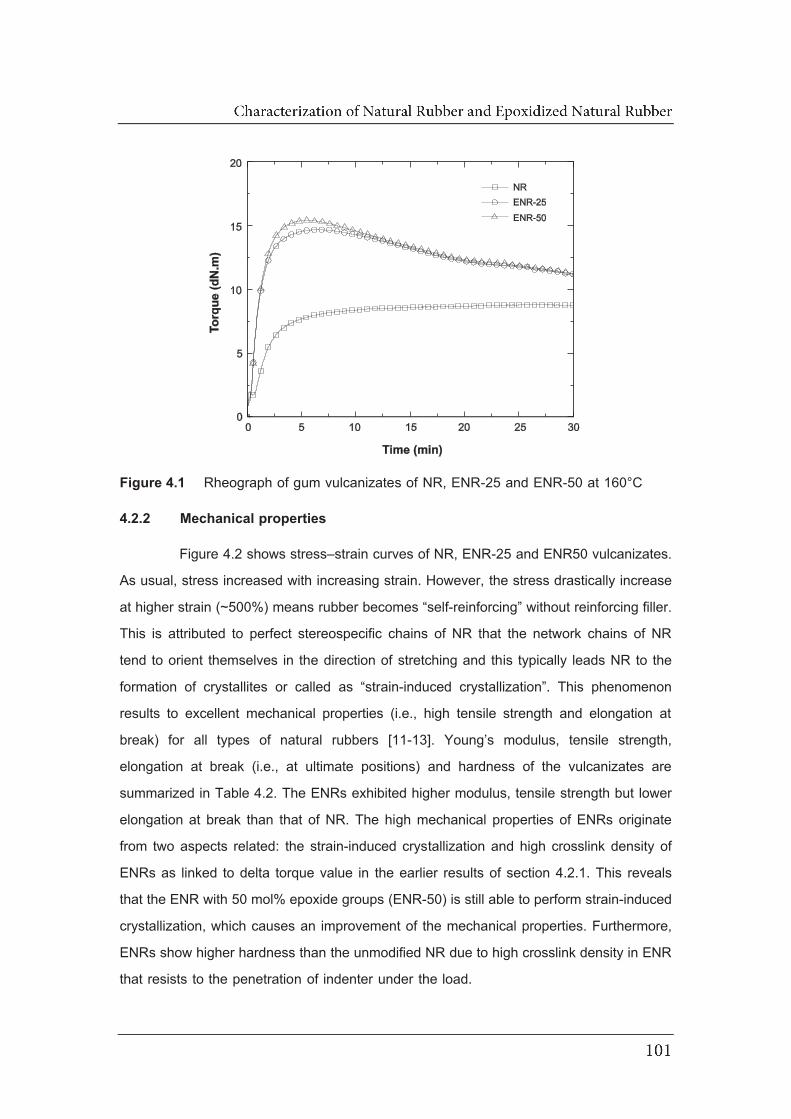
Figure 4.1 Rheograph of gum vulcanizates of NR, ENR-25 and ENR-50 at 160°C
4.2.2 Mechanical properties
Figure 4.2 shows stress–strain curves of NR, ENR-25 and ENR50 vulcanizates.
As usual, stress increased with increasing strain. However, the stress drastically increase
at higher strain (~500%) means rubber becomes “self-reinforcing” without reinforcing filler.
This is attributed to perfect stereospecific chains of NR that the network chains of NR
tend to orient themselves in the direction of stretching and this typically leads NR to the
formation of crystallites or called as “strain-induced crystallization”. This phenomenon
results to excellent mechanical properties (i.e., high tensile strength and elongation at
break) for all types of natural rubbers [11-13]. Young’s modulus, tensile strength,
elongation at break (i.e., at ultimate positions) and hardness of the vulcanizates are
summarized in Table 4.2. The ENRs exhibited higher modulus, tensile strength but lower
elongation at break than that of NR. The high mechanical properties of ENRs originate
from two aspects related: the strain-induced crystallization and high crosslink density of
ENRs as linked to delta torque value in the earlier results of section 4.2.1. This reveals
that the ENR with 50 mol% epoxide groups (ENR-50) is still able to perform strain-induced
crystallization, which causes an improvement of the mechanical properties. Furthermore,
ENRs show higher hardness than the unmodified NR due to high crosslink density in ENR
that resists to the penetration of indenter under the load.

Figure 4.2 Stress-strain curves of NR, ENR-25 and ENR-50 gum vulcanizates
Table 4.2 Mechanical properties of NR, ENR-25 and ENR-50 gum vulcanizates Type of NR Young’s modulus
(MPa) Tensile strength (MPa)
Elongation at break (%)
Hardness (Shore A)
NR 1.3 (±0.1) 17.1 (±0.8) 778 (±25) 30.0 (±0.61)
ENR-25 2.0 (±0.2) 27.3 (±1.6) 728 (±23) 34.0 (±0.79)
ENR-50 1.9 (±0.2) 26.0 (±1.5) 707 (±37) 38.0 (±0.57)
4.2.3 Dynamic mechanical analysis
Figure 4.3 shows temperature dependence of storage modulus (EE ) and loss
tangent (tan ) of NR, ENR-25 and ENR-50 vulcanizates. It is observed that the storage
modulus curve of all types of NR is divided into three regions. First, a high storage
modulus value (3000 to 7000 MPa) is observed at very low temperature period, which is
called glassy state. Second, a sharp decrease of storage modulus by three decades is
defined as glass transition region. Third, the storage modulus exhibited plateau curve
which is called rubbery state. The main data from DMA curves are presented in Table
4.3.
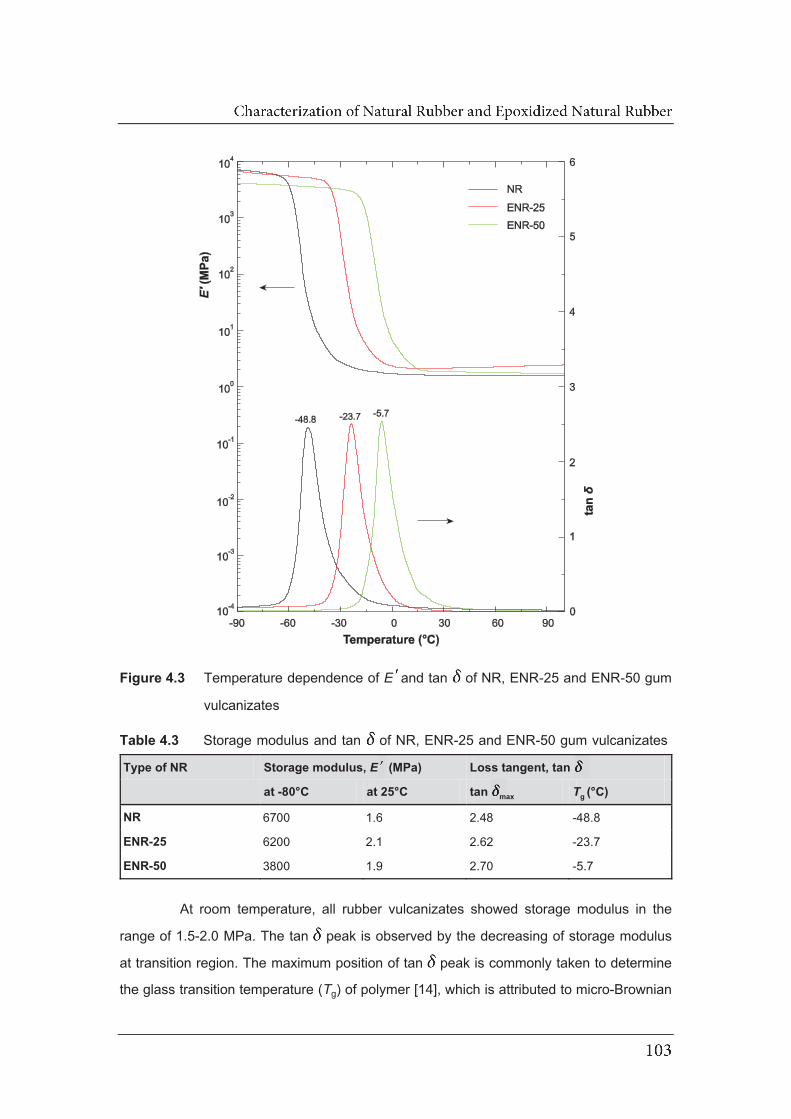
Figure 4.3 Temperature dependence of EE and tan of NR, ENR-25 and ENR-50 gum
vulcanizates
Table 4.3 Storage modulus and tan of NR, ENR-25 and ENR-50 gum vulcanizates
Type of NR Storage modulus, EE (MPa) Loss tangent, tan
at -80°C at 25°C tan max Tg (°C)
NR 6700 1.6 2.48 -48.8
ENR-25 6200 2.1 2.62 -23.7
ENR-50 3800 1.9 2.70 -5.7
At room temperature, all rubber vulcanizates showed storage modulus in the
range of 1.5-2.0 MPa. The tan peak is observed by the decreasing of storage modulus
at transition region. The maximum position of tan peak is commonly taken to determine
the glass transition temperature (Tg) of polymer [14], which is attributed to micro-Brownian

motion of main chain or also called -relaxation [15]. The transition region of storage
modulus and position of tan peak shifted to higher temperature with increasing epoxide
group as clearly seen in Figure 4.3. This indicates that glass transition temperature
increased with increasing epoxide group content because polar elastomers tend to have
relatively high Tg [16]. The relative high Tg of ENR is mainly caused by the steric
interference of the epoxide group, resulting in restriction of chain mobility because the
intermolecular forces exerted on the ENR molecules [4, 17]. The level of intermolecular
forces depends on the concentration of polar groups in the ENR molecules; higher
epoxide contents caused lower chain mobility and hence higher Tgs. The results
correspond to the work of Gelling [18] and Baker et al. [19] . Gelling [5] reported for every
mole percent increase in epoxidation, the glass transition temperature (Tg) increases by
0.93°C.
4.2.4 Dielectric analysis
The temperature dependence of permittivity ( ) and loss factor ( ) of NR,
ENR-25 and ENR-50 vulcanizates are shown in Figures 4.4 - 4.6, respectively. Molecular
relaxation is observed for NR and ENRs. At low temperature, there is a slight dependence
of permittivity on frequency and low permittivity is observed. The permittivity increases at
temperature near glass transition temperature, that corresponding to the segmental
motion of the rubber chain. At glass transition temperature, the dipoles begin to have
enough mobility to contribute to the permittivity, indicating a relaxation process. Segmental
mobility of the polymer molecules increased with increasing temperature, leading to the
increase in permittivity [20]. The step-like in and peak reveal relaxation in the
materials. The and are strongly depend on temperature and frequency. A drastic
increase of permittivity and appearance of loss factor peak is attributed to -relaxation
which associated to the glass transition region. The transition region and loss factor peak
shifted to the higher temperature with increasing frequency, because the increased
frequency results in faster movement of polymer chains, which leads to increase in
relaxation temperature, consequently shifting the maximum peak to higher temperature.
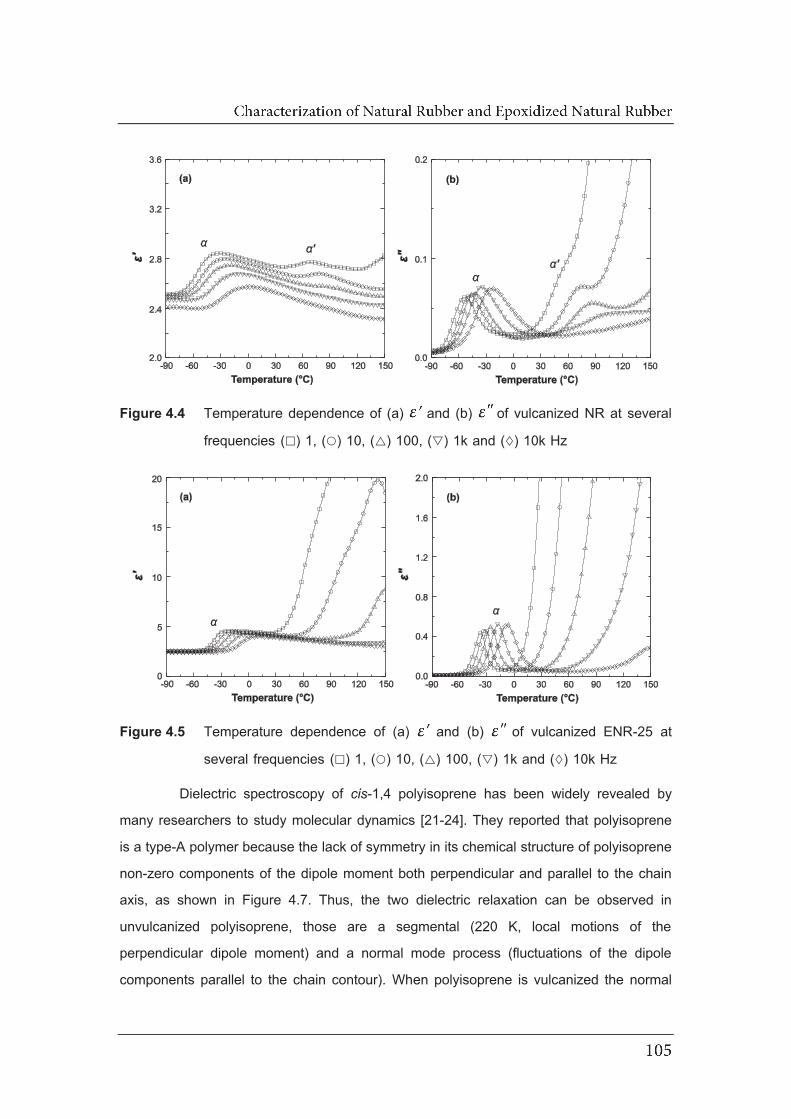
Figure 4.4 Temperature dependence of (a) and (b) of vulcanized NR at several
frequencies ( ) 1, ( ) 10, ( ) 100, ( ) 1k and ( ) 10k Hz
Figure 4.5 Temperature dependence of (a) and (b) of vulcanized ENR-25 at
several frequencies ( ) 1, ( ) 10, ( ) 100, ( ) 1k and ( ) 10k Hz
Dielectric spectroscopy of cis-1,4 polyisoprene has been widely revealed by
many researchers to study molecular dynamics [21-24]. They reported that polyisoprene
is a type-A polymer because the lack of symmetry in its chemical structure of polyisoprene
non-zero components of the dipole moment both perpendicular and parallel to the chain
axis, as shown in Figure 4.7. Thus, the two dielectric relaxation can be observed in
unvulcanized polyisoprene, those are a segmental (220 K, local motions of the
perpendicular dipole moment) and a normal mode process (fluctuations of the dipole
components parallel to the chain contour). When polyisoprene is vulcanized the normal
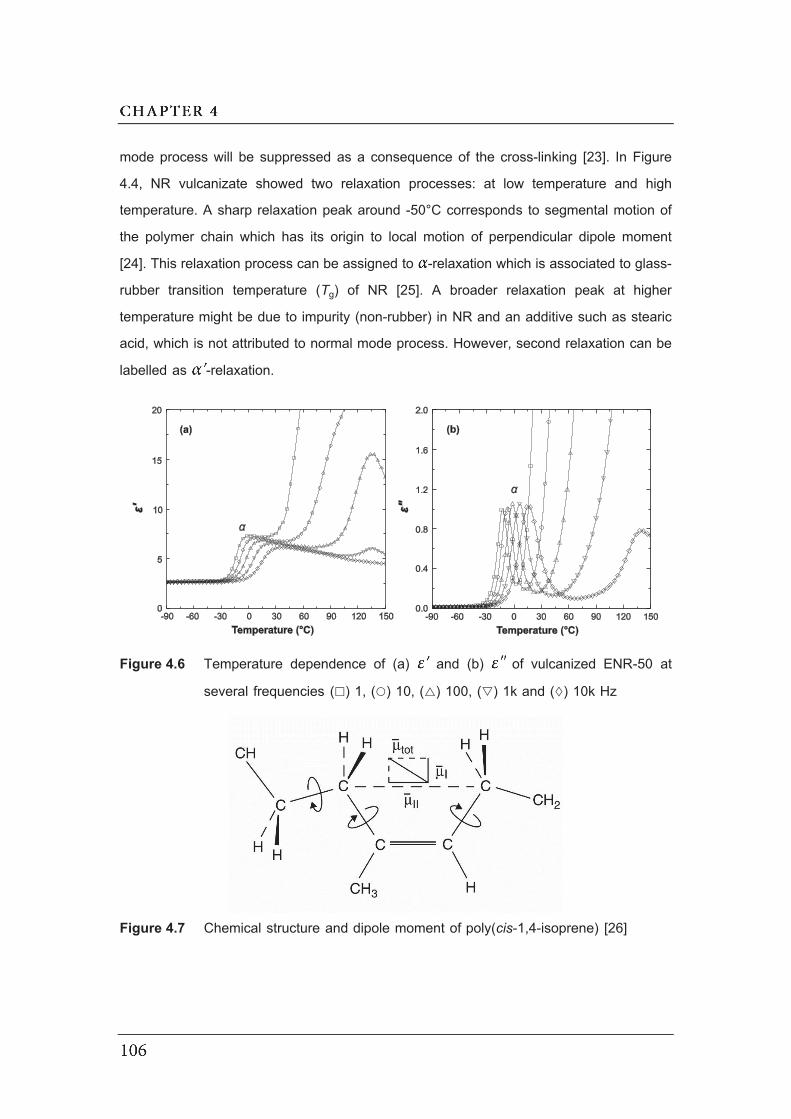
mode process will be suppressed as a consequence of the cross-linking [23]. In Figure
4.4, NR vulcanizate showed two relaxation processes: at low temperature and high
temperature. A sharp relaxation peak around -50°C corresponds to segmental motion of
the polymer chain which has its origin to local motion of perpendicular dipole moment
[24]. This relaxation process can be assigned to -relaxation which is associated to glass-
rubber transition temperature (Tg) of NR [25]. A broader relaxation peak at higher
temperature might be due to impurity (non-rubber) in NR and an additive such as stearic
acid, which is not attributed to normal mode process. However, second relaxation can be
labelled as -relaxation.
Figure 4.6 Temperature dependence of (a) and (b) of vulcanized ENR-50 at
several frequencies ( ) 1, ( ) 10, ( ) 100, ( ) 1k and ( ) 10k Hz
Figure 4.7 Chemical structure and dipole moment of poly(cis-1,4-isoprene) [26]
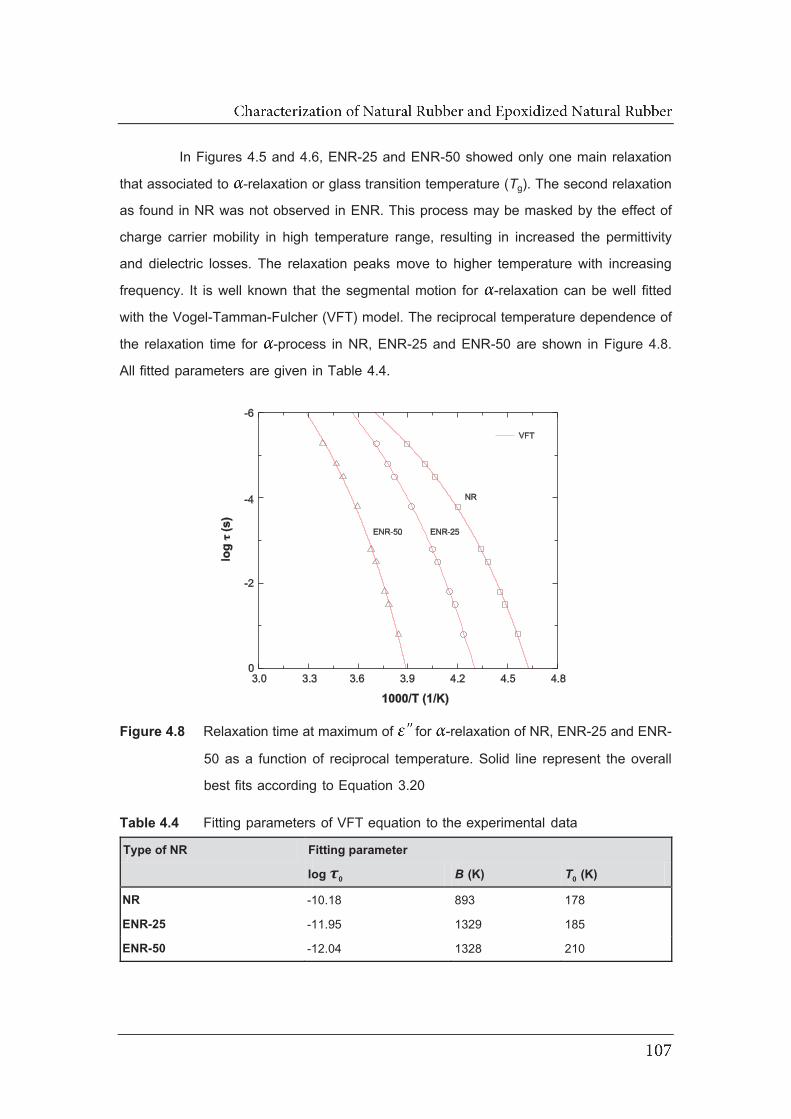
In Figures 4.5 and 4.6, ENR-25 and ENR-50 showed only one main relaxation
that associated to -relaxation or glass transition temperature (Tg). The second relaxation
as found in NR was not observed in ENR. This process may be masked by the effect of
charge carrier mobility in high temperature range, resulting in increased the permittivity
and dielectric losses. The relaxation peaks move to higher temperature with increasing
frequency. It is well known that the segmental motion for -relaxation can be well fitted
with the Vogel-Tamman-Fulcher (VFT) model. The reciprocal temperature dependence of
the relaxation time for -process in NR, ENR-25 and ENR-50 are shown in Figure 4.8.
All fitted parameters are given in Table 4.4.
Figure 4.8 Relaxation time at maximum of for -relaxation of NR, ENR-25 and ENR-
50 as a function of reciprocal temperature. Solid line represent the overall
best fits according to Equation 3.20
Table 4.4 Fitting parameters of VFT equation to the experimental data
Type of NR Fitting parameter
log τ0 B (K) T0 (K)
NR -10.18 893 178
ENR-25 -11.95 1329 185
ENR-50 -12.04 1328 210
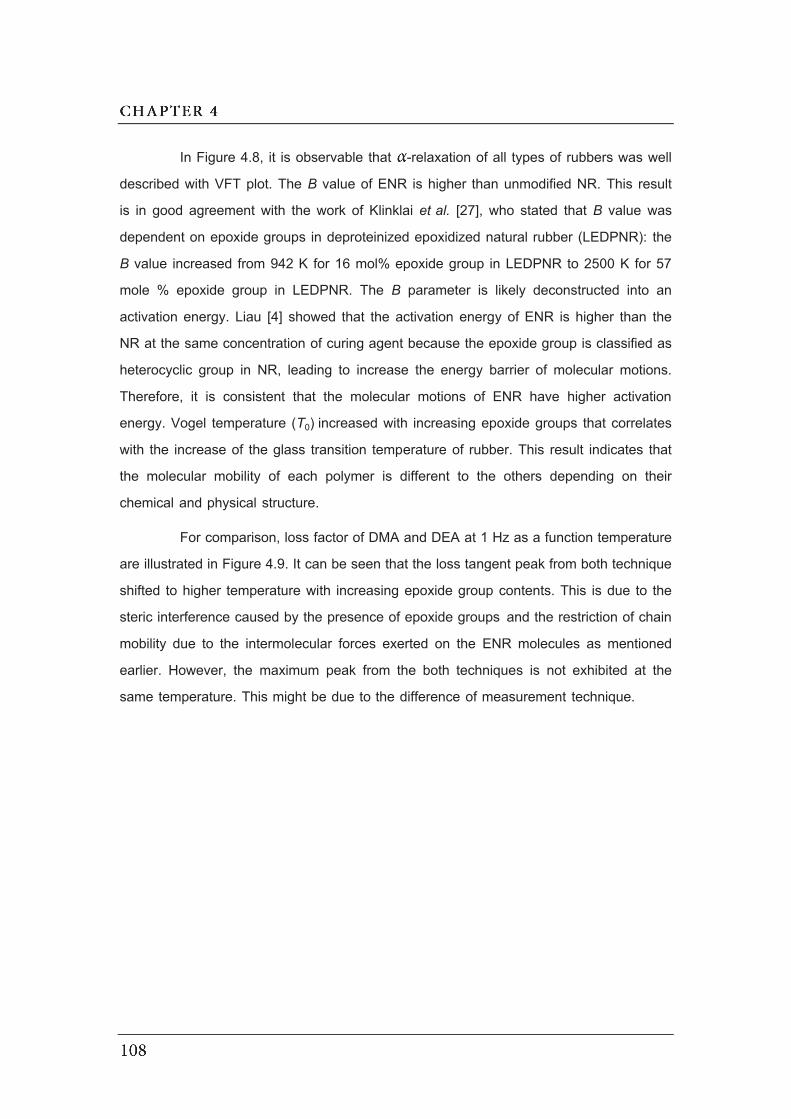
In Figure 4.8, it is observable that -relaxation of all types of rubbers was well
described with VFT plot. The B value of ENR is higher than unmodified NR. This result
is in good agreement with the work of Klinklai et al. [27], who stated that B value was
dependent on epoxide groups in deproteinized epoxidized natural rubber (LEDPNR): the
B value increased from 942 K for 16 mol% epoxide group in LEDPNR to 2500 K for 57
mole % epoxide group in LEDPNR. The B parameter is likely deconstructed into an
activation energy. Liau [4] showed that the activation energy of ENR is higher than the
NR at the same concentration of curing agent because the epoxide group is classified as
heterocyclic group in NR, leading to increase the energy barrier of molecular motions.
Therefore, it is consistent that the molecular motions of ENR have higher activation
energy. Vogel temperature (T0) increased with increasing epoxide groups that correlates
with the increase of the glass transition temperature of rubber. This result indicates that
the molecular mobility of each polymer is different to the others depending on their
chemical and physical structure.
For comparison, loss factor of DMA and DEA at 1 Hz as a function temperature
are illustrated in Figure 4.9. It can be seen that the loss tangent peak from both technique
shifted to higher temperature with increasing epoxide group contents. This is due to the
steric interference caused by the presence of epoxide groups and the restriction of chain
mobility due to the intermolecular forces exerted on the ENR molecules as mentioned
earlier. However, the maximum peak from the both techniques is not exhibited at the
same temperature. This might be due to the difference of measurement technique.
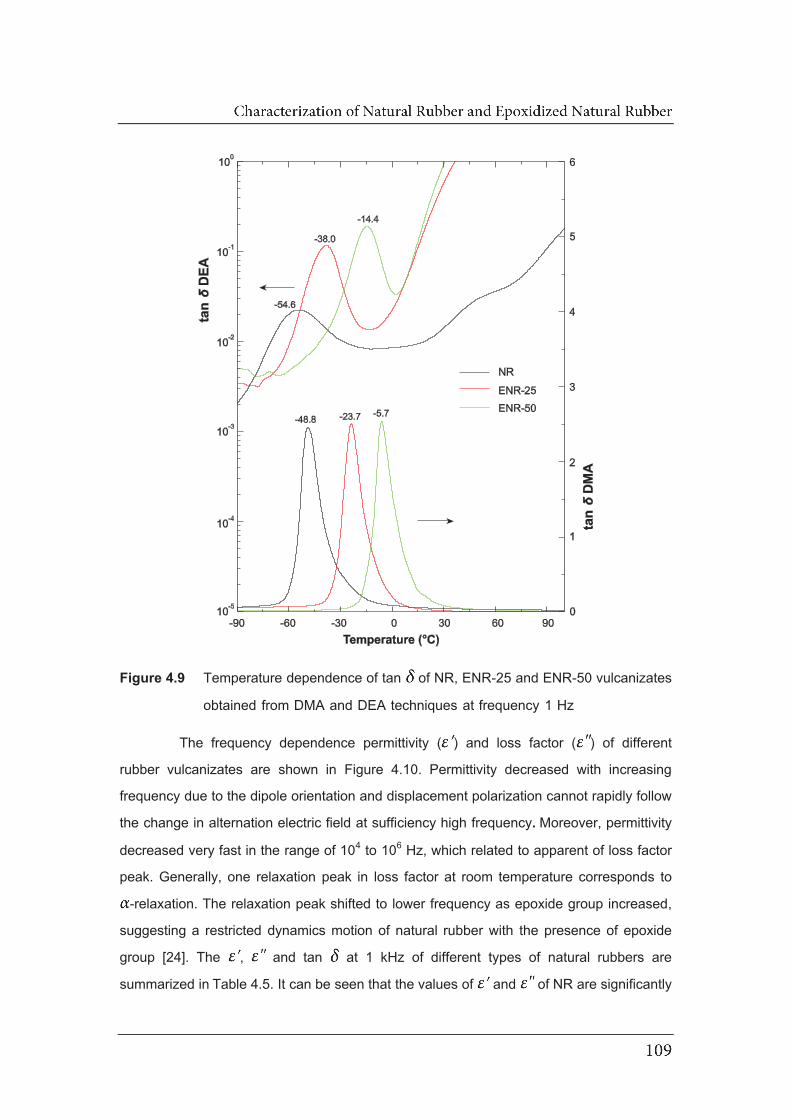
Figure 4.9 Temperature dependence of tan of NR, ENR-25 and ENR-50 vulcanizates
obtained from DMA and DEA techniques at frequency 1 Hz
The frequency dependence permittivity ( ) and loss factor ( ) of different
rubber vulcanizates are shown in Figure 4.10. Permittivity decreased with increasing
frequency due to the dipole orientation and displacement polarization cannot rapidly follow
the change in alternation electric field at sufficiency high frequency. Moreover, permittivity
decreased very fast in the range of 104 to 106 Hz, which related to apparent of loss factor
peak. Generally, one relaxation peak in loss factor at room temperature corresponds to
-relaxation. The relaxation peak shifted to lower frequency as epoxide group increased,
suggesting a restricted dynamics motion of natural rubber with the presence of epoxide
group [24]. The , and tan at 1 kHz of different types of natural rubbers are
summarized in Table 4.5. It can be seen that the values of and of NR are significantly

lower compared to ENRs one. This is attributed to difference in polarity of chain segments.
The NR segments have no polar group. Therefore, NR is a very low polarity rubber.
Naturally, the ENR-50 has much more polar than the ENR-25 due to the presence of a
larger number of epoxide groups in its structure. Generally, the high polarity in molecular
structure leads to the increase of the dielectric permittivity [28-30]. Hence, the ENR-50
shows the highest , and tan as it has the highest concentration of dipole. The
increase of dipole in ENR also leads to increase the amplitude of loss factor peak as
observed in temperature and frequency dependence curves. This has a good agreement
with the work of Furukawa et al. [31]. They reported that the peak becomes higher as
the maleic anhydride fraction increased because the dipole moment of maleic anhydride
groups contributed to the relaxation strength.
Figure 4.10 Frequency dependence of (a) and (b) of NR, ENR-25 and ENR-50
vulcanizates at room temperature
Table 4.5 Dielectric properties at frequency 1 kHz of NR, ENR-25 and ENR-50
vulcanizates
Type of NR Permittivity, Loss factor, Loss tangent, tan
NR 2.22 0.01 0.006
ENR-25 3.76 0.03 0.008
ENR-50 6.00 0.25 0.042

At low frequency and high temperature, a sharp increase of permittivity and loss
factor was observed in ENR-25 and ENR-50 (Figure 4.5, 4.6 and 4.10) confirming the
existence of conduction loss due to thermally excited ionic species which can accumulate
and become tapped at the electrode and/or at local heterogeneous interface within the
material. The interfacial polarization may arise from the additive, fillers, impurities and
heterogeneous system having different permittivity and conductivity in polymer and
polymer composites [20, 32, 33]. The high values of at high temperatures and low
frequencies can be attributed to the charge in carriers accumulating at interfaces within
the bulk of the sample (interfacial or Maxwell-Wagner-Sillars (MWS) polarization
phenomenon) and/or at the interface between the sample and the electrodes (electrode
or space charge polarization phenomenon). At high temperatures, the mainly exhibits
an increase with decreasing frequency due to the contribution of DC conductivity (σdc)
indicating the existence of space charge polarization [32]. The electric modulus formalism
can be used to exclude the electrode polarization and space charge injection phenomena.
The relaxation process is hidden by high permittivity and the loss factor can be revealed
and explained by applying electric modulus (see Equation 3.18) [20, 33, 34].
The imaginary part (MM ) versus temperature with various frequencies for NR,
ENR-25 and ENR-50 are shown in Figure 4.11. It can be seen that a new peak was
observed in experimented temperature range of MM plot, which indicates the relaxation
processes. NR showed two relaxation peaks corresponded to and -relaxation as
observed in dielectric loss factor (Figure 4.4). The two MM relaxation peaks were clearly
observed at lower and higher temperature for ENR-25 and ENR-50 vulcanizates. The
relaxation at low temperature corresponded to -relaxation process which is related to
segmental motion of molecular chain. The relaxation at high temperature was not visibly
evident in spectrum but appear in MM spectrum. This relaxation is attributed to the
conductivity (σ) because at sufficient temperature and low frequency charge transfer in
conductivity process sharply increases the dielectric value [20, 35].

Figure 4.11 Temperature dependence of MM of (a) NR, (b) ENR-25 and (c) ENR-50
vulcanizates at several frequencies ( ) 1, ( ) 10, ( ) 100, ( ) 1k and ( )
10k Hz
Furthermore, the conductivity relaxation can also be observed in frequency
domain of MM as depicted in Figure 4.12. ENR-50 shows two relaxation peaks at low and
high frequency. The narrow peak at frequency 1 Hz is associated with conductivity
relaxation. Second relaxation peak at higher frequency can be ascribed to -relaxation
process generally associated with segmental motion [35]. Nevertheless, ENR-25 shows
only one relaxation peak in experimented frequency. Therefore, conductivity peak of ENR-
25 may be observed at very low frequency (<10-1 Hz). Meanwhile, relaxation of NR in MM
as a function of frequency was not clearly observed.
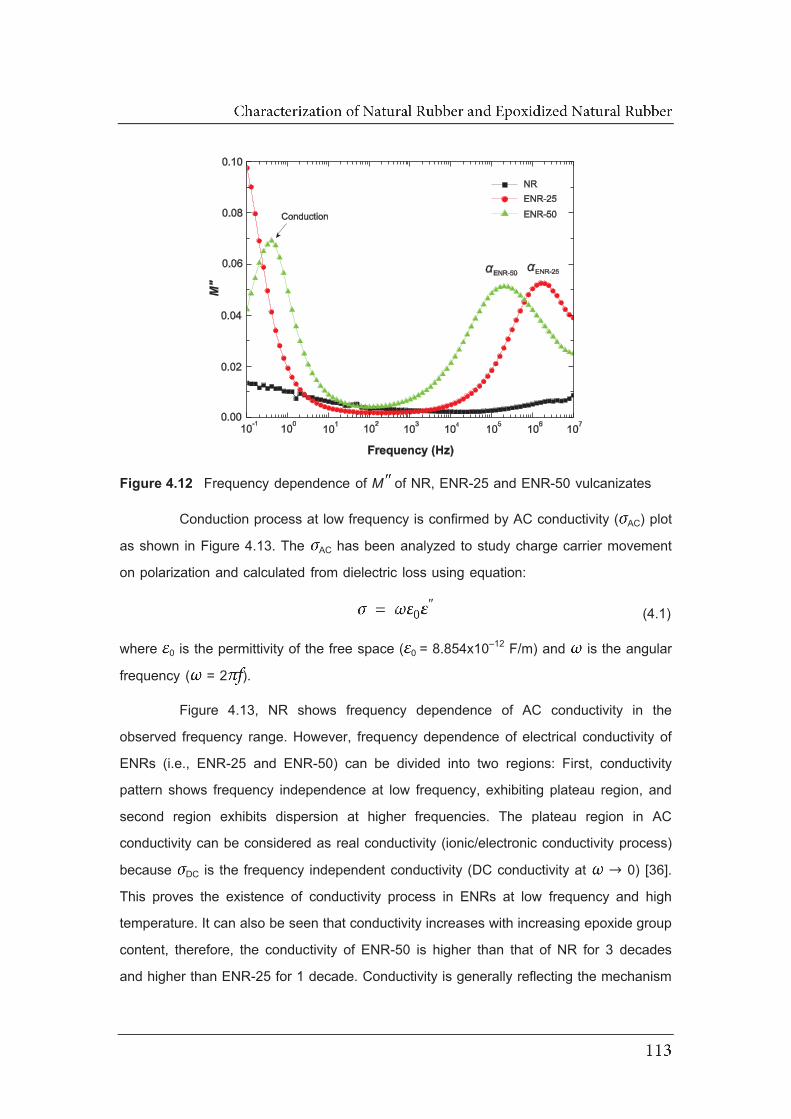
Figure 4.12 Frequency dependence of MM of NR, ENR-25 and ENR-50 vulcanizates
Conduction process at low frequency is confirmed by AC conductivity ( AC) plot
as shown in Figure 4.13. The AC has been analyzed to study charge carrier movement
on polarization and calculated from dielectric loss using equation:
″
where 0 is the permittivity of the free space ( 0 = 8.854x10⁻¹² F/m) and is the angular
frequency ( = 2 ).
Figure 4.13, NR shows frequency dependence of AC conductivity in the
observed frequency range. However, frequency dependence of electrical conductivity of
ENRs (i.e., ENR-25 and ENR-50) can be divided into two regions: First, conductivity
pattern shows frequency independence at low frequency, exhibiting plateau region, and
second region exhibits dispersion at higher frequencies. The plateau region in AC
conductivity can be considered as real conductivity (ionic/electronic conductivity process)
because DC is the frequency independent conductivity (DC conductivity at 0) [36].
This proves the existence of conductivity process in ENRs at low frequency and high
temperature. It can also be seen that conductivity increases with increasing epoxide group
content, therefore, the conductivity of ENR-50 is higher than that of NR for 3 decades
and higher than ENR-25 for 1 decade. Conductivity is generally reflecting the mechanism
(4.1)

of charge transport behavior of charge carriers. It can be concluded that at low frequency
and sufficient temperature, an ion can jump successfully from one site to its neighboring
vacant site, hence contributing to DC conductivity. The enhancement in conductivity with
epoxide group may be due to an increase in number of ions transportation.
Figure 4.13 Frequency dependence of AC conductivity of NR, ENR-25 and ENR-50
vulcanizates
The temperature dependence of MM for peak related to the conductivity process
at high temperature, can provide information of charge transport mechanisms within the
materials. Figure 4.14 shows relaxation time of conductivity process as a function of
reciprocal of temperature where solid line least square fits to experimental data points.
The conductivity relaxation shows Arrhenius type behavior indicating that relaxation is
thermally activated process. The relaxation time decreases with increasing temperature
due to enhancement of mobility of charge carriers at high temperature; the movement of
ions by hopping mechanism is more favored and leads to increase conductivity. For
Arrhenius relationship, it is stated that the nature of transportation charge carrier is similar
with the migration in ionic crystal [37]. Existence of hopping process in ENRs resulting
from oxyrane ring may act as a vacant site or empty voids in the polymer chains.
Therefore, the ions tend to occupy these neighboring vacant sites. This transportation of
charge carriers increases the conductivity and it also increases with increasing epoxide
content. The temperature dependence of dielectric relaxation time is well described by
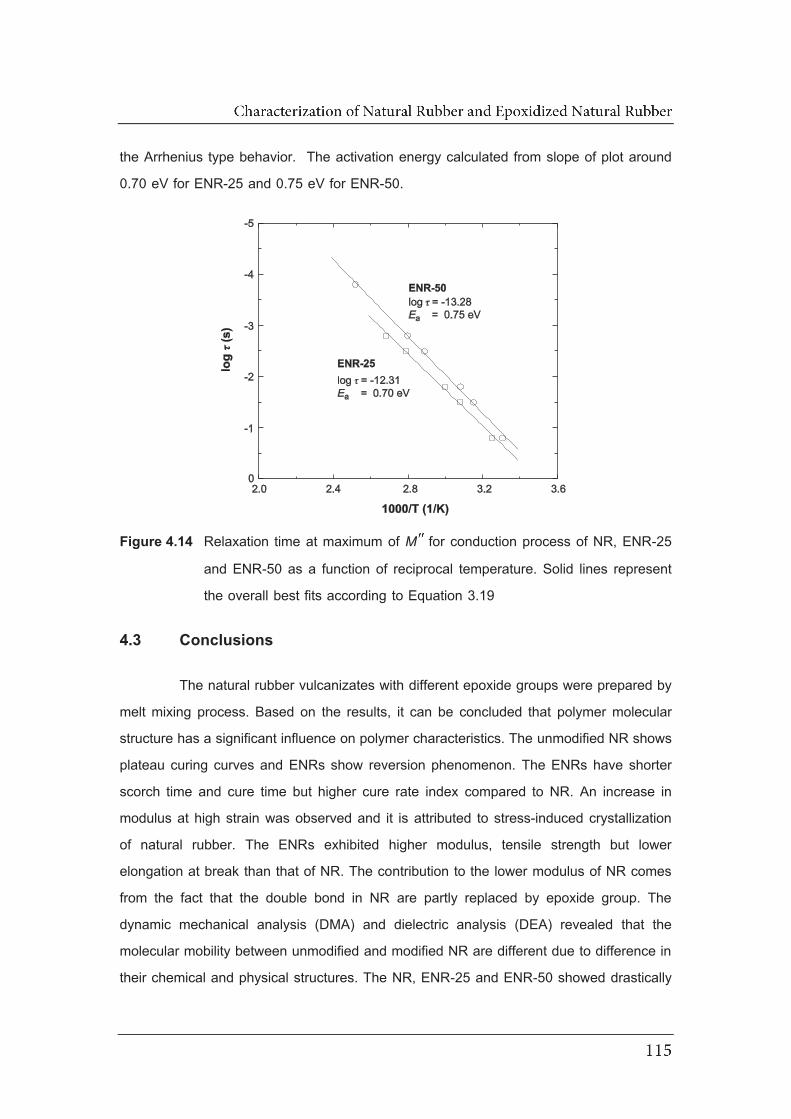
the Arrhenius type behavior. The activation energy calculated from slope of plot around
0.70 eV for ENR-25 and 0.75 eV for ENR-50.
Figure 4.14 Relaxation time at maximum of MM for conduction process of NR, ENR-25
and ENR-50 as a function of reciprocal temperature. Solid lines represent
the overall best fits according to Equation 3.19
4.3 Conclusions
The natural rubber vulcanizates with different epoxide groups were prepared by
melt mixing process. Based on the results, it can be concluded that polymer molecular
structure has a significant influence on polymer characteristics. The unmodified NR shows
plateau curing curves and ENRs show reversion phenomenon. The ENRs have shorter
scorch time and cure time but higher cure rate index compared to NR. An increase in
modulus at high strain was observed and it is attributed to stress-induced crystallization
of natural rubber. The ENRs exhibited higher modulus, tensile strength but lower
elongation at break than that of NR. The contribution to the lower modulus of NR comes
from the fact that the double bond in NR are partly replaced by epoxide group. The
dynamic mechanical analysis (DMA) and dielectric analysis (DEA) revealed that the
molecular mobility between unmodified and modified NR are different due to difference in
their chemical and physical structures. The NR, ENR-25 and ENR-50 showed drastically

decrease in storage modulus when reaching their glass transition temperature. The
relaxation peak which correspond to glass rubber transition in DMA and DEA shifts to
higher temperature as epoxide group content increased. The ENRs show conduction
process at low frequency and high temperature which was revealed by electric modulus
formalism. The relaxation time for segmental motion or -relaxation and conductivity can
be well fitted with the Vogel-Tamman-Fulcher (VFT) and Arrhenius equation, respectively.
The B and T0 were dependent on epoxide groups content in molecular chains while
activation energy of conductivity is around 0.70 eV. Furthermore, dielectric parameter (i.e.
, and tan ) and conductivity increased with increasing epoxide groups concentration
and ENR-50 shows the highest value. This result indicated that ENR-50 was suitable
polymer for preparation of high permittivity composite due to its higher mechanical
properties and dielectric permittivity than those of ENR-25 and NR.
4.4 References
[1] Mark, H.F. 2007. Encyclopedia of Polymer Science and Technology. 3rd ed. Wiley-
Interscience, New York.
[2] Eng, A.H. and Ong, E.L. 2001. Hevea natural rubber, in Handbook of elastomers,
A.K. Bhownick and H.L. Stephens, eds. Marcel Dekker, New York.
[3] Cardarelli, F. 2008. Materials Handbook: A Concise Desktop Reference. Springer,
New York.
[4] Liau, W.B. 1999. Dynamic mechanical relaxation of lightly cross-linked epoxidized
natural rubber. Polymer. 40, 599-605.
[5] Gelling, I.R. 1991. Epoxidised natural rubber. J. Nat. Rubber Res. 6, 21.
[6] Poh, B.T., Kwok, C.P. and Lim, G.H. 1995. Reversion behaviour of epoxidized
natural rubber. Eur. Polym. J. 31, 223-226.
[7] Sadequl, A.M., Ishiaku, U.S., Ismail, H. and Poh, B.T. 1998. The effect of
accelerator/sulphur ratio on the scorch time of epoxidized natural rubber. Eur.
Polym. J. 34, 51-57.
[8] Poh, B.T., Chen, M.F. and Ding, B.S. 1996. Cure characteristics of unaccelerated
sulfur vulcanization of epoxidized natural rubber. J. Appl. Polym. Sci. 60, 1569-
1574.

[9] Ismail, H. and Chia, H.H. 1998. The effects of multifunctional additive and
vulcanization systems on silica filled epoxidized natural rubber compounds. Eur.
Polym. J. 34, 1857-1863.
[10] Gelling, I.R., Porter, M. and Ad, R. 1990. Chemical modification of natural rubber.
Natural rubber science and technology, AD Roberts (ed.), Malaysian Rubber
Producers Research Association, Oxford University Press, Oxford.
[11] Trabelsi, S., Albouy, P.A. and Rault, J. 2004. Stress-induced crystallization
properties of natural and synthetic cis-polyisoprene. Rubber Chem. Technol. 77,
303-316.
[12] Tripathy, A.R., Morin, J.E., Williams, D.E., Eyles, S.J. and Farris, R.J. 2002. A
novel approach to improving the mechanical properties in recycled vulcanized
natural rubber and its mechanism. Macromolecules. 35, 4616-4627.
[13] Ozbas, B., Toki, S., Hsiao, B.S., Chu, B., Register, R.A., Aksay, I.A., Prud'homme,
R.K. and Adamson, D.H. 2012. Strain-induced crystallization and mechanical
properties of functionalized graphene sheet-filled natural rubber. J. Polym. Sci. Pol.
Phys. 50, 718-723.
[14] Zhang, X.G. and Loo, L.S. 2009. Study of glass transition and reinforcement
mechanism in polymer/layered silicate nanocomposites. Macromolecules. 42,
5196-5207.
[15] Grellmann, W. and Seidler, S. 2007. Polymer Testing. Hanser, Munich.
[16] Groves, S. 1998. Natural rubber/ENR-25 blends, in Blends of Natural Rubber, A.J.
Tinker and K.P. Jones, eds. Springer.
[17] Nakason, C., Panklieng, Y. and Kaesaman, A. 2004. Rheological and thermal
properties of thermoplastic natural rubbers based on poly(methyl
methacrylate)/epoxidized-natural-rubber blends. J. Appl. Polym. Sci. 92, 3561-
3572.
[18] Gelling, I.R. 1985. Modification of natural rubber latex with peracetic acid. Rubber
Chem. Technol. 58, 86-96.
[19] Baker, C.S.L., Gelling, I.R. and Newell, R. 1985. Epoxidized natural rubber.
Rubber Chem. Technol. 58, 67-85.
[20] Hammami, H., Arous, M., Lagache, M. and Kallel, A. 2007. Study of the interfacial
MWS relaxation by dielectric spectroscopy in unidirectional PZT fibres/epoxy resin
composites. J. Alloys Compd. 430, 1-8.
[21] Ortiz-Serna, P., Díaz-Calleja, R., Sanchis, M.J., Floudas, G., Nunes, R.C.,
Martins, A.F. and Visconte, L.L. 2010. Dynamics of natural rubber as a function of
frequency, temperature, and pressure. a dielectric spectroscopy investigation.
Macromolecules. 43, 5094-5102.
[22] Ortiz-Serna, P., Díaz-Calleja, R., Sanchis, M.J., Riande, E., Nunes, R., Martins,
A. and Visconte, L. 2011. Dielectric spectroscopy of natural rubber-cellulose II
nanocomposites. J. Non-Cryst. Solids. 357, 598-604.
[23] Fragiadakis, D., Bokobza, L. and Pissis, P. 2011. Dynamics near the filler surface
in natural rubber-silica nanocomposites. Polymer. 52, 3175-3182.
[24] Hernández, M., Ezquerra, T.A., Verdejo, R. and López-Manchado, M.A. 2012.
Role of vulcanizing additives on the segmental dynamics of natural rubber.
Macromolecules. 45, 1070-1075.
[25] Hernández, M., López-Manchado, M.A., Sanz, A., Nogales, A. and Ezquerra, T.A.
2011. Effects of strain-induced crystallization on the segmental dynamics of
vulcanized natural rubber. Macromolecules. 44, 6574-6580.
[26] Kremer, F. 2007. Broadband dielectric spectroscopy to study the molecular
dynamics of polymers having different molecular architectures, in Physical
Properties of Polymers Handbook. Springer, New York.
[27] Klinklai, W., Kawahara, S., Marwanta, E., Mizumo, T., Isono, Y. and Ohno, H.
2006. Ionic conductivity of highly deproteinized natural rubber having various
amount of epoxy group mixed with lithium salt. Solid State Ionics. 177, 3251-3257.
[28] Madbouly, S.A. and Otaigbe, J.U. 2007. Broadband dielectric spectroscopy of
nanostructured maleated polypropylene/polycarbonate blends prepared by in situ
polymerization and compatibilization. Polymer. 48, 4097-4107.
[29] Popielarz, R., Chiang, C.K., Nozaki, R. and Obrzut, J. 2001. Dielectric properties
of polymer/ferroelectric ceramic composites from 100 Hz to 10 GHz.
Macromolecules. 34, 5910-5915.
[30] Leu, C.M., Chang, Y.T. and Wei, K.H. 2003. Polyimide-side-chain tethered
polyhedral oligomeric silsesquioxane nanocomposites for low-dielectric film
applications. Chem. Mater. 15, 3721-3727.
[31] Furukawa, T., Yuruzume, H., Kimura, T. and Matsuura, S. 1994. Dielectric
investigation of polypropylene grafted with maleic anhydride. 8th International
Symposium on Electrets (ISE 8), 450-454.
[32] Khazaka, R., Locatelli, M.L., Diaham, S., Bidan, P., Dupuy, L. and Grosset, G.
2013. Broadband dielectric spectroscopy of BPDA/ODA polyimide films. J. Phys.
D: Appl. Phys. 46.
[33] Wang, M.-J. 1998. Effect of polymer-filler and filler-filler interactions on dynamic
properties of filled vulcanizates. Rubber Chem. Technol. 71, 520-589.
[34] Kontos, G.A., Soulintzis, A.L., Karahaliou, P.K., Psarras, G.C., Georga, S.N.,
Krontiras, C.A. and Pisanias, M.N. 2007. Electrical relaxation dynamics in TiO2 -
polymer matrix composites. Express Polym. Lett. 1, 781-789.
[35] Adohi, B.J.P. and Brosseau, C. 2009. Dielectric relaxation in particle-filled polymer:
Influence of the filler particles and thermal treatments. J. Appl. Phys. 105.
[36] Sohi, N.J.S., Bhadra, S. and Khastgir, D. 2011. The effect of different carbon fillers
on the electrical conductivity of ethylene vinyl acetate copolymer-based composites
and the applicability of different conductivity models. Carbon. 49, 1349-1361.
[37] Ramesh, S., Liew, C.W. and Ramesh, K. 2013. Ionic conductivity, dielectric
behavior, and HATR–FTIR analysis onto poly(methyl methacrylate)–poly(vinyl
chloride) binary solid polymer blend electrolytes. J. Appl. Polym. Sci. 127, 2380-
2388.

CHAPTER 5
FLEXIBLE CERAMIC-POLYMER COMPOSITES
BASED ON BT/ENR-50 COMPOSITES
5.1 Introduction
Polymer composites incorporating reinforcing and non-reinforcing fillers have
been consistently investigated to create useful property of the combinations. Their typical
modified characteristics include stiffness, stability, coloring and anti-static properties.
Ferroelectric ceramics are one type of filler which can be used to prepare ceramic-polymer
composites for dielectric permittivity improvement. They have been used in various
applications: multi-layer ceramics capacitors (MLCC), piezoelectric sensors, transducers,
actuators, and microelectromechanical systems (MEMS) because they typically exhibit
high dielectric constant and piezoelectric coefficient [1]. On the other hand polymers
provide excellent flexibility and are easy to process, but generally have low dielectric
constant. The synthesis of ferroelectric ceramic-polymer composites strives to combine
some electrical properties of the ceramic with the viscoelastic properties of the polymer
matrix. In prior studies, such 0-3 structured hybrid materials have provided stiffness and
high permittivity from the ceramic part and excellent flexibility and strength from the
polymer part. These composites are essential in various applications such as flexible
capacitors, sensors, and piezoelectric and pyroelectric devices [2-4]. Recently,
ferroelectric ceramic-polymers based on poly(vinylidene fluoride) and its copolymers have
been reported that these materials have high permittivity and dielectric strength [5, 6].
Some other semi-crystalline and amorphous polymers, such as polyimide [7], and
poly(methyl methacrylate) (PMMA) [8] have also been used to prepare ceramic-polymer
composite. The fabrication of ceramic-containing composites based on thermoset
polymers such as epoxy [9, 10], cross-linked silicone rubber [11], and ethylene-vinyl
acetate elastomer (EVA) [12] have been prepared and reached relatively low degradation
and high flexibility. Besides, epoxidized natural rubber (ENR) is a modified natural rubber
containing epoxide groups in its molecular backbone. In our previous chapter and work,
the presence of epoxide groups in isoprene units was found to enhance mechanical
properties and dielectric permittivity of ENR. ENR-50 (containing 50 mol% epoxide) has
the highest dielectric constant in comparison with unmodified natural rubber and ENR-25
(containing 25 mol% epoxide) [13]. Therefore, the high mechanical strength, flexibility and
high dielectric permittivity of ENR-50 make it a prime candidate for the synthesis of
ceramic-polymer composites with high dielectric constant.
The aim of this chapter is to investigate the use of barium titanate (BT) particle,
which was prepared through solid state reaction technique. The XRD, microstructure and
dielectric properties were used to verify the BT characteristics for fabricating ceramic-
polymer composite. The composites of BT with ENR-50 were prepared by melt-mixing
method. The effect of loading level of BT particle in ENR-50 on curing, morphological,
static and dynamic mechanical, dielectric properties was investigated and discussed.
5.2 Barium titanate characterization
Preparation of barium titanate ceramic (BaTiO3 or BT) has been described in
section 3.2.2. Microstructure and dielectric properties of prepared barium titanate were
investigated.
5.2.1 XRD pattern
The BT were prepared by using solid state technique. The phases involved in
formation of the BT were examined by XRD technique as the patterns shown in Figure
5.1. It can be seen that the mixed powders of BaCO3|TiO2 exhibited the different XRD
patterns compared to the BT product. The structure of BT was found at peak of 22.02°,
22.23°, 31.49°, 31.65°, 38.89°, 44.90°, 45.37°, 50.98°, 55.27°, and 56.27° which
corresponded to the (0 0 1), (1 0 0), (1 0 1), (1 1 0), (1 1 1), (0 0 2), (2 0 0), (2 0 1), (1
1 2), and (2 1 1) planes of perovskite structure, respectively. Furthermore, the results in
Figure 5.1 agreed with the XRD data of BT reported in the JCPDS (Joint Committee on
Powder Diffraction Standards) file number 01-075-0583, which is proved that the reaction
of BaCO3 and TiO2 at 1100°C yielded BT product.

Figure 5.1 XRD patterns of mixed BaCO3+TiO2 and BaTiO3
5.2.2 Microstructure of barium titanate
The microstructure of BT was investigated using scanning electron
microscope (SEM) and particle size distribution studies as the results shown in Figure
5.2. The SEM and particle size distribution studies on the powder prepared BT show that
agglomerate size distribution of the prepared powder is large distribution and the powder
crushed by conventional ball mill consists of agglomerated particles with an average
particle size of about 4.5 m.
Figure 5.2 (a) SEM micrograph and (b) particle size distribution of BT powders
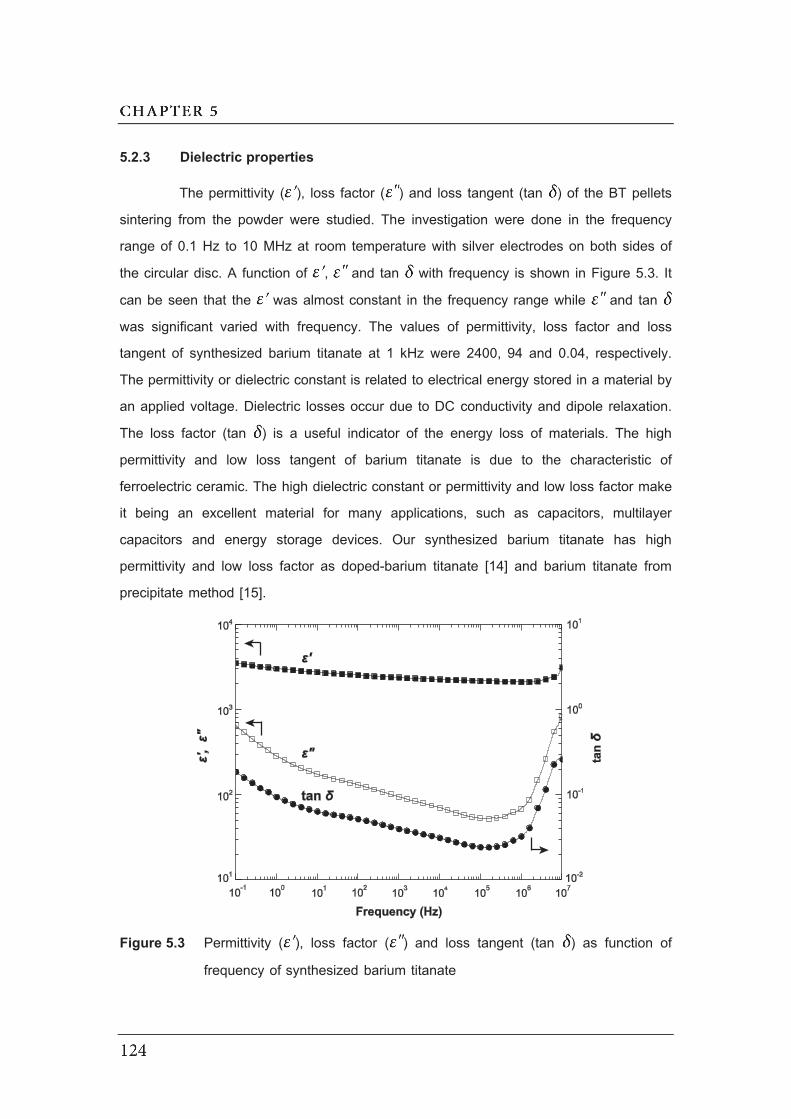
5.2.3 Dielectric properties
The permittivity ( ), loss factor ( ) and loss tangent (tan ) of the BT pellets
sintering from the powder were studied. The investigation were done in the frequency
range of 0.1 Hz to 10 MHz at room temperature with silver electrodes on both sides of
the circular disc. A function of , and tan with frequency is shown in Figure 5.3. It
can be seen that the was almost constant in the frequency range while and tan
was significant varied with frequency. The values of permittivity, loss factor and loss
tangent of synthesized barium titanate at 1 kHz were 2400, 94 and 0.04, respectively.
The permittivity or dielectric constant is related to electrical energy stored in a material by
an applied voltage. Dielectric losses occur due to DC conductivity and dipole relaxation.
The loss factor (tan ) is a useful indicator of the energy loss of materials. The high
permittivity and low loss tangent of barium titanate is due to the characteristic of
ferroelectric ceramic. The high dielectric constant or permittivity and low loss factor make
it being an excellent material for many applications, such as capacitors, multilayer
capacitors and energy storage devices. Our synthesized barium titanate has high
permittivity and low loss factor as doped-barium titanate [14] and barium titanate from
precipitate method [15].
Figure 5.3 Permittivity ( ), loss factor ( ) and loss tangent (tan ) as function of
frequency of synthesized barium titanate
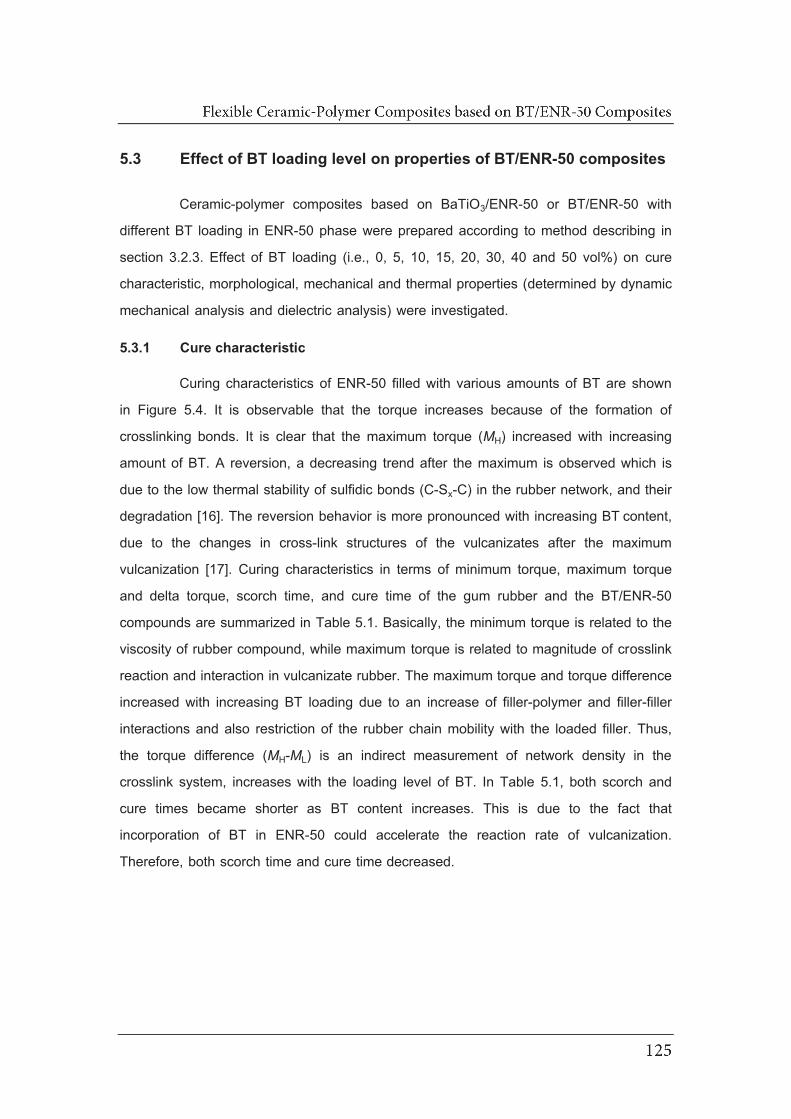
5.3 Effect of BT loading level on properties of BT/ENR-50 composites
Ceramic-polymer composites based on BaTiO3/ENR-50 or BT/ENR-50 with
different BT loading in ENR-50 phase were prepared according to method describing in
section 3.2.3. Effect of BT loading (i.e., 0, 5, 10, 15, 20, 30, 40 and 50 vol%) on cure
characteristic, morphological, mechanical and thermal properties (determined by dynamic
mechanical analysis and dielectric analysis) were investigated.
5.3.1 Cure characteristic
Curing characteristics of ENR-50 filled with various amounts of BT are shown
in Figure 5.4. It is observable that the torque increases because of the formation of
crosslinking bonds. It is clear that the maximum torque (MH) increased with increasing
amount of BT. A reversion, a decreasing trend after the maximum is observed which is
due to the low thermal stability of sulfidic bonds (C-Sx-C) in the rubber network, and their
degradation [16]. The reversion behavior is more pronounced with increasing BT content,
due to the changes in cross-link structures of the vulcanizates after the maximum
vulcanization [17]. Curing characteristics in terms of minimum torque, maximum torque
and delta torque, scorch time, and cure time of the gum rubber and the BT/ENR-50
compounds are summarized in Table 5.1. Basically, the minimum torque is related to the
viscosity of rubber compound, while maximum torque is related to magnitude of crosslink
reaction and interaction in vulcanizate rubber. The maximum torque and torque difference
increased with increasing BT loading due to an increase of filler-polymer and filler-filler
interactions and also restriction of the rubber chain mobility with the loaded filler. Thus,
the torque difference (MH-ML) is an indirect measurement of network density in the
crosslink system, increases with the loading level of BT. In Table 5.1, both scorch and
cure times became shorter as BT content increases. This is due to the fact that
incorporation of BT in ENR-50 could accelerate the reaction rate of vulcanization.
Therefore, both scorch time and cure time decreased.
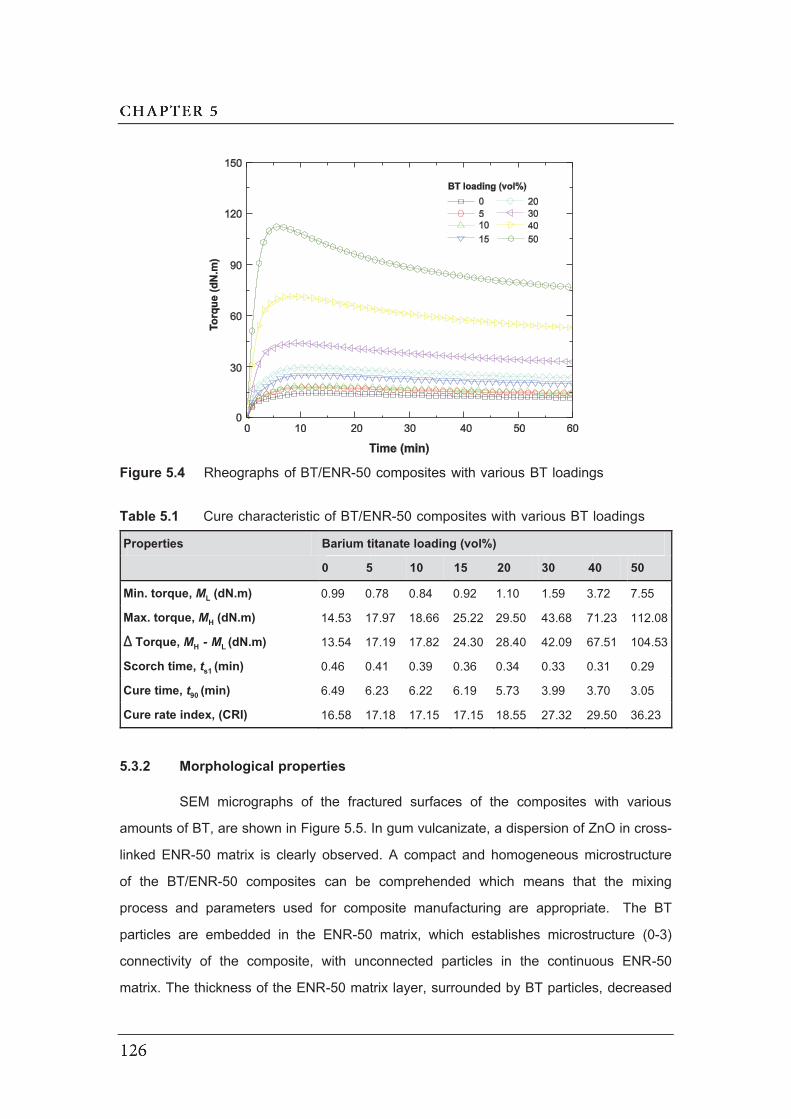
Figure 5.4 Rheographs of BT/ENR-50 composites with various BT loadings
Table 5.1 Cure characteristic of BT/ENR-50 composites with various BT loadings
Properties Barium titanate loading (vol%)
0 5 10 15 20 30 40 50
Min. torque, ML (dN.m) 0.99 0.78 0.84 0.92 1.10 1.59 3.72 7.55
Max. torque, MH (dN.m) 14.53 17.97 18.66 25.22 29.50 43.68 71.23 112.08
ΔΔ Torque, MH - ML (dN.m) 13.54 17.19 17.82 24.30 28.40 42.09 67.51 104.53
Scorch time, ts1 (min) 0.46 0.41 0.39 0.36 0.34 0.33 0.31 0.29
Cure time, t90 (min) 6.49 6.23 6.22 6.19 5.73 3.99 3.70 3.05
Cure rate index, (CRI) 16.58 17.18 17.15 17.15 18.55 27.32 29.50 36.23
5.3.2 Morphological properties
SEM micrographs of the fractured surfaces of the composites with various
amounts of BT, are shown in Figure 5.5. In gum vulcanizate, a dispersion of ZnO in cross-
linked ENR-50 matrix is clearly observed. A compact and homogeneous microstructure
of the BT/ENR-50 composites can be comprehended which means that the mixing
process and parameters used for composite manufacturing are appropriate. The BT
particles are embedded in the ENR-50 matrix, which establishes microstructure (0-3)
connectivity of the composite, with unconnected particles in the continuous ENR-50
matrix. The thickness of the ENR-50 matrix layer, surrounded by BT particles, decreased

when the BT concentration increased. Enlarged image in Figure 5.6 shows that the
average diameter of BT particles in ENR-50 matrix was less than 1 m (1000 nm) and
their agglomerate formation was visibly observed particularly at high loading level. At low
particle loadings (10 and 15 vol%), the ceramic powder is uniformly dispersed in the ENR-
50 matrix without apparent agglomeration. However, at higher loading levels,
agglomeration of BT in composites was observed (encircled in Figures 5.5(f), (g) and (h))
due to decreasing of inter-particle distance and thus filler particles become closer. At 40
and 50 vol% loading level of BT (arrows in Figure 5.5(g) and (h)) the thin film becomes
porous. This is due to poor adhesion between the polymer matrix and the ceramic
particles. The particle dispersion, volume percent of particle, connectivity of phase and
particle-matrix reinforcement play important roles in both electrical and mechanical
properties of the composites.
Figure 5.5 SEM micrographs of BT/ENR-50 composites with various BT loadings (a)
0, (b) 5, (c) 10, (d) 15, (e) 20, (f) 30, (g) 40 and (h) 50 vol%

Figure 5.6 Enlarged SEM micrographs of BT/ENR-50 composites with (a) 10 and (b)
50, vol% of BT
5.3.3 Mechanical properties
The stress-strain curves of gum and BT filled ENR-50 vulcanizates are shown
in Figure 5.7. The ENR-50 gum vulcanizate exhibited flexibility (i.e., high elongation at
break) and high mechanical strength (i.e., high stress at break) due to the typical
orientation of natural rubber molecules. Incorporation of filler particles in ENR-50
enhanced the material stiffness (i.e., increasing initial slope of the curves) however, it
reduced the flexibility (decreases in elongation at break) due to poorer molecular chains
mobility. Therefore, the stiffness of composites is higher than that of the gum vulcanizate
which can be estimated from Young’s modulus and hardness, as shown in Table 5.2.
Both the Young’s modulus and hardness increased with increasing BT content. This is
attributed to the filler-polymer and filler-filler interactions in the composite that limit mobility
of polymer molecules. This result agrees well with increasing of delta torque in Table 5.1.
In Figure 5.7, it is seen that the composites retained good flexibility even at a loading
level of 40 vol%: the elongation at break is higher than 100%. However, at a loading level
of 50 vol%, flexibility became low and the material was ductile. Mechanical properties in
terms of tensile strength and elongation at break, based on the failure points of stress–
strain curves in Figure 5.7, are graphed in Figure 5.8. An increasing volume fraction of
BT was associated with decreasing tensile strength and elongation at break. In summary,
BT particles in ENR-50 matrix enhanced modulus or stiffness but deteriorated tensile
strength and elongation at break. Especially, at BT content higher than 30 vol%,
elongation at break drastically decreased from 508% (for 30 vol%) to 114% (for 40 vol%).
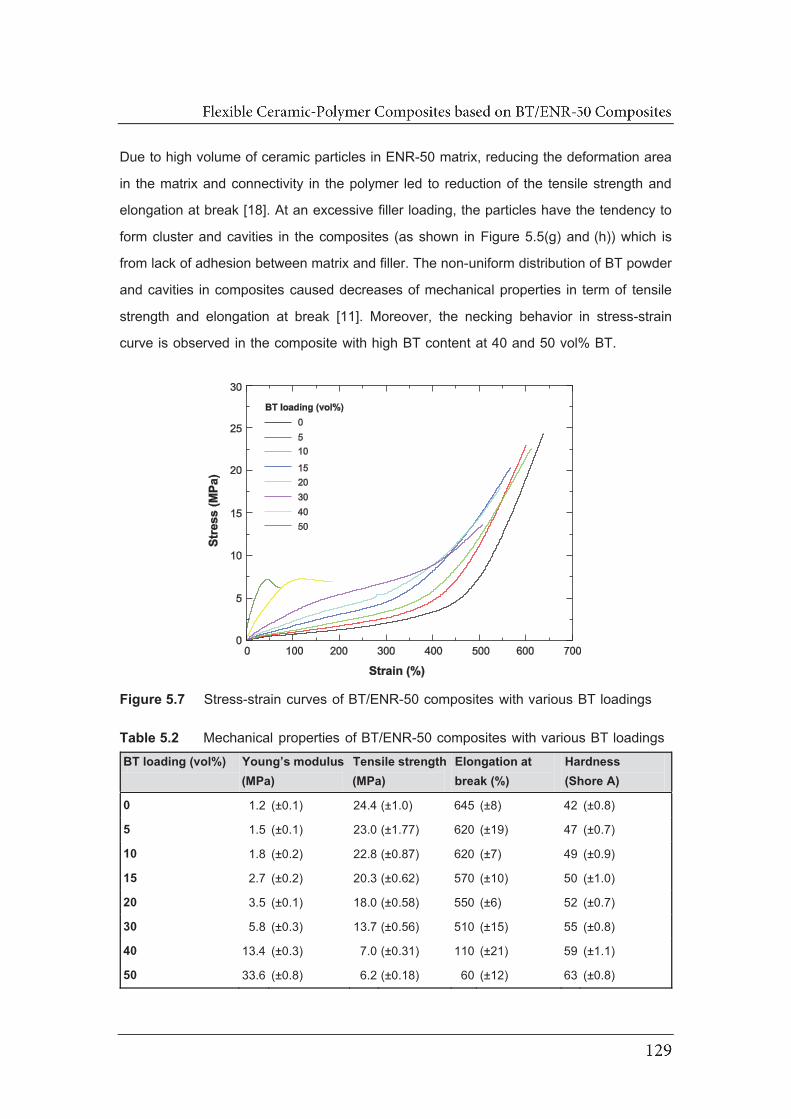
Due to high volume of ceramic particles in ENR-50 matrix, reducing the deformation area
in the matrix and connectivity in the polymer led to reduction of the tensile strength and
elongation at break [18]. At an excessive filler loading, the particles have the tendency to
form cluster and cavities in the composites (as shown in Figure 5.5(g) and (h)) which is
from lack of adhesion between matrix and filler. The non-uniform distribution of BT powder
and cavities in composites caused decreases of mechanical properties in term of tensile
strength and elongation at break [11]. Moreover, the necking behavior in stress-strain
curve is observed in the composite with high BT content at 40 and 50 vol% BT.
Figure 5.7 Stress-strain curves of BT/ENR-50 composites with various BT loadings
Table 5.2 Mechanical properties of BT/ENR-50 composites with various BT loadings BT loading (vol%) Young’s modulus
(MPa) Tensile strength (MPa)
Elongation at break (%)
Hardness (Shore A)
0 1.2 (±0.1) 24.4 (±1.0) 645 (±8) 42 (±0.8)
5 1.5 (±0.1) 23.0 (±1.77) 620 (±19) 47 (±0.7)
10 1.8 (±0.2) 22.8 (±0.87) 620 (±7) 49 (±0.9)
15 2.7 (±0.2) 20.3 (±0.62) 570 (±10) 50 (±1.0)
20 3.5 (±0.1) 18.0 (±0.58) 550 (±6) 52 (±0.7)
30 5.8 (±0.3) 13.7 (±0.56) 510 (±15) 55 (±0.8)
40 13.4 (±0.3) 7.0 (±0.31) 110 (±21) 59 (±1.1)
50 33.6 (±0.8) 6.2 (±0.18) 60 (±12) 63 (±0.8)
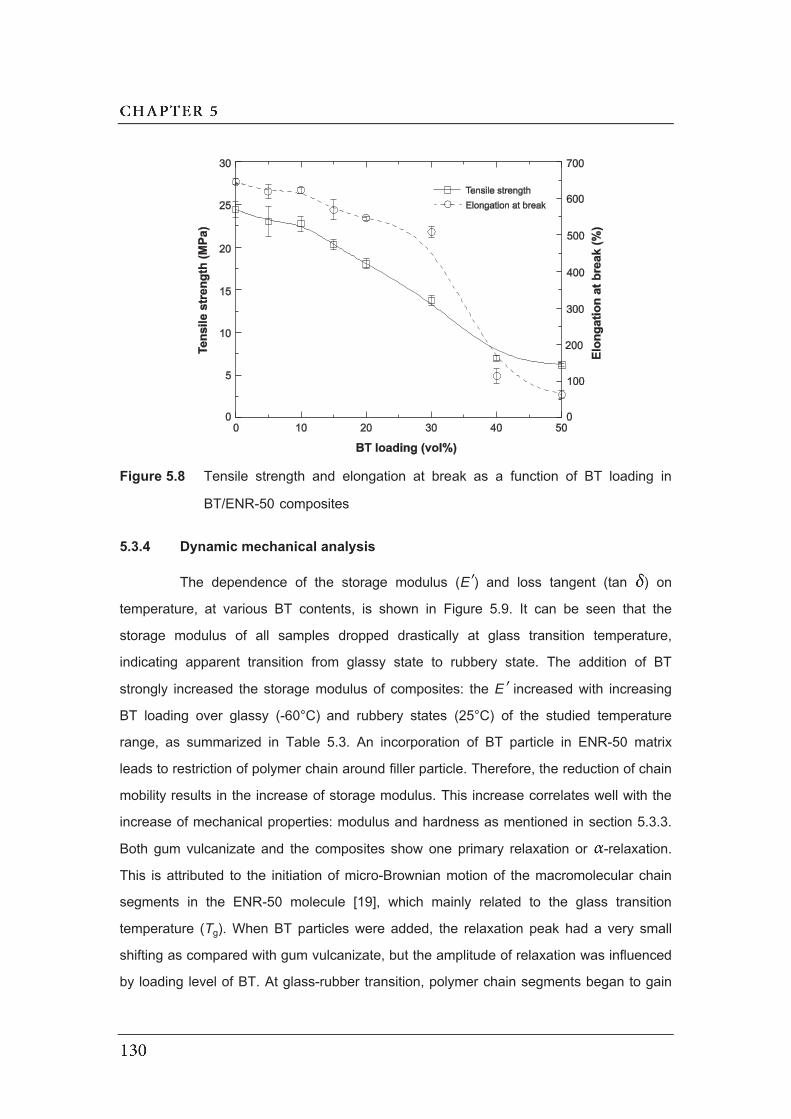
Figure 5.8 Tensile strength and elongation at break as a function of BT loading in
BT/ENR-50 composites
5.3.4 Dynamic mechanical analysis
The dependence of the storage modulus (EE ) and loss tangent (tan ) on
temperature, at various BT contents, is shown in Figure 5.9. It can be seen that the
storage modulus of all samples dropped drastically at glass transition temperature,
indicating apparent transition from glassy state to rubbery state. The addition of BT
strongly increased the storage modulus of composites: the EE increased with increasing
BT loading over glassy (-60°C) and rubbery states (25°C) of the studied temperature
range, as summarized in Table 5.3. An incorporation of BT particle in ENR-50 matrix
leads to restriction of polymer chain around filler particle. Therefore, the reduction of chain
mobility results in the increase of storage modulus. This increase correlates well with the
increase of mechanical properties: modulus and hardness as mentioned in section 5.3.3.
Both gum vulcanizate and the composites show one primary relaxation or -relaxation.
This is attributed to the initiation of micro-Brownian motion of the macromolecular chain
segments in the ENR-50 molecule [19], which mainly related to the glass transition
temperature (Tg). When BT particles were added, the relaxation peak had a very small
shifting as compared with gum vulcanizate, but the amplitude of relaxation was influenced
by loading level of BT. At glass-rubber transition, polymer chain segments began to gain
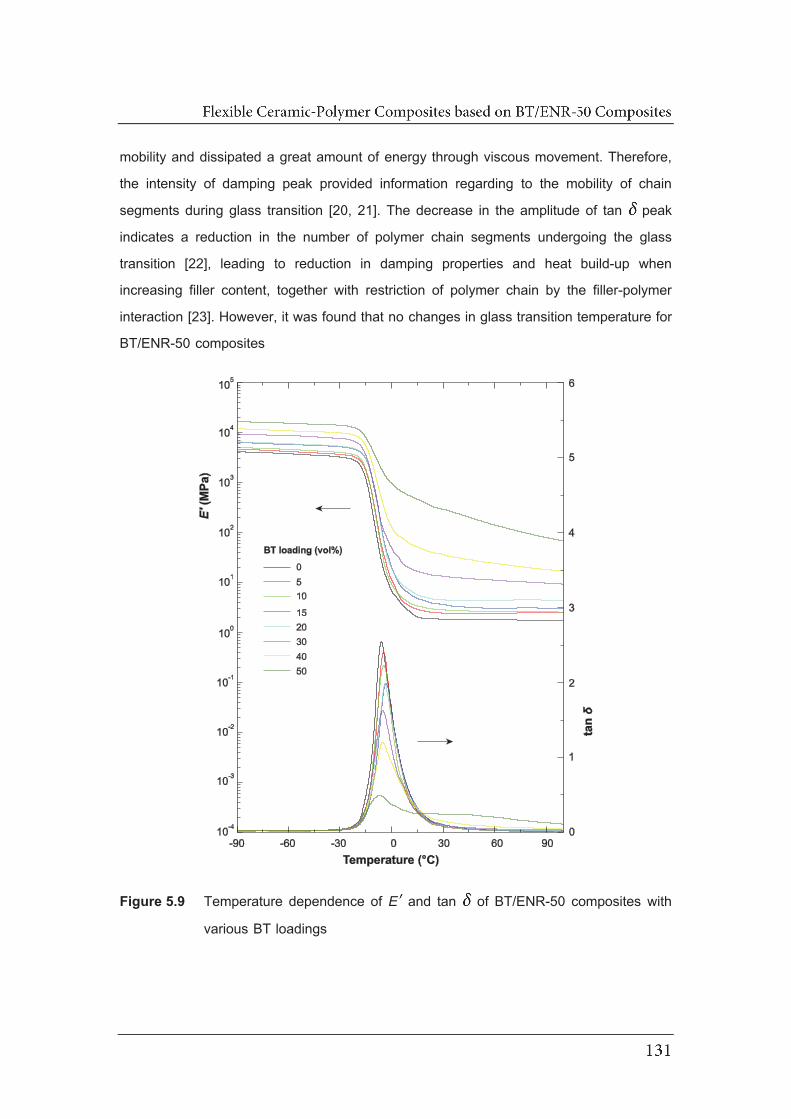
mobility and dissipated a great amount of energy through viscous movement. Therefore,
the intensity of damping peak provided information regarding to the mobility of chain
segments during glass transition [20, 21]. The decrease in the amplitude of tan peak
indicates a reduction in the number of polymer chain segments undergoing the glass
transition [22], leading to reduction in damping properties and heat build-up when
increasing filler content, together with restriction of polymer chain by the filler-polymer
interaction [23]. However, it was found that no changes in glass transition temperature for
BT/ENR-50 composites
Figure 5.9 Temperature dependence of EE and tan of BT/ENR-50 composites with
various BT loadings

Table 5.3 Storage modulus (EE ) and loss tangent (tan ) of BT/ENR-50 with various BT
loadings
BT loading (vol%) Storage modulus, EE (MPa) Loss tangent, tan
at -60°C at 25°C tan max Tg (°C)
0 3800 1.9 2.7 -5.7
5 4200 2.5 2.5 -4.7
10 4610 2.9 2.3 -4.6
15 5800 3.8 2.1 -3.3
20 6000 4.6 2.1 -3.8
30 8700 13.9 1.7 -5.3
40 10900 38.8 1.2 -5.5
50 15300 319.8 0.5 -7.4
5.3.5 Dielectric analysis
Temperature dependence of permittivity ( ) and loss factor ( ) of BT/ENR-50
composites with 10, 20, 30 and 50 vol% of BT in ENR-50 matrix are shown in Figure
5.10, 5.11, 5.12 and 5.13, respectively. All composites demonstrated similar dielectric
relaxation to gum ENR-50 as described in section 4.2.4. At low temperature, the
permittivity and loss factor slightly depend on frequency. Molecular chains have enough
mobility to contribute to the permittivity, leading to the increase in permittivity. At high
temperature, the permittivity is higher and strongly depends on frequency. The step-like
in and the peak represents relaxation in the materials which corresponds to micro-
Brownian cooperative motions of the polymer chain segment or -relaxation and
associated to glass transition temperature (Tg). The gradual increase in permittivity with
the increasing ceramic volume fraction can also be clearly seen from the curves.

Figure 5.10 Temperature dependence of (a) and (b) of BT/ENR-50 composite with
10 vol% BT at several frequencies ( ) 1, ( ) 10, ( ) 100, ( ) 1k and ( )
10k Hz
Figure 5.11 Temperature dependence of (a) and (b) of BT/ENR-50 composite with
20 vol% BT at several frequencies ( ) 1, ( ) 10, ( ) 100, ( ) 1k and ( )
10k Hz
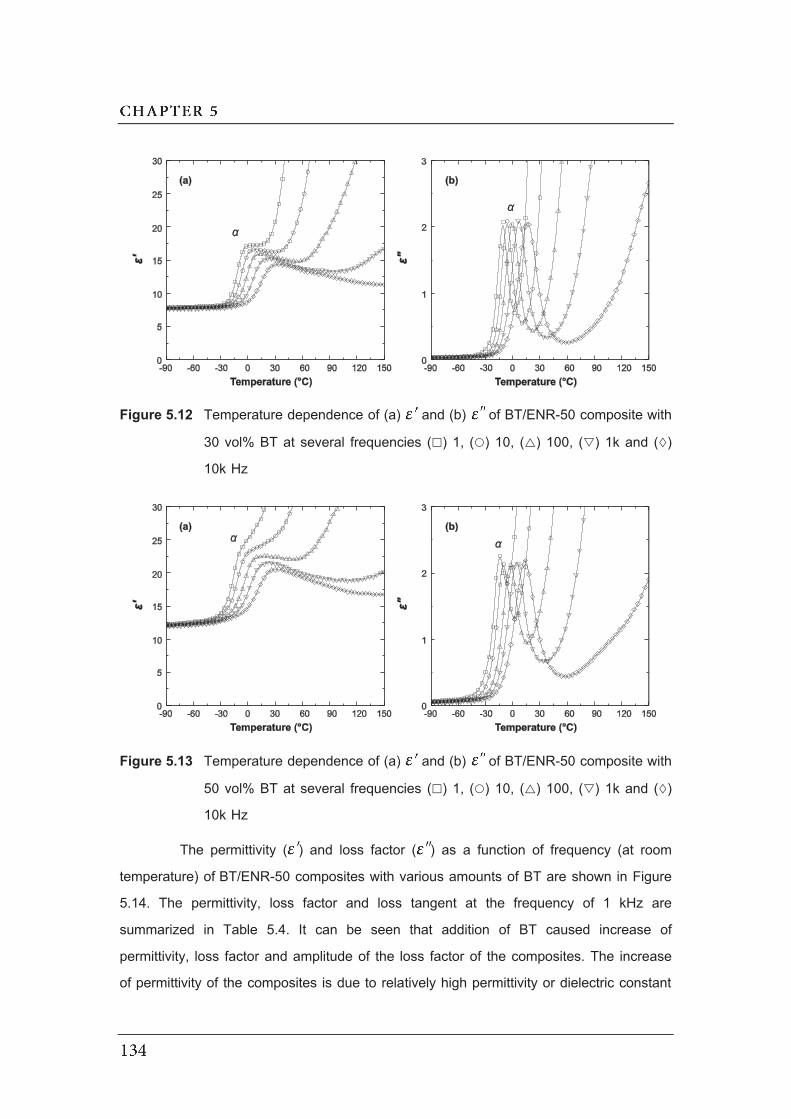
Figure 5.12 Temperature dependence of (a) and (b) of BT/ENR-50 composite with
30 vol% BT at several frequencies ( ) 1, ( ) 10, ( ) 100, ( ) 1k and ( )
10k Hz
Figure 5.13 Temperature dependence of (a) and (b) of BT/ENR-50 composite with
50 vol% BT at several frequencies ( ) 1, ( ) 10, ( ) 100, ( ) 1k and ( )
10k Hz
The permittivity ( ) and loss factor ( ) as a function of frequency (at room
temperature) of BT/ENR-50 composites with various amounts of BT are shown in Figure
5.14. The permittivity, loss factor and loss tangent at the frequency of 1 kHz are
summarized in Table 5.4. It can be seen that addition of BT caused increase of
permittivity, loss factor and amplitude of the loss factor of the composites. The increase
of permittivity of the composites is due to relatively high permittivity or dielectric constant

of ceramic filler compared to the single polymer. In addition, as BT content increased, the
interfacial area between ceramic phase and polymer phase was increased that resulted
in interfacial polarization. Both factors significantly influence the dielectric permittivity and
dielectric loss, according to the increase of permittivity and dielectric loss [4]. It can also
be seen that for each sample the permittivity was nearly constant in the frequency range
of 1 to 104 Hz, then decreased with a higher the frequency, and drops drastically between
105 and 106 Hz; which is also indicated by apparent relaxation peaks in the loss factor
curves. This is attributed to segmental motion of ENR-50 backbone or -relaxation of
ENR-50.
For composite systems, loss factor might originate from the contributions of
dipole orientation, conduction loss and interfacial polarization. The measurement results
of dielectric loss are helpful to confirm the polarization mechanism [12, 24]. The of
composite systems could be expressed as a sum of three distinct effects, that is:
where is due to conduction loss contribution, is due to interfacial polarization
(Maxwell–Wagner) contribution and is the dipole orientation or Debye loss factor.
Figure 5.14 Frequency dependence of (a) and (b) of BT/ENR-50 composites with
various BT loadings
(5.1)
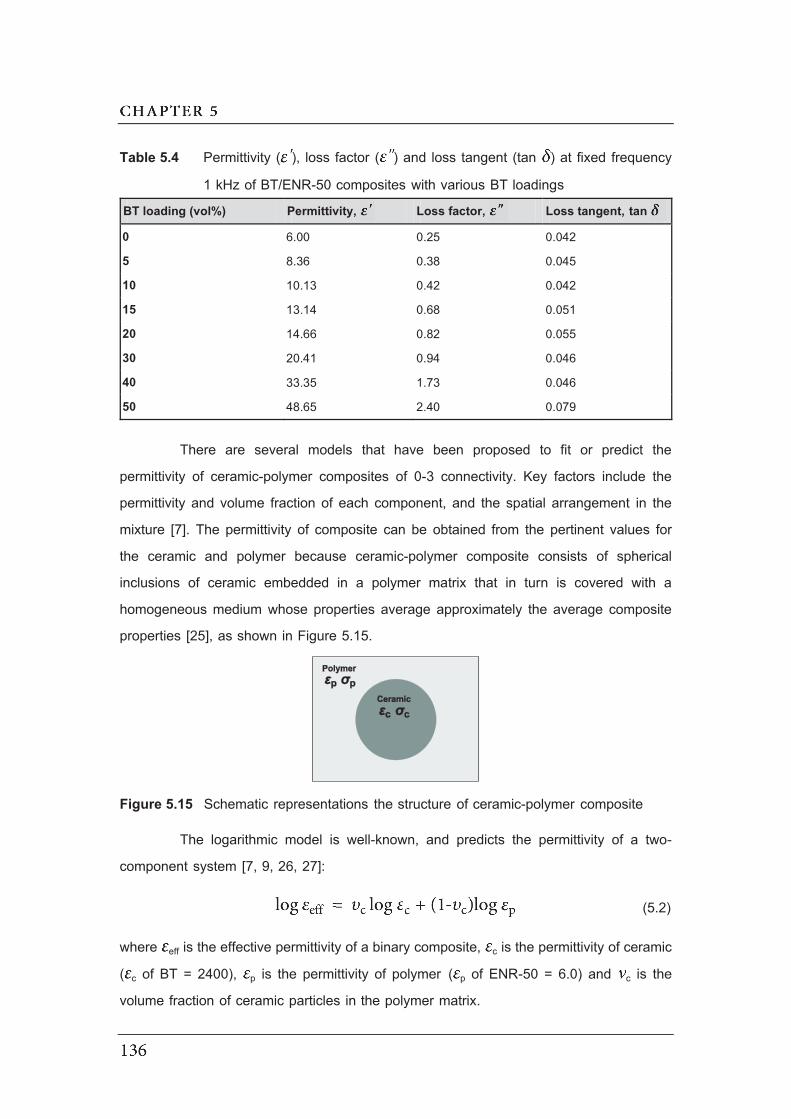
Table 5.4 Permittivity ( ), loss factor ( ) and loss tangent (tan ) at fixed frequency
1 kHz of BT/ENR-50 composites with various BT loadings
BT loading (vol%) Permittivity, Loss factor, Loss tangent, tan
0 6.00 0.25 0.042
5 8.36 0.38 0.045
10 10.13 0.42 0.042
15 13.14 0.68 0.051
20 14.66 0.82 0.055
30 20.41 0.94 0.046
40 33.35 1.73 0.046
50 48.65 2.40 0.079
There are several models that have been proposed to fit or predict the
permittivity of ceramic-polymer composites of 0-3 connectivity. Key factors include the
permittivity and volume fraction of each component, and the spatial arrangement in the
mixture [7]. The permittivity of composite can be obtained from the pertinent values for
the ceramic and polymer because ceramic-polymer composite consists of spherical
inclusions of ceramic embedded in a polymer matrix that in turn is covered with a
homogeneous medium whose properties average approximately the average composite
properties [25], as shown in Figure 5.15.
Figure 5.15 Schematic representations the structure of ceramic-polymer composite
The logarithmic model is well-known, and predicts the permittivity of a two-
component system [7, 9, 26, 27]:
where eff is the effective permittivity of a binary composite, c is the permittivity of ceramic
( c of BT = 2400), p is the permittivity of polymer ( p of ENR-50 = 6.0) and c is the
volume fraction of ceramic particles in the polymer matrix.
(5.2)

The modified Lichtenecker’s equation with a fitting factor k can be applied to
calculate permittivity of composites. It is reported that k = 0.3 is the best suited for a well-
dispersed system [7, 28]:
The effective medium theory (EMT) model has been used to calculate the
permittivity of composites [6, 27, 29, 30]:
where n is a shape factor of the ceramic particles. A small value of n corresponds to
near-spherical shape, while a high value of n is used for elongated particle shapes.
Jayasundere and Smith (J-S) developed a model by modifying the well-known
Kerner equations to include interactions between neighboring spheres, for calculation the
permittivity of composites [6, 7, 11, 31]:
where
and
The theoretical model of Bruggeman has the form [10, 11, 32, 33]:
A comparison of the experimental values of permittivity, obtained from dielectric
spectra at 1 kHz, and the above equations is shown in Figure 5.16. The effective
permittivity has a nonlinear nature and most prediction models showed a matching result
at a low ceramic content up to 15 vol% of BT. Some of them deviate from experiment at
high ceramic content. The Jayasundere and Smith (J-S) and modified Lichtenecker’s
models performed the best for lower and higher particle loadings. This is due to the fact
(5.3)
(5.4)
(5.5)
(5.6)
(5.7)
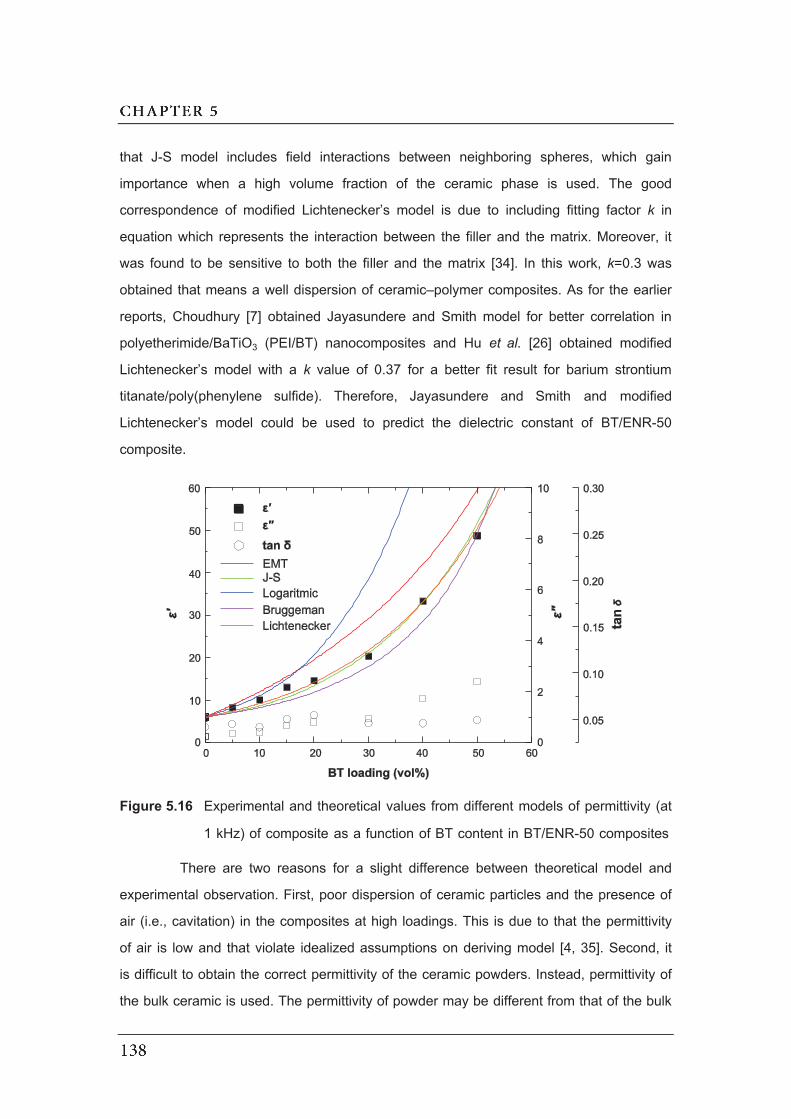
that J-S model includes field interactions between neighboring spheres, which gain
importance when a high volume fraction of the ceramic phase is used. The good
correspondence of modified Lichtenecker’s model is due to including fitting factor k in
equation which represents the interaction between the filler and the matrix. Moreover, it
was found to be sensitive to both the filler and the matrix [34]. In this work, k=0.3 was
obtained that means a well dispersion of ceramic–polymer composites. As for the earlier
reports, Choudhury [7] obtained Jayasundere and Smith model for better correlation in
polyetherimide/BaTiO3 (PEI/BT) nanocomposites and Hu et al. [26] obtained modified
Lichtenecker’s model with a k value of 0.37 for a better fit result for barium strontium
titanate/poly(phenylene sulfide). Therefore, Jayasundere and Smith and modified
Lichtenecker’s model could be used to predict the dielectric constant of BT/ENR-50
composite.
Figure 5.16 Experimental and theoretical values from different models of permittivity (at
1 kHz) of composite as a function of BT content in BT/ENR-50 composites
There are two reasons for a slight difference between theoretical model and
experimental observation. First, poor dispersion of ceramic particles and the presence of
air (i.e., cavitation) in the composites at high loadings. This is due to that the permittivity
of air is low and that violate idealized assumptions on deriving model [4, 35]. Second, it
is difficult to obtain the correct permittivity of the ceramic powders. Instead, permittivity of
the bulk ceramic is used. The permittivity of powder may be different from that of the bulk
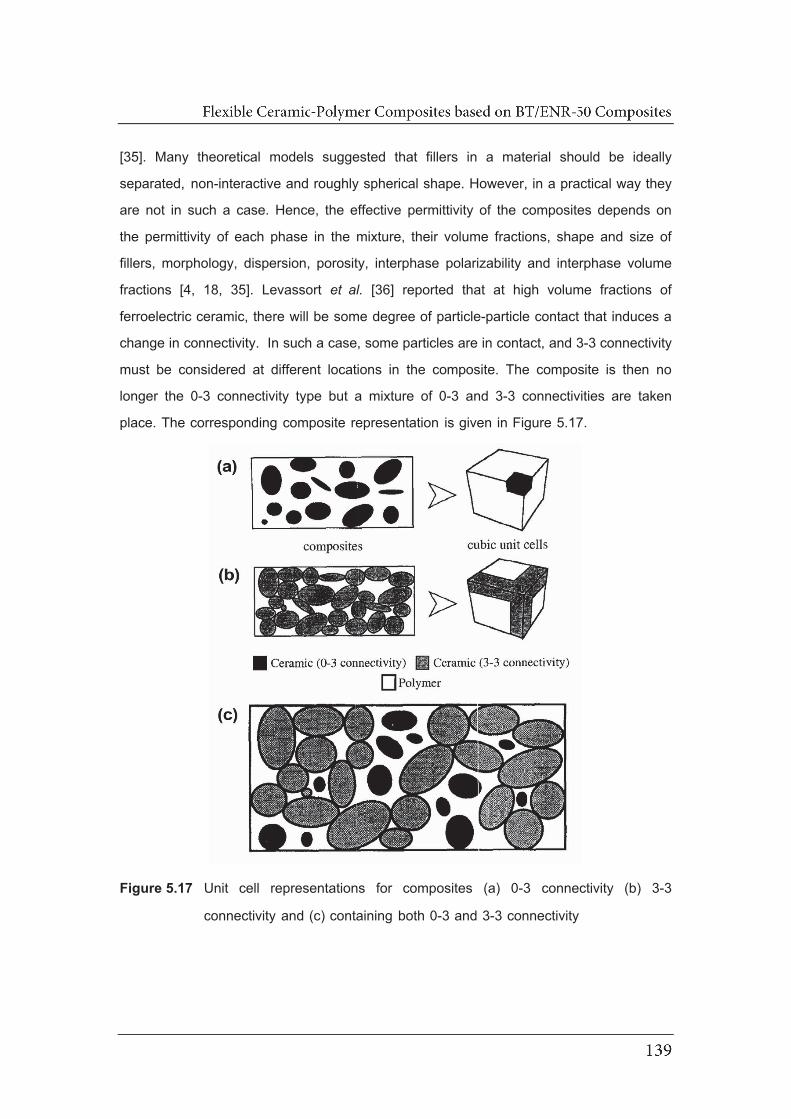
[35]. Many theoretical models suggested that fillers in a material should be ideally
separated, non-interactive and roughly spherical shape. However, in a practical way they
are not in such a case. Hence, the effective permittivity of the composites depends on
the permittivity of each phase in the mixture, their volume fractions, shape and size of
fillers, morphology, dispersion, porosity, interphase polarizability and interphase volume
fractions [4, 18, 35]. Levassort et al. [36] reported that at high volume fractions of
ferroelectric ceramic, there will be some degree of particle-particle contact that induces a
change in connectivity. In such a case, some particles are in contact, and 3-3 connectivity
must be considered at different locations in the composite. The composite is then no
longer the 0-3 connectivity type but a mixture of 0-3 and 3-3 connectivities are taken
place. The corresponding composite representation is given in Figure 5.17.
Figure 5.17 Unit cell representations for composites (a) 0-3 connectivity (b) 3-3
connectivity and (c) containing both 0-3 and 3-3 connectivity

Our BT/ENR-50 composites at 50 vol% of BT nearly reached the values of
permittivity, loss factor and loss tangent of 4 8 . 7 , 2.4 and 0.05, respectively, at 1 kHz.
These values matched the values obtaining from PVDF and its co-polymer as matrix, [5,
37] and exceeding the permittivity of some polyimide/BT composites [7, 38] and epoxy/BT
[9] at the same loading and same measured frequency as summarized in Table 2.2. This
can be concluded that high permittivity (high- ) and low loss tangent (low-tan )
composite are successfully prepared by filling BT in ENR-50. Furthermore, all types of
composites showed a sharp increasing of permittivity and loss factor at high temperature
and low frequency, which is rather due to conductivity as described earlier. The imaginary
part (MM ) as a function of temperature of BT/ENR-50 composite at different amounts of
BT is shown in Figure 5.18.
Figure 5.18 Temperature dependence of MM of ENR-50 composites with (a) 10, (b) 20,
(c) 30 and (d) 50 vol% BT at ( ) 1, ( ) 10, ( ) 100, ( ) 1k and ( ) 10k Hz

In Figure 5.18, it is clear that all types of composites revealed two relaxations
at lower and higher temperatures. The relaxation peak at low temperature corresponds
to -relaxation process which mainly related to segmental motion of molecule chain or
glass transition temperature. The second relaxation peak cannot be observed in
spectra however, using electric modulus formalism revealed a new relaxation peak at
higher temperature. This relaxation peak attributed to the conductivity because at
sufficient temperature and low frequency, charge transfer in conductivity process affects
sharp increase of and values [39, 40]. This relaxation is also attributed to the
interfacial or Maxwell-Wagner-Sillars (MWS) polarization which is normally encountered
in heterogeneous materials. Furthermore, the conduction process at low frequency can
be confirmed by appearance of relaxation at low frequency in the plot of MM in frequency
domain as shown in Figure 5.19. The relaxation peak at low frequency related to
conductivity and at high frequency related to -process. It can also be seen that the
intensity of relaxation peak decreased with increasing BT contents. These are due to the
real permittivity was increased.
Figure 5.19 Frequency dependence of MM of BT/ENR-50 composites with various BT
loadings
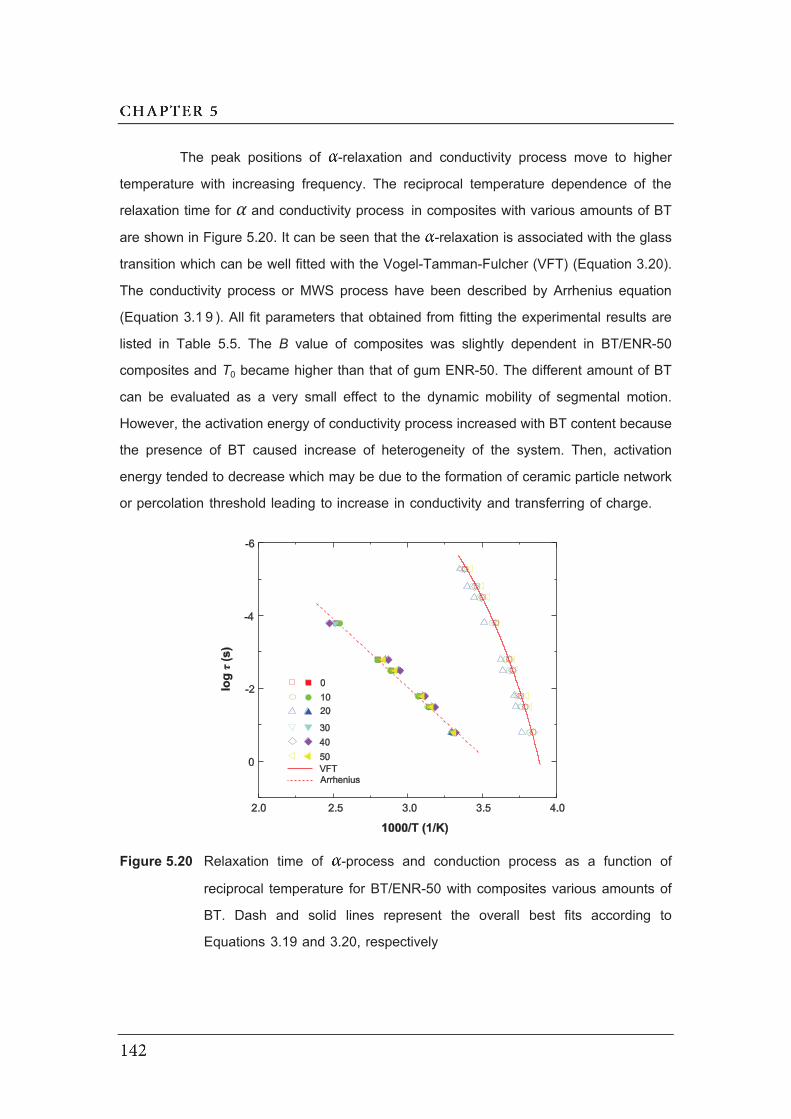
The peak positions of -relaxation and conductivity process move to higher
temperature with increasing frequency. The reciprocal temperature dependence of the
relaxation time for α and conductivity process in composites with various amounts of BT
are shown in Figure 5.20. It can be seen that the -relaxation is associated with the glass
transition which can be well fitted with the Vogel-Tamman-Fulcher (VFT) (Equation 3.20).
The conductivity process or MWS process have been described by Arrhenius equation
(Equation 3.1 9 ). All fit parameters that obtained from fitting the experimental results are
listed in Table 5.5. The B value of composites was slightly dependent in BT/ENR-50
composites and T0 became higher than that of gum ENR-50. The different amount of BT
can be evaluated as a very small effect to the dynamic mobility of segmental motion.
However, the activation energy of conductivity process increased with BT content because
the presence of BT caused increase of heterogeneity of the system. Then, activation
energy tended to decrease which may be due to the formation of ceramic particle network
or percolation threshold leading to increase in conductivity and transferring of charge.
Figure 5.20 Relaxation time of -process and conduction process as a function of
reciprocal temperature for BT/ENR-50 with composites various amounts of
BT. Dash and solid lines represent the overall best fits according to
Equations 3.19 and 3.20, respectively
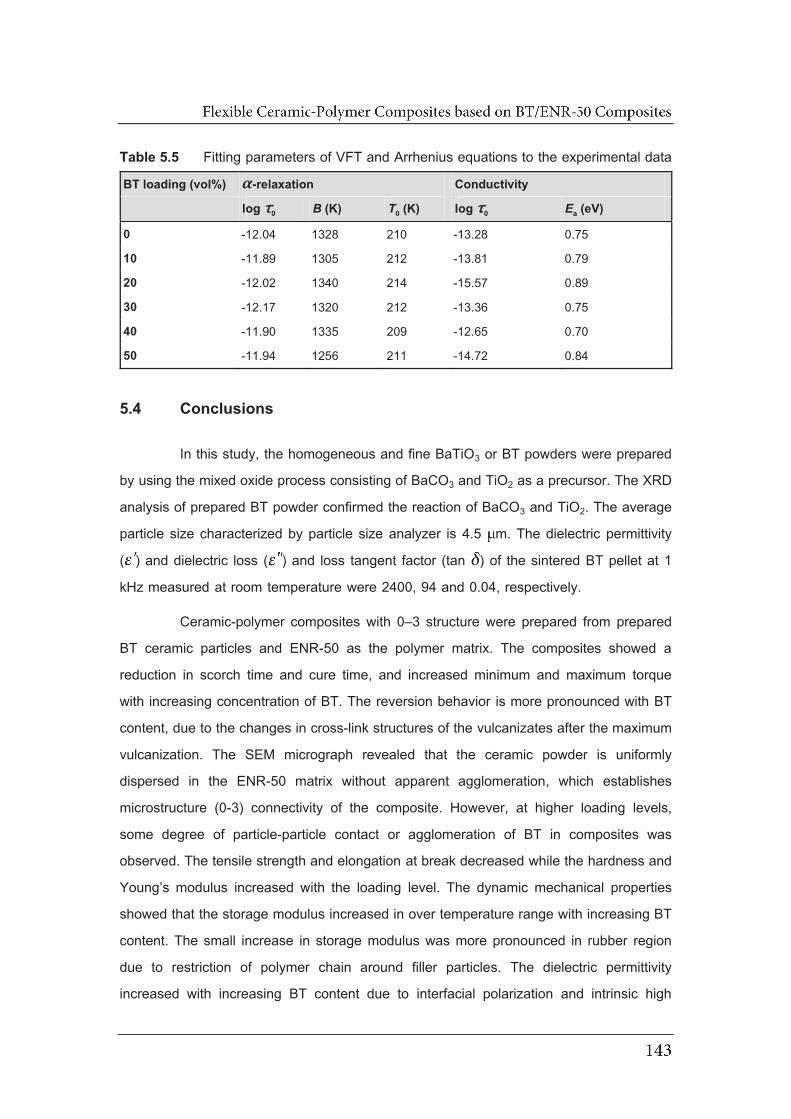
Table 5.5 Fitting parameters of VFT and Arrhenius equations to the experimental data
BT loading (vol%) α-relaxation Conductivity
log 0 B (K) T0 (K) log 0 Ea (eV)
0 -12.04 1328 210 -13.28 0.75
10 -11.89 1305 212 -13.81 0.79
20 -12.02 1340 214 -15.57 0.89
30 -12.17 1320 212 -13.36 0.75
40 -11.90 1335 209 -12.65 0.70
50 -11.94 1256 211 -14.72 0.84
5.4 Conclusions
In this study, the homogeneous and fine BaTiO3 or BT powders were prepared
by using the mixed oxide process consisting of BaCO3 and TiO2 as a precursor. The XRD
analysis of prepared BT powder confirmed the reaction of BaCO3 and TiO2. The average
particle size characterized by particle size analyzer is 4.5 m. The dielectric permittivity
( ) and dielectric loss ( ) and loss tangent factor (tan ) of the sintered BT pellet at 1
kHz measured at room temperature were 2400, 94 and 0.04, respectively.
Ceramic-polymer composites with 0–3 structure were prepared from prepared
BT ceramic particles and ENR-50 as the polymer matrix. The composites showed a
reduction in scorch time and cure time, and increased minimum and maximum torque
with increasing concentration of BT. The reversion behavior is more pronounced with BT
content, due to the changes in cross-link structures of the vulcanizates after the maximum
vulcanization. The SEM micrograph revealed that the ceramic powder is uniformly
dispersed in the ENR-50 matrix without apparent agglomeration, which establishes
microstructure (0-3) connectivity of the composite. However, at higher loading levels,
some degree of particle-particle contact or agglomeration of BT in composites was
observed. The tensile strength and elongation at break decreased while the hardness and
Young’s modulus increased with the loading level. The dynamic mechanical properties
showed that the storage modulus increased in over temperature range with increasing BT
content. The small increase in storage modulus was more pronounced in rubber region
due to restriction of polymer chain around filler particles. The dielectric permittivity
increased with increasing BT content due to interfacial polarization and intrinsic high
permittivity of BT particle in ENR-50 matrix. The drastically decrease in permittivity
between 105 and 106 Hz corresponds to segmental motion of ENR-50 backbone or -
relaxation of ENR-50 as evidenced by relaxations in the loss factor curves. The
Jayasundere and Smith (J-S) and modified Lichtenecker’s models performed the best fit
to describe for fabricated BT/ENR-50 composite in over range of BT loading. BT/ENR-50
composites at 50 vol% of BT nearly reached value of permittivity, loss factor and loss
tangent of 48.7, 2.4 and 0.05, respectively at 1 kHz. Therefore, it is concluded that addition
of BT into ENR-50 matrix is suitable ceramic-polymer pairs and can be used to prepare
ceramic-polymer composite with high permittivity and flexibility.
5.5 References
[1] Carter, C.B. and Norton, M.G. 2007. Ceramic Materials: Science and Engineering.
Springer, New York.
[2] Patsidis, A. and Psarras, G.C. 2008. Dielectric behaviour and functionality of
polymer matrix-ceramic BaTiO3 composites. Express Polym. Lett. 2, 718-726.
[3] Hsiang, H.-I., Lin, K.-Y., Yen, F.-S. and Hwang, C.-Y. 2001. Effects of particle size
of BaTiO3 powder on the dielectric properties of BaTiO3/polyvinylidene fluoride
composites. J. Mater. Sci. 36, 3809-3815.
[4] Dang, Z.M., Yuan, J.K., Zha, J.W., Zhou, T., Li, S.T. and Hu, G.H. 2012.
Fundamentals, processes and applications of high-permittivity polymer matrix
composites. Prog. Mater. Sci. 57, 660-723.
[5] Kim, P., Doss, N.M., Tillotson, J.P., Hotchkiss, P.J., Pan, M.J., Marder, S.R., Li,
J., Calame, J.P. and Perry, J.W. 2009. High energy density nanocomposites based
on surface-modified BaTiO3 and a ferroelectric polymer. ACS Nano. 3, 2581-2592.
[6] Ahmad, Z., Prasad, A. and Prasad, K. 2009. A comparative approach to predicting
effective dielectric, piezoelectric and elastic properties of PZT/PVDF composites.
Physica B. 404, 3637-3644.
[7] Choudhury, A. 2010. Dielectric and piezoelectric properties of
polyetherimide/BaTiO3 nanocomposites. Mater. Chem. Phys. 121, 280-285.
[8] Wang, H., Xiang, F. and Li, K.C. 2010. Ceramic-polymer Ba0.6Sr0.4TiO3/poly(methyl
methacrylate) composites with different type composite structures for electronic
technology. Int. J. Appl. Ceram. Technol. 7, 435-443.

[9] Cho, S.D., Lee, S.Y., Hyun, J.G. and Paik, K.W. 2005. Comparison of theoretical
predictions and experimental values of the dielectric constant of epoxy/BaTiO3
composite embedded capacitor films. J. Mater. Sci: Mater. El. 16, 77-84.
[10] Peng, W., Huang, X., Yu, J., Jiang, P. and Liu, W. 2010. Electrical and
thermophysical properties of epoxy/aluminum nitride nanocomposites: Effects of
nanoparticle surface modification. Compos. Part A: Appl. S. 41, 1201-1209.
[11] Gallone, G., Carpi, F., De Rossi, D., Levita, G. and Marchetti, A. 2007. Dielectric
constant enhancement in a silicone elastomer filled with lead magnesium niobate-
lead titanate. Mater. Sci. Eng., C. 27, 110-116.
[12] Huang, X., Xie, L., Jiang, P., Wang, G. and Liu, F. 2009. Electrical, thermophysical
and micromechanical properties of ethylene-vinyl acetate elastomer composites
with surface modified BaTiO3 nanoparticles. J. Phys. D: Appl. Phys. 42, 245407.
[13] Salaeh, S., Muensit, N., Bomlai, P. and Nakason, C. 2011. Ceramic/natural rubber
composites: influence types of rubber and ceramic materials on curing, mechanical,
morphological, and dielectric properties. J. Mater. Sci. 46, 1723-1731.
[14] Hsiang, H.I., Mei, L.T. and Chun, Y.J. 2009. Dielectric properties and
microstructure of Nb-Co codoped BaTiO3-(Bi0.5Na0.5)TiO3 ceramics. J. Am. Ceram.
Soc. 92, 2768-2771.
[15] Chen, J.F., Shen, Z.G., Liu, F.T., Liu, X.L. and Yun, J. 2003. Preparation and
properties of barium titanate nanopowder by conventional and high-gravity reactive
precipitation methods. Scripta. Mater. 49, 509-514.
[16] González Hernández, L., Rodríguez Díaz, A., Valentín, J.L., Marcos-Fernández,
Á. and Posadas, P. 2005. Conventional and efficient crosslinking of natural rubber:
effect of heterogeneities on the physical properties. Kaut. Gummi Kunstst. 58, 638-
643.
[17] Kruzelák, J., Kysela, G. and Hudec, I. 2008. Elastomeric magnetic composites
curing and properties. Kaut. Gummi Kunstst. 61, 424-428.
[18] Rajesh, S., Murali, K.P., Rajani, K.V. and Ratheesh, R. 2009. SrTiO3-filled PTFE
composite laminates for microwave substrate applications. Int. J. Appl. Ceram.
Technol. 6, 553-561.
[19] Mohanty, S., Nando, G.B., Vijayan, K. and Neelakanthan, N.R. 1996. Mechanical
and dynamic mechanical properties of miscible blends of epoxidized natural rubber
and poly(ethylene-co-acrylic acid). Polymer. 37, 5387-5394.
[20] Rao, Y.Q. and Pochan, J.M. 2007. Mechanics of polymer-clay nanocomposites.
Macromolecules. 40, 290-296.
[21] Zhang, X.G. and Loo, L.S. 2009. Study of glass transition and reinforcement
mechanism in polymer/layered silicate nanocomposites. Macromolecules. 42,
5196-5207.
[22] Zhang, B.Q., Ding, Y.F., Chen, P., Liu, C.Y., Zhang, J., He, J.S. and Hu, G.H.
2005. Fibrillation of thermotropic liquid crystalline polymer enhanced by nano-clay
in nylon-6 matrix. Polymer. 46, 5385-5395.
[23] Rajasekar, R., Pal, K., Heinrich, G., Das, A. and Das, C.K. 2009. Development of
nitrile butadiene rubber-nanoclay composites with epoxidized natural rubber as
compatibilizer. Mater. Design. 30, 3839-3845.
[24] Chen, Q., Xi, Y., Bin, Y. and Matsuo, M. 2008. Electrical and dielectric properties
in carbon fiber-filled LMWPE/UHMWPE composites with different blend ratios. J.
Polym. Sci. Pol. Phys. 46, 359-369.
[25] Riande, E. and Díaz-Calleja, R. 2004. Electrical Properties of Polymers. Marcel
Dekker Inc, USA.
[26] Hu, T., Juuti, J. and Jantunen, H. 2007. RF properties of BST-PPS composites. J.
Eur. Ceram. Soc. 27, 2923-2926.
[27] George, S. and Sebastian, M.T. 2009. Three-phase polymer-ceramic-metal
composite for embedded capacitor applications. Compos. Sci. Technol. 69, 1298-
1302.
[28] Sonoda, K., Juuti, J., Moriya, Y. and Jantunen, H. 2010. Modification of the
dielectric properties of 0-3 ceramic-polymer composites by introducing surface
active agents onto the ceramic filler surface. Compos. Struct. 92, 1052-1058.
[29] Thomas, P., Varughese, K.T., Dwarakanath, K. and Varma, K.B.R. 2010.
Dielectric properties of poly(vinylidene fluoride)/CaCu3Ti4O12 composites. Compos.
Sci. Technol. 70, 539-545.
[30] Anjana, P.S., Uma, S., Philip, J. and Sebastian, M.T. 2010. Thermal properties of
low loss PTFE-CeO2 dielectric ceramic composites for microwave substrate
applications. J. Appl. Polym. Sci. 118, 751-758.
[31] George, S., Anjana, P.S., Sebastian, M.T., Krupka, J., Uma, S. and Philip, J.
2010. Dielectric, mechanical, and thermal properties of low-permittivity polymer-
ceramic composites for microelectronic applications. Int. J. Appl. Ceram. Technol.
7, 461-474.
[32] Wegener, M. and Arlt, K. 2008. PZT/P(VDF-HFP) 0-3 composites as solvent-cast
thin films: preparation, structure and piezoelectric properties. J. Phys. D: Appl.
Phys. 41, 165409.
[33] Wang, X.X., Lam, K.H., Tang, X.G. and Chan, H.L.W. 2004. Dielectric
characteristics and polarization response of lead-free ferroelectric
(Bi0.5Na0.5)0.94Ba0.06TiO3-P(VDF-TrFE) 0-3 composites. Solid State Commun. 130,
695-699.
[34] Thomas, S., Deepu, V., Uma, S., Mohanan, P., Philip, J. and Sebastian, M.T.
2009. Preparation, characterization and properties of Sm2Si2O7 loaded polymer
composites for microelectronic applications. Mater. Sci. Eng. B: Adv. 163, 67-75.
[35] Sebastian, M.T. and Jantunen, H. 2010. Polymer-ceramic composites of 0-3
connectivity for circuits in electronics: a review. Int. J. Appl. Ceram. Technol. 7,
415-434.
[36] Levassort, F., Lethiecq, M. and Desmare, R. 1999. Effective electroelastic moduli
of 3-3 (0-3) piezocomposites. IEEE T. Ultrason. Ferr. 46, 1028-1034.
[37] Dang, Z.M., Wang, H.Y., Zhang, Y.H. and Qi, J.Q. 2005. Morphology and dielectric
property of homogenous BaTiO3/PVDF nanocomposites prepared via the natural
adsorption action of nanosized BaTiO3. Macromol. Rapid Commun. 26, 1185-
1189.
[38] Xie, S.H., Zhu, B.K., Wei, X.Z., Xu, Z.K. and Xu, Y.Y. 2005. Polylmide/BaTiO3
composites with controllable dielectric properties. Compos. Part A: Appl. S. 36,
1152-1157.
[39] Chanmal, C.V. and Jog, J.P. 2008. Dielectric relaxations in PVDF/BaTiO3
nanocomposites. Express Polym. Lett. 2, 294-301.
[40] Hammami, H., Arous, M., Lagache, M. and Kallel, A. 2007. Study of the interfacial
MWS relaxation by dielectric spectroscopy in unidirectional PZT fibres/epoxy resin
composites. J. Alloys Compd. 430, 1-8.
CHAPTER 6
CONDUCTIVE ELASTOMER COMPOSITES BASED
ON CB/ENR-50 COMPOSITES
6.1 Introductions
Carbon black (CB) is a reinforcing filler and also widely used as conductive filler
to improve mechanical and electrical properties of high performance rubber materials. Different types of carbon black offer difference in mechanical and electrical properties
which mainly depend on the specific surface area and/or structure of the primary
aggregates [1, 2]. A high surface activity and specific surface area of the carbon black
play an important role in reinforcement of elastomer by physically bound of the chain at
the surface of CB particles. The strong interaction between filler and elastomer leads to
increase in tensile strength, tear resistance, abrasion resistance and modulus [1, 3, 4].
The surface area of CB depends on primary particle size of filler which determines
effective contact area between the filler and polymer matrix. Generally, structure of CB is
related to the aggregate irregularity in shapes. High structure carbon blacks exhibit a high
number of primary particles per aggregate but low structure carbon blacks show only a
weak aggregation [3]. Conductivity of composite depends on the formation of a percolating
path of conductive filler through the polymer matrix. The percolation threshold (pc) is the
minimum concentration of the filler that causes to form a continuous conducting structure.
Hence, the composite is transferred from an insulator to conductor [5]. Generally, the CB
with high surface area and high structure is generally considered as conductive carbon
black (CCB) due to lower percolation threshold concentration. That is pc decreases with
the increasing of the surface area and/or structure of the CB particles. This leads to
decrease in gaps between particles or particle clusters, which contributes to hopping of
charge carriers across the gaps for conductivity of CB filled polymers [1, 2]. The
percolation threshold of CB filler in elastomer is around 25 to 30 phr (~12 to 14 vol%) [6-
10], which is higher than carbon nanotube elastomer composites around 1 to 5 phr (~0.5
to 3 vol%) [7, 11-13]. However, utilization of carbon nanotube in elastomer resulted in
poor dispersion in elastomer matrix [13]. Thus, the challenge is to reduce as much as
possible the percolation threshold of CB in conductive composite. This is favored the
financial reasons but inferior in mechanical properties is needed to compensate.
The main aim of this study was to prepare CB/ENR-50 composite with low
percolation threshold. Two types of CBs; high abrasion furnace (HAF) and extra
conductive furnace (ECF) were employed in the investigation. Effect of different types of
CB (i.e., HAF and ECF) and CB loading (i.e., 0 to 60 phr) on the properties of CB/ENR-
50 composite were elucidated. Cure characteristic, mechanical, dynamic mechanical
properties and electrical properties of the prepared composite were investigated.
6.2 Effect of different carbon black structure and content on properties
of carbon black filled ENR-50 composites
The study was performed with the ENR-50 using two types of carbon black (i.e.,
HAF and ECF with various CB loading (0 to 60 phr)). Various important properties were
studied as follows:
6.2.1 Cure characteristic
Cure characteristics of the HAF and ECF filled ENR-50 compound are shown
and summarized in Figure 6.1 and Table 6.1, respectively. It can be seen that torque is
increased with increasing loading level of carbon black. This is due to the formation of
crosslinks and filler-polymer interaction upon increasing content of fillers. A remarkable
increase in minimum torque, maximum torque and delta torque with addition of CB
particles. This might be attributed to the formation of physical bound rubber at the surface
of CB particles in the matrix, as shown in Figure 2.6(b), resulting in hindrance in the
mobility of rubber chains which restrict chains deformation. The delta torque or torque
difference is related to cross-link density of rubber vulcanizates. In the Figure 6.1 and
Table 6.1, the ECF composite showed higher delta torque than HAF composite. This is
attributed to high surface area and structure of ECF (Table 3.1). This give rises to large
number of rubber chains immobilized on the carbon black surfaces [4, 14]. This leads to
enhancement of physical crosslink and hence the delta torque. Furthermore, the HAF

filled ENR-50 exhibited reversion phenomenon while the ECF higher than 25 phr shows
marching phenomenon with ECF higher than 25 phr. This is due to high structure and
surface area of ECF particles could be possibly absorbed accelerator and curing agent
molecules during vulcanization [15]. This causes delayed of vulcanization reaction and
hence increasing of the scorch time (ts1), cure time (tc90) and decreasing of cure rate index
(Table 6.1). However, Li et al. [14] reported that the content of sulfur on CB surface was
highly associated with the surface area of carbon black that the shorter scorch time and
cure time can be observed in rubber filled with high structure CB.
Figure 6.1 Rheographs of (a) HAF and (b) ECF filled ENR-50 at various CB loading
levels
Table 6.1 Cure characteristic of HAF and ECF filled ENR-50 composites Properties Carbon black loading (phr)
0 5 10 15 20 25 30 40 50 60
Min. torque, ML ( min) HAF
0.99 0.91 0.93 0.94 0.95 0.99 1.23 1.42 2.00 2.45
ECF 0.93 0.94 0.96 0.97 1.10 1.26 1.80 3.63 6.13
Max. torque, MH (min) HAF
14.53 17.29 17.79 19.81 21.83 24.81 29.48 37.74 45.43 50.52
ECF 17.69 19.43 20.13 21.48 23.16 26.64 37.39 60.68 81.33
torque, MH-ML (dN.m) HAF
13.54 16.38 16.86 18.87 20.88 23.82 28.25 36.32 43.43 48.07
ECF 16.76 18.49 19.17 20.51 22.06 25.38 35.59 57.05 75.20
Scorch time, ts1 (min) HAF
0.46 0.45 0.42 0.41 0.40 0.37 0.34 0.28 0.26 0.25
ECF 0.59 0.56 0.52 0.48 0.44 0.43 0.40 0.35 0.27
Cure time, tc90 (min) HAF
6.49 7.78 6.93 6.63 6.60 4.11 4.77 5.62 6.22 6.69
ECF 6.67 6.91 9.90 12.45 14.09 15.38 25.00 40.73 44.81
Cure rate index, (CRI) HAF
16.58 13.64 15.36 16.08 16.13 26.74 18.73 18.73 16.78 15.53
ECF 16.45 15.75 10.66 8.35 7.32 6.69 4.07 2.48 2.25
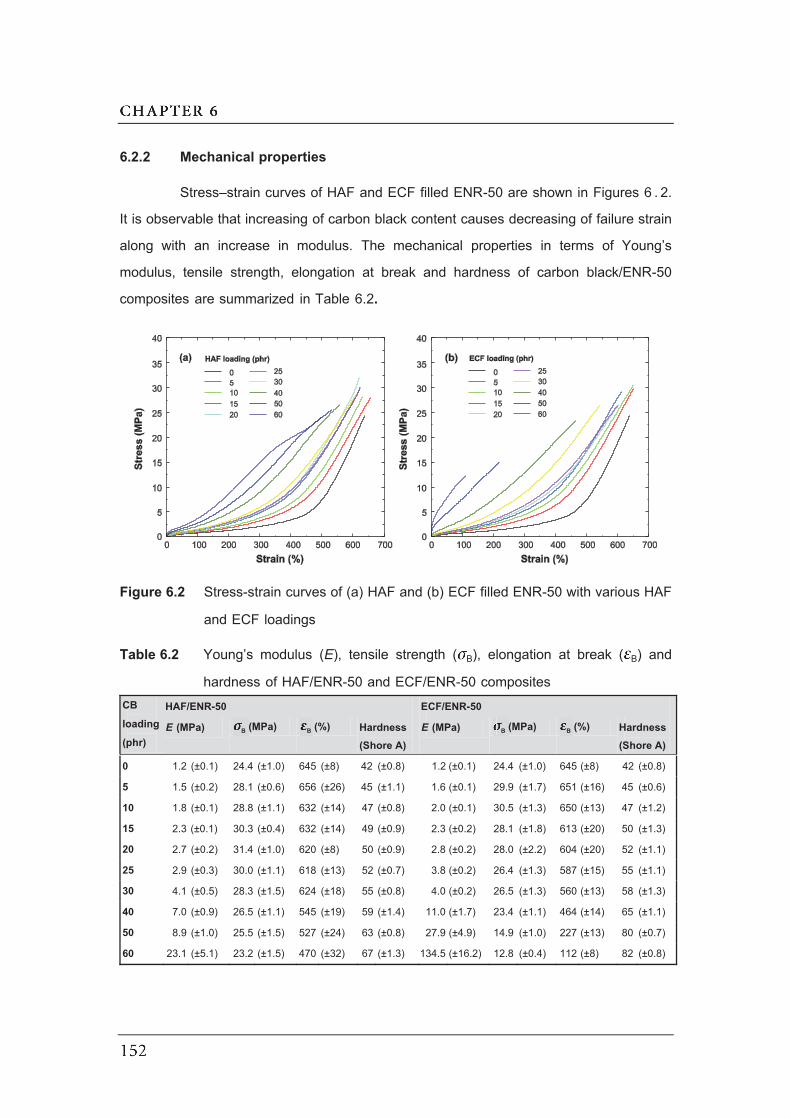
6.2.2 Mechanical properties
Stress–strain curves of HAF and ECF filled ENR-50 are shown in Figures 6 . 2.
It is observable that increasing of carbon black content causes decreasing of failure strain
along with an increase in modulus. The mechanical properties in terms of Young’s
modulus, tensile strength, elongation at break and hardness of carbon black/ENR-50
composites are summarized in Table 6.2.
Figure 6.2 Stress-strain curves of (a) HAF and (b) ECF filled ENR-50 with various HAF
and ECF loadings
Table 6.2 Young’s modulus (E), tensile strength ( B), elongation at break ( B) and
hardness of HAF/ENR-50 and ECF/ENR-50 composites CB loading (phr)
HAF/ENR-50 ECF/ENR-50
E (MPa) B (MPa) B (%) Hardness (Shore A)
E (MPa) B (MPa) B (%) Hardness (Shore A)
0 1.2 (±0.1) 24.4 (±1.0) 645 (±8) 42 (±0.8) 1.2 (±0.1) 24.4 (±1.0) 645 (±8) 42 (±0.8)
5 1.5 (±0.2) 28.1 (±0.6) 656 (±26) 45 (±1.1) 1.6 (±0.1) 29.9 (±1.7) 651 (±16) 45 (±0.6)
10 1.8 (±0.1) 28.8 (±1.1) 632 (±14) 47 (±0.8) 2.0 (±0.1) 30.5 (±1.3) 650 (±13) 47 (±1.2)
15 2.3 (±0.1) 30.3 (±0.4) 632 (±14) 49 (±0.9) 2.3 (±0.2) 28.1 (±1.8) 613 (±20) 50 (±1.3)
20 2.7 (±0.2) 31.4 (±1.0) 620 (±8) 50 (±0.9) 2.8 (±0.2) 28.0 (±2.2) 604 (±20) 52 (±1.1)
25 2.9 (±0.3) 30.0 (±1.1) 618 (±13) 52 (±0.7) 3.8 (±0.2) 26.4 (±1.3) 587 (±15) 55 (±1.1)
30 4.1 (±0.5) 28.3 (±1.5) 624 (±18) 55 (±0.8) 4.0 (±0.2) 26.5 (±1.3) 560 (±13) 58 (±1.3)
40 7.0 (±0.9) 26.5 (±1.1) 545 (±19) 59 (±1.4) 11.0 (±1.7) 23.4 (±1.1) 464 (±14) 65 (±1.1)
50 8.9 (±1.0) 25.5 (±1.5) 527 (±24) 63 (±0.8) 27.9 (±4.9) 14.9 (±1.0) 227 (±13) 80 (±0.7)
60 23.1 (±5.1) 23.2 (±1.5) 470 (±32) 67 (±1.3) 134.5 (±16.2) 12.8 (±0.4) 112 (±8) 82 (±0.8)
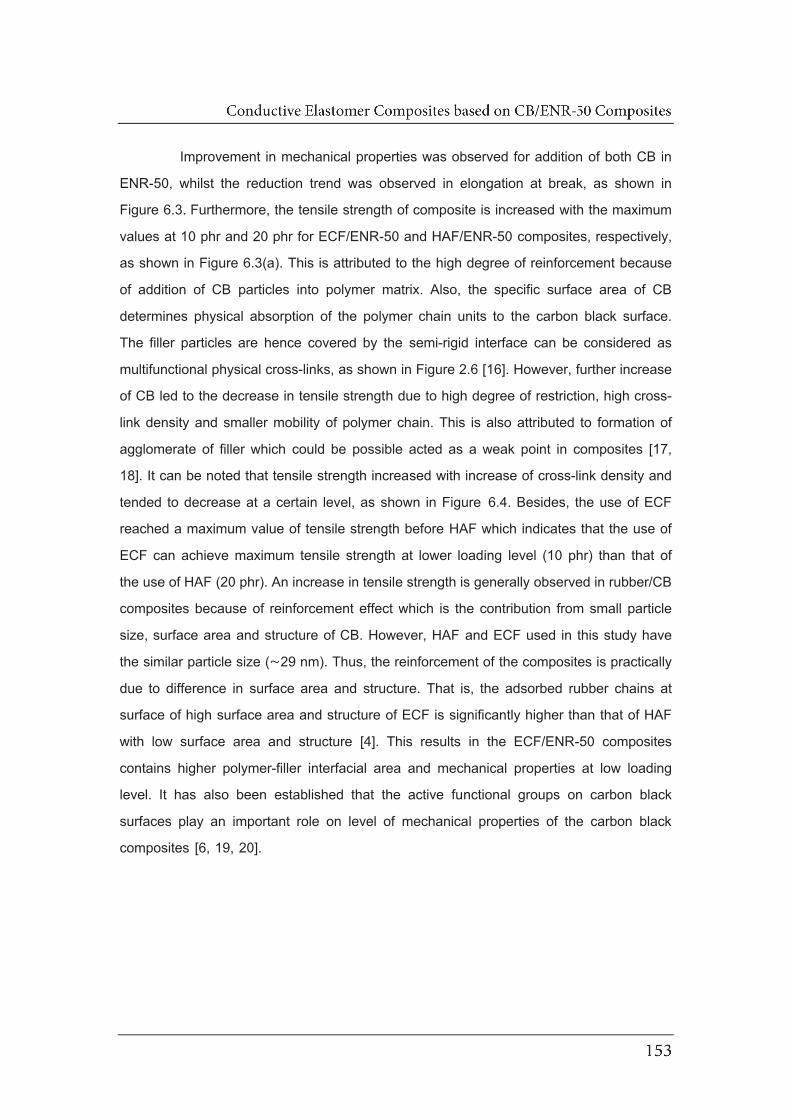
Improvement in mechanical properties was observed for addition of both CB in
ENR-50, whilst the reduction trend was observed in elongation at break, as shown in
Figure 6.3. Furthermore, the tensile strength of composite is increased with the maximum
values at 10 phr and 20 phr for ECF/ENR-50 and HAF/ENR-50 composites, respectively,
as shown in Figure 6.3(a). This is attributed to the high degree of reinforcement because
of addition of CB particles into polymer matrix. Also, the specific surface area of CB
determines physical absorption of the polymer chain units to the carbon black surface.
The filler particles are hence covered by the semi-rigid interface can be considered as
multifunctional physical cross-links, as shown in Figure 2.6 [16]. However, further increase
of CB led to the decrease in tensile strength due to high degree of restriction, high cross-
link density and smaller mobility of polymer chain. This is also attributed to formation of
agglomerate of filler which could be possible acted as a weak point in composites [17,
18]. It can be noted that tensile strength increased with increase of cross-link density and
tended to decrease at a certain level, as shown in Figure 6.4. Besides, the use of ECF
reached a maximum value of tensile strength before HAF which indicates that the use of
ECF can achieve maximum tensile strength at lower loading level (10 phr) than that of
the use of HAF (20 phr). An increase in tensile strength is generally observed in rubber/CB
composites because of reinforcement effect which is the contribution from small particle
size, surface area and structure of CB. However, HAF and ECF used in this study have
the similar particle size ( 29 nm). Thus, the reinforcement of the composites is practically
due to difference in surface area and structure. That is, the adsorbed rubber chains at
surface of high surface area and structure of ECF is significantly higher than that of HAF
with low surface area and structure [4]. This results in the ECF/ENR-50 composites
contains higher polymer-filler interfacial area and mechanical properties at low loading
level. It has also been established that the active functional groups on carbon black
surfaces play an important role on level of mechanical properties of the carbon black
composites [6, 19, 20].
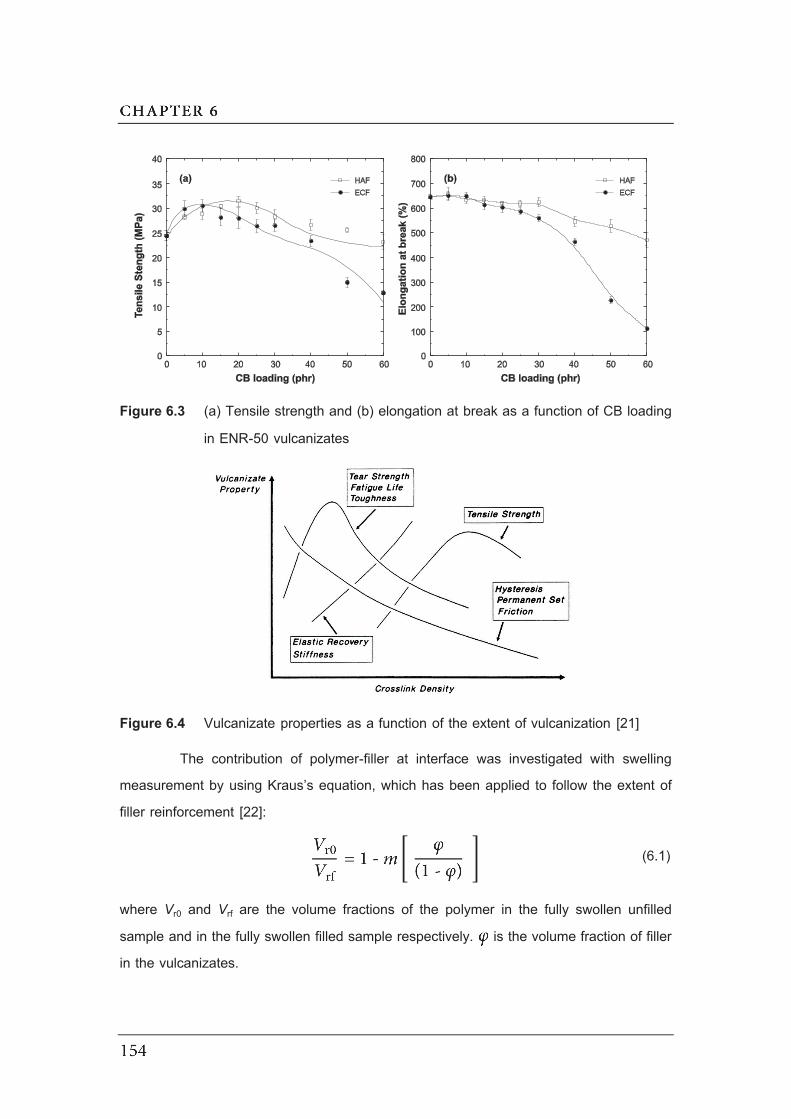
Figure 6.3 (a) Tensile strength and (b) elongation at break as a function of CB loading
in ENR-50 vulcanizates
Figure 6.4 Vulcanizate properties as a function of the extent of vulcanization [21]
The contribution of polymer-filler at interface was investigated with swelling
measurement by using Kraus’s equation, which has been applied to follow the extent of
filler reinforcement [22]:
where Vr0 and Vrf are the volume fractions of the polymer in the fully swollen unfilled
sample and in the fully swollen filled sample respectively. is the volume fraction of filler
in the vulcanizates.
(6.1)
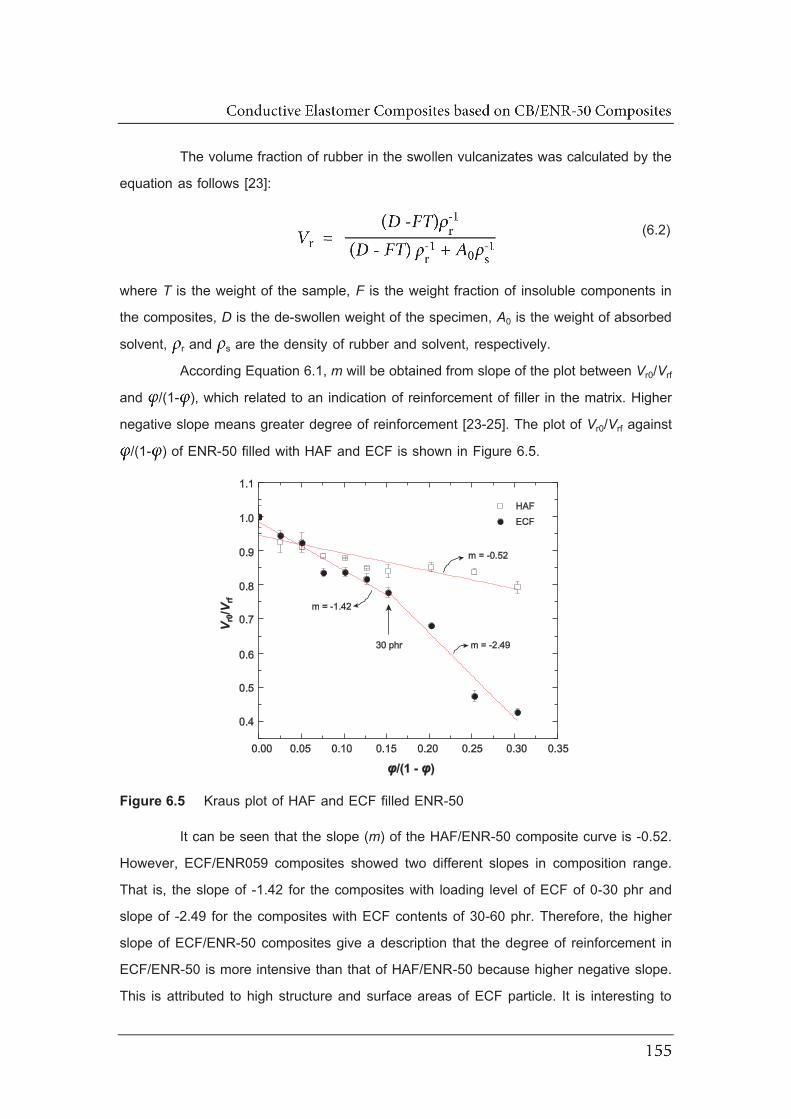
The volume fraction of rubber in the swollen vulcanizates was calculated by the
equation as follows [23]:
where T is the weight of the sample, F is the weight fraction of insoluble components in
the composites, D is the de-swollen weight of the specimen, A0 is the weight of absorbed
solvent, r and s are the density of rubber and solvent, respectively.
According Equation 6.1, m will be obtained from slope of the plot between Vr0/Vrf
and /(1- ), which related to an indication of reinforcement of filler in the matrix. Higher
negative slope means greater degree of reinforcement [23-25]. The plot of Vr0/Vrf against
/(1- ) of ENR-50 filled with HAF and ECF is shown in Figure 6.5.
Figure 6.5 Kraus plot of HAF and ECF filled ENR-50
It can be seen that the slope (m) of the HAF/ENR-50 composite curve is -0.52.
However, ECF/ENR059 composites showed two different slopes in composition range.
That is, the slope of -1.42 for the composites with loading level of ECF of 0-30 phr and
slope of -2.49 for the composites with ECF contents of 30-60 phr. Therefore, the higher
slope of ECF/ENR-50 composites give a description that the degree of reinforcement in
ECF/ENR-50 is more intensive than that of HAF/ENR-50 because higher negative slope.
This is attributed to high structure and surface areas of ECF particle. It is interesting to
(6.2)
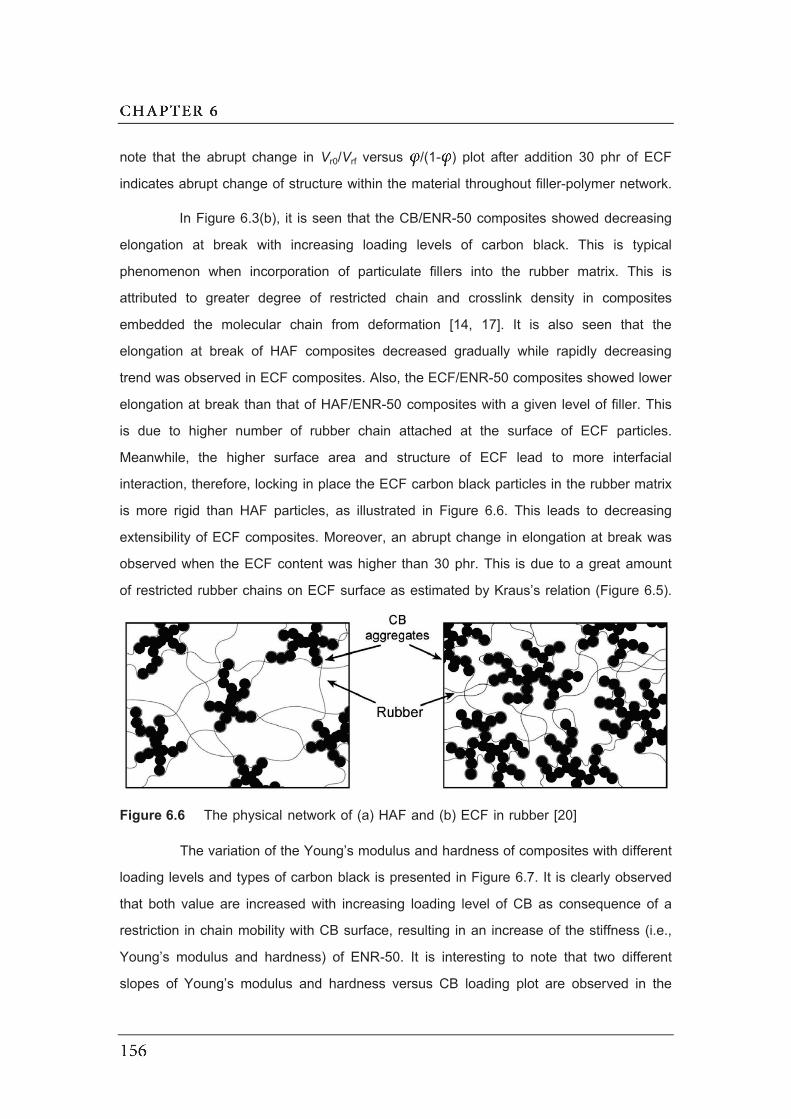
note that the abrupt change in Vr0/Vrf versus /(1- ) plot after addition 30 phr of ECF
indicates abrupt change of structure within the material throughout filler-polymer network.
In Figure 6.3(b), it is seen that the CB/ENR-50 composites showed decreasing
elongation at break with increasing loading levels of carbon black. This is typical
phenomenon when incorporation of particulate fillers into the rubber matrix. This is
attributed to greater degree of restricted chain and crosslink density in composites
embedded the molecular chain from deformation [14, 17]. It is also seen that the
elongation at break of HAF composites decreased gradually while rapidly decreasing
trend was observed in ECF composites. Also, the ECF/ENR-50 composites showed lower
elongation at break than that of HAF/ENR-50 composites with a given level of filler. This
is due to higher number of rubber chain attached at the surface of ECF particles.
Meanwhile, the higher surface area and structure of ECF lead to more interfacial
interaction, therefore, locking in place the ECF carbon black particles in the rubber matrix
is more rigid than HAF particles, as illustrated in Figure 6.6. This leads to decreasing
extensibility of ECF composites. Moreover, an abrupt change in elongation at break was
observed when the ECF content was higher than 30 phr. This is due to a great amount
of restricted rubber chains on ECF surface as estimated by Kraus’s relation (Figure 6.5).
Figure 6.6 The physical network of (a) HAF and (b) ECF in rubber [20]
The variation of the Young’s modulus and hardness of composites with different
loading levels and types of carbon black is presented in Figure 6.7. It is clearly observed
that both value are increased with increasing loading level of CB as consequence of a
restriction in chain mobility with CB surface, resulting in an increase of the stiffness (i.e.,
Young’s modulus and hardness) of ENR-50. It is interesting to note that two different
slopes of Young’s modulus and hardness versus CB loading plot are observed in the

ECF/ENR-50 composites. On the other hand, the HAF/ENR-50 composites showed a
single slope of Young’s modulus and hardness versus CB loading plot throughout the
ranges of filler used. In Figure 6.7, it is also seen that the slope of Young’s modulus and
hardness of ECF/ENR-50 composite are larger than that of HAF/ENR-50 composites
when the loading level of the ECF is higher than 30 phr. This confirmed the results of
polymer–filler interaction based on Kraus’s relation (Figure 6.5). This again may be
attributed to high structure and surface area of the ECF particles.
Figure 6.7 (a) Young’s modulus and (b) hardness versus CB loading in ENR-50
6.2.3 Dynamic mechanical analysis
Effect of type and loading level of CB on dynamic properties in term of storage
modulus (EE ) and loss tangent (tan ) of CB filled ENR-50 as a function of temperature
are shown in Figure 6.8. It can be seen that addition of CB led to a strong increasing EE
in CB/ENR-50 composites in the tested temperature range. However, the increment of EE
was more pronounced in the rubbery region. The increasing EE contributes from restricted
movement of rubber molecule at carbon black surface, which plays a role in reinforcement
of carbon black filler. The attachment of ENR-50 to the CB surfaces increase with higher
CB content, resulting in an increased EE . As expected, the EE is abruptly decreased around
three orders of magnitude when glass transition temperature (Tg) ranges of ENR-50 in
each type of composites. These results in the composites are transitioned from glassy to
rubber states. Loss tangent (tan ) shows a peak at around -6°C which has been assigned
to the -relaxation or Tg of ENR-50. The representative values of the EE at -60 and 25°C
including the maximum loss tangent and Tg of ENR-50 are listed in Table 6.3. At rubbery
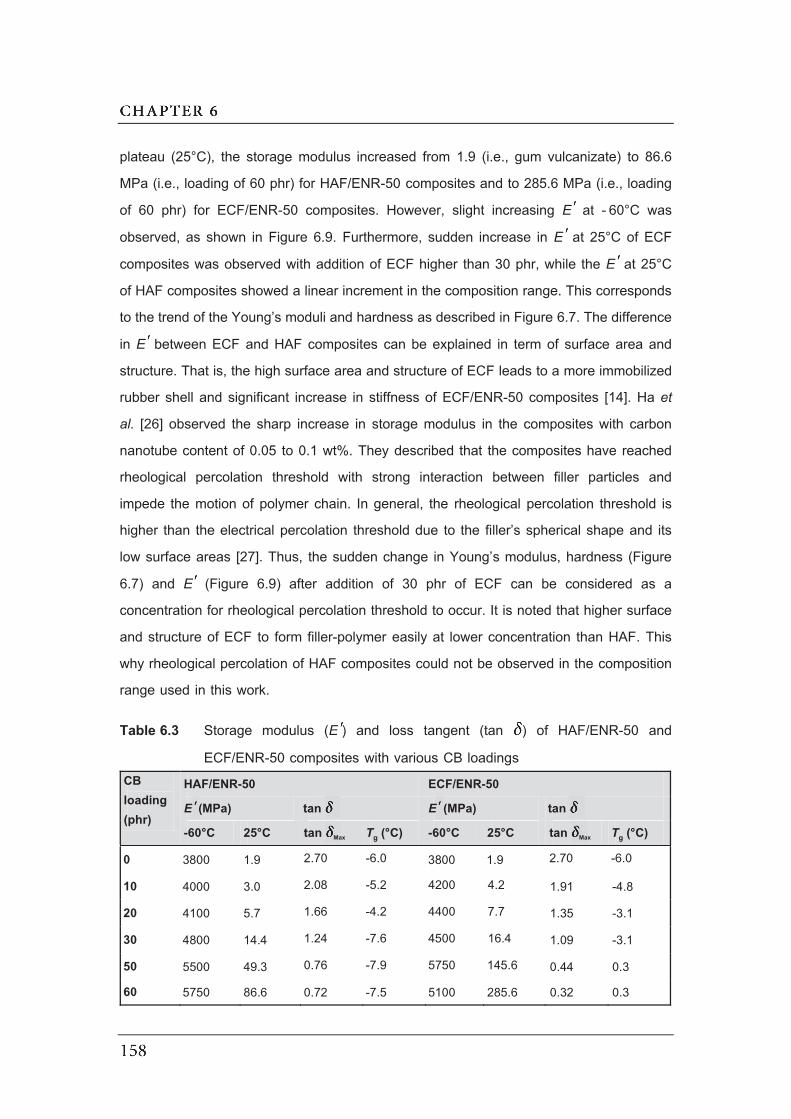
plateau (25°C), the storage modulus increased from 1.9 (i.e., gum vulcanizate) to 86.6
MPa (i.e., loading of 60 phr) for HAF/ENR-50 composites and to 285.6 MPa (i.e., loading
of 60 phr) for ECF/ENR-50 composites. However, slight increasing EE at - 60°C was
observed, as shown in Figure 6.9. Furthermore, sudden increase in EE at 25°C of ECF
composites was observed with addition of ECF higher than 30 phr, while the EE at 25°C
of HAF composites showed a linear increment in the composition range. This corresponds
to the trend of the Young’s moduli and hardness as described in Figure 6.7. The difference
in EE between ECF and HAF composites can be explained in term of surface area and
structure. That is, the high surface area and structure of ECF leads to a more immobilized
rubber shell and significant increase in stiffness of ECF/ENR-50 composites [14]. Ha et
al. [26] observed the sharp increase in storage modulus in the composites with carbon
nanotube content of 0.05 to 0.1 wt%. They described that the composites have reached
rheological percolation threshold with strong interaction between filler particles and
impede the motion of polymer chain. In general, the rheological percolation threshold is
higher than the electrical percolation threshold due to the filler’s spherical shape and its
low surface areas [27]. Thus, the sudden change in Young’s modulus, hardness (Figure
6.7) and EE (Figure 6.9) after addition of 30 phr of ECF can be considered as a
concentration for rheological percolation threshold to occur. It is noted that higher surface
and structure of ECF to form filler-polymer easily at lower concentration than HAF. This
why rheological percolation of HAF composites could not be observed in the composition
range used in this work.
Table 6.3 Storage modulus (EE ) and loss tangent (tan ) of HAF/ENR-50 and
ECF/ENR-50 composites with various CB loadings CB loading (phr)
HAF/ENR-50 ECF/ENR-50
EE (MPa) tan EE (MPa) tan
-60°C 25°C tan Max Tg (°C) -60°C 25°C tan Max Tg (°C)
0 3800 1.9 2.70 -6.0 3800 1.9 2.70 -6.0
10 4000 3.0 2.08 -5.2 4200 4.2 1.91 -4.8
20 4100 5.7 1.66 -4.2 4400 7.7 1.35 -3.1
30 4800 14.4 1.24 -7.6 4500 16.4 1.09 -3.1
50 5500 49.3 0.76 -7.9 5750 145.6 0.44 0.3
60 5750 86.6 0.72 -7.5 5100 285.6 0.32 0.3
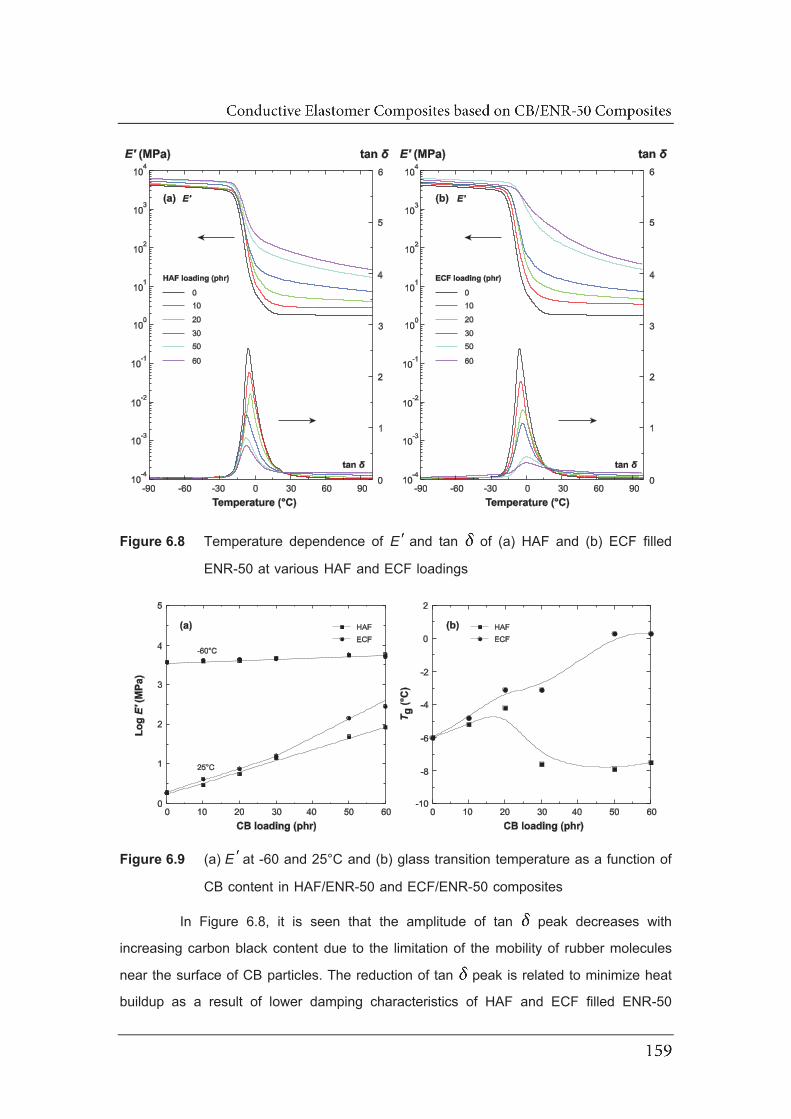
Figure 6.8 Temperature dependence of EE and tan of (a) HAF and (b) ECF filled
ENR-50 at various HAF and ECF loadings
Figure 6.9 (a) EE at -60 and 25°C and (b) glass transition temperature as a function of
CB content in HAF/ENR-50 and ECF/ENR-50 composites
In Figure 6.8, it is seen that the amplitude of tan peak decreases with
increasing carbon black content due to the limitation of the mobility of rubber molecules
near the surface of CB particles. The reduction of tan peak is related to minimize heat
buildup as a result of lower damping characteristics of HAF and ECF filled ENR-50

vulcanizates. It is also seen that at a given loading of carbon black, the ECF/ENR-50
composites showed the lower tan peak height than that of HAF/ENR-50 composites.
This indicates a strong filler–rubber interactions and higher reinforcement capability of the
ECF particles as compared with HAF counterpart. That is, high surface area and structure
of ECF are responsible to cause very strong interaction between ECF and ENR-50
molecules, which contributed to reduction of the chain mobility and reduction of tan
peak height during dynamic mechanical deformation [25, 26, 28, 29]. In Figure 6.8 and
Table 6.3, it is seen that increasing trend of Tg of ECF/ENR-50 composite was observed
upon increasing loading level of ECF. That is, a shift in Tg by +6°C was observed in
ECF/ENR-50 composite over the whole composition ranges. On the other hand, the Tg of
HAF/ENR-50 composite increased until the maximum value at a loading level of HAF =
20 phr. Increasing higher loading level of HAF than 20 phr causes decreasing trend of Tg
in HAF/ENR-50 composites. Therefore, the incorporation of carbon black filler could shift
Tg of the matrix due to the strong interaction at filler surface that restricts the mobility of
polymer chain segment [25, 30]. The immobilized rubber (occluded rubber) acts as a part
of the filler rather than of the polymer, that increases the effective volume of the filler. The
significant increase in Tg of ECF/ENR-50 composites is attributed to high structure and
surface area of ECF particles. This results in greater immobilization of rubber molecules
that restrict on the surface of ECF particles. However, addition of a much higher content
of HAF (i.e., 30-60 phr) shows lower Tg than that of gum vulcanizate. This is believed that
high content of filler prevents the packing of the polymer chain and consequently
increases the free volume of molecular mobility. This results in the cooperative motion of
the polymer chains at lower temperature [31, 32]. These results indicate a strong
interfacial interaction between the CB and rubber matrix, in particular, by the incorporation
of ECF.
6.2.4 Electrical properties
The variation of the dielectric permittivity ( ) at room temperature as a function
of frequency for HAF and ECF filled ENR-50 is shown in Figure 6.10. At a given tested
frequency, the value of the permittivity was significantly increased with increasing CB
content. Since the permittivity is a measurement of the polarization in the sample. Hence,
the amount of interfaces between CB and polymer is an important parameter to control
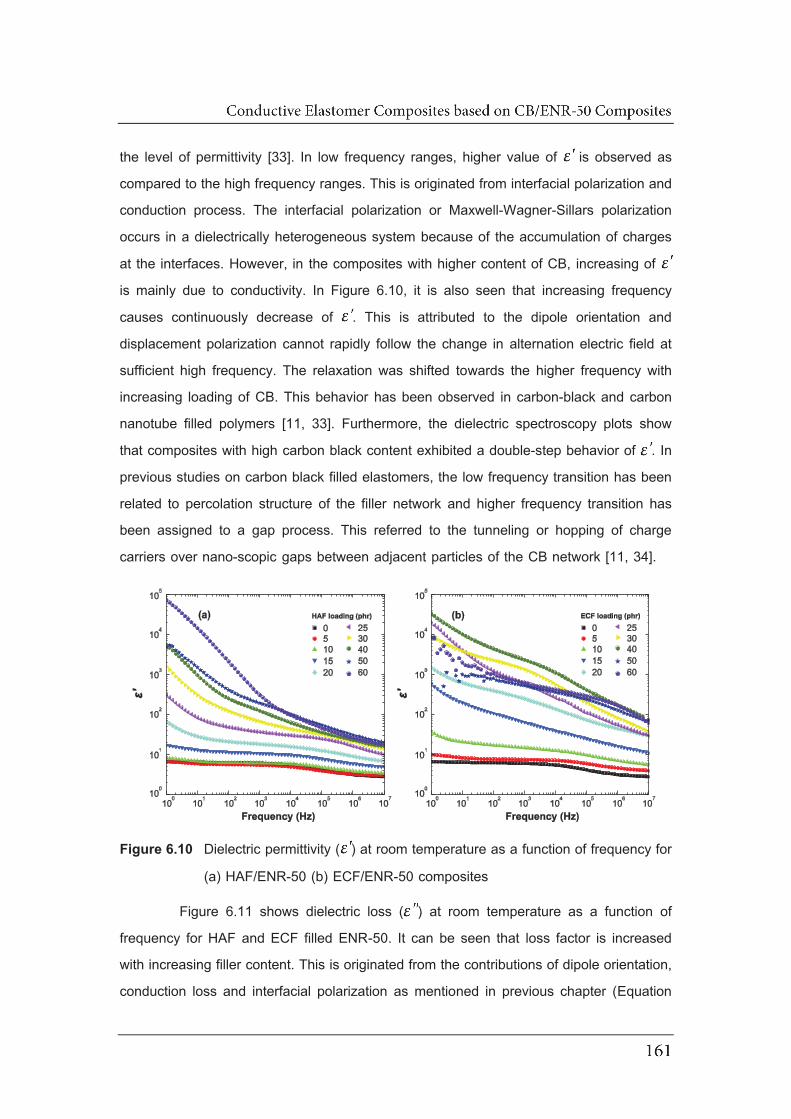
the level of permittivity [33]. In low frequency ranges, higher value of is observed as
compared to the high frequency ranges. This is originated from interfacial polarization and
conduction process. The interfacial polarization or Maxwell-Wagner-Sillars polarization
occurs in a dielectrically heterogeneous system because of the accumulation of charges
at the interfaces. However, in the composites with higher content of CB, increasing of
is mainly due to conductivity. In Figure 6.10, it is also seen that increasing frequency
causes continuously decrease of . This is attributed to the dipole orientation and
displacement polarization cannot rapidly follow the change in alternation electric field at
sufficient high frequency. The relaxation was shifted towards the higher frequency with
increasing loading of CB. This behavior has been observed in carbon-black and carbon
nanotube filled polymers [11, 33]. Furthermore, the dielectric spectroscopy plots show
that composites with high carbon black content exhibited a double-step behavior of . In
previous studies on carbon black filled elastomers, the low frequency transition has been
related to percolation structure of the filler network and higher frequency transition has
been assigned to a gap process. This referred to the tunneling or hopping of charge
carriers over nano-scopic gaps between adjacent particles of the CB network [11, 34].
Figure 6.10 Dielectric permittivity ( ) at room temperature as a function of frequency for
(a) HAF/ENR-50 (b) ECF/ENR-50 composites
Figure 6.11 shows dielectric loss ( ) at room temperature as a function of
frequency for HAF and ECF filled ENR-50. It can be seen that loss factor is increased
with increasing filler content. This is originated from the contributions of dipole orientation,
conduction loss and interfacial polarization as mentioned in previous chapter (Equation

5.1) [35, 36]. Furthermore, it is also visibly observed the relaxation peak in gum
vulcanizate, which originates from the dipole relaxation in the polymer chain or -
relaxation of ENR-50. Also, the polymer chain relaxation peak is found in the HAF and
ECF filled ENR-50 where the relaxation peaks are shifted to higher frequencies with the
increasing CB content. However, the relaxation was masked and exhibited as a linear
relation between and frequency when the CB content above 30 and 15 phr for HAF
and ECF composites, respectively. This is attributed to predominating of DC conduction
process in the composites with high CB loading. AC conductivity ( AC) of HAF and ECF
composites as a function frequency with different amounts of carbon black is shown in
Figure 6.12. It can be seen that the AC of HAF and ECF composites is increased with
increasing loading levels of CB in the vulcanizates. A significant increase in AC was
observed when introducing a high CB loading. This is attributed to the shorter distance
between the charge carriers and flow of charges by hopping or tunneling [37, 38].
Figure 6.11 Dielectric loss factor ( ) at room temperature as a function of frequency for
(a) HAF/ENR-50 (b) ECF/ENR-50 composites
In general, the increase in AC (real part, ′) with increasing frequency in
isothermal condition can be expressed by the following equation [39, 40]:
where is the angular frequency (2 ), DC is the independent frequency conductivity or
DC conductivity ( → 0), A is a temperature-dependent constant and s is an exponent
dependent on both frequency and temperature. This is a typical behavior for a wide variety
(6.3)

of materials and is called by Jonscher “universal dynamic response” (UDR) because of a
wide variety of materials that displayed in such behavior [40].
Figure 6.12 AC conductivity at room temperature as a function of frequency for (a) HAF
and (b) ECF filled ENR-50 vulcanizate with various CB loading levels. The
solid line is a fit of Equation 6.3
In Figure 6.12, the frequency dependence of AC conductivity of CB/ENR-50
composite can be divided into two regions. First region, conductivity pattern shows
frequency independence at low frequency, exhibiting plateau region which can be
considered as a truly DC conductivity DC according to Equation 6.3. Second region,
frequency dependence behavior is observed. This is generally attributed to the hopping
transport phenomena, following a power law ( s) (Equation 6.3). In the conductive
composite, the appearance of plateau region have been widely interpreted that the
connective network or percolating paths of conductive clusters are formed in polymer
matrix [7, 25, 41]. Furthermore, the DC plateau was seen to be broaden with increase in
CB loading due to the increase in connected conductive networks within the insulating
rubber together with the decreasing distance between the CB particles and clusters [42].
It is also seen that all the conductive composites showed plateau regions until some
critical frequency ( c). Above this frequency, conductivity is again increased with a power
law. The transition region is therefore shifted to higher frequencies as increasing of CB
content. The values of DC, A, and s were obtained by fitting the power law equation are
listed in Table 6.4.
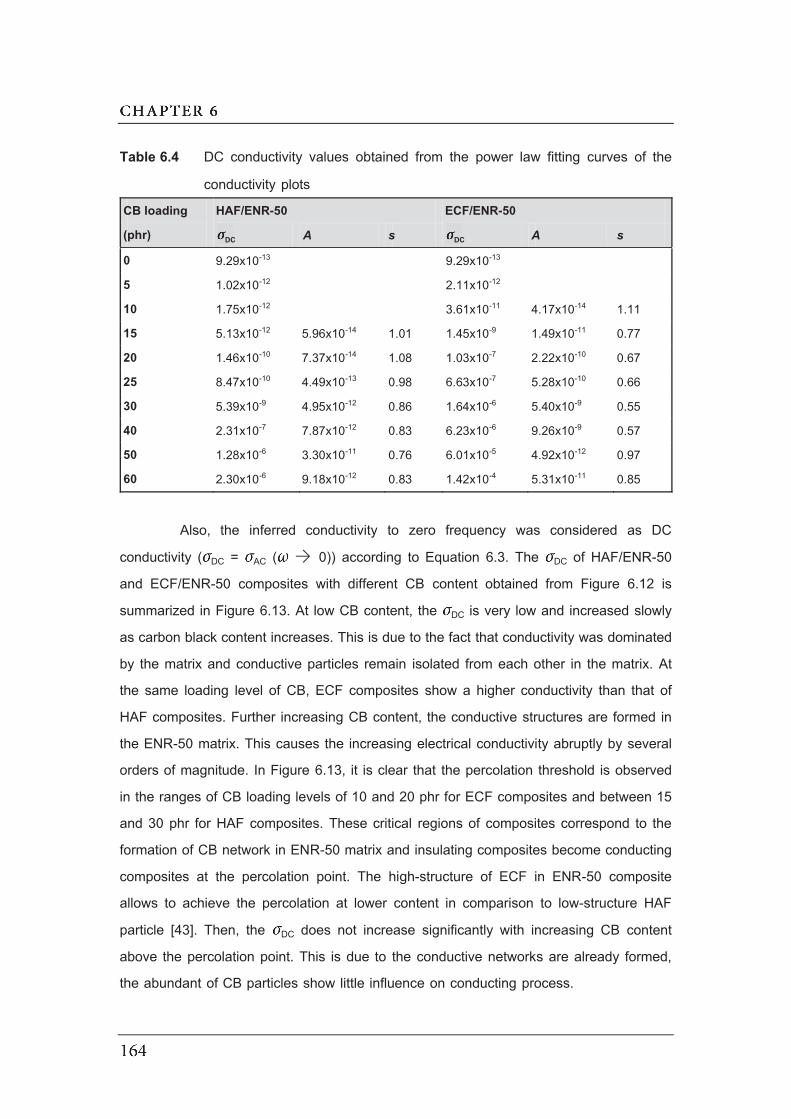
Table 6.4 DC conductivity values obtained from the power law fitting curves of the
conductivity plots
CB loading
(phr)
HAF/ENR-50 ECF/ENR-50
DC A s DC A s
0 9.29x10⁻¹³ 9.29x10⁻¹³
5 1.02x10⁻¹² 2.11x10⁻¹²
10 1.75x10⁻¹² 3.61x10⁻¹¹ 4.17x10⁻¹⁴ 1.11
15 5.13x10⁻¹² 5.96x10⁻¹⁴ 1.01 1.45x10⁻⁹ 1.49x10⁻¹¹ 0.77
20 1.46x10⁻¹⁰ 7.37x10⁻¹⁴ 1.08 1.03x10⁻⁷ 2.22x10⁻¹⁰ 0.67
25 8.47x10⁻¹⁰ 4.49x10⁻¹³ 0.98 6.63x10⁻⁷ 5.28x10⁻¹⁰ 0.66
30 5.39x10⁻⁹ 4.95x10⁻¹² 0.86 1.64x10⁻⁶ 5.40x10⁻⁹ 0.55
40 2.31x10⁻⁷ 7.87x10⁻¹² 0.83 6.23x10⁻⁶ 9.26x10⁻⁹ 0.57
50 1.28x10⁻⁶ 3.30x10⁻¹¹ 0.76 6.01x10⁻⁵ 4.92x10⁻¹² 0.97
60 2.30x10⁻⁶ 9.18x10⁻¹² 0.83 1.42x10⁻⁴ 5.31x10⁻¹¹ 0.85
Also, the inferred conductivity to zero frequency was considered as DC
conductivity ( DC = AC ( → 0)) according to Equation 6.3. The DC of HAF/ENR-50
and ECF/ENR-50 composites with different CB content obtained from Figure 6.12 is
summarized in Figure 6.13. At low CB content, the DC is very low and increased slowly
as carbon black content increases. This is due to the fact that conductivity was dominated
by the matrix and conductive particles remain isolated from each other in the matrix. At
the same loading level of CB, ECF composites show a higher conductivity than that of
HAF composites. Further increasing CB content, the conductive structures are formed in
the ENR-50 matrix. This causes the increasing electrical conductivity abruptly by several
orders of magnitude. In Figure 6.13, it is clear that the percolation threshold is observed
in the ranges of CB loading levels of 10 and 20 phr for ECF composites and between 15
and 30 phr for HAF composites. These critical regions of composites correspond to the
formation of CB network in ENR-50 matrix and insulating composites become conducting
composites at the percolation point. The high-structure of ECF in ENR-50 composite
allows to achieve the percolation at lower content in comparison to low-structure HAF
particle [43]. Then, the DC does not increase significantly with increasing CB content
above the percolation point. This is due to the conductive networks are already formed,
the abundant of CB particles show little influence on conducting process.

Figure 6.13 DC conductivity ( DC) versus CB loading levels of HAF and ECF composites
The classical relationship between the DC conductivity ( DC) of conductive
particles filled polymer and conductive concentration (p) in the composite is well known
as scaling law, which can be used to estimate percolation threshold (pc) in the conductive
composite [44]:
for
where 0 is a constant, p is the filler concentration, pc is the filler concentration at
percolation threshold and t is the critical exponent. The electrical percolation threshold
(pc) was fitted the DC data for p > pc.
The pc was determined from Figure 6.13, it was found that the best fitting for
percolation threshold (pc) in composites were 25.3 0.4 and 12.4 2.0 phr, respectively.
A density of 1.8 g/cm3 were employed to convert from phr to vol% [7]. Thus, the
percolation threshold (pc) of HAF and ECF composites are 12.0 vol% and 6.3 vol%,
respectively. The ECF/ENR-50 composite show lower percolation threshold than that of
HAF/ENR-50 composite due to high structure of ECF particles. The complex shape of
ECF causes to form better conductive network which is formed through the spatial
arrangement of carbon aggregate in the polymer matrix, as shown in Figure 6.14. It can
be seen that high electrical contact of high-structure ECF are created in conductive
(6.4)

composite and electrical percolation reached at very low ECF content as compared with
low-structure HAF. It was revealed that high structure CB exhibit more complex shapes,
higher internal voids and large surface, leading to observed low percolation limit [7, 14,
43]. It is claimed that the estimated value of the percolation threshold for ECF/ENR-50
composite in this work is lower than those of conductive elastomer composites which
have been reported in literature [6-8]. That is, Ghosh and Chakrabarti [6] obtained the
percolation concentration zone over a carbon black loading range of 20-35 phr in
ethylene-propylene diene copolymer (EPDM). Whereas, Reffaee et al. [8] filled HAF in
acrylonitrile butadiene rubber (NBR) by melt mixing technique and found the percolation
threshold at approximately 30 phr of HAF. Furthermore, the high structure of ECF not
only reduces percolation threshold concentration but it also increases the conductivity
above percolation concentration. That is, the ECF composite reaches a value of 10-4
S cm-1, while HAF composite reaches a value of 10-6 S cm-1. This indicates that ECF
composite is a conductive composite with low percolation threshold and high conductivity.
Figure 6.14 The formation of conductive network of two different CB structures
The t value can be obtained from the slope of DC as a function of (p - pc) on a
double logarithm scale, as shown in Figure 6.15. The t value of 3.3 0.01 and 3.1 0.16 are observed in HAF/ENR-50 and ECF/ENR-50 composites, respectively. Theoretically,
a value of t = 2.0 is predicted for a statistical percolation network in three dimensions
[45]. The t values based on our experiment are higher than theory, which might be
probably due to the fact that wider inter-particle distance distribution yields a diverging
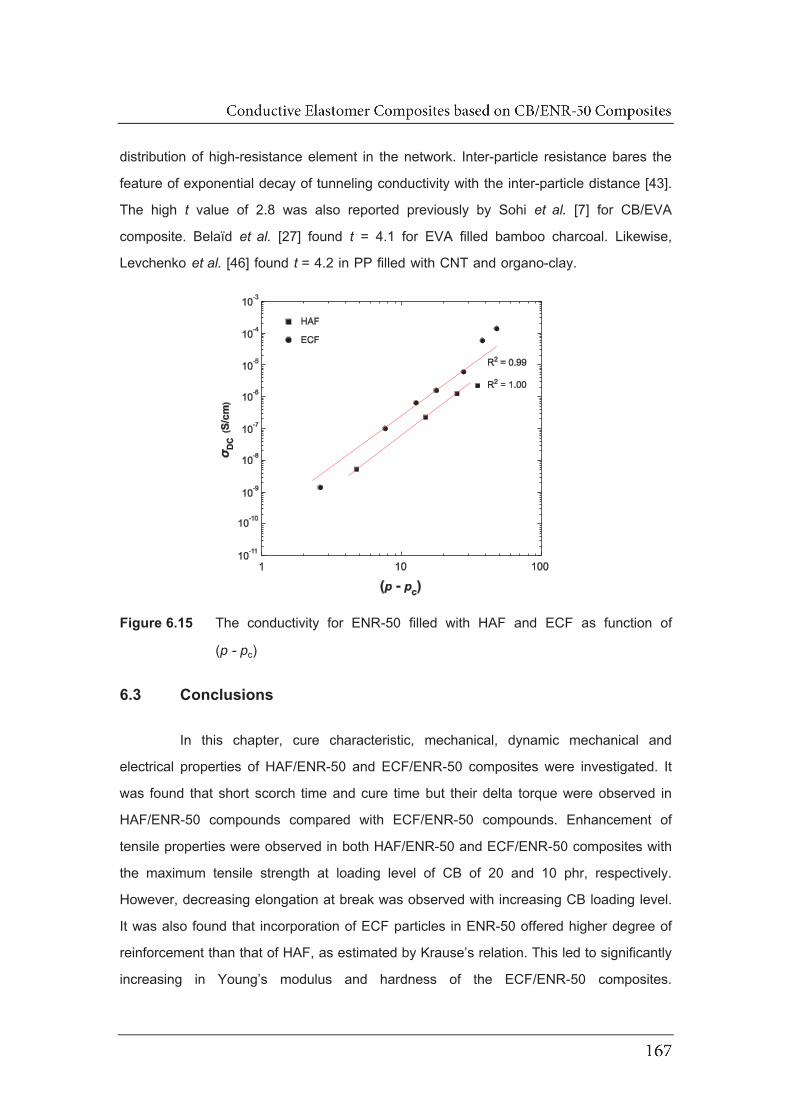
distribution of high-resistance element in the network. Inter-particle resistance bares the
feature of exponential decay of tunneling conductivity with the inter-particle distance [43].
The high t value of 2.8 was also reported previously by Sohi et al. [7] for CB/EVA
composite. Belaïd et al. [27] found t = 4.1 for EVA filled bamboo charcoal. Likewise,
Levchenko et al. [46] found t = 4.2 in PP filled with CNT and organo-clay.
Figure 6.15 The conductivity for ENR-50 filled with HAF and ECF as function of
(p - pc)
6.3 Conclusions
In this chapter, cure characteristic, mechanical, dynamic mechanical and
electrical properties of HAF/ENR-50 and ECF/ENR-50 composites were investigated. It
was found that short scorch time and cure time but their delta torque were observed in
HAF/ENR-50 compounds compared with ECF/ENR-50 compounds. Enhancement of
tensile properties were observed in both HAF/ENR-50 and ECF/ENR-50 composites with
the maximum tensile strength at loading level of CB of 20 and 10 phr, respectively.
However, decreasing elongation at break was observed with increasing CB loading level.
It was also found that incorporation of ECF particles in ENR-50 offered higher degree of
reinforcement than that of HAF, as estimated by Krause’s relation. This led to significantly
increasing in Young’s modulus and hardness of the ECF/ENR-50 composites.

Furthermore, dynamic mechanical properties revealed the significant improvement in
storage modulus and reduction of tan peak height of ECF composite due to the higher
reinforcing efficiency of the ECF particles compared with HAF counterpart. The abruptly
increase in Young’s modulus, hardness and storage modulus with addition ECF above
30 phr might be attributed to the rheological percolation. Also, a shift in glass transition
by +6°C was observed in ECF/ENR-50 composites over the whole composition range.
On the other hand, the Tg of HAF composite increased until a loading level of 20 phr of
HAF beyond this point the decreasing trend in Tg was observed. The electrical properties
of CB/ENR-50 composites were also studied by employing dielectric spectroscopy. The
incorporation of CB leads to increase permittivity, loss factor and conductivity of the
composites. The use of ECF show higher conductivity than that of HAF at a given loading
level of CB. The electrical percolation threshold (pc) in HAF/ENR-50 and ECF/ENR-50
composites was found at 25.3 and 12.4 phr of CB, which are equivalent to 12.0 and 6.3
vol%, respectively. It is therefore concluded that the percolation threshold of ECF/ENR-
50 composites is very low and it could be considered as high conductive elastomer
material.
6.4 References
[1] Klüppel, M., Schroüder, A. and Heinrich, G. 2007. Carbon black, in Physical
Properties of Polymers Handbook, J.E. Mark, ed. Springer, New York.
[2] Huang, J.C. 2002. Carbon black filled conducting polymers and polymer blends.
Adv. Polym. Tech. 21, 299-313.
[3] Fröhlich, J., Niedermeier, W. and Luginsland, H.D. 2005. The effect of filler–filler
and filler–elastomer interaction on rubber reinforcement. Compos. Part A: Appl. S.
36, 449-460.
[4] Wang, M.-J. 1998. Effect of polymer-filler and filler-filler interactions on dynamic
properties of filled vulcanizates. Rubber Chem. Technol. 71, 520-589.
[5] Zhang, W., Dehghani-Sanij, A.A. and Blackburn, R.S. 2007. Carbon based
conductive polymer composites. J. Mater. Sci. 42, 3408-3418.
[6] Ghosh, P. and Chakrabarti, A. 2000. Conducting carbon black filled EPDM
vulcanizates: assessment of dependence of physical and mechanical properties
and conducting character on variation of filler loading. Eur. Polym. J. 36, 1043-
1054.
[7] Sohi, N.J.S., Bhadra, S. and Khastgir, D. 2011. The effect of different carbon fillers
on the electrical conductivity of ethylene vinyl acetate copolymer-based composites
and the applicability of different conductivity models. Carbon. 49, 1349-1361.
[8] Reffaee, A.S.A., El Nashar, D.E., Abd-El-Messieh, S.L. and Abd-El Nour, K.N.
2009. Electrical and mechanical properties of acrylonitrile rubber and linear low
density polyethylene composites in the vicinity of the percolation threshold. Mater.
Design. 30, 3760-3769.
[9] Nanda, M. and Tripathy, D.K. 2008. Physico-mechanical and electrical properties
of conductive carbon black reinforced chlorosulfonated polyethylene vulcanizates.
Express Polym. Lett. 2, 855-865.
[10] Sau, K.P., Chaki, T.K. and Khastgir, D. 1997. Conductive rubber composites from
different blends of ethylene-propylene-diene rubber and nitrile rubber. J. Mater.
Sci. 32, 5717-5724.
[11] Das, A., Stöckelhuber, K.W., Jurk, R., Saphiannikova, M., Fritzsche, J., Lorenz,
H., Klüppel, M. and Heinrich, G. 2008. Modified and unmodified multiwalled carbon
nanotubes in high performance solution-styrene-butadiene and butadiene rubber
blends. Polymer. 49, 5276-5283.
[12] Bhattacharyya, S., Sinturel, C., Bahloul, O., Saboungi, M.L., Thomas, S. and
Salvetat, J.P. 2008. Improving reinforcement of natural rubber by networking of
activated carbon nanotubes. Carbon. 46, 1037-1045.
[13] Bokobza, L. and Kolodziej, M. 2006. On the use of carbon nanotubes as reinforcing
fillers for elastomeric materials. Polym. Int. 55, 1090-1098.
[14] Li, Z.H., Zhang, J. and Chen, S.J. 2008. Effects of carbon blacks with various
structures on vulcanization and reinforcement of filled ethylene-propylene-diene
rubber. Express Polym. Lett. 2, 695-704.
[15] Luo, Y.Y., Wang, Y.Q., Zhong, J.P., He, C.Z., Li, Y.Z. and Peng, Z. 2011.
Interaction between fumed-silica and epoxidized natural rubber. J. Inorg.
Organomet. P. 21, 777-783.
[16] Litvinov, V.M. and Steeman, P.A.M. 1999. EPDM-carbon black interactions and
the reinforcement mechanisms, as studied by low-resolution 1H NMR.
Macromolecules. 32, 8476-8490.
[17] Dijkhuis, K.A.J., Noordermeer, J.W.M. and Dierkes, W.K. 2009. The relationship
between crosslink system, network structure and material properties of carbon
black reinforced EPDM. Eur. Polym. J. 45, 3302-3312.
[18] Praveen, S., Chattopadhyay, P.K., Jayendran, S., Chakraborty, B.C. and
Chattopadhyay, S. 2010. Effect of rubber matrix type on the morphology and
reinforcement effects in carbon black-nanoclay hybrid composites-a comparative
assessment. Polym. Compos. 31, 97-104.
[19] Manna, A.K., De, P.P., Tripathy, D.K. and De, S.K. 1998. Hysteresis and strain-
dependent dynamic mechanical properties of epoxidized natural rubber filled with
surface-oxidized carbon black. J. Appl. Polym. Sci. 70, 723-730.
[20] Salaeh, S. and Nakason, C. 2012. Influence of modified natural rubber and
structure of carbon black on properties of natural rubber compounds. Polym.
Compos. 33, 489-500.
[21] Coran, A.Y. 2011. Vulcanization, in Science and Technology of Rubber, J.E. Mark,
B. Erman and F. R. Eirich, eds. Elsevier, New York.
[22] Kraus, G. 1963. Swelling of filler-reinforced vulcanizates. J. Appl. Polym. Sci. 7,
861-871.
[23] Shanmugharaj, A.M. and Ryu, S.H. 2013. Influence of aminosilane-functionalized
carbon nanotubes on the rheometric, mechanical, electrical and thermal
degradation properties of epoxidized natural rubber nanocomposites. Polym. Int.
62, 1433-1441.
[24] Stephen, R., Ranganathaiah, C., Varghese, S., Joseph, K. and Thomas, S. 2006.
Gas transport through nano and micro composites of natural rubber (NR) and their
blends with carboxylated styrene butadiene rubber (XSBR) latex membranes.
Polymer. 47, 858-870.
[25] Sahoo, B.P., Naskar, K. and Tripathy, D.K. 2012. Conductive carbon black-filled
ethylene acrylic elastomer vulcanizates: physico-mechanical, thermal, and
electrical properties. J. Mater. Sci. 47, 2421-2433.
[26] Ha, M.L.P., Grady, B.P., Lolli, G., Resasco, D.E. and Ford, W.T. 2007.
Composites of single-walled carbon nanotubes and styrene-isoprene copolymer
latices. Macromol. Chem. Phys. 208, 446-456.
[27] Belaïd, S., Boiteux, G. and Cassagnau, P. 2013. Rheological and electrical
properties of EVA copolymer filled with bamboo charcoal. Rheol. Acta. 52, 75-84.
[28] Teh, P.L., Ishak, Z.A.M., Hashim, A.S., Karger-Kocsis, J. and Ishiaku, U.S. 2004.
Effects of epoxidized natural rubber as a compatibilizer in melt compounded natural
rubber-organoclay nanocomposites. Eur. Polym. J. 40, 2513-2521.
[29] Das, A., Costa, F.R., Wagenknecht, U. and Heinrich, G. 2008. Nanocomposites
based on chloroprene rubber: effect of chemical nature and organic modification of
nanoclay on the vulcanizate properties. Eur. Polym. J. 44, 3456-3465.
[30] López-Manchado, M.A., Biagiotti, J., Valentini, L. and Kenny, J.M. 2004. Dynamic
mechanical and raman spectroscopy studies on interaction between single-walled
carbon nanotubes and natural rubber. J. Appl. Polym. Sci. 92, 3394-3400.
[31] Logakis, E., Pandis, C., Peoglos, V., Pissis, P., Stergiou, C., Pionteck, J.,
Pötschke, P., Micusík, M. and Omastová, M. 2009. Structure–property
relationships in polyamide 6/multi-walled carbon nanotubes nanocomposites. J.
Polym. Sci. Pol. Phys. 47, 764-774.
[32] Kosmidou, T.V., Vatalis, A.S., Delides, C.G., Logakis, E., Pissis, P. and
Papanicolaou, G.C. 2008. Structural, mechanical and electrical characterization of
epoxy-amine/carbon black nanocomposites. Express Polym. Lett. 2, 364-372.
[33] Fritzsche, J., Lorenz, H. and Klüppel, M. 2009. CNT based elastomer-hybrid-
nanocomposites with promising mechanical and electrical properties. Macromol.
Mater. Eng. 294, 551-560.
[34] Meier, J.G. and Klüppel, M. 2008. Carbon black networking in elastomers
monitored by dynamic mechanical and dielectric spectroscopy. Macromol. Mater.
Eng. 293, 12-38.
[35] Chen, Q., Xi, Y., Bin, Y. and Matsuo, M. 2008. Electrical and dielectric properties
in carbon fiber-filled LMWPE/UHMWPE composites with different blend ratios. J.
Polym. Sci. Pol. Phys. 46, 359-369.
[36] Huang, X., Xie, L., Jiang, P., Wang, G. and Liu, F. 2009. Electrical, thermophysical
and micromechanical properties of ethylene-vinyl acetate elastomer composites
with surface modified BaTiO3 nanoparticles. J. Phys. D: Appl. Phys. 42, 245407.
[37] Subramaniam, K., Das, A., Steinhauser, D., Klüppel, M. and Heinrich, G. 2011.
Effect of ionic liquid on dielectric, mechanical and dynamic mechanical properties
of multi-walled carbon nanotubes/polychloroprene rubber composites. Eur. Polym.
J. 47, 2234-2243.
[38] Psarras, G.C., Manolakaki, E. and Tsangaris, G.M. 2002. Electrical relaxations in
polymeric particulate composites of epoxy resin and metal particles. Compos. Part
A: Appl. S. 33, 375-384.
[39] Dyre, J.C. and Schrøder, T.B. 2000. Universality of ac conduction in disordered
solids. Rev. Mod. Phys. 72, 873-892.
[40] Jonscher, A.K. 1977. The ‘universal’ dielectric response. Nature. 267, 673-679.
[41] Pötschke, P., Abdel-Goad, M., Alig, I., Dudkin, S. and Lellinger, D. 2004.
Rheological and dielectrical characterization of melt mixed polycarbonate-
multiwalled carbon nanotube composites. Polymer. 45, 8863-8870.
[42] Al-Saleh, M.H., Al-Anid, H.K., Husain, Y.A., El-Ghanem, H.M. and Jawad, S.A.
2013. Impedance characteristics and conductivity of CNT/ABS nanocomposites. J.
Phys. D: Appl. Phys. 46.
[43] Balberg, I. 2002. A comprehensive picture of the electrical phenomena in carbon
black-polymer composites. Carbon. 40, 139-143.
[44] Barrau, S., Demont, P., Peigney, A., Laurent, C. and Lacabanne, C. 2003. DC
and AC conductivity of carbon nanotubes-polyepoxy composites. Macromolecules.
36, 5187-5194.
[45] Logakis, E., Pandis, C., Peoglos, V., Pissis, P., Pionteck, J., Pötschke, P., Micusik,
M. and Omastova, M. 2009. Electrical/dielectric properties and conduction
mechanism in melt processed polyamide/multi-walled carbon nanotubes
composites. Polymer. 50, 5103-5111.
[46] Levchenko, V., Mamunya, Y., Boiteux, G., Lebovka, M., Alcouffe, P., Seytre, G.
and Lebedev, E. 2011. Influence of organo-clay on electrical and mechanical
properties of PP/MWCNT/OC nanocomposites. Eur. Polym. J. 47, 1351-1360.
CHAPTER 7
PHASE DEVELOPMENT AND MISCIBILITY OF
PVDF/ENR-50 SIMPLE BLENDS
7.1 Introduction
Blending of polymers is an attractive way to develop new materials by combining
two or more polymers, resulting in improvements of properties which could not be
obtained from the individual components [1, 2]. Most of polymer blends are generally
immiscible and their properties are strongly dependent on phase structure. The
morphology and physical properties of the blends can be tailored by adjusting blends
ratio, viscosity, as well as the interfacial adhesion between their phases [3, 4]. Morphology of immiscible blends can be divided into two categories; dispersed and co-
continuous structures. In the dispersed structure, the minor phase is generally dispersed
in the major component, matrix that controls the physical properties of the blends. In the
co-continuous phase structure, both components are interconnected in all directions, this
could be fully contributing concurrently to the blends properties. Three dimensional co-
continuous phase structure is a main criterion to form thermoplastic elastomer (TPE)
materials based on blending of thermoplastic and elastomeric materials via a simple blend
technique. The TPEs have attracted significant attention in polymer industries because
they exhibit properties of elastomeric materials at room and ambient temperature together
with the ability to process by using thermoplastic equipment. This is, the continuous hard
plastic phase provides strength and processability while the continuous soft rubbery phase
provides flexibility and elasticity of the materials [5].
Polymer blends generally exhibit high interfacial tension since it is only poor
interfacial adhesion between blend components leading to poor physical properties.
Therefore, compatibilization has been applied to improve interfacial adhesion or
interaction and to stabilize the phase morphology. The blend components would be

stabilized by covalent bonds, ionic bonds or attractive intermolecular forces, e.g., dipole-
dipole and ion-dipole interaction, charge-transfer, H-bonding, van der Waals forces, etc.
The blends are usually compatibilized either by addition of compatibilizer or by reactive
blending [ 6 - 9 ] . Miscibility and compatibility of polymer blends have been widely
investigated by various techniques such as FTIR [4, 10], NMR [11], microscopy, dynamic
mechanical properties [12-16] and dielectric properties [17-21].
Poly(vinylidene fluoride) (PVDF) molecules consist of alternating CH2 and CF2
groups in the carbon main chain. PVDF exhibits excellent mechanical properties and
flexural modulus. Furthermore, the alternating CF2 groups in PVDF molecules create
dipole with high permittivity and exhibit ferroelectricity under certain conditions. Due to
fluorine atoms in the molecular chain, PVDF has good chemical resistance and
weatherability [9, 12, 22-24]. Blending of PVDF with other polymers have been extensively
performed. It was found that the PVDF is miscible with poly(methyl methacrylate) (PMMA)
[10, 17], poly(vinyl alcohol) (PVA) [19], and acrylic rubber (ACM) [25]. Furthermore,
PVDF/ACM blend showed a single glass transition temperature (Tg), which indicates
miscibility of the blend with excellent elongation at break, strain recovery, and heat and
oil resistances [25]. However, the PVDF/polyamide-12 (PA-12) blend [26] and
PVDF/thermoplastic polyurethane (TPU) blend [9] are partially compatible.
Epoxidized natural rubber (ENR) is chemically modified natural rubber (NR) by
randomly replacement of epoxide groups to the double bond in cis-1,4-polyisoprene
chains. ENR with low content of epoxide groups still exhibit strain-induced crystallization
characteristics with high flexibility and mechanical properties in term of tensile strength
and elongation at break. ENR has been used to enhance interfacial adhesion of polymer
blends and to compatibilize filler-polymer composites. That is, high polarity of the epoxide
rings in ENR molecules develop strong interactions between components in polymer
blend and composite [27-29]. This evidences from blending of ENR with several polymers
such as polyamide-12 (PA-12) [4], thermoplastic polyurethane (TPU) [28] and nitrile
rubber (NBR) [29].
The main aim of this chapter is to prepare polymer blend based on PVDF/ENR
by simple blend technique. Effects of different epoxide level in ENR molecules (i.e., ENR-
25 and ENR-50 with 25 and 50 mol% epoxide, respectively) and various blend
composition were investigated. Moreover, miscibility and phase development of

PVDF/ENR blends were determined. Furthermore, morphological properties, static and
dynamic mechanical properties, differential scanning calorimetry, and dielectric analysis
of the prepared blends were examined. Finally, the evolution of co-continuous structure
of the blend was also investigated.
7.2 Effect of difference epoxidation level in ENR on the properties of
PVDF/ENR simple blend
PVDF/ENRs blends were prepared by simple blend technique according to the
methodology described in section 3.2.4. Two different types of ENRs (i.e., ENR-25 and
ENR-50) were used to prepare the simple blend. Morphological and physical properties
of the blends were analyzed. Further investigation have been done by dynamic
mechanical properties, differential scanning calorimetry, and dielectric analysis. The
evolution of co-continuous structure of the blend was also investigated.
7.2.1 Morphological properties
Figure 7.1 shows SEM micrographs of the PVDF/ENR-25 and PVDF/ENR-50
blends. It can be seen that the SEM micrographs showed the co-continuous phase
structures with remained PVDF phase and cavitations were the former location of ENRs
in the blends. Both blends exhibited the co-continuous structure, indicating 50/50 wt% is
in the composition range for co-continuity of PVDF/ENR-25 and PVDF/ENR-50. It is clear
that the PVDF/ENR-50 blend showed finer grain morphology of co-continuous phase
structure compared with the PVDF/ENR-25 counterpart. The domain size in PVDF/ENR-
25 blend developed with an average domain size of about 9.0 m while average domain
size of PVDF/ENR-50 was relatively small of about 3.7 m. This indicates a higher
interfacial adhesion and better miscibility between PVDF and ENR-50.

Figure 7.1 SEM micrographs of (a) PVDF/ENR-25 and (b) PVDF/ENR-50 blends
As discussed in section 2.2.1, phase separation can be caused by a high
molecular weight of polymer and weak interaction between blend components. The
miscibility contribution can be assessed in terms of solubility parameter [13, 30] (see
Equation 2.8). The smaller the difference ( ) in solubility is the better
miscibility. The solubility of polymers using in present work are listed in Table 7.1.
Table 7.1 Solubility parameter of PVDF, ENR-25 and ENR-50
Polymer PVDF [31] ENR-25 [32] ENR-50 [32]
Solubility parameter, (MPa)1/2 19.2 17.4 18.6
On the basis of theoretical considerations interfacial tension arises mainly from
the disparity between the polarities of the two polymer phases. The introduction of polar
functional group causes to reduce interfacial tension between the components of the
mixture. The difference between the solubility parameters ( ) of the two polymer types
increases as a consequence, interfacial tension increases as well [30]. Therefore, can
be used to estimate interfacial tension in polymer blend. Based on data from Table 7.1,
the solubility parameter of the ENR-50 is very close to PVDF as compared with ENR-25.
The interfacial tension for the PVDF/ENRs blend is order as follows: PVDF/ENR-50 ( = 0 . 6 ) < PVDF/ENR-25 ( = 1.8). The small difference in solubility parameter of
PVDF/ENR-50 is due to the presence of 50 mol% epoxide group in ENR chain, which
increases solubility parameter and improve thermodynamic miscibility in PVDF/ENR-50.
This supports the explanation on the decrease in domain size of PVDF/ENR-50 blends.
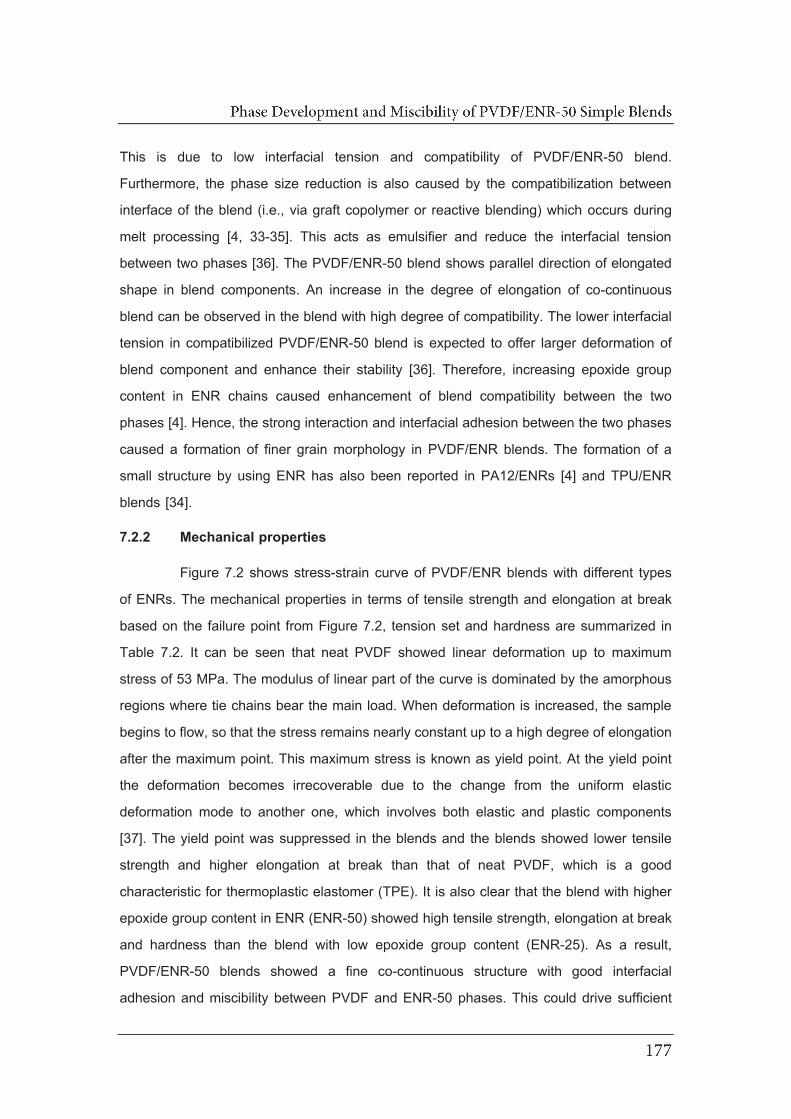
This is due to low interfacial tension and compatibility of PVDF/ENR-50 blend.
Furthermore, the phase size reduction is also caused by the compatibilization between
interface of the blend (i.e., via graft copolymer or reactive blending) which occurs during
melt processing [4, 33-35]. This acts as emulsifier and reduce the interfacial tension
between two phases [36]. The PVDF/ENR-50 blend shows parallel direction of elongated
shape in blend components. An increase in the degree of elongation of co-continuous
blend can be observed in the blend with high degree of compatibility. The lower interfacial
tension in compatibilized PVDF/ENR-50 blend is expected to offer larger deformation of
blend component and enhance their stability [36]. Therefore, increasing epoxide group
content in ENR chains caused enhancement of blend compatibility between the two
phases [4]. Hence, the strong interaction and interfacial adhesion between the two phases
caused a formation of finer grain morphology in PVDF/ENR blends. The formation of a
small structure by using ENR has also been reported in PA12/ENRs [4] and TPU/ENR
blends [34].
7.2.2 Mechanical properties
Figure 7.2 shows stress-strain curve of PVDF/ENR blends with different types
of ENRs. The mechanical properties in terms of tensile strength and elongation at break
based on the failure point from Figure 7.2, tension set and hardness are summarized in
Table 7.2. It can be seen that neat PVDF showed linear deformation up to maximum
stress of 53 MPa. The modulus of linear part of the curve is dominated by the amorphous
regions where tie chains bear the main load. When deformation is increased, the sample
begins to flow, so that the stress remains nearly constant up to a high degree of elongation
after the maximum point. This maximum stress is known as yield point. At the yield point
the deformation becomes irrecoverable due to the change from the uniform elastic
deformation mode to another one, which involves both elastic and plastic components
[37]. The yield point was suppressed in the blends and the blends showed lower tensile
strength and higher elongation at break than that of neat PVDF, which is a good
characteristic for thermoplastic elastomer (TPE). It is also clear that the blend with higher
epoxide group content in ENR (ENR-50) showed high tensile strength, elongation at break
and hardness than the blend with low epoxide group content (ENR-25). As a result,
PVDF/ENR-50 blends showed a fine co-continuous structure with good interfacial
adhesion and miscibility between PVDF and ENR-50 phases. This could drive sufficient
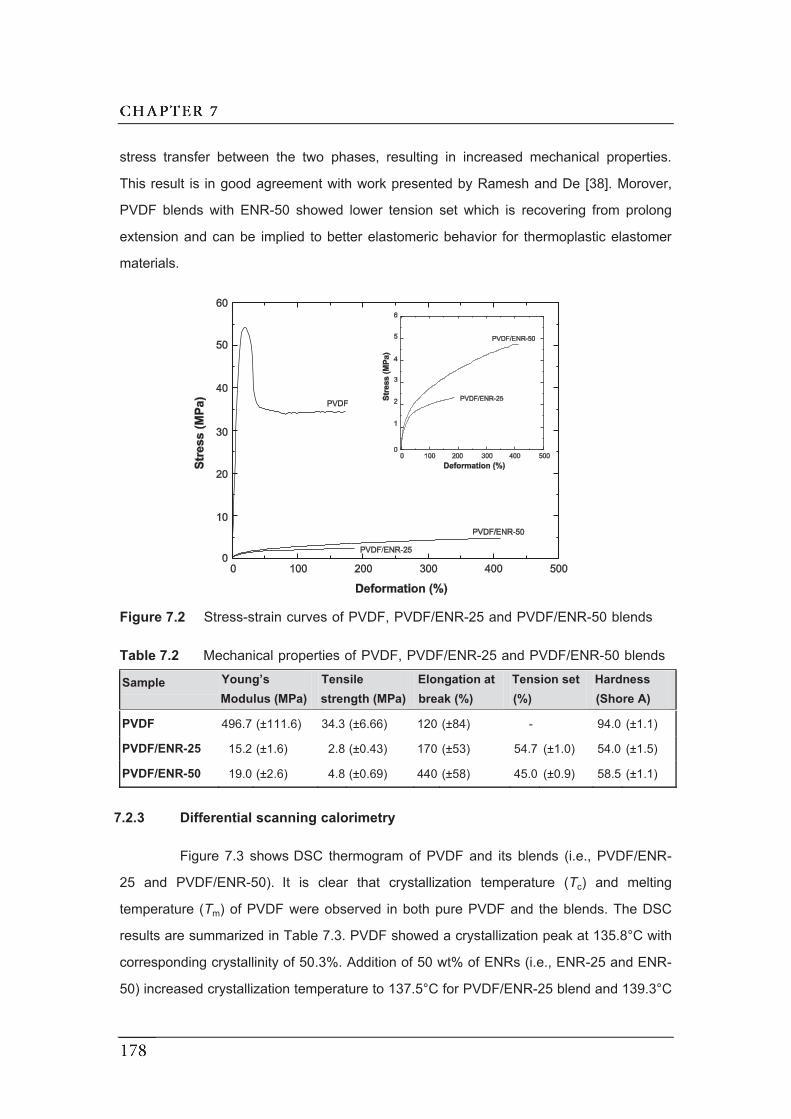
stress transfer between the two phases, resulting in increased mechanical properties.
This result is in good agreement with work presented by Ramesh and De [38]. Morover,
PVDF blends with ENR-50 showed lower tension set which is recovering from prolong
extension and can be implied to better elastomeric behavior for thermoplastic elastomer
materials.
Figure 7.2 Stress-strain curves of PVDF, PVDF/ENR-25 and PVDF/ENR-50 blends
Table 7.2 Mechanical properties of PVDF, PVDF/ENR-25 and PVDF/ENR-50 blends
Sample Young’s Modulus (MPa)
Tensile strength (MPa)
Elongation at break (%)
Tension set (%)
Hardness (Shore A)
PVDF 496.7 (±111.6) 34.3 (±6.66) 120 (±84) - 94.0 (±1.1)
PVDF/ENR-25 15.2 (±1.6) 2.8 (±0.43) 170 (±53) 54.7 (±1.0) 54.0 (±1.5)
PVDF/ENR-50 19.0 (±2.6) 4.8 (±0.69) 440 (±58) 45.0 (±0.9) 58.5 (±1.1)
7.2.3 Differential scanning calorimetry
Figure 7.3 shows DSC thermogram of PVDF and its blends (i.e., PVDF/ENR-
25 and PVDF/ENR-50). It is clear that crystallization temperature (Tc) and melting
temperature (Tm) of PVDF were observed in both pure PVDF and the blends. The DSC
results are summarized in Table 7.3. PVDF showed a crystallization peak at 135.8°C with
corresponding crystallinity of 50.3%. Addition of 50 wt% of ENRs (i.e., ENR-25 and ENR-
50) increased crystallization temperature to 137.5°C for PVDF/ENR-25 blend and 139.3°C
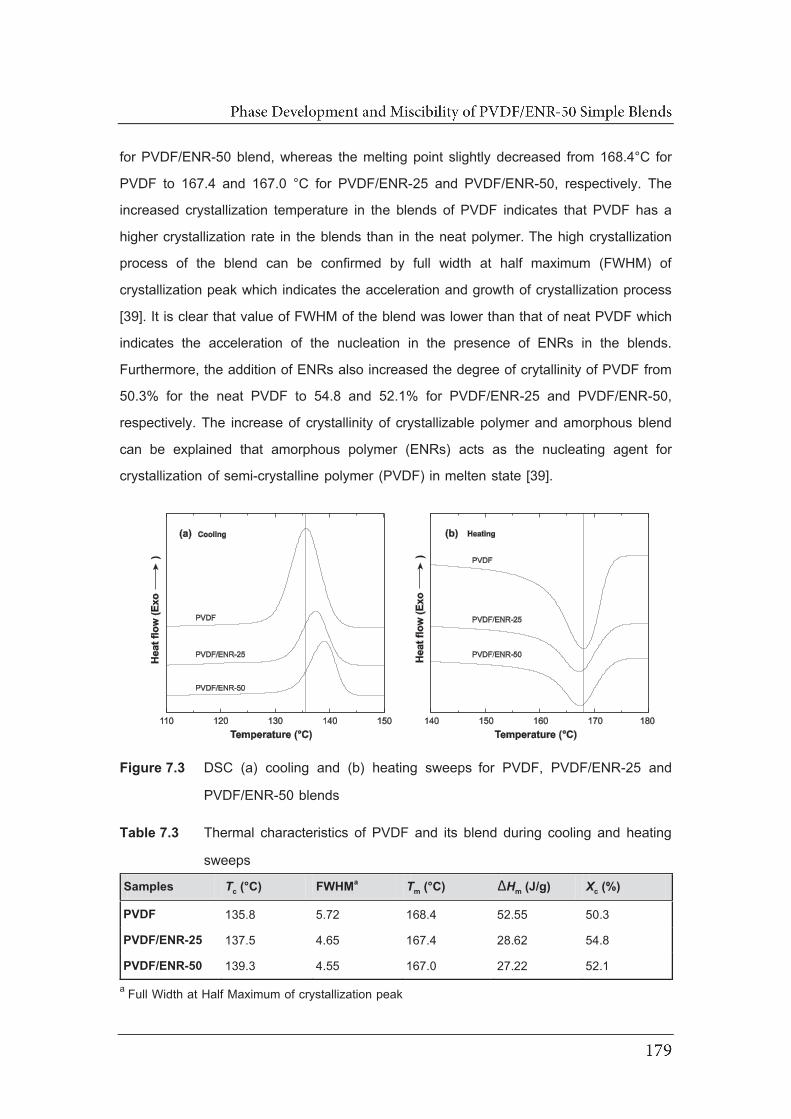
for PVDF/ENR-50 blend, whereas the melting point slightly decreased from 168.4°C for
PVDF to 167.4 and 167.0 °C for PVDF/ENR-25 and PVDF/ENR-50, respectively. The
increased crystallization temperature in the blends of PVDF indicates that PVDF has a
higher crystallization rate in the blends than in the neat polymer. The high crystallization
process of the blend can be confirmed by full width at half maximum (FWHM) of
crystallization peak which indicates the acceleration and growth of crystallization process
[39]. It is clear that value of FWHM of the blend was lower than that of neat PVDF which
indicates the acceleration of the nucleation in the presence of ENRs in the blends.
Furthermore, the addition of ENRs also increased the degree of crytallinity of PVDF from
50.3% for the neat PVDF to 54.8 and 52.1% for PVDF/ENR-25 and PVDF/ENR-50,
respectively. The increase of crystallinity of crystallizable polymer and amorphous blend
can be explained that amorphous polymer (ENRs) acts as the nucleating agent for
crystallization of semi-crystalline polymer (PVDF) in melten state [39].
Figure 7.3 DSC (a) cooling and (b) heating sweeps for PVDF, PVDF/ENR-25 and
PVDF/ENR-50 blends
Table 7.3 Thermal characteristics of PVDF and its blend during cooling and heating
sweeps
Samples Tc (°C) FWHMa Tm (°C) ΔHm (J/g) Xc (%)
PVDF 135.8 5.72 168.4 52.55 50.3
PVDF/ENR-25 137.5 4.65 167.4 28.62 54.8
PVDF/ENR-50 139.3 4.55 167.0 27.22 52.1 a Full Width at Half Maximum of crystallization peak

7.2.4 Dynamic mechanical analysis
DMA thermograms in terms of temperature dependence of storage modulus (EE )
and loss tangent (tan ) of the neat PVDF in the temperature ranges of -90 to 100°C and
a frequency 1 Hz are shown in Figure 7.4. It is seen that the neat PVDF exhibited high
modulus in the glass transition region. The storage modulus then abruptly dropped in the
glass transition region. The substantial decrease of EE indicates glass transition zone
which is also associated to tan relaxation. It is also clear that the PVDF showed three
relaxations (i.e., tan peak) around -39, 25 and 85°C. The relaxation at lower temperature
(~-39°C) is related to or a-relaxation which is attributed to segmental motion in the
amorphous regions. This is typically assigned to the glass transition temperature (Tg) of
PVDF. The relaxation at high temperature (~85°C) is related to -relaxation that
corresponds to segmental motion in crystalline region [40-44]. The weak relaxation
between and relaxation (~25°C) is related to the ′-relaxation. This corresponds to
fold motion in amorphous phase [44].
Figure 7.4 Temperature dependence of EE and tan of PVDF at 1 Hz
Effects of epoxidation level on storage modulus (EE ) and loss tangent (tan ) of
PVDF/ENRs blends are shown in Figure 7.5. The dynamic mechanical properties of the
blend are summarized in Table 7.4. It can be seen that all types of blends exhibited the
lower magnitude of EE compared with the neat PVDF. This is due to addition of ENRs

which caused an increase of the chain mobility of the blends. The changes in the storage
modulus at glass transition zone of PVDF are less drastic as compared with the blends
due to semi-crystalline nature [45]. In the semi-crystalline polymer, the crystalline chains
are regularly arranged and it will remain intact. Thus, the small amount of amorphous part
undergoes segmental motion and leads to observing a small drop in storage modulus of
semi-crystalline polymer (i.e., PVDF) at transition temperature. It is also seen that the
higher storage modulus was observed in the PVDF/ENR-50 blend compared with
PVDF/ENR-25 blend over the whole range of tested temperatures. As mentioned above,
stress transfer was improved significantly, accompanied by an increase in interfacial
adhesion, also resulting in an improved EE in dynamic mechanical properties.
In tan plot, it is seen that the PVDF/ENR-25 blend showed a single relaxation
peak or single glass transition temperature (Tg) at approximately -29.5°C. However,
PVDF/ENR-50 showed double relaxation peaks at approximately -35.8 and -9.7°C,
respectively. A single tan peak or a single Tg in polymer blends might be presumably a
proof of the miscible blends. However, in this type of blend, some degree of overlapping
of and -relaxation which are related to glass transition temperatures of PVDF (i.e., Tg
= -39.1°C) and ENR-25 (i.e., Tg = -23.9°C), respectively, might occur. This is the reason
why the phase separation in the form of co-continuous phase structure is obviously
observed in Figure 7.1. In the PVDF/ENR-50 blend, two relaxation peaks are associated
to glass transition temperature of PVDF and ENR-50, respectively, the immiscible or
partial miscible blend might occur. In this work, it is seen that the glass transition
temperatures of PVDF and ENR-50 were shifted from -39.1°C to -35.8°C and from -5.7°C
to -9.7°C, respectively. This indicates partial miscible blend where chemical interaction
between the phases contributed to the shift of the glass transition temperature. It is also
seen that the PVDF/ENR-25 blend showed lower glass transition temperature compared
with the one of the PVDF/ENR-50 blend. This is attributed to the steric interference caused
by the epoxide group and restriction of chain mobility due to the intermolecular forces
exerted on the ENR molecules as observed in ENR-25 and ENR-50 vulcanizates [46, 47]. Higher epoxide contents caused lower chain mobility and hence higher Tgs. Furthermore,
the ′ and -relaxation of PVDF could not be observed in all types of blends as marked
by higher tan of ENRs than that of the PVDF.
Figure 7.5 Temperature dependence of storage modulus and tan of PVDF,
PVDF/ENR-25 and PVDF/ENR-50 at 1 Hz
Table 7.4 Dynamic mechanical properties of PVDF and its blends
Samples Storage Modulus, E (MPa) Loss tangent (tan )
-60°C at 25°C tan max Tg (°C)
PVDF ENR PVDF ENR
PVDF 8100 1765 0.10 - -39.8 -
ENR-25 6220 2.1 - 2.62 - -23.7
ENR-50 3800 1.9 - 2.70 - -5.7
PVDF/ENR-25 4100 12.2 1.19 -29.6
PVDF/ENR-50 6200 30.4 0.05 0.77 -35.8 -9.7
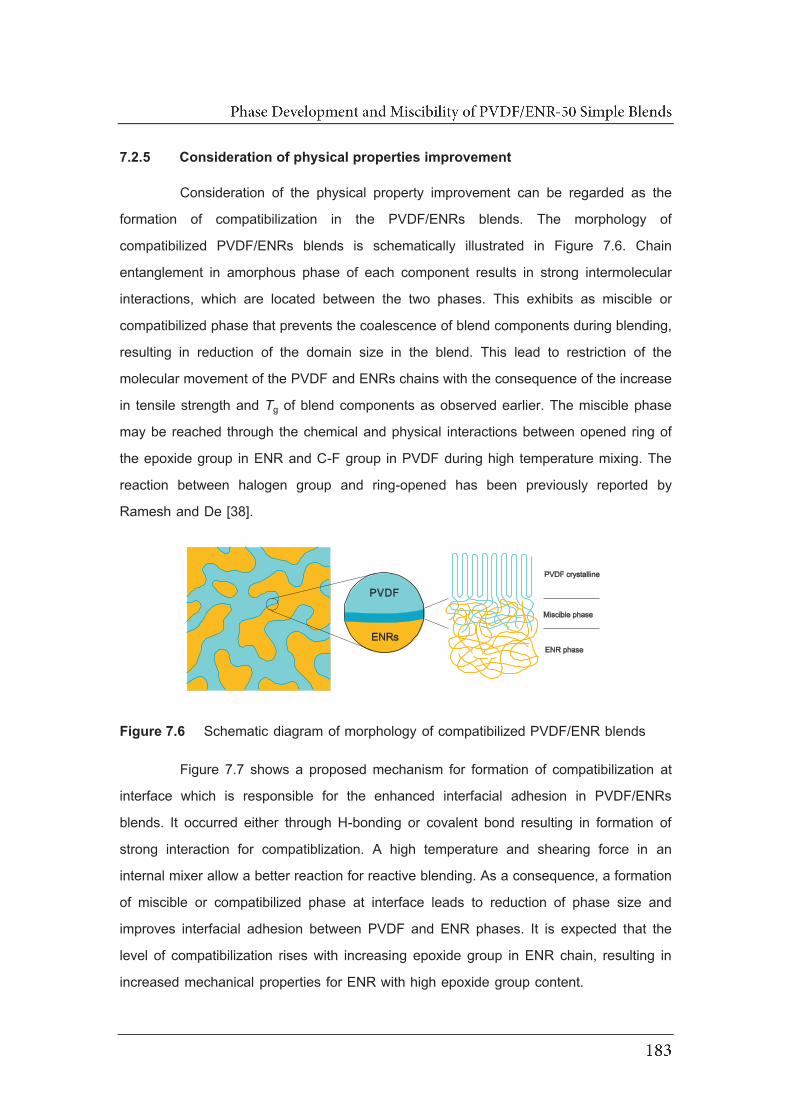
7.2.5 Consideration of physical properties improvement
Consideration of the physical property improvement can be regarded as the
formation of compatibilization in the PVDF/ENRs blends. The morphology of
compatibilized PVDF/ENRs blends is schematically illustrated in Figure 7.6. Chain
entanglement in amorphous phase of each component results in strong intermolecular
interactions, which are located between the two phases. This exhibits as miscible or
compatibilized phase that prevents the coalescence of blend components during blending,
resulting in reduction of the domain size in the blend. This lead to restriction of the
molecular movement of the PVDF and ENRs chains with the consequence of the increase
in tensile strength and Tg of blend components as observed earlier. The miscible phase
may be reached through the chemical and physical interactions between opened ring of
the epoxide group in ENR and C-F group in PVDF during high temperature mixing. The
reaction between halogen group and ring-opened has been previously reported by
Ramesh and De [38].
Figure 7.6 Schematic diagram of morphology of compatibilized PVDF/ENR blends
Figure 7.7 shows a proposed mechanism for formation of compatibilization at
interface which is responsible for the enhanced interfacial adhesion in PVDF/ENRs
blends. It occurred either through H-bonding or covalent bond resulting in formation of
strong interaction for compatiblization. A high temperature and shearing force in an
internal mixer allow a better reaction for reactive blending. As a consequence, a formation
of miscible or compatibilized phase at interface leads to reduction of phase size and
improves interfacial adhesion between PVDF and ENR phases. It is expected that the
level of compatibilization rises with increasing epoxide group in ENR chain, resulting in
increased mechanical properties for ENR with high epoxide group content.
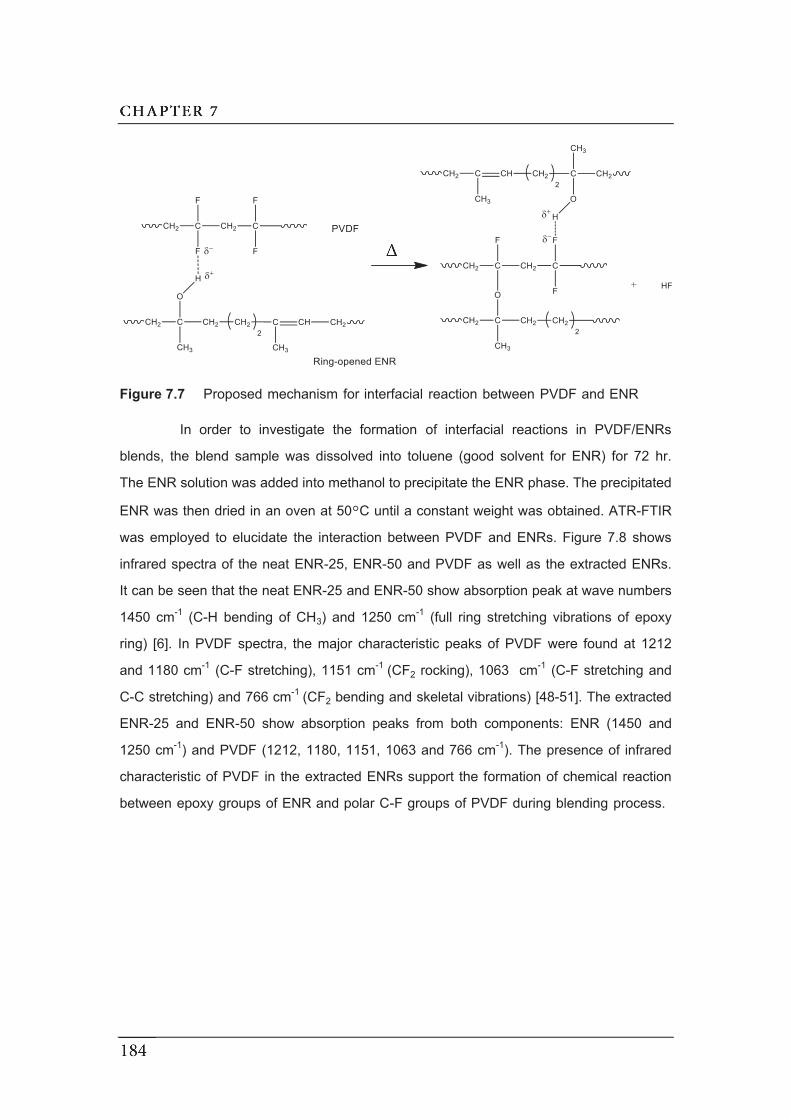
Figure 7.7 Proposed mechanism for interfacial reaction between PVDF and ENR
In order to investigate the formation of interfacial reactions in PVDF/ENRs
blends, the blend sample was dissolved into toluene (good solvent for ENR) for 72 hr.
The ENR solution was added into methanol to precipitate the ENR phase. The precipitated
ENR was then dried in an oven at 50◦C until a constant weight was obtained. ATR-FTIR
was employed to elucidate the interaction between PVDF and ENRs. Figure 7.8 shows
infrared spectra of the neat ENR-25, ENR-50 and PVDF as well as the extracted ENRs.
It can be seen that the neat ENR-25 and ENR-50 show absorption peak at wave numbers
1450 cm-1 (C-H bending of CH3) and 1250 cm-1 (full ring stretching vibrations of epoxy
ring) [6]. In PVDF spectra, the major characteristic peaks of PVDF were found at 1212
and 1180 cm-1 (C-F stretching), 1151 cm-1 (CF2 rocking), 1063 cm-1 (C-F stretching and
C-C stretching) and 766 cm-1 (CF2 bending and skeletal vibrations) [48-51]. The extracted
ENR-25 and ENR-50 show absorption peaks from both components: ENR (1450 and
1250 cm-1) and PVDF (1212, 1180, 1151, 1063 and 766 cm-1). The presence of infrared
characteristic of PVDF in the extracted ENRs support the formation of chemical reaction
between epoxy groups of ENR and polar C-F groups of PVDF during blending process.
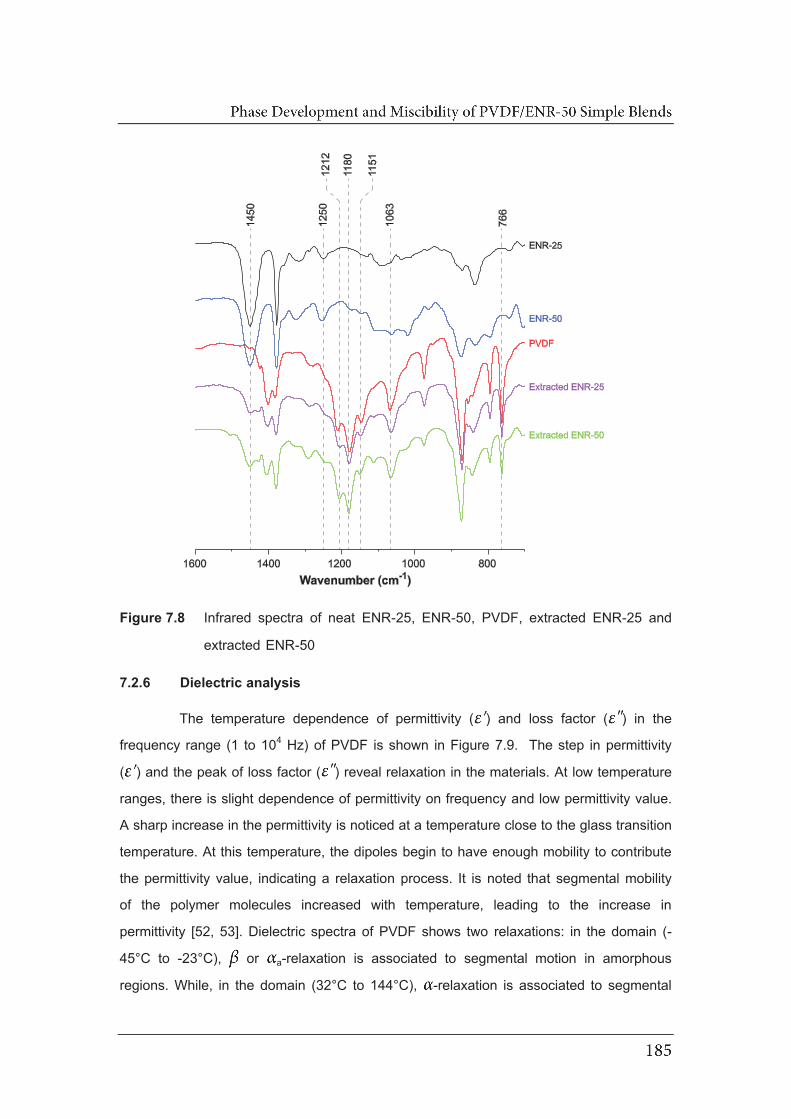
Figure 7.8 Infrared spectra of neat ENR-25, ENR-50, PVDF, extracted ENR-25 and
extracted ENR-50
7.2.6 Dielectric analysis
The temperature dependence of permittivity ( ) and loss factor ( ) in the
frequency range (1 to 104 Hz) of PVDF is shown in Figure 7.9. The step in permittivity
( ) and the peak of loss factor ( ) reveal relaxation in the materials. At low temperature
ranges, there is slight dependence of permittivity on frequency and low permittivity value.
A sharp increase in the permittivity is noticed at a temperature close to the glass transition
temperature. At this temperature, the dipoles begin to have enough mobility to contribute
the permittivity value, indicating a relaxation process. It is noted that segmental mobility
of the polymer molecules increased with temperature, leading to the increase in
permittivity [52, 53]. Dielectric spectra of PVDF shows two relaxations: in the domain (-
45°C to -23°C), or a-relaxation is associated to segmental motion in amorphous
regions. While, in the domain (32°C to 144°C), -relaxation is associated to segmental
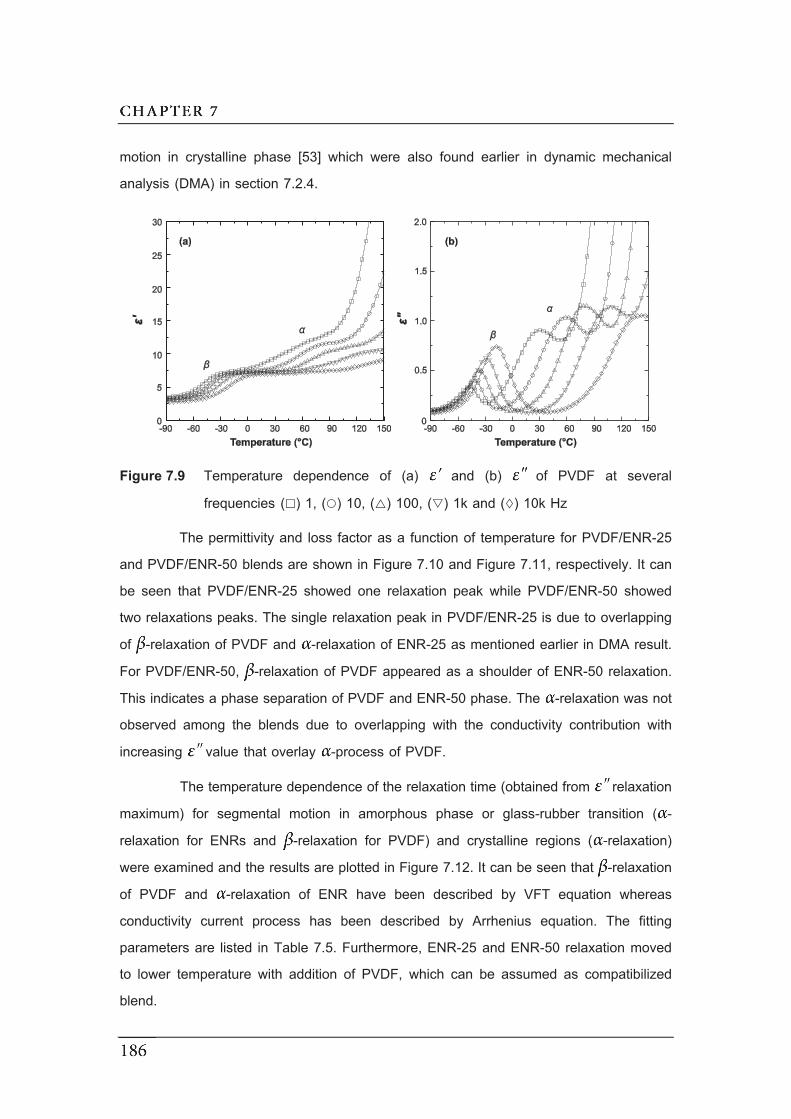
motion in crystalline phase [53] which were also found earlier in dynamic mechanical
analysis (DMA) in section 7.2.4.
Figure 7.9 Temperature dependence of (a) and (b) of PVDF at several
frequencies ( ) 1, ( ) 10, ( ) 100, ( ) 1k and ( ) 10k Hz
The permittivity and loss factor as a function of temperature for PVDF/ENR-25
and PVDF/ENR-50 blends are shown in Figure 7.10 and Figure 7.11, respectively. It can
be seen that PVDF/ENR-25 showed one relaxation peak while PVDF/ENR-50 showed
two relaxations peaks. The single relaxation peak in PVDF/ENR-25 is due to overlapping
of -relaxation of PVDF and -relaxation of ENR-25 as mentioned earlier in DMA result.
For PVDF/ENR-50, -relaxation of PVDF appeared as a shoulder of ENR-50 relaxation.
This indicates a phase separation of PVDF and ENR-50 phase. The -relaxation was not
observed among the blends due to overlapping with the conductivity contribution with
increasing value that overlay -process of PVDF.
The temperature dependence of the relaxation time (obtained from relaxation
maximum) for segmental motion in amorphous phase or glass-rubber transition ( -
relaxation for ENRs and -relaxation for PVDF) and crystalline regions ( -relaxation)
were examined and the results are plotted in Figure 7.12. It can be seen that -relaxation
of PVDF and -relaxation of ENR have been described by VFT equation whereas
conductivity current process has been described by Arrhenius equation. The fitting
parameters are listed in Table 7.5. Furthermore, ENR-25 and ENR-50 relaxation moved
to lower temperature with addition of PVDF, which can be assumed as compatibilized
blend.

Figure 7.10 Temperature dependence of (a) and (b) of PVDF/ENR-25 blend at
several frequencies ( ) 1, ( ) 10, ( ) 100, ( ) 1k and ( ) 10k Hz
Figure 7.11 Temperature dependence of (a) and (b) of PVDF/ENR-50 blend at
several frequencies ( ) 1, ( ) 10, ( ) 100, ( ) 1k and ( ) 10k Hz

Figure 7.12 Activation plot for segmental motion (square symbols) of PVDF, ENR-25
and ENR-50 and -relaxation (circle symbols) of PVDF
Table 7.5 Fitting parameters for PVDF, ENR-25, ENR-50 and their blends
Sample Segmental motion –relaxation log 0 B (K) T0 (K) log 0 Ea (eV)
PVDF -10.85 1067 180 -16.32 0.97
ENR-25 -11.95 1329 185
ENR-50 -12.04 1328 210
PVDF/ENR-25 -11.26 1168 185
PVDF/ENR-50 -11.64 1237 205
The sharp increase of permittivity and loss factor is observed at high
temperature and low frequency. This is rather due to conductivity process which is
contribution of ionic conductivity. This indicates the existence of space charge polarization
and free charge motion within the blends. The electric modulus formalism (Equation 3.18)
was employed to overcome the high temperature relaxation. The imaginary part of electric
modulus (MM ) of PVDF, PVDF/ENR-25 and PVDF/ENR-50 blends as a function of
temperature at different frequencies are shown in Figure 7.13. It can be seen that PVDF
shows three relaxations corresponding to and relaxation and conductivity,
respectively, while ENR-25 and ENR-50 showed only two relaxations at low temperature
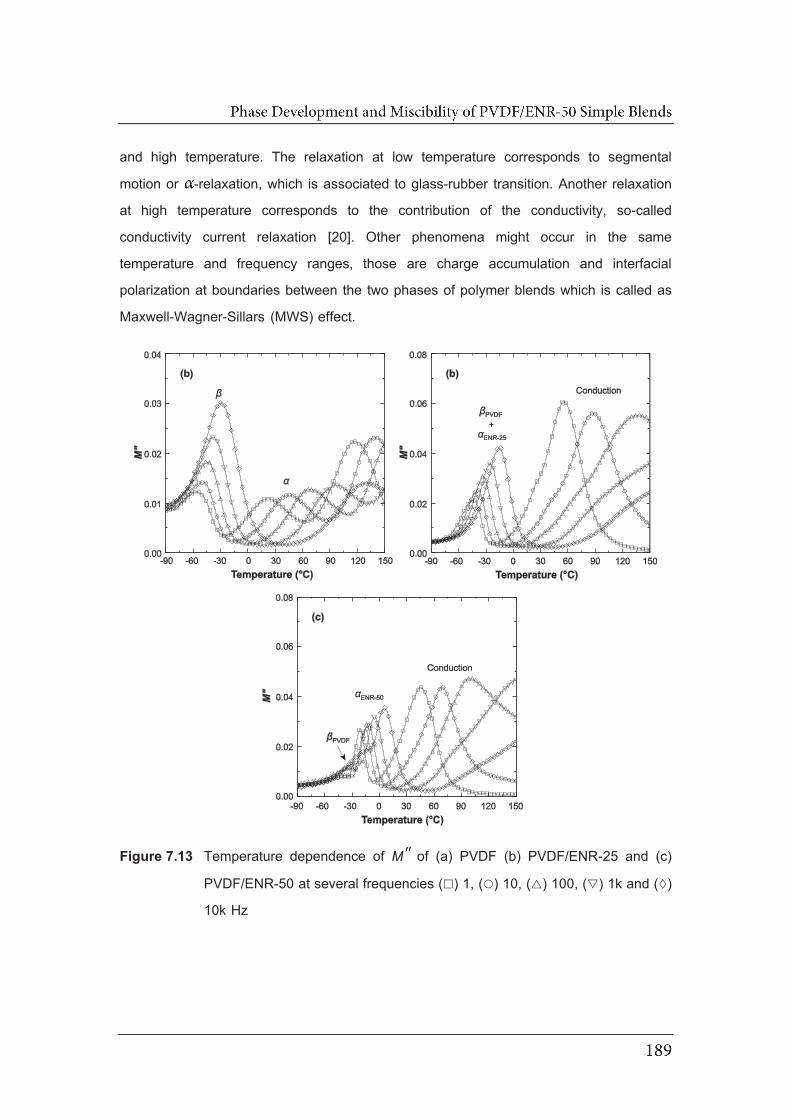
and high temperature. The relaxation at low temperature corresponds to segmental
motion or -relaxation, which is associated to glass-rubber transition. Another relaxation
at high temperature corresponds to the contribution of the conductivity, so-called
conductivity current relaxation [20]. Other phenomena might occur in the same
temperature and frequency ranges, those are charge accumulation and interfacial
polarization at boundaries between the two phases of polymer blends which is called as
Maxwell-Wagner-Sillars (MWS) effect.
Figure 7.13 Temperature dependence of MM of (a) PVDF (b) PVDF/ENR-25 and (c)
PVDF/ENR-50 at several frequencies ( ) 1, ( ) 10, ( ) 100, ( ) 1k and ( )
10k Hz

Figure 7.14 presents the relaxation time of the conductivity process as a function
of temperature for the PVDF blend with difference types of ENRs. The relaxation times
of all samples are well fitted by the Arrhenius equation. The activation energy is provided
in Table 7.6, which can also give information of the charge transport mechanism within
the materials. The PVDF/ENR-50 blends have higher activation energy than that of
PVDF/ENR-25. This might be attributed to the fine co-continuous structure of PVDF/ENR-
50 as can be seen from Figure 7.1, which is more difficult for charge transport in the
blend.
Figure 7.14 Activation plot for conductivity process for ENR-25, ENR-50 and their blends
Table 7.6 Fitting parameters of conductivity process for PVDF, ENR-25, ENR-50 and
their blends
Sample Conductivity log 0 Ea (eV)
ENR-25 -12.30 0.71
ENR-50 -13.28 0.75
PVDF/ENR-25 -11.81 0.72
PVDF/ENR-50 -14.83 0.89
7.3 The effect of blend composition on the properties of PVDF/ENR-
50 simple blend
PVDF/ENR-50 simple blend with different blend ratios were prepared, according
to the experimental procedure as described in section 3.2.4. Their properties:
morphological properties, mechanical properties, thermal behavior, dynamic mechanical
analysis and dielectric analysis) were investigated and compared.
7.3.1 Morphological properties
Figure 7.15 shows SEM micrographs of PVDF/ENR-50 blends with various
blend proportions. It is clearly seen that two apparent phase morphologies are
distinguishable due to phase separation. In the blends with lower content of ENR-50 than
30 wt% (i.e., in Figure 7.15(a) and (b)), it can be seen that the minor ENR-50 component
(i.e., cavitations) was dispersed in the major phase of PVDF. Also, the size of ENR-50
domains increased but PVDF phase decreased with increasing ENR-50 content until the
fine co-continuous phase structures where dual dispersion phases is observed in the
blends with PVDF/ENR-50 = 60/40, 50/50, and 40/60 (i.e., Figure 7.15(c), (d) and (e)),
respectively. In Figure 7.15, it is clear that the first phase inversion occurred between the
blend ratios of PVDF/ENR-50 = 70/30 and 60/40 where the dispersed ENR-50 in PVDF
matrix was transformed to co-continuous phase structure. It is noted that the phase
inversion occurs in a domain manner rather than at a single point [54]. It is also noted
that increasing ENR content higher than 60 wt% causes the second phase inversion
between the blend ratios of PVDF/ENR-50 = 40/60 and 30/70 where the co-continuous
phase structure is modified leading to dispersion of PVDF in the ENR-50 matrix. This is
due to the influence of different viscosity ratios and hence shearing forces of the blend
components. Therefore, in the blends with ENR-50 content higher than 60 wt% (i.e., in
Figure 7.15(f) and (g)), the PVDF phase remains as dispersed domains in the ENR matrix.
Hence, phase separation between PVDF and ENR-50 was observed due to partly
immiscible blends with the fully co-continuous phase structures. The phase inversion took
place in the blend with ENR-50 beyond the weight content of 40 to 60%. Willemse et al.
[55] reported that the composition range for full co-continuity not only depends on viscosity
ratio but also depends on the interfacial tension. The increase of the interfacial tension
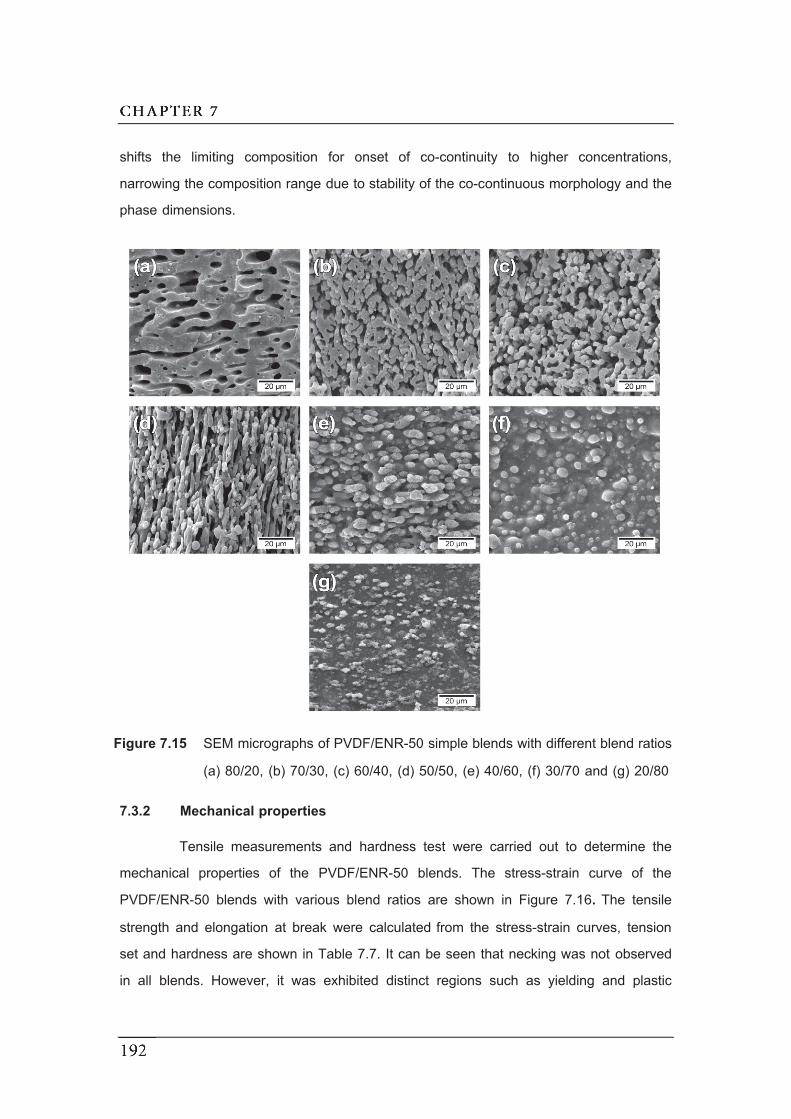
shifts the limiting composition for onset of co-continuity to higher concentrations,
narrowing the composition range due to stability of the co-continuous morphology and the
phase dimensions.
Figure 7.15 SEM micrographs of PVDF/ENR-50 simple blends with different blend ratios
(a) 80/20, (b) 70/30, (c) 60/40, (d) 50/50, (e) 40/60, (f) 30/70 and (g) 20/80
7.3.2 Mechanical properties
Tensile measurements and hardness test were carried out to determine the
mechanical properties of the PVDF/ENR-50 blends. The stress-strain curve of the
PVDF/ENR-50 blends with various blend ratios are shown in Figure 7.16. The tensile
strength and elongation at break were calculated from the stress-strain curves, tension
set and hardness are shown in Table 7.7. It can be seen that necking was not observed
in all blends. However, it was exhibited distinct regions such as yielding and plastic
deformation for the neat PVDF. Moreover, a significant difference of deformation
characteristics was observed: The PVDF/ENR-50 (80/20) blend first showed very high
tensile strength and quickly failed after slight stretching of 64%, indicating a brittle fracture
behavior caused by PVDF matrix phase in the blend. Further increasing ENR-50 content,
the blends break at elongation higher than 100% and represent like a typical elastomer
deformation. This indicates that deformation ability of blend significantly changes from
brittle plastic to elastomer characteristic with a larger strain. The phase morphology
evolution of varying blend proportions can be used to describe tensile characteristics.
Generally, the deformation characteristic is dominated by the matrix phase. The small
addition of ENR-50 into PVDF showed high initial moduli, stiffness and strength but less
capability for stretching due to the PVDF continuous matrix in the blend. Increasing ENR-
50 concentration, the tensile strength decreased, while elongation at break increased, as
shown in Figure 7.17. When ENR-50 become matrix phase, the blend showed superior
elongation at break and flexibility but poor tensile strength. Hardness and tension set as
a function of ENR-50 contents are shown in Figure 7.17. It can be seen that hardness
and tension set decreased with increasing ENR-50 contents. This decreasing is attributed
to incorporation of ENR-50 which increases chain mobility in the blend that less resists to
deformation by indenter (low hardness). Furthermore, the tension set of the blends
decreased with the addition of ENR-50, making high recovery of the blends after extension
or better elasticity (low tension set). Although, the blends with ENR-50 matrix have
superior extension and very low tension set which is expected for elastomeric material
but they also exhibit very low tensile strength. Thus, 50/50 PVDF/ENR-50 blend presents
an excellence balance of mechanical properties for thermoplastic elastomer characteristic
(high tensile strength, moderate elongation at break and low tension set) due to co-
continuous PVDF providing strength and co-continuous ENR-50 providing flexibility. From
Figure 7.17, it can be seen that the most of mechanical properties abruptly decrease after
adding ENR-50 in the range of 40 to 60 wt%, which can be considered as phase co-
continuous region.
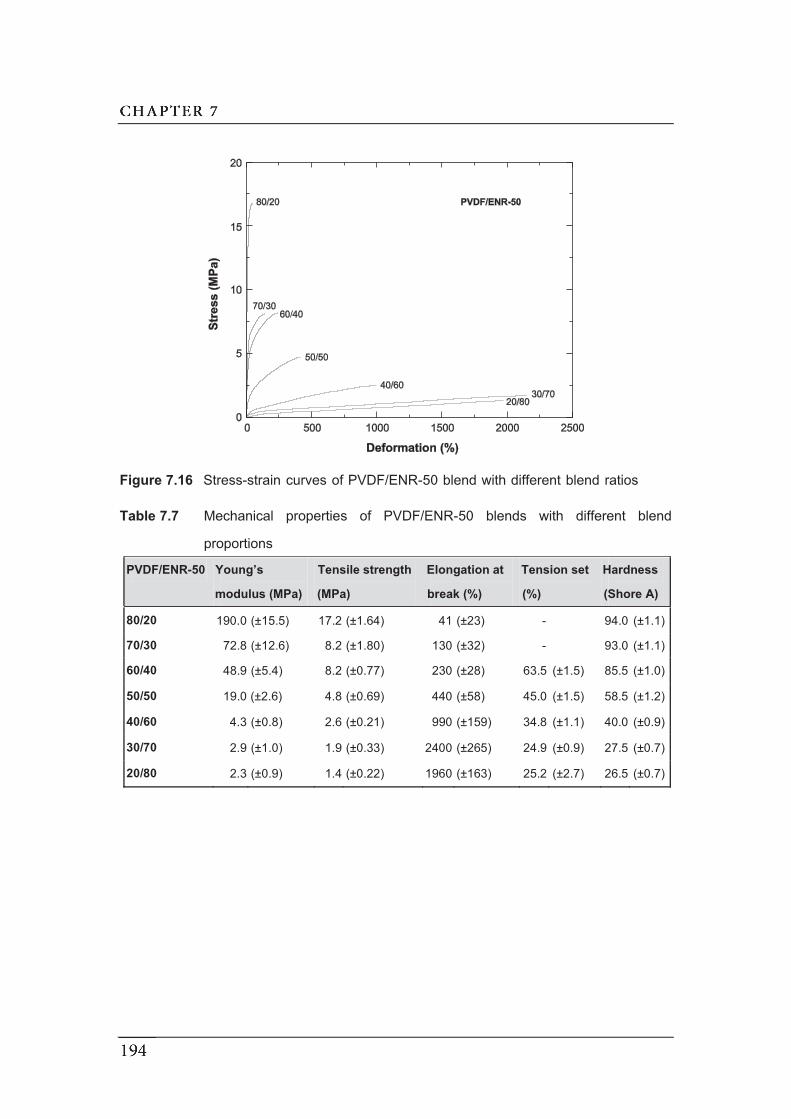
Figure 7.16 Stress-strain curves of PVDF/ENR-50 blend with different blend ratios
Table 7.7 Mechanical properties of PVDF/ENR-50 blends with different blend
proportions
PVDF/ENR-50 Young’s
modulus (MPa)
Tensile strength
(MPa)
Elongation at
break (%)
Tension set
(%)
Hardness
(Shore A)
80/20 190.0 (±15.5) 17.2 (±1.64) 41 (±23) - 94.0 (±1.1)
70/30 72.8 (±12.6) 8.2 (±1.80) 130 (±32) - 93.0 (±1.1)
60/40 48.9 (±5.4) 8.2 (±0.77) 230 (±28) 63.5 (±1.5) 85.5 (±1.0)
50/50 19.0 (±2.6) 4.8 (±0.69) 440 (±58) 45.0 (±1.5) 58.5 (±1.2)
40/60 4.3 (±0.8) 2.6 (±0.21) 990 (±159) 34.8 (±1.1) 40.0 (±0.9)
30/70 2.9 (±1.0) 1.9 (±0.33) 2400 (±265) 24.9 (±0.9) 27.5 (±0.7)
20/80 2.3 (±0.9) 1.4 (±0.22) 1960 (±163) 25.2 (±2.7) 26.5 (±0.7)

Figure 7.17 Mechanical properties as a function of ENR-50 content in PVDF/ENR-50
simple blends

7.3.3 Differential scanning calorimetry
DSC thermograms during heating and cooling of PVDF/ENR-50 blends with
various blend proportions are shown in Figure 7.18. Also, the crystallization temperature
(Tc), full width at half maximum (FWHM) of crystallization peak, melting temperature (Tm),
melting enthalpy and degree of crystallinity are summarized in Table 7.8. It can be seen
that the crytallization temperature (Tc) based on the cooling curves of the blend was
shifted to higher temperature in the temperature ranges of 137.2 to 139.3°C compared
with Tc of pure PVDF (i.e., Tc = 135.8°C). On the other hand, the crytalline melting
temperature (Tm) based on the heating curves of the blend was slightly decreased from
166.4 to 168.3°C compared with Tm of pure PVDF (i.e., Tm = 168.4°C). Higher Tcs of the
blends up to 50 wt% of ENR-50 indicates that higher crystallization and degree of
crystallization of PVDF in the blends compared with the neat PVDF. In the DSC cooling
curves, the crystallization peaks of the blends in the ENR-50 content of 20 to 30 wt%
where the PVDF is the matrix to gather with blends with ENR-50 content of 40 to 50 wt% with the co-continuous structure, it is clear that the Tcs are shifted to higher temperature
with similar values, as confirmed in Figure 7.19. However, the Tcs are shifted to lower
temperature as further increasing the ENR-50 content in the blend higher than 50 wt%.
This is attributed to large ENR-50 inclusion (ENR-50 is the matrix phase) which causes
decreasing crystallization rate which is related to morphology of the blends (Figure 7.15
(e-g)) [39]. The Full width at half maximum of crystallization peak or FWHM of
crystallization peak indicates the time distributions for the nucleation and growth of PVDF
crystal. It can be seen that FWHM value decreased from 5.7 to 4.5°C by addition of 40
wt% ENR-50. This suggested for a narrower time for crystallization of PVDF crystal in the
blends. Therefore, addition of ENR-50 up to 40 wt%, ENR-50 displayed as the nucleating
agent for PVDF crystallization that causes increasing degree of crystallinity upon
incorporation of ENR-50, as shown in Table 7.8. However, increasing content of ENR-50
to 50 wt%, transition from the co-continuous phase to dispersion of PVDF in the matrix is
observed in Figure 7.15(e). Therefore, time for the nucleation and growth of PVDF
crystalline is longer (FWHM = 5.24°C) and lower Xc is observed compared with the blend
with fully co-continuous structure at the ENR content 30 and 40 wt%. Furthermore, the
blend with ENR-50 content higher than 50 wt% (ENR is the matrix), ENR-50 retard the
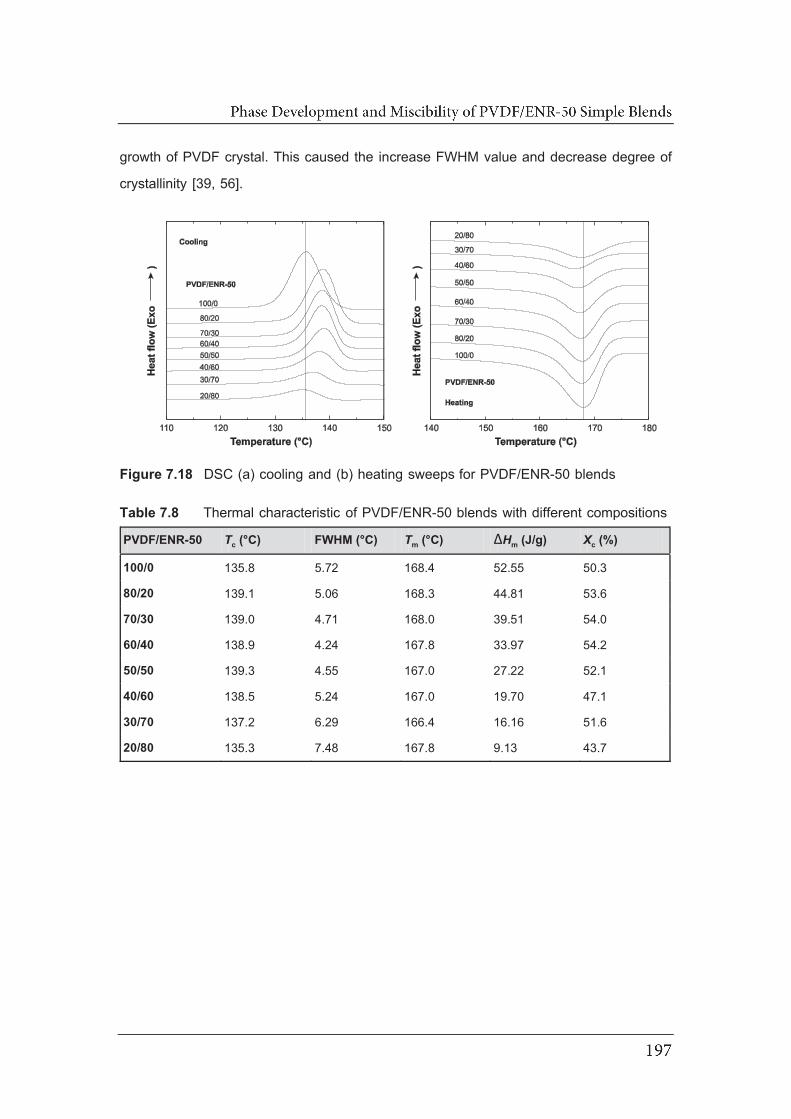
growth of PVDF crystal. This caused the increase FWHM value and decrease degree of
crystallinity [39, 56].
Figure 7.18 DSC (a) cooling and (b) heating sweeps for PVDF/ENR-50 blends
Table 7.8 Thermal characteristic of PVDF/ENR-50 blends with different compositions
PVDF/ENR-50 Tc (°C) FWHM (°C) Tm (°C) ΔHm (J/g) Xc (%)
100/0 135.8 5.72 168.4 52.55 50.3
80/20 139.1 5.06 168.3 44.81 53.6
70/30 139.0 4.71 168.0 39.51 54.0
60/40 138.9 4.24 167.8 33.97 54.2
50/50 139.3 4.55 167.0 27.22 52.1
40/60 138.5 5.24 167.0 19.70 47.1
30/70 137.2 6.29 166.4 16.16 51.6
20/80 135.3 7.48 167.8 9.13 43.7
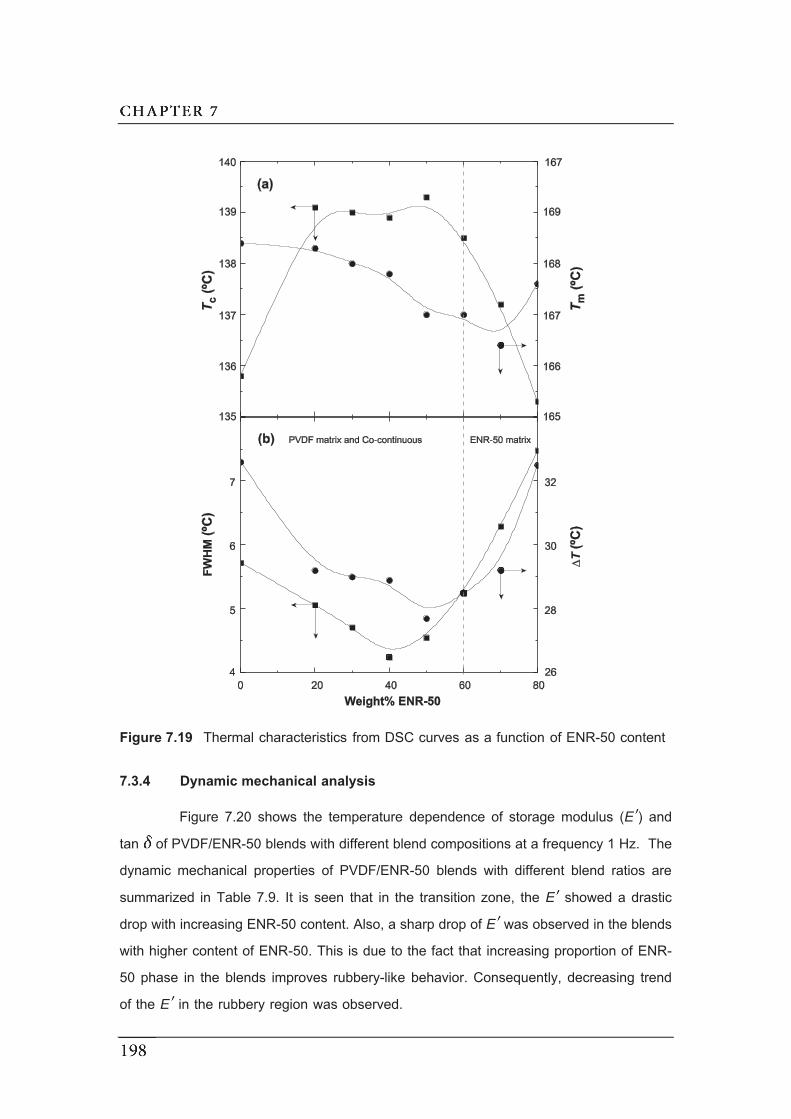
Figure 7.19 Thermal characteristics from DSC curves as a function of ENR-50 content
7.3.4 Dynamic mechanical analysis
Figure 7.20 shows the temperature dependence of storage modulus (EE ) and
tan of PVDF/ENR-50 blends with different blend compositions at a frequency 1 Hz. The
dynamic mechanical properties of PVDF/ENR-50 blends with different blend ratios are
summarized in Table 7.9. It is seen that in the transition zone, the EE showed a drastic
drop with increasing ENR-50 content. Also, a sharp drop of EE was observed in the blends
with higher content of ENR-50. This is due to the fact that increasing proportion of ENR-
50 phase in the blends improves rubbery-like behavior. Consequently, decreasing trend
of the EE in the rubbery region was observed.
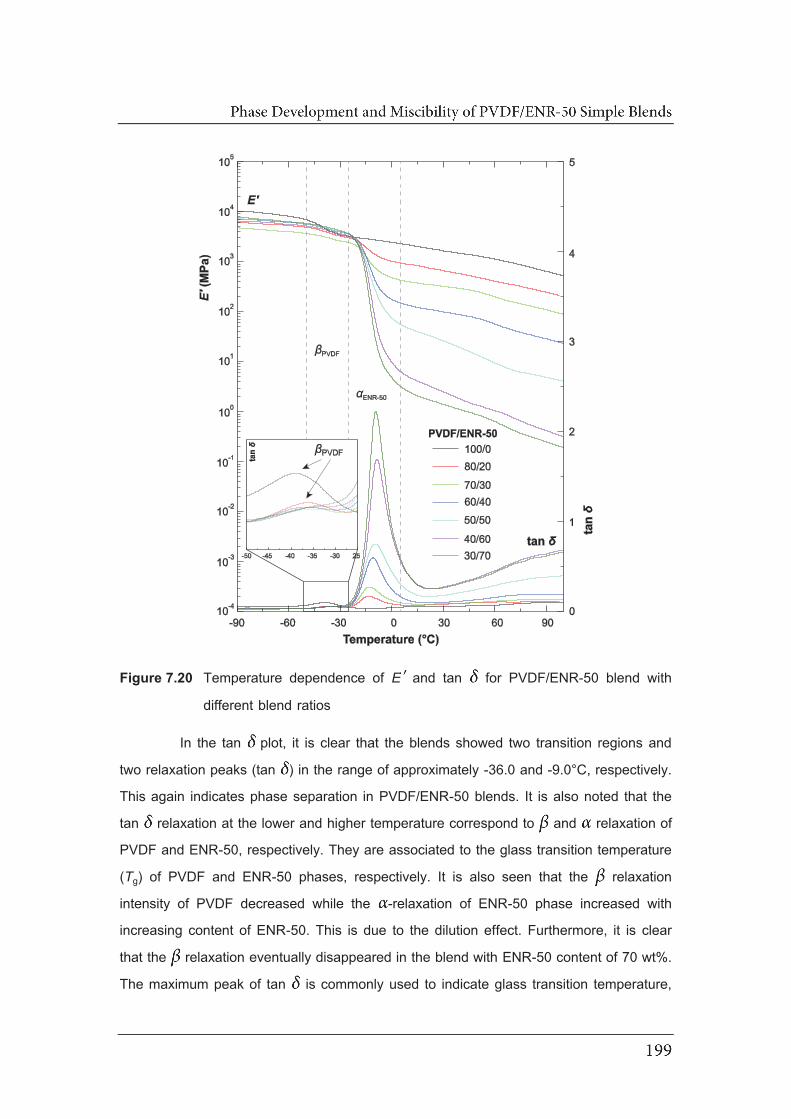
Figure 7.20 Temperature dependence of EE and tan for PVDF/ENR-50 blend with
different blend ratios
In the tan plot, it is clear that the blends showed two transition regions and
two relaxation peaks (tan ) in the range of approximately -36.0 and -9.0°C, respectively.
This again indicates phase separation in PVDF/ENR-50 blends. It is also noted that the
tan relaxation at the lower and higher temperature correspond to and relaxation of
PVDF and ENR-50, respectively. They are associated to the glass transition temperature
(Tg) of PVDF and ENR-50 phases, respectively. It is also seen that the relaxation
intensity of PVDF decreased while the -relaxation of ENR-50 phase increased with
increasing content of ENR-50. This is due to the dilution effect. Furthermore, it is clear
that the relaxation eventually disappeared in the blend with ENR-50 content of 70 wt%.
The maximum peak of tan is commonly used to indicate glass transition temperature,

as summarized in Figure 7.21. It can be seen that the Tg of PVDF and ENR-50 depended
on blend composition. That is, the Tg of PVDF and ENR-50 in the blends was shifted to
higher temperature with increasing ENR-50 content. Shifting of the glass transition
temperature indicated partial miscibility between the two phases [14-16, 45, 56]. This can
be explained by increasing chain entanglement in amorphous phase of each component
as a result of strong intermolecular interaction. It is also noted that the ENR-50 might also
acts as a nucleating agent to enhance the crystallization of PVDF in the blend, as
described earlier. This leads to restriction of the molecular movement of the PVDF chains
with the consequence to the increase in Tg of PVDF phase with increasing content of
ENR-50 in the blends. The same phenomenon was observed in the PP/POE blends [56].
Table 7.9 Storage modulus (EE ) and loss tangent (tan ) of PVDF/ENR-50 blends with
various blend compositions
PVDF/ENR-50 Storage Modulus, EE (MPa) Loss tangent (tan )
at -60°C at 25°C tan max Tg (°C)
PVDF ENR PVDF ENR
100/0 8100 1765 0.10 - -39.8 -
80/20 5300 713.3 0.06 0.16 -35.6 -13.9
70/30 4000 336.8 0.06 0.28 -35.6 -13.7
60/40 6100 106.6 0.06 0.61 -36.1 -11.7
50/50 6200 30.4 0.05 0.77 -35.8 -9.7
40/60 5600 3.0 0.06 1.73 -33.5 -8.8
30/70 6340 1.7 0.06 2.33 - -9.9
0/100 3800 1.9 - 2.70 - -5.7

Figure 7.21 Glass transition temperature (Tg) of PVDF and ENR-50 phases as a function
of ENR-50 content in PVDF/ENR-50 blend
Figure 7.22 shows the storage modulus, tan at 25°C and tan at -10°C as a
function of ENR-50 content in PVDF/ENR-50 blends which are correlated to the blend
morphology. It can be seen that these properties could be distinguished into three regions.
In the first region is in the ranges of ENR-50 = 0 to 40 wt% where ENR-50 is dispersed
in the PVDF matrix (as SEM micrographs indicated in Figure 7.15(a) and (b)). In this
region, it is seen that the storage modulus was slightly decreased while the tan was
slightly increased until the phase inversion took place at the blend proportion prior to
40wt% of ENR-50. This is due to the fact that PVDF is the continuous or matrix phase
and the properties of the blend are controlled by the matrix phase. Therefore, high EE but
low tan is observed in the blend with PVDF matrix. In the second region, when the
content of ENR-50 in the blend is higher than 40 wt%, the co-continuous structure is
observed until the ENR content of 60 wt%. This correlates to abrupt decreasing trend of
the storage modulus but increasing trend of tan . The second phase inversion occurred
when the addition of ENR-50 greater than 60 wt%. This forms the third region of the
curves in the ranges of ENR-50 contents of 60 to 80 wt% where dispersion of PVDF in
the ENR-50 matrix was observed. This causes slight plateau storage modulus with low
magnitude due to the weak ENR-50 matrix. Slight plateau curves with high values of tan
is also observed due to the properties which are dominated by the ENR-50 matrix. This
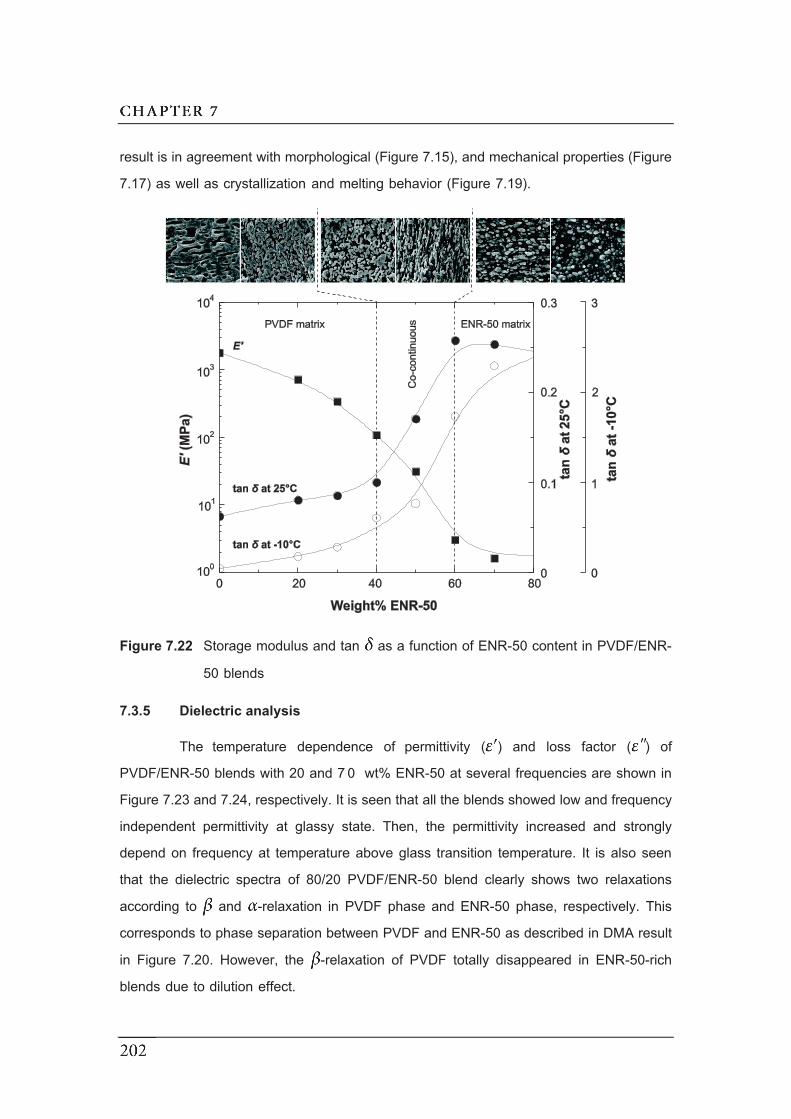
result is in agreement with morphological (Figure 7.15), and mechanical properties (Figure
7.17) as well as crystallization and melting behavior (Figure 7.19).
Figure 7.22 Storage modulus and tan as a function of ENR-50 content in PVDF/ENR-
50 blends
7.3.5 Dielectric analysis
The temperature dependence of permittivity ( ) and loss factor ( ) of
PVDF/ENR-50 blends with 20 and 7 0 wt% ENR-50 at several frequencies are shown in
Figure 7.23 and 7.24, respectively. It is seen that all the blends showed low and frequency
independent permittivity at glassy state. Then, the permittivity increased and strongly
depend on frequency at temperature above glass transition temperature. It is also seen
that the dielectric spectra of 80/20 PVDF/ENR-50 blend clearly shows two relaxations
according to and -relaxation in PVDF phase and ENR-50 phase, respectively. This
corresponds to phase separation between PVDF and ENR-50 as described in DMA result
in Figure 7.20. However, the -relaxation of PVDF totally disappeared in ENR-50-rich
blends due to dilution effect.

Figure 7.23 Temperature dependence of (a) and (b) of 80/20 PVDF/ENR-50 blend
at frequency ( ) 1, ( ) 10, ( ) 100, ( ) 1k and ( ) 10k Hz
Figure 7.24 Temperature dependence of (a) and (b) of 30/70 PVDF/ENR-50 blend
at frequency ( ) 1, ( ) 10, ( ) 100, ( ) 1k and ( ) 10k Hz
Figure 7.25 shows the temperature dependence of tan based on DEA and
DMA at frequency 1 Hz of PVDF/ENR-50 with different blend proportions. It is seen that
the tan peak of PVDF and ENR-50 phase tends to overlapped approach to each
component. This is due to partial miscibility of PVDF/ENR-50 blends. This supported the
DMA result that the relaxation curves of blend component shifted to each other (Tg of
PVDF and ENR-50 move towards to higher and lower temperature, respectively). It is
also seen that the -relaxation of PVDF could not be clearly observed in the blends with
addition of ENR-50 = 50 wt%. It appears as a shoulder of ENR-50 relaxation and totally
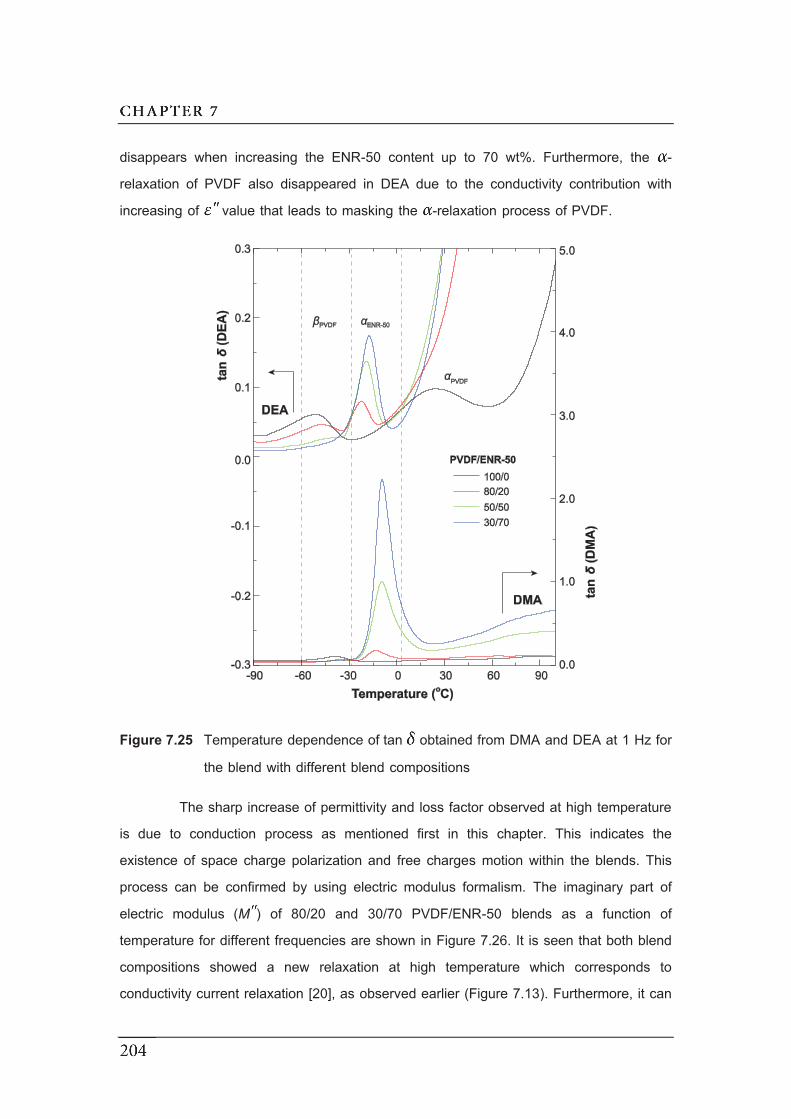
disappears when increasing the ENR-50 content up to 70 wt%. Furthermore, the -
relaxation of PVDF also disappeared in DEA due to the conductivity contribution with
increasing of value that leads to masking the -relaxation process of PVDF.
Figure 7.25 Temperature dependence of tan obtained from DMA and DEA at 1 Hz for
the blend with different blend compositions
The sharp increase of permittivity and loss factor observed at high temperature
is due to conduction process as mentioned first in this chapter. This indicates the
existence of space charge polarization and free charges motion within the blends. This
process can be confirmed by using electric modulus formalism. The imaginary part of
electric modulus (MM ) of 80/20 and 30/70 PVDF/ENR-50 blends as a function of
temperature for different frequencies are shown in Figure 7.26. It is seen that both blend
compositions showed a new relaxation at high temperature which corresponds to
conductivity current relaxation [20], as observed earlier (Figure 7.13). Furthermore, it can
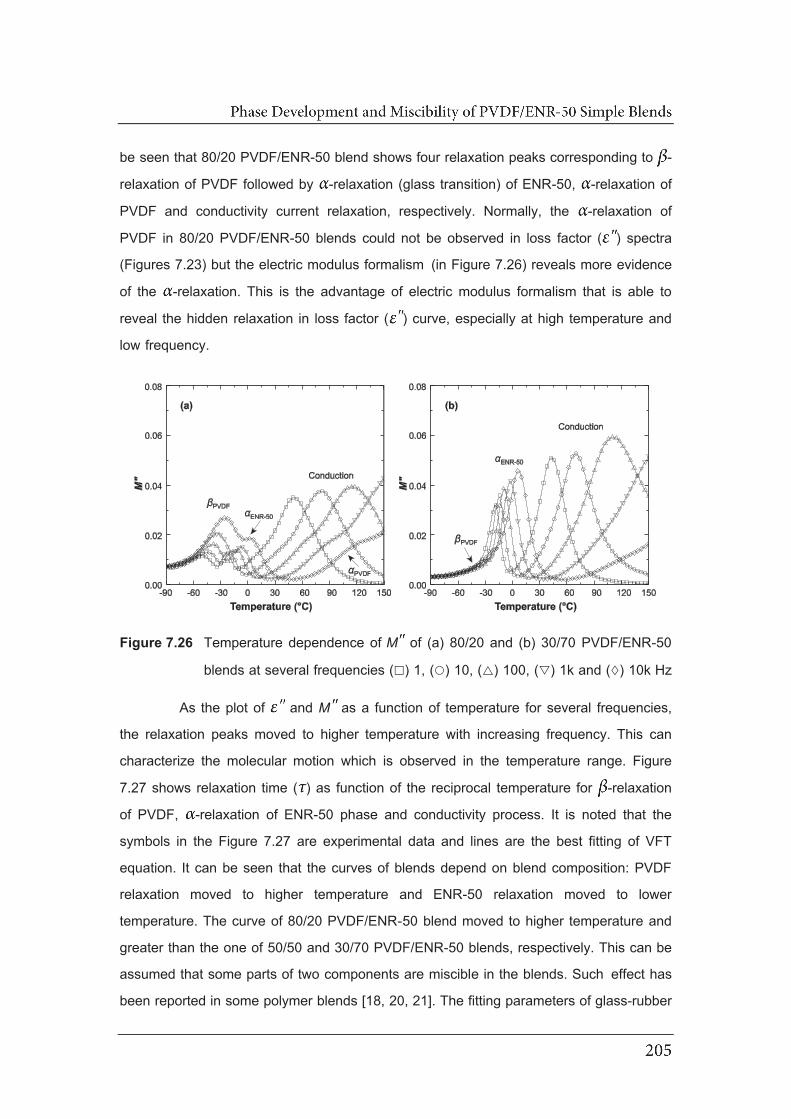
be seen that 80/20 PVDF/ENR-50 blend shows four relaxation peaks corresponding to -
relaxation of PVDF followed by -relaxation (glass transition) of ENR-50, -relaxation of
PVDF and conductivity current relaxation, respectively. Normally, the -relaxation of
PVDF in 80/20 PVDF/ENR-50 blends could not be observed in loss factor ( ) spectra
(Figures 7.23) but the electric modulus formalism (in Figure 7.26) reveals more evidence
of the -relaxation. This is the advantage of electric modulus formalism that is able to
reveal the hidden relaxation in loss factor ( ) curve, especially at high temperature and
low frequency.
Figure 7.26 Temperature dependence of MM of (a) 80/20 and (b) 30/70 PVDF/ENR-50
blends at several frequencies ( ) 1, ( ) 10, ( ) 100, ( ) 1k and ( ) 10k Hz
As the plot of and MM as a function of temperature for several frequencies,
the relaxation peaks moved to higher temperature with increasing frequency. This can
characterize the molecular motion which is observed in the temperature range. Figure
7.27 shows relaxation time ( ) as function of the reciprocal temperature for -relaxation
of PVDF, -relaxation of ENR-50 phase and conductivity process. It is noted that the
symbols in the Figure 7.27 are experimental data and lines are the best fitting of VFT
equation. It can be seen that the curves of blends depend on blend composition: PVDF
relaxation moved to higher temperature and ENR-50 relaxation moved to lower
temperature. The curve of 80/20 PVDF/ENR-50 blend moved to higher temperature and
greater than the one of 50/50 and 30/70 PVDF/ENR-50 blends, respectively. This can be
assumed that some parts of two components are miscible in the blends. Such effect has
been reported in some polymer blends [18, 20, 21]. The fitting parameters of glass-rubber
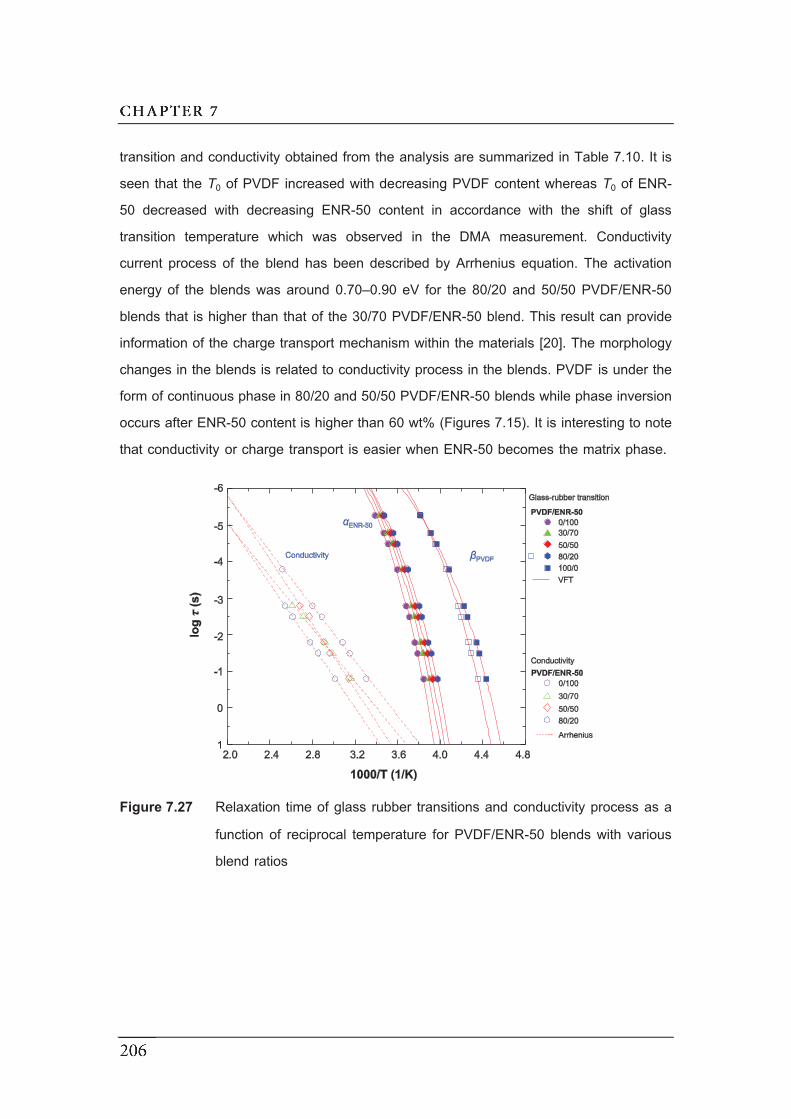
transition and conductivity obtained from the analysis are summarized in Table 7.10. It is
seen that the T0 of PVDF increased with decreasing PVDF content whereas T0 of ENR-
50 decreased with decreasing ENR-50 content in accordance with the shift of glass
transition temperature which was observed in the DMA measurement. Conductivity
current process of the blend has been described by Arrhenius equation. The activation
energy of the blends was around 0.70–0.90 eV for the 80/20 and 50/50 PVDF/ENR-50
blends that is higher than that of the 30/70 PVDF/ENR-50 blend. This result can provide
information of the charge transport mechanism within the materials [20]. The morphology
changes in the blends is related to conductivity process in the blends. PVDF is under the
form of continuous phase in 80/20 and 50/50 PVDF/ENR-50 blends while phase inversion
occurs after ENR-50 content is higher than 60 wt% (Figures 7.15). It is interesting to note
that conductivity or charge transport is easier when ENR-50 becomes the matrix phase.
Figure 7.27 Relaxation time of glass rubber transitions and conductivity process as a
function of reciprocal temperature for PVDF/ENR-50 blends with various
blend ratios

Table 7.10 Fitting parameter for glass-rubber transition and conductivity peaks of
PVDF/ENR-50 blends with various blend ratios
PVDF/ENR-50 Glass-rubber transition Conductivity
log 0 B (K) T0 (K) log 0 Ea (eV)
100/0 -10.85 1067 180
80/20 -11.34 1224 203 -13.57 0.85
50/50 -11.47 1237 205 -14.73 0.89
30/70 -11.64 1229 208 -12.23 0.72
0/100 -12.04 1328 210 -13.28 0.75
7.4 Conclusions
The PVDF/ENR blends with different epoxidation levels of ENR and various
blend proportions were prepared by simple blend technique. PVDF/ENRs blends are
generally immiscible blends, however, the increase of epoxide group content in ENR
showed significant role to enhance interfacial adhesion which leads to formation of small
domains. The addition of ENR in PVDF decreases tensile strength but increases
elongation at break, which is a usual characteristic of blended thermoplastic elastomer.
The blend of PVDF/ENR-50 exhibited superior mechanical properties: high tensile
strength, storage modulus and elongation at break due to good interfacial adhesion
between the two phases. Thermal properties characterized by DSC revealed that ENR
can accelerate crystallization and act as a nucleating agent in PVDF. The molecular
dynamic of the blends has been characterized by DMA and DEA. Both technique revealed
molecular relaxation of blend components. It was found that PVDF/ENR-25 showed a
single relaxation due to some degree of overlapping of PVDF and ENR-25 relaxations,
while PVDF/ENR-50 showed two relaxation peaks corresponding to glass transition
temperatures of PVDF and ENR-50. The miscibility of PVDF/ENR-50 had been revealed
by DMA and DEA measurement from shifting of the relaxations of blend components.
The DEA plots showed a sharp increase in loss factor at high temperature and low
frequency, which corresponded to contribution of conductivity.
The PVDF/ENR-50 blends with various blend ratios were prepared and their
properties were investigated. The effect of blend compositions revealed phase

development of PVDF/ENR-50 blends. The blends consisting of ENR-50 dispersed in
PVDF at low content of ENR-50 (<40 wt%) and fully co-continuous morphology can be
observed when ENR-50 was added in the range of 40 to 50 wt%. The further increase of
ENR-50 contents led to phase inversion to take place where ENR-50 became the matrix
and PVDF became the dispersed phase. It was also found that increasing content of
ENR-50 in the blends caused decreasing trends of the tensile strength, modulus (i.e.,
Young’s modulus and storage modulus), tension set but showed increasing trends of
elongation at break. The phase inversion of PVDF/ENR-50 blend had been confirmed by
DMA measurement that storage modulus and tan show a radically change at the
formation of co-continuous structure in the blends. Furthermore, the addition of ENR-50
accelerated PVDF crystallization and ENR-50 acted as a nucleating agent in the blend.
The molecular mobility of the blends was also investigated by dynamic mechanical
analysis and dielectric analysis. The blends showed similar relaxation in the dynamic
mechanical analysis and dielectric analysis. That is, all types of blend compositions
showed two relaxations according to -relaxation annotated to Tg of PVDF and ENR-50
due to phase separation. However, maxima positions of relaxations of PVDF and ENR-
50 moved toward to higher and lower temperature, respectively. This generally occurred
in the blends with partial compatibility. This is attributed to interaction and chain
entanglement between PVDF and ENR-50 molecules. The temperature dependence of
electric modulus revealed a new relaxation at high temperature which corresponded to
conductivity process. The morphology of the blend seemed to influence the charge
transfer in the blends. Log 0 and Ea parameters calculated for 30/70 PVDF/ENR-50 blend
seemed to indicate conductivity improvement when ENR is the matrix. This is in
agreement with the flexibility of ENR compared to the one of PVDF.
7.5 References
[1] Utracki, L.A. 2002. Introduction to polymer blends, in Polymer Blends Handbook,
L.A. Utracki, ed. Springer, Dordrecht.
[2] Nwabunma, D. 2007. Overview of polyolefin blends, in Polyolefin Blends, D.
Nwabunma and T. Kyu, eds. John Wiley & Sons, New Jersey.
[3] Jha, A., Dutta, B. and Bhowmick, A.K. 1999. Effect of fillers and plasticizers on the
performance of novel heat and oil-resistant thermoplastic elastomers from nylon-6
and acrylate rubber blends. J. Appl. Polym. Sci. 74, 1490-1501.
[4] Narathichat, M., Kummerlöwe, C., Vennemann, N., Sahakaro, K. and Nakason,
C. 2012. Influence of epoxide level and reactive blending on properties of
epoxidized natural rubber and nylon-12 blends. Adv. Polym. Tech. 31, 118-129.
[5] Drobny, J.G. 2007. Handbook of Thermoplastic Elastomers. PDL(Plastics Design
Library)/William Andrew Pub., New York.
[6] Rooj, S., Thakur, V., Gohs, U., Wagenknecht, U., Bhowmick, A.K. and Heinrich,
G. 2011. In situ reactive compatibilization of polypropylene/epoxidized natural
rubber blends by electron induced reactive processing: novel in-line mixing
technology. Polym. Adv. Technol. 22, 2257-2263.
[7] Brown, S.B. 2002. Reactive compatibilization of polymer blends, in Polymer Blends
Handbook, L.A. Utracki, ed. Springer, Dordrecht, The Netherlands.
[8] Sailer, C. and Handge, U.A. 2007. Melt viscosity, elasticity, and morphology of
reactively compatibilized polyamide 6/styrene-acrylonitrile blends in shear and
elongation. Macromolecules. 40, 2019-2028.
[9] Ma, H., Xiong, Z., Lv, F., Li, C. and Yang, Y. 2011. Rheological behavior and
morphologies of reactively compatibilized PVDF/TPU blends. Macromol. Chem.
Phys. 212, 252-258.
[10] Elashmawi, I.S. and Hakeern, N.A. 2008. Effect of PMMA addition on
characterization and morphology of PVDF. Polym. Eng. Sci. 48, 895-901.
[11] Madbouly, S.A., Otaigbe, J.U. and Ougizawa, T. 2006. Morphology and properties
of novel blends prepared from simultaneous in situ polymerization and
compatibilization of macrocychc carbonates and maleated poly(propylene).
Macromol. Chem. Phys. 207, 1233-1243.

[12] Kim, K.J., Cho, H.W. and Yoon, K.J. 2003. Effect of P(MMA-co-MAA)
compatibilizer on the miscibility of nylon 6/PVDF blends. Eur. Polym. J. 39, 1249-
1265.
[13] Mohanty, S., Nando, G.B., Vijayan, K. and Neelakanthan, N.R. 1996. Mechanical
and dynamic mechanical properties of miscible blends of epoxidized natural rubber
and poly(ethylene-co-acrylic acid). Polymer. 37, 5387-5394.
[14] Marin, N. and Favis, B.D. 2002. Co-continuous morphology development in
partially miscible PMMA/PC blends. Polymer. 43, 4723-4731.
[15] Bhadane, P.A., Champagne, M.F., Huneault, M.A., Tofan, F. and Favis, B.D.
2006. Continuity development in polymer blends of very low interfacial tension.
Polymer. 47, 2760-2771.
[16] Al-Malaika, S. and Kong, W. 2005. Reactive processing of polymers: effect of in
situ compatibilisation on characteristics of blends of polyethylene terephthalate and
ethylene-propylene rubber. Polymer. 46, 209-228.
[17] Sy, J.W. and Mijovic, J. 2000. Reorientational dynamics of poly(vinylidene
fluoride)/poly(methyl methacrylate) blends by broadband dielectric relaxation
spectroscopy. Macromolecules. 33, 933-946.
[18] Madbouly, S.A. and Otaigbe, J.U. 2007. Broadband dielectric spectroscopy of
nanostructured maleated polypropylene/polycarbonate blends prepared by in situ
polymerization and compatibilization. Polymer. 48, 4097-4107.
[19] Linares, A., Nogales, A., Rueda, D.R. and Ezquerra, T.A. 2007. Molecular
dynamics in PVDF/PVA blends as revealed by dielectric loss spectroscopy. J.
Polym. Sci., Part B: Polym. Phys. 45, 1653-1661.
[20] Kanapitsas, A., Pissis, P. and Garcia Estrella, A. 1999. Molecular mobility in
polyurethane/styrene–acrylonitrile blends studied by dielectric techniques. Eur.
Polym. J. 35, 923-937.
[21] Carius, H.-E., Schönhals, A., Guigner, D., Sterzynski, T. and Brostow, W. 1996.
Dielectric and mechanical relaxation in the blends of a polymer liquid crystal with
polycarbonate. Macromolecules. 29, 5017-5025.
[22] Li, R., Xiong, C., Kuang, D., Dong, L., Lei, Y., Yao, J., Jiang, M. and Li, L. 2008.
Polyamide 11/poly(vinylidene fluoride) blends as novel flexible materials for
capacitors. Macromol. Rapid Commun. 29, 1449-1454.

[23] Drobny, J.G. 2000. Technology of Fluoropolymers. CRC Press. 190.
[24] Nalwa, H.S. 1995. Ferroelectric Polymers: Chemistry: Physics, and Applications.
Taylor & Francis. 904.
[25] Li, Y., Oono, Y., Kadowaki, Y., Inoue, T., Nakayama, K. and Shimizu, H. 2006. A
novel thermoplastic elastomer by reaction-induced phase decomposition from a
miscible polymer blend. Macromolecules. 39, 4195-4201.
[26] Keun Yoon, L. and Kyu Kim, B. 2000. Compatibility of poly (vinylidene
fluoride)(PVDF)/polyamide 12 (PA12) blends. J. Appl. Polym. Sci. 78, 1374-1380.
[27] Varughese, K.T., Nando, G.B., De, P.P. and De, S.K. 1988. Miscible blends from
rigid poly(vinyl chloride) and epoxidized natural rubber. J. Mater. Sci. 23, 3894-
3902.
[28] Kalkornsurapranee, E., Nakason, C., Kummerlöwe, C. and Vennemann, N. 2013.
Development and preparation of high-performance thermoplastic vulcanizates
based on blends of natural rubber and thermoplastic polyurethanes. J. Appl. Polym.
Sci. 128, 2358-2367.
[29] Mathai, A.E. and Thomas, S. 2005. Morphology, mechanical and viscoelastic
properties of nitrile rubber/epoxidized natural rubber blends. J. Appl. Polym. Sci.
97, 1561-1573.
[30] Rocha, T.L.A.C., Rosca, C., Ziegler, J. and Schuster, R.H. 2005. Influence of
polymer polarity on phase morphology of NR blends. Kaut. Gummi Kunstst. 58,
22-29.
[31] Bottino, A., Capannelli, G., Munari, S. and Turturro, A. 1988. Solubility parameters
of poly(vinylidene fluoride). J. Polym. Sci., Part B: Polym. Phys. 26, 785-794.
[32] Chee, K.K. 1995. Solubility parameters of polymers from swelling measurements
at 60oC. J. Appl. Polym. Sci. 58, 2057-2062.
[33] Na, B., Xu, W., Lv, R., Li, Z., Tian, N. and Zou, S. 2010. Toughening of nylon-6
by semicrystalline poly(vinylidene fluoride): role of phase transformation and
fibrillation of dispersed particles. Macromolecules. 43, 3911-3915.
[34] Pichaiyut, S., Nakason, C. and Vennemann, N. 2012. Thermoplastic elastomers-
based natural rubber and thermoplastic polyurethane blends. Iran Polym. J. 21,
65-79.
[35] Bourry, D. and Favis, B.D. 1998. Cocontinuity and phase inversion in HDPE/PS
blends: Influence of interfacial modification and elasticity. J. Polym. Sci., Part B:
Polym. Phys. 36, 1889-1899.
[36] Tol, R.T., Groeninckx, G., Vinckier, I., Moldenaers, P. and Mewis, J. 2004. Phase
morphology and stability of co-continuous (PPE/PS)/PA6 and PS/PA6 blends:
effect of rheology and reactive compatibilization. Polymer. 45, 2587-2601.
[37] Dmitriev, I., Bukosek, V., Lavrentyev, V. and Elyashevich, G. 2007. Structure and
deformational behavior of poly(vinylidene fluoride) hard elastic films. Acta Chim.
Slov. 54, 784-791.
[38] Ramesh, P. and De, S.K. 1991. Self-cross-linkable plastic-rubber blend system
based on poly(vinyl chloride) and epoxidized natural rubber. J. Mater. Sci. 26,
2846-2850.
[39] Li, Y., Iwakura, Y., Zhao, L. and Shimizu, H. 2008. Nanostructured poly(vinylidene
fluoride) materials by melt blending with several percent of acrylic rubber.
Macromolecules. 41, 3120-3124.
[40] Mano, J.F., Sencadas, V., Costa, A.M. and Lanceros-Méndez, S. 2004. Dynamic
mechanical analysis and creep behaviour of -PVDF films. Mat. Sci. Eng. A-Struct.
370, 336-340.
[41] Sencadas, V., Lanceros-Méndez, S. and Mano, J.F. 2004. Characterization of
poled and non-poled -PVDF films using thermal analysis techniques.
Thermochim. Acta. 424, 201-207.
[42] Martins, J.N., Bassani, T.S. and Oliveira, R.V.B. 2012. Morphological, viscoelastic
and thermal properties of poly(vinylidene fluoride)/POSS nanocomposites. Mat.
Sci. Eng. C-Mater. 32, 146-151.
[43] Linares, A. and Acosta, J.L. 1997. Tensile and dynamic mechanical behaviour of
polymer blends based on PVDF. Eur. Polym. J. 33, 467-473.
[44] Patro, T.U., Mhalgi, M.V., Khakhar, D.V. and Misra, A. 2008. Studies on
poly(vinylidene fluoride)-clay nanocomposites: effect of different clay modifiers.
Polymer. 49, 3486-3499.
[45] Komalan, C., George, K.E., Kumar, P.A.S., Varughese, K.T. and Thomas, S.
2007. Dynamic mechanical analysis of binary and ternary polymer blends based
on nylon copolymer/EPDM rubber and EPM grafted maleic anhydride
compatibilizer. Express Polym. Lett. 1, 641-653.
[46] Liau, W.B. 1999. Dynamic mechanical relaxation of lightly cross-linked epoxidized
natural rubber. Polymer. 40, 599-605.
[47] Nakason, C., Panklieng, Y. and Kaesaman, A. 2004. Rheological and thermal
properties of thermoplastic natural rubbers based on poly(methyl
methacrylate)/epoxidized-natural-rubber blends. J. Appl. Polym. Sci. 92, 3561-
3572.
[48] Chanachai, A., Meksup, K. and Jiraratananon, R. 2010. Coating of hydrophobic
hollow fiber PVDF membrane with chitosan for protection against wetting and flavor
loss in osmotic distillation process. Sep. Purif. Technol. 72, 217-224.
[49] Nakhmanson, S.M., Korlacki, R., Johnston, J.T., Ducharme, S., Ge, Z. and
Takacs, J.M. 2010. Vibrational properties of ferroelectric -vinylidene fluoride
polymers and oligomers. Physical Review B. 81, 174120.
[50] Ray, S., Easteal, A.J., Cooney, R.P. and Edmonds, N.R. 2009. Structure and
properties of melt-processed PVDF/PMMA/polyaniline blends. Mater. Chem. Phys.
113, 829-838.
[51] Wang, P., Wang, Z., Wu, Z., Zhou, Q. and Yang, D. 2010. Effect of hypochlorite
cleaning on the physiochemical characteristics of polyvinylidene fluoride
membranes. Chem. Eng. J. 162, 1050-1056.
[52] Hammami, H., Arous, M., Lagache, M. and Kallel, A. 2007. Study of the interfacial
MWS relaxation by dielectric spectroscopy in unidirectional PZT fibres/epoxy resin
composites. J. Alloys Compd. 430, 1-8.
[53] Rekik, H., Ghallabi, Z., Royaud, I., Arous, M., Seytre, G., Boiteux, G. and Kallel,
A. 2013. Dielectric relaxation behaviour in semi-crystalline polyvinylidene fluoride
(PVDF)/TiO2 nanocomposites. Compos. Part B-Eng. 45, 1199-1206.
[54] Omonov, T.S., Harrats, C., Moldenaers, P. and Groeninckx, G. 2007. Phase
continuity detection and phase inversion phenomena in immiscible
polypropylene/polystyrene blends with different viscosity ratios. Polymer. 48, 5917-
5927.
[55] Willemse, R.C., Posthuma de Boer, A., Van Dam, J. and Gotsis, A.D. 1999. Co-
continuous morphologies in polymer blends: the influence of the interfacial tension.
Polymer. 40, 827-834.
[56] Ying, J.R., Liu, S.P., Guo, F., Zhou, X.P. and Xie, X.L. 2008. Non-isothermal
crystallization and crystalline structure of PP/POE blends. J. Therm. Anal. Calorim.
91, 723-731.
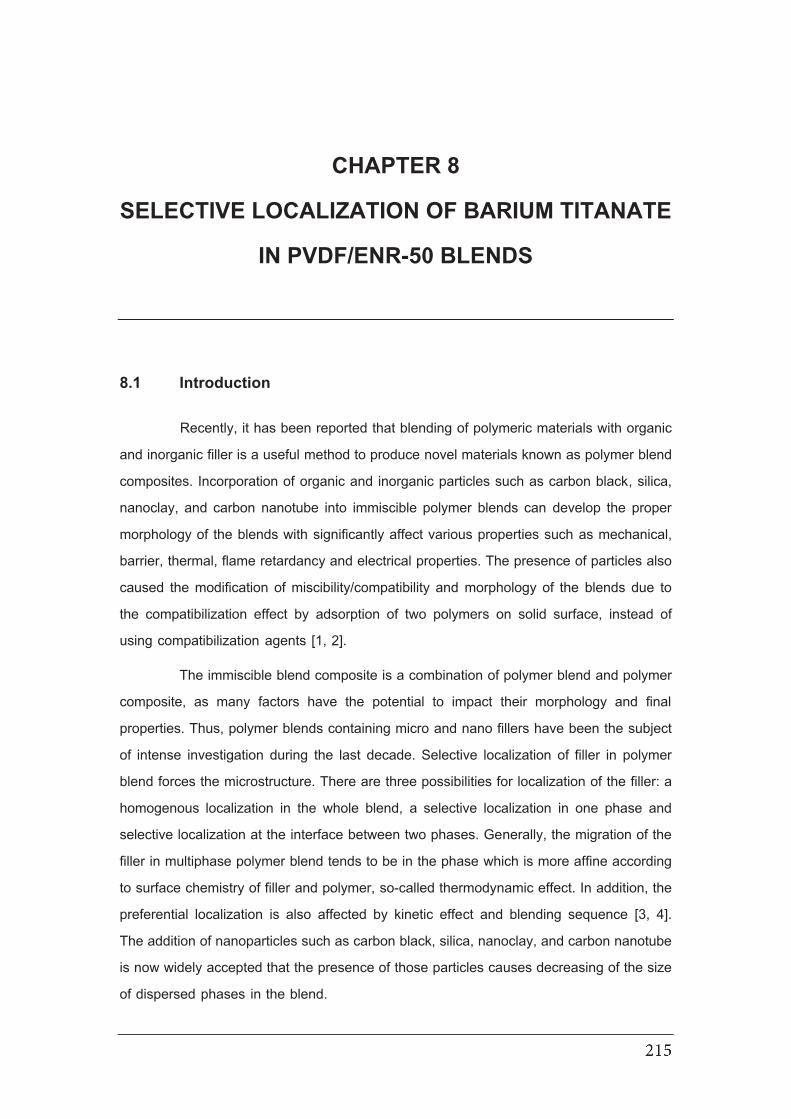
CHAPTER 8
SELECTIVE LOCALIZATION OF BARIUM TITANATE
IN PVDF/ENR-50 BLENDS
8.1 Introduction
Recently, it has been reported that blending of polymeric materials with organic
and inorganic filler is a useful method to produce novel materials known as polymer blend
composites. Incorporation of organic and inorganic particles such as carbon black, silica,
nanoclay, and carbon nanotube into immiscible polymer blends can develop the proper
morphology of the blends with significantly affect various properties such as mechanical,
barrier, thermal, flame retardancy and electrical properties. The presence of particles also
caused the modification of miscibility/compatibility and morphology of the blends due to
the compatibilization effect by adsorption of two polymers on solid surface, instead of
using compatibilization agents [1, 2].
The immiscible blend composite is a combination of polymer blend and polymer
composite, as many factors have the potential to impact their morphology and final
properties. Thus, polymer blends containing micro and nano fillers have been the subject
of intense investigation during the last decade. Selective localization of filler in polymer
blend forces the microstructure. There are three possibilities for localization of the filler: a
homogenous localization in the whole blend, a selective localization in one phase and
selective localization at the interface between two phases. Generally, the migration of the
filler in multiphase polymer blend tends to be in the phase which is more affine according
to surface chemistry of filler and polymer, so-called thermodynamic effect. In addition, the
preferential localization is also affected by kinetic effect and blending sequence [3, 4].
The addition of nanoparticles such as carbon black, silica, nanoclay, and carbon nanotube
is now widely accepted that the presence of those particles causes decreasing of the size
of dispersed phases in the blend.

Barium titanate (BT) is a filler which was widely incorporated into polymer to
increase dielectric permittivity of polymer composite. Most of barium titanate-polymer
composites have been prepared based on single polymer, as summarized in Table 2.2.
However, the BT is rarely used in polymer blend. Therefore, the blendings poly(vinylidene
fluoride) and epoxidized natural rubber have been studied in the chapter 7. It is seen that
this type of blend exhibited thermoplastic elastomer (TPE) behavior with partial miscibility.
It would thus be interesting to study the localization of BT in PVDF/ENR-50 blend with
provide high permittivity thermoplastic/elastomer blend. In this chapter, effect of barium titanate in simple blend and dynamically
vulcanized blend of PVDF/ENR-50/BT composites was elucidated. Two different blend
proportions (i.e., PVDF/ENR-50 = 80/20 and 50/50 wt%) and mixing procedures were
used to investigate location of BT particles in the blend. Two mixing steps used in this
investigation are the addition of BT particles before and after dynamic vulcanization.
Moreover, the variation of BT loading in the simple and dynamically cured PVDF/ENR-50
blends was also studied. Morphological properties, mechanical properties, dynamic
mechanical properties and dielectric properties of PVDF/ENR-50/BT composites were
examined and discussed.
8.2 Effect of barium titanate in the simple and dynamically vulcanized
PVDF/ENR-50 blends
The thermoplastic elastomer based on PVDF/ENR-50 blends filled with 5 vol%
BT was prepared by simple blend and dynamic vulcanization techniques according to the
methodology described earlier in section 3.2.5. The effect of barium titanate in simple and
dynamically cured PVDF/ENR-50 blends on morphological, mechanical (characterized by
tensile test and DMA) and dielectric properties were studied.
8.2.1 Morphological properties
SEM micrographs of simple blend of PVDF/ENR-50 = 80/20 and 50/50 without
and with BT are shown in Figure 8.1. In the blend without BT, PVDF exhibited major
phase in the blend with PVDF/ENR-50 = 80/20 while the co-continuous morphology is
observed in the blend with PVDF/ENR-50 = 50/50. The addition 5 vol% of BT (5BT), the
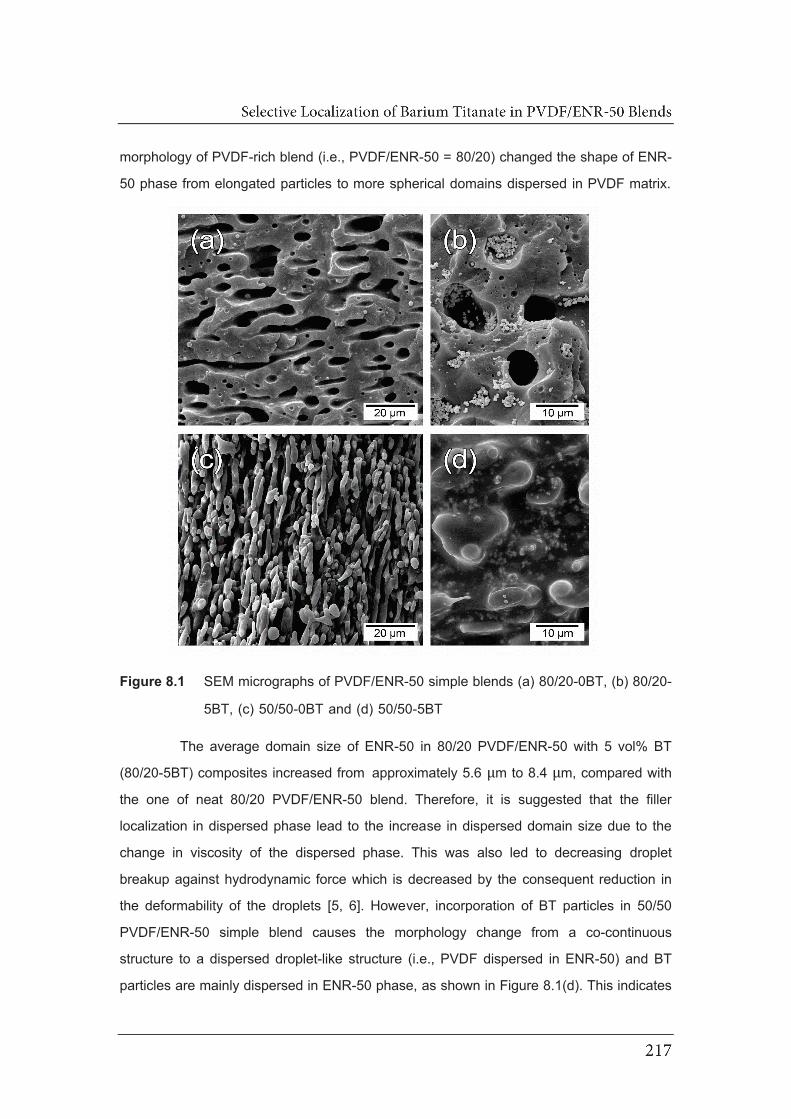
morphology of PVDF-rich blend (i.e., PVDF/ENR-50 = 80/20) changed the shape of ENR-
50 phase from elongated particles to more spherical domains dispersed in PVDF matrix.
Figure 8.1 SEM micrographs of PVDF/ENR-50 simple blends (a) 80/20-0BT, (b) 80/20-
5BT, (c) 50/50-0BT and (d) 50/50-5BT
The average domain size of ENR-50 in 80/20 PVDF/ENR-50 with 5 vol% BT
(80/20-5BT) composites increased from approximately 5.6 μm to 8.4 μm, compared with
the one of neat 80/20 PVDF/ENR-50 blend. Therefore, it is suggested that the filler
localization in dispersed phase lead to the increase in dispersed domain size due to the
change in viscosity of the dispersed phase. This was also led to decreasing droplet
breakup against hydrodynamic force which is decreased by the consequent reduction in
the deformability of the droplets [5, 6]. However, incorporation of BT particles in 50/50
PVDF/ENR-50 simple blend causes the morphology change from a co-continuous
structure to a dispersed droplet-like structure (i.e., PVDF dispersed in ENR-50) and BT
particles are mainly dispersed in ENR-50 phase, as shown in Figure 8.1(d). This indicates
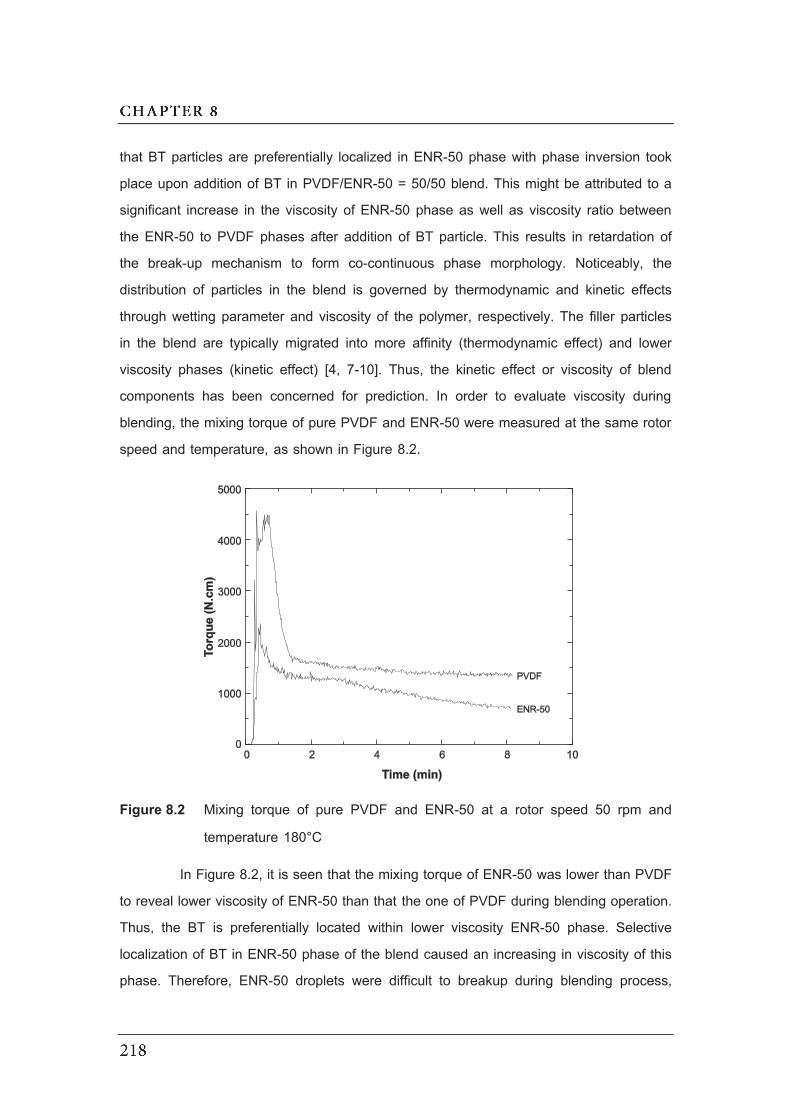
that BT particles are preferentially localized in ENR-50 phase with phase inversion took
place upon addition of BT in PVDF/ENR-50 = 50/50 blend. This might be attributed to a
significant increase in the viscosity of ENR-50 phase as well as viscosity ratio between
the ENR-50 to PVDF phases after addition of BT particle. This results in retardation of
the break-up mechanism to form co-continuous phase morphology. Noticeably, the
distribution of particles in the blend is governed by thermodynamic and kinetic effects
through wetting parameter and viscosity of the polymer, respectively. The filler particles
in the blend are typically migrated into more affinity (thermodynamic effect) and lower
viscosity phases (kinetic effect) [4, 7-10]. Thus, the kinetic effect or viscosity of blend
components has been concerned for prediction. In order to evaluate viscosity during
blending, the mixing torque of pure PVDF and ENR-50 were measured at the same rotor
speed and temperature, as shown in Figure 8.2.
Figure 8.2 Mixing torque of pure PVDF and ENR-50 at a rotor speed 50 rpm and
temperature 180°C
In Figure 8.2, it is seen that the mixing torque of ENR-50 was lower than PVDF
to reveal lower viscosity of ENR-50 than that the one of PVDF during blending operation.
Thus, the BT is preferentially located within lower viscosity ENR-50 phase. Selective
localization of BT in ENR-50 phase of the blend caused an increasing in viscosity of this
phase. Therefore, ENR-50 droplets were difficult to breakup during blending process,

resulting in bigger ENR-50 domains. This result complies with the morphological
observation (Figure 8.1). As a consequence, the preferential distribution of BT in
PVDF/ENR-50 simple blends at blend proportion of 80/20 and 50/50 wt% is schematically
illustrated in Figure 8.3. The use of BT content of 5 vol% is equal to 20 wt% which is
considered as relatively high amount of filler in the blend. This result is corresponded with
the work of Lee et al. [11] that the co-continuous structure was transformed to a dispersed
structure when high content of filler was introduced into the blend. This was speculated
that changes in the dynamics of droplet breakup in the presence of the filler were
responsible for the revolution of new morphologies.
Figure 8.3 Schematic diagram illustration of selective localization of BT in PVDF/ENR-
50 simple blends
Morphological properties of the dynamically cured PVDF/ENR-50 blends without
BT was studied by SEM, as shown in Figure 8.4. The dynamically cured samples was
examined without extraction. Therefore, the contrast between PVDF and ENR-50 phase
in SEM is achieved with different microstructures of PVDF and ENR-50. This enables by
the distinction between semi-crystalline or PVDF (rough) and amorphous or ENR-50
(smooth) regions. In Figure 8.4(a) and (b) shows a dispersion of the cross-linked ENR-
50 particles in the PVDF matrix due to the dynamic vulcanization of the blend which leads
to break-up of the co-continuous structure into droplet (cross-linked rubber)-matrix
(thermoplastic) morphology. It can also be seen that size and shape of the ENR-50 phase
are not uniformed because the particle size distribution of the rubber phase depends on
shear rate applied to the polymer melt during blending and particle shape depends on
viscosity of matrix phase. At high rubber content, it is difficult to observe dispersion of
ENR-50 in PVDF, nonetheless, ENR-50 particles remained surrounded shape by
thermoplastic PVDF phase, which is a characteristic of TPV. This may be attributed to
the connecting or overlapping and limiting break-up of dispersed phase at 50 wt% of
rubber, giving the impression of partial co-continuity [12, 13]. Furthermore, SEM technique
used in this investigation detected some secondary electron which emitted from the
surface of a sample and thus SEM discarded some vital spatial information behind the
surface. It is also seen that the ENR-50 appeared to be elongated and enlarged with
increasing ENR-50 content (Figure 8.4(b)). This indicates that break-up of the rubber
phase during dynamic vulcanization was not completed due to high rubber proportion.
Figure 8.4 SEM micrographs of dynamically cured PVDF/ENR-50 blend at blend ratio
(a) 80/20 and (b) 50/50
Figure 8.5 shows SEM micrographs of dynamically vulcanized PVDF/ENR-50
blends containing 5 vol% BT with different blend proportions. The dynamically cured blend
filled with BT showed phase separation between PVDF and cross-linked ENR-50. That
is, the PVDF domain presents a roughness surface, in opposite to smooth interfaces of
ENR-50 domain. Addition of particles and blending sequence affect the blend morphology.
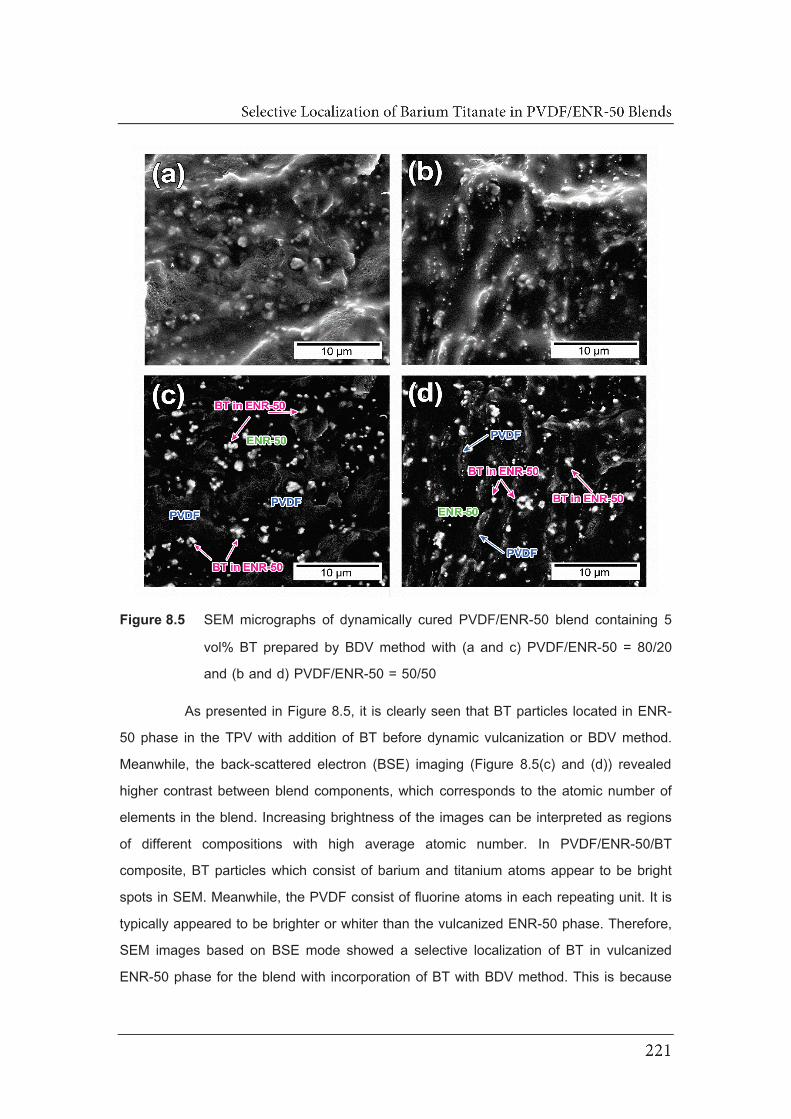
Figure 8.5 SEM micrographs of dynamically cured PVDF/ENR-50 blend containing 5
vol% BT prepared by BDV method with (a and c) PVDF/ENR-50 = 80/20
and (b and d) PVDF/ENR-50 = 50/50
As presented in Figure 8.5, it is clearly seen that BT particles located in ENR-
50 phase in the TPV with addition of BT before dynamic vulcanization or BDV method.
Meanwhile, the back-scattered electron (BSE) imaging (Figure 8.5(c) and (d)) revealed
higher contrast between blend components, which corresponds to the atomic number of
elements in the blend. Increasing brightness of the images can be interpreted as regions
of different compositions with high average atomic number. In PVDF/ENR-50/BT
composite, BT particles which consist of barium and titanium atoms appear to be bright
spots in SEM. Meanwhile, the PVDF consist of fluorine atoms in each repeating unit. It is
typically appeared to be brighter or whiter than the vulcanized ENR-50 phase. Therefore,
SEM images based on BSE mode showed a selective localization of BT in vulcanized
ENR-50 phase for the blend with incorporation of BT with BDV method. This is because

BT particles are preferentially migrated into ENR-50 phase prior to the introduction of
vulcanizing agent (HRJ-10518) in the blend. Thus, BT still remained in the ENR-50 phase,
where they have been located before addition of HRJ-10518 as observed in simple blend.
The dynamic vulcanization in the blend resulted in formation of permanent crosslink of
ENR-50 chains. Therefore, BT particles are trapped in ENR-50 phase by three-
dimensional cross-linked network. For comparison between Figures 8.5 and 8.6, it
appears that filler localization is different between the mixing sequence BDV and ADV
methods. It is interesting to indicate that in ADV technique BT particles are selectively
adhered at the interface and in PVDF phase, as shown in Figure 8.6. Moreover, this
phenomenon could not be observed in the blend with BDV technique. Therefore, the
dynamic vulcanization leads to formation of crosslink between ENR-50 chains which
causes obstruction of migration of BT into ENR-50 phase by cross-linked network. Thus,
BT located at interface and in PVDF phase. Therefore, the migration of BT particles are
more difficult when the favorable phase is vulcanized before addition of BT. In addition,
the mixing sequence overshadows the kinetic effect that BT particles attempt to localize
in the preferential ENR-50 phase. From the SEM observation, it can be concluded that
the difference in localization of BT in the blend with BDV and ADV methods are due to
different mixing step, as schematically illustrated in Figure 8.7 and 8.8, respectively.
Figure 8.6 SEM micrographs of dynamically cured PVDF/ENR-50 blend containing 5
vol% BT prepared by ADV method for (a) PVDF/ENR-50 = 80/20 and (b)
PVDF/ENR-50 = 50/50
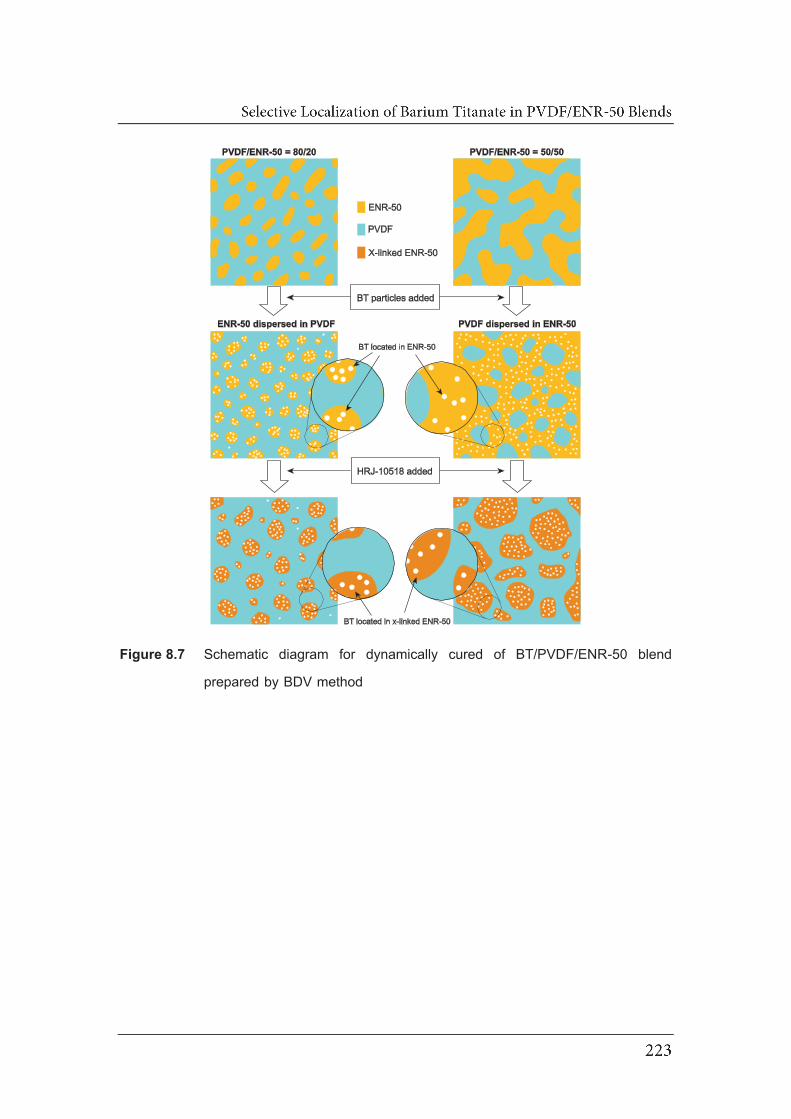
Figure 8.7 Schematic diagram for dynamically cured of BT/PVDF/ENR-50 blend
prepared by BDV method
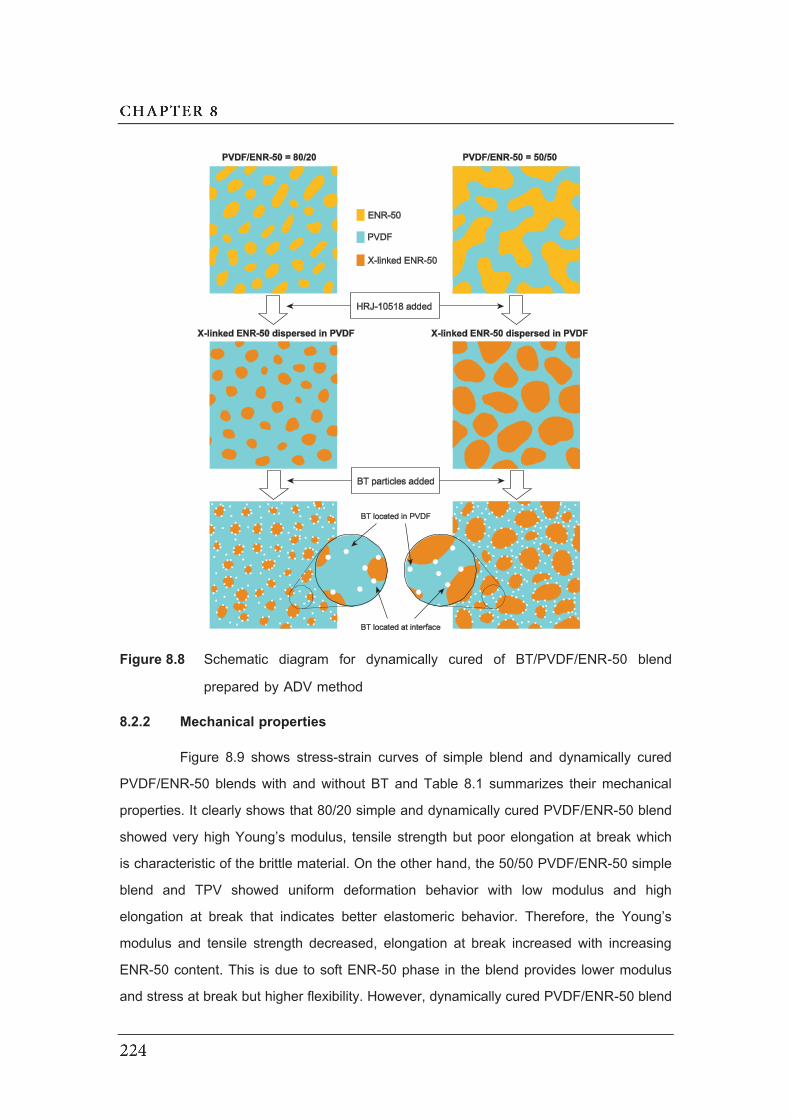
Figure 8.8 Schematic diagram for dynamically cured of BT/PVDF/ENR-50 blend
prepared by ADV method
8.2.2 Mechanical properties
Figure 8.9 shows stress-strain curves of simple blend and dynamically cured
PVDF/ENR-50 blends with and without BT and Table 8.1 summarizes their mechanical
properties. It clearly shows that 80/20 simple and dynamically cured PVDF/ENR-50 blend
showed very high Young’s modulus, tensile strength but poor elongation at break which
is characteristic of the brittle material. On the other hand, the 50/50 PVDF/ENR-50 simple
blend and TPV showed uniform deformation behavior with low modulus and high
elongation at break that indicates better elastomeric behavior. Therefore, the Young’s
modulus and tensile strength decreased, elongation at break increased with increasing
ENR-50 content. This is due to soft ENR-50 phase in the blend provides lower modulus
and stress at break but higher flexibility. However, dynamically cured PVDF/ENR-50 blend

with and without BT exhibited better physical properties compared with simple blend. This
indicates that dynamic vulcanization improves physical properties of hard
plastic/elastomer blend. The fully vulcanized rubber particles in thermoplastic matrix leads
to an enhancement of the mechanical properties in term of Young’s modulus, tensile
strength, elongation at break, hardness and elastic recovery (lower tension set) [14].
However, the mechanical properties of 80/20 PVDF/ENR-50 simple blend are not affected
by incorporation of BT, as shown in Figure 8.9 and Table 8.1. This suggests that ENR-
50 phase still remains dispersed in PVDF matrix and tensile behavior is dominated by the
matrix. In contrast, 50/50 PVDF/ENR-50 simple blend with BT showed decrease in tensile
strength but increase in elongation at break. This implies the formation of phase inversion.
SEM studies revealed that 50/50 PVDF/ENR-50 simple blend with BT consisted of PVDF
dispersed in ENR-50 matrix phase and BT located in ENR-50 phase, as shown in Figure
8.1(d).
Figure 8.9 Stress-strain curves of (a) simple and (b) dynamically cured PVDF/ENR-50
blend with and without BT at 80/20 and 50/50 blend ratios
A significant enhancement in elongation at break is observed when the BT
particles were introduced in TPV for PVDF-rich and ENR-50 rich blend, as shown in
Figure 8.9. This demonstrates that the addition of filler improve elasticity of TPV. The
incorporation of BT into dynamically cured 80/20 PVDF/ENR-50 blend showed a decrease
in tensile strength for the blends with BDV and ADV techniques. It was also found that
dynamically cured 50/50 PVDF/ENR-50 blend showed increasing tensile strength with the
addition of BT. This denotes a positive effect on addition of BT on tensile strength of the
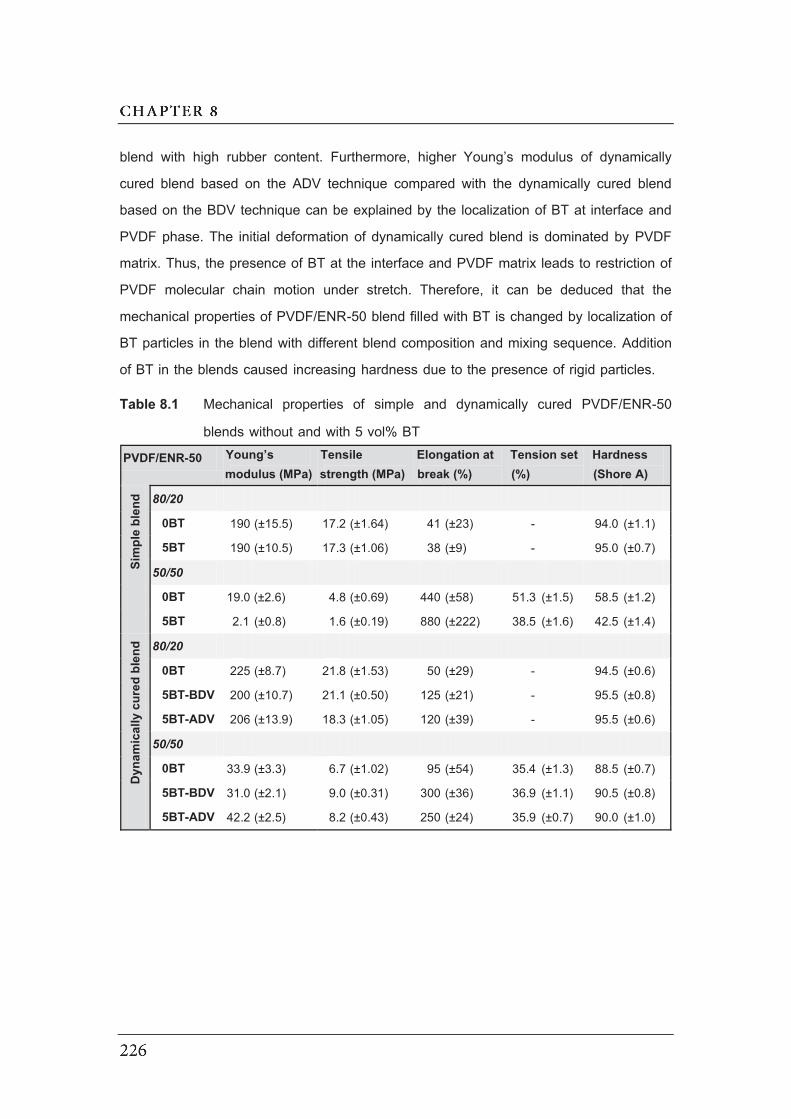
blend with high rubber content. Furthermore, higher Young’s modulus of dynamically
cured blend based on the ADV technique compared with the dynamically cured blend
based on the BDV technique can be explained by the localization of BT at interface and
PVDF phase. The initial deformation of dynamically cured blend is dominated by PVDF
matrix. Thus, the presence of BT at the interface and PVDF matrix leads to restriction of
PVDF molecular chain motion under stretch. Therefore, it can be deduced that the
mechanical properties of PVDF/ENR-50 blend filled with BT is changed by localization of
BT particles in the blend with different blend composition and mixing sequence. Addition
of BT in the blends caused increasing hardness due to the presence of rigid particles.
Table 8.1 Mechanical properties of simple and dynamically cured PVDF/ENR-50
blends without and with 5 vol% BT
PVDF/ENR-50 Young’s modulus (MPa)
Tensile strength (MPa)
Elongation at break (%)
Tension set (%)
Hardness (Shore A)
Sim
ple
blen
d 80/20
0BT 190 (±15.5) 17.2 (±1.64) 41 (±23) - 94.0 (±1.1)
5BT 190 (±10.5) 17.3 (±1.06) 38 (±9) - 95.0 (±0.7)
50/50
0BT 19.0 (±2.6) 4.8 (±0.69) 440 (±58) 51.3 (±1.5) 58.5 (±1.2)
5BT 2.1 (±0.8) 1.6 (±0.19) 880 (±222) 38.5 (±1.6) 42.5 (±1.4)
Dyna
mic
ally
cur
ed b
lend
80/20
0BT 225 (±8.7) 21.8 (±1.53) 50 (±29) - 94.5 (±0.6)
5BT-BDV 200 (±10.7) 21.1 (±0.50) 125 (±21) - 95.5 (±0.8)
5BT-ADV 206 (±13.9) 18.3 (±1.05) 120 (±39) - 95.5 (±0.6)
50/50
0BT 33.9 (±3.3) 6.7 (±1.02) 95 (±54) 35.4 (±1.3) 88.5 (±0.7)
5BT-BDV 31.0 (±2.1) 9.0 (±0.31) 300 (±36) 36.9 (±1.1) 90.5 (±0.8)
5BT-ADV 42.2 (±2.5) 8.2 (±0.43) 250 (±24) 35.9 (±0.7) 90.0 (±1.0)

8.2.3 Dynamic mechanical analysis
Temperature dependence of storage modulus (EE ) and tan of simple and
dynamically cured 80/20 and 50/50 PVDF/ENR-50 blends with and without BT are shown
in Figures 8.10 and 8.11, respectively. All blends show a high storage modulus in glassy
state due to the restriction of molecular chains. Two transitions of storage modulus were
observed for all blends which were assigned to molecular chain in amorphous region
begins in Brownian-motion or glass-rubber transition (Tg), resulting in a significant
reduction in storage modulus.
Figure 8.10 Temperature dependence of EE and tan of 80/20 PVDF/ENR-50 (a) simple
blend and (b) dynamically cured blend with and without BT
Data from DMA curve in terms of storage modulus (EE ) and tan are listed in
Table 8.2. It is clear that addition of 5 vol% of BT in 80/20 simple blend caused increasing
storage modulus while the storage modulus of 50/50 simple blend is decreased with
addition of BT. This can be explained by phase structure development of composite with
immiscible blend. The addition of BT in 80/20 PVDF/ENR-50 simple blend changes the
phase structure from elongated rubber phase to more spherical like rubber phase, leading
to an increase in storage modulus of the blend. Furthermore, BTs are located at interface
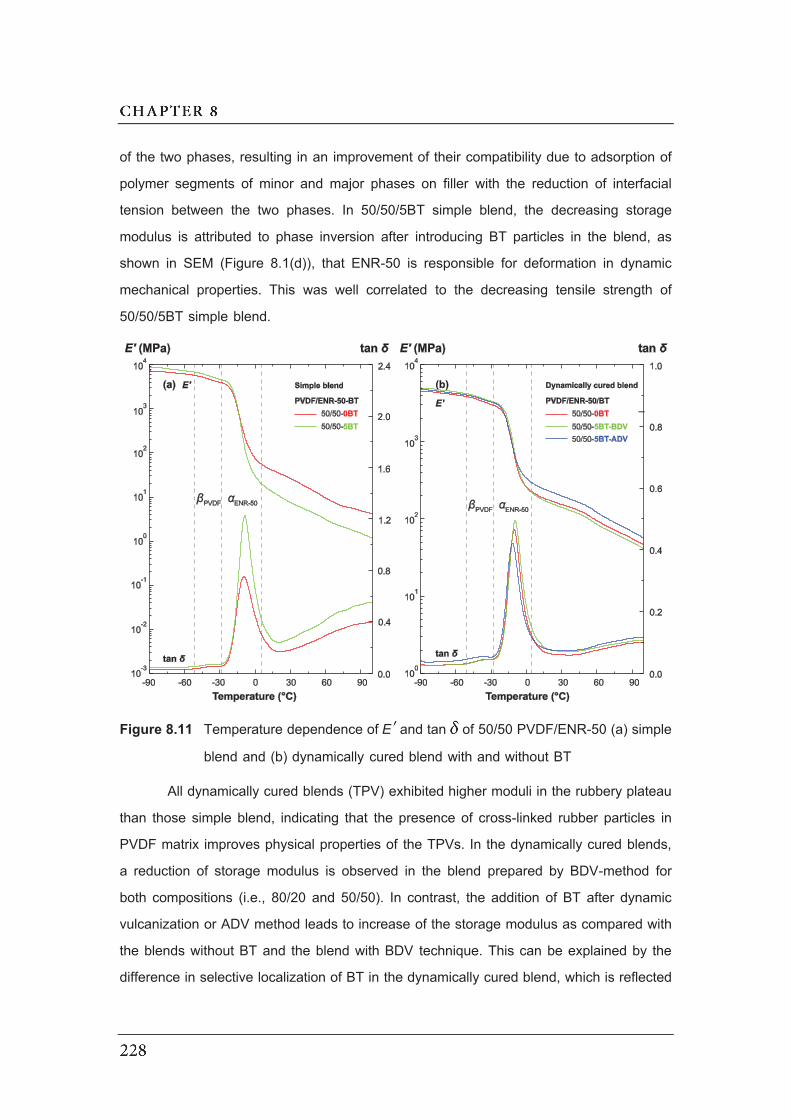
of the two phases, resulting in an improvement of their compatibility due to adsorption of
polymer segments of minor and major phases on filler with the reduction of interfacial
tension between the two phases. In 50/50/5BT simple blend, the decreasing storage
modulus is attributed to phase inversion after introducing BT particles in the blend, as
shown in SEM (Figure 8.1(d)), that ENR-50 is responsible for deformation in dynamic
mechanical properties. This was well correlated to the decreasing tensile strength of
50/50/5BT simple blend.
Figure 8.11 Temperature dependence of EE and tan of 50/50 PVDF/ENR-50 (a) simple
blend and (b) dynamically cured blend with and without BT
All dynamically cured blends (TPV) exhibited higher moduli in the rubbery plateau
than those simple blend, indicating that the presence of cross-linked rubber particles in
PVDF matrix improves physical properties of the TPVs. In the dynamically cured blends,
a reduction of storage modulus is observed in the blend prepared by BDV-method for
both compositions (i.e., 80/20 and 50/50). In contrast, the addition of BT after dynamic
vulcanization or ADV method leads to increase of the storage modulus as compared with
the blends without BT and the blend with BDV technique. This can be explained by the
difference in selective localization of BT in the dynamically cured blend, which is reflected

in higher storage modulus. The composite with BDV technique consists of BT particles
dispersed in ENR-50 phase, leading to no significant improvement of storage modulus.
However, the improvement of storage modulus of the blend with ADV technique is
attributed to localization of BT at interface and in PVDF phase. As may be expected,
localization of the BT at interface evidently improves the interfacial adhesion of
PVDF/ENR-50 blend, resulting in good transfer of stress between the two phases and
restriction of molecular chain [15]. The dynamically cured blend with BT based on the
ADV method shows the higher storage modulus in comparison with the neat and BDV
blend. This is in agreement with Young’s modulus result, as described in mechanical
properties (Section 8.2.2).
In Figures 8.10 and 8.11 and Table 8.2, it can be seen that two distinct tan
peaks appeared around -35◦C and -10◦C. The relaxation at lower-temperature
corresponds to -relaxation or Tg of PVDF phase, whereas the higher-temperature
relaxation corresponds to -relaxation or Tg of ENR-50 phase, which are associated with
segmental motion in amorphous region of PVDF and ENR-50, respectively. Summary of
Tg data in the blend obtained from tan peak in the simple blends and dynamically cured
PVDF/ENR-50 blends with and without BT is summarized in Table 8.2. It is clearly showed
that the variation in Tg of ENR-50 was affected by the incorporation of BT while Tg of
PVDF was slightly affected in the simple and dynamically cured blends. The glass
transition of ENR-50 is shifted to lower temperature for BT composite of PVDF-rich simple
blend and the dynamically cured blend with ADV method. This can be explained by a
selective localization of BT in the immiscible blend. The improvement of compatibility
between PVDF and ENR-50 with BT at interface in TPV-ADV leads to thermodynamically
stabilization of interface. This is typically the same as observed in the reactive blending
or using blend compatibilizer, resulting in shifting of Tg towards each other as compared
with the pure components [15, 16]. This is the reason for shifts in Tg of ENR-50 closer to
the Tg of PVDF. In contrast, the Tg of ENR-50 is shifted to higher temperature for BT
composite of 50/50 simple blend and dynamically cured blend with BDV method. This is
because the BT is mainly dispersed in ENR-50 matrix, leading to restriction of motion of
ENR-50 chains without compatibilization between the two phases and increased Tg of
ENR-50 to higher temperature.
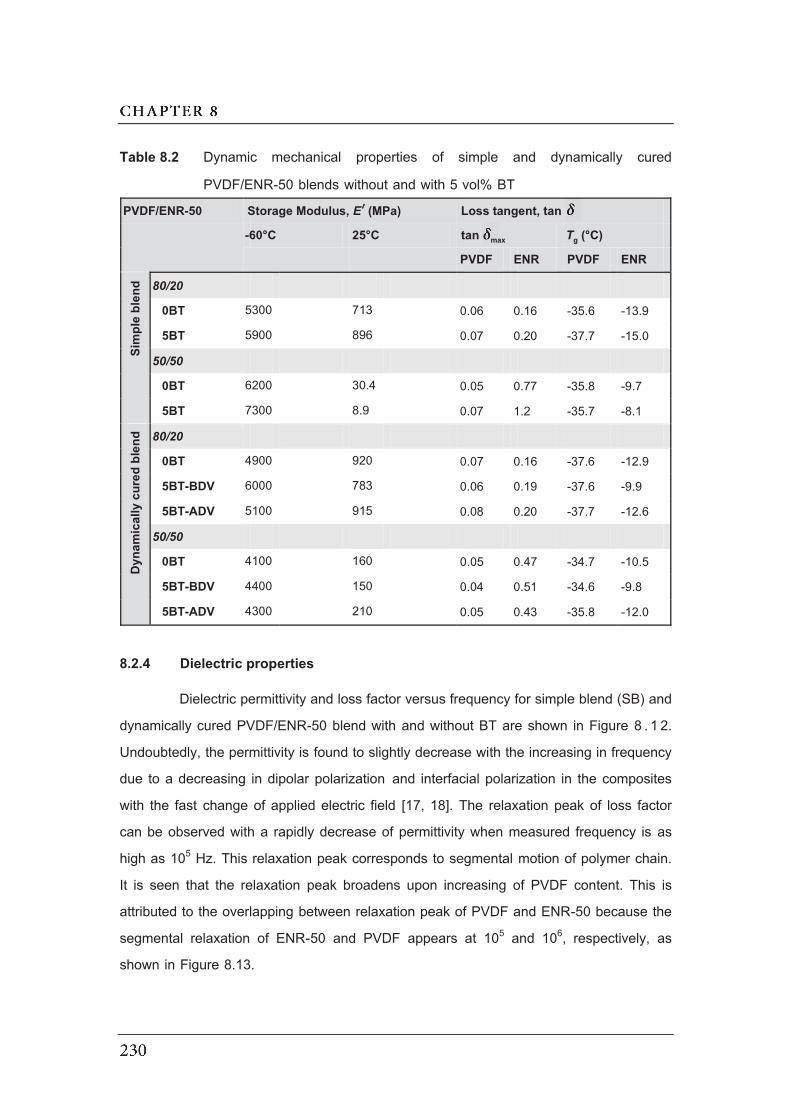
Table 8.2 Dynamic mechanical properties of simple and dynamically cured
PVDF/ENR-50 blends without and with 5 vol% BT PVDF/ENR-50 Storage Modulus, Eʹ́ (MPa) Loss tangent, tan
-60°C 25°C tan max Tg (°C)
PVDF ENR PVDF ENR
Sim
ple
blen
d 80/20
0BT 5300 713 0.06 0.16 -35.6 -13.9
5BT 5900 896 0.07 0.20 -37.7 -15.0
50/50
0BT 6200 30.4 0.05 0.77 -35.8 -9.7
5BT 7300 8.9 0.07 1.2 -35.7 -8.1
Dyna
mic
ally
cur
ed b
lend
80/20
0BT 4900 920 0.07 0.16 -37.6 -12.9
5BT-BDV 6000 783 0.06 0.19 -37.6 -9.9
5BT-ADV 5100 915 0.08 0.20 -37.7 -12.6
50/50
0BT 4100 160 0.05 0.47 -34.7 -10.5
5BT-BDV 4400 150 0.04 0.51 -34.6 -9.8
5BT-ADV 4300 210 0.05 0.43 -35.8 -12.0
8.2.4 Dielectric properties
Dielectric permittivity and loss factor versus frequency for simple blend (SB) and
dynamically cured PVDF/ENR-50 blend with and without BT are shown in Figure 8 . 1 2.
Undoubtedly, the permittivity is found to slightly decrease with the increasing in frequency
due to a decreasing in dipolar polarization and interfacial polarization in the composites
with the fast change of applied electric field [17, 18]. The relaxation peak of loss factor
can be observed with a rapidly decrease of permittivity when measured frequency is as
high as 105 Hz. This relaxation peak corresponds to segmental motion of polymer chain.
It is seen that the relaxation peak broadens upon increasing of PVDF content. This is
attributed to the overlapping between relaxation peak of PVDF and ENR-50 because the
segmental relaxation of ENR-50 and PVDF appears at 105 and 106, respectively, as
shown in Figure 8.13.
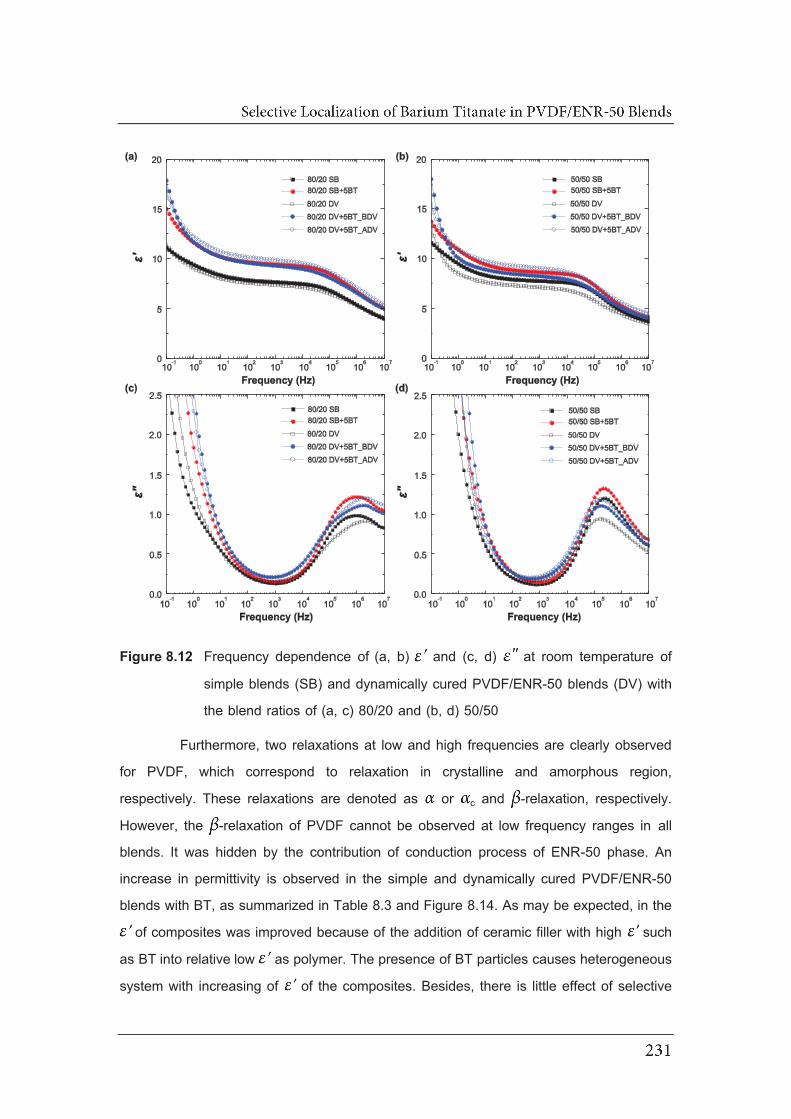
Figure 8.12 Frequency dependence of (a, b) and (c, d) at room temperature of
simple blends (SB) and dynamically cured PVDF/ENR-50 blends (DV) with
the blend ratios of (a, c) 80/20 and (b, d) 50/50
Furthermore, two relaxations at low and high frequencies are clearly observed
for PVDF, which correspond to relaxation in crystalline and amorphous region,
respectively. These relaxations are denoted as or c and -relaxation, respectively.
However, the -relaxation of PVDF cannot be observed at low frequency ranges in all
blends. It was hidden by the contribution of conduction process of ENR-50 phase. An
increase in permittivity is observed in the simple and dynamically cured PVDF/ENR-50
blends with BT, as summarized in Table 8.3 and Figure 8.14. As may be expected, in the
of composites was improved because of the addition of ceramic filler with high such
as BT into relative low as polymer. The presence of BT particles causes heterogeneous
system with increasing of of the composites. Besides, there is little effect of selective
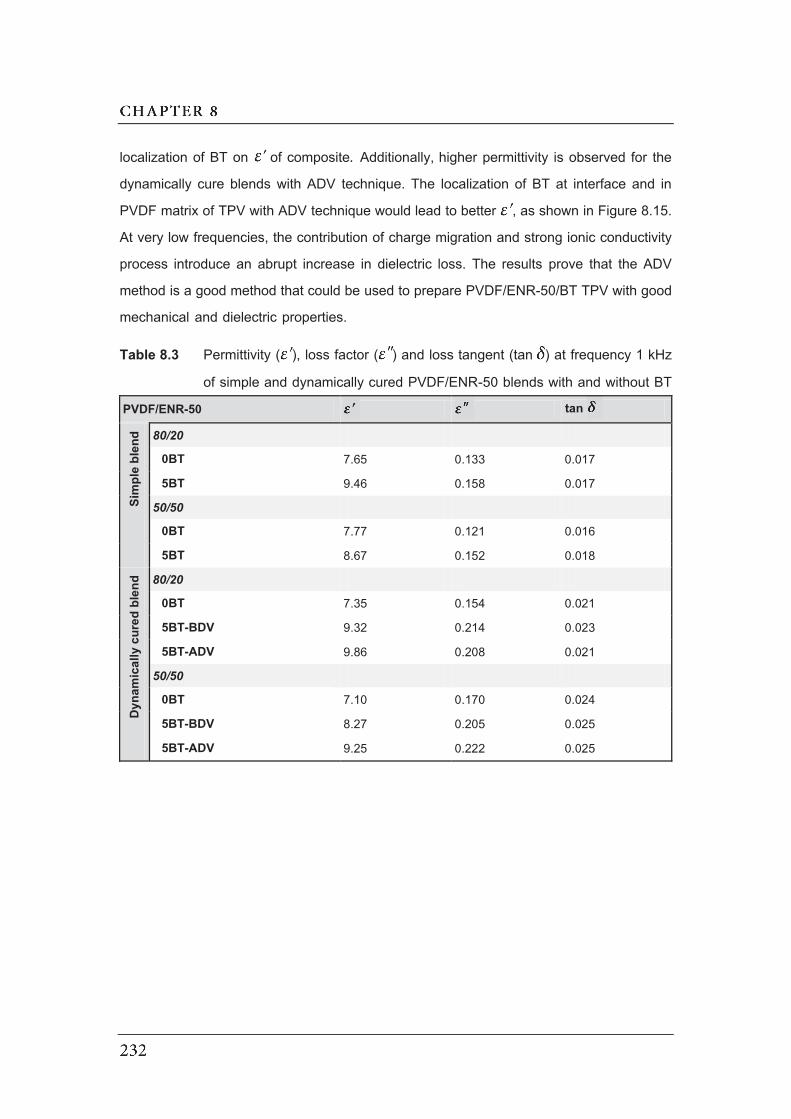
localization of BT on of composite. Additionally, higher permittivity is observed for the
dynamically cure blends with ADV technique. The localization of BT at interface and in
PVDF matrix of TPV with ADV technique would lead to better , as shown in Figure 8.15.
At very low frequencies, the contribution of charge migration and strong ionic conductivity
process introduce an abrupt increase in dielectric loss. The results prove that the ADV
method is a good method that could be used to prepare PVDF/ENR-50/BT TPV with good
mechanical and dielectric properties.
Table 8.3 Permittivity ( ), loss factor ( ) and loss tangent (tan ) at frequency 1 kHz
of simple and dynamically cured PVDF/ENR-50 blends with and without BT PVDF/ENR-50 tan
Sim
ple
blen
d 80/20
0BT 7.65 0.133 0.017
5BT 9.46 0.158 0.017
50/50
0BT 7.77 0.121 0.016
5BT 8.67 0.152 0.018
Dyna
mic
ally
cur
ed b
lend
80/20
0BT 7.35 0.154 0.021
5BT-BDV 9.32 0.214 0.023
5BT-ADV 9.86 0.208 0.021
50/50
0BT 7.10 0.170 0.024
5BT-BDV 8.27 0.205 0.025
5BT-ADV 9.25 0.222 0.025
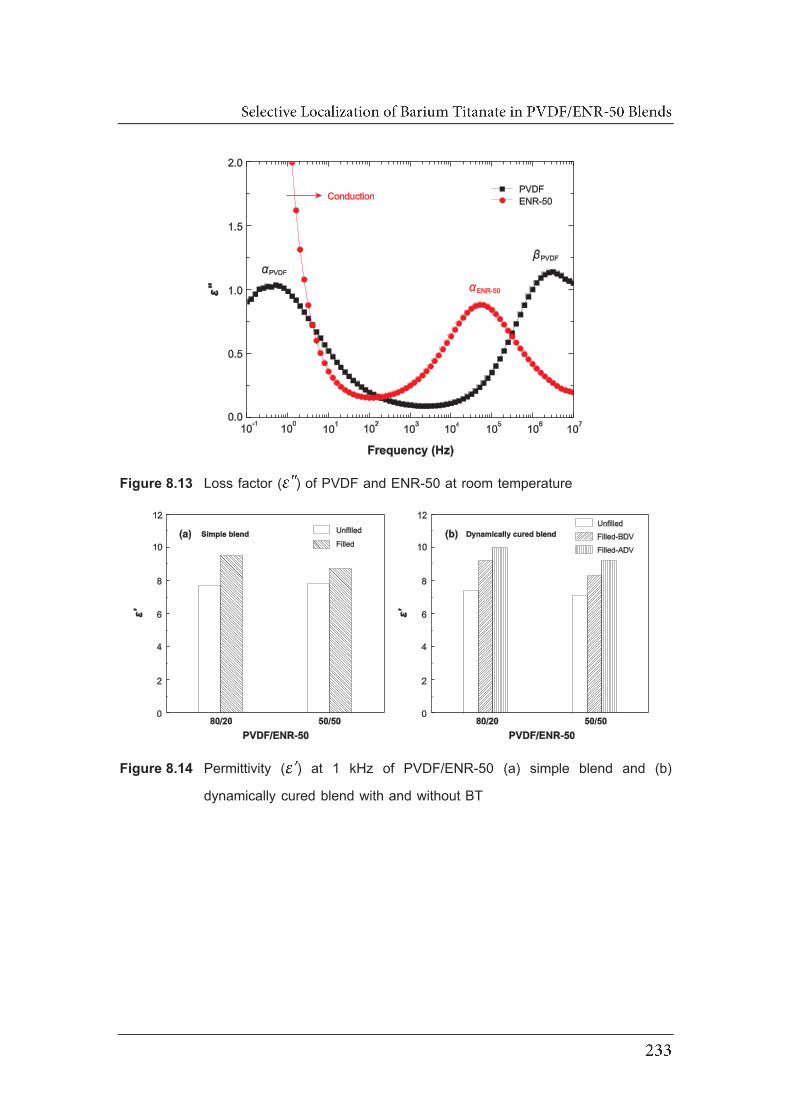
Figure 8.13 Loss factor ( ) of PVDF and ENR-50 at room temperature
Figure 8.14 Permittivity ( ) at 1 kHz of PVDF/ENR-50 (a) simple blend and (b)
dynamically cured blend with and without BT

8.3 Effect of barium titanate loading in dynamically vulcanized
PVDF/ENR-50 blend
In this section, dynamically cured PVDF/ENR-50 blends with the blend ratios of
80/20 and 50/50 with various BT loading (i.e., 0, 5, 12, 25 and 35 vol%) were prepared
by methodology described previously in section 3.2.5. Various important properties were
studied as follows:
8.3.1 Morphological properties
The morphology of the PVDF/ENR-50 TPV filled with 0, 5, 12 and 25 vol% BT
is shown in Figure 8.15. The smooth surface in the SEM images are ENR-50 phase and
rough areas represent PVDF phases. In TPV without BT particles, SEM image clearly
showed a dispersion of ENR-50 particles in the PVDF matrix with a large variation in
particle size. The rubber connectivity and large size distribution without sharp interface
are observed in the TPV with high rubber content, since the separate particles may appear
connect or overlap. It can be also seen that the BT particles appear well disperse in the
blend with both low and high proportion of PVDF. It has been reported that good
dispersion along with homogeneous packing of ceramic filler is likely to exhibit high
dielectric constant [19]. The BT particles are uniformly located in PVDF phase and at
interface because of addition of BT after dynamic vulcanization. Thus inhibition of the
particles in ENR-50 phase occurred, as mentioned earlier. There was no obvious
aggregation in the nanocomposites with lower BT loading (5 and 12 vol%). Gradually
increased loading, the average of interparticle distance decreased due to the formation
of agglomerates. However, at higher BT content (25 vol%), the nanocomposites exhibited
some BT agglomerates with discrete ceramic particles (Fig. 8.15(g) and (h)). Furthermore,
there were many cavitations in the visual surface due to the composite materials became
less compact. Therefore, it easily brought out slots and holes with decreasing
concentration of BT. The agglomeration at high ceramic loading has also been reported
elsewhere [20, 21]. As shown in Figure 8.15, the BT particles are almost spherical in
shape and their sizes vary between 40 and 80 nm. The occurrence of small voids or
pores in the nanocomposite with high content of BT could be ascribed to the
agglomeration of BT nanoparticles.
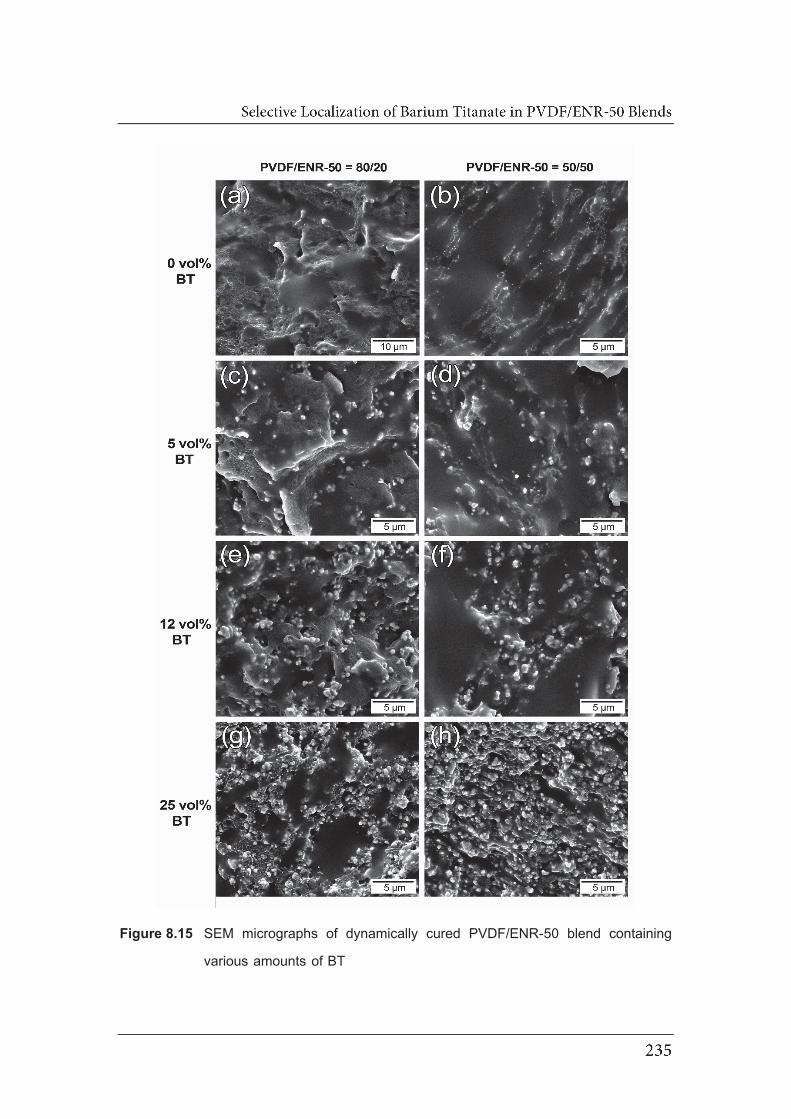
Figure 8.15 SEM micrographs of dynamically cured PVDF/ENR-50 blend containing
various amounts of BT
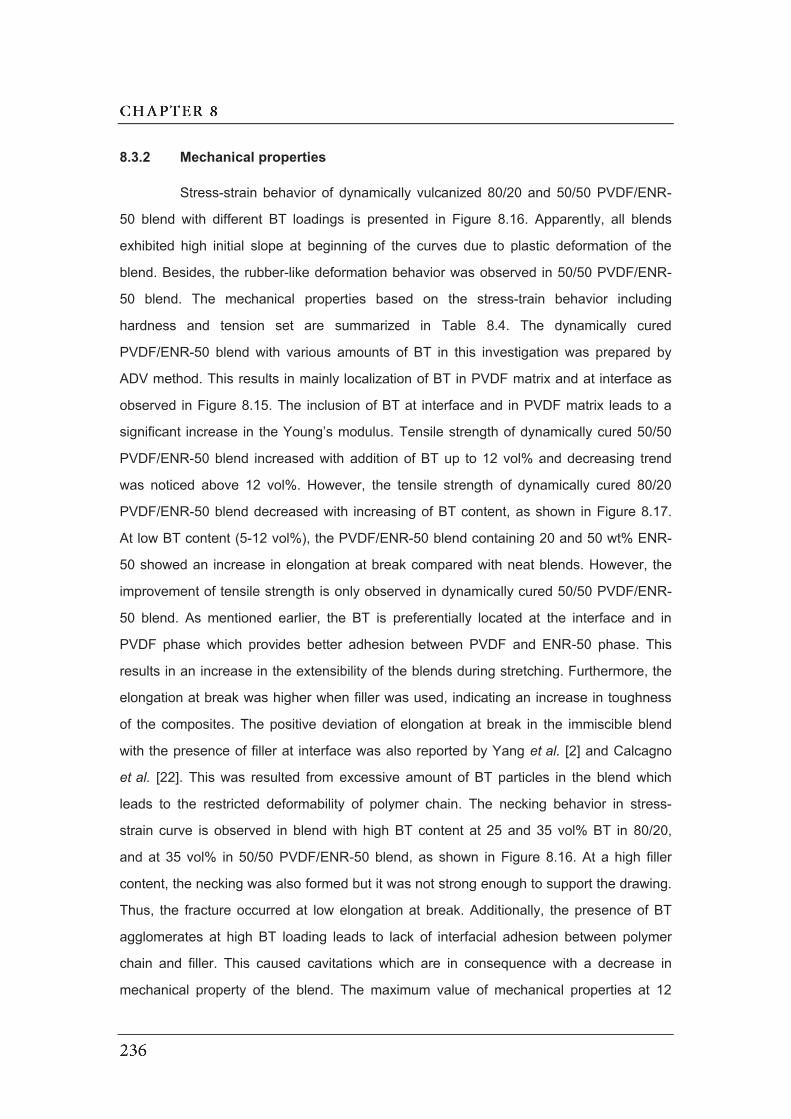
8.3.2 Mechanical properties
Stress-strain behavior of dynamically vulcanized 80/20 and 50/50 PVDF/ENR-
50 blend with different BT loadings is presented in Figure 8.16. Apparently, all blends
exhibited high initial slope at beginning of the curves due to plastic deformation of the
blend. Besides, the rubber-like deformation behavior was observed in 50/50 PVDF/ENR-
50 blend. The mechanical properties based on the stress-train behavior including
hardness and tension set are summarized in Table 8.4. The dynamically cured
PVDF/ENR-50 blend with various amounts of BT in this investigation was prepared by
ADV method. This results in mainly localization of BT in PVDF matrix and at interface as
observed in Figure 8.15. The inclusion of BT at interface and in PVDF matrix leads to a
significant increase in the Young’s modulus. Tensile strength of dynamically cured 50/50
PVDF/ENR-50 blend increased with addition of BT up to 12 vol% and decreasing trend
was noticed above 12 vol%. However, the tensile strength of dynamically cured 80/20
PVDF/ENR-50 blend decreased with increasing of BT content, as shown in Figure 8.17.
At low BT content (5-12 vol%), the PVDF/ENR-50 blend containing 20 and 50 wt% ENR-
50 showed an increase in elongation at break compared with neat blends. However, the
improvement of tensile strength is only observed in dynamically cured 50/50 PVDF/ENR-
50 blend. As mentioned earlier, the BT is preferentially located at the interface and in
PVDF phase which provides better adhesion between PVDF and ENR-50 phase. This
results in an increase in the extensibility of the blends during stretching. Furthermore, the
elongation at break was higher when filler was used, indicating an increase in toughness
of the composites. The positive deviation of elongation at break in the immiscible blend
with the presence of filler at interface was also reported by Yang et al. [2] and Calcagno
et al. [22]. This was resulted from excessive amount of BT particles in the blend which
leads to the restricted deformability of polymer chain. The necking behavior in stress-
strain curve is observed in blend with high BT content at 25 and 35 vol% BT in 80/20,
and at 35 vol% in 50/50 PVDF/ENR-50 blend, as shown in Figure 8.16. At a high filler
content, the necking was also formed but it was not strong enough to support the drawing.
Thus, the fracture occurred at low elongation at break. Additionally, the presence of BT
agglomerates at high BT loading leads to lack of interfacial adhesion between polymer
chain and filler. This caused cavitations which are in consequence with a decrease in
mechanical property of the blend. The maximum value of mechanical properties at 12
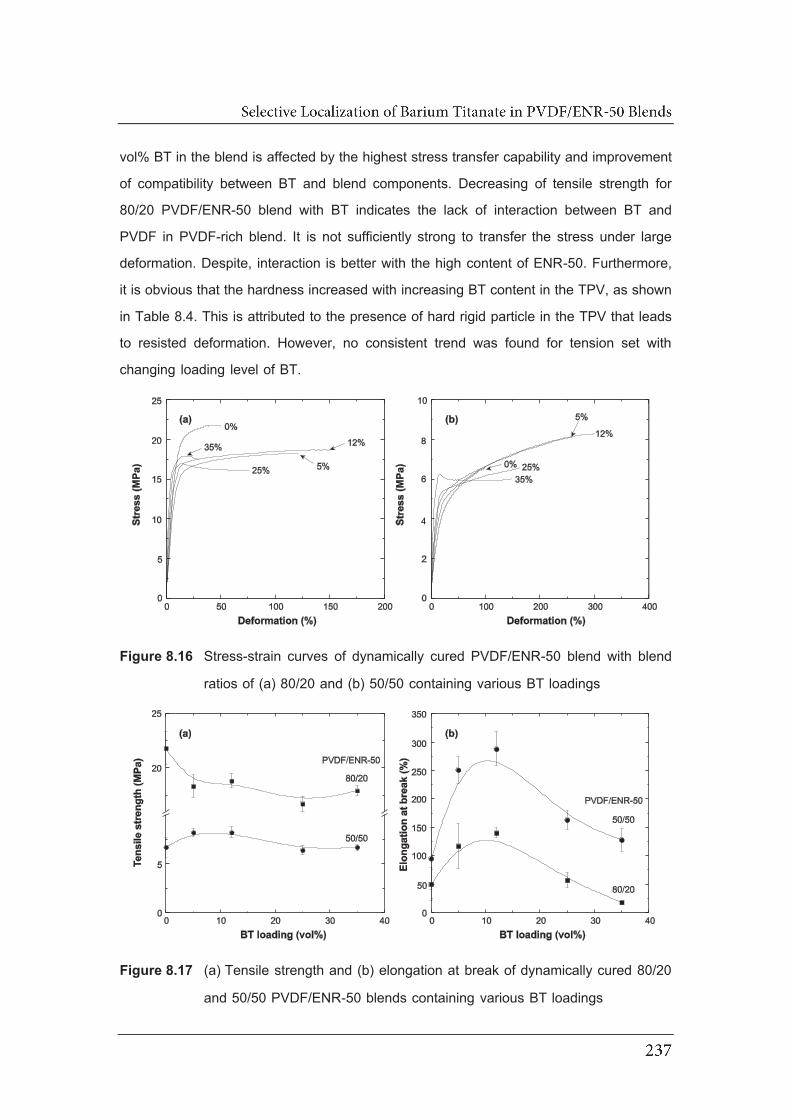
vol% BT in the blend is affected by the highest stress transfer capability and improvement
of compatibility between BT and blend components. Decreasing of tensile strength for
80/20 PVDF/ENR-50 blend with BT indicates the lack of interaction between BT and
PVDF in PVDF-rich blend. It is not sufficiently strong to transfer the stress under large
deformation. Despite, interaction is better with the high content of ENR-50. Furthermore,
it is obvious that the hardness increased with increasing BT content in the TPV, as shown
in Table 8.4. This is attributed to the presence of hard rigid particle in the TPV that leads
to resisted deformation. However, no consistent trend was found for tension set with
changing loading level of BT.
Figure 8.16 Stress-strain curves of dynamically cured PVDF/ENR-50 blend with blend
ratios of (a) 80/20 and (b) 50/50 containing various BT loadings
Figure 8.17 (a) Tensile strength and (b) elongation at break of dynamically cured 80/20
and 50/50 PVDF/ENR-50 blends containing various BT loadings
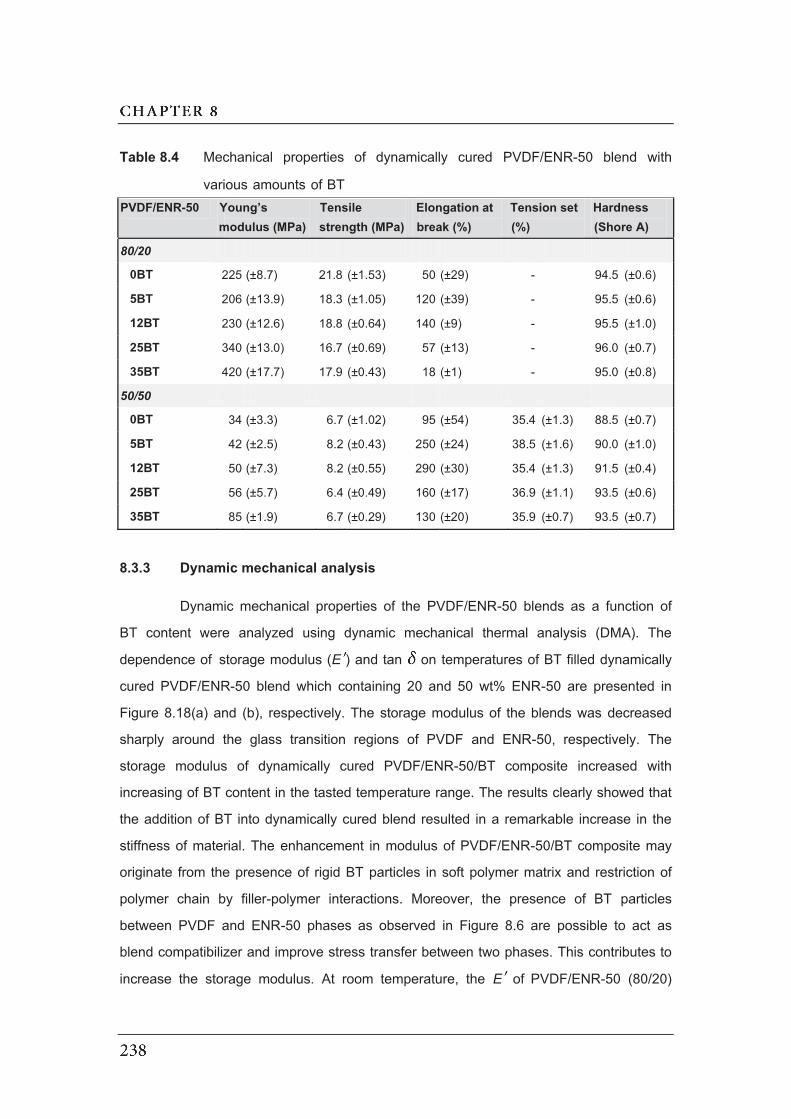
Table 8.4 Mechanical properties of dynamically cured PVDF/ENR-50 blend with
various amounts of BT PVDF/ENR-50 Young’s
modulus (MPa) Tensile strength (MPa)
Elongation at break (%)
Tension set (%)
Hardness (Shore A)
80/20
0BT 225 (±8.7) 21.8 (±1.53) 50 (±29) - 94.5 (±0.6)
5BT 206 (±13.9) 18.3 (±1.05) 120 (±39) - 95.5 (±0.6)
12BT 230 (±12.6) 18.8 (±0.64) 140 (±9) - 95.5 (±1.0)
25BT 340 (±13.0) 16.7 (±0.69) 57 (±13) - 96.0 (±0.7)
35BT 420 (±17.7) 17.9 (±0.43) 18 (±1) - 95.0 (±0.8)
50/50
0BT 34 (±3.3) 6.7 (±1.02) 95 (±54) 35.4 (±1.3) 88.5 (±0.7)
5BT 42 (±2.5) 8.2 (±0.43) 250 (±24) 38.5 (±1.6) 90.0 (±1.0)
12BT 50 (±7.3) 8.2 (±0.55) 290 (±30) 35.4 (±1.3) 91.5 (±0.4)
25BT 56 (±5.7) 6.4 (±0.49) 160 (±17) 36.9 (±1.1) 93.5 (±0.6)
35BT 85 (±1.9) 6.7 (±0.29) 130 (±20) 35.9 (±0.7) 93.5 (±0.7)
8.3.3 Dynamic mechanical analysis
Dynamic mechanical properties of the PVDF/ENR-50 blends as a function of
BT content were analyzed using dynamic mechanical thermal analysis (DMA). The
dependence of storage modulus (EE ) and tan on temperatures of BT filled dynamically
cured PVDF/ENR-50 blend which containing 20 and 50 wt% ENR-50 are presented in
Figure 8.18(a) and (b), respectively. The storage modulus of the blends was decreased
sharply around the glass transition regions of PVDF and ENR-50, respectively. The
storage modulus of dynamically cured PVDF/ENR-50/BT composite increased with
increasing of BT content in the tasted temperature range. The results clearly showed that
the addition of BT into dynamically cured blend resulted in a remarkable increase in the
stiffness of material. The enhancement in modulus of PVDF/ENR-50/BT composite may
originate from the presence of rigid BT particles in soft polymer matrix and restriction of
polymer chain by filler-polymer interactions. Moreover, the presence of BT particles
between PVDF and ENR-50 phases as observed in Figure 8.6 are possible to act as
blend compatibilizer and improve stress transfer between two phases. This contributes to
increase the storage modulus. At room temperature, the EE of PVDF/ENR-50 (80/20)

blend was improved by 143% higher and the EE of 50/50 PVDF/ENR-50 blend was
improved by 270% higher with the addition of 35 vol% BT. At the same BT concentration,
the higher increment of EE can be observed in 50/50 PVDF/ENR-50, as shown in Figure
8.19. This indicates that influence of the BT on EE becomes more pronounced with the
blend containing the higher rubber fraction. Apparently, the rapid drop in storage modulus
accompanied with the relaxation peak of tan . As stated earlier, the PVDF/ENR-50 blend
showed two relaxations at low and high temperatures which corresponded to -relaxation
and -relaxation of PVDF and ENR-50, respectively. These relaxations are assigned to
glass-rubber transition (Tg) of PVDF and ENR-50, respectively. The influence of BT
loading on glass transition temperature is summarized in Table 8.5. Clearly, it can be
seen that the addition of BT has a significant influence on Tg of ENR-50 and PVDF. The
Tg of ENR-50 in PVDF/ENR-50 (50/50) blend is shifted to lower temperature for small
addition of BT. This indicates the localization of BT at interface act as compatibilizer for
PVDF and ENR-50 blends which leads to shifting of relaxation peaks of blend
components toward each other. However, Tg of ENR-50 in PVDF/ENR-50 (50/50) blend
is shifted to higher temperature at high BT loading. This can be explained by strong
interaction between BT and ENR-50 at the interface, which confines or immobilizes the
polymer chains near the filler surface. This results in higher Tg of polymer [23]. Meanwhile, Tg of PVDF is shifted to lower temperature (close to Tg of pure PVDF -39) as BT content
increased. This shift is explained by the fact that high content of filler prevents the packing
of the polymer chain and consequently increases free volume for molecular mobility.
Consequently, the cooperative motion of the polymer chains at lower temperature
occurred [24]. The different Tg of PVDF and ENR-50 may occur because BT particles are
mainly located in PVDF and interface. Thus, the preventing of polymer chain packing and
increasing free volume with high BT loading become more pronounced in PVDF phase.
This leads to decrease in Tg of PVDF to lower temperature. Moreover, restriction of ENR-
50 chain movement occurred at interface.
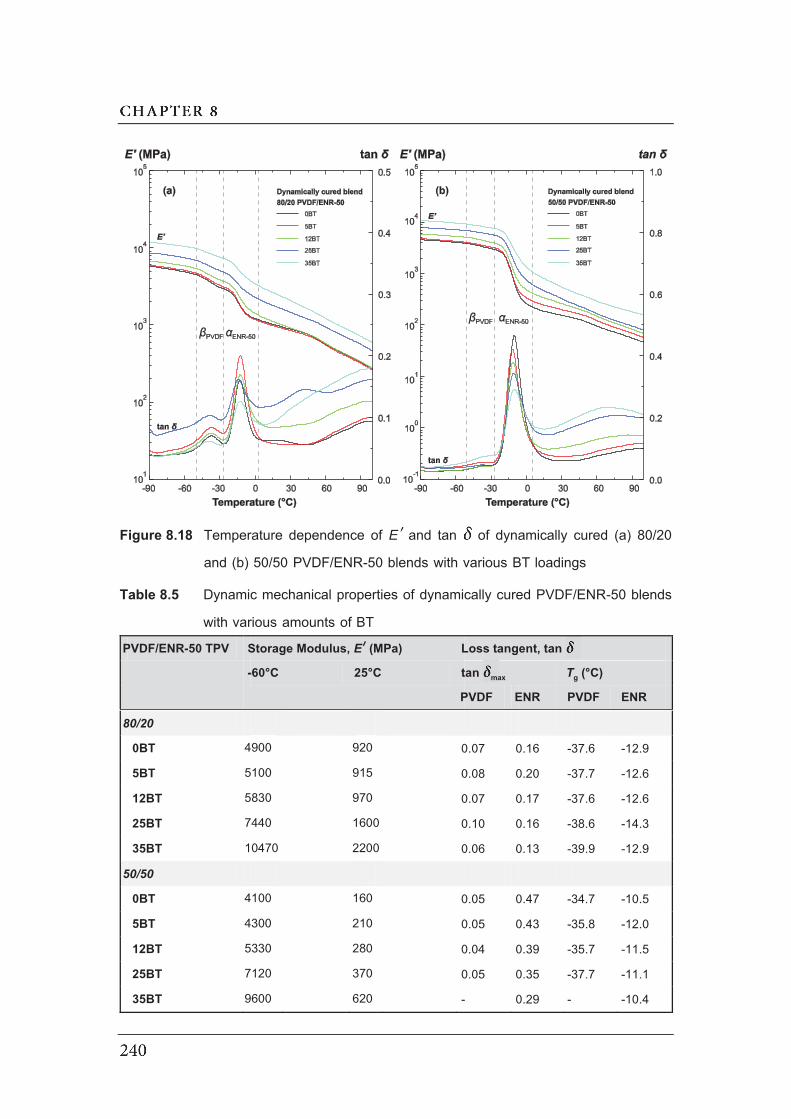
Figure 8.18 Temperature dependence of EE and tan of dynamically cured (a) 80/20
and (b) 50/50 PVDF/ENR-50 blends with various BT loadings
Table 8.5 Dynamic mechanical properties of dynamically cured PVDF/ENR-50 blends
with various amounts of BT PVDF/ENR-50 TPV Storage Modulus, Eʹ́ (MPa) Loss tangent, tan
-60°C 25°C tan max Tg (°C)
PVDF ENR PVDF ENR
80/20
0BT 4900 920 0.07 0.16 -37.6 -12.9
5BT 5100 915 0.08 0.20 -37.7 -12.6
12BT 5830 970 0.07 0.17 -37.6 -12.6
25BT 7440 1600 0.10 0.16 -38.6 -14.3
35BT 10470 2200 0.06 0.13 -39.9 -12.9
50/50
0BT 4100 160 0.05 0.47 -34.7 -10.5
5BT 4300 210 0.05 0.43 -35.8 -12.0
12BT 5330 280 0.04 0.39 -35.7 -11.5
25BT 7120 370 0.05 0.35 -37.7 -11.1
35BT 9600 620 - 0.29 - -10.4
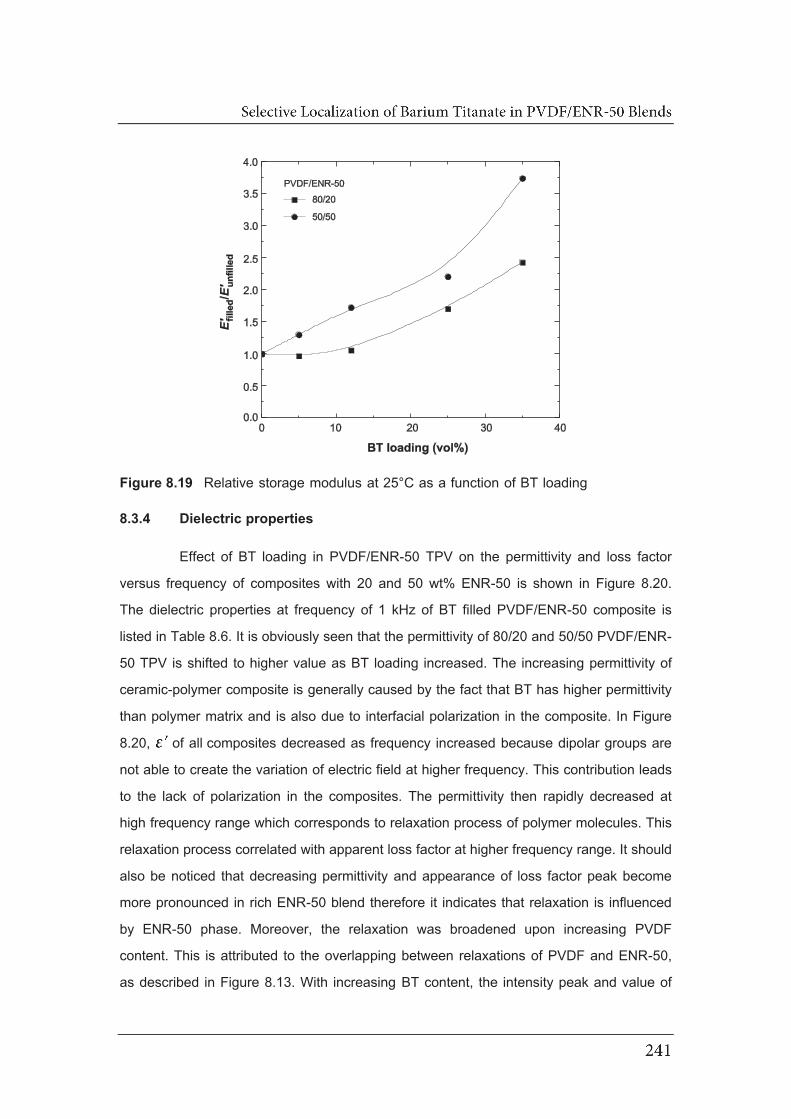
Figure 8.19 Relative storage modulus at 25°C as a function of BT loading
8.3.4 Dielectric properties
Effect of BT loading in PVDF/ENR-50 TPV on the permittivity and loss factor
versus frequency of composites with 20 and 50 wt% ENR-50 is shown in Figure 8.20.
The dielectric properties at frequency of 1 kHz of BT filled PVDF/ENR-50 composite is
listed in Table 8.6. It is obviously seen that the permittivity of 80/20 and 50/50 PVDF/ENR-
50 TPV is shifted to higher value as BT loading increased. The increasing permittivity of
ceramic-polymer composite is generally caused by the fact that BT has higher permittivity
than polymer matrix and is also due to interfacial polarization in the composite. In Figure
8.20, of all composites decreased as frequency increased because dipolar groups are
not able to create the variation of electric field at higher frequency. This contribution leads
to the lack of polarization in the composites. The permittivity then rapidly decreased at
high frequency range which corresponds to relaxation process of polymer molecules. This
relaxation process correlated with apparent loss factor at higher frequency range. It should
also be noticed that decreasing permittivity and appearance of loss factor peak become
more pronounced in rich ENR-50 blend therefore it indicates that relaxation is influenced
by ENR-50 phase. Moreover, the relaxation was broadened upon increasing PVDF
content. This is attributed to the overlapping between relaxations of PVDF and ENR-50,
as described in Figure 8.13. With increasing BT content, the intensity peak and value of

loss factor ( ) increased in the specified frequency range, which originate from the
contributions of dipole orientation, conduction loss and interfacial polarization in the
composites [25, 26]. The extremely fast increasing dielectric loss with decreasing
frequency was due to charge transfer. This behavior can be explained as the increased
contribution of DC conductivity. Figure 8.21 shows permittivity, loss factor and tan at
frequency of 1 kHz as a function of BT loading in 80/20 and 50/50 PVDF/ENR-50 TPVs
in comparison with BT/ENR-50 composite described in Chapter 5. It is obviously seen
that the permittivity and loss factor significantly increased with increasing BT loading. The
dielectric permittivity is increased from 7.3 to 36.7 ( 400% higher) in the PVDF/ENR-50
(80/20) TPV composites and increased from 7.0 to 28.6 ( 300% higher) in PVDF/ENR-
50 (50/50) TPV composites with 35 vol% of BT. Besides, It is also seen that the composite
of dynamically cured PVDF/ENR-50 blend with the blend ratio of 80/20 showed higher
permittivity than those of the composite of 50/50 PVDF/ENR-50 TPV and ENR-50. This
is due to strong dipole moment of the CF2 in PVDF molecules which contribute to increase
in permittivity of PVDF-rich blend. Furthermore, the PVDF/ENR-50 TPV filled with BT
exhibits a lower loss tangent than that of the BT/ENR-50 composite, which is attributed
to a higher loss factor of the ENR-50 than that of PVDF, as shown in Figure 8.13. This
results in minimized loss factor and tan in the blend. The TPV filled with BT showed
very low tan value which is lower than ENR-50 filled with BT. Also, the tan value of
TPV is nearly constant over the whole loading range of BT from 0 to 35 vol%. Since, the
loss tangent (tan ) is proportional to loss factor and permittivity. Hence, high permittivity
and low tan of samples are considered for selecting dielectric materials. Thus, the
significant increase in permittivity and decrease in loss factor of the TPV with high PVDF
content indicate that PVDF can improve dielectric properties of the composite. Therefore,
the BT filled TPV composites prepared in this study are possible to be candidates for
good dielectric material with most of loss tangents of the composites are lesser than 0.03.

Table 8.6 Permittivity ( ), loss factor ( ) and loss tangent (tan ) at frequency 1 kHz
of dynamically cured PVDF/ENR-50 blend with various BT loadings BT loading (vol%) PVDF/ENR-50 = 80/20 PVDF/ENR-50 = 50/50
tan tan
0 7.35 0.154 0.021 7.10 0.170 0.024
5 9.86 0.208 0.021 9.25 0.222 0.025
12 13.13 0.293 0.022 11.71 0.296 0.025
25 13.31 0.548 0.023 20.62 0.530 0.026
35 36.74 0.886 0.024 28.56 0.782 0.027
Figure 8.20 Frequency dependence of and at room temperature of dynamically
cured PVDF/ENR-50 blends with various BT loadings
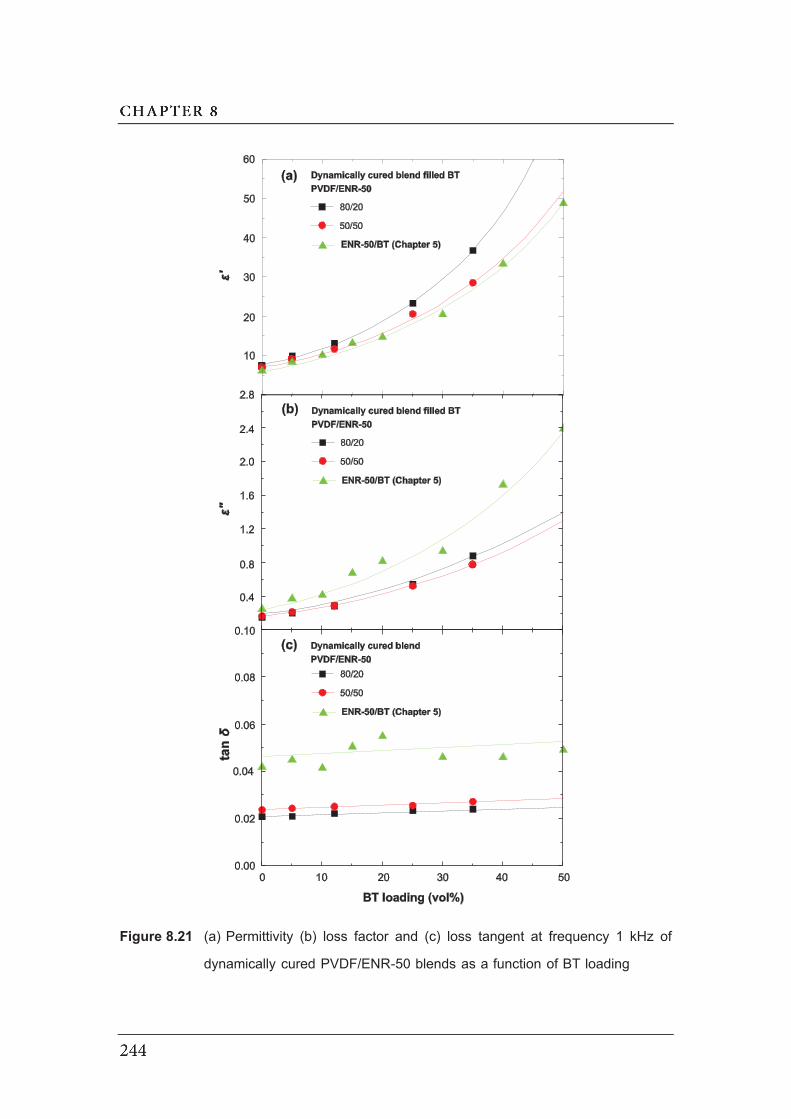
Figure 8.21 (a) Permittivity (b) loss factor and (c) loss tangent at frequency 1 kHz of
dynamically cured PVDF/ENR-50 blends as a function of BT loading
8.4 Conclusions
Incorporation of barium titanate in the simple blend and dynamically cured
PVDF/ENR-50 blends was performed. It was found that the BT particles preferential
located in ENR-50 phase of simple blend and dynamically cured blend due to lower
viscosity of ENR-50 component. The selective localization of 5vol% of BT in ENR-50
phase caused increasing in dispersed phase size of ENR-50 in the 80/20 PVDF/ENR-50
simple blend and changing of the morphology from co-continuous phase to dispersed-
matirx phase in 50/50 PVDF/ENR-50 simple blend. Two different mixing sequences for
addition of BT into dynamically cured blend were investigated. It revealed that
incorporation of BT after dynamic vulcanization (ADV method) cause changes in of
localization of BT in PVDF/ENR-50 TPV whereby the BT particles are mainly located at
interface and in PVDF phase. This localization of BT caused increasing modulus (i.e.,
Young’s modulus and storage modulus) of the blend. Furthermore, incorporation of BT
into 80/20 PVDF/ENR-50 TPV caused decreasing tensile strength while 50/50
PVDF/ENR-50 TPV showed higher tensile strength. However, incorporation of BT
increased elongation at break of 80/20 and 50/50 PVDF/ENR-50 TPVs. Also, interfacial
localization of the BT evidently improved the interfacial adhesion of PVDF/ENR-50 blend.
This results in good stress transfer between two phases and restriction of molecular chain.
The variation of BT loadings in dynamically cured PVDF/ENR-50 blend was also
studied by adding BT after dynamic vulcanization (ADV method). It was found that the
modulus (i.e., Young’s modulus and storage modulus) increased with increasing BT
content and the great increment of modulus was observed in the blend containing high
rubber fraction. The tensile strength of 50/50 PVDF/ENR-50 TPV increased up to 12 vol%
of BT, while decreasing trend was observed in the 80/20 PVDF/ENR-50 TPV in the
composition range. Additionally, the elongation at break showed the maximum value at
12 vol% of BT in both types of TPVs. The dielectric permittivity and dielectric loss factor
of PVDF/ENR-50 filled with BT increased with increasing BT content which is a typical
trend for ceramic filled polymer composite. The TPV composites with higher PVDF
proportion showed higher permittivity than the TPV composite with lower content of PVDF
and ENR-50 composites at the same BT loading. Meanwhile, the TPV filled BT showed
lower dielectric loss than BT/ENR-50, which is good characteristic of dielectric materials.

8.5 References
[1] Entezam, M., Khonakdar, H.A., Yousefi, A.A., Jafari, S.H., Wagenknecht, U. and
Heinrich, G. 2013. On nanoclay localization in polypropylene/poly(ethylene
terephthalate) blends: correlation with thermal and mechanical properties. Mater.
Design. 45, 110-117.
[2] Yang, J.H., Feng, C.X., Dai, J., Zhang, N., Huang, T. and Wang, Y. 2013.
Compatibilization of immiscible nylon 6/poly(vinylidene fluoride) blends using
graphene oxides. Polym. Int. 62, 1085-1093.
[3] Yun-yun, S., Jing-hui, Y., Ting, H., Nan, Z., Chen, C. and Yong, W. 2013. Selective
localization of carbon nanotubes at the interface of poly(L-lactide)/ethylene-co-vinyl
acetate resulting in lowered electrical resistivity. Compos. Part B: Eng. 55.
[4] Jarnthong, M., Nakason, C., Lopattananon, N. and Peng, Z. 2012. Influence of
incorporation sequence of silica nanoparticles on morphology, crystallization
behavior, mechanical properties, and thermal resistance of melt blended
thermoplastic natural rubber. Polym. Compos. 33, 1911-1920.
[5] Hong, J.S., Namkung, H., Ahn, K.H., Lee, S.J. and Kim, C. 2006. The role of
organically modified layered silicate in the breakup and coalescence of droplets in
PBT/PE blends. Polymer. 47, 3967-3975.
[6] Kontopoulou, M., Liu, Y.Q., Austin, J.R. and Parent, J.S. 2007. The dynamics of
montmorillonite clay dispersion and morphology development in immiscible
ethylene-propylene rubber/polypropylene blends. Polymer. 48, 4520-4528.
[7] Bailly, M. and Kontopoulou, M. 2010. Nanocomposite blends containing
polyolefins, in Advances in Polyolefin Nanocomposites, V. Mittal, ed. CRC Press,
Boca Raton.
[8] Wu, D.F., Lin, D.P., Zhang, J., Zhou, W.D., Zhang, M., Zhang, Y.S., Wang, D.M.
and Lin, B.L. 2011. Selective localization of nanofillers: effect on morphology and
crystallization of PLA/PCL blends. Macromol. Chem. Phys. 212, 613-626.
[9] Shi, Y.Y., Yang, J.H., Huang, T., Zhang, N., Chen, C. and Wang, Y. 2013.
Selective localization of carbon nanotubes at the interface of poly(L-
lactide)/Ethylene-co-vinyl acetate resulting in lowered electrical resistivity. Compos.
Part B: Eng. 55, 463-469.
[10] Goldel, A., Marmur, A., Kasaliwal, G.R., Pötschke, P. and Heinrich, G. 2011.
Shape-dependent localization of carbon nanotubes and carbon Black in an
immiscible polymer blend during melt mixing. Macromolecules. 44, 6094-6102.
[11] Lee, S.H., Kontopoulou, M. and Park, C.B. 2010. Effect of nanosilica on the co-
continuous morphology of polypropylene/polyolefin elastomer blends. Polymer. 51,
1147-1155.
[12] Sengupta, P. and Noordermeer, J.W.M. 2005. Three-dimensional structure of
olefinic thermoplastic elastomer blends using electron tomography. Macromol.
Rapid Commun. 26, 542-547.
[13] Machado, A. and van Duin, M. 2005. Dynamic vulcanisation of EPDM/PE-based
thermoplastic vulcanisates studied along the extruder axis. Polymer. 46, 6575-
6586.
[14] Drobny, J.G. 2007. Handbook of Thermoplastic Elastomers. PDL(Plastics Design
Library)/William Andrew Pub., New York.
[15] Wu, D.F., Zhang, Y.S., Zhang, M. and Yu, W. 2009. Selective localization of
multiwalled carbon nanotubes in poly(( -caprolactone)/polylactide blend.
Biomacromolecules. 10, 417-424.
[16] Das, A., Mahaling, R.N., Stockelhuber, K.W. and Heinrich, G. 2011.
Reinforcement and migration of nanoclay in polychloroprene/ethylene-propylene-
diene-monomer rubber blends. Compos. Sci. Technol. 71, 276-281.
[17] Thomas, S., Deepu, V., Uma, S., Mohanan, P., Philip, J. and Sebastian, M.T.
2009. Preparation, characterization and properties of Sm2Si2O7 loaded polymer
composites for microelectronic applications. Mater. Sci. Eng. B: Adv. 163, 67-75.
[18] Li, Y.C., Tjong, S.C. and Li, R.K.Y. 2011. Dielectric properties of binary
polyvinylidene fluoride/barium titanate nanocomposites and their nanographite
doped hybrids. Express Polym. Lett. 5, 526-534.
[19] Windlass, H., Raj, P.M., Balaraman, D., Bhattacharya, S.K. and Tummala, R.R.
2003. Colloidal processing of polymer ceramic nanocomposite integral capacitors.
IEEE T. Electron. Pa. M. 26, 100-105.
[20] Choudhury, A. 2010. Dielectric and piezoelectric properties of
polyetherimide/BaTiO3 nanocomposites. Mater. Chem. Phys. 121, 280-285.

[21] Dang, Z.M., Zheng, Y. and Xu, H.P. 2008. Effect of the ceramic particle size on
the microstructure and dielectric properties of barium titanate/polystyrene
composites. J. Appl. Polym. Sci. 110, 3473-3479.
[22] Calcagno, C.I.W., Mariani, C.M., Teixeira, S.R. and Mauler, R.S. 2008. The role
of the MMT on the morphology and mechanical properties of the PP/PET blends.
Compos. Sci. Technol. 68, 2193-2200.
[23] Carretero-González, J., Retsos, H., Verdejo, R., Toki, S., Hsiao, B.S., Giannelis,
E.P. and López-Manchado, M.A. 2008. Effect of nanoclay on natural rubber
microstructure. Macromolecules. 41, 6763-6772.
[24] Leu, C.M., Chang, Y.T. and Wei, K.H. 2003. Polyimide-side-chain tethered
polyhedral oligomeric silsesquioxane nanocomposites for low-dielectric film
applications. Chem. Mater. 15, 3721-3727.
[25] Huang, X., Xie, L., Jiang, P., Wang, G. and Liu, F. 2009. Electrical, thermophysical
and micromechanical properties of ethylene-vinyl acetate elastomer composites
with surface modified BaTiO3 nanoparticles. J. Phys. D: Appl. Phys. 42, 245407.
[26] Logakis, E., Pandis, C., Peoglos, V., Pissis, P., Stergiou, C., Pionteck, J.,
Pötschke, P., Micusík, M. and Omastová, M. 2009. Structure–property
relationships in polyamide 6/multi-walled carbon nanotubes nanocomposites. J.
Polym. Sci. Pol. Phys. 47, 764-774.
CHAPTER 9 GENERAL CONCLUSIONS
The aim of this work was to understand the behavior of natural rubber composite
and blend materials from the knowledge of their composition, microstructures and
properties. Epoxidized natural rubber composite with barium titanate (BT) and carbon
black have been prepared to improve permittivity and conductivity, respectively. The
simple blend and dynamically cured blend of epoxidized natural rubber and
poly(vinylidene fluoride) have also been prepared to study their miscibility and phase
morphology. The results are summarized below.
Experimental results have initially focused on the characterization of natural
rubber and epoxidized natural rubber (ENR). The cure characteristics of three types of
natural rubber (i.e., NR, ENR-25 and ENR-50) were first investigated. It was found that
the unmodified NR showed plateau curing curve and ENRs showed reversion
phenomenon. Meanwhile, the presence of epoxide group in ENR caused an increase in
modulus at high strain as compared to natural rubber without epoxide group (NR).
However, elongation at break of ENRs was lower than that of the NR. Influence of epoxide
group on molecular dynamics of NR and ENR were also observed by DMA and DEA
experiments which showed that glass transition temperature (Tg) of rubber increased with
increasing epoxidation level. This indicates the steric interference caused by the epoxide
group which results in restriction of chain mobility. Furthermore, DEA experiment also
revealed that polarity of epoxide group leads to enhance dielectric permittivity, loss factor
and conductivity.
In order to prepare high permittivity polymer composite, addition of barium titanate
(BT) was used to increase in permittivity of composite. Epoxidized natural rubber with 50
mole% of epoxide group (ENR-50) was used as polymer matrix for 0-3 composite.
Ceramic-polymer 0-3 composites based on BT-ENR-50 containing BT 0 to 60 vol% were
prepared in molten state. It was found that the composites showed a reduction in scorch
time and cure time, and increased in minimum and maximum torques with increase of
the concentration of BT. As expected, the BT particles were dispersed uniformly in ENR-
50, which established microstructure (0-3) connectivity of the composite. However, at high
BT content, agglomerates formation of BT powders was easily observed. The mechanical
and dielectric properties of nanocomposites were modified according to the volume
fraction of BaTiO3: the tensile strength and elongation at break are decreased as BT
content increased. Besides, the real and imaginary part of the dielectric permittivity
increased with increasing BT content. The evolution of with the volume fraction was
well described by the Jayasundere and Smith (J-S) and modified Lichtenecker’s models in over range of BT loading. BT/ENR-50 composites at 50 vol% of BT nearly reached
value of permittivity, loss factor and loss tangent of 48.7, 2.4 and 0.05, respectively at 1
kHz. Therefore, it is concluded that addition of BT into ENR-50 matrix was suitable
ceramic-polymer pairs to obtain ceramic-polymer composites with high permittivity and
flexibility.
The conductive elastomer composites have been also developed by using ENR-
50 as the matrix phase. Two types of carbon black (CB) i.e., high abrasion furnace and
extra conductive furnace were used to obtain conductive composite. It was found that the
reinforcement of carbon black particle in rubber matrix played a role in the improvement
of mechanical properties. The use of HAF and ECF showed maximum tensile strength at
20 and 10 phr, respectively. Furthermore, degree of reinforcement of ECF was higher
than that of HAF, which has been estimated by Krause’s relation. The electrical properties
of the conductive composites were studied by employing dielectric spectroscopy. The
dielectric permittivity and loss factor are increased with increasing CB content. It was
found that the electrical conductivity increased gradually with increasing CB contents in
the composites and then increased abruptly at the percolation threshold. The drastic rise
in conductivity was due to the formation of continuous chains or network of carbon black
that spanned throughout the insulating ENR-50 matrix. The electrical percolation threshold
(pc) in HAF and ECF composites was reached at 25.3 phr and 12.4 phr, respectively.
The very low percolation threshold of ECF/ENR-50 composite is good candidate to
prepare conductive elastomer composite because the production of conductive composite
depends on conductive filler content, which must be as low as possible to avoid poor
mechanical properties and high cost.

The miscibility and phase development of polymer blends based on
poly(vinylidene fluoride) (PVDF) and epoxidized natural rubber (ENR) blends were also
studied. The morphologies were observed by scanning electron microscopy (SEM) after
minor phase etching. As expected, the morphology of PVDF/ENR blends became finer
with increasing epoxide group content in ENR molecules due to small difference in
solubility parameter and compatibilization between two phases. This results in an increase
in tensile strength, elongation at break and storage modulus. The compatibilization
reaction may occur between chemical interaction between PVDF and ENR-50 phases.
The miscibility was also revealed by DMA and DEA techniques, which detected that the
glass transition temperatures of PVDF and ENR-50 were shifted to each other.
Different morphologies of proportion PVDF/ENR-50 blends were observed as a
function of the blend. That is, the ENR-50 dispersed in PVDF matrix at low ENR-50
content. The co-continuous interpenetrating phases were observed in the mixtures of
40/60 and 50/50 of PVDF/ENR-50 blends. The further increase of ENR-50 content led to
inversion phenomenon which was confirmed by dynamic mechanical analysis. That is, a
radically change of storage modulus and tan was observed when formation of co-
continuous structure occurring in the blends. Furthermore, the mechanical behavior of
PVDF/ENR-50 blends, confirmed by tensile testing, revealed that the blends containing
20 wt% of ENR-50 exhibited very significant low deformation. The ENR-50 played a major
role in increasing the elongation at break of the blend. However, the tensile strength is
decreased with increasing ENR-50 content. The crystalline temperature (Tc) and melting
temperature (Tm) of PVDF in the blend were also studied. The addition of ENR-50 into
PVDF was found to increase Tc and crytallinity of PVDF in the blend while ENR-50 did
not influence on the Tm. All blends showed two relaxation peaks which correspond to the
glass transition temperature of PVDF and ENR-50. However, maximum positions of
relaxation peaks of PVDF and ENR-50 moved toward higher and lower temperatures,
respectively. This generally occurred in the blends with partial compatibility. The localization of BT in PVDF/ENR-50 simple blend and dynamically cured blend
was also studied by using the blends with the blend ratios of 80/20 and 50/50. In a simple
blend, it was found that the BT particles tended to accumulate in ENR-50, which has
lower viscosity. This selective localization of BT leads change of the viscosity ratio and
morphology of the blends. In dynamically cured blend, the BT was also localized in ENR-

50 phase in the blend with addition of BT before dynamic vulcanization (BDV method).
On the other hand, the BT particles were selectively localized at interface and in PVDF
phase in the blend with addition of BT after dynamic vulcanization (ADV method). This
causes an increase in Young’s modulus and storage modulus of the blends. The variation
of BT loadings in dynamically cured PVDF/ENR-50 blend has also been studied. It was
found that increment of storage modulus was more pronounced in the 50/50 compared
with 80/20 PVDF/ENR-50 TPV composites. Meanwhile, all blends showed maximum
value of elongation at break at 12 vol% of BT. As may be expected, the dielectric
permittivity and dielectric loss factor of PVDF/ENR-50 filled with BT increased with
increasing BT content, which is a typical trend of the ceramic filled polymer composite.
Furthermore, the blend with high PVDF proportion showed higher permittivity than the
blend with low PVDF proportion and BT/ENR-50 composite at the same BT loading.
Hence, dynamically cured blend filled with BT is good candidate for high permittivity
composite which could be possible for apply in industries uses.
The natural rubber composites with high permittivity were successfully prepared
using barium titanate as filler in dynamically cured PVDF/ENR-50 blends. This type of
composites exhibit high permittivity and low dielectric loss, which may suitable for energy
storage applications like a capacitor because it is obviously wish to maximize permittivity
and minimize the dielectric loss.
APPENDIX

APPENDIX A Published Article in Adv. Mat. Res. 626: 71–74 (2013)
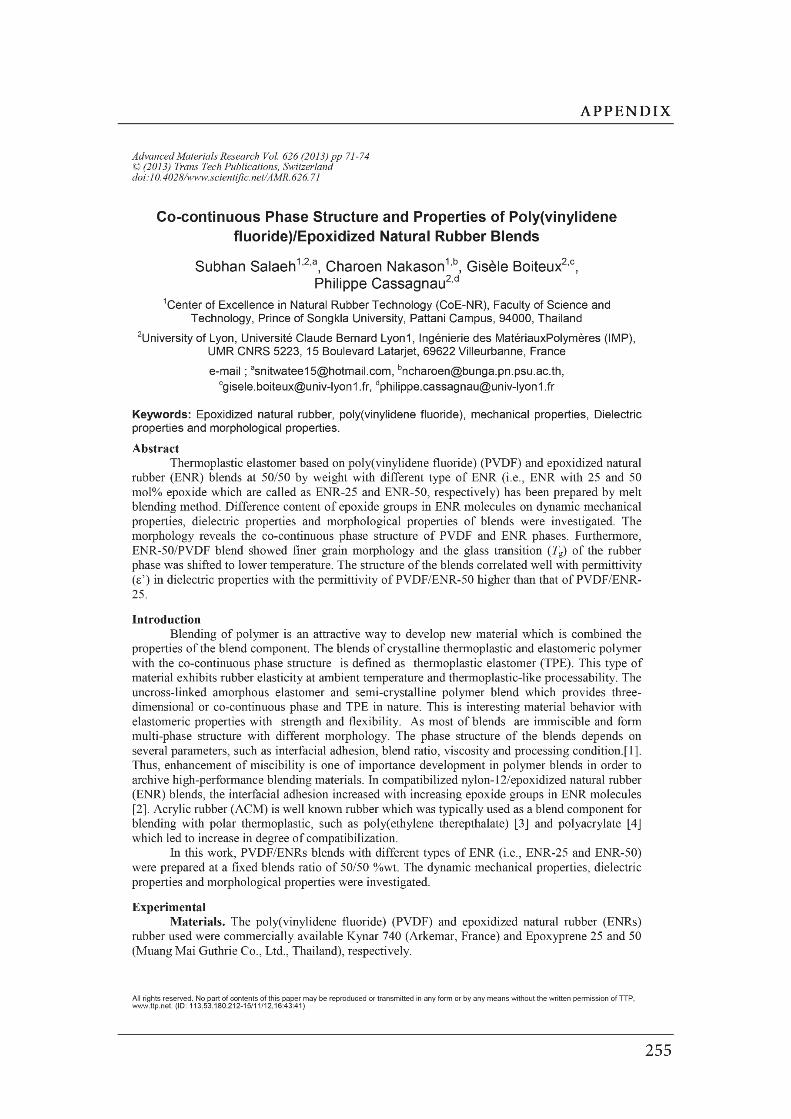
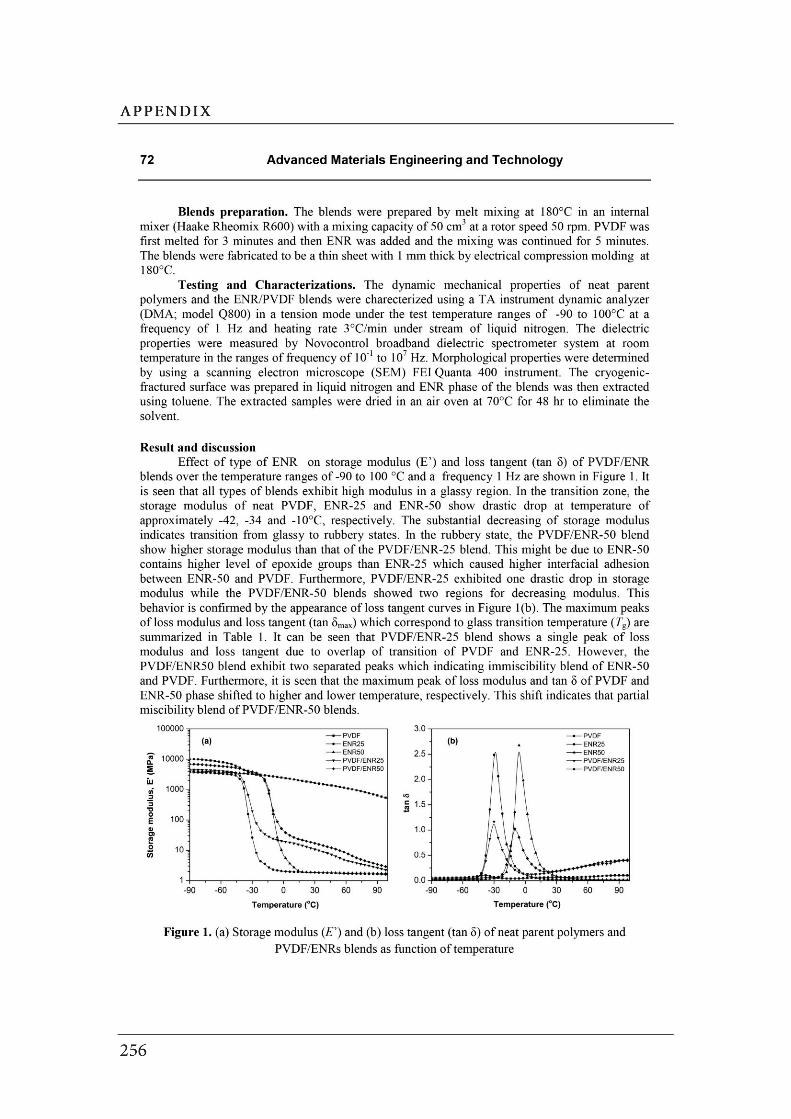
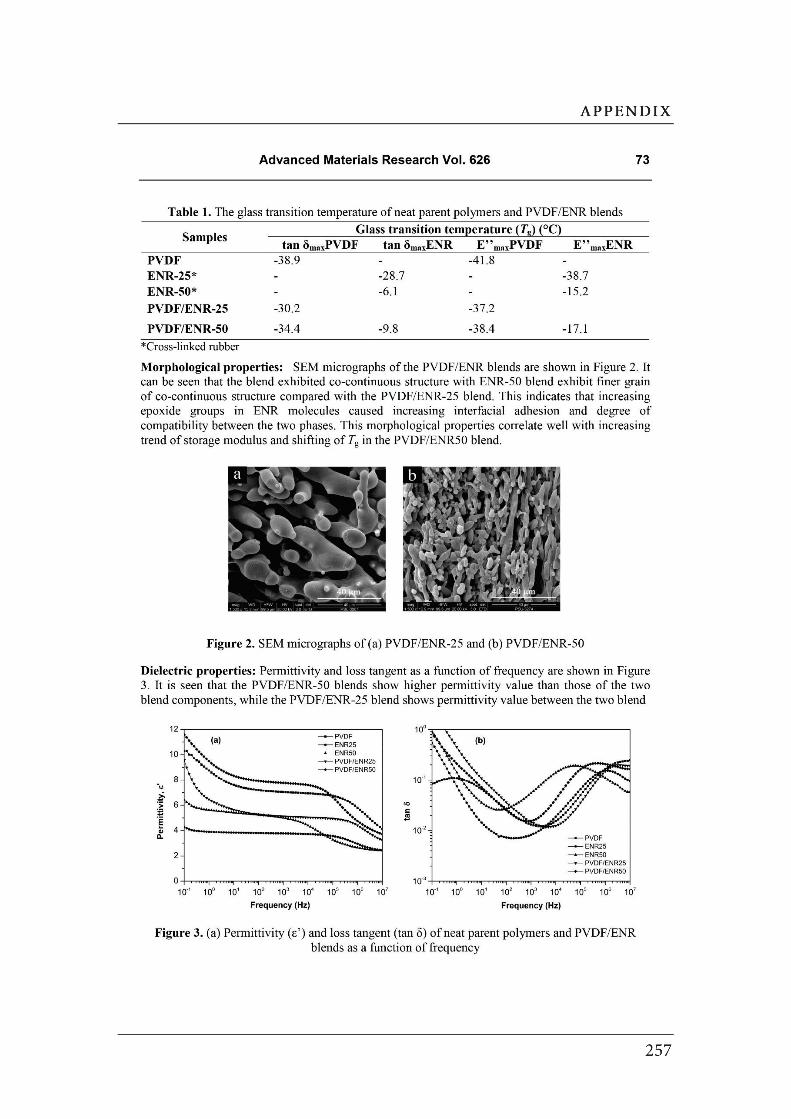

APPENDIX B Accepted article in Int. J. Appl. Ceram. Technol. In press (2013)

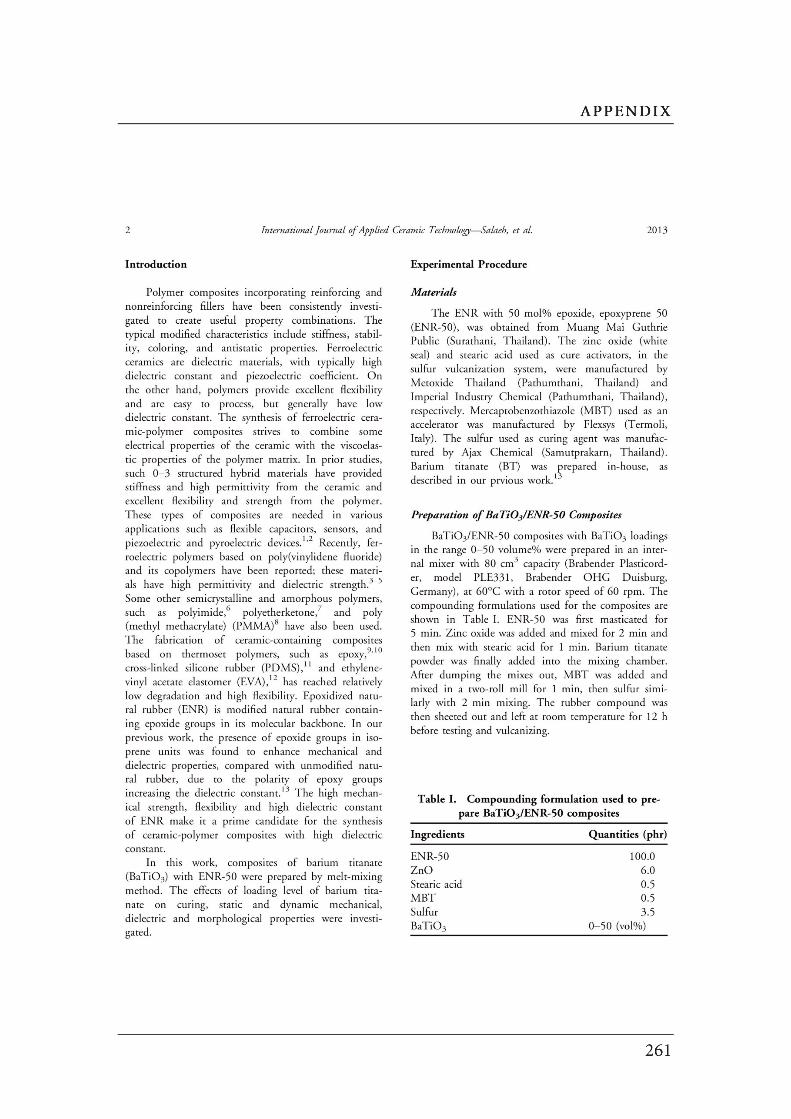
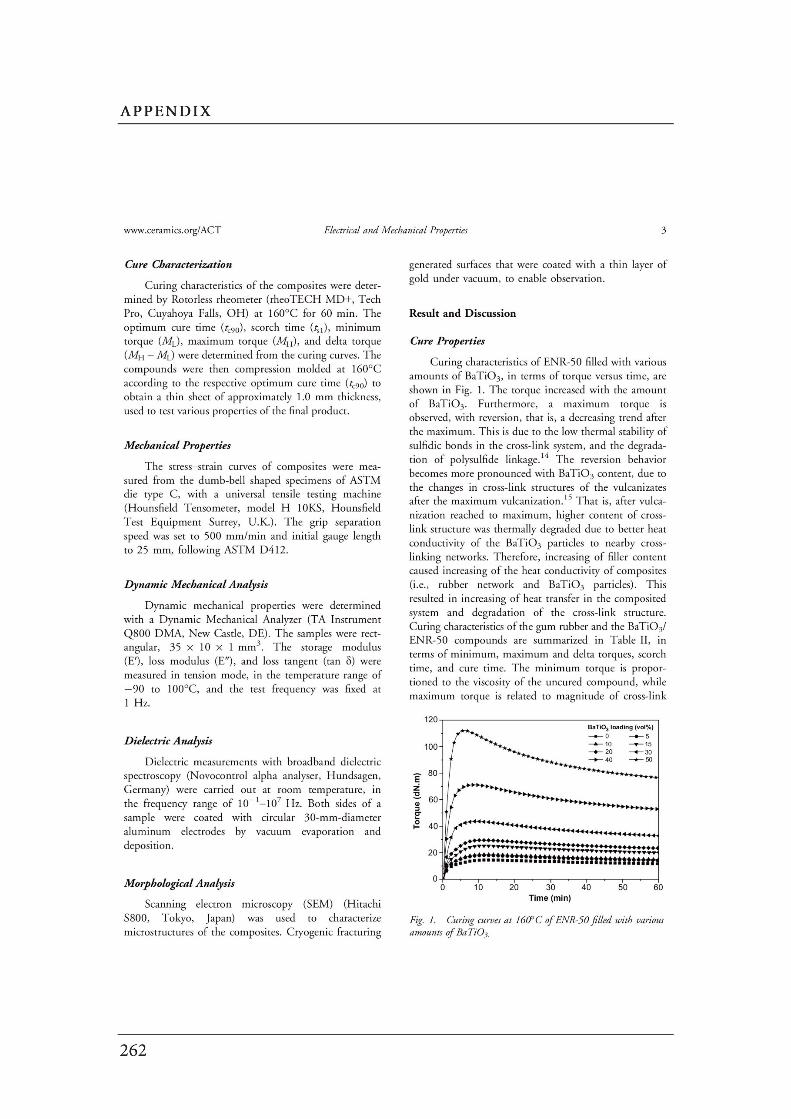
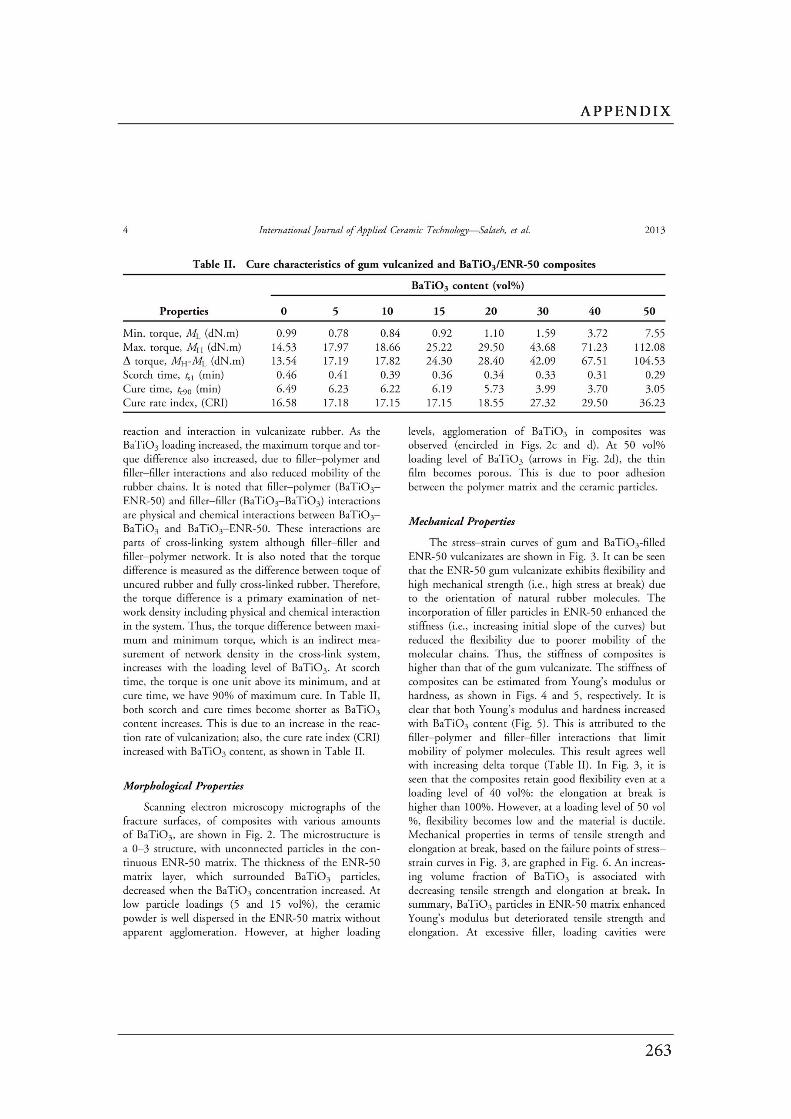


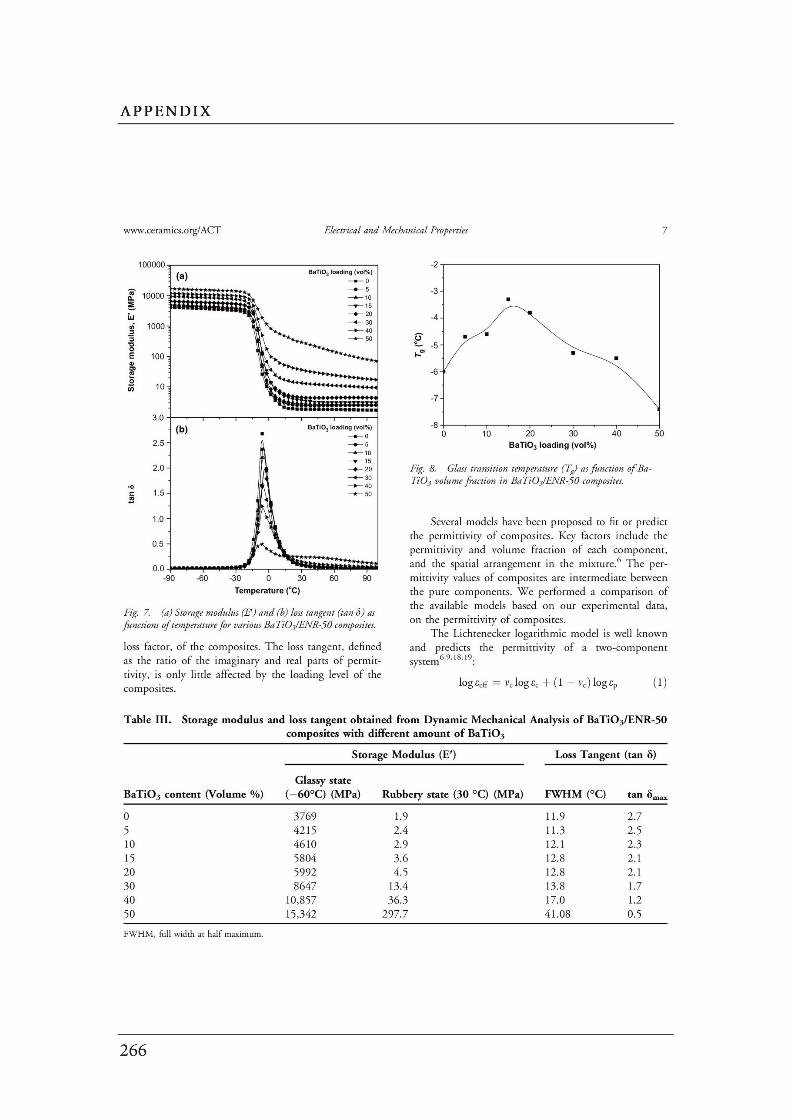
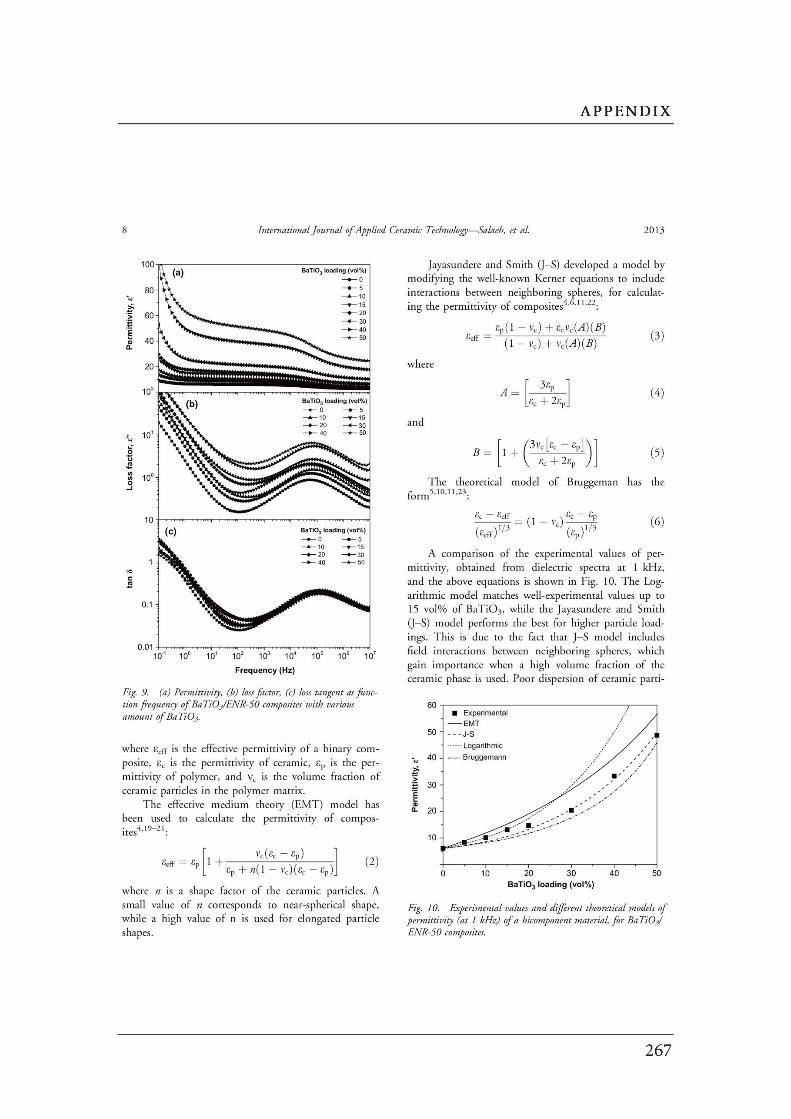
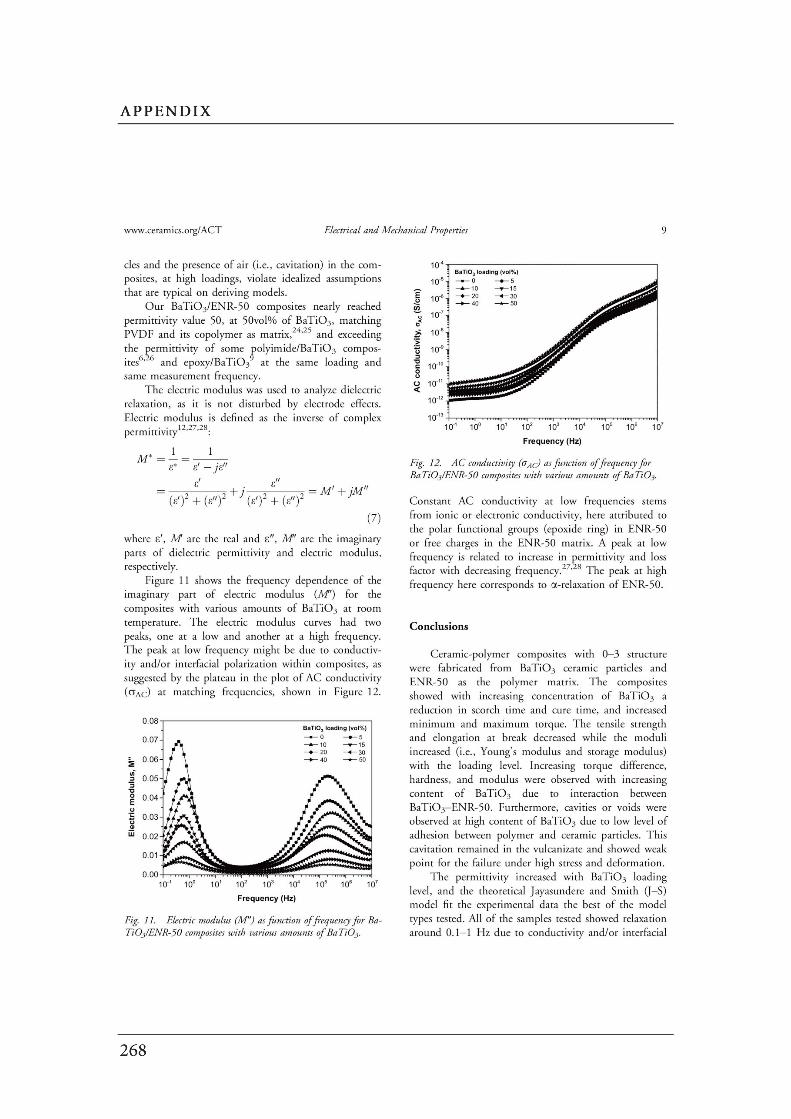

APPENDIX C Published Article in Adv. Mat. Res. 844: 97-100 (2014)

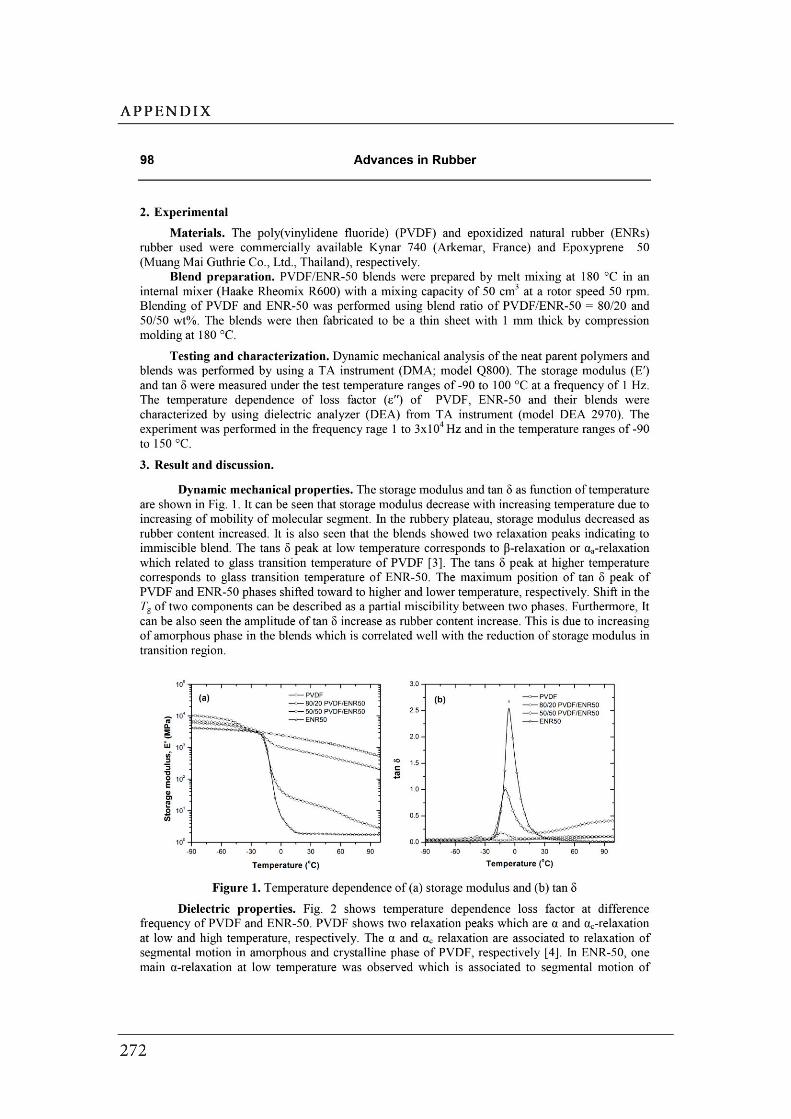

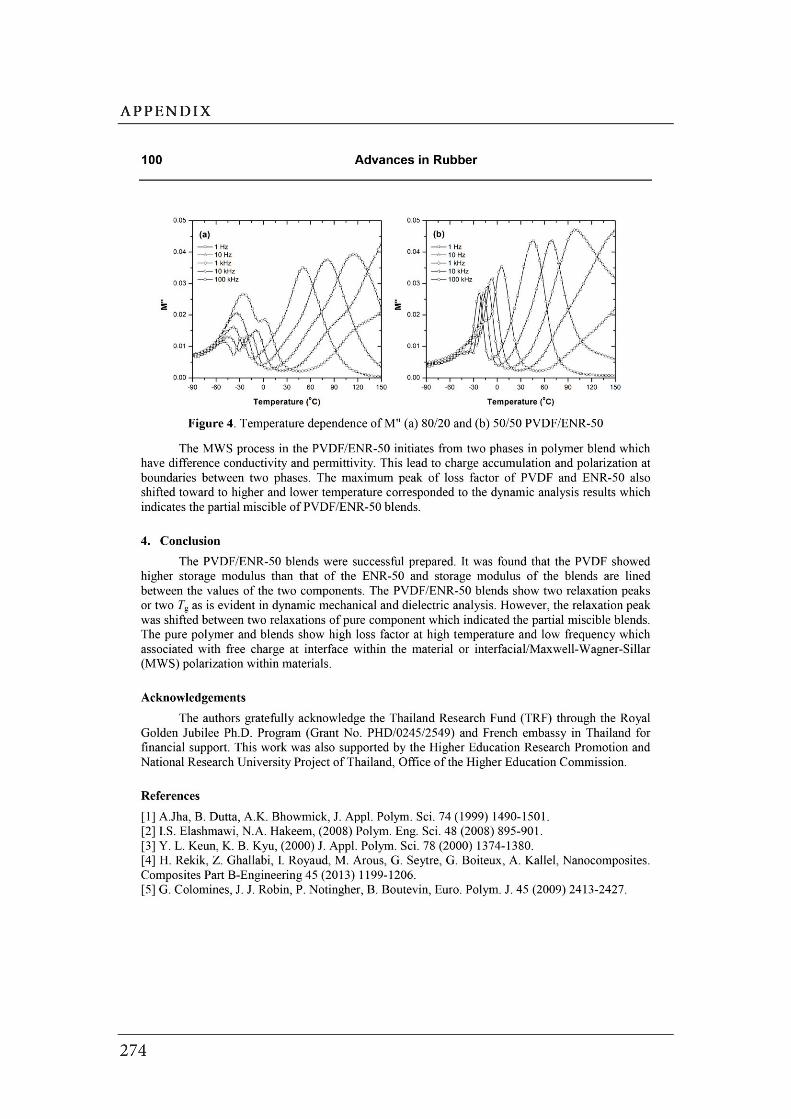
CURRICULUM VITAE
Name Mr. Subhan SALAEH
Student ID 5120330101
Educational attainment
Degree Name of Institution Year of Graduation
B.Sc (Rubber Technology) Prince of Songkla University 2004-2008
First Class Honors
Scholarship awards during enrolment
1. The Thailand Research Fund (TRF)-the Royal Golden Jubilee (RGJ) Ph.D.
Program (Grant No. PHD/0245/2549)
2. French Government via the Embassy in Thailand.
3. The Graduate school, Prince of Songkla University, Pattani.
List of publications and communications
Publications:
1. Salaeh, S., Boiteux, G., Cassagnau, P., Nakason, C. Conductive Elastomer
Composites with Low Percolation Threshold based on Carbon black/Epoxidized
Natural Rubber Composites and Their Mechanical Properties. Carbon (submitted).
2. Salaeh, S., Boiteux, G., Cassagnau, P., Nakason, C. Phase Development and
Electrical Properties of Poly(vinylidene fluoride)/Epoxidized Natural Rubber Blends. Polymer (submitted).
3. Salaeh, S., Boiteux, G., Gain, O., Cassagnau, P., Nakason, C. Dynamic Mechanical
and Dielectric properties of Poly(vinylidene fluoride) and Epoxidized Natural Rubber
Blends. Adv. Mat. Res. 844 (2014) 97.
4. Salaeh, S., Boiteux, G., Cassagnau, P., Nakason, C. Flexible 0-3 Ceramic-Polymer
Composites of Barium Titanate and Epoxidized Natural Rubber. Int. J. Appl. Ceram.
Technol. (2013) (In press).
5. Salaeh, S., Nakason, C., Boiteux, G., Cassagnau, P., Co-continuous Phase
Structure and Properties of Poly(vinylidene fluoride)/Epoxidized Natural Rubber
Blends. Adv. Mat. Res. 626 (2013) 71.
6. Salaeh, S., Nakason, C. Influence of Modified Natural Rubber and Structure of
Carbon Black on Properties of Natural Rubber Compounds. Polym. Composite. 33
(2012) 489.
7. Salaeh, S., Muensit, N., Bomlai, P., Nakason, C. Ceramic/natural rubber
composites: influence types of rubber and ceramic materials on curing, mechanical,
morphological, and dielectric properties. J. Mater. Sci. 46 (2010) 1723.
8. Nakason, C., Worlee, A., Salaeh, S. Effect of vulcanization systems on properties
and recyclability of dynamically cured epoxidized natural rubber/polypropylene
blends. Polym.Test. 27 (2008) 858.
Communications:
1. Salaeh, S., Boiteux, G., Gain, O., Cassagnau, P., Nakason, C. Morphology and
Molecular Mobility of a Novel Thermoplastic Elastomer based on Poly(vinylidene
fluoride) and Epoxidized Natural Rubber Blends. The 2014 IUPAC World Polymer
Congress (MACRO 2014), 6-11 July 2014, Chiang Mai International Convention &
Exhibition Centre, Chiang Mai, Thailand. (Poster presentation)
2. Salaeh, S., Boiteux, G., Cassagnau, P., Nakason, C. Miscibility and Phas
Development of Poly(vinylidene fluoride) and Epoxidized Natural Rubber Blends.
RGJ-PhD Congress, 28-30 May 2014, Jomtien Palm Beach Resort, Pattaya,
Thailand. (Poster presentation)
3. Salaeh, S., Boiteux, G., Gain, O., Cassagnau, P., Nakason, C. Dynamic Mechanical
and Dielectric Properties of Poly(vinylidene fluoride) and Epoxidized Natural Rubber
Blends. Oral presentation; The First Asia Pacific Rubber Conference (APRC2013),
5-6 September 2013, Surat Thani, Thailand. (Oral presentation)
4. Salaeh, S., Nakason, C., Boiteux, G., Tamet, T., Cassagnau, P. Development of
phase structure in thermoplastic elastomer based on poly(vinylidene
fluoride)/epoxidized natural rubber blends and their properties. The 28th Polymer
Processing Society (PPS-28), 11-15 December 2012, Pattaya, Thailand. (Oral
presentation)
5. Salaeh, S., Nakason, C., Boiteux, G., Cassagnau, P. Co-continuous Phase
Structure and Properties of Poly(vinylidene fluoride)/Epoxidized Natural Rubber
Blends. The International Conference on Advanced Material Engineering &
Technology, 28-29 November 2012, Penang, Malaysia. (Oral presentation)
6. Salaeh, S., Nakason, C., Boiteux, G., Cassagnau, P. Relaxation Behaviour of
Poly(vinylidene fluoride) and Epoxidized Natural Rubber Blends. Broadband
Dielectric Spectroscopy (BDS) and its Application. 3-7 September 2012, Leipzig,
Germany. (Poster presentation)
7. Salaeh, S., Nakason, C., Boiteux, G., Cassagnau, P. Structure-property relation of
thermoplastic elastomer poly(vinylidene fluoride) (PVDF)/epoxidized natural rubber
(ENR) blends. The 5th International Conference on Polymer Behavior (ICPB5) -
Multiphysics Approaches for the Behavior of Polymers and Polymer-based
Nanomaterials. 15-18 October 2012, Aveiro, Portugal. (Poster presentation).
8. Salaeh, S., Nakason, C. Mechanical, Mophological and Electrical Properties of
Ceramic/Natural Rubber Composites. The 12th International Seminar on Elastomers
and 2nd Thailand-Japan Rubber Symposium. 8-11 March 2010, Cha-am, Thailand.
(Oral presentation).


