Embed Size (px)
Citation preview
HAL Id: hal-01914248https://hal-amu.archives-ouvertes.fr/hal-01914248
Submitted on 29 Mar 2019
HAL is a multi-disciplinary open accessarchive for the deposit and dissemination of sci-entific research documents, whether they are pub-lished or not. The documents may come fromteaching and research institutions in France orabroad, or from public or private research centers.
L’archive ouverte pluridisciplinaire HAL, estdestinée au dépôt et à la diffusion de documentsscientifiques de niveau recherche, publiés ou non,émanant des établissements d’enseignement et derecherche français ou étrangers, des laboratoirespublics ou privés.
Processes controlling silicon isotopic fractionation in aforested tropical watershed : Mule hole critical zone
observatory (Southern India)Jean Riotte, Jean-Dominique Meunier, Thomas Zambardi, Stephane Audry,
Doris Barboni, Krishnamurthy Anupama, Srinivasan Prasad, JérômeChmeleff, Franck Poitrasson, Muddu Sekhar, et al.
To cite this version:Jean Riotte, Jean-Dominique Meunier, Thomas Zambardi, Stephane Audry, Doris Barboni, et al..Processes controlling silicon isotopic fractionation in a forested tropical watershed : Mule hole criticalzone observatory (Southern India). Geochimica et Cosmochimica Acta, Elsevier, 2018, 228, pp.301 -319. �10.1016/j.gca.2018.02.046�. �hal-01914248�
1
Processes controlling silicon isotopic fractionation in a forested tropical watershed:
Mule Hole Critical Zone Observatory (Southern India)
Jean Riotte1,2*
, Jean-Dominique Meunier3, Thomas Zambardi
1, Stéphane Audry
1, Doris
Barboni3, Krishnamurthy Anupama
4, Srinivasan Prasad
4, Jérôme Chmeleff
1, Franck
Poitrasson1, Muddu Sekhar
2,5, Jean-Jacques Braun
1
(*) Corresponding author: [email protected]
1- Géosciences Environnement Toulouse (Université Paul-Sabatier, IRD, CNRS), 14 avenue
E. Belin, 31400 Toulouse, France
2- Indo-French Cell for Water Sciences, IRD-Indian Institute of Science, Bangalore 560012
India
3- Aix Marseille Univ, CNRS, IRD, Coll France, CEREGE, 13545 Aix-en-Provence cedex
04, France
4- French Institute of Pondicherry PB 33, UMIFRE 21 CNRS-MAEE / USR 3330,
Pondicherry 605001 India
5- Civil Engineering Department, Indian Institute of Science, Bangalore 560012 India
Abstract
Assessing the dynamics of the silica cycle in the critical zone remains challenging,
particularly within the soil, where multiple processes are involved. To improve our
understanding of this cycle in the Tropics, and more specifically the role played by
vegetation, we combined elemental Si mass balance with the 30
Si signatures of the
compartments involved in the water-plant-rock interactions of a tropical forested watershed,
Mule Hole (Southern India). To accomplish this, we analysed (1) the 30
Si values of present-
day litter phytoliths from tree leaves and grass, as well as soil amorphous silica (ASi); (2) the
Si isotope fractionation induced by phytolith dissolution; (3) the silicon mass balance inferred
from isotopes at the soil-plant scale; and (4) the consistency between water sources and the
30
Si signatures in the ephemeral stream.
The 30
Si values of present-day litter phytoliths and soil ASi vary within a narrow range of
1.10 to 1.40 ‰ for all samples, but two deep vertisol samples which likely trapped phytoliths
from different vegetation growing under more humid conditions, as indicated by pollen
analysis. A homogeneous signature of litter is a minimum condition for using 30
Si as a
2
proxy for the litter/phytolith source of Si. However, litter-ash dissolution experiments
demonstrate that the incipient dissolution of phytoliths fractionates Si isotopes, with the
preferential dissolution of 28
Si over 30
Si yielding 30
Si values as low as -1.41 ‰. Values close
to the whole-sample signatures, i.e., above 1 ‰, were recovered in the solution after a few
hours of water-ash interaction. At the soil-plant scale, the average 30
Si value of soil-
infiltrating solutions is slightly lighter than the average phytolith signature, which suggests
phytoliths as the source of soil dissolved Si. The isotopic budget of dissolved Si within the
soil layer, which was obtained based on previous elemental fluxes, is imbalanced.
Equilibrating the isotopic budget would imply that up to 4100 mol ha-1
yr-1
of silica is taken
up by vegetation, which is almost twice as large as that initially estimated from the elemental
budget. The additional Si flux taken up, and likely stored in woody stems, was estimated
assuming that Si isotopes followed a steady-state model for the whole Si plant uptake and
then followed a Rayleigh model once in the plants. The 30
Si value of the additional Si flux
taken up should be close to 0 ‰, i.e., enriched in light Si isotopes compared to the litter. If
steady-state conditions apply, the source could correspond to soil ASi dissolution or deep
(saprolite) root uptake. At the outlet of the watershed, the stream exhibits low 30
Si values
(0.28 to 0.71 ‰) during peak flows and high 30
Si values (1.29 to 1.61 ‰) during the
recessions at the end of the rainy season. Heavy 30
Si signatures are consistent with the
expected domination of seepage at the end of floods. The light 30
Si values during peak flow
are slightly lower than the overland flow signature and reflect either a sampling bias of
overland flow or a minor but significant contribution of another Si source within the stream,
possibly the partial dissolution of phytoliths from the suspended load, with slight isotopic
fractionation. This study confirms that vegetation controls the silicon cycle in this dry tropical
forest. It also shows that silicon isotopes yield a better grasp of the mass balance and sources
and potential mechanisms involved than the consideration of only silicon concentrations.
However, this proxy still relies on working hypotheses, notably steady-state and/or Rayleigh
fractionation models, which need to be confirmed in further studies.
1 Introduction
The biological cycle of silicon has received increasing attention in the last decade because it
mobilizes large amounts of silica, particularly in the Tropics, where rivers contribute 74% of
the dissolved flux to the ocean (Martin & Meybec, 1979; Tréguer and De La Rocha, 2013).
3
For example, in the Amazonian forest, the silica flux brought to the soil by litterfall (as
phytoliths) is four times more important than the silica flux exported by the river (Lucas et al.,
1993). Similarly, at Reunion Island, Meunier et al. (2001) found that the silica annually
recycled by litter was similar to the chemical weathering flux estimated by Louvat & Allègre
(1997). The high solubilities of phytoliths and other amorphous silica particles in soils make
them potentially significant contributors to the solute silica budget within the soil (Alexandre
et al., 1997; Fraysse et al., 2010; Cornelis and Delvaux, 2016) and possibly to rivers. The
biological control of silica fluxes in river systems can be observed in some streams, such as in
Hawaii, using the Ge/Si ratio (Derry et al., 2005); more recently, this was observed in the
experimental watershed of Mule Hole (Southern India) using combined solute mass balance at
the soil-plant scale and hydrological modelling (Riotte et al., 2014a).
Because silicon isotopes are fractionated during interactions between water, soil and plants,
the isotopic signature (30
Si values) of these compartments has the potential to trace the origin
of the silica fluxes exported from watersheds (e.g., Cardinal et al., 2010; Opfergelt and
Delmelle, 2012; Hughes et al., 2013). The fractionation of silicon isotopes is significant in
natural environments, particularly in the various compartments of the Critical Zone (i.e.,
Earth’s surface zone, encompassing groundwater, soils, rivers and vegetation), with values up
to 12‰ (see reviews in Opfergelt and Delmelle, 2012, Frings et al., 2016). The lightest Si
isotopic compositions are found in the silicification zones of aquifers (30
Si = -5.7‰, Basile-
Doelsch et al., 2005), while the heaviest ones are observed in some vegetation components
(30
Si = +6.1‰, Ding et al., 2005).
The use of30
Si as a tracer of biogeochemical cycling in watersheds is complex. Both the
formation of clay minerals during weathering and biological uptake result in the preferential
incorporation of the light 28
Si isotope relative to the heavier 29
Si and 30
Si isotopes (see review
in Poitrasson, 2017). The silicon isotope fractionation factors (expressed as ∆30
Si rather than
using the 30Si notation, see Poitrasson, 2017) between parent and authigenic minerals are
therefore negative. They range from -1‰ for the adsorption of Si onto ferrihydrite
(Delstanche et al., 2009) to -1.5 and -2‰ for the incorporation of Si into allophane and
kaolinite (Ziegler et al., 2005; Georg et al., 2007). Some of the mechanisms controlling this
fractionation factor during water-mineral interactions were recently identified through
laboratory experiments. During the abiotic precipitation of amorphous silica (further referred
to as ASi), Geilert et al. (2014) observed that the isotopic fractionation between precipitated
and dissolved Si decreased with increasing temperature from -2.1‰ at 10°C to almost 0‰
4
beyond 50°C. Geilert et al. (2014) suggested that the effect of temperature on isotopic
fractionation is “system-dependent”, i.e., indirect and primarily linked to the saturation level
of the solution, changes in reactive surface area and the flow regime. Although the silica
saturation levels of soil pore water can be easily estimated in natural systems, assessing soil
reactive surface areas and flow regimes remains challenging.
The use of 30
Si as a tracer for studying the silica cycle in vegetation is also not
straightforward for two reasons. First, the range of 30
Si values in worldwide plants, as well
as in the phytoliths they produce, exceeds 8 ‰ (Frings et al., 2016), which means that cycling
through plants does not induce a specific isotopic signature. However, if the 30
Si signatures
of all plants in a given ecosystem are “system-dependent”, they should vary within a narrow
range, as observed in a boreal forest (Engström et al. 2008). In this case, 30
Si signatures
could be used to trace the contribution of vegetation to the silica cycle in ecosystems and river
systems, providing that the “vegetation signature” is distinct from the signature induced by
silicate weathering (i.e., the dissolution of primary minerals and the precipitation of clay
minerals) or adsorption/desorption processes. Second, significant isotopic fractionation also
occurs within plant compartments, with large inter-specific variations. For instance, Ding et
al. (2005) reported a large increase of 30
Si within rice plants, from -1 ‰ in roots to +6 ‰ in
grain, while Opfergelt et al. (2006) observed a limited increase of 0.26 ‰ from pseudostems
to leaves in banana plants. According to these authors, the magnitude of isotopic fractionation
within a plant is related to the intensity of evapotranspiration, which, to some extent, is also a
“system-dependent” parameter.
In the Mule Hole watershed (which has been monitored as a Critical Zone Observatory (CZO)
since 2003), South India, the prominent role of vegetation in the water cycle and the
biogeochemical cycle has previously been demonstrated (Ruiz et al., 2010; Riotte et al.,
2014a, b). For instance, evapotranspiration accounts for at least 80% of the water balance and
controls the decennial fluctuation of the water stock in the vadose zone, as well as runoff and
groundwater discharge (Maréchal et al., 2009; Ruiz et al., 2010). In addition, the silica flux
annually recycled through the litter compartment represents 10 to 15 times the dissolved silica
flux exported by the stream and dominates the solute mass balance at the soil-plant scale.
However, assessing the respective fluxes of plant uptake and silicate weathering within the
soil layer requires more constraints than solute mass balance at the soil-plant scale.
By taking advantage of the decennial hydro-geochemical monitoring of the Mule Hole
watershed and subsequent recent elemental budgeting (Riotte et al., 2014a, b), the objective of
5
the present study is to describe the processes affecting silica during water-soil-plant
interactions and the impact of these processes on Si mass balance using the silicon isotopic
signatures (30
Si) of the dissolved and solid water-soil-plant compartments. This study also
represents an opportunity to assess the potential and limitations of 30
Si as a tracer of silica
sources at both the soil-plant and watershed scales. First, the morphotypes and isotopic
compositions of amorphous silica particles (ASi) (i.e., phytoliths) are characterized and
compared with those of fresh litter, soils and stream suspended loads. Second, the 30
Si
signature of ASi dissolution is assessed from environmental samples (i.e., overland flow
water, which gathers water from canopy and forest floor interactions) and batch leaching
experiments. Third, solute isotopic budgets are carried out at the soil-plant and watershed
scales to assess the identified processes and sources controlling the silica cycle in this forested
watershed, including the hourly and seasonal 30
Si fluctuations in the stream.
2 Environmental settings
The experimental watershed of Mule Hole, which has an area of 4.1 km2, is located at
11°430N–76°260E within the Cauvery Basin, on the Deccan Plateau, in the subhumid zone of
the climatic gradient induced by the Western Ghats. The bedrock is composed of 85 %
Precambrian peninsular gneiss (metasediments, Shadakshara Swamy et al., 1995) containing
quartz, oligoclase, sericite, biotite and chlorite as major minerals. In Mule Hole, the average
regolith consists of 15-m-thick immature saprolite and 2-m-thick soils (Braun et al., 2009).
The soil comprises a ferralsol-vertisol system (Barbiero et al. 2007, 2010). The alternation of
subhumid and semi-arid conditions at Mule Hole during at least the Quaternary (Violette et
al., 2010a) limited the intensity of chemical weathering and allowed the preservation of few
primary minerals, such as Na-plagioclase and sericite, in soils. The secondary mineral
assemblages in the ferralsol profile comprise kaolinite and Fe-oxyhydroxides, and those in the
vertisol areas comprise a mix of kaolinite, smectite, Fe-oxyhydroxides and relics of pedogenic
carbonates (Barbiero et al., 2010, Violette et al., 2010a). Four associations of soils and
bedrocks were found and defined (Fig. 1): (A) ferralsol on gneiss, which is the most abundant;
(B) vertisol on amphibolite; (C) shallow ferralsol on gneiss; and (D) vertisol on gneiss in
valley bottoms.
The annual rainfall at Mule Hole has varied from 800 to 1500 mm/yr over the last 35 years,
with an average value of 1100 mm/yr. The hydrological modelling of the watershed (Violette
et al., 2010b) and End-Member Mixing Analysis (Riotte et al., 2014a; Audry et al., 2014)
6
indicate that the stream flow is mostly composed of overland flow (> 90 %), i.e., rainwater
having interacted with the canopy and then at the ground surface with decaying litter. Soil
pore water contributes the last 10% during flood recessions, when soils are saturated at the
end of monsoon season.
The vegetation cover is a dry deciduous forest (Barbiero et al., 2007), with the Anogeissus –
Tectona - Terminalia (ATT) facies (70% of the watershed area) developed principally on
ferralsols and less frequently on vertisols. Shallow ferralsols are also covered by Shorea trees
(Shorea Roxb. ex C.F.Gaertn), and vertisols are covered by Ceriscoides turgida (Hook.f.)
Tirveng. Litter fall occurs within a short period of time after monsoon season, typically from
December to February.
The isotopic budgets of the present study rely on the solute mass balances recently performed
at two spatial scales in order to understand the biogeochemical processes and their impact on
the solute fluxes exported from the watershed: (1) those at the soil-plant profile scale,
assessed using the hydrological modelling output for water fluxes and the chemical
compositions of rainfall, throughfall, overland flow and soil pore water samples (Riotte et al.
2014a; Braun et al., 2017); and (2) those at the watershed scale, assessed using the
hydrological modelling output for water fluxes and the chemical compositions of the stream
(Violette et al., 2010b, Maréchal et al. 2011).
3 Materials and methods
3.1 Water, soil, bedrock and vegetation sampling
The water samples analysed in this study for their 30
Si values, namely, stream water,
overland flow, soil porewater and groundwater, were analysed during the broader, long-term
monitoring of the Mule Hole watershed, which is an environmental observatory (BVET, see
https://mtropics.obs-mip.fr/experimental-tropical-watersheds-2/) (Fig. 1). The sampling and
storage protocols are described in Riotte et al. (2014a). Stream water was sampled on an
hourly basis, and groundwater was sampled on a monthly basis. The stream samples selected
for 30
Si measurements (n=11) were chosen in order to cover both hourly and seasonal
fluctuations in the stream composition in 2004 and 2005 (see Electronic Annex EA-1). In
March 2004, the litter was burnt by a forest fire during the dry season. The two first short
storms that occurred a few days later (i.e., in April and May, each with a 3-hour duration)
exhibited particularly high silica concentrations (Audry et al., 2014) and were thus selected to
7
assess the signal of litter ash leaching. One major storm (with a 48-hour duration) that
occurred in the middle of the 2004 monsoon season, and is thus more representative of the
hydrological functioning of the watershed, was also analysed for its 30
Si composition. In
2005, stream storm samples were collected during the first short storm in the summer season
(April) and at the end of the monsoon season, when the soil layer was saturated (November).
Overland flow samples (n=7) were collected during the 2009 monsoon season on the ferralsol
and vertisol/ferralsol transition (see below and Riotte et al., 2014a for sampling setup); each
sample integrated overland flow events for two to three weeks. Deep groundwater samples
were collected at 4 locations in 2005: 2 were collected close to a transect crossing the outlet,
and 2 others were collected along the crest line (P5 in gneiss, P6 in amphibolite). Soil pore
water samples were collected in vertisol seepage within the streambed in 2004 (n=5) and in
ferralsol/vertisol transition seepage in 2009 and 2010 (n=4). All water samples were filtrated
in the laboratory soon after collection (Sartorius® cellulose acetate, 0.22-µm membrane).
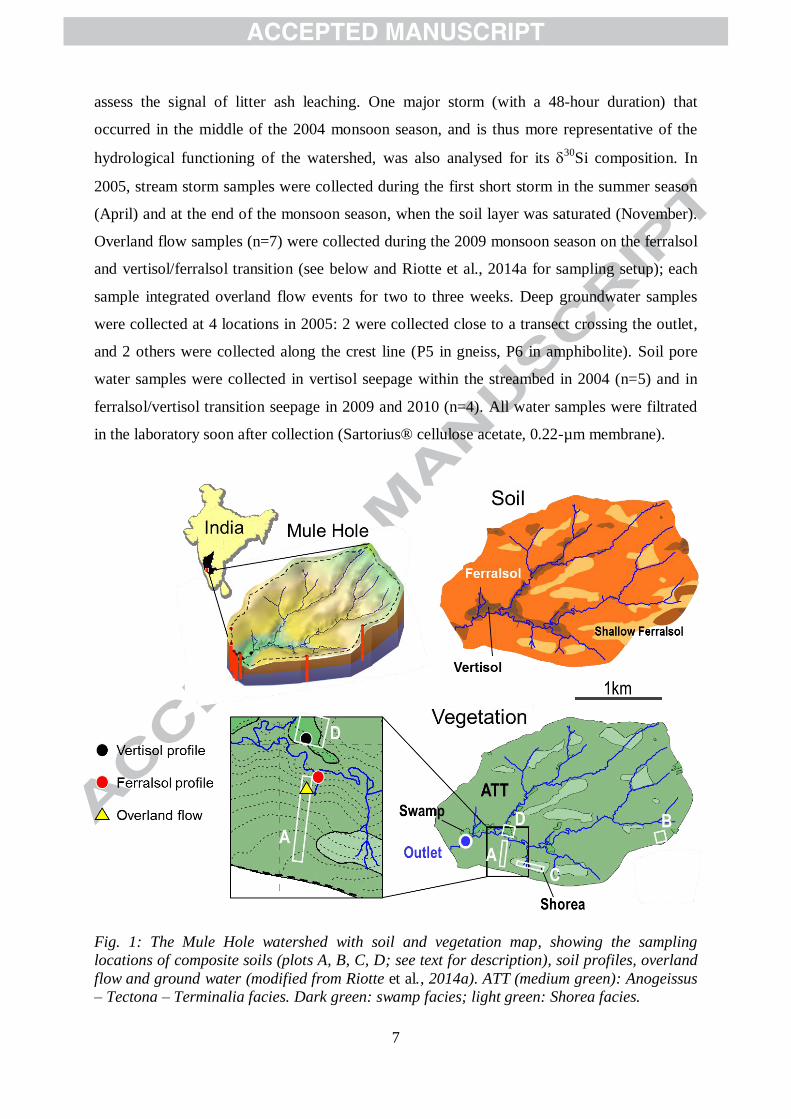
Fig. 1: The Mule Hole watershed with soil and vegetation map, showing the sampling
locations of composite soils (plots A, B, C, D; see text for description), soil profiles, overland
flow and ground water (modified from Riotte et al., 2014a). ATT (medium green): Anogeissus
– Tectona – Terminalia facies. Dark green: swamp facies; light green: Shorea facies.
8
Soil samples were selected from two well-documented soil profiles, one in ferralsol (5 depths)
and one in vertisol (4 depths). Their mineralogy, granulometry, cation exchange capacity and
major and trace element contents are summarized in Electronic Annex EA-2 and given in
detail in Violette et al. (2010a and 2010b). Composite surface soils are composed of 36 to 42
samples collected between depths of 0 and 10 cm within a one-hectare plot of each soil and
bedrock association (Fig. 1): (A) ferralsol on gneiss, (B) vertisol on amphibolite, (C) shallow
ferralsol on gneiss and (D) vertisol on gneiss. Approximately 100 g of each soil sample was
sieved with water to sizes of 2 mm and 50 µm. The < 2 mm fraction was considered to
represent the bulk soil. The < 2 µm fraction was recovered from the < 50 µm fraction after the
decantation of the coarse particles according to Stokes’ law. Bulk soils and the < 2 µm
fraction were further dried and powdered with an agate mortar. A fresh bedrock sample was
collected at a depth of 50 m as drilling cuttings when the “P5” piezometer was drilled. Its
chemical composition corresponds to the average gneiss composition estimated by Braun et
al. (2009).
Leaf and herbaceous litters were collected in large bags during the dry seasons of 2009 and
2010 from the dominant soil/vegetation configuration in the watershed, i.e., ATT vegetation
developed on ferralsol. Litter samples consisted of A. latifolia, T. grandis and T. crenulata
leaves and T. triandra grass. The litter of T. grandis was picked up as dry leaves on the
ground in January and March 2009 and 2010. The leaves of A. latifolia and T. crenulata,
which are more difficult to identify once they have fallen, were harvested on trees during their
senescence in January. T. triandra was also cut in January, priori to senescence. All litter
samples were dried at 70°C and powdered in an agate mortar (using the protocol detailed in
Riotte et al., 2014a). The silica content of A. latifolia leaves was very low, i.e., 0.04 % Si dry
weight (DW), which is close to the detection limit (Riotte et al., 2014a). Because this species
was unlikely to contribute to silica cycling, 30
Si analyses were restricted to the three species
containing measurable silica, i.e., T. triandra grass (1.88 % Si DW), T. grandis (1.97 % Si
DW) and T. crenulata (0.4 % Si DW) leaves.
3.2 Assessment of 30Si during ASi dissolution
Assessing the 30
Si value of ASi dissolution is of primary importance for tracing the origin of
silica in rivers and assessing the consistency between elemental and isotopic mass balances.
Two approaches were used in this study, namely, one onsite approach and one experimental
approach.
9
The onsite approach relied on the dominant contribution of ASi dissolution to overland flow
(Riotte et al., 2014a). Overland flow (n=7) samples were collected close to the streambed at
the ground surface using a PVC pipe connected to a buried can during the 2009 and 2010
monsoon seasons. Each collector drained an area of approximately 100 m2 and integrated
several weeks of intermittent flow. The chemical compositions of overland flow and soil pore
water are given in Riotte et al. (2014a). One advantage of using overland flow is that each
sample integrates a significant area (~100 m2) and several ephemeral flow events. The limit of
this approach is the long interaction, i.e., up to two weeks, between the finest particles (likely
phytoliths) and the solution collected in the sampling can, which can prevent the detection of
possible kinetic isotopic fractionation occurring during ASi dissolution. The possible
contribution of dust was extensively discussed in Riotte et al. (2014). It was considered to be
negligible (3% of the Si concentration in overland flow) because the throughfall contained
very low Si contents. Also, the ASi origin of Si in overland flow is supported by the good
relationship between its Si/Na, DOC/Na, Ca/Na ratios, which all increase during the monsoon
season as litter decays, as well as by the oversaturation of overland flow solutions with
respect to clays (Riotte et al., 2014a).
The experimental approach, as described in detail in Audry et al. (2014), was performed on
litter ash from the ATT vegetation species. It consisted of 2-step batch experiments (with a
solid/solution ratio of 2 g L−1
, i.e., close to field conditions) and was designed to assess the
impact of forest fires on the Mule Hole stream composition. In the first step, a mixture of
ash/deionized water was filtered after 5 minutes of interaction to quantify and remove the
easily dissolving salts present in the ash that would have dissolved during the first rainfall
event. In the second step, the deionized water was renewed with the same solid/solution ratio.
The leaching progress was monitored by periodically sampling the suspension without
stopping the stirring in order to maintain a constant solid/solution ratio during the full
duration of the experiment. The suspension aliquots were filtered, and the filtrates were
analysed for their major dissolved species, including silica. The 30
Si signatures were
determined for the filtrates retrieved from the first step of the experiment and the filtrates
retrieved after 100 hours of interaction for the three species containing measurable silica, i.e.,
T. triandra grass, T. grandis and T. crenulata leaves. After 100 hours of interaction, the Si
concentration in the leachate had reached its maximum value, i.e., 2.83 mmol L-1
for T.
grandis and 3.18 mmol L-1
for T. triandra (see Electronic Annex EA-3, data from Audry et
al., 2014) beyond saturation with amorphous silica (~2 103 µmol L
-1, log K = -2.71; Parkhurst
and Appelo, 1999). The amount of silica released by T. crenulata from the first step was too
10
small to allow the determination of 30
Si; thus, for this species, 30
Si could only be measured
in the filtrate after 100 hours.
3.3 Amorphous Si and Dissolved Si measurements
The ASi pool was separated from the soil (5 g aliquot) and suspended load (0.6 to 3 g, based
on sample availability) matrices using heavy liquid flotation. This method allows the
quantification and identification of phytolith morphotypes and diatom frustules by optical
microscopy (Kelly, 1990). The procedure includes overnight carbonate removal with 37 %
HCl, the oxidation of organic matter (OM) with 33 % H2O2 at 50–70 °C, and clay removal by
decantation with sodium hexametaphosphate to ease deflocculation. To remove heavy
minerals, we used ZnBr2 heavy liquid (d=2.3 g cm-3
). After observing under the microscope
that ASi is mainly composed of phytoliths, we calculated the concentration of Si from
ASi/phytoliths assuming a mean water content in opal of 10 % (Bartoli & Wilding, 1980),
which is equivalent to 0.37 moles of H2O for 2 moles of SiO2 (ASi = 0.42 × mass of
phytolith). This is referred herein as ASizb. This extraction protocol may lead to the
underestimation of ASi due to phytolith loss during extraction or to the overestimation of ASi
when the final fraction is not pure and contains organic compounds or mineralogical residues
(Meunier et al., 2014). Because mineralogical residues (typically clays) could impact the
estimation of ASi and alter the 30
Si signatures of phytoliths, we used a purity index based on
the chemical composition of the ASizb fraction. The chemical composition was determined
after the alkaline digestion of ASi with NaOH (see section 3.4) with an ICP-OES Horiba
Ultima Expert at GET. The purity of the ASizb fractions was determined using the relation
ASizb purity = (Si-(Al, Fe, Ca, Mg, Mn, K))/Si (1)
where concentrations are expressed in mol g-1
. Using this index (dimensionless), pure
amorphous silica would exhibit an ASizb purity of 1 and clay would exhibit a value close to 0.
For each sample, the mass of ASi/phytoliths that was extracted was expressed as a percentage
of the sample dry weight (% DW).
The ASizb contents were measured along the two vertisol and ferralsol reference profiles, on
three suspended loads of streams and overland flow and on four composite 0-20 cm soils
corresponding to the four vegetation-soil-bedrock occurrences in the watershed: (A) ferralsol
developed on gneiss with ATT vegetation facies (dominant configuration), (B) vertisol
developed on amphibolite with ATT vegetation facies, (C) shallow and sandy ferralsol
11
developed on gneiss and covered with Shorea and (D) vertisol developed on gneiss and
covered with Ceriscoides. The ASizb data from the 5 vertisols and one ferralsol reported in
Table 2 are from Meunier et al. (2014).
The dissolved Si concentrations (DSi) of stream, overland flow, soil pore water and
groundwater samples were determined with a Hach® spectrophotometer at the Indo-French
Cell for Water Sciences (IISc, Bangalore) using the molybdate blue method, with a precision
of better than 10 %. The analytical quality was assessed using Perade-09 certified reference
material.
Plant samples were first digested using a mixture of concentrated H2O2 and HNO3. The
residual silica fraction, which was mainly composed of phytoliths, was dissolved separately
using concentrated NaOH. Samples were then homogenized, and their silica concentrations
were determined with an ICP-OES Horiba Ultima Expert at the GET lab (Toulouse, France).
Soil samples from vertisol and ferralsol profiles were analysed for their major (including Si)
and trace elements by ICP-OES at the SARM (Nancy, France) after digestion by borate
fusion. The Si concentrations of ash samples were determined by ICP-OES after alkaline
NaOH digestion at GET. The overall precision obtained for the concentration measurements
in solids was 5 to 10 %.
3.4 30Si measurements
Solid samples (soils, litter and ASizb) dedicated to 30
Si measurements were digested and
purified following the procedure described in Zambardi and Poitrasson (2011), which was
itself modified from Georg et al. (2006). Soil and bedrock samples were powdered in an agate
mortar, whereas litter samples were calcined at 900°C for 3 hours. Approximately 5 mg of
powdered sample was melted with an ~200 mg NaOH pellet in a silver crucible and then
dissolved in water and diluted HCl.
The silicon fraction was separated from cations by column chromatography using Bio-Rad
AG50W-X12 cationic resin. Si recovery was very close to 100%. Procedural blanks were
lower than 50 ng Si, i.e., negligible compared to the amount of Si in each sample. Prior to
isotopic measurements, the purified Si fraction was diluted to 2 or 3 mg L-1
based on the
initial amount of Si; the HCl concentration was adjusted to 0.05 mol L-1
; and 1 mg L-1
of Mg
was added as an internal standard for correcting online mass bias variations during the
analysis. Isotopic compositions were measured using a Neptune (Thermo®) multi-collector
ICP-MS in dynamic multicollection mode using medium- or high-resolution slits following
12
the methodology of Zambardi and Poitrasson (2011). The reference material NBS 28, which
was also spiked with 1 mg L-1
of Mg, was measured between each sample (sample-standard
bracketing). Most sample measurements were replicated 3 to 6 times. Isotopic data were
normalized to NBS 28 and expressed as:
(2)
The uncertainty associated with the 30
Si data (2SE) corresponds to two standard errors
obtained from the 3 to 6 replicates. The reproducibility was assessed by regular measurements
of the reference material BHVO-2 (basaltic rock). The average 30
Si value obtained here for
BHVO, i.e., -0.27 ± 0.06 ‰ (2SD, n=24), matches those obtained by Abraham et al. (2008) (-
0.29 ± 0.11 ‰), Zambardi and Poitrasson (2011) (-0.27 ± 0.08 ‰), and Savage et al. (2012) (-
0.30 ± 0.09 ‰). The standard deviation of the BHVO-2 measurements (±0.06 ‰) is
considered here to represent the best achievable uncertainty of our 30
Si data.
3.5 Phytolith morphotypes and pollen analysis
Phytoliths extracted from the soil and suspended load samples by heavy liquid flotation were
analysed under the microscope to evaluate the relative contributions of various plant types to
the pool of ASi in the Mule Hole soils. Slides were mounted using Canada balsam. Phytolith
morphotypes were described and counted at x400 and x1000 magnifications. They were
classified based on their 3D shapes and surface textures (Madella et al. 2005). They were then
assigned their most likely botanical origin (grass, sedge, forest indicator, or non-diagnostic)
according to e.g., Krishnan et al. (2000), Piperno (2006), Collura and Neumann (2016).
Pollen was extracted from eight soil samples – 4 from each composite surface soil from the
one-hectare plots and 4 from the vertisol profile (site D, Fig. 1) following standard protocols
(Faegri et al., 1991 and Moore et al., 1991). Only seven of these samples could be analysed
microscopically, as one contained too little pollen. Pollen taxa were counted under x400 and
x1000 magnifications and identified using regional pollen atlases (Huang, 1972; Vasanthy,
1976; Nayar, 1990 and Tissot et al., 1994) as well as the Thanikaimoni pollen slide collection
at the IFP as identification tools. The ecological attribution of the pollen taxa used here refers
to Barboni and Bonnefille (2001), Barboni et al. (2003) and Anupama et al. (2014).
13
4 Results
4.1 30Si values of bedrock, soils and suspended load
The 30
Si value of the gneissic bedrock is -0.34 ± 0.08 ‰ (Table 1), which falls within the
lowest part of the range defined for igneous rocks (Savage et al., 2012). The gneiss signature
is consistent with the light signatures observed in metasediment-derived igneous bedrock
(Savage et al., 2012, Poitrasson & Zambardi, 2015). The isotopic signatures of the bulk
ferralsol samples are very close to those of the bedrock composition. However, they slightly
decrease with depth from -0.26 ± 0.08 ‰ at 0-20 cm to -0.42 ± 0.27 ‰ at 100-120 cm. These
signatures are heavier than most of the values reported for tropical soils (e.g., Opfergelt et al.,
2009; 2012, Bern et al., 2010; Ziegler et al., 2005).
The clay-size fraction of ferralsol samples, which mostly comprises kaolinite, yielded a 30
Si
value of -1.30‰ (n=3), which is homogeneous in the soil profile. The fractionation factor
between kaolinite and bedrock is thus close to -1 ‰, which is less than the values that have
been observed in other soils to date (Opfergelt and Delmelle, 2012 and references therein),
which are closer to -2 ‰.
The suspended load of the overland flow yielded a 30
Si signature of -0.90 ± 0.14 ‰, which
falls in between those of bulk soil and kaolinite, thus reflecting the mobilization of the fine
grain size fractions from topsoil during rainy events.
4.2 Contribution to amorphous Si in soils: ASi content, phytolith morphotypes, pollen
analysis, 30Si of ASi
4.2.1 ASi content
The amorphous silica (ASizb) concentrations in the soil profiles range from 0.05 to 0.24 % for
ferralsol and from 0.06 to 0.86 % for vertisol (Table 2). The degree of ASizb purity was
elevated (>0.85) in surface soils and suspended load samples but decreased with ASizb content
and depth in soil profiles, down to 0.42 for the ferralsol sample collected at a depth of 200-
220 cm (Table 2). The ASizb concentrations in soils are comparable to those in other forest
soils, both in humid tropics (0.02 % to 0.25 %, Congo, Alexandre et al., 1997; 0.3 to 2 %,
Cameroon, Cary et al., 2005) and temperate climates (0.3-1.4 %, France, Cornelis et al.,
2010). Their concentrations decreased with depth, as it is commonly the case in pristine
tropical forests (Alexandre et al., 1997; Alexandre et al., 2011; Blecker et al., 2006; Saccone
14
et al., 2007; Saccone et al., 2008). This distribution reflects a balance between litterfall input
and the dissolution/preservation of phytoliths in the soil profile. The ASi stocks in ferralsol
and vertisol, assessed by extrapolating the measured values to the 2-m-thick profiles, should
then range from 4 kg m-2
Si to 8 kg m-2
Si, respectively. These values are comparable to those
observed in other mature tropical forests in Amazonia (Lucas, 2001) and the Congo
(Alexandre et al. 1997) and are higher than those observed in savannas (Alexandre et al.,
2011). The ASizb values of the four composite surface soils ranged from 0.4 to 0.65 %. This
narrow range suggests a homogeneous phytolith content at the soil surface of Mule Hole. The
corresponding stock for the 15-cm topsoil layer would be 1 kg m-2
ASi, which is equivalent to
approximately 150 years of litter production (Riotte et al., 2014a) and 1000 to 2000 years of
litter production for the whole soil layer.
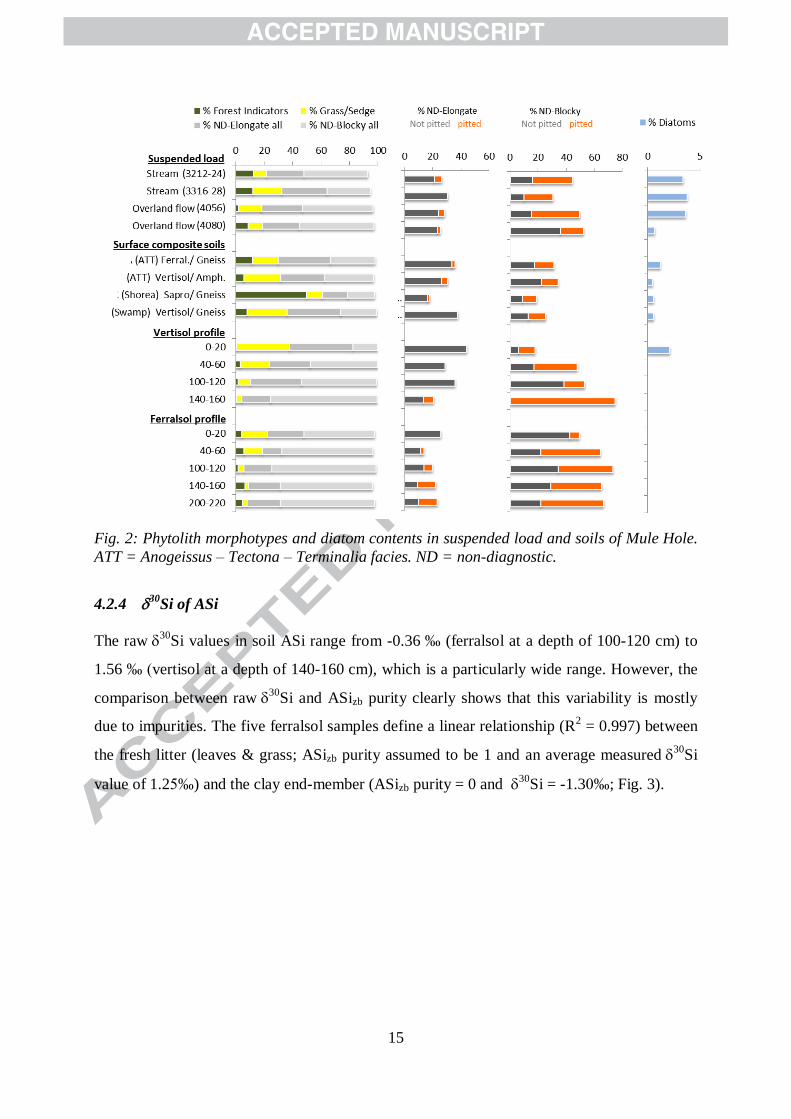
4.2.2 Phytolith morphotypes
Phytolith counts are given in Electronic Annex EA-4 and summarized in Fig. 2. Under the
microscope, the ASi appears to mostly comprise phytoliths. Diatoms represent less than 4% of
all samples, including the stream and overland flow samples. The non-diagnostic elongate and
blocky phytoliths are the dominant morphotypes (Fig. 2, micrographs in Electronic Annex
AE-5) in all samples but the surface soil sample located in the Shorea forest, which contains
abundant forest indicator phytoliths (Fig. 2). Grass/sedge indicators are more dominant than
forest ones, but the abundance of grass/sedge indicators decreases with soil depth. The
proportion of pitted phytoliths in ferralsol and vertisol profiles increases with depth, revealing
an “aging effect” on deep phytoliths (Fig. 2).
4.2.3 Pollen analysis
Pollen counts are given in Electronic Annex EA-6. The analysis of the vertisol profile shows
that more taxa with an affinity for evergreen forests are represented in the bottom of the
vertisol profile (100-160 cm) compared to the top, which is characterized by pollen taxa with
an affinity to moist deciduous forests (Electronic Annex AE-7). Changes associated with
more seasonality and/or less annual precipitation are likely responsible for these changes in
the pollen taxa composition through the vertisol profile at Mule Hole.
15
Fig. 2: Phytolith morphotypes and diatom contents in suspended load and soils of Mule Hole.
ATT = Anogeissus – Tectona – Terminalia facies. ND = non-diagnostic.
4.2.4 30Si of ASi
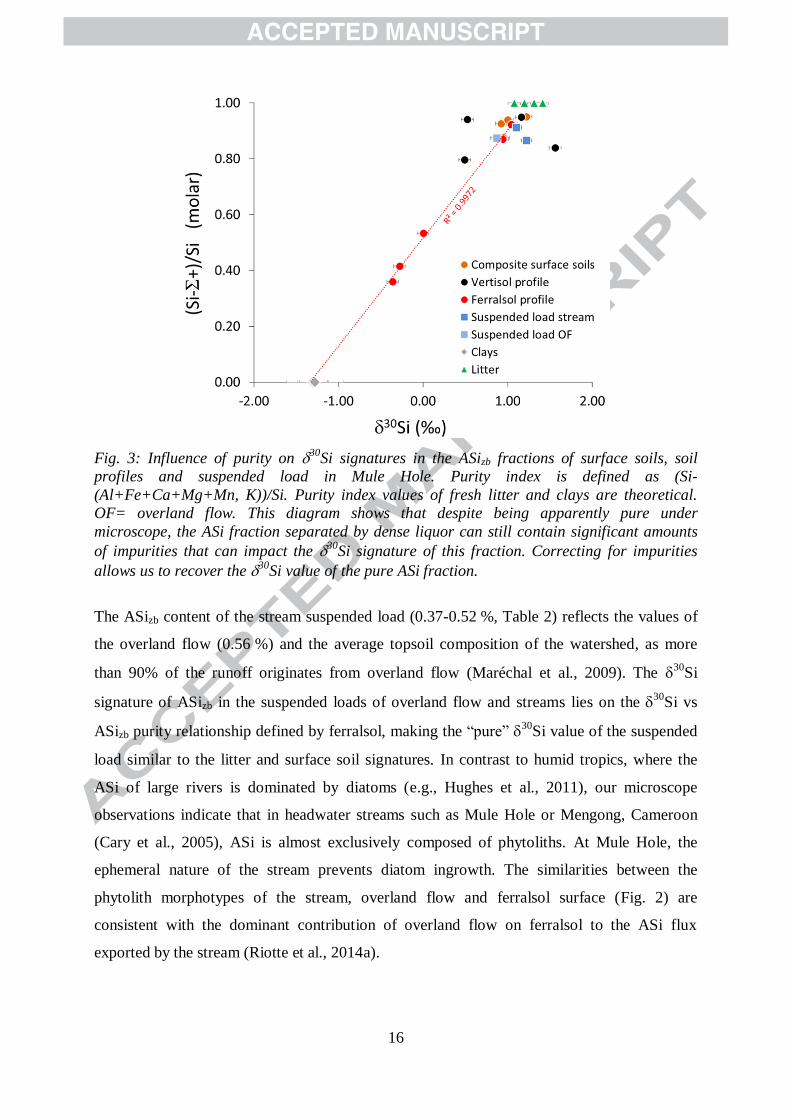
The raw30
Si values in soil ASi range from -0.36 ‰ (ferralsol at a depth of 100-120 cm) to
1.56 ‰ (vertisol at a depth of 140-160 cm), which is a particularly wide range. However, the
comparison between raw30
Si and ASizb purity clearly shows that this variability is mostly
due to impurities. The five ferralsol samples define a linear relationship (R2 = 0.997) between
the fresh litter (leaves & grass; ASizb purity assumed to be 1 and an average measured30
Si
value of 1.25‰) and the clay end-member (ASizb purity = 0 and 30
Si = -1.30‰; Fig. 3).
16
Fig. 3: Influence of purity on 30Si signatures in the ASizb fractions of surface soils, soil
profiles and suspended load in Mule Hole. Purity index is defined as (Si-
(Al+Fe+Ca+Mg+Mn, K))/Si. Purity index values of fresh litter and clays are theoretical.
OF= overland flow. This diagram shows that despite being apparently pure under
microscope, the ASi fraction separated by dense liquor can still contain significant amounts
of impurities that can impact the 30Si signature of this fraction. Correcting for impurities
allows us to recover the 30Si value of the pure ASi fraction.
The ASizb content of the stream suspended load (0.37-0.52 %, Table 2) reflects the values of
the overland flow (0.56 %) and the average topsoil composition of the watershed, as more
than 90% of the runoff originates from overland flow (Maréchal et al., 2009). The 30
Si
signature of ASizb in the suspended loads of overland flow and streams lies on the 30
Si vs
ASizb purity relationship defined by ferralsol, making the “pure” 30
Si value of the suspended
load similar to the litter and surface soil signatures. In contrast to humid tropics, where the
ASi of large rivers is dominated by diatoms (e.g., Hughes et al., 2011), our microscope
observations indicate that in headwater streams such as Mule Hole or Mengong, Cameroon
(Cary et al., 2005), ASi is almost exclusively composed of phytoliths. At Mule Hole, the
ephemeral nature of the stream prevents diatom ingrowth. The similarities between the
phytolith morphotypes of the stream, overland flow and ferralsol surface (Fig. 2) are
consistent with the dominant contribution of overland flow on ferralsol to the ASi flux
exported by the stream (Riotte et al., 2014a).
17
4.3 30Si of natural solutions
The 30
Si values of DSi in overland flow (n=7) ranged from 0.44 ± 0.16 ‰ to 2.22 ± 0.69‰,
with a cluster around 1.08 ± 0.11‰ (n=5; Table 3). No shift in 30
Si was noticed during the
rainy season, in contrast to the Si/Na and DOC/Na molar ratios, which increased as litter
decayed (Riotte et al., 2014a). The 30
Si values of DSi in soil pore water was homogeneous
whatever the soil type, 1.64 ± 0.11‰ (n=9; Table 3).
Apart from the first two storms of 2004, during which litter-ash leaching released highly
above-average Si fluxes (Audry et al., 2014) with specific 30
Si values, the 30
Si values of the
stream water varied based on the water sources, with the lightest 30
Si values (0.28 to 0.74‰)
occurring during flood peaks and the heaviest ones occurring during peak recession (1.04 to
1.61‰) (Table 3). Similar patterns were reported in tropical (Hughes et al., 2013) or
temperate to boreal rivers (Georg et al., 2006; Engström et al. 2010; Pokrovsky et al., 2013).
The range of 30
Si values in the Mule Hole stream of 1.3‰ is as wide as those observed in
some large rivers, such as the Solimoes River from Amazonia (Hughes et al., 2013), which
undergoes contrasted weathering regimes from the Andes to the Amazon plain, or Siberian
rivers (1 to 1.5‰; Pokrovsky et al., 2013).
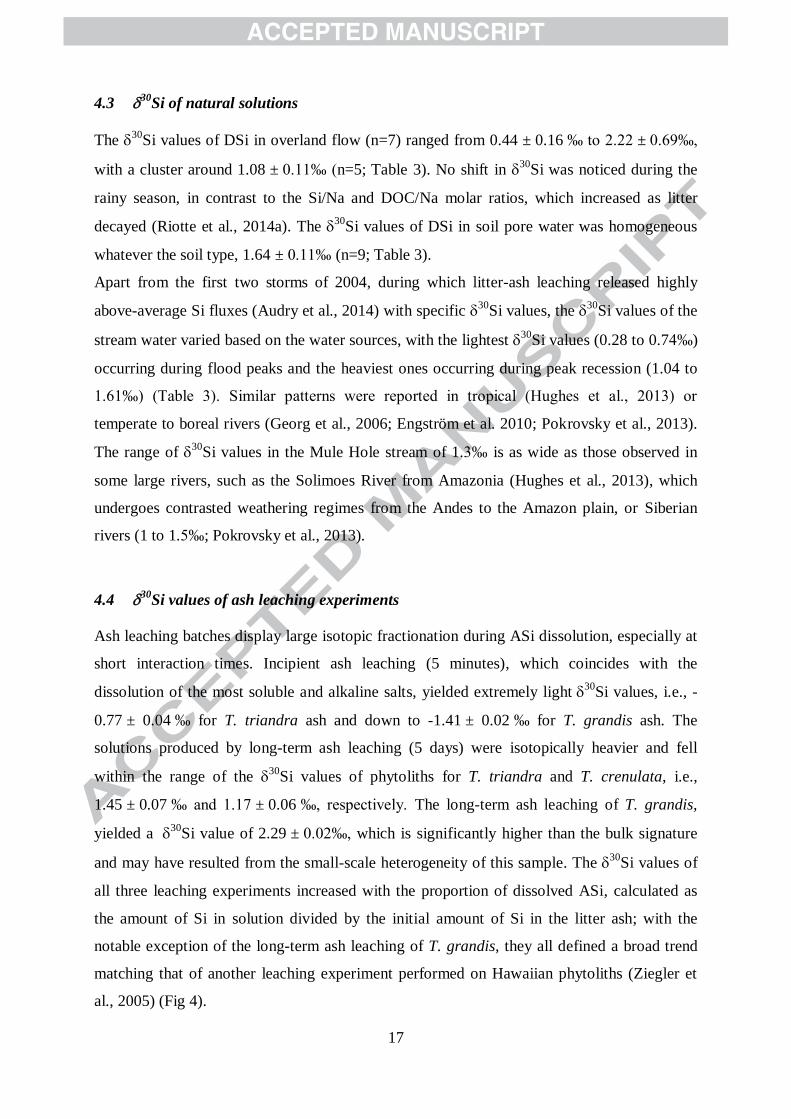
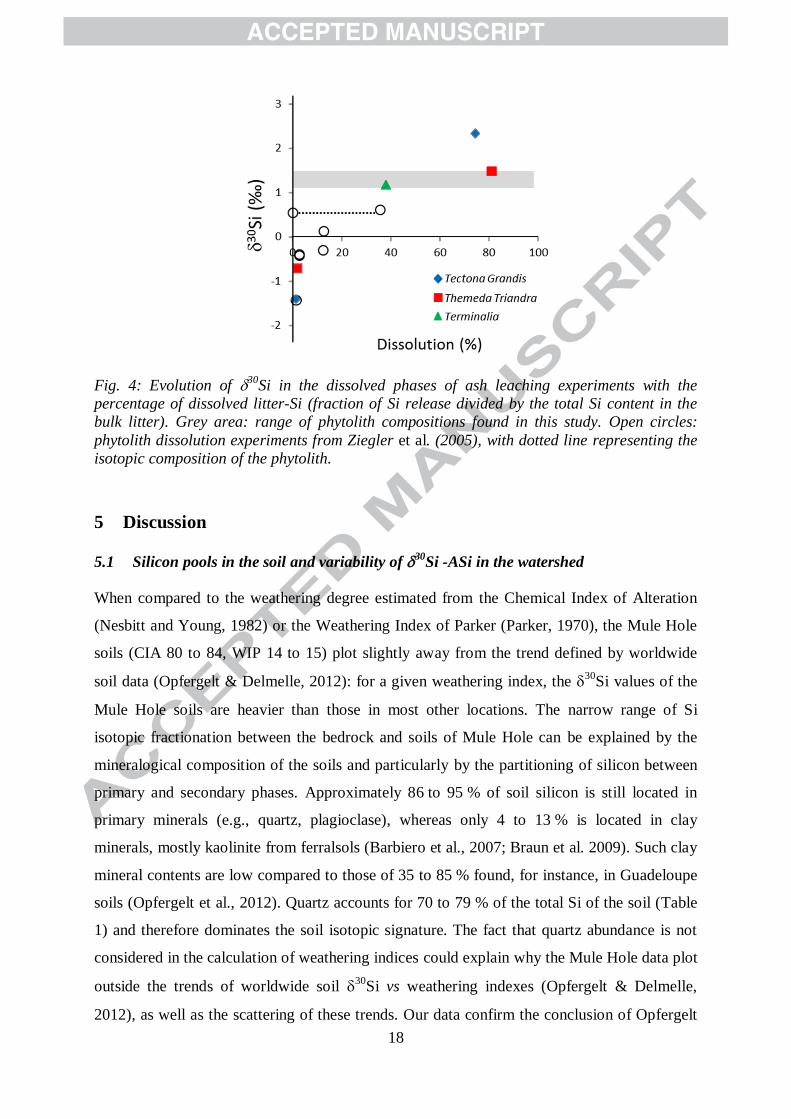
4.4 30Si values of ash leaching experiments
Ash leaching batches display large isotopic fractionation during ASi dissolution, especially at
short interaction times. Incipient ash leaching (5 minutes), which coincides with the
dissolution of the most soluble and alkaline salts, yielded extremely light30
Si values, i.e., -
0.77 ± 0.04 ‰ for T. triandra ash and down to -1.41 ± 0.02 ‰ for T. grandis ash. The
solutions produced by long-term ash leaching (5 days) were isotopically heavier and fell
within the range of the 30
Si values of phytoliths for T. triandra and T. crenulata, i.e.,
1.45 ± 0.07 ‰ and 1.17 ± 0.06 ‰, respectively. The long-term ash leaching of T. grandis,
yielded a 30
Si value of 2.29 ± 0.02‰, which is significantly higher than the bulk signature
and may have resulted from the small-scale heterogeneity of this sample. The 30
Si values of
all three leaching experiments increased with the proportion of dissolved ASi, calculated as
the amount of Si in solution divided by the initial amount of Si in the litter ash; with the
notable exception of the long-term ash leaching of T. grandis, they all defined a broad trend
matching that of another leaching experiment performed on Hawaiian phytoliths (Ziegler et
al., 2005) (Fig 4).
18
Fig. 4: Evolution of 30Si in the dissolved phases of ash leaching experiments with the
percentage of dissolved litter-Si (fraction of Si release divided by the total Si content in the
bulk litter). Grey area: range of phytolith compositions found in this study. Open circles:
phytolith dissolution experiments from Ziegler et al. (2005), with dotted line representing the
isotopic composition of the phytolith.
5 Discussion
5.1 Silicon pools in the soil and variability of 30Si -ASi in the watershed
When compared to the weathering degree estimated from the Chemical Index of Alteration
(Nesbitt and Young, 1982) or the Weathering Index of Parker (Parker, 1970), the Mule Hole
soils (CIA 80 to 84, WIP 14 to 15) plot slightly away from the trend defined by worldwide
soil data (Opfergelt & Delmelle, 2012): for a given weathering index, the 30
Si values of the
Mule Hole soils are heavier than those in most other locations. The narrow range of Si
isotopic fractionation between the bedrock and soils of Mule Hole can be explained by the
mineralogical composition of the soils and particularly by the partitioning of silicon between
primary and secondary phases. Approximately 86 to 95 % of soil silicon is still located in
primary minerals (e.g., quartz, plagioclase), whereas only 4 to 13 % is located in clay
minerals, mostly kaolinite from ferralsols (Barbiero et al., 2007; Braun et al. 2009). Such clay
mineral contents are low compared to those of 35 to 85 % found, for instance, in Guadeloupe
soils (Opfergelt et al., 2012). Quartz accounts for 70 to 79 % of the total Si of the soil (Table
1) and therefore dominates the soil isotopic signature. The fact that quartz abundance is not
considered in the calculation of weathering indices could explain why the Mule Hole data plot
outside the trends of worldwide soil 30
Si vs weathering indexes (Opfergelt & Delmelle,
2012), as well as the scattering of these trends. Our data confirm the conclusion of Opfergelt
19
and Delmelle (2012) that the 30
Si values of bulk soils depend on the ratio of clay to primary
minerals. The relatively high 30
Si value of the clay fraction could possibly be explained by a
slight contribution of quartz to this fraction, which would slightly increase the 30
Si value, as
was recently proposed by Ameijeiras-Mariño et al. (2017). Alternatively, some minerals of the
bedrock could exhibit slightly heavier 30
Si values than the bulk rock, which could account
for the limited apparent fractionation factor. However, the narrow range of 30
Si values
observed for separate silicate minerals (Savage et al., 2014) or modelled between quartz and
albite at 600 °C (<0.1 ‰, Méheut et al., 2014) makes this assumption unlikely.
The low purity index of ASizb in deep ferralsol samples attests to the difficulty of recovering
the soil ASi fraction, despite using an elaborate purification protocol (see section 3.2) and
further microscope quality control. In contrast to the microscope control, which is qualitative,
the chemical control, as assessed through the purity index, is sensitive and quantitative. It
allows us to quantify contamination and correct the 30
Si value of ASi when necessary. In the
case of deep ferralsol samples, the clay mineral contribution was significant and impacted the
30
Si of ASizb, which thus must be corrected. The alignment of the clay and fresh litter
compositions of 5 ASizb ferralsol samples (Fig. 3) indicates that the 30
Si of ASizb is constant
along the ferralsol profile and corresponds to the average signature of fresh litter. It is
remarkable that the ASizb 30
Si values of the four composite surface soils, the shallow vertisol
sample and the suspended load of the overland flow and stream also lie close to the
relationship defined by ferralsol samples, implying that the ASizb 30
Si can be corrected by
extrapolation to an ASizb purity of 1. Then, the 30
Sicorr values of all these ASizb samples
(Table 2) fall within a narrow range, between 1.10 and 1.30 ‰, corresponding to the present-
day litter phytolith composition.
In contrast to the ferralsol profile and composite surface soils, the ASi fractions of the vertisol
profile exhibit scattered ASizb 30
Si compositions, i.e., from 0.52 to 1.56 ‰ (uncorrected from
clay impurities), although the contribution of impurities does not exceed 20%. If the clay
signature in this soil profile is the same as that of the ferralsol, then the ASizb 30
Sicorr values
of deeper vertisol samples should vary from 0.62 to 2.10 ‰. The presence of smectite in
vertisols may induce a heavier 30
Si value of the clay pool, as was observed for another clay
mineral, illite (-0.68 ‰, Steinhofel et al., 2011). However, because of the purity level of the
vertisol ASi fraction, the clay signature only marginally impacts the 30
Sicorr value; if the
clays have a 30
Si value of -0.5 ‰, the range of the 30
Sicorr values of deeper vertisol samples
would be still 0.5 to 2.0 ‰. Rather, the scattered signatures could result from the impervious
20
properties of vertisols (Kurtzman et al., 2016) that could host preserved phytoliths from past
vegetation/climate conditions or have induced opal precipitation due to the intense
evaporation of soil pore water. Pedogenic carbonates dated to the Last Glacial Maximum,
when semi-arid conditions prevailed (Violette et al., 2010a), are present in the vertisols of
Mule Hole. Given the low permeability of vertisols, phytoliths from this period could also
have been preserved, which would also explain their higher abundance in vertisols compared
to ferralsols. Indeed, the phytolith morphotypes at the vertisol surface (Fig. 2; Supplementary
table 1), which are dominated by elongate shapes, differ from those of deeper horizons, where
blocky shapes are dominant relative to elongate shapes. The antiquity of these phytoliths is
indicated by an increase in the proportions of pitted phytoliths with depth, probably due to
weathering over time, whereas the absence of cultivation pollen markers below a depth of 100
cm suggests that those soils were preserved from significant human impacts. A spike in
certain ubiquitous pollen taxa in tandem with the spike in evergreen taxa below this depth
suggests a mosaic landscape of patches or islands of wet/humid forests separated by openings,
which is certainly different from the present landscape in terms of its species composition
(Electronic Annex AE-7). Then, the large variability of ASizb 30
Si values in deeper vertisol
horizons could come from phytoliths of a vegetation cover different than the present one. One
cannot exclude that ageing effects also impacted ASizb 30
Si. Alternatively, it is known that
the seasonal swelling/cracking properties of vertisols favour pore water evaporation and then
salinization (e.g., Baram et al., 2013). Deep soil pore water could then reach saturation with
opal and allow opal precipitation at this depth. If this process is not completely reversible over
a monsoon-dry season cycle, small amounts of opal could have accumulated over time in the
soil and then contributed to the ASizb fraction of deep vertisol samples, possibly also
impacting the 30
Si signature of ASizb.
To summarize, apart from two depths in the vertisol in which phytoliths likely represent
fossils of another vegetation cover, the 30
Si value of ASi remains remarkably constant
throughout the watershed, which confirms that the 30
Si values of vegetation are “system-
dependent” rather than “vegetation species-dependent” (Geilert et al., 2014). However, it
remains unclear why two vertisol samples exhibit a wide range of ASi30
Si values, i.e.,, from
0.6 to 2.1 ‰.
21
5.2 Silicon isotopic solute mass balance at the soil-plant scale
5.2.1 Initial elemental Si mass balance
The Si isotopic mass balance at the soil-plant scale (Fig. 5) relies on the initial elemental mass
balance performed by Riotte et al. (2014a). At the ground surface, the solute Si flux
infiltrating the soil layer (i.e., the soil input flux), assuming an overland flow composition, is
1850 mol ha-1
yr-1
of DSi, which is similar to that brought to the ground by litter fall, i.e.,
2200 ± 200 mol Si ha-1
yr-1
. The origin of the Si infiltrating the soil was assigned to ASi
dissolution from litter, based on the good relationship between the Si/Na, DOC/Na, and
Ca/Na ratios that all increase during the monsoon season as litter decays. Since the Na
concentration in overland flow was identical to that of rainfall and throughfall, the
contribution of primary minerals, such as Na-plagioclase, to the overland flow solution was
considered to be negligible, while its oversaturation with respect to clay minerals indicated
that clays were not a potential source. Within the soil, the Si solute mass balance was
performed using both Si and Na budgets (Fig. 5, left side, from Riotte et al., 2014a). With a
DSi output of only 704 ± 150 mol ha-1
yr-1
, the input-output budget indicates an apparent loss
of 1150 mol DSi ha-1
yr-1
from the soil layer. However, the net soil output of 650 mol Na ha-
1 yr
-1, which could only originate from the weathering of Na-plagioclase, likely induced the
release of an additional 1300 mol DSi ha-1
yr-1
if kaolinite is the weathering product,
according to the following weathering reaction (Riotte et al., 2014a):
2 (Na0.92Ca0.08)(Al1.07Si2.93)O8 + 2 H+ + 9 H2O 1.07 Si2Al2O5(OH)4 + 1.84 Na
+ + 0.16 Ca
2+
+ 3.72 H4SiO4 (3)
Then, according to this Na-Si solute budget, the DSi loss from the soil layer would be at least
2450 mol ha-1
yr-1
; this value is similar to the annual litter flux (tree leaves and grass). The
loss of Si from soil pore water was attributed to vegetation uptake.
5.2.2 Si mass balance inferred from isotopes
The Si mass balance inferred from isotopes consists of multiplying the elemental Si fluxes of
section 5.2.1 by their isotopic signature (30
Si). When 30
Si values were obtained from several
samples of a given compartment, the variability between these data was taken into account
using two standard deviations between samples.
The elemental mass balance inferred from isotopes first provides the opportunity to test the
assumption of the biogenic origin of Si in overland flow proposed by Riotte et al. (2014a).
22
Accordingly, the three potential sources of Si, namely, fresh litter (1.25 ± 0.14 ‰), primary
minerals (-0.34 ‰) and clay minerals (-1.30 ‰), exhibit contrasting 30
Si values. The average
30
Si of overland flow DSi (1.15 ± 0.50 ‰) is much heavier than the signature of the clay-size
fraction (-1.30 ‰), thus ruling out any contribution of clay mineral dissolution to the silica
content in overland flow. It is indeed slightly lower than the fresh litter average,
1.25 ± 0.14 ‰, which is consistent with the fractionation factor Δ30
SiASi-DSi of -0.26 ‰
estimated for ASi dissolution in the delta of Okavango (Frings et al., 2014a) and in the range
observed during diatom dissolution, i.e., approximately 0 ‰ (Wetzel et al., 2014) to -0.55 ‰
(Demarest et al. 2009). The similarity between the 30
Si values of overland flow and fresh
litter leaves no doubt about the biogenic origin (phytolith dissolution) of DSi in overland
flow. By extension, the biogenic origin of Si in solutions infiltrating the soil (Riotte et al.,
2014a) is therefore confirmed.
The isotopic mass balance then allows us to evaluate whether the plant uptake of Si is limited
to cycling through the litter or involves a larger flux with storage in the woody biomass.
Tropical trees are known to accumulate silica in their woody stems; at least one of the most
abundant tree species of Mule Hole, T. grandis, contains 0.27 to 0.66 % of silica in its wood
(Kjaer et al., 1999). If the Si stored in a plant were concentrated in the litter, 30
Siuptake should
be equal to 30
Silitter, whereas if Si is partly stored in the woody biomass, 30
Siuptake should
differ from 30
Silitter because Si isotopes fractionate within the plants (Opfergelt, 2006; Ding et
al. 2005). The 30
Siuptake can first be estimated from the solute isotopic budget within the soil
layer, which requires an assessment of the 30
Si value of the silica released during plagioclase
weathering. If plagioclase crystals break down into kaolinite with the release of dissolved Na
and silica (a process referred to in Fig. 5 as plagioclase weathering and described by the above
weathering reaction), the 30
Si value of the silica released can be estimated according to a
mass balance equation (Bouchez et al., 2013):
(4)
Using the reaction stoichiometry (FSi values) given in the weathering reaction (3) (from
Riotte et al., 2014a) and the 30
Sikaolinite values measured in ferralsol clays (-1.30 ± 0.03‰)
and assuming that the 30
Siplagioclase value is similar to the bedrock signature (-0.34 ± 0.08‰),
the estimated 30
Sireleased value produced by Na-plagioclase weathering would be
23
+0.21 ± 0.14‰. Adding the DSi flux infiltrated from the surface (1850 mol ha-1
yr-1
with 30
Si
of 1.15 ± 0.50‰) to the Si released by Na-plagioclase weathering indicates that the minimum
DSi flux to the soil would have an average 30
Si value of +0.76 ± 0.35‰. Since the soil
output of 842 mol DSi ha-1
yr-1
(Riotte et al., 2014a) has an average 30
Si value of
+1.64 ± 0.11‰, the silica removed from soil pore water and assigned to plant uptake should
exhibit a 30
Si value of +0.52± 0.30‰. This signature is 0.7 ‰ lower than the average
30
Silitter value, which means that plants likely take up more silica than expected from the
elemental mass balance. Therefore, the latter must be re-evaluated and isotopically
equilibrated.
5.2.3 Equilibration of the Si isotopic mass balance
In this section, we propose a three-step methodology for equilibrating the Si isotopic mass
balance, which consists of (1) estimating the 30
Si value of the bulk Si taken up by plants, (2)
estimating the corresponding flux of the bulk Si uptake and (3) identifying the potential
additional Si sources to plants:
(1) The Si isotopes taken up by plants could theoretically follow either a Rayleigh model,
implying that the Si source is limited (i.e., a closed system), or a steady-state model, implying
a non-limited Si source and open system. The Rayleigh model could apply, for instance, to a
pot experiment with no other Si supply than the initial hydroponic solution. In the case of
Mule Hole, the intensity of soil mineral weathering (for instance, ASi or Na-plagioclase)
varies seasonally based on soil moisture fluctuations. However, soil moisture hardly falls
below 20% in the ferralsol and 25% in the vertisol (Parate et al., 2011), which is sufficient to
sustain soil-Si release throughout the year. This soil-Si flux complements the Si flux from
litter decay that regularly infiltrates the ground surface during the monsoon season. The
continuous (but obviously temporally variable) supply of Si makes the soil a relatively open
system with a non-limited source of Si. As a consequence, a steady-state model would be
more appropriate than the Rayleigh model to describe the silicon isotopic fractionation
induced by plant uptake. Accordingly, the 30
Siuptake value would be linked to the soil pore
water composition by the following relation (De La Rocha et al., 1997):
(5)
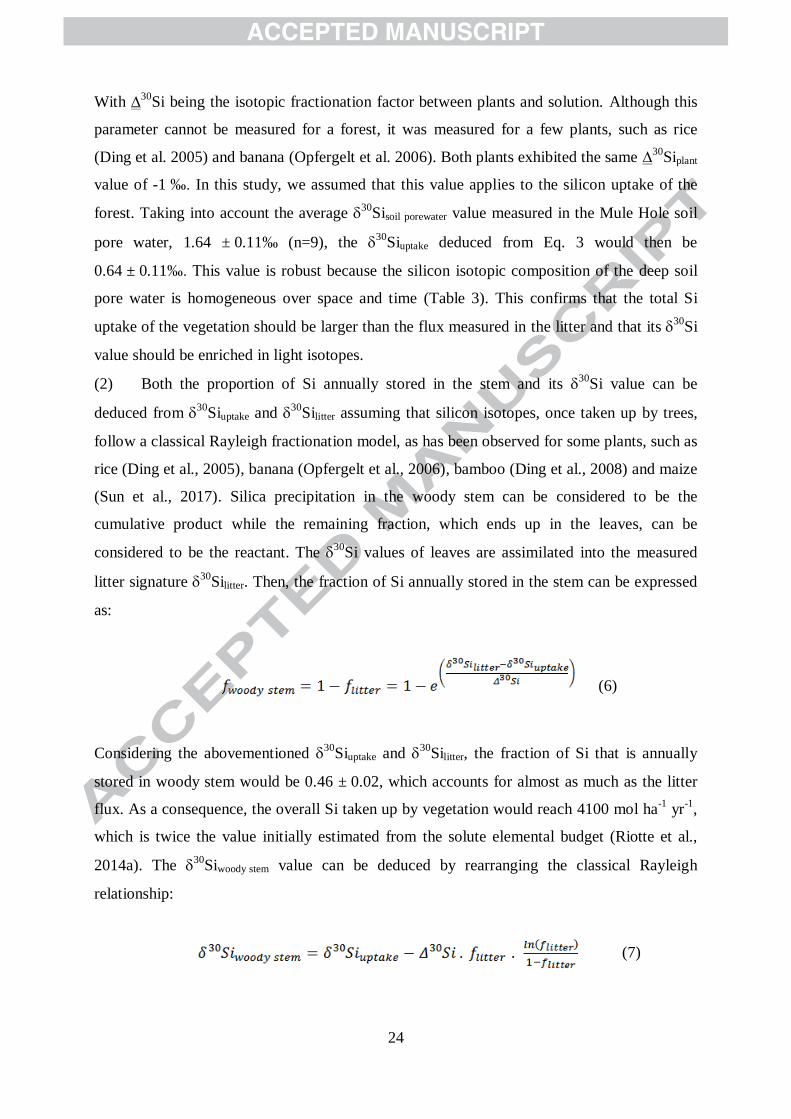
24
With ∆30
Si being the isotopic fractionation factor between plants and solution. Although this
parameter cannot be measured for a forest, it was measured for a few plants, such as rice
(Ding et al. 2005) and banana (Opfergelt et al. 2006). Both plants exhibited the same ∆30
Siplant
value of -1 ‰. In this study, we assumed that this value applies to the silicon uptake of the
forest. Taking into account the average 30
Sisoil porewater value measured in the Mule Hole soil
pore water, 1.64 ± 0.11‰ (n=9), the 30
Siuptake deduced from Eq. 3 would then be
0.64 ± 0.11‰. This value is robust because the silicon isotopic composition of the deep soil
pore water is homogeneous over space and time (Table 3). This confirms that the total Si
uptake of the vegetation should be larger than the flux measured in the litter and that its 30
Si
value should be enriched in light isotopes.
(2) Both the proportion of Si annually stored in the stem and its 30
Si value can be
deduced from 30
Siuptake and 30
Silitter assuming that silicon isotopes, once taken up by trees,
follow a classical Rayleigh fractionation model, as has been observed for some plants, such as
rice (Ding et al., 2005), banana (Opfergelt et al., 2006), bamboo (Ding et al., 2008) and maize
(Sun et al., 2017). Silica precipitation in the woody stem can be considered to be the
cumulative product while the remaining fraction, which ends up in the leaves, can be
considered to be the reactant. The 30
Si values of leaves are assimilated into the measured
litter signature 30
Silitter. Then, the fraction of Si annually stored in the stem can be expressed
as:
(6)
Considering the abovementioned 30
Siuptake and 30
Silitter, the fraction of Si that is annually
stored in woody stem would be 0.46 ± 0.02, which accounts for almost as much as the litter
flux. As a consequence, the overall Si taken up by vegetation would reach 4100 mol ha-1
yr-1
,
which is twice the value initially estimated from the solute elemental budget (Riotte et al.,
2014a). The 30
Siwoody stem value can be deduced by rearranging the classical Rayleigh
relationship:
(7)
25
Here, the 30
Siwoody stem value would be -0.08 ± 0.14‰. The fact that the Si accumulated in
woody stems is isotopically lighter than that in the leaves is consistent with the progressive
enrichment in 30
Si from the lowest parts of the plant (roots) to the highest ones (leaves)
observed by Ding et al. (2005) and Opfergelt (2006).
(3) In the absence of additional proxies of silicate weathering fluxes or Si sources, one can
only suggest hypotheses to explain the origin of the Si flux stored in the woody stem and its
isotopic signature of -0.08 ± 0.14‰. If the Si source(s) consist(s) of a dissolved compartment,
based on the above assumptions, its uptake should follow steady-state conditions, with a
∆30
Siplant value of -1 ‰. The Si source should exhibit a 30
Si value of approximately +1 ‰,
which corresponds to the soil ASi (1.25 ‰ in ferralsols) and groundwater (1.20 ± 0.3‰;
Table 3) signatures. The current stock of 4 kg ASi m-2
in the ferralsol could indeed sustain the
additional flux of 1900 mol Si ha-1
yr-1
for 600 years (twice as long for vertisols). This pool
was also recently identified as the principal Si source for rice (Riotte et al., 2017) and may
thus sustain many Si-accumulator plants. If plants directly take up Si from the soil
compartments, with limited or no isotopic fractionation, then the 30
Si value of -.08 ± 0.14‰
in the stems could originate from the congruent dissolution of primary silicate minerals. The
best rock-forming mineral candidates would be Al-poor phases, such as the ubiquitous Mg-
hornblende and quartz, because their weathering would not induce the formation of clay
minerals and thus result in limited to no silicon isotopic fractionation. In all cases, the
contribution of clay minerals as a source of Si to plants is unlikely. The isotopic solute budget
of silica at the soil-plant scale is summarized in Fig. 5.
26
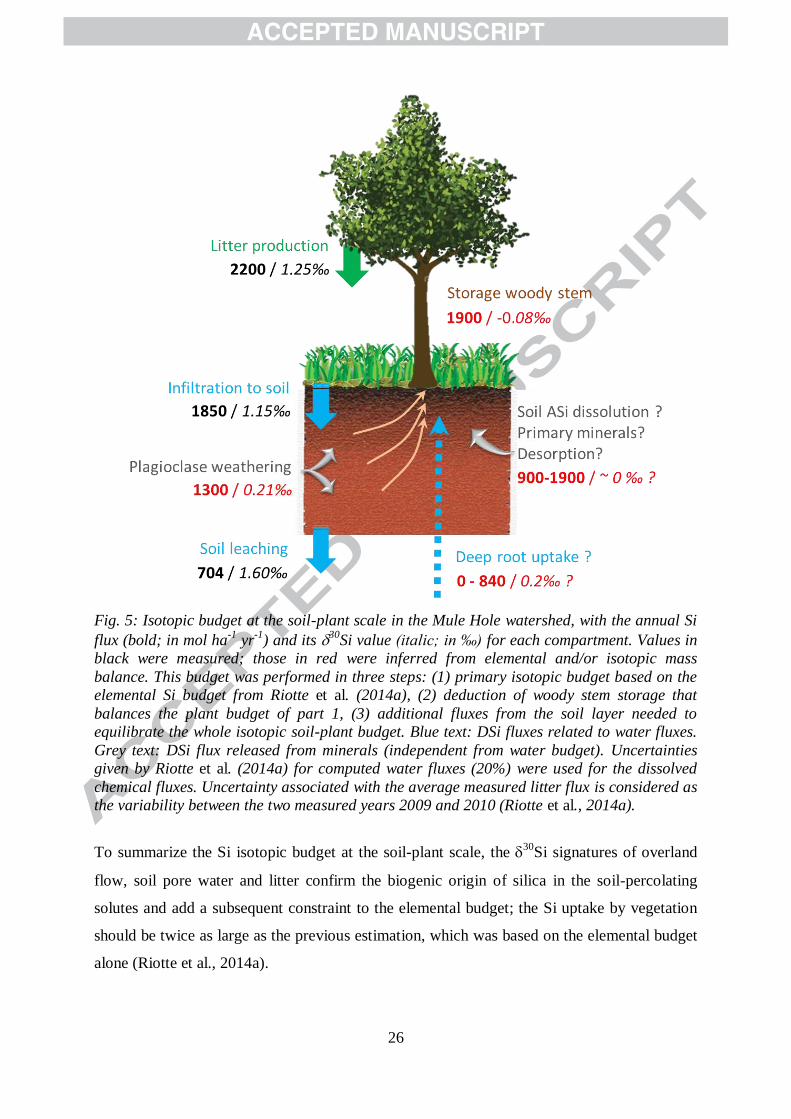
Fig. 5: Isotopic budget at the soil-plant scale in the Mule Hole watershed, with the annual Si
flux (bold; in mol ha-1
yr-1
) and its 30Si value (italic; in ‰) for each compartment. Values in
black were measured; those in red were inferred from elemental and/or isotopic mass
balance. This budget was performed in three steps: (1) primary isotopic budget based on the
elemental Si budget from Riotte et al. (2014a), (2) deduction of woody stem storage that
balances the plant budget of part 1, (3) additional fluxes from the soil layer needed to
equilibrate the whole isotopic soil-plant budget. Blue text: DSi fluxes related to water fluxes.
Grey text: DSi flux released from minerals (independent from water budget). Uncertainties
given by Riotte et al. (2014a) for computed water fluxes (20%) were used for the dissolved
chemical fluxes. Uncertainty associated with the average measured litter flux is considered as
the variability between the two measured years 2009 and 2010 (Riotte et al., 2014a).
To summarize the Si isotopic budget at the soil-plant scale, the 30
Si signatures of overland
flow, soil pore water and litter confirm the biogenic origin of silica in the soil-percolating
solutes and add a subsequent constraint to the elemental budget; the Si uptake by vegetation
should be twice as large as the previous estimation, which was based on the elemental budget
alone (Riotte et al., 2014a).
27
5.3 Controls of 30Si in stream dissolved and suspended loads
The few studies that have reported time-related fluctuations of 30
Si in rivers have proposed
various explanations. Hughes et al. (2013) observed that for several streams of the Amazon
River system, the highest 30
Si values corresponded to base flow conditions and low Si/cation
molar ratios. These compositions were interpreted to reflect the greater contribution of the
chemical weathering of primary minerals due to a greater contribution of groundwater. The
chemical compositions of these waters were compatible with either smectite (bisiallitization)
or kaolinite (monosiallitization) production. In Siberian watersheds, the highest 30
Si occurred
during the summer-fall season, when biomass and the active soil layer thickness increased.
Two explanations were proposed to explain these high signatures, i.e., the formation of
secondary minerals (clays and amorphous phases) or Si uptake by vegetation, although it was
not possible to determine the respective contribution of each process (Pokrovsky et al., 2013).
According to the hydrological model of the Mule Hole watershed (Violette et al., 2010b), the
ephemeral stream is mostly fed by overland flow on ferralsol (53 mm yr-1
) and vertisol
(29 mm yr-1
). Soil seepage contributes slightly to the runoff at the end of the rainy season,
when soils are saturated (12 mm yr-1
). The relative contribution of each source is consistent
with the evolution of the chemical composition during a given storm as well as during the
rainy season (Riotte et al., 2014a).
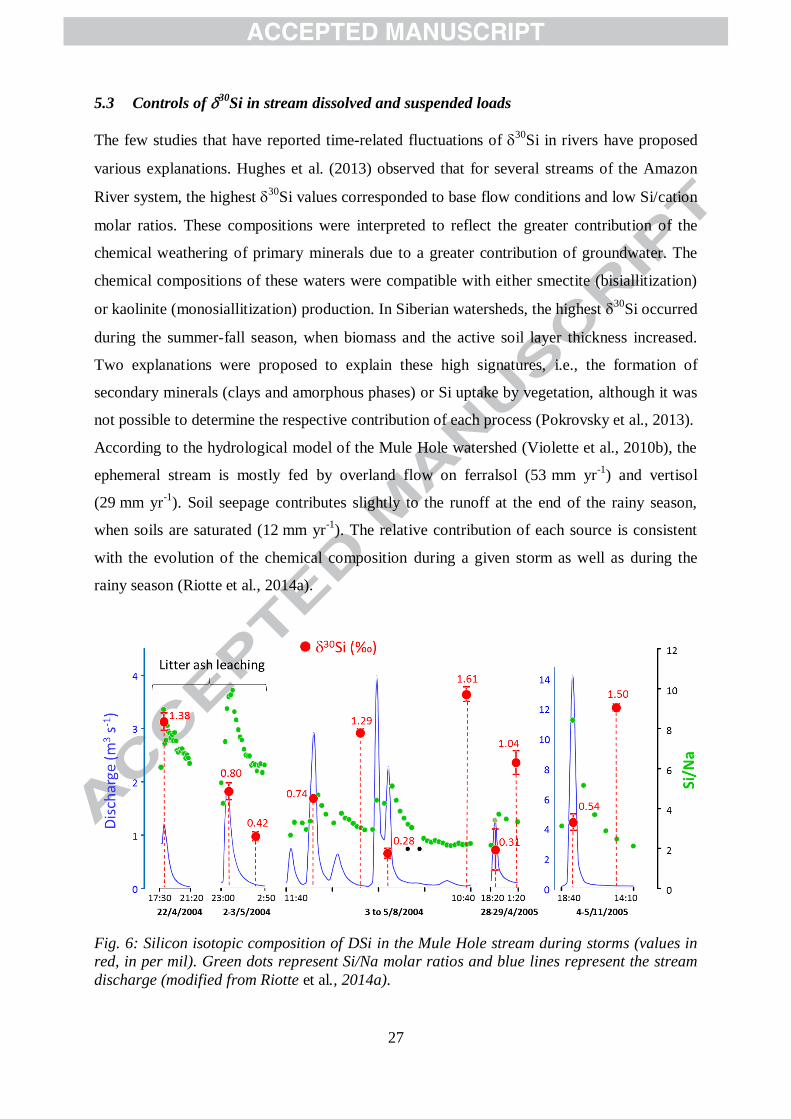
Fig. 6: Silicon isotopic composition of DSi in the Mule Hole stream during storms (values in
red, in per mil). Green dots represent Si/Na molar ratios and blue lines represent the stream
discharge (modified from Riotte et al., 2014a).
28
Both the high 30
Si values and chemical compositions during flood recession reflect the
contributions of soil seepage (Fig. 6), which is consistent with the expected water
contributions in the stream (Violette et al., 2010b; Riotte et al., 2014a). Based on the isotopic
mass balance at the soil-plant scale, it is possible to confidently assign the enrichment in the
heavy Si isotopes of soil pore water, and then of flood recession, to the combination of both
primary silicate chemical weathering and plant uptake.
Various processes have been suggested to explain the low 30
Si values in rivers. In the
Amazon Basin, the lowest 30
Si values were found in the plain (Rio Negro) and attributed to
an increase in the relative silica mobility (fSi), defined by the ratio of the Si/(Na*+K*) molar
ratio of the dissolved phase (Na and K corrected from atmospheric inputs) divided by the
same ratio of the bedrock (Hughes et al., 2013). According to these authors, the silicate
bedrock would dissolve in a congruent way, i.e., with a limited fraction of isotopically light Si
relocated to secondary clay minerals (kaolinite). Most of the 30
Si values of the large rivers of
the Amazonian basin were indeed inversely correlated to fSi, which was compatible with
Rayleigh or steady-state fractionation models. Such findings are consistent with those of
Frings et al. (2015), who used a similar proxy in the Ganga Basin, and Georg et al. (2007) in
Iceland, who used the ratio between DSi and Na as a silica mobility index. In both cases, the
role of vegetation in the 30
Si values of rivers was considered to be unlikely. However,
neglecting the role of vegetation in the case of the Amazon plain is surprising, as it is covered
by a dense forest, in which silica recycling by litter accounts for up to 1500 mol ha-1
yr-1
(Cornu et al., 1998). According to our observations at Mule Hole, the high K*/Na* values
associated with the low 30
Si values in the Amazonian rivers (Hughes et al., 2013) could also
result from the contribution of vegetation cycling. Very low 30
Si values (close to 0 ‰) were
also observed in the black rivers of the Congo Basin and interpreted to represent the
dissolution of clay minerals by organic-rich waters (Cardinal et al., 2010). In Siberian
watersheds, the low 30
Si values during spring floods (0.8‰) were assigned to the partial
dissolution of the silicate suspended load because of the high solid/solution ratio (Pokrovsky
et al., 2013). During the flow peaks of Mule Hole, the stream 30
Si is also low (0.47
± 0.22 ‰) and surprisingly lighter than the overland flow signature (1.15 ± 0.53 ‰). This is
unexpected since the stream is fed by overland flow during flow peaks. An additional DSi
source to the stream is needed. As this DSi source should exhibit a low 30
Si value, it could
correspond to the dissolution of the suspended load, as proposed by Pokrovsky et al. (2013)
for Siberian rivers. However, the average DSi concentration during these flow peaks
29
(128 ± 35 µmol L-1
) exceeds saturation with respect to kaolinite and smectite, thus making
clay dissolution unlikely. Moreover, the circum-neutral pH and low DOC content of the
stream do not favour clay mineral dissolution. An alternative explanation could be partial,
short-term (i.e., hourly) phytolith dissolution within the stream which, according to ash
leaching experiments (see section 4.3), could release light Si isotopes. If the 30
Si value of the
additional DSi source were -1 ‰, it would contribute to up to 30% of stream DSi, which is
unlikely because ash leaching experiments indicate that the kinetic isotopic fractionation that
releases light Si isotopes is expected to occur during incipient ASi dissolution (see Fig. 4).
Sampling bias thus remains the most likely cause of the difference between the 30
Si values of
the overland flow and streams.
The ASi flux exported annually by the stream as suspended load was estimated using the
2003-2014 specific runoff of 100 mm.yr-1
, the average suspended load content of 0.5 g L-1
and the average suspended load ASizb concentration of 0.44 %. The ASi specific flux exported
accounts for 89 mol ha-1
yr-1
, which represents only 4 % of the annual flux produced by litter
fall; this is in good agreement with the data from the Kaveri River, India (Meunier et al.,
2015). This also confirms that the silica mobilized by the vegetation at Mule Hole is rarely
exported as ASi but is rather accumulated or recycled within the watershed (Riotte et al.,
2014a). However, the specific ASi flux exported by the stream is close to the DSi flux for the
period 2005-2009 of 130 mol ha-1
yr-1
(Riotte et al., 2014a). Similarities in the exported ASi
and DSi were also recently observed in the Ganga River (Frings et al., 2014b) and represent
further evidence that biota play a significant role in the export of silica to the ocean.
6 Conclusion
The investigation of silicon isotopic fractionation during water-rock/soil-plant interactions in
the forested watershed of Mule Hole provided new constraints on the biogeochemical cycling
of silica in this dry tropical forest:
The 30
Si composition of amorphous Si in litter (tree leaves and grass), surface soil
horizons and the ferralsol profile is particularly homogeneous, with a range of only 1.1 to
1.4 ‰. The only exceptions are deeper horizons from the vertisol profile (in a marginal
area of the watershed) that also contain pollen taxa typical of humid forests. Phytoliths
from these horizons may thus be representative of past, more humid conditions. The
homogeneity of the 30
Si values in ASi confirms that the silicon isotope signature of
30
vegetation is “system-dependent”. Accordingly, 30
Si should be suitable for tracing the
biogenic component of silica cycling at both the soil-plant and watershed scales.
At the soil-plant scale, the 30
Si value of solutes percolating into the soil is similar to the
isotopic signature of phytoliths, which supports the biogenic origin of DSi in the soil input.
Within the soil, the assignment of 30
Si signatures to the solute elemental budget suggests
an imbalance. The isotopic equilibration of the solute budget, considering a steady-state
model for plant uptake and Rayleigh fractionation within the plants, implies a silica flux
annually taken up by vegetation that is twice as large as that first estimated from the
elemental budget (Riotte et al., 2014a). This additional Si flux, which may be stored in
woody stems, should exhibit a 30
Si value close to 0 ‰. Such a signature could be
compatible with soil ASi dissolution or deep root uptake if a steady-state model applies. If
vegetation takes up Si directly from soil particles without isotopic fractionation, then
primary silicate or Si desorption from clays could constitute possible sources. We observed
that deep groundwater exhibits the same signature as litter dissolution, meaning that biotic
(cycling through vegetation) and abiotic (silicate chemical weathering) reactions may lead
to comparable 30
Si signatures.
Ephemeral stream storms tend to display low 30
Si values during peak flows, whereas
high 30
Si values are observed during recessions, but only at the end of the rainy season,
when soils are saturated. This pattern has been observed in most previous river studies.
The chemical and isotopic compositions of stream recessions tend consistently towards
soil pore water compositions, in agreement with the hydrological functioning of such an
ecosystem. However, a slight difference was observed between the 30
Si values of
overland flow, which feeds the stream during flood peaks, and those of the stream. The
contribution of clay mineral dissolution from the suspended load is unlikely, given the
DSi concentration in the stream. We suggest that this slight difference results from a bias
in overland flow sampling.
As a broader conclusion, it appears that stable silicon isotope fractionation provides
significant insights into the processes controlling the biogeochemical cycle of silica in
ecosystems, but only if water and elemental mass balances are already well constrained.
Acknowledgments
31
The Mule Hole basin is part of the ORE-BVET project (Observatoire de Recherche en
Environnement – Bassin Versant Expérimentaux Tropicaux, http://bvet.omp.obs-
mip.fr/index.php/eng/) supported by the French Institute of Research for Development (IRD),
CNRS and Toulouse University. The project also benefited from funding from INSU/ CNRS
(Institut National des Sciences de l’Univers/Centre National de la Recherche Scientifique)
through the French program EC2CO (Ecosphère Continentale et Côtière) and from the ACI-
Eau. The authors are thankful to the Associate Editor, Jan Wiederhold, to Sophie Opfergelt
and the two anonymous reviewers for their numerous comments and corrections that greatly
improved the quality of the manuscript. Sebastien Carretier and Vincent Regard are thanked
for their help in calculations of error propagation. We thank the Karnataka Forest Department
and the staff of the Bandipur National Park for all the facilities and support they provided.
32
Figure & tables captions
Figure 1: The Mule Hole watershed with soil and vegetation map, showing the sampling
location of composite soils (plots A, B, C, D; see text for description), soil profiles, overland
flow and ground water (modified from Riotte et al., 2014a). ATT (medium green):
Anogeissus – Tectona – Terminalia facies. Dark green: swamp facies; light green: Shorea
facies.
Figure 2: Phytolith morphotypes and diatom contents in suspended load and soils of Mule
Hole. ATT = Anogeissus – Tectona – Terminalia facies. ND = non-diagnostic.
Figure 3: Influence of purity on 30
Si signatures in the ASizb fractions of surface soils, soil
profiles and suspended load in Mule Hole. Purity index is defined as (Si-
(Al+Fe+Ca+Mg+Mn, K))/Si. Purity index values of fresh litter and clays are theoretical. OF=
overland flow. This diagram shows that despite being apparently pure under microscope, the
ASi fraction separated by dense liquor can still contain significant amounts of impurities that
can impact the 30
Si signature of this fraction. Correcting for impurities allows us to recover
the 30
Si value of the pure ASi fraction.
Figure 4: Evolution of 30
Si in the dissolved phase of ash leaching experiments with the
percentage of dissolved litter-Si (fraction of Si release divided by the total Si content in the
bulk litter). Grey area: range of phytolith compositions found in this study. Open circles:
phytolith dissolution experiments from Ziegler et al. (2005), with dotted line representing the
isotopic composition of the phytolith.
Figure 5: Isotopic budget at the soil-plant scale in the Mule Hole watershed, with the annual
Si flux (bold; in mol ha-1
yr-1
) and its 30
Si value (italic; in ‰) for each compartment. Values
in black were measured, those in red were inferred from elemental and/or isotopic mass
balance. This budget was performed in three steps: (1) primary isotopic budget based on the
elemental Si budget from Riotte et al. (2014a), (2) deduction of woody stem storage that
balances the plant budget of part 1, (3) additional fluxes from the soil layer needed to
equilibrate the whole isotopic soil-plant budget. Blue text: DSi fluxes related to water fluxes.
Grey text: DSi flux released from minerals (independent from water budget). Uncertainties
given by Riotte et al. (2014a) for computed water fluxes (20%) were used for the dissolved
chemical fluxes. Uncertainty associated with the average measured litter flux is considered as
the variability between the two measured years 2009 and 2010 (Riotte et al., 2014a).
Figure 6: Silicon isotopic composition of DSi in the Mule Hole stream during storms (values
in red, in per mil). Green dots represent Si/Na molar ratio and blue lines represent the stream
discharge (modified from Riotte et al., 2014a).
33
References
Abraham K., Opfergelt S., Fripiat F., Cavagna A., de Jong J., Foley S., André L. and Cardinal
D. (2008) 30
Si and 29
Si Determinations on USGS BHVO-1 and BHVO-2 Reference Materials
with a New Configuration on a Nu Plasma Multi-Collector ICP-MS. Geostand. Geoanal. Res.
32, 193-202.
Alexandre A., Meunier J.D., Colin F., Koud J.M. (1997) Plant impact on the biogeochemical
cycle of silicon and related weathering processes. Geochim. Cosmochim. Acta, 61, 677–682.
Alexandre A., Bouvet M., Abbadie L., (2011) The role of savannas in the terrestrial Si cycle:
a case-study from Lamto, Ivory Coast. Global Planet. Changes 78, 162–169.
Ameijeiras-Mariño Y., Opfergelt S., Schoonejans J., Vanacker V., Sonnet P., de Jong J.,
Delmelle P. (2017) Impact of low denudation rates on soil chemical weathering intensity: A
multiproxy approach. Chem. Geol., 456, 72-84.
Anupama K., S. Prasad, C. S. Reddy (2014) Vegetation, land cover and land use changes of
the last 200 years in the Eastern Ghats (southern India) inferred from pollen analysis of
sediments from a rain-fed tank and remote sensing. Quat. Int. 325, 93–104.
Audry S., Akerman A., Riotte J., Oliva P., Maréchal J.C., Fraysse F., Pokrovsky O., Braun
J.J. (2014) Contribution of forest fire ash and plant litter decay on stream dissolved
composition in a sub-humid tropical watershed (Mule Hole, Southern India). Chem. Geol.
372, 144-161.
Baram S., Ronen Z., Kurtzman D., Külls C., Dahan O. (2013) Desiccation-crack-induced
salinization in deep clay sediment, Hydrol. Earth Syst. Sci., 17, 1533–1545.
Barbiero L., Parate H. R., Descloitres M., Bost A., Furian S., Mohan Kumar M. S., Kumar C.
and Braun J. J. (2007) Using a structural approach to identify relationships between soil and
erosion in a semi-humid forested area, South India. Catena 70, 313–329.
Barbiero L., Mohan Kumar M.S., Violette A., Oliva P., Braun J.J., Kumar C., Furian S.,
Babic M., Riotte J., Valles V. (2010) Soil transformations through ferrolysis induced by
recent natural drainage in Vertisols of 1 sub-humid South India. Geoderma 156, 173-188.
Barboni D., R. Bonnefille (2001) Precipitation signal in pollen rain from tropical forests,
South India. Rev. Palaeobot. Palynol. 114, 239–258.
34
Barboni D., R. Bonnefille, S. Prasad, B. R. Ramesh (2003) Variation in modern pollen from
tropical evergreen forests and the monsoon seasonality gradient in SW India. J. Veg. Sci. 14,
551–562.
Bartoli F. and Wilding L.P. (1980) Dissolution of biogenic opal as a function of its physical
and chemical pool in the terrestrial silicon cycle. Nature 433, 399-402.
Blecker S.W., McCulley R. L., Chadwick O. A., and Kelly E. F. (2006) Biologic cycling of
silica across a grassland bioclimosequence. Global Biogeochem. Cycles, 20,
doi:10.1029/2006GB002690.
Bouchez J., von Blanckenburg F., A. Schuessler J. (2013) Modeling novel stable isotope
ratios in the weathering zone. Am. J. Sci. 313, 267-308.
Braun J.J., Descloitres M., Riotte J., Fleury S., Barbiero L., Boeglin J.L., Violette A., Lacarce
E., Ruiz L., Sekhar M., Mohan Kumar M.S., Subramanian S., Dupré B. (2009) Regolith mass
balance inferred from combined mineralogical, geochemical and geophysical studies: Mule
Hole gneissic watershed, South India. Geochim. Cosmochim. Acta 73, 935-961.
Braun, J.-J., Riotte, J., Battacharya, S., Violette, A., Prunier, J., Bouvier, V., Candaudap F.,
Maréchal J.C., Ruiz L., Rekha Panda S., Subramanian, S. (2017) REY-Th-U solute dynamics
in the critical zone: Combined influence of chemical weathering, atmospheric deposit
leaching, and vegetation cycling (mule hole watershed, South India). Geochem., Geophys.,
Geosys., 18. https://doi.org/10.1002/2017GC007158
Cardinal D., Gaillardet J., Hughes H. J., Opfergelt S. and André L. (2010) Contrasting silicon
isotope signatures in rivers from the Congo Basin and the specific behaviour of organic‐rich
waters. Geophys. Res. Lett. 37, doi:10.1029/2010GL043413.
Cary L., Alexandre A., Meunier J.D., Boeglin J.L., Braun J.J. (2005) Contribution of
phytoliths to the suspended load of biogenic silica in the Nyong basin rivers (Cameroon).
Biogeochem.74, 101–114.
Collura L. V., K. Neumann, (2016) Wood and bark phytoliths of West African woody plants.
Quat. Intern. http://dx.doi.org/10.1016/j.quaint.2015.12.070
Cornelis and Delvaux (2016) Soil processes drive the biological silicon feedback loop. Funct.
Ecol. 30, 1298–1310. doi: 10.1111/1365-2435.12704
Cornu S., Lucas Y., Ambrosi J. P. and Desjardins T. (1998) Transfer of dissolved Al, Fe and
Si in two amazonian forest environments in Brazil. Eur. J. Soil Sci. 49, 377–384.
35
De La Rocha, C.L., Brzezinski, M.A., DeNiro, M.J., 1997. Fractionation of silicon isotopes
by marine diatoms during biogenic silica formation. Geochim. Cosmochim. Acta 61, 5051–
5056.
Delstanche S., Opfergelt S. Cardinal D. Elsass F. André L., Delvaux L. (2009) Silicon
isotopic fractionation during adsorption of aqueous monosilicic acid onto iron oxide.
Geochim. Cosmochim. Acta, 73, 923-934.
Demarest M.S., Brzezinski M.A., Beucher C.P. (2009) Fractionation of silicon isotopes
during biogenic silica dissolution. Geochim. Cosmochim. Acta, 73, 5572–5583.
Derry L.A., Kurtz A.C., Ziegler K. and Chadwick O.A. (2005) Biological control of terrestrial
silica cycling and export fluxes to watersheds. Nature, 433, 728-731.
Ding T., Ma G., Shui M., Wan D. and Li R. (2005) Silicon isotope study on rice plants from
the Zhejiang province, China. Chem. Geol. 218, 41-50.
Ding T.P., Zhou J.X., Wan D.F., Chen Z.Y., Wang C.Y., Zhang F. (2008) Silicon isotope
fractionation in bamboo and its significance to the biogeochemical cycle of silicon. Geochim.
Cosmochim. Acta, 72, 1381-1395.
Dupuis R., Benoit M., Nardin E., Meheut M. (2015) Fractionation of silicon isotopes in
liquids: The importance of configurational disorder. Chem. Geol., 396, 239-254.
Engström E., Rodushkin I., Öhlander B., Ingri J., Baxter D.C. (2008) Silicon isotopic
composition of boreal forest vegetation in Northern Sweden. Chem. Geol., 257, 247–256.
Engström E., Rodushkin I., Ingri J., Baxter D.C., Ecke F., Österlund H. and Öhlander B.
(2010) Temporal isotopic variations of dissolved silicon in a pristine boreal river. Chem.
Geol. 271, 142–152
Faegri K., Iversen J., Kaland P.E., Krzywinski K. (1991) Text Book of Pollen Analysis
(fourth ed.) John Wiley and Sons Ltd, 328p.
Fraysse F., Pokrovsky O.S. and Meunier J.D. (2010) Experimental study of terrestrial plant
litter interaction with aqueous solutions. Geochim. Cosmochim. Acta 74, 70-84.
Frings P. J., De La Rocha C., Struyf E., van Pelt D., Schoelynck J., Hudson J.M., Gondwe M.
J., Wolski P., Mosimane K., Gray W., Schaller J., Conley D.J. (2014a) Tracing silicon cycling
in the Okavango Delta, a sub-tropical flood-pulse wetland using silicon isotopes Geochim.
Cosmochim. Acta, 142, 132–148.
Frings P.J., Clymans W., Conley D.J. (2014b) Amorphous silica transport in the Ganges
basin: Implications for Si delivery to the oceans. Proc. Earth Planet. Sci. 10, 271-274.
36
Frings P.J., Clymans W., Fontorbe G., Gray W., Chakrapani G.J., Conley D.J., De La Rocha
C.L. (2015) Silicate weathering in the Ganges alluvial plain. Earth Planet. Sci. Lett. 427, 136–
148.
Frings P.J., Clymans W., Fontorbe G., De La Rocha C., Conley D.J. (2016) The continental Si
cycle and its impact on the ocean Si isotope budget. Chem. Geol. 425, 12-36.
Geilert S., Vroon P.Z., Roerdink D.L., Van Cappellen P., van Bergen M.J. (2014) Silicon
isotope fractionation during abiotic silica precipitation at low temperatures: Inferences from
flow-through experiments. Geochim. Cosmochim. Acta 142, 95–114.
Georg R.B., Reynolds B.C., Frank M. and Halliday A.N. (2006) Mechanisms controlling the
silicon isotopic compositions of river waters. Earth Planet. Sci. Lett. 249, 290-306.
Georg R.B., Reynolds B.C., West A.J., Burton K.W., Halliday A.N. (2007) Silicon isotope
variations accompanying basalt weathering in Iceland. Earth Planet. Sci. Lett. 261, 476–490.
Gunnarsson I. and Arnorsson S. (2000) Amorphous silica solubility and the thermodynamic
properties of H4SiO4 in the range of 0 to 350 °C at Psat. Geochim. Cosmochim. Acta 64, 2295–
2307.
Huang T.C. (1972) Pollen Flora of Taiwan. National Taiwan University Botany Department
Press.
Hughes H. J., Sondag F., Cocquyt C., Laraque A., Pandi A., André L., Cardinal D. (2011)
Effect of seasonal biogenic silica variations on dissolved silicon fluxes and isotopic signatures
in the Congo River. Limnol. Oceanogr., 56, 551–561.
Hughes H. J., Sondag F., Santos R. V., André L., Cardinal D. (2013) The riverine silicon
isotope composition of the Amazon Basin. Geochim. Cosmochim. Acta 121, 637-651.
ICPN Working Group, M. Madella, A. Alexandre, T. Ball, (2005) International Code for
Phytolith Nomenclature 1.0. Ann Bot. 96, 253–260.
Jouquet P., Caner L., Bottinelli N., Chaudhary E., Cheik S., Riotte J. (2017) Where do south-
Indian termite mound soils come from? Appl. Soil Ecol. 117–118, 190–195.
Kelly E.F. (1990) Method for Extracting Opal Phytoliths from Soil and Plant Material. Intern.
Rep. Dep. Agron. Colorado State Univ., Fort Collins.
Kjaer E.D., Kajornsrichon S. and Lauridsen E. B. (1999) Heartwood, Calcium and Silica
Content in Five Provenances of Teak (Tectona grandis L.) Silvae Genetica 48(1), 1-3.
37
Krishnan S., N. P. Samson, P. Ravichandran, D. Narasimhan, P. Dayanandan (2000)
Phytoliths of Indian grasses and their potential use in identification. Botanical Journal of the
Linnean Society. 132, 241–252.
Louvat P. and Allegre C.J. (1997) Present day denudation rates on the island of Réunion
determined by river geochemistry: basalt weathering and mass budget between chemical and
mechanical erosions. Geochim. Cosmochim. Acta 61, 3645-3669.
Lucas Y., Luizão F.J., Chauvel A., Rouiller J., Nahon D. (1993) The relation between
biological activity of the rainforest and mineral composition of the soils. Science 260, 521–23.
Lucas Y. (2001) The role of plants in controlling rates and products of weathering:
Importance of Biological pumping. Annu. Rev. Earth Planet. Sci. 29, 135-163.
Madella M., Alexandre A., Ball T. (2005) International Code for Phytolith Nomenclature 1.0.
Ann. Bot. 96, 253-260.
Maréchal J.C., Murari R.R.V., Riotte J., Vouillamoz J.M., Mohan Kumar M.S., Ruiz L.,
Muddu S. and Braun J.J. (2009) Indirect and direct recharges in a tropical forested watershed:
Mule Hole, India. J. Hydrol. 364, 272-284.
Maréchal J.C., Riotte J., Lagane C., Subramanian S., Kumar C., Ruiz L., Audry S., Murari V.,
Braun J.J. (2011) Chemical groundwater outputs from a small drainage watershed: Mule
Hole, South India. Appl. Geochem. 26, S94-S96.
Martin J.M. and Meybeck M. (1979) Elemental Mass-Balance of Material Carried by Major
World Rivers. Mar. Chem. 7, 173-206.
Méheut M., Schauble E.A. (2014) Silicon isotope fractionation in silicate minerals: Insights
from first-principles models of phyllosilicates, albite and pyrope. Geochim. Cosmochim. Acta,
134, 137-154
Meunier J.D., Alexandre A., Colin F., Braun J.J. (2001) Intérêt de l'étude du cycle
biogéochimique du silicium pour interpréter la dynamique des sols tropicaux. Bull. Soc. Geol.
Fra. 172, 533-538.
Meunier J. D., Keller C., Guntzer F., Riotte J., Braun J.J., Krishnamurty A. (2014)
Assessment of the 1% Na2CO3 technique to quantify the phytolith pool. Geoderma, 216, 30-
35.
Meunier J.D., Riotte J., Braun J.J., Muddu S., Chalié F., Barboni D. Saccone L. (2015)
Controls of DSi in streams and reservoirs along the Kaveri River, South India. Sci. Tot. Env.
502, 103-113.
38
Moore P.D., Webb J.A., Collinson M.E. (1991) Pollen Analysis (second ed.) Blackwell
Scientific Publications, 216 p.
Nayar T.S. (1990) Pollen Flora of Maharashtra State, India. Today and Tomorrow's Printers
and Publishers, New Delhi, 157 p.
Nesbitt H. W. and Young G. M. (1982) Early Proterozoic climates and plate motions inferred
from major element chemistry of lutites. Nature 299, 715–717.
Opfergelt S., Cardinal D., Henriet C., Draye X., André L., Delvaux B. (2006) Silicon isotopic
fractionation by banana (Musa spp.) grown in a continuous nutrient flow device. Plant Soil
285, 333-345.
Opfergelt S., de Bournonville G., Cardinal D., André L., Delstanche S., Delvaux B. (2009)
Impact of soil weathering degree on silicon isotopic fractionation during adsorption onto iron
oxides in basaltic ash soils, Cameroon. Geochim. Cosmochim. Acta, 73, 7226–7240.
Opfergelt S., Georg R.B., Delvaux B., Cabidoche Y.M., Burton K.W., Halliday A.N. (2012)
Silicon isotopes and the tracing of desilication in volcanic soil weathering sequences,
Guadeloupe. Chem. Geol. 326–327, 113–122.
Opfergelt S. and Delmelle P. (2012) Silicon isotopes and continental weathering processes:
Assessing controls on Si transfer to the ocean. C. R. Geoscience 344, 723–738.
Parate H.R., M. S. Mohan Kumar, Descloitres M., Barbiero L., Ruiz L., Braun J.J., M. Sekhar
and C. Kumar (2011) Comparison of electrical resistivity by geophysical method and neutron
probe logging for soil moisture monitoring in a forested watershed. Curr. Sci., 100, 1405-
1412.
Parker A. (1970) An index of weathering for silicate rocks. Geol. Mag., 501–504.
Parkhurst D.L. and Appelo C.A.J. (1999) User's guide to PHREEQC (Version 2)-A computer
program for speciation, batch-reaction, one-dimensional transport, and inverse geochemical
calculations. US Geological Survey Water-Resources Investigations Report.
Piperno D. R. (2006) Phytoliths: A Comprehensive Guide for Archaeologists and
Paleoecologists. Rowman Altamira. 238p.
Poitrasson F. and Zambardi T. (2015) An Earth-Moon silicon isotope model to track silicic
magma origins. Geochim. Cosmochim. Acta, 167, 301-312.
Poitrasson, F. (2017) Silicon isotope geochemistry. In: Teng, F.Z., Watkins, J.M., Dauphas,
N. (Eds.), Non-traditional stable isotopes. Rev. in Min. Geochem. Mineralogical Society of
America, Washington, D.C., 289-344.
39
Pokrovsky O.S., Reynolds B.C., Prokushkin A.S., Schott J., Viers J. (2013) Silicon isotope
variations in Central Siberian rivers during basalt weathering in permafrost-dominated larch
forests. Chem. Geol. 355, 103–116.
Riotte J., Maréchal J.C., Audry S., Kumar C., Bedimo J.P., Ruiz L., Sekhar M., Cisel M.,
Chitra Tarak R., Varma M.R.R., Lagane C., Reddy P. and Braun J.J. (2014a) Vegetation
impact on stream chemical fluxes: Mule Hole watershed (South India). Geochim. Cosmochim.
Acta 145, 116-138.
Riotte J., Ruiz L., Audry S., Sekhar M., Mohan Kumar M.S., Siva Soumya B. and Braun J.J.
(2014b) Impact of vegetation and decennial rainfall fluctuations on the weathering fluxes
exported from a dry tropical forest (Mule Hole). Proc. Earth Planet. Sci. 10, 34-37.
Riotte J., Sandhya K., Prakash N.B., Audry S., Zambardi T., Chmeleff J., Buvaneshwari S.,
Meunier J.D. (2017) Origin of silica in rice plants and contribution of diatom earth
fertilization: insights from isotopic Si mass balance in a paddy field. Plant and Soil. DOI:
10.1007/s11104-017-3535-z
Ruiz L., Varma M.R.R., Mohan Kumar M.S., Sekhar M., Maréchal J.C., Descloitres M.,
Riotte J., and Braun J.J. (2010) Water balance modelling in a tropical watershed under
deciduous forest (Mule Hole, India): regolith matric storage buffers the groundwater recharge
process. J. Hydrol., 380, 460-472.
Saccone L., Conley D.J., Koning E., Sauer D., Sommer M., Kaczorek D., Blecker S.W., Kelly
E.F. (2007) Assessing the extraction and quantification of amorphous silica in soils of forest
and grassland ecosystems. Eur. J. Soil Sci. 58, 1446–1459.
Saccone L., Conley D.J., Likens G.E., Bailey S.W., Buso D.C., Johnson C.E. (2008) Factors
that Control the Range and Variability of Amorphous Silica in Soils in the Hubbard Brook
Experimental Forest. Soil Sci. Soc. Am. J., 72, 1637-1644.
Savage P.S., Georg R.B., Williams H.M., Turner S., Halliday A.N. and Chappell B.W. (2012)
The silicon isotope composition of granites. Geochim. Cosmochim. Acta, 92, 184-202.
Savage P.S., Armytage R.M.G., Georg R.B., Halliday A.N. (2014) High temperature silicon
isotope geochemistry. Lithos 190–191, 500–519.
Shadakshara Swamy N., Jayananda M. and Janardhan A. S. (1995) Geochemistry of
Gundlupet gneisses, Southern Karnataka: a 2.5 Ga old reworked sialic crust. In: Yoshida,
M., Santosh, M., and Rao, A. T. Eds.), India as a fragment of East Gondwana. Gondwana
Research Group.
40
Steinhoefel G., Breuerb J. , von Blanckenburg F., Hornc I., Sommer M. (2017) The dynamics
of Si cycling during weathering in two small catchments in the Black Forest (Germany) traced
by Si isotopes. Chem. Geol., 466, 389-402.
Sun Y., Wu L., Li X., Sun L., Gao J., Ding T., Zhu Y. (2017) Silicon Isotope Fractionation in
Maize and its Biogeochemical Significance. Anal. Lett. 50, 2475-2490.
Sun Y., Wu L. H., Li X. (2016) Experimental Determination of Silicon Isotope Fractionation
in Rice. PLoS ONE 11(12): e0168970. doi:10.1371/journal.pone.0168970.
Tissot C., Chikhi H., Nayar T.S. (1994) Pollen of Wet Evergreen Forests of the Western
Ghats, India. Publications du departement d'ecologie, Institut Francais de Pondichery, 133p.
Treguer P.J., De La Rocha C.L. (2013) The World Ocean Silica Cycle. In: Carlson, C.A.,
Giovannoni, S.J. (Eds.), Annual Review of Marine Science, 5. Annual Reviews, Palo Alto,
477-501.
Vasanthy G. (1976) Pollen of the South Indian Hills, Institut Francais de Pondichery (1976),
74p.
Violette A., Riotte J., Braun J.J., Oliva P., Maréchal J.C., Sekhar M., Jeandel C.,
Subramanian S., Barbiero L. and Dupré B. (2010a) Formation and preservation of pedogenic
carbonates in South India, links with paleomonsoon and pedological conditions: Clues from
Sr isotopes, U-Th series and REEs, Geochim. Cosmochim. Acta 74, 7059-7085.
Violette A., Goddéris G., Maréchal J.M., Riotte J., Oliva P., Mohan Kumar M.S., Sekhar M.,
Braun J.J. (2010b) Modeling the chemical weathering fluxes at the watershed scale in the
Tropics (Mule Hole, South India): Relative contribution of the smectite/kaolinite assemblage
versus primary minerals. Chem. Geol. 277, 42-60.
Wetzel F., de Souza G.F., Reynolds B.C. (2014) What controls silicon isotope fractionation
during dissolution of diatom opal? Geochim. Cosmochim. Acta, 131, 128-137.
Zambardi T. and Poitrasson F. (2011) Precise Determination of Silicon Isotopes in Silicate
Rock Reference Materials by MC-ICP-MS. Geostandards and Geoanalytical Research, 35,
89-99.
Ziegler K., Chadwick O.A., Brzezinski M.A. and Kelly E.F. (2005) Natural variations of 30
Si
ratios during progressive basalt weathering, Hawaiian Islands. Geochim. Cosmochim. Acta 69,
4597-4610.
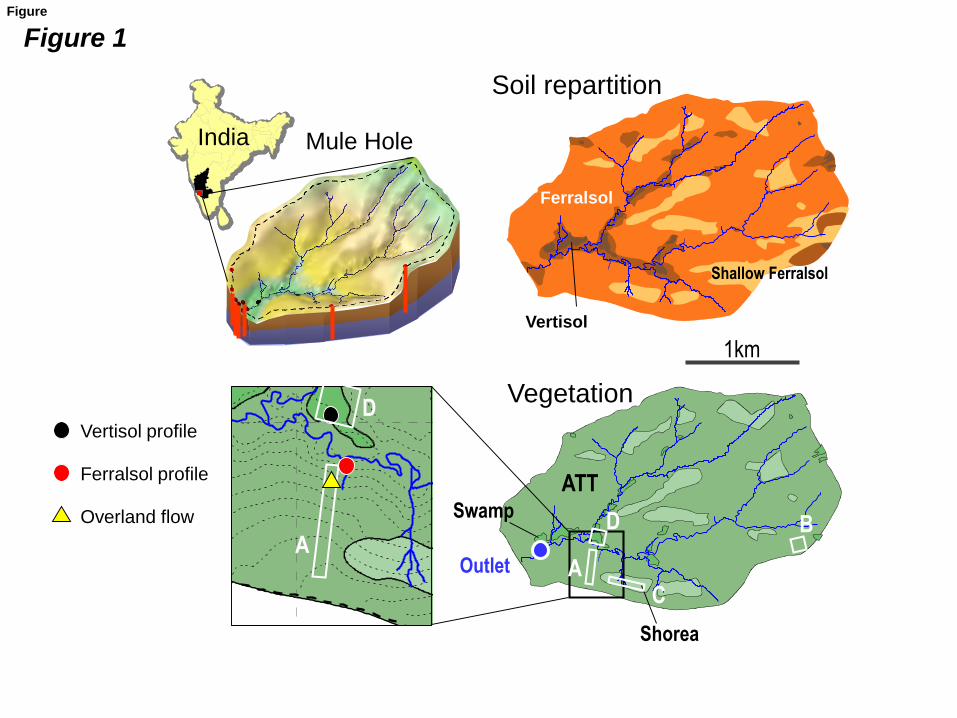
Figure 1
Vegetation
Ferralsol
Shallow Ferralsol
Shorea
ATTSwamp
Soil repartition
Vertisol
ATT
Shorea
Swamp
656500 657000 657500 658000 658500 659000
UTM coordinates (WGS 84, in m)
1297000
1297500
1298000
1298500
UT
M c
oo
rdin
ate
s (
WG
S 8
4,
in m
)
1km
12.012.0India Mule Hole
A
B
C
DA
DVertisol profile
Ferralsol profile
Overland flow
Outlet
Figure
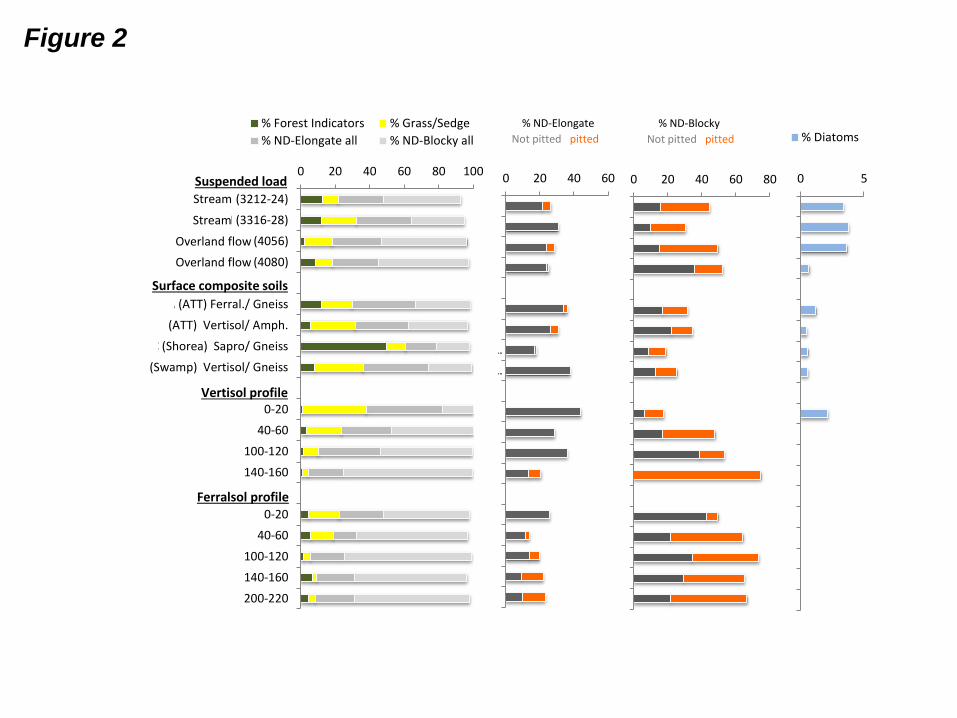
Figure 2
0 5
SM MH (3212-24)
SM MH (3316-28)
SM OF (4056)
SM OF (4080)
A (ATT) Ferral./ Gneiss
B (ATT) Vertisol/ Amph.
C (Shorea) Sapro/ Gneiss
D (Swamp) Vertisol/ Gneiss
0-20
40-60
100-120
140-160
0-20
40-60
100-120
140-160
200-220
% Diatoms
0 20 40 60 80
SM MH (3212-24)
SM MH (3316-28)
SM OF (4056)
SM OF (4080)
A (ATT) Ferral./ Gneiss
B (ATT) Vertisol/ Amph.
C (Shorea) Sapro/ Gneiss
D (Swamp) Vertisol/ Gneiss
0-20
40-60
100-120
140-160
0-20
40-60
100-120
140-160
200-220
0 20 40 60
SM MH (3212-24)
SM MH (3316-28)
SM OF (4056)
SM OF (4080)
A (ATT) Ferral./ Gneiss
B (ATT) Vertisol/ Amph.
C (Shorea) Sapro/…
D (Swamp) Vertisol/…
0-20
40-60
100-120
140-160
0-20
40-60
100-120
140-160
200-220
0 20 40 60 80 100
SM MH (3212-24)
SM MH (3316-28)
SM OF (4056)
SM OF (4080)
A (ATT) Ferral./ Gneiss
B (ATT) Vertisol/ Amph.
C (Shorea) Sapro/ Gneiss
D (Swamp) Vertisol/ Gneiss
0-20
40-60
100-120
140-160
0-20
40-60
100-120
140-160
200-220
% Forest Indicators % Grass/Sedge
% ND-Elongate all % ND-Blocky all
Suspended load
Surface composite soils
Vertisol profile
Ferralsol profile
Not pitted pitted
% ND-Elongate % ND-Blocky
Not pitted pitted
Stream
Stream
Overland flow
Overland flow
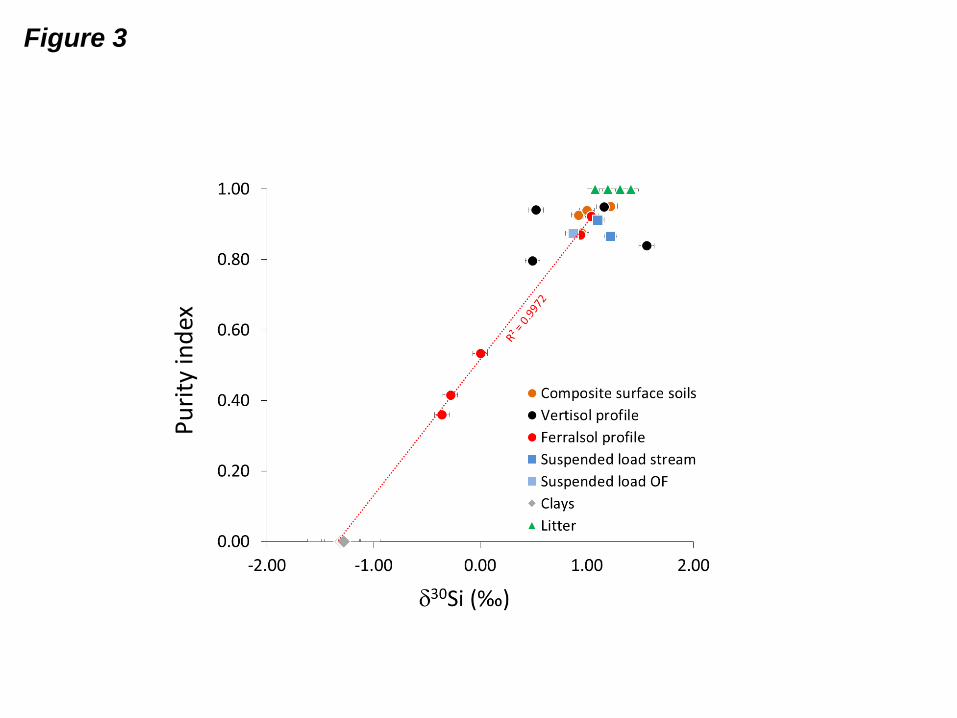
Figure 3
Pu
rity
ind
ex
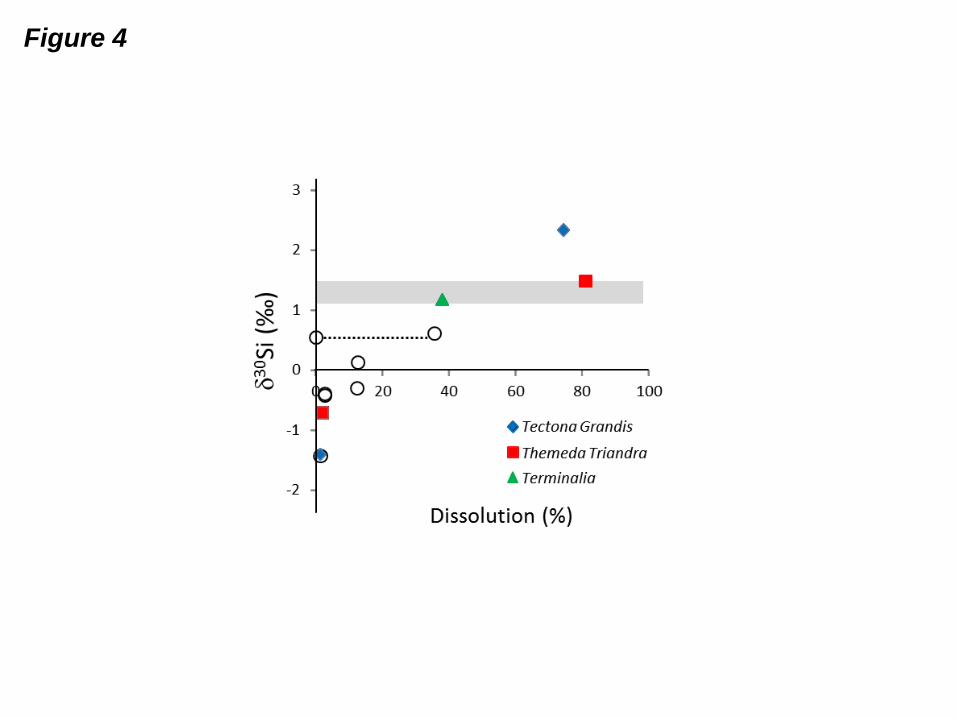
Figure 4
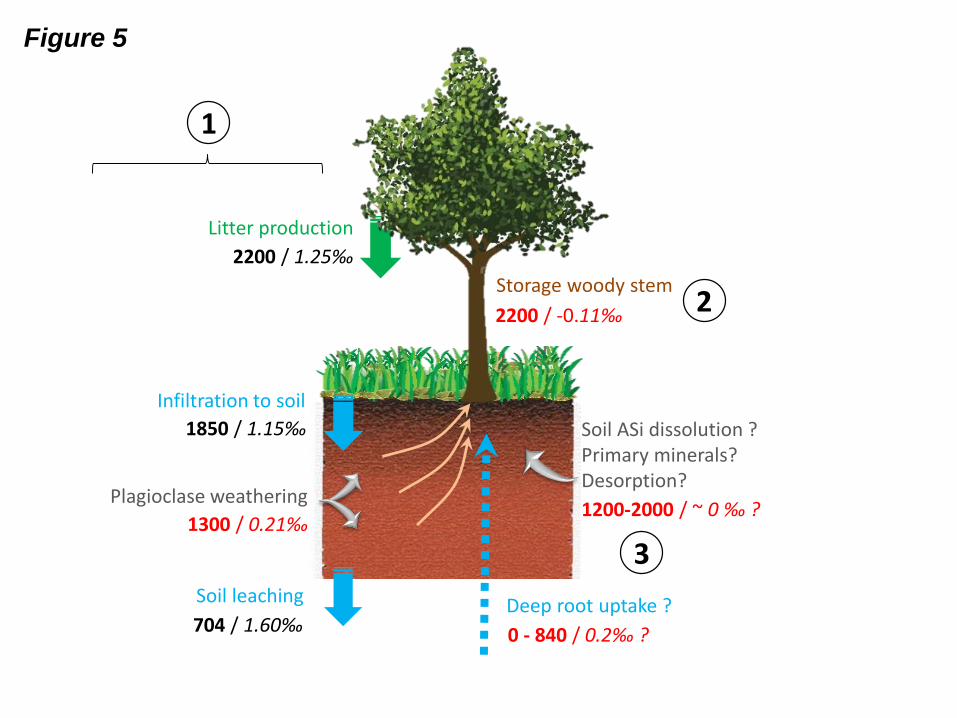
Figure 5
Soil leaching
1300 / 0.21‰
Plagioclase weathering
Storage woody stem
Litter production
2200 / 1.25‰
2200 / -0.11‰
Infiltration to soil
1850 / 1.15‰
704 / 1.60‰Deep root uptake ?
0 - 840 / 0.2‰ ?
1200-2000 / ~ 0 ‰ ?
Soil ASi dissolution ?Primary minerals?Desorption?
1
3
2
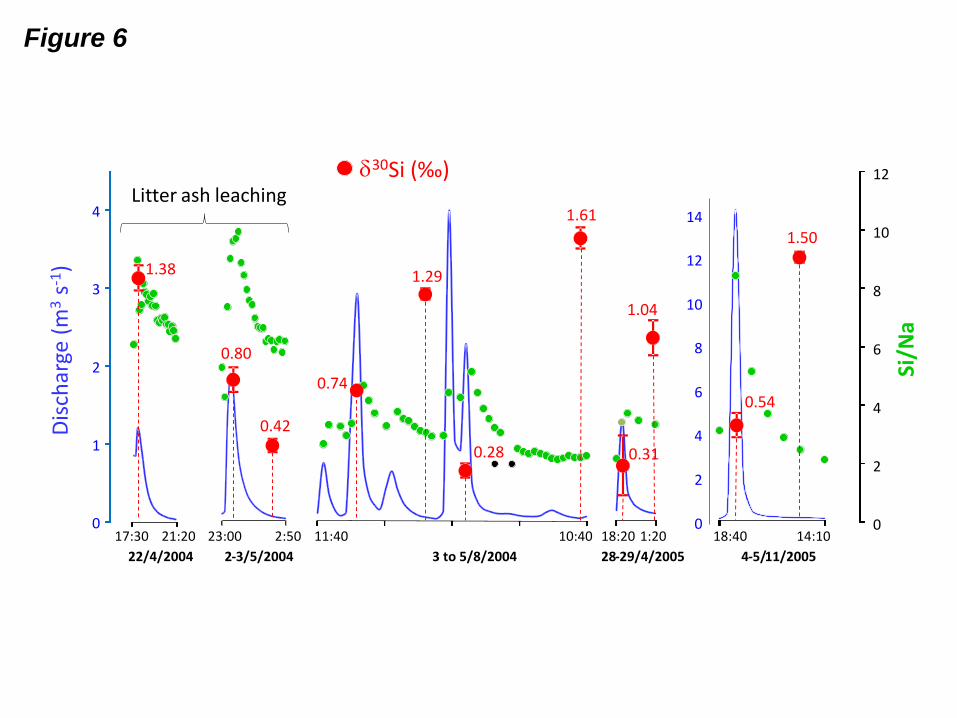
Figure 6
0
1
2
3
4
0
2
4
6
8
10
12
Si/N
a
Dis
char
ge(m
3s-1
)
17:30 21:20
22/4/2004
23:00 2:50
2-3/5/2004
11:40 10:40
3 to 5/8/2004
18:20 1:20
28-29/4/2005
0
2
4
6
8
10
12
14
18:40 14:10
4-5/11/2005
1.50
0.54
0.31
1.04
1.61
0.28
1.29
0.74
0.42
0.80
1.38
Litter ash leachingd30Si (‰)
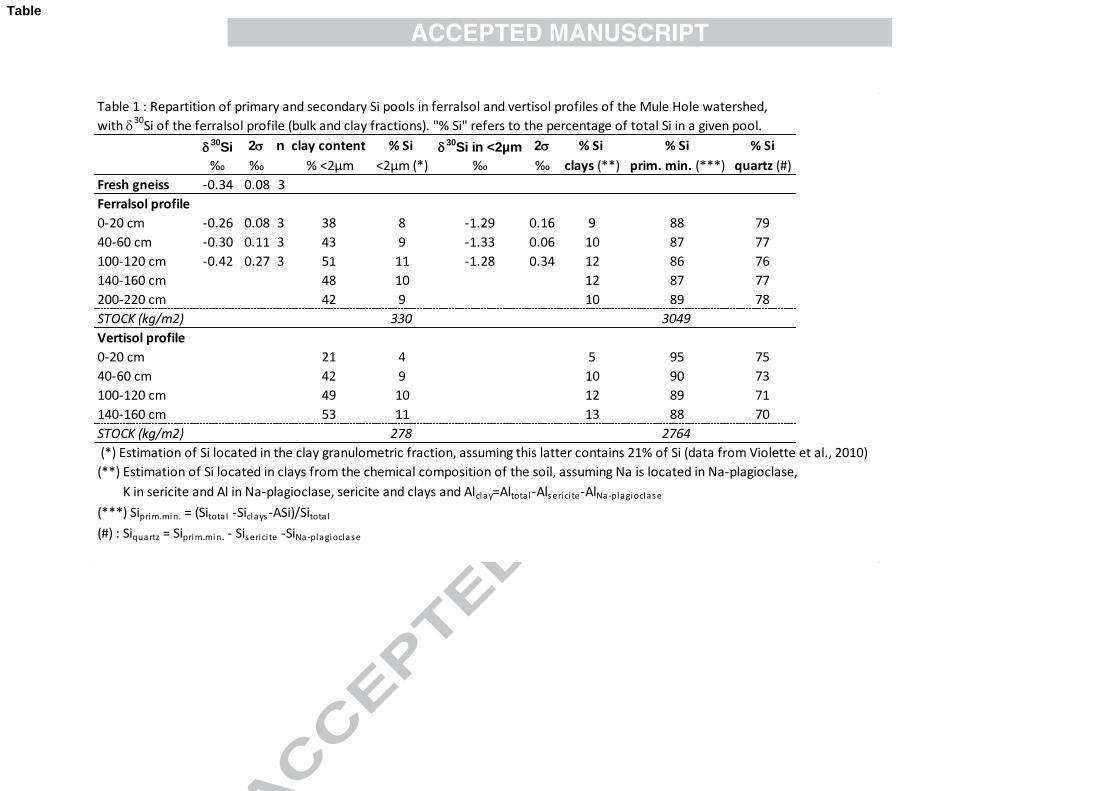
Table 1 : Repartition of primary and secondary Si pools in ferralsol and vertisol profiles of the Mule Hole watershed,
with d30
Si of the ferralsol profile (bulk and clay fractions). "% Si" refers to the percentage of total Si in a given pool.
d30
Si 2s n clay content % Si d30
Si in <2µm 2s % Si % Si % Si
‰ ‰ % <2µm <2µm (*) ‰ ‰ clays (**) prim. min. (***) quartz (#)
Fresh gneiss -0.34 0.08 3
Ferralsol profile
0-20 cm -0.26 0.08 3 38 8 -1.29 0.16 9 88 79
40-60 cm -0.30 0.11 3 43 9 -1.33 0.06 10 87 77
100-120 cm -0.42 0.27 3 51 11 -1.28 0.34 12 86 76
140-160 cm 48 10 12 87 77
200-220 cm 42 9 10 89 78
STOCK (kg/m2) 330 3049
Vertisol profile
0-20 cm 21 4 5 95 75
40-60 cm 42 9 10 90 73
100-120 cm 49 10 12 89 71
140-160 cm 53 11 13 88 70
STOCK (kg/m2) 278 2764
(*) Estimation of Si located in the clay granulometric fraction, assuming this latter contains 21% of Si (data from Violette et al., 2010)
(**) Estimation of Si located in clays from the chemical composition of the soil, assuming Na is located in Na-plagioclase,
K in sericite and Al in Na-plagioclase, sericite and clays and Alclay=Altota l-Alserici te-AlNa-plagioclase
(***) Siprim.min. = (Sitota l -Siclays-ASi)/Sitota l
(#) : Siquartz = Siprim.min. - Siserici te -SiNa-plagioclase
Table
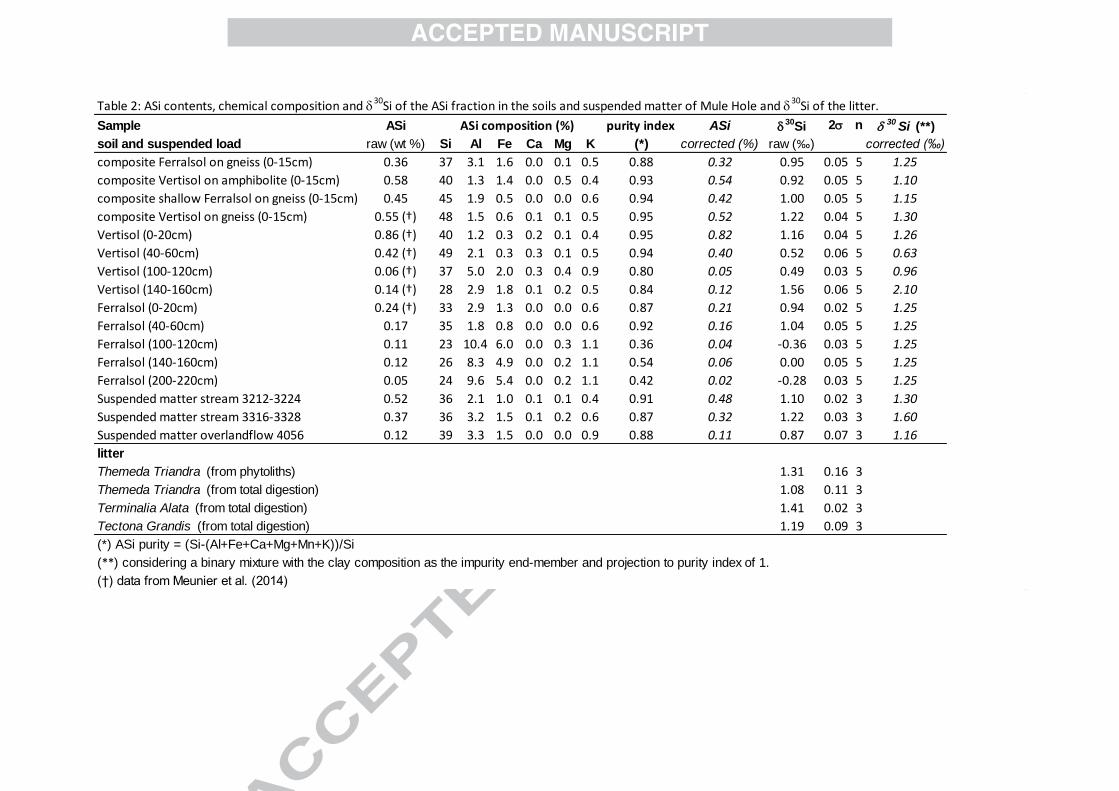
Table 2: ASi contents, chemical composition and d30
Si of the ASi fraction in the soils and suspended matter of Mule Hole and d30
Si of the litter.
Sample ASi purity index ASi d30
Si 2s n d 30Si (**)
soil and suspended load raw (wt %) Si Al Fe Ca Mg K (*) corrected (%) raw (‰) corrected (‰)
composite Ferralsol on gneiss (0-15cm) 0.36 37 3.1 1.6 0.0 0.1 0.5 0.88 0.32 0.95 0.05 5 1.25
composite Vertisol on amphibolite (0-15cm) 0.58 40 1.3 1.4 0.0 0.5 0.4 0.93 0.54 0.92 0.05 5 1.10
composite shallow Ferralsol on gneiss (0-15cm) 0.45 45 1.9 0.5 0.0 0.0 0.6 0.94 0.42 1.00 0.05 5 1.15
composite Vertisol on gneiss (0-15cm) 0.55 (†) 48 1.5 0.6 0.1 0.1 0.5 0.95 0.52 1.22 0.04 5 1.30
Vertisol (0-20cm) 0.86 (†) 40 1.2 0.3 0.2 0.1 0.4 0.95 0.82 1.16 0.04 5 1.26
Vertisol (40-60cm) 0.42 (†) 49 2.1 0.3 0.3 0.1 0.5 0.94 0.40 0.52 0.06 5 0.63
Vertisol (100-120cm) 0.06 (†) 37 5.0 2.0 0.3 0.4 0.9 0.80 0.05 0.49 0.03 5 0.96
Vertisol (140-160cm) 0.14 (†) 28 2.9 1.8 0.1 0.2 0.5 0.84 0.12 1.56 0.06 5 2.10
Ferralsol (0-20cm) 0.24 (†) 33 2.9 1.3 0.0 0.0 0.6 0.87 0.21 0.94 0.02 5 1.25
Ferralsol (40-60cm) 0.17 35 1.8 0.8 0.0 0.0 0.6 0.92 0.16 1.04 0.05 5 1.25
Ferralsol (100-120cm) 0.11 23 10.4 6.0 0.0 0.3 1.1 0.36 0.04 -0.36 0.03 5 1.25
Ferralsol (140-160cm) 0.12 26 8.3 4.9 0.0 0.2 1.1 0.54 0.06 0.00 0.05 5 1.25
Ferralsol (200-220cm) 0.05 24 9.6 5.4 0.0 0.2 1.1 0.42 0.02 -0.28 0.03 5 1.25
Suspended matter stream 3212-3224 0.52 36 2.1 1.0 0.1 0.1 0.4 0.91 0.48 1.10 0.02 3 1.30
Suspended matter stream 3316-3328 0.37 36 3.2 1.5 0.1 0.2 0.6 0.87 0.32 1.22 0.03 3 1.60
Suspended matter overlandflow 4056 0.12 39 3.3 1.5 0.0 0.0 0.9 0.88 0.11 0.87 0.07 3 1.16
litter
Themeda Triandra (from phytoliths) 1.31 0.16 3
Themeda Triandra (from total digestion) 1.08 0.11 3
Terminalia Alata (from total digestion) 1.41 0.02 3
Tectona Grandis (from total digestion) 1.19 0.09 3
(*) ASi purity = (Si-(Al+Fe+Ca+Mg+Mn+K))/Si
(**) considering a binary mixture with the clay composition as the impurity end-member and projection to purity index of 1.
(†) data from Meunier et al. (2014)
ASi composition (%)
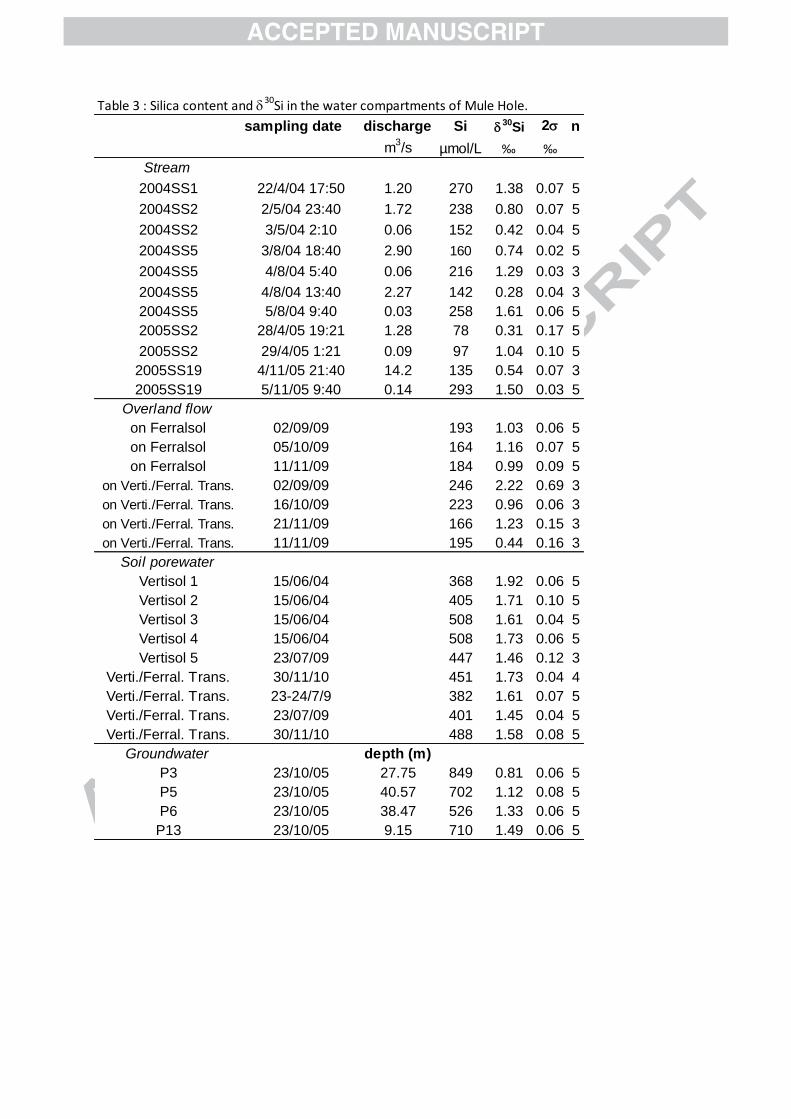
Table 3 : Silica content and d30
Si in the water compartments of Mule Hole.
sampling date discharge Si d30
Si 2s n
m3/s µmol/L ‰ ‰
Stream
2004SS1 22/4/04 17:50 1.20 270 1.38 0.07 5
2004SS2 2/5/04 23:40 1.72 238 0.80 0.07 5
2004SS2 3/5/04 2:10 0.06 152 0.42 0.04 5
2004SS5 3/8/04 18:40 2.90 160 0.74 0.02 5
2004SS5 4/8/04 5:40 0.06 216 1.29 0.03 3
2004SS5 4/8/04 13:40 2.27 142 0.28 0.04 3
2004SS5 5/8/04 9:40 0.03 258 1.61 0.06 5
2005SS2 28/4/05 19:21 1.28 78 0.31 0.17 5
2005SS2 29/4/05 1:21 0.09 97 1.04 0.10 5
2005SS19 4/11/05 21:40 14.2 135 0.54 0.07 3
2005SS19 5/11/05 9:40 0.14 293 1.50 0.03 5
Overland flow
on Ferralsol 02/09/09 193 1.03 0.06 5
on Ferralsol 05/10/09 164 1.16 0.07 5
on Ferralsol 11/11/09 184 0.99 0.09 5
on Verti./Ferral. Trans. 02/09/09 246 2.22 0.69 3
on Verti./Ferral. Trans. 16/10/09 223 0.96 0.06 3
on Verti./Ferral. Trans. 21/11/09 166 1.23 0.15 3
on Verti./Ferral. Trans. 11/11/09 195 0.44 0.16 3
Soil porewater
Vertisol 1 15/06/04 368 1.92 0.06 5
Vertisol 2 15/06/04 405 1.71 0.10 5
Vertisol 3 15/06/04 508 1.61 0.04 5
Vertisol 4 15/06/04 508 1.73 0.06 5
Vertisol 5 23/07/09 447 1.46 0.12 3
Verti./Ferral. Trans. 30/11/10 451 1.73 0.04 4
Verti./Ferral. Trans. 23-24/7/9 382 1.61 0.07 5
Verti./Ferral. Trans. 23/07/09 401 1.45 0.04 5
Verti./Ferral. Trans. 30/11/10 488 1.58 0.08 5
Groundwater depth (m)
P3 23/10/05 27.75 849 0.81 0.06 5
P5 23/10/05 40.57 702 1.12 0.08 5
P6 23/10/05 38.47 526 1.33 0.06 5
P13 23/10/05 9.15 710 1.49 0.06 5


