Embed Size (px)
Citation preview


PRIORITY DEVELOPMENT PROJECT (PDP) SWQMP ii
Template Date: August 28, 2017 Preparation Date: March 26, 2018 Revised: July 10, 2018
Revised: October 10, 2018 BH:HC:es:k/Report/18145.006] LUEG:SW PDP SWQMP
This page was left intentionally blank.

PRIORITY DEVELOPMENT PROJECT (PDP) SWQMP iii
Template Date: August 28, 2017 Preparation Date: March 26, 2018 Revised: July 10, 2018
Revised: October 10, 2018 BH:HC:es:k/Report/18145.006] LUEG:SW PDP SWQMP
Table of Contents Table of Contents ....................................................................................................................... iii
Revision Page, dated October 10, 2018………………………………………………………………iii
Revision Page, dated July 10, 2018……………………………………………………………………iii
Attachments ............................................................................................................................... iv
Acronyms ................................................................................................................................... iv
PDP SWQMP Preparer's Certification Page ............................................................................... vi
Submittal Record ..................................................................................................................... viii
Project Vicinity Map .................................................................................................................... x
Step 1: Project type determination (Standard or Priority Development Project) .................... 1
Step 1.1: Storm Water Quality Management Plan requirements ....................................... 4
Step 1.2: Exemption to PDP definitions ............................................................................ 4
Step 2: Construction Storm Water BMP Checklist ................................................................ 5
Step 3: County of San Diego PDP SWQMP Site Information Checklist ................................ 8
Step 3.1: Description of Existing Site Condition ................................................................ 8
Step 3.2: Description of Existing Site Drainage Patterns .................................................. 9
Step 3.3: Description of Proposed Site Development ......................................................10
Step 3.4: Description of Proposed Site Drainage Patterns ...............................................11
Step 3.5: Potential Pollutant Source Areas ......................................................................12
Step 3.6: Identification and Narrative of Receiving Water and Pollutants of Concern ......13
Step 3.7: Hydromodification Management Requirements ................................................14
Step 3.7.1: Critical Coarse Sediment Yield Areas* ..........................................................15
Step 3.7.2: Flow Control for Post-Project Runoff* ...........................................................16
Step 3.8: Other Site Requirements and Constraints ........................................................17
Step 4: Source Control BMP Checklist ................................................................................18
Step 5: Site Design BMP Checklist ......................................................................................20
Step 6: PDP Structural BMPs ..............................................................................................22
Step 6.1: Description of structural BMP strategy ..............................................................22
Step 6.2: Structural BMP Checklist ..................................................................................24
Step 6.3: Offsite Alternative Compliance Participation Form ............................................25

PRIORITY DEVELOPMENT PROJECT (PDP) SWQMP iv
Template Date: August 28, 2017 Preparation Date: March 26, 2018 Revised: July 10, 2018
Revised: October 10, 2018 BH:HC:es:k/Report/18145.006] LUEG:SW PDP SWQMP
Attachments Attachment 1: Backup for PDP Pollutant Control BMPs
Attachment 1a: Storm Water Pollutant Control Worksheet Calculations Attachment 1b: DMA Exhibit Attachment 1c: Individual Structural BMP DMA Mapbook
Attachment 2: Backup for PDP Hydromodification Control Measures Attachment 2a: Flow Control Facility Design Attachment 2b: Hydromodification Management Exhibit Attachment 2c: Management of Critical Coarse Sediment Yield Areas Attachment 2d: Geomorphic Assessment of Receiving Channels (optional) Attachment 2e: Vector Control Plan (if applicable)
Attachment 3: Structural BMP Maintenance Plan Attachment 3a: Structural BMP Maintenance Thresholds and Actions Attachment 3b: Draft Maintenance Agreements / Notifications(when applicable)
Attachment 4: County of San Diego PDP Structural BMP Verification for DPW Permitted Land Development Projects
Attachment 5: Copy of Plan Sheets Showing Permanent Storm Water BMPs Attachment 6: Copy of Project's Drainage Report Attachment 7: Copy of Project's Geotechnical and Groundwater Investigation Report
Acronyms ACP Alternative Compliance Project APN Assessor's Parcel Number BMP Best Management Practice BMP DM Best Management Practice Design Manual HMP Hydromodification Management Plan HSG Hydrologic Soil Group MS4 Municipal Separate Storm Sewer System N/A Not Applicable NRCS Natural Resources Conservation Service PDCI Private Development Construction Inspection Section PDP Priority Development Project PDS Planning and Development Services PE Professional Engineer RPO Resource Protection Ordinance SC Source Control SD Site Design SDRWQCB San Diego Regional Water Quality Control Board SIC Standard Industrial Classification SWQMP Storm Water Quality Management Plan WMAA Watershed Management Area Analysis WPO Watershed Protection Ordinance WQIP Water Quality Improvement Plan
PRIORITY DEVELOPMENT PROJECT (PDP) SWQMP FOR
JAMUL RETAIL CENTER
REVISION PAGE
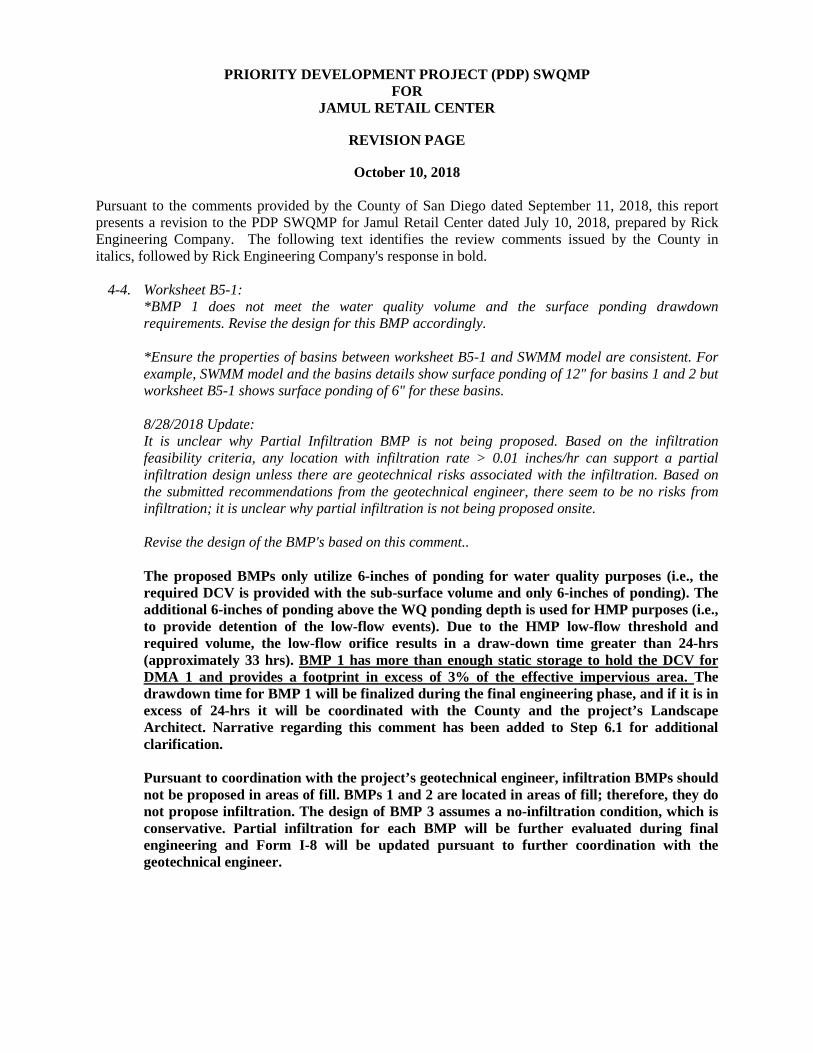
October 10, 2018 Pursuant to the comments provided by the County of San Diego dated September 11, 2018, this report presents a revision to the PDP SWQMP for Jamul Retail Center dated July 10, 2018, prepared by Rick Engineering Company. The following text identifies the review comments issued by the County in italics, followed by Rick Engineering Company's response in bold.
4-4. Worksheet B5-1:
*BMP 1 does not meet the water quality volume and the surface ponding drawdown requirements. Revise the design for this BMP accordingly. *Ensure the properties of basins between worksheet B5-1 and SWMM model are consistent. For example, SWMM model and the basins details show surface ponding of 12" for basins 1 and 2 but worksheet B5-1 shows surface ponding of 6" for these basins. 8/28/2018 Update: It is unclear why Partial Infiltration BMP is not being proposed. Based on the infiltration feasibility criteria, any location with infiltration rate > 0.01 inches/hr can support a partial infiltration design unless there are geotechnical risks associated with the infiltration. Based on the submitted recommendations from the geotechnical engineer, there seem to be no risks from infiltration; it is unclear why partial infiltration is not being proposed onsite. Revise the design of the BMP's based on this comment.. The proposed BMPs only utilize 6-inches of ponding for water quality purposes (i.e., the required DCV is provided with the sub-surface volume and only 6-inches of ponding). The additional 6-inches of ponding above the WQ ponding depth is used for HMP purposes (i.e., to provide detention of the low-flow events). Due to the HMP low-flow threshold and required volume, the low-flow orifice results in a draw-down time greater than 24-hrs (approximately 33 hrs). BMP 1 has more than enough static storage to hold the DCV for DMA 1 and provides a footprint in excess of 3% of the effective impervious area. The drawdown time for BMP 1 will be finalized during the final engineering phase, and if it is in excess of 24-hrs it will be coordinated with the County and the project’s Landscape Architect. Narrative regarding this comment has been added to Step 6.1 for additional clarification. Pursuant to coordination with the project’s geotechnical engineer, infiltration BMPs should not be proposed in areas of fill. BMPs 1 and 2 are located in areas of fill; therefore, they do not propose infiltration. The design of BMP 3 assumes a no-infiltration condition, which is conservative. Partial infiltration for each BMP will be further evaluated during final engineering and Form I-8 will be updated pursuant to further coordination with the geotechnical engineer.

4-5. I-8 Form:
Provide justification for all the responses in form I-8.
8/28/2018 Update:
Revise the response for I-8 form to support a partial infiltration. Based on the measured inflation rates and the recommendation from the geotechnical engineer, there are no risks associated with partial infiltration. It is unclear why I-8 form is selecting No infiltration as conclusion.
Refer to response for Comment 4-4.
4-6. 8/28/2018 Update:
DMA Exhibit (Attachment 1C/2B):*Clearly show on the plans how the outfall structures for basins 1 will be accessed for maintenance. Please note based on the existing topography, an access road may need to be provided. Any Additional impervious area required for the construction of access roads should be included as part of the stormwater calculation.
It is unclear how the inlet at the back of the DG pathway will collect drainage from the existing and proposed pavement along Jefferson Road. Based on the typical cross section, the flows drain away from the DG pathway to the gutter. Please clarify the design.
Pursuant to coordination with the Project's Biologist, an access road cannot be provided since it would require disturbance of the Biological Open Space Preserve. Therefore, an access road is not proposed. The proposed curb inlets on Jefferson Road will intercept drainage from the existing/proposed pavement along Jefferson Rd. These inlets will only intercept flow from the western half of Jefferson Rd. The eastern half is not being improved as part of this project; therefore, it will not be intercepted by proposed inlets. The DG path drains towards the street. Please refer to the TM Plans, specifically Jefferson Rd Cross Sections A-A and B-B, and the project’s Drainage Study for more information regarding drainage characteristics, storm drain, and inlets.
4-10. Step 3.7.1 (Page 15): Select the third item related to bypass of the onsite and upstream CCSYA under scenario 1. Please note the project will be required to show the bypass of the offsite upstream CCSYA during the final engineering submittal.
The box has been selected as required.

4-11. Step 6.1 (Page 24): Clarify how the Excess treated impervious area is being routed to the proposed BMP's. Based on the location of the inlets and the typical cross section provided, no part of the road widening or existing pavement will be captured by the proposed inlets at the back of the walkway.
Additionally the type of proposed BMP may need to be revised based on revised recommendation on form I-8.
The existing and proposed impervious area on the western half of Jefferson Road slopes towards the proposed inlets. Please refer to the TM Plans, specifically, the proposed grading on Jefferson Rd and Cross Sections A-A and B-B for additional information. Contour intervals have been decreased to 2-ft intervals on the PDP Exhibits for clarity. Refer to Response to Comments 4-4 and 4-5 for updated information regarding BMP design.
4-12. Step 6.2 (Page 25): Revise the Structural BMP Checklist based on comments provided on form I-8.
Pursuant to coordination with the project’s geotechnical engineer, infiltration BMPs should not be proposed in areas of fill. BMPs 1 and 2 are located in areas of fill; therefore, they do not propose infiltration. The design of BMP 3 assumes a no-infiltration condition, which is conservative. Partial infiltration for each BMP will be further evaluated during final engineering and Form I-8 will be updated at that time pursuant to further coordination with the geotechnical engineer
4-13. Please note there are new comments on Attachment 1 because on the previous submittal, I-8 form had an assumption that any infiltration will cause negative impact at the project site. That assumption does not match the new submitted geotechnical recommendation. Hence the type of BMP proposed need to be revised to allow partial infiltration.
Noted. Refer to comment response 4-12 for additional information.
4-14. Verify the answers provided for infiltration rate and the negative impacts from infiltration to match the determination in form I-8.
Refer to comment response 4-12 for additional information.
4-15. It is unclear why infiltration rate of 0 is assumed for all BMP's. The infiltration rates used here should match the values in the geotechnical report.
Refer to comment response 4-12 for additional information.
4-16. Revise the detail of the BMP or the table to show the size of the low flow orifice.
BMP details have been updated accordingly.

PRIORITY DEVELOPMENT PROJECT (PDP) SWQMP FOR
JAMUL RETAIL CENTER
REVISION PAGE
July 10, 2018 Pursuant to the comments provided by the County of San Diego dated June 15, 2018, this report presents a revision to the report dated March 26, 2018, prepared by Rick Engineering Company. The following text identifies the review comments issued by the County in italics, followed by Rick Engineering Company's response in bold.
1. Include the project number on the title sheet. The project number has been added to the title sheet as requested.
2. The final SWQMP report shall be signed, stamped and dated by the responsible California Registered Civil Engineer. The report has been signed, stamped and dated accordingly.
3. Step 3 (Page 6): Under “Existing Natural Hydrologic Features” remove the checklist from the “None” category. The “None” category under the “Existing Natural Hydrologic Features” has been removed from the checklist as requested. Only “watercourses” has been selected since the project is proposing a storm drain outfall with a rip-rap pad adjacent to the unnamed natural channel that is tributary to Steele Canyon Creek, just east of the project site.
4. Worksheet B5-1: BMP 1 does not meet the water quality volume and the surface ponding drawdown requirements. Revise the design for this BMP accordingly. Ensure the properties of basins between worksheet B5-1 and SWMM model are consistent. For example, SWMM model and the basins details show surface ponding of 12” for basins 1 and 2 but worksheet B5-1 shows surface ponding of 6” for these basins.
The proposed BMPs only utilize 6-inches of ponding for water quality purposes (i.e., the required DCV is provided with the sub-surface volume and only 6-inches of ponding). The additional 6-inches of ponding above the WQ ponding depth is used for HMP purposes (i.e., to provide detention of the low-flow events). Due to the HMP low-flow threshold and required volume, the low-flow orifice results in a draw-down time greater than 24-hrs (approximately 33 hrs). BMP 1 has more than enough static storage to hold the DCV for DMA 1 and provides a footprint in excess of 3% of the effective impervious area. The drawdown time for BMP 1 will be finalized during the final engineering phase, and if it is in excess of 24-hrs it will be coordinated with the County and the project’s Landscape Architect. Narrative regarding this comment has been added to Step 6.1.
5. I-8 Form: Provide justification for all the responses in form I-8. The project’s geotechnical report is now provided within Appendix 7 for reference purposes, which includes the geotechnical engineer’s responses to form I-8.

6. DMA Exhibit (Attachment 1C/2B): Clearly label the DMA’s that cover the required frontage improvements along Jefferson Road. The DMA may be missing the labels for DMA 2-B and 3-B. Verify and make any necessary changes. Revise the limits of the DMA and the DCV calculations to include all the required road frontage improvements listed in item 1-2 above. Provide a table with the breakdown of impervious area for each DMA. Clearly show on the plans how the outfall structures for basins 1 will be accessed for maintenance. Please note based on the existing topography, an access road may need to be provided. Any additional impervious area required for the construction of access roads should be included as part of the stormwater calculation. The DMA exhibit has been updated to provide missing DMA labels and to be consistent with the latest site plan. DMA boundaries, DCVs, and the site plan have all been updated accordingly. A table of each DMA with hydrologic characteristics is now provided within the DMA exhibit. Refer to the project’s improvement plans for maintenance access.
7. Revise the SWMM model to show analysis at the point of discharge of BMP 1 not just at POC 1.
The modeled POC in the SWMM Model is the project outfall, where storm water generated from the site discharges into the existing natural channel (including stormwater from BMP 1). For graphical purposes, the point of compliance (POC) is shown as the discharge point for the existing condition. In order to minimize the impacts to riparian and environmental areas, the outfall location in the post-project condition was proposed within the unnamed tributary to Steele Canyon Creek. For additional information regarding the outfall location refer to the project’s drainage study.
8. Ensure the properties of basins between SWMM model, Worksheet B5-1, and the provided BMP detail are consistent. For example, BMP 3 is modeled with 12” ponding depth in SWMM which is not constant with Worksheet B5-1 and the BMP detail provided. Verify and make any necessary changes. The proposed BMPs only utilize 6-inches of ponding for water quality purposes. The additional 6-inches of ponding above the WQ ponding depth is used for HMP purposes (i.e., to provide detention of the low-flow events). WQ calculations are based on the 6-inches of ponding and HMP calculations are based on 12-inches of ponding. The SWMM models have been updated to be consistent with the latest site plan; however, continue to use 12-inches of ponding prior to the first mid-flow orifice.
9. Provide a digital copy of the model on the next submittal.
A Digital copy of the SWMM model has been provided as requested as a CD pocket.

PRIORITY DEVELOPMENT PROJECT (PDP) SWQMP v
Template Date: August 28, 2017 Preparation Date: March 26, 2018 Revised: July 10, 2018
Revised: October 10, 2018 BH:HC:es:k/Report/18145.006] LUEG:SW PDP SWQMP


PRIORITY DEVELOPMENT PROJECT (PDP) SWQMP vii
Template Date: August 28, 2017 Preparation Date: March 26, 2018 Revised: July 10, 2018
Revised: October 10, 2018 BH:HC:es:k/Report/18145.006] LUEG:SW PDP SWQMP
This page was left intentionally blank.

PRIORITY DEVELOPMENT PROJECT (PDP) SWQMP viii
Template Date: August 28, 2017 Preparation Date: March 26, 2018 Revised: July 10, 2018
Revised: October 10, 2018 BH:HC:es:k/Report/18145.006] LUEG:SW PDP SWQMP
Submittal Record Use this Table to keep a record of submittals of this PDP SWQMP. Each time the PDP SWQMP is re-submitted, provide the date and status of the project. In column 4 summarize the changes that have been made or indicate if response to plancheck comments is included. When applicable, insert response to plancheck comments behind this page. Preliminary Design / Planning / CEQA Submittal Number
Date Summary of Changes
1 3/26/2018 Initial Submittal
2 7/10/2018 2nd Submittal
3 10/10/2018 3rd Submittal – Address Comments dated 9/11/18 from the County of San Diego.
4
Final Design Submittal Number
Date Summary of Changes
1 Initial Submittal
2
3
4
Plan Changes Submittal Number
Date Summary of Changes
1 Initial Submittal
2
3
4

PRIORITY DEVELOPMENT PROJECT (PDP) SWQMP ix
Template Date: August 28, 2017 Preparation Date: March 26, 2018 Revised: July 10, 2018
Revised: October 10, 2018 BH:HC:es:k/Report/18145.006] LUEG:SW PDP SWQMP
This page was left intentionally blank.

PRIORITY DEVELOPMENT PROJECT (PDP) SWQMP x
Template Date: August 28, 2017 Preparation Date: March 26, 2018 Revised: July 10, 2018
Revised: October 10, 2018 BH:HC:es:k/Report/18145.006] LUEG:SW PDP SWQMP
Project Vicinity Map Project Name: Jamul Retail Center Record ID: PDS2018-MUP-18-008 and PDS2018-TPM-21262

PRIORITY DEVELOPMENT PROJECT (PDP) SWQMP 1 of 42
Template Date: August 28, 2017 Preparation Date: February 16, 2018] LUEG:SW PDP SWQMP
Step 1: Project type determination (Standard or Priority Development Project)
Is the project part of another Priority Development Project (PDP)? (☐ Yes ☒ No If so, a PDP SWQMP is required. Go to Step 2. The project is (select one): ☒ New Development ☐ Redevelopment1 The total proposed newly created or replaced impervious area is: 259,500 ft2 The total existing (pre-project) impervious area is: 14,340 ft2 The total area disturbed by the project is: 431,244 ft2 If the total area disturbed by the project is 1 acre (43,560 sq. ft.) or more OR the project is part of a larger common plan of development disturbing 1 acre or more, a Waste Discharger Identification (WDID) number must be obtained from the State Water Resources Control Board. WDID: ___ Is the project in any of the following categories, (a) through (f)?2 Yes ☒
No ☐
(a) New development projects that create 10,000 square feet or more of impervious surfaces 3(collectively over the entire project site). This includes commercial, industrial, residential, mixed-use, and public development projects on public or private land.
Yes ☐
No ☒
(b) Redevelopment projects that create and/or replace 5,000 square feet or more of impervious surface (collectively over the entire project site on an existing site of 10,000 square feet or more of impervious surfaces). This includes commercial, industrial, residential, mixed-use, and public development projects on public or private land.
Yes ☒
No ☐
(c) New and redevelopment projects that create and/or replace 5,000 square feet or more of impervious surface (collectively over the entire project site), and support one or more of the following uses:
(i) Restaurants. This category is defined as a facility that sells prepared foods and drinks for consumption, including stationary lunch counters and refreshment stands selling prepared foods and drinks for immediate consumption (Standard Industrial Classification (SIC) code 5812).
(ii) Hillside development projects. This category includes development on any natural slope that is twenty-five percent or greater.
(iii) Parking lots. This category is defined as a land area or facility for the temporary parking or storage of motor vehicles used personally, for business, or for commerce.
(iv) Streets, roads, highways, freeways, and driveways. This category is defined as any paved impervious surface used for the transportation of automobiles, trucks, motorcycles, and other vehicles.
1 Redevelopment is defined as: The creation and/or replacement of impervious surface on an already developed
site. Examples include the expansion of a building footprint, road widening, the addition to or replacement of a structure, and creation or addition of impervious surfaces. Replacement of impervious surfaces includes any activity that is not part of a routine maintenance activity where impervious material(s) are removed, exposing underlying soil during construction. Redevelopment does not include routine maintenance activities, such as trenching and resurfacing associated with utility work; pavement grinding; resurfacing existing roadways; new sidewalks construction; pedestrian ramps; or bike lanes on existing roads; and routine replacement of damaged pavement, such as pothole repair.
2 Applicants should note that any development project that will create and/or replace 10,000 square feet or more of impervious surface (collectively over the entire project site) is considered a new development.
3 For solar energy farm projects, the area of the solar panels does not count toward the total impervious area of the site.

PRIORITY DEVELOPMENT PROJECT (PDP) SWQMP 2 of 42
Template Date: August 28, 2017 Preparation Date: February 16, 2018] LUEG:SW PDP SWQMP
This page was left intentionally blank.

PRIORITY DEVELOPMENT PROJECT (PDP) SWQMP 3 of 42
Template Date: August 28, 2017 Preparation Date: February 16, 2018] LUEG:SW PDP SWQMP
Project type determination (continued)
Yes ☒
No ☐
(d) New or redevelopment projects that create and/or replace 2,500 square feet or more of impervious surface (collectively over the entire project site), and discharging directly to an Environmentally Sensitive Area (ESA). “Discharging directly to” includes flow that is conveyed overland a distance of 200 feet or less from the project to the ESA, or conveyed in a pipe or open channel any distance as an isolated flow from the project to the ESA (i.e. not commingled with flows from adjacent lands).
Note: ESAs are areas that include but are not limited to all Clean Water Act Section 303(d) impaired water bodies; areas designated as Areas of Special Biological Significance by the State Water Board and San Diego Water Board; State Water Quality Protected Areas; water bodies designated with the RARE beneficial use by the State Water Board and San Diego Water Board; and any other equivalent environmentally sensitive areas which have been identified by the Copermittees. See BMP Design Manual Section 1.4.2 for additional guidance.
Yes ☐
No ☒
(e) New development projects, or redevelopment projects that create and/or replace 5,000 square feet or more of impervious surface, that support one or more of the following uses:
(i) Automotive repair shops. This category is defined as a facility that is categorized in any one of the following SIC codes: 5013, 5014, 5541, 7532-7534, or 7536-7539.
(ii) Retail gasoline outlets (RGOs). This category includes RGOs that meet the following criteria: (a) 5,000 square feet or more or (b) a projected Average Daily Traffic (ADT) of 100 or more vehicles per day.
Yes ☒
No ☐
(f) New or redevelopment projects that result in the disturbance of one or more acres of land and are expected to generate pollutants post construction.
Note: See BMP Design Manual Section 1.4.2 for additional guidance. Does the project meet the definition of one or more of the Priority Development Project categories (a) through (f) listed above? ☐ No – the project is not a Priority Development Project (Standard Project). ☒ Yes – the project is a Priority Development Project (PDP). Further guidance may be found in Chapter 1 and Table 1-2 of the BMP Design Manual. The following is for redevelopment PDPs only: The area of existing (pre-project) impervious area at the project site is: ft2 (A) The total proposed newly created or replaced impervious area is ft2 (B) Percent impervious surface created or replaced (B/A)*100: % The percent impervious surface created or replaced is (select one based on the above calculation):
☐ less than or equal to fifty percent (50%) – only newly created or replaced impervious areas are considered a PDP and subject to stormwater requirements
OR ☐ greater than fifty percent (50%) – the entire project site is considered a PDP and subject to
stormwater requirements

PRIORITY DEVELOPMENT PROJECT (PDP) SWQMP 4 of 42
Template Date: August 28, 2017 Preparation Date: February 16, 2018] LUEG:SW PDP SWQMP
Step 1.1: Storm Water Quality Management Plan requirements Step Answer Progression
Is the project a Standard Project, Priority Development Project (PDP), or exception to PDP definitions? To answer this item, complete Step 1 Project Type Determination Checklist on Pages 1 and 2, and see PDP exemption information below. For further guidance, see Section 1.4 of the BMP Design Manual in its entirety.
☐ Standard Project
Standard Project requirements apply, including Standard Project SWQMP. Complete Standard Project SWQMP.
☒ PDP ☐ PDP with
ACP
Standard and PDP requirements apply, including PDP SWQMP. Complete PDP SWQMP. If participating in offsite alternative compliance, complete Step 6.3 and an ACP SWQMP.
☐ PDP Exemption
Go to Step 1.2 below.
Step 1.2: Exemption to PDP definitions Is the project exempt from PDP definitions based on either of the following:
☐ Projects that are only new or retrofit paved sidewalks, bicycle lanes, or trails that meet the following criteria:
(i) Designed and constructed to direct storm water runoff to adjacent vegetated areas, or other non-erodible permeable areas; OR
(ii) Designed and constructed to be hydraulically disconnected from paved streets or roads [i.e., runoff from the new improvement does not drain directly onto paved streets or roads]; OR
(iii) Designed and constructed with permeable pavements or surfaces in accordance with County of San Diego Guidance on Green Infrastructure;
If so: Standard Project requirements apply, AND any additional requirements specific to the type of project. County concurrence with the exemption is required. Provide discussion and list any additional requirements below in this form. Complete Standard Project SWQMP
☐ Projects that are only retrofitting or redeveloping existing paved alleys, streets or roads that are designed and constructed in accordance with the County of San Diego Guidance on Green Infrastructure.
Complete Green Streets PDP Exempt SWQMP.
Discussion / justification, and additional requirements for exceptions to PDP definitions, if applicable:

PRIORITY DEVELOPMENT PROJECT (PDP) SWQMP 5 of 42
Template Date: August 28, 2017 Preparation Date: February 16, 2018] LUEG:SW PDP SWQMP
Step 2: Construction Storm Water BMP Checklist Minimum Required Standard Construction Storm Water BMPs
If you answer “Yes” to any of the questions below, your project is subject to Table 1 on the following page (Minimum Required Standard Construction Stormwater BMPs). As noted in Table 1, please select at least the minimum number of required BMPs, or as many as are feasible for your project. If no BMP is selected, an explanation must be given in the box provided. The following questions are intended to aid in determining construction BMP requirements for your project. Note: All selected BMPs below must be included on the BMP plan incorporated into the construction plan sets. 1. Will there be soil disturbing activities that will result in exposed soil areas? (This includes minor grading and trenching.) Reference Table 1 Items A, B, D, and E Note: Soil disturbances NOT considered significant include, but are not limited to, change in use, mechanical/electrical/plumbing activities, signs, temporary trailers, interior remodeling, and minor tenant improvement.
☒Yes ☐No
2. Will there be asphalt paving, including patching? Reference Table 1 Items D and F
☒Yes ☐No
3. Will there be slurries from mortar mixing, coring, or concrete saw cutting? Reference Table 1 Items D and F
☐Yes ☐No
4. Will there be solid wastes from concrete demolition and removal, wall construction, or form work? Reference Table 1 Items D and F
☐Yes ☐No
5. Will there be stockpiling (soil, compost, asphalt, concrete, solid waste) for over 24 hours? Reference Table 1 Items D and F
☐Yes ☐No
6. Will there be dewatering operations? Reference Table 1 Items C and D
☐Yes ☐No
7. Will there be temporary on-site storage of construction materials, including mortar mix, raw landscaping and soil stabilization materials, treated lumber, rebar, and plated metal fencing materials? Reference Table 1 Items E and F
☐Yes ☐No
8. Will trash or solid waste product be generated from this project? Reference Table 1 Item F
☒Yes ☐No
9. Will construction equipment be stored on site (e.g.: fuels, oils, trucks, etc.?) Reference Table 1 Item F
☐Yes ☐No
10. Will Portable Sanitary Services (“Porta-potty”) be used on the site? Reference Table 1 Item F
☐Yes ☐No

PRIORITY DEVELOPMENT PROJECT (PDP) SWQMP 6 of 42
Template Date: August 28, 2017 Preparation Date: February 16, 2018] LUEG:SW PDP SWQMP
Table 1. Construction Storm Water BMP Checklist
Minimum Required Best Management Practices
(BMPs)
CALTRANS SW
Handbook4 Detail or
County Std. Detail
BMP
Selected
Reference sheet No.’s where each selected BMP is shown on the
plans. If no BMP is selected, an
explanation must be provided. A. Select Erosion Control Method for Disturbed Slopes (choose at least one for the appropriate season) Vegetation Stabilization Planting5 (Summer)
SS-2, SS-4 ☐ Will be revised in future submittal as the project design and construction methods are finalized.
Hydraulic Stabilization Hydroseeding2 (Summer)
SS-4 ☒
Bonded Fiber Matrix or Stabilized Fiber Matrix6 (Winter)
SS-3 ☒
Physical Stabilization Erosion Control Blanket3 (Winter)
SS-7 ☒
B. Select erosion control method for disturbed flat areas (slope < 5%) (choose at least one) County Standard Lot Perimeter Protection Detail
PDS 6597, SC-2
☐ Will be revised in future submittal as the project design and construction methods are finalized.
Will use erosion control measures from Item A on flat areas also
SS-3, 4, 7 ☒
County Standard Desilting Basin (must treat all site runoff)
PDS 6608, SC-2
☐
Mulch, straw, wood chips, soil application
SS-6, SS-8 ☒
4 State of California Department of Transportation (Caltrans). 2003. Storm Water Quality Handbooks, Construction
Site Best Management Practices (BMPs) Manual. March. Available online at: http://www.dot.ca.gov/hq/construc/stormwater/manuals.htm.
5 If Vegetation Stabilization (Planting or Hydroseeding) is proposed for erosion control it may be installed between May 1st and August 15th. Slope irrigation is in place and needs to be operable for slopes >3 feet. Vegetation must be watered and established prior to October 1st. The owner must implement a contingency physical BMP by August 15th if vegetation establishment does not occur by that date. If landscaping is proposed, erosion control measures must also be used while landscaping is being established. Established vegetation must have a subsurface mat of intertwined mature roots with a uniform vegetative coverage of 70 percent of the natural vegetative coverage or more on all disturbed areas.
6 All slopes over three feet must have established vegetative cover prior to final permit approval. 7 County of San Diego, Planning & Development Services. 2012. Standard Lot Perimeter Protection Design
System. Building Division. PDS 659. Available online at http://www.sandiegocounty.gov/pds/docs/pds659.pdf. 8 County of San Diego, Planning & Development Services. 2012. County Standard Desilting Basin for Disturbed
Areas of 1 Acre or Less Building Division. PDS 659. Available online at http://www.sandiegocounty.gov/pds/docs/pds660.pdf.

PRIORITY DEVELOPMENT PROJECT (PDP) SWQMP 7 of 42
Template Date: August 28, 2017 Preparation Date: February 16, 2018] LUEG:SW PDP SWQMP
Table 1. Construction Storm Water BMP Checklist (continued)
Minimum Required Best Management Practices
(BMPs)
CALTRANS SW Handbook
Detail or County Std.
Detail
BMP
Selected
Reference sheet No.’s where each selected BMP is shown on the
plans. If no BMP is selected, an
explanation must be provided. C. If runoff or dewatering operation is concentrated, velocity must be controlled using an energy dissipater Energy Dissipater Outlet Protection9
SS-10 ☒
D. Select sediment control method for all disturbed areas (choose at least one) Silt Fence SC-1 ☒ Will be revised in future submittal
as the project design and construction methods are finalized.
Fiber Rolls (Straw Wattles) SC-5 ☒ Gravel & Sand Bags SC-6 & 8 ☒ Dewatering Filtration NS-2 ☐ Storm Drain Inlet Protection SC-10 ☒ Engineered Desilting Basin (sized for 10-year flow)
SC-2 ☐
E. Select method for preventing offsite tracking of sediment (choose at least one) Stabilized Construction Entrance TC-1 ☒ Will be revised in future submittal
as the project design and construction methods are finalized.
Construction Road Stabilization TC-2 ☐ Entrance/Exit Tire Wash TC-3 ☐ Entrance/Exit Inspection & Cleaning Facility
TC-1 ☐
Street Sweeping and Vacuuming SC-7 ☒ F. Select the general site management BMPs F.1 Materials Management Material Delivery & Storage WM-1 ☒ Will be revised in future submittal
as the project design and construction methods are finalized.
Spill Prevention and Control WM-4 ☒
F.2 Waste Management10 Waste Management Concrete Waste Management
WM-8 ☒ Will be revised in future submittal as the project design and construction methods are finalized.
Solid Waste Management WM-5 ☒ Sanitary Waste Management WM-9 ☒ Hazardous Waste Management WM-6 ☒
Note: The Construction General Permit (Order No. 2009-0009-DWQ) also requires all projects not subject to the BMP Design Manual to comply with runoff reduction requirements through the implementation of post-construction BMPs as described in Section XIII of the order.
9 Regional Standard Drawing D-40 – Rip Rap Energy Dissipater is also acceptable for velocity reduction. 10 Not all projects will have every waste identified. The applicant is responsible for identifying wastes that will be
onsite and applying the appropriate BMP. For example, if concrete will be used, BMP WM-8 must be selected.

PRIORITY DEVELOPMENT PROJECT (PDP) SWQMP 8 of 42
Template Date: August 28, 2017 Preparation Date: February 16, 2018] LUEG:SW PDP SWQMP
Step 3: County of San Diego PDP SWQMP Site Information Checklist
Step 3.1: Description of Existing Site Condition Project Watershed (Complete Hydrologic Unit, Area, and Subarea Name with Numeric Identifier)
Hydrologic Unit: Sweetwater, 909.2 Subarea: Jamacha, 909.21
Current Status of the Site (select all that apply): ☐ Existing development ☐ Previously graded but not built out ☐ Demolition completed without new construction ☒ Agricultural or other non-impervious use ☐ Vacant, undeveloped/natural Description / Additional Information: See below existing project site description Existing Land Cover Includes (select all that apply and provide each area on site): ☒ Vegetative Cover 5.4 Acres ( 235,224 Square Feet) ☒ Non-Vegetated Pervious Areas 4.2 Acres ( 182,952 Square Feet) ☒ Impervious Areas 0.3 Acres ( 13,068 Square Feet) Description / Additional Information:
Underlying Soil belongs to Hydrologic Soil Group (select all that apply): ☐ NRCS Type A ☐ NRCS Type B ☒ NRCS Type C ☐ NRCS Type D Approximate Depth to Groundwater (GW) (or N/A if no infiltration is used): N/A ☐ GW Depth < 5 feet ☐ 5 feet < GW Depth < 10 feet ☐ 10 feet < GW Depth < 20 feet ☒ GW Depth > 20 feet Existing Natural Hydrologic Features (select all that apply): ☒ Watercourses ☐ Seeps ☐ Springs ☐ Wetlands ☐ None ☐ Other Description / Additional Information: A natural unnamed natural channel to the north of the project site flows westerly and confluences with Steele Canyon Creek. The project site will discharge via a proposed storm drain and rip-rap pad into the unnamed channel.

PRIORITY DEVELOPMENT PROJECT (PDP) SWQMP 9 of 42
Template Date: August 28, 2017 Preparation Date: February 16, 2018] LUEG:SW PDP SWQMP
Step 3.2: Description of Existing Site Drainage Patterns How is storm water runoff conveyed from the site? At a minimum, this description should answer:
(1) Whether existing drainage conveyance is natural or urban; (2) Is runoff from offsite conveyed through the site? if yes, quantify all offsite drainage areas, design flows, and locations where offsite flows enter the project site, and summarize how such flows are conveyed through the site; (3) Provide details regarding existing project site drainage conveyance network, including any existing storm drains, concrete channels, swales, detention facilities, storm water treatment facilities, natural or constructed channels; and (4) Identify all discharge locations from the existing project site along with a summary of conveyance system size and capacity for each of the discharge locations. Provide summary of the pre-project drainage areas and design flows to each of the existing runoff discharge locations. Describe existing site drainage patterns: 1. The project area is comprised of rolling hills and thin vegetation. The project is located on undeveloped land. Mobile homes lie west of the project and there is a proposed housing projected to the east. Low density homes lie north and south of the project. 2. Off-site runoff sheet flows onto Jefferson Road from the east and is conveyed northerly through asphalt gutter on the east side of the street before entering an existing culvert and continuing off-site through an unnamed channel until it confluences with Steele Canyon Creek. Although the runoff flows on Jefferson Road, it does not seem to enter the proposed project site on the other side of the road. 3. The only drainage conveyance system that exists on-site consists of two asphalt gutters on both sides of Jefferson Road that conveys runoff north until it reaches the unnamed creek and existing culvert or southerly until it reaches Campo Road. A majority of the existing runoff sheet flows northwesterly through the existing adjacent mobile home park or directly into Steele Canyon Creek. 4. For detailed existing condition drainage areas and peak flow rates, refer to the report titled, “Drainage Study for Jamul Retail Center,” prepared by Rick Engineering Company and dated July 10, 2018, or any revision thereof.

PRIORITY DEVELOPMENT PROJECT (PDP) SWQMP 10 of 42
Template Date: August 28, 2017 Preparation Date: February 16, 2018] LUEG:SW PDP SWQMP
Step 3.3: Description of Proposed Site Development Project Description / Proposed Land Use and/or Activities: The project proposes to develop the site into two separate lots for commercial/retail use. One of these lots will include the Tractor Supply Company and the other will be used as a self-storage facility. The project also proposes improvements to west half of Jefferson Road on the east side of the project. List/describe proposed impervious features of the project (e.g., buildings, roadways, parking lots, courtyards, athletic courts, other impervious features): Impervious features include the roadway widening to Jefferson Road, a large building on each of the two separate lots as well as areas for parking and an area reserved for permanent tractor display.
List/describe proposed pervious features of the project (e.g., landscape areas): Pervious features of the project include decomposed granite (DG) sidewalks along the west side of Jefferson Road and parking areas adjacent to the self-storage area. There will also be landscape areas adjacent to the parking areas and areas reserved for three biofiltration basins.
Does the project include grading and changes to site topography? ☒Yes ☐No
Description / Additional Information: The proposed grading changes will be to fill on top of the overall existing slope that ranges from 10-30% and create a flat pad elevation for the buildings and parking lots
Insert acreage or square feet for the different land cover types in the table below:
Change in Land Cover Type Summary Land Cover Type Existing
(acres or ft2) Proposed (acres or ft2)
Percent Change
Vegetation 5.4 acres 3.4 -37% Pervious (non-vegetated) 4.2 acres 0.5 -88% Impervious 0.3 acres 6.0 + 190%

PRIORITY DEVELOPMENT PROJECT (PDP) SWQMP 11 of 42
Template Date: August 28, 2017 Preparation Date: February 16, 2018] LUEG:SW PDP SWQMP
Step 3.4: Description of Proposed Site Drainage Patterns Does the project include changes to site drainage (e.g., installation of new storm water conveyance systems)? ☒Yes ☐No
If yes, provide details regarding the proposed project site drainage conveyance network, including storm drains, concrete channels, swales, detention facilities, storm water treatment facilities, natural or constructed channels, and the method for conveying offsite flows through or around the proposed project site. Identify all discharge locations from the proposed project site along with a summary of the conveyance system size and capacity for each of the discharge locations. Provide a summary of pre- and post-project drainage areas and design flows to each of the runoff discharge locations. Reference the drainage study for detailed calculations. Describe proposed site drainage patterns: The project will have two primary drainage systems between the two lots and widening of Jefferson Road. The southerly lot where the tractor supply will be located will have a drainage system consisting of multiple catch basins and curb inlets that collect runoff and direct it into two biofiltration basins (BMPs 2 and 3). The northern lot where the self-storage area is proposed will primarily have surface conveyance through ribbon gutters into catch basins that will direct runoff into one biofiltration basin (BMP 1). The two storm drain systems will confluence downstream of the BMPs within the northerly lot and share a single outfall at the northern existing unnamed channel that flows westerly into Steele Canyon Creek. Please refer to the report titled, “Drainage Study for Jamul Retail Center,” dated October 10, 2018, or any revision thereof, prepared by Rick Engineering Company (J-18145), for additional drainage information.

PRIORITY DEVELOPMENT PROJECT (PDP) SWQMP 12 of 42
Template Date: August 28, 2017 Preparation Date: February 16, 2018] LUEG:SW PDP SWQMP
Step 3.5: Potential Pollutant Source Areas Identify whether any of the following features, activities, and/or pollutant source areas will be present (select all that apply). Select “Other” if the project is a phased development and provide a description: ☒ On-site storm drain inlets ☐ Interior floor drains and elevator shaft sump pumps ☐ Interior parking garages ☒ Need for future indoor & structural pest control ☒ Landscape/Outdoor Pesticide Use ☐ Pools, spas, ponds, decorative fountains, and other water features ☐ Food service ☒ Refuse areas ☐ Industrial processes ☒ Outdoor storage of equipment or materials ☐ Vehicle and Equipment Cleaning ☐ Vehicle/Equipment Repair and Maintenance ☐ Fuel Dispensing Areas ☐ Loading Docks ☒ Fire Sprinkler Test Water ☒ Miscellaneous Drain or Wash Water ☒ Plazas, sidewalks, and parking lots ☐ Other (provide description) Description / Additional Information: No interior floor drains, shaft pumps, parking garages, pesticide use, water features, industrial process, vehicle cleaning, vehicle repair, or fuel dispensing areas are anticipated.

PRIORITY DEVELOPMENT PROJECT (PDP) SWQMP 13 of 42
Template Date: August 28, 2017 Preparation Date: February 16, 2018] LUEG:SW PDP SWQMP
Step 3.6: Identification and Narrative of Receiving Water and Pollutants of Concern
Describe flow path of storm water from the project site discharge location(s), through urban storm conveyance systems as applicable, to receiving creeks, rivers, and lagoons as applicable, and ultimate discharge to the Pacific Ocean (or bay, lagoon, lake or reservoir, as applicable): From the project site discharge location, runoff is conveyed through a natural unnamed channel flowing westerly where it confluences with Steele Canyon Creek, then Sweetwater River and ultimately the San Diego Bay. List any 303(d) impaired water bodies11 within the path of storm water from the project site to the Pacific Ocean (or bay, lagoon, lake or reservoir, as applicable), identify the pollutant(s)/stressor(s) causing impairment, and identify any TMDLs and/or Highest Priority Pollutants from the WQIP for the impaired water bodies:
303(d) Impaired Water Body Pollutant(s)/Stressor(s) TMDLs / WQIP Highest
Priority Pollutant Sweetwater River, Lower Enterococcus
Fecal Coliform Phosphorus Selenium Total Dissolved Solids Total Nitrogen as N Toxicity
Estimated TMDL Completion:2021 Estimated TMDL Completion: 2021 Estimated TMDL Completion: 2021 Estimated TMDL Completion: 2021 Estimated TMDL Completion: 2021 Estimated TMDL Completion: 2021 Estimated TMDL Completion: 2021
San Diego Bay PCBs (Polychlorinated biphenyls Estimated TMDL Completion: 2019
Identification of Project Site Pollutants*
*Identification of project site pollutants below is only required if flow-thru treatment BMPs are implemented onsite in lieu of retention or biofiltration BMPs. Note the project must also participate in an alternative compliance program (unless prior lawful approval to meet earlier PDP requirements is demonstrated). Identify pollutants expected from the project site based on all proposed use(s) of the site (see BMP Design Manual Appendix B.6):
Pollutant Not Applicable to the Project Site
Anticipated from the Project Site
Also a Receiving Water Pollutant of
Concern Sediment ☐ ☐ ☐
Nutrients ☐ ☐ ☐
Heavy Metals ☐ ☐ ☐
Organic Compounds ☐ ☐ ☐
Trash & Debris ☐ ☐ ☐
Oxygen Demanding Substances ☐ ☐ ☐
11 The current list of Section 303(d) impaired water bodies can be found at
http://www.waterboards.ca.gov/water_issues/programs/water_quality_assessment/#impaired

PRIORITY DEVELOPMENT PROJECT (PDP) SWQMP 14 of 42
Template Date: August 28, 2017 Preparation Date: February 16, 2018] LUEG:SW PDP SWQMP
Oil & Grease ☐ ☐ ☐
Bacteria & Viruses ☐ ☐ ☐
Pesticides ☐ ☐ ☐
Step 3.7: Hydromodification Management Requirements Do hydromodification management requirements apply (see Section 1.6 of the BMP Design Manual)?
☒Yes, hydromodification management requirements for flow control and preservation of critical coarse sediment yield areas are applicable.
☐No, the project will discharge runoff directly to existing underground storm drains discharging directly to water storage reservoirs, lakes, enclosed embayments, or the Pacific Ocean.
☐No, the project will discharge runoff directly to conveyance channels whose bed and bank are concrete-lined all the way from the point of discharge to water storage reservoirs, lakes, enclosed embayments, or the Pacific Ocean.
☐No, the project will discharge runoff directly to an area identified as appropriate for an exemption by the WMAA12 for the watershed in which the project resides.
Description / Additional Information (to be provided if a 'No' answer has been selected above):
12 The Watershed Management Area Analysis (WMAA) is an optional element for inclusion in the Water Quality
Improvement Plans (WQIPs) described in the 2013 MS4 Permit [Provision B.3.b.(4)]. It is available online at the Project Clean Water website: http://www.projectcleanwater.org/index.php?option=com_content&view=article&id=248

PRIORITY DEVELOPMENT PROJECT (PDP) SWQMP 15 of 42
Template Date: August 28, 2017 Preparation Date: February 16, 2018] LUEG:SW PDP SWQMP
Step 3.7.1: Critical Coarse Sediment Yield Areas* *This Section only required if hydromodification management requirements apply
Projects must satisfy critical coarse sediment yield area (CCSYA) requirements by characterizing the project as one of the scenario-types presented below and satisfying associated criteria. Projects must appropriately satisfy all requirements for identification, avoidance, and bypass, OR may alternatively elect to demonstrate no net impact. ☒ Scenario 1: Project is subject to and in compliance with RPO requirements (without
utilization of RPO exemptions 86.604(e)(2)(cc) or 86.604(e)(3) that result in impacts to more than 15% of the project-scale CCSYAs). ☒ Identify: Project has identified both onsite and upstream CCSYAs as areas that are
coarse, ≥25% slope, and ≥50’ tall. (Optional refinement methods may be performed per guidance in Section H.1.2). AND,
☒ Avoid: Project has avoided onsite CCSYAs per existing RPO steep slope encroachment criteria. AND,
☒ Bypass: Project has demonstrated that both onsite and upstream CCSYAs are bypassed through or around the project site with a 2 year peak storm velocity of 3 feet per second or greater. OR,
☐ No Net Impact: Project does not satisfy all Scenario 1 criteria above and must alternatively demonstrate no net impact to the receiving water.
☐ Scenario 2: Project is entirely exempt/not subject to RPO requirements without utilization of RPO exemptions 86.604(e)(2)(cc) or 86.604(e)(3). ☐ Identify: Project has identified upstream CCSYAs that are coarse, ≥25% slope, and ≥50’
tall. (Optional refinement methods may be performed per guidance in Section H.1.2). AND,
☐ Avoid: Project is not required to avoid onsite CCSYAs as none were identified in the previous step. AND,
☐ Bypass: Project has demonstrated that upstream CCSYAs are bypassed through or around the project site with a 2 year peak storm velocity of 3 feet per second or greater. OR,
☐ No Net Impact: Project does not satisfy all Scenario 2 criteria above and must alternatively demonstrate no net impact to the receiving water. (Skip to next row).
☐ Scenario 3: Project utilizes exemption(s) via RPO Section 86.604(e)(2)(cc) or 86.604(e)(3) and impacts more than 15% of the project-scale CCSYAs. ☐ No Net Impact: Project is not eligible for traditional methods of identification, avoidance,
and bypass. Project must demonstrate no net impact to the receiving water.

PRIORITY DEVELOPMENT PROJECT (PDP) SWQMP 16 of 42
Template Date: August 28, 2017 Preparation Date: February 16, 2018] LUEG:SW PDP SWQMP
Critical Coarse Sediment Yield Areas Continued Demonstrate No Net Impact
If the project elects to satisfy CCSYA criteria through demonstration of no net impact to the receiving water. Applicants must identify the methods utilized from the list below and provide supporting documentation in Attachment 2c of the SWQMP. Check all that are applicable. ☐ N/A, the project appropriately identifies, avoids, and bypasses CCSYAs. ☐ Project has performed additional analysis to demonstrate that impacts to CCSYAs satisfy the
no net impact standard of Ep/Sp≤1.1. ☐ Project has provided alternate mapping of CCSYAs. ☐ Project has implemented additional onsite hydromodification flow control measures. ☐ Project has implemented an offsite stream rehabilitation project to offset impacts. ☐ Project has implemented other applicant-proposed mitigation measures.
Step 3.7.2: Flow Control for Post-Project Runoff* *This Section only required if hydromodification management requirements apply
List and describe point(s) of compliance (POCs) for flow control for hydromodification management (see Section 6.3.1). For each POC, provide a POC identification name or number correlating to the project's HMP Exhibit and a receiving channel identification name or number correlating to the project's HMP Exhibit. The project site will be draining to one Point of Compliance identified as POC-1. POC-1 contains all drainage from DMAs 1-5. For comparison purposes, this POC is located along Steele Canyon Creek where all runoff from the pre-development condition will have sheet flowed into the channel. A continuous simulation analysis was prepared to comply with the hydromodification management requirements using EPA SWMM version 5.1 for the default range of flows from the pre-development 0.1Q2 to Q10. Refer to Attachment 2a for flow frequency and flow duration results for HMP modeling. Has a geomorphic assessment been performed for the receiving channel(s)? ☒ No, the low flow threshold is 0.1Q2 (default low flow threshold) ☐ Yes, the result is the low flow threshold is 0.1Q2 ☐ Yes, the result is the low flow threshold is 0.3Q2 ☐ Yes, the result is the low flow threshold is 0.5Q2 If a geomorphic assessment has been performed, provide title, date, and preparer: Discussion / Additional Information: (optional)

PRIORITY DEVELOPMENT PROJECT (PDP) SWQMP 17 of 42
Template Date: August 28, 2017 Preparation Date: February 16, 2018] LUEG:SW PDP SWQMP
Step 3.8: Other Site Requirements and Constraints When applicable, list other site requirements or constraints that will influence storm water management design, such as zoning requirements including setbacks and open space, or local codes governing minimum street width, sidewalk construction, allowable pavement types, and drainage requirements. Constraints have influenced the location of the single site outfall and after taking these into account it has been determined that the proposed location is the least likely to cause any negative impacts to downstream channels compared to any other on-site location. The constraints are as follows: -a biologist has recommended against discharging within the dense live oak trees at the northwesterly portion of the property due to constructability and maintenance concerns. -existing adverse drainage conditions exist at the downstream mobile home community as a result of run-on from the project site. -no existing storm drain network exists on the property direct runoff to in the ultimate build out condition. -a Resource Protection Ordinance (RPO) limit on the outer edge of the project boundary restricts development opportunities.
Optional Additional Information or Continuation of Previous Sections As Needed This space provided for additional information or continuation of information from previous sections as needed.

PRIORITY DEVELOPMENT PROJECT (PDP) SWQMP 18 of 42
Template Date: August 28, 2017 Preparation Date: February 16, 2018] LUEG:SW PDP SWQMP
Step 4: Source Control BMP Checklist Source Control BMPs
All development projects must implement source control BMPs 4.2.1 through 4.2.6 where applicable and feasible. See Chapter 4.2 and Appendix E of the County BMP Design Manual for information to implement source control BMPs shown in this checklist. Answer each category below pursuant to the following:
• "Yes" means the project will implement the source control BMP as described in Chapter 4.2 and/or Appendix E of the County BMP Design Manual. Discussion / justification is not required.
• "No" means the BMP is applicable to the project but it is not feasible to implement. Discussion / justification must be provided.
• "N/A" means the BMP is not applicable at the project site because the project does not include the feature that is addressed by the BMP (e.g., the project has no outdoor materials storage areas). Discussion / justification must be provided.
Source Control Requirement Applied? 4.2.1 Prevention of Illicit Discharges into the MS4 ☒Yes ☐No ☐N/A Discussion / justification if 4.2.1 not implemented:
4.2.2 Storm Drain Stenciling or Signage ☒Yes ☐No ☐N/A Discussion / justification if 4.2.2 not implemented:
4.2.3 Protect Outdoor Materials Storage Areas from Rainfall, Run-On, Runoff, and Wind Dispersal
☒Yes ☐No ☐N/A
Discussion / justification if 4.2.3 not implemented:
4.2.4 Protect Materials Stored in Outdoor Work Areas from Rainfall, Run-On, Runoff, and Wind Dispersal
☐Yes ☐No ☒N/A
Discussion / justification if 4.2.4 not implemented: No outdoor work areas are proposed at this time.

PRIORITY DEVELOPMENT PROJECT (PDP) SWQMP 19 of 42
Template Date: August 28, 2017 Preparation Date: February 16, 2018] LUEG:SW PDP SWQMP
Source Control Requirement Applied? 4.2.5 Protect Trash Storage Areas from Rainfall, Run-On, Runoff, and Wind Dispersal
☒Yes ☐No ☐N/A
Discussion / justification if 4.2.5 not implemented: 4.2.6 Additional BMPs Based on Potential Sources of Runoff Pollutants (must answer for each source listed below):
☒ A. On-site storm drain inlets ☒Yes ☐No ☐N/A ☒ B. Interior floor drains and elevator shaft sump pumps ☐Yes ☐No ☒N/A ☒ C. Interior parking garages ☐Yes ☐No ☒N/A ☒ D. Need for future indoor & structural pest control ☒Yes ☐No ☐N/A ☒ E. Landscape/outdoor pesticide use ☒Yes ☐No ☐N/A ☒ F. Pools, spas, ponds, fountains, and other water
features ☐Yes ☐No ☒N/A
☒ G. Food service ☐Yes ☐No ☒N/A ☒ H. Refuse areas ☒Yes ☐No ☐N/A ☒ I. Industrial processes ☐Yes ☐No ☒N/A ☒ J. Outdoor storage of equipment or materials ☒Yes ☐No ☐N/A ☒ K. Vehicle and equipment cleaning ☐Yes ☐No ☒N/A ☒ L. Vehicle/equipment repair and maintenance ☐Yes ☐No ☒N/A ☒ M. Fuel dispensing areas ☐Yes ☐No ☒N/A ☒ N. Loading docks ☐Yes ☐No ☒N/A ☒ O. Fire sprinkler test water ☒Yes ☐No ☐N/A ☒ P. Miscellaneous drain or wash water ☒Yes ☐No ☐N/A ☒ Q. Plazas, sidewalks, and parking lots ☒Yes ☐No ☐N/A
Discussion / justification if 4.2.6 not implemented. Clearly identify which sources of runoff pollutants are discussed. Justification must be provided for all "No" answers shown above. No interior floor drains, shaft pumps, parking garages, pesticide use, water features, industrial process, vehicle cleaning, vehicle repair, or fuel dispensing areas is proposed for this project.
Note: Show all source control measures described above that are included in design capture volume calculations in the plan sheets of Attachment 5.

PRIORITY DEVELOPMENT PROJECT (PDP) SWQMP 20 of 42
Template Date: August 28, 2017 Preparation Date: February 16, 2018] LUEG:SW PDP SWQMP
Step 5: Site Design BMP Checklist Site Design BMPs
All development projects must implement site design BMPs SD-A through SD-H where applicable and feasible. See Chapter 4.3 and Appendix E of the County BMP Design Manual for information to implement site design BMPs shown in this checklist. Answer each category below pursuant to the following:
• "Yes" means the project will implement the site design BMP as described in Chapter 4.3 and/or Appendix E of the County BMP Design Manual. Discussion / justification is not required.
• "No" means the BMP is applicable to the project but it is not feasible to implement. Discussion / justification must be provided.
• "N/A" means the BMP is not applicable at the project site because the project does not include the feature that is addressed by the BMP (e.g., the project site has no existing natural areas to conserve). Discussion / justification must be provided.
Site Design Requirement Applied? 4.3.1 Maintain Natural Drainage Pathways and Hydrologic Features
☒Yes ☐No ☐N/A
Discussion / justification if 4.3.1 not implemented: It should be noted that due to riparian and environmental areas, the project will be discharging into the natural unnamed tributary for Steele Canyon via a proposed outfall. This outfall location minimizes the impacts to the riparian areas. 4.3.2 Conserve Natural Areas, Soils, and Vegetation ☒Yes ☐No ☐N/A Discussion / justification if 4.3.2 not implemented:
4.3.3 Minimize Impervious Area ☒Yes ☐No ☐N/A Discussion / justification if 4.3.3 not implemented:
4.3.4 Minimize Soil Compaction ☒Yes ☐No ☐N/A Discussion / justification if 4.3.4 not implemented:
4.3.5 Impervious Area Dispersion ☐Yes ☐No ☒N/A Discussion / justification if 4.3.5 not implemented: No areas are proposed at this time that serves the purpose of impervious area dispersion.

PRIORITY DEVELOPMENT PROJECT (PDP) SWQMP 21 of 42
Template Date: August 28, 2017 Preparation Date: February 16, 2018] LUEG:SW PDP SWQMP
Site Design Requirement Applied? 4.3.6 Runoff Collection ☐Yes ☐No ☒N/A Discussion / justification if 4.3.6 not implemented: No pervious pavements, green roofs, or small subcatchments are proposed
4.3.7 Landscaping with Native or Drought Tolerant Species ☒Yes ☐No ☐N/A Discussion / justification if 4.3.7 not implemented:
4.3.8 Harvesting and Using Precipitation ☐Yes ☒No ☐N/A Discussion / justification if 4.3.8 not implemented: Harvest and Use BMPs are deemed infeasible, please see Attachment 1a
Note: Show all site design measures described above that are included in design capture volume calculations in the plan sheets of Attachment 5.

PRIORITY DEVELOPMENT PROJECT (PDP) SWQMP 22 of 42
Template Date: August 28, 2017 Preparation Date: February 16, 2018] LUEG:SW PDP SWQMP
Step 6: PDP Structural BMPs All PDPs must implement structural BMPs for storm water pollutant control (see Chapter 5 of the BMP Design Manual). Selection of PDP structural BMPs for storm water pollutant control must be based on the selection process described in Chapter 5. PDPs subject to hydromodification management requirements must also implement structural BMPs for flow control for hydromodification management (see Chapter 6 of the BMP Design Manual). Both storm water pollutant control and flow control for hydromodification management can be achieved within the same structural BMP(s).
PDP structural BMPs must be verified by the County at the completion of construction. This may include requiring the project owner or project owner's representative and engineer of record to certify construction of the structural BMPs (see Section 1.12 of the BMP Design Manual). PDP structural BMPs must be maintained into perpetuity, and the County must confirm the maintenance (see Section 7 of the BMP Design Manual).
Use this section to provide narrative description of the general strategy for structural BMP implementation at the project site in the box below. Then complete the PDP structural BMP summary information sheet (Step 6.2) for each structural BMP within the project (copy the BMP summary information sheet [Step 6.2] as many times as needed to provide summary information for each individual structural BMP).
Step 6.1: Description of structural BMP strategy Describe the general strategy for structural BMP implementation at the site. This information must describe how the steps for selecting and designing storm water pollutant control BMPs presented in Section 5.1 of the BMP Design Manual were followed, and the results (type of BMPs selected). For projects requiring hydromodification flow control BMPs, indicate whether pollutant control and flow control BMPs are integrated or separate. At the end of this discussion provide a summary of all the structural BMPs within the project including the type and number. Three structural BMPs (BMP-1, 2 and 3), are proposed for both stormwater pollutant control and hydromodification management flow control of drainage from the project site. Selection of the BMP type was selected using Figures 5-1 and 5-2 from the County BMP Design Manual. DMA-1, 2, and 3 contains impervious surfaces; therefore, the selection begins at Step 1B. DMA-4 and DMA-5 drain directly to the northerly channel, contain impervious area of less than 5%, are composed of amended soils that do not require regular application of fertilizer/pesticides, and are hydraulically separate from other DMA's, thus they are identified as self-mitigating DMAs as outlined in Section 5.2.1 in the County BMP Design Manual. After calculating the Design Capture Volume, Step 2 was completed to determine Harvest and Use feasibility. Based on low proposed landscape irrigation water demand for the site, it was determined that Harvest and Use is infeasible (refer to Form B.3.1 provided in Attachment 1a). (Continue on following page as necessary.)

PRIORITY DEVELOPMENT PROJECT (PDP) SWQMP 23 of 42
Template Date: August 28, 2017 Preparation Date: February 16, 2018] LUEG:SW PDP SWQMP
Description of structural BMP strategy continued (Page reserved for continuation of description of general strategy for structural BMP
implementation at the site) (Continued from previous page) Pursuant to the project’s geotechnical report prepared by C.W. La Monte Company, Inc.(refer to Attachment 7 for a copy of the report), full infiltration is not feasible for proposed BMPs. Additionally, per coordination with the geotechnical engineer, partial infiltration is not allowed within areas of fill; therefore, BMPs 1 and 2 do not provide partial infiltration. BMP 3 currently assumes no infiltration, which is conservative. Partial infiltration will be re-evaluated through coordination with the project’s Geotech during final engineering and form I-8 will be updated at that time. Storm water generated from the project will be managed by the proposed BMPs and will ultimately discharge into the existing unnamed channel to the north of the project. In step 4 it was determined that BMP-1, 2 and 3 can be designed to treat the full DCV and satisfy the minimum 3% footprint requirement. It should be noted that a mid-flow orifice is provided 12-inches above the bottom of the proposed BMPs for HMP purposes (i.e., to meet the low-flow threshold (0.1Q2) requirements). The proposed BMPs more than adequately provide the required DCV with only 6-inches of surface ponding; however, the additional 6-inches of ponding were required for HMP purposes. Furthermore, due to low-flow threshold requirements for HMP, a low-flow restrictor was necessary for the proposed biofiltration BMPs, which causes the drawdown time for BMP 1 to be in excess of 24-hours. The drawdown time for all BMPs will be finalized during the final engineering phase, and if it is in excess of 24-hrs, it will be coordinated with the County and the project’s Landscape Architect. It should be noted that although Worksheet B5-1 states that BMP 1 does not meet the water quality volume, it has more than enough static storage to manage the DCV for DMA 1. BMP 1 provides and bottom footprint that exceeds the minimum 3% sizing criteria and provides 6-inches of water quality surface ponding. Additionally, It should be noted that approximately 950 S.F. of impervious area of required impervious area of Jefferson Road cannot be feasibly treated due to site constraints. However, approximately 12,000 S.F. of “Excess Treated” impervious area is managed within the project’s BMPs, which more than offsets the required untreated area. The “Excess Treated” area is comprised of existing roadway on Jefferson Road that will be overlaid and is therefore not required to be treated as part of the project.

PRIORITY DEVELOPMENT PROJECT (PDP) SWQMP 24 of 42
Template Date: August 28, 2017 Preparation Date: February 16, 2018] LUEG:SW PDP SWQMP
Step 6.2: Structural BMP Checklist (Copy this page as needed to provide information for each individual proposed
structural BMP) Structural BMP ID No. BMP-1 Construction Plan Sheet No. Type of structural BMP: ☐ Retention by harvest and use (HU-1) ☐ Retention by infiltration basin (INF-1) ☐ Retention by bioretention (INF-2) ☐ Retention by permeable pavement (INF-3) ☐ Partial retention by biofiltration with partial retention (PR-1) ☒ Biofiltration (BF-1) ☐ Biofiltration with Nutrient Sensitive Media Design (BF-2) ☐ Proprietary Biofiltration (BF-3) meeting all requirements of Appendix F ☐ Flow-thru treatment control with prior lawful approval to meet earlier PDP requirements
(provide BMP type/description in discussion section below) ☐ Flow-thru treatment control included as pre-treatment/forebay for an onsite retention or
biofiltration BMP (provide BMP type/description and indicate which onsite retention or biofiltration BMP it serves in discussion section below)
☐ Flow-thru treatment control with alternative compliance (provide BMP type/description in discussion section below)
☐ Detention pond or vault for hydromodification management ☐ Other (describe in discussion section below)
Purpose: ☐ Pollutant control only ☐ Hydromodification control only ☒ Combined pollutant control and hydromodification control ☐ Pre-treatment/forebay for another structural BMP ☒ Other (describe in discussion section below) Who will certify construction of this BMP? Provide name and contact information for the party responsible to sign BMP verification forms (See Section 1.12 of the BMP Design Manual)
Who will be the final owner of this BMP?
☐ HOA ☒ Property Owner ☐ County ☐ Other (describe)
Who will maintain this BMP into perpetuity?
☐ HOA ☒ Property Owner ☐ County ☐ Other (describe)
What Category (1-4) is the Structural BMP? Refer to the Category definitions in Section 7.3 of the BMP DM. Attach the appropriate maintenance agreement in Attachment 3.
2
Discussion (as needed): Also provides Detention for 100-yr storm event (Continue on subsequent pages as necessary)

PRIORITY DEVELOPMENT PROJECT (PDP) SWQMP 25 of 42
Template Date: August 28, 2017 Preparation Date: February 16, 2018] LUEG:SW PDP SWQMP
Step 6.3: Offsite Alternative Compliance Participation Form PDP INFORMATION Record ID: N/A
Assessor's Parcel Number(s) [APN(s)] N/A
What are your PDP Pollutant Control Debits? *See Attachment 1 of the PDP SWQMP
N/A
What are your PDP HMP Debits? (if applicable) *See Attachment 2 of the PDP SWQMP
N/A
ACP Information Record ID: N/A
Assessor's Parcel Number(s) [APN(s)] N/A
Project Owner/Address
N/A
What are your ACP Pollutant Control Credits? *See Attachment 1 of the ACP SWQMP
N/A
What are your ACP HMP Debits? (if applicable) *See Attachment 2 of the ACP SWQMP
N/A
Is your ACP in the same watershed as your PDP?
☐ Yes ☐ No
Will your ACP project be completed prior to the completion of the PDP?
☐ Yes ☐ No
Does your ACP account for all Deficits generated by the PDP?
☐ Yes ☐ No (PDP and/or ACP must be redesigned to account for all deficits generated by the PDP.
What is the difference between your PDP debits and ACP Credits? *(ACP Credits -Total PDP Debits = Total Earned Credits)

PRIORITY DEVELOPMENT PROJECT (PDP) SWQMP 25 of 42
Template Date: August 28, 2017 Preparation Date: March 26, 2018 LUEG:SW PDP SWQMP
Step 6.2: Structural BMP Checklist (Copy this page as needed to provide information for each individual proposed
structural BMP) Structural BMP ID No. BMP-2 Construction Plan Sheet No. Type of structural BMP: ☐ Retention by harvest and use (HU-1) ☐ Retention by infiltration basin (INF-1) ☐ Retention by bioretention (INF-2) ☐ Retention by permeable pavement (INF-3) ☐ Partial retention by biofiltration with partial retention (PR-1) ☒ Biofiltration (BF-1) ☐ Biofiltration with Nutrient Sensitive Media Design (BF-2) ☐ Proprietary Biofiltration (BF-3) meeting all requirements of Appendix F ☐ Flow-thru treatment control with prior lawful approval to meet earlier PDP requirements
(provide BMP type/description in discussion section below) ☐ Flow-thru treatment control included as pre-treatment/forebay for an onsite retention or
biofiltration BMP (provide BMP type/description and indicate which onsite retention or biofiltration BMP it serves in discussion section below)
☐ Flow-thru treatment control with alternative compliance (provide BMP type/description in discussion section below)
☐ Detention pond or vault for hydromodification management ☐ Other (describe in discussion section below)
Purpose: ☐ Pollutant control only ☐ Hydromodification control only ☒ Combined pollutant control and hydromodification control ☐ Pre-treatment/forebay for another structural BMP ☐ Other (describe in discussion section below) Who will certify construction of this BMP? Provide name and contact information for the party responsible to sign BMP verification forms (See Section 1.12 of the BMP Design Manual)
Who will be the final owner of this BMP?
☐ HOA ☒ Property Owner ☐ County ☐ Other (describe)
Who will maintain this BMP into perpetuity?
☐ HOA ☒ Property Owner ☐ County ☐ Other (describe)
What Category (1-4) is the Structural BMP? Refer to the Category definitions in Section 7.3 of the BMP DM. Attach the appropriate maintenance agreement in Attachment 3.
2
Discussion (as needed): (Continue on subsequent pages as necessary) Also provides Detention for 100-yr storm event

PRIORITY DEVELOPMENT PROJECT (PDP) SWQMP 25 of 42
Template Date: August 28, 2017 Preparation Date: March 26, 2018 LUEG:SW PDP SWQMP
Step 6.2: Structural BMP Checklist (Copy this page as needed to provide information for each individual proposed
structural BMP) Structural BMP ID No. BMP-3 Construction Plan Sheet No. Type of structural BMP: ☐ Retention by harvest and use (HU-1) ☐ Retention by infiltration basin (INF-1) ☐ Retention by bioretention (INF-2) ☐ Retention by permeable pavement (INF-3) ☐ Partial retention by biofiltration with partial retention (PR-1) ☒ Biofiltration (BF-1) ☐ Biofiltration with Nutrient Sensitive Media Design (BF-2) ☐ Proprietary Biofiltration (BF-3) meeting all requirements of Appendix F ☐ Flow-thru treatment control with prior lawful approval to meet earlier PDP requirements
(provide BMP type/description in discussion section below) ☐ Flow-thru treatment control included as pre-treatment/forebay for an onsite retention or
biofiltration BMP (provide BMP type/description and indicate which onsite retention or biofiltration BMP it serves in discussion section below)
☐ Flow-thru treatment control with alternative compliance (provide BMP type/description in discussion section below)
☐ Detention pond or vault for hydromodification management ☐ Other (describe in discussion section below)
Purpose: ☐ Pollutant control only ☐ Hydromodification control only ☒ Combined pollutant control and hydromodification control ☐ Pre-treatment/forebay for another structural BMP ☐ Other (describe in discussion section below)
Who will certify construction of this BMP? Provide name and contact information for the party responsible to sign BMP verification forms (See Section 1.12 of the BMP Design Manual) Who will be the final owner of this BMP? ☐ HOA ☒ Property Owner ☐ County
☐ Other (describe) Who will maintain this BMP into perpetuity? ☐ HOA ☒ Property Owner ☐ County
☐ Other (describe) What Category (1-4) is the Structural BMP? Refer to the Category definitions in Section 7.3 of the BMP DM. Attach the appropriate maintenance agreement in Attachment 3.
2
Discussion (as needed):
(Continue on subsequent pages as necessary) Also provides Detention for 100-yr storm event

PRIORITY DEVELOPMENT PROJECT (PDP) SWQMP 26 of 42
Template Date: August 28, 2017 Preparation Date: February 16, 2018] LUEG:SW PDP SWQMP - Attachments
ATTACHMENT 1
BACKUP FOR PDP POLLUTANT CONTROL BMPS
This is the cover sheet for Attachment 1.
Indicate which Items are Included behind this cover sheet: Attachment Sequence Contents Checklist Attachment 1a Storm Water Pollutant Control
Worksheet Calculations -Worksheet B.3-1 (Required) -Worksheet B.1-1 (Required) -Worksheet B.4-1 (if applicable) -Worksheet B.4-2 (if applicable) -Worksheet B.5-1 (if applicable) -Worksheet B.5-2 (if applicable) -Worksheet B.5-3 (if applicable) -Worksheet B.6-1 (if applicable) -Summary Worksheet (optional)
☒ Included
Attachment 1b Form I-8, Categorization of Infiltration Feasibility Condition (Required unless the project will use harvest and use BMPs) Refer to Appendices C and D of the BMP Design Manual to complete Form I-8.
☒ Included ☐ Not included because the entire
project will use harvest and use BMPs
Attachment 1c DMA Exhibit (Required) See DMA Exhibit Checklist on the back of this Attachment cover sheet.
☒ Included
Attachment 1d Individual Structural BMP DMA Mapbook (Required) -Place each map on 8.5”x11” paper. -Show at a minimum the DMA, Structural BMP, and any existing hydrologic features within the DMA.
☐ Included

PRIORITY DEVELOPMENT PROJECT (PDP) SWQMP 27 of 42
Template Date: August 28, 2017 Preparation Date: February 16, 2018] LUEG:SW PDP SWQMP - Attachments
Use this checklist to ensure the required information has been included on the DMA Exhibit:
The DMA Exhibit must identify: ☒ Underlying hydrologic soil group ☒ Approximate depth to groundwater ☒ Existing natural hydrologic features (watercourses, seeps, springs, wetlands) ☒ Critical coarse sediment yield areas to be protected ☒ Existing topography and impervious areas ☒ Existing and proposed site drainage network and connections to drainage offsite ☐ Proposed demolition ☒ Proposed grading ☒ Proposed impervious features ☒ Proposed design features and surface treatments used to minimize imperviousness ☒ Drainage management area (DMA) boundaries, DMA ID numbers, and DMA areas (square
footage or acreage), and DMA type (i.e., drains to BMP, self-retaining, or self-mitigating) ☒ Potential pollutant source areas and corresponding required source controls (see Chapter 4,
Appendix E.1, and Step 3.5) ☒ Structural BMPs (identify location, structural BMP ID#, type of BMP, and size/detail)


Category # Description Value Units
0 Design Capture Volume for Entire Project Site 10,857 cubic-feet
1 Proposed Development Type Retail unitless
2 Number of Residents or Employees at Proposed Development 50 #
3 Total Planted Area within Development 47,698 sq-ft
4 Water Use Category for Proposed Planted Areas Low unitless
5 Is Average Site Design Infiltration Rate ≤0.500 Inches per Hour? Yes yes/no
6 Is Average Site Design Infiltration Rate ≤0.010 Inches per Hour? Yes yes/no
7 Is Infiltration of the Full DCV Anticipated to Produce Negative Impacts? Yes yes/no
8 Is Infiltration of Any Volume Anticipated to Produce Negative Impacts? Yes yes/no
9 36-Hour Toilet Use Per Resident or Employee 1.40 cubic-feet
10 Subtotal: Anticipated 36 Hour Toilet Use 70 cubic-feet
11 Anticipated 1 Acre Landscape Use Over 36 Hours 52.14 cubic-feet
12 Subtotal: Anticipated Landscape Use Over 36 Hours 57 cubic-feet
13 Total Anticipated Use Over 36 Hours 127 cubic-feet
14 Total Anticipated Use / Design Capture Volume 0.01 cubic-feet
15 Are Full Capture and Use Techniques Feasible for this Project? No unitless
16 Is Full Retention Feasible for this Project? No yes/no
17 Is Partial Retention Feasible for this Project? No yes/no
Result 18 Feasibility Category 5 1, 2, 3, 4, 5
Worksheet B.3-1 General Notes:
H. PDPs participating in an offsite alternative compliance program are not held to the feasibility categories presented herein.
Capture & Use
Inputs
Automated Worksheet B.3-1: Project-Scale BMP Feasibility Analysis (V1.3)
C. Feasibility Category 1: Applicant must implement capture & use, retention, and/or infiltration elements for the entire DCV.
D. Feasibility Category 2: Applicant must implement capture & use elements for the entire DCV.
E. Feasibility Category 3: Applicant must implement retention and/or infiltration elements for all DMAs with Design Infiltration Rates greater
than 0.50 in/hr.
B. Negative impacts associated with retention may include geotechnical, groundwater, water balance, or other issues identified by a
geotechnical engineer and substantiated through completion of Form I-8.
Infiltration
Inputs
G. Feasibility Category 5: Applicant must implement standard lined biofiltration BMPs sized at ≥3% of the effective impervious tributary area
for all DMAs with Design Infiltration Rates of 0.010 in/hr or less. Applicants may also be permitted to implement reduced size and/or
specialized biofiltration BMPs provided additional criteria identified in "Supplemental Retention Criteria for Non-Standard Biofiltration
BMPs" are satisfied.
A. Applicants may use this worksheet to determine the types of structural BMPs that are acceptable for implementation at their project site (as
required in Section 5 of the BMPDM). User input should be provided for yellow shaded cells, values for all other cells will be automatically
generated. Projects demonstrating feasibility or potential feasibility via this worksheet are encouraged to incorporate capture and use features
in their project.
F. Feasibility Category 4: Applicant must implement standard unlined biofiltration BMPs sized at ≥3% of the effective impervious tributary
area for all DMAs with Design Infiltration Rates of 0.011 to 0.50 in/hr. Applicants may be permitted to implement lined BMPs, reduced size
BMPs, and/or specialized biofiltration BMPs provided additional criteria identified in "Supplemental Retention Criteria for Non-Standard
Biofiltration BMPs" are satisfied.
Calculations

Category # Description i ii iii iv v vi vii viii ix x Units
0 Drainage Basin ID or Name 1 2 3 unitless
1 Basin Drains to the Following BMP Type Biofiltration Biofiltration Biofiltration unitless
2 85th Percentile 24-hr Storm Depth 0.51 0.51 0.51 inches
3 Design Infiltration Rate Recommended by Geotechnical Engineer 0.000 0.000 0.000 in/hr
4 Impervious Surfaces Not Directed to Dispersion Area (C=0.90) 140,481 93,654 36,155 sq-ft
5 Semi-Pervious Surfaces Not Serving as Dispersion Area (C=0.30) 10,035 7,813 19,085 sq-ft
6 Engineered Pervious Surfaces Not Serving as Dispersion Area (C=0.10) 6,300 3,077 1,388 sq-ft
7 Natural Type A Soil Not Serving as Dispersion Area (C=0.10) sq-ft
8 Natural Type B Soil Not Serving as Dispersion Area (C=0.14) sq-ft
9 Natural Type C Soil Not Serving as Dispersion Area (C=0.23) sq-ft
10 Natural Type D Soil Not Serving as Dispersion Area (C=0.30) sq-ft
11 Does Tributary Incorporate Dispersion, Tree Wells, and/or Rain Barrels? No No No No No No No No No No yes/no
12 Impervious Surfaces Directed to Dispersion Area per SD-B (Ci=0.90) sq-ft
13 Semi-Pervious Surfaces Serving as Dispersion Area per SD-B (Ci=0.30) sq-ft
14 Engineered Pervious Surfaces Serving as Dispersion Area per SD-B (Ci=0.10) sq-ft
15 Natural Type A Soil Serving as Dispersion Area per SD-B (Ci=0.10) sq-ft
16 Natural Type B Soil Serving as Dispersion Area per SD-B (Ci=0.14) sq-ft
17 Natural Type C Soil Serving as Dispersion Area per SD-B (Ci=0.23) sq-ft
18 Natural Type D Soil Serving as Dispersion Area per SD-B (Ci=0.30) sq-ft
19 Number of Tree Wells Proposed per SD-A #
20 Average Mature Tree Canopy Diameter ft
21 Number of Rain Barrels Proposed per SD-E #
22 Average Rain Barrel Size gal
23 Does BMP Overflow to Stormwater Features in Downstream Drainage? No No No No No No No No No No unitless
24 Identify Downstream Drainage Basin Providing Treatment in Series unitless
25 Percent of Upstream Flows Directed to Downstream Dispersion Areas percent
26 Upstream Impervious Surfaces Directed to Dispersion Area (Ci=0.90) 0 0 0 0 0 0 0 0 0 0 cubic-feet
27 Upstream Impervious Surfaces Not Directed to Dispersion Area (C=0.90) 0 0 0 0 0 0 0 0 0 0 cubic-feet
28 Total Tributary Area 156,816 104,544 56,628 0 0 0 0 0 0 0 sq-ft
29 Initial Runoff Factor for Standard Drainage Areas 0.83 0.83 0.68 0.00 0.00 0.00 0.00 0.00 0.00 0.00 unitless
30 Initial Runoff Factor for Dispersed & Dispersion Areas 0.00 0.00 0.00 0.00 0.00 0.00 0.00 0.00 0.00 0.00 unitless
31 Initial Weighted Runoff Factor 0.83 0.83 0.68 0.00 0.00 0.00 0.00 0.00 0.00 0.00 unitless
32 Initial Design Capture Volume 5,532 3,688 1,637 0 0 0 0 0 0 0 cubic-feet
33 Total Impervious Area Dispersed to Pervious Surface 0 0 0 0 0 0 0 0 0 0 sq-ft
34 Total Pervious Dispersion Area 0 0 0 0 0 0 0 0 0 0 sq-ft
35 Ratio of Dispersed Impervious Area to Pervious Dispersion Area n/a n/a n/a n/a n/a n/a n/a n/a n/a n/a ratio
36 Adjustment Factor for Dispersed & Dispersion Areas 1.00 1.00 1.00 1.00 1.00 1.00 1.00 1.00 1.00 1.00 ratio
37 Runoff Factor After Dispersion Techniques 0.83 0.83 0.68 n/a n/a n/a n/a n/a n/a n/a unitless
38 Design Capture Volume After Dispersion Techniques 5,532 3,688 1,637 0 0 0 0 0 0 0 cubic-feet
39 Total Tree Well Volume Reduction 0 0 0 0 0 0 0 0 0 0 cubic-feet
40 Total Rain Barrel Volume Reduction 0 0 0 0 0 0 0 0 0 0 cubic-feet
41 Final Adjusted Runoff Factor 0.83 0.83 0.68 0.00 0.00 0.00 0.00 0.00 0.00 0.00 unitless
42 Final Effective Tributary Area 130,157 86,772 38,507 0 0 0 0 0 0 0 sq-ft
43 Initial Design Capture Volume Retained by Site Design Elements 0 0 0 0 0 0 0 0 0 0 cubic-feet
44 Final Design Capture Volume Tributary to BMP 5,532 3,688 1,637 0 0 0 0 0 0 0 cubic-feet
Worksheet B.1-1 General Notes:
False
False
False
Automated Worksheet B.1-1: Calculation of Design Capture Volume (V1.3)
A. Applicants may use this worksheet to calculate design capture volumes for up to 10 drainage areas User input must be provided for yellow shaded cells, values for all other cells will be automatically generated, errors/notifications will be highlighted in red and summarized below.
Upon completion of this worksheet, proceed to the appropriate BMP Sizing worksheet(s).
Dispersion
Area, Tree Well
& Rain Barrel
Inputs
(Optional)
Standard
Drainage Basin
Inputs
Results
Tree & Barrel
Adjustments
Initial Runoff
Factor
Calculation
Dispersion
Area
Adjustments
Treatment
Train Inputs &
Calculations
False

Category # Description i ii iii iv v vi vii viii ix x Units
0 Drainage Basin ID or Name 1 2 3 - - - - - - - sq-ft
1 Design Infiltration Rate Recommended by Geotechnical Engineer 0.000 0.000 0.000 - - - - - - - in/hr
2 Effective Tributary Area 130,157 86,772 38,507 - - - - - - - sq-ft
3 Minimum Biofiltration Footprint Sizing Factor 0.030 0.030 0.030 - - - - - - - ratio
4 Design Capture Volume Tributary to BMP 5,532 3,688 1,637 - - - - - - - cubic-feet
5 Is Biofiltration Basin Impermeably Lined or Unlined? Lined Lined Lined unitless
6 Provided Biofiltration BMP Surface Area 6,300 3,077 1,388 sq-ft
7 Provided Surface Ponding Depth 6 6 6 inches
8 Provided Soil Media Thickness 27 27 27 inches
9 Provided Depth of Gravel Above Underdrain Invert 24 24 24 inches
10 Diameter of Underdrain or Hydromod Orifice (Select Smallest) 0.69 0.69 0.50 inches
11 Provided Depth of Gravel Below the Underdrain 3 3 3 inches
12 Volume Infiltrated Over 6 Hour Storm 0 0 0 0 0 0 0 0 0 0 cubic-feet
13 Soil Media Pore Space Available for Retention 0.05 0.05 0.05 0.05 0.05 0.05 0.05 0.05 0.05 0.05 unitless
14 Gravel Pore Space Available for Retention 0.00 0.00 0.00 0.00 0.00 0.00 0.00 0.00 0.00 0.00 unitless
15 Effective Retention Depth 1.35 1.35 1.35 0.00 0.00 0.00 0.00 0.00 0.00 0.00 inches
16 Calculated Retention Storage Drawdown (Including 6 Hr Storm) 120 120 120 0 0 0 0 0 0 0 hours
17 Volume Retained by BMP 709 346 156 0 0 0 0 0 0 0 cubic-feet
18 Fraction of DCV Retained 0.13 0.09 0.10 0.00 0.00 0.00 0.00 0.00 0.00 0.00 ratio
19 Portion of Retention Performance Standard Satisfied 0.15 0.11 0.12 0.00 0.00 0.00 0.00 0.00 0.00 0.00 ratio
20 Fraction of DCV Retained (normalized to 36-hr drawdown) 0.07 0.05 0.06 0.00 0.00 0.00 0.00 0.00 0.00 0.00 ratio
21 Design Capture Volume Remaining for Biofiltration 5,145 3,504 1,539 0 0 0 0 0 0 0 cubic-feet
22 Max Hydromod Flow Rate through Underdrain 0.0270 0.0270 0.0143 n/a n/a n/a n/a n/a n/a n/a CFS
23 Max Soil Filtration Rate Allowed by Underdrain Orifice 0.18 0.38 0.44 n/a n/a n/a n/a n/a n/a n/a in/hr
24 Soil Media Filtration Rate per Specifications 5.00 5.00 5.00 5.00 5.00 5.00 5.00 5.00 5.00 5.00 in/hr
25 Soil Media Filtration Rate to be used for Sizing 0.18 0.38 0.44 5.00 5.00 5.00 5.00 5.00 5.00 5.00 in/hr
26 Depth Biofiltered Over 6 Hour Storm 1.11 2.27 2.67 30.00 30.00 30.00 30.00 30.00 30.00 30.00 inches
27 Soil Media Pore Space Available for Biofiltration 0.20 0.20 0.20 0.20 0.20 0.20 0.20 0.20 0.20 0.20 unitless
28 Effective Depth of Biofiltration Storage 21.00 21.00 21.00 0.00 0.00 0.00 0.00 0.00 0.00 0.00 inches
29 Drawdown Time for Surface Ponding 32 16 14 0 0 0 0 0 0 0 hours
30 Drawdown Time for Effective Biofiltration Depth 114 55 47 0 0 0 0 0 0 0 hours
31 Total Depth Biofiltered 22.11 23.27 23.67 30.00 30.00 30.00 30.00 30.00 30.00 30.00 inches
32 Option 1 - Biofilter 1.50 DCV: Target Volume 7,718 5,256 2,309 0 0 0 0 0 0 0 cubic-feet
33 Option 1 - Provided Biofiltration Volume 7,718 5,256 2,309 0 0 0 0 0 0 0 cubic-feet
34 Option 2 - Store 0.75 DCV: Target Volume 3,859 2,628 1,154 0 0 0 0 0 0 0 cubic-feet
35 Option 2 - Provided Storage Volume 3,859 2,628 1,154 0 0 0 0 0 0 0 cubic-feet
36 Portion of Biofiltration Performance Standard Satisfied 0.00 1.00 1.00 0.00 0.00 0.00 0.00 0.00 0.00 0.00 ratio
37 Do Site Design Elements and BMPs Satisfy Annual Retention Requirements? Yes Yes Yes - - - - - - - yes/no
38 Overall Portion of Performance Standard Satisfied 0.15 1.00 1.00 0.00 0.00 0.00 0.00 0.00 0.00 0.00 ratio
39 This BMP Overflows to the Following Drainage Basin - - - - - - - - - - unitless
40 Deficit of Effectively Treated Stormwater -4,702 0 0 n/a n/a n/a n/a n/a n/a n/a cubic-feet
Worksheet B.5-1 General Notes:
Attention!
Biofiltration
Calculations
A. Applicants may use this worksheet to size Lined or Unlined Biofiltration BMPs (BF-1, PR-1) for up to 10 basins. User input must be provided for yellow shaded cells, values for blue cells are automatically populated based on user inputs from previous worksheets, values for all
other cells will be automatically generated, errors/notifications will be highlighted in red/orange and summarized below. BMPs fully satisfying the pollutant control performance standards will have a deficit treated volume of zero and be highlighted in green.
-This BMP does not fully satisfy the performance standards for pollutant control and must be supplemented with flow-thru treatment and an offsite alternative compliance project.
False
-Vegetated BMPs must have a surface ponding drawdown time of 24 hours or less. Drawdown times over 24 hours may be permitted at the discretion of County staff if certified by a landscape architect or agronomist.
False
Result
False
False
Retention
Calculations
Automated Worksheet B.5-1: Sizing Lined or Unlined Biofiltration BMPs (V1.3)
False
BMP Inputs
False

Category # Description i ii iii iv v vi vii viii ix x Units
0 Drainage Basin ID or Name 1 2 3 - - - - - - - unitless
1 85th Percentile Storm Depth 0.51 0.51 0.51 - - - - - - - inches
2Design Infiltration Rate Recommended by Geotechnical
Engineer0.000 0.000 0.000 - - - - - - - in/hr
3 Total Tributary Area 156,816 104,544 56,628 - - - - - - - sq-ft
4 85th Percentile Storm Volume (Rainfall Volume) 6,665 4,443 2,407 - - - - - - - cubic-feet
5 Initial Weighted Runoff Factor 0.83 0.83 0.68 - - - - - - - unitless
6 Initial Design Capture Volume 5,532 3,688 1,637 - - - - - - - cubic-feet
7 Dispersion Area Reductions 0 0 0 - - - - - - - cubic-feet
8 Tree Well and Rain Barrel Reductions 0 0 0 - - - - - - - cubic-feet
9 Effective Area Tributary to BMP 130,157 86,772 38,507 - - - - - - - square feet
10 Final Design Capture Volume Tributary to BMP 5,532 3,688 1,637 - - - - - - - cubic-feet
11 Basin Drains to the Following BMP Type Biofiltration Biofiltration Biofiltration - - - - - - - unitless
12Volume Retained by BMP
(normalized to 36 hour drawdown)387 184 98 - - - - - - - cubic-feet
13 Total Fraction of Initial DCV Retained within DMA 0.07 0.05 0.06 - - - - - - - fraction
14 Percent of Average Annual Runoff Retention Provided 10.7% 7.6% 9.1% - - - - - - - %
15 Percent of Average Annual Runoff Retention Required 4.5% 4.5% 4.5% - - - - - - - %
Performance
Standard16 Percent of Pollution Control Standard Satisfied 15.0% 100.0% 100.0% - - - - - - - %
17 Discharges to Secondary Treatment in Drainage Basin - - - - - - - - - - unitless
18 Impervious Surface Area Still Requiring Treatment 122,926 0 0 - - - - - - - square feet
19Impervious Surfaces Directed to Downstream Dispersion
Area- - - - - - - - - - square feet
20Impervious Surfaces Not Directed to Downstream
Dispersion Area- - - - - - - - - - square feet
Result 21 Deficit of Effectively Treated Stormwater -4,702 0 0 - - - - - - - cubic-feet
-Performance standards for onsite pollutant control are not satisfied. The applicant must implement onsite flow-thru BMPs per Worksheet B.6-1 and an offsite alternative compliance project to mitigate for the deficit of effectively treated stormwater.
All fields in this summary worksheet are populated based on previous user inputs. If applicable, drainage basin elements that require revisions and/or supplemental information outside the scope of these worksheets are highlighted in orange and summairzed in the red text below. If all drainage basins achieve full compliance without a need for supplemental information, a green message will appear below.
Summary Notes:
False
False
False
False
False
Total Volume
Reductions
Attention!
Summary of Stormwater Pollutant Control Calculations (V1.3)
Initial DCV
Site Design
Volume
Reductions
General Info
BMP Volume
Reductions
Treatment
Train

Appendix I: Forms and Checklists
I-3 February 26, 2016
Categorization of Infiltration Feasibility Condition Form I-8
Part 1 - Full Infiltration Feasibility Screening Criteria
Would infiltration of the full design volume be feasible from a physical perspective without any undesirable consequences that cannot be reasonably mitigated?
Note that it is not necessary to investigate each and every criterion in the worksheet if infiltration is precluded. Instead a letter of justification from a geotechnical professional familiar with the local conditions substantiating any geotechnical issues will be required.
Criteria Screening Question Yes No
1Is the estimated reliable infiltration rate below proposed facility locations greater than 0.5 inches per hour? The response to this Screening Question must be based on a comprehensive evaluation of the factors presented in Appendix C.2 and Appendix D.
Provide basis:
Summarize findings of studies; provide reference to studies, calculations, maps, data sources, etc. Provide narrative discussion of study/data source applicability.
2
Can infiltration greater than 0.5 inches per hour be allowed without increasing risk of geotechnical hazards (slope stability, groundwater mounding, utilities, or other factors) that cannot be mitigated to an acceptable level? The response to this Screening Question must be based on a comprehensive evaluation of the factors presented in Appendix C.2.
Provide basis:
Summarize findings of studies; provide reference to studies, calculations, maps, data sources, etc. Provide narrative discussion of study/data source applicability.

Appendix I: Forms and Checklists
I-4 February 26, 2016
Form I-8 Page 2 of 4 Criteria Screening Question Yes No
3
Can infiltration greater than 0.5 inches per hour be allowed without increasing risk of groundwater contamination (shallow water table, storm water pollutants or other factors) that cannot be mitigated to an acceptable level? The response to this Screening Question must be based on a comprehensive evaluation of the factors presented in Appendix C.3.
Provide basis:
Summarize findings of studies; provide reference to studies, calculations, maps, data sources, etc. Provide narrative discussion of study/data source applicability.
4
Can infiltration greater than 0.5 inches per hour be allowed without causing potential water balance issues such as change of seasonality of ephemeral streams or increased discharge of contaminated groundwater to surface waters? The response to this Screening Question must be based on a comprehensive evaluation of the factors presented in Appendix C.3.
Provide basis:
Summarize findings of studies; provide reference to studies, calculations, maps, data sources, etc. Provide narrative discussion of study/data source applicability.
Part 1 Result*
If all answers to rows 1 - 4 are “Yes” a full infiltration design is potentially feasible. The feasibility screening category is Full Infiltration If any answer from row 1-4 is “No”, infiltration may be possible to some extent but would not generally be feasible or desirable to achieve a “full infiltration” design. Proceed to Part 2
*To be completed using gathered site information and best professional judgment considering the definition of MEP in the MS4 Permit. Additional testing and/or studies may be required by Agency/Jurisdictions to substantiate findings

Appendix I: Forms and Checklists
I-5 February 26, 2016
Form I-8 Page 3 of 4
Part 2 – Partial Infiltration vs. No Infiltration Feasibility Screening Criteria
Would infiltration of water in any appreciable amount be physically feasible without any negative consequences that cannot be reasonably mitigated?
Criteria Screening Question Yes No
5
Do soil and geologic conditions allow for infiltration in any appreciable rate or volume? The response to this Screening Question must be based on a comprehensive evaluation of the factors presented in Appendix C.2 and Appendix D.
Provide basis:
Summarize findings of studies; provide reference to studies, calculations, maps, data sources, etc. Provide narrative discussion of study/data source applicability and why it was not feasible to mitigate low infiltration rates.
6
Can Infiltration in any appreciable quantity be allowed without increasing risk of geotechnical hazards (slope stability, groundwater mounding, utilities, or other factors) that cannot be mitigated to an acceptable level? The response to this Screening Question must be based on a comprehensive evaluation of the factors presented in Appendix C.2.
Provide basis:
Summarize findings of studies; provide reference to studies, calculations, maps, data sources, etc. Provide narrative discussion of study/data source applicability and why it was not feasible to mitigate low infiltration rates.

Appendix I: Forms and Checklists
I-6 February 26, 2016
Form I-8 Page 4 of 4
Criteria Screening Question Yes No
7
Can Infiltration in any appreciable quantity be allowed without posing significant risk for groundwater related concerns (shallow water table, storm water pollutants or other factors)? The response to this Screening Question must be based on a comprehensive evaluation of the factors presented in Appendix C.3.
Provide basis:
Summarize findings of studies; provide reference to studies, calculations, maps, data sources, etc. Provide narrative discussion of study/data source applicability and why it was not feasible to mitigate low infiltration rates.
8 Can infiltration be allowed without violating downstream water rights? The response to this Screening Question must be based on a comprehensive evaluation of the factors presented in Appendix C.3.
Provide basis:
Summarize findings of studies; provide reference to studies, calculations, maps, data sources, etc. Provide narrative discussion of study/data source applicability and why it was not feasible to mitigate low infiltration rates.
Part 2 Result*
If all answers from row 1-4 are yes then partial infiltration design is potentially feasible. The feasibility screening category is Partial Infiltration.
If any answer from row 5-8 is no, then infiltration of any volume is considered to be infeasible within the drainage area. The feasibility screening category is No Infiltration.
*To be completed using gathered site information and best professional judgment considering the definition of MEP in the MS4 Permit. Additional testing and/or studies may be required by Agency/Jurisdictions to substantiate findings
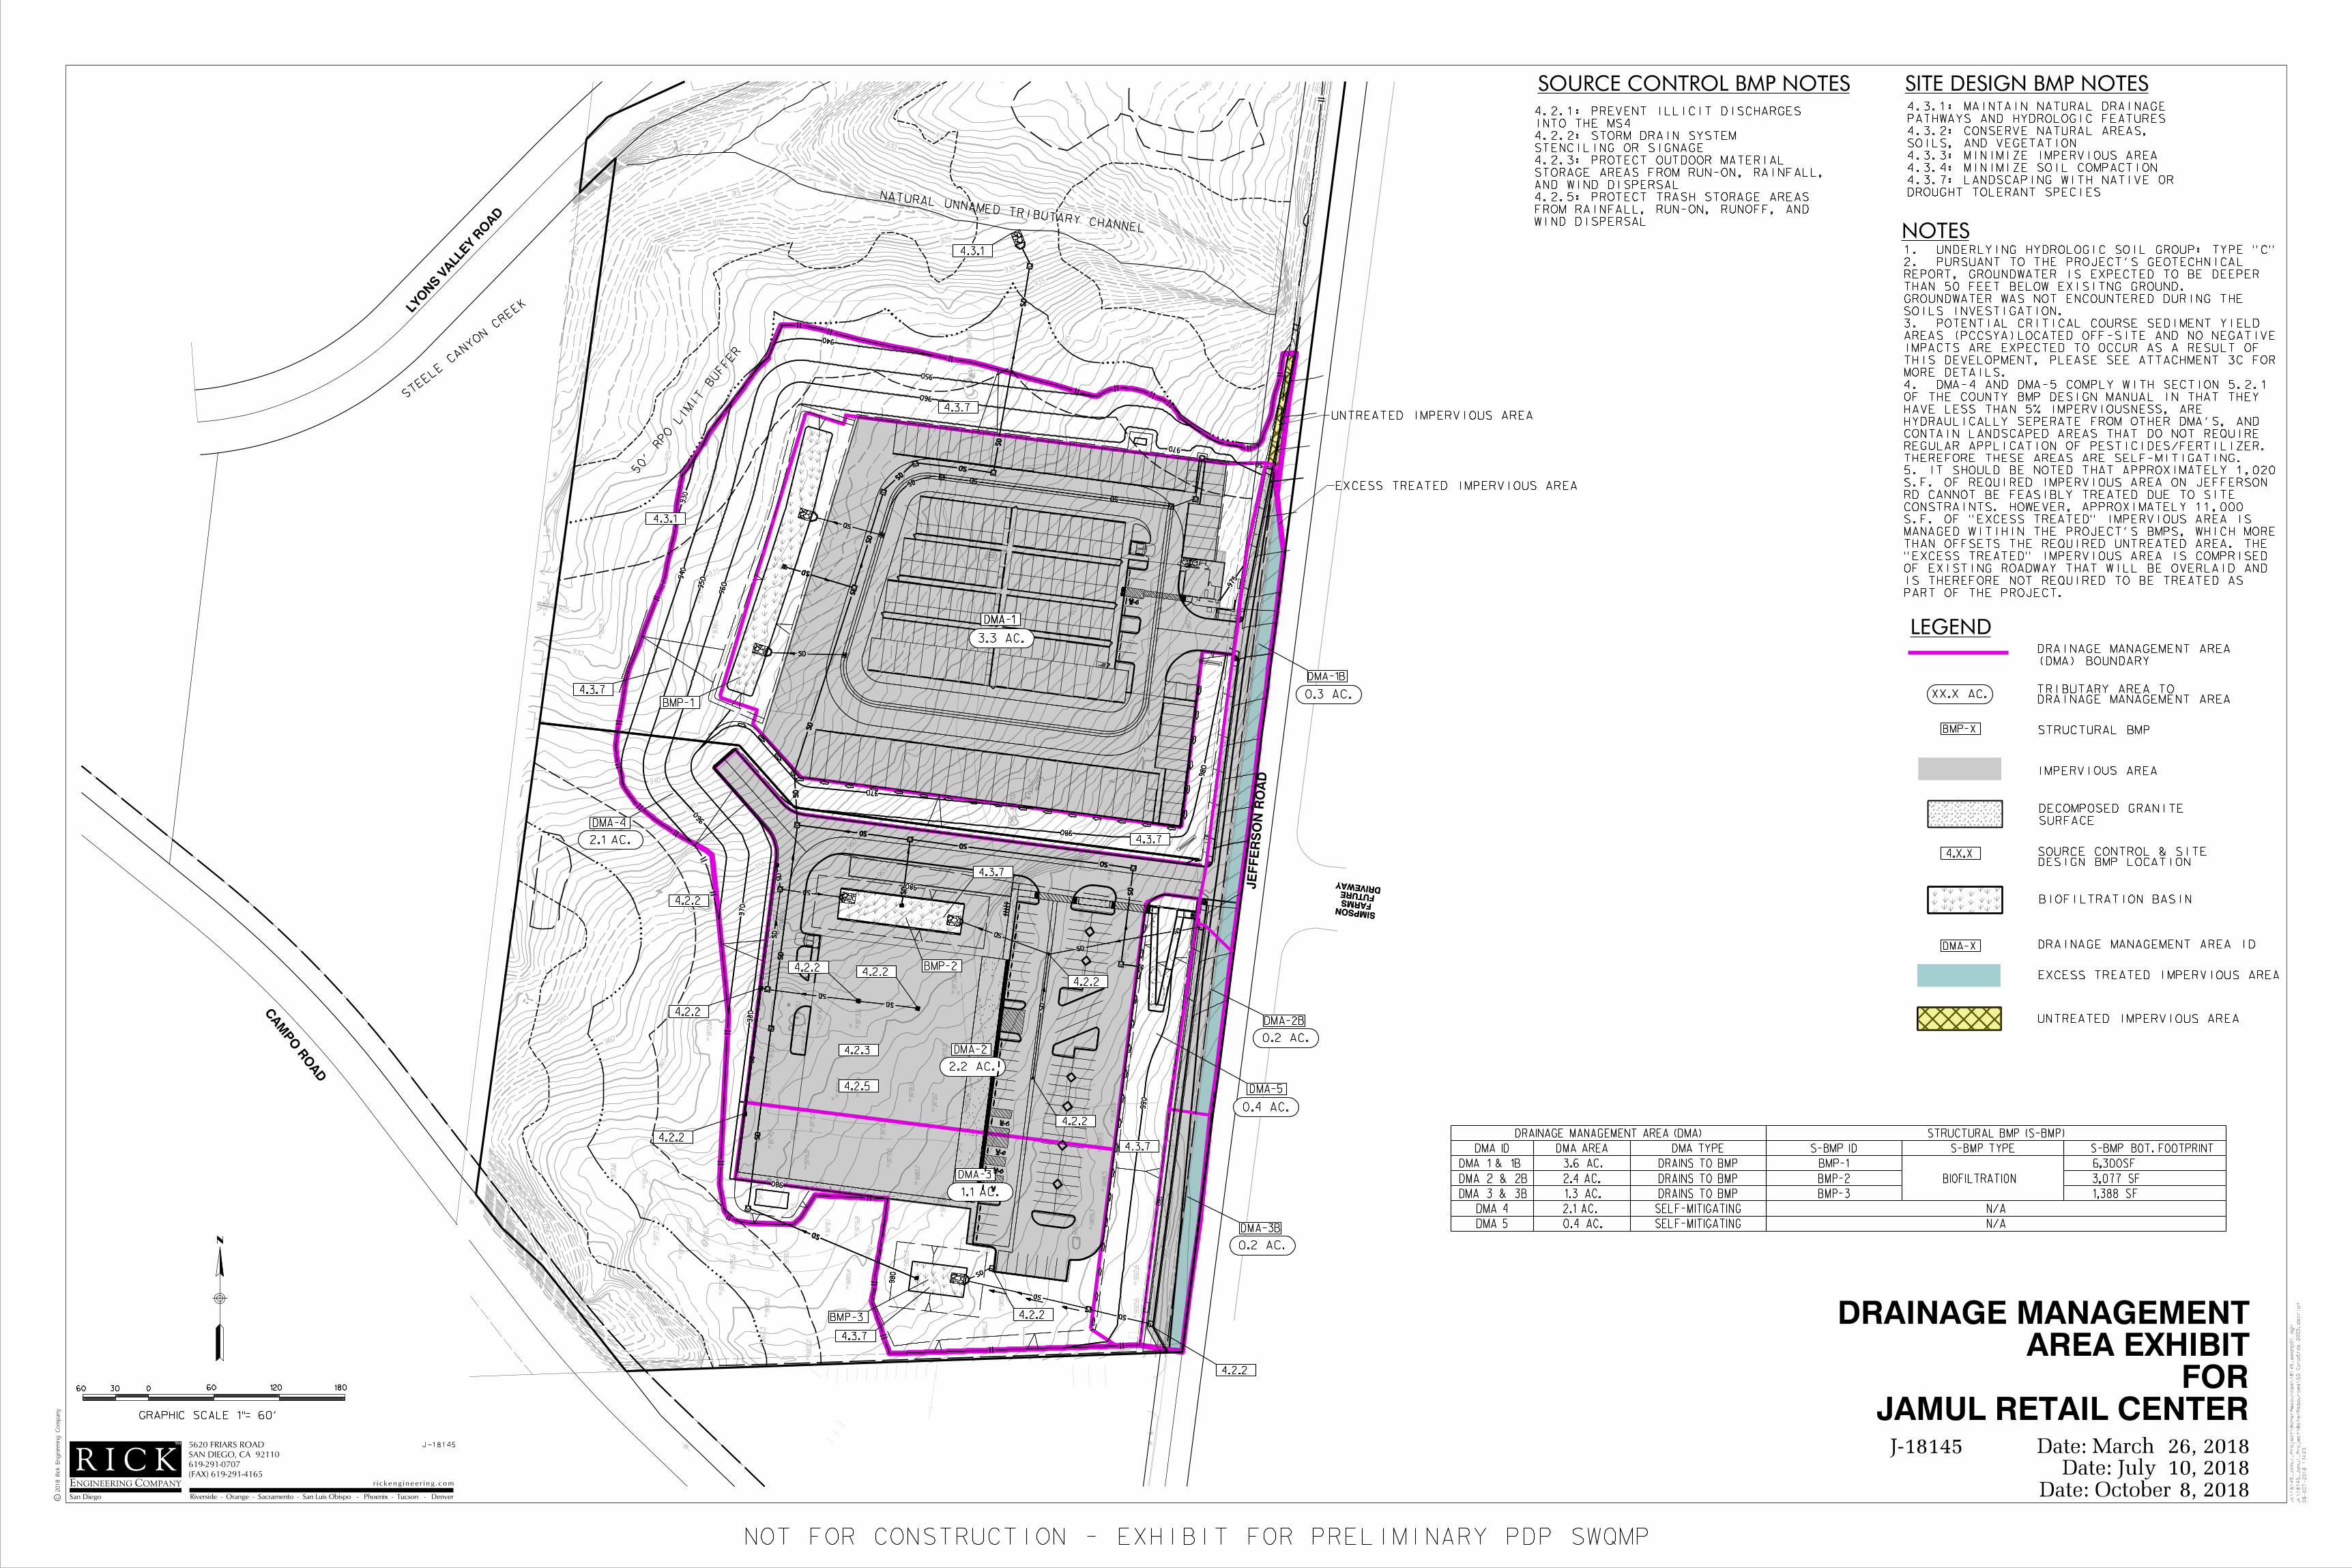
X
X
X
X
X
X
X
X
X
X
X
910
915
915
915
920
920
920
920
925
925
925
925
925
X
926.7
X
928.3
930
930
930
930
935
935
935
935
X
935.2
X
936.1
X
940
940
940
X
940.6
X
944.5
945
945
945
945
950
950
950
950
X
953.8
955
955
955
955
955
955
X
958.7
960
960
960
960
960
X
960.4
X
964.4
965
965
965
965
965
X
966.6
X
967.7
X
969.2
X
969.2
970
970
970
970
X
970.1
X
970.6
X
971.0
X
972.6
X
972.8
X
973.4
X
973.5
X
973.6
X
973.6
X
973.9
X
974.7
X
974.7
X
974.7
975
975
X
975.3
X
975.4
X
975.5
X
975.6
X
975.9
X
976.1
X
976.4
X
976.7
X
976.9
X
977.3
X
977.3 X
977.5
X
977.6
X
977.8
X
978.1
X
978.1
X
978.1
X
978.5
X
978.5
X
978.6
X
978.8
X
979.3
X
979.5
X
979.6
X
979.7
X
979.8
980
980
980
X
980.4
X
980.5
X
980.6
X
980.7
X
981.0
X
981.6
X
981.6
X
982.2
X
982.3
X
982.3
X
982.4
X
982.8
X
983.5
X
984.3
X
984.4
985
985
X
985.4
X 985.8
X
986.1
X
986.3
X
989.3
X
989.5
X
989.5
990
990
X
990.2
X
990.5
X
990.8
X
992.6
X
992.6
X
994.4
995
995
995
UNTREATED IMPERVIOUS AREA
EXCESS TREATED IMPERVIOUS AREA
SITE DESIGN BMP NOTES
DROUGHT TOLERANT SPECIES
4.3.7: LANDSCAPING WITH NATIVE OR
4.3.4: MINIMIZE SOIL COMPACTION
4.3.3: MINIMIZE IMPERVIOUS AREA
SOILS, AND VEGETATION
4.3.2: CONSERVE NATURAL AREAS,
PATHWAYS AND HYDROLOGIC FEATURES
4.3.1: MAINTAIN NATURAL DRAINAGE
LEGEND
08-
OC
T-2018
13:23
J:\18145_Ja
mul_
Project\
Water
Resources\
SD
Corp
Stds 2005.dscript
J:\18145_Ja
mul_
Project\
Water
Resources\18145_s
wq
mp01.dgn
XX.X AC.
0
GRAPHIC SCALE 1"= 60'
60 30 60 120 180
NOTES
(DMA) BOUNDARY
DRAINAGE MANAGEMENT AREA
STRUCTURAL BMP
DRAINAGE MANAGEMENT AREATRIBUTARY AREA TO
IMPERVIOUS AREA
DRAINAGE MANAGEMENT AREA IDDMA-X
BMP-X
DESIGN BMP LOCATIONSOURCE CONTROL & SITE
SOURCE CONTROL BMP NOTES
NOT FOR CONSTRUCTION - EXHIBIT FOR PRELIMINARY PDP SWQMP
J-18145J-18145
SURFACE
DECOMPOSED GRANITE
JAMUL RETAIL CENTERFOR
AREA EXHIBIT DRAINAGE MANAGEMENT
4.X.X
WIND DISPERSAL
FROM RAINFALL, RUN-ON, RUNOFF, AND
4.2.5: PROTECT TRASH STORAGE AREAS
AND WIND DISPERSAL
STORAGE AREAS FROM RUN-ON, RAINFALL,
4.2.3: PROTECT OUTDOOR MATERIAL
STENCILING OR SIGNAGE
4.2.2: STORM DRAIN SYSTEM
INTO THE MS4
4.2.1: PREVENT ILLICIT DISCHARGES
Date: March 26, 2018Date: July 10, 2018
EXCESS TREATED IMPERVIOUS AREA
Date: October 8, 2018
c2018 Rick Engineering Co
mpany
PART OF THE PROJECT.
IS THEREFORE NOT REQUIRED TO BE TREATED AS
OF EXISTING ROADWAY THAT WILL BE OVERLAID AND
"EXCESS TREATED" IMPERVIOUS AREA IS COMPRISED
THAN OFFSETS THE REQUIRED UNTREATED AREA. THE
MANAGED WITIHIN THE PROJECT'S BMPS, WHICH MORE
S.F. OF "EXCESS TREATED" IMPERVIOUS AREA IS
CONSTRAINTS. HOWEVER, APPROXIMATELY 11,000
RD CANNOT BE FEASIBLY TREATED DUE TO SITE
S.F. OF REQUIRED IMPERVIOUS AREA ON JEFFERSON
5. IT SHOULD BE NOTED THAT APPROXIMATELY 1,020
THEREFORE THESE AREAS ARE SELF-MITIGATING.
REGULAR APPLICATION OF PESTICIDES/FERTILIZER.
CONTAIN LANDSCAPED AREAS THAT DO NOT REQUIRE
HYDRAULICALLY SEPERATE FROM OTHER DMA'S, AND
HAVE LESS THAN 5% IMPERVIOUSNESS, ARE
OF THE COUNTY BMP DESIGN MANUAL IN THAT THEY
DMA-4 AND DMA-5 COMPLY WITH SECTION 5.2.1 4.
MORE DETAILS.
THIS DEVELOPMENT, PLEASE SEE ATTACHMENT 3C FOR
IMPACTS ARE EXPECTED TO OCCUR AS A RESULT OF
AREAS (PCCSYA)LOCATED OFF-SITE AND NO NEGATIVE
POTENTIAL CRITICAL COURSE SEDIMENT YIELD 3.
SOILS INVESTIGATION.
GROUNDWATER WAS NOT ENCOUNTERED DURING THE
THAN 50 FEET BELOW EXISITNG GROUND.
REPORT, GROUNDWATER IS EXPECTED TO BE DEEPER
PURSUANT TO THE PROJECT'S GEOTECHNICAL 2.
UNDERLYING HYDROLOGIC SOIL GROUP: TYPE "C"1.
BIOFILTRATION BASIN
2.1 AC.
DMA-1
DMA-2
DMA-3
DMA-5
DMA-4
0.4 AC.
2.2 AC.
1.1 AC.
4.2.2
4.2.2
4.2.2
4.2.2
4.2.2
4.2.2
4.2.2
4.2.24.2.2
4.2.3
4.2.5
4.3.7
4.3.7
4.3.7
4.3.7
DMA-1
3.3 AC.
DMA-1B
0.3 AC.
DMA-3B
0.2 AC.
DMA-2B
0.2 AC.
980
930
960
HC
HC
HC
HC
X
HC
SD
D-1
16~5'
B IN
LE
T
D9-A
4
D9-A
4
D9-A
4
D9-A
4
D9-A
4
D9-A
4
D9-A
4
SD
D-1
16~5'
B IN
LE
T
SD
D-1
16~5'
B IN
LE
T
SD
D-1
16~5'
B IN
LE
T
D9-A
4
D9-A
4
D9-A
4
D9-A
4
D9-A
4
D9-A
4
D9-A
4
D9-A
4
D9-A
4
D9-A
4
D9-A
4
DRIVEWAY
FUTURE
FARMS
SIMPSON
HC
HC
HC
HC
X
HC
HC
HC
HC
HC
HC
ROOM
SPRINKLER
980
930
960
DRIVEWAY
FUTURE
FARMS
SIMPSON
980
960
HC
HC
HC
HC
X
HC
SD
D-1
16~5'
B IN
LE
T
D9-A
4
D9-A
4
D9-A
4
D9-A
4
D9-A
4
D9-A
4
D9-A
4
SD
D-1
16~5'
B IN
LE
T
SD
D-1
16~5'
B IN
LE
T
SD
D-1
16~5'
B IN
LE
T
D9-A
4
D9-A
4
D9-A
4
D9-A
4
D9-A
4
D9-A
4
D9-A
4
D9-A
4
D9-A
4
D9-A
4
D9-A
4
4.3.1
4.3.1
BMP-3
BMP-2
940
940
940
940
940
940
950
950
950
950
950
950
960
960
960
960
960
960
970
970
970
975
970
970
970
975
970
970
970
975
980
980
980
980
980
980
980
980
980
980
980
980
980 980 980
990
990
990
JEFFE
RS
ON R
OA
D
LYO
NS V
ALLEY R
OAD
CA
MPO R
OA
D
4.3.7
STEELE C
AN
YO
N CREE
K
NATURAL UNNAMED TRIBUTARY CHANNEL
BMP-1
4.3.7
UNTREATED IMPERVIOUS AREA
(DMA) AREA MANAGEMENTDRAINAGE (S-BMP) BMPSTRUCTURAL
IDDMA AREADMA TYPEDMA IDS-BMP TYPES-BMP S-BMP BOT. FOOTPRINT
3.6 AC. BMP TODRAINS BMP-1
BIOFILTRATION
6,300SF
DMA 2 & 2B AC.2.4 BMP TODRAINS BMP-2 3,077 SF
1.3 AC. BMP TODRAINS BMP-3 1,388 SF
4DMA 2.1 AC. SELF-MITIGATING N/A
5DMA 0.4 AC. SELF-MITIGATING N/A
DMA 1 & 1B
DMA 3 & 3B
50'
RP
O LI
MIT
BUFFE
R

PRIORITY DEVELOPMENT PROJECT (PDP) SWQMP 28 of 42
Template Date: August 28, 2017 Preparation Date: February 16, 2018] LUEG:SW PDP SWQMP - Attachments
ATTACHMENT 2
BACKUP FOR PDP HYDROMODIFICATION CONTROL MEASURES
This is the cover sheet for Attachment 2. ☐ Mark this box if this attachment is empty because the project is exempt from PDP
hydromodification management requirements.
Indicate which Items are Included behind this cover sheet: Attachment Sequence Contents Checklist Attachment 2a Flow Control Facility Design, including
Structural BMP Drawdown Calculations and Overflow Design Summary (Required) See Chapter 6 and Appendix G of the BMP Design Manual
☒ Included ☐ Submitted as separate stand-
alone document
Attachment 2b Hydromodification Management Exhibit (Required)
☒ Included See Hydromodification Management Exhibit Checklist on the back of this Attachment cover sheet.
Attachment 2c Management of Critical Coarse Sediment Yield Areas See Section 6.2 and Appendix H of the BMP Design Manual.
☒ Exhibit depicting onsite and/or upstream sources of critical coarse sediment as mapped by Regional or Jurisdictional approaches outlined in Appendix H.1 AND,
☐ Demonstration that the project effectively avoids and bypasses sources of mapped critical coarse sediment per approaches outlined in Appendix H.2 and H.3. OR,
☐ Demonstration that project does not generate a net impact on the receiving water per approaches outlined in Appendix H.4.
Attachment 2d Geomorphic Assessment of Receiving Channels (Optional) See Section 6.3.4 of the BMP Design Manual.
☒ Not performed ☐ Included ☐ Submitted as separate stand-
alone document Attachment 2e Vector Control Plan (Required when
structural BMPs will not drain in 96 hours)
☐ Included ☒ Not required because BMPs will
drain in less than 96 hours

PRIORITY DEVELOPMENT PROJECT (PDP) SWQMP 29 of 42
Template Date: August 28, 2017 Preparation Date: February 16, 2018] LUEG:SW PDP SWQMP - Attachments
Use this checklist to ensure the required information has been included on the Hydromodification Management Exhibit:
The Hydromodification Management Exhibit must identify: ☒ Underlying hydrologic soil group ☒ Approximate depth to groundwater ☒ Existing natural hydrologic features (watercourses, seeps, springs, wetlands) ☒ Critical coarse sediment yield areas to be protected ☒ Existing topography ☒ Existing and proposed site drainage network and connections to drainage offsite ☒ Proposed grading ☒ Proposed impervious features ☒ Proposed design features and surface treatments used to minimize imperviousness ☒ Point(s) of Compliance (POC) for Hydromodification Management ☒ Existing and proposed drainage boundary and drainage area to each POC (when necessary,
create separate exhibits for pre-development and post-project conditions) ☒ Structural BMPs for hydromodification management (identify location, type of BMP, and
size/detail)


SWMM Model Inputs
- POC-1
-Schematic
-Pre-development Input
-Post-project Input
-LID Control Calculations
-Rating Curve
- NRCS Web Soil Survey Hydrologic Soil Group Report
- Rain Gage Exhibit

Jamul Retail Center
J-18145
7/10/18
SWMM Model Schematics – POC 1
Pre-development Model Post-project Model

18145_JRC_PRE.inp[TITLE];;Project Title/NotesJAMUL RETAIL CENTERPOC-1 PRE-DEVELOPMENT CONDITIONJ-18145
[OPTIONS] ;;Option Value FLOW_UNITS CFS INFILTRATION GREEN_AMPT FLOW_ROUTING KINWAVE LINK_OFFSETS DEPTH MIN_SLOPE 0 ALLOW_PONDING NO SKIP_STEADY_STATE NO
START_DATE 10/03/1970 START_TIME 05:00:00 REPORT_START_DATE 10/03/1970 REPORT_START_TIME 05:00:00 END_DATE 05/25/2008 END_TIME 22:00:00 SWEEP_START 01/01 SWEEP_END 12/31 DRY_DAYS 0 REPORT_STEP 01:00:00 WET_STEP 00:15:00 DRY_STEP 04:00:00 ROUTING_STEP 0:01:00
INERTIAL_DAMPING PARTIAL NORMAL_FLOW_LIMITED BOTH FORCE_MAIN_EQUATION H-W VARIABLE_STEP 0.75 LENGTHENING_STEP 0 MIN_SURFAREA 12.557 MAX_TRIALS 8 HEAD_TOLERANCE 0.005 SYS_FLOW_TOL 5 LAT_FLOW_TOL 5 MINIMUM_STEP 0.5 THREADS 1
[EVAPORATION] ;;Data Source Parameters ;;-------------- ---------------- MONTHLY .07 .1 .13 .17 .19 .22 .24 .22 .19 .13 .09
.06 DRY_ONLY NO
[RAINGAGES] ;;Name Format Interval SCF Source ;;-------------- --------- ------ ------ ---------- Bonita VOLUME 1:00 1.0 TIMESERIES TS-Bonita
[SUBCATCHMENTS] ;;Name Rain Gage Outlet Area %Imperv
Width %Slope CurbLen SnowPack ;;-------------- ---------------- ---------------- -------- --------
-------- -------- -------- ---------------- Pre1 Bonita POC1 7.6 0 632
9.54 0 Pre2 Bonita POC1 2.3 0 290
5.1 0
[SUBAREAS] ;;Subcatchment N-Imperv N-Perv S-Imperv S-Perv PctZero
RouteTo PctRouted ;;-------------- ---------- ---------- ---------- ---------- ----------
---------- ---------- Pre1 0.012 .1 0.05 0.1 25
OUTLET Pre2 0.012 0.1 0.05 0.1 25
OUTLET
[INFILTRATION] ;;Subcatchment Suction Ksat IMD ;;-------------- ---------- ---------- ---------- Pre1 6 .1 .32 Pre2 6 .1 .32
Page 1

18145_JRC_PRE.inp[OUTFALLS]
;;Name Elevation Type Stage Data Gated Route To
;;-------------- ---------- ---------- ---------------- ------------------------
POC1 0 FREE NO
[TIMESERIES] ;;Name Date Time Value ;;-------------- ---------- ---------- ---------- TS-Bonita FILE "bonita.dat"
[REPORT];;Reporting Options
INPUT NO CONTROLS NO
SUBCATCHMENTS ALL NODES ALL LINKS ALL
[TAGS]
[MAP] DIMENSIONS 0.000 0.000 10000.000 10000.000 Units None
[COORDINATES] ;;Node X-Coord Y-Coord ;;-------------- ------------------ ------------------ POC1 4190.523 3613.031
[VERTICES] ;;Link X-Coord Y-Coord ;;-------------- ------------------ ------------------
[Polygons] ;;Subcatchment X-Coord Y-Coord ;;-------------- ------------------ ------------------ Pre1 3232.971 5646.594 Pre2 4970.385 5656.466
[SYMBOLS] ;;Gage X-Coord Y-Coord ;;-------------- ------------------ ------------------ Bonita 4200.395 6080.948
Page 2

18145_JRC_POST.inp[TITLE];;Project Title/NotesJAMUL RETAIL CENTERPOC-1 POST-DEVELOPMENT CONDITIONJ-18145
[OPTIONS] ;;Option Value FLOW_UNITS CFS INFILTRATION GREEN_AMPT FLOW_ROUTING KINWAVE LINK_OFFSETS DEPTH MIN_SLOPE 0 ALLOW_PONDING NO SKIP_STEADY_STATE NO
START_DATE 10/03/1970 START_TIME 05:00:00 REPORT_START_DATE 10/03/1970 REPORT_START_TIME 05:00:00 END_DATE 05/25/2008 END_TIME 22:00:00 SWEEP_START 01/01 SWEEP_END 12/31 DRY_DAYS 0 REPORT_STEP 01:00:00 WET_STEP 00:15:00 DRY_STEP 04:00:00 ROUTING_STEP 0:01:00
INERTIAL_DAMPING PARTIAL NORMAL_FLOW_LIMITED BOTH FORCE_MAIN_EQUATION H-W VARIABLE_STEP 0.75 LENGTHENING_STEP 0 MIN_SURFAREA 12.557 MAX_TRIALS 8 HEAD_TOLERANCE 0.005 SYS_FLOW_TOL 5 LAT_FLOW_TOL 5 MINIMUM_STEP 0.5 THREADS 1
[EVAPORATION] ;;Data Source Parameters ;;-------------- ---------------- MONTHLY .07 .1 .13 .17 .19 .22 .24 .22 .19 .13 .09
.06 DRY_ONLY NO
[RAINGAGES] ;;Name Format Interval SCF Source ;;-------------- --------- ------ ------ ---------- Bonita VOLUME 1:00 1.0 TIMESERIES TS-Bonita
[SUBCATCHMENTS] ;;Name Rain Gage Outlet Area %Imperv
Width %Slope CurbLen SnowPack ;;-------------- ---------------- ---------------- -------- --------
-------- -------- -------- ---------------- DMA4 Bonita POC-1 2.1 0 330
45 0 DMA5 Bonita poc-1 0.4 0 48
.5 0 DMA1-1 Bonita LID1 3.3 92 140
1.0 0 DMA1-2 Bonita LID1 .3 85 41
5.4 0 DMA2-1 Bonita LID2 2.1 90 230
1 0 DMA2-2 Bonita LID2 0.2 85 40
3.2 0 DMA3-1 Bonita LID3 1.1 60 130
1 0 DMA3-2 Bonita LID3 .2 85 40
2.7 0 LID1 Bonita DIV1 .144628 0 25
.001 0 LID2 Bonita DIV2 .07064 0 27
0.001 0 LID3 Bonita DIV3 0.03156 0
Page 1

18145_JRC_POST.inp 27.5 0.001 0
[SUBAREAS] ;;Subcatchment N-Imperv N-Perv S-Imperv S-Perv PctZero
RouteTo PctRouted ;;-------------- ---------- ---------- ---------- ---------- ----------
---------- ---------- DMA4 0.012 .12 0.05 0.1 25
OUTLET DMA5 0.012 0.12 0.05 0.1 25
OUTLET DMA1-1 0.012 0.12 0.05 0.1 25
OUTLET DMA1-2 0.012 0.12 0.05 0.1 25
OUTLET DMA2-1 0.012 0.12 0.05 0.1 25
OUTLET DMA2-2 0.012 0.12 0.05 0.1 25
OUTLET DMA3-1 0.012 0.12 0.05 0.1 25
OUTLET DMA3-2 0.012 0.12 0.05 0.1 25
OUTLET LID1 0.012 0.12 0.05 0.1 25
OUTLET LID2 0.012 0.12 0.05 0.1 25
OUTLET LID3 0.012 0.12 0.05 0.1 25
OUTLET
[INFILTRATION] ;;Subcatchment Suction Ksat IMD ;;-------------- ---------- ---------- ---------- DMA4 6 .075 .32 DMA5 6 .075 .32 DMA1-1 6 .075 .32 DMA1-2 6 .075 .32 DMA2-1 6 .075 .32 DMA2-2 6 .075 .32 DMA3-1 6 .075 .32 DMA3-2 6 .075 .32 LID1 1.5 5 .32 LID2 1.5 5 .32 LID3 1.5 5 .32
[LID_CONTROLS] ;;Name Type/Layer Parameters ;;-------------- ---------- ---------- LID1 BC LID1 SURFACE 13.2 0.0 0 0 5
LID1 SOIL 27 0.4 0.2 0.1 5
5 1.5 LID1 STORAGE 24 .67 0 0 LID1 DRAIN .024 0.5 0 6
LID2 BC LID2 SURFACE 12 0.0 0 0 5
LID2 SOIL 27 0.4 0.2 0.1 5
5 1.5 LID2 STORAGE 24 0.67 0 0 LID2 DRAIN .0507 0.5 0 6
LID3 BC LID3 SURFACE 14.1 0.0 0 0 5
LID3 SOIL 27 0.4 0.2 0.1 5
5 1.5 LID3 STORAGE 24 0.67 0 0 LID3 DRAIN .059 0.5 0 6
[LID_USAGE] ;;Subcatchment LID Process Number Area Width InitSat
FromImp ToPerv RptFile DrainTo ;;-------------- ---------------- ------- ---------- ---------- ----------
---------- ---------- ------------------------ ---------------- LID1 LID1 1 6300.00 25 0 100
0 LID2 LID2 1 3077.08 27 0 100
0 Page 2

18145_JRC_POST.inp LID3 LID3 1 1374.75 27.5 0 100
0
[OUTFALLS] ;;Name Elevation Type Stage Data Gated Route To
;;-------------- ---------- ---------- ---------------- --------
---------------- POC-1 0 FREE NO
[DIVIDERS] ;;Name Elevation Diverted Link Type Parameters ;;-------------- ---------- ---------------- ---------- ---------- DIV1 0 BP1 CUTOFF .0284 3
0 0 0 DIV2 0 BP2 CUTOFF .0284 3
0 0 0 DIV3 0 BP3 CUTOFF .015 3
0 0 0
[STORAGE] ;;Name Elev. MaxDepth InitDepth Shape Curve Name/Params
N/A Fevap Psi Ksat IMD ;;-------------- -------- ---------- ----------- ----------
---------------------------- -------- -------- -------- -------- STOR3 0 3 0 TABULAR STOR3
0 1 STOR2 0 3 0 TABULAR STOR2
0 1 STOR1 0 3 0 TABULAR STOR1
0 1
[CONDUITS] ;;Name From Node To Node Length Roughness
InOffset OutOffset InitFlow MaxFlow ;;-------------- ---------------- ---------------- ---------- ----------
---------- ---------- ---------- ---------- UD1 DIV1 POC-1 1 0.01 0
0 0 0 BP1 DIV1 STOR1 1 0.01 0
0 0 0 BP2 DIV2 STOR2 1 0.01 0
0 0 0 BP3 DIV3 STOR3 1 0.01 0
0 0 0 UD2 DIV2 POC-1 1 0.01 0
0 0 0 UD3 DIV3 POC-1 1 0.01 0
0 0 0
[OUTLETS] ;;Name From Node To Node Offset Type QTable/Qcoeff Qexpon Gated ;;-------------- ---------------- ---------------- ---------- --------------- ---------------- ---------- -------- MF1 STOR1 POC-1 0 TABULAR/DEPTH RatingCurve1 NO MF2 STOR2 POC-1 0 TABULAR/DEPTH RatingCurve2 NO MF3 STOR3 POC-1 0 TABULAR/DEPTH RatingCurve3 NO
[XSECTIONS] ;;Link Shape Geom1 Geom2 Geom3 Geom4
Barrels Culvert ;;-------------- ------------ ---------------- ---------- ---------- ----------
---------- ---------- UD1 DUMMY 0 0 0 0
1 BP1 DUMMY 0 0 0 0
1 BP2 DUMMY 0 0 0 0
1 BP3 DUMMY 0 0 0 0
1 UD2 DUMMY 0 0 0 0
1 UD3 DUMMY 0 0 0 0
1
Page 3

18145_JRC_POST.inp[CURVES]
;;Name Type X-Value Y-Value ;;-------------- ---------- ---------- ----------
;HEAD TOTAL Q RatingCurve1 Rating 0.00 0.000 RatingCurve1 0.50 0.009 RatingCurve1 0.75 0.011 RatingCurve1 1.00 0.012 RatingCurve1 1.50 0.015 RatingCurve1 2.00 0.058 RatingCurve1 2.10 0.942 RatingCurve1 2.50 9.878 RatingCurve1 3.00 23.493
; RatingCurve2 Rating 0.00 0.000 RatingCurve2 0.50 0.018 RatingCurve2 0.75 0.022 RatingCurve2 1.00 0.026 RatingCurve2 1.50 0.032 RatingCurve2 2.00 0.037 RatingCurve2 2.10 0.918 RatingCurve2 2.50 9.841 RatingCurve2 3.00 23.445
; RatingCurve3 Rating 0.00 0.000 RatingCurve3 0.50 0.006 RatingCurve3 0.75 0.007 RatingCurve3 1.00 0.008 RatingCurve3 1.50 0.015 RatingCurve3 2.00 0.898 RatingCurve3 2.1 9.819 RatingCurve3 3.0 23.424
; STOR1 Storage 0.00 7790 STOR1 0.50 8516 STOR1 0.75 8884 STOR1 1.00 9256 STOR1 1.50 10010 STOR1 2.00 10778 STOR1 2.10 10934 STOR1 2.50 11561 STOR1 3.00 12358
; STOR2 Storage 0.00 3077 STOR2 0.50 3436 STOR2 0.75 3620 STOR2 1.00 3808 STOR2 1.50 4192 STOR2 2.00 4588 STOR2 2.50 4997 STOR2 3.00 5418
; STOR3 Storage 0 1890 STOR3 .5 2028 STOR3 .75 2170 STOR3 1 2316 STOR3 1.5 2622 STOR3 2 2950 STOR3 3 3648
[TIMESERIES] ;;Name Date Time Value ;;-------------- ---------- ---------- ---------- TS-Bonita FILE "bonita.dat"
[REPORT];;Reporting Options
INPUT NO CONTROLS NO
SUBCATCHMENTS ALL NODES ALL LINKS ALL
[TAGS]
[MAP] DIMENSIONS 0.000 0.000 10000.000 10000.000 Units None
[COORDINATES] ;;Node X-Coord Y-Coord
Page 4

18145_JRC_POST.inp ;;-------------- ------------------ ------------------ POC-1 3746.298 1915.104 DIV1 2537.917 3670.374 DIV2 4138.595 3917.228 DIV3 5851.781 3715.111 STOR3 4709.130 3464.337 STOR2 3137.632 3849.856 STOR1 1850.938 2931.885
[VERTICES] ;;Link X-Coord Y-Coord ;;-------------- ------------------ ------------------
[Polygons] ;;Subcatchment X-Coord Y-Coord ;;-------------- ------------------ ------------------ DMA4 7035.611 2762.271 DMA5 6717.998 3522.618 DMA1-1 1516.684 4964.611 DMA1-2 2355.915 5601.618 DMA2-1 3489.635 5686.081 DMA2-2 4560.162 5591.507 DMA3-1 5409.505 5601.618 DMA3-2 6814.965 5419.616 LID1 2406.160 4735.322 LID2 3984.601 4966.314 LID3 5967.276 5024.062
[SYMBOLS] ;;Gage X-Coord Y-Coord ;;-------------- ------------------ ------------------ Bonita 4121.422 6485.686
Page 5

Jamul Retail Center
18145
3/26/2018
[POC 1]
SWMM - LID Control Calculations
PARAMETER ABBREV.
WQ Ponding Depth PD 12 in 12 in 12 in
Bioretention Soil Layer S 27 in 27 in 27 in
Gravel Layer G 24 in 24 in 24 in
5.3 ft 5.3 ft 5.3 ft
63 in 63 in 63 in
Orifice Coefficient cg 0.6 -- 0.6 -- 0.6 --
Low Flow Orifice Diameter D 0.6875 in 0.6875 in 0.5 in
Drain exponent n 0.5 -- 0.5 -- 0.5 --
Surface Area @ WQ Ponding Depth APD 7,800 ft2 3,077 ft
2 1,890 ft2
Surface Area @ Basin Bottom Abot 6,500 ft2 3,077 ft
2 1,400 ft2
Modelled LID Surface Area @... 6,500 ft2 3,077 ft
2 1,400 ft2
Surface Area @ Basin Bottom 0.14922 ac 0.07064 ac 0.03214 ac
Effective Ponding Depth PDeff 13.20 in 12.00 in 14.10 in
Flow Coefficient C 0.0240 -- 0.0507 -- 0.0590 --
Bioretention Soil Media
Design Percolation Rate5 in/hr 5 in/hr 5 in/hr
Max. Flow Rate thru BSM QBSM,max. 0.75231 cfs 0.35613 cfs 0.16204 cfs
Max. Flow Rate thru Low Flow Orifice QLF,max. 0.02836 cfs 0.02836 cfs 0.01501 cfs
Storage Unit: Cutoff Flow Qcutoff 0.0284 cfs 0.0284 cfs 0.0150 cfs
TOTAL
ALID
BMP 3
("Bio-Retention Cell")
Q thru low flow orifice
governs
Q thru low flow orifice
governs
BMP 2
("Bio-Retention Cell")
Q thru low flow orifice
governs
BMP 1
("Bio-Retention Cell")
J:\18145_Jamul_Project\WaterResources\Hydromodification\SWMM\18145_SWMM_PostProcessing_POC1_final.xlsm

Jamul Retail Center J-18145
Rating Curve for POC-1 Prepared by: HC
Last Updated: 3/26/18
Orifice Equation Calculation BMP-1 FULL RATING CURVEQorifice = Co * A * (2 * g * (H-h))
0.5
Orifice Coefficient, Co 0.6
g (ft/s2) 32.2
Increment (ft) 0.10
CIRCULAR OPENINGS
1 x 0.6875"
dia. 4 x 0.75" dia. Type I x " dia.
# of openings 1 4 Type I
Orifice Size (inches) 0.6875 0.75
Flowline of Orifice (ft) 0 1.5 2
Flowline1 (ft) Q (cfs) Qmidflow (cfs) Q Type I(cfs) TOTAL
Flowline
aboveWQ
Ponding (ft)
Horizontal from
3:1 Side Slopes Area (sq ft)
Surface
Volume
(cu-ft)
Surface
Volume (ac-
ft)
0.00 No Value - 0.000 - - - -
0.50 0.009 - 0.009 - - - -
0.75 0.011 - 0.011 0.00 0.00 7790 0 0.0000
1.00 0.012 - 0.012 0.50 1.50 8516 4077 0.0936
1.50 0.015 No Value 0.015 0.75 2.25 8884 6252 0.1435
2.00 0.017 0.040 0 0.058 1.00 3.00 9256 8519 0.1956
2.10 0.018 0.045 0.880 0.942 1.50 4.50 10010 13336 0.3061
2.50 0.020 0.058 9.800 9.878 2.00 6.00 10778 18533 0.4254
3.00 0.021 0.072 23.400 23.493 2.10 6.30 10934 19618 0.4504
2.50 7.50 11561 24117 0.5537
3.00 9.00 12358 30097 0.6909
J:\18145_Jamul_Project\WaterResources\Hydromodification\SWMM\18145_FullRatingCurve_POC1.xlsx

Jamul Retail Center J-18145
Rating Curve for POC-1 Prepared by: HC
Last Updated: 3/26/18
Orifice Equation Calculation BMP-2 FULL RATING CURVEQorifice = Co * A * (2 * g * (H-h))
0.5
Orifice Coefficient, Co 0.6
g (ft/s2) 32.2
Increment (ft) 0.10
CIRCULAR OPENINGS 1 x 1" dia. None None
# of openings 1 0 0
Orifice Size (inches) 1 0 0
Flowline of Orifice (ft) 0 0 Type I
Flowline1 (ft) Q (cfs) Qmidflow (cfs) Q Type I(cfs) TOTAL
Flowline
above WQ
Ponding (ft)
Horizontal from
3:1 Side Slopes Area (sq ft)
Surface
Volume
(cu-ft)
Surface
Volume (ac-
ft)
0.00 No Value 0.000 0.000 - - - -
0.50 0.018 0.000 0.018 - - - -
0.75 0.022 0.000 0.022 0.00 0.00 3077 0 0.0000
1.00 0.026 0.000 0.026 0.50 1.50 3436 1628 0.0374
1.50 0.032 0.000 0.032 0.75 2.25 3620 2510 0.0576
2.00 0.037 0.000 0.000 0.037 1.00 3.00 3808 3439 0.0789
2.10 0.038 0.000 0.880 0.918 1.50 4.50 4192 5439 0.1249
2.50 0.041 0.000 9.8 9.841 2.00 6.00 4588 7634 0.1752
3.00 0.045 0.000 23.400 23.445 2.50 7.50 4997 10030 0.2303
3.00 9.00 5418 12634 0.2900
J:\18145_Jamul_Project\WaterResources\Hydromodification\SWMM\18145_FullRatingCurve_POC1.xlsx

Jamul Retail Center J-18145
Rating Curve for POC-1 Prepared by: HC
Last Updated: 3/26/18
Orifice Equation Calculation BMP-3 FULL RATING CURVEQorifice = Co * A * (2 * g * (H-h))
0.5
Orifice Coefficient, Co 0.6
g (ft/s2) 32.2
Increment (ft) 1.00
CIRCULAR OPENINGS
1 x 0.5625"
dia. 1 x 0.5" dia. None
# of openings 1 1 0
Orifice Size (inches) 0.5625 0.5 0
Flowline of Orifice (ft) 0 1 0
Flowline1 (ft) Q (cfs) Qmidflow (cfs) Q Type I(cfs) TOTAL
Flowline
above Basin
Bottom (ft)
Horizontal from
3:1 Side Slopes Area (sq ft)
Surface
Volume
(cu-ft)
Surface
Volume (ac-
ft)
0.00 No Value - 0.000 0.000 - - - -
0.50 0.006 - 0.000 0.006 - - - -
0.75 0.007 - 0.000 0.007 0.00 3.00 1890 0 0.0000
1.00 0.008 No Value 0.000 0.008 0.50 3.00 2028 980 0.0225
1.50 0.010 0.005 0.000 0.015 0.75 3.00 2170 1504 0.0345
2.00 0.012 0.006 0.880 0.898 1.00 3.00 2316 2065 0.0474
2.10 0.012 0.007 9.800 9.819 1.50 3.00 2622 3300 0.0757
3.00 0.014 0.009 23.400 23.424 2.00 3.00 2950 4693 0.1077
J:\18145_Jamul_Project\WaterResources\Hydromodification\SWMM\18145_FullRatingCurve_POC1.xlsx

Hydrologic Soil Group—San Diego County Area, California(Jamul Retail Center)
Natural ResourcesConservation Service
Web Soil SurveyNational Cooperative Soil Survey
2/5/2018Page 1 of 4
3619
960
3620
020
3620
080
3620
140
3620
200
3620
260
3620
320
3620
380
3620
440
3619
960
3620
020
3620
080
3620
140
3620
200
3620
260
3620
320
3620
380
3620
440
511390 511450 511510 511570 511630 511690 511750
511390 511450 511510 511570 511630 511690 511750
32° 43' 18'' N11
6° 5
2' 4
2'' W
32° 43' 18'' N
116°
52'
28'
' W
32° 43' 2'' N
116°
52'
42'
' W
32° 43' 2'' N
116°
52'
28'
' W
N
Map projection: Web Mercator Corner coordinates: WGS84 Edge tics: UTM Zone 11N WGS840 100 200 400 600
Feet0 35 70 140 210
MetersMap Scale: 1:2,450 if printed on A portrait (8.5" x 11") sheet.
Soil Map may not be valid at this scale.

MAP LEGEND MAP INFORMATION
Area of Interest (AOI)Area of Interest (AOI)
SoilsSoil Rating Polygons
A
A/D
B
B/D
C
C/D
D
Not rated or not available
Soil Rating LinesA
A/D
B
B/D
C
C/D
D
Not rated or not available
Soil Rating PointsA
A/D
B
B/D
C
C/D
D
Not rated or not available
Water FeaturesStreams and Canals
TransportationRails
Interstate Highways
US Routes
Major Roads
Local Roads
BackgroundAerial Photography
The soil surveys that comprise your AOI were mapped at 1:24,000.
Warning: Soil Map may not be valid at this scale.
Enlargement of maps beyond the scale of mapping can cause misunderstanding of the detail of mapping and accuracy of soil line placement. The maps do not show the small areas of contrasting soils that could have been shown at a more detailed scale.
Please rely on the bar scale on each map sheet for map measurements.
Source of Map: Natural Resources Conservation ServiceWeb Soil Survey URL: Coordinate System: Web Mercator (EPSG:3857)
Maps from the Web Soil Survey are based on the Web Mercator projection, which preserves direction and shape but distorts distance and area. A projection that preserves area, such as the Albers equal-area conic projection, should be used if more accurate calculations of distance or area are required.
This product is generated from the USDA-NRCS certified data as of the version date(s) listed below.
Soil Survey Area: San Diego County Area, CaliforniaSurvey Area Data: Version 12, Sep 13, 2017
Soil map units are labeled (as space allows) for map scales 1:50,000 or larger.
Date(s) aerial images were photographed: Dec 31, 2009—Mar 11, 2017
The orthophoto or other base map on which the soil lines were compiled and digitized probably differs from the background imagery displayed on these maps. As a result, some minor shifting of map unit boundaries may be evident.
Hydrologic Soil Group—San Diego County Area, California(Jamul Retail Center)
Natural ResourcesConservation Service
Web Soil SurveyNational Cooperative Soil Survey
2/5/2018Page 2 of 4

Hydrologic Soil Group
Map unit symbol Map unit name Rating Acres in AOI Percent of AOI
CmrG Cieneba very rocky coarse sandy loam, 30 to 75 percent slopes
D 4.4 16.8%
FaC2 Fallbrook sandy loam, 5 to 9 percent slopes, eroded
C 3.4 13.1%
FaE2 Fallbrook sandy loam, 15 to 30 percent slopes, eroded
C 0.3 1.0%
PeD2 Placentia sandy loam, 9 to 15 percent slopes, eroded
D 0.9 3.3%
PfC Placentia sandy loam, thick surface, 2 to 9 percent slo pes
D 0.0 0.1%
RaC2 Ramona sandy loam, 5 to 9 percent slopes, eroded
C 12.2 46.9%
RaD2 Ramona sandy loam, 9 to 15 percent slopes, eroded
C 4.9 18.7%
Totals for Area of Interest 26.0 100.0%
Hydrologic Soil Group—San Diego County Area, California Jamul Retail Center
Natural ResourcesConservation Service
Web Soil SurveyNational Cooperative Soil Survey
2/5/2018Page 3 of 4

Description
Hydrologic soil groups are based on estimates of runoff potential. Soils are assigned to one of four groups according to the rate of water infiltration when the soils are not protected by vegetation, are thoroughly wet, and receive precipitation from long-duration storms.
The soils in the United States are assigned to four groups (A, B, C, and D) and three dual classes (A/D, B/D, and C/D). The groups are defined as follows:
Group A. Soils having a high infiltration rate (low runoff potential) when thoroughly wet. These consist mainly of deep, well drained to excessively drained sands or gravelly sands. These soils have a high rate of water transmission.
Group B. Soils having a moderate infiltration rate when thoroughly wet. These consist chiefly of moderately deep or deep, moderately well drained or well drained soils that have moderately fine texture to moderately coarse texture. These soils have a moderate rate of water transmission.
Group C. Soils having a slow infiltration rate when thoroughly wet. These consist chiefly of soils having a layer that impedes the downward movement of water or soils of moderately fine texture or fine texture. These soils have a slow rate of water transmission.
Group D. Soils having a very slow infiltration rate (high runoff potential) when thoroughly wet. These consist chiefly of clays that have a high shrink-swell potential, soils that have a high water table, soils that have a claypan or clay layer at or near the surface, and soils that are shallow over nearly impervious material. These soils have a very slow rate of water transmission.
If a soil is assigned to a dual hydrologic group (A/D, B/D, or C/D), the first letter is for drained areas and the second is for undrained areas. Only the soils that in their natural condition are in group D are assigned to dual classes.
Rating Options
Aggregation Method: Dominant Condition
Component Percent Cutoff: None Specified
Tie-break Rule: Higher
Hydrologic Soil Group—San Diego County Area, California Jamul Retail Center
Natural ResourcesConservation Service
Web Soil SurveyNational Cooperative Soil Survey
2/5/2018Page 4 of 4


SWMM Model Outputs
- POC-1
-Pre-development Output Report
-Post-development Output Report
-Flow Frequency Curve
-Flow Frequency Table
-Flow Duration Curve
-Flow Duration Table

18145_JRC_PRET.rpt
EPA STORM WATER MANAGEMENT MODEL - VERSION 5.1 (Build 5.1.010) --------------------------------------------------------------
JAMUL RETAIL CENTER POC-1 PRE-DEVELOPMENT CONDITION J-18145 ********************************************************* NOTE: The summary statistics displayed in this report are based on results found at every computational time step, not just on results from each reporting time step. ********************************************************* **************** Analysis Options **************** Flow Units ............... CFS Process Models: Rainfall/Runoff ........ YES RDII ................... NO Snowmelt ............... NO Groundwater ............ NO Flow Routing ........... NO Water Quality .......... NO Infiltration Method ...... GREEN_AMPT Starting Date ............ OCT-03-1970 05:00:00 Ending Date .............. MAY-25-2008 22:00:00 Antecedent Dry Days ...... 0.0 Report Time Step ......... 01:00:00 Wet Time Step ............ 00:15:00 Dry Time Step ............ 04:00:00 ************************** Volume Depth Runoff Quantity Continuity acre-feet inches ************************** --------- ------- Total Precipitation ...... 279.733 339.070 Evaporation Loss ......... 2.781 3.371 Infiltration Loss ........ 267.848 324.665 Surface Runoff ........... 10.528 12.762 Final Storage ............ 0.000 0.000 Continuity Error (%) ..... -0.509 ************************** Volume Volume Flow Routing Continuity acre-feet 10^6 gal ************************** --------- --------- Dry Weather Inflow ....... 0.000 0.000 Wet Weather Inflow ....... 10.528 3.431 Groundwater Inflow ....... 0.000 0.000 RDII Inflow .............. 0.000 0.000 External Inflow .......... 0.000 0.000 External Outflow ......... 10.528 3.431 Flooding Loss ............ 0.000 0.000 Evaporation Loss ......... 0.000 0.000 Exfiltration Loss ........ 0.000 0.000 Initial Stored Volume .... 0.000 0.000 Final Stored Volume ...... 0.000 0.000 Continuity Error (%) ..... 0.000 *************************** Subcatchment Runoff Summary *************************** -------------------------------------------------------------------------------------------------------- Total Total Total Total Total Total Peak Runoff Precip Runon Evap Infil Runoff Runoff Runoff Coeff Subcatchment in in in in in 10^6 gal CFS -------------------------------------------------------------------------------------------------------- Pre1 339.07 0.00 3.37 324.71 12.71 2.62 7.24 0.037 Pre2 339.07 0.00 3.36 324.52 12.94 0.81 2.21 0.038
Analysis begun on: Wed Jul 11 09:59:56 2018 Analysis ended on: Wed Jul 11 10:00:05 2018 Total elapsed time: 00:00:09
Page 1

18145_JRC_POST.rpt
EPA STORM WATER MANAGEMENT MODEL - VERSION 5.1 (Build 5.1.010) --------------------------------------------------------------
JAMUL RETAIL CENTER POC-1 POST-DEVELOPMENT CONDITION J-18145 WARNING 04: minimum elevation drop used for Conduit UD1 WARNING 04: minimum elevation drop used for Conduit BP1 WARNING 04: minimum elevation drop used for Conduit BP2 WARNING 04: minimum elevation drop used for Conduit BP3 WARNING 04: minimum elevation drop used for Conduit UD2 WARNING 04: minimum elevation drop used for Conduit UD3 ********************************************************* NOTE: The summary statistics displayed in this report are based on results found at every computational time step, not just on results from each reporting time step. ********************************************************* **************** Analysis Options **************** Flow Units ............... CFS Process Models: Rainfall/Runoff ........ YES RDII ................... NO Snowmelt ............... NO Groundwater ............ NO Flow Routing ........... YES Ponding Allowed ........ NO Water Quality .......... NO Infiltration Method ...... GREEN_AMPT Flow Routing Method ...... KINWAVE Starting Date ............ OCT-03-1970 05:00:00 Ending Date .............. MAY-25-2008 22:00:00 Antecedent Dry Days ...... 0.0 Report Time Step ......... 01:00:00 Wet Time Step ............ 00:15:00 Dry Time Step ............ 04:00:00 Routing Time Step ........ 60.00 sec ************************** Volume Depth Runoff Quantity Continuity acre-feet inches ************************** --------- ------- Initial LID Storage ...... 0.056 0.067 Total Precipitation ...... 281.056 339.070 Evaporation Loss ......... 51.973 62.701 Infiltration Loss ........ 93.440 112.728 Surface Runoff ........... 21.214 25.593 LID Drainage ............. 116.329 140.341 Final Storage ............ 0.056 0.067 Continuity Error (%) ..... -0.676 ************************** Volume Volume Flow Routing Continuity acre-feet 10^6 gal ************************** --------- --------- Dry Weather Inflow ....... 0.000 0.000 Wet Weather Inflow ....... 137.544 44.821 Groundwater Inflow ....... 0.000 0.000 RDII Inflow .............. 0.000 0.000 External Inflow .......... 0.000 0.000 External Outflow ......... 136.195 44.381 Flooding Loss ............ 0.000 0.000 Evaporation Loss ......... 1.347 0.439 Exfiltration Loss ........ 0.000 0.000 Initial Stored Volume .... 0.000 0.000 Final Stored Volume ...... 0.000 0.000 Continuity Error (%) ..... 0.001 ******************************** Highest Flow Instability Indexes ******************************** All links are stable. ************************* Routing Time Step Summary
Page 1

18145_JRC_POST.rpt ************************* Minimum Time Step : 60.00 sec Average Time Step : 60.00 sec Maximum Time Step : 60.00 sec Percent in Steady State : 0.00 Average Iterations per Step : 1.00 Percent Not Converging : 0.00 *************************** Subcatchment Runoff Summary *************************** -------------------------------------------------------------------------------------------------------- Total Total Total Total Total Total Peak Runoff Precip Runon Evap Infil Runoff Runoff Runoff Coeff Subcatchment in in in in in 10^6 gal CFS -------------------------------------------------------------------------------------------------------- DMA4 339.07 0.00 3.31 317.67 19.34 1.10 2.15 0.057 DMA5 339.07 0.00 3.60 323.33 12.62 0.14 0.30 0.037 DMA1-1 339.07 0.00 70.79 25.50 244.64 21.92 3.61 0.722 DMA1-2 339.07 0.00 58.73 47.53 237.96 1.94 0.33 0.702 DMA2-1 339.07 0.00 65.13 31.76 245.47 14.00 2.30 0.724 DMA2-2 339.07 0.00 58.50 47.52 238.41 1.29 0.22 0.703 DMA3-1 339.07 0.00 43.54 127.95 170.56 5.09 1.17 0.503 DMA3-2 339.07 0.00 58.67 47.47 238.15 1.29 0.22 0.702 LID1 339.07 6075.61 622.27 0.00 5792.39 22.75 4.06 0.903 LID2 339.07 7972.51 646.17 0.00 7665.42 14.70 2.60 0.922 LID3 339.07 7453.80 643.83 0.00 7149.00 6.13 1.31 0.917
*********************** LID Performance Summary ***********************
-------------------------------------------------------------------------------------------------------------------- Total Evap Infil Surface Drain Initial Final Continuity Inflow Loss Loss Outflow Outflow Storage Storage Error Subcatchment LID Control in in in in in in in % -------------------------------------------------------------------------------------------------------------------- LID1 LID1 6414.68 622.29 0.00 771.20 5021.40 2.70 2.70 -0.00 LID2 LID2 8311.58 646.20 0.00 1050.49 6615.20 2.70 2.70 -0.00 LID3 LID3 7792.87 643.85 0.00 733.88 6415.40 2.70 2.70 -0.00 ****************** Node Depth Summary ****************** --------------------------------------------------------------------------------- Average Maximum Maximum Time of Max Reported Depth Depth HGL Occurrence Max Depth Node Type Feet Feet Feet days hr:min Feet --------------------------------------------------------------------------------- POC-1 OUTFALL 0.00 0.00 0.00 0 00:00 0.00 DIV1 DIVIDER 0.00 0.00 0.00 0 00:00 0.00 DIV2 DIVIDER 0.00 0.00 0.00 0 00:00 0.00 DIV3 DIVIDER 0.00 0.00 0.00 0 00:00 0.00 STOR3 STORAGE 0.01 1.74 1.74 5532 14:24 1.63 STOR2 STORAGE 0.01 2.12 2.12 5532 14:03 2.12 STOR1 STORAGE 0.02 2.07 2.07 8141 05:25 2.06 ******************* Node Inflow Summary ******************* ------------------------------------------------------------------------------------------------- Maximum Maximum Lateral Total Flow Lateral Total Time of Max Inflow Inflow Balance Inflow Inflow Occurrence Volume Volume Error Node Type CFS CFS days hr:min 10^6 gal 10^6 gal Percent
Page 2

18145_JRC_POST.rpt ------------------------------------------------------------------------------------------------- POC-1 OUTFALL 2.45 2.66 5532 14:01 1.24 44.4 0.000 DIV1 DIVIDER 4.06 4.06 4532 12:01 22.7 22.7 0.000 DIV2 DIVIDER 2.60 2.60 4532 12:01 14.7 14.7 0.000 DIV3 DIVIDER 1.31 1.31 4532 12:16 6.13 6.13 0.000 STOR3 STORAGE 0.00 1.29 4532 12:16 0 0.63 0.016 STOR2 STORAGE 0.00 2.57 4532 12:01 0 2.02 0.012 STOR1 STORAGE 0.00 4.03 4532 12:01 0 3.02 0.001 ********************** Node Surcharge Summary ********************** Surcharging occurs when water rises above the top of the highest conduit. --------------------------------------------------------------------- Max. Height Min. Depth Hours Above Crown Below Rim Node Type Surcharged Feet Feet --------------------------------------------------------------------- DIV1 DIVIDER 329993.00 0.000 3.000 DIV2 DIVIDER 329993.00 0.000 3.000 DIV3 DIVIDER 329993.00 0.000 3.000 STOR3 STORAGE 329993.00 1.737 1.263 STOR2 STORAGE 329993.00 2.119 0.881 STOR1 STORAGE 329993.00 2.074 0.926 ********************* Node Flooding Summary ********************* No nodes were flooded. ********************** Storage Volume Summary ********************** -------------------------------------------------------------------------------------------------- Average Avg Evap Exfil Maximum Max Time of Max Maximum Volume Pcnt Pcnt Pcnt Volume Pcnt Occurrence Outflow Storage Unit 1000 ft3 Full Loss Loss 1000 ft3 Full days hr:min CFS -------------------------------------------------------------------------------------------------- STOR3 0.012 0 6 0 3.942 49 5532 14:23 0.43 STOR2 0.025 0 3 0 8.188 65 5532 14:03 1.35 STOR1 0.164 1 11 0 19.340 64 8141 05:24 0.72 *********************** Outfall Loading Summary *********************** ----------------------------------------------------------- Flow Avg Max Total Freq Flow Flow Volume Outfall Node Pcnt CFS CFS 10^6 gal ----------------------------------------------------------- POC-1 18.01 0.03 2.66 44.378 ----------------------------------------------------------- System 18.01 0.03 2.66 44.378 ******************** Link Flow Summary ******************** ----------------------------------------------------------------------------- Maximum Time of Max Maximum Max/ Max/ |Flow| Occurrence |Veloc| Full Full Link Type CFS days hr:min ft/sec Flow Depth ----------------------------------------------------------------------------- UD1 DUMMY 0.03 4532 12:01 BP1 DUMMY 4.03 4532 12:01 BP2 DUMMY 2.57 4532 12:01 BP3 DUMMY 1.29 4532 12:16 UD2 DUMMY 0.03 79 06:29 UD3 DUMMY 0.02 79 11:17 MF1 DUMMY 0.72 8141 05:25 MF2 DUMMY 1.35 5532 14:03 MF3 DUMMY 0.43 5532 14:24
Page 3

18145_JRC_POST.rpt ************************* Conduit Surcharge Summary ************************* No conduits were surcharged.
Analysis begun on: Wed Jul 11 10:01:05 2018 Analysis ended on: Wed Jul 11 10:01:39 2018 Total elapsed time: 00:00:34
Page 4

Jamul Retail Center
18145
03/26/2018
Revised: July 10, 2018
[POC 1]
Peak Flow Frequency Summary- POC 1
Return PeriodPre-development Qpeak
(cfs)
Post-project - Mitigated Q
(cfs)
LF = 0.1*Q2 0.211 0.065
2-year 2.111 0.654
3-year 2.554 0.846
4-year 2.699 1.029
5-year 2.925 1.142
6-year 3.290 1.185
7-year 3.431 1.242
8-year 3.623 1.286
9-year 3.733 1.339
10-year 3.831 1.381
J:\18145_Jamul_Project\WaterResources\Hydromodification\SWMM\18145_SWMM_PostProcessing_POC1_final.xlsm

Q10 (3.831 cfs)
Q5 (2.925 cfs)
Q2 (2.111 cfs)
Qlf (0.211 cfs)
0.000
0.500
1.000
1.500
2.000
2.500
3.000
3.500
4.000
4.500
5.000
0 1 2 3 4 5 6 7 8 9 10
Pe
ak
Flo
w (
cfs)
Return Period in Years
Peak Flow Frequency Curves - POC 1
Pre-development Qpeak
Post-project Mitigated Qpeak

0.000
0.500
1.000
1.500
2.000
2.500
3.000
3.500
4.000
5.0E-07 5.0E-06 5.0E-05 5.0E-04 5.0E-03
Flo
w (
cfs)
% Time Exceeding
Flow Duration Curves - POC 1
Pre-development Qpeak
Post-project Mitigated Qpeak

Jamul Retail Center
18145
7/11/2018
[POC 1]
Low-flow Threshold: 10%
0.1xQ2 (Pre): 0.211 cfs
Q10 (Pre): 3.831 cfs
Ordinate #: 100
Incremental Q (Pre): 0.03620 cfs
Total Hourly Data: 329993 hours The proposed BMP: PASSED
Beginning of
Interval
Pre-develop. Flow
(cfs)
Pre-develop.
Hours
Pre-develop.
% Time Exceeding
Post-project
Hours
Post-project
% Time ExceedingPercentage Pass/Fail
1 0.211 148 4.48E-04 161 4.88E-04 109% Pass^
2 0.247 134 4.06E-04 142 4.30E-04 106% Pass^
3 0.283 128 3.88E-04 119 3.61E-04 93% Pass
4 0.320 120 3.64E-04 109 3.30E-04 91% Pass
5 0.356 113 3.42E-04 97 2.94E-04 86% Pass
6 0.392 105 3.18E-04 87 2.64E-04 83% Pass
7 0.428 103 3.12E-04 72 2.18E-04 70% Pass
8 0.464 99 3.00E-04 67 2.03E-04 68% Pass
9 0.501 95 2.88E-04 64 1.94E-04 67% Pass
10 0.537 92 2.79E-04 56 1.70E-04 61% Pass
11 0.573 87 2.64E-04 51 1.55E-04 59% Pass
12 0.609 84 2.55E-04 42 1.27E-04 50% Pass
13 0.645 80 2.42E-04 40 1.21E-04 50% Pass
14 0.682 80 2.42E-04 37 1.12E-04 46% Pass
15 0.718 78 2.36E-04 33 1.00E-04 42% Pass
16 0.754 76 2.30E-04 29 8.79E-05 38% Pass
17 0.790 75 2.27E-04 27 8.18E-05 36% Pass
18 0.826 70 2.12E-04 23 6.97E-05 33% Pass
19 0.863 63 1.91E-04 19 5.76E-05 30% Pass
20 0.899 60 1.82E-04 18 5.45E-05 30% Pass
21 0.935 58 1.76E-04 17 5.15E-05 29% Pass
22 0.971 57 1.73E-04 16 4.85E-05 28% Pass
23 1.008 57 1.73E-04 15 4.55E-05 26% Pass
24 1.044 55 1.67E-04 14 4.24E-05 25% Pass
25 1.080 49 1.48E-04 13 3.94E-05 27% Pass
26 1.116 46 1.39E-04 12 3.64E-05 26% Pass
27 1.152 43 1.30E-04 10 3.03E-05 23% Pass
28 1.189 42 1.27E-04 7 2.12E-05 17% Pass
29 1.225 42 1.27E-04 6 1.82E-05 14% Pass
30 1.261 41 1.24E-04 6 1.82E-05 15% Pass
31 1.297 40 1.21E-04 5 1.52E-05 13% Pass
32 1.333 40 1.21E-04 5 1.52E-05 13% Pass
33 1.370 40 1.21E-04 5 1.52E-05 13% Pass
34 1.406 38 1.15E-04 4 1.21E-05 11% Pass
35 1.442 37 1.12E-04 3 9.09E-06 8% Pass
36 1.478 37 1.12E-04 3 9.09E-06 8% Pass
37 1.514 37 1.12E-04 3 9.09E-06 8% Pass
38 1.551 34 1.03E-04 2 6.06E-06 6% Pass
39 1.587 32 9.70E-05 2 6.06E-06 6% Pass
40 1.623 31 9.39E-05 2 6.06E-06 6% Pass
41 1.659 30 9.09E-05 2 6.06E-06 7% Pass
42 1.695 28 8.49E-05 2 6.06E-06 7% Pass
43 1.732 28 8.49E-05 2 6.06E-06 7% Pass
44 1.768 26 7.88E-05 2 6.06E-06 8% Pass
45 1.804 26 7.88E-05 2 6.06E-06 8% Pass
46 1.840 25 7.58E-05 2 6.06E-06 8% Pass
47 1.876 24 7.27E-05 2 6.06E-06 8% Pass
48 1.913 24 7.27E-05 2 6.06E-06 8% Pass
49 1.949 23 6.97E-05 2 6.06E-06 9% Pass
50 1.985 23 6.97E-05 2 6.06E-06 9% Pass
51 2.021 23 6.97E-05 2 6.06E-06 9% Pass
52 2.057 22 6.67E-05 2 6.06E-06 9% Pass
53 2.094 21 6.36E-05 2 6.06E-06 10% Pass
54 2.130 21 6.36E-05 2 6.06E-06 10% Pass
55 2.166 19 5.76E-05 2 6.06E-06 11% Pass
56 2.202 19 5.76E-05 2 6.06E-06 11% Pass
57 2.238 18 5.45E-05 2 6.06E-06 11% Pass
58 2.275 18 5.45E-05 2 6.06E-06 11% Pass
59 2.311 17 5.15E-05 2 6.06E-06 12% Pass
60 2.347 16 4.85E-05 2 6.06E-06 13% Pass
61 2.383 16 4.85E-05 2 6.06E-06 13% Pass
62 2.419 16 4.85E-05 2 6.06E-06 13% Pass
63 2.456 16 4.85E-05 2 6.06E-06 13% Pass
J:\18145_Jamul_Project\WaterResources\Hydromodification\SWMM\18145_SWMM_PostProcessing_POC1_final.xlsm

Jamul Retail Center
18145
7/11/2018
[POC 1]
Beginning of
Interval
Pre-develop. Flow
(cfs)
Pre-develop.
Hours
Pre-develop.
% Time Exceeding
Post-project
Hours
Post-project
% Time ExceedingPercentage Pass/Fail
64 2.492 14 4.24E-05 2 6.06E-06 14% Pass
65 2.528 14 4.24E-05 2 6.06E-06 14% Pass
66 2.564 13 3.94E-05 1 3.03E-06 8% Pass
67 2.600 11 3.33E-05 1 3.03E-06 9% Pass
68 2.637 11 3.33E-05 0 0.00E+00 0% Pass
69 2.673 10 3.03E-05 0 0.00E+00 0% Pass
70 2.709 9 2.73E-05 0 0.00E+00 0% Pass
71 2.745 8 2.42E-05 0 0.00E+00 0% Pass
72 2.781 8 2.42E-05 0 0.00E+00 0% Pass
73 2.818 8 2.42E-05 0 0.00E+00 0% Pass
74 2.854 8 2.42E-05 0 0.00E+00 0% Pass
75 2.890 7 2.12E-05 0 0.00E+00 0% Pass
76 2.926 7 2.12E-05 0 0.00E+00 0% Pass
77 2.962 7 2.12E-05 0 0.00E+00 0% Pass
78 2.999 7 2.12E-05 0 0.00E+00 0% Pass
79 3.035 7 2.12E-05 0 0.00E+00 0% Pass
80 3.071 7 2.12E-05 0 0.00E+00 0% Pass
81 3.107 7 2.12E-05 0 0.00E+00 0% Pass
82 3.143 7 2.12E-05 0 0.00E+00 0% Pass
83 3.180 7 2.12E-05 0 0.00E+00 0% Pass
84 3.216 7 2.12E-05 0 0.00E+00 0% Pass
85 3.252 7 2.12E-05 0 0.00E+00 0% Pass
86 3.288 6 1.82E-05 0 0.00E+00 0% Pass
87 3.324 6 1.82E-05 0 0.00E+00 0% Pass
88 3.361 5 1.52E-05 0 0.00E+00 0% Pass
89 3.397 5 1.52E-05 0 0.00E+00 0% Pass
90 3.433 5 1.52E-05 0 0.00E+00 0% Pass
91 3.469 5 1.52E-05 0 0.00E+00 0% Pass
92 3.505 5 1.52E-05 0 0.00E+00 0% Pass
93 3.542 5 1.52E-05 0 0.00E+00 0% Pass
94 3.578 5 1.52E-05 0 0.00E+00 0% Pass
95 3.614 4 1.21E-05 0 0.00E+00 0% Pass
96 3.650 4 1.21E-05 0 0.00E+00 0% Pass
97 3.686 4 1.21E-05 0 0.00E+00 0% Pass
98 3.723 4 1.21E-05 0 0.00E+00 0% Pass
99 3.759 4 1.21E-05 0 0.00E+00 0% Pass
100 3.795 4 1.21E-05 0 0.00E+00 0% Pass
J:\18145_Jamul_Project\WaterResources\Hydromodification\SWMM\18145_SWMM_PostProcessing_POC1_final.xlsm

930
940
950
960
970
970
970
980
980
980
980
990
990
1000
1000
1010
1010
1020
1020
1030
1030
NOTES
INTO THE UNNAMED CHANNEL.
PROJECT SITE WILL HAVE SHEET FLOWED
NORTHWEST WHERE ALL RUNOFF FROM THE
APROXIMATELY 200 LINEAR FEET
POC-1 IS LOCATED OFF-SITE 5.
THE POC-1.
WHILE STILL ULTIMATELY FLOWING TO
REPRESENT A DIFFERENCE IN SLOPES
PRE-DEVELOPMENT CONDITION TO BETTER
TWO DMAS ARE USED IN 4.
SEE ATTACHMENT 3C FOR MORE DETAILS.
RESULT OF THIS DEVELOPMENT, PLEASE
IMPACTS ARE EXPECTED TO OCCUR AS A
OFF-SITE AND NO ASSOCIATED NEGATIVE
SEDIMENT YIELD AREAS (PCCSYA)LOCATED
POTENTIAL CRITICAL COURSE 3.
SOILS INVESTIGATION.
WAS NOT ENCOUNTERED DURING THE
BELOW EXISTING GROUND. GROUNDWATER
EXPECTED TO BE DEEPER THAN 50 FEET
GEOTECHNICAL REPORT, GROUNDWATER IS
PURSUANT TO THE PROJECT'S 2.
GROUP: TYPE "C"
UNDERLYING HYDROLOGIC SOIL 1.
LEGEND
17-J
UL-2018
08:35
J:\18145_Ja
mul_
Project\
Water
Resources\
SD
Corp
Stds 2005.dscript
J:\18145_Ja
mul_
Project\
Water
Resources\18145h
mp_pre01.dgn
c2017 Rick Engineering Co
mpany
XX.X AC.
0
GRAPHIC SCALE 1"= 60'
60 30 60 120 180
(DMA) BOUNDARY
DRAINAGE MANAGEMENT AREA
DRAINAGE MANAGEMENT AREATRIBUTARY AREA TO
DMA-X
NOT FOR CONSTRUCTION - EXHIBIT FOR PRELIMINARY PDP SWQMP
J-18145
J-18145
POINT OF COMPLIANCE (POC)
(PRE-DEVELOPMENT)JAMUL RETAIL CENTER
FOR MANAGEMENT EXHIBIT
HYDROMODIFICATION
(FOR USE IN EPA SWMM)DRAINAGE MANAGEMENT AREA ID
Date: July 10, 2018
2.3 AC.
Pre2
7.6 AC.
Pre1
FLOW ARROWS
POC 1
NATURAL UNNAMED TRIBUTARY CHANNEL
STEELE C
AN
YO
N CREE
K

X
X
930
940
950
960
970
970
970
980
980
980
980
990
990
1000
1000
1010
1020
1030
NOTES
EXISTING NATRUAL CHANNEL.
POINT FOR THE PROJECT INTO THE
SITE. THE POC IS THE DISCHARGE
POINT OF COMPLIANCE FOR THE PROJECT
FOR COMPARISON, POC-1 IS THE 4.
ATTACHMENT 2C FOR MORE DETAILS.
OF THIS DEVELOPMENT. PLEASE SEE
ARE EXPECTED TO OCCUR AS A RESULT
OFF-SITE AND NO NEGATIVE IMPACTS
SEDIMENT YIELD AREAS (PCCSYA)LOCATED
POTENTIAL CRITICAL COURSE 3.
SOILS INVESTIGATION.
WAS NOT ENCOUNTERED DURING THE
BELOW EXISTING GROUND. GROUNDWATER
EXPECTED TO BE DEEPER THAN 50 FEET
GEOTECHNICAL REPORT, GROUNDWATER IS
PURSUANT TO THE PROJECT'S 2.
GROUP: TYPE "C"
UNDERLYING HYDROLOGIC SOIL 1.
LEGEND
16-J
UL-2018
16:35
J:\18145_Ja
mul_
Project\
Water
Resources\
SD
Corp
Stds 2005.dscript
J:\18145_Ja
mul_
Project\
Water
Resources\18145h
mp_post01.dgn
c2017 Rick Engineering Co
mpany
XX.X AC.
0
GRAPHIC SCALE 1"= 60'
60 30 60 120 180
(DMA) BOUNDARY
DRAINAGE MANAGEMENT AREA
STRUCTURAL BMP
DRAINAGE MANAGEMENT AREATRIBUTARY AREA TO
IMPERVIOUS AREA
DMA-X
BMP-X
NOT FOR CONSTRUCTION - EXHIBIT FOR PRELIMINARY PDP SWQMP
J-18145
J-18145
BIOFILTRATION BASIN
LOCATION OF
(POST-PROJECT)JAMUL RETAIL CENTER
FOR MANAGEMENT EXHIBIT
HYDROMODIFICATION
POINT OF COMPLIANCE (POC)
(FOR USE IN EPA SWMM)DRAINAGE MANAGEMENT AREA ID
Date: March 26, 2018Revised: July 10, 2018
3.3 AC.
DMA 1-1
0.1 AC.
0.1 AC.
2.1 AC.
DMA 2-1
0.1 AC.
1.1 AC.
DMA 3-1
0.2 AC.
DMA 3-2
0.4 AC.
0.2 AC.
DMA 2-2
0.3 AC.
DMA 1-2
LID 1
LID 2
DMA 5
LID 3
VA
RIES
2:1
MA
X.
2:1
3:1
3:1
2:1
930
2:1
X
SD
D-1
16~5'
B IN
LE
T
D9-A
4
D9-A
4
D9-A
4
D9-A
4
D9-A
4
D9-A
4
D9-A
4
SD
D-1
16~5'
B IN
LE
T
SD
D-1
16~5'
B IN
LE
T
D9-A
4
D9-A
4
D9-A
4
D9-A
4
D9-A
4
D9-A
4
D9-A
4
D9-A
4
D9-A
4
D9-A
4
D9-A
4
DRIVEWAY
FUTURE
FARMS
SIMPSON
X
ROOM
SPRINKLER
930
940
940
940
940
950
950
950
950
3:1
960
960
960
960
960
960
2.1 AC.
DMA 4
SD
D-1
16~5'
B IN
LE
T
970
970
970
975
970
970
970
975
980
980
980
980
980
980
980
980
980
980
980 980
3:1
2:1
3:1
2:1
2:1
3:1
3:1
0
GR
AP
HIC
SC
AL
E 1"
= 40'
20
40
40
80
2:1
990
990
FLOW PATH
POC 1
BUFFER
50' RPO LIMIT
SUMMARY LID W/ SUBCATCHMENT CONDITION POST-PROJECTSWMM
MODEL IDSUBCATCHMENT CONTROLLID BMP FOOTPRINT
POC-1 LID-1 CELL""BIO-RETENTION 0.14 AC.
POC-1 LID-2 CELL""BIO-RETENTION 0.07 AC.
POC-1 LID-3 CELL""BIO-RETENTION 0.03 AC.
JEFFE
RS
ON R
OA
D
JEFFE
RS
ON R
OA
D
LYO
NS V
ALL
EY R
OAD
CA
MP
O R
OA
D
NATURAL UNNAMED TRIBUTARY CHANNEL
STEELE C
AN
YO
N CREE
K

Service Layer Credits:
Steele Canyon
Jamul Retail CenterPotential Critical Coarse Sediment Yield Areas
JN: 18145
Date of Exhibit: 2/14/2018SanGIS PCCSY: 03/2015FEMA NFHL: 04/2016SanGIS/USGS Aerial Imagery: 11/2014
J:\18
145_
Jam
ul_Pro
ject\G
IS\TSC
Jamu
l_PCC
SY_B
aseM
ap_v
10.m
xd
0 250 500
Scale in Feet
North[
Legend18145hmp_post.dgn PolylineLayer
PROJECT FOOTPRINT
Streams! Drain Structure
Storm DrainPCCSY Areas
No
YesFEMA NFHL Floodplain
100-YR Floodway
100-YR Floodplain
500-YR Floodplain

PRIORITY DEVELOPMENT PROJECT (PDP) SWQMP 30 of 42
Template Date: August 28, 2017 Preparation Date: February 16, 2018] LUEG:SW PDP SWQMP - Attachments
ATTACHMENT 3
Structural BMP Maintenance Information
This is the cover sheet for Attachment 3.
Indicate which Items are Included behind this cover sheet: Attachment Sequence Contents Checklist Attachment 3a Structural BMP Maintenance Plan
(Required)
☒ Included See Structural BMP Maintenance Information Checklist on the back of this Attachment cover sheet.
Attachment 3b Draft Stormwater Maintenance Notification / Agreement (when applicable)
☐ Included ☐ Not Applicable

PRIORITY DEVELOPMENT PROJECT (PDP) SWQMP 31 of 42
Template Date: August 28, 2017 Preparation Date: February 16, 2018] LUEG:SW PDP SWQMP - Attachments
Use this checklist to ensure the required information has been included in the Structural BMP Maintenance Information Attachment:
Attachment 3a must identify:
☒ Specific maintenance indicators and actions for proposed structural BMP(s). This must be based on Section 7.7 of the BMP Design Manual and enhanced to reflect actual proposed components of the structural BMP(s)
☒ How to access the structural BMP(s) to inspect and perform maintenance ☒ Features that are provided to facilitate inspection (e.g., observation ports, cleanouts, silt
posts, or other features that allow the inspector to view necessary components of the structural BMP and compare to maintenance thresholds)
☐ Manufacturer and part number for proprietary parts of structural BMP(s) when applicable ☒ Maintenance thresholds specific to the structural BMP(s), with a location-specific frame
of reference (e.g., level of accumulated materials that triggers removal of the materials, to be identified based on viewing marks on silt posts or measured with a survey rod with respect to a fixed benchmark within the BMP)
☒ Recommended equipment to perform maintenance ☐ When applicable, necessary special training or certification requirements for inspection
and maintenance personnel such as confined space entry or hazardous waste management
Attachment 3b: For all Structural BMPs, Attachment 3b must include a draft maintenance agreement in the County’s standard format depending on the Category (PDP applicant to contact County staff to obtain the current maintenance agreement forms). Refer to Section 7.3 in the BMP Design Manual for a description of the different categories.

JAMUL RETAIL CENTERJ-181452/14/2018
ATTACHMENT 3A
INSPECTIONFREQUENCY2
MAINTENANCEFREQUENCY MAINTENANCE METHOD
LANDSCAPED AREAS
MONTHLY(NOTE: INSPECTOR SHALL CHECK FOR THE FOLLOWING MAINTENANCE INDICATORS: EROSION IN THE FORM OF RILLS OR GULLIES, PONDING WATER, BARE AREAS, ANIMAL BURROWS, HOLES, MOUNDS, AND TRASH)
1. AS DETERMINED BY INSPECTION; AND 2. ON OR BEFORE SEPTEMBER 30TH.
1. FILL AND COMPACT AREAS OF RUTS, RILLS, OR GULLIES;2. RE-SEED AND/OR PLANT SLOPES AND AREAS OF EXPOSED SOILS; AND3. ROUTINE MOWING AND TRIMMING AND TRASH REMOVAL.
AMENDED SOILS
MONTHLY(NOTE: INSPECTOR SHALL CHECK FOR THE FOLLOWING MAINTENANCE INDICATORS: EROSION IN THE FORM OF RILLS OR GULLIES, PONDING WATER, BARE AREAS, ANIMAL BURROWS, HOLES, MOUNDS, AND TRASH)
1. AS DETERMINED BY INSPECTION; AND 2. ON OR BEFORE SEPTEMBER 30TH.
1. REAPPLICATION OF AMENDED SOILS IF SIGNS OF COMPACTION, WATERLOGGING AND UNHEALTHY VEGETATION IS PRESENT2. RE-SEED AND/OR PLANT SLOPES AND AREAS OF EXPOSED SOILS; AND3. ROUTINE MOWING AND TRIMMING AND TRASH REMOVAL.
ENERGY DISSIPATION
MONTHLY(NOTE: INSPECTOR SHALL CHECK FOR THE FOLLOWING MAINTENANCE INDICATORS: EROSION IN THE FORM OF RILLS OR GULLIES, PONDING WATER, BARE AREAS, ANIMAL BURROWS, HOLES, MOUNDS, AND TRASH)
1. AS DETERMINED BY INSPECTION; AND 2. ON OR BEFORE SEPTEMBER 30TH.
1. ROUTINE TRIM VEGETATION AND REMOVE TRASH IN AND AROUND THE ENERGY DISSIPATION AREA. 2. REAPPLY COBBLE TO ENERGY DISSIPATION AREA AS NEEDED.
POST-CONSTRUCTION PERMANENT BMPOPERATION & MAINTENANCE PROCEDURE DETAILS1
O&M RESPONSIBLE PARTY DESIGNEE: PROPERTY OWNER
BMP DESCRIPTION
SITE DESIGN

JAMUL RETAIL CENTERJ-181452/14/2018
ATTACHMENT 3A
INSPECTIONFREQUENCY2
MAINTENANCEFREQUENCY MAINTENANCE METHOD
POST-CONSTRUCTION PERMANENT BMPOPERATION & MAINTENANCE PROCEDURE DETAILS1
O&M RESPONSIBLE PARTY DESIGNEE: PROPERTY OWNER
BMP DESCRIPTION
INTEGRATED PEST MANAGEMENT
MONTHLY(NOTE: INSPECTOR SHALL CHECK FOR INDICATIONS OF THE PRESENCE OF PESTS ON-SITE)
WHEN THE PEST OR PESTS, OBSERVED IN GREATEST ABUNDANCE OR CAUSE THE MOST OBSERVED SYMPTOMS, ARE IDENTIFIED.
CHECK FREQUENTLY FOR PESTS, AND TREAT WITH A PESTICIDE ONLY WHEN A PEST IS PRESENT, ETC.
PREVENTIVE STENCILING AND SIGNAGE
ANNUALLY WHEN FULLY OR PARTIALLY ERASED SIGNS ARE OBSERVED; WHEN DUMPING OF TRASH ARE OBSERVED AT PUBLIC ACCESS POINTS, BUILDING ENTRANCES, PUBLIC PARKS, ETC.
1. REPLACE OR REPAINT THE STENCILS AND SIGNAGE SO THAT THEY ARE LEGIBLE; AND 2. MAKE SURE THAT THEY ARE PLACED AT ALL REQUIRED LOCATIONS (I.E. - ALL INLETS).
EFFECTIVE IRRIGATION SYSTEM
MONTHLY WHEN BROKEN SPRINKLER HEADS, RAIN SHUTOFF DEVICES, AND FLOW REDUCERS ARE OBSERVED; OR RUNNING SPRINKLERS IN RAIN ARE OBSERVED
REPAIR OR REPLACE THE BROKEN AND/OR MALFUNCTIONING PARTS OF IRRIGATION SYSTEM.
1. AS DETERMINED BY INSPECTION;2. STANDING WATER IN TRASH STORAGE AREA.3. LOOSE TRASH OR DEBRIS.4. LEAKED OR SPILLED MATERIALS.5. COMPROMISED FENCE, SCREEN, GATE, WALL, BIN. LID OR ROOF AWNING (WHERE APPLICABLE).6. CRACKED OR OTHERWISE COMPROMISED PAVING OR OTHER FLAWED FLOOR SURFACE (AS APPLICABLE).
1. IF STANDING WATER IS OBSERVED IN THE AREA, DETERMINE THE WATER SOURCE AND REMOVE THE SOURCE. ALLOW STANDING WATER TO EVAPORATE. IF WATER DOES NOT EVAPORATE IN 48 HOURS, REDISTRIBUTE THE WATER TO LANDSCAPED AREA(S). DO NOT DRAIN WATER TO STORM DRAIN SYSTEM.2. REMOVE AND PROPERLY DISPOSE LOOSE TRASH, DEBRIS, AND LEAKED OR SPILLED MATERIALS. USE APPROPRIATE SPILL CLEANUP MATERIAL AS NECESSARY TO REMOVE ALL LEAKED AND SPILLED MATERIALS INCLUDING MATERIALS ADHERED TO PAVEMENT. IDENTIFY AND REMOVE OR REPAIR THE SOURCE OF ANY LEAKED OR SPILLED MATERIALS.3. REPAIR THE FOLLOWING AS APPLICABLE: COMPROMISED FENCE, SCREEN, GATE, WALL, BIN, LID OR ROOF AWNING (WHERE APPLICABLE), CRACKED OR COMPROMISED PAVING OR OTHER FLOOR SURFACE (AS APPLICABLE).
SOURCE CONTROL
TRASH STORAGE AREAS
WEEKLY

JAMUL RETAIL CENTERJ-181452/14/2018
ATTACHMENT 3A
INSPECTIONFREQUENCY2
MAINTENANCEFREQUENCY MAINTENANCE METHOD
POST-CONSTRUCTION PERMANENT BMPOPERATION & MAINTENANCE PROCEDURE DETAILS1
O&M RESPONSIBLE PARTY DESIGNEE: PROPERTY OWNER
BMP DESCRIPTION
STRUCTURAL BMPs
BIOFILTRATION BASINS (BMPS 1, 2, 3)
TWICE A YEAR AND AFTER MAJOR STORM EVENTS(NOTE: INSPECTOR SHALL CHECK FOR THE FOLLOWING MAINTENANCE INIDICATORS: EROSION IN THE FORM OF RILLS OR GULLIES, PONDING WATER, BARE AREAS, ANIMAL BURROWS, HOLES, MOUNDS, AND TRASH)
1. AS DETERMINED BY INSPECTION; AND 2. ON OR BEFORE SEPTEMBER 30TH AND FOLLOWING THE RAINY SEASON AFTER MAY 1ST.
1. REPLACE MULCH IN AREAS OF RUTS, RILLS, OR GULLIES;2. RE-SEED AND/OR PLANT SLOPES AND AREAS OF EXPOSED SOILS; AND3. ROUTINE MAINTENANCE TO REMOVE ACCUMULATED MATERIALS SUCH AS TRASH AND DEBRIS.4. NON-ROUTINE MAINTENANCE WILL BE REQUIRED TO BACKWASH AND CLEAR UNDERDRAINS IF INSPECTION INDICATES UNDERDRAINS ARE CLOGGED.5. DEPENDING ON POLLUTANT LOADS, SOILS MAY NEED TO BE REPLACED EVERY 5 TO 10 YEARS. 6. THE RISER STRUCTURE SHOULD BE MAINTAINED TO AVOID CLOGGING AND ANY LEAKAGE THROUGH BOLTHOLES. 7. TRIM VEGETATION AT THE BEGINNING AND END OF WET SEASON AND INSPECT MONTHLY TO PREVENT ESTABLISHMENT OF WOODY VEGETATION AND FOR AESTHETIC AND VECTOR REASONS
NOTE:
3. BASINS HAVE A MID FLOW ORIFICE DIAMETER: 1.125" & LOW FLOW ORIFICE DIAMETER: 0.625"
1. A SIGNIFICANT RAIN EVENT CONSIDERED WHENEVER THE NATIONAL WEATHER SERVICE REPORTS 0.50" OF RAIN IN 48 HOURS FOR THE LOCAL COMMUNITY2. DURING THE FIRST YEAR OF NORMAL OPERATION, ALL BMPS SHOULD BE INSPECTED ONCE BEFORE AUGUST 31 AND THEN MONTHLY FROM SEPTEMBER THROUGH MAY. THE MINIMUM INSPECTION AND MAINTENANCE FREQUENCY SHOULD BE DETERMINED BASED ON THE RESULTS OF THE FIRST YEAR INSPECTIONS.

PRIORITY DEVELOPMENT PROJECT (PDP) SWQMP 32 of 42
Template Date: August 28, 2017 Preparation Date: February 16, 2018] LUEG:SW PDP SWQMP - Attachments
ATTACHMENT 4
County of San Diego PDP Structural BMP Verification for Permitted Land Development Projects

PRIORITY DEVELOPMENT PROJECT (PDP) SWQMP 33 of 42
Template Date: August 28, 2017 Preparation Date: February 16, 2018] LUEG:SW PDP SWQMP - Attachments
This page was left intentionally blank.

County of San Diego PDP-IVF:
Installation Verification Form for Priority Development Projects (PDPs)
Last updated: February 15, 2018 LUEG:SW PDP SWQMP – Attachments Page 1 of 6
This form must be accepted by the County prior to the release of construction permits or granting of occupancy for applicable portions of a Priority Development Project (PDP). Applicants are responsible for providing all requested information. Do not leave any fields blank; indicate N/A for any requested item that is not applicable.
PART 1 General Project and Applicant Information
Table 1: Project and Applicant Information
A. Project Summary Information
Project Name Jamul Retail Center
Record ID (e.g., grading/improvement plan number, building permit)
TBD
Project Address West Side of Jefferson Road
Assessor's Parcel Number(s) APN(s)) 596-071-60
Project Watershed (complete Hydrologic Unit, Area, and Subarea Name with
Numeric Identifier)
Hydrologic Unit: Sweetwater, 909.2 Subarea: Jamacha, 909.21
B. Owner Information
Name Woodside REV
Address 1410 Main Street, Suite C
Email Address Ramona, California 92065
Phone Number 760-271-9400

County of San Diego PDP-IVF:
Installation Verification Form for Priority Development Projects (PDPs)
Last updated: February 15, 2018 LUEG:SW PDP SWQMP – Attachments Page 2 of 6
Document previously verified BMPs for the PDP in Table 2. Include the Verification Form ID No. from Page 1 if one was issued.
**** DO NOT INCLUDE THIS PAGE UNLESS THIS IS A PARTIAL RECORD PLAN VERIFICATION ****
Table 2: Information on Verifications for Partial Record Plans Only
A: Previous Submittals
Previous Submittals
Submittal Date Installation Verification Form ID No. if applicable (e.g., 2016-001)
1 Enter date. Click here to enter text. 2 Enter date. Click here to enter text. 3 Enter date. Click here to enter text. 4 Enter date. Click here to enter text. 5 Enter date. Click here to enter text.
Add rows as needed
B: DMA and BMP Map
Please attach a map showing (1) all DMAs for the project site, (2) the DMAs and/or lots accepted under previous Verification Forms, and (3) the locations of Structural BMPs and Significant Site Design BMPs previously accepted OR listed in Table 3 of this Verification Form.
SAMPLE DMA MAP

County of San Diego PDP-IVF:
Installation Verification Form for Priority Development Projects (PDPs)
Last updated: February 15, 2018 LUEG:SW PDP SWQMP – Attachments Page 3 of 6
PART 2 DMA and BMP Inventory Information Use this table to document Structural BMPs (S-BMPs) and Significant Site Design BMPs (SSD-BMPs) for the PDP. All DMAs are required to have at least one Structural BMP or Significant Site Design BMP. • In Part A, list all Structural BMPs (including both Pollutant Control and/or Hydromodification as applicable) by DMA. • Complete Part B for all DMAs that contain only Significant Site Design BMPs. SSD-BMPs are Site Design BMPs credited in Worksheet B-1.1 of the
BMP Design Manual for Design Capture Volume (DCV) reductions. Only Tree Wells and Dispersion Areas should be included in this inventory. • For any DMA that contains both S-BMPs and SD-BMPs, document only the S-BMPs; you do not need to include the SD-BMPs. • The information provided for each BMP in the table must match that provided in the Stormwater Quality Management Plan (SWQMP),
construction plans, maintenance agreements, and other relevant project documentation. Table 3: Required Information for Structural BMPs and Significant Site Design BMPs
DMA # BMP Information Maintenance Category
Maintenance Agreement
or Maintenance Notification
Recorded Doc. #
Construction Plan Sheet #
Landscape Plan #
& Sheet #
(For Vegetated BMPs Only)
FOR DPW-WPP USE ONLY
Reviewer concurs that the BMP(s) may be
accepted into inventory (date and
initial)
Quantity Description/Type of Structural BMP BMP ID #(s)
Part A Structural BMPs
DMA-1 1 Biofiltration Basin (BF-1) BMP-1 2 TBD TBD TBD
DMA-2 1 Biofiltration Basin (BF-1) BMP-2 2 TBD TBD TBD
DMA-3 1 Biofiltration Basin (BF-1) BMP-3 2 TBD TBD TBD
Add rows as needed
Part B Significant Site Design BMPs
Choose an item.
Choose an item.
Choose an item.
Add rows as needed

County of San Diego PDP-IVF:
Installation Verification Form for Priority Development Projects (PDPs)
Last updated: February 15, 2018 LUEG:SW PDP SWQMP – Attachments Page 4 of 6
PART 3 Required Attachments for All BMPs Listed in Table 3
For ALL projects, submit the following to the County inspector (check all that are attached):
☐ Photographs: A photograph of each fully constructed S-BMP or SSD-BMP (or group of BMPs). ☐ Maintenance Agreements: Copies of all approved and recorded Storm Water Maintenance Agreements
(SWMAs) or Maintenance Notifications (MNs) for all S-BMPs.
Note: All BMPs proposed for County ownership will remain the responsibility of the owner listed on Page 1 until a signed Letter of Acceptance of Completion is received by the DPW Watershed Protection Program. For Grading and Improvement projects only, ALSO submit:
☐ Landscape Plans: An 11” X 17” copy of the most current applicable Landscape Plan sheets where the BMPs are required to be vegetated, including:
☐ The Certification of Completion (Form 407), AND ☐ The Certificate of Approval from PDS Landscape Architect
Note: For each Landscape Plan, the sheets submitted must show the location of each verified as-built BMP. ☐ Construction Plans: An 11” X 17” copy of the most current applicable approved Construction Plan
sheets:
☐ Grading Plans, AND/OR ☐ Improvement Plans, AND/OR ☐ Precise Grading Plan(s) (only for residential subdivisions with tract homes), AND/OR ☐ Other (Please specify) Click here to enter text.
Note: For each Construction Plan, the sheets submitted must incorporate all of the following:
☐ A BMP Table, AND ☐ A plan/cross-section of each verified as-built BMP, AND ☐ The location of each verified as-built BMP
Required only for Verifications for Partial Record Plans
☐ If this is a partial record plan verification, please include the following:
☐ A list of previously submitted Verification Forms (Table 2, part A) ☐ A map of DMAs and BMPs (Table 2, part B)

County of San Diego PDP-IVF:
Installation Verification Form for Priority Development Projects (PDPs)
Last updated: February 15, 2018 LUEG:SW PDP SWQMP – Attachments Page 5 of 6
PART 4 Engineer of Work Certification
By signing below, I certify that the BMP(s) listed in Table 3 of this Verification Form have been constructed and all are in substantial conformance with the approved plans and applicable regulations. I understand the County reserves the right to inspect the above BMPs to verify compliance with the approved plans and Watershed Protection Ordinance (WPO). Should it be determined that the BMPs were not constructed to plan or code, corrective actions may be necessary before permits can be closed. Please sign and provide your seal below. Professional Engineer's Printed Name: ____Click here to enter text.__________________ Email: _Click here to enter text.________________ Phone Number: _Click here to enter text.________ Professional Engineer's Signed Name: ____________________________________________ Date: _Click here to enter text._________________
[SEAL]

County of San Diego PDP-IVF:
Installation Verification Form for Priority Development Projects (PDPs)
Last updated: February 15, 2018 LUEG:SW PDP SWQMP – Attachments Page 6 of 6
COUNTY - OFFICIAL USE ONLY: For County Inspectors County Department: ____________________ Date verification received from EOW: _____________________________ By signing below, County Inspector concurs that every noted BMP has been installed per plan. Inspector Name: _______________________________________________ Inspector’s Signature: __________________________ _____ Date: ________________ For Building Division Only Inspection Supervisor Name: __________________________________________________ Inspector Supervisor’s Signature: ____________________________ Date: _____________ PDCI & Building, along with the rest of this package, please provide to DPW WPP:
☐ A copy of the final accepted SWQMP and any accepted addendum
For Watershed Protection Program Only Date Received: _________________________________________ WPP Submittal Reviewer: __________________________________________ WPP Reviewer concurs that the BMPs accepted in Part 2 above may be entered into inventory. WPP Reviewer’s Signature: __________________________________ Date: _____________

PRIORITY DEVELOPMENT PROJECT (PDP) SWQMP 39 of 44
Template Date: August 28, 2017 Preparation Date: February 16, 2018] LUEG:SW PDP SWQMP - Attachments
ATTACHMENT 5
Copy of Plan Sheets Showing Permanent Storm Water BMPs, Source Control, and Site Design
This is the cover sheet for Attachment 5.
Use this checklist to ensure the required information has been included on the plans:
The plans must identify: ☒ Structural BMP(s) with ID numbers matching Step 6 Summary of PDP Structural BMPs ☒ The grading and drainage design shown on the plans must be consistent with the delineation
of DMAs shown on the DMA exhibit ☒ Details and specifications for construction of structural BMP(s) ☒ Signage indicating the location and boundary of structural BMP(s) as required by County
staff ☐ How to access the structural BMP(s) to inspect and perform maintenance ☐ Features that are provided to facilitate inspection (e.g., observation ports, cleanouts, silt
posts, or other features that allow the inspector to view necessary components of the structural BMP and compare to maintenance thresholds)
☒ Manufacturer and part number for proprietary parts of structural BMP(s) when applicable ☐ Maintenance thresholds specific to the structural BMP(s), with a location-specific frame of
reference (e.g., level of accumulated materials that triggers removal of the materials, to be identified based on viewing marks on silt posts or measured with a survey rod with respect to a fixed benchmark within the BMP)
☐ Recommended equipment to perform maintenance ☐ When applicable, necessary special training or certification requirements for inspection and
maintenance personnel such as confined space entry or hazardous waste management ☐ Include landscaping plan sheets showing vegetation requirements for vegetated structural
BMP(s) ☒ All BMPs must be fully dimensioned on the plans ☐ When proprietary BMPs are used, site-specific cross section with outflow, inflow, and model
number must be provided. Photocopies of general brochures are not acceptable. ☐ Include all source control and site design measures described in Steps 4 and 5 of the
SWQMP. Can be included as a separate exhibit as necessary.

PRIORITY DEVELOPMENT PROJECT (PDP) SWQMP 40 of 44
Template Date: August 28, 2017 Preparation Date: February 16, 2018] LUEG:SW PDP SWQMP - Attachments
This page was left intentionally blank.

PRELIMINARY NOT FOR CONSTRUCTION
c2017 Rick Engineering Co
mpany
J-18145
Prepared By:Prepared By:
Revision 12:
Revision 11:
Revision 10:
Revision 8:
Revision 9:
Revision 7:
Revision 5:
Revision 6:
Revision 3:
Revision 2:
Revision 1:
Revision 4:
Revision 14:
Revision 13:
Name:
Address:
Phone #:
Original Date:
Rick Engineering Company
San Diego, California 92110
5620 Friars Road
(619) 291-0707
Sheet of
Project Name:
Sheet Title:
Project Name:
Project Address:
COUNTY OF SAN DIEGO
JAMUL RETAIL CENTER
EAST OF LYONS VALLEY ROAD, SOUTH OF
JAMUL, COUNTY OF SAN DIEGO, CALIFORNIA
OLIVE VISTA DR, NORTH OF CAMPO ROAD
WEST SIDE JEFFERSON ROAD
09-
OC
T-2018
14:08
J:\18145_Ja
mul_
Project\
Civil\
SH
EE
TS\18145_
Preli
minary
Grading
Plan\
SD
Corp
Stds 2005.dscript
J:\18145_Ja
mul_
Project\
Civil\
SH
EE
TS\18145_
Preli
minary
Grading
Plan\18145_
Preli
mGrd
Plan_
Sht_02_
Notes_
Details_
Street
Sections.dgn
PRELIMINARY GRADING PLAN 6
04/09/2018
TRACT NO. TPM 21262
TYPICAL BMP CROSS SECTION
NOT TO SCALE
R/W
44'
+-14'ROS 6517
MS 876
APN: 596-180-01
86' FUTURE ULTIMATE
GROUND
EXISTING
BOUNDARY
CL &
WAY
TRAVELED
EXIST.
40' EXIST. ROW
2%
2:1 MAX
CURB & GUTTER
PROP. G-2 PAVING
SCH. 'J'
BERM
EXISTING
IMPROVEMENTS
MATCH EXIST.
42' IOD
15' 15'
CL
30'
NOT TO SCALE
STREET SECTION: TRACTOR SUPPLY DRIVEWAY
PAVING
SCH. 'J'
CURB
PROP. G-1
PARKWAY
12'12'12'6'
2
TRAIL
DG
5'
& EQUIPMENT DISPLAY AREA
PERMANENT TRAILER
2:1 MAX
2:1 MAX
2% 2%
5.5'
PL
WALL
RETAININGCURB
PROP. G-1
LANE
TURN
LANE
TRAVEL
DOWN
BREAK-
42' IOD
BOUNDARY
CL &
44'APN: 596-180-01
GROUND
EXISTING
BERM
EXISTING
R/W40' EXIST. ROW
+-14'
WAY
TRAVELED
EXIST.
NOT TO SCALE
86' FUTURE ULTIMATE
BERM
EXISTING
+-14'
WAY
TRAVELED
EXIST.
EXIST. STREET SECTION B-B: JEFFERSON ROAD
WALL
GRAVITY
PROP. C-9
NOT TO SCALE
STREET SECTION A-A: JEFFERSON ROAD
EXIST. STREET SECTION C-C: OLIVE VISTA DRIVE
CL
50' EXIST. R.O.W.
R/WR/W
12' 16'̀`
WAY
TRAVELED
EXIST.
WAY
TRAVELED
EXIST.
BERM
EXIST.
GROUND
EXISTINGGROUND
EXISTING BERM
EXIST.
TRAIL
DG
4.5'
3" MULCH
SOIL MEDIA
24" BIORETENTION
3" ASTM 33 FINE SAND FILTER
3" ASTM NO. 8 STONE FILTER
LAYER
STONE STORAGE
18" ASTM NO. 57
NO. 2
MID-FLOW
NO. 1
MID-FLOW
CATCH BASINTYPE-I
NOT TO SCALE
24"
12"
6"
WQ POND
BMP BOTTOM
1
VARIES
1
VARIES
50 scale sheet
(ASTM NO. 57)
3" DEAD STORAGE
ORIFICE
W. LOW-FLOW
UNDER DRAIN
5'
2.5' 2.5'
0.5'
PER STANDARD DWG. SDG-157
AND JOINT SPECIFICATIONS
NOTE: ALL OTHER CONRETE
FIELD RECOMMENDATIONS.
PER SOILS ENGINEER'S
STRUCTURAL SECTION
NO SCALE
RIBBON GUTTER
0.5'
DITCH PER D-75TYPE 'D' BROW
SLOPE PER PLAN
SLOPE PER
PLAN
1' MIN. 1' 1'
PER G-016" CURB
HCHC
NOT TO SCALE
18'
MIN.
ST
AL
L
DEP
TH
3'
9' MIN.
18'
MIN.
ST
AL
L
DEP
TH
3'
TYP.
WHEEL STOP
8' MIN. 9' MIN.
ZONE
LOADING
VAN
TYPICAL PARKING STALL(S)
STALL
PARKING
TYPICAL
STALL
PARKING
VAN ACCESSIBLE
TYPICAL ADA
BROW DITCH
MODIFIED TYPE D
NOT TO SCALE
50 scale sheet

PRIORITY DEVELOPMENT PROJECT (PDP) SWQMP 41 of 44
Template Date: August 28, 2017 Preparation Date: February 16, 2018] LUEG:SW PDP SWQMP - Attachments
ATTACHMENT 6
Copy of Project's Drainage Report
This is the cover sheet for Attachment 6. If hardcopy or CD is not attached, the following information should be provided: Title: Drainage Study for Jamul Retail Center Prepared By: Rick Engineering Company (J-18145) Date: 7/10/2018

PRIORITY DEVELOPMENT PROJECT (PDP) SWQMP 42 of 44
Template Date: August 28, 2017 Preparation Date: February 16, 2018] LUEG:SW PDP SWQMP - Attachments
This page was left intentionally blank.

DRAINAGE STUDY FOR
JAMUL RETAIL CENTER
(PRELIMINARY ENGINEERING)
County of San Diego Record ID: PDS2018-MUP-18-008 & PDS2018-TPM-21262
Job Number 18145
March 26, 2018
Revised: July 10, 2018 Revised: October 10, 2018


Prepared by: BH:HC:vs:k/files/Report/18145.005 Rick Engineering Company – Water Resources Division 3-26-16
Revised: 7-10-18 Revised: 10-10-18
TABLE OF CONTENTS
Revision Page, Dated October 10, 2018 .......................................................................................... i Revision Page, Dated July 10, 2018 ............................................................................................... ii 1.0 Introduction ...............................................................................................................................1 2.0 Hydrology .................................................................................................................................4 3.0 Detention ...................................................................................................................................7 4.0 Hydraulics .................................................................................................................................9 5.0 Summary .................................................................................................................................10 Figures: Figure 1: Vicinity Map....................................................................................................................3 Tables: Table 1: Hydrologic Summary Table (Pre-project) ........................................................................5 Table 2: Hydrologic Summary Table (Post-project, Undetained) ..................................................6 Table 3: Hydrologic Summary Table (Post-project, Undetained) ..................................................8 Appendices: Appendix A: Hydrology
Appendix A1: Existing Condition AES Output Appendix A2: Proposed Condition AES Output [Undetained] Appendix A3: Proposed Condition AES Output [Detained] Appendix A4: AES Analysis Back-Up
Appendix B: Preliminary Storm Drain Sizing Calculations Appendix C: Preliminary Detention Analysis Appendix D: FEMA FIRM Map Pockets: Map Pocket 1: Drainage Study Map for Jamul Retail Center [Pre-project] Map Pocket 2: Drainage Study Map for Jamul Retail Center [Post-project]


Prepared by: BH:HC:vs:k/files/Report/18145.005 Rick Engineering Company – Water Resources Division 3-26-16
Revised: 7-10-18 Revised: 10-10-18
i
DRAINAGE STUDY FOR
JAMUL RETAIL CENTER
REVISION PAGE October 10, 2018
Pursuant to the Comments provided by the County of San Diego received September 11, 2018, this letter presents a revision to the report titled, "Drainage Study for Jamul Retail Center (Preliminary Engineering)” dated July 10, 2018, prepared by Rick Engineering Company. The following text identifies the review comments in italics, followed by Rick Engineering Company's response in bold.
5-4: In the narrative of the report please provide a summary table of: pre- and post- development C, Tc, I, A, V100, Q100 without mitigation and Q100 with mitigation for each area (or point) where drainage discharges from the project. Peak runoff rates (cfs), velocities (fps) and identification of all erosive velocities (at all points of discharge) calculations for pre-development and post-development.
The comparisons should be made about the same discharge points for each drainage basin affecting the site and adjacent properties. Based on the analysis, it seems like the project may cause minor diversion of flow; node 160 in existing conditions receives drainage from .8 acres but in proposed conditions this area increases to about 1.7 acres. Provide comparison of flows at both nodes 150 and 160 to show no impacts is caused by the development. 8/28/2018 Update: The project is showing diversion of the flow and an increase of runoff by 15 cfs at POI1. Please provide supporting calculation showing that there is no impacts downstream of the two POI at a ultimate point of discharge.
In the existing condition, there is no contributing area to POI 1 (node 150) from the project site, and there is 9.9 acres of contributing area to POI 2 (node 160). In order to minimize the impacts to the Biological Open Space and to mitigate existing adverse drainage conditions on the adjacent mobile home community, the outfall for the project is located at post-project node 150 (POI 1); therefore, there is a decrease in total area contributing to Node 160 in the post-project condition. Please refer to Tables 1, 2, and 3 for Hydrologic results for the pre-project, post-project (un-detained), and post-project (detained), respectively. Stormwater conveyed into POI 1 from the site is being detained from 47.3 cfs to 15.1 cfs to minimize the potential

Prepared by: BH:HC:vs:k/files/Report/18145.005 Rick Engineering Company – Water Resources Division 3-26-16
Revised: 7-10-18 Revised: 10-10-18
i
for erosion and flooding. The outfall will include a rip-rap that will be designed during final engineering. Tables 1, 2, and 3 have been updated to include additional information as requested and narrative in Section 2.3 has been added to clarify the drainage conditions.
5-6: Revise Table 2 and the conclusion section of the report based on comments provided
above. 8/28/2018 Update: Revise Table 2 and the conclusion section of the report based on comment 5-4 above.
Tables 1, 2, and 3 and the conclusion have been updated based on Comment 5-4. Refer to response to 5-4 for additional information.
5-8: Discuss whether or not the proposed project would substantially alter the existing
drainage pattern of the site or area, including through the alteration of the course of a stream or river, or substantially increase the rate or amount of surface runoff in a manner which would result in flooding on- or off-site? Provide reasons and mitigations proposed. 8/28/2018 Update: Revise based on comment 5-4 above. Clearly discuss how there is no impacts from the increase of runoff at POI 1.
Narrative has been added to Section 2.3 the Detention Section (Section 3), and the Conclusion to better explain the drainage patterns and detention. It should be noted that the total runoff from the site has been decreased in the post-project condition when compared to the existing condition. Refer to the response to Comment 5-4 for additional information.
5-13: New Comment: Clarify how the runoff from the street is routed to the proposed BMP's.
See comment 4-6 above for more clarification.
Runoff from Jefferson Road is conveyed into the proposed inlets on the west half of Jefferson Road via street flow and curb and gutter. Stormwater is then conveyed into the proposed BMPs through the proposed on-site storm drain. Please refer to the TM Plans, specifically Jefferson Rd Cross Sections A-A and B-B for typical roadway cross sections. Additionally, refer to the Post-Project Drainage Exhibit located in Map Pocket 2 for drainage patterns, proposed storm drain, and BMP locations.

Prepared by: BH:HC:vs:k/files/Report/18145.005 Rick Engineering Company – Water Resources Division 3-26-16
Revised: 7-10-18 Revised: 10-10-18
ii
DRAINAGE STUDY FOR
JAMUL RETAIL CENTER
REVISION PAGE
July 10, 2018 Pursuant to the Comments provided by the County of San Diego received June 15, 2018, this letter presents a revision to the report titled, "Drainage Study for Jamul Retail Center (Preliminary Engineering)” dated March 26, 2018, prepared by Rick Engineering Company. The following text identifies the review comments in italics, followed by Rick Engineering Company's response in bold.
1. Provide DECLARATION OF RESPONSIBLE CHARGE – see San Diego County Hydrology Manual, Figure 1-9. Declaration of Responsible Charge has been provided in as requested.
2. The final CEQA Drainage report shall be signed, stamped and dated by the responsible California Registered Civil Engineer. The final CEQA Drainage report has been signed, stamped and dated appropriately.
3. Include the project number on the title sheet. The project number has been added to the title sheet.
4. In the narrative of the report please provide a summary table of: pre- and post- development C, Tc, I, A, V100, Q100 without mitigation and Q100 with mitigation for each area (or point) where drainage discharges from the project. Peak runoff rates (cfs), velocities (fps) and identification of all erosive velocities (at all points of discharge) calculations for pre-development and post-development.
The comparisons should be made about the same discharge points for each drainage basin affecting the site and adjacent properties.
Based on the analysis, it seems like the project may cause minor diversion of flow; node 160 in existing conditions receives drainage from .8 acres but in proposed conditions this area increases to about 1.7 acres.

Prepared by: BH:HC:vs:k/files/Report/18145.005 Rick Engineering Company – Water Resources Division 3-26-16
Revised: 7-10-18 Revised: 10-10-18
ii
Provide comparison of flows at both nodes 150 and 160 to show no impacts is caused by the development. The results and summary tables in Section 2.3 have been updated to show the comparison at each Point of Interest (POI) and where drainage discharges from the project. Rainfall intensity (I) and additional information for each node and sub-area can be found in the AES analysis in Appendix A. Node 160 now referenced as POI 2, receives storm water runoff from 9.9 acres in the pre-project condition and decreases to 1.2 acres in the post-project condition (from landscaped slopes).
5. Existing and Proposed Hydrology Maps: *The limits of overall DMA between existing and proposed conditions should be the same and should include the entire project site. Currently the existing exhibit shows the entire 9.8 acres; while the proposed exhibit is only addressing the areas tributary to node 150.
Clearly show how the runoff in node 160 is impacted from the proposed development. As mentioned in the previous comment, the project is causing a minor diversion of flow. Clearly show how the runoff is impacted at each POC as a result of development.
*Show discharge point with A & Q information for each node and discharge of sub-basins on the existing and proposed drainage exhibits. The hydrologic maps have been updated to show the same major watershed boundary for the project site. Two Points of Interest (POIs) (discharge points from the site) showing peak flow rate, time of concentration, and watershed areas, have been added to clearly show the impacts between the pre- and post- project conditions. Peak flow rates for individual sub-basins can be found in the AES analysis in Appendix A.
6. Revise Table 2 and the conclusion section of the report based on comments provided above. Table 2 has been modified to reflect the latest site plan and calculations. Additionally, refer to responses for comments 4 and 5 for more information regarding changes to maps and calculations.
7. Summary/Conclusion: Please discuss whether or not the proposed project would substantially alter the existing drainage pattern of the site or area, including through the alteration of the course of a stream or river, in a manner which would result in substantial erosion or siltation on- or off-site? Provide reasons and mitigations proposed.
The proposed project is not anticipated to alter the existing drainage pattern in a manner which would result in substantial erosion or siltation on- or off-site. Additional discussion has been added to Section 5.0.

Prepared by: BH:HC:vs:k/files/Report/18145.005 Rick Engineering Company – Water Resources Division 3-26-16
Revised: 7-10-18 Revised: 10-10-18
ii
8. Discuss whether or not the proposed project would substantially alter the existing
drainage pattern of the site or area, including through the alteration of the course of a stream or river, or substantially increase the rate or amount of surface runoff in a manner which would result in flooding on- or off-site? Provide reasons and mitigations proposed. The proposed project is not anticipated to alter the existing drainage pattern in a manner which would result in flooding on- or off-site. Additional discussion has been added to Section 5.0.
9. Discuss whether or not the proposed project would create or contribute runoff water
which would exceed the capacity of existing or planned storm water drainage systems? Provide reasons and mitigations proposed. The proposed project is not expected to create or contribute runoff water which would exceed the capacity of existing or planned storm water drainage systems. Additional discussion has been added to Section 5.0.
10. Discuss whether or not the proposed project would place housing within a 100-year flood hazard area as mapped on a federal Flood Hazard Boundary or Flood Insurance Rate Map or other flood hazard delineation map, including County Floodplain Maps? Provide reasons and mitigations proposed. The proposed project is not anticipated to place housing within a 100-year flood hazard area. The FEMA FIRM provided in Appendix D shows that the project is located in a Zone X, which is an area of minimal flooding. Additional discussion has been added to Section 5.0.
11. Discuss whether or not the proposed project would place structures within a 100-year flood hazard area which would impede or redirect flood flows? The proposed project is not anticipated to place structures within a 100-year flood hazard area. Additional discussion has been added to Section 5.0.
12. Discuss whether or not the proposed project would expose people or structures to a significant risk of loss, injury or death involving flooding as a result of the failure of a levee or dam? No levees or dams are located within the vicinity of the project site. Therefore, the proposed project is not anticipated to expose people or structures to a significant risk of loss, injury or death involving flooding as a result of the failure of a levee or dam. Additional discussion has been added to Section 5.0.

Prepared by: BH:HC:vs:k/files/Report/18145.005 Rick Engineering Company – Water Resources Division 3-26-16
Revised: 7-10-18 Revised: 10-10-18
1
1.0 INTRODUCTION
This drainage report supports preliminary design of the Jamul Retail Center project (herein
referred to as the Project). The project site is located along the western side of Jefferson Road
between Olive Vista Drive and Campo Road, within the County of San Diego. The project is
located approximately 200 feet east of Steele Canyon Creek. The vicinity map is shown in
Figure 1, located at the end of this section.
The project proposes to develop the site into a tractor supply and self-storage center. The project
will also improve and widen the west side of Jefferson Road for the length adjacent to the project
site. The area within the project footprint is approximately 9.9 acres, and the parcel area is
approximately 19.4 acres.
1.1 Existing Drainage Characteristics
The Project in its existing condition is comprised of a moderately steep, undeveloped hillside
with dirt trails and scattered vegetation, as well as the west side of Jefferson Road. Runoff
consists of unconcentrated drainage across the undeveloped hillside that flows through an
existing mobile home community downstream and adjacent to the project site. There is no
existing drainage system that conveys this unconcentrated flow from the project site around the
mobile home community; therefore, much of this storm water runoff is conveyed through the
yards or various localized ditches. Drainage along Jefferson Road is conveyed northerly along an
existing asphalt dike that enters a natural unnamed channel and ultimately confluences with
Steele Canyon Creek.
A large, mostly undeveloped off-site area east of the project drains westerly onto Jefferson Road
as well as under the road through two 24-inch corrugated metal pipe (CMP) culverts into the
natural unnamed tributary channel north of the project site. The portion of this off-site area that
drains onto Jefferson Road is conveyed northerly through a natural eroded channel adjacent to
the road as well as the asphalt dike before entering the unnamed channel, bypassing the project
site.
Refer to the Existing Condition Drainage Study Map located in Map Pocket 1 for more
information.

Prepared by: BH:HC:vs:k/files/Report/18145.005 Rick Engineering Company – Water Resources Division 3-26-16
Revised: 7-10-18 Revised: 10-10-18
2
1.2 Proposed Drainage Characteristics
In the proposed condition the Project will develop the site into two lots; the southern lot
associated with the tractor supply center, and the northern lot associated with the self-storage
center. These two lots contain approximately 5.5 acres of impervious surface along with 0.7
acres associated with the Jefferson Road widening and improvements. The remaining 3.7 acres
of the project site will be various landscape features, including fill slopes and areas reserved for
three biofiltration basins. Each lot will have a localized storm drain system consisting of ribbon
gutters, catch basins, and curb inlets.
The drainage from Jefferson road will be split between the two lots and will enter the storm drain
system through three curb inlets with each curb inlet ultimately leading to a separate biofiltration
basin. Two of the three biofiltration basins will capture runoff from the southern lot as well as
approximately 400 linear feet of the west side of Jefferson road. The third biofiltration basin will
capture runoff from the northern lot and approximately 400 linear feet of Jefferson Road. Runoff
from approximately 0.7 acres of landscaped area within the project site will be conveyed via
brow ditch directly into the storm drain system, bypassing the biofiltration basins.
Storm drains conveying drainage from each lot and adjacent portion of Jefferson Road will
confluence within the northern lot before leading to the single proposed outfall along the natural
unnamed channel located north of the project site. The outfall is located in an area that directs
flows away from the mobile home community. Pursuant to coordination with the project’s
environmental consultant, the current proposed storm drain layout would result in the least
impact to riparian zones and existing trees/vegetation.
Off-site drainage that is conveyed along the east side of Jefferson Road will continue to be
conveyed into the natural unnamed channel prior to the two 24-inch CMP culverts and is not
included in the analyses.
Refer to Section 2.3 and the Proposed Condition Drainage Study Map within Map Pocket 2 for
more information.

Prepared by: BH:HC:vs:k/files/Report/18145.005 Rick Engineering Company – Water Resources Division 3-26-16
Revised: 7-10-18 Revised: 10-10-18
3
Figure 1 Vicinity Map

Prepared by: BH:HC:vs:k/files/Report/18145.005 Rick Engineering Company – Water Resources Division 3-26-16
Revised: 7-10-18 Revised: 10-10-18
4
2.0 HYDROLOGY
2.1 Criteria
The hydrologic conditions were analyzed in accordance with the County of San Diego’s design criteria.
Design Storm: 100-year, 6-hour 100-Year 6-Hour Precip (inches): P = 3.3 inches
June 2003 San Diego County Hydrology Manual Criteria (unit-less)
Soil Type: C (See Appendix A.3)
Intensity-Duration-Frequency (I-D-F) Curves within the June 2003 County of San Diego Hydrology Manual (inches per hour) 2.2 Modified Rational Method
To calculate the flow rates for Basin 100 in pre-project and post-project condition, a Modified Rational Method analysis was performed in accordance with the methodology presented in the June 2003 County of San Diego Hydrology Manual to determine pre- and post-project 100-year peak discharge rates for watersheds less than 1 square-mile. The Advanced Engineering Software (AES) Rational Method computer program was used to perform these calculations. The hydrologic model is developed by creating independent node-link models of each interior drainage basin and linking these sub-models together at confluence points. The program has the capability to perform calculations for 15 hydrologic processes. These processes are assigned code numbers that appear in the results. The code numbers and their significance are as follows: Code 1: Confluence analysis at a node Code 2: Initial subarea analysis Code 3: Pipe flow travel time (computer-estimated pipe sizes) Code 4: Pipe flow travel time (user-specified pipe size) Code 5: Trapezoidal channel travel time Code 6: Street flow analysis through a subarea Code 7: User-specified information at a node Code 8: Addition of the subarea runoff to mainline Code 9: V-Gutter flow thru subarea Code 10: Copy main-stream data onto a memory bank Code 11: Confluence a memory bank with the main-stream memory Code 12: Clear a memory bank Code 13: Clear the main-stream memory Code 14: Copy a memory bank onto the main-stream memory Code 15: Hydrologic data bank storage functions

Prepared by: BH:HC:vs:k/files/Report/18145.005 Rick Engineering Company – Water Resources Division 3-26-16
Revised: 7-10-18 Revised: 10-10-18
5
In order for the program to perform the hydrologic analysis; base information for the study area is required. This information includes the land uses, drainage facility locations, flow patterns, drainage basin boundaries, and topographic elevations. The rainfall data, runoff coefficients, and soils information were obtained from the June 2003, County of San Diego Hydrology Manual. 2.3 Hydrologic Results
In the pre-project condition, the entire project site drains to the west toward the mobile home community and is represented by a single Point of Interest (POI), referred to as POI 2. In the post-project condition, the majority of the stormwater generated from the site will be directed to a single outfall being proposed along the natural unnamed channel located north of the project site at POI 1 (Node 150). As a result, the total area tributary to POI 2 has decreased from 9.9 acres to 1.2 acres. Stormwater that is tributary to POI 2 will continue to sheet flow from the site similar to existing conditions; however, the tributary area and peak flow rate have decreased. The 100-year peak discharge rate at POI 2 (Node 160) has decreased from 19.4 cfs in the pre-project condition to 3.1 cfs in the post-project condition. POI 1 (approximately 550 feet upstream of the existing condition confluence with Steele Canyon Creek (POI 3)) was selected as the project’s outfall through coordination with the project’s biologist in order to minimize the impacts to riparian areas and biological open space and also to mitigate flooding issues that the mobile home community currently experiences. The total area tributary to POI 1 has increased from 0.0 acres in the pre-project condition to 8.7 acres. A summary of the pre- and post-project hydrologic results are provided below in Tables 1, 2, and 3.
Table 1 – Hydrologic Summary Table (Pre-project)
POI1/Drainage Node
Watershed Area (acres)
Runoff Coefficient
Time of Concentration
(min)
100-Year Peak Flow Rate (cfs)
100-Year Peak Flow
Velocity (fps) POI 1/150 0.0 N/A N/A 0.0 0.0 POI 2/160 9.9 0.32 8.8 19.4 Sheet Flow
POI 3 (Total Site) 9.9 0.32 8.8 19.4 Sheet Flow

Prepared by: BH:HC:vs:k/files/Report/18145.005 Rick Engineering Company – Water Resources Division 3-26-16
Revised: 7-10-18 Revised: 10-10-18
6
Table 2 – Hydrologic Summary Table (Post-project, Un-detained)
POI1/Drainage Node
Watershed Area (acres)
Runoff Coefficient
Time of Concentration (min)
Un-detained 100-Year Peak Flow Rate (cfs)
106 (BMP2) 2.4 0.83 5.7 15.9 126 (BMP1) 1.3 0.68 5.9 6.9 146 (BMP3) 3.5 0.89 6.0 24.2 POI 1/150a 8.7 0.74 6.9 47.3 POI 2/160 1.2 0.30 4.6 3.1
POI 3 (Total Site) 9.9 0.69 6.9 49.7 a. POI 1 includes areas from nodes 106, 126, and 146.
It can be observed that there is an increase in the peak discharge rate for the site as a whole at POI 3 due to the increase in imperviousness and decrease in time of concentration. However, detention is being provided within the proposed BMPs to route the un-detained post-project peak flow rate back to pre-project conditions for the site as a whole. The 100-year modified rational method calculations for pre- and post-project conditions are provided in Appendix A1 through A3, while the associated hydrologic drainage exhibits are located in Map Pockets 1 and 2.

Prepared by: BH:HC:vs:k/files/Report/18145.005 Rick Engineering Company – Water Resources Division 3-26-16
Revised: 7-10-18 Revised: 10-10-18
7
3.0 DETENTION
Detention is provided within BMPs-1, 2 & 3 to route the un-detained 100-year peak discharge for Basin 100 back to pre-project conditions for the site as a whole. As mentioned in section 2.3, POI 1 was selected as the project’s outfall through coordination with the project’s biologist in order to minimize the impacts to riparian areas and biological open space and also to mitigate existing adverse drainage conditions that the mobile home community currently experiences. In order to mitigate the potential for flooding downstream of Steele Canyon Creek (POI 3), the peak discharge from the site is being detained within the proposed BMPs. The detention analysis utilizes the AES Modified Rational Method hydrologic analysis for the post-project (un-detained) condition that is tributary to each proposed BMP (Nodes 106, 126, and 146). To determine the pre-project 100-year peak flow rate that each BMP must detain to, the pre-project 100-year peak flow rate was prorated based on a fraction of tributary acreage to each BMP to the total tributary acreage of Basin 100. The sizing of a detention facility requires an inflow hydrograph to obtain the necessary storage volume. The modified rational method only yields a peak discharge and time of concentration, and does not yield a hydrograph. In order to convert the peak discharge and time of concentration into a hydrograph, a modified rational method hydrograph synthesizing procedure was used. The modified rational method hydrograph synthesizing procedure methodology and criteria that were used are based on the Rational Method Hydrograph Procedure and Detention Basin Design, of the San Diego County Hydrology Manual 2003. The 100-year hydrographs and preliminary elevation-storage-outflow rating curves were used in the HEC-1 hydrologic model to perform routing calculations for the detention basin, and to determine the preliminary 100-year detention volumes required for the basin to reduce the post-project peak discharge rate back to the prorated pre-project peak discharge rate. Actual storage and rating curves will be provided during final engineering along with detailed outlet-works designs for each BMP. Table 3 below provides a summary of the detention analysis.

Prepared by: BH:HC:vs:k/files/Report/18145.005 Rick Engineering Company – Water Resources Division 3-26-16
Revised: 7-10-18 Revised: 10-10-18
8
Table 3 – Hydrologic Summary Table (Post-project, Detained)
BMP or POI1 ID/ Drainage
Node
Watershed Area
(acres)
Runoff Coefficient
Lag Time (min)
Time of Concentration4
(min)
Detained 100-Year
Peak Flow Rate (cfs)
100-Year Peak Flow Velocity5
(fps) BMP 1 / 1462 3.5 0.89 4.8 10.8 7.3 3.7 BMP 2 / 1062 2.4 0.83 4.8 10.5 4.7 3.2 BMP 3 / 1262 1.3 0.68 4.8 10.7 2.4 3.2 POI 1 / 1502 8.7 0.74 N/A 12.9 15.1 5.9 POI 2 / 1603 1.2 0.30 N/A 4.6 3.1 N/A
POI 3 (Total Site) 9.9 .69 N/A 12.9 16.7 N/A
(1): POI is the Point of Interest for the project (2): Flow Rate calculated using the Modified Rational Method (3): Refers to fill slope (landscaped) acreage on west perimeter of project that does not convey drainage into the proposed storm drain system tributary to POI 1. (4): Time of Concentration includes lag time for detained conditions (5): Velocities determined using normal depth calculations, see Appendix B Based on the HEC-1 hydraulic model, the required detention volume for BMP-1, 2, & 3 is approximately 0.30, 0.18 & 0.07 acre-feet, respectively for the 100-year storm event. Refer to Appendix C for a schematic of the proposed basins, calculation back-up and results from the HEC-1 detention analyses. It should be noted that the peak discharge rate from the entire site at POI 3with detention (16.7 cfs from Table 3) is less than the pre-project peak discharge rate (19.4 cfs from Table 1).

Prepared by: BH:HC:vs:k/files/Report/18145.005 Rick Engineering Company – Water Resources Division 3-26-16
Revised: 7-10-18 Revised: 10-10-18
9
4.0 HYDRAULICS 4.1 Hydraulic Methodology and Criteria
The 100-year post-project peak flow rates determined using the Modified Rational Method were used to preliminarily size the on-site storm drain system. Additional hydraulic analyses such as open channel sizing for brow ditches, proposed inlet sizing, dry lane calculations, and energy dissipaters will be prepared during final engineering pursuant to the San Diego County Hydrology Manual (June 2003). 4.2 Storm Drain Sizing
Proposed storm drain pipes were designed using normal depth calculations (storm drain sizing spreadsheet or Federal Highway Administration’s Hydraulic Toolbox (v.4.2)). The anticipated 100-year flow rate to each storm drain pipe was estimated with AES Modified Rational Method. The anticipated 100-year flow rate with a 30% bump-up factor was used in calculations to provide recommended storm drain sizes. The 30% bump-up helps account for hydraulic losses within the system. A preliminary (general) storm drain sizing table was created to size proposed storm drain pipes.
The preliminary storm drain sizing table and the estimate velocities at each pipe outlet are provided in Appendix B of this report.

Prepared by: BH:HC:vs:k/files/Report/18145.005 Rick Engineering Company – Water Resources Division 3-26-16
Revised: 7-10-18 Revised: 10-10-18
10
5.0 SUMMARY/CONCLUSION
This Drainage Study presents the hydrologic and hydraulic analyses for the Jamul Retail Center. The pre-project and post-project condition peak discharge rates were determined using the Modified Rational Method based on the hydrologic methodology and criteria described in the San Diego County Hydrology Manual 2003. Preliminary storm drain sizes have been determined based on the 100-year peak flow rates. Preliminary detention sizing is provided for the 100-year, 6-hour storm event so that post-project peak discharge rates are routed back to pre-project conditions using the HEC-1 hydrologic model. Post-project flows will be treated per the County of San Diego’s BMP Design Manual, dated February 2016. For more information on water quality and HMP sizing, please refer to the a separate report titled, “Priority Development Project Storm Water Quality Management Plan (PDP SWQMP) for Jamul Retail Center,” dated October 10, 2018 and prepared by Rick Engineering Company (Job No. 18145). The proposed project will safely direct drainage away from the mobile home community and to the natural, unnamed channel located north of the project site (POI 1), and ultimately confluence with Steele Canyon Creek (POI 3). As a result, the amount of drainage that sheet flows directly to the mobile home community is significantly reduced (at POI 2). Therefore, it is not anticipated that there will be adverse impacts on existing or planned storm water drainage systems as a result of the project. The proposed project is not expected to alter the existing drainage pattern in a manner which would result in flooding on- or off-site. The proposed outfall to the north will be protected with rip rap, and concentrated flows from the storm drain will be dissipated such that velocities leaving the rip rap pad will be non-erosive to the natural channel. The proposed project is not anticipated to alter the existing drainage pattern in a manner which would result in substantial erosion or siltation on- or off-site. Additionally, the proposed project is not anticipated to place housing or structures within a 100-year flood hazard area. The FEMA FIRM provided in Appendix D shows that the project is located in a Zone X, which is an area of minimal flooding. No levees or dams are located within the vicinity of the project site. Therefore, the proposed project is not anticipated to expose people or structures to a significant risk of loss, injury or death involving flooding as a result of the failure of a levee or dam.

APPENDIX A
Hydrology

APPENDIX A1
Existing Condition AES Output
[100-Year]

JR100E1H.RES ____________________________________________________________________________ ****************************************************************************
RATIONAL METHOD HYDROLOGY COMPUTER PROGRAM PACKAGE Reference: SAN DIEGO COUNTY FLOOD CONTROL DISTRICT 2003,1985,1981 HYDROLOGY MANUAL (c) Copyright 1982-2014 Advanced Engineering Software (aes) Ver. 21.0 Release Date: 06/01/2014 License ID 1261
Analysis prepared by:
Rick Engineering Company 1160 Marsh St. Suite 150 San Luis Obispo, CA 93401
************************** DESCRIPTION OF STUDY ************************** * JAMUL RETAIL CENTER, J-18145 * * 100-YR, 6-HR EXISTING CONDITION FOR BASIN 100 * * J:\18145\WATERRESOURCES\HYDROLOGY\RATIONALMETHOD\.. * **************************************************************************
FILE NAME: JR100E1H.RAT TIME/DATE OF STUDY: 10:37 07/06/2018 ---------------------------------------------------------------------------- USER SPECIFIED HYDROLOGY AND HYDRAULIC MODEL INFORMATION: ---------------------------------------------------------------------------- 2003 SAN DIEGO MANUAL CRITERIA
USER SPECIFIED STORM EVENT(YEAR) = 100.00 6-HOUR DURATION PRECIPITATION (INCHES) = 3.300 SPECIFIED MINIMUM PIPE SIZE(INCH) = 18.00 SPECIFIED PERCENT OF GRADIENTS(DECIMAL) TO USE FOR FRICTION SLOPE = 0.95 SAN DIEGO HYDROLOGY MANUAL "C"-VALUES USED FOR RATIONAL METHOD NOTE: USE MODIFIED RATIONAL METHOD PROCEDURES FOR CONFLUENCE ANALYSIS *USER-DEFINED STREET-SECTIONS FOR COUPLED PIPEFLOW AND STREETFLOW MODEL* HALF- CROWN TO STREET-CROSSFALL: CURB GUTTER-GEOMETRIES: MANNING WIDTH CROSSFALL IN- / OUT-/PARK- HEIGHT WIDTH LIP HIKE FACTOR NO. (FT) (FT) SIDE / SIDE/ WAY (FT) (FT) (FT) (FT) (n) === ===== ========= ================= ====== ===== ====== ===== ======= 1 30.0 20.0 0.018/0.018/0.020 0.67 2.00 0.0313 0.167 0.0150
GLOBAL STREET FLOW-DEPTH CONSTRAINTS: 1. Relative Flow-Depth = 0.50 FEET as (Maximum Allowable Street Flow Depth) - (Top-of-Curb) 2. (Depth)*(Velocity) Constraint = 6.0 (FT*FT/S) *SIZE PIPE WITH A FLOW CAPACITY GREATER THAN OR EQUAL TO THE UPSTREAM TRIBUTARY PIPE.*
**************************************************************************** FLOW PROCESS FROM NODE 100.00 TO NODE 102.00 IS CODE = 21 ---------------------------------------------------------------------------- >>>>>RATIONAL METHOD INITIAL SUBAREA ANALYSIS<<<<< ============================================================================ *USER SPECIFIED(SUBAREA): USER-SPECIFIED RUNOFF COEFFICIENT = .4100 S.C.S. CURVE NUMBER (AMC II) = 0 INITIAL SUBAREA FLOW-LENGTH(FEET) = 100.00 UPSTREAM ELEVATION(FEET) = 997.00 DOWNSTREAM ELEVATION(FEET) = 989.00 ELEVATION DIFFERENCE(FEET) = 8.00 SUBAREA OVERLAND TIME OF FLOW(MIN.) = 6.210 100 YEAR RAINFALL INTENSITY(INCH/HOUR) = 7.560
Page 1

JR100E1H.RES SUBAREA RUNOFF(CFS) = 0.93 TOTAL AREA(ACRES) = 0.30 TOTAL RUNOFF(CFS) = 0.93
**************************************************************************** FLOW PROCESS FROM NODE 102.00 TO NODE 160.00 IS CODE = 51 ---------------------------------------------------------------------------- >>>>>COMPUTE TRAPEZOIDAL CHANNEL FLOW<<<<< >>>>>TRAVELTIME THRU SUBAREA (EXISTING ELEMENT)<<<<< ============================================================================ CHANNEL LENGTH THRU SUBAREA(FEET) = 650.00 REPRESENTATIVE CHANNEL SLOPE = 0.1000 CHANNEL BASE(FEET) = 5.00 "Z" FACTOR = 10.000 MANNING'S FACTOR = 0.040 MAXIMUM DEPTH(FEET) = 10.00 100 YEAR RAINFALL INTENSITY(INCH/HOUR) = 6.070 *USER SPECIFIED(SUBAREA): USER-SPECIFIED RUNOFF COEFFICIENT = .3200 S.C.S. CURVE NUMBER (AMC II) = 0 TRAVEL TIME COMPUTED USING ESTIMATED FLOW(CFS) = 10.43 TRAVEL TIME THRU SUBAREA BASED ON VELOCITY(FEET/SEC.) = 4.30 AVERAGE FLOW DEPTH(FEET) = 0.30 TRAVEL TIME(MIN.) = 2.52 Tc(MIN.) = 8.73 SUBAREA AREA(ACRES) = 9.60 SUBAREA RUNOFF(CFS) = 18.65 AREA-AVERAGE RUNOFF COEFFICIENT = 0.323 TOTAL AREA(ACRES) = 9.9 PEAK FLOW RATE(CFS) = 19.39
END OF SUBAREA CHANNEL FLOW HYDRAULICS: DEPTH(FEET) = 0.42 FLOW VELOCITY(FEET/SEC.) = 5.08 LONGEST FLOWPATH FROM NODE 100.00 TO NODE 160.00 = 750.00 FEET. ============================================================================ END OF STUDY SUMMARY: TOTAL AREA(ACRES) = 9.9 TC(MIN.) = 8.73 PEAK FLOW RATE(CFS) = 19.39 ============================================================================ ============================================================================ END OF RATIONAL METHOD ANALYSIS
�
Page 2

APPENDIX A2
Proposed Condition AES Output
[100-Year, Undetained]

JR100P.RES ____________________________________________________________________________ ****************************************************************************
RATIONAL METHOD HYDROLOGY COMPUTER PROGRAM PACKAGE Reference: SAN DIEGO COUNTY FLOOD CONTROL DISTRICT 2003,1985,1981 HYDROLOGY MANUAL (c) Copyright 1982-2014 Advanced Engineering Software (aes) Ver. 21.0 Release Date: 06/01/2014 License ID 1261
Analysis prepared by:
Rick Engineering Company 1160 Marsh St. Suite 150 San Luis Obispo, CA 93401
************************** DESCRIPTION OF STUDY ************************** * JAMUL RETAIL CENTER, J-18145 * * 100-YR, 6-HR POST-PROJECT CONDITION FOR BASIN 100, UNDETAINED * * J:\18145\WATERRESOURCES\HYDROLOGY\RATIONALMETHOD\.. * **************************************************************************
FILE NAME: JR100P.RAT TIME/DATE OF STUDY: 09:10 07/06/2018 ---------------------------------------------------------------------------- USER SPECIFIED HYDROLOGY AND HYDRAULIC MODEL INFORMATION: ---------------------------------------------------------------------------- 2003 SAN DIEGO MANUAL CRITERIA
USER SPECIFIED STORM EVENT(YEAR) = 100.00 6-HOUR DURATION PRECIPITATION (INCHES) = 3.300 SPECIFIED MINIMUM PIPE SIZE(INCH) = 18.00 SPECIFIED PERCENT OF GRADIENTS(DECIMAL) TO USE FOR FRICTION SLOPE = 0.95 SAN DIEGO HYDROLOGY MANUAL "C"-VALUES USED FOR RATIONAL METHOD NOTE: USE MODIFIED RATIONAL METHOD PROCEDURES FOR CONFLUENCE ANALYSIS *USER-DEFINED STREET-SECTIONS FOR COUPLED PIPEFLOW AND STREETFLOW MODEL* HALF- CROWN TO STREET-CROSSFALL: CURB GUTTER-GEOMETRIES: MANNING WIDTH CROSSFALL IN- / OUT-/PARK- HEIGHT WIDTH LIP HIKE FACTOR NO. (FT) (FT) SIDE / SIDE/ WAY (FT) (FT) (FT) (FT) (n) === ===== ========= ================= ====== ===== ====== ===== ======= 1 30.0 20.0 0.018/0.018/0.020 0.67 2.00 0.0313 0.167 0.0150 2 30.0 25.0 0.020/0.020/0.020 0.50 1.50 0.0313 0.125 0.0180
GLOBAL STREET FLOW-DEPTH CONSTRAINTS: 1. Relative Flow-Depth = 0.50 FEET as (Maximum Allowable Street Flow Depth) - (Top-of-Curb) 2. (Depth)*(Velocity) Constraint = 6.0 (FT*FT/S) *SIZE PIPE WITH A FLOW CAPACITY GREATER THAN OR EQUAL TO THE UPSTREAM TRIBUTARY PIPE.*
**************************************************************************** FLOW PROCESS FROM NODE 100.00 TO NODE 102.00 IS CODE = 21 ---------------------------------------------------------------------------- >>>>>RATIONAL METHOD INITIAL SUBAREA ANALYSIS<<<<< ============================================================================ *USER SPECIFIED(SUBAREA): USER-SPECIFIED RUNOFF COEFFICIENT = .8300 S.C.S. CURVE NUMBER (AMC II) = 0 INITIAL SUBAREA FLOW-LENGTH(FEET) = 70.00 UPSTREAM ELEVATION(FEET) = 998.00 DOWNSTREAM ELEVATION(FEET) = 997.20 ELEVATION DIFFERENCE(FEET) = 0.80 SUBAREA OVERLAND TIME OF FLOW(MIN.) = 3.889
Page 1

JR100P.RES 100 YEAR RAINFALL INTENSITY(INCH/HOUR) = 8.695 NOTE: RAINFALL INTENSITY IS BASED ON Tc = 5-MINUTE. SUBAREA RUNOFF(CFS) = 0.72 TOTAL AREA(ACRES) = 0.10 TOTAL RUNOFF(CFS) = 0.72
**************************************************************************** FLOW PROCESS FROM NODE 102.00 TO NODE 104.00 IS CODE = 62 ---------------------------------------------------------------------------- >>>>>COMPUTE STREET FLOW TRAVEL TIME THRU SUBAREA<<<<< >>>>>(STREET TABLE SECTION # 1 USED)<<<<< ============================================================================ REPRESENTATIVE SLOPE = 0.0200 STREET LENGTH(FEET) = 100.00 CURB HEIGHT(INCHES) = 8.0 STREET HALFWIDTH(FEET) = 30.00
DISTANCE FROM CROWN TO CROSSFALL GRADEBREAK(FEET) = 20.00 INSIDE STREET CROSSFALL(DECIMAL) = 0.018 OUTSIDE STREET CROSSFALL(DECIMAL) = 0.018
SPECIFIED NUMBER OF HALFSTREETS CARRYING RUNOFF = 1 STREET PARKWAY CROSSFALL(DECIMAL) = 0.020 Manning's FRICTION FACTOR for Streetflow Section(curb-to-curb) = 0.0150 Manning's FRICTION FACTOR for Back-of-Walk Flow Section = 0.0200
**TRAVEL TIME COMPUTED USING ESTIMATED FLOW(CFS) = 1.08 STREETFLOW MODEL RESULTS USING ESTIMATED FLOW: STREET FLOW DEPTH(FEET) = 0.25 HALFSTREET FLOOD WIDTH(FEET) = 5.03 AVERAGE FLOW VELOCITY(FEET/SEC.) = 2.58 PRODUCT OF DEPTH&VELOCITY(FT*FT/SEC.) = 0.65 STREET FLOW TRAVEL TIME(MIN.) = 0.65 Tc(MIN.) = 4.54 100 YEAR RAINFALL INTENSITY(INCH/HOUR) = 8.695 NOTE: RAINFALL INTENSITY IS BASED ON Tc = 5-MINUTE. *USER SPECIFIED(SUBAREA): USER-SPECIFIED RUNOFF COEFFICIENT = .8300 S.C.S. CURVE NUMBER (AMC II) = 0 AREA-AVERAGE RUNOFF COEFFICIENT = 0.830 SUBAREA AREA(ACRES) = 0.10 SUBAREA RUNOFF(CFS) = 0.72 TOTAL AREA(ACRES) = 0.2 PEAK FLOW RATE(CFS) = 1.44
END OF SUBAREA STREET FLOW HYDRAULICS: DEPTH(FEET) = 0.27 HALFSTREET FLOOD WIDTH(FEET) = 6.28 FLOW VELOCITY(FEET/SEC.) = 2.64 DEPTH*VELOCITY(FT*FT/SEC.) = 0.73 LONGEST FLOWPATH FROM NODE 100.00 TO NODE 104.00 = 170.00 FEET.
**************************************************************************** FLOW PROCESS FROM NODE 104.00 TO NODE 106.00 IS CODE = 41 ---------------------------------------------------------------------------- >>>>>COMPUTE PIPE-FLOW TRAVEL TIME THRU SUBAREA<<<<< >>>>>USING USER-SPECIFIED PIPESIZE (EXISTING ELEMENT)<<<<< ============================================================================ REPRESENTATIVE SLOPE = 0.0050 FLOW LENGTH(FEET) = 225.00 MANNING'S N = 0.013 DEPTH OF FLOW IN 18.0 INCH PIPE IS 5.5 INCHES PIPE-FLOW VELOCITY(FEET/SEC.) = 3.20 GIVEN PIPE DIAMETER(INCH) = 18.00 NUMBER OF PIPES = 1 PIPE-FLOW(CFS) = 1.44 PIPE TRAVEL TIME(MIN.) = 1.17 Tc(MIN.) = 5.71 LONGEST FLOWPATH FROM NODE 100.00 TO NODE 106.00 = 395.00 FEET.
**************************************************************************** FLOW PROCESS FROM NODE 106.00 TO NODE 106.00 IS CODE = 81 ----------------------------------------------------------------------------
Page 2

JR100P.RES >>>>>ADDITION OF SUBAREA TO MAINLINE PEAK FLOW<<<<< ============================================================================ 100 YEAR RAINFALL INTENSITY(INCH/HOUR) = 7.982 *USER SPECIFIED(SUBAREA): USER-SPECIFIED RUNOFF COEFFICIENT = .8300 S.C.S. CURVE NUMBER (AMC II) = 0 AREA-AVERAGE RUNOFF COEFFICIENT = 0.8300 SUBAREA AREA(ACRES) = 2.20 SUBAREA RUNOFF(CFS) = 14.57 TOTAL AREA(ACRES) = 2.4 TOTAL RUNOFF(CFS) = 15.90 TC(MIN.) = 5.71
**************************************************************************** FLOW PROCESS FROM NODE 106.00 TO NODE 108.00 IS CODE = 41 ---------------------------------------------------------------------------- >>>>>COMPUTE PIPE-FLOW TRAVEL TIME THRU SUBAREA<<<<< >>>>>USING USER-SPECIFIED PIPESIZE (EXISTING ELEMENT)<<<<< ============================================================================ REPRESENTATIVE SLOPE = 0.0050 FLOW LENGTH(FEET) = 160.00 MANNING'S N = 0.013 ASSUME FULL-FLOWING PIPELINE PIPE-FLOW VELOCITY(FEET/SEC.) = 9.00 PIPE FLOW VELOCITY = (TOTAL FLOW)/(PIPE CROSS SECTION AREA) GIVEN PIPE DIAMETER(INCH) = 18.00 NUMBER OF PIPES = 1 PIPE-FLOW(CFS) = 15.90 PIPE TRAVEL TIME(MIN.) = 0.30 Tc(MIN.) = 6.01 LONGEST FLOWPATH FROM NODE 100.00 TO NODE 108.00 = 555.00 FEET.
**************************************************************************** FLOW PROCESS FROM NODE 108.00 TO NODE 108.00 IS CODE = 1 ---------------------------------------------------------------------------- >>>>>DESIGNATE INDEPENDENT STREAM FOR CONFLUENCE<<<<< ============================================================================ TOTAL NUMBER OF STREAMS = 3 CONFLUENCE VALUES USED FOR INDEPENDENT STREAM 1 ARE: TIME OF CONCENTRATION(MIN.) = 6.01 RAINFALL INTENSITY(INCH/HR) = 7.73 TOTAL STREAM AREA(ACRES) = 2.40 PEAK FLOW RATE(CFS) AT CONFLUENCE = 15.90
**************************************************************************** FLOW PROCESS FROM NODE 110.00 TO NODE 112.00 IS CODE = 21 ---------------------------------------------------------------------------- >>>>>RATIONAL METHOD INITIAL SUBAREA ANALYSIS<<<<< ============================================================================ *USER SPECIFIED(SUBAREA): USER-SPECIFIED RUNOFF COEFFICIENT = .3000 S.C.S. CURVE NUMBER (AMC II) = 0 INITIAL SUBAREA FLOW-LENGTH(FEET) = 50.00 UPSTREAM ELEVATION(FEET) = 984.00 DOWNSTREAM ELEVATION(FEET) = 983.50 ELEVATION DIFFERENCE(FEET) = 0.50 SUBAREA OVERLAND TIME OF FLOW(MIN.) = 10.182 100 YEAR RAINFALL INTENSITY(INCH/HOUR) = 5.496 SUBAREA RUNOFF(CFS) = 0.16 TOTAL AREA(ACRES) = 0.10 TOTAL RUNOFF(CFS) = 0.16
**************************************************************************** FLOW PROCESS FROM NODE 112.00 TO NODE 114.00 IS CODE = 51 ---------------------------------------------------------------------------- >>>>>COMPUTE TRAPEZOIDAL CHANNEL FLOW<<<<< >>>>>TRAVELTIME THRU SUBAREA (EXISTING ELEMENT)<<<<< ============================================================================ CHANNEL LENGTH THRU SUBAREA(FEET) = 270.00
Page 3

JR100P.RES REPRESENTATIVE CHANNEL SLOPE = 0.0050 CHANNEL BASE(FEET) = 0.50 "Z" FACTOR = 2.000 MANNING'S FACTOR = 0.015 MAXIMUM DEPTH(FEET) = 2.00 100 YEAR RAINFALL INTENSITY(INCH/HOUR) = 4.791 *USER SPECIFIED(SUBAREA): USER-SPECIFIED RUNOFF COEFFICIENT = .3000 S.C.S. CURVE NUMBER (AMC II) = 0 TRAVEL TIME COMPUTED USING ESTIMATED FLOW(CFS) = 0.38 TRAVEL TIME THRU SUBAREA BASED ON VELOCITY(FEET/SEC.) = 1.86 AVERAGE FLOW DEPTH(FEET) = 0.22 TRAVEL TIME(MIN.) = 2.42 Tc(MIN.) = 12.60 SUBAREA AREA(ACRES) = 0.30 SUBAREA RUNOFF(CFS) = 0.43 AREA-AVERAGE RUNOFF COEFFICIENT = 0.300 TOTAL AREA(ACRES) = 0.4 PEAK FLOW RATE(CFS) = 0.57
END OF SUBAREA CHANNEL FLOW HYDRAULICS: DEPTH(FEET) = 0.26 FLOW VELOCITY(FEET/SEC.) = 2.12 LONGEST FLOWPATH FROM NODE 110.00 TO NODE 114.00 = 320.00 FEET.
**************************************************************************** FLOW PROCESS FROM NODE 114.00 TO NODE 108.00 IS CODE = 41 ---------------------------------------------------------------------------- >>>>>COMPUTE PIPE-FLOW TRAVEL TIME THRU SUBAREA<<<<< >>>>>USING USER-SPECIFIED PIPESIZE (EXISTING ELEMENT)<<<<< ============================================================================ REPRESENTATIVE SLOPE = 0.0050 FLOW LENGTH(FEET) = 420.00 MANNING'S N = 0.013 DEPTH OF FLOW IN 18.0 INCH PIPE IS 3.4 INCHES PIPE-FLOW VELOCITY(FEET/SEC.) = 2.46 GIVEN PIPE DIAMETER(INCH) = 18.00 NUMBER OF PIPES = 1 PIPE-FLOW(CFS) = 0.57 PIPE TRAVEL TIME(MIN.) = 2.85 Tc(MIN.) = 15.45 LONGEST FLOWPATH FROM NODE 110.00 TO NODE 108.00 = 740.00 FEET.
**************************************************************************** FLOW PROCESS FROM NODE 108.00 TO NODE 108.00 IS CODE = 1 ---------------------------------------------------------------------------- >>>>>DESIGNATE INDEPENDENT STREAM FOR CONFLUENCE<<<<< ============================================================================ TOTAL NUMBER OF STREAMS = 3 CONFLUENCE VALUES USED FOR INDEPENDENT STREAM 2 ARE: TIME OF CONCENTRATION(MIN.) = 15.45 RAINFALL INTENSITY(INCH/HR) = 4.20 TOTAL STREAM AREA(ACRES) = 0.40 PEAK FLOW RATE(CFS) AT CONFLUENCE = 0.57
**************************************************************************** FLOW PROCESS FROM NODE 120.00 TO NODE 122.00 IS CODE = 21 ---------------------------------------------------------------------------- >>>>>RATIONAL METHOD INITIAL SUBAREA ANALYSIS<<<<< ============================================================================ *USER SPECIFIED(SUBAREA): USER-SPECIFIED RUNOFF COEFFICIENT = .8300 S.C.S. CURVE NUMBER (AMC II) = 0 INITIAL SUBAREA FLOW-LENGTH(FEET) = 70.00 UPSTREAM ELEVATION(FEET) = 998.00 DOWNSTREAM ELEVATION(FEET) = 997.20 ELEVATION DIFFERENCE(FEET) = 0.80 SUBAREA OVERLAND TIME OF FLOW(MIN.) = 3.889 100 YEAR RAINFALL INTENSITY(INCH/HOUR) = 8.695 NOTE: RAINFALL INTENSITY IS BASED ON Tc = 5-MINUTE. SUBAREA RUNOFF(CFS) = 0.72 TOTAL AREA(ACRES) = 0.10 TOTAL RUNOFF(CFS) = 0.72
Page 4

JR100P.RES
**************************************************************************** FLOW PROCESS FROM NODE 122.00 TO NODE 124.00 IS CODE = 62 ---------------------------------------------------------------------------- >>>>>COMPUTE STREET FLOW TRAVEL TIME THRU SUBAREA<<<<< >>>>>(STREET TABLE SECTION # 1 USED)<<<<< ============================================================================ REPRESENTATIVE SLOPE = 0.0100 STREET LENGTH(FEET) = 130.00 CURB HEIGHT(INCHES) = 8.0 STREET HALFWIDTH(FEET) = 30.00
DISTANCE FROM CROWN TO CROSSFALL GRADEBREAK(FEET) = 20.00 INSIDE STREET CROSSFALL(DECIMAL) = 0.018 OUTSIDE STREET CROSSFALL(DECIMAL) = 0.018
SPECIFIED NUMBER OF HALFSTREETS CARRYING RUNOFF = 1 STREET PARKWAY CROSSFALL(DECIMAL) = 0.020 Manning's FRICTION FACTOR for Streetflow Section(curb-to-curb) = 0.0150 Manning's FRICTION FACTOR for Back-of-Walk Flow Section = 0.0200
**TRAVEL TIME COMPUTED USING ESTIMATED FLOW(CFS) = 1.08 STREETFLOW MODEL RESULTS USING ESTIMATED FLOW: STREET FLOW DEPTH(FEET) = 0.28 HALFSTREET FLOOD WIDTH(FEET) = 6.47 AVERAGE FLOW VELOCITY(FEET/SEC.) = 1.91 PRODUCT OF DEPTH&VELOCITY(FT*FT/SEC.) = 0.53 STREET FLOW TRAVEL TIME(MIN.) = 1.14 Tc(MIN.) = 5.03 100 YEAR RAINFALL INTENSITY(INCH/HOUR) = 8.665 *USER SPECIFIED(SUBAREA): USER-SPECIFIED RUNOFF COEFFICIENT = .8300 S.C.S. CURVE NUMBER (AMC II) = 0 AREA-AVERAGE RUNOFF COEFFICIENT = 0.830 SUBAREA AREA(ACRES) = 0.10 SUBAREA RUNOFF(CFS) = 0.72 TOTAL AREA(ACRES) = 0.2 PEAK FLOW RATE(CFS) = 1.44
END OF SUBAREA STREET FLOW HYDRAULICS: DEPTH(FEET) = 0.30 HALFSTREET FLOOD WIDTH(FEET) = 7.72 FLOW VELOCITY(FEET/SEC.) = 1.98 DEPTH*VELOCITY(FT*FT/SEC.) = 0.60 LONGEST FLOWPATH FROM NODE 120.00 TO NODE 124.00 = 200.00 FEET.
**************************************************************************** FLOW PROCESS FROM NODE 124.00 TO NODE 126.00 IS CODE = 41 ---------------------------------------------------------------------------- >>>>>COMPUTE PIPE-FLOW TRAVEL TIME THRU SUBAREA<<<<< >>>>>USING USER-SPECIFIED PIPESIZE (EXISTING ELEMENT)<<<<< ============================================================================ REPRESENTATIVE SLOPE = 0.0050 FLOW LENGTH(FEET) = 170.00 MANNING'S N = 0.013 DEPTH OF FLOW IN 18.0 INCH PIPE IS 5.4 INCHES PIPE-FLOW VELOCITY(FEET/SEC.) = 3.20 GIVEN PIPE DIAMETER(INCH) = 18.00 NUMBER OF PIPES = 1 PIPE-FLOW(CFS) = 1.44 PIPE TRAVEL TIME(MIN.) = 0.89 Tc(MIN.) = 5.91 LONGEST FLOWPATH FROM NODE 120.00 TO NODE 126.00 = 370.00 FEET.
**************************************************************************** FLOW PROCESS FROM NODE 126.00 TO NODE 126.00 IS CODE = 81 ---------------------------------------------------------------------------- >>>>>ADDITION OF SUBAREA TO MAINLINE PEAK FLOW<<<<< ============================================================================ 100 YEAR RAINFALL INTENSITY(INCH/HOUR) = 7.804 *USER SPECIFIED(SUBAREA): USER-SPECIFIED RUNOFF COEFFICIENT = .6500
Page 5

JR100P.RES S.C.S. CURVE NUMBER (AMC II) = 0 AREA-AVERAGE RUNOFF COEFFICIENT = 0.6777 SUBAREA AREA(ACRES) = 1.10 SUBAREA RUNOFF(CFS) = 5.58 TOTAL AREA(ACRES) = 1.3 TOTAL RUNOFF(CFS) = 6.88 TC(MIN.) = 5.91
**************************************************************************** FLOW PROCESS FROM NODE 126.00 TO NODE 108.00 IS CODE = 41 ---------------------------------------------------------------------------- >>>>>COMPUTE PIPE-FLOW TRAVEL TIME THRU SUBAREA<<<<< >>>>>USING USER-SPECIFIED PIPESIZE (EXISTING ELEMENT)<<<<< ============================================================================ REPRESENTATIVE SLOPE = 0.0050 FLOW LENGTH(FEET) = 520.00 MANNING'S N = 0.013 DEPTH OF FLOW IN 18.0 INCH PIPE IS 14.0 INCHES PIPE-FLOW VELOCITY(FEET/SEC.) = 4.66 GIVEN PIPE DIAMETER(INCH) = 18.00 NUMBER OF PIPES = 1 PIPE-FLOW(CFS) = 6.88 PIPE TRAVEL TIME(MIN.) = 1.86 Tc(MIN.) = 7.77 LONGEST FLOWPATH FROM NODE 120.00 TO NODE 108.00 = 890.00 FEET.
**************************************************************************** FLOW PROCESS FROM NODE 108.00 TO NODE 108.00 IS CODE = 1 ---------------------------------------------------------------------------- >>>>>DESIGNATE INDEPENDENT STREAM FOR CONFLUENCE<<<<< >>>>>AND COMPUTE VARIOUS CONFLUENCED STREAM VALUES<<<<< ============================================================================ TOTAL NUMBER OF STREAMS = 3 CONFLUENCE VALUES USED FOR INDEPENDENT STREAM 3 ARE: TIME OF CONCENTRATION(MIN.) = 7.77 RAINFALL INTENSITY(INCH/HR) = 6.54 TOTAL STREAM AREA(ACRES) = 1.30 PEAK FLOW RATE(CFS) AT CONFLUENCE = 6.88
** CONFLUENCE DATA ** STREAM RUNOFF Tc INTENSITY AREA NUMBER (CFS) (MIN.) (INCH/HOUR) (ACRE) 1 15.90 6.01 7.726 2.40 2 0.57 15.45 4.201 0.40 3 6.88 7.77 6.542 1.30
RAINFALL INTENSITY AND TIME OF CONCENTRATION RATIO CONFLUENCE FORMULA USED FOR 3 STREAMS.
** PEAK FLOW RATE TABLE ** STREAM RUNOFF Tc INTENSITY NUMBER (CFS) (MIN.) (INCH/HOUR) 1 21.44 6.01 7.726 2 20.63 7.77 6.542 3 13.63 15.45 4.201
COMPUTED CONFLUENCE ESTIMATES ARE AS FOLLOWS: PEAK FLOW RATE(CFS) = 21.44 Tc(MIN.) = 6.01 TOTAL AREA(ACRES) = 4.1 LONGEST FLOWPATH FROM NODE 120.00 TO NODE 108.00 = 890.00 FEET.
**************************************************************************** FLOW PROCESS FROM NODE 108.00 TO NODE 134.00 IS CODE = 41 ---------------------------------------------------------------------------- >>>>>COMPUTE PIPE-FLOW TRAVEL TIME THRU SUBAREA<<<<< >>>>>USING USER-SPECIFIED PIPESIZE (EXISTING ELEMENT)<<<<< ============================================================================ REPRESENTATIVE SLOPE = 0.0050
Page 6

JR100P.RES FLOW LENGTH(FEET) = 50.00 MANNING'S N = 0.013 ASSUME FULL-FLOWING PIPELINE PIPE-FLOW VELOCITY(FEET/SEC.) = 6.82 PIPE FLOW VELOCITY = (TOTAL FLOW)/(PIPE CROSS SECTION AREA) GIVEN PIPE DIAMETER(INCH) = 24.00 NUMBER OF PIPES = 1 PIPE-FLOW(CFS) = 21.44 PIPE TRAVEL TIME(MIN.) = 0.12 Tc(MIN.) = 6.13 LONGEST FLOWPATH FROM NODE 120.00 TO NODE 134.00 = 940.00 FEET.
**************************************************************************** FLOW PROCESS FROM NODE 134.00 TO NODE 134.00 IS CODE = 81 ---------------------------------------------------------------------------- >>>>>ADDITION OF SUBAREA TO MAINLINE PEAK FLOW<<<<< ============================================================================ 100 YEAR RAINFALL INTENSITY(INCH/HOUR) = 7.626 *USER SPECIFIED(SUBAREA): USER-SPECIFIED RUNOFF COEFFICIENT = .3000 S.C.S. CURVE NUMBER (AMC II) = 0 AREA-AVERAGE RUNOFF COEFFICIENT = 0.6918 SUBAREA AREA(ACRES) = 0.40 SUBAREA RUNOFF(CFS) = 0.92 TOTAL AREA(ACRES) = 4.5 TOTAL RUNOFF(CFS) = 23.74 TC(MIN.) = 6.13
**************************************************************************** FLOW PROCESS FROM NODE 134.00 TO NODE 135.00 IS CODE = 41 ---------------------------------------------------------------------------- >>>>>COMPUTE PIPE-FLOW TRAVEL TIME THRU SUBAREA<<<<< >>>>>USING USER-SPECIFIED PIPESIZE (EXISTING ELEMENT)<<<<< ============================================================================ REPRESENTATIVE SLOPE = 0.0200 FLOW LENGTH(FEET) = 180.00 MANNING'S N = 0.013 DEPTH OF FLOW IN 24.0 INCH PIPE IS 15.7 INCHES PIPE-FLOW VELOCITY(FEET/SEC.) = 10.92 GIVEN PIPE DIAMETER(INCH) = 24.00 NUMBER OF PIPES = 1 PIPE-FLOW(CFS) = 23.74 PIPE TRAVEL TIME(MIN.) = 0.27 Tc(MIN.) = 6.40 LONGEST FLOWPATH FROM NODE 120.00 TO NODE 135.00 = 1120.00 FEET.
**************************************************************************** FLOW PROCESS FROM NODE 135.00 TO NODE 135.00 IS CODE = 1 ---------------------------------------------------------------------------- >>>>>DESIGNATE INDEPENDENT STREAM FOR CONFLUENCE<<<<< ============================================================================ TOTAL NUMBER OF STREAMS = 2 CONFLUENCE VALUES USED FOR INDEPENDENT STREAM 1 ARE: TIME OF CONCENTRATION(MIN.) = 6.40 RAINFALL INTENSITY(INCH/HR) = 7.41 TOTAL STREAM AREA(ACRES) = 4.50 PEAK FLOW RATE(CFS) AT CONFLUENCE = 23.74
**************************************************************************** FLOW PROCESS FROM NODE 140.00 TO NODE 142.00 IS CODE = 21 ---------------------------------------------------------------------------- >>>>>RATIONAL METHOD INITIAL SUBAREA ANALYSIS<<<<< ============================================================================ *USER SPECIFIED(SUBAREA): USER-SPECIFIED RUNOFF COEFFICIENT = .8300 S.C.S. CURVE NUMBER (AMC II) = 0 INITIAL SUBAREA FLOW-LENGTH(FEET) = 100.00 UPSTREAM ELEVATION(FEET) = 992.00 DOWNSTREAM ELEVATION(FEET) = 985.00 ELEVATION DIFFERENCE(FEET) = 7.00 SUBAREA OVERLAND TIME OF FLOW(MIN.) = 2.541
Page 7

JR100P.RES 100 YEAR RAINFALL INTENSITY(INCH/HOUR) = 8.695 NOTE: RAINFALL INTENSITY IS BASED ON Tc = 5-MINUTE. SUBAREA RUNOFF(CFS) = 0.72 TOTAL AREA(ACRES) = 0.10 TOTAL RUNOFF(CFS) = 0.72
**************************************************************************** FLOW PROCESS FROM NODE 142.00 TO NODE 144.00 IS CODE = 62 ---------------------------------------------------------------------------- >>>>>COMPUTE STREET FLOW TRAVEL TIME THRU SUBAREA<<<<< >>>>>(STREET TABLE SECTION # 1 USED)<<<<< ============================================================================ REPRESENTATIVE SLOPE = 0.0500 STREET LENGTH(FEET) = 300.00 CURB HEIGHT(INCHES) = 8.0 STREET HALFWIDTH(FEET) = 30.00
DISTANCE FROM CROWN TO CROSSFALL GRADEBREAK(FEET) = 20.00 INSIDE STREET CROSSFALL(DECIMAL) = 0.018 OUTSIDE STREET CROSSFALL(DECIMAL) = 0.018
SPECIFIED NUMBER OF HALFSTREETS CARRYING RUNOFF = 1 STREET PARKWAY CROSSFALL(DECIMAL) = 0.020 Manning's FRICTION FACTOR for Streetflow Section(curb-to-curb) = 0.0150 Manning's FRICTION FACTOR for Back-of-Walk Flow Section = 0.0200
**TRAVEL TIME COMPUTED USING ESTIMATED FLOW(CFS) = 1.44 STREETFLOW MODEL RESULTS USING ESTIMATED FLOW: STREET FLOW DEPTH(FEET) = 0.24 HALFSTREET FLOOD WIDTH(FEET) = 4.28 AVERAGE FLOW VELOCITY(FEET/SEC.) = 4.04 PRODUCT OF DEPTH&VELOCITY(FT*FT/SEC.) = 0.96 STREET FLOW TRAVEL TIME(MIN.) = 1.24 Tc(MIN.) = 3.78 100 YEAR RAINFALL INTENSITY(INCH/HOUR) = 8.695 NOTE: RAINFALL INTENSITY IS BASED ON Tc = 5-MINUTE. *USER SPECIFIED(SUBAREA): USER-SPECIFIED RUNOFF COEFFICIENT = .8300 S.C.S. CURVE NUMBER (AMC II) = 0 AREA-AVERAGE RUNOFF COEFFICIENT = 0.830 SUBAREA AREA(ACRES) = 0.20 SUBAREA RUNOFF(CFS) = 1.44 TOTAL AREA(ACRES) = 0.3 PEAK FLOW RATE(CFS) = 2.16
END OF SUBAREA STREET FLOW HYDRAULICS: DEPTH(FEET) = 0.27 HALFSTREET FLOOD WIDTH(FEET) = 6.03 FLOW VELOCITY(FEET/SEC.) = 4.17 DEPTH*VELOCITY(FT*FT/SEC.) = 1.13 LONGEST FLOWPATH FROM NODE 140.00 TO NODE 144.00 = 400.00 FEET.
**************************************************************************** FLOW PROCESS FROM NODE 144.00 TO NODE 146.00 IS CODE = 41 ---------------------------------------------------------------------------- >>>>>COMPUTE PIPE-FLOW TRAVEL TIME THRU SUBAREA<<<<< >>>>>USING USER-SPECIFIED PIPESIZE (EXISTING ELEMENT)<<<<< ============================================================================ REPRESENTATIVE SLOPE = 0.0050 FLOW LENGTH(FEET) = 480.00 MANNING'S N = 0.013 DEPTH OF FLOW IN 18.0 INCH PIPE IS 6.7 INCHES PIPE-FLOW VELOCITY(FEET/SEC.) = 3.58 GIVEN PIPE DIAMETER(INCH) = 18.00 NUMBER OF PIPES = 1 PIPE-FLOW(CFS) = 2.16 PIPE TRAVEL TIME(MIN.) = 2.24 Tc(MIN.) = 6.02 LONGEST FLOWPATH FROM NODE 140.00 TO NODE 146.00 = 880.00 FEET.
**************************************************************************** FLOW PROCESS FROM NODE 146.00 TO NODE 146.00 IS CODE = 81 ----------------------------------------------------------------------------
Page 8

JR100P.RES >>>>>ADDITION OF SUBAREA TO MAINLINE PEAK FLOW<<<<< ============================================================================ 100 YEAR RAINFALL INTENSITY(INCH/HOUR) = 7.718 *USER SPECIFIED(SUBAREA): USER-SPECIFIED RUNOFF COEFFICIENT = .9000 S.C.S. CURVE NUMBER (AMC II) = 0 AREA-AVERAGE RUNOFF COEFFICIENT = 0.8940 SUBAREA AREA(ACRES) = 3.20 SUBAREA RUNOFF(CFS) = 22.23 TOTAL AREA(ACRES) = 3.5 TOTAL RUNOFF(CFS) = 24.15 TC(MIN.) = 6.02
**************************************************************************** FLOW PROCESS FROM NODE 146.00 TO NODE 135.00 IS CODE = 41 ---------------------------------------------------------------------------- >>>>>COMPUTE PIPE-FLOW TRAVEL TIME THRU SUBAREA<<<<< >>>>>USING USER-SPECIFIED PIPESIZE (EXISTING ELEMENT)<<<<< ============================================================================ REPRESENTATIVE SLOPE = 0.0050 FLOW LENGTH(FEET) = 60.00 MANNING'S N = 0.013 ASSUME FULL-FLOWING PIPELINE PIPE-FLOW VELOCITY(FEET/SEC.) = 7.69 PIPE FLOW VELOCITY = (TOTAL FLOW)/(PIPE CROSS SECTION AREA) GIVEN PIPE DIAMETER(INCH) = 24.00 NUMBER OF PIPES = 1 PIPE-FLOW(CFS) = 24.15 PIPE TRAVEL TIME(MIN.) = 0.13 Tc(MIN.) = 6.15 LONGEST FLOWPATH FROM NODE 140.00 TO NODE 135.00 = 940.00 FEET.
**************************************************************************** FLOW PROCESS FROM NODE 135.00 TO NODE 135.00 IS CODE = 1 ---------------------------------------------------------------------------- >>>>>DESIGNATE INDEPENDENT STREAM FOR CONFLUENCE<<<<< >>>>>AND COMPUTE VARIOUS CONFLUENCED STREAM VALUES<<<<< ============================================================================ TOTAL NUMBER OF STREAMS = 2 CONFLUENCE VALUES USED FOR INDEPENDENT STREAM 2 ARE: TIME OF CONCENTRATION(MIN.) = 6.15 RAINFALL INTENSITY(INCH/HR) = 7.61 TOTAL STREAM AREA(ACRES) = 3.50 PEAK FLOW RATE(CFS) AT CONFLUENCE = 24.15
** CONFLUENCE DATA ** STREAM RUNOFF Tc INTENSITY AREA NUMBER (CFS) (MIN.) (INCH/HOUR) (ACRE) 1 23.74 6.40 7.413 4.50 2 24.15 6.15 7.612 3.50
RAINFALL INTENSITY AND TIME OF CONCENTRATION RATIO CONFLUENCE FORMULA USED FOR 2 STREAMS.
** PEAK FLOW RATE TABLE ** STREAM RUNOFF Tc INTENSITY NUMBER (CFS) (MIN.) (INCH/HOUR) 1 47.27 6.15 7.612 2 47.26 6.40 7.413
COMPUTED CONFLUENCE ESTIMATES ARE AS FOLLOWS: PEAK FLOW RATE(CFS) = 47.27 Tc(MIN.) = 6.15 TOTAL AREA(ACRES) = 8.0 LONGEST FLOWPATH FROM NODE 120.00 TO NODE 135.00 = 1120.00 FEET.
**************************************************************************** FLOW PROCESS FROM NODE 135.00 TO NODE 150.00 IS CODE = 41 ----------------------------------------------------------------------------
Page 9

JR100P.RES >>>>>COMPUTE PIPE-FLOW TRAVEL TIME THRU SUBAREA<<<<< >>>>>USING USER-SPECIFIED PIPESIZE (EXISTING ELEMENT)<<<<< ============================================================================ REPRESENTATIVE SLOPE = 0.0050 FLOW LENGTH(FEET) = 420.00 MANNING'S N = 0.013 ASSUME FULL-FLOWING PIPELINE PIPE-FLOW VELOCITY(FEET/SEC.) = 9.63 PIPE FLOW VELOCITY = (TOTAL FLOW)/(PIPE CROSS SECTION AREA) GIVEN PIPE DIAMETER(INCH) = 30.00 NUMBER OF PIPES = 1 PIPE-FLOW(CFS) = 47.27 PIPE TRAVEL TIME(MIN.) = 0.73 Tc(MIN.) = 6.87 LONGEST FLOWPATH FROM NODE 120.00 TO NODE 150.00 = 1540.00 FEET.
**************************************************************************** FLOW PROCESS FROM NODE 150.00 TO NODE 150.00 IS CODE = 81 ---------------------------------------------------------------------------- >>>>>ADDITION OF SUBAREA TO MAINLINE PEAK FLOW<<<<< ============================================================================ 100 YEAR RAINFALL INTENSITY(INCH/HOUR) = 7.082 *USER SPECIFIED(SUBAREA): USER-SPECIFIED RUNOFF COEFFICIENT = .3000 S.C.S. CURVE NUMBER (AMC II) = 0 AREA-AVERAGE RUNOFF COEFFICIENT = 0.7416 SUBAREA AREA(ACRES) = 0.70 SUBAREA RUNOFF(CFS) = 1.49 TOTAL AREA(ACRES) = 8.7 TOTAL RUNOFF(CFS) = 47.27 TC(MIN.) = 6.87 NOTE: PEAK FLOW RATE DEFAULTED TO UPSTREAM VALUE
**************************************************************************** FLOW PROCESS FROM NODE 160.10 TO NODE 160.20 IS CODE = 21 ---------------------------------------------------------------------------- >>>>>RATIONAL METHOD INITIAL SUBAREA ANALYSIS<<<<< ============================================================================ *USER SPECIFIED(SUBAREA): USER-SPECIFIED RUNOFF COEFFICIENT = .3000 S.C.S. CURVE NUMBER (AMC II) = 0 INITIAL SUBAREA FLOW-LENGTH(FEET) = 45.00 UPSTREAM ELEVATION(FEET) = 969.67 DOWNSTREAM ELEVATION(FEET) = 950.00 ELEVATION DIFFERENCE(FEET) = 19.67 SUBAREA OVERLAND TIME OF FLOW(MIN.) = 4.484 WARNING: THE MAXIMUM OVERLAND FLOW SLOPE, 10.%, IS USED IN Tc CALCULATION! 100 YEAR RAINFALL INTENSITY(INCH/HOUR) = 8.695 NOTE: RAINFALL INTENSITY IS BASED ON Tc = 5-MINUTE. SUBAREA RUNOFF(CFS) = 0.26 TOTAL AREA(ACRES) = 0.10 TOTAL RUNOFF(CFS) = 0.26
**************************************************************************** FLOW PROCESS FROM NODE 106.20 TO NODE 160.00 IS CODE = 51 ---------------------------------------------------------------------------- >>>>>COMPUTE TRAPEZOIDAL CHANNEL FLOW<<<<< >>>>>TRAVELTIME THRU SUBAREA (EXISTING ELEMENT)<<<<< ============================================================================ CHANNEL LENGTH THRU SUBAREA(FEET) = 45.00 REPRESENTATIVE CHANNEL SLOPE = 0.5000 CHANNEL BASE(FEET) = 5.00 "Z" FACTOR = 20.000 MANNING'S FACTOR = 0.030 MAXIMUM DEPTH(FEET) = 0.50 100 YEAR RAINFALL INTENSITY(INCH/HOUR) = 8.695 NOTE: RAINFALL INTENSITY IS BASED ON Tc = 5-MINUTE. *USER SPECIFIED(SUBAREA): USER-SPECIFIED RUNOFF COEFFICIENT = .3000 S.C.S. CURVE NUMBER (AMC II) = 0 TRAVEL TIME COMPUTED USING ESTIMATED FLOW(CFS) = 1.70
Page 10

JR100P.RES TRAVEL TIME THRU SUBAREA BASED ON VELOCITY(FEET/SEC.) = 4.73 AVERAGE FLOW DEPTH(FEET) = 0.06 TRAVEL TIME(MIN.) = 0.16 Tc(MIN.) = 4.64 SUBAREA AREA(ACRES) = 1.10 SUBAREA RUNOFF(CFS) = 2.87 AREA-AVERAGE RUNOFF COEFFICIENT = 0.300 TOTAL AREA(ACRES) = 1.2 PEAK FLOW RATE(CFS) = 3.13
END OF SUBAREA CHANNEL FLOW HYDRAULICS: DEPTH(FEET) = 0.08 FLOW VELOCITY(FEET/SEC.) = 5.83 LONGEST FLOWPATH FROM NODE 160.10 TO NODE 160.00 = 90.00 FEET. ============================================================================ END OF STUDY SUMMARY: TOTAL AREA(ACRES) = 1.2 TC(MIN.) = 4.64 PEAK FLOW RATE(CFS) = 3.13 ============================================================================ ============================================================================ END OF RATIONAL METHOD ANALYSIS
�
Page 11
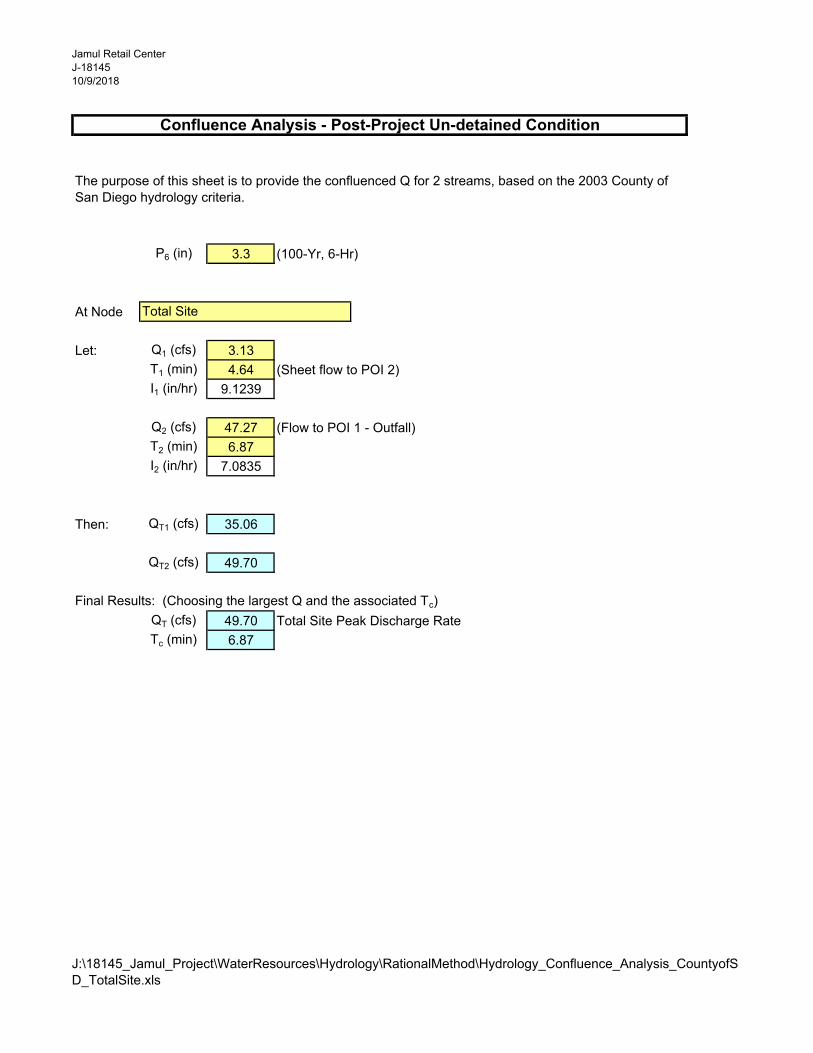
Jamul Retail Center
J-18145
10/9/2018
P6 (in) 3.3 (100-Yr, 6-Hr)
At Node
Let: Q1 (cfs) 3.13
T1 (min) 4.64 (Sheet flow to POI 2)
I1 (in/hr) 9.1239
Q2 (cfs) 47.27 (Flow to POI 1 - Outfall)
T2 (min) 6.87
I2 (in/hr) 7.0835
Then: QT1 (cfs) 35.06
QT2 (cfs) 49.70
Final Results: (Choosing the largest Q and the associated Tc)
QT (cfs) 49.70 Total Site Peak Discharge Rate
Tc (min) 6.87
Confluence Analysis - Post-Project Un-detained Condition
The purpose of this sheet is to provide the confluenced Q for 2 streams, based on the 2003 County of
San Diego hydrology criteria.
Total Site
J:\18145_Jamul_Project\WaterResources\Hydrology\RationalMethod\Hydrology_Confluence_Analysis_CountyofS
D_TotalSite.xls

APPENDIX A3
Proposed Condition AES Output
[100-Year, Detained]

JR100P1H.RES ____________________________________________________________________________ ****************************************************************************
RATIONAL METHOD HYDROLOGY COMPUTER PROGRAM PACKAGE Reference: SAN DIEGO COUNTY FLOOD CONTROL DISTRICT 2003,1985,1981 HYDROLOGY MANUAL (c) Copyright 1982-2014 Advanced Engineering Software (aes) Ver. 21.0 Release Date: 06/01/2014 License ID 1261
Analysis prepared by:
RICK ENGINEERING COMPANY 5620 Friars Road San Diego, California 92110 619-291-0707 Fax 619-291-4165
************************** DESCRIPTION OF STUDY ************************** * JAMUL RETAIL CENTER, J-18145 * * 100-YR, 6-HR POST-PROJECT CONDITION FOR BASIN 100, DETAINED * * J:\18145\WATERRESOURCES\HYDROLOGY\RATIONALMETHOD\.. * **************************************************************************
FILE NAME: JR100P1H.RAT TIME/DATE OF STUDY: 13:53 07/09/2018 ---------------------------------------------------------------------------- USER SPECIFIED HYDROLOGY AND HYDRAULIC MODEL INFORMATION: ---------------------------------------------------------------------------- 2003 SAN DIEGO MANUAL CRITERIA
USER SPECIFIED STORM EVENT(YEAR) = 100.00 6-HOUR DURATION PRECIPITATION (INCHES) = 3.300 SPECIFIED MINIMUM PIPE SIZE(INCH) = 18.00 SPECIFIED PERCENT OF GRADIENTS(DECIMAL) TO USE FOR FRICTION SLOPE = 0.95 SAN DIEGO HYDROLOGY MANUAL "C"-VALUES USED FOR RATIONAL METHOD NOTE: USE MODIFIED RATIONAL METHOD PROCEDURES FOR CONFLUENCE ANALYSIS *USER-DEFINED STREET-SECTIONS FOR COUPLED PIPEFLOW AND STREETFLOW MODEL* HALF- CROWN TO STREET-CROSSFALL: CURB GUTTER-GEOMETRIES: MANNING WIDTH CROSSFALL IN- / OUT-/PARK- HEIGHT WIDTH LIP HIKE FACTOR NO. (FT) (FT) SIDE / SIDE/ WAY (FT) (FT) (FT) (FT) (n) === ===== ========= ================= ====== ===== ====== ===== ======= 1 30.0 20.0 0.018/0.018/0.020 0.67 2.00 0.0313 0.167 0.0150 2 30.0 25.0 0.020/0.020/0.020 0.50 1.50 0.0313 0.125 0.0180
GLOBAL STREET FLOW-DEPTH CONSTRAINTS: 1. Relative Flow-Depth = 0.50 FEET as (Maximum Allowable Street Flow Depth) - (Top-of-Curb) 2. (Depth)*(Velocity) Constraint = 6.0 (FT*FT/S) *SIZE PIPE WITH A FLOW CAPACITY GREATER THAN OR EQUAL TO THE UPSTREAM TRIBUTARY PIPE.*
**************************************************************************** FLOW PROCESS FROM NODE 100.00 TO NODE 102.00 IS CODE = 21 ---------------------------------------------------------------------------- >>>>>RATIONAL METHOD INITIAL SUBAREA ANALYSIS<<<<< ============================================================================ *USER SPECIFIED(SUBAREA): USER-SPECIFIED RUNOFF COEFFICIENT = .8300 S.C.S. CURVE NUMBER (AMC II) = 0 INITIAL SUBAREA FLOW-LENGTH(FEET) = 70.00 UPSTREAM ELEVATION(FEET) = 998.00 DOWNSTREAM ELEVATION(FEET) = 997.20 ELEVATION DIFFERENCE(FEET) = 0.80 SUBAREA OVERLAND TIME OF FLOW(MIN.) = 3.889
Page 1

JR100P1H.RES 100 YEAR RAINFALL INTENSITY(INCH/HOUR) = 8.695 NOTE: RAINFALL INTENSITY IS BASED ON Tc = 5-MINUTE. SUBAREA RUNOFF(CFS) = 0.72 TOTAL AREA(ACRES) = 0.10 TOTAL RUNOFF(CFS) = 0.72
**************************************************************************** FLOW PROCESS FROM NODE 102.00 TO NODE 104.00 IS CODE = 62 ---------------------------------------------------------------------------- >>>>>COMPUTE STREET FLOW TRAVEL TIME THRU SUBAREA<<<<< >>>>>(STREET TABLE SECTION # 1 USED)<<<<< ============================================================================ REPRESENTATIVE SLOPE = 0.0200 STREET LENGTH(FEET) = 100.00 CURB HEIGHT(INCHES) = 8.0 STREET HALFWIDTH(FEET) = 30.00
DISTANCE FROM CROWN TO CROSSFALL GRADEBREAK(FEET) = 20.00 INSIDE STREET CROSSFALL(DECIMAL) = 0.018 OUTSIDE STREET CROSSFALL(DECIMAL) = 0.018
SPECIFIED NUMBER OF HALFSTREETS CARRYING RUNOFF = 1 STREET PARKWAY CROSSFALL(DECIMAL) = 0.020 Manning's FRICTION FACTOR for Streetflow Section(curb-to-curb) = 0.0150 Manning's FRICTION FACTOR for Back-of-Walk Flow Section = 0.0200
**TRAVEL TIME COMPUTED USING ESTIMATED FLOW(CFS) = 1.08 STREETFLOW MODEL RESULTS USING ESTIMATED FLOW: STREET FLOW DEPTH(FEET) = 0.25 HALFSTREET FLOOD WIDTH(FEET) = 5.03 AVERAGE FLOW VELOCITY(FEET/SEC.) = 2.58 PRODUCT OF DEPTH&VELOCITY(FT*FT/SEC.) = 0.65 STREET FLOW TRAVEL TIME(MIN.) = 0.65 Tc(MIN.) = 4.54 100 YEAR RAINFALL INTENSITY(INCH/HOUR) = 8.695 NOTE: RAINFALL INTENSITY IS BASED ON Tc = 5-MINUTE. *USER SPECIFIED(SUBAREA): USER-SPECIFIED RUNOFF COEFFICIENT = .8300 S.C.S. CURVE NUMBER (AMC II) = 0 AREA-AVERAGE RUNOFF COEFFICIENT = 0.830 SUBAREA AREA(ACRES) = 0.10 SUBAREA RUNOFF(CFS) = 0.72 TOTAL AREA(ACRES) = 0.2 PEAK FLOW RATE(CFS) = 1.44
END OF SUBAREA STREET FLOW HYDRAULICS: DEPTH(FEET) = 0.27 HALFSTREET FLOOD WIDTH(FEET) = 6.28 FLOW VELOCITY(FEET/SEC.) = 2.64 DEPTH*VELOCITY(FT*FT/SEC.) = 0.73 LONGEST FLOWPATH FROM NODE 100.00 TO NODE 104.00 = 170.00 FEET.
**************************************************************************** FLOW PROCESS FROM NODE 104.00 TO NODE 106.00 IS CODE = 41 ---------------------------------------------------------------------------- >>>>>COMPUTE PIPE-FLOW TRAVEL TIME THRU SUBAREA<<<<< >>>>>USING USER-SPECIFIED PIPESIZE (EXISTING ELEMENT)<<<<< ============================================================================ REPRESENTATIVE SLOPE = 0.0050 FLOW LENGTH(FEET) = 225.00 MANNING'S N = 0.013 DEPTH OF FLOW IN 18.0 INCH PIPE IS 5.5 INCHES PIPE-FLOW VELOCITY(FEET/SEC.) = 3.20 GIVEN PIPE DIAMETER(INCH) = 18.00 NUMBER OF PIPES = 1 PIPE-FLOW(CFS) = 1.44 PIPE TRAVEL TIME(MIN.) = 1.17 Tc(MIN.) = 5.71 LONGEST FLOWPATH FROM NODE 100.00 TO NODE 106.00 = 395.00 FEET.
**************************************************************************** FLOW PROCESS FROM NODE 106.00 TO NODE 106.00 IS CODE = 81 ----------------------------------------------------------------------------
Page 2

JR100P1H.RES >>>>>ADDITION OF SUBAREA TO MAINLINE PEAK FLOW<<<<< ============================================================================ 100 YEAR RAINFALL INTENSITY(INCH/HOUR) = 7.982 *USER SPECIFIED(SUBAREA): USER-SPECIFIED RUNOFF COEFFICIENT = .8300 S.C.S. CURVE NUMBER (AMC II) = 0 AREA-AVERAGE RUNOFF COEFFICIENT = 0.8300 SUBAREA AREA(ACRES) = 2.20 SUBAREA RUNOFF(CFS) = 14.57 TOTAL AREA(ACRES) = 2.4 TOTAL RUNOFF(CFS) = 15.90 TC(MIN.) = 5.71
+--------------------------------------------------------------------------+ | THE CODE 7 BELOW IS THE DETAINED 100-YEAR PEAK FLOW AND Tc FROM BMP-2 | | | | | +--------------------------------------------------------------------------+
**************************************************************************** FLOW PROCESS FROM NODE 106.00 TO NODE 106.00 IS CODE = 7 ---------------------------------------------------------------------------- >>>>>USER SPECIFIED HYDROLOGY INFORMATION AT NODE<<<<< ============================================================================ USER-SPECIFIED VALUES ARE AS FOLLOWS: TC(MIN) = 10.51 RAIN INTENSITY(INCH/HOUR) = 5.38 TOTAL AREA(ACRES) = 2.40 TOTAL RUNOFF(CFS) = 4.70
**************************************************************************** FLOW PROCESS FROM NODE 106.00 TO NODE 108.00 IS CODE = 41 ---------------------------------------------------------------------------- >>>>>COMPUTE PIPE-FLOW TRAVEL TIME THRU SUBAREA<<<<< >>>>>USING USER-SPECIFIED PIPESIZE (EXISTING ELEMENT)<<<<< ============================================================================ REPRESENTATIVE SLOPE = 0.0050 FLOW LENGTH(FEET) = 160.00 MANNING'S N = 0.013 DEPTH OF FLOW IN 18.0 INCH PIPE IS 10.6 INCHES PIPE-FLOW VELOCITY(FEET/SEC.) = 4.36 GIVEN PIPE DIAMETER(INCH) = 18.00 NUMBER OF PIPES = 1 PIPE-FLOW(CFS) = 4.70 PIPE TRAVEL TIME(MIN.) = 0.61 Tc(MIN.) = 11.12 LONGEST FLOWPATH FROM NODE 100.00 TO NODE 108.00 = 555.00 FEET.
**************************************************************************** FLOW PROCESS FROM NODE 108.00 TO NODE 108.00 IS CODE = 1 ---------------------------------------------------------------------------- >>>>>DESIGNATE INDEPENDENT STREAM FOR CONFLUENCE<<<<< ============================================================================ TOTAL NUMBER OF STREAMS = 3 CONFLUENCE VALUES USED FOR INDEPENDENT STREAM 1 ARE: TIME OF CONCENTRATION(MIN.) = 11.12 RAINFALL INTENSITY(INCH/HR) = 5.19 TOTAL STREAM AREA(ACRES) = 2.40 PEAK FLOW RATE(CFS) AT CONFLUENCE = 4.70
**************************************************************************** FLOW PROCESS FROM NODE 110.00 TO NODE 112.00 IS CODE = 21 ---------------------------------------------------------------------------- >>>>>RATIONAL METHOD INITIAL SUBAREA ANALYSIS<<<<< ============================================================================ *USER SPECIFIED(SUBAREA): USER-SPECIFIED RUNOFF COEFFICIENT = .3000 S.C.S. CURVE NUMBER (AMC II) = 0 INITIAL SUBAREA FLOW-LENGTH(FEET) = 50.00 UPSTREAM ELEVATION(FEET) = 984.00
Page 3

JR100P1H.RES DOWNSTREAM ELEVATION(FEET) = 983.50 ELEVATION DIFFERENCE(FEET) = 0.50 SUBAREA OVERLAND TIME OF FLOW(MIN.) = 10.182 100 YEAR RAINFALL INTENSITY(INCH/HOUR) = 5.496 SUBAREA RUNOFF(CFS) = 0.16 TOTAL AREA(ACRES) = 0.10 TOTAL RUNOFF(CFS) = 0.16
**************************************************************************** FLOW PROCESS FROM NODE 112.00 TO NODE 114.00 IS CODE = 51 ---------------------------------------------------------------------------- >>>>>COMPUTE TRAPEZOIDAL CHANNEL FLOW<<<<< >>>>>TRAVELTIME THRU SUBAREA (EXISTING ELEMENT)<<<<< ============================================================================ CHANNEL LENGTH THRU SUBAREA(FEET) = 270.00 REPRESENTATIVE CHANNEL SLOPE = 0.0050 CHANNEL BASE(FEET) = 0.50 "Z" FACTOR = 2.000 MANNING'S FACTOR = 0.015 MAXIMUM DEPTH(FEET) = 2.00 100 YEAR RAINFALL INTENSITY(INCH/HOUR) = 4.791 *USER SPECIFIED(SUBAREA): USER-SPECIFIED RUNOFF COEFFICIENT = .3000 S.C.S. CURVE NUMBER (AMC II) = 0 TRAVEL TIME COMPUTED USING ESTIMATED FLOW(CFS) = 0.38 TRAVEL TIME THRU SUBAREA BASED ON VELOCITY(FEET/SEC.) = 1.86 AVERAGE FLOW DEPTH(FEET) = 0.22 TRAVEL TIME(MIN.) = 2.42 Tc(MIN.) = 12.60 SUBAREA AREA(ACRES) = 0.30 SUBAREA RUNOFF(CFS) = 0.43 AREA-AVERAGE RUNOFF COEFFICIENT = 0.300 TOTAL AREA(ACRES) = 0.4 PEAK FLOW RATE(CFS) = 0.57
END OF SUBAREA CHANNEL FLOW HYDRAULICS: DEPTH(FEET) = 0.26 FLOW VELOCITY(FEET/SEC.) = 2.12 LONGEST FLOWPATH FROM NODE 110.00 TO NODE 114.00 = 320.00 FEET.
**************************************************************************** FLOW PROCESS FROM NODE 114.00 TO NODE 108.00 IS CODE = 41 ---------------------------------------------------------------------------- >>>>>COMPUTE PIPE-FLOW TRAVEL TIME THRU SUBAREA<<<<< >>>>>USING USER-SPECIFIED PIPESIZE (EXISTING ELEMENT)<<<<< ============================================================================ REPRESENTATIVE SLOPE = 0.0050 FLOW LENGTH(FEET) = 420.00 MANNING'S N = 0.013 DEPTH OF FLOW IN 18.0 INCH PIPE IS 3.4 INCHES PIPE-FLOW VELOCITY(FEET/SEC.) = 2.46 GIVEN PIPE DIAMETER(INCH) = 18.00 NUMBER OF PIPES = 1 PIPE-FLOW(CFS) = 0.57 PIPE TRAVEL TIME(MIN.) = 2.85 Tc(MIN.) = 15.45 LONGEST FLOWPATH FROM NODE 110.00 TO NODE 108.00 = 740.00 FEET.
**************************************************************************** FLOW PROCESS FROM NODE 108.00 TO NODE 108.00 IS CODE = 1 ---------------------------------------------------------------------------- >>>>>DESIGNATE INDEPENDENT STREAM FOR CONFLUENCE<<<<< ============================================================================ TOTAL NUMBER OF STREAMS = 3 CONFLUENCE VALUES USED FOR INDEPENDENT STREAM 2 ARE: TIME OF CONCENTRATION(MIN.) = 15.45 RAINFALL INTENSITY(INCH/HR) = 4.20 TOTAL STREAM AREA(ACRES) = 0.40 PEAK FLOW RATE(CFS) AT CONFLUENCE = 0.57
**************************************************************************** FLOW PROCESS FROM NODE 120.00 TO NODE 122.00 IS CODE = 21 ----------------------------------------------------------------------------
Page 4

JR100P1H.RES >>>>>RATIONAL METHOD INITIAL SUBAREA ANALYSIS<<<<< ============================================================================ *USER SPECIFIED(SUBAREA): USER-SPECIFIED RUNOFF COEFFICIENT = .8300 S.C.S. CURVE NUMBER (AMC II) = 0 INITIAL SUBAREA FLOW-LENGTH(FEET) = 70.00 UPSTREAM ELEVATION(FEET) = 998.00 DOWNSTREAM ELEVATION(FEET) = 997.20 ELEVATION DIFFERENCE(FEET) = 0.80 SUBAREA OVERLAND TIME OF FLOW(MIN.) = 3.889 100 YEAR RAINFALL INTENSITY(INCH/HOUR) = 8.695 NOTE: RAINFALL INTENSITY IS BASED ON Tc = 5-MINUTE. SUBAREA RUNOFF(CFS) = 0.72 TOTAL AREA(ACRES) = 0.10 TOTAL RUNOFF(CFS) = 0.72
**************************************************************************** FLOW PROCESS FROM NODE 122.00 TO NODE 124.00 IS CODE = 62 ---------------------------------------------------------------------------- >>>>>COMPUTE STREET FLOW TRAVEL TIME THRU SUBAREA<<<<< >>>>>(STREET TABLE SECTION # 1 USED)<<<<< ============================================================================ REPRESENTATIVE SLOPE = 0.0100 STREET LENGTH(FEET) = 130.00 CURB HEIGHT(INCHES) = 8.0 STREET HALFWIDTH(FEET) = 30.00
DISTANCE FROM CROWN TO CROSSFALL GRADEBREAK(FEET) = 20.00 INSIDE STREET CROSSFALL(DECIMAL) = 0.018 OUTSIDE STREET CROSSFALL(DECIMAL) = 0.018
SPECIFIED NUMBER OF HALFSTREETS CARRYING RUNOFF = 1 STREET PARKWAY CROSSFALL(DECIMAL) = 0.020 Manning's FRICTION FACTOR for Streetflow Section(curb-to-curb) = 0.0150 Manning's FRICTION FACTOR for Back-of-Walk Flow Section = 0.0200
**TRAVEL TIME COMPUTED USING ESTIMATED FLOW(CFS) = 1.08 STREETFLOW MODEL RESULTS USING ESTIMATED FLOW: STREET FLOW DEPTH(FEET) = 0.28 HALFSTREET FLOOD WIDTH(FEET) = 6.47 AVERAGE FLOW VELOCITY(FEET/SEC.) = 1.91 PRODUCT OF DEPTH&VELOCITY(FT*FT/SEC.) = 0.53 STREET FLOW TRAVEL TIME(MIN.) = 1.14 Tc(MIN.) = 5.03 100 YEAR RAINFALL INTENSITY(INCH/HOUR) = 8.665 *USER SPECIFIED(SUBAREA): USER-SPECIFIED RUNOFF COEFFICIENT = .8300 S.C.S. CURVE NUMBER (AMC II) = 0 AREA-AVERAGE RUNOFF COEFFICIENT = 0.830 SUBAREA AREA(ACRES) = 0.10 SUBAREA RUNOFF(CFS) = 0.72 TOTAL AREA(ACRES) = 0.2 PEAK FLOW RATE(CFS) = 1.44
END OF SUBAREA STREET FLOW HYDRAULICS: DEPTH(FEET) = 0.30 HALFSTREET FLOOD WIDTH(FEET) = 7.72 FLOW VELOCITY(FEET/SEC.) = 1.98 DEPTH*VELOCITY(FT*FT/SEC.) = 0.60 LONGEST FLOWPATH FROM NODE 120.00 TO NODE 124.00 = 200.00 FEET.
**************************************************************************** FLOW PROCESS FROM NODE 124.00 TO NODE 126.00 IS CODE = 41 ---------------------------------------------------------------------------- >>>>>COMPUTE PIPE-FLOW TRAVEL TIME THRU SUBAREA<<<<< >>>>>USING USER-SPECIFIED PIPESIZE (EXISTING ELEMENT)<<<<< ============================================================================ REPRESENTATIVE SLOPE = 0.0050 FLOW LENGTH(FEET) = 170.00 MANNING'S N = 0.013 DEPTH OF FLOW IN 18.0 INCH PIPE IS 5.4 INCHES
Page 5

JR100P1H.RES PIPE-FLOW VELOCITY(FEET/SEC.) = 3.20 GIVEN PIPE DIAMETER(INCH) = 18.00 NUMBER OF PIPES = 1 PIPE-FLOW(CFS) = 1.44 PIPE TRAVEL TIME(MIN.) = 0.89 Tc(MIN.) = 5.91 LONGEST FLOWPATH FROM NODE 120.00 TO NODE 126.00 = 370.00 FEET.
**************************************************************************** FLOW PROCESS FROM NODE 126.00 TO NODE 126.00 IS CODE = 81 ---------------------------------------------------------------------------- >>>>>ADDITION OF SUBAREA TO MAINLINE PEAK FLOW<<<<< ============================================================================ 100 YEAR RAINFALL INTENSITY(INCH/HOUR) = 7.804 *USER SPECIFIED(SUBAREA): USER-SPECIFIED RUNOFF COEFFICIENT = .6500 S.C.S. CURVE NUMBER (AMC II) = 0 AREA-AVERAGE RUNOFF COEFFICIENT = 0.6777 SUBAREA AREA(ACRES) = 1.10 SUBAREA RUNOFF(CFS) = 5.58 TOTAL AREA(ACRES) = 1.3 TOTAL RUNOFF(CFS) = 6.88 TC(MIN.) = 5.91
+--------------------------------------------------------------------------+ | THE CODE 7 BELOW IS THE DETAINED 100-YR PEAK FLOW AND Tc FROM BMP-3 | | | | | +--------------------------------------------------------------------------+
**************************************************************************** FLOW PROCESS FROM NODE 126.00 TO NODE 126.00 IS CODE = 7 ---------------------------------------------------------------------------- >>>>>USER SPECIFIED HYDROLOGY INFORMATION AT NODE<<<<< ============================================================================ USER-SPECIFIED VALUES ARE AS FOLLOWS: TC(MIN) = 10.71 RAIN INTENSITY(INCH/HOUR) = 5.32 TOTAL AREA(ACRES) = 1.30 TOTAL RUNOFF(CFS) = 2.40
**************************************************************************** FLOW PROCESS FROM NODE 126.00 TO NODE 108.00 IS CODE = 41 ---------------------------------------------------------------------------- >>>>>COMPUTE PIPE-FLOW TRAVEL TIME THRU SUBAREA<<<<< >>>>>USING USER-SPECIFIED PIPESIZE (EXISTING ELEMENT)<<<<< ============================================================================ REPRESENTATIVE SLOPE = 0.0050 FLOW LENGTH(FEET) = 520.00 MANNING'S N = 0.013 DEPTH OF FLOW IN 18.0 INCH PIPE IS 7.1 INCHES PIPE-FLOW VELOCITY(FEET/SEC.) = 3.68 GIVEN PIPE DIAMETER(INCH) = 18.00 NUMBER OF PIPES = 1 PIPE-FLOW(CFS) = 2.40 PIPE TRAVEL TIME(MIN.) = 2.36 Tc(MIN.) = 13.07 LONGEST FLOWPATH FROM NODE 120.00 TO NODE 108.00 = 890.00 FEET.
**************************************************************************** FLOW PROCESS FROM NODE 108.00 TO NODE 108.00 IS CODE = 1 ---------------------------------------------------------------------------- >>>>>DESIGNATE INDEPENDENT STREAM FOR CONFLUENCE<<<<< >>>>>AND COMPUTE VARIOUS CONFLUENCED STREAM VALUES<<<<< ============================================================================ TOTAL NUMBER OF STREAMS = 3 CONFLUENCE VALUES USED FOR INDEPENDENT STREAM 3 ARE: TIME OF CONCENTRATION(MIN.) = 13.07 RAINFALL INTENSITY(INCH/HR) = 4.68 TOTAL STREAM AREA(ACRES) = 1.30 PEAK FLOW RATE(CFS) AT CONFLUENCE = 2.40
Page 6

JR100P1H.RES ** CONFLUENCE DATA ** STREAM RUNOFF Tc INTENSITY AREA NUMBER (CFS) (MIN.) (INCH/HOUR) (ACRE) 1 4.70 11.12 5.192 2.40 2 0.57 15.45 4.201 0.40 3 2.40 13.07 4.679 1.30
RAINFALL INTENSITY AND TIME OF CONCENTRATION RATIO CONFLUENCE FORMULA USED FOR 3 STREAMS.
** PEAK FLOW RATE TABLE ** STREAM RUNOFF Tc INTENSITY NUMBER (CFS) (MIN.) (INCH/HOUR) 1 7.16 11.12 5.192 2 7.12 13.07 4.679 3 6.53 15.45 4.201
COMPUTED CONFLUENCE ESTIMATES ARE AS FOLLOWS: PEAK FLOW RATE(CFS) = 7.16 Tc(MIN.) = 11.12 TOTAL AREA(ACRES) = 4.1 LONGEST FLOWPATH FROM NODE 120.00 TO NODE 108.00 = 890.00 FEET.
**************************************************************************** FLOW PROCESS FROM NODE 108.00 TO NODE 134.00 IS CODE = 41 ---------------------------------------------------------------------------- >>>>>COMPUTE PIPE-FLOW TRAVEL TIME THRU SUBAREA<<<<< >>>>>USING USER-SPECIFIED PIPESIZE (EXISTING ELEMENT)<<<<< ============================================================================ REPRESENTATIVE SLOPE = 0.0050 FLOW LENGTH(FEET) = 50.00 MANNING'S N = 0.013 DEPTH OF FLOW IN 24.0 INCH PIPE IS 11.4 INCHES PIPE-FLOW VELOCITY(FEET/SEC.) = 4.85 GIVEN PIPE DIAMETER(INCH) = 24.00 NUMBER OF PIPES = 1 PIPE-FLOW(CFS) = 7.16 PIPE TRAVEL TIME(MIN.) = 0.17 Tc(MIN.) = 11.29 LONGEST FLOWPATH FROM NODE 120.00 TO NODE 134.00 = 940.00 FEET.
**************************************************************************** FLOW PROCESS FROM NODE 134.00 TO NODE 134.00 IS CODE = 81 ---------------------------------------------------------------------------- >>>>>ADDITION OF SUBAREA TO MAINLINE PEAK FLOW<<<<< ============================================================================ 100 YEAR RAINFALL INTENSITY(INCH/HOUR) = 5.141 *USER SPECIFIED(SUBAREA): USER-SPECIFIED RUNOFF COEFFICIENT = .3000 S.C.S. CURVE NUMBER (AMC II) = 0 AREA-AVERAGE RUNOFF COEFFICIENT = 0.3476 SUBAREA AREA(ACRES) = 0.40 SUBAREA RUNOFF(CFS) = 0.62 TOTAL AREA(ACRES) = 4.5 TOTAL RUNOFF(CFS) = 8.04 TC(MIN.) = 11.29
**************************************************************************** FLOW PROCESS FROM NODE 134.00 TO NODE 135.00 IS CODE = 41 ---------------------------------------------------------------------------- >>>>>COMPUTE PIPE-FLOW TRAVEL TIME THRU SUBAREA<<<<< >>>>>USING USER-SPECIFIED PIPESIZE (EXISTING ELEMENT)<<<<< ============================================================================ REPRESENTATIVE SLOPE = 0.0200 FLOW LENGTH(FEET) = 180.00 MANNING'S N = 0.013 DEPTH OF FLOW IN 24.0 INCH PIPE IS 8.3 INCHES PIPE-FLOW VELOCITY(FEET/SEC.) = 8.32 GIVEN PIPE DIAMETER(INCH) = 24.00 NUMBER OF PIPES = 1 PIPE-FLOW(CFS) = 8.04
Page 7

JR100P1H.RES PIPE TRAVEL TIME(MIN.) = 0.36 Tc(MIN.) = 11.65 LONGEST FLOWPATH FROM NODE 120.00 TO NODE 135.00 = 1120.00 FEET.
**************************************************************************** FLOW PROCESS FROM NODE 135.00 TO NODE 135.00 IS CODE = 1 ---------------------------------------------------------------------------- >>>>>DESIGNATE INDEPENDENT STREAM FOR CONFLUENCE<<<<< ============================================================================ TOTAL NUMBER OF STREAMS = 2 CONFLUENCE VALUES USED FOR INDEPENDENT STREAM 1 ARE: TIME OF CONCENTRATION(MIN.) = 11.65 RAINFALL INTENSITY(INCH/HR) = 5.04 TOTAL STREAM AREA(ACRES) = 4.50 PEAK FLOW RATE(CFS) AT CONFLUENCE = 8.04
**************************************************************************** FLOW PROCESS FROM NODE 140.00 TO NODE 142.00 IS CODE = 21 ---------------------------------------------------------------------------- >>>>>RATIONAL METHOD INITIAL SUBAREA ANALYSIS<<<<< ============================================================================ *USER SPECIFIED(SUBAREA): USER-SPECIFIED RUNOFF COEFFICIENT = .8300 S.C.S. CURVE NUMBER (AMC II) = 0 INITIAL SUBAREA FLOW-LENGTH(FEET) = 100.00 UPSTREAM ELEVATION(FEET) = 992.00 DOWNSTREAM ELEVATION(FEET) = 985.00 ELEVATION DIFFERENCE(FEET) = 7.00 SUBAREA OVERLAND TIME OF FLOW(MIN.) = 2.541 100 YEAR RAINFALL INTENSITY(INCH/HOUR) = 8.695 NOTE: RAINFALL INTENSITY IS BASED ON Tc = 5-MINUTE. SUBAREA RUNOFF(CFS) = 0.72 TOTAL AREA(ACRES) = 0.10 TOTAL RUNOFF(CFS) = 0.72
**************************************************************************** FLOW PROCESS FROM NODE 142.00 TO NODE 144.00 IS CODE = 62 ---------------------------------------------------------------------------- >>>>>COMPUTE STREET FLOW TRAVEL TIME THRU SUBAREA<<<<< >>>>>(STREET TABLE SECTION # 1 USED)<<<<< ============================================================================ REPRESENTATIVE SLOPE = 0.0500 STREET LENGTH(FEET) = 300.00 CURB HEIGHT(INCHES) = 8.0 STREET HALFWIDTH(FEET) = 30.00
DISTANCE FROM CROWN TO CROSSFALL GRADEBREAK(FEET) = 20.00 INSIDE STREET CROSSFALL(DECIMAL) = 0.018 OUTSIDE STREET CROSSFALL(DECIMAL) = 0.018
SPECIFIED NUMBER OF HALFSTREETS CARRYING RUNOFF = 1 STREET PARKWAY CROSSFALL(DECIMAL) = 0.020 Manning's FRICTION FACTOR for Streetflow Section(curb-to-curb) = 0.0150 Manning's FRICTION FACTOR for Back-of-Walk Flow Section = 0.0200
**TRAVEL TIME COMPUTED USING ESTIMATED FLOW(CFS) = 1.44 STREETFLOW MODEL RESULTS USING ESTIMATED FLOW: STREET FLOW DEPTH(FEET) = 0.24 HALFSTREET FLOOD WIDTH(FEET) = 4.28 AVERAGE FLOW VELOCITY(FEET/SEC.) = 4.04 PRODUCT OF DEPTH&VELOCITY(FT*FT/SEC.) = 0.96 STREET FLOW TRAVEL TIME(MIN.) = 1.24 Tc(MIN.) = 3.78 100 YEAR RAINFALL INTENSITY(INCH/HOUR) = 8.695 NOTE: RAINFALL INTENSITY IS BASED ON Tc = 5-MINUTE. *USER SPECIFIED(SUBAREA): USER-SPECIFIED RUNOFF COEFFICIENT = .8300
Page 8

JR100P1H.RES S.C.S. CURVE NUMBER (AMC II) = 0 AREA-AVERAGE RUNOFF COEFFICIENT = 0.830 SUBAREA AREA(ACRES) = 0.20 SUBAREA RUNOFF(CFS) = 1.44 TOTAL AREA(ACRES) = 0.3 PEAK FLOW RATE(CFS) = 2.16
END OF SUBAREA STREET FLOW HYDRAULICS: DEPTH(FEET) = 0.27 HALFSTREET FLOOD WIDTH(FEET) = 6.03 FLOW VELOCITY(FEET/SEC.) = 4.17 DEPTH*VELOCITY(FT*FT/SEC.) = 1.13 LONGEST FLOWPATH FROM NODE 140.00 TO NODE 144.00 = 400.00 FEET.
**************************************************************************** FLOW PROCESS FROM NODE 144.00 TO NODE 146.00 IS CODE = 41 ---------------------------------------------------------------------------- >>>>>COMPUTE PIPE-FLOW TRAVEL TIME THRU SUBAREA<<<<< >>>>>USING USER-SPECIFIED PIPESIZE (EXISTING ELEMENT)<<<<< ============================================================================ REPRESENTATIVE SLOPE = 0.0050 FLOW LENGTH(FEET) = 480.00 MANNING'S N = 0.013 DEPTH OF FLOW IN 18.0 INCH PIPE IS 6.7 INCHES PIPE-FLOW VELOCITY(FEET/SEC.) = 3.58 GIVEN PIPE DIAMETER(INCH) = 18.00 NUMBER OF PIPES = 1 PIPE-FLOW(CFS) = 2.16 PIPE TRAVEL TIME(MIN.) = 2.24 Tc(MIN.) = 6.02 LONGEST FLOWPATH FROM NODE 140.00 TO NODE 146.00 = 880.00 FEET.
**************************************************************************** FLOW PROCESS FROM NODE 146.00 TO NODE 146.00 IS CODE = 81 ---------------------------------------------------------------------------- >>>>>ADDITION OF SUBAREA TO MAINLINE PEAK FLOW<<<<< ============================================================================ 100 YEAR RAINFALL INTENSITY(INCH/HOUR) = 7.718 *USER SPECIFIED(SUBAREA): USER-SPECIFIED RUNOFF COEFFICIENT = .9000 S.C.S. CURVE NUMBER (AMC II) = 0 AREA-AVERAGE RUNOFF COEFFICIENT = 0.8940 SUBAREA AREA(ACRES) = 3.20 SUBAREA RUNOFF(CFS) = 22.23 TOTAL AREA(ACRES) = 3.5 TOTAL RUNOFF(CFS) = 24.15 TC(MIN.) = 6.02
+--------------------------------------------------------------------------+ | THE CODE 7 BELOW IS THE DETAINED 100-YR PEAK FLOW AND Tc FROM BMP-1 | | | | | +--------------------------------------------------------------------------+
**************************************************************************** FLOW PROCESS FROM NODE 146.00 TO NODE 146.00 IS CODE = 7 ---------------------------------------------------------------------------- >>>>>USER SPECIFIED HYDROLOGY INFORMATION AT NODE<<<<< ============================================================================ USER-SPECIFIED VALUES ARE AS FOLLOWS: TC(MIN) = 10.80 RAIN INTENSITY(INCH/HOUR) = 5.29 TOTAL AREA(ACRES) = 3.50 TOTAL RUNOFF(CFS) = 7.30
**************************************************************************** FLOW PROCESS FROM NODE 146.00 TO NODE 135.00 IS CODE = 41 ---------------------------------------------------------------------------- >>>>>COMPUTE PIPE-FLOW TRAVEL TIME THRU SUBAREA<<<<< >>>>>USING USER-SPECIFIED PIPESIZE (EXISTING ELEMENT)<<<<< ============================================================================ REPRESENTATIVE SLOPE = 0.0050 FLOW LENGTH(FEET) = 60.00 MANNING'S N = 0.013 DEPTH OF FLOW IN 24.0 INCH PIPE IS 11.5 INCHES
Page 9

JR100P1H.RES PIPE-FLOW VELOCITY(FEET/SEC.) = 4.88 GIVEN PIPE DIAMETER(INCH) = 24.00 NUMBER OF PIPES = 1 PIPE-FLOW(CFS) = 7.30 PIPE TRAVEL TIME(MIN.) = 0.20 Tc(MIN.) = 11.00 LONGEST FLOWPATH FROM NODE 140.00 TO NODE 135.00 = 940.00 FEET.
**************************************************************************** FLOW PROCESS FROM NODE 135.00 TO NODE 135.00 IS CODE = 1 ---------------------------------------------------------------------------- >>>>>DESIGNATE INDEPENDENT STREAM FOR CONFLUENCE<<<<< >>>>>AND COMPUTE VARIOUS CONFLUENCED STREAM VALUES<<<<< ============================================================================ TOTAL NUMBER OF STREAMS = 2 CONFLUENCE VALUES USED FOR INDEPENDENT STREAM 2 ARE: TIME OF CONCENTRATION(MIN.) = 11.00 RAINFALL INTENSITY(INCH/HR) = 5.23 TOTAL STREAM AREA(ACRES) = 3.50 PEAK FLOW RATE(CFS) AT CONFLUENCE = 7.30
** CONFLUENCE DATA ** STREAM RUNOFF Tc INTENSITY AREA NUMBER (CFS) (MIN.) (INCH/HOUR) (ACRE) 1 8.04 11.65 5.038 4.50 2 7.30 11.00 5.227 3.50
RAINFALL INTENSITY AND TIME OF CONCENTRATION RATIO CONFLUENCE FORMULA USED FOR 2 STREAMS.
** PEAK FLOW RATE TABLE ** STREAM RUNOFF Tc INTENSITY NUMBER (CFS) (MIN.) (INCH/HOUR) 1 15.05 11.00 5.227 2 15.08 11.65 5.038
COMPUTED CONFLUENCE ESTIMATES ARE AS FOLLOWS: PEAK FLOW RATE(CFS) = 15.08 Tc(MIN.) = 11.65 TOTAL AREA(ACRES) = 8.0 LONGEST FLOWPATH FROM NODE 120.00 TO NODE 135.00 = 1120.00 FEET.
**************************************************************************** FLOW PROCESS FROM NODE 135.00 TO NODE 150.00 IS CODE = 41 ---------------------------------------------------------------------------- >>>>>COMPUTE PIPE-FLOW TRAVEL TIME THRU SUBAREA<<<<< >>>>>USING USER-SPECIFIED PIPESIZE (EXISTING ELEMENT)<<<<< ============================================================================ REPRESENTATIVE SLOPE = 0.0050 FLOW LENGTH(FEET) = 420.00 MANNING'S N = 0.013 DEPTH OF FLOW IN 30.0 INCH PIPE IS 15.6 INCHES PIPE-FLOW VELOCITY(FEET/SEC.) = 5.85 GIVEN PIPE DIAMETER(INCH) = 30.00 NUMBER OF PIPES = 1 PIPE-FLOW(CFS) = 15.08 PIPE TRAVEL TIME(MIN.) = 1.20 Tc(MIN.) = 12.85 LONGEST FLOWPATH FROM NODE 120.00 TO NODE 150.00 = 1540.00 FEET.
**************************************************************************** FLOW PROCESS FROM NODE 150.00 TO NODE 150.00 IS CODE = 81 ---------------------------------------------------------------------------- >>>>>ADDITION OF SUBAREA TO MAINLINE PEAK FLOW<<<<< ============================================================================ 100 YEAR RAINFALL INTENSITY(INCH/HOUR) = 4.730 *USER SPECIFIED(SUBAREA): USER-SPECIFIED RUNOFF COEFFICIENT = .3000 S.C.S. CURVE NUMBER (AMC II) = 0
Page 10

JR100P1H.RES AREA-AVERAGE RUNOFF COEFFICIENT = 0.3625 SUBAREA AREA(ACRES) = 0.70 SUBAREA RUNOFF(CFS) = 0.99 TOTAL AREA(ACRES) = 8.7 TOTAL RUNOFF(CFS) = 15.08 TC(MIN.) = 12.85 NOTE: PEAK FLOW RATE DEFAULTED TO UPSTREAM VALUE
+--------------------------------------------------------------------------+ | NODE 150 REPRESENTS THE SINGLE PROPOSED OUTFALL FOR THE PROJECT SITE | | NODE 160 REPRESENTS THE FILL SLOPE ALONG THE WESTERN PERIMETER OF THE | | PROJECT SITE | +--------------------------------------------------------------------------+
**************************************************************************** FLOW PROCESS FROM NODE 160.10 TO NODE 160.20 IS CODE = 21 ---------------------------------------------------------------------------- >>>>>RATIONAL METHOD INITIAL SUBAREA ANALYSIS<<<<< ============================================================================ *USER SPECIFIED(SUBAREA): USER-SPECIFIED RUNOFF COEFFICIENT = .3000 S.C.S. CURVE NUMBER (AMC II) = 0 INITIAL SUBAREA FLOW-LENGTH(FEET) = 45.00 UPSTREAM ELEVATION(FEET) = 969.67 DOWNSTREAM ELEVATION(FEET) = 950.00 ELEVATION DIFFERENCE(FEET) = 19.67 SUBAREA OVERLAND TIME OF FLOW(MIN.) = 4.484 WARNING: THE MAXIMUM OVERLAND FLOW SLOPE, 10.%, IS USED IN Tc CALCULATION! 100 YEAR RAINFALL INTENSITY(INCH/HOUR) = 8.695 NOTE: RAINFALL INTENSITY IS BASED ON Tc = 5-MINUTE. SUBAREA RUNOFF(CFS) = 0.26 TOTAL AREA(ACRES) = 0.10 TOTAL RUNOFF(CFS) = 0.26
**************************************************************************** FLOW PROCESS FROM NODE 106.20 TO NODE 160.00 IS CODE = 51 ---------------------------------------------------------------------------- >>>>>COMPUTE TRAPEZOIDAL CHANNEL FLOW<<<<< >>>>>TRAVELTIME THRU SUBAREA (EXISTING ELEMENT)<<<<< ============================================================================ CHANNEL LENGTH THRU SUBAREA(FEET) = 45.00 REPRESENTATIVE CHANNEL SLOPE = 0.5000 CHANNEL BASE(FEET) = 5.00 "Z" FACTOR = 20.000 MANNING'S FACTOR = 0.030 MAXIMUM DEPTH(FEET) = 0.50 100 YEAR RAINFALL INTENSITY(INCH/HOUR) = 8.695 NOTE: RAINFALL INTENSITY IS BASED ON Tc = 5-MINUTE. *USER SPECIFIED(SUBAREA): USER-SPECIFIED RUNOFF COEFFICIENT = .3000 S.C.S. CURVE NUMBER (AMC II) = 0 TRAVEL TIME COMPUTED USING ESTIMATED FLOW(CFS) = 1.70 TRAVEL TIME THRU SUBAREA BASED ON VELOCITY(FEET/SEC.) = 4.73 AVERAGE FLOW DEPTH(FEET) = 0.06 TRAVEL TIME(MIN.) = 0.16 Tc(MIN.) = 4.64 SUBAREA AREA(ACRES) = 1.10 SUBAREA RUNOFF(CFS) = 2.87 AREA-AVERAGE RUNOFF COEFFICIENT = 0.300 TOTAL AREA(ACRES) = 1.2 PEAK FLOW RATE(CFS) = 3.13
END OF SUBAREA CHANNEL FLOW HYDRAULICS: DEPTH(FEET) = 0.08 FLOW VELOCITY(FEET/SEC.) = 5.83 LONGEST FLOWPATH FROM NODE 160.10 TO NODE 160.00 = 90.00 FEET. ============================================================================ END OF STUDY SUMMARY: TOTAL AREA(ACRES) = 1.2 TC(MIN.) = 4.64 PEAK FLOW RATE(CFS) = 3.13 ============================================================================ ============================================================================
Page 11

JR100P1H.RES END OF RATIONAL METHOD ANALYSIS
�
Page 12

Jamul Retail Center
J-18145
10/9/2018
P6 (in) 3.3 (100-Yr, 6-Hr)
At Node
Let: Q1 (cfs) 3.13
T1 (min) 4.64 (Sheet flow to POI 2)
I1 (in/hr) 9.1239
Q2 (cfs) 15.10 (Flow to POI 1 - Outfall)
T2 (min) 12.85
I2 (in/hr) 4.7298
Then: QT1 (cfs) 8.58
QT2 (cfs) 16.72
Final Results: (Choosing the largest Q and the associated Tc)
QT (cfs) 16.72 Total Site Peak Discharge Rate
Tc (min) 12.85
Confluence Analysis - Post-Project Detained Condition
The purpose of this sheet is to provide the confluenced Q for 2 streams, based on the 2003 County of
San Diego hydrology criteria.
Total Site
J:\18145_Jamul_Project\WaterResources\Hydrology\RationalMethod\Hydrology_Confluence_Analysis_CountyofS
D_TotalSite.xls

APPENDIX A4
AES Analysis Back-Up

Hydrologic Soil Group—San Diego County Area, California(Jamul Retail Center)
Natural ResourcesConservation Service
Web Soil SurveyNational Cooperative Soil Survey
2/5/2018Page 1 of 4
3619
960
3620
020
3620
080
3620
140
3620
200
3620
260
3620
320
3620
380
3620
440
3619
960
3620
020
3620
080
3620
140
3620
200
3620
260
3620
320
3620
380
3620
440
511390 511450 511510 511570 511630 511690 511750
511390 511450 511510 511570 511630 511690 511750
32° 43' 18'' N11
6° 5
2' 4
2'' W
32° 43' 18'' N
116°
52'
28'
' W
32° 43' 2'' N
116°
52'
42'
' W
32° 43' 2'' N
116°
52'
28'
' W
N
Map projection: Web Mercator Corner coordinates: WGS84 Edge tics: UTM Zone 11N WGS840 100 200 400 600
Feet0 35 70 140 210
MetersMap Scale: 1:2,450 if printed on A portrait (8.5" x 11") sheet.
Soil Map may not be valid at this scale.

MAP LEGEND MAP INFORMATION
Area of Interest (AOI)Area of Interest (AOI)
SoilsSoil Rating Polygons
A
A/D
B
B/D
C
C/D
D
Not rated or not available
Soil Rating LinesA
A/D
B
B/D
C
C/D
D
Not rated or not available
Soil Rating PointsA
A/D
B
B/D
C
C/D
D
Not rated or not available
Water FeaturesStreams and Canals
TransportationRails
Interstate Highways
US Routes
Major Roads
Local Roads
BackgroundAerial Photography
The soil surveys that comprise your AOI were mapped at 1:24,000.
Warning: Soil Map may not be valid at this scale.
Enlargement of maps beyond the scale of mapping can cause misunderstanding of the detail of mapping and accuracy of soil line placement. The maps do not show the small areas of contrasting soils that could have been shown at a more detailed scale.
Please rely on the bar scale on each map sheet for map measurements.
Source of Map: Natural Resources Conservation ServiceWeb Soil Survey URL: Coordinate System: Web Mercator (EPSG:3857)
Maps from the Web Soil Survey are based on the Web Mercator projection, which preserves direction and shape but distorts distance and area. A projection that preserves area, such as the Albers equal-area conic projection, should be used if more accurate calculations of distance or area are required.
This product is generated from the USDA-NRCS certified data as of the version date(s) listed below.
Soil Survey Area: San Diego County Area, CaliforniaSurvey Area Data: Version 12, Sep 13, 2017
Soil map units are labeled (as space allows) for map scales 1:50,000 or larger.
Date(s) aerial images were photographed: Dec 31, 2009—Mar 11, 2017
The orthophoto or other base map on which the soil lines were compiled and digitized probably differs from the background imagery displayed on these maps. As a result, some minor shifting of map unit boundaries may be evident.
Hydrologic Soil Group—San Diego County Area, California(Jamul Retail Center)
Natural ResourcesConservation Service
Web Soil SurveyNational Cooperative Soil Survey
2/5/2018Page 2 of 4

Hydrologic Soil Group
Map unit symbol Map unit name Rating Acres in AOI Percent of AOI
CmrG Cieneba very rocky coarse sandy loam, 30 to 75 percent slopes
D 4.4 16.8%
FaC2 Fallbrook sandy loam, 5 to 9 percent slopes, eroded
C 3.4 13.1%
FaE2 Fallbrook sandy loam, 15 to 30 percent slopes, eroded
C 0.3 1.0%
PeD2 Placentia sandy loam, 9 to 15 percent slopes, eroded
D 0.9 3.3%
PfC Placentia sandy loam, thick surface, 2 to 9 percent slo pes
D 0.0 0.1%
RaC2 Ramona sandy loam, 5 to 9 percent slopes, eroded
C 12.2 46.9%
RaD2 Ramona sandy loam, 9 to 15 percent slopes, eroded
C 4.9 18.7%
Totals for Area of Interest 26.0 100.0%
Hydrologic Soil Group—San Diego County Area, California Jamul Retail Center
Natural ResourcesConservation Service
Web Soil SurveyNational Cooperative Soil Survey
2/5/2018Page 3 of 4

Description
Hydrologic soil groups are based on estimates of runoff potential. Soils are assigned to one of four groups according to the rate of water infiltration when the soils are not protected by vegetation, are thoroughly wet, and receive precipitation from long-duration storms.
The soils in the United States are assigned to four groups (A, B, C, and D) and three dual classes (A/D, B/D, and C/D). The groups are defined as follows:
Group A. Soils having a high infiltration rate (low runoff potential) when thoroughly wet. These consist mainly of deep, well drained to excessively drained sands or gravelly sands. These soils have a high rate of water transmission.
Group B. Soils having a moderate infiltration rate when thoroughly wet. These consist chiefly of moderately deep or deep, moderately well drained or well drained soils that have moderately fine texture to moderately coarse texture. These soils have a moderate rate of water transmission.
Group C. Soils having a slow infiltration rate when thoroughly wet. These consist chiefly of soils having a layer that impedes the downward movement of water or soils of moderately fine texture or fine texture. These soils have a slow rate of water transmission.
Group D. Soils having a very slow infiltration rate (high runoff potential) when thoroughly wet. These consist chiefly of clays that have a high shrink-swell potential, soils that have a high water table, soils that have a claypan or clay layer at or near the surface, and soils that are shallow over nearly impervious material. These soils have a very slow rate of water transmission.
If a soil is assigned to a dual hydrologic group (A/D, B/D, or C/D), the first letter is for drained areas and the second is for undrained areas. Only the soils that in their natural condition are in group D are assigned to dual classes.
Rating Options
Aggregation Method: Dominant Condition
Component Percent Cutoff: None Specified
Tie-break Rule: Higher
Hydrologic Soil Group—San Diego County Area, California Jamul Retail Center
Natural ResourcesConservation Service
Web Soil SurveyNational Cooperative Soil Survey
2/5/2018Page 4 of 4


APPENDIX B
Preliminary Storm Drain Sizing Calculations

Jamul Retail Center181457-10-2018
J:\18145_Jamul_Project\WaterResources\Hydraulics\Pipeflow\18145_Hydraulics_Storm_Drain_Sizing.xls
Manning's n: 0.013
Sizing Factor (%): 30
Slope at:
Q100
(cfs1)Pipe Segment
(Node to Node)
Q100 with Sizing Factor(cfs1)
Minimum Pipe Size2
(feet)
Recommended Pipe Size(inches)
Minimum Pipe Size2
(feet)
Recommended Pipe Size(inches)
Minimum Pipe Size 2
(feet)
Recommended Pipe Size(inches)
Minimum Pipe Size2
(feet)
Recommended Pipe Size(inches)
1.4 104 to 106 1.9 0.89 12" 0.78 10" 0.69 10" 0.64 8"4.7 106 to 108 6.1 1.39 18" 1.22 18" 1.07 18" 1.00 12"0.6 114 to 108 0.8 0.64 8" 0.57 8" 0.50 6" 0.46 6"1.4 124 to 126 1.8 0.88 12" 0.78 10" 0.68 10" 0.63 8"2.4 126 to 108 3.1 1.08 18" 0.95 12" 0.83 10" 0.77 10"7.2 108 to 134 9.4 1.63 24" 1.44 18" 1.26 18" 1.17 18"8.0 134 to 135 10.4 1.70 24" 1.49 18" 1.31 18" 1.21 18"2.2 144 to 146 2.9 1.05 18" 0.92 12" 0.81 10" 0.75 10"7.3 146 to 135 9.5 1.64 24" 1.44 18" 1.27 18" 1.17 18"14.9 135 to 150 19.4 2.15 30" 1.89 24" 1.66 24" 1.53 24"
Note:1. "cfs" = cubic feet per second.2. Minimum pipe sizes are calculated using the Manning's equation and are based on the flow rates with 30% factor.
Preliminary Storm Drain Size
3.0%
The purpose of this table is to provide an estimated pipe size to convey the 100-year flow rates with a sizing factor.
0.5% 1.0% 2.0%

Hydraulic Analysis ReportProject Data Project Title: 18145 Jamul
Designer: BWC
Project Date: Friday, July 06, 2018
Project Units: U.S. Customary Units
Notes:
Channel Analysis: Pipe 104 to 106 Notes:
Input Parameters Channel Type: Circular
Pipe Diameter: 1.5000 (ft)
Longitudinal Slope: 0.0050 (ft/ft)
Manning's n: 0.0130
Flow: 1.4000 (cfs)
Result Parameters Depth: 0.4412 (ft)
Area of Flow: 0.4338 (ft^2)
Wetted Perimeter: 1.7197 (ft)
Hydraulic Radius: 0.2523 (ft)
Average Velocity: 3.2272 (ft/s)
Top Width: 1.3670 (ft)
Froude Number: 1.0095
Critical Depth: 0.4435 (ft)
Critical Velocity: 3.2041 (ft/s)
Critical Slope: 0.0049 (ft/ft)
Critical Top Width: 1.3690 (ft)
Calculated Max Shear Stress: 0.1377 (lb/ft^2)
Calculated Avg Shear Stress: 0.0787 (lb/ft^2)

Channel Analysis: Pipe 124 to 126 Notes:
Input Parameters Channel Type: Circular
Pipe Diameter: 1.5000 (ft)
Longitudinal Slope: 0.0050 (ft/ft)
Manning's n: 0.0130
Flow: 1.4000 (cfs)
Result Parameters Depth: 0.4412 (ft)
Area of Flow: 0.4338 (ft^2)
Wetted Perimeter: 1.7197 (ft)
Hydraulic Radius: 0.2523 (ft)
Average Velocity: 3.2272 (ft/s)
Top Width: 1.3670 (ft)
Froude Number: 1.0095
Critical Depth: 0.4435 (ft)
Critical Velocity: 3.2041 (ft/s)
Critical Slope: 0.0049 (ft/ft)
Critical Top Width: 1.3690 (ft)
Calculated Max Shear Stress: 0.1377 (lb/ft^2)
Calculated Avg Shear Stress: 0.0787 (lb/ft^2)

Channel Analysis: Pipe 144 to 146 Notes:
Input Parameters Channel Type: Circular
Pipe Diameter: 1.5000 (ft)
Longitudinal Slope: 0.0050 (ft/ft)
Manning's n: 0.0130
Flow: 2.2000 (cfs)
Result Parameters Depth: 0.5595 (ft)
Area of Flow: 0.6009 (ft^2)
Wetted Perimeter: 1.9710 (ft)
Hydraulic Radius: 0.3049 (ft)
Average Velocity: 3.6611 (ft/s)
Top Width: 1.4508 (ft)
Froude Number: 1.0025
Critical Depth: 0.5603 (ft)
Critical Velocity: 3.6539 (ft/s)
Critical Slope: 0.0050 (ft/ft)
Critical Top Width: 1.4512 (ft)
Calculated Max Shear Stress: 0.1746 (lb/ft^2)
Calculated Avg Shear Stress: 0.0951 (lb/ft^2)

Channel Analysis: Pipe 135 to 150 Notes:
Input Parameters Channel Type: Circular
Pipe Diameter: 2.5000 (ft)
Longitudinal Slope: 0.0050 (ft/ft)
Manning's n: 0.0130
Flow: 14.9000 (cfs)
Result Parameters Depth: 1.2702 (ft)
Area of Flow: 2.5049 (ft^2)
Wetted Perimeter: 3.9674 (ft)
Hydraulic Radius: 0.6314 (ft)
Average Velocity: 5.9484 (ft/s)
Top Width: 2.4997 (ft)
Froude Number: 1.0472
Critical Depth: 1.3013 (ft)
Critical Velocity: 5.7696 (ft/s)
Critical Slope: 0.0046 (ft/ft)
Critical Top Width: 2.4979 (ft)
Calculated Max Shear Stress: 0.3963 (lb/ft^2)
Calculated Avg Shear Stress: 0.1970 (lb/ft^2)

APPENDIX C
Preliminary Detention Analysis


JR_B1P1H.OUT1***************************************** *************************************** * * * * * FLOOD HYDROGRAPH PACKAGE (HEC-1) * * U.S. ARMY CORPS OF ENGINEERS * * JUN 1998 * * HYDROLOGIC ENGINEERING CENTER * * VERSION 4.1 * * 609 SECOND STREET * * * * DAVIS, CALIFORNIA 95616 * * RUN DATE 06JUL18 TIME 09:18:35 * * (916) 756-1104 * * * * * ***************************************** ***************************************
X X XXXXXXX XXXXX X X X X X X XX X X X X X XXXXXXX XXXX X XXXXX X X X X X X X X X X X X X X XXXXXXX XXXXX XXX
THIS PROGRAM REPLACES ALL PREVIOUS VERSIONS OF HEC-1 KNOWN AS HEC1 (JAN 73), HEC1GS, HEC1DB, AND HEC1KW.
THE DEFINITIONS OF VARIABLES -RTIMP- AND -RTIOR- HAVE CHANGED FROM THOSE USED WITH THE 1973-STYLE INPUT STRUCTURE. THE DEFINITION OF -AMSKK- ON RM-CARD WAS CHANGED WITH REVISIONS DATED 28 SEP 81. THIS IS THE FORTRAN77 VERSION NEW OPTIONS: DAMBREAK OUTFLOW SUBMERGENCE , SINGLE EVENT DAMAGE CALCULATION, DSS:WRITE STAGE FREQUENCY, DSS:READ TIME SERIES AT DESIRED CALCULATION INTERVAL LOSS RATE:GREEN AND AMPT INFILTRATION KINEMATIC WAVE: NEW FINITE DIFFERENCE ALGORITHM
1 HEC-1 INPUT PAGE 1
LINE ID.......1.......2.......3.......4.......5.......6.......7.......8.......9......10
*** FREE *** *DIAGRAM 1 ID JAMUL RETAIL CENTER, J-18145 BIOFILTRATION BASIN, BMP-1 2 ID 100-YEAR DETENTION ANALYSES - PRELIMINARY ENGINEERING 3 ID FEBRUARY 14, 2018 - FILE NAME: JR_B1P1H.HC1 4 IT 1 01JAN90 1200 1000 5 IO 5 0 6 KKBMP1_RatHydro_rev.hc1 7 KM RUN DATE 7/5/2018 8 KM RATIONAL METHOD HYDROGRAPH PROGRAM 9 KM COPYRIGHT 1992, 2014, RICK ENGINEERING COMPANY 10 KM 6HR RAINFALL IS 3.3 INCHES 11 KM RATIONAL METHOD RUNOFF COEFFICIENT IS 0.89 12 KM RATIONAL METHOD TIME OF CONCENTRATION IS 6 MIN. 13 KM FOR THIS DATA TO RUN PROPERLY THIS IT CARD MUST BE ADDED TO YOUR HEC-1 14 KM IT 2 01JAN90 1200 200 15 BA 0.0055 16 IN 6 01JAN90 1157 17 QI 0 0.6 0.6 0.6 0.6 0.7 0.7 0.7 0.7 0.7 18 QI 0.7 0.7 0.7 0.8 0.8 0.8 0.8 0.9 0.9 0.9 19 QI 0.9 1 1 1 1.1 1.1 1.1 1.2 1.3 1.3 20 QI 1.4 1.5 1.6 1.8 1.9 2.2 2.3 2.9 3.2 4.8 21 QI 6.7 24.1 3.8 2.6 2 1.7 1.5 1.3 1.2 1.1 22 QI 1 0.9 0.9 0.8 0.8 0.8 0.7 0.7 0.7 0.6 23 QI 0.6 0 0 0 0 0 0 0 0 0 24 QI 0 0 25 KK DETAIN 26 KO 0 0 0 0 21 27 RS 1 STOR -1 28 SV 0 0.3 29 SQ 0 7.3 30 SE 100 101 31 ZZ 1 SCHEMATIC DIAGRAM OF STREAM NETWORK INPUT LINE (V) ROUTING (--->) DIVERSION OR PUMP FLOW
NO. (.) CONNECTOR (<---) RETURN OF DIVERTED OR PUMPED FLOW
6 BMP1_Rat V V 25 DETAIN
(***) RUNOFF ALSO COMPUTED AT THIS LOCATION1***************************************** *************************************** * * * * * FLOOD HYDROGRAPH PACKAGE (HEC-1) * * U.S. ARMY CORPS OF ENGINEERS * * JUN 1998 * * HYDROLOGIC ENGINEERING CENTER * * VERSION 4.1 * * 609 SECOND STREET * * * * DAVIS, CALIFORNIA 95616 * * RUN DATE 06JUL18 TIME 09:18:35 * * (916) 756-1104 * * * * * ***************************************** ***************************************
Page 1

JR_B1P1H.OUT
JAMUL RETAIL CENTER, J-18145 BIOFILTRATION BASIN, BMP-1 100-YEAR DETENTION ANALYSES - PRELIMINARY ENGINEERING FEBRUARY 14, 2018 - FILE NAME: JR_B1P1H.HC1
5 IO OUTPUT CONTROL VARIABLES IPRNT 5 PRINT CONTROL IPLOT 0 PLOT CONTROL QSCAL 0. HYDROGRAPH PLOT SCALE
IT HYDROGRAPH TIME DATA NMIN 1 MINUTES IN COMPUTATION INTERVAL IDATE 1JAN90 STARTING DATE ITIME 1200 STARTING TIME NQ 1000 NUMBER OF HYDROGRAPH ORDINATES NDDATE 2JAN90 ENDING DATE NDTIME 0439 ENDING TIME ICENT 19 CENTURY MARK
COMPUTATION INTERVAL .02 HOURS TOTAL TIME BASE 16.65 HOURS
ENGLISH UNITS DRAINAGE AREA SQUARE MILES PRECIPITATION DEPTH INCHES LENGTH, ELEVATION FEET FLOW CUBIC FEET PER SECOND STORAGE VOLUME ACRE-FEET SURFACE AREA ACRES TEMPERATURE DEGREES FAHRENHEIT
*** *** *** *** *** *** *** *** *** *** *** *** *** *** *** *** *** *** *** *** *** *** *** *** *** *** *** *** *** *** *** *** ***
************** * * 25 KK * DETAIN * * * **************
26 KO OUTPUT CONTROL VARIABLES IPRNT 5 PRINT CONTROL IPLOT 0 PLOT CONTROL QSCAL 0. HYDROGRAPH PLOT SCALE IPNCH 0 PUNCH COMPUTED HYDROGRAPH IOUT 21 SAVE HYDROGRAPH ON THIS UNIT ISAV1 1 FIRST ORDINATE PUNCHED OR SAVED ISAV2 1000 LAST ORDINATE PUNCHED OR SAVED TIMINT .017 TIME INTERVAL IN HOURS
1 RUNOFF SUMMARY FLOW IN CUBIC FEET PER SECOND TIME IN HOURS, AREA IN SQUARE MILES
PEAK TIME OF AVERAGE FLOW FOR MAXIMUM PERIOD BASIN MAXIMUM TIME OF OPERATION STATION FLOW PEAK AREA STAGE MAX STAGE+ 6-HOUR 24-HOUR 72-HOUR
HYDROGRAPH AT+ BMP1_Rat 24. 4.05 2. 1. 1. .01
ROUTED TO+ DETAIN 7. 4.13 2. 1. 1. .01+ 100.94 4.13
*** NORMAL END OF HEC-1 ***
Page 2

TAPE21.out DETAIN 11200 1JAN90 0 1 11000 .005 .300 .302 .307 .315 .324 .333 .342 .350 .359 .367 .374 .382 .389 .396 .403 .409 .415 .421 .427 .433 .439 .444 .449 .455 .461 .468 .475 .482 .489 .496 .503 .509 .515 .521 .527 .533 .539 .544 .549 .554 .559 .563 .568 .572 .577 .581 .585 .588 .592 .596 .599 .602 .606 .609 .612 .615 .617 .620 .623 .625 .628 .630 .632 .635 .637 .639 .641 .643 .645 .647 .649 .651 .654 .658 .661 .666 .670 .674 .679 .683 .686 .690 .694 .697 .701 .704 .707 .710 .713 .716 .719 .721 .724 .727 .729 .732 .736 .740 .744 .749 .754 .759 .764 .768 .773 .777 .781 .785 .789 .792 .796 .799 .803 .806 .809 .812 .815 .818 .821 .824 .828 .832 .837 .842 .847 .852 .857 .862 .866 .871 .875 .879 .883 .887 .891 .894 .898 .902 .907 .912 .917 .923 .929 .934 .940 .945 .950 .955 .960 .965 .969 .973 .978 .982 .986 .990 .995 1.001 1.006 1.013 1.019 1.026 1.033 1.040 1.048 1.056 1.064 1.072 1.079 1.087 1.094 1.101 1.107 1.115 1.122 1.130 1.138 1.146 1.155 1.164 1.173 1.182 1.192 1.202 1.212 1.222 1.233 1.244 1.255 1.266 1.277 1.290 1.302 1.316 1.330 1.345 1.361 1.376 1.391 1.407 1.422 1.438 1.454 1.471 1.489 1.508 1.529 1.550 1.572 1.593 1.615 1.636 1.657 1.678 1.700 1.725 1.752 1.782 1.813 1.848 1.883 1.919 1.956 1.993 2.030 2.068 2.109 2.158 2.215 2.278 2.348 2.424 2.508 2.599 2.698 2.804 2.916 3.036 3.204 3.463 3.809 4.239 4.750 5.340 5.903 6.335 6.642 6.827 6.895 6.848 6.745 6.638 6.528 6.415 6.299 6.180 6.061 5.942 5.823 5.705 5.588 5.472 5.356 5.243 5.132 5.023 4.916 4.811 4.708 4.607 4.508 4.412 4.318 4.225 4.135 4.046 3.960 3.875 3.792 3.710 3.630 3.553 3.477 3.403 3.331 3.261 3.193 3.127 3.062 2.999 2.937 2.877 2.818 2.760 2.704 2.649 2.596 2.543 2.492 2.442 2.393 2.346 2.299 2.253 2.208 2.165 2.123 2.083 2.044 2.006 1.970 1.934 1.898 1.863 1.829 1.795 1.763 1.731 1.700 1.670 1.642 1.614 1.587 1.561 1.536 1.512 1.488 1.466 1.444 1.421 1.400 1.378 1.356 1.335 1.314 1.294 1.274 1.255 1.237 1.219 1.202 1.186 1.170 1.154 1.139 1.125 1.110 1.096 1.082 1.067 1.053 1.038 1.024 1.010 .996 .983 .970 .958 .945 .928 .909 .888 .863 .836 .809 .782 .756 .732 .707 .684 .662 .640 .619 .598 .579 .559 .541 .523 .506 .489 .473 .458 .442 .428 .414 .400 .387 .374 .362 .350 .338 .327 .316 .306 .296 .286 .277 .268 .259 .250 .242 .234 .226 .219 .212 .205 .198 .191 .185 .179 .173 .167 .162 .157 .151 .146 .142 .137 .132 .128 .124 .120 .116 .112 .108 .105 .101 .098 .095 .092 .089 .086 .083 .080 .077 .075 .072 .070 .068 .065 .063 .061 .059 .057 .055 .054 .052 .050 .048 .047 .045 .044 .042 .041 .040 .038 .037 .036 .035 .033 .032 .031 .030 .029 .028 .027 .026 .026 .025 .024 .023 .022 .022 .021 .020 .020 .019 .018 .018 .017 .017 .016 .015 .015 .014 .014 .014 .013 .013 .012 .012 .011 .011 .011 .010 .010 .010 .009 .009 .009 .008 .008 .008 .008 .007 .007 .007 .007 .006 .006 .006 .006 .006 .005 .005 .005 .005 .005 .005 .004 .004 .004 .004 .004 .004 .004 .004 .003 .003 .003 .003 .003 .003 .003 .003 .003 .003 .002 .002 .002 .002 .002 .002 .002 .002 .002 .002 .002 .002 .002 .002 .002 .001 .001 .001 .001 .001 .001 .001 .001 .001 .001 .001 .001 .001 .001 .001 .001 .001 .001 .001 .001 .001 .001 .001 .001 .001 .001 .001 .001 .001 .001 .001 .001 .001 .000 .000 .000 .000 .000 .000 .000 .000 .000 .000 .000 .000 .000 .000 .000 .000 .000 .000 .000 .000 .000 .000 .000 .000 .000 .000 .000 .000 .000 .000 .000 .000 .000 .000 .000 .000 .000 .000 .000 .000 .000 .000 .000 .000 .000 .000 .000 .000 .000 .000 .000 .000 .000 .000 .000 .000 .000 .000 .000 .000 .000 .000 .000 .000 .000 .000 .000 .000 .000 .000 .000 .000 .000 .000 .000 .000 .000 .000 .000 .000 .000 .000 .000 .000 .000 .000 .000 .000 .000 .000 .000 .000 .000 .000 .000 .000 .000 .000 .000 .000 .000 .000 .000 .000 .000 .000 .000 .000 .000 .000 .000 .000 .000 .000 .000 .000 .000 .000 .000 .000 .000 .000 .000 .000 .000 .000 .000 .000 .000 .000 .000 .000 .000 .000 .000 .000 .000 .000 .000 .000 .000 .000 .000 .000 .000 .000 .000 .000 .000 .000 .000 .000 .000 .000 .000 .000 .000 .000 .000 .000 .000 .000 .000 .000 .000 .000 .000 .000 .000 .000 .000 .000 .000 .000 .000 .000 .000 .000 .000 .000 .000 .000 .000 .000 .000 .000 .000 .000 .000 .000 .000 .000 .000 .000 .000 .000 .000 .000 .000 .000 .000 .000 .000 .000 .000 .000 .000 .000 .000 .000 .000 .000 .000 .000 .000 .000 .000 .000 .000 .000 .000 .000 .000 .000 .000 .000 .000 .000 .000 .000 .000 .000 .000 .000 .000 .000 .000 .000 .000 .000 .000 .000 .000 .000 .000 .000 .000 .000 .000 .000 .000 .000 .000 .000 .000 .000 .000 .000 .000 .000 .000 .000 .000 .000 .000 .000 .000 .000 .000 .000 .000 .000 .000 .000 .000 .000 .000 .000 .000 .000 .000 .000 .000 .000 .000 .000 .000 .000 .000 .000 .000 .000 .000 .000 .000 .000 .000 .000 .000 .000 .000 .000 .000 .000 .000 .000 .000 .000 .000 .000 .000 .000 .000 .000 .000 .000 .000 .000 .000 .000 .000 .000 .000 .000 .000 .000 .000 .000 .000 .000 .000 .000 .000 .000 .000 .000 .000 .000 .000 .000 .000 .000 .000 .000 .000 .000 .000 .000 .000 .000 .000 .000 .000 .000 .000 .000 .000 .000 .000 .000 .000 .000 .000 .000 .000 .000 .000 .000 .000 .000 .000 .000 .000 .000 .000 .000 .000 .000 .000 .000 .000 .000 .000 .000 .000 .000 .000 .000 .000 .000 .000 .000 .000 .000 .000
Page 1

TAPE21.out .000 .000 .000 .000 .000 .000 .000 .000 .000 .000 .000 .000 .000 .000 .000 .000 .000 .000 .000 .000
Page 2

JR_B2P1H.OUT1***************************************** *************************************** * * * * * FLOOD HYDROGRAPH PACKAGE (HEC-1) * * U.S. ARMY CORPS OF ENGINEERS * * JUN 1998 * * HYDROLOGIC ENGINEERING CENTER * * VERSION 4.1 * * 609 SECOND STREET * * * * DAVIS, CALIFORNIA 95616 * * RUN DATE 06JUL18 TIME 09:20:21 * * (916) 756-1104 * * * * * ***************************************** ***************************************
X X XXXXXXX XXXXX X X X X X X XX X X X X X XXXXXXX XXXX X XXXXX X X X X X X X X X X X X X X XXXXXXX XXXXX XXX
THIS PROGRAM REPLACES ALL PREVIOUS VERSIONS OF HEC-1 KNOWN AS HEC1 (JAN 73), HEC1GS, HEC1DB, AND HEC1KW.
THE DEFINITIONS OF VARIABLES -RTIMP- AND -RTIOR- HAVE CHANGED FROM THOSE USED WITH THE 1973-STYLE INPUT STRUCTURE. THE DEFINITION OF -AMSKK- ON RM-CARD WAS CHANGED WITH REVISIONS DATED 28 SEP 81. THIS IS THE FORTRAN77 VERSION NEW OPTIONS: DAMBREAK OUTFLOW SUBMERGENCE , SINGLE EVENT DAMAGE CALCULATION, DSS:WRITE STAGE FREQUENCY, DSS:READ TIME SERIES AT DESIRED CALCULATION INTERVAL LOSS RATE:GREEN AND AMPT INFILTRATION KINEMATIC WAVE: NEW FINITE DIFFERENCE ALGORITHM
1 HEC-1 INPUT PAGE 1
LINE ID.......1.......2.......3.......4.......5.......6.......7.......8.......9......10
*** FREE *** *DIAGRAM 1 ID JAMUL RETAIL CENTER, J-18145 BIOFILTRATION BASIN, BMP-2 2 ID 100-YEAR DETENTION ANALYSES - PRELIMINARY ENGINEERING 3 ID FEBRUARY 14, 2018 - FILE NAME: JR_B2P1H.HC1 4 IT 1 01JAN90 1200 1000 5 IO 5 0 6 KKBMP2_RatHydro.hc1 7 KM RUN DATE 7/3/2018 8 KM RATIONAL METHOD HYDROGRAPH PROGRAM 9 KM COPYRIGHT 1992, 2014, RICK ENGINEERING COMPANY 10 KM 6HR RAINFALL IS 3.3 INCHES 11 KM RATIONAL METHOD RUNOFF COEFFICIENT IS 0.83 12 KM RATIONAL METHOD TIME OF CONCENTRATION IS 6 MIN. 13 KM FOR THIS DATA TO RUN PROPERLY THIS IT CARD MUST BE ADDED TO YOUR HEC-1 14 KM IT 2 01JAN90 1200 200 15 BA 0.0038 16 IN 6 01JAN90 1157 17 QI 0 0.4 0.4 0.4 0.4 0.4 0.4 0.4 0.4 0.5 18 QI 0.5 0.5 0.5 0.5 0.5 0.5 0.5 0.5 0.6 0.6 19 QI 0.6 0.6 0.6 0.7 0.7 0.7 0.7 0.8 0.8 0.9 20 QI 0.9 1 1 1.1 1.2 1.4 1.5 1.8 2.1 3 21 QI 3.8 15.9 2.4 1.6 1.3 1.1 0.9 0.8 0.8 0.7 22 QI 0.6 0.6 0.6 0.5 0.5 0.5 0.5 0.4 0.4 0.4 23 QI 0.4 0 0 0 0 0 0 0 0 0 24 QI 0 0 25 KK DETAIN 26 KO 0 0 0 0 21 27 RS 1 STOR -1 28 SV 0 0.18 29 SQ 0 4.7 30 SE 100 101 31 ZZ 1 SCHEMATIC DIAGRAM OF STREAM NETWORK INPUT LINE (V) ROUTING (--->) DIVERSION OR PUMP FLOW
NO. (.) CONNECTOR (<---) RETURN OF DIVERTED OR PUMPED FLOW
6 BMP2_Rat V V 25 DETAIN
(***) RUNOFF ALSO COMPUTED AT THIS LOCATION1***************************************** *************************************** * * * * * FLOOD HYDROGRAPH PACKAGE (HEC-1) * * U.S. ARMY CORPS OF ENGINEERS * * JUN 1998 * * HYDROLOGIC ENGINEERING CENTER * * VERSION 4.1 * * 609 SECOND STREET * * * * DAVIS, CALIFORNIA 95616 * * RUN DATE 06JUL18 TIME 09:20:21 * * (916) 756-1104 * * * * * ***************************************** ***************************************
Page 1

JR_B2P1H.OUT
JAMUL RETAIL CENTER, J-18145 BIOFILTRATION BASIN, BMP-2 100-YEAR DETENTION ANALYSES - PRELIMINARY ENGINEERING FEBRUARY 14, 2018 - FILE NAME: JR_B2P1H.HC1
5 IO OUTPUT CONTROL VARIABLES IPRNT 5 PRINT CONTROL IPLOT 0 PLOT CONTROL QSCAL 0. HYDROGRAPH PLOT SCALE
IT HYDROGRAPH TIME DATA NMIN 1 MINUTES IN COMPUTATION INTERVAL IDATE 1JAN90 STARTING DATE ITIME 1200 STARTING TIME NQ 1000 NUMBER OF HYDROGRAPH ORDINATES NDDATE 2JAN90 ENDING DATE NDTIME 0439 ENDING TIME ICENT 19 CENTURY MARK
COMPUTATION INTERVAL .02 HOURS TOTAL TIME BASE 16.65 HOURS
ENGLISH UNITS DRAINAGE AREA SQUARE MILES PRECIPITATION DEPTH INCHES LENGTH, ELEVATION FEET FLOW CUBIC FEET PER SECOND STORAGE VOLUME ACRE-FEET SURFACE AREA ACRES TEMPERATURE DEGREES FAHRENHEIT
*** *** *** *** *** *** *** *** *** *** *** *** *** *** *** *** *** *** *** *** *** *** *** *** *** *** *** *** *** *** *** *** ***
************** * * 25 KK * DETAIN * * * **************
26 KO OUTPUT CONTROL VARIABLES IPRNT 5 PRINT CONTROL IPLOT 0 PLOT CONTROL QSCAL 0. HYDROGRAPH PLOT SCALE IPNCH 0 PUNCH COMPUTED HYDROGRAPH IOUT 21 SAVE HYDROGRAPH ON THIS UNIT ISAV1 1 FIRST ORDINATE PUNCHED OR SAVED ISAV2 1000 LAST ORDINATE PUNCHED OR SAVED TIMINT .017 TIME INTERVAL IN HOURS
1 RUNOFF SUMMARY FLOW IN CUBIC FEET PER SECOND TIME IN HOURS, AREA IN SQUARE MILES
PEAK TIME OF AVERAGE FLOW FOR MAXIMUM PERIOD BASIN MAXIMUM TIME OF OPERATION STATION FLOW PEAK AREA STAGE MAX STAGE+ 6-HOUR 24-HOUR 72-HOUR
HYDROGRAPH AT+ BMP2_Rat 16. 4.05 1. 0. 0. .00
ROUTED TO+ DETAIN 5. 4.13 1. 0. 0. .00+ 100.98 4.13
*** NORMAL END OF HEC-1 ***
Page 2

TAPE21.OUT DETAIN 11200 1JAN90 0 1 11000 .004 .200 .201 .205 .210 .217 .224 .230 .236 .242 .247 .253 .258 .263 .268 .272 .277 .281 .285 .289 .293 .297 .301 .304 .308 .311 .314 .317 .320 .323 .326 .328 .331 .333 .336 .338 .340 .342 .344 .346 .348 .350 .352 .353 .355 .357 .358 .360 .362 .365 .368 .372 .376 .381 .385 .389 .393 .397 .400 .404 .407 .411 .414 .417 .420 .423 .425 .428 .430 .433 .435 .438 .440 .442 .444 .446 .448 .450 .451 .453 .455 .456 .458 .459 .461 .462 .464 .465 .466 .467 .468 .470 .471 .472 .473 .474 .475 .475 .476 .477 .478 .479 .481 .483 .486 .489 .492 .496 .500 .503 .507 .510 .513 .516 .519 .522 .525 .528 .530 .533 .535 .537 .539 .542 .544 .546 .548 .549 .551 .553 .555 .556 .559 .562 .565 .569 .573 .578 .582 .586 .590 .594 .598 .602 .605 .608 .612 .615 .618 .621 .624 .626 .629 .631 .634 .636 .640 .643 .647 .652 .657 .662 .667 .671 .676 .680 .684 .689 .694 .699 .705 .711 .717 .723 .730 .736 .741 .747 .752 .758 .764 .770 .777 .784 .791 .799 .806 .813 .819 .826 .832 .838 .845 .852 .859 .866 .874 .883 .891 .900 .909 .919 .928 .938 .949 .961 .974 .987 1.001 1.015 1.030 1.044 1.059 1.074 1.089 1.104 1.121 1.138 1.157 1.177 1.199 1.221 1.244 1.268 1.293 1.319 1.345 1.375 1.408 1.446 1.488 1.533 1.582 1.635 1.690 1.748 1.809 1.872 1.938 2.039 2.208 2.443 2.740 3.098 3.515 3.913 4.217 4.431 4.558 4.601 4.563 4.484 4.403 4.321 4.237 4.150 4.063 3.975 3.888 3.803 3.719 3.636 3.555 3.474 3.396 3.319 3.243 3.169 3.097 3.026 2.956 2.887 2.820 2.754 2.689 2.626 2.564 2.503 2.445 2.388 2.332 2.278 2.225 2.175 2.126 2.080 2.034 1.990 1.948 1.906 1.864 1.824 1.785 1.746 1.708 1.671 1.635 1.599 1.564 1.530 1.497 1.466 1.435 1.405 1.377 1.350 1.323 1.297 1.273 1.249 1.226 1.204 1.182 1.160 1.138 1.116 1.095 1.074 1.053 1.034 1.015 .997 .979 .962 .946 .930 .915 .900 .886 .872 .859 .847 .834 .823 .811 .800 .788 .777 .765 .753 .741 .729 .717 .706 .695 .685 .675 .665 .656 .646 .638 .629 .621 .613 .606 .599 .592 .585 .578 .571 .561 .550 .536 .521 .504 .486 .469 .452 .436 .421 .406 .391 .378 .364 .351 .339 .327 .315 .304 .294 .283 .273 .264 .254 .245 .237 .228 .220 .212 .205 .198 .191 .184 .177 .171 .165 .159 .154 .148 .143 .138 .133 .128 .124 .119 .115 .111 .107 .103 .100 .096 .093 .090 .086 .083 .080 .078 .075 .072 .070 .067 .065 .063 .060 .058 .056 .054 .052 .050 .049 .047 .045 .044 .042 .041 .039 .038 .036 .035 .034 .033 .032 .030 .029 .028 .027 .026 .025 .025 .024 .023 .022 .021 .020 .020 .019 .018 .018 .017 .017 .016 .015 .015 .014 .014 .013 .013 .012 .012 .012 .011 .011 .010 .010 .010 .009 .009 .009 .008 .008 .008 .007 .007 .007 .007 .006 .006 .006 .006 .006 .005 .005 .005 .005 .005 .005 .004 .004 .004 .004 .004 .004 .004 .003 .003 .003 .003 .003 .003 .003 .003 .003 .002 .002 .002 .002 .002 .002 .002 .002 .002 .002 .002 .002 .002 .002 .001 .001 .001 .001 .001 .001 .001 .001 .001 .001 .001 .001 .001 .001 .001 .001 .001 .001 .001 .001 .001 .001 .001 .001 .001 .001 .001 .001 .001 .001 .001 .000 .000 .000 .000 .000 .000 .000 .000 .000 .000 .000 .000 .000 .000 .000 .000 .000 .000 .000 .000 .000 .000 .000 .000 .000 .000 .000 .000 .000 .000 .000 .000 .000 .000 .000 .000 .000 .000 .000 .000 .000 .000 .000 .000 .000 .000 .000 .000 .000 .000 .000 .000 .000 .000 .000 .000 .000 .000 .000 .000 .000 .000 .000 .000 .000 .000 .000 .000 .000 .000 .000 .000 .000 .000 .000 .000 .000 .000 .000 .000 .000 .000 .000 .000 .000 .000 .000 .000 .000 .000 .000 .000 .000 .000 .000 .000 .000 .000 .000 .000 .000 .000 .000 .000 .000 .000 .000 .000 .000 .000 .000 .000 .000 .000 .000 .000 .000 .000 .000 .000 .000 .000 .000 .000 .000 .000 .000 .000 .000 .000 .000 .000 .000 .000 .000 .000 .000 .000 .000 .000 .000 .000 .000 .000 .000 .000 .000 .000 .000 .000 .000 .000 .000 .000 .000 .000 .000 .000 .000 .000 .000 .000 .000 .000 .000 .000 .000 .000 .000 .000 .000 .000 .000 .000 .000 .000 .000 .000 .000 .000 .000 .000 .000 .000 .000 .000 .000 .000 .000 .000 .000 .000 .000 .000 .000 .000 .000 .000 .000 .000 .000 .000 .000 .000 .000 .000 .000 .000 .000 .000 .000 .000 .000 .000 .000 .000 .000 .000 .000 .000 .000 .000 .000 .000 .000 .000 .000 .000 .000 .000 .000 .000 .000 .000 .000 .000 .000 .000 .000 .000 .000 .000 .000 .000 .000 .000 .000 .000 .000 .000 .000 .000 .000 .000 .000 .000 .000 .000 .000 .000 .000 .000 .000 .000 .000 .000 .000 .000 .000 .000 .000 .000 .000 .000 .000 .000 .000 .000 .000 .000 .000 .000 .000 .000 .000 .000 .000 .000 .000 .000 .000 .000 .000 .000 .000 .000 .000 .000 .000 .000 .000 .000 .000 .000 .000 .000 .000 .000 .000 .000 .000 .000 .000 .000 .000 .000 .000 .000 .000 .000 .000 .000 .000 .000 .000 .000 .000 .000 .000 .000 .000 .000 .000 .000 .000 .000 .000 .000 .000 .000 .000 .000 .000 .000 .000 .000 .000 .000 .000 .000 .000 .000 .000 .000 .000 .000 .000 .000 .000 .000 .000 .000 .000 .000 .000 .000 .000 .000 .000 .000 .000 .000 .000 .000 .000 .000 .000 .000 .000 .000 .000 .000 .000 .000 .000 .000 .000 .000 .000 .000 .000 .000 .000 .000 .000 .000 .000 .000 .000 .000 .000 .000 .000 .000 .000 .000 .000 .000 .000 .000 .000 .000 .000 .000 .000 .000 .000 .000 .000 .000 .000 .000 .000 .000
Page 1

TAPE21.OUT .000 .000 .000 .000 .000 .000 .000 .000 .000 .000 .000 .000 .000 .000 .000 .000 .000 .000 .000 .000
Page 2

JR_B3P1H.OUT1***************************************** *************************************** * * * * * FLOOD HYDROGRAPH PACKAGE (HEC-1) * * U.S. ARMY CORPS OF ENGINEERS * * JUN 1998 * * HYDROLOGIC ENGINEERING CENTER * * VERSION 4.1 * * 609 SECOND STREET * * * * DAVIS, CALIFORNIA 95616 * * RUN DATE 06JUL18 TIME 09:57:21 * * (916) 756-1104 * * * * * ***************************************** ***************************************
X X XXXXXXX XXXXX X X X X X X XX X X X X X XXXXXXX XXXX X XXXXX X X X X X X X X X X X X X X XXXXXXX XXXXX XXX
THIS PROGRAM REPLACES ALL PREVIOUS VERSIONS OF HEC-1 KNOWN AS HEC1 (JAN 73), HEC1GS, HEC1DB, AND HEC1KW.
THE DEFINITIONS OF VARIABLES -RTIMP- AND -RTIOR- HAVE CHANGED FROM THOSE USED WITH THE 1973-STYLE INPUT STRUCTURE. THE DEFINITION OF -AMSKK- ON RM-CARD WAS CHANGED WITH REVISIONS DATED 28 SEP 81. THIS IS THE FORTRAN77 VERSION NEW OPTIONS: DAMBREAK OUTFLOW SUBMERGENCE , SINGLE EVENT DAMAGE CALCULATION, DSS:WRITE STAGE FREQUENCY, DSS:READ TIME SERIES AT DESIRED CALCULATION INTERVAL LOSS RATE:GREEN AND AMPT INFILTRATION KINEMATIC WAVE: NEW FINITE DIFFERENCE ALGORITHM
1 HEC-1 INPUT PAGE 1
LINE ID.......1.......2.......3.......4.......5.......6.......7.......8.......9......10
*** FREE *** *DIAGRAM 1 ID JAMUL RETAIL CENTER, J-18145 BIOFILTRATION BASIN, BMP-3 2 ID 100-YEAR DETENTION ANALYSES - PRELIMINARY ENGINEERING 3 ID FEBRUARY 14, 2018 - FILE NAME: JR_B3P1H.HC1 4 IT 1 01JAN90 1200 1000 5 IO 5 0 6 KKBMP3_RatHydro.hc1 7 KM RUN DATE 7/3/2018 8 KM RATIONAL METHOD HYDROGRAPH PROGRAM 9 KM COPYRIGHT 1992, 2014, RICK ENGINEERING COMPANY 10 KM 6HR RAINFALL IS 3.3 INCHES 11 KM RATIONAL METHOD RUNOFF COEFFICIENT IS 0.68 12 KM RATIONAL METHOD TIME OF CONCENTRATION IS 6 MIN. 13 KM FOR THIS DATA TO RUN PROPERLY THIS IT CARD MUST BE ADDED TO YOUR HEC-1 14 KM IT 2 01JAN90 1200 200 15 BA 0.002 16 IN 6 01JAN90 1157 17 QI 0 0.2 0.2 0.2 0.2 0.2 0.2 0.2 0.2 0.2 18 QI 0.2 0.2 0.2 0.2 0.2 0.2 0.2 0.2 0.2 0.3 19 QI 0.3 0.3 0.3 0.3 0.3 0.3 0.3 0.3 0.4 0.4 20 QI 0.4 0.4 0.5 0.5 0.5 0.6 0.7 0.8 0.9 1.4 21 QI 1.8 6.9 1.1 0.7 0.6 0.5 0.4 0.4 0.3 0.3 22 QI 0.3 0.3 0.3 0.2 0.2 0.2 0.2 0.2 0.2 0.2 23 QI 0.2 0 0 0 0 0 0 0 0 0 24 QI 0 0 25 KK DETAIN 26 KO 0 0 0 0 21 27 RS 1 STOR -1 28 SV 0 0.07 29 SQ 0 2.4 30 SE 100 101 31 ZZ 1 SCHEMATIC DIAGRAM OF STREAM NETWORK INPUT LINE (V) ROUTING (--->) DIVERSION OR PUMP FLOW
NO. (.) CONNECTOR (<---) RETURN OF DIVERTED OR PUMPED FLOW
6 BMP3_Rat V V 25 DETAIN
(***) RUNOFF ALSO COMPUTED AT THIS LOCATION1***************************************** *************************************** * * * * * FLOOD HYDROGRAPH PACKAGE (HEC-1) * * U.S. ARMY CORPS OF ENGINEERS * * JUN 1998 * * HYDROLOGIC ENGINEERING CENTER * * VERSION 4.1 * * 609 SECOND STREET * * * * DAVIS, CALIFORNIA 95616 * * RUN DATE 06JUL18 TIME 09:57:21 * * (916) 756-1104 * * * * * ***************************************** ***************************************
Page 1

JR_B3P1H.OUT
JAMUL RETAIL CENTER, J-18145 BIOFILTRATION BASIN, BMP-3 100-YEAR DETENTION ANALYSES - PRELIMINARY ENGINEERING FEBRUARY 14, 2018 - FILE NAME: JR_B3P1H.HC1
5 IO OUTPUT CONTROL VARIABLES IPRNT 5 PRINT CONTROL IPLOT 0 PLOT CONTROL QSCAL 0. HYDROGRAPH PLOT SCALE
IT HYDROGRAPH TIME DATA NMIN 1 MINUTES IN COMPUTATION INTERVAL IDATE 1JAN90 STARTING DATE ITIME 1200 STARTING TIME NQ 1000 NUMBER OF HYDROGRAPH ORDINATES NDDATE 2JAN90 ENDING DATE NDTIME 0439 ENDING TIME ICENT 19 CENTURY MARK
COMPUTATION INTERVAL .02 HOURS TOTAL TIME BASE 16.65 HOURS
ENGLISH UNITS DRAINAGE AREA SQUARE MILES PRECIPITATION DEPTH INCHES LENGTH, ELEVATION FEET FLOW CUBIC FEET PER SECOND STORAGE VOLUME ACRE-FEET SURFACE AREA ACRES TEMPERATURE DEGREES FAHRENHEIT
*** *** *** *** *** *** *** *** *** *** *** *** *** *** *** *** *** *** *** *** *** *** *** *** *** *** *** *** *** *** *** *** ***
************** * * 25 KK * DETAIN * * * **************
26 KO OUTPUT CONTROL VARIABLES IPRNT 5 PRINT CONTROL IPLOT 0 PLOT CONTROL QSCAL 0. HYDROGRAPH PLOT SCALE IPNCH 0 PUNCH COMPUTED HYDROGRAPH IOUT 21 SAVE HYDROGRAPH ON THIS UNIT ISAV1 1 FIRST ORDINATE PUNCHED OR SAVED ISAV2 1000 LAST ORDINATE PUNCHED OR SAVED TIMINT .017 TIME INTERVAL IN HOURS
1 RUNOFF SUMMARY FLOW IN CUBIC FEET PER SECOND TIME IN HOURS, AREA IN SQUARE MILES
PEAK TIME OF AVERAGE FLOW FOR MAXIMUM PERIOD BASIN MAXIMUM TIME OF OPERATION STATION FLOW PEAK AREA STAGE MAX STAGE+ 6-HOUR 24-HOUR 72-HOUR
HYDROGRAPH AT+ BMP3_Rat 7. 4.05 0. 0. 0. .00
ROUTED TO+ DETAIN 2. 4.13 0. 0. 0. .00+ 100.99 4.13
*** NORMAL END OF HEC-1 ***
Page 2

TAPE21.OUT DETAIN 11200 1JAN90 0 1 11000 .002 .100 .101 .103 .107 .111 .115 .119 .123 .126 .130 .133 .136 .139 .142 .145 .147 .150 .152 .154 .156 .158 .160 .162 .164 .165 .167 .169 .170 .171 .173 .174 .175 .176 .177 .178 .179 .180 .181 .182 .183 .184 .185 .185 .186 .187 .187 .188 .188 .189 .189 .190 .190 .191 .191 .192 .192 .192 .193 .193 .193 .194 .194 .194 .195 .195 .195 .195 .195 .196 .196 .196 .196 .196 .197 .197 .197 .197 .197 .197 .197 .198 .198 .198 .198 .198 .198 .198 .198 .198 .198 .198 .199 .199 .199 .199 .199 .199 .199 .199 .199 .199 .199 .199 .199 .199 .199 .200 .201 .203 .205 .209 .212 .216 .220 .224 .227 .231 .234 .237 .240 .243 .245 .248 .250 .253 .255 .257 .259 .261 .263 .264 .266 .267 .269 .270 .272 .273 .274 .276 .277 .278 .279 .280 .281 .282 .282 .283 .284 .285 .285 .286 .287 .287 .288 .288 .289 .290 .290 .290 .291 .292 .293 .295 .298 .302 .306 .310 .315 .318 .322 .326 .329 .333 .336 .339 .341 .344 .347 .349 .352 .354 .356 .358 .360 .362 .365 .369 .373 .377 .383 .388 .393 .398 .403 .407 .412 .416 .420 .423 .427 .430 .433 .437 .441 .446 .451 .457 .463 .469 .477 .484 .492 .501 .510 .519 .528 .538 .548 .559 .569 .580 .592 .603 .615 .627 .639 .653 .670 .691 .714 .740 .768 .799 .831 .865 .901 .937 .976 1.033 1.128 1.257 1.419 1.613 1.837 2.049 2.205 2.311 2.366 2.375 2.338 2.280 2.220 2.161 2.101 2.041 1.981 1.922 1.864 1.808 1.755 1.702 1.652 1.603 1.556 1.510 1.465 1.422 1.379 1.338 1.299 1.260 1.222 1.185 1.150 1.115 1.082 1.050 1.020 .992 .965 .938 .912 .887 .861 .837 .812 .789 .766 .745 .724 .705 .686 .668 .651 .635 .619 .605 .591 .577 .564 .552 .541 .530 .519 .509 .499 .490 .481 .473 .465 .457 .449 .440 .431 .421 .411 .402 .392 .383 .375 .367 .359 .352 .345 .338 .332 .326 .320 .314 .309 .304 .299 .295 .290 .286 .282 .278 .275 .271 .268 .265 .262 .259 .256 .254 .251 .249 .247 .244 .242 .240 .239 .237 .235 .233 .232 .230 .229 .227 .223 .218 .212 .205 .196 .187 .178 .170 .162 .155 .148 .141 .134 .128 .122 .117 .111 .106 .101 .097 .092 .088 .084 .080 .076 .073 .069 .066 .063 .060 .057 .055 .052 .050 .048 .045 .043 .041 .039 .038 .036 .034 .033 .031 .030 .028 .027 .026 .025 .023 .022 .021 .020 .019 .018 .018 .017 .016 .015 .015 .014 .013 .013 .012 .012 .011 .010 .010 .010 .009 .009 .008 .008 .008 .007 .007 .007 .006 .006 .006 .005 .005 .005 .005 .004 .004 .004 .004 .004 .004 .003 .003 .003 .003 .003 .003 .003 .002 .002 .002 .002 .002 .002 .002 .002 .002 .002 .002 .001 .001 .001 .001 .001 .001 .001 .001 .001 .001 .001 .001 .001 .001 .001 .001 .001 .001 .001 .001 .001 .001 .001 .000 .000 .000 .000 .000 .000 .000 .000 .000 .000 .000 .000 .000 .000 .000 .000 .000 .000 .000 .000 .000 .000 .000 .000 .000 .000 .000 .000 .000 .000 .000 .000 .000 .000 .000 .000 .000 .000 .000 .000 .000 .000 .000 .000 .000 .000 .000 .000 .000 .000 .000 .000 .000 .000 .000 .000 .000 .000 .000 .000 .000 .000 .000 .000 .000 .000 .000 .000 .000 .000 .000 .000 .000 .000 .000 .000 .000 .000 .000 .000 .000 .000 .000 .000 .000 .000 .000 .000 .000 .000 .000 .000 .000 .000 .000 .000 .000 .000 .000 .000 .000 .000 .000 .000 .000 .000 .000 .000 .000 .000 .000 .000 .000 .000 .000 .000 .000 .000 .000 .000 .000 .000 .000 .000 .000 .000 .000 .000 .000 .000 .000 .000 .000 .000 .000 .000 .000 .000 .000 .000 .000 .000 .000 .000 .000 .000 .000 .000 .000 .000 .000 .000 .000 .000 .000 .000 .000 .000 .000 .000 .000 .000 .000 .000 .000 .000 .000 .000 .000 .000 .000 .000 .000 .000 .000 .000 .000 .000 .000 .000 .000 .000 .000 .000 .000 .000 .000 .000 .000 .000 .000 .000 .000 .000 .000 .000 .000 .000 .000 .000 .000 .000 .000 .000 .000 .000 .000 .000 .000 .000 .000 .000 .000 .000 .000 .000 .000 .000 .000 .000 .000 .000 .000 .000 .000 .000 .000 .000 .000 .000 .000 .000 .000 .000 .000 .000 .000 .000 .000 .000 .000 .000 .000 .000 .000 .000 .000 .000 .000 .000 .000 .000 .000 .000 .000 .000 .000 .000 .000 .000 .000 .000 .000 .000 .000 .000 .000 .000 .000 .000 .000 .000 .000 .000 .000 .000 .000 .000 .000 .000 .000 .000 .000 .000 .000 .000 .000 .000 .000 .000 .000 .000 .000 .000 .000 .000 .000 .000 .000 .000 .000 .000 .000 .000 .000 .000 .000 .000 .000 .000 .000 .000 .000 .000 .000 .000 .000 .000 .000 .000 .000 .000 .000 .000 .000 .000 .000 .000 .000 .000 .000 .000 .000 .000 .000 .000 .000 .000 .000 .000 .000 .000 .000 .000 .000 .000 .000 .000 .000 .000 .000 .000 .000 .000 .000 .000 .000 .000 .000 .000 .000 .000 .000 .000 .000 .000 .000 .000 .000 .000 .000 .000 .000 .000 .000 .000 .000 .000 .000 .000 .000 .000 .000 .000 .000 .000 .000 .000 .000 .000 .000 .000 .000 .000 .000 .000 .000 .000 .000 .000 .000 .000 .000 .000 .000 .000 .000 .000 .000 .000 .000 .000 .000 .000 .000 .000 .000 .000 .000 .000 .000 .000 .000 .000 .000 .000 .000 .000 .000 .000 .000 .000 .000 .000 .000 .000 .000 .000 .000 .000 .000 .000 .000 .000 .000 .000 .000 .000 .000 .000 .000 .000 .000 .000 .000 .000 .000 .000 .000 .000 .000 .000 .000 .000 .000 .000 .000 .000 .000 .000 .000 .000 .000 .000 .000 .000 .000 .000 .000 .000 .000 .000 .000 .000 .000 .000 .000 .000 .000 .000
Page 1

TAPE21.OUT .000 .000 .000 .000 .000 .000 .000 .000 .000 .000 .000 .000 .000 .000 .000 .000 .000 .000 .000 .000
Page 2

APPENDIX D
FEMA - FIRM


MAP POCKET 1
Drainage Study Map
for
Jamul Retail Center
[Pre-project]

X
920
930
940
950
960
970
970
970
980
980
980
980
990
990
1000
1000
1010
1010
1020
1020
1030
9.9 AC.
BASIN 100
NOTES
AREAS.
STEELE CANYON CREEK AND DOES NOT INCLUDE OFF-SITE
POI 3 IS THE CONFLUENCE OF THE ENTIRE SITE AT
5. POI 3 IS PROVIDED FOR REFERENCE PURPOSES ONLY.
TO THE PROJECT SITE.
CONDITIONS AT THE DOWNSTREAM MOBILE HOME PARK DUE
ORDER TO MITIGATE EXISTING ADVERSE DRAIANGE
BIOLOGIST.ADDITIONALLY, POI 1 WAS SELECTED IN
SPACE THROUGH COORDINATION WITH THE PROJECT
MINIMIZE IMPACTS TO RIPERIAN AND BILOGOCIAL OPEN
1 WAS SELECTED AS THE PROJECT'S OUTFALL TO
HOWEVER, IT IS IN THE POST-PROJECT CONDITION. POI
TRIBUTARY TO POI 1 IN THE PRE-PROJECT CONDITION;
STORMWATER GENERATED FROM THE SITE IS NOT
4. POI 1 IS PROVIDED FOR REFERENCE PUSPOSES ONLY.
BYPASSING THE PROJECT SITE
CHANNEL OR SOUTHWESTERLY TOWARD CAMPO ROAD,
ROAD IS CONVEYED NORTHERLY INTO A NATURAL UNNAMED
3. OFF-SITE AREA DRAINING WESTERLY ONTO JEFFERSON
ENCOUNTERED DURING THE SOILS INVESTIGATION.
BELOW EXISTING GROUND. GROUNDWATER WAS NOT
GROUNDWATER IS EXPECTED TO BE DEEPER THAN 50 FEET
2. PURSUANT TO THE PROJECT'S GEOTECHNICAL REPORT,
1. UNDERLYING HYDROLOGIC SOIL GROUP: TYPE "C"
LEGEND
09-
OC
T-2018
08:11
J:\18145_Ja
mul_
Project\
Water
Resources\
SD
Corp
Stds 2005.dscript
J:\18145_Ja
mul_
Project\
Water
Resources\18145drn_pre01.dgn
XX.X AC.
0
GRAPHIC SCALE 1"= 60'
60 30 60 120 180
J-18145
J-18145
DRAINAGE BASIN BOUNDARY
DRAINAGE BASINTRIBUTARY AREA TO
BOUNDARY
DRAINAGE BASIN SUBAREA
DRAINAGE BASIN ID
(PRE-PROJECT)JAMUL RETAIL CENTER
FOR DRAINAGE STUDY MAP
NOT FOR CONSTRUCTION - EXHIBIT FOR PRELIMINARY DRAINAGE STUDY
BASIN X
XXX DRAINAGE NODE NUMBER
Date: March 26, 2018Revised: July 10, 2018
Revised: October 10, 2018
c2018 Rick Engineering Co
mpany
FLOW PATH
(POI) POINT OF INTEREST
POI #2
POI #3 (TOTAL SITE)
9.6 AC.
100
0.3 AC.
160
RP
O
LIMIT
BUFFE
R
ZO
NE
BUIL
DIN
G
RPO LIMIT
BUFF
ER ZONE
BUIL
DIN
G
Tc= 8.7 MIN.A= 9.9 AC.Q100 = 19.4 CFSPRE-PROJECT
Tc= 8.7 MIN.A= 9.9 AC.Q100 = 19.4 CFSPRE-PROJECT
JEFFE
RS
ON R
OA
D
LYO
NS V
ALLEY R
OAD
CA
MP
O R
OA
D
102
NATURAL UNNAMED TRIBUTARY CHANNEL
POI #1
Tc= N/AA= N/AQ100 = N/APRE-PROJECT
STEELE C
AN
YO
N CREE
K
MO
BI
LE
HO
ME
CO
MM
UNI
TY
50'
50.0
0'
50.0
0'
50.00'

MAP POCKET 2
Drainage Study Map
for
Jamul Retail Center
[Post-project]

X
X
X
X
X
X
X
X
910
915
915
915
920
920
920
920
925
925
925
925
925
930
930
930
930
935
935
935
935
940
940
940
945
945
945
945
950
950
950
950
955
955
955
955
955
955
960
960
960
960
960
965
965
965
965
965
970
970
970
970
975
975
980
980
980
985
985
990
990
995
995
995
NOTES
CREEK (POI 3).
THE EXISTING CONFLUENCE WITH STEELE CANYON
LOCATED APPROXIMATELY 550 FEET UPSTREAM OF
ON THE DOWNSTREAM MOBILE HOME PARK. POI 1 IS
MITIGATE EXISTING ADVERSE DRAIANGE CONDITIONS
AREAS AND BIOOLIGICAL OPEN SPACE AND ALSO TO
AREA IN ORDER TO MINIMIZE IMPACTS TO RIPERIAN
DISCHARGE POINT FOR A MAJORITY OF THE PROJECT
BIOLOGIST, POI 1 WAS SELECTED AS THE
5. THROUGH COORDINATION WITH THE PROJECT'S
OF THE PROJECT.
OR DOWNSTREAM DRAINAGE FACILITIES AS A RESULT
IMPACTS TO THE EXISTING MOBILE HOME COMMUNITY
ANTICIPATED THAT THERE WILL BE NO ADVERSE
CONDITION (AT POI 3); THEREFORE, IT IS
CONDITION IS LESS THAN THE EXISTING
THE ENTIRE SITE DURING THE POST-PROJECT
CONTRIBUTING AREAS. THE TOTAL PEAK FLOW FOR
DOES NOT INLCUDE FLOWS FROM OFF-SITE
POI 1 AND 2) AT STEELE CREEK. THE ANALYSIS
CONFLUENCE OF THE SITE AS A WHOLE (FLOWS FROM
IT SHOULD BE NOTED THAT POI 3 IS THE 4.
TOWARD CAMPO ROAD, BYPASSING THE PROJECT SITE
NATURAL UNNAMED CHANNEL OR SOUTHWESTERLY
JEFFERSON ROAD IS CONVEYED NORTHERLY INTO A
OFF-SITE AREA DRAINING WESTERLY ONTO 3.
SOILS INVESTIGATION.
GROUNDWATER WAS NOT ENCOUNTERED DURING THE
THAN 50 FEET BELOW EXISTING GROUND.
REPORT, GROUNDWATER IS EXPECTED TO BE DEEPER
PURSUANT TO THE PROJECT'S GEOTECHNICAL 2.
UNDERLYING HYDROLOGIC SOIL GROUP: TYPE "C"1.
LEGEND
08-
OC
T-2018
08:45
J:\18145_Ja
mul_
Project\
Water
Resources\
SD
Corp
Stds 2005.dscript
J:\18145_Ja
mul_
Project\
Water
Resources\18145drn_post01.dgn
XX.X AC.
0
GRAPHIC SCALE 1"= 60'
60 30 60 120 180
J-18145
J-18145
DRAINAGE BASIN BOUNDARY
DRAINAGE BASINTRIBUTARY AREA TO
BOUNDARY
DRAINAGE BASIN SUBAREA
DRAINAGE BASIN ID
(POST-PROJECT)JAMUL RETAIL CENTER
FOR DRAINAGE STUDY MAP
BASIN X
XXX DRAINAGE NODE NUMBER
BIOFILTRATION BASIN
LOCATION OF
BMP-X STRUCTURAL BMP
NOT FOR CONSTRUCTION - EXHIBIT FOR DRAINAGE STUDY ONLY
Date: March 26, 2018Revised: July 10, 2018
Revised: October 8, 2018
c2018 Rick Engineering Co
mpany
0.6 AC.
0.3 AC.
9.9 AC.
120
122
124
126
100
102
110
112
114
104106
140
142
144
150
3.3 AC.
0.2 AC.
1.1 AC.
2.2 AC.
0.1 AC.
RPO LIMIT
BUFF
ER ZONE
BUIL
DIN
G
BUFFE
R
ZO
NE
BUIL
DIN
G
RP
O
LIMIT
SD
D-1
16~5'
B IN
LE
T
D9-A
4
D9-A
4
D9-A
4
D9-A
4
D9-A
4
D9-A
4
D9-A
4
SD
D-1
16~5'
B IN
LE
T
SD
D-1
16~5'
B IN
LE
T
SD
D-1
16~5'
B IN
LE
T
D9-A
4
D9-A
4
D9-A
4
D9-A
4
D9-A
4
D9-A
4
D9-A
4
D9-A
4
D9-A
4
D9-A
4
D9-A
4
DRIVEWAY
FUTURE
FARMS
SIMPSON
HC
HC
HC
HC
X
HC
HC
HC
HC
HC
HC
ROOM
SPRINKLER
980
930
960
0.4 AC.
JEFFE
RS
ON R
OA
D
1.1 AC.
160
Tc= 8.7 MIN.A= 9.9 AC.Q100 = 19.4 CFSPRE-PROJECT
PROJECT CONTRIBUTION TO POI #2
V= N/A (SHEET FLOW)Tc= 4.6 MIN.A= 1.2 AC.Q100 = 3.1 CFSPOST-PROJECT
V = N/ATc= 8.7 MIN.A= 9.9 AC.Q100 = 19.4 CFSPRE-PROJECT
CONFLUENCE POINT (POI #3)
V= N/ATc= 12.9 MIN.A= 9.9 AC.Q100 = 16.7 CFSPOST-PROJECT (DETAINED)
BMP-3
BMP-2
146
940
940
950
950
108
960
960
BASIN 100132
970
970
970
975
LYO
NS V
ALL
EY R
OAD
CA
MP
O R
OA
D
980
980
980
980
980
990
0.1 AC.
0.1 AC.
0.1 AC.
0.1 AC.
0.1 AC.
NATURAL UNNAMED TRIBUTARY CHANNEL
TRACTOR SUPPLY CENTER
SELF-STORAGE CENTER
160.2
160.1
0.1 AC.
BMP-1
134
135
STEELE C
AN
YO
N CREE
K
MO
BI
LE
HO
ME
CO
MM
UNI
TY
Tc= N/AA= N/AQ100 = N/APRE-PROJECT
V(DETAINED) = 5.9 FPSV(UNDETAINED) = N/ATc(DETAINED) = 13.1 MIN.Tc(UNDETAINED) = 6.9 MIN.A = 8.7 AC.Q100(DETAINED) = 15.1 CFSQ100(UNDETAINED) = 47.3 CFSPOST-PROJECT
PROJECT CONTRIBUTION TO POI #1
FLOW PATH
(POI) POINT OF INTEREST
50.00'
50.0
0'
50.0
0'
50'

PRIORITY DEVELOPMENT PROJECT (PDP) SWQMP 43 of 44
Template Date: August 28, 2017 Preparation Date: February 16, 2018] LUEG:SW PDP SWQMP - Attachments
ATTACHMENT 7
Copy of Project's Geotechnical and Groundwater Investigation Report
This is the cover sheet for Attachment 7. If hardcopy or CD is not attached, the following information should be provided: Title: Prepared By: Date:

PRIORITY DEVELOPMENT PROJECT (PDP) SWQMP 44 of 44
Template Date: August 28, 2017 Preparation Date: February 16, 2018] LUEG:SW PDP SWQMP - Attachments
This page was left intentionally blank.


