Embed Size (px)
Citation preview

Science of the Total Environment 421-422 (2012) 102–110
Contents lists available at SciVerse ScienceDirect
Science of the Total Environment
j ourna l homepage: www.e lsev ie r .com/ locate /sc i totenv
Prioritising pharmaceuticals for environmental risk assessment: Towards adequateand feasible first-tier selection
V. Roos a, L. Gunnarsson b, J. Fick c, D.G.J. Larsson b, C. Rudén a,⁎a Division of Philosophy, Royal Institute of Technology (KTH), SE-100 44 Stockholm, Swedenb Department of Neuroscience and Physiology, the Sahlgrenska Academy at the University of Gothenburg, SE-405 30 Göteborg, Swedenc Department of Chemistry, Umeå University, SE-901 87 Umeå, Sweden
⁎ Corresponding author. Tel.: +46 8 790 9587; fax: +E-mail address: [email protected] (C. Rudén).
0048-9697/$ – see front matter © 2012 Elsevier B.V. Alldoi:10.1016/j.scitotenv.2012.01.039
a b s t r a c t
a r t i c l e i n f oArticle history:Received 8 November 2011Received in revised form 10 January 2012Accepted 14 January 2012Available online 22 February 2012
Keywords:PharmaceuticalsEnvironmentRisk assessmentFish plasma modelPrioritisationEcotoxicity
The presence of pharmaceuticals in the aquatic environment, and the concerns for negative effects on aquaticorganisms, has gained increasing attention over the last years. As ecotoxicity data are lacking for most activepharmaceutical ingredients (APIs), it is important to identify strategies to prioritise APIs for ecotoxicity test-ing and environmental monitoring. We have used nine previously proposed prioritisation schemes, both risk-and hazard-based, to rank 582 APIs. The similarities and differences in overall ranking results and input datawere compared. Moreover, we analysed howwell the methods ranked seven relatively well-studied APIs. It isconcluded that the hazard-based methods were more successful in correctly ranking the well-studied APIs,but the fish plasma model, which includes human pharmacological data, also showed a high success rate.The results of the analyses show that the input data availability vary significantly; some data, such as logP,are available for most API while information about environmental concentrations and bioconcentration arestill scarce. The results also suggest that the exposure estimates in risk-based methods need to be improvedand that the inclusion of effect measures at first-tier prioritisation might underestimate risks. It is proposedthat in order to develop an adequate prioritisation scheme, improved data on exposure such as degradationand sewage treatment removal and bioconcentration ability should be further considered. The use of ATCcodes may also be useful for the development of a prioritisation scheme that includes the mode of actionof pharmaceuticals and, to some extent, mixture effects.
© 2012 Elsevier B.V. All rights reserved.
1. Introduction
The presence of pharmaceuticals in the aquatic environment, andthe associated risk for aquatic organisms, has gained increasing con-cern over the last years (Fent et al., 2006; Halling-Sörensen et al.,1998). Pharmaceutical substances have been detected in surface wa-ters worldwide (Fick et al., 2009; Larsson et al., 2007; Phillips et al.,2010; Castensson and Ekedahl, 2010; Halling-Sörensen et al., 1998;Heberer, 2002; Kümmerer, 2009; Santos et al., 2010) and althoughthey are generally less persistent than the classical persistent organicpollutants, many are not readily degraded and their continuous re-lease render them semi-persistent (Daughton and Ternes, 1999).Moreover, pharmaceuticals deserve special attention as environmen-tal contaminants since they are designed to interfere with biologicalprocesses already at low concentrations (Ankley et al., 2007).
Since 2005, the European Medicines Agency (EMA) requires thatan environmental risk assessment is included when applying fornew marketing authorisations for pharmaceuticals for human use
46 8 790 9517.
rights reserved.
(EMEA, 2006). However, for most APIs currently on the market, theknowledge about environmental fate and the toxicity to aquatic or-ganisms remains scarce. Given that resources for testing are limited,the prompt conception of useful and adequate prioritisation schemesfor further ecotoxicity testing and environmental monitoring of phar-maceutical substances is of great environmental importance (Brookset al., 2009). A useful first tier prioritisation procedure should gener-ate as few false negatives as possible and still not too many false pos-itives. At the first tier the false negatives are most problematicbecause they will not continue to the next level. The false positiveson the other hand will be selected for further scrutiny at the nexttier (Hansson and Rudén, 2007). It is also important that priority set-ting is systematic, transparent, based on relevant data, and readily ap-plicable to all or most APIs on the market.
Several prioritisation and ranking schemes have been proposed(Berninger and Brooks, 2010; Besse and Garric, 2008; Christen et al.,2010; Cooper et al., 2008; Fick et al., 2010b; Huggett et al., 2003;Kools et al., 2008; Kostich and Lazorchak, 2008; Kumar andXagoraraki, 2010; Muñoz et al., 2008; Perazzolo et al., 2010;Sanderson et al., 2004; Wennmalm and Gunnarsson, 2005). These ap-proaches are based on different types of data, often combined withexpert judgement and/or case-by-case assessment. Systematic

Table 1Types of data included in nine different prioritisation schemes.
Datainclusion
FPM Soldkg/year
PEC/PNEC
MECSV/PNEC
Cooperaq env
CEC PBT QSAR logP
Sales stats(kg)
+ + + − − − − − −
Potency(pharma)
+ − − − − + − − −
Effect data − − + + + − + − −Water conc − − − + + − − − −LogP + − − − + + + + +Modelling − − − − − − − + −Persistency/fate
− − − − + − + − −
103V. Roos et al. / Science of the Total Environment 421-422 (2012) 102–110
comparisons of different approaches are needed in order to developimproved approaches.
The aim of the present study was to compare and discuss a set ofpreviously proposed ranking methods/prioritisation schemes suitablefor first-tier prioritisation. The focus is on risks to aquatic species.
2. Methods
2.1. Compilation of a database
For the purpose of this paper a database was compiled containingdata for the APIs currently on the Swedish market. The complete da-tabase used for our comparisons of different prioritisation schemes isavailable as Table S1 in the supplementary material. All data were col-lected from open sources.
Initially all APIs currently on the Swedish market (autumn 2010)were selected. We then deselected the APIs not covered by the cur-rent EMA directives, i.e. vitamins, electrolytes, amino acids, peptides,proteins, carbohydrates, lipids, vaccines and herbal medicinal products(EMEA, 2006). We further excluded APIs that are mainly used for otherpurposes than as pharmaceuticals, e.g. caffeine and nicotine. Moreover,only APIs with eukaryotic primary targets were included, i.e. antibioticsand antivirals were excluded. In total, 582 APIswere included in the da-tabase. The database was supplemented with the available input datarequired according to the criteria in the different prioritisation schemesincluded in this study and described below.
2.2. Selection of prioritisation schemes
The included schemes for prioritisation are based on differenttypes of data (Table 1). The schemes are briefly introduced belowand the reason for inclusion is indicated.
2.2.1. The fish plasma model (FPM)The fish plasma model (FPM) was proposed by Huggett et al.
(2003). This model compares the human therapeutic plasma concen-tration (HTPC) for an API to a calculated fish plasma steady state con-centration (FssPC). The latter is estimated from the predictedenvironmental concentration (PEC) and a theoretical bioconcentra-tion factor from water to fish based on the lipophilicity (logP) of thecompound. The model does not take into account that some APIs arelikely to be ionised at ambient pH, however the use of logP providesa more conservative estimate of bioconcentration (Fitzsimmons et al.,2001; Huggett et al., 2003).
The model thus provides a ratio of two concentrations (HTPC/FssPC) which Huggett et al. originally referred to as “effect ratio”but which we prefer to call “concentration ratio” (CR). A lower CRcorresponds to a higher risk. The CR is thought to reflect the likeli-hood for a pharmacological (but not necessarily adverse) responsein fish, assuming that homologs to the human drug targets are func-tionally conserved in fish. The FPM is thus based on pharmacological
data (potency) as well as on sales statistics and physicochemicalproperties (logP).
2.2.2. PEC/PNECPEC/PNEC (predicted environmental concentration/predicted no-
effect concentration) is the traditional approach to environmentalrisk assessment. For the comparison, the same PNEC values werealso included in a MEC/PNEC ratio (MEC=measured environmentalconcentration). The PEC as well as the MEC values used in thisstudy were based on Swedish conditions to facilitate comparisons be-tween the two approaches. PEC/PNEC ratios were collected from theSwedish voluntary environmental classification of pharmaceuticalsat www.fass.se (Mattson, 2007; Mattson et al., 2007) and MEC valueswere collected from the Stockholm Water Company (Wahlberg et al.,2010).
2.2.3. Swedish sales statistics in kilogrammes per yearThis is the prioritisation principle used for regulatory purposes. In
the EMA legislation it constitutes an important trigger point for fur-ther testing of APIs (EMEA, 2006). Swedish sales statistics in kilo-grammes for 2009 were used (Apotekens Service, 2010).
2.2.4. The “aquatic environment” ranking (Cooper et al., 2008)The “aquatic environment” ranking was selected since it was
designed to include variables of particular interest for risks to theaquatic environment, e.g. environmental half-life, fish and crustaceantoxicity, and surface water concentration (Cooper et al., 2008).
Several hazard-based prioritisation schemes were furthermoreconsidered. Hazard-based methods have the advantage of being di-rectly applicable in every country irrespective of pharmaceutical useand/or sewage treatment systems.
2.2.5. The critical environmental concentration (CEC)CEC is a hazard measure proposed by Fick et al. (2010b), which
uses the same equations as the FPM but is independent of the expo-sure/PEC value.
2.2.6. The persistency/bioaccumulation/(eco)toxicity (PBT) score rankingIs a method published by the Stockholm County Council (Wennmalm
and Gunnarsson, 2005) and available at www.janusinfo.se. PBT is also ageneral and common approach to environmental risk assessment.
2.2.7. The QSARA QSAR approach for first-tier prioritisation was proposed by
Sanderson et al. (2004). This model generates PNECs assuming a com-mon mode of action (narcosis). This model was chosen since narcosisis generally not considered a relevant mode of action for APIs.
2.2.8. logP rankingThis is a simplistic approach but it was included since the logP is
input data in several of the other selected ranking methods. ThelogP values were retrieved from the EPI Suite™ KOWWIN program(US EPA, 2011).
The mode of action of pharmaceuticals may provide useful infor-mation regarding the potential (eco)toxic effect and several methodsthat try to include such data have been proposed (Besse and Garric,2008; Christen et al., 2010; Kumar and Xagoraraki, 2010). None ofthe suggested approaches could however be included in this studysince all aspects were not described in a sufficiently transparentway and since they rely too heavily on expert judgement to fit ourstandards of a first-tier prioritisation process. Instead we used preg-nancy categories and a selection of ATC codes as two different types

Table 2Number and percentage of APIs in the prioritisation database (total: 582) that could beranked according to nine different prioritisation schemes.
Ranking method No. of APIs % of APIs
FPM 324 55.7sold kg/year 397 68.2PEC/PNEC 196 33.7MECSV/PNEC 44 7.6Cooper aq env 140 24.1CEC 344 59.1PBT 272 46.7QSAR HQ 327 56.2logP 580 99.7
FPM Fish plasma modelPEC Predicted environmental concentrationPNEC Predicted no effect concentrationMEC Measured environmental concentrationCEC Critical environmental concentrationPBT Persistency, bioaccumulation, toxicityQSAR Quantitative structure-activity relationshipHQ Hazard quotient
104 V. Roos et al. / Science of the Total Environment 421-422 (2012) 102–110
of relatively simplistic (1/0) hazard estimates related to pharmaco-logical mode of action.
2.2.9. Pregnancy categoriesThe pregnancy category, which is an assessment of the risk of foe-
tal injury due to pharmaceutical exposure via the mother, has beensuggested as a method to select APIs that may have potential toxic ef-fect on exposed wildlife (Kumar and Xagoraraki, 2010). Pregnancycategories are product-based and in Sweden there are six categories:
▪ A (adequate and well-controlled human studies have failed todemonstrate a risk to the foetus),
▪ B:1 (animal reproduction studies have failed to demonstrate a riskto the foetus),
▪ B:2 (animal reproduction studies are inadequate or missing butavailable data do not demonstrate any increased risk to thefoetus),
▪ B:3 (animal reproduction studies have shown an increased occur-rence of birth defects or other adverse effects on the reproductiveprocess, whose importance for humans are unclear),
▪ C (drugs that in humans, has given or may be reasonably likely topose a risk to the foetus and/or the newborn child without directlycausing malformations), and
▪ D (drugs that in humans are likely to cause increased incidence offoetal malformations or other forms of permanent disability).
With the help of the trade organisation for the research-basedpharmaceutical industry in Sweden (LIF) the available Swedish preg-nancy categories from www.fass.se were extracted for all productscontaining any of the selected APIs. When more than one risk catego-ry was indicated for an API, the category indicating the highest riskwas chosen. When the pregnancy category for an API was not avail-able through www.fass.se, the equivalent from the United StatesFood and Drug Administration (US FDA) was used. We grouped thesix categories into two groups where the categories A, B:1 and B:2 de-scribed no risks to animals or humans and B:3, C and D were classifiedas potential risks for foetal injury in animals or humans.
2.2.10. Anatomical therapeutic chemical (ATC) classification codesWe made a selection of ATC classification codes that would in-
clude APIs with possible population effects, namely APIs with directeffects on reproduction and/or cytotoxic compounds, assuming thattargets are functionally conserved in at least some aquatic organisms.The selected ATC codes were:
▪ prostaglandins (A02BB),▪ oxytocics/uterus-contracting agents (G02A),▪ contraceptives for topical use (G02B),▪ sex hormones and modulators of the genital system (G03),▪ antineoplastic agents (L01), and▪ endocrine agents used in the treatment of neoplastic diseases(L02).
2.3. The relative risk comparison measure
Due to differences in data availability, the different prioritisationschemes allowed for ranking of different numbers of APIs. A standar-dised comparison measure was developed to enable comparisons ofrankings between subsets containing different numbers of APIs. Theabsolute rank positions within each list were divided by the numberof APIs ranked according to that particular scheme in order to obtaina relative rank. The relative rank for each API was then expressed as 1— relative rank. For the purposes of this paper, relative risks whererated as “low” for values b0.25; “moderate” for values 0.26–0.74;and “high” for values >0.75.
Table 2 lists the number and percentage of APIs in the prioritisa-tion database that could be ranked according to each scheme.
2.4. Correlation analysis of ranking methods
The correlation between relative ranking results for APIs using dif-ferent prioritisation schemes was evaluated in pairs. For each pair ofprioritisation schemes, relative ranks for APIs ranked using bothschemes were correlated using the MS Excel correl function, whichcorresponds to a Spearman rank correlation. Correlation analyses re-veal overall similarities and differences in prioritisation approaches,but do not provide information on whether a method is good at iden-tifying APIs with high risk/hazard or not.
2.5. Selection of key APIs
In order to make a tentative assessment of how well the differentmodels could distinguish between high and low risk APIs, an analysiswas made on a handful of reasonably well investigated pharmaceuti-cals. Seven key API were selected and divided into three groups:(i) ethinylestradiol and levonorgestrel, for which relatively strong in-dications exists for adverse effects at concentrations regularly foundin treated municipal effluents (Fick et al., 2010a; Gyllenhammar etal., 2009; Kvarnryd et al., 2011; Parrott and Blunt, 2005; Zeilinger etal., 2009); (ii) carbamazepine, diclofenac, and fluoxetine, for whichexperimental data indicates some environmental effects at concen-trations approaching those found in municipal effluents, thus in thiscontext representing a moderate environmental risk (Cuklev et al.,2011; Fent et al., 2006; Ferrari et al., 2003; Kostich et al., 2010;Mehinto et al., 2010; Pery et al., 2008; Santos et al., 2010; Schwaigeret al., 2004; Triebskorn et al., 2004); and (iii) atenolol and paraceta-mol (acetaminophen), for which fairly comprehensive data indicatea low environmental risk (Brun et al., 2006; Fent et al., 2006; Küsteret al., 2009; Winter et al., 2008).
3. Results
3.1. Absolute and relative ranking results
The APIs ranked 1–32 according to each prioritisation scheme arepresented in Table 3. Note that in the case of the PBT classification, 32APIs shared the highest score of 9 and these are therefore presentedalphabetically. The complete relative risk ranking lists are presentedin Table S2. An alphabetical list of APIs with absolute ranks and rela-tive risks according to each prioritisation scheme is given in Table S3.
A majority of the APIs in the prioritisation database, 404 out of 582(69%, Table S1), had been issued a pregnancy category indicating a
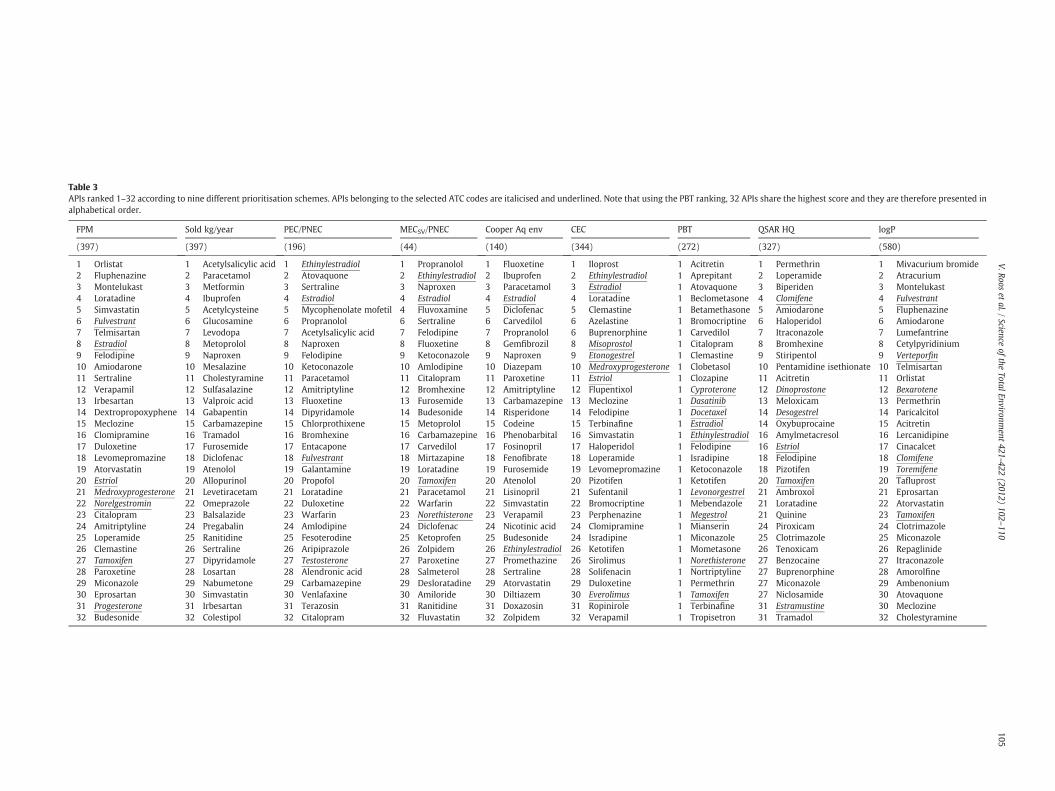
Table 3APIs ranked 1–32 according to nine different prioritisation schemes. APIs belonging to the selected ATC codes are italicised and underlined. Note that using the PBT ranking, 32 APIs share the highest score and they are therefore presented inalphabetical order.
FPM Sold kg/year PEC/PNEC MECSV/PNEC Cooper Aq env CEC PBT QSAR HQ logP
(397) (397) (196) (44) (140) (344) (272) (327) (580)
1 Orlistat 1 Acetylsalicylic acid 1 Ethinylestradiol 1 Propranolol 1 Fluoxetine 1 Iloprost 1 Acitretin 1 Permethrin 1 Mivacurium bromide2 Fluphenazine 2 Paracetamol 2 Atovaquone 2 Ethinylestradiol 2 Ibuprofen 2 Ethinylestradiol 1 Aprepitant 2 Loperamide 2 Atracurium3 Montelukast 3 Metformin 3 Sertraline 3 Naproxen 3 Paracetamol 3 Estradiol 1 Atovaquone 3 Biperiden 3 Montelukast4 Loratadine 4 Ibuprofen 4 Estradiol 4 Estradiol 4 Estradiol 4 Loratadine 1 Beclometasone 4 Clomifene 4 Fulvestrant5 Simvastatin 5 Acetylcysteine 5 Mycophenolate mofetil 4 Fluvoxamine 5 Diclofenac 5 Clemastine 1 Betamethasone 5 Amiodarone 5 Fluphenazine6 Fulvestrant 6 Glucosamine 6 Propranolol 6 Sertraline 6 Carvedilol 6 Azelastine 1 Bromocriptine 6 Haloperidol 6 Amiodarone7 Telmisartan 7 Levodopa 7 Acetylsalicylic acid 7 Felodipine 7 Propranolol 6 Buprenorphine 1 Carvedilol 7 Itraconazole 7 Lumefantrine8 Estradiol 8 Metoprolol 8 Naproxen 8 Fluoxetine 8 Gemfibrozil 8 Misoprostol 1 Citalopram 8 Bromhexine 8 Cetylpyridinium9 Felodipine 9 Naproxen 9 Felodipine 9 Ketoconazole 9 Naproxen 9 Etonogestrel 1 Clemastine 9 Stiripentol 9 Verteporfin10 Amiodarone 10 Mesalazine 10 Ketoconazole 10 Amlodipine 10 Diazepam 10 Medroxyprogesterone 1 Clobetasol 10 Pentamidine isethionate 10 Telmisartan11 Sertraline 11 Cholestyramine 11 Paracetamol 11 Citalopram 11 Paroxetine 11 Estriol 1 Clozapine 11 Acitretin 11 Orlistat12 Verapamil 12 Sulfasalazine 12 Amitriptyline 12 Bromhexine 12 Amitriptyline 12 Flupentixol 1 Cyproterone 12 Dinoprostone 12 Bexarotene13 Irbesartan 13 Valproic acid 13 Fluoxetine 13 Furosemide 13 Carbamazepine 13 Meclozine 1 Dasatinib 13 Meloxicam 13 Permethrin14 Dextropropoxyphene 14 Gabapentin 14 Dipyridamole 14 Budesonide 14 Risperidone 14 Felodipine 1 Docetaxel 14 Desogestrel 14 Paricalcitol15 Meclozine 15 Carbamazepine 15 Chlorprothixene 15 Metoprolol 15 Codeine 15 Terbinafine 1 Estradiol 14 Oxybuprocaine 15 Acitretin16 Clomipramine 16 Tramadol 16 Bromhexine 16 Carbamazepine 16 Phenobarbital 16 Simvastatin 1 Ethinylestradiol 16 Amylmetacresol 16 Lercanidipine17 Duloxetine 17 Furosemide 17 Entacapone 17 Carvedilol 17 Fosinopril 17 Haloperidol 1 Felodipine 16 Estriol 17 Cinacalcet18 Levomepromazine 18 Diclofenac 18 Fulvestrant 18 Mirtazapine 18 Fenofibrate 18 Loperamide 1 Isradipine 18 Felodipine 18 Clomifene19 Atorvastatin 19 Atenolol 19 Galantamine 19 Loratadine 19 Furosemide 19 Levomepromazine 1 Ketoconazole 18 Pizotifen 19 Toremifene20 Estriol 20 Allopurinol 20 Propofol 20 Tamoxifen 20 Atenolol 20 Pizotifen 1 Ketotifen 20 Tamoxifen 20 Tafluprost21 Medroxyprogesterone 21 Levetiracetam 21 Loratadine 21 Paracetamol 21 Lisinopril 21 Sufentanil 1 Levonorgestrel 21 Ambroxol 21 Eprosartan22 Norelgestromin 22 Omeprazole 22 Duloxetine 22 Warfarin 22 Simvastatin 22 Bromocriptine 1 Mebendazole 21 Loratadine 22 Atorvastatin23 Citalopram 23 Balsalazide 23 Warfarin 23 Norethisterone 23 Verapamil 23 Perphenazine 1 Megestrol 21 Quinine 23 Tamoxifen24 Amitriptyline 24 Pregabalin 24 Amlodipine 24 Diclofenac 24 Nicotinic acid 24 Clomipramine 1 Mianserin 24 Piroxicam 24 Clotrimazole25 Loperamide 25 Ranitidine 25 Fesoterodine 25 Ketoprofen 25 Budesonide 24 Isradipine 1 Miconazole 25 Clotrimazole 25 Miconazole26 Clemastine 26 Sertraline 26 Aripiprazole 26 Zolpidem 26 Ethinylestradiol 26 Ketotifen 1 Mometasone 26 Tenoxicam 26 Repaglinide27 Tamoxifen 27 Dipyridamole 27 Testosterone 27 Paroxetine 27 Promethazine 26 Sirolimus 1 Norethisterone 27 Benzocaine 27 Itraconazole28 Paroxetine 28 Losartan 28 Alendronic acid 28 Salmeterol 28 Sertraline 28 Solifenacin 1 Nortriptyline 27 Buprenorphine 28 Amorolfine29 Miconazole 29 Nabumetone 29 Carbamazepine 29 Desloratadine 29 Atorvastatin 29 Duloxetine 1 Permethrin 27 Miconazole 29 Ambenonium30 Eprosartan 30 Simvastatin 30 Venlafaxine 30 Amiloride 30 Diltiazem 30 Everolimus 1 Tamoxifen 27 Niclosamide 30 Atovaquone31 Progesterone 31 Irbesartan 31 Terazosin 31 Ranitidine 31 Doxazosin 31 Ropinirole 1 Terbinafine 31 Estramustine 30 Meclozine32 Budesonide 32 Colestipol 32 Citalopram 32 Fluvastatin 32 Zolpidem 32 Verapamil 1 Tropisetron 31 Tramadol 32 Cholestyramine
105V.Roos
etal./
Scienceofthe
TotalEnvironment
421-422(2012)
102–110

106 V. Roos et al. / Science of the Total Environment 421-422 (2012) 102–110
potential risk for foetal injury. 89 APIs were assigned one or more ofthe selected ATC codes. These APIs are italicised and underlined inTable 3.
3.2. Similarities and differences between ranking methods
3.2.1. Overall ranking resultsThe results from the pair-wise correlation analyses shows that the
correlation between methods ranged from −0.24 (sold kg/year vsCEC) to 0.87 (PEC/PNEC vs MECSV/PNEC). In general, the relativeranks of APIs using ranking methods incorporating logP values(FPM, CEC, QSAR and logP) correlated well with each other(Table 4). The sold kg/year ranking exhibited the overall lowest similar-ity to other methods. The number of APIs in each analysis ranged from34 (MECSV/PNEC vs Cooper aq env) to 396 (sold kg/year vs logP).
3.2.2. Ability of methods to correctly assess key APIsThe relative risk levels of the key APIs are summarised in Fig. 1A–
C.
3.2.2.1. APIs with empirical data indicating high risk: Ethinylestradioland levonorgestrel. The synthetic oestrogen ethinylestradiol wasassigned a high relative risk using all prioritisation schemes exceptwhen ranking APIs according to sold kg/year when the relative riskwas instead rated as low (Fig. 1A). In terms of absolute rank positions,the PEC/PNEC and PBT rankings both place ethinylestradiol at the topposition, while the MECSV/PNEC and CEC rankings place it second high-est (Table 3). The gestagen levonorgestrel was assigned a high relativerisk using the PBT ranking (top absolute rank) as well as using thepotency-based FPM and CEC rankings. Apart from the MECSV/PNEC,which does not cover levonorgestrel, the remaining ranking methodsassigned amoderate relative risks to levonorgestrel (Fig. 1A).Moreover,ethinylestradiol as well as levonorgestrel belong to the selected ATCcodes and are classified as potential risks for foetal injury.
3.2.2.2. APIs with empirical data indicating a moderate risk: Carbamaze-pine, diclofenac, and fluoxetine. The relative risk of the antiepileptic car-bamazepine was rated as high by the sold kg/year, PEC/PNEC, and
Table 4Correlation coefficients for relative ranks of ranked APIs in common. Number of ranked APIs in
FPM sold kg/year PEC/PNECMEC SV/
PNEC
FPM0.37
(324)
0.38
(137)
0.31
(39)
sold kg/year0.55
(154)
0.12
(41)
PEC/PNEC0.87
(44)
MEC SV/PNEC
Coope raq env
CEC
PBT
QSAR HQ
logP
Cooper aq env rankings; and as low using the CEC ranking. The remain-ing methods assigned a moderate relative risk to carbamazepine(Fig. 1B). Diclofenac, a non-steroidal anti-inflammatory drug, wasassigned a high relative risk using the FPM, sold kg/year, PEC/PNEC,Cooper aq env, and logP rankings; and a moderate relative risk usingthe remaining methods (Fig. 1B). The selective serotonin reuptake in-hibitor (SSRI) fluoxetine was the API in our selection with the lowestvariation in assigned relative risks: all methods assigned fluoxetine ahigh or moderate relative risk (Fig. 1B). The Cooper aq env rankingplaced fluoxetine at the top in absolute ranks (Table 3). Neither carba-mazepine nor diclofenac or fluoxetine belong to the selected ATCcodes, but all three are classified as potential risks for foetal injury.
3.2.2.3. APIs with empirical data suggesting low risk: Atenolol and para-cetamol. The relative risk of atenolol, a beta-adrenoreceptor antagonist,was rated as low by the CEC and logP rankings; as moderate using theFPM, PBT, and QSAR rankings; and as high using the sold kg/year andCooper aq env ranking methods (Fig. 1C). Atenolol could not be rankedaccording to the PEC/PNEC and MECSV/PNEC methods.
The analgetic and antipyretic paracetamol was assigned very dif-ferent relative risks depending on the prioritisation scheme used(Fig. 1C). The sold kg/year (absolute rank 2), PEC/PNEC, and Cooperaq env (absolute rank 3) rankings rated the relative risk of paraceta-mol as high; the CEC and logP rankings as low; and the remainingmethods as moderate (Table 3, Fig. 1C). Neither paracetamol noratenolol belong to the selected ATC codes, but both are classified aspotential risks for foetal injury.
4. Discussion and conclusions
As discussed above, a first-tier prioritisation scheme should be aswidely applicable as possible and should therefore ideally be based ondata that are, or can become, readily available for all pharmaceuticals.However, the need for data availability needs to be balanced against rel-evance. For example, logP values are available for 580 (99.7%) of our se-lected APIs and thus allow for a comprehensive prioritisation process,but the relevance of logP values for pharmaceuticals is under debate(as referenced in e.g. Tarazona et al., 2009). On the other hand, mea-
common in parentheses.
Cooper
aq envCEC PBT QSAR HQ logP
0.20
(116)
0.77
(277)
0.26
(192)
0.51
(202)
0.71
(324)
0.20
(125)
-0.24
(278)
-0.22
(214)
-0.14
(234)
-0.03
(396)
0.30
(73)
0.04
(135)
0.24
(162)
0.09
(106)
0.28
(196)
0.28
(34)
0.20
(39)
0.29
(42)
0.10
(40)
0.24
(44)
0.09
(113)
-0.07
(96)
0.12
(101)
0.17
(139)
0.43
(201)
0.60
(226)
0.78
(344)
0.39
(164)
0.34
(272)
0.68
(327)

A
B
0.0
0.1
0.2
0.3
0.4
0.5
0.6
0.7
0.8
0.9
1.0
Risk-based FPM
Risk-based sold kg/year
Risk-based FPM
Risk-based sold kg/year
Risk-based FPM
Risk-based sold kg/year
Risk-based
PEC/PNEC
Risk-based
MECSV/PNEC
Risk-based
Cooper aq env
Hazard-based
CEC
Hazard-based Hazard-based
QSAR HQ
Hazard-based
logP
Ethinylestradiol Levonorgestrel
0.6
0.7
0.8
0.9
1.0
Carbamazepine Diclofenac Fluoxetine
C
0.0
0.1
0.2
0.3
Rel
ativ
e ri
sk
0.0
0.1
0.2
0.3
0.4
0.5
0.6
0.7
0.8
0.9
1.0
PBT
Risk-based
PEC/PNEC
Risk-based
MECSV/PNEC
Risk-based
Cooper aq env
Hazard-based
CEC
Hazard-based Hazard-based
QSAR HQ
Hazard-based
logPPBT
Risk-based
PEC/PNEC
Risk-based
MECSV/PNEC
Risk-based
Cooper aq env
Hazard-based
CEC
Hazard-based Hazard-based
QSAR HQ
Hazard-based
logPPBT
Rel
ativ
e ri
sk
0.0
0.1
0.2
0.3
0.4
0.5
0.6
0.7
0.8
0.9
1.0
Rel
ativ
e ri
sk
Atenolol Paracetamol
Fig. 1. Relative risks of seven key APIs according to nine different prioritisation schemes. (A) APIs with strong indications of risk, (B) APIs with some indications of risk, (C) APIs withindications of low risk.
107V. Roos et al. / Science of the Total Environment 421-422 (2012) 102–110
sured environmental/water concentrations (MECs) in Sweden (MECSV)are only available for 71 (12%) of our selected APIs and is therefore oflimited use for first-tier prioritisation purposes, although they inmany cases may be more relevant for risk assessments than PECs.
Our comparison included risk- as well as hazard-based prioritisa-tion schemes. In general, risk-based approaches are preferred over
hazard-based methods since actual risk depends on the combined ef-fects of the exposure situation and the inherent hazard of the API. Incase of insufficient exposure data, hazard-based methods may stillbe useful to indicate APIs that are of interest for monitoring purposes.Inadequate exposure estimations confer a risk of putting too muchemphasis and research efforts into large-volume substances.

108 V. Roos et al. / Science of the Total Environment 421-422 (2012) 102–110
The pair-wise correlations of relative ranks of APIs shows, asexpected, that prioritisation schemes based on the same types ofdata exhibited the highest similarities in ranking results. This indi-cates that the choice of variables to include in a prioritisation schememight be more important than the mathematical operations includedin the model. Furthermore, the high similarities between the simplis-tic logP ranking and the FPM and CEC rankings (correlation coeffi-cients 0.71 and 0.78, respectively) suggest a strong dependence ofthe twomethods on the logP value. It is quite plausible that an adjust-ment of the logP for expected ionisation at environmental pH wouldimprove the assessment of bioconcentration potential for many APIsand that the usage of logP of the neutral form introduces a systematicoverestimation of acids and bases (Valenti et al., 2009; Rayne andForest, 2010). On the other hand, adjusting for ionisation did not re-sult in a better agreement between predicted and measured biocon-centration factors of several APIs in fish exposed to sewage effluents(Fick et al., 2010a). Until empirical bioconcentration factors becomeavailable for a larger number of APIs, a more conservative approachbased on non-ionised APIs may thus be motivated for first-tier test-ing, while a refinement based on ionisation may be useful at highertiers. The strong correlation (0.77) between the hazard-based CECand the risk-based FPM approaches confirms that the exposure compo-nent plays a relativelyminor role for the outcomeof the FPM in compar-ison with the inherent properties of the APIs (Schreiber et al., 2011).
The lowest similarities were found between the sold kg/year andthe hazard-based CEC and PBT rankings (correlation coefficients−0.24 and −0.22, respectively), highlighting the consequences ofchoosing to prioritise APIs based on sales statistics or on hazardousproperties.
For the seven selected well-investigated APIs, the results suggestthat the hazard-based methods, which all more or less depend onthe logP value, achieved a higher success rate in correctly identifyingAPIs of high, moderate and low environmental risk respectively com-pared to the risk-basedmethods which rely more heavily on sales sta-tistics. An interesting exception is the fish plasma model, whichseemed to be the most successful of the risk-based methods in whatwe judge to be a correct risk classification of the seven key APIs. Itis worth noting that the FPM is the only prioritisation schemeamong these nine that includes both logP values and sales statistics.
The relative risk of ethinylestradiol is particularly interesting,since ethinylestradiol is one of few pharmaceuticals for which toxicityhas been convincingly proven at environmental concentrations.Prioritisation schemes containing ecotoxicological effect data, suchas the PEC/PNEC, MECSV/PNEC, and PBT rankings all put ethinylestra-diol at the top (Table 3). However, the inclusion of effect data alreadyat first-tier prioritisation is problematic since the only APIs prioritisedfor further testing would be the ones where existing ecotoxicologicaleffect data already indicate elevated risks. This problem may be illus-trated by comparing the relative risks of ethinylestradiol and levonor-gestrel (Fig. 1A). While estrogens, especially ethinylestradiol, areestablished environmental toxicants, gestagens such as levonorges-trel have only very recently been identified as highly potent environ-mental endocrine disrupters (Fick et al., 2010a; Kvarnryd et al., 2011;Zeilinger et al., 2009). As shown in Fig. 1A, the effect data-drivenprioritisation methods (PEC/PNEC, MECSV/PNEC, Cooper aq env),which use effect data from before the true potency of levonorgestrelwas recognised, rank levonorgestrel considerably lower than ethiny-lestradiol. In contrast, methods focusing on properties such as phar-macological potency/HTPC and lipophilicity (FPM, CEC, QSAR andlogP) rank ethinylestradiol and levonorgestrel more similar whichin retrospect appears more realistic. An interesting exception is thePBT score, which ranks ethinylestradiol and levonorgestrel equallyhigh despite containing a T (toxicity) component. The explanation isthat the transformation of actual PNECs into T scores in the PBTmodel reduces the relative impact of differences in the already lowPNECs: ethinylestradiol and levonorgestrel are both assigned a
maximum T score of 3 although their respective PNECs according towww.fass.se differ by a factor of 50,000 (0.00002 vs 1 μg/L).
Although the usefulness of some kind of effect measure for risk as-sessment purposes is undisputable, the inclusion of ecotoxicologicaleffect data in first-tier prioritisation schemes might thus be errone-ous. An alternative approach, applied in the fish plasma model, is touse the human therapeutic blood plasma concentration (HTPC) as ameasure of pharmacological potency (Huggett et al., 2003). SinceHTPCs are derived during the drug development process, the use ofthis variable instead of ecotoxicological effect data greatly increasesdata availability and hence method applicability. However, pharma-cological potency in humans does not necessarily correspond withecotoxicological potential in aquatic organisms (Toutain et al., 2010)and the model assumes that pharmacological targets are presentand functionally conserved between humans and fish (Huggett etal., 2003), which is often, but not always, true (Daughton andTernes, 1999; Gunnarsson et al., 2008). Moreover, the model assumesthat the estimated concentration of a pharmaceutical in fish plasma isequally bioavailable as in humans and thus does not consider e.g.species-specific protein binding (Brown et al., 2007; Huggett et al.,2003; Miguel-Queralt and Hammond, 2008).
The relative risks of paracetamol across prioritisation schemesmay serve to illustrate the adequacy of the exposure estimation ineach model, since paracetamol, although among the most sold phar-maceuticals, is removed to almost 100% in Swedish STPs (Wahlberget al., 2010). The predicted environmental concentrations, andhence the relative risks, of paracetamol should therefore be low. Asshown in Fig. 1C, ranking methods based solely on, or containingPEC values based on, sales volumes (sold kg/year, PEC/PNEC) rankparacetamol at the top. However, when using measured water con-centrations as in the MECSV/PNEC ranking, the relative risk of paracet-amol drops to about half compared to the PEC/PNEC ranking.Moreover, this example clearly illustrates the usefulness in includingaccurate STP removal of APIs in PEC calculations. Interestingly,though, the Cooper aq env ranking lends paracetamol a high relativerisk despite being based on MECs. This discrepancy could possibly beexplained by the fact that the applied PEC and MECSV values both de-scribe Swedish conditions, while the MECs in the Cooper aq env rank-ing originate from different matrices and countries/regions (Cooperet al., 2008) where sewage treatment processes might differ fromthe Swedish situation. This discrepancy thus illustrates the need fornational adaptation of exposure estimations.
Exposure estimations may also be refined using degradation andbioconcentration data, since these properties are crucial for deter-mining the internal exposure and hence the resulting toxicity. Indeed,two APIs with similar concentrations in STP effluents and similarpharmacological properties but with different abilities to bioconcen-trate fromwater into e.g. fish would pose different risks. The fish plas-ma model takes bioconcentration of APIs into account by includingthe bioconcentration equation proposed by Fitzsimmons et al.(Fitzsimmons et al., 2001). Empirical investigations suggests thatthis equation needs to be optimised (Brown et al., 2007; Fick et al.,2010a) and, there is much discussion about the validity of using thelogP/logKow measure for polar compounds such as pharmaceuticals(Cunningham, 2008; Winter et al., 2010).
The usefulness of the pregnancy categories for prioritisation purposesseems limited since over two-thirds of the APIs in our databasewere clas-sified as posing apossible risk to the foetus, should they reach therapeuticconcentrations in wildlife species. If this categorisation represents actualrisk for adverse developmental effects also in aquatic organisms, it cer-tainly accentuates the urgent need for prompt and proper environmentalrisk assessments of pharmaceuticals. The ATC code selection could how-ever be added to a risk-based prioritisation scheme and further facilitatethe prioritisation process and increase the possibility of identifying high-risk substances. Regarding our seven key APIs, all were classified as pos-ing a possible risk to the foetus, but only the APIs confirmed to be of risk

109V. Roos et al. / Science of the Total Environment 421-422 (2012) 102–110
to the environment (ethinylestradiol and levonorgestrel) belonged to theselected ATC codes.
Whichever prioritisation scheme is preferred, it must be empiri-cally evaluated for accuracy before being applied on any largerscale. Fick et al. (2010a) initiated such an evaluation of the fish plas-ma model by comparing theoretical and experimental bioconcentra-tion factors for 16 APIs. The study by Fick et al. (2010a) constitutesthe first effort in the prioritisation approach adopted by the Mistra-Pharma research programme, in which experimental bioconcentra-tion factors will be determined for a large number of APIs. Theresults from this effort will contribute to the development of ade-quate prioritisation schemes.
In summary it is concluded that a successful prioritisation schemeought to be risk-based, i.e. involve estimations of both exposure andeffect. However, the analyses reported in this paper indicate that inorder to develop an adequate risk-based ranking method, exposureassessments need to be refined beyond sales statistics (sold kg/year) and include degradation data, sewage treatment removal andbioconcentration ability. Effect assessments, on the other hand,should not necessarily include effect data in a first-tier prioritisationprocess, but could instead include e.g. drug target conservation acrossspecies and pharmacological potency.
An interesting approachwould be to thoroughly groupAPIswith sim-ilar modes of action, possibly aided by ATC codes, and assess the cumula-tive relative risk for each group and scheme. Such an approach could giveimportant insights for the development of a prioritisation scheme that in-cludes themodes of action of pharmaceuticals and, to some degree, mix-ture effects in a transparent and readily applicable manner.
Supplementary materials related to this article can be found on-line at doi: 10.1016/j.scitotenv.2012.01.039.
Acknowledgements
The authors wish to thank LIF— the research-based pharmaceuticalindustry in Sweden for extracting pregnancy categories from their data-base. The research was funded by the Swedish Foundation for StrategicEnvironmental Research (MISTRA) and the Swedish Research Council.
References
Ankley GT, Brooks BW, Huggett DB, Sumpter JP. Repeating history: pharmaceuticals inthe environment. Environ Sci Technol 2007;41:8211–7.
Apotekens Service. http://www.apotekensservice.se/Nyheter-och-Press/Presskontakt/Lakemedelsstatistik/ 2010. Accessed on Nov 2nd.
Berninger JP, Brooks BW. Leveraging mammalian pharmaceutical toxicology and phar-macology data to predict chronic fish responses to pharmaceuticals. Toxicol Lett2010;193:69–78.
Besse JP, Garric J. Human pharmaceuticals in surface waters. Implementation of a priori-tization methodology and application to the French situation. Toxicol Lett 2008;176:104–23.
Brooks BW, Huggett DB, Boxall AB. Pharmaceuticals and personal care products: re-search needs for the next decade. Environ Toxicol Chem 2009;28:2469–72.
Brown JN, Paxéus N, Förlin L, Larsson DGJ. Variations in bioconcentration of humanpharmaceuticals from sewage effluents into fish blood plasma. Environ ToxicolPharmacol 2007;24:267–74.
Brun GL, Bernier M, Losier R, Doe K, Jackman P, Lee H-B. Pharmaceutically active com-pounds in Atlantic Canadian sewage treatment plant effluents and receiving wa-ters, and potential for environmental effects as measured by acute and chronicAquatic Toxicity. Environ Toxicol Chem 2006;25:2163–76.
Castensson S, Ekedahl A. Pharmaceutical waste: the patient role. In: Kümmerer K, HempelM, editors. Green and sustainable pharmacy. Springer Verlag; 2010. p. 179–200.
Christen V, Hickmann S, Rechenberg B, Fent K. Highly active human pharmaceuticals inaquatic systems: a concept for their identification based on their mode of action.Aquat Toxicol 2010;96:167–81.
Cooper ER, Siewicki TC, Phillips K. Preliminary risk assessment database and risk rank-ing of pharmaceuticals in the environment. Sci Total Environ 2008;398:26–33.
Cuklev F, Kristiansson E, Fick J, Asker N, Förlin L, Larsson DGJ. Diclofenac in fish: bloodplasma levels similar to human therapeutic levels affect global hepatic gene ex-pression. Environ Toxicol Chem 2011;30:2126–34.
Cunningham VL. Special characteristics of pharmaceuticals related to environmentalfate. In: Kümmerer K, editor. Pharmaceuticals in the environment: sources, fate, ef-fects and risks. Springer-Verlag; 2008. p. 23–34.
Daughton CG, Ternes TA. Pharmaceuticals and personal care products in the environment:agents of subtle change? Environ Health Perspect 1999;107(Suppl 6):907–38.
EMEA. Guideline on the environmental risk assessment of medicinal products forhuman use. European Medicines Agency (EMEA), Committee for medicinal prod-ucts for human use (CHMP) 2006: Ref EMEA/CRMP/SWP/4447/00.
Fent K, Weston AA, Caminada D. Ecotoxicology of human pharmaceuticals. Aquat Tox-icol 2006;76:122–59.
Ferrari B, Paxéus N, Lo Giudice R, Pollio A, Garric J. Ecotoxicological impact of pharma-ceuticals found in treated wastewaters: study of carbamazepine, clofibric acid, anddiclofenac. Ecotoxicol Environ Saf 2003;55:359–70.
Fick J, Söderström H, Lindberg RH, Phan C, Tysklind M, Larsson DGJ. Contamination ofsurface, ground, and drinkingwater from pharmaceutical production. Environ ToxicolChem 2009;28:2522–7.
Fick J, Lindberg RH, Parkkonen J, Arvidsson B, Tysklind M, Larsson DGJ. Therapeuticlevels of levonorgestrel detected in blood plasma of fish: results from screeningrainbow trout exposed to treated sewage effluents. Environ Sci Technol2010a;44:2661–6.
Fick J, Lindberg RH, Tysklind M, Larsson DGJ. Predicted critical environmental concen-trations for 500 pharmaceuticals. Regul Toxicol Pharmacol 2010b;58:516–23.
Fitzsimmons PN, Fernandez JD, Hoffman AD, Butterworth BC, Nichols JW. Branchialelimination of superhydrophobic organic compounds by rainbow trout (Oncor-hynchus mykiss). Aquat Toxicol 2001;55:23–34.
Gunnarsson L, Jauhiainen A, Kristiansson E, Nerman O, Larsson DGJ. Evolutionary con-servation of human drug targets in organisms used for environmental risk assess-ments. Environ Sci Technol 2008;42:5807–13.
Gyllenhammar I, Holm L, Eklund R, Berg C. Reproductive toxicity in Xenopus tropicalisafter developmental exposure to environmental concentrations of ethynylestra-diol. Aquat Toxicol 2009;91:171–8.
Halling-Sörensen B, Nors Nielsen S, Lanzky PF, Ingerslev F, Holten Lützhöft HC,Jörgensen SE. Occurrence, fate and effects of pharmaceutical substances in the en-vironment — A review. Chemosphere 1998;36:357–93.
Hansson SO, Rudén C. Towards a theory of tiered testing. Regul Toxicol Pharmacol2007;48:35–44.
Heberer T. Occurrence, fate, and removal of pharmaceutical residues in the aquatic en-vironment: a review of recent research data. Toxicol Lett 2002;131:5-17.
Huggett DB, Cook JC, Ericson JF, Williams RT. A theoretical model for utilizing mamma-lian pharmacology and safety data to prioritize potential impacts of human phar-maceuticals to fish. Hum Ecol Risk Assess 2003;9:1789–99.
Kools SA, Boxall A, Moltmann JF, Bryning G, Koschorreck J, Knacker T. A ranking of Eu-ropean veterinary medicines based on environmental risks. Integr Environ AssessManag 2008;4:399–408.
Kostich MS, Lazorchak JM. Risks to aquatic organisms posed by human pharmaceuticaluse. Sci Total Environ 2008;389:329–39.
Kostich MS, Batt AL, Glassmeyer ST, Lazorchak JM. Predicting variability of aquatic con-centrations of human pharmaceuticals. Sci Total Environ 2010;408:4504–10.
Kumar A, Xagoraraki I. Pharmaceuticals, personal care products and endocrine-disrupting chemicals in U.S. surface and finished drinking waters: a proposed rank-ing system. Sci Total Environ 2010;408:5972–89.
Kümmerer K. The presence of pharmaceuticals in the environment due to human use—present knowledge and future challenges. J Environ Manage 2009;90:2354–66.
Küster A, Alder AC, Escher BI, Duis K, Fenner K, Garric J, et al. Environmental risk assess-ment of human pharmaceuticals in the European Union: a case study with thebeta-blocker atenolol. Integr Environ Assess Manag 2009(6 Suppl.):514–23.
Kvarnryd M, Grabic R, Brandt I, Berg C. Early life progestin exposure causes arrested oo-cyte development, oviductal agenesis and sterility in adult Xenopus tropicalis frogs.Aquat Toxicol 2011;103:18–24.
Larsson DGJ, de Pedro C, Paxeus N. Effluent from drug manufactures contains extreme-ly high levels of pharmaceuticals. J Hazard Mater 2007;148:751–5.
Mattson B. A voluntary environmental classification system for pharmaceutical sub-stances. Drug Inf J 2007;41:187–91.
Mattson B, Näsman I, Ström J. Sweden's voluntary environmental drug classificationsystem. RAJ Pharma 2007:153–8. [March].
Mehinto AC, Hill EM, Tyler CR. Uptake and biological effects of environmentally relevantconcentrations of the nonsteroidal anti-inflammatory pharmaceutical diclofenac inrainbow trout (Oncorhynchus mykiss). Environ Sci Technol 2010;44:2176–82.
Miguel-Queralt S, Hammond GL. Sex hormone-binding globulin in fish gills is a portalfor sex steroids breached by xenobiotics. Endocrinology 2008;149:4269–75.
Muñoz I, Jose Gómez M, Molina-Díaz A, Huijbregts MA, Fernández-Alba AR, García-Calvo E. Ranking potential impacts of priority and emerging pollutants in urbanwastewater through life cycle impact assessment. Chemosphere 2008;74:37–44.
Parrott JL, Blunt BR. Life-cycle exposure of fathead minnows (Pimephales promelas) toan ethinylestradiol concentration below 1 ng/L reduces egg fertilization successand demasculinizes males. Environ Toxicol 2005;20:131–41.
Perazzolo C, Morasch B, Kohn T, Magnet A, Thonney D, Chèvre N. Occurrence and fateof micropollutants in the Vidy Bay of Lake Geneva, Switzerland. Part I: priority listfor environmental risk assessment of pharmaceuticals. Environ Toxicol Chem2010;29:1649–57.
Pery AR, Gust M, Vollat B, Mons R, Ramil M, Fink G, et al. Fluoxetine effects assessmenton the life cycle of aquatic invertebrates. Chemosphere 2008;73:300–4.
Phillips PJ, Smith SG, Kolpin DW, Zaugg SD, Buxton HT, Furlong ET, et al. Pharmaceuti-cal formulation facilities as sources of opioids and other pharmaceuticals to waste-water treatment plant effluents. Environ Sci Technol 2010;44:4910–6.
Rayne S, Forest K. Dow and Kaw, eff vs. Kow and K°aw: acid/base ionization effects onpartitioning properties and screening commercial chemicals for long-range trans-port and bioaccumulation potential. J Environ Sci Health A 2010;45:1550–94.
Sanderson H, Johnson DJ, Reitsma T, Brain RA,Wilson CJ, Solomon KR. Ranking and prior-itization of environmental risks of pharmaceuticals in surface waters. Regul ToxicolPharmacol 2004;39:158–83.

110 V. Roos et al. / Science of the Total Environment 421-422 (2012) 102–110
Santos LH, Araujo AN, Fachini A, Pena A, Delerue-Matos C, Montenegro MC. Ecotoxico-logical aspects related to the presence of pharmaceuticals in the aquatic environ-ment. J Hazard Mater 2010;175:45–95.
Schreiber R, Gundel U, Franz S, Kuster A, Rechenberg B, Altenburger R. Using the fishplasma model for comparative hazard identification for pharmaceuticals in the en-vironment by extrapolation from human therapeutic data. Regul Toxicol Pharma-col 2011. doi:10.1016/j.yrtph.2011.08.006.
Schwaiger J, Ferling H, Mallow U, Wintermayr H, Negele RD. Toxic effects of the non-steroidal anti-inflammatory drug diclofenac. Part I: histopathological alterationsand bioaccumulation in rainbow trout. Aquat Toxicol 2004;68:141–50.
Tarazona JV, Escher BI, Giltrow E, Sumpter J, Knacker T. Targeting the environmentalrisk assessment of pharmaceuticals: facts and fantasies. Integr Environ AssessManag 2009;6:603–13.
Toutain P-L, Ferran A, Bousquet-Mélou A. Species differences in pharmacokineticsand pharmacodynamics. In: Cunningham F, Elliott J, Lees P, editors. Compara-tive and Veterinary Pharmacology, 199. Berlin Heidelberg: Springer; 2010.p. 19–48.
Triebskorn R, Casper H, Heyd A, Eikemper R, Kohler HR, Schwaiger J. Toxic effects of thenon-steroidal anti-inflammatory drug diclofenac. Part II: cytological effects in liver,kidney, gills and intestine of rainbow trout (Oncorhynchus mykiss). Aquat Toxicol2004;68:151–66.
US EPA. KOWWIN v 1.68, in Estimation Programs Interface Suite™ for MicrosoftWindows, v 4.10. Washington, DC, USA: United States Environmental ProtectionAgency; 2011.
Valenti Jr TW, Perez-Hurtado P, Chambliss CK, Brooks BW. Aquatic toxicity of sertralineto Pimephales promelas at environmentally relevant surface water pH. EnvironToxicol Chem 2009;28(12):2685–94. [Dec].
Wahlberg C, Björlenius B, Paxéus N. Final report from the project pharmaceuticals —
presence and effects in the aquatic environment, preventive measures and possi-ble treatment methods. Stockholm: Stockholm Vatten AB; 2010.
Wennmalm Å, Gunnarsson B. Public health care management of water pollution withpharmaceuticals: environmental classification and analysis of pharmaceutical resi-dues in sewage water. Drug Inf J 2005;39:291–7.
Winter MJ, Lillicrap AD, Caunter JE, Schaffner C, Alder AC, Ramil M, et al. Defining thechronic impacts of atenolol on embryo–larval development and reproduction inthe fathead minnow (Pimephales promelas). Aquat Toxicol 2008;86:361–9.
Winter MJ, Owen SF, Murray-Smith R, Panter GH, Hetheridge MJ, Kinter LB. Using datafrom drug discovery and development to aid the aquatic environmental risk as-sessment of human pharmaceuticals: concepts, considerations, and challenges.Integr Environ Assess Manag 2010;6:38–51.
Zeilinger J, Steger-Hartmann T, Maser E, Goller S, Vonk R, Länge R. Effects of syntheticgestagens on fish reproduction. Environ Toxicol Chem 2009;28:2663–70.


![Sustainable Goals: Feasible Paths to Desirable Long-Term Futures [Licentiate thesis]](https://img.dokumen.tips/doc/110x75/631be89793f371de19012edf/sustainable-goals-feasible-paths-to-desirable-long-term-futures-licentiate-thesis.jpg)


