Embed Size (px)
Citation preview

Acceptée sur proposition du jury
pour l’obtention du grade de Docteur ès Sciences
par
Principles of checkpoint override
Ahmad SADEGHI
Thèse n° 9828
2022
Présentée le 4 février 2022
Prof. F. Courbin, président du juryProf. S. J. Rahi, directeur de thèseProf. S. Martin, rapporteuseProf. N. Buchler, rapporteurDr A. Verkhovsky, rapporteur
Faculté des sciences de baseLaboratoire de Physique des Systèmes BiologiquesProgramme doctoral en physique


To my parents and my forever love, Zahra.


Acknowledgements
I would like to express my deepest appreciation to my wife, Zahra, for all her love and patience,
especially in hard times. Without you, I could not finish my Ph.D. You are not just my wife but
the best friend I have ever had.
I would like to thank my supervisor, Professor Sahand Jamal Rahi, for his mentorship. I would
also like to thank Professor Frédéric Mila, director of the doctoral program in physics, who
advised me and helped me in many hard situations and guided me in my Ph.D. program many
times. I appreciate your kindness. I would also like to thank Professor Raphaël Butté for all of
his advice and help.
I would like to thank Professor Seyed Akbar Jafari so much for all his advice and teaching,
especially before I came to EPFL. I would like to thank Professor Hessamaddin Arfaei for his
teaching and understanding during my Master’s degree studies. I thank Professor Mahdi
Torabian and Professor Mahmud Bahmanabadi for their help and advice.
I would like to acknowledge my colleagues for their collaboration, especially Roxane Dervey. I
thank Vojislav Gligorovski for all of the times we spent together.
I would like to thank my sister for her advice and kindness especially during my Ph.D. I would
like to thank my parents-in-law for everything. I would like to thank so much my friend Amir.
I would like to thank my friends Saleh, Ali, and Mahdi.
I would also like to thank my parents for everything they did so I can graduate with a Ph.D.
because of them. My mother always encouraged me to be a mathematician and for that,
she started teaching me when I was an infant. She continued her love and encouraged me
throughout my education. My father, the kindest father, worked hard for the welfare of the
family and my education.
I will miss Professor Sina Khorasani; may he rest in peace.
Lausanne, December 5, 2021 AS
i


Abstract
Quality-control and surveillance systems are critical for biological systems. In particular, the
cell cycle, which is the process by which cells replicate, is controlled by multiple checkpoint
systems, which arrest cells when certain conditions are not met. Checkpoints ensure that
requirements on nutrient levels, genome integrity, and attachment of chromosomes to the
spindle, the machinery that pulls genetic material into two daughter cell, are fulfilled before
cells can pass specific transitions in the cell cycle. However, many of these quality-control
systems fail or are overridden: After prolonged arrests, the cell cycle continues despite the
presence of errors.1–6 The reasons for checkpoint override have remained mysterious. In
particular, checkpoint override is not understood quantitatively by experiment or theory. This
is the knowledge gap that I sought to fill with my thesis work. I sought to find dynamical
laws obeyed by error-correction and quality-control systems, using DNA repair and the DNA
damage checkpoint in budding yeast as specific experimental models. First, I helped derive a
general theory of optimal checkpoint strategies, balancing the trade-off7,8 between risk and
self-replication opportunity. We demonstrated that the mathematical problem of finding the
optimal strategy maps onto the question of calculating the optimal absorbing boundary for a
random walk, which we showed can be solved efficiently recursively. The theory predicted the
optimal override time without free parameters based on the statistics i) of error correction
and ii) of survival. We applied the theory experimentally to the DNA damage checkpoint in
budding yeast. We built budding yeast strains, in which we could control the cell cycle stage,
introduce a precise number of DNA breaks, and monitor DNA repair and checkpoint override.
For this, we developed a DNA break sensor whose fluorescence signal changed depending
on whether a DNA break was present or not. Using these systems, we quantified i) the proba-
bility distribution of repair for a double-strand DNA break (DSB), including for the critically
important, rare events deep in the tail of the distribution and ii) the survival probability after
iii

Abstract
override. Based on these parameters, the theory predicted the theoretically optimal DNA
damage override times. Finally, we measured these times precisely experimentally. We found
a remarkably close match between the optimal theory and measurements of the DNA damage
checkpoint override times as a function of the number of DSBs. The universal nature of the
balance between risk and self-replication opportunity is in principle relevant to many other
systems, suggesting potential further applications of the theory.
Keywords: Cell cycle, checkpoint, DNA damage, DNA break, override, adaptation, slippage,
budding yeast, fitness
iv

Résumé
Les systèmes de contrôle de la qualité et de surveillance sont essentiels pour les systèmes
biologiques. En particulier, le cycle cellulaire, qui est le processus par lequel les cellules se ré-
pliquent, est contrôlé par de multiples systèmes de points de contrôle, qui arrêtent les cellules
lorsque certaines conditions ne sont pas remplies. Les points de contrôle garantissent que
les exigences relatives aux niveaux de nutriments, à l’intégrité du génome et à l’attachement
des chromosomes au fuseau, la machinerie qui entraîne le matériel génétique dans deux
cellules filles, sont remplies avant que les cellules puissent passer à des transitions spécifiques
dans le cycle cellulaire. Cependant, bon nombre de ces systèmes de contrôle de la qualité
échouent ou sont dépassés : Après des arrêts prolongés, le cycle cellulaire se poursuit malgré
la présence d’erreurs.1–6 Les raisons de ce contournement des points de contrôle sont res-
tées mystérieuses. En particulier, le dépassement des points de contrôle n’est pas compris
quantitativement par l’expérience ou la théorie. C’est ce manque de connaissances que j’ai
cherché à combler avec mon travail de thèse. J’ai cherché à trouver des lois dynamiques
auxquelles obéissent les systèmes de correction des erreurs et de contrôle de la qualité, en
utilisant la réparation de l’ADN et le point de contrôle des dommages à l’ADN chez la levure
Saccharomyces cerevisiae comme modèles expérimentaux spécifiques. Tout d’abord, j’ai aidé
à dériver une théorie générale des stratégies optimales de point de contrôle, en équilibrant le
compromis 7,8 entre le risque et l’opportunité d’auto-réplication. Nous avons démontré que le
problème mathématique consistant à trouver la stratégie optimale correspond à la question
du calcul de la limite d’absorption optimale pour une marche aléatoire, dont nous avons
montré qu’elle pouvait être résolue efficacement de manière récursive. La théorie a prédit le
temps optimal d’absorption sans paramètres libres en se basant sur les statistiques i) de la
correction des erreurs et ii) de la survie. Nous avons appliqué la théorie expérimentalement
au point de contrôle des dommages à l’ADN chez la levure S. cerevisiae. Nous avons construit
v

Résumé
des souches de levure S. cerevisiae dans lesquelles nous pouvions contrôler le stade du cycle
cellulaire, introduire un nombre précis de cassures de l’ADN et surveiller la réparation de
l’ADN et le dépassement du point de contrôle. Pour cela, nous avons développé un capteur
de cassure d’ADN, dont le signal de fluorescence change selon qu’une cassure d’ADN est
présente ou non. À l’aide de ces systèmes, nous avons quantifié i) la distribution de probabilité
de réparation d’une cassure double brin de l’ADN (CDB), y compris pour les événements rares
d’importance critique situés dans la queue de la distribution, et ii) la probabilité de survie
après le dépassement du point de contrôle. Sur la base de ces paramètres, la théorie a prédit
les temps de dépassement des dommages à l’ADN théoriquement optimaux. Enfin, nous
avons mesuré ces temps avec précision de manière expérimentale. Nous avons trouvé une
correspondance remarquablement étroite entre la théorie optimale et les mesures des temps
de dépassement du point de contrôle des dommages à l’ADN en fonction du nombre de CDB.
La nature universelle de l’équilibre entre le risque et l’opportunité d’auto-réplication est en
principe pertinente pour de nombreux autres systèmes, ce qui suggère d’autres applications
potentielles de la théorie.
Mots clés : Cycle cellulaire, point de contrôle, dommages à l’ADN, cassure de l’ADN, dépasse-
ment, adaptation, levure S. cerevisiae, fitness.
vi

Contents
Acknowledgements i
Abstract iii
List of Figures ix
List of Tables xi
Abbreviations xiii
1 Introduction 1
1.1 Quantitative approaches to checkpoint override . . . . . . . . . . . . . . . . 1
1.2 Double-strand break (DSB) repair . . . . . . . . . . . . . . . . . . . . . . . . 1
1.3 DSB repair kinetics . . . . . . . . . . . . . . . . . . . . . . . . . . . . . . . . 2
1.4 DNA damage checkpoint (DDC): activation and override . . . . . . . . . . . . 3
1.5 Importance of DDC override . . . . . . . . . . . . . . . . . . . . . . . . . . . 5
1.6 Biophysics can help elucidate checkpoints . . . . . . . . . . . . . . . . . . . 6
1.7 Past theoretical work . . . . . . . . . . . . . . . . . . . . . . . . . . . . . . . 6
1.7.1 System-level theories . . . . . . . . . . . . . . . . . . . . . . . . . . . 6
1.7.2 Chemical kinetics models . . . . . . . . . . . . . . . . . . . . . . . . . 7
2 Optimal checkpoint strategies 9
2.1 Abstract . . . . . . . . . . . . . . . . . . . . . . . . . . . . . . . . . . . . . . 10
2.2 Introduction . . . . . . . . . . . . . . . . . . . . . . . . . . . . . . . . . . . . 11
2.3 Results . . . . . . . . . . . . . . . . . . . . . . . . . . . . . . . . . . . . . . . 14
2.3.1 Theoretical results . . . . . . . . . . . . . . . . . . . . . . . . . . . . . 14
vii
Contents
2.3.2 Experimental results . . . . . . . . . . . . . . . . . . . . . . . . . . . . 20
2.4 Discussion . . . . . . . . . . . . . . . . . . . . . . . . . . . . . . . . . . . . . 29
2.5 Methods . . . . . . . . . . . . . . . . . . . . . . . . . . . . . . . . . . . . . . 33
2.5.1 Strains . . . . . . . . . . . . . . . . . . . . . . . . . . . . . . . . . . . 33
2.5.2 Media changes and sonication . . . . . . . . . . . . . . . . . . . . . . 34
2.5.3 Microscopy . . . . . . . . . . . . . . . . . . . . . . . . . . . . . . . . . 34
2.5.4 Image processing . . . . . . . . . . . . . . . . . . . . . . . . . . . . . 35
2.5.5 FACS . . . . . . . . . . . . . . . . . . . . . . . . . . . . . . . . . . . . 35
2.5.6 Fit to data . . . . . . . . . . . . . . . . . . . . . . . . . . . . . . . . . . 36
2.5.7 Statistical tests . . . . . . . . . . . . . . . . . . . . . . . . . . . . . . . 36
2.6 Supplementary Information . . . . . . . . . . . . . . . . . . . . . . . . . . . 37
2.6.1 Supplementary theoretical results . . . . . . . . . . . . . . . . . . . . 37
2.6.2 Supplementary experimental results . . . . . . . . . . . . . . . . . . . 48
2.6.3 Supplementary note: Further applications . . . . . . . . . . . . . . . . 50
3 Conclusions 53
4 Future work 57
Bibliography 61
Curriculum Vitae 71
viii

List of Figures
1.1 Core wiring diagram for DDC override. . . . . . . . . . . . . . . . . . . . . . 4
1.2 Hypothetical balance setting checkpoint override times. . . . . . . . . . . . . 6
2.1 Scenarios for the self-replication dynamics of a checkpoint-arrested cell. . . . 15
2.2 Pictorial representation of checkpoint strategies. . . . . . . . . . . . . . . . . 17
2.3 Steps for computing the optimal advancement boundary. . . . . . . . . . . . 18
2.4 The ADH1pr-HOcs-yEVenus-ADH1 DSB sensor. . . . . . . . . . . . . . . . . . 21
2.5 Rate of nuclear division with respect to budding scored by microscopy. . . . . 23
2.6 Measurements of DSB repair and survival rates after checkpoint override. . . 24
2.7 The optimal checkpoint theory predicts DNA damage checkpoint override times. 27
S1 Distribution of offspring numbers for a simple checkpoint model. . . . . . . . 40
S2 Illustration of trajectories in a checkpoint strategy. . . . . . . . . . . . . . . . 44
S3 Additional plots to illustrate the recursive solution to the optimization problem. 47
S4 Supplementary data for the FACS experiments. . . . . . . . . . . . . . . . . . 48
S5 Supplementary microscopy data. . . . . . . . . . . . . . . . . . . . . . . . . . 49
ix


List of Tables
2.1 Strains used . . . . . . . . . . . . . . . . . . . . . . . . . . . . . . . . . . . . 33
xi


Abbreviations
dsDNA double-strand DNA
DDC DNA damage checkpoint
DSB double-strand DNA break
FACS fluorescence-activated cell sorting
HR homologous recombination
Met methionine
MMEJ microhomology-mediated end joining
NHEJ non-homologous end joining
ODE ordinary differential equation
ssDNA single-strand DNA
SAC spindle assembly checkpoint
YFP yellow fluorescent protein
xiii


1 Introduction
1.1 Quantitative approaches to checkpoint override
Checkpoints are molecular systems that ensure the self-replication cycle of cells, the cell cycle,
progresses only when certain criteria are met. 9 Checkpoint function is critical for health, and
dysfunction contributes to numerous diseases, including cancer. 6,10–14 Checkpoints consist of
complex gene networks and are dynamic: They turn on, off, and some checkpoints are known
to override (adapt) despite persistent damage. Checkpoint override has been observed in
yeast1,2,6,15 and mammals 3,5,16 in the DNA damage checkpoint (DDC), the spindle assembly
checkpoint (SAC), and for developmental checkpoints 4,17,18.
Although checkpoint override has been researched for decades, 3,5,16 a system-level, quantita-
tive, and dynamic analysis of checkpoint override did not exist. A goal of my thesis work was
to begin to explore checkpoints from this perspective.
1.2 Double-strand break (DSB) repair
Double-strand DNA breaks (DSBs) can be caused by a variety of processes including DNA repli-
cation, mitotic forces, or radiation and chemicals in the environment. 6,10–14 Improper repair
of DSBs can lead to genomic instability, which is why DSB repair has been intensely researched,
and budding yeast has served as a major model for elucidating DSB repair processes6.
1

Chapter 1. Introduction
Three types of DSB repair are generally distinguished: non-homologous end joining (NHEJ),
homologous recombination (HR), and microhomology-mediated end joining (MMEJ).6,13
NHEJ usually leads to a simple religation of the DNA ends generated by a break. NHEJ, however,
can also religate DNA unfaithfully, generating mutations at the break site. If religation does
not occur rapidly, the DNA is resected, that is, nucleotides are removed from one of the DNA
strands in the 5’ to the 3’ direction, exposing single-strand DNA (ssDNA) and a 3’ overhang.
This ssDNA is the prerequisite for both MMEJ and HR. HR requires a homologous template
elsewhere in the genome, which exists, for example, in diploid cells on the second homologous
chromosome. In HR, the ssDNA is used to find the homologous template, which is used
for repairing the break. The different repair pathways are controlled by different genes. HR
requires the resection machinery and RAD52, MMEJ in addition requires RAD1-RAD10, and
NHEJ requires YKU70 and YKU80. While NHEJ can occur throughout the cycle, it is the main
repair pathway in G1 phase.
The first step in these repair processes is the recognition of the ends of broken chromosomes
by the Mre11-Rad50-Xrs2 complex (MRX or MRN in mammals). The next step is the recruit-
ment of Tel1 kinase. The sliding clamp complex (called the 9-1-1 complex, formed of Ddc1,
Rad17, and Mec3 in budding yeast) then binds the dsDNA-ssDNA junction, and RPA binds to
ssDNA and recruits the Mec1-Ddc2 dimer. Mec1 and Tel1 go on to activate the DNA damage
checkpoint, which arrests the cell cycle, and to activate repair.
1.3 DSB repair kinetics
Measuring repair kinetics is critical for gaining a quantitative understanding of DNA repair and
the DNA damage checkpoint. However, NHEJ, for example, had primarily been measured in
bulk culture and only with relatively low temporal resolution. Measurements have traditionally
been performed using qPCR19–22 or other bulk culture methods23. The measurements have
generally been too coarse to deduce typical timescales for repair, e.g., ≈50% repair was seen in
about 6 hrs 22.
An alternative approach has been to aim to detect DSBs with fluorescently tagged proteins
which bind near DSBs.24–26 However, the reliability of foci formation is difficult to estab-
2

1.4. DNA damage checkpoint (DDC): activation and override
lish 24,26. Furthermore, the fluorescent signals are too weak to be detectable by flow cytometry,
which is needed to analyze large numbers of cells for rare events.
1.4 DNA damage checkpoint (DDC): activation and override
The DNA damage checkpoint causes delays in the cell cycle during which repair can oc-
cur. 6,10–14 The DDC acts at three different stages, at the G1/S transition, during S phase, and
at the G2/M transition.
The first step in DDC activation is the binding of the MRX complex at the DNA ends. Tel1 is then
recruited, followed by Sae2, Exo1, Dna2-Sgs1, and resection of DNA. After RPA coats ssDNA,
the Mec1-Ddc2 dimer is recruited to the DNA, and Dpb11 and the 9-1-1 (Ddc1-Rad17-Mec3)
complex activate Mec1. The Mec1-Ddc2 dimer and Tel1 then phosphorylate and activate the
central checkpoint kinase Rad53 with Rad9 serving as a mediator in this process. Rad53 is
a central hub in the DNA damage checkpoint, which integrates the signals from Mec1 and
Tel1. The checkpoint blocks anaphase in part by active Rad53 preventing APC-Cdc20 function.
Rad53 dephosphorylation coincides with a downregulation of the DDC, and is often taken to
be the key determinant of checkpoint downregulation.
In budding yeast, a single unrepaired DSB activates the DDC, yet, after ≈8 hr arrest at the
G2/M checkpoint, cells proceed with the cell cycle although the DSB is not repaired.1,2,27
This coincides with the dephosphorylation of Rad53, and the phenomenon has been termed
checkpoint adaptation or override. DNA damage due to X-rays 28 or telomere dysfunction 2,29
also lead to checkpoint override. A number of mutations have been found to prevent or reduce
checkpoint override, notably cdc5-ad (missense mutation in CDC5)2, ckb2∆2, yku70∆27,
among others discussed below 30,31.
The existence of mutations that abrogate override underscores the possibility that DNA dam-
age checkpoint override is functionally important to yeast cells. However, past work had
not shown definitively that override has a benefit for wild-type cells nor explained the im-
portance of its timing (≈8 hrs after one DSB). A key test to establish whether override has
a functional role is whether cells with DNA damage produce more offspring on average, if
they override their checkpoint. This was found not to be the case; in haploid yeast cells, no
3

Chapter 1. Introduction
significant difference was found between survival rates of override-competent (CDC5) or
override-incompetent (cdc5-ad) cells after X-ray irradiation. 28 On the other hand, a situation
in which checkpoint override was beneficial was created experimentally by blocking critical
pathways for DNA repair (rad52∆) or telomere maintenance (tlc1∆). 28,32,33 (This is likely to be
relevant since checkpoint override occurs in cancer cells that often have lost one or another
DNA repair mechanism.) Furthermore, it was found that DNA damage checkpoint override
occurred only if exactly one endonuclease-generated DSB was present but not if the cell had
two DSBs 27.
Many genes have been shown to affect checkpoint override, including CDC5 2, RAD5334,
PTC2 30,35, PTC3 30,35, MEC1 36, DDC2 36, YKU70 27, MRE11 27, RAD51 37, SRS2 32, SAE2 38, RDH54 39,
YKU70 27, EXO1 40, FUN30 40, VPS51 41, YPT6 41, CMR1 42, RPD3 42, BTN2 42, and HSP42 42. How
this large network computes the decision to override is mostly not understood. However,
a core network involving (CDC5, RAD53, MEC1, DDC2, and the protein phosphatase PTC2
or its paralog PTC3) is widely considered to be key.6,43 A second phosphatase, Pph3 43–45,
is sometimes considered to be important for DDC override but a pph3∆ deletion was not
sufficient to delay DDC override.44 The DDC network is particularly challenging to study
because reversible phosphorylation events are critical for its establishment, maintenance, and
reversal.
Rad53 Ptc2,3
Checkpoint arrest
Cdc5
Mec1-Ddc2
Rad9
RNR3,HUG1,...
DSBRPA
CK2
Dun1
Rfx1
Sml1
Fig. 1.1 – Core wiring diagram for DDC override.
The cdc5-ad mutation of the Polo-like kinase CDC5 was one of the first to be found to prevent
checkpoint override.2 Cdc5 is controlled transcriptionally as well as post-transcriptionally.
Since transcriptional activation of CDC5 using the GAL1 promoter sufficed to speed up check-
4

1.5. Importance of DDC override
point override, we conclude that transcriptional induction during checkpoint arrest may
suffice for Cdc5 activity. 46,47 This result also indicated that the cdc5-ad mutation could plau-
sibly be a loss-of-function mutation. However, it was found that phosphorylation of Rad53
by Cdc5 was needed for DDC override48, suggesting that cdc5-ad was a gain-of-function
mutation. Thus, the role of Cdc5 has remained difficult to pin down. 49
The PP2C phosphatases Ptc2 and Ptc3 dephosphorylate Rad53, thereby silencing it and allow-
ing override. 30 Ptc2 is thought to be controlled post-translationally by another kinase, casein
kinase 2 (CK2) to perform this function. 35 However, Ptc2 activity may not be strongly regulated
and represent a constitutive phosphatase activity. 35 Consistently, the transcripts of PTC2 and
PTC3 are not upregulated with DNA damage. 50
The amount or rate of resected DNA was thought to determine the timing of DDC override. 27,31
However, newer data called this model into question: Some mutations that slow down resec-
tion (sgs1∆, fun30∆) block override and certain mutations that increase resection (H2BK123)
speed up override. 6
1.5 Importance of DDC override
Elucidating checkpoint override from a quantitative perspective can also be expected to ad-
vance our understanding of disease. Checkpoints are corrupted in many diseases that are
driven by genetic alteration.6,10–14 Checkpoint override is associated with genomic instabil-
ity and aneuploidy in yeast and mammalian cells,3,16,28,29,33,51 and with cancer emergence
or exacerbation in human cells.5 Tumor-derived U2OS cells arrest in response to ionizing
irradiation and then override the DDC. 16
Checkpoint override provides growth advantages to yeast cells with one double-strand DNA
break (DSB), as I showed in my thesis work. 52 Thus, it is reasonable to speculate that cancer
cells explore checkpoint override as a growth strategy and remodel the checkpoint toward
increased cellular fitness 53. Future exploration of this subject in budding yeast should intensify
interest in such questions.
Checkpoint override also occurs in entirely different systems. In response to injury, check-
5

Chapter 1. Introduction
points arrest insect development, and some of these checkpoints have been shown to be
overridden if the damage is not repaired. 4 Drosophila larvae delay but do not block entry into
pupariation if their imaginal discs are damaged at specific developmental stages. 17 Principles
(but not molecular mechanisms) gleaned from yeast may feed into the broader research efforts
into checkpoints.
1.6 Biophysics can help elucidate checkpoints
SlowFast- higher probability of:-- repair-- survival
Tc
Checkpoint arrest time
- more potential progeny
0 ∞
Fig. 1.2 – Hypothetical balance settingcheckpoint override times.
Checkpoints are subjects of intense current interest due to
their biological and medical importance. However, check-
points are also conceptually fascinating for biophysicists.
Checkpoints create a risk-speed trade-off: Whenever self-
replication arrests because of errors, opportunities for pro-
ducing offspring decrease as a consequence of the delay.
On the other hand, delays may be necessary for correcting errors, e.g., for DNA damage
repair.54 How this balance (Fig. 1.2) may have shaped checkpoints and their ability to be
overridden is not understood.
In addition to being conceptually interesting, the checkpoint network is well suited to tak-
ing a biophysical approach because many of the fundamental open questions in the field
require quantitative, single-cell measurements. However, biophysics has contributed less to
checkpoint studies than to many other fields.
1.7 Past theoretical work
1.7.1 System-level theories
Despite the importance of checkpoints to biology, a theoretical understanding of checkpoint
trade-offs or strategies had not been developed. While researchers have pointed out that
checkpoints may balance opposing demands on repair success and speed,27,28,32,33 these
ideas had not been developed into a quantitative theory of checkpoint strategies. This is
precisely the gap I began to fill by providing a system-level description of checkpoint strategies
6

1.7. Past theoretical work
in terms of error repair probabilities, survival probabilities, and checkpoint arrest durations
depending on the amount of DNA damage. The balances that checkpoints strike are different
from speed-accuracy-energy dissipation balances or decision-making frameworks proposed
for sensing in chemotaxis or kinetic proofreading. 7,55–70 For checkpoints, errors such as DNA
damage or poor chromosome-spindle attachment are thought to be signaled reliably,71 and
uncertainty arises from the stochastic nature of the outcomes (survival, sickness, or death).
More closely related to our approach are analyses of the benefits of DNA repair to cancer
cells, based on coarse-grained parameters.72–74 While these ideas bear similarities to ours,
quantitative predictions and validation are rare.
1.7.2 Chemical kinetics models
In contrast to analyses of checkpoint strategies, a number of chemical kinetic models describ-
ing the dynamics of the molecular components of checkpoints have been published. Check-
point activation has been modeled by systems of ordinary differential equations (ODEs) for
yeast 75,76 or mammalian cells 77–86, which were in part followed up by experimental tests 76,85.
As far as our literature searches revealed, DDC override has not been modeled before, even
though it emerges as a decision of a complex network, which requires modeling for a clear
understanding of the mechanism. (Override of the spindle assembly checkpoint has, however,
been modeled, and we will consider stochastic escape as a possible mechanism. 76) Biochemi-
cal kinetics models have been very successful at describing the cell cycle oscillator. 87 In many
cases, models are proposed based on a consensus wiring diagram of gene interactions, which
is turned into an ODE model by ‘educated guesses’. 87
7

2 Optimal checkpoint strategies
This chapter is based on a paper currently in review:
Ahmad Sadeghi, Roxane Dervey, Vojislav Gligorovski, Sahand Jamal Rahi, “The optimal check-
point strategy balancing risk and speed predicts experimental DNA damage checkpoint over-
ride times,” biorxiv: 2020.08.14.251504
I helped conceptualize this research project, carried out the experiments, helped advance the
theory and helped write the manuscript.
9

Chapter 2. Optimal checkpoint strategies
2.1 Abstract
Why biological quality-control systems fail is often mysterious. Specifically, checkpoints in
yeast and animals are overridden after prolonged arrests allowing self-replication to proceed
despite the continued presence of errors.1–6 Although critical for the organism, checkpoint
override is not understood quantitatively by experiment or theory. To uncover dynamical laws
obeyed by error-correction systems, we derived a general theory of optimal checkpoint strate-
gies, balancing the trade-off 7,8 between risk and self-replication opportunity. We demonstrate
that the mathematical problem of finding the optimal strategy maps onto the question of
calculating the optimal absorbing boundary for a random walk, which we show can be solved
efficiently recursively. The theory predicts the optimal override time without free parameters
based on the statistics i) of error correction and ii) of survival. We applied the theory experi-
mentally to the DNA damage checkpoint in budding yeast, an intensively researched model
for eukaryotic checkpoints, whose override is nevertheless not understood quantitatively,
functionally, or at the system level. Using a novel fluorescent construct which allowed cells
with DNA breaks to be isolated by flow cytometry, we quantified i) the probability distribution
of repair for a double-strand DNA break (DSB), including for the critically important, rare
events deep in the tail of the distribution and ii) the survival probability after override. Based
on these two measurements, the optimal checkpoint theory predicted remarkably accurately
the DNA damage checkpoint override times as a function of DSB numbers, which we also
measured for the first time precisely. Thus, a first-principles calculation uncovered hitherto
hidden patterns underlying the highly noisy checkpoint override process. Our multi-DSB
results revise well-known bulk culture measurements27 and show that override is a more
general phenomenon than previously thought. The universal nature of the balance between
risk and self-replication opportunity is in principle relevant to many other systems, suggesting
potential further applications 4,74.
10

2.2. Introduction
2.2 Introduction
Error detection and correction during self-replication processes are subjects of intense current
interest. However, fundamental questions remain unanswered. A risk-speed trade-off emerges
by necessity in biological surveillance systems: Whenever self-replication arrests because
of errors, opportunities for producing offspring decrease as a consequence of the delay. On
the other hand, delays may be necessary for correcting errors, e.g., for DNA damage repair. 54
How this simple idea can lead to the potential discovery of quantitative, system-level patterns
obeyed by biological surveillance systems has remained unexplored.
Cell cycle checkpoints arrest the self-replication process, thus limiting its speed, and increase
the chances of survival when a cell encounters errors. 6,71,88 However, checkpoints show more
complex behaviors than merely gating the cell cycle depending on the presence or absence
of errors. After prolonged arrests, checkpoints such as the DNA damage checkpoint or the
spindle assembly checkpoint (SAC) are overridden in the continued presence of errors, which is
associated with genomic instability and aneuploidy in yeast and mammalian cells. 3,16,28,29,33,51
(We opt for the more general term ‘override’ in place of ‘adaptation’, ‘slippage’, or ‘leakage’ 3.)
Despite the importance of checkpoints to living systems, there are no quantitative theories of
checkpoint trade-offs or strategies. Many researchers have pointed out that checkpoints may
balance opposing demands on repair success and speed. 27,28,32,33 However, these ideas have
so far not been developed into a quantitative theory of checkpoint strategies, which would
motivate experimental measurements of the parameters of the theory and lead to validation
of new predictions. Chemical kinetic models represent the dynamics of the molecular com-
ponents of checkpoints76,77,83 but they do not indicate potential strategies for checkpoints
in an obvious manner as they primarily describe the state of the system in time. Similarly,
the potential balances that checkpoints strike are not straightforwardly explained by speed-
accuracy-energy dissipation relations or decision-making frameworks proposed for other
systems: Sensing in chemotaxis and mechanisms for kinetic proofreading address the diffi-
culties of ascertaining information and decision-making in the presence of noise. 7,55–70 This
contrasts with the case of checkpoints where errors such as DNA damage or poor chromosome-
spindle attachment are signaled reliably; 71 uncertainty arises from the seemingly stochastic
11

Chapter 2. Optimal checkpoint strategies
nature of the outcomes (survival, sickness, or death).
Experiments support the existence of a balance between risk and speed qualitatively: Budding
yeast cells with dysfunctional DNA damage (rad9∆) or spindle assembly checkpoints (mad2∆),
which arrest very briefly 6 or not noticeably 71, die at much higher rates in the presence of DNA
damage or poor spindle-chromosome binding. 71 Multiple experimental challenges have to be
overcome in order to resolve checkpoint strategies more quantitatively:
• The differences between strategies may manifest in rare events, which, by their nature,
are difficult to capture experimentally, e.g., rare, late repair events. (Over evolutionary
timescales or in large populations, rare beneficial outcomes can nevertheless suffice for
selection and fixation.)
• Checkpoints and repair systems are complicated, involving many different genes and
pathways, which makes it difficult to isolate and study specific effects without confound-
ing factors.
The DNA damage checkpoint in budding yeast, which has been intensively studied by molec-
ular biology and genetics,6,71 is particularly ripe for quantitative, system-level insights. In
haploid cells, which cannot utilize highly efficient template-based DNA repair mechanisms
such as homologous recombination, DSBs remain unrepaired in a substantial fraction of cells
for many hours. 89 For a single unrepaired DSB near the left telomere of chromosome VII, the
MAT locus, or URA3, it was observed that after an ≈8 hr arrest at the G2/M checkpoint, cells
proceeded with the cell cycle although the DSB was not repaired. 1,2,27 Difficult-to-quantify but
possibly large amounts of DNA damage due to X-rays 28 or telomere dysfunction 2,29 also lead to
checkpoint override. A number of mutations have been found to prevent or reduce checkpoint
override: cdc5-ad (missense mutation in CDC5) 2, ckb2∆2, yku70∆27, and others30,31.
The existence of mutations that abrogate override underscores the possibility that DNA dam-
age checkpoint override is functionally important to yeast cells. However, past work has not
shown that override has a benefit for wild-type cells nor explained the importance of its timing
(≈8 hrs): A key test to establish whether override has a functional role at all is whether cells with
DNA damage produce more offspring on average if they override their checkpoint. This was
12

2.2. Introduction
found not to be the case; in haploid yeast cells, no significant difference was found between
survival rates of override-performing (CDC5) or override-unable (cdc5-ad) cells after X-ray
irradiation, which causes DSBs.28 (A situation in which checkpoint override was beneficial
was created by artificially blocking critical pathways for DNA repair (rad52∆) or telomere
maintenance (tlc1∆).28,32,33) Furthermore, it was found that DNA damage checkpoint over-
ride occurred only if exactly one endonuclease-generated DSB was present but not with two
DSBs 27, indicating that override happens only under specific conditions and is not a universal
response to DNA damage in yeast. Thus, the functional relevance of override remains unclear.
A quantitative analysis of checkpoint strategies requires the statistics of rare repair events,
which have not been measured. In the absence of a genomic template with a similar DNA
sequence, repair occurs by non-homologous end joining (NHEJ)90, whose timing and effi-
ciency after DSB induction has been measured, for example, by performing qPCR 19–22 or other
quantification methods23 in bulk culture at regular time points after the break event. These
measurements showed broadly distributed repair times such that a typical repair timescale
could not be easily deduced (≈50% repair in about 6 hrs22). Bulk culture assays may be too
insensitive to quantify rare and late repair events.
Here, we present
1. the first, general theory of optimal checkpoint strategies, which is based on the funda-
mental principle of offspring maximization,
2. measurements of the two parameters of the theory, the probability distribution function
of repair and the survival probability after checkpoint override,
3. predictions of the theory: optimal override times as a function of the numbers of DSBs,
4. quantitative experimental verification of the predictions, and
5. the first measurements showing that override is indeed advantageous with wild-type
DNA repair machinery.
13

Chapter 2. Optimal checkpoint strategies
2.3 Results
2.3.1 Theoretical results
Arrest implies an exponential fitness penalty
To compute the fitness effects of different checkpoint strategies, we compared an arrested
cell to other cells in the population theoretically. The two canonical scenarios of population
genetics are exponential growth (Fig. 2.1 A) and stochastic birth-death processes in a fixed-size
population (Fig. 2.1 B). 91
In exponential growth, the expected number of progeny of a checkpoint-arrested cell is re-
duced by 2−t/T (P2+P1/2), where t is the arrest time, P2 the probability that both progeny
proliferate after the arrest, and P1 the probability that only one progeny proliferates (Fig. 2.1 A).
(In this presentation, cells either die or produce healthy progeny, in agreement with experi-
mental observations, see Supplementary Information.)
We also analyzed the effect of checkpoint arrest on the expected number of progeny in two
classical fixed-size population models, the Wright-Fisher and the Moran models91 (Supple-
mentary Information). Here, the reduction in the expected number of progeny has the same
form as for exponential growth: the product of a penalty for the arrest time, which is exponen-
tial, multiplied by a probability of proliferation. Thus, one can represent the arrest penalty
by a general factor e−t/τ, which applies in all three cases and where τ absorbs model-specific
parameters, for example, τ= T/log 2 for exponential growth.
Winning strategy maximizes the arithmetic mean of the future progeny
To evaluate how different strategies influence an organism’s reproductive success, one of two
quantities is commonly taken as a fitness function, i) the number of offspring averaged over all
possible outcomes or ii) the expected number of offspring in a typical scenario. 7,91,92 In some
instances, such as in fluctuating environments, the typical series of outcomes (ii) is thought to
be the more relevant quantity for evolutionary selection91,92, favoring bet hedging93. How-
ever, since errors and checkpoint arrests affect cells randomly, averaging over the predicted
14

2.3. Results
T+t
A
B0 T 2T 3T time
0 T 2T 3T time
Fig. 2.1 – Scenarios for the self-replication dynamics of a checkpoint-arrested cell (magenta circle) in a populationof cells (white) with generation time T . A: The exponential growth with doubling time T is delayed by a checkpointarrest of duration t (= T in this illustration) after which both, one, or no progeny (yellow circles) remains viable.Only the case where both progeny are viable is illustrated. B: In a population of fixed size N , random birth-deathprocesses change the proportions of different clones, as in the Wright-Fisher or Moran models.
number of offspring (i) is the appropriate fitness function to consider here, as we illustrate by
contrasting a random checkpoint arrest model with a fluctuating-environment model in the
Supplementary Information.
Checkpoint strategy parameters
In addition to the arrest penalty, an experimentally accessible set of parameters for analyzing
checkpoint strategies are needed:
• The remaining number of errors E(t) in a cell after arresting for time t , for example,
DSBs (potentially signaled by the amount of RPA covering resected DNA) or unattached
kinetochores. E0 = E(0) denotes the initial number of errors, and E(t) decreases with
the arrest time t as errors are corrected.
• The probability r ({ti}) that the errors are repaired at times {ti}= {t1, . . . , tE0}. When
needed, we will assume that each error is repaired independently with the cumulative
15

Chapter 2. Optimal checkpoint strategies
probability density function ρ(t) for the repair of a single error.
• The probability s (t∣{ti}) of survival if a checkpoint is overridden after an arrest of
duration t given that repairs take place at times {ti}. (A repair time ti after t (ti > t)
indicates that error i was not fixed before the checkpoint is overridden.) To simplify,
we will just write s(E) when the survival probability only depends on the number of
remaining errors E(t). If each error reduces the survival probability by the same amount,
we will write s(E)= σE .
• The probability of cell cycle advancement a (t∣{ti}), that is, of override if there are
unrepaired errors or of continuation of the self-replication cycle if there are no errors.
The cell cycle advancement probability a (t∣{ti}) represents the checkpoint strategy
and is the function that we seek to compute.
E(t), r (t∣{ti}), and s(t∣{ti}) represent the state of the cell and are determined by biochemi-
cal processes. The function a (t∣{ti}) represents the behavior of the checkpoint whose effect
on the reproductive success of the cell we analyze.
General mathematical description of checkpoint strategies
Combining the above probabilities, the fitness coefficient f is the factor by which the number
of progeny is changed due to the damage and the subsequent behavior of the checkpoint:
f [a]=∫∞
0d t
E0
∏E=1
d tE r ({ti}) s(t∣{ti})a(t∣{ti})e−t/τ
. (2.1)
Additional information regarding this expression is given in the Supplementary Information.
To visualize the processes that this functional represents, we make two simplifications: each
repair occurs independently and each error reduces the survival probability by the same
amount. This allows a graphical interpretation of the mathematical expressions, depicted in
Fig. 2.2 A.
16

2.3. Results
12
...
C
time
E0
12
...
Err
ors
rep
aire
d
A
12
...
B
t'
E'
E0-E'
12
...
D
time threshold
repair threshold stochastic
12
...
E deterministic
E0
E0
E0
E0
advancementboundary
Fig. 2.2 – Pictorial representation of checkpoint strategies. A: A checkpoint-arrested cell (red) moves to the right astime increases and moves up as repairs occur probabilistically. As prescribed by the checkpoint strategy, the celldivides into two cells (yellow). The progeny may or may not be viable. B: In the timer strategy, once a checkpoint
is activated, the cell arrests until time t ′ and then divides. The advancement boundary is a vertical line. C: In
the repair threshold strategy, cells arrest until E ′ errors remain and then divide. The advancement boundary is ahorizontal line. D, E: The optimal strategy could, in principle, be probabilistic (panel D) or deterministic (panel E).
Calculating the optimal checkpoint strategy
For comparison with the optimal strategy, we also analyzed two other plausible checkpoint
strategies, a ‘timer’ override strategy (Fig. 2.2 B) and an ‘error-threshold’ override strategy
(Fig. 2.2 C), described in the Supplementary Information.
In general, the optimal checkpoint strategy could be stochastic; that is, depending on the state
of the cell and on predictions about future outcomes, the optimal decision could be to advance
the cell cycle with a probability between zero and one. As explained in the Supplementary
Information, we have proven that the optimal strategy is not stochastic (illustrated by a
gray region in Fig. 2.2 D) but must be deterministic (dashed lines in Fig. 2.2 E). This means
17

Chapter 2. Optimal checkpoint strategies
that the optimal advancement probability a(t ,{ti}) is a Dirac delta (δ) function in t ; the
advancement probability can be represented by a sharp decision boundary in the error-time
plane (Fig. 2.2 E), which we refer to as the ‘advancement boundary’. Once a cell reaches this
boundary, the optimal decision is to advance the cell cycle with probability one.
C
time
E0
Err
ors
rep
aire
d
A B
dt
E
E-1
E
E-1
t*E,r
D
E
E-1
t*E,r
E
E
E-1
t*E,rt*
E,ℓ
t*E,ℓ ?
t*E,r ?
F
E
E-1
t*E,rt*
E,ℓ t
potential repair vs. potential wait
futureoutcomes
now vs.
represent allfuture outcomes
Fig. 2.3 – Steps for computing the optimal advancement boundary.
The problem of solving for the optimal strategy is, in principle, complicated because of the
branching nature of the decisions; the consequences of a decision at time t and with E(t)remaining errors depend on an infinite number of possible future events. However, the
optimal checkpoint strategy can be solved recursively starting from the future and working
backwards. Specifically, closed-form expressions for the advancement boundary can be found
by analyzing the points in the error-time plane from right-to-left (future-to-present) and then
from top-to-bottom (all-to-no errors corrected). In the following steps, we start with the trivial
case where all errors have been fixed (E = 0, Step 1) and calculate the advancement boundary
for E errors provided we have carried out the analysis for E −1 errors already (Steps 2-5):
18
2.3. Results
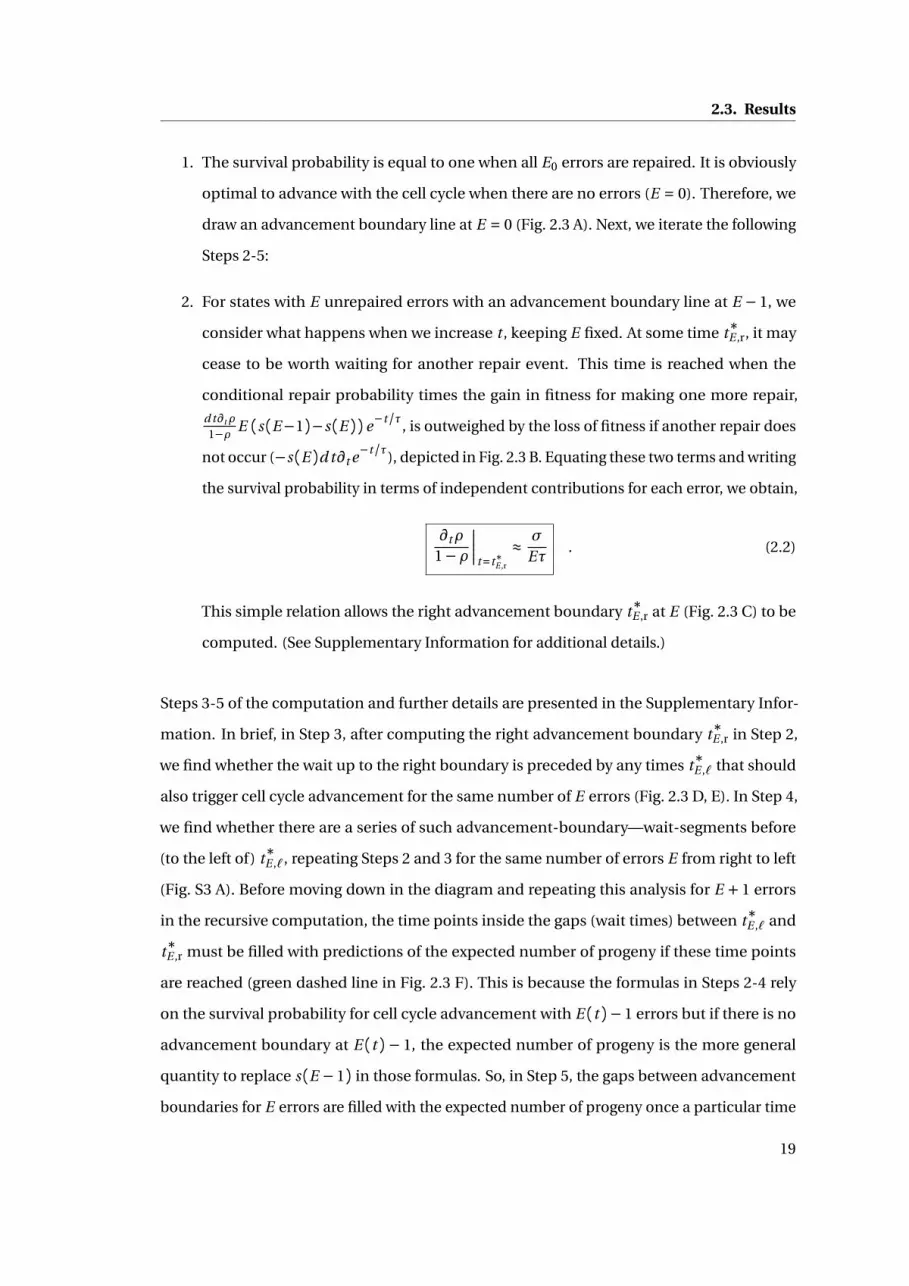
1. The survival probability is equal to one when all E0 errors are repaired. It is obviously
optimal to advance with the cell cycle when there are no errors (E = 0). Therefore, we
draw an advancement boundary line at E = 0 (Fig. 2.3 A). Next, we iterate the following
Steps 2-5:
2. For states with E unrepaired errors with an advancement boundary line at E − 1, we
consider what happens when we increase t , keeping E fixed. At some time t∗E ,r, it may
cease to be worth waiting for another repair event. This time is reached when the
conditional repair probability times the gain in fitness for making one more repair,
d t∂tρ
1−ρE (s(E−1)−s(E))e−t/τ, is outweighed by the loss of fitness if another repair does
not occur (−s(E)d t∂t e−t/τ), depicted in Fig. 2.3 B. Equating these two terms and writing
the survival probability in terms of independent contributions for each error, we obtain,
∂tρ
1−ρ
»»»»»»»t=t∗E ,r
≈σ
Eτ. (2.2)
This simple relation allows the right advancement boundary t∗E ,r at E (Fig. 2.3 C) to be
computed. (See Supplementary Information for additional details.)
Steps 3-5 of the computation and further details are presented in the Supplementary Infor-
mation. In brief, in Step 3, after computing the right advancement boundary t∗E ,r in Step 2,
we find whether the wait up to the right boundary is preceded by any times t∗E ,` that should
also trigger cell cycle advancement for the same number of E errors (Fig. 2.3 D, E). In Step 4,
we find whether there are a series of such advancement-boundary—wait-segments before
(to the left of) t∗E ,`, repeating Steps 2 and 3 for the same number of errors E from right to left
(Fig. S3 A). Before moving down in the diagram and repeating this analysis for E + 1 errors
in the recursive computation, the time points inside the gaps (wait times) between t∗E ,` and
t∗E ,r must be filled with predictions of the expected number of progeny if these time points
are reached (green dashed line in Fig. 2.3 F). This is because the formulas in Steps 2-4 rely
on the survival probability for cell cycle advancement with E(t)−1 errors but if there is no
advancement boundary at E(t)− 1, the expected number of progeny is the more general
quantity to replace s(E −1) in those formulas. So, in Step 5, the gaps between advancement
boundaries for E errors are filled with the expected number of progeny once a particular time
19

Chapter 2. Optimal checkpoint strategies
point in the gap is reached (Fig. S3 B).
The strategy encompasses two possible actions: i) wait for more potential repairs or ii) advance
because waiting any longer brings down the expected offspring number. The reasons for
advancement (ii) can be subtly different: Hitting a right border as in Fig. 2.2 E means that any
further waiting is disadvantageous (waiting is hopeless); arriving at a left border, before it is
optimal to wait, a number of repairs had to have been performed quickly, and any further
improvements are unlikely to occur soon enough to be worth the wait (cash in a lucky draw);
advancement at a top border can be interpreted either way.
The strategy is optimal by construction. Given that we start in the future and work backward,
at each step we calculate the optimal decision based on having calculated the best decision
for all accessible future time points.
2.3.2 Experimental results
Experimental system
To apply the theory, we created genetically mutated budding yeast strains. To avoid artificially
creating templates for DNA repair by homologous recombination, we minimized the intro-
duction of extraneous DNA, including markers, by using the URA3-insertion/5-FOA-pop-out
method throughout.
We deleted the Start cyclins CLN1,3 and replaced the CLN2 promoter by the MET3 promoter.
This allows cells to be blocked in the pre-Start (G1) phase prior to DNA replication by adding
methionine to the growth medium (+Met) or to be released to start a new cell cycle by removing
methionine (-Met). 94 Blocking cells in G1 prior to DNA replication, where haploid yeast cells
only have one of each chromosome avoids efficient template-based repair mechanisms based
on the homologous chromosome and allows the controlled generation of DSBs.
We further integrated a GAL1pr-HO construct in the genome. The enzyme Ho creates a DSB
with a 4-nucleotide 3’ overhang 31 at locations in the genome where we inserted, additionally,
the short (30 bp) Ho recognition sequence. Ho has a natural cut site at the mating type locus
(MAT), which we abolished in cells of mating type α by 10 synonymous mutations in the
20

2.3. Results
alpha1 gene (MATα-syn). Ho is widely used to create DSBs to study checkpoints, override, and
DNA repair. 31
DNA breakarrest Start checkpointRaff+Gal+Met
overrideRaff+Met Glu-Met
+Hoendo-
nucleaserepair repair
ADH1pr
ADH1yEVenusHOcs
A B
Ho
Glu+Met
C
1 h2 h 1.5 h ∞
E
0 1 2 3 4 5-1-2 [h] 0 1 2 3 4 5-1-2 [h]
fluor
esce
nce
[a.u
.]
fluor
esce
nce
[a.u
.]
D +5 h
time = 0
Ho Ho
Fig. 2.4 – The ADH1pr-HOcs-yEVenus-ADH1 DSB sensor reports the presence of a DSB. A: Design of the sensor.B: Basic experimental protocol illustrated with cln∆ MET3pr-CLN2 GAL1pr-HO ADH1pr-HOcs-yEVenus-ADH1strain. Raff = raffinose, Gal = galactose, Glu = glucose. C: YFP time courses in cells which additionally carry thecdc5-ad mutation. Green/black: cells that did/did not complete nuclear division. Four dead cells indicated bydotted lines. Switch to Glu-Met occurred at time 0 h. (n = 75) D: Cells 5 hrs after media switch to Glu-Met. Nuclearmarker Htb2-mCherry in red. Scale bar: 5 µm. E: Examples of YFP time courses for cells that divided nuclei latebut seemed to repair the DSB early. Time point of rise in fluorescence indicated by a blue circle; nuclear divisionindicated by a red circle.
To detect DSBs and their repairs in single cells under the microscope or by flow cytometry, we
devised a simple trick: We inserted an HO cut site (HOcs) and a destabilized version of the
yellow fluorescent protein gene yEVenus between the constitutive yeast promoter ADH1pr and
the non-essential ADH1 gene, creating an ADH1pr-HOcs-yEVenus-ADH1 fusion (Fig. 2.4 A) in
place of the genomic ADH1pr-ADH1 locus. (We refer to the yEVenus protein as YFP to simplify
the figure labels and the text.) When the HO cut site suffers a DSB, yellow fluorescence should
be low; when the DSB is repaired, yellow fluorescence should turn back on. Among other
advantages, this system allowed us to induce Ho briefly in galactose medium, switch to the
preferred carbon source glucose, and focus on cells with DSBs based on their fluorescence
levels.
Thus, the basic genotype for all experiments described below is cln1-3∆MET3pr-CLN2 GAL1pr-
HO ADH1pr-HOcs-yEVenus-ADH1 HTB2-mCherry MATα-syn, and only modifications of this
21

Chapter 2. Optimal checkpoint strategies
strain are highlighted explicitly.
DSB repair distributions
A key input to the checkpoint theory is the repair probability distribution (ρ(t) in Eq. (2.2)).
To quantify the timing of DSB repairs, we used the protocol depicted in Fig. 2.4 B: i) cells were
arrested in G1 phase to ensure that only one copy of each chromosome was present, ii) a
break was induced between ADH1pr and yEVenus by Ho, iii) the cell cycle was restarted, and
iv) a new cell cycle was prevented. Step (iv) allowed us to watch cells for many hours under
the microscope by preventing intact cells from dividing and overcrowding the field of view.
This was necessary to detect late, rare repair events. Furthermore, in order to use nuclear
division as an indicator of DSB repairs, we performed experiments with cells carrying the
well-characterized cdc5-ad mutation2, which prevents checkpoint override, so that nuclear
division only occurred in the absence of DSBs.
To characterize the system, we performed single-cell fluorescence microscopy and analyzed
the images with the convolutional neural network YeaZ95. At the switch to Glu-Met, all cells
showed low fluorescence due to the induced DSB or low ADH1 expression in raffinose and
galactose. Subsequently, fluorescence shot up in all cells that divided their nuclei (Fig. 2.4 C).
Thus, only cells where the DSB was repaired (or had never been induced in the first place,
discussed below) divided. This underscores the effectiveness of override suppression by the
cdc5-ad mutation since we saw no YFP-negative (YFP-) cells that performed nuclear division.
Some cells did not divide their nuclei but showed a jump in fluorescence, indicating a failure
to complete the cell cycle even in the absence of a DSB. We investigated the four cells that
divided but showed low fluorescence after 5 hrs in Fig. 2.4 C (dashed lines) and found that
they did not grow noticeably, suggesting that they were dead. Thus, there was a clear gap
in fluorescence levels between cells that did not divide and had an unrepaired DSB and the
rest (Fig. 2.4 C, D). Furthermore, we compared the time when fluorescence increased and
when nuclear division occurred and found that in all cells with dividing nuclei, fluorescence
increased earlier than anaphase (examples of large differences between the two shown in
Fig. 2.4 E). Thus, the DSB sensor provided direct information about whether cells had a DSB
or not, which complements information provided by nuclear division. In the cells observed,
22

2.3. Results
anaphase was always preceded by rising YFP levels but YFP could increase without anaphase,
i.e., repair could occur but the cell cycle fail, nevertheless.
0 1 2 3 4 5 6 7 8 9 10 [h]0
0.4
0.8
1.0
1.2[h-1] A
0 1 2 3 4 5 6 7 8 9 10 [h]0
0.4
0.8
1.0
1.2[h-1] B
0 1 2 3 4 5 6 7 8 9 10 [h]0
0.4
0.8
1.0
1.2[h-1] C
no HOcs (97%)
cdc5-ad (61%)
no HOcs (97%)
CDC5, no override (51%)
CDC5, override (38%)
no HOcs (97%)
yku70Δ (31%)
Fig. 2.5 – Rate of nuclear division with respect to budding scored by fluorescence microscopy. All divisions wereaccompanied by YFP increases except in panel B where dividing CDC5 cells could fail to turn on YFP (checkpointoverride). Percentage in parentheses indicates the fraction of the budding cells of each genotype that dividednuclei. These cells’ budding-to-nuclear-division times are shown in the histograms. The same no-HOcs controlcells are shown in all three panels for comparison. n = 656 (cdc5-ad), 493 (wt-CDC5), 413 (no HOcs), 259 (yku70∆).
As a first estimate of repair times, we recorded the time from budding to nuclear division by
fluorescence microscopy with 10 min time resolution. We verified that the cdc5-ad mutation
neither affected repair timing nor repair efficiency negatively by comparing the division times
of cdc5-ad cells with wild-type CDC5 cells in which YFP turned on, i.e., did not override (61%
vs. 51%, Fig. 2.5 A, B), in agreement with previous observations 29.
A substantial fraction of cdc5-ad cells (39% = 100% - 61%) did not divide compared to 3%
of cell cycles failing under these conditions in a no-cut-site control strain (Fig. 2.5 A). Thus,
approximately 36% (= 39% - 3%) failed to repair the DSB. The fraction of cdc5-ad cells that
divided (61%) (Fig. 2.5 A) did not simply represent inefficient cutting by Ho. This is because
only 31% of cells that additionally carried the yku70∆ (=hdf1∆) deletion, which blocks the
non-homologous end-joining repair pathway 6, divided, showing that 30% (= 61% - 31%) of
cells repaired the DSB by a YKU70-dependent mechanism (Fig. 2.5 A, C). The fraction of
dividing cells with the yku70∆ deletion is higher than in previous studies22,89, possibly due
to differences in the DSB loci, e.g., level of transcriptional activity around the cut site. As
expected, in the cdc5-ad population (Fig. 2.5 A) there were cells that divided late, i.e., later than
2 hours after budding, 6.1%, which was significantly (p = 2⋅10−3, one-tailed) higher than when
there was no cut site, 2.7%, representing late repair events. However, most YKU70-dependent
repairs (NHEJ) clearly took place very quickly (Fig. 2.5 A, C).
23

Chapter 2. Optimal checkpoint strategies
4 h
6 h 8 h 10 h
1) sort
YFP‒cells
2) sort
YFP‒cells
50k
3) count YFP+ colonies
cdc5-ad
A
...
6 8 10 12 14 16
B
[h]
cdc5-adyku70Δ
0
1
2
3
4
5x 10⁻⁴
1614121086
C
[h]0
1
2
x 10-5 [h-1]
Fig. 2.6 – Measurements of late DSB repair statistics and survival rates after checkpoint override. A: Schematic ofFACS experiments to measure the tail of the DSB repair time distribution. Horizontal and vertical axes on FACSplots are Venus-A and FSC-A, respectively. See Fig. S4 for more details. B: Measurements of the fraction of repaired
cells (YFP+ colonies) compared to the number of cells plated (5 ⋅104). Each circle represents the fraction of YFP+colonies among 50k cells on one plate. Circles are stacked horizontally when experimental replicas had the samenumbers of colonies. The thick black line represents a spline fit to the mean values for cdc5-ad cells at each timepoint. C: The probability distribution function of repair (dashed line), which is the negative of the derivative of thefit in panel B. Horizontal lines represent σ/(Eτ) for E = 1 (red), 2 (magenta), 3 (orange), 4 (yellow).
The long tails of the distributions observed by microscopy (Fig. 2.5) are potentially critical to
understanding checkpoint override. However, statistics on the rare events that make up the
tail were by their nature difficult to ascertain accurately by single-cell microscopy. Thus, we
took advantage of the strong fluorescence signal of the ADH1pr-HOcs-yEVenus-ADH1 reporter
to analyze cells by fluorescence-activated cell sorting (FACS) (Figs. 2.6 A, S4). At +4 hrs after the
switch to Glu-Met (Fig. 2.4 B), >106 YFP- cells were isolated. To avoid contamination by YFP+
cells, we chose the gates for the FACS conservatively, based on the width of the distribution of
fluorescence in a no-cut-site control strain (Fig. S4 C). (The yku70∆ results, discussed below,
indicate that stray low-fluorescence but uncut cells, which would contaminate the results,
were dead or negligible.) Then, from this population, multiple batches of 50 000 YFP- cells were
sorted and plated on Glu-Met plates every 2 hours. On Glu-Met plates, cells could generate
colonies if they repaired the DSB eventually since the absence of methionine reactivated the
MET3pr-CLN2 construct and allowed new cell divisions. The double sorting, once at 4 hrs and
once before plating, served to minimize the possibility that sorting errors let bright (YFP+)
cells slip through as YFP- cells. After 3 days, we counted the number of all colonies on the
plates and determined the subset of YFP+ colonies. With yku70∆ cells, substantially fewer
colonies emerged, showing that nearly all colonies represented YKU70-dependent repairs by
non-homologous end joining (Fig. 2.6 B, Fig. S4 B), and not technical artefacts. The number of
YFP+ colonies decreased rapidly between the 6 h to 12 h time points (Fig. 2.6 B), showing that
24

2.3. Results
some YFP- cells had repaired the DSB between sorting events, had turned YFP back on, and
had left the population of YFP- cells between time points. We estimate that for a typical YFP-
cell, it took approximately 30 min to leave the YFP- population, as delimited by our FACS gate,
once it repaired the DSB (see Methods). The total number of colonies, that is, YFP+ and YFP-
combined, did not drop appreciably between the 6 h to 16 h time points (Fig. S4 D); this shows
that the precipitous drop in YFP+ cells with time was not because cells were generally dying
during the long arrests. Because the number of YFP- colonies did not change substantially
within a very long time span (6 h-16 h), these colonies likely arose from cells that repaired the
DSB early but which destroyed the DSB sensor in the process and became permanently YFP-
cells.
To extract the repair probability in an unbiased manner, we fit a spline through the mean
fractions of repaired cells (Fig. 2.6 B). The negative of the derivative of the fit represents the
conditional probability density function for DSB repair, ∂tρ/(1−ρ), indicated by a dashed
line in Fig. 2.6 C.
Statistics of survival after checkpoint override
Another crucial quantity determining the balance between risk and speed is the lethality of
overriding the checkpoint with unrepaired damage (Eq. (2.2)). We measured the survival
probability s(E) for one DSB (s(1)= σ) by repeating the experiment in Fig. 2.4 with wt-CDC5
cells. We plated CDC5 cells at the 6 h time point, just as cells were beginning to override the
DNA damage checkpoint and after most pre-override repairs had taken place (Figs. 2.5 B, S4 E).
Subtracting the survival probability of cdc5-ad cells, similarly sorted at +6 h to further remove
the contribution of pre-override repairs, we arrived at the mean survival probability σ, which
is represented, after dividing by the cell cycle time τ= 90 min/log 2, by the red horizontal line
in Fig. 2.6 C.
Quantitative experimental validation of theoretical predictions
We begin with a comparison of theory and experiment for one DSB (E = 1). The red (σ/(Eτ))
and dashed lines (∂tρ/(1− ρ)) overlap very well in the time window 6-9.5 h (90% or 95%
25

Chapter 2. Optimal checkpoint strategies
bootstrap confidence intervals: ∂tρ/(1− ρ) is within 25% or 33% of σ/τ, respectively, in
the 6-10 h window, see Methods). Remarkably, the measured override time in Fig. 2.5 B is
7.4± 1.4 h (mean ± STD) or 7.3± 1.3 h (median, 20th to 80th percentile) (n = 188). (Note
that the microscopy results, e.g., in Fig. 2.5 B, show bud-to-nuclear-division times, to which
the time from +0 until budding has to be added for each cell (≈50 min) to compare to FACS
results.) Our measured override times for 1 DSB agree with the override time of ≈8 h reported
in multiple past studies.1,2,27 Thus, the optimal checkpoint theory explains for the first time
the mean as well as the broad width of the override distribution for 1 DSB.
We wished to make new, untested predictions. Assuming that each DSB reduces the survival
probability independently, s(E) = σE , we predicted the optimal override time for multiple
DSBs using Eq. (2.2). The repair probability distribution ∂tρ/(1− ρ) intersects σ/(Eτ) at
approximately 13.8 h for E = 2 DSBs and 16.2 h for E = 3 DSBs. A linear extrapolation of the
last half hour of ∂tρ/(1−ρ) intersects σ/(Eτ) at 19.1 h for E = 4 DSBs. These predictions
contrast with previous override measurements for 2 DSBs by DNA content quantification in
bulk culture 27, which did not detect override for the duration of the experiment (24 hrs). This
led to the conclusion that cells do not override in the presence of 2 DSBs.
To compare to our theoretical predictions and to revisit these past experimental results, we
inserted additional DSB cut sites at the URA3 locus or in the promoters of DLD2 or MIC60.
URA3 was chosen for comparison with previous work 27. DLD2 and MIC60 are in long (≈10 kB)
regions of the yeast genome which can be deleted without affecting viability. 96 Measurements
were performed as before by single-cell timelapse microscopy where budding and anaphase
were scored. Because in these strains, not all cut sites had a fluorescent reporter, we had to
modify the protocol in Fig. 2.4 B; this made the procedure similar to previous studies 1,2,27: We
kept GAL1pr-HO on by switching to Gal-Met medium instead of Glu-Met after time 0, to ensure
that cut sites would be recut and could not be repaired.89 Thus, nuclear divisions now only
occurred after checkpoint override; DSB repair resulting in a restored cut site and subsequent
normal nuclear division were suppressed. The alternative possibility that error-prone repair
allowed normal divisions, because Ho could no longer recut the corrupted Ho recognition
site, was too rare (probability ≈ 10−3)97 to have affected our measurements. We assessed
how much galactose medium in this modified protocol affected override times and found a
26

2.3. Results
relatively small change to 8.9± 0.3 h (mean± SEM, n = 53, bud to nuclear division) with the
single DSB in ADH1pr-HOcs-yEVenus-ADH1.
4
3
2
1
0
0 2 4 6 8 10 12 14 16checkpoint override time
unre
pai
red
DS
Bs
(D) Theory
Experiment
0 8 16 24 [h]0
0.05
0.10
[h-1]
A
E
2 cut sites:ADH1 and URA3
32
18
B 3 cut sites:ADH1, URA3,
MIC60
C 4 cut sites:ADH1, URA3,DLD2, MIC60
20 [h]22
extrapolation
0 8 16 24 [h]0
[h-1]
32
0 8 16 24 [h]0
[h-1]
32 0 8 16 24 [h]0
0.05
0.10
[h-1]
32
D 1+1 cut sites:ADH1,
MATa (repairable)
0.15
0.05
0.10
0.05
0.10
Fig. 2.7 – The optimal checkpoint theory predicts DNA damage checkpoint override times. A-D: Histograms ofbudding-to-nuclear-division probabilities for cells with multiple cut sites (n = 75, 38, 85, 92). E: Comparisonof the optimal checkpoint theory with the experimental data. 50 min have been added to the means from thebud-to-nuclear-division histograms because the FACS time points are with respect to time 0 in the experimentalprotocol. Horizontal red error bars indicate 95% confidence intervals.
Strikingly, our results differ from previous conclusions based on bulk culture measurements 27
but agree with the predictions of the optimal checkpoint theory (Fig. 2.7 E): For two cut sites
at ADH1 and URA3 we observed that 80% of cells overrode with bud-to-nuclear-division
time 13.4±0.4 h (mean± SEM, n = 75) (Fig. 2.7 A). For the two cut sites at DLD2 and MIC60,
the mean override time was very similar, 13.6±0.4 h (mean ± SEM, n = 88, bud-to-nuclear
division) (Fig. S5 A). For three and four cut sites, the fraction of overriding cells decreased
(34% and 42%) while the proportion of clearly dead cells, e.g., cell wall ruptured, increased.
27

Chapter 2. Optimal checkpoint strategies
Nevertheless, for cells which performed nuclear divisions, we measured the override times to
be 16.6±0.7 h (mean± SEM, n = 38, bud-to-nuclear division) for 3 cut sites and 20.2±0.6 h
(mean± SEM, n = 85, bud-to-nuclear division) for 4 cut sites (Fig. 2.7 B, C). Note that these
shifts in override timing as a function of DSB numbers cannot be explained by the greater
lethality of increasing numbers of DSBs since the above override times are computed based
only on the observed checkpoint overrides, not by averaging with non-overriding or dead cells.
Thus, the match between theory and experiment is remarkably close (Fig. 2.7 E), especially
considering the disparate nature of the experiments and the substantial cell-to-cell variability.
Thus far, we have compared our theoretical results for E = 1 DSB to experiments in which we
ensured that cells had the DSB at the time of override by using the ADH1pr-HOcs-yEVenus-
ADH1 sensor and focusing on YFP- cells. For E = 2, 3, or 4 cut sites, we ensured that DSBs were
maintained throughout the experiment by continuous HO induction. (We repeated the E = 1
DSB experiment with continuous HO induction as well.)
Finally, we also wished to examine the predicted advancement boundary in a more complex
way. We wondered whether the override decision could be confused by a decoy. To quantify
more complex explorations of override decisions, we created a strain in which one DSB would
be repaired efficiently and another DSB not. To accomplish that, we replaced MATα-syn at
the mating type locus, which could not be cut, by the wild-type MATa site, which could be cut,
in our DSB sensor (ADH1pr-HOcs-yEVenus-ADH1) strain. When MATa is cut by Ho, the DSB is
repaired efficiently by homologous recombination based on the HML and HMR cassettes in
the same chromosome. 98 The ADH1pr-HOcs-yEVenus-ADH1 site, of course, still harbored the
cut site without homology elsewhere in the genome, for which thus template-based repair was
not available. We returned to our original experimental protocol in which Ho is shut back off
(Fig. 2.4 B). (We extended the induction window of GAL1pr-HO while cells were arrested in G1
to 3 hrs to ensure that in a large fraction of cells both MATa and ADH1pr-HOcs-yEVenus-ADH1
would be cut initially.) Control cells with only the cut site at the MATa locus divided their
nuclei very quickly after switching to Glu-Met (median: 75 min), showing that, indeed, MATa
was repaired efficiently. However, in combination with the ADH1pr-HOcs-yEVenus-ADH1
sensor, YFP- cells overrode after 8.1± 0.2 h (mean ± SEM, n = 92, bud-to-nuclear division,
Fig. 2.7 D), as expected for 1 DSB and unlike for 2 DSBs (Fig. 2.7 A). These results support our
28

2.4. Discussion
theoretical analysis, in which cells compute the optimal override decision continuously as
they move in the error-time plane, and adjust their override time based on E(t), the present
number of DSBs, as illustrated in Fig. 2.2 E.
Override is an advantageous strategy
The close match between predicted and measured override times (Fig. 2.7 E) suggests that
checkpoint override may indeed be an advantageous strategy. However, this has not been
shown directly in the past except with crippled DNA repair and maintenance genes28,32,33,
leaving the question open, to what extent checkpoint override is relevant to wild-type cells.
In preliminary tests, we found a simple comparison of overriding (CDC5) to non-overriding
(cdc5-ad) cells with one HO cut site under continuous HO induction inconclusive (data not
shown). We speculated that most repairs occur well before checkpoint override (<6 hrs) and
thus swamp the effects of checkpoint override (>6 hrs) on survival. Therefore, we compared
CDC5 and cdc5-ad YFP- cells at the 6 h time point directly, using the protocol described in
Fig. 2.6 A. We found a significantly higher probability of survival for CDC5 cells versus cdc5-ad
cells (Fig. S5 B), showing that override is beneficial for cells with wild-type repair genes when
they continue to have an unrepaired DSB late into the checkpoint arrest.
2.4 Discussion
We have shown that DNA damage checkpoint override follows predictable patterns. We
presented the first theory of checkpoint strategies, which led us to discover these timing
hierarchies.
Fundamentally, the theory is based on the simple principle of offspring maximization; a popu-
lation genetics analysis showed that the probability of producing live progeny multiplied by an
exponential time penalty for arrest should have been the target to be maximized in the course
of evolution. In reality, this maximization would have been performed by selection: Given two
genetically encoded strategies, one closer to the optimum and one less optimal, the more opti-
mal strategy would have produced more progeny and won out over evolutionary timescales –
until a strategy even closer to the optimum would have displaced it in the population.
29

Chapter 2. Optimal checkpoint strategies
The theory is general in that it is compatible with both canonical models of population
genetics, exponential growth as well as fixed-size populations. We demonstrated the latter by
analyzing both the classical Wright-Fisher and Moran models. Furthermore, the theory is also
general because it describes fundamental balances between risk, represented by repair and
survival probabilities, and growth. It would presumably apply to other biological surveillance
systems, including the examples discussed below, even though in our presentation of the
theory we anticipated the application to the DNA damage checkpoint. It can be extended
straightforwardly, for example, to allow for sick cells.
We proved that according to the theory, a deterministic strategy is optimal. This may ap-
pear to be difficult to reconcile with the observed broad distribution of checkpoint override
times (Fig. 2.5 B). However, the DSB repair probability is roughly flat for 6 h-10 h and then
decays slowly (Fig. 2.6 C); thus, broad distributions of override times are compatible with a
deterministic strategy since the optimal range is wide.
To solve for the optimal strategy, we mapped the problem of maximizing the fitness functional
(Eq. (2.1)) onto the question of finding the optimal boundary for a random walk and derived
closed-form recursive solutions. These can be calculated easily, e.g., the simple relation in
Eq. (2.2). Simulations are not needed.
The theory establishes relationships between three independent quantities, i) the probability
distribution of error correction, ii) the survival probability if errors are not fixed, and iii) the
optimal timing of checkpoint override. The theory makes quantitative predictions for the
override time as a function of the number of errors.
Experimentally, we built a budding yeast system which could be arrested in G1, a controlled
number of DSBs could be induced, and the cells with DSBs could be separated from intact cells
based on the fluorescence output of the DSB sensor. This allowed us to switch to glucose as the
carbon source, which switched HO expression back off and permitted cells to repair the DSB.
The fluorescent DSB sensor also allowed us to eliminate repaired cells by flow cytometry, which
pollute experiments with checkpoint-arrested cells because intact cells divide and overwhelm
bulk measurements exponentially quickly. The alternative, keeping cells in galactose, was not
an option because Ho would continuously recut the DNA (until the DSB would be repaired
30

2.4. Discussion
non-conservatively in a small fraction of cells). We used continuous HO induction in galactose
only to measure override times.
This experimental system allowed us to measure the parameters (i) and (ii) and the predictions
(iii) precisely. The theory predicted the override times as a function of the number of DSBs
strikingly well. The discrepancies between theory and experiment are less than 7% for ≤ 3
DSBs. The predictions and experimental data are non-trivial. The override times vary by finite
amounts as a function of the number of DSBs. These finite shifts were predicted well by the
theory.
It is also interesting that the theory compelled us to reexamine the current view29,31,33 that
override only occurs for 1 DSB and not 2 Ho-induced DSBs 27, which implied that checkpoint
override is limited and not a universal response to DNA damage in wild-type cells. Instead,
we found override to occur with up to 4 DSBs. We verified our override time measurements
with two different DSB pairs, at ADH1 and URA3 or at MIC60 and DLD2 (Figs. 2.7 A, S5 A). We
speculate that the wide distribution of override times for ≥2 DSBs (compare the variability for
2 DSBs in Figs. 2.7 A, S5 A to the variability for 1 DSB in Fig. 2.5 B), DNA re-replication after
override, and slow post-override cell cycles hid the small fraction of post-override (1C DNA
content) cells in bulk culture DNA content measurements at the time points 6 h, 12 h, 18 h, and
24 h in previous experiments27. This explanation is supported by our single-cell microscopy
results with the 2 DSB strain YSL53 from previous work27: To have the same level of control
over cell cycle entry and the same readout as in the rest of our experiments, we introgressed
cln∆MET3pr-CLN2 HTB2-mCherry from our strains partially into YSL53 by a cross and three
backcrosses with YSL53. We picked four different strains after the third backcross and found
in all four that checkpoint override did occur with two cut sites.
Our detection of override with at least up to four DSBs also brings the basic observations
about DNA damage checkpoint override more in line with each other. Override has been
documented with difficult-to-quantify but plausibly large amounts of DNA damage due X-
rays28 or telomere dysfunction in cdc13-12 or tlc1∆29 cells. Our results revise the current
view 33 that different types of DSBs must have different effects on override; varying numbers of
DSBs led to quantitatively but not qualitatively different override times in our measurements.
31

Chapter 2. Optimal checkpoint strategies
Furthermore, the previously reported override block with 2 DSBs supported a molecular
model in which the amount of post-break DNA resection, potentially signaled by the amount
of ssDNA-bound RPA, determines whether or not override occurs. 27 The threshold on resected
ssDNA allowing override would be between the amount produced in response to 1 to 2 DSBs.
However, the discovery of mutants that produce less post-break DNA resection but also did not
override have represented a challenge to this model. 31 Our results are in principle consistent
with a modified, graded molecular model in which increasing amounts of ssDNA due to
additional breaks increase the arrest duration by finite amounts.
Finally, we measured the biological relevance of checkpoint override on cells without crippling
DNA repair or maintenance. We filtered for cells that had not repaired their DSB shortly before
override occurred and saw a significantly greater chance of survival for override-performing
(CDC5) cells.
The quantitative, system-level study we present here complements the more developed but
nevertheless incomplete understanding of checkpoint override at the genetic level.6,31 As in
other fields, these two perspectives can be expected to drive each other forward. For example,
the computations we uncovered here must presumably be performed at the molecular level
by a complex machinery involving CDC5 2, RAD53 34, PTC2 and PTC330, and other genes6,31.
Quantitative measurements of the kinetics of these elements, e.g., as for DNA resection rates 27,
combined with molecular modeling ought to be able explain the system-level computations
we predicted from the bottom-up.
Theory ideally compels new kinds of experiments to uncover previously hidden patterns. A
powerful aspect of a general, first-principles theory is that it can apply to disparate systems;
the generality of the mathematical abstractions means that the specifics of the override are not
important, for example, whether the checkpoint signal is silenced before override. (This is why
we avoided the more specific term ‘adaptation’, which is more common in the literature.) To
facilitate such further experimental exploration, we discuss in the Supplementary Information,
on the basis of the existing literature, how the theory can potentially be applied to explain or
predict override timescales of other checkpoints, including the spindle assembly checkpoint,
in development, and in cancer cells.
32

2.5. Methods
2.5 Methods
2.5.1 Strains
We performed experiments in budding yeast strains of background W303. Genetic manipula-
tions and crosses were performed by standard methods. The cdc5-ad mutation was cloned
into our strain background from a strain given to us by Achille Pellicioli. A GAL1pr-HO plasmid
was given to us by Eric Alani.
All ORF deletions and HOcs insertions were performed using the URA3-insertion/5-FOA-pop-
out method. This method leaves no markers and no unwanted DNA in the genome. For this,
the desired sequence of DNA was cloned into a URA3-backbone plasmid. After integration at
the desired locus, cells were plated on 5-FOA plates. Colonies that grew on these plates were
screened for the desired ORF deletion or HOcs insertion.
The basic genotype for all strains was cln1∆0 cln2∆0::MET3pr-CLN2 (promoter replacement)
cln3∆0::GAL1pr-HO ADH1pr-HOcs-yEVenus-ADH1 HTB2-mCherry::HIS5 MATα-syn. The
modifications to this strain are indicated in Table 2.1. After constructing the basic strain,
we performed three backcrosses with our wild-type W303 strains to reduce the likelihood of
mutations.
Table 2.1 – Strains used
AS18 - rad5-G535RET47 - RAD5AS20.1 cdc5-ad rad5-G535RET45 cdc5-ad RAD5AS30 yku70∆0 rad5-G535RET46 yku70∆0 RAD5ET44 ADH1pr-yEVenus-ADH1 (no ADH1pr-HOcs-yEVenus-ADH1) RAD5AS31.9 ura3∆0::HOcs::KanMX rad5-G535RAS32.1 ura3∆0::HOcs::KanMX RAD5ET32 MIC60pr::HOcs DLD2pr::HOcs (no ADH1pr-HOcs-yEVenus-ADH1) rad5-G535RRD58 MIC60pr::HOcs DLD2pr::HOcs (no ADH1pr-HOcs-yEVenus-ADH1) RAD5RD53 ura3∆0::HOcs::KanMX MIC60pr::HOcs RAD5RD54 ura3∆0::HOcs::KanMX MIC60pr::HOcs DLD2pr::HOcs RAD5AS14.2 MATa (no ADH1pr-HOcs-yEVenus-ADH1) RAD5AS35.2 MATa RAD5
33

Chapter 2. Optimal checkpoint strategies
HOcs stands for the 30 bp sequence: TTCAGCTTTCCGCAACAGTATAATTTTATA.
We performed experiments with cells carrying the W303-specific rad5-G535R mutation99 as
well as with cells with a corrected RAD5 gene wherever we indicate both versions of the strain
in the list above. Since we observed no systematic or noticeable differences between results
with rad5-G535R and RAD5, we pooled the measurements for higher statistical certainty. All
other experiments were performed with cells with a corrected RAD5 gene only.
2.5.2 Media changes and sonication
The standard protocol for all experiments, except where the protocol was modified as noted,
is depicted in Fig. 2.4 B. Cells were pre-grown in 5 ml Raff-Met liquid medium for 24-48 hours,
then diluted at 18:00 in the evening before the experiment to OD=0.005. The first step of the
protocol, the switch to Raff+Met, was performed at around 9:00 on the next morning. For bulk
culture experiments, the OD was maintained below 0.5.
Cells were sonicated for 10 sec at 40% power on a Sonics & Materials VCX 500 instrument
for single-cell experiments immediately before loading into the microfluidic chip. For bulk
culture experiments, the culture tube containing cells was placed in a Branson bath sonicator
for 8 sec before FACS sorting (see below).
2.5.3 Microscopy
Microscopy experiments were performed with commercial microfluidic chips. Timelapse
recordings were carried out with a 60x objective and a Hamamatsu Orca-Flash4.0 camera.
Widefield images were taken in phase-contrast mode. Fluorescence images were taken with
a Lumencor Sola SE II light source. The filter cubes were a Semrock YFP-2427B (excitation:
500/24, emission: 542/27) and a Semrock mCherry-C (excitation: 562/40, emission: 641/75).
All exposure times were 100 ms at 50% light source power. The interval between images was
10 min except for experiments with ≥2 cut site where the time between images was increased
to 15 min to decrease potential phototoxicity during the long arrests. The override time was
recorded as the first time point at which the Htb2-marked nuclei separated. In microscopy
experiments where we released cells from Gal+Met into Gal-Met (Fig. 2.7 A-C), there were
34

2.5. Methods
sometimes 1-2 cells that divided immediately and then arrested in the next cycle. We excluded
these if this first division occurred within the first 100 min.
2.5.4 Image processing
For segmenting the microscopy images, we used the YeaZ convolutional neural network and
GUI 95.
2.5.5 FACS
Fluorescence-activated cell sorting was performed with a Sony SH800S instrument. The
protocol and all the gates are illustrated in Figs. 2.6 and S4.
The instrument was set to room temperature for sorting events. A 100 µm microfluidic sorting
chip was used. The purity level was set to ‘ultra purity’. We used the excitation/emission filters
for ‘Venus’.
Before each sort, cells were centrifuges at 900 g for 1.5 min, medium was removed to concen-
trate cells, and the cell culture was sonicated for 8 sec. This was done to speed up the sorting.
At the 4 h time point, 1.0−1.8 ⋅106 YFP- cells were isolated per biological replica, which took
about 20−40 min. After sorting, cells were centrifuged, the sheath medium was discarded,
and≈5 ml SCD+Met medium was added. Cells were always kept on a nutator at 30o C between
sorting events. The second sorting events of 50k YFP- cells at 6 h, 8 h, 10 h, 12 h, 14 h, or 16 h
took 3−8 min. After the second sorting, 100 µl of SCD-Met medium was immediately added
to the isolated cells and each batch of 50k YFP- cells was spread on a different Petri dish with
SCD-Met agar medium.
To estimate the time it took cells to escape the YFP- gate after repairing the cut site at ADH1pr-
HOcs-yEVenus-ADH1, we noted that at the 4 h sorting event, YFP- and YFP+ cells showed
fluorescence levels of 1700 ± 700 [au] (median ± SD) and 7500 [au] (median), respectively.
The speed of increase of fluorescence per hour therefore was about 1500 [au]/h, which is more
than twice the standard deviation of fluorescence values in the YFP- gate. Hence, we estimate
the escape time for repaired cells from the YFP- gate to be about 30 min.
35

Chapter 2. Optimal checkpoint strategies
2.5.6 Fit to data
In Fig. 2.6 B, we fit a ‘SmoothingSpline’ through the means at each time point using the Matlab
‘fit’ function with parameter ‘SmoothingParam’ set to 0.1. A spline was used to avoid any biases
regarding the functional form, e.g., type of decay, we might have expected. The smoothing
parameter was chosen without fine-tuning; thus, it only has one significant digit. It was chosen
among such one-significant digit values because it was the highest such number (generating
the least amount of smoothing) that removed the bumps from the fit.
2.5.7 Statistical tests
All p value tests were one-tailed. For the confidence interval analysis of the repair probability
versus σ/τ in Fig. 2.6 C, we picked 103 random alternative means for each time point (6 h,
8 h, 10 h, 12 h, 14 h, and 16 h) by bootstrapping. We fit the same spline as described above
through 103 combinations of these means and computed the derivative. We calculated how
close the closest 90% and 95% of these conditional repair probability densities were to the σ/τline between the 6 h and 10 h interval, which gave us the values quoted in the text (25% and
33%, respectively).
36

2.6. Supplementary Information
2.6 Supplementary Information
2.6.1 Supplementary theoretical results
Outcome options: survival or death
Focusing only on the possibilities that cells either die or survive was supported by our obser-
vations in all DNA break experiments that the surviving cells grew into colonies of roughly the
same size at about the same speed. Thus, we did not observe two different colony sizes, which
would suggest healthy and sick survivors.
Similarly, other researchers have scored viability by counting the number of colonies that have
been formed from single surviving cells without noting sick colonies. 54,89
Galgoczy and Toczyski 28 observed colonies growing at different speeds after exposing diploid
cells that could not repair DSBs by homologous recombination (rad52∆) to X-rays. Diploid
cells can survive the loss of a chromosome and become aneuploid. Thus, sickness may have
been a more common outcome under those conditions than for haploid cells.
Furthermore, in reality, sick cells would be outcompeted exponentially quickly in time and thus
would be effectively dead except in special circumstances, e.g., spatial isolation or immediate
post-arrest mating and random assortment of the chromosomes generating a subset of healthy
offspring. These more complicated scenarios may be considered for further developments of
the theory but we did not find those to be necessary because of the excellent match between
theory and experiment.
In any case, the theory can be easily extended by introducing additional parameters describing
the statistics of the occurrence and degree of sick cells.
Additional information on the arrest penalty
In a fixed-size population of N cells reproducing according to the Wright-Fisher model 91,
the survival probability of an arrested cell is (1− (1−1/N)N) per generation. This factor
represents the probability that the arrested cell is not lost from the population due to drift,
37

Chapter 2. Optimal checkpoint strategies
which would occur if the N − 1 other cells in the population were selected to reproduce N
times by chance. The probability of survival decreases from 3/4 for N = 2 to 1− e−1= 0.63...
as the population becomes larger (N →∞). Since in this model, the checkpoint-arrested cell
either dies or survives and then rejoins the regular population dynamics as before the arrest,
the expected number of progeny is reduced by P1 [1− (1−1/N)N]t/Tfor a checkpoint arrest
of t/T generations.
In a Moran process, the survival probability due to random drift is (1−1/N) for a checkpoint-
arrested cell, which is the probability that the cell is not killed with probability 1/N . However,
in a Moran process, it takes N generations on average for each cell to have its turn in repro-
duction because only one cell’s fate is considered in each generation. Thus, adjusted for the
smaller time steps in this model compared to the Wright-Fisher model, the survival probability
in the presence of drift is (1−1/N)N per N generations in this model, which increases from
1/4 for N = 2 to e−1= 0.37... for N →∞. The expected number of progeny after checkpoint
arrest is thus P1(1−1/N)N t/T .
Thus, in all models, the expected number of progeny of a checkpoint-arrested cell is reduced
by the product of a temporal penalty for arrest, which is exponential in time, and a probability
of proliferation. In exponential growth, the fitness penalty due to checkpoint arrest (2−t/T ) is
exponential in time with base 1/2. In the Wright-Fisher model, the base of the exponential
penalty depends on the size of the population; in each generation, the probability of survival
decreases by a factor of 1− (1− 1/N)N . In a Moran process, the equivalent factor is (1−
1/N)N . Interestingly, while these processes are very different, the loss of expected progeny
per generation due to waiting is roughly similar numerically.
We represent the time penalty by a factor e−t/τ, which applies in all three cases and where τ ab-
sorbs the logarithm of the base, that is, τ= T/log 2 for exponential growth, τ=−T/log(1− (1−1/N)N)for the Wright-Fisher model, and τ=−T/log((1−1/N)N) for the Moran model.
Fitness: arithmetic vs. geometric mean
To illustrate that with random checkpoint arrests, the average of the offspring numbers is an
appropriate fitness function, we consider the following simple exponential growth model:
38

2.6. Supplementary Information
1. Starting with one cell, every cell produces two offspring with probability (1−q) in every
generation.
2. With probability q , a cell suffers damage, which is either lethal with probability (1−p)or which is repaired with probability p and delays reproduction by g generations.
The expected number of offspring ⟨offspring⟩ for this model after G generations is approxi-
mately:
⟨offspring⟩= (2(1− q)+2−g
pq)G, (S1)
where 2(1− q) is the expected number of new cells due to normal divisions (model step 1)
and 2−g pq is the expected number of cells which resolve the damage after arresting at the
checkpoint for g generations (model step 2).
As the simulations of the model in Fig. S1 show, the above equation for the average number
of offspring (⟨offspring⟩) captures the main peak of the distribution well. Thus, the average
is a useful indicator for the behavior of the population. Given that the incidence of damage
q is random and set by processes other than checkpoint control, we can only increase the
average number of offspring by maximizing the product 2−g p, as we did to find the optimal
checkpoint strategy.
If, by contrast, we consider a fluctuating environment model in which a whole generation –
not random cells – suffers damage with probability q which is lethal with probability (1−p),
then in each generation, the chance of survival goes down by a factor of (1− q(1−p)). The
survival probability thus goes to zero with time, and the average number of offspring after
many generations would be dominated by unlikely scenarios where cells survive for long times
and with many offspring. In these types of models the more appropriate fitness function to
maximize would be the expected number of offspring for a typical (average) scenario, which
leads to bet hedging. 93
Additional information regarding the general fitness functional
To make the mathematical presentation simpler, we assume in Eq. (2.1) and in the subse-
quent calculations that if cells survive after cell cycle division, it is either always one of the
39

Chapter 2. Optimal checkpoint strategies
0.4 0.6 0.8 1 1.20
200
400
600
800
1000
1200
0.4 0.6 0.8 1 1.20
500
1000
1500
0.4 0.6 0.8 1 1.20
500
1000
1500
2000
2500
3000
0.4 0.6 0.8 1 1.20
500
1000
1500
2000
2500
3000
A
log(offspring)/log(<offspring>)
coun
ts
C
B
Dlog(offspring)/log(<offspring>)
coun
ts
log(offspring)/log(<offspring>)
coun
ts
log(offspring)/log(<offspring>)
coun
ts
q=0.1, p=0.4, g=2
fraction zero =6.6%
q=0.1, p=0.4, g=5
fraction zero =6.7%
q=0.2, p=0.7, g=2
fraction zero =6.5%
q=0.2, p=0.7, g=5
fraction zero =6.5%
Fig. S1 – Distribution of offspring numbers for a simple population model of damage and checkpoint arrest, asexplained in the Supplementary Information text, given the parameters listed on top of the histograms. As gincreases, the first peak separates from the main peak. This small first peak represents trials where the very firstcells in the simulation receive damage but arrest for g generations and repair the damage. The trials in whichthe first cell dies immediately (‘fraction zero’) are not indicated in the histogram because the logarithm of zerois undefined, but the fraction is noted in each panel. The simulation was run for twenty generations G = 20 and
repeated 104 times.
two progeny that survives, in agreement with experimental data for DSBs 100, or always both
progeny that survive. This assumption can be removed in the theory by introducing parame-
ters for the relative likelihoods that one offspring survives versus both offspring survive.
Timer strategy
A simple checkpoint strategy could be to wait for a fixed time t ′, and then advance with the
cell cycle. Mathematically, this means setting a(t∣{ti})= δ(t − t ′):
f (t′)= e
−t ′/τ∫∞
0
E0
∏E=1
d tE r ({ti}) s(t′∣{ti}) . (S2)
40

2.6. Supplementary Information
Assuming that each error is repaired independently according to the cumulative probability
function ρ(ti) and each unrepaired error reduces the probability of survival by a factor σ, we
obtain:
f (t′)= e
−t ′/τE0
∑E=0
(E0
E )ρE0−E(t′)(1−ρ(t
′))E1
E0−Eσ
E
= e−t ′/τ [ρ(t
′)+σ(1−ρ(t′))]E0
= e−t ′/τ [ρ(t
′)(1−σ)+σ)]E0
(S3)
The best timer strategy is obtained by maximizing f (t ′) with respect to t ′,
τE0∂t ′∗ρ(t ′∗)
ρ(t ′∗)+ σ1−σ
= 1 . (S4)
Assuming that repairs follow a Poisson process, ρ(ti)= ρmax (1− e−ti/τr ), we obtain for the
optimal waiting time in the timer model:
t ′∗
τr= log
1+E0ττr
1+ 1ρmax
σ1−σ
, (S5)
which implies that unless
E0ττr>
1ρmax
σ
1−σ (S6)
is satisfied, it is not worth waiting a fixed time for repair at a checkpoint at all (t ′∗ = 0), for
example, if survival is too likely (σ close to 1).
Repair-threshold strategy
In an alternative model, a fixed amount (E0−E ′) of the total damage (E0) is repaired before
continuing with the cell cycle. Here,
a(t∣{ti})= ∑perm.
δ(t − ti1)
Í ÎÌ Ï1 repaired at t
θ(t − ti2)⋯θ(t − tiE0−E ′
)Í ÎÌ Ï
E0−E ′−1 repaired before t
θ(tiE0−E ′+1− t)⋯θ(tiE0
− t)Í ÎÌ Ï
E ′ errors remaining
, (S7)
41

Chapter 2. Optimal checkpoint strategies
the cell cycle advancement probability, is equal to the sum of all permutations where damage i1
is repaired at time t , before which E0−E ′−1 errors were repaired, leaving E ′ errors unrepaired.
Assuming as above that repair events are independent and survival for each error that remains
at override is reduced by a factor σ, we obtain:
f (E′)=∫
∞
0d t E0
dρ(t)d t
(E0−1
E ′)ρE0−E ′−1(t)(1−ρ(t))E ′
σE ′
e−t/τ
. (S8)
Assuming a Poisson process as above but with ρM = 1 to simplify the equations, we obtain:
f (E′)= E0!(E ′+τr/τ)!
(E0+τr/τ)!E ′!σ
E ′. (S9)
Maximizing f (E ′) with respect to E ′, we obtain:
ψ0(1+E′∗+τr/τ)−ψ0(1+E
′∗)=−log σ , (S10)
where ψ0 is the polygamma function of order zero.
The left-hand side is a decreasing function of E ′∗, so the larger the survival probability σ, the
more errors E ′∗ can be tolerated for proceeding with the cell cycle.
E ′∗ is generally not an integer, and, therefore, f (E ′∗) has to be evaluated at the two nearest
integers to E ′∗ to find the maximally tolerable amount of damage.
Optimal strategy is deterministic
The idea of the proof is as follows: To evaluate whether the optimal checkpoint strategy is
stochastic or deterministic, we take a particular checkpoint strategy and increase or decrease
the advancement probability a(t ,{ti}) at one point (t ,{ti}) in that strategy. Since the ad-
vancement probability must be normalized, that is, the integral or sum over all advancement
probabilities must be equal to one, we also multiply all the other advancement probabili-
ties that branch off from that point and that describe future advancement decisions by a
compensatory factor. While satisfying the normalization constraint, we show that the fitness
42

2.6. Supplementary Information
coefficient of the strategy f [a] can be increased unless the advancement probability density
at that point was zero or infinity, that is, a Dirac delta (δ) function. A Dirac delta (δ) function
advancement probability means that the checkpoint strategy is deterministic. Thus, only a
deterministic strategy can be optimal.
To begin the proof, we assume that time is discretized with time points spaced ∆t apart to
replace integrals by sums. Consider a checkpoint strategy with advancement probability
a(t ,{ti}) and a particular point in the strategy, that is, a damaged cell is arrested for time t ,
has E(t) errors, and has repaired E0−E(t) errors at times {t j} which are smaller than t . The
value of a(t∣{ti}) of course only depends on t and the values of the repair times {t j} before t ,
since the repair times greater than t lie in the future. Therefore, a(t∣{ti})= a(t∣{t j}) holds.
The contribution of this advancement probability to the fitness coefficient is:
∆ fpoint =∆t r ({ti})s(t∣{ti})a(t∣{ti})e−t/τ
, (S11)
according to Eq. (2.1).
Next, we consider the later advancement probabilities a(t ′∣{t ′i}) where t ′ > t in which addi-
tional errors may have been repaired after t (the repaired errors before t are obviously the
same {t j}), see Fig. S2 for an illustration. These advancement probabilities make the following
contributions to the fitness coefficient:
∆ fbranch =∆t ∑t ′
r ({t′i})s(t
′∣{t′i})a(t
′∣{t′i})e
−t ′/τ. (S12)
Suppose that the advancement probabilities of the checkpoint strategy are normalized such
that:
const.= a(t∣{ti})+∑t ′
a(t′∣{t
′i}). (S13)
We create a new strategy in which we multiply a(t∣{ti}) by a factor α, yielding αa(t∣{ti}),
and we also multiply each of the later advancement probabilities a(t ′∣{t ′i}) by α′:
α′= 1+ (1−α) a(t∣{ti})
∑t ′ a(t ′∣{t ′i}). (S14)
43

Chapter 2. Optimal checkpoint strategies
time
E0
12
...
Err
ors
rep
aire
d
a(t|{ti})
a(t'|{t'i})
t t'
Fig. S2 – Illustration of trajectories in a checkpoint strategy. Solid lines indicate the realized trajectory (sequence ofrepairs) of the cell until time t . Dashed lines indicate possible future trajectories. The advancement probabilities
a(t∣{ti }) at time t and a(t ′∣{t ′i}) at a later time t ′ are indicated.
We see that in the new checkpoint strategy,
const.= αa(t∣{ti})+∑t ′α′a(t
′∣{t′i}) , (S15)
the advancement probability continues to be correctly normalized.
Plugging in the scaled advancement probabilities, we see that in this new strategy, the modified
point contributes:
α∆ fpoint = α∆t r ({ti})s(t∣{ti})a(t∣{ti})e−t/τ
(S16)
to the fitness coefficient and the contribution of the future points is:
α′∆ fbranch = α
′∆t ∑
t ′r ({t
′i})s(t
′∣{t′i})a(t
′∣{t′i})e
−t ′/τ,
= [1+ (1−α) a(t∣{ti})∑t ′ a(t ′∣{t ′i})
]∆t ∑t ′
r ({t′i})s(t
′∣{t′i})a(t
′∣{t′i})e
−t ′/τ,
(S17)
which is linear in α. Since the contributions to the fitness coefficient are linearly dependent
44

2.6. Supplementary Information
on the parameter α,
α∆ fpoint+α′∆ fbranch =O(α0)+α∆t a(t∣{ti})
×[r ({ti})s(t∣{ti})e−t/τ
−∑t ′
r ({t′i})s(t
′∣{t′i})e
−t ′/τ a(t ′∣{t ′i})∑t ′′ a(t ′′∣{t ′′i })
]
(S18)
the fitness coefficient of this strategy could not be maximal, unless either a(t∣{ti}) is zero
or all future a(t ′∣{t ′i}) are zero. (Here, we assume that the slope of α, which is proportional
to the term in square brackets in Eq. (S18), is not zero. This term is the difference between
the contribution to the fitness coefficient if the advancement took place at t and the average
contributions of all future divisions, which are weighted by their conditional advancement
probabilitya(t ′∣{t ′i})
∑t ′′ a(t ′′∣{t ′′i }). Generically, it will not be zero.)
This argument applies for every point in the error-time plane, such that at points where
∆t a(t ,{ti}) is nonzero, it must be equal to one. In the limit ∆t → 0 as the discretization
becomes smaller, a(t ,{ti}) becomes a Dirac delta (δ) function.
Additional information regarding the optimal strategy
Here, we provide additional details for Step 2 (main text) for computing the optimal strategy
and describe Steps 3-5 depicted in Fig. 2.3 D-F.
2. First, we provide more information regarding Step 2 in the main text. Equating the
two terms discussed in Step 2,d t∂tρ
1−ρE (s(E−1)−s(E))e−t/τ and −s(E)d t∂t e−t/τ, we
obtain,∂tρ
1−ρ
»»»»»»»t=t∗E ,r
τE ( s(E−1)s(E) −1)= 1 . (S19)
Next, we use s(E)= σE and only keep the linear term in σ, neglecting the O(σ2) terms.
This is justified, for example, for an unrepaired DSB since the survival probability is very
small (σ≪ 1) (Fig. 2.7 D). This yields Eq. (2.2).
3. For the left advancement boundary at each E , we need to compare the instantaneous
fitness s(E)e−t/τ with the expected future fitness. To calculate the expected number
45

Chapter 2. Optimal checkpoint strategies
of progeny due to waiting, one needs to take into account the possibility that another
repair happens before reaching the right boundary at t∗E ,r versus the possibility that no
other such repair occurs (Fig. 2.3 D). This leads to the following condition:
s(E)e−t∗E ,`/τ
=∫t∗E ,r
t∗E ,`
d t′ (−∂t ′)[
1−ρ(t ′)1−ρ(t∗E ,`)
]E
s(E−1)e−t ′/τ
+[1−ρ(t∗E ,r)1−ρ(t∗E ,`)
]E
s(E)e−t∗E ,r/τ .
(S20)
This sets the left advancement boundary t∗E ,` at E (Fig. 2.3 E). (The last two equations
are related; Eq. (S20) simplifies to Eq. (S19) by taking the derivative with respect to t∗E ,r
and setting t∗E ,` = t∗E ,r.)
4. It is, in principle, possible for there to be alternating segments of advancement boundary
and waiting episodes (Fig. S3 A). Additional boundary points, if they exist, can be found
by solving for the right-most t∗E ,r, then the preceding t∗E ,`, and then for a possible right
boundary further to the left and so on.
5. Thus far, all calculations assumed that with one fewer error (E − 1), it is optimal to
advance and that there is a continuous advancement boundary line, as for E = 0. This
assumption explicitly entered the right-hand sides of Eqns. 2.2, S19, and S20 which
refer to the survival probability if one more error is fixed (s(E −1)) at the advancement
boundary at E −1. However, if at the previous step, which means at some time point
t and for E −1 errors, the optimal decision is to wait, it would not be correct to assess
the consequence of reaching that point by the survival probability s(E −1) since upon
arriving at t and E − 1, the cell cycle should continue to arrest. So, to calculate the
optimal checkpoint decision for E +1 errors after the advancement boundary for E has
been computed, for all times between the advancement boundaries, e.g., between t∗E ,`
and t∗E ,r in Fig. 2.3 F, the expected number of offspring fwait(t , E) needs to be computed.
The formula for fwait(t , E) has to be adapted to the specific situation but can be based
46

2.6. Supplementary Information
on the following example:
fwait(t , E)=∫t∗E ,r
td t′ (−∂t ′)[
1−ρ(t ′)1−ρ(t) ]
E
fwait(t′, E−1)e
(t−t ′)/τ
+[1−ρ(t∗E ,r)
1−ρ(t) ]E
s(E)e(t−t∗E ,r)/τ ,
(S21)
which describes a strategy in which the cell will wait at E − 1 (because there is also
a fwait(t ′, E − 1) term on the right-hand side). fwait(t , E) replaces s(E) in the above
formulas for calculating the advancement boundary for E +1 errors (Fig. S3 B).
t*E,r
2t*E,ℓ
2 t*E,ℓ
1 t*E,r
1
A
E
E-1
B
E
E-1
t*E,rt*
E,ℓ
Fig. S3 – Additional plots to illustrate the recursive solution to the checkpoint optimization problem. A: Boundary
with alternating advancement boundaries (t∗,i+1E ,r to t
∗,iE ,`) and wait segments (t
∗,iE ,` to t
∗,iE ,r ). B: After all points for E
have been analyzed, there are either advancement segments (black) or wait segments (green) with the expectednumbers of progeny computed at each point of the wait segments. The calculations can then be repeated for E +1errors.
For a Poisson process ρ(t)= 1− e−t/τr , one can see by plugging into Eq. (2.2) that the bound-
aries are always horizontal, thus the optimal strategy reduces to the repair-threshold strategy.
(The resulting condition, τ/τr D(1/σ− 1) = 1, is not obviously equivalent to Eq. (S10), but
we checked numerically, scanning a large range of parameters, that they both give the same
optimal horizontal boundary.)
47

Chapter 2. Optimal checkpoint strategies
2.6.2 Supplementary experimental results
4 h
6 h 8 h 10 h 12 h 14 h 16 h
4 h
6 h 10 h
8 h 10 h
sort
YFP‒cells
sort
YFP‒cells
50k
count YFP+ colonies
cdc5-ad
sort
YFP‒cells
sort
YFP‒cells
50k
count YFP+ colonies
yku70Δno
HOcs
C
A
B
D
6
cdc5-adyku70Δ
8 10 12 14 16 [h]0
5
10
x 10-4
4 h 6 h
sort
YFP‒cells
sort
YFP‒cells
50kcount YFP+ colonies
CDC5
E
Fig. S4 – Supplementary data for the FACS experiments. A-C, E: FACS gates and protocols for the indicatedstrains. D: Total fraction of colonies (YFP- and YFP+ together) relative to 50 000 YFP- cells that were plated. Sameexperiments as shown in Fig. 2.6 B but only the fraction of YFP+ colonies is shown in Fig. 2.6 B.
48
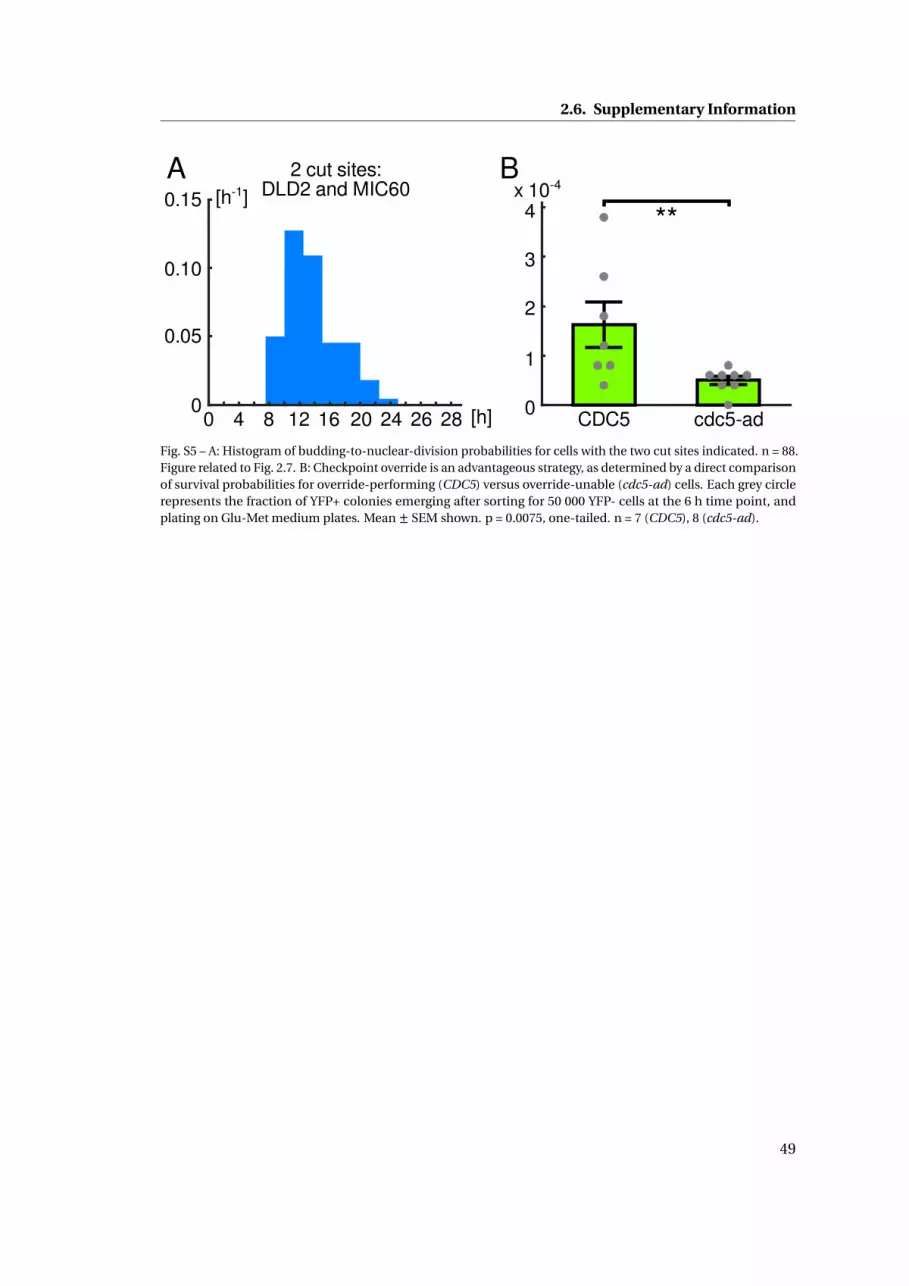
2.6. Supplementary Information
0
0.05
0.10
0.15 [h-1]A 2 cut sites:
DLD2 and MIC60
0 4 8 12 16 20 24 [h]26 28 CDC5 cdc5-ad
**
0
1
2
x 10-4
3
4
B
Fig. S5 – A: Histogram of budding-to-nuclear-division probabilities for cells with the two cut sites indicated. n = 88.Figure related to Fig. 2.7. B: Checkpoint override is an advantageous strategy, as determined by a direct comparisonof survival probabilities for override-performing (CDC5) versus override-unable (cdc5-ad) cells. Each grey circlerepresents the fraction of YFP+ colonies emerging after sorting for 50 000 YFP- cells at the 6 h time point, andplating on Glu-Met medium plates. Mean± SEM shown. p = 0.0075, one-tailed. n = 7 (CDC5), 8 (cdc5-ad).
49

Chapter 2. Optimal checkpoint strategies
2.6.3 Supplementary note: Further applications
To facilitate further applications of the optimal checkpoint theory, we discuss here steps to
using the theory in other systems.
• The spindle assembly checkpoint has been measured to override after 120 min in
budding yeast in the continued presence of the microtubule-depolarizing agent noco-
dazole,76 which does not allow the number of errors to be controlled accurately. The
activity of elements of the checkpoint can be monitored during nuclear division by Mad2-
GFP localization76, potentially obviating the need for override-suppressing mutations
such as cdc5-ad; overriding cells are identifiable in post-processing 76. To measure repair
statistics and survival statistics, nocodazole exposure can be withdrawn by washing it
out. Instead of drugs, more precise control can in principle be exerted over the numbers
and timing of errors by way of inducible suppression of specific centromeres,101 in
analogy to the controlled generation of DSBs.
• In response to injury, checkpoints arrest insect development, and some of these check-
points have been shown to be overridden if the damage is not repaired.4 Drosophila
larvae delay entry into pupariation if their imaginal discs are damaged at specific devel-
opmental stages; this delay is thought to allow for regeneration but is limited even if the
damage is not repaired, e.g., to ≈40 hrs under the experimental conditions in ref. 17 All
three quantities of the checkpoint theory can be measured with current technology 17,18:
repair statistics (fraction of adult flies capable of flight as a function of developmental
delay), survival statistics (fraction of flies capable of flight if the checkpoint was over-
ridden), and override times. Similar to our DNA break experiments, damage can be
induced for a short time window or continuously. 17,18 Suppression of checkpoint over-
ride as with the cdc5-ad mutation in yeast may not be needed if the fates of pre-override
and post-override animals 17,18 are sufficiently distinct.
• Checkpoint adaptation is believed to be associated with cancer emergence or exacerba-
tion in human cells. 5 Tumor-derived U2OS cells arrest in response to ionizing irradiation
and are reported to override the DNA damage checkpoint. 16 The appropriate candidate
for testing the optimal checkpoint theory may indeed be cells that are already cancerous
50

2.6. Supplementary Information
because they explore growth and presumably checkpoint strategies in competition
with other cells.53 The simplest prediction of the theory is that the cells’ DNA damage
checkpoint is neither absent nor strict, but overridable, as reported for various cell
lines. 5 Another relatively simple test is whether different cancer cell lines show similar
arrest times in response to errors, suggesting the presence of an optimal strategy and
an optimal arrest time. Similar to other cases, the transfer of experiments from yeast
to mammalian cells is in principle possible, but will require further developments in
technology such as inducible CRISPR-Cas9 systems that are proven to not interfere with
post-break DNA repair.
51


3 Conclusions
Checkpoints are critical for living systems. However, they are poorly characterized quantita-
tively by experiment or theory. In particular, checkpoint override is an inherently quantitative
phenomenon that invites an organism-level analysis, which had not been carried out previ-
ously. In my work, I sought to advance this understanding of checkpoints.
Despite high levels of noise, we found that DNA damage checkpoint override follows pre-
dictable patterns. We discovered these timing hierarchies following the predictions of our
theory.
The fundamental idea, which we relied on to develop the theory, was the principle of offspring
maximization; different population genetics models showed that the quantity that evolution
should be expected to have maximized is the probability of producing live progeny multiplied
by an exponential time penalty for arrest. Three well-known models of population genetics,
involving exponential growth or fixed-size populations (Wright-Fisher and Moran models),
were drawn on in this analysis. In reality, fitness maximization would have been performed
by natural selection: If two strategies existed in a population of cells, the one closer to the
optimum ought to have won out over evolutionary timescales – until an even more optimal
strategy would appear and win out.
The results of our analysis are general because they describe a fundamental balance between
risk, represented by repair and survival probabilities, and growth. Thus, other biological
surveillance systems could be investigated with regard to their balances on the basis of our
53

Chapter 3. Conclusions
theory.
Interestingly, a deterministic strategy turned out to be optimal. Experimentally, however, the
observed distributions of checkpoint override times (Fig. 2.5 B) were broad. This discrepancy
remains a topic for future study. In fact, other authors have suggested that fluctuating envi-
ronments could cause a stochastic strategy to be more advantageous than a deterministic
strategy. 102
The general fitness functional (Eq. (2.1)) served to prove that the optimal strategy is deter-
ministic. This allowed us to map the problem of maximizing the fitness functional onto the
question of finding the optimal boundary for a random walk. We found that this problem
allowed closed-form recursive solutions. Simulations were not needed to solve the equations.
There are three independent quantities, i) the probability distribution of error correction,
ii) the survival probability if errors are not fixed, and iii) the optimal timing of checkpoint
override, which the theory relates to each other. After providing experimental values for i) and
ii), the theory predicted iii), the override time as a function of the number of errors.
In our experiments, we focused on budding yeast and on the DNA damage checkpoint because
it was relatively well explored by molecular geneticists. We built a budding yeast system whose
cell cycle stage could be controlled, a specific number of DSBs could be induced, and the cells
with DSBs could be separated from intact cells based on the fluorescence output of the DSB
sensor. This system allowed us to eliminate repaired cells by flow cytometry and capture rare
repair events.
Using this experimental system, we were able to measure the parameters of the theory and
the predictions precisely. The predictions matched the observations well. It is important to
note that the predictions and experimental data were non-trivial: The override times varied by
finite amounts as a function of the number of DSBs. These finite shifts were predicted well by
the theory.
Interestingly, the theoretical predictions compelled us to reexamine the current view in the
field 29,31,33 that override only occurs for 1 DSB and not 2 Ho-induced DSBs 27, which implied
that checkpoint override is limited and not a universal response to DNA damage in wild-
54

type cells. Instead, we found override to occur with up to 4 DSBs. This result brings the
observations about DNA damage checkpoint override more in line with each other since the
failure to override with 2 DSBs stands out from the other results. For example, override has
been documented with plausibly large amounts of DNA damage due to X-rays28 or telomere
dysfunction in cdc13-1 2 or tlc1∆29 cells. It is no longer necessary to explain these differences
by postulating that different types of DSBs must have different effects on override. 33
The result of Lee et al. that the DNA damage checkpoint does not override with 2 DSBs
supported a molecular model in which the amount of post-break DNA resection determines
whether or not override occurs.27 Persumably, the threshold on resected ssDNA allowing
or blocking override would be between the amount produced in response to 1 to 2 DSBs.
However, the model was already challenged by the discovery of mutants that produce less
post-break DNA resection but also did not override. 31 In principle, this model can be modified
to be consistent with our data: increasing amounts of ssDNA due to additional breaks simply
increase the arrest duration by finite amounts.
Finally, we demonstrated the biological relevance of checkpoint override – without crippling
DNA repair or maintenance. This was made possible with our DNA damage sensor. It allowed
us to select only cells that had not repaired their DSB for many hours after break induction
and compare override-blocked (cdc5-ad) and override-competent (CDC5) cells.
The field of checkpoint biology is largely driven by molecular genetics. Our quantitative,
system-level study complements these efforts and ought to help drive them forward. A key
central question will be how the override computation is performed dynamically by the
complex DNA damage checkpoint machinery, which involves CDC5 2, RAD5334, PTC2 and
PTC3 30, and other genes 6,31. The global, system-level analysis that we provided ought to guide
and constrain the molecular exploration of this complex system.
55


4 Future work
There are, in principle, four important directions for future research: i) elucidating the biologi-
cal function of override of the DNA damage checkpoint, ii) dissecting how the DNA damage
checkpoint computes override times, iii) identifying the signal that is read out for setting the
DNA damage checkpoint override time, and iv) testing the theory in other systems.
While we showed that DDC override is beneficial for survival for yeast cells with 1 double-
strand DNA break (DSB), and that there are temporal patterns underlying how the DDC
overrides (8 hrs for 1 DSB, 14 hrs for 2 DSBs, ...), the mechanism that renders override advanta-
geous and the biological significance of the striking override time pattern remain unknown.
Using dynamic perturbations and single-cell readout, one should examine i) the mechanisms
increasing survival rates after override and ii) the importance of override timing for cell fit-
ness, tested by varying the time experimentally. Explaining the function of override ought to
motivate research into other systems where override may also create a fitness advantage, e.g.,
cancer cells.
We have shown that cells adjust override times to the amount of damage gradually and
dynamically. However, we do not know how DNA damage checkpoint proteins interact
dynamically to trigger override. Focusing on the central genes involved in override, one should
manipulate the level of each and the time at which each increases. One should measure the
impact of these changes in single cells in order to deduce the molecular mechanisms that
determine override timing. Past research has uncovered many genes and interactions but a
57

Chapter 4. Future work
dynamic, circuit-level model is missing.
We found that the override time changes dynamically with the number of DSBs. Whether the
number of DNA ends or resected ssDNA determine the override time is a fundamental but
open question. Newer data call into question6 the well-known model27 that DNA resection
sets override times. Combining novel ‘resection sensors’ developed by us with known resection
rate mutations, one should establish the relationship between the number of DNA ends,
ssDNA, and override times at the single-cell level. How cells measure damage to set the arrest
time has been researched intensely but has remained elusive.
Theory can compel new kinds of experiments to uncover previously hidden patterns. A
powerful aspect of a general, first-principles theory is that it can apply to disparate systems.
We envisage a number of further applications. The spindle assembly checkpoint (SAC) has
been measured to override after 120 min in budding yeast in the continued presence of the
microtubule-depolarizing agent nocodazole, 76 which does not allow the number of errors to
be controlled accurately. The activity of elements of the checkpoint can be monitored during
nuclear division by Mad2-GFP localization76, potentially obviating the need for override-
suppressing mutations such as cdc5-ad; overriding cells are identifiable in post-processing 76.
To measure repair statistics and survival statistics, nocodazole exposure can be withdrawn
by washing it out. A second potential application is in developmental biology. In response
to injury, checkpoints arrest insect development, and some of these checkpoints have been
shown to be overridden if the damage is not repaired.4 Drosophila larvae delay entry into
pupariation if their imaginal discs are damaged at specific developmental stages; this delay
is thought to allow for regeneration but is limited even if the damage is not repaired, e.g., to
≈40 hrs under the experimental conditions in ref.17 All three quantities of the checkpoint
theory can be measured with current technology 17,18: repair statistics (fraction of adult flies
capable of flight as a function of developmental delay), survival statistics (fraction of flies
capable of flight if the checkpoint was overridden), and override times. Similar to our DNA
break experiments, damage can be induced for a short time window or continuously.17,18
Suppression of checkpoint override as with the cdc5-ad mutation in yeast may not be needed
if the fates of pre-override and post-override animals17,18 are sufficiently distinct. Finally,
checkpoint adaptation is believed to be associated with cancer emergence or exacerbation
58

in human cells. 5 Tumor-derived U2OS cells arrest in response to ionizing irradiation and are
reported to override the DNA damage checkpoint.16 The appropriate candidate for testing
the optimal checkpoint theory may indeed be cells that are already cancerous because they
explore growth and presumably checkpoint strategies in competition with other cells. 53 The
simplest prediction of the theory is that the cells’ DNA damage checkpoint is neither absent
nor strict, but overridable, as reported for various cell lines. 5 Another relatively simple test is
whether different cancer cell lines show similar arrest times in response to errors, suggesting
the presence of an optimal strategy and an optimal arrest time. Similar to other cases, the
transfer of experiments from yeast to mammalian cells is in principle possible, but will require
further developments in technology such as inducible CRISPR-Cas9 systems that are proven
to not interfere with post-break DNA repair.
The quantitative examination of the override of the DNA damage checkpoint, which I per-
formed in my PhD studies, leads to further fundamental questions, for which the ideas, tools,
and data that I generated ought to be very helpful.
59


Bibliography
1. Sandell, L. L. & Zakian, V. A. Loss of a yeast telomere: Arrest, recovery, and chromosome
loss. Cell 75, 729–739 (1993).
2. Toczyski, D. P., Galgoczy, D. J. & Hartwell, L. H. CDC5 and CKII control adaptation to the
yeast DNA damage checkpoint. Cell 90, 1097–1106 (1997).
3. Rieder, C. L. & Maiato, H. Stuck in division or passing through: What happens when cells
cannot satisfy the spindle assembly checkpoint. Dev. Cell 7, 637–651 (2004).
4. Hackney, J. F. & Cherbas, P. Injury response checkpoint and developmental timing in
insects. Fly 8, 226–231 (2014).
5. Swift, L. & Golsteyn, R. Chapter 22 - the relationship between checkpoint adaptation
and mitotic catastrophe in genomic changes in cancer cells. In Genome Stability (eds.
Kovalchuk, I. & Kovalchuk, O.), 373–389 (Academic Press, 2016).
6. Waterman, D. P., Haber, J. E. & Smolka, M. B. Checkpoint responses to DNA double-strand
breaks. Annu. Rev. Biochem. 89, 103–133 (2020).
7. Perkins, T. J. & Swain, P. S. Strategies for cellular decision-making. Mol. Syst. Biol. 5, 326
(2009).
8. Alon, U. An Introduction to Systems Biology: Design Principles of Biological Circuits
(Chapman & Hall/CRC, 2019).
9. Hartwell, L. & Weinert, T. Checkpoints: controls that ensure the order of cell cycle events.
Science 246, 629–634 (1989).
10. Elledge, S. J. Cell cycle checkpoints: Preventing an identity crisis. Science 274, 1664–1672
(1996).
11. Zhou, B.-B. S. & Elledge, S. J. The DNA damage response: putting checkpoints in per-
spective. Nature 408, 433–439 (2000).
61

Bibliography
12. Negrini, S., Gorgoulis, V. G. & Halazonetis, T. D. Genomic instability – an evolving
hallmark of cancer. Nat. Rev. Mol. Cell Biol. 11, 220–228 (2010).
13. Symington, L. S. & Gautier, J. Double-strand break end resection and repair pathway
choice. Annu. Rev. Genet. 45, 247–271 (2011). PMID: 21910633.
14. Kramara, J., Osia, B. & Malkova, A. Break-induced replication: The where, the why, and
the how. Trends Genet. 34, 518–531 (2018).
15. Rossio, V., Galati, E. & Piatti, S. Adapt or die: how eukaryotic cells respond to prolonged
activation of the spindle assembly checkpoint. Biochem. Soc. Trans. 38, 1645–1649 (2010).
16. Syljuåsen, R. G. Checkpoint adaptation in human cells. Oncogene 26, 5833–5839 (2007).
17. Halme, A., Cheng, M. & Hariharan, I. K. Retinoids regulate a developmental checkpoint
for tissue regeneration in drosophila. Curr. Biol. 20, 458–463 (2010).
18. Hackney, J. F., Zolali-Meybodi, O. & Cherbas, P. Tissue damage disrupts developmental
progression and ecdysteroid biosynthesis in Drosophila. PLoS One 7, 1–12 (2012).
19. Wu, D., Topper, L. M. & Wilson, T. E. Recruitment and dissociation of nonhomologous
end joining proteins at a DNA double-strand break in Saccharomyces cerevisiae. Genetics
178, 1237–1249 (2008).
20. Balestrini, A., Ristic, D., Dionne, I., Liu, X. Z., Wyman, C., Wellinger, R. J. & Petrini, J. H.
The Ku heterodimer and the metabolism of single-ended DNA double-strand breaks.
Cell Rep. 3, 2033–2045 (2013).
21. Chiruvella, K. K., Liang, Z., Birkeland, S. R., Basrur, V. & Wilson, T. E. Saccharomyces
cerevisiae DNA ligase IV supports imprecise end joining independently of its catalytic
activity. PLoS Genet. 9, 1–12 (2013).
22. Liang, Z., Sunder, S., Nallasivam, S. & Wilson, T. E. Overhang polarity of chromosomal
double-strand breaks impacts kinetics and fidelity of yeast non-homologous end joining.
Nucleic Acids Res. 44, 2769–2781 (2016).
23. Muñoz-Galván, S., López-Saavedra, A., Jackson, S. P., Huertas, P., Cortés-Ledesma, F. &
Aguilera, A. Competing roles of DNA end resection and non-homologous end joining
functions in the repair of replication-born double-strand breaks by sister-chromatid
recombination. Nucleic Acids Res. 41, 1669–1683 (2012).
24. Lisby, M., Mortensen, U. H. & Rothstein, R. Colocalization of multiple DNA double-strand
breaks at a single Rad52 repair centre. Nat. Cell Biol. 5, 572–577 (2003).
62

Bibliography
25. Seeber, A., Hauer, M. H. & Gasser, S. M. Chromosome dynamics in response to DNA
damage. Annu. Rev. Genet. 52, 295–319 (2018).
26. Waterman, D. P., Zhou, F., Li, K., Lee, C.-S., Tsabar, M., Eapen, V. V., Mazzella, A. & Haber,
J. E. Live cell monitoring of double strand breaks in S. cerevisiae. PLoS Genet. 15, 1–22
(2019).
27. Lee, S. E., Moore, J., Holmes, A., Umezu, K., Kolodner, R. D. & Haber, J. E. Saccharomyces
Ku70, Mre11/Rad50, and RPA proteins regulate adaptation to G2/M arrest after DNA
damage. Cell 94, 399–409 (1998).
28. Galgoczy, D. J. & Toczyski, D. P. Checkpoint adaptation precedes spontaneous and
damage-induced genomic instability in yeast. Mol. Cell. Biol. 21, 1710–1718 (2001).
29. Coutelier, H., Xu, Z., Morisse, M. C., Lhuillier-Akakpo, M., Pelet, S., Charvin, G., Dubrana,
K. & Teixeira, M. T. Adaptation to DNA damage checkpoint in senescent telomerase-
negative cells promotes genome instability. Genes Dev. 32, 1499–1513 (2018).
30. Leroy, C., Lee, S. E., Vaze, M. B., Ochsenbien, F., Guerois, R., Haber, J. E. & Marsolier-
Kergoat, M.-C. PP2C phosphatases Ptc2 and Ptc3 are required for DNA checkpoint
inactivation after a double-strand break. Mol. Cell 11, 827–835 (2003).
31. Haber, J. E. A life investigating pathways that repair broken chromosomes. Annu. Rev.
Genet. 50, 1–28 (2016).
32. Lee, S. E., Pellicioli, A., Demeter, J., Vaze, M. P., Gasch, A. P., Malkova, A., Brown, P. O.,
Botstein, D., Stearns, T., Foiani, M. & Haber, J. E. Arrest, adaptation, and recovery
following a chromosome double-strand break in Saccharomyces cerevisiae. Cold Spring
Harb. Symp. Quant. Biol. 65, 303–314 (2000).
33. Coutelier, H. & Xu, Z. Adaptation in replicative senescence: a risky business. Curr. Genet.
65, 711–716 (2019).
34. Pellicioli, A., Lee, S. E., Lucca, C., Foiani, M. & Haber, J. E. Regulation of Saccharomyces
Rad53 checkpoint kinase during adaptation from DNA damage–induced G2/M arrest.
Mol. Cell 7, 293–300 (2001).
35. Guillemain, G., Ma, E., Mauger, S., Miron, S., Thai, R., Guérois, R., Ochsenbein, F. &
Marsolier-Kergoat, M.-C. Mechanisms of checkpoint kinase Rad53 inactivation after a
double-strand break in Saccharomyces cerevisiae. Mol. Cell. Biol. 27, 3378–3389 (2007).
36. Memisoglu, G., Eapen, V. V., Yang, Y., Klionsky, D. J. & Haber, J. E. PP2C phosphatases
63

Bibliography
promote autophagy by dephosphorylation of the Atg1 complex. Proc. Natl. Acad. Sci. U.
S. A. 116, 1613–1620 (2019).
37. Lee, S. E., Pellicioli, A., Vaze, M. B., Sugawara, N., Malkova, A., Foiani, M. & Haber, J. E.
Yeast Rad52 and Rad51 recombination proteins define a second pathway of DNA damage
assessment in response to a single double-strand break. Mol. Cell. Biol. 23, 8913–8923
(2003).
38. Clerici, M., Mantiero, D., Lucchini, G. & Longhese, M. P. The Saccharomyces cerevisiae
Sae2 protein negatively regulates DNA damage checkpoint signalling. EMBO Rep. 7,
212–218 (2006).
39. Lee, S. E., Pellicioli, A., Malkova, A., Foiani, M. & Haber, J. E. The Saccharomyces re-
combination protein Tid1p is required for adaptation from G2/M arrest induced by a
double-strand break. Curr. Biol. 11, 1053–1057 (2001).
40. Eapen, V. V., Sugawara, N., Tsabar, M., Wu, W.-H. & Haber, J. E. The Saccharomyces
cerevisiae chromatin remodeler Fun30 regulates DNA end resection and checkpoint
deactivation. Mol. Cell. Biol. 32, 4727–4740 (2012).
41. Dotiwala, F., Eapen, V. V., Harrison, J. C., Arbel-Eden, A., Ranade, V., Yoshida, S. & Haber,
J. E. DNA damage checkpoint triggers autophagy to regulate the initiation of anaphase.
Proc. Natl. Acad. Sci. U. S. A. 110, E41–E49 (2013).
42. Gallina, I., Colding, C., Henriksen, P., Beli, P., Nakamura, K., Offman, J., Mathiasen, D. P.,
Silva, S., Hoffmann, E., Groth, A., Choudhary, C. & Lisby, M. Cmr1/WDR76 defines a
nuclear genotoxic stress body linking genome integrity and protein quality control. Nat.
Commun. 6, 6533 (2015).
43. Clémenson, C. & Marsolier-Kergoat, M.-C. DNA damage checkpoint inactivation: Adap-
tation and recovery. DNA Repair 8, 1101–1109 (2009). Checkpoint response to DNA
damage.
44. Keogh, M.-C., Kim, J.-A., Downey, M., Fillingham, J., Chowdhury, D., Harrison, J. C.,
Onishi, M., Datta, N., Galicia, S., Emili, A., Lieberman, J., Shen, X., Buratowski, S., Haber,
J. E., Durocher, D., Greenblatt, J. F. & Krogan, N. J. A phosphatase complex that dephos-
phorylates γH2AX regulates DNA damage checkpoint recovery. Nature 439, 497–501
(2006).
45. Hustedt, N., Seeber, A., Sack, R., Tsai-Pflugfelder, M., Bhullar, B., Vlaming, H., van
64

Bibliography
Leeuwen, F., Guénolé, A., van Attikum, H., Srivas, R., Ideker, T., Shimada, K. & Gasser, S. M.
Yeast PP4 interacts with ATR homolog Ddc2-Mec1 and regulates checkpoint signaling.
Molecular Cell 57, 273–289 (2015).
46. Vidanes, G. M., Sweeney, F. D., Galicia, S., Cheung, S., Doyle, J. P., Durocher, D. & Toczyski,
D. P. CDC5 inhibits the hyperphosphorylation of the checkpoint kinase Rad53, leading
to checkpoint adaptation. PLoS Biol. 8, e1000286 (2010).
47. Donnianni, R. A., Ferrari, M., Lazzaro, F., Clerici, M., Tamilselvan Nachimuthu, B., Plevani,
P., Muzi-Falconi, M. & Pellicioli, A. Elevated levels of the Polo kinase Cdc5 override the
Mec1/ATR checkpoint in budding yeast by acting at different steps of the signaling
pathway. PLoS Genet. 6, 1–14 (2010).
48. Schleker, T., Shimada, K., Sack, R., Pike, B. L. & Gasser, S. M. Cell cycle-dependent
phosphorylation of Rad53 kinase by Cdc5 and Cdc28 modulates checkpoint adaptation.
Cell cycle 9, 350–63 (2010).
49. Botchkarev, V. V. & Haber, J. E. Functions and regulation of the Polo-like kinase Cdc5 in
the absence and presence of DNA damage. Curr. Genet. 64, 87–96 (2018).
50. Jaehnig, E. J., Kuo, D., Hombauer, H., Ideker, T. G. & Kolodner, R. D. Checkpoint kinases
regulate a global network of transcription factors in response to {DNA} damage. Cell Rep.
4, 174–188 (2013).
51. Rossio, V., Galati, E. & Piatti, S. Adapt or die: how eukaryotic cells respond to prolonged
activation of the spindle assembly checkpoint. Biochem. Soc. Trans. 38, 1645–1649 (2010).
52. Sadeghi, A., Dervey, R., Gligorovski, V. & Rahi, S. J. The optimal checkpoint strategy
balancing risk and speed predicts experimental DNA damage checkpoint override times.
bioRxiv 2020.08.14.251504 (2020). In revision, Nature Physics, screenshot from submis-
sion web site attached as evidence. Preprint: https://doi.org/10.1101/2020.08.14.251504.
53. Bowling, S., Lawlor, K. & Rodríguez, T. A. Cell competition: the winners and losers of
fitness selection. Development 146, 1–12 (2019).
54. Jain, S., Sugawara, N., Lydeard, J., Vaze, M., Tanguy Le Gac, N. & Haber, J. E. A recombina-
tion execution checkpoint regulates the choice of homologous recombination pathway
during DNA double-strand break repair. Genes Dev. 23, 291–303 (2009).
55. Hopfield, J. J. Kinetic proofreading: A new mechanism for reducing errors in biosynthetic
processes requiring high specificity. Proc. Natl. Acad. Sci. U. S. A. 71, 4135–4139 (1974).
65

Bibliography
56. Ninio, J. Kinetic amplification of enzyme discrimination. Biochimie 57, 587–595 (1975).
57. Berg, H. & Purcell, E. Physics of chemoreception. Biophys. J. 20, 193–219 (1977).
58. Ehrenberg, M. & Blomberg, C. Thermodynamic constraints on kinetic proofreading in
biosynthetic pathways. Biophys. J. 31, 333–358 (1980).
59. Freter, R. R. & Savageau, M. A. Proofreading systems of multiple stages for improved
accuracy of biological discrimination. J. Theor. Biol. 85, 99–123 (1980).
60. Savageau, M. A. & Lapointe, D. S. Optimization of kinetic proofreading: A general method
for derivation of the constraint relations and an exploration of a specific case. J. Theor.
Biol. 93, 157–177 (1981).
61. McKeithan, T. W. Kinetic proofreading in T-cell receptor signal transduction. Proc. Natl.
Acad. Sci. U. S. A. 92, 5042–5046 (1995).
62. Murugan, A., Huse, D. A. & Leibler, S. Speed, dissipation, and error in kinetic proofreading.
Proc. Natl. Acad. Sci. U. S. A. 109, 12034–12039 (2012).
63. Lan, G., Sartori, P., Neumann, S., Sourjik, V. & Tu, Y. The energy-speed-accuracy trade-off
in sensory adaptation. Nat. Phys. 8, 422–428 (2012).
64. Sartori, P., Granger, L., Lee, C. F. & Horowitz, J. M. Thermodynamic costs of information
processing in sensory adaptation. PLoS Comput. Biol. 10, 1–9 (2014).
65. Rao, R. & Peliti, L. Thermodynamics of accuracy in kinetic proofreading: dissipation and
efficiency trade-offs. J. Stat. Mech: Theory Exp. 2015, P06001 (2015).
66. ten Wolde, P. R., Becker, N. B., Ouldridge, T. E. & Mugler, A. Fundamental limits to cellular
sensing. J. Stat. Phys. 162, 1395–1424 (2016).
67. Banerjee, K., Kolomeisky, A. B. & Igoshin, O. A. Elucidating interplay of speed and
accuracy in biological error correction. Proc. Natl. Acad. Sci. U. S. A. 114, 5183–5188
(2017).
68. Cui, W. & Mehta, P. Identifying feasible operating regimes for early T-cell recognition:
The speed, energy, accuracy trade-off in kinetic proofreading and adaptive sorting. PLoS
One 13, 1–16 (2018).
69. Wong, F., Amir, A. & Gunawardena, J. Energy-speed-accuracy relation in complex net-
works for biological discrimination. Phys. Rev. E 98, 012420 (2018).
70. Mallory, J. D., Kolomeisky, A. B. & Igoshin, O. A. Trade-offs between error, speed, noise,
and energy dissipation in biological processes with proofreading. J. Phys. Chem. B 123,
66

Bibliography
4718–4725 (2019).
71. Morgan, D. O. The cell cycle: Principles of control (New Science Press, 2007).
72. Breivik, J. & Gaudernack, G. Resolving the evolutionary paradox of genetic instability:
a cost–benefit analysis of DNA repair in changing environments. FEBS Lett. 563, 7–12
(2004).
73. Komarova, N. L., Sadovsky, A. V. & Wan, F. Y. Selective pressures for and against genetic
instability in cancer: a time-dependent problem. J. R. Soc. Interface 5, 105–121 (2008).
74. Nik-Zainal, S. & Hall, B. A. Cellular survival over genomic perfection. Science 366, 802–803
(2019).
75. Ciliberto, A., Novak, B. & Tyson, J. J. Mathematical model of the morphogenesis check-
point in budding yeast. J. Cell Biol. 163, 1243–1254 (2003).
76. Bonaiuti, P., Chiroli, E., Gross, F., Corno, A., Vernieri, C., Štefl, M., Cosentino Lagomarsino,
M., Knop, M. & Ciliberto, A. Cells escape an operational mitotic checkpoint through a
stochastic process. Curr. Biol. 28, 28–37 (2018).
77. Aguda, B. D. A quantitative analysis of the kinetics of the G2 DNA damage checkpoint
system. Proc. Natl. Acad. Sci. U. S. A. 96, 11352–11357 (1999).
78. Gérard, C. & Goldbeter, A. Temporal self-organization of the cyclin/Cdk network driving
the mammalian cell cycle. Proc. Natl. Acad. Sci. U. S. A. 106, 21643–21648 (2009).
79. Qu, Z., Weiss, J. N. & MacLellan, W. R. Regulation of the mammalian cell cycle: a model
of the G1-to-S transition. Am. J. Physiol. 284, C349–C364 (2003).
80. Qu, Z., MacLellan, W. R. & Weiss, J. N. Dynamics of the cell cycle: Checkpoints, sizers,
and timers. Biophys. J. 85, 3600–3611 (2003).
81. Iwamoto, K., Hamada, H., Eguchi, Y. & Okamoto, M. Mathematical modeling of cell cycle
regulation in response to DNA damage: Exploring mechanisms of cell-fate determination.
Biosystems 103, 384–391 (2011).
82. He, E., Kapuy, O., Oliveira, R. A., Uhlmann, F., Tyson, J. J. & Novák, B. System-level
feedbacks make the anaphase switch irreversible. Proc. Natl. Acad. Sci. U. S. A. 108,
10016–10021 (2011).
83. Kesseler, K. J., Blinov, M. L., Elston, T. C., Kaufmann, W. K. & Simpson, D. A. A predictive
mathematical model of the DNA damage G2 checkpoint. J. Theor. Biol. 320, 159–169
(2013).
67

Bibliography
84. Iwamoto, K., Hamada, H., Eguchi, Y. & Okamoto, M. Stochasticity of intranuclear bio-
chemical reaction processes controls the final decision of cell fate associated with DNA
damage. PLoS One 9, 1–12 (2014).
85. Heldt, F. S., Barr, A. R., Cooper, S., Bakal, C. & Novák, B. A comprehensive model for the
proliferation–quiescence decision in response to endogenous DNA damage in human
cells. Proc. Natl. Acad. Sci. U. S. A. 115, 2532–2537 (2018).
86. Jung, Y. & Kraikivski, P. Computational model of G2-M DNA damage checkpoint regula-
tion in normal and p53-null cancer cells. bioRxiv 2020.06.17.158246 (2020).
87. Chen, K. C., Calzone, L., Csikasz-Nagy, A., Cross, F. R., Novak, B. & Tyson, J. J. Integrative
analysis of cell cycle control in budding yeast. Mol. Biol. Cell 15, 3841–3862 (2004).
88. Curtis, N. L., Ruda, G. F., Brennan, P. & Bolanos-Garcia, V. M. Deregulation of chromosome
segregation and cancer. Annu. Rev. Cancer Biol. 4, 257–278 (2020).
89. Lee, S. E., Pâques, F., Sylvan, J. & Haber, J. E. Role of yeast SIR genes and mating type in
directing DNA double-strand breaks to homologous and non-homologous repair paths.
Curr. Biol. 9, 767–770 (1999).
90. Chiruvella, K. K., Liang, Z. & Wilson, T. E. Repair of double-strand breaks by end joining.
Cold Spring Harbor Perspect. Biol. 5, a012757 (2013).
91. Crow, J. F. & Kimura, M. An Introduction to Population Genetics Theory (The Blackburn
Press, 1970).
92. Orr, H. A. Fitness and its role in evolutionary genetics. Nat. Rev. Genet. 10, 531–539
(2009).
93. Kelly Jr., J. L. A new interpretation of information rate. Bell Syst. Tech. J. 35, 917–926
(1956).
94. Amon, A., Irniger, S. & Nasmyth, K. Closing the cell cycle circle in yeast: G2 cyclin
proteolysis initiated at mitosis persists until the activation of G1 cyclins in the next cycle.
Cell 77, 1037 – 1050 (1994).
95. Dietler, N., Minder, M., Gligorovski, V., Economou, A. M., Joly, D. A. H. L., Sadeghi, A.,
Chan, C. H. M., Kozinski, M., Weigert, M., Bitbol, A.-F. & Rahi, S. J. A convolutional neural
network segments yeast microscopy images with high accuracy. Nat. Commun. 11, 5723
(2020).
96. Kaboli, S., Yamakawa, T., Sunada, K., Takagaki, T., Sasano, Y., Sugiyama, M., Kaneko, Y.
68

Bibliography
& Harashima, S. Genome-wide mapping of unexplored essential regions in the Sac-
charomyces cerevisiae genome: evidence for hidden synthetic lethal combinations in a
genetic interaction network. Nucleic Acids Res. 42, 9838–9853 (2014).
97. Moore, J. K. & Haber, J. E. Cell cycle and genetic requirements of two pathways of
nonhomologous end-joining repair of double-strand breaks in Saccharomyces cerevisiae.
Mol. Cell. Biol. 16, 2164–2173 (1996).
98. Haber, J. E. Mating-type genes and MAT switching in Saccharomyces cerevisiae. Genetics
191, 33–64 (2012).
99. Elserafy, M. & El-Khamisy, S. F. Choose your yeast strain carefully: the RAD5 gene matters.
Nat. Rev. Mol. Cell Biol. 19, 343–344 (2018).
100. Kaye, J. A., Melo, J. A., Cheung, S. K., Vaze, M. B., Haber, J. E. & Toczyski, D. P. DNA breaks
promote genomic instability by impeding proper chromosome segregation. Curr. Biol.
14, 2096–2106 (2004).
101. Tsabar, M., Haase, J., Harrison, B., Snider, C. E., Eldridge, B., Kaminsky, L., Hine, R. M.,
Haber, J. E. & Bloom, K. A cohesin-based partitioning mechanism revealed upon tran-
scriptional inactivation of centromere. PLoS Genet. 12, 1–25 (2016).
102. Roux, P., Salort, D. & Xu, Z. Adaptation to DNA damage as a bet-hedging mechanism in a
fluctuating environment. R. Soc. Open Sci. 8, 210460 (2021).
69


Contact Website: https://www.epfl.ch/labs/lpbs/Phone: +41789122090
Work experience Ara-research, Tehran 2016
Modaresan-e sharif (instituteof education)
2013 — 2017
Sharif University ofTechnology
2016 — 2017
Researcher
Building a scanning electron microscope.
Editor
Editing several books in mathematics and physics for the institute.Designing tests for preparation for master and doctoral nation-wideentrance exam.
A research into cosmic rays sources and detectors
I and Mr Heydarizad have built a cloud chamber in professor Bahmanabadi'slab.
This is aired in Iran-national TV: https://bit.ly/3nuLYG6
Qualifications JOURNAL ARTICLE AND CONFERENCES:
1. Optimizing checkpoint strategies based on first principles predictsexperimental DNA damage checkpoint override times, Authors: A Sadeghi, R Dervey, V Gligorovski, SJ Rahi; under revision innature physics; https://doi.org/10.1101/2020.08.14.251504
2. Multidimensional single-cell benchmarking of inducible promoters forprecise dynamic control in budding yeast, under revision in naturecommunication.Authors: V Gligorovski, A Sadeghi, SJ Rahi;https://doi.org/10.1101/2020.08.16.253310
3. YeaZ: A convolutional neural network for highly accurate, label-free
Ahmad Sadeghi [email protected] 1
71

segmentation of yeast microscopy images, Authors: N Dietler, MMinder, V Gligorovski, AM Economou, DAHL Joly, A Sadeghi, Chun HeiMichael Chan, Mateusz Koziński, Martin Weigert, Anne-Florence Bitbol,Sahand Jamal Rahi;Nature Communications 11, 5723 (2020),https://doi.org/10.1038/s41467-020-19557-4
4. Emergent Weak Scale from Cosmological Evolution and DimensionalTransmutation, Authors: A Sadeghi, M Torabian;https://arxiv.org/abs/1512.02948
5. Crosstalk Suppression and High-Fidelity Measurement in 2-D Tunnelingof Coupled Josephson Junctions, Authors: A Sadeghi, H Zandi, SKhorasani; IEEE Transactions on Applied Superconductivity; doi:10.1109/TASC.2012.2193616.
COMPUTER SKILLS: 1. Programming Languages: C and C++, Quartus, AssemblyLanguage ,and Python. 2. Technical Software: Pspice, Codevision AVR, MatLab, AWR, andMathematica. 3. Other: Basics of machine learning, Microsoft Office, Math type, LaTeX…
QUALIFICATION EXAMS:
1. GRE Physics: 980/9902. GRE Quantitative: 170/1703. GRE Verbal: 144/1704. TOEFL: Reading 27,Listening 21,Speaking 22, Writing 23
HONORS AND AWARDS:Ranked 73rd in nationwide entrance exam into bachelor of science among319,259 (top 0.02%) students in 2008. Ranked 13th in nationwide entranceexam into master of science of around 13,000 students in 2013 and ranked 3rd in nationwide entrance exam into PhD of physics in 2015.
MAIN DUTIES DURING PhD:
1. Carried out molecular biology experiments, including DNA extraction,PCR, qPCR, molecular cloning, gel electrophoresis, making DNAconstructs, ...
2. Fluorescence-activated cell sorting, including SONY-SH800S, andAttune NxT.
3. Microscopy, including fluorescence microscopy (Nikon Ti2).4. Microfluidic (studying the dynamics of gene expression in budding
yeast cells).
Education PhD in Biophysics 01/08/2018 — 09/07/2021
MSc in Physics 22/08/2013 — 22/08/2015
École polytechnique fédérale de Lausanne (EPFL)
Thesis title: Principles of checkpoint override
Sharif University of Technology
Thesis title: Emergence of the Electroweak Scale via Cosmic Relation andQuantum Corrections.
Ahmad Sadeghi [email protected] 2
72

BSc in Electerical Engineering 22/08/2008 — 22/08/2013Sharif University of Technology
Thesis title: A research into high temperature superconductivity.
Interests Music, Reading, Biking
Ahmad Sadeghi [email protected] 3
73


