Embed Size (px)
Citation preview
Prime Minister and Parliament: Strategic Split-Ticket Voting
Paul R. AbramsonMichigan State University
John H. AldrichMatthew Diamond
Renan LevineThomas J. Scotto
Duke University
Abraham DiskinHebrew University of Jerusalem
We investigate strategic considerations in a contest using run-off rules andcompare our results to elections using plurality rules and to those usingproportional representation. We examine the unusual case of the Israeli Electionof 1999, when two votes, one for a prime minister and one for a parliamentaryparty, were cast. Strategic considerations should be expected to influence bothvotes as voters attempt to maximize utility given their preferences for thegoverning coalition, their expectations of who will lead that coalition, and whatoutcomes they will enact. We observe strategic voting in the direct vote for PrimeMinister, especially when candidates are thought to be in a close race. We alsofind that voters incorporate expectations of the outcome of the parliamentaryelection when deciding whom to support. “Split-ticket” voting occurs when thevoter prefers a different party to the party of the prime minister and as aconsequence of expectations of coalition power interacting with expectations ofwho will be the Prime Minister.
Paper prepared for delivery at the 2001 Annual Meeting of the American Political ScienceAssociation, Hilton San Francisco and Towers, August 30 - September 2, 2001.
Copyright by the American Political Science Association.
Questions or comments can be sent to: [email protected]
Latest version can be viewed on-line at: http://www.duke.edu/~rml5/papers

1
Introduction
What set of electoral laws are most effective at inducing voters to reveal their trueor “sincere” preferences? Scholars of comparative politics have long been interested inidentifying the conditions under which voters support less desirable candidates who havea better chance of winning. We examine strategic considerations in a contest using run-off rules and compare our results to elections using plurality rules and to those usingproportional representation before examining the strategic considerations when twovotes, one for a prime minister and one for a parliamentary party, are cast. Strategicconsiderations should be expected to affect both votes as voters attempt to maximizeutility given their preferences for the governing coalition, their expectations of who willlead that coalition, and what outcomes they will enact.
The classic formulations of the strategic calculations of voting (Riker andOrdeshook 1968, McKelvey and Ordeshook 1972) argue that voters choose amongalternatives by looking at their possible choices as well as their perceptions of outcomesof the electoral contest. After comparing the utility expected to accrue as a result of eachpossible course action, citizens choose the voting strategy that will maximize theirexpected utility. We apply this calculus of voting to the May 17, 1999 Israeli election.This election was governed by an unusual set of electoral laws creating a hybrid semi-presidential system with a directly elected Prime Minister. During this election, Israelivoters cast two votes; one for the head of government, the Prime Minister, and one for aparliamentary party. Under this system, the Prime Minister was elected to office by amajority vote. If no candidate had a majority in the first round of voting, a run-offelection was held between the top two finishers. In the Israeli Parliament, the Knesset,seats are allocated through a system of proportional representation. Unlike a purepresidential system, the Prime Minister’s power remained dependent on the consent of amajority of parliamentarians. Consequently, the Israeli case served as a rare laboratoryfor the comparative study of voting behavior, with two votes, normally found in differentsystems, occurring at the same time and shaping a common outcome. We examine thestrategic considerations existing for each type of vote independently, but we argue thatcorrectly modeling the behavior of the voters requires the consideration of both votes.With two votes, each Israeli voices a preference for who should lead the governingcoalition and which party should be strongest in the parliament or cabinet. Thecombination affects the formation of the government, leading to the most desirable set ofpolicy outcomes. In this case study, we use data from a representative sample collectedduring the election campaign by Abraham Diskin and from another study conducted byAsher Arian and Michal Shamir.1 We first examine strategic considerations in the PrimeMinister’s race and introduce a novel method of estimating aversion to wasted votes. Wethen compare turn to an analysis of voting for the Knesset before considering theconstruction of a unified model.
1 Diskin’s survey is based upon a cluster sample of 995 respondents conducted between April 28 and May5. The Arian and Shamir survey is based upon 1,225 respondents conducted during the six weeks beforethe election. Respondents to both surveys were interviewed face to face by survey researchers. Bothsurveys were implemented while all five candidates for Prime Minister were in the race. Both surveysinclude Jews and Arabs, but most of our analysis examines only the Jewish voters.
2
Strategic Voting
One way to conceive of voting is that it represents an expression of astraightforward preference for one candidate. Indeed, this is precisely what one wouldexpect, if, as Ferejohn and Fiorina (1974, 1975, 1993) have argued, rational voters followa “minimax-regret” strategy - minimizing their maximum regret. The maximum regretfor these voters would be for their preferred candidate to lose because they failed to votefor him or her. Thus, to minimize this regret, a rational voter would always vote for hermost preferred candidate. Strategic considerations do not affect the choices made byminimax regret voters.
This strategy may be inappropriate when the voter is confronted with a choicebetween more than two candidates on the ballot. In these contests, many voters, whomwe refer to as “sincere” voters, may continue to support their preferred candidateregardless of that candidate’s chance of winning. But at least some voters, whom we call“sophisticated” or “strategic” voters, may not vote for the candidate they like best.Rather, they may vote to maximize their expected utility by taking into account theirperceptions of the probability of electoral outcomes (Riker and Ordeshook 1968,McKelvey and Ordeshook 1972). In this environment, voters weigh their utility for acandidate against the odds of that candidate winning, under the assumption that the closera candidate is to winning, the more efficacious is the individual’s vote. As Riker (1986,78) defines it, strategic voting is “voting contrary to one’s immediate tastes in order toobtain an advantage in the long run.”
A strong account of strategic voting must take note that information regarding thecloseness of the electoral contest, especially through media-reported polling, would havea significant impact upon voting behavior. Polls signal to the voter the viability of thecandidates, defined as the probability a candidate will win a race. In a close contest, theprobability of influencing the outcome of the election is assumed to be looming large invoters’ minds, affecting their voting calculations. Strategic voting should be most likelywhen polls show that a race between a voter’s least preferred candidate and the voter’ssecond choice is close, especially if the voter greatly prefers the second choice candidate.Most accounts of strategic voting emphasize the penchant to vote strategically when thevoter’s preferred candidate is perceived to be a non-viable candidate with little chance ofwinning. The impetus for that voter to vote strategically is greatest when altering hervote will contribute to the victory of her second choice over her least preferred candidate.
We present new evidence that it is not just a hopeless candidacy that contributesto a “wasted” vote in strategic terms. If the polls project a landslide there would seem tobe little reason to vote strategically since the perceived probability of altering theoutcome drops as the victory margin increases. The argument is symmetric, and votingfor a candidate who is running away with the contest is also considered to be a “wasted”a vote. Thus, the information about the perceived probability of the candidate winningmust be “folded” at the victory point to reflect the degree of competitiveness of theelectoral race and the chance that the voter may cast a decisive vote in the election.
3
Previous work empirically demonstrates that there has been strategic voting inAmerican political contests. Abramson and his colleagues (1992) use data collected bythe National Election Studies (NES) during the 1988 U.S. presidential primaries tosuggest that at least some primary voters were “sophisticated,” or “strategic,” byincorporating their assessments of the viability of candidates in making their votingchoices. Analyses of NES data also suggest that there was strategic voting in the 1968,1980, 1992, 1996 and 2000 U.S. presidential contests (Abramson et al., 1995; Abramson,Aldrich and Rohde, 2001).
Numerous other studies have explored the logic of supporting unviable candidatesin a comparative context, especially for parliamentary elections. Most of the thesestudies explore the extent to which voters are motivated by disaffection (Miller andListhaug 1990), a weak attachment to the largest parties (Dalton and Wattenberg 2001),or support for the niche concerns articulated by small parties (Kitschelt 1989). Duverger(1963) originally suggested that there is little reason to expect strategic voting in run-offelections. Voters may vote sincerely so that their candidates will be in a better position toextract sympathetic policy promises in exchange for their endorsement in the secondround, or because they expect the opportunity to vote again in the second round (seeAbramson, et al. 1995).2 Cox (1997) developed the formal logic of strategic competitionfrom single-ballot plurality elections to runoff elections. Since voters respond to theincentive structure provided by the electoral system, strategic voting limits the number ofentrants in a dual-ballot race similar to the way it limits the number of entrants in asingle-ballot election. Responding to voters averse to wasting support on candidates withno chance of even making it to the second round, few candidacies are launched beyondthe number of candidates who can qualify for the second round plus one. However, Coxexpects that strategic voting would be more unusual in run-off elections than pluralityelections.
Estimation of Models Based on the Multi-candidate Calculus of Voting:
A) Vote for Prime Minister Candidate: We expect to observe strategic voting forPrime Minister, rather than purely sincere voting. The dependent variable in our model ofthe choice for Prime Minister is dichotomous. If the respondent planned to vote for theirmost preferred candidate as measured by the feeling thermometer scores the variable isscored a one. Otherwise, the variable is given a value of zero. The independent variablesare comparisons of viability expectations. The survey asked respondents to estimate thechance of the candidate winning. These responses were normalized so that thepercentages summed to 100%. The data was then folded at the victory point, 50%. So, themaximum value is 0.5, with a candidate with no chance of winning and a candidate witha 100% chance of winning being assigned a value of zero. By folding the scale at thevictory point, high values reflect how close the candidate is to winning an election by asingle vote.3
2 While these works mainly consider parliamentary elections, we expect the logic of their arguments to alsoapply to elections for executive offices.3 Careful readers will note that in a three-way race for a single office, a plurality can be won by a singlevote over one-third (33.33%) of the votes cast. However, in this case, an outright winner of this election

4
Using data taken from two surveys of the 1999 Israeli election for Prime Minister,we first seek to examine the relationship between voter preferences, candidateevaluations, and citizen assessments of the chances of each of the three main primeministerial candidate’s chances of winning. We test Cox and Duverger’s propositions bycomparing the expected vote decisions by survey respondents in a run-off election inIsrael to survey data from American survey data. We develop and test several models ofvoting behavior positing that the decision to vote for one’s favored candidate is a functionof that candidate’s participation in a close race and the level of affect toward thatcandidate relative to his competitors. Our innovative use of folded probability scoresdemonstrates that voters are more likely to vote strategically to support a candidate in acompetitive race.
B) Vote for Knesset Party: We then shift our attention to the parliamentary election anddiscuss whether similar considerations of wasting votes applies to an election under asystem of proportional representation where the entire nation is one district and thethreshold for representation is a low 1.5%. Israel’s party system is extremely fragmented,with 15 independent lists4 winning representation in the Knesset in 1999. In addition toconsidering which list will cross the minimum threshold to gain seats, a voter might alsofocus on the extent that the party can influence the nature of the governing coalition.While the directly elected Prime Minister will lead the cabinet, he may be able to enjoy amajority alliance with like-minded parties or he may be forced to cobble a coalition fromparties across the spectrum including the main opposition party. Some parties in 1999would have enjoyed more power and influence under a government led by the incumbentPrime Minister Benjamin Netanyahu, others under a government led by one of hisopponents. Others may benefit from being included in a “unity” government includingboth of the largest parties.
Like most other parliamentary systems, bargaining power comes from aninteraction between the size and the ideological position of the parties (see Strom, Budgeand Laver 1994). At the outset of every Israeli election campaign since the 1970’s, Laborand Likud were assumed to be the two largest parties. So, the other Israeli parties desireto be the third largest party in the Knesset. The third largest party would be in the bestposition to negotiate with either of the two major parties (assuming the third largest partyare in the “pivot” between the two parties)5. The size of parties usually determines the
required 50% of the vote. A candidate who receives one-third of the total vote plus one is only guaranteedparticipation in a run-off. Furthermore, experimental psychologists suggest that when the event space ispartitioned, expected probabilities will often sum to greater than one. The complement of one event, sayBarak winning, is often less than the sum of the other possible events, in this case the probability ofNetanyahu or Mordecai winning (Rottenstreich and Tversky 1997; see Fox 1999). So, despite somehesitations, we expect that values approaching 0.5 (rather than 0.33) will capture the competitiveness of thecandidate, resulting in a greater inclination to vote for that candidate rather than one expected to coast tovictory or lose in a landslide.4 Arian (1998) draws a distinction between lists and parties. Parties are formal institutions engaged in anon-going pursuit of power. Voters cast a vote for a list made up of one or more parties who choose to unifyon election day.5 We define a “major” party to be a party led by a viable candidate for Prime Minister. We use this term todifferentiate between the largest parties (Likud, Labor and Shas) and the “major” parties (Likud, Labor/OneIsrael and the Center in 1999, Labor and Likud only in 1996 and 2001).
5
number of cabinet seats they receive in a government. For many parties, more importantthan the number of cabinet seats is which cabinet seat they get (thus, this is consistentwith the theory of cabinet formation developed by Laver and Shepsle, 1996). Many ofthe smaller parties are similar to interest groups in other countries, and care only about aselect area of legislation or only matters that concern a narrow constituency. These goalsare often incompatible with another party’s goals,6 so an extra percentage point for somesmall or even medium size parties could make a large difference in government influenceand policy. However, the marginal value of each additional seat eventually decreases dueto the inability of any party to receive a majority of seats and the necessity of includingsome very small parties in any viable coalition. Remaining seats in the Knesset areallocated using the d’Hondt formula that benefits larger parties (Arian 1998, p. 186).Many lists, though, enter into pre-election pacts to pool remaining votes.
We do not expect that the same notion of a wasted vote applies to the Knesset.Even though the marginal value of an additional Knesset seat presumably does decline invalue for most voters, it never becomes negative. We cannot think of any realisticscenario where a voter would desire that their favorite party should not maximize votes.7
However, since the marginal value of additional seats does decline, it is possible that themarginal value of increasing the vote share of one party may exceed the marginal valueof increasing the vote share of one’s favorite party. The logic we are trying to capture isthat, to a voter, it may matter less if a large list like One Israel wins 24 or 25, or even 26seats. However, another seat or two may greatly aid a smaller party, such as thesecularist Shinui, or the leftist Meretz, so they desire to cast a vote for the smaller party.Based upon the fact that a voter must take into account the number of mandates a party isexpected to receive, whether or not a particular party will act as a “pivot,” and whichparties will receive representation in the cabinet, we expect to observe strategic voting forthe Knesset. However, we hypothesize that strategic considerations will be stronger forPrime Minister than for the Knesset since the probability of “wasting” ones vote is muchlower under rules of parliamentary representation.
C) Unified Model of Competition: The policy outcomes that result after the election arevery much dependent on the winner of the direct election for Prime Minister and thegovernment he forms based on the distribution of seats in the Knesset. Since the policyoutcomes are dependent on the results of two simultaneous elections, a properly definedutility maximization model of voting must consider:
a) The voter’s preferences for the Prime Ministerial candidates.
b) The voter’s preferences for Knesset representation.
6 For example, the two Russian parties might seek control of the Interior Ministry, but so will threereligious parties. One religious party might desire either another religious party or a Russian party to get theministry.7 There is a theoretical possibility that a voter dislikes the party whom their favorite party has an agreementto pool any unallocated votes, and would desire to vote for another party rather than see their vote pooled.Expecting one’s party to have extra votes requires an exceptional level of sophistication, if not a crystalball. In these circumstances, the probability of one’s vote being enough for the list to get another seatremains positive, so it seems highly unlikely that many voters would defect for these reasons.

6
c) The voter’s expectations of who will win the direct election (in the first orsecond round).
d) The voter’s expectations of the distribution of power in the Knesset.
We compare strategic behavior in the two related contexts, but complicatingmatters is that the preferences for Knesset (or Prime Minister) may be conditional on theexpectations of the outcome of the election of the Prime Minister (Knesset). If votersexpect their favorite candidate to win the election for Prime Minister, then a sincere votemay be cast for the party of the Prime Minister or another party that more closely reflectsthe voter’s policy preferences. Sincere vote for either the party of the Prime Minister oran extreme party may not be desirable if voters expect their favored candidate to lose. Avote for a party in “the pivot” with the opportunity to be influential in any coalition maybe desirable to voters who expect their favorite candidate for Prime Minister to lose orare uncertain about the outcome. For example, the leftist8 Meretz list could expect toexert little influence on a government led by the rightist Netanyahu, but would be animportant player in almost any government formed by challenger Ehud Barak. So, a voterwho expects Netanyahu to win may choose instead to vote for a small party such as thesecularist Shinui that (if strong) would have more influence in a Netanyahu-led coalition.However, if the voters expect Barak to win, then a vote for Meretz may result in thehighest expected utility for the voter. Increasing support for Meretz affects the possibilitythat Barak could build a coalition entirely from parties on the left and center, or that leftor secular interests would be stronger in a broad or unity coalition arrangement.
So, we hypothesize that the vote for Prime Minister may reflect expectations ofwho will win, but voting for a party other than the party of the candidate for PrimeMinister will reflect a sincere appreciation for the different party. Alternatively, splitticket voting will occur as the result of a different set of strategic considerations forKnesset, based on expectations of coalition power interacting with expectations of whowill be the Prime Minister.
1999 Israeli Election
As a multi-candidate runoff election in a country with a high degree of media-reported polling, the 1999 Israeli elections provided an excellent case to examinestrategic voting outside the American context. Israelis are sophisticated consumers ofpolitical information, and the Israeli media provides it incessantly. Virtually every majormedia source conducts weekly polls during a campaign and these poll results top thenews coverage. Such an environment is the natural habitat of the strategic voter. Inaddition, the unique electoral rules governing the 1999 Israeli elections are ideally suitedto this investigation, as will be described below. We looked to this case, then, inanticipation of understanding the voting relationship between voter preferences, 8 Careful readers will note that it is more appropriate to characterize most major parties along the “dove-hawk” security dimension. Since Microsoft Word does not believe that dove can be made into an adjectivein English, we use the traditional comparative left-right terminology and warn our readers that left-right incontemporary Israel does not refer to economic policy. Nonetheless, left-right is the most common termsemployed in the polity to describe the primary political cleavage (see also Arian and Shamir 1983). Dovesflock to parties of the left.
7
candidate evaluations, and viability assessments in a multi-candidate election. First wepresent a discussion of our case:
The Campaign for Prime Minister
In the direct election for Prime Minister, the incumbent Prime Minister Benjamin“Bibi” Netanyahu from the right-wing Likud party faced four challengers: Azmi Bishara,Ehud Barak, Yitzhak Mordecai and Benny Begin. In our analyses, we exclude Bisharaand Begin since they were extremely marginal candidates from the start until theirultimate withdrawal. Bishara, a Christian, ran simply to set the precedent that an IsraeliArab nationalist could run, but was never a serious contender even in the Arab sector.Begin, the son of the late Likud icon, Prime Minister Menachem Begin, split off from theLikud to the far right because he felt that Netanyahu was a compulsive prevaricatorutterly lacking in integrity. Begin also feared the possibility that Netanyahu wouldimplement the Wye River peace accord with the Palestinians. Though many, even on theleft, respected Begin’s personal honesty and integrity, his ultra-right positions regardingthe peace process relegated him to a fringe candidacy before he eventually bowed out.
The two remaining candidates, Barak and Mordecai, were both significantcontenders against Netanyahu. Barak had been the Chief of Staff of the Israel DefenseForces and the Defense Minister under Prime Minster Shimon Peres following the Rabinassassination. He took the helm of the center-left Labor party after the 1996 elections,when Peres lost to Netanyahu. Emulating Clinton and Blair, Barak led the party towardsthe center to beat Netanyahu. Though the far left considered Barak too right-wing, theyacquiesced to his candidacy because they considered Netanyahu anathema. They soughtNetanyahu’s defeat at all costs because they blamed Netanyahu for the Rabinassassination and for setbacks in the peace process. Barak ran as the head of One Israel,a joint list from the Labor Party and two tiny parties - the religious peace party, Meimad,and former Netanyahu cabinet minister David Levy’s Sephardic [Jews of North Africanor Middle Eastern descent] party, Gesher.
Mordecai, a Kurdish Jew born in Iraq, was Netanyahu’s Defense Minister untilFebruary 1999, shortly before the calling of early elections. Mordecai was consideringleaving the Likud to ally with Netanyahu’s former Finance Minister, Dan Meridor, whohad already resigned. When Netanyahu discovered Mordecai’s contacts with Meridor, hedismissed Mordecai immediately. Mordecai then joined a new Center Party togetherwith Meridor, Tel Aviv mayor Roni Milo and former Chief of Staff Amnon Lipkin-Shahak. They put forward a parliamentary list composed of “all-stars” from all parts ofthe political spectrum, united primarily by disrespect for Netanyahu and vague centristpolicy aspirations and appeals to Sephardic voters.
But in the three-way race that developed between Netanyahu, Barak andMordecai, the strategic competition was largely between Barak and Mordecai over whowas the more viable challenger to Netanyahu. Indeed, Mordecai ran campaign ads thatexplicitly called for strategic voting until the last week of the campaign (Harris, May 12,1999). Though polls showed him a distant third in the three-way race, he claimed thatpolls showed he had the best chance of defeating Netanyahu head-to-head, and, to a
8
background of rolling dice, exhorted voters not to gamble on Barak against Netanyahu.As the campaign progressed, Barak was not only preferred to Mordecai by the voters, butpolls identified him as the most viable candidate head-to-head against Netanyahu as well(see Figure 1 and 2). Left without even the viability claim, Mordecai withdrew from therace the morning before the election. Barak went on to defeat Netanyahu in the firstround.
[Figures 1 and 2 about here]
These events remind us that no account of strategic voting would be completewithout mentioning that on the two-way street of democracy, not only does informationabout candidate viability and electoral competitiveness influence levels of strategicvoting, but indications of strategic voting also influence elite behavior, such as thechoices made by candidates to remain in an electoral contest or to withdraw. In theparticular case considered here, the Israeli elections in 1999, all candidates but the twowith the most support, Barak and Netanyahu, withdrew from the race for Prime Ministerin the final days of the campaign precisely because of the levels of strategic votes theyanticipated being cast.
The Campaign for Knesset
The need for an election was created in December 1998, after the Knesset votedto dissolve itself when Netanyahu failed to garner enough support for his securitypolicies. While much of the Prime Minister’s campaign focused on the incumbentNetanyahu, his personality and the peace process, other concerns played important rolesin the campaign for parliamentary representation. Included in these concerns were specialbenefits for ultra-orthodox religious Jews and recent immigrants (especially from theformer Soviet Union), and the prosecution for bribery of a prominent leader of Shas, theSephardi religious party, Rabbi Aryeh Deri.
Labor had been the largest party in the out-going Knesset, with 34 seats ormandates. To Labor’s left was Meretz, a coalition of doves and secularists, with nineseats. Four seats were held by Arab parties, and another five were held by the Israelicommunists (Hadash). Netanyahu’s Likud (and allied parties on the same list) won 32seats. A small party further right held two seats. Netanyahu’s coalition included Shas, anultra-orthodox religious party supported primarily by Sephardi Jews (ten seats), theorthodox Zionists, National Religious Party (NRP or Mafdal, nine seats) and anotherultra-orthodox religious party (four seats). Yisrael B’aliya, a party articulating theconcerns of the predominantly secular new immigrants won seven seats, and the centristThird Way, who campaigned against withdrawal from the Golan Heights, held four seats.
The Knesset campaign featured several significant new voices: a right-wingRussian immigrant party, Yisrael Beiteinu led by Netanyahu’s former chief of staff,Avigdor Lieberman, Mordecai’s moderate “all-star” Center Party, and the secular Shinui(Change). Shinui had participated as a part of the Meretz list in the two previouselections, but decided to run an independent list in 1999. Shinui, led by a popular Israelitalk show personality Tommy Lapid, emphasized opposition to the influence of thereligious parties along with free-market policies and an ambiguous approach to the peace
9
process. Many smaller parties contested the election, including a party advocating thelegalization of marijuana, an environmentalist party, and a party led by former model andcosmetics queen, Pnina Rosenblum. Of these, only Am Echad (One Nation), a party ledby national union leader Amir Peretz, crossed the threshold.
Israeli voters chose from a bewildering array of choices in 1999. To attempt asimplification, Jewish voters could support a party on the left (Labor, Am Echad, Meretzor Hadash), on the right (Likud or the National Unity Party), in the center (Center Party,Third Way), a religious party (NRP, United Torah Judaism), an anti-clerical party(Shinui), an immigrant party (Yisrael B’aliya, Yisrael Beiteinu), or Shas(religious/Sephardi). Voters could decide to support either the largest party on the right orleft (Likud and Labor, respectively), or a smaller party articulating a narrower set ofinterests. Most chose to support one of the smaller parties (see Figure 3).
[Figure 3: Knesset Results about here]
The number of seats held by the two major parties fell precipitously. Likud,routed amidst Netanyahu’s defeat, won only 19 seats. On the right, Begin’s NationalUnity Party won four mandates. Riding Barak’s coattails, Labor held onto 26 seats,successful relative to their opponents, but a 24% decline in representation compared tothe previous election. Am Echad won two seats and Meretz claimed another nine. ThirdWay failed to cross the threshold, but the Center Party won 6 seats. The religious partieswon 10 mandates, the two immigrant parties won 11 seats,9 but the big news was thestrong showing of two diametrically opposed parties, Shinui and Shas. Shinui won asurprising six seats, while Shas fell just short of becoming the second largest party in theKnesset, with 17 mandates.
In 1999, most expected that the religious parties would likely play a pivotal rolein post-election coalition negotiation. During the campaign, it was widely expected thatone or both Russian parties, Shas, and the Center Party would also be importantcomponents of most winning coalitions. However, as Barak’s lead in the polls solidified,commentators raised the question of whether Barak would be able to assemble a coalitionentirely from parties that supported the peace process and/or opposed the influence of thereligious parties. As a result of the strong showing by such a dissimilar set of smallparties, Barak found it difficult to assemble a coalition. The strong showing by Shas andthe other religious parties ensured that Barak’s government, like almost every Israeligovernment before him, would include at least one religious party.
Prime Minister Candidate Preferences
Table 1 reports data from the survey conducted by Diskin. Diskin askedrespondents to evaluate the candidates on a thermometer measure of 0-100. In Table 1,we present the percentage of voters who gave each candidate the highest feelingthermometer measure by whom they intended to vote. There is a strong suggestion hereof strategic voting. While frontrunners Barak and Netanyahu each captured 97.6% of the 9 Parties representing Israeli Arabs, Ra’am (United Arab List), Hadash and Bishara’s Balad Party won tenseats.

10
votes of those who preferred them to any other candidate, Mordecai captures only 68% ofthe votes when he is the preferred candidate. Similarly, when voters were indifferentbetween Mordecai and one of the frontrunners, they were much more likely to vote forthe frontrunner. Eighty-six percent of those who liked Mordecai and Netanyahu the same(but more than Barak), voted for Netanyahu, and 65% of those who liked Mordecai andBarak the same voted for Barak. When indifferent between Barak and Netanyahu (butliking both better than Mordecai), it was virtually a toss-up over whom the voter wouldsupport. Nearly half of the respondents who were indifferent between all three candidatessupported Barak. These percentages are similar to the results in the American electionsmentioned above (see Abramson et al. 1999). Clearly there were substantial numbers ofvoters who preferred Mordecai, but voted Barak or even Netanyahu. These defectionsamong voters who preferred Mordecai were much more likely to occur than defectionsfrom either Barak or Netanyahu.
Table 1
Expected Vote Choice and Highest Preference for Prime Minister
Vote
Highest Preference
Barak Netanyahu Mordecai Total
Barak 97.6%(327)
1.2%(4)
1.2%(4)
43.5%(335)
Netanyahu 1.6%(4)
97.6%(239)
0.8%(2)
31.8%(245)
Mordecai 23.0%(23)
9.0%(9)
68.0%(68)
13.0%(100)
B-N Tie 56.3%(9)
43.8%(7)
0%(0)
2.1%(16)
N-M Tie 4.5%(1)
86.4%(19)
9.1%(2)
2.9%(22)
B-M Tie 65.0%(26)
7.5%(3)
2.8%(11)
5.2%(40)
All Tied 46.2%(6)
30.8%(4)
23.1%(3)
1.7%(13)
Total 51.4%(396)
37.0%(285)
11.7%(90)
100%(771)
Survey: Diskin (JewishRespondents)
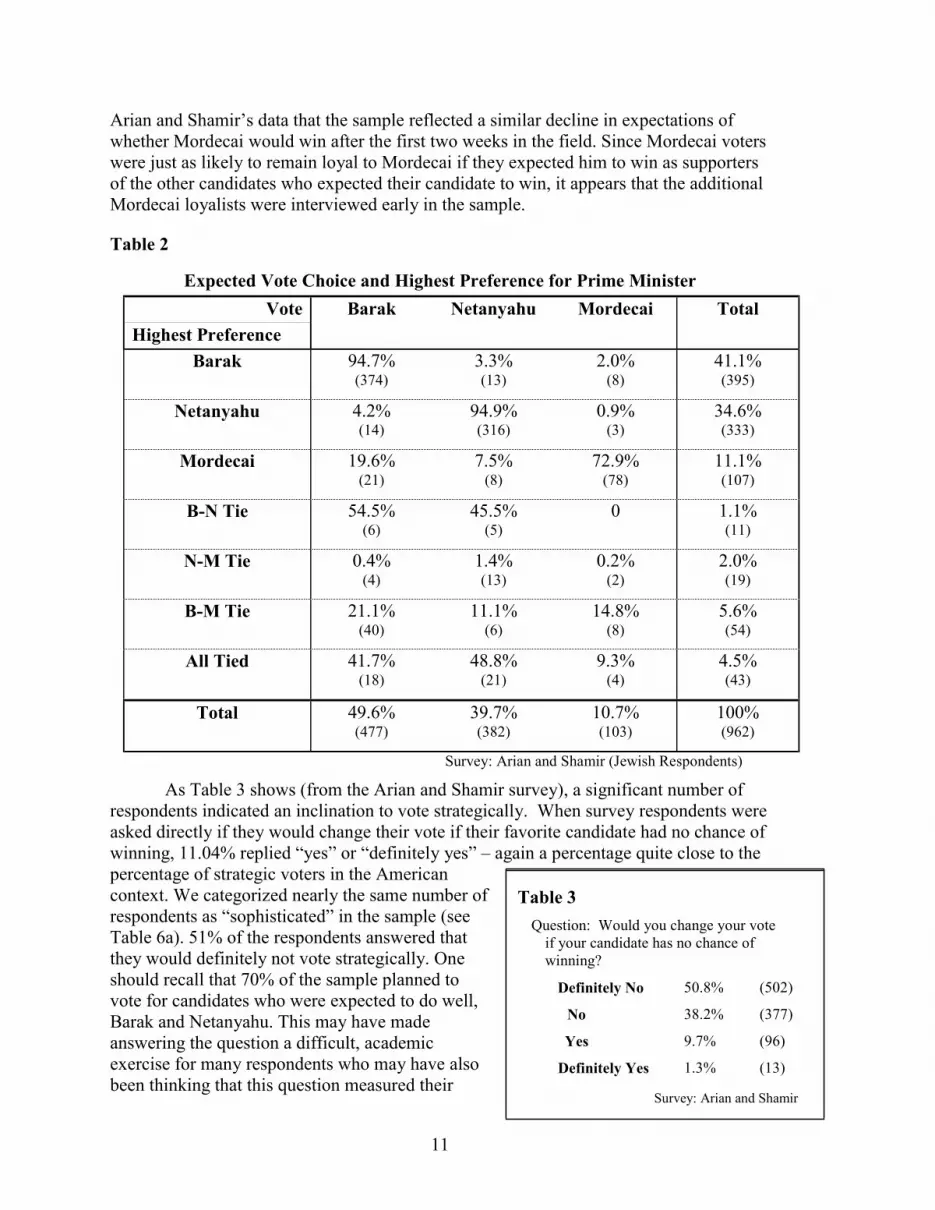
Table 2 reports the similar data from the Arian-Shamir survey. Those data show avery comparable pattern. The major exception is the greater reluctance to vote foranother candidate among those who preferred Mordecai the most. The difference is likelydue to the fact that this survey was conducted over a six-week stretch of the campaign.The polling data presented in Figure 1 clearly show how Mordecai’s support eroded overthe course of the campaign. Abramson, Aldrich and Diskin (2000) present evidence from
11
Arian and Shamir’s data that the sample reflected a similar decline in expectations ofwhether Mordecai would win after the first two weeks in the field. Since Mordecai voterswere just as likely to remain loyal to Mordecai if they expected him to win as supportersof the other candidates who expected their candidate to win, it appears that the additionalMordecai loyalists were interviewed early in the sample.
Table 2
Expected Vote Choice and Highest Preference for Prime Minister
Vote
Highest Preference
Barak Netanyahu Mordecai Total
Barak 94.7%(374)
3.3%(13)
2.0%(8)
41.1%(395)
Netanyahu 4.2%(14)
94.9%(316)
0.9%(3)
34.6%(333)
Mordecai 19.6%(21)
7.5%(8)
72.9%(78)
11.1%(107)
B-N Tie 54.5%(6)
45.5%(5)
0 1.1%(11)
N-M Tie 0.4%(4)
1.4%(13)
0.2%(2)
2.0%(19)
B-M Tie 21.1%(40)
11.1%(6)
14.8%(8)
5.6%(54)
All Tied 41.7%(18)
48.8%(21)
9.3%(4)
4.5%(43)
Total 49.6%(477)
39.7%(382)
10.7%(103)
100%(962)
Survey: Arian and Shamir (Jewish Respondents)
As Table 3 shows (from the Arian and Shamir survey), a significant number ofrespondents indicated an inclination to vote strategically. When survey respondents wereasked directly if they would change their vote if their favorite candidate had no chance ofwinning, 11.04% replied “yes” or “definitely yes” – again a percentage quite close to thepercentage of strategic voters in the Americancontext. We categorized nearly the same number ofrespondents as “sophisticated” in the sample (seeTable 6a). 51% of the respondents answered thatthey would definitely not vote strategically. Oneshould recall that 70% of the sample planned tovote for candidates who were expected to do well,Barak and Netanyahu. This may have madeanswering the question a difficult, academicexercise for many respondents who may have alsobeen thinking that this question measured their
Table 3Question: Would you change your vote
if your candidate has no chance ofwinning?
Definitely No 50.8% (502)
No 38.2% (377)
Yes 9.7% (96)
Definitely Yes 1.3% (13)
Survey: Arian and Shamir
Table 3
Question: Would you change your voteif your candidate has no chance ofwinning?
Definitely No 50.8% (502)
No 38.2% (377)
Yes 9.7% (96)
Definitely Yes 1.3% (13)
Survey: Arian and Shamir

12
willingness to support their candidate or parties’ traditional opponent.
Prime Minister: Viability Expectations
For strategic voting to take place, voters must evaluate not only candidatepreferences, but viability expectations as well. Low expected viability gives a strongimpetus for voters who prefer that candidate to defect strategically to their second choice.We measure viability in two ways. Diskin’s survey asked the survey respondents toestimate each candidates’ chances of winning.10 We then normalize their responses sothat the answers sum to 100%. Arian and Shamir asked who the respondent thoughtwould advance to the second round election. If the respondent expected a first roundwinner, then they were asked to specify who they thought it would be (see Table 4).Tables 4 and 5 show the expected election outcomes of the voters.
[Table 4 About here]
Most respondents expected that Barak and Netanyahu would advance to thesecond round. Few thought one or the other would win in the first round, consistent withthe information from the weekly polls that were published while the surveys were beingadministered. Nearly 80% of the respondents to the Arian and Shamir questionnaireexpected Netanyahu to reach the second round of the multi-candidate contest, and anadditional 5.5% predicted an outright first round victory in such a race. Similarly, 76.3%expected Barak to reach the second round and 6.3% expected an outright first roundvictory. 70.6% of the respondents expected Barak and Netanyahu to oppose each other ina run-off. Mordecai’s candidacy was perceived as substantially less viable and theexpectations were radically lower than for either Netanyahu or Barak. Less than 13% ofthe respondents expected him to even reach the second round, with a miniscule 1.7%predicting an outright first round victory.
Table 5
Expectations of Election Outcomes
Respondent’s Intended Vote for Prime Minister by the Candidate theRespondent Believes will Win the Election
VotePredicted
WinnerNetanyahu Barak Mordecai Total
Netanyahu 96.8%(362)
2.4%(9)
0.8%(3)
39.8%(374)
Barak 11.4%(53)
87.5%(405)
1.1%(5)
49.3%(463)
Mordecai 33.3%(34)
31.4%(32)
35.3%(36)
10.9%(102)
Total 47.8%(449)
47.5%(446)
4.7%(44)
100.0%(939)
10 Diskin’s survey actually asked two sets of questions about probable outcomes, about who would win theelection and who would advance to the second round.

13
Survey: Arian and Shamir
Table 5 presents the crosstab results for intended vote choice and the expectedwinner. Less than 5% expected Mordecai to be the winner, and, in fact, two-thirds ofthose who intended to vote for Mordecai expected him to lose. The expectations forNetanyahu and Barak were virtually a dead heat with 47.3% and 47.9% respectivelypredicting them as the winner. This perception of a tight electoral contest betweenNetanyahu and Barak coupled with low viability expectations for Mordecai likely fueledintentions to vote strategically among Mordecai supporters. These defections may wellhave led to a vicious cycle of poor polling results, leading even more of Mordecai’ssupporters to support another candidate, further decreasing his chances. While thepercentage of Barak voters (46.9%) largely mimicked victory expectations, Netanyahu’sreputation did better than the actual candidacy, as the victory expectations outpacedvoters (37.9%) by nearly ten percentage points. Most of those who thought Barak wouldwin the election voted for Barak. Almost everyone who expected to vote for Netanyahuexpected Netanyahu to triumph.
Distributions of Voting Types among the Entire Electorate and by Supporters ofEach Candidate
Table 6a
EntireElectorate
NetanyahuVoters Only
Barak VotersOnly
MordecaiVoters Only
Straightforward 76.0% (563) 86.9% (253) 75.8% (292) 27.7% (18)
Sincere 11.2% (83) 2.1% (6) 9.4% (36) 63.1% (41)
Sophisticated 9.5% (70) 8.5% (25) 10.9% (42) 4.6% (3)
Irrational 3.4% (25) 2.4% (7) 3.9% (15) 4.6% (3)
Survey: Arian and Shamir
Table 6b
EntireElectorate
NetanyahuVoters Only
Barak VotersOnly
MordecaiVoters Only
Straightforward 69.8% (518) 85.0% (237) 71.1% (270) 13.3% (11)
Sincere 22.2% (165) 4.7% (13) 21.8% (83) 83.1% (54)
Sophisticated 4.5% (33) 5.7% (16) 4.5% (17) 0% (0)
Irrational 3.5% (26) 4.7% (13) 2.6% (10) 3.6% (3)
Survey: Diskin
Putting together preferences and probabilities of winning, we get the ordinalbreakdown of voter types presented in Table 6a and Table 6b for the entire electorate aswell as for the supporters of each candidate. “Sincere” voters, for purposes of thisanalysis, are those who intended to vote for their most preferred candidate despitebelieving that the candidate did not have the highest chance of winning. “Sophisticated”or “strategic” voters are those who believed that their second-most preferred candidate

14
was more likely to win than their favorite, and they intended to vote for that second-bestalternative. “Straightforward” voters are those who believed their most preferredcandidate was the most likely to win (or had the best chance of beating their leastpreferred candidate) and intended to vote for their favorite. For these “straightforward”voters, their strategic choice is the same as their sincere choice so we cannot, therefore,discriminate between strategic and sincere voting strategies for these cases (Farquharson1969). We classify most voters in both surveys as straightforward, since they thoughtthat the candidate whom they were going to vote for was going to win.
Comparing the two surveys reveals some variation in the distribution of votertypes. The Arian and Shamir data shows that a slightly higher percentage of the votersare inclined to vote for the candidate they like the most and feel is going to win. MoreDiskin respondents are categorized as “sincere.” Many of the sincere respondents toDiskin survey are Barak voters. More than one in five of the Barak supporters in theDiskin survey are pessimistic about their candidate’s chances of winning the election,choosing to support Barak even though they felt that he was not going to prevail in theelection. More Barak and Mordecai supporters thought their candidate would win whenthey spoke to Arian and Shamir’s investigators. More Barak voters preferred anothercandidate, according to Arian and Shamir.
These differences can be attributed to the longer time that Arian and Shamir spentin the field, both before and after Diskin administered his survey. Earlier respondents (4+weeks before the election) in Arian and Shamir’s study who intended to vote forMordecai thought that Mordecai had the best chance of winning in what they saw asessentially a head-to-head Mordecai-Netanyahu race (45% expected him to win versus42% and 12% respectively for Netanyahu and Barak). However, later respondents whowere Mordecai supporters calculated that he now had the worst chance of winning,slightly behind Netanyahu but far behind Barak (27% expected him to win versus 31%and 42% respectively for Netanyahu and Barak, see Figure 4). Fewer and fewer of thosewho gave Mordecai the highest rating on the feeling thermometers intended to vote forhim. The last week Arian and Shamir were in the field (after Diskin completed his study),only 2 out of 35 respondents they interviewed gave Mordecai the highest rating on thefeeling thermometers and intended to vote for him.
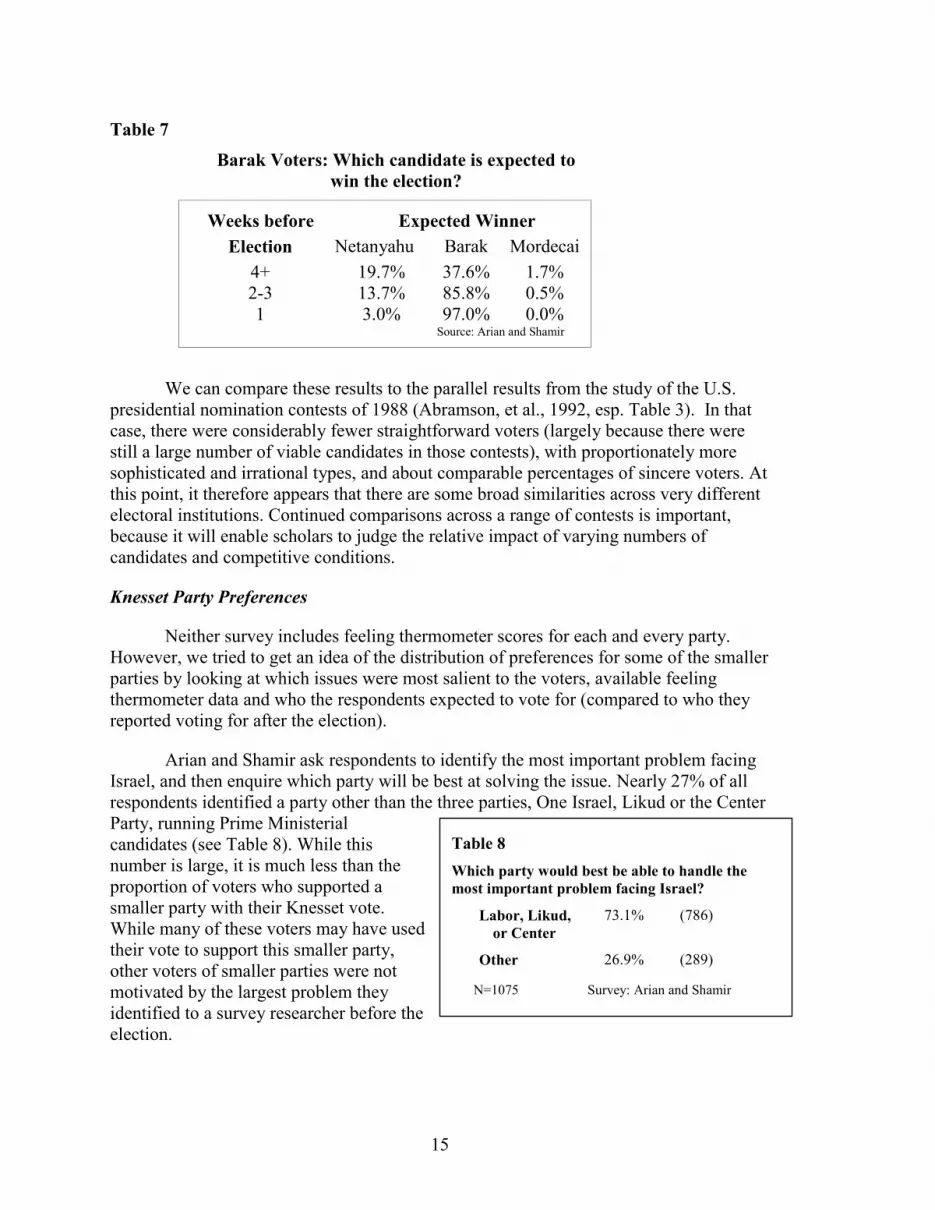
Meanwhile, earlier respondents who were Barak supporters thought that he had byfar the best chance of winning in what they saw as essentially a head-to-head Barak-Netanyahu race (79% expected him to win versus 20% and 2% respectively forNetanyahu and Barak). These lopsided expectations became significantly more lopsidedas later respondents who were Barak supporters not only wrote off Mordecai completely,but increased their expectation of a Barak win by 11 percentage points at Netanyahu'sdirect expense (90% expected Barak to win versus 10% and 0% respectively forNetanyahu and Mordecai, see Table 7). Only 3 out of the 101 respondents contacted thefinal week by Arian and Shamir who intended to vote for Barak thought Netanyahuwould win.
15
Table 7
Barak Voters: Which candidate is expected towin the election?
Weeks before Expected Winner
Election Netanyahu Barak Mordecai
4+ 19.7% 37.6% 1.7%2-3 13.7% 85.8% 0.5%1 3.0% 97.0% 0.0%
Source: Arian and Shamir
We can compare these results to the parallel results from the study of the U.S.presidential nomination contests of 1988 (Abramson, et al., 1992, esp. Table 3). In thatcase, there were considerably fewer straightforward voters (largely because there werestill a large number of viable candidates in those contests), with proportionately moresophisticated and irrational types, and about comparable percentages of sincere voters. Atthis point, it therefore appears that there are some broad similarities across very differentelectoral institutions. Continued comparisons across a range of contests is important,because it will enable scholars to judge the relative impact of varying numbers ofcandidates and competitive conditions.
Knesset Party Preferences
Neither survey includes feeling thermometer scores for each and every party.However, we tried to get an idea of the distribution of preferences for some of the smallerparties by looking at which issues were most salient to the voters, available feelingthermometer data and who the respondents expected to vote for (compared to who theyreported voting for after the election).
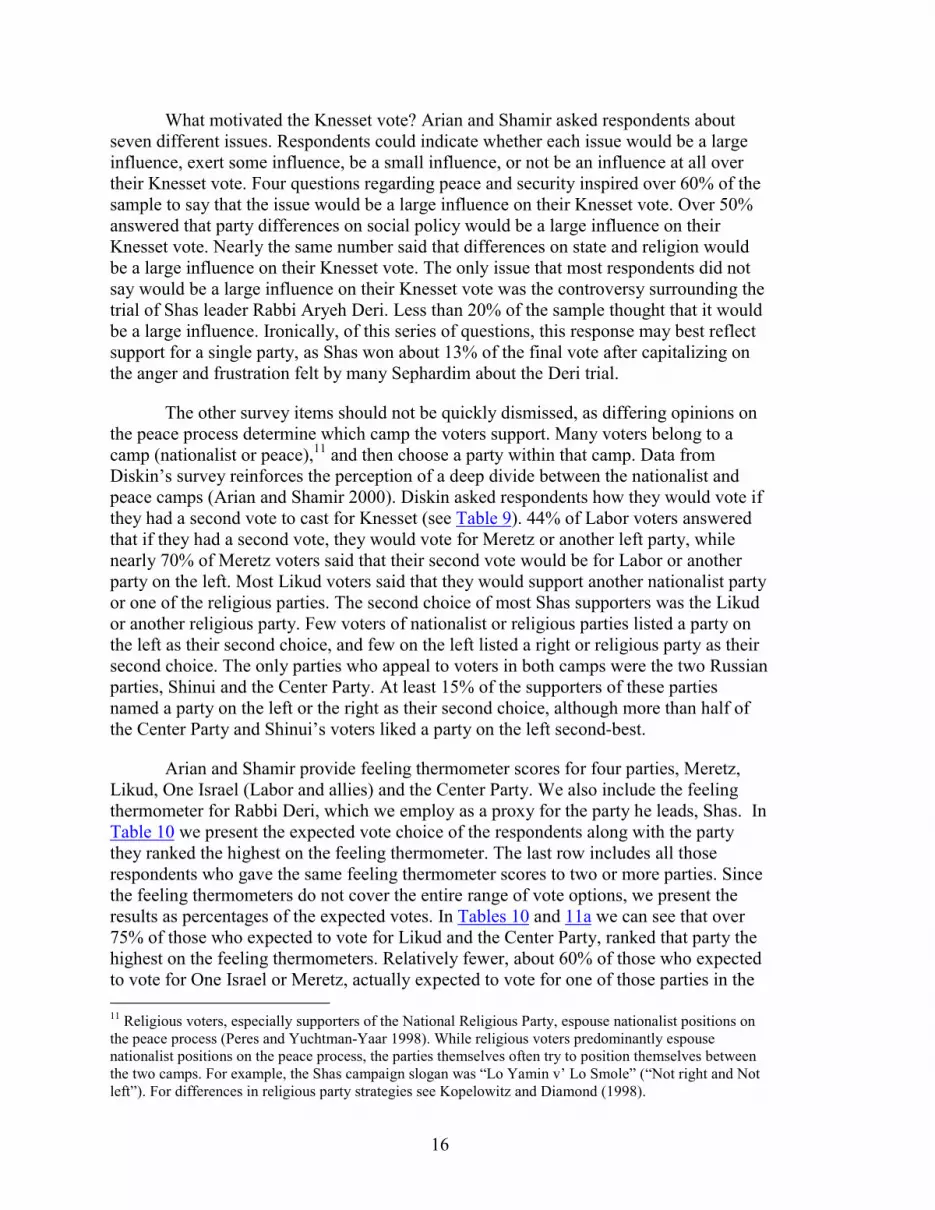
Arian and Shamir ask respondents to identify the most important problem facingIsrael, and then enquire which party will be best at solving the issue. Nearly 27% of allrespondents identified a party other than the three parties, One Israel, Likud or the CenterParty, running Prime Ministerialcandidates (see Table 8). While thisnumber is large, it is much less than theproportion of voters who supported asmaller party with their Knesset vote.While many of these voters may have usedtheir vote to support this smaller party,other voters of smaller parties were notmotivated by the largest problem theyidentified to a survey researcher before theelection.
Table 8
Which party would best be able to handle themost important problem facing Israel?
Labor, Likud,or Center
73.1% (786)
Other 26.9% (289)
N=1075 Survey: Arian and Shamir
16
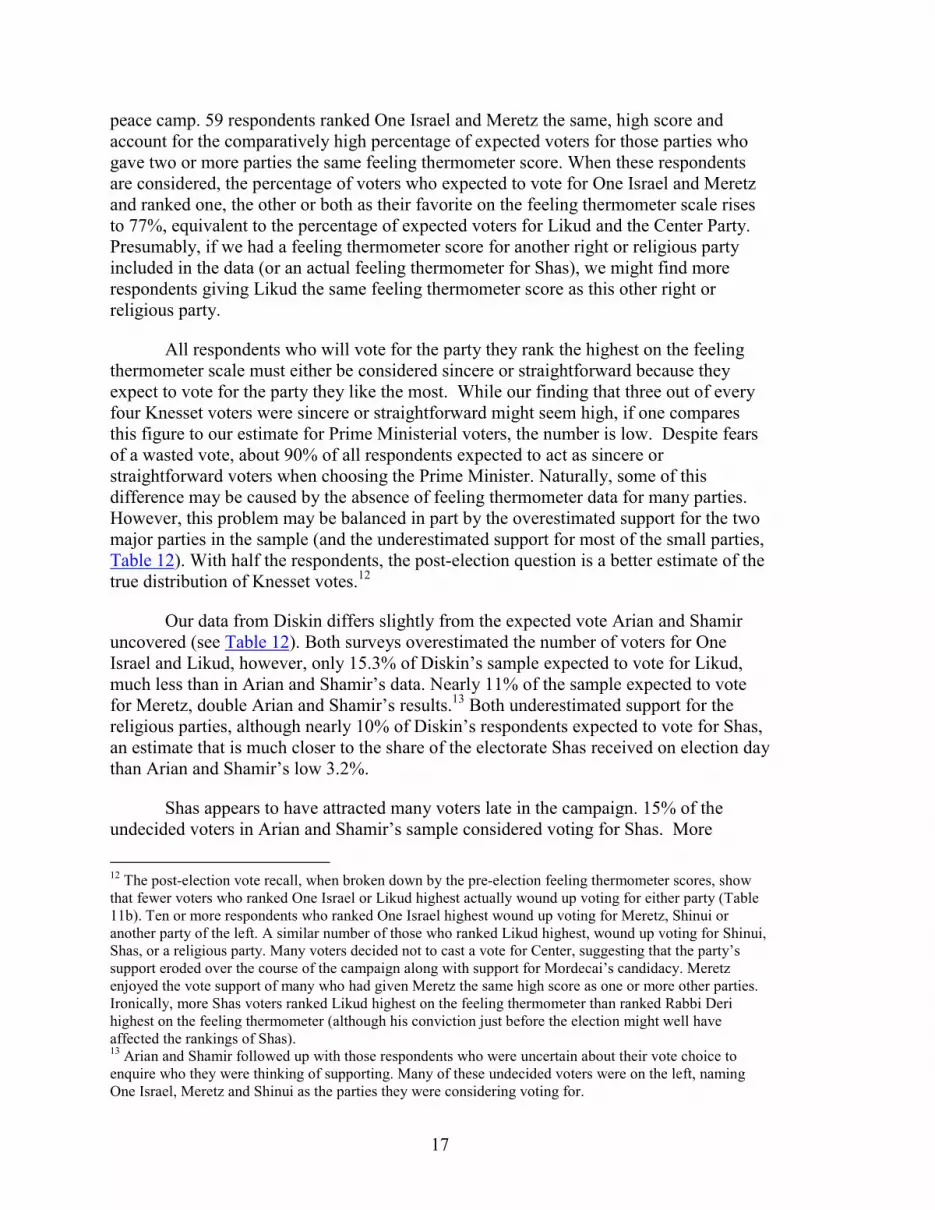
What motivated the Knesset vote? Arian and Shamir asked respondents aboutseven different issues. Respondents could indicate whether each issue would be a largeinfluence, exert some influence, be a small influence, or not be an influence at all overtheir Knesset vote. Four questions regarding peace and security inspired over 60% of thesample to say that the issue would be a large influence on their Knesset vote. Over 50%answered that party differences on social policy would be a large influence on theirKnesset vote. Nearly the same number said that differences on state and religion wouldbe a large influence on their Knesset vote. The only issue that most respondents did notsay would be a large influence on their Knesset vote was the controversy surrounding thetrial of Shas leader Rabbi Aryeh Deri. Less than 20% of the sample thought that it wouldbe a large influence. Ironically, of this series of questions, this response may best reflectsupport for a single party, as Shas won about 13% of the final vote after capitalizing onthe anger and frustration felt by many Sephardim about the Deri trial.
The other survey items should not be quickly dismissed, as differing opinions onthe peace process determine which camp the voters support. Many voters belong to acamp (nationalist or peace),11 and then choose a party within that camp. Data fromDiskin’s survey reinforces the perception of a deep divide between the nationalist andpeace camps (Arian and Shamir 2000). Diskin asked respondents how they would vote ifthey had a second vote to cast for Knesset (see Table 9). 44% of Labor voters answeredthat if they had a second vote, they would vote for Meretz or another left party, whilenearly 70% of Meretz voters said that their second vote would be for Labor or anotherparty on the left. Most Likud voters said that they would support another nationalist partyor one of the religious parties. The second choice of most Shas supporters was the Likudor another religious party. Few voters of nationalist or religious parties listed a party onthe left as their second choice, and few on the left listed a right or religious party as theirsecond choice. The only parties who appeal to voters in both camps were the two Russianparties, Shinui and the Center Party. At least 15% of the supporters of these partiesnamed a party on the left or the right as their second choice, although more than half ofthe Center Party and Shinui’s voters liked a party on the left second-best.
Arian and Shamir provide feeling thermometer scores for four parties, Meretz,Likud, One Israel (Labor and allies) and the Center Party. We also include the feelingthermometer for Rabbi Deri, which we employ as a proxy for the party he leads, Shas. InTable 10 we present the expected vote choice of the respondents along with the partythey ranked the highest on the feeling thermometer. The last row includes all thoserespondents who gave the same feeling thermometer scores to two or more parties. Sincethe feeling thermometers do not cover the entire range of vote options, we present theresults as percentages of the expected votes. In Tables 10 and 11a we can see that over75% of those who expected to vote for Likud and the Center Party, ranked that party thehighest on the feeling thermometers. Relatively fewer, about 60% of those who expectedto vote for One Israel or Meretz, actually expected to vote for one of those parties in the 11 Religious voters, especially supporters of the National Religious Party, espouse nationalist positions onthe peace process (Peres and Yuchtman-Yaar 1998). While religious voters predominantly espousenationalist positions on the peace process, the parties themselves often try to position themselves betweenthe two camps. For example, the Shas campaign slogan was “Lo Yamin v’ Lo Smole” (“Not right and Notleft”). For differences in religious party strategies see Kopelowitz and Diamond (1998).
17
peace camp. 59 respondents ranked One Israel and Meretz the same, high score andaccount for the comparatively high percentage of expected voters for those parties whogave two or more parties the same feeling thermometer score. When these respondentsare considered, the percentage of voters who expected to vote for One Israel and Meretzand ranked one, the other or both as their favorite on the feeling thermometer scale risesto 77%, equivalent to the percentage of expected voters for Likud and the Center Party.Presumably, if we had a feeling thermometer score for another right or religious partyincluded in the data (or an actual feeling thermometer for Shas), we might find morerespondents giving Likud the same feeling thermometer score as this other right orreligious party.
All respondents who will vote for the party they rank the highest on the feelingthermometer scale must either be considered sincere or straightforward because theyexpect to vote for the party they like the most. While our finding that three out of everyfour Knesset voters were sincere or straightforward might seem high, if one comparesthis figure to our estimate for Prime Ministerial voters, the number is low. Despite fearsof a wasted vote, about 90% of all respondents expected to act as sincere orstraightforward voters when choosing the Prime Minister. Naturally, some of thisdifference may be caused by the absence of feeling thermometer data for many parties.However, this problem may be balanced in part by the overestimated support for the twomajor parties in the sample (and the underestimated support for most of the small parties,Table 12). With half the respondents, the post-election question is a better estimate of thetrue distribution of Knesset votes.12
Our data from Diskin differs slightly from the expected vote Arian and Shamiruncovered (see Table 12). Both surveys overestimated the number of voters for OneIsrael and Likud, however, only 15.3% of Diskin’s sample expected to vote for Likud,much less than in Arian and Shamir’s data. Nearly 11% of the sample expected to votefor Meretz, double Arian and Shamir’s results.13 Both underestimated support for thereligious parties, although nearly 10% of Diskin’s respondents expected to vote for Shas,an estimate that is much closer to the share of the electorate Shas received on election daythan Arian and Shamir’s low 3.2%.
Shas appears to have attracted many voters late in the campaign. 15% of theundecided voters in Arian and Shamir’s sample considered voting for Shas. More
12 The post-election vote recall, when broken down by the pre-election feeling thermometer scores, showthat fewer voters who ranked One Israel or Likud highest actually wound up voting for either party (Table11b). Ten or more respondents who ranked One Israel highest wound up voting for Meretz, Shinui oranother party of the left. A similar number of those who ranked Likud highest, wound up voting for Shinui,Shas, or a religious party. Many voters decided not to cast a vote for Center, suggesting that the party’ssupport eroded over the course of the campaign along with support for Mordecai’s candidacy. Meretzenjoyed the vote support of many who had given Meretz the same high score as one or more other parties.Ironically, more Shas voters ranked Likud highest on the feeling thermometer than ranked Rabbi Derihighest on the feeling thermometer (although his conviction just before the election might well haveaffected the rankings of Shas).13 Arian and Shamir followed up with those respondents who were uncertain about their vote choice toenquire who they were thinking of supporting. Many of these undecided voters were on the left, namingOne Israel, Meretz and Shinui as the parties they were considering voting for.

18
respondents to Arian and Shamir recalled voting for Shas after the election than intendedto vote for Shas prior to the election even though the pre-election sample size was nearlythree times the size. Table 11b breaks down how voters for the five parties ranked theparty on the feeling thermometer scale. 63.6% of Shas voters ranked Shas (Deri) lowerthan one or more of the other four parties. Only 11.4% ranked Shas (Deri) highest on thefeeling thermometers. Less than 30% of Meretz voters preferred one of the major partiesto Meretz, although nearly half gave Meretz the same rating as another party. Theseresults suggest that, contrary to the hypothesis that split ticket voters sincerely preferred asmaller party, many Shas and Meretz voters did not prefer that party to one of the majorparties (even though a majority of each party’s supporters in the pre-election sampleranked each party highest or tied for highest on the feeling thermometers).
Knesset Party “Viability”
It is absurd to ask about a party’s chance of winning when the spoils of victory arenot determined in a winner-take-all fashion. This does not imply that expectations of aparty’s success is irrelevant to the calculations of a rational voter. Instead of winning, thevoter might be expected to consider the allocation of power in parliament and cabinet.The most powerful parties are a necessary part of any minimal winning or minimalconnected winning coalition. So, power comes from an interaction between a party’sideological location and its size (Strom, Budge and Laver 1994). Power in Israeligovernments can also stem directly from the party’s size alone, as cabinet portfolios tendto be distributed proportionately to the size of the party. Size can affect the amount ofbargaining leverage the party might enjoy in coalition negotiations. As discussed above,sufficient size of one party may make it such a necessary component of a coalition that aparty whose interests it opposes (such as the religious parties and the secular Shinui) canbe effectively frozen out of the policy process.
Over 70% of the respondents to Diskin’s survey expected One Israel to be thelargest party in the Knesset. This is important because it means that most of the samplewas deciding which party to support on the assumption that Labor would have the mostseats. Another 23% thought that the Likud would receive the most Knesset votes, sohardly anyone expected another party to be the largest party. In Table 13 we presentexpectations of which party was going to get the largest number of seats and the range ofseats they were expected to get. Regardless of which party the respondent thought wasgoing to have the largest delegation in the Knesset, expectations of the number of seatswon by the largest party averaged 32 seats. In Table 14 we present the mean expectationsof how many seats the party the respondent supports is going to get. Only two parties,Shas and Shinui, won more mandates than their voters, on average, expected them to win.Most respondents overestimate the success of the largest parties, as well as overestimatethe popularity of their own party. This is consistent with much of the literature inpsychology about expectations of events (Fox 1999).
We expect that a strong showing by the major parties, and especially Labor,would be a disincentive to cast a vote for the other major parties. Instead, voters decideto cast a vote in favor of smaller parties to influence a coalition including the largestparty. As discussed earlier, the marginal value to a voter of an additional seat for a small

19
party may be higher than the marginal value of an additional seat for a major party sincethat additional seat may greatly increase the small parties’ bargaining power vis-a-vis themajor coalition partner(s). Often, the third largest party in the Knesset is in the strongestnegotiating position with the party of the Prime Minister. The value of an additional seatfor the largest party remains high since that additional seat may provide leverage incoalition negotiations with the smaller parties. The larger the party, the greater theleverage they will have relative to both the large and the small parties both in narrow andin broad coalitions or cabinets. Therefore, it is rational (and similar to, but nottheoretically identical to, straightforwardness) for supporters of the largest party toremain committed to voting for that party. So, we exclude all those respondents whothought their party was going to be the largest in the Knesset (77% of whom are OneIsrael supporters) to focus on how expectations of the largest party size influencessupporters of other parties.14
To test whether the size of the largest party is a disincentive to vote for anothermajor party, we perform a probit analysis using Diskin’s data. The dependent variable isone when the respondents expresses a plan to vote for one of the three major parties, OneIsrael, Likud or the Center Party. We concentrate on two independent variables, thenumber of seats the largest party is expected to have and the expected number of seats forthe party the respondent intends to cast a vote. Our primary expectation is that theexpected size of the largest party, which runs as high as sixty seats, should decrease thechance of voting for a major party since the size of the largest party should decrease thelikelihood of voting for another major party. Secondly, since larger parties are bydefinition those that win more seats than small parties, the number of seats the respondentexpects their favorite party to win should be positively related to voting for a major party.As controls we use seven dummy variables, six of which we expect would encouragevoting for a minor party. These controls include three demographic variables: whetherthe respondent is very religious (or ultra-orthodox, “Haredi”), whether the respondent is aRussian immigrant, and whether the respondent is in a poor financial situation. The ultra-orthodox and the Russian immigrants are served by small parties that represent theirspecial interests in the Knesset. We also include a dummy as to whether the respondentplaced themselves on either extreme on issues regarding security and foreign affairs,leading us to predict that they might support one of the smaller parties at the ideologicalextremes. Two other variables are taken from a question about what is the main reasonwhy a respondent would support a party. Five answers were given to the respondent. Themodal response was support for positions on foreign affairs and defense. Those whoanswered that non-security issues are the main reason why they support a political party,and those who answered that the main reason the party represents “people like me”, wereincluded as separate dummy variables. We expect that both variables will decrease thelikelihood of voting for a major party because the main divide between the major partiesis over security issues, while minor parties like Shinui, Shas and the Russian partiesemphasize non-security issues, especially for particular constituency groups (Shamir andArian 1999). We also include a dummy for whether the respondent remembers casting avote for one of the two largest parties in the previous election (Labor and Likud in 1996),which we expect would dispose the respondent to vote for one of the major parties.
14 We also performed the analysis on all voters, and the results were substantively similar.

20
Our analysis confirms that the expected size of the largest party decreases thelikelihood that the voter intends to cast a vote for a major party (see Table 15). Voting inthe previous election for a major party and the number of seats that the respondents’ partywas expected to win significantly influenced voting for a major party. The additionalvariables, as expected, either decreased the likelihood of intending to cast a vote for amajor party or were statistically insignificant.
Using first differences, we investigated how changing the voter’s expectations ofthe size of the largest party in the Knesset would influence their likelihood of voting forone of the three major parties. Holding all controls constant at their modal response(zero), we observe that the likelihood of voting for a major party increases when theexpected size of the largest party decreases. Table 15 illustrates that a respondent wouldbe expected to cast a Knesset vote for one of the three major parties only when the voterexpects the largest party to win about twenty five mandates and their party to win slightlyfewer seats. This is not surprising since a situation in which the two largest parties haveabout the same number of seats would describe a fragmented parliament with a highchance of a national unity government.
If a respondent believes that the largest party in the newly elected Knesset willwin more than 32 mandates (the mean prediction), that respondent is not likely to supportone of the major parties. When the respondent is supporting a party that they do notexpect to win many seats or when the citizen expects the largest party in the Knesset tohold fewer than twenty-five seats, they are predicted to support a minor party.
When varying the value of each of the attitudinal and demographic controlvariables, we find that the voter is likely to support a minor party regardless of therespondent’s expectations of the number of mandates the largest party is likely to receive.The probability that a respondent will support a major party increases sharply if therespondents voted for a major party in 1996. If the respondent supported a major party in1996, our results show that individual voters are likely to support a major party with morethan 13 Knesset seats unless they have wildly high expectations of the size of the largestparty (a party with 40 or more mandates).
In conclusion, the relative “viability” of Knesset parties impacts voterconsiderations. A respondent is most likely to consider voting for another major partywhen the respondent believes the largest party in the Knesset will only gainapproximately twenty-five mandates and they predict their most favored party to gainbetween ten and fifteen number of seats. This is an interesting finding considering thatthe largest party captured only 26 mandates. The remaining voters of the major partieseither have a history of voting for major parties or believe that the major party theysupport would also gain the most mandates in the Knesset. However, the expected sizeof the largest party appears to have little influence over those who we expect to supportsmall parties on the basis of demographic or attitudinal characteristics. We found noevidence to suggest that even when a fragmented Knesset is likely that these respondentshesitate to support a small party.

21
Prime Minister Vote Model
Using the preferences and the expected viability of the Prime Ministerialcandidates, we estimate a model of voting for Prime Minister based on the multicandidatecalculate of voting. The multi-candidate calculus of voting presumes that voters will bemaking their decisions on the basis of maximizing expected utility. In our case expectedutility is arrived at by multiplying utility, as measured by feeling thermometer scores forthe candidates, by “folded” probabilities expressing the viability of the candidates withreference to the victory point. We otherwise replicate analyses in Abramson, Aldrich, etal. (1992), by testing two statistical models based on the calculus of voting using thefolded probability of winning terms.
The dependent variable in the following models is dichotomous. If the respondentplanned to vote for their most preferred candidate as measured by the feelingthermometer scores the variable is scored a one. Otherwise, the variable is given a valueof zero. The independent variables are comparisons of viability expectations. The surveyasked respondents to estimate the chance of the candidate winning. These responses werenormalized so that the percentages summed to 100%. The data was then folded at thevictory point, 50%. So, the maximum value is 0.5, with a candidate with no chance ofwinning and a candidate with a 100% chance of winning being assigned a value of zero.By folding the scale at the victory point, high values reflect how close the candidate is towinning an election by a single vote. Rational choice models of the vote argue that thehigher the probabilities of a single vote deciding an election, the greater the chance ofthat vote being cast (Riker and Ordeshook 1968; McKelvey and Ordeshook, 1972).
We first computed how the competitiveness of the first- and the second- rankedcandidates predicted voting for the favorite candidate. We expected that the closer theprobability of the first- ranked candidate winning was to 0.5, the more likely therespondent would cast her vote for the preferred candidate. However, if the likelihoodthat the second-ranked candidate would win approached 0.5, the less likely therespondent would remain loyal to their favorite candidate. The results of the model arepresented in Table 16, confirming our expectations. Both coefficients are large,statistically significant, and signed in the expected direction. We observe a particularlylarge likelihood to vote for the favorite candidate the closer the probability of himwinning was to 50%.
The table of first differences is particularly illustrative. This table presents theestimated probability of planning on voting for the favorite candidate at different levelsof the “folded” probability of the candidate winning. We present the effect of the foldedprobability of the favorite candidate winning at three levels, the minimum (zero), one-third, and the maximum (0.5). We present the effect of the folded probability of thesecond-favorite candidate winning at four levels, the minimum (zero), the mean (0.196),one-third, and the maximum value (0.5). The mean of the folded probability of thefavorite candidate winning is not presented because it is so close to one-third (0.342).One-third is included for illustration because that value includes those candidates who areexpected to earn 33% of the vote and a guaranteed spot in a run-off (or a plurality in aneven, three-way race).

22
Expectations that the favorite candidate is in a competitive race have a dramaticeffect on how the respondents planned to vote. As the probability of winning approaches0.5, the likelihood of voting for the favorite candidate soars to no less than 78% or evento 92.7%, depending on the probability of the second-candidate winning. In contrast,when the favorite candidate has surely won or lost, the likelihood of intending to vote forthe favorite candidate is small (15.6 to 37%). Most of the increase in the probability ofplanning to vote for the favorite candidate occurs between the minimum value and one-third. For example, when the folded probability of the second-favorite candidate winningis held at the mean value, the likelihood that the respondent will vote for the favoritecandidate rises from 27.4% to 72.3%, an increase of 45 percentage points. Between one-third and the maximum value, the likelihood of intending to vote for the favorite risesnearly 16 percentage points to 88.2%. These results suggest that the probability of votingfor the favorite candidate is sensitive to a broad notion of competitiveness rather than just50%. As the probability of the favorite candidate winning approaches this range of valuesaround fifty, the likelihood of voting for the favorite candidate becomes very high.
Interestingly, when moving from the minimum value to the maximum value ofthe folded probability of the second- ranked- candidate winning, the probability ofintending to vote for the favorite candidate goes down a nearly uniform 20 percentagepoints at every level of the favorite candidate’s folded probability of winning the election.However, unless the favorite candidate’s folded probability of winning the election is low(less than 0.28), voters are still predicted to vote for their favorite candidate.
To replicate the analysis in Abramson, et al. 1992, we first measured the effect ofdifferences in “folded” viability on the decision to vote for the favorite candidate. InTable 17, P12 refers to the difference in folded viability between the first- and second-ranked candidates as determined by creating an ordinal ranking based on feelingthermometer scores. P13 is the difference in folded viability between the first- and third-ranked candidates. High values (maximum 0.5) for these independent variables suggestthat the favorite candidate's probability of winning is much closer to 50% than thesecond- (or third- ) highest-ranked candidate. Values approaching zero reflect narrowdifferences in distance from 50% chance of winning. Negative values mean that thepreferred candidate is less likely to be in a close race than the second favorite.Theoretically, if the respondent believes that all three candidates are equally likely towin, the value of both independent variables is zero. Of the three possible pairedcomparisons only P12 and P13, both of which should have positive parameters, arepresented, since by definition P23=P13-P12 (and so ought have a negative parameter).
The probit estimation of this model appears in Table 17. The overall fit of themodel is strong. Both of the coefficient estimates are statistically significant and correctlysigned. The impact of P12 is particularly large, suggesting that the competitiveness of thepreferred candidate relative to the competitiveness of the second candidate is animportant determinant of votes cast for the preferred candidate.
This effect can be understood by considering the table of first differences atmaximum and minimum values. We present here the calculated effects of moving thevalue of each independent variable from zero to its minimum and maximum values. One

23
can clearly observe how the probability of voting for a favorite candidate rises the higherthe value of each independent variable. Although the entire 3 x 3 table can be statisticallyestimated, only those cases highlighted in bold are arithmetically possible. For example,if P12 is at the maximum value of 0.5, suggesting that favorite candidates have a 50%chance of winning while the second-highest-ranked candidates’ chances are hopeless, thethird candidate cannot also have a folded probability of zero. But, in this situation, P13
could be at its maximum possible value only if the third candidate had no chance ofwinning. If this were the case, the normalized probabilities would not sum to one. Sincethe favorite candidate cannot have a 50% chance of winning against two hopelesscandidates, both independent variables cannot both be at the maximum value.
Calculating these differences allows us to estimate that when all the candidateshave an equal shot at winning, this model predicts that the voter will vote for her favoritecandidate 60.4% of the time. If her favorite candidate has no chance while the other twocandidates are locked in a close race, there is only a 10.9% chance that she will vote forher favorite. Conversely, when the second-favorite candidate has no chance of winning,but the favorite and the least-preferred candidate are in a tight race (a realistic scenariofor this election), there is a 90.8% chance that the voter will vote for her favorite. As thevalue of P13 increases, as the least preferred candidate moves further away from the fiftypercent mark as compared to the favorite candidate, the chances that the respondent willvote for the most favored candidate increases. In contrast, as the least preferred candidatemoves closer to the fifty- percent mark as compared to the most preferred candidate, thechances that the respondent will vote for the most favored candidate decrease. Theseresults confirm our hypothesis that the respondent’s estimates as to the chances of hermost preferred candidate’s chances of winning relative to her second-favorite candidatewill influence the decision as to whether the respondent will defect to a lesser preferredbut more viable candidate. In short, these are the patterns that would result if voters do,indeed, reason via expected utility maximization.
[Table 18 about here]
Table 18 presents the result of a probit model designed to document more directlythe role of expected utility, by formally including utility and probability terms inexpectational form. The estimates reported in Table 18 include the same dependentvariable as above with three newly created independent variables, PB12, PB13, and PB23.Each of the new independent variables is the difference in normalized folded probabilityof winning multiplied by the difference in expected utility as measured by normalizedthermometer scores. So, PBjk = ([folded] Pj – [folded] Pk)(Uj-Uk). Therefore, for example,PB12 is the difference between the most- preferred and second- preferred candidate’sprobability of winning folded at the victory point (50%) multiplied by the differencebetween the candidates’ thermometer scores. Since the normalized thermometer scorefor the favorite candidate is equal to one, the difference between the two thermometerscores is always positive. Thus, the sign of P12 is the same as the direction for PB12, andthe sign of P13 is the same as PB13. So, we expect the coefficient estimates for PB12 andPB13 to be positive. As the gap between the thermometer scores between two candidatesincreases, the smaller the reduction in magnitude of the PB12 and PB13 compared to theindependent variables in the previous model measuring only competitiveness. A larger
24
value for PB12 or PB13 reflects a larger relative utility for the favorite candidate, makingsupport for the favorite candidate more likely. Conversely, we expect that the parameterestimate for PB23 to be negative because the more the respondent likes the secondfavorite candidate relative to the least favorite candidate, the more likely he will intend tovote for the second-favorite candidate. Note that (unlike the previous model) PB23 is notequal to the difference in the other two variables.
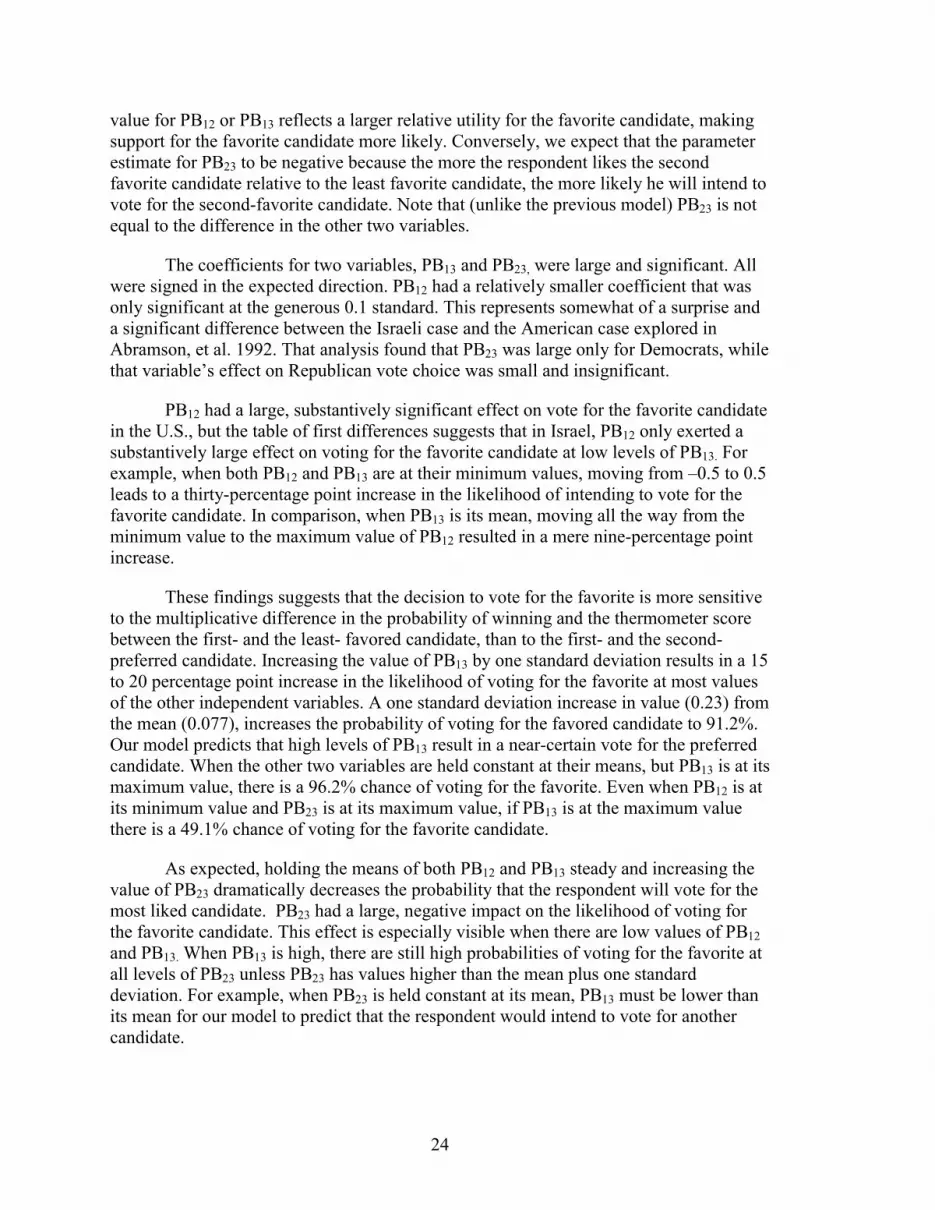
The coefficients for two variables, PB13 and PB23, were large and significant. Allwere signed in the expected direction. PB12 had a relatively smaller coefficient that wasonly significant at the generous 0.1 standard. This represents somewhat of a surprise anda significant difference between the Israeli case and the American case explored inAbramson, et al. 1992. That analysis found that PB23 was large only for Democrats, whilethat variable’s effect on Republican vote choice was small and insignificant.
PB12 had a large, substantively significant effect on vote for the favorite candidatein the U.S., but the table of first differences suggests that in Israel, PB12 only exerted asubstantively large effect on voting for the favorite candidate at low levels of PB13. Forexample, when both PB12 and PB13 are at their minimum values, moving from –0.5 to 0.5leads to a thirty-percentage point increase in the likelihood of intending to vote for thefavorite candidate. In comparison, when PB13 is its mean, moving all the way from theminimum value to the maximum value of PB12 resulted in a mere nine-percentage pointincrease.
These findings suggests that the decision to vote for the favorite is more sensitiveto the multiplicative difference in the probability of winning and the thermometer scorebetween the first- and the least- favored candidate, than to the first- and the second-preferred candidate. Increasing the value of PB13 by one standard deviation results in a 15to 20 percentage point increase in the likelihood of voting for the favorite at most valuesof the other independent variables. A one standard deviation increase in value (0.23) fromthe mean (0.077), increases the probability of voting for the favored candidate to 91.2%.Our model predicts that high levels of PB13 result in a near-certain vote for the preferredcandidate. When the other two variables are held constant at their means, but PB13 is at itsmaximum value, there is a 96.2% chance of voting for the favorite. Even when PB12 is atits minimum value and PB23 is at its maximum value, if PB13 is at the maximum valuethere is a 49.1% chance of voting for the favorite candidate.
As expected, holding the means of both PB12 and PB13 steady and increasing thevalue of PB23 dramatically decreases the probability that the respondent will vote for themost liked candidate. PB23 had a large, negative impact on the likelihood of voting forthe favorite candidate. This effect is especially visible when there are low values of PB12
and PB13. When PB13 is high, there are still high probabilities of voting for the favorite atall levels of PB23 unless PB23 has values higher than the mean plus one standarddeviation. For example, when PB23 is held constant at its mean, PB13 must be lower thanits mean for our model to predict that the respondent would intend to vote for anothercandidate.

25
Implications of Prime Minister Vote Models
Our main finding is that strategic voting does occur in runoff elections, nearlyduplicating the results found in the American cases. This result is something of asurprise, given Duverger’s account (1963). There, he argued that plurality voting wouldlead to two-party systems due to both psychological and “mechanical” effects. Theseeffects would not be found in run-off systems lacking, inter alia, the psychological factorstudied here as the strategic vote. Contrary, to Cox’s (1997) expectations, we find thatstrategic considerations were not uncommon in a run-off election. In a polity with highlevels of information about the candidate’s chances of victory, voters demonstrated apropensity to support a candidate in a close contest despite the expectation of a second-ballot.
Our use of folded probability scores is an important methodological refinement.Previous research demonstrated that strategic votes are cast for the candidate with thebest chance of winning, but here we present a model that shows that voters are moreinclined to vote strategically in support a candidate who is in a very competitive race.This is consistent with rational choice models of voting behavior that argue that votersare motivated, in part, by the probability of their vote making a difference in the outcomeof the election. Here we show that voters are much more likely to vote for their preferredcandidate if that candidate is more likely to be in a close race than their second candidate.However, when using a multiplicative variable, combining expectations of victory withutility, the difference between the first- and least- favorite candidate exerts the largestinfluence on voting for the favored candidate.
Israeli voters, when faced with a multi-candidate electoral contest for PrimeMinister, responded overwhelmingly as rational voters, considering the viability of thecandidates in addition to their sincere preferences for each candidate. When anothercandidate appeared to be in close competition with their least favorite candidate, theyvoted for this other candidate. So, now we examine whether they behave similarly fortheir Knesset vote choices.
Knesset Vote Model
Most previous research argues that Israeli voters are primarily driven byideological motivations predicted by a voter’s education, religiosity and theSephardi/Ashkenazi divide (see Shalev with Kis 2000, Shamir and Arian 1999). Arianfinds that as religiosity increases, education decreases and whether the voter (or thevoter’s father) was born in Asia or Africa determines whether they are apt to supportLikud, another party on the right, or a religious party (Arian 1998). Arian (1998) foundthat since the outbreak of the Intifadah in 1987, these voters support these partiesprimarily because of their positions on peace, security and state/religion issues.
In 1996, during the first election under the hybrid system, Arian (1998, pp. 225-226) found that almost everyone who expected to cast a vote for Likud or Labor said theywould have behaved in the same way if the old rules were still in effect. However, one-

26
third of Meretz supporters said they would have voted for Labor and 12 percent of thevoters for religious parties reported that they would have voted for Likud.
This does not go very far towards explaining why increasing numbers of votersleft the major parties in 1999. Using the feeling thermometer data available for fourparties plus Rabbi Aryeh Deri, the leader of Shas, we calculate an ordinal ranking ofparties. We then examine whether or not voters intend to cast a vote for their favoriteparty. We created the dependent variable by transforming the pre-election Knessetvoting intention survey item so that those respondents who voted for the party thatreceived the highest score on the feeling thermometer received a one, and all others weregiven a zero. The independent variables are comparisons of viability expectations. Sinceit is inappropriate in a system of proportional representation to ask for chances of a partywinning the election, we performed analyses using the published share of the vote foreach of the parties at the time of the interview. We used polls administered by Israelipollster Mina Tzemach and published in the popular Israeli daily Yediot Ahranot. Thecombination of a politically attentive electorate and high readership of the newspapergives us a reasonable expectation that these published results would be read- and believedby most voters.15
In Table 19, P12 refers to the difference in percent of vote between the first- andsecond- ranked parties, with preference ranking determined by creating an ordinalranking based on feeling thermometer scores. P13 is the difference between the first- andthird- ranked parties. High values for these independent variables suggest that the favoriteparty’s share of the vote is much higher than the second- (or third- ) highest-rankedcandidate. Although we could compare all five parties, few would consider voting for anyof the five parties and we do not expect the success of the lowest-ranked parties to havemuch of a bearing on the vote decision. The data closely conforms to our expectations ofhow voters might rank order the parties, with One Israel supporters liking Meretz orCenter second best, Likud voters like Shas or Center, and Center was the modal third-favorite party of every single set of party supporters. None of the models we tested usingall five parties challenged this expectation,16 so we present only P12 and P13. Recall thatby definition P23=P13-P12.
Unlike the results for the election for Prime Minister, the P12 has a negativecoefficient. The size of the favorite party’s vote relative to the size of the second favoriteparty reduces the likelihood of the respondent’s consideration of voting for the favoriteparty. In contrast, the size of the favorite party’s vote relative to the size of the thirdfavorite party significantly increases the likelihood of the respondent considering a votefor the favorite party. When the model uses normalized percentages of the vote, theresults are similar, except that the effect of P12 is not statististically significant. This isvirtually the opposite of our findings when we examine voting intentions for PrimeMinister, but we cannot ascertain whether this change is the result of the share of the vote 15 We also performed the analysis using actual vote results with similar results. The effect of p12 was notstatistically significant and the effect of p13 was larger. Because the actual results contained surprises,notably the success of Shas, and because of the decline in support for the Center Party during the campaign,it is more accurate to use the poll results.16 In some models, P15 predicts a significant decrease in the probability of voting for the favorite party.

27
being correlated with a measure of preference or whether the expected utility model doesnot describe parliamentary voting.
Unified models of voting
To what extent does a voter’s considerations and behavior in one vote affect his orher behavior when casting the second vote towards the composition of a government? Inprevious sections, we investigate the extent to which preferences for each of thecandidates or parties and expectations of the outcome affects voter considerations for theKnesset and the Prime Minister’s election separately. Now we examine the two together.Were people who acted in a sophisticated manner when voting for Prime Minister morelikely than others to be sophisticated when considering whom to support in the Knesset?We expect that a voter’s prediction of the outcome of the election for Prime Minister willinfluence how they vote for the Knesset. Some parties will be more influential under onePrime Minister than they will be under his opponent. Parties to the left of Labor wouldexpect to have more influence if Barak was Prime Minister than if another of thecandidates won. Likewise, parties to the right of Likud (and Likud itself) would havemore influence if Netanyahu became Prime Minister. Parties, in the middle, though,would be desirable regardless who the expected winner was- or if the outcome of the racewas in doubt.
It is plausible to think that the ability to think strategically when considering avote in two polls would be only possible if the voter is unusually knowledgeable aboutpolitics. Are those who are sophisticated for to take into account strategic considerationswhen deciding whom they will support for Prime Minister also more likely to besophisticated when considering their Knesset vote? If true, we would expect sophisticatedand sincere voters to be likely to support small (unranked) parties, reflecting a high levelof knowledge about these smaller parties and/or the outcome of the election.Sophisticated voters should be more likely to vote for a party other than the one like best,while sincere voters should be unlikely to support another ranked party. Table 20 presentshow the categories of voters for Prime Minister intended to vote for Knesset. We foundconsistency in behavior across both votes. 16% of sophisticated voters for Prime Ministerintended to vote for a Knesset party they did not rank the highest. Sincere andsophisticated voters were the most likely to intend to vote for a small party. Those whointended to cast a sincere vote for Prime Minister were the least likely to vote for a“ranked” party other than the one they liked best. However, the most striking finding onthis table is that irrational voters for Prime Minister demonstrate a proclivity for votingcontrary to their reported levels of affect. 59% irrational voters intended to vote for aKnesset party other than the one they ranked the highest.
Second, we looked to see how supporters of each candidate for Prime Ministerintended to vote. Were supporters of one candidate more likely to support smallerparties? Table 21a shows how supporters of each candidate for Prime Minister intendedto cast a Knesset vote, while Table 21b shows how they recalled casting a Knesset vote.About 20% of Mordecai and Netanyahu voters intended to vote for a party other than thefive we have feeling thermometer data for. Disproportionately fewer Netanyahu votersintended to vote for a party tied with another party for the highest feeling thermometer

28
ranking. This is not surprising, since we lack feeling thermometer data for all of thereligious and right wing parties other than Shas and Likud. However, after the election,more than 60% of those who intended to vote for Netanyahu or Mordecai recalled votingfor a party other than the one they preferred most (or as much as any other party). Incontrast, Barak’s supporters were likely to vote for the party they liked best, or tied forbest. This is consistent with our expectation that supporters of Mordecai or Netanyahu,expecting that their candidate would be vanquished, cast a strategic vote for a party thatmight exert influence in a Barak government.
Based on this descriptive evidence, we tested the proposition that supporters ofone candidate for Prime Minister would vote for a smaller party when they expected theirown candidate to lose. So, we performed a logit analysis to investigate whether or notpeople voted for a “straight” ticket, Netanyahu and Likud, Barak and One Israel, orMordecai and the Center Party. We tested this relationship by expanding our model ofstrategic Knesset vote considerations. Instead of the dependent variable being a vote for amajor party, the unified model’s dependent variable is whether or not the respondentintends to cast a straight ticket set of votes. Diskin’s survey data estimates that 40% ofthose who intended to vote for Netanyahu voted for Likud. About 60% of those whointended to vote for the Barak or Mordecai intended to also vote for the parties they led.We added a dummy to the model for all those who thought that their favorite candidatehad the best chance of winning, and two interaction terms. These terms interacted thedummy with the size of the largest party in the Knesset, and the size of the party thecandidate expected to cast a vote for in the Knesset, respectively. We used interactionsbecause we expect that the size of the largest party in the Knesset, and the anticipatedsize of the party the respondent supports, to have a greater effect when the respondentexpects that his candidate for Prime Minister will prevail. The interaction with theexpected size of the largest party should decrease the likelihood that the respondent willintend to cast a straight-ticket vote while interactions with the size of the party shouldincrease the likelihood of casting a straight-ticket vote. We include the same controls asbefore since the demographic and attitudinal variables are all expected to increase thechances of voting for a small party (and hence, a split-ticket). Voting for a major party in1996 and the expected size of the party the respondent supports was expected to increasethe likelihood that one might vote for a major party as part of a straight ticket.
Expecting one’s favorite candidate for Prime Minister to win significantlyincreased the likelihood that the respondent would cast a straight ticket vote (see Table22). The expected size of the largest party in the Knesset and the size of the party oneintends to vote for had no significant direct effect on voting a straight ticket. However,both interaction terms were significant. The size of the largest party in the Knesset (notthe one the respondent intends to vote for) decreases the chances of voting for a straightticket when the candidate the respondent supports has the best chance of winning theelection for Prime Minister. The size of the Knesset party the respondent intends to votefor increases the likelihood of voting for the same party as the Prime Minister when therespondent expects the candidate of his choice to win. Expecting the candidate you intendto vote for to win the election for Prime Minister exacerbates the effect previouslyobserved in the model of strategic Knesset voting. Voting because of non-security issuesand identifying oneself as being at either extreme on security issues also decreased the
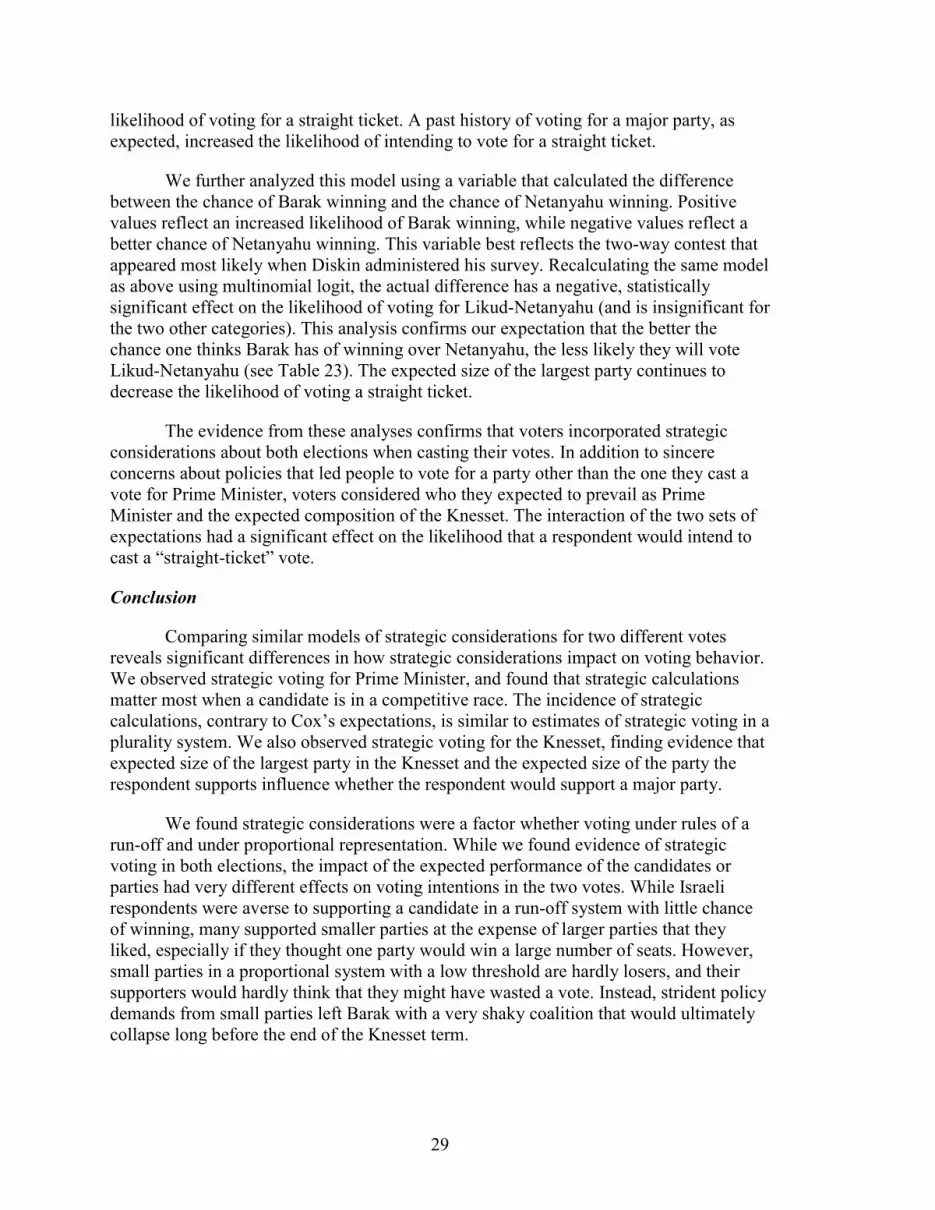
29
likelihood of voting for a straight ticket. A past history of voting for a major party, asexpected, increased the likelihood of intending to vote for a straight ticket.
We further analyzed this model using a variable that calculated the differencebetween the chance of Barak winning and the chance of Netanyahu winning. Positivevalues reflect an increased likelihood of Barak winning, while negative values reflect abetter chance of Netanyahu winning. This variable best reflects the two-way contest thatappeared most likely when Diskin administered his survey. Recalculating the same modelas above using multinomial logit, the actual difference has a negative, statisticallysignificant effect on the likelihood of voting for Likud-Netanyahu (and is insignificant forthe two other categories). This analysis confirms our expectation that the better thechance one thinks Barak has of winning over Netanyahu, the less likely they will voteLikud-Netanyahu (see Table 23). The expected size of the largest party continues todecrease the likelihood of voting a straight ticket.
The evidence from these analyses confirms that voters incorporated strategicconsiderations about both elections when casting their votes. In addition to sincereconcerns about policies that led people to vote for a party other than the one they cast avote for Prime Minister, voters considered who they expected to prevail as PrimeMinister and the expected composition of the Knesset. The interaction of the two sets ofexpectations had a significant effect on the likelihood that a respondent would intend tocast a “straight-ticket” vote.
Conclusion
Comparing similar models of strategic considerations for two different votesreveals significant differences in how strategic considerations impact on voting behavior.We observed strategic voting for Prime Minister, and found that strategic calculationsmatter most when a candidate is in a competitive race. The incidence of strategiccalculations, contrary to Cox’s expectations, is similar to estimates of strategic voting in aplurality system. We also observed strategic voting for the Knesset, finding evidence thatexpected size of the largest party in the Knesset and the expected size of the party therespondent supports influence whether the respondent would support a major party.
We found strategic considerations were a factor whether voting under rules of arun-off and under proportional representation. While we found evidence of strategicvoting in both elections, the impact of the expected performance of the candidates orparties had very different effects on voting intentions in the two votes. While Israelirespondents were averse to supporting a candidate in a run-off system with little chanceof winning, many supported smaller parties at the expense of larger parties that theyliked, especially if they thought one party would win a large number of seats. However,small parties in a proportional system with a low threshold are hardly losers, and theirsupporters would hardly think that they might have wasted a vote. Instead, strident policydemands from small parties left Barak with a very shaky coalition that would ultimatelycollapse long before the end of the Knesset term.

30
The challenge of estimating how many voters split their tickets as a result of asincere appreciation for a smaller party or as a direct consequence of strategiccalculations remains. Sadly, we have little insight into the many voters who appear tohave decided to split their tickets at or near the very end of the campaign. Nor do we havea full range of feeling thermometers that would enable us to better estimate affect towardsmost of the minor parties. However, Table 24 provides some very general estimates ofthe distribution of voters. In Table 24, we break down the voters for each of the large fiveparties into three categories, those that voted for the party whom they ranked the higheston the feeling thermometers, those that ranked the party tied for highest, and those thatranked the party lower than another of the five parties. We then divided each of thesecategories into columns noting which candidate for Prime Minister the voter expectedwould win the election.
The most striking finding from this table is the large number of presumably“straightforward” voters, who expect that their camp’s leader will win the election.However, beyond the large percentage of One Israel voters who thought Barak would winor Likud voters who thought Netanyahu would win, there are some interesting insightsthat can be surmised from these statistics. It is instructive to observe how many votersvoted for Meretz even though they expected Netanyahu to win. Many of these voters(about 13% of Meretz voters) would probably be considered sincere supporters of theseparties because Meretz would have little influence in a Netanyahu-led government. Onlyone “irrational” respondent in the sample intended to vote for Meretz rather than a partythey liked better in face of a Netanyahu victory, and only two more intended to vote forMeretz rather than a party they liked the same.
Hardly any of the respondents intended to vote for the Center Party when theCenter Party was not the respondent's first choice, despite its presence in the ideologicalcenter and expected role in any future government. This is an important reminder that thisdoes not mean that all of the Center Party voters were "sincere" since the anticipation ofits all-star list's role in any government may have made them more attractive. Futureresearch into strategic considerations in parliamentary systems should investigate theextent to which a pivotal position contributes to the popularity of similarly situatedparties in other systems.

31
References
Abramson, Paul R., John H. Aldrich, Phil Paolino, and David W. Rohde. 1992. “‘Sophisticated’ Voting inthe 1988 Presidential Primaries.” American Political Science Review 88 (March):55-69.
Abramson, Paul R., John H. Aldrich, Phil Paolino, and David W. Rohde. 1995. “Independent and ThirdParty Candidates in American Politics: Wallace, Anderson, and Perot.” Political Science Quarterly110 (Fall):545-74.
Abramson, Paul R., John H. Aldrich, Phil Paolino, and David W. Rohde. 2000. “Challenges to theAmerican Two-Party System: Evidence from the 1968, 1980, 1992, and 1996 PresidentialElections.” Political Research Quarterly 53 (December).
Abramson, Paul R., John H. Aldrich, and David W. Rohde. 2001. Change and Continuity in the 2000Election. Washington, DC: CQ Press.
Arian, Asher. 1998. The Second Republic: Politics in Israel. Chatham, NJ: Chatham House.
Arian, Asher and Michal Shamir. 1983. “The Primarily Political Functions of the Left-Right Continuum.”Comparative Politics 15: 139-158.
Arian, Asher and Michal Shamir. 2000. “Candidate, Parties and Blocs: Evidence from the 1999 Elections.”Tel-Aviv, Israel: Pinhas Sapir Center for Development. Discussion Paper No. 1-2000.
Cox, Gary W. 1997. Making Votes Count: Strategic Coordination in the World’s Electoral Systems.Cambridge: Cambridge University Press.
Dalton, Russell J., and Martin P. Wattenberg (eds.). 2001. Parties Without Partisans: Political Change inAdvanced Industrial Democracies. Oxford: Oxford University Press.
Duverger, Maurice. 1963. Political Parties: Their Organization and Activity in the Modern State. Translatedby Barbara North and Robert North. New York: Wiley.
Farquharson, Robin. 1969. Theory of Voting. New Haven: Yale University Press.
Ferejohn, John A., and Morris P. Fiorina. 1974. “The Paradox of Not Voting: A Decision TheoreticAnalysis.” American Political Science Review 68 (June):525-36.
Ferejohn, John A., and Morris P. Fiorina. 1975. “Closeness Counts Only in Horseshoes and Dancing.”American Political Science Review 69: 920-925.
Ferejohn, John A., and Morris P. Fiorina. 1993. “To P or not to P? Still Asking After All These Years.”Typescript. Harvard University.
Fox, Craig R. 1999. “Strength of Evidence, Judged Probability and Choice under Uncertainty.” CognitivePsychology 38:167-189.
Harris, David Zev. 1999. “Center shifts campaign focus away from Mordechai.” The Jerusalem Post, May12.
Kitschelt, Herbert. 1989. The Logics of Party Formation: Ecological Politics in Belgium and WestGermany. London: Cornell University Press.
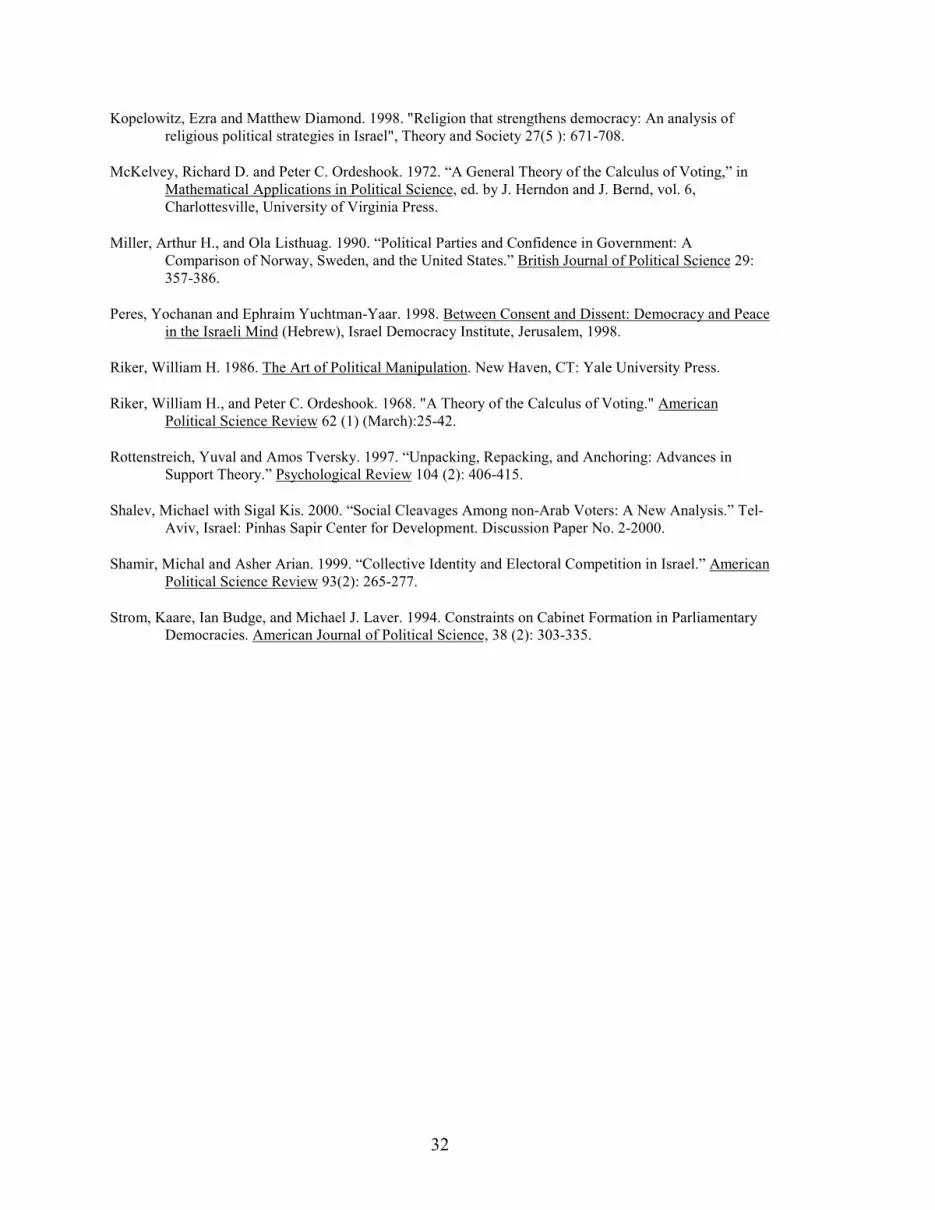
32
Kopelowitz, Ezra and Matthew Diamond. 1998. "Religion that strengthens democracy: An analysis ofreligious political strategies in Israel", Theory and Society 27(5 ): 671-708.
McKelvey, Richard D. and Peter C. Ordeshook. 1972. “A General Theory of the Calculus of Voting,” inMathematical Applications in Political Science, ed. by J. Herndon and J. Bernd, vol. 6,Charlottesville, University of Virginia Press.
Miller, Arthur H., and Ola Listhuag. 1990. “Political Parties and Confidence in Government: AComparison of Norway, Sweden, and the United States.” British Journal of Political Science 29:357-386.
Peres, Yochanan and Ephraim Yuchtman-Yaar. 1998. Between Consent and Dissent: Democracy and Peacein the Israeli Mind (Hebrew), Israel Democracy Institute, Jerusalem, 1998.
Riker, William H. 1986. The Art of Political Manipulation. New Haven, CT: Yale University Press.
Riker, William H., and Peter C. Ordeshook. 1968. "A Theory of the Calculus of Voting." AmericanPolitical Science Review 62 (1) (March):25-42.
Rottenstreich, Yuval and Amos Tversky. 1997. “Unpacking, Repacking, and Anchoring: Advances inSupport Theory.” Psychological Review 104 (2): 406-415.
Shalev, Michael with Sigal Kis. 2000. “Social Cleavages Among non-Arab Voters: A New Analysis.” Tel-Aviv, Israel: Pinhas Sapir Center for Development. Discussion Paper No. 2-2000.
Shamir, Michal and Asher Arian. 1999. “Collective Identity and Electoral Competition in Israel.” AmericanPolitical Science Review 93(2): 265-277.
Strom, Kaare, Ian Budge, and Michael J. Laver. 1994. Constraints on Cabinet Formation in ParliamentaryDemocracies. American Journal of Political Science, 38 (2): 303-335.

1
Figure 1
Yedioth Aharanot Tracking Poll Results (3-Way Race)
0
5
10
15
20
25
30
35
40
45
50
3/12
/99
3/19
/99
3/26
/99
4/2/
99
4/9/
99
4/16
/99
4/23
/99
4/30
/99
5/7/
99
5/14
/99
Survey Publication Date
Pe
rce
nta
ge
of
Vo
te
Netanyahu
Barak
Mordecai
Source: Yedioth Aharonot - Surveys by Dr. Mina Tzemach

2
Figure 2
Opposition Lead over Netanyahu in Two-Candidate Race
0
2
4
6
8
10
12
14
3/12
/99
3/19
/99
3/26
/99
4/2/
99
4/9/
99
4/16
/99
4/23
/99
4/30
/99
5/7/
99
5/14
/99
Survey Publication Date
Per
cen
tag
e P
oin
t L
ead
Barak's Lead overNetanyahu
Mordecai's Leadover Netanyahu
Source: Yedioth Aharonot - Surveys by Dr. Mina Tzemach
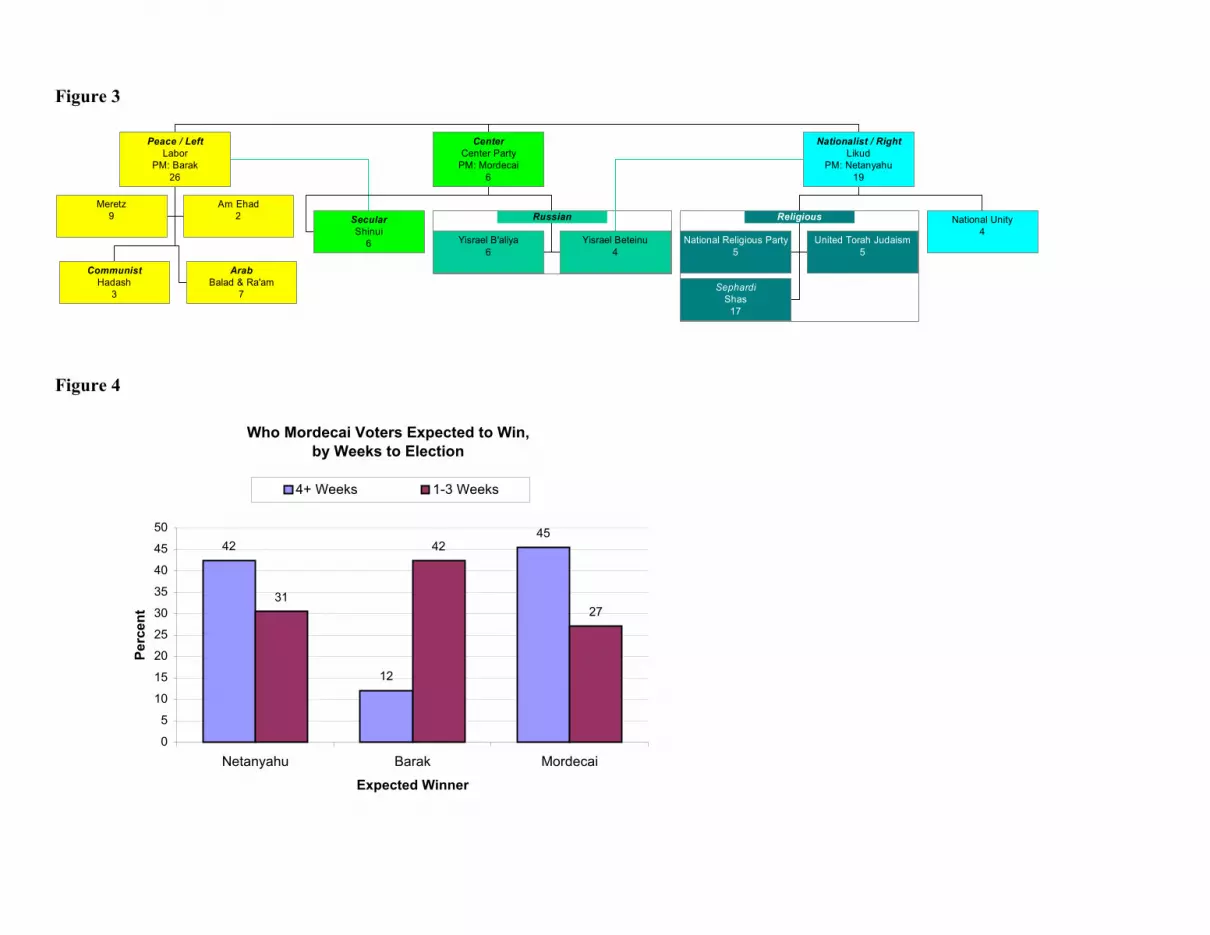
Figure 3
Meretz9
Am Ehad2
CommunistHadash
3
ArabBalad & Ra'am
7
Peace / LeftLabor
PM: Barak26
SecularShinui
6 Yisrael B'aliya6
Yisrael Beteinu4
Russian
CenterCenter Party
PM: Mordecai6
National Religious Party5
United Torah Judaism5
SephardiShas
17
Religious National Unity4
Nationalist / RightLikud
PM: Netanyahu19
Figure 4
Who Mordecai Voters Expected to Win, by Weeks to Election
42
12
45
31
42
27
0
5
10
15
20
25
30
35
40
45
50
Netanyahu Barak Mordecai
Expected Winner
Per
cen
t
4+ Weeks 1-3 Weeks
Table 4 Who do you think will advance to the second round?
Name: Percent:
Outright Winner(No Second Round): 14.7% (145)
Netanyahu
and Barak: 70.6% (698)
and Mordecai: 7.8% (77)
Barak and Mordecai: 5.1% (50)
Other Predictions 1.9% (19)
Total: 100% (989)
Survey: Arian and Shamir
If Respondent Picked a Candidate to Win Outright, Who Was It?Answers deduced from victory predictions
Name: Percent:
Netanyahu 37.2% (54)
Barak 42.8% (62)
Mordecai 11.7% (17)
Other 8.3% (12)
Total: 100% (145)
Survey: Arian and Shamir

Table 9
Second Knesset vote (if possible)?Vote Intention Likud &
RightReligious Shas Russians Center Shinui One Israel,
Arabs andLeft
Other orNone
Total
Right-other 40.5% 33.3% 2.4% 4.8% 4.8% 2.4% 2.4% 9.5%17 14 1 2 2 1 1 4 42
Likud 26.2% 22.1% 8.2% 0.8% 10.7% 7.4% 4.9% 19.7%32 27 10 1 13 9 6 24 122
Religious 45.9% 27.0% 13.5% 2.7% 0.0% 2.7% 5.4% 2.7%17 10 5 1 0 1 2 1 37
Shas 38.7% 37.3% 1.3% 17.3% 0.0% 2.7% 1.3%29 28 1 13 0 2 1 75
Russians 29.2% 2.1% 2.1% 41.7% 2.1% 2.1% 18.8% 2.1%14 1 1 20 1 1 9 1 48
Center 17.6% 0.0% 0.0% 1.5% 13.2% 44.1% 23.5%12 0 0 1 9 30 16 68
Shinui 18.4% 0.0% 0.0% 2.6% 13.2% 50.0% 15.8%7 0 0 1 5 19 6 38
One Israel 1.8% 0.9% 0.0% 0.0% 21.3% 22.7% 44.4% 8.9%4 2 0 0 48 51 100 20 225
Meretz 0.0% 0.0% 0.0% 0.0% 5.4% 14.0% 71.0% 9.7%0 0 0 0 5 13 66 9 93
Left-other, Arab 11.1% 11.1% 0.0% 0.0% 55.6% 0.0% 11.1% 11.1%1 1 0 0 5 0 1 1 9
Other/No Vote 7.7% 0.0% 0.0% 7.7% 0.0% 7.7% 30.8% 46.2%2 0 0 2 0 2 8 12 26
Total 135 83 18 29 92 87 244 95 783Source: Diskin
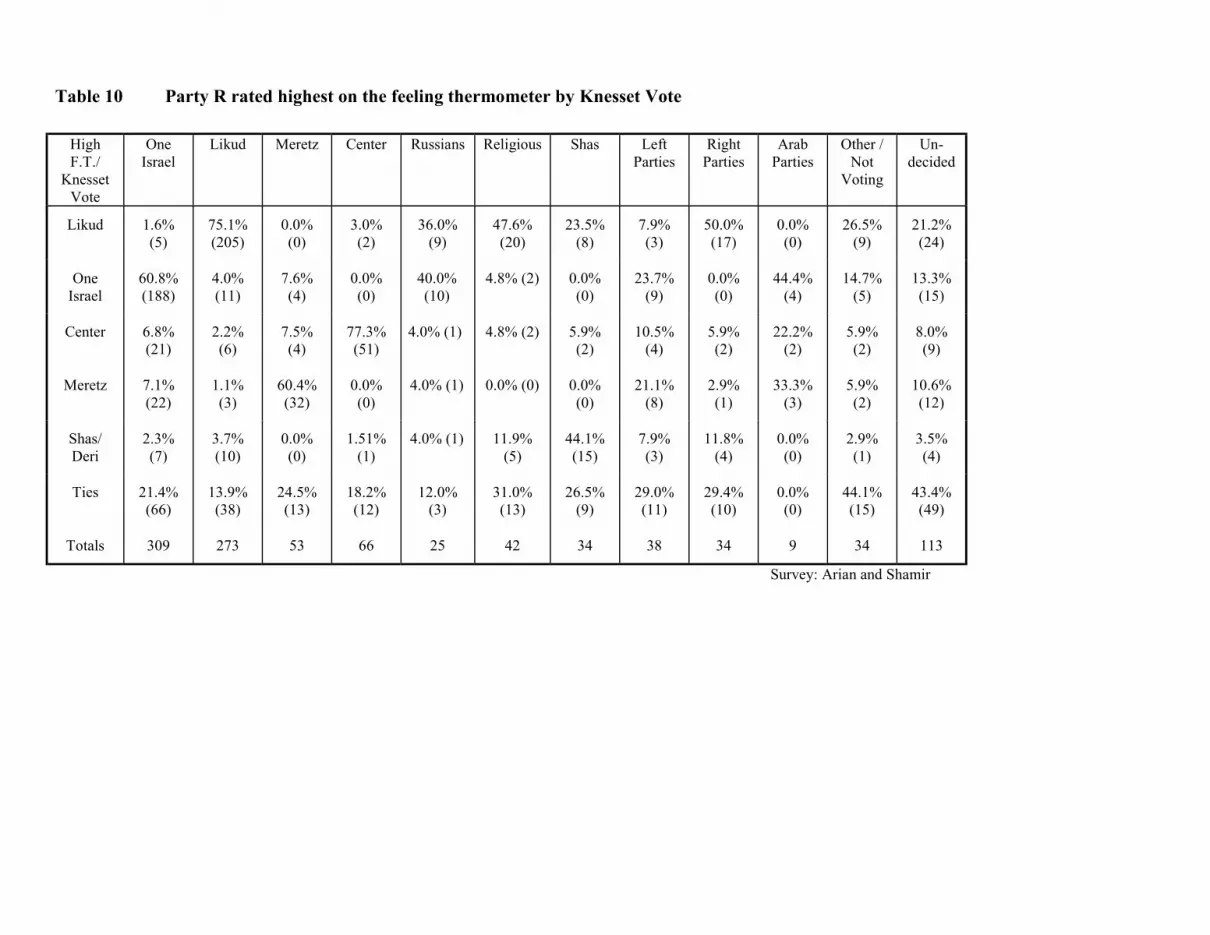
Table 10 Party R rated highest on the feeling thermometer by Knesset Vote
HighF.T./
KnessetVote
OneIsrael
Likud Meretz Center Russians Religious Shas LeftParties
RightParties
ArabParties
Other /Not
Voting
Un-decided
Likud 1.6%(5)
75.1%(205)
0.0%(0)
3.0%(2)
36.0%(9)
47.6%(20)
23.5%(8)
7.9%(3)
50.0%(17)
0.0%(0)
26.5%(9)
21.2%(24)
OneIsrael
60.8%(188)
4.0%(11)
7.6%(4)
0.0%(0)
40.0%(10)
4.8% (2) 0.0%(0)
23.7%(9)
0.0%(0)
44.4%(4)
14.7%(5)
13.3%(15)
Center 6.8%(21)
2.2%(6)
7.5%(4)
77.3%(51)
4.0% (1) 4.8% (2) 5.9%(2)
10.5%(4)
5.9%(2)
22.2%(2)
5.9%(2)
8.0%(9)
Meretz 7.1%(22)
1.1%(3)
60.4%(32)
0.0%(0)
4.0% (1) 0.0% (0) 0.0%(0)
21.1%(8)
2.9%(1)
33.3%(3)
5.9%(2)
10.6%(12)
Shas/Deri
2.3%(7)
3.7%(10)
0.0%(0)
1.51%(1)
4.0% (1) 11.9%(5)
44.1%(15)
7.9%(3)
11.8%(4)
0.0%(0)
2.9%(1)
3.5%(4)
Ties 21.4%(66)
13.9%(38)
24.5%(13)
18.2%(12)
12.0%(3)
31.0%(13)
26.5%(9)
29.0%(11)
29.4%(10)
0.0%(0)
44.1%(15)
43.4%(49)
Totals 309 273 53 66 25 42 34 38 34 9 34 113
Survey: Arian and Shamir
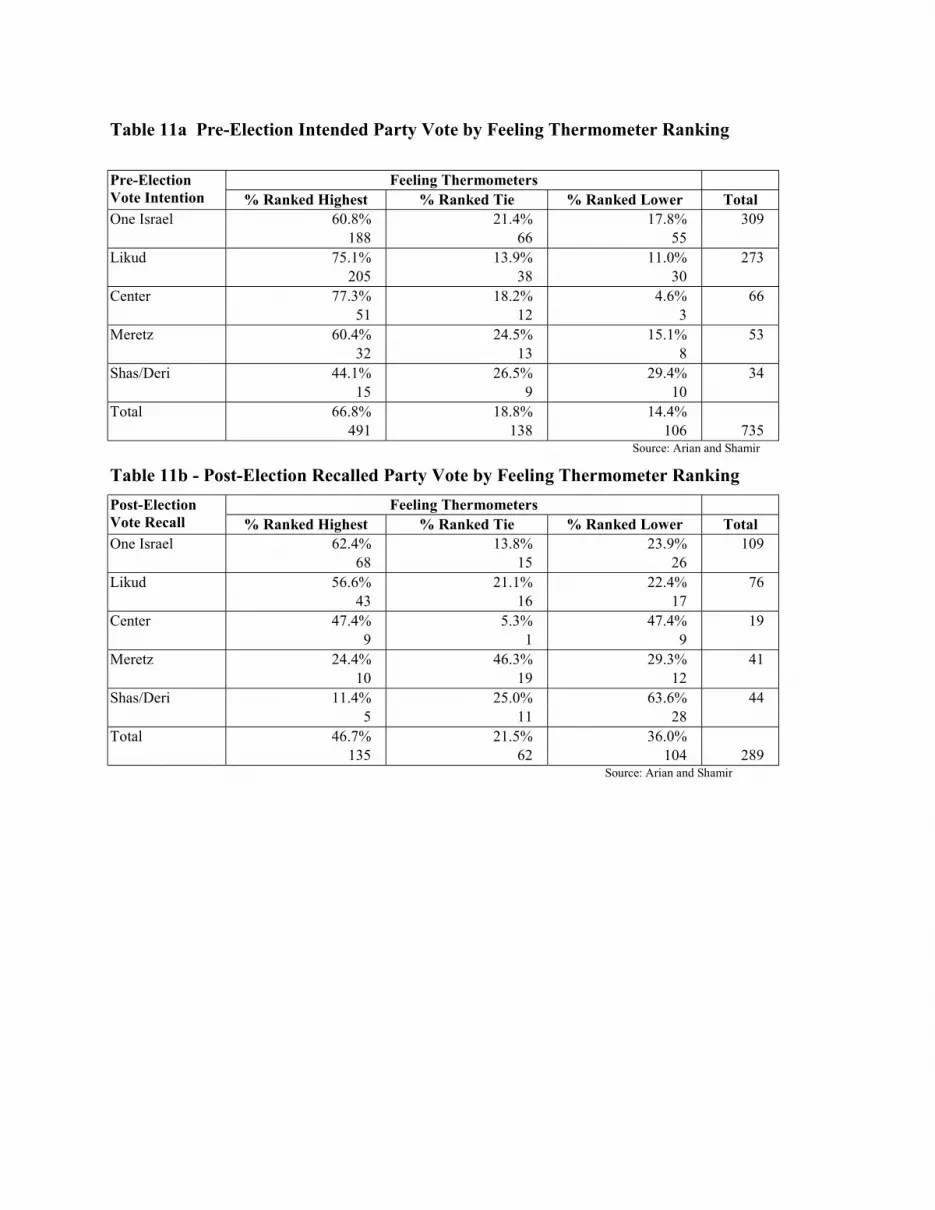
Table 11a Pre-Election Intended Party Vote by Feeling Thermometer Ranking
Feeling ThermometersPre-ElectionVote Intention % Ranked Highest % Ranked Tie % Ranked Lower TotalOne Israel 60.8% 21.4% 17.8% 309
188 66 55Likud 75.1% 13.9% 11.0% 273
205 38 30Center 77.3% 18.2% 4.6% 66
51 12 3Meretz 60.4% 24.5% 15.1% 53
32 13 8Shas/Deri 44.1% 26.5% 29.4% 34
15 9 10Total 66.8% 18.8% 14.4%
491 138 106 735Source: Arian and Shamir
Table 11b - Post-Election Recalled Party Vote by Feeling Thermometer Ranking
Feeling ThermometersPost-ElectionVote Recall % Ranked Highest % Ranked Tie % Ranked Lower TotalOne Israel 62.4% 13.8% 23.9% 109
68 15 26Likud 56.6% 21.1% 22.4% 76
43 16 17Center 47.4% 5.3% 47.4% 19
9 1 9Meretz 24.4% 46.3% 29.3% 41
10 19 12Shas/Deri 11.4% 25.0% 63.6% 44
5 11 28Total 46.7% 21.5% 36.0%
135 62 104 289Source: Arian and Shamir
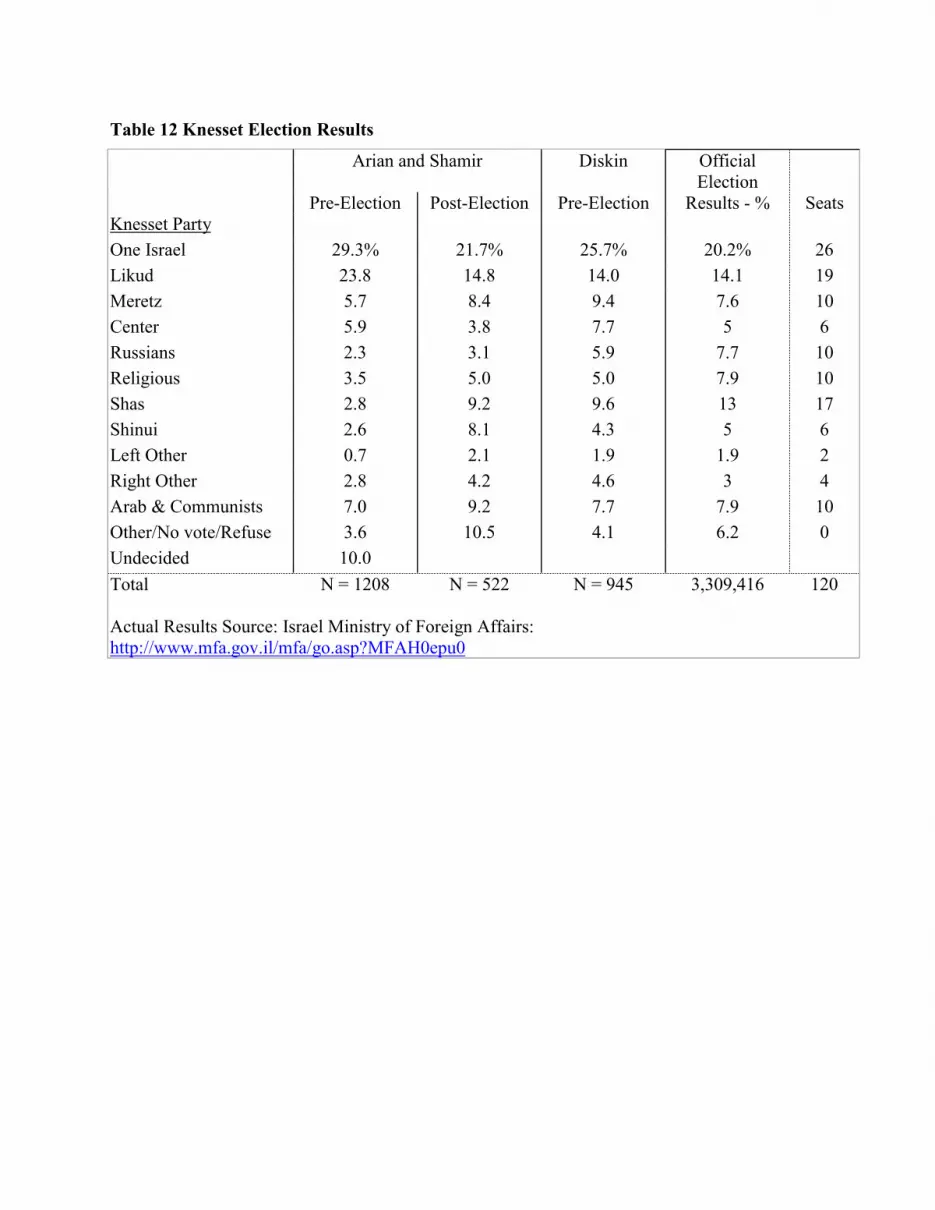
Table 12 Knesset Election Results
Arian and Shamir Diskin OfficialElection
Pre-Election Post-Election Pre-Election Results - % SeatsKnesset Party
One Israel 29.3% 21.7% 25.7% 20.2% 26
Likud 23.8 14.8 14.0 14.1 19
Meretz 5.7 8.4 9.4 7.6 10
Center 5.9 3.8 7.7 5 6
Russians 2.3 3.1 5.9 7.7 10
Religious 3.5 5.0 5.0 7.9 10
Shas 2.8 9.2 9.6 13 17
Shinui 2.6 8.1 4.3 5 6
Left Other 0.7 2.1 1.9 1.9 2
Right Other 2.8 4.2 4.6 3 4
Arab & Communists 7.0 9.2 7.7 7.9 10
Other/No vote/Refuse 3.6 10.5 4.1 6.2 0
Undecided 10.0
Total N = 1208 N = 522 N = 945 3,309,416 120
Actual Results Source: Israel Ministry of Foreign Affairs:http://www.mfa.gov.il/mfa/go.asp?MFAH0epu0
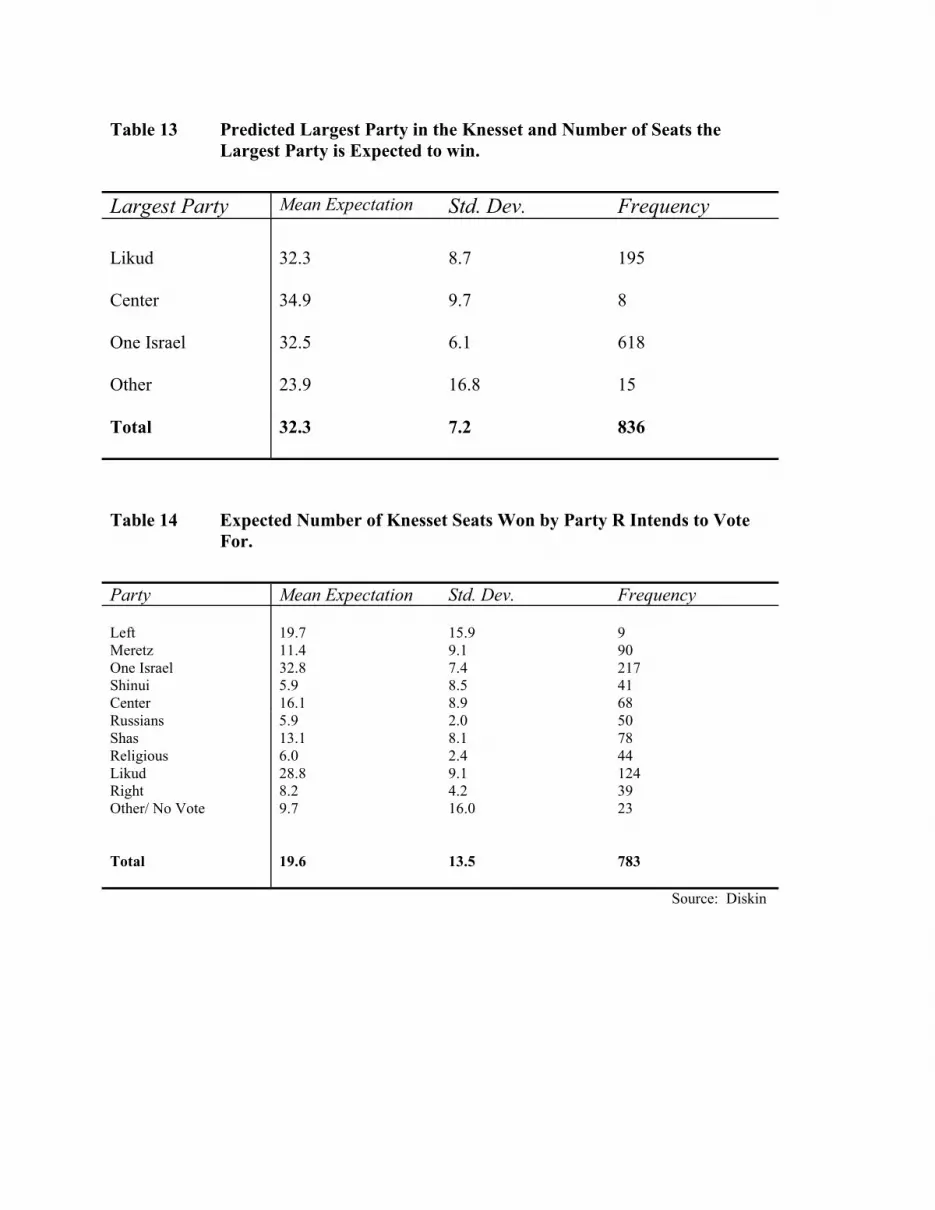
Table 13 Predicted Largest Party in the Knesset and Number of Seats theLargest Party is Expected to win.
Largest Party Mean Expectation Std. Dev. Frequency
Likud 32.3 8.7 195
Center 34.9 9.7 8
One Israel 32.5 6.1 618
Other 23.9 16.8 15
Total 32.3 7.2 836
Table 14 Expected Number of Knesset Seats Won by Party R Intends to VoteFor.
Party Mean Expectation Std. Dev. Frequency
Left 19.7 15.9 9Meretz 11.4 9.1 90One Israel 32.8 7.4 217Shinui 5.9 8.5 41Center 16.1 8.9 68Russians 5.9 2.0 50Shas 13.1 8.1 78Religious 6.0 2.4 44Likud 28.8 9.1 124Right 8.2 4.2 39Other/ No Vote 9.7 16.0 23
Total 19.6 13.5 783
Source: Diskin

Table 15 Did R intend to vote for a major party?
Probit analysis of whether R intended to vote for a major party forKnesset, given expectations of Knesset election outcome, pastvoting history and select demographic and attitudinal controls.
Coef. Std. Err.
Constant -0.60 0.31
Size of Largest Knesset Party -0.03 0.01
Expected Number of Seats 0.06 0.01
Controls
Voted for Major Party in1996
0.81 0.14
Haredi -0.20 0.34
Russian -1.13 0.52
Bad Personal FinancialSituation
-0.05 0.20
Main reason for vote: Non-security issue
-0.88 0.31
Main reason for vote: Partyrepresents people like me
-0.18 0.17
Self-placement at extremes onsecurity issues
-1.10 0.28
Chi2= 251.83 Pseudo R2= 0. 3779
First Differences with all control variables = 0Seats of Largest Knesset Party
R's Party# Seats 20 25 32 40 60
0 11.95% 9.30% 6.36% 3.94% 0.97%3 16.16% 12.86% 9.08% 5.85% 1.59%
13 36.08% 30.80% 24.06% 17.45% 6.47%24 63.24% 57.66% 49.61% 40.45% 20.56%60 99.55% 99.32% 98.82% 97.89% 92.67%
First Differences with Voted for Major Party Control = 1Seats of Largest Knesset Party
R's Party# Seats 20 25 32 40 60
0 35.74% 30.48% 23.78% 17.22% 6.36%3 43.01% 37.41% 30.01% 22.48% 9.08%
13 67.56% 62.19% 54.28% 45.04% 24.05%24 88.75% 85.73% 80.65% 73.67% 52.12%60 99.97% 99.95% 99.89% 99.78% 98.82%

Table 16
Table 16
Did R Intend to Vote for FavoredCandidate?
Probit Estimates of the Probability of Intending toVote for the Favorite Candidate Given “Folded”
Probability of the First- and Second- RankedCandidates Winning the Election
Coef. Std. Err. Z“Folded” P1 3.57 0.29 12.49“Folded” P2 -1.36 0.28 -4.92
Constant -0.33 0.11 -2.96
N= 880
Chi2= 167.39 Pseudo R2 =0.156
Predicted DifferencesOver select values of P
“Folded” P1“Folded” P2 Min 0.33 Max
Min 37.0% 80.4% 92.7%Mean 27.4% 72.3% 88.2%
0.33 21.6% 65.7% 84.1%Max 15.6% 57.0% 78.0%
Survey: Diskin
Table 17
Table 17
Did R Intend to Vote for Favored Candidate?Probit Estimates of the “Folded” Probability of Expecting to Vote
for the Favorite Candidate, Given Ordinal Preferences and DifferingAssessments of Candidate Viability
Coef. Std. Err. ZConstant 0.26 0.05 5.07
p12 2.13 0.22 9.64p13 0.86 0.20 4.34
N=880
Chi2= 185.21 Pseudo R2= 0.173
First DifferencesP12
P13 Min Zero MaxMin 10.9% 43.5% 81.6%Zero 21.1% 60.4% 90.8%Max 35.4% 75.6% 96.1%
Survey: Diskin
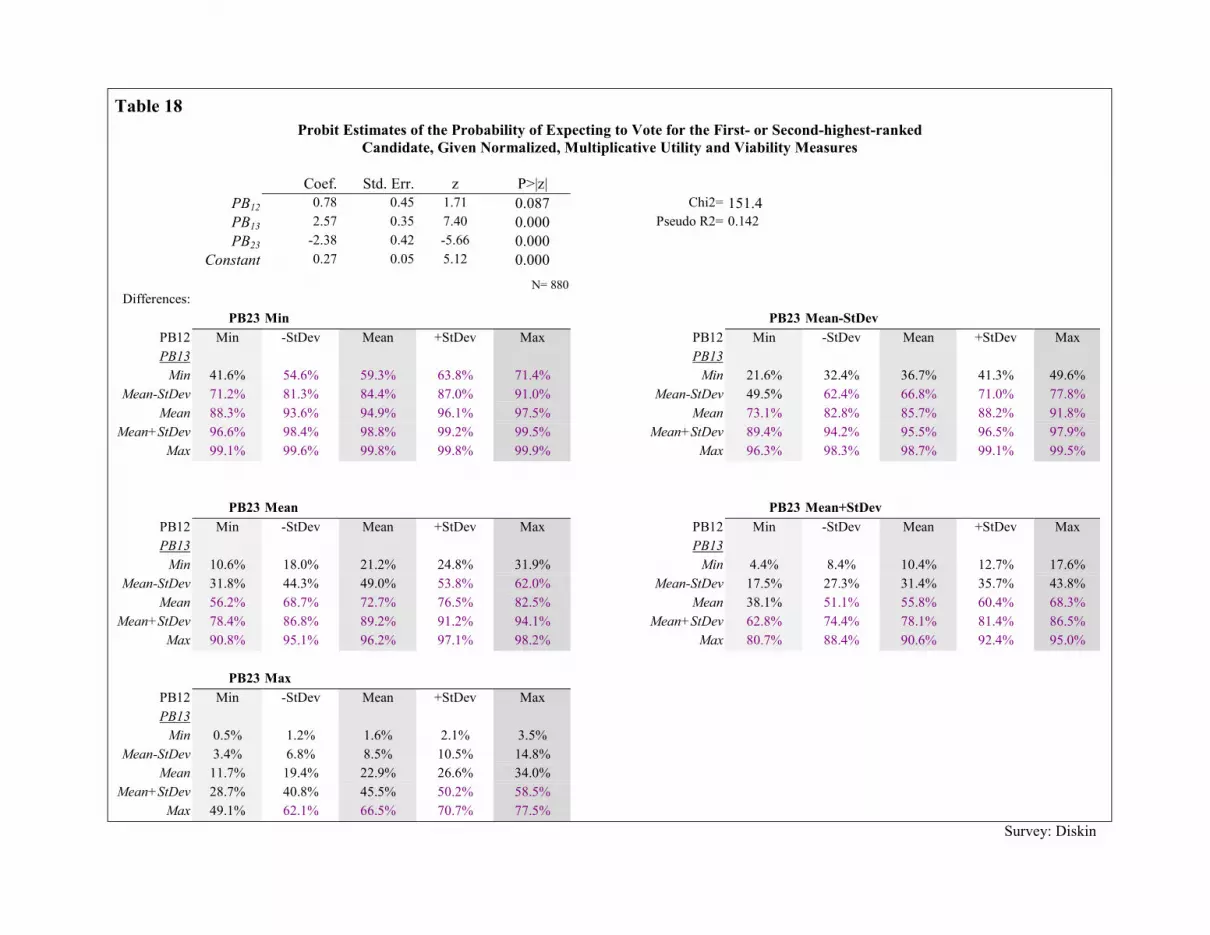
Table 18Probit Estimates of the Probability of Expecting to Vote for the First- or Second-highest-ranked
Candidate, Given Normalized, Multiplicative Utility and Viability Measures
Coef. Std. Err. z P>|z|PB12 0.78 0.45 1.71 0.087 Chi2= 151.4PB13 2.57 0.35 7.40 0.000 Pseudo R2= 0.142
PB23 -2.38 0.42 -5.66 0.000Constant 0.27 0.05 5.12 0.000
N= 880Differences:
PB23 Min PB23 Mean-StDev
PB12 Min -StDev Mean +StDev Max PB12 Min -StDev Mean +StDev Max
PB13 PB13
Min 41.6% 54.6% 59.3% 63.8% 71.4% Min 21.6% 32.4% 36.7% 41.3% 49.6%
Mean-StDev 71.2% 81.3% 84.4% 87.0% 91.0% Mean-StDev 49.5% 62.4% 66.8% 71.0% 77.8%
Mean 88.3% 93.6% 94.9% 96.1% 97.5% Mean 73.1% 82.8% 85.7% 88.2% 91.8%
Mean+StDev 96.6% 98.4% 98.8% 99.2% 99.5% Mean+StDev 89.4% 94.2% 95.5% 96.5% 97.9%
Max 99.1% 99.6% 99.8% 99.8% 99.9% Max 96.3% 98.3% 98.7% 99.1% 99.5%
PB23 Mean PB23 Mean+StDev
PB12 Min -StDev Mean +StDev Max PB12 Min -StDev Mean +StDev Max
PB13 PB13
Min 10.6% 18.0% 21.2% 24.8% 31.9% Min 4.4% 8.4% 10.4% 12.7% 17.6%
Mean-StDev 31.8% 44.3% 49.0% 53.8% 62.0% Mean-StDev 17.5% 27.3% 31.4% 35.7% 43.8%
Mean 56.2% 68.7% 72.7% 76.5% 82.5% Mean 38.1% 51.1% 55.8% 60.4% 68.3%
Mean+StDev 78.4% 86.8% 89.2% 91.2% 94.1% Mean+StDev 62.8% 74.4% 78.1% 81.4% 86.5%
Max 90.8% 95.1% 96.2% 97.1% 98.2% Max 80.7% 88.4% 90.6% 92.4% 95.0%
PB23 Max
PB12 Min -StDev Mean +StDev Max
PB13
Min 0.5% 1.2% 1.6% 2.1% 3.5%
Mean-StDev 3.4% 6.8% 8.5% 10.5% 14.8%Mean 11.7% 19.4% 22.9% 26.6% 34.0%
Mean+StDev 28.7% 40.8% 45.5% 50.2% 58.5%
Max 49.1% 62.1% 66.5% 70.7% 77.5%
Survey: Diskin

Table 18Table 19
Table 19
Did R Intend to Vote for Favored Party?Probit Estimates of the “Folded” Probability of
Expecting to Vote for the Favorite Party, Given OrdinalPreferences and Differing Assessments of Party Viability
Coef. Std. Err. ZConstant -0.32 0.04 -8.32
p12 -1.05 0.37 -2.84p13 1.62 0.43 3.76
N=1143
Chi2= 14.65 Pseudo R2= 0.010
Survey: Diskin
Table 20
What Party Did R Intend to Vote For?Voter Types Highest
RankedParty
Party Tiedfor Highest
AnotherRankedParty
UnrankedParty
Total
Sophisticated 39.3% 21.4% 16.1% 23.2% 5622 12 9 13
Sincere 57.3% 17.3% 5.3% 20.0% 7543 13 4 15
Straight 60.9% 15.2% 9.0% 14.8% 532324 81 48 79
Irrational 22.7% 4.5% 59.1% 13.6% 225 1 13 3
Total 57.5% 15.6% 10.8% 16.1% 685394 107 74 110

Table 21a
What Party Did R Intend to Vote For?IntendedPM Vote
HighestRankedParty
Party Tiedfor Highest
AnotherRankedParty
UnrankedParty
Total
Netanyahu 57.2% 12.1% 10.0% 20.7% 290166 35 29 60
Barak 58.6% 18.2% 11.6% 11.6% 336197 61 39 39
Mordecai 52.5% 18.6% 10.2% 18.6% 5931 11 6 11
Total 57.5% 15.6% 10.8% 16.1% 685394 107 74 110
Table 21b
What Party Did R Vote For?IntendedPM Vote
HighestRankedParty
Party Tiedfor Highest
AnotherRankedParty
UnrankedParty
Total
Netanyahu 26.4% 12.8% 24.0% 36.8% 12533 16 30 46
Barak 40.1% 13.2% 21.0% 25.7% 16767 22 35 43
Mordecai 23.8% 14.3% 19.0% 42.9% 215 3 4 9
Total 33.5% 13.1% 22.0% 31.3% 313105 41 69 98

Table 22
Did R cast a vote for a “straight – ticket”?Logit analysis of whether R intended to vote for a majorparty for Knesset, given interaction of expectations of
outcome election of both Knesset and Prime Minister, pastvoting history and select demographic and attitudinal
controls.
Coef. Std. Err. zConstant -3.06 1.10 -2.78
Size of Largest KnessetParty
0.04 0.03 1.30
Expected Number ofSeats
0.01 0.02 0.31
Candidate for PM hasbest chance of winning
3.53 1.32 2.67
Interaction: LargestKnesset Party & PMhas best chance ofwinning
-0.18 0.04 -4.10
Interaction: Expectedseats & PM has bestchance of winning
0.16 0.03 5.57
Controls
Vote for Major Party in1996
1.24 0.28 4.43
Haredi 0.11 0.65 0.17Russian -2.00 1.10 -1.82Bad Personal Financial
Situation-0.13 0.40 -0.32
Main reason for vote:Non-security issue
-2.17 0.71 -3.04
Main reason for vote:Party representspeople like me
-0.18 0.33 -0.53
Self-placement atextremes on securityissues
-2.58 0.72 -3.60
N=528
Chi2= 245.94 Pseudo R2= 0.4013

Table 23 Did R intend to vote for a “Straight-Ticket”?
Multinomial logit analysis of whether R intended to vote for a “Straight-Ticket.” Comparison group is a split ticket vote.Vote for a straight ticket depends on the chance of winning Barak and Netanyahu, expectations of the Knesset election, pasthistory of voting and select demographic and attitudinal controls
Coef. Std. Err. z
Likud-Netanyahu
Size of Largest Knesset Party -0.14 0.03 -5.19Expected Number of Seats 0.17 0.02 7.94Chance of Winning: Difference between Barak &
Netanyahu-0.02 0.01 -2.74
Voted for Major Party in 1996 1.04 0.38 2.76Haredi 1.08 0.75 1.44Russian -0.54 1.14 -0.47Bad Personal Financial Situation -1.54 0.81 -1.92Main reason for vote: Non-security issue -1.98 0.87 -2.28Main reason for vote: Party represents people like
me0.26 0.43 0.60
Self-placement at extremes on security issues -2.49 0.90 -2.75Constant -1.00 0.72 -1.38
One Israel-Barak
Size of Largest Knesset Party -0.19 0.04 -4.33Expected Number of Seats 0.25 0.04 6.25Chance of Winning: Difference between Barak &
Netanyahu-0.01 0.01 -0.43
Voted for Major Party in 1996 1.64 0.65 2.53Haredi -37.57 * 0.00Russian -39.45 * 0.00Bad Personal Financial Situation 0.72 0.71 1.02Main reason for vote: Non-security issue -1.67 1.24 -1.35Main reason for vote: Party represents people like
me1.16 0.61 1.91
Self-placement at extremes on security issues -1.22 1.21 -1.01Constant -3.21 1.12 -2.88
Center-Mordecai
Size of Largest Knesset Party 0.02 0.02 0.95Expected Number of Seats 0.02 0.02 1.28Chance of Winning: Difference between Barak &
Netanyahu0.01 0.01 0.92
Voted for Major Party in 1996 1.14 0.35 3.28Haredi -39.01 * 0.00Russian -39.61 * 0.00Bad Personal Financial Situation 0.23 0.47 0.48Main reason for vote: Non-security issue -1.60 1.06 -1.51Main reason for vote: Party represents people like
me-0.50 0.43 -1.16
Self-placement at Self-placement at extremes onsecurity issuess on security issues
-40.04 * 0.00
Constant -3.13 0.82 -3.81

Table 24 Intended Party Vote by Party Feeling Thermometer Ranking and Expected PM Winner
FeelingThermometerRanking ofParty
Highest Tied for Highest Other
ExpectedPM Winner
Netanyahu Barak Mordecai Netanyahu Barak Mordecai Netanyahu Barak Mordecai
IntendedParty VoteLabor 10% 90% 0% 15.79% 80.26% 3.95% 11.54% 84.62% 3.85%
19 171 0 12 61 3 9 66 3Likud 96.59% 2.44% 0.98% 97.44% 0% 2.56% 92.31% 2.56% 5.13%
198 5 2 38 0 1 36 1 2Center 30.77% 28.85% 40.38% 14.29% 57.14% 28.57% 60% 0% 40%
16 15 21 2 8 4 3 0 2Meretz 13.16% 84.21% 2.63% 13.33% 80% 6.67% 7.14% 85.71% 7.14%
5 32 1 2 12 1 1 12 1Shas 85.71% 14.29% 0% 88.89% 11.11% 0% 80% 20% 0%
12 2 0 8 1 0 8 2 0
Source: Arian and Shamir


