Embed Size (px)
Citation preview
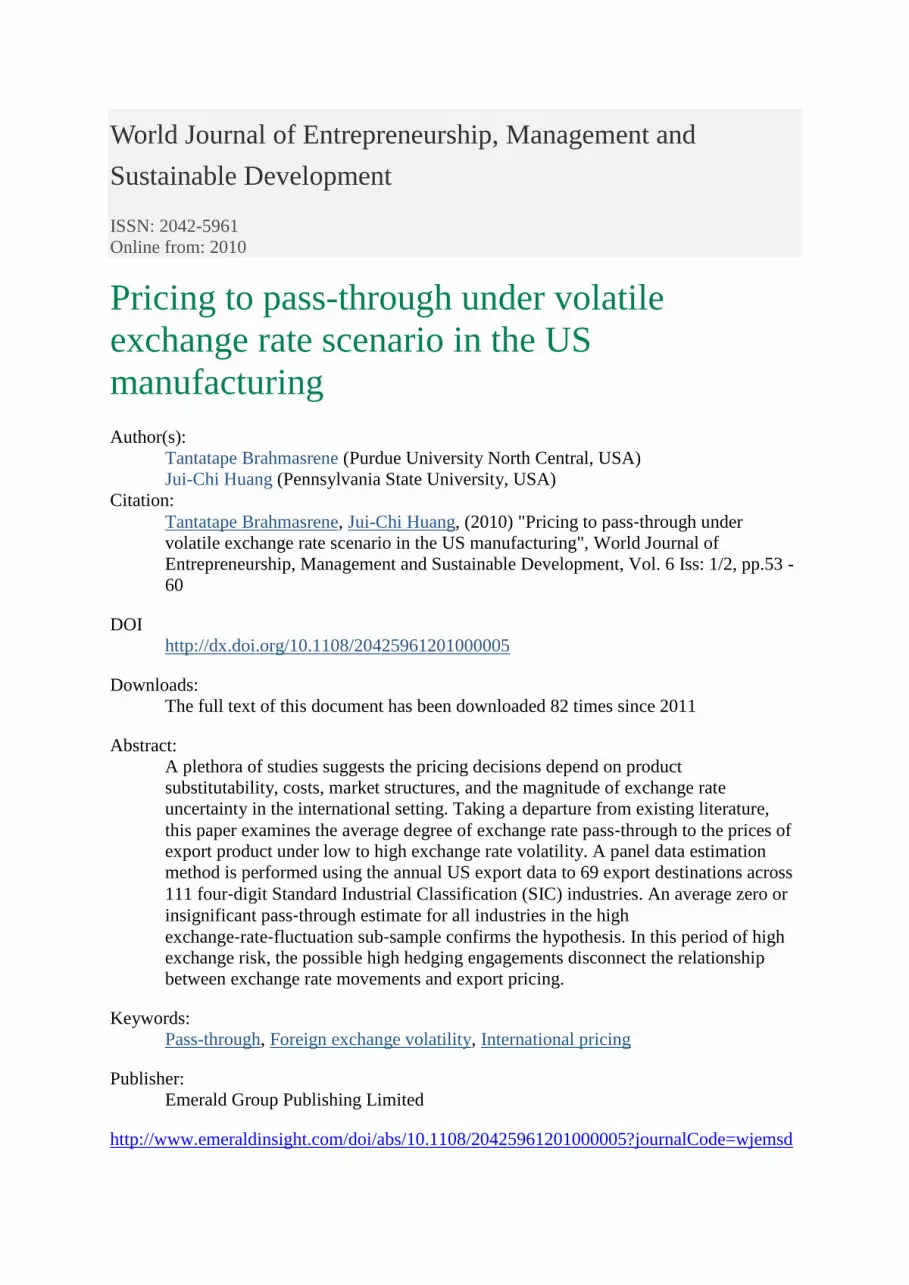
World Journal of Entrepreneurship, Management and
Sustainable Development
ISSN: 2042-5961
Online from: 2010
Pricing to pass-through under volatile
exchange rate scenario in the US
manufacturing
Author(s):
Tantatape Brahmasrene (Purdue University North Central, USA)
Jui-Chi Huang (Pennsylvania State University, USA)
Citation:
Tantatape Brahmasrene, Jui-Chi Huang, (2010) "Pricing to pass‐through under
volatile exchange rate scenario in the US manufacturing", World Journal of
Entrepreneurship, Management and Sustainable Development, Vol. 6 Iss: 1/2, pp.53 -
60
DOI
http://dx.doi.org/10.1108/20425961201000005
Downloads:
The full text of this document has been downloaded 82 times since 2011
Abstract:
A plethora of studies suggests the pricing decisions depend on product
substitutability, costs, market structures, and the magnitude of exchange rate
uncertainty in the international setting. Taking a departure from existing literature,
this paper examines the average degree of exchange rate pass‐through to the prices of
export product under low to high exchange rate volatility. A panel data estimation
method is performed using the annual US export data to 69 export destinations across
111 four‐digit Standard Industrial Classification (SIC) industries. An average zero or
insignificant pass‐through estimate for all industries in the high
exchange‐rate‐fluctuation sub‐sample confirms the hypothesis. In this period of high
exchange risk, the possible high hedging engagements disconnect the relationship
between exchange rate movements and export pricing.
Keywords:
Pass-through, Foreign exchange volatility, International pricing
Publisher:
Emerald Group Publishing Limited
http://www.emeraldinsight.com/doi/abs/10.1108/20425961201000005?journalCode=wjemsd

2
(Final draft)
Pricing to pass-through under volatile exchange rate scenario in
the U.S. manufacturing
Tantatape Brahmasrene (CONTACT AUTHOR)
College of Business
Purdue University North Central
Westville, IN 46391-9528, U.S.A.
E-mail: [email protected]
Jui-Chi Huang
Division of Engineering, Business, and Computing
Pennsylvania State University Berks Campus
Reading, PA 19610, U.S.A.
Biographical Sketch
Tantatape Brahmasrene is Professor of Finance & International Business in College of
Business at Purdue University. Dr. Brahmasrene is a 2001 J. William Fulbright Senior
Scholar, a 2003 Fulbright Senior Specialists in Thailand and a 2007 Fulbright Senior
Specialists in Kazakshstan. He holds a M.S. from Indiana State University, and a M.A. and
Ph.D. from University of Cincinnati. He earned two professional designations: Certified
Financial Planner (1991) and Chartered Financial Consultant (1992). His recent articles
appear in selected refereed journals such as Journal of the Asia Pacific Economy, Journal of
Transnational Management, International Journal of Entrepreneurship, Journal of
International Business Research and Managerial Finance.
Jui-Chi Huang is Assistant Professor of Economics at Pennsylvania State University at
Berks campus. He received a Ph.D. in economics from American University. He serves on a
Board of Directors for Pennsylvania Economic Association. His current research interest is
in the area of exchange rate risk and exchange rate pass-through. In addition to regularly
presenting papers at professional meetings, he has published in selected journals such as
International Journal of Business Economic Perspectives, Journal of Economics and
3
Economic Education Research, Managerial Finance and the Journal of Business Economic
Research.

4
Pricing to pass-through under volatile exchange rate scenario in
the U.S. manufacturing
A plethora of studies suggests the pricing decisions depend on product
substitutability, costs, market structures, and the magnitude of exchange rate
uncertainty in the international setting. Taking a departure from existing literature,
this paper examines the average degree of exchange rate pass-through to the prices of
export product under low to high exchange rate volatility. A panel data estimation
method is performed using the annual U.S. export data to 69 export destinations
across 111 four-digit Standard Industrial Classification (SIC) industries. An average
zero or insignificant pass-through estimate for all industries in the high exchange-rate-
fluctuation sub-sample confirms the hypothesis. In this period of high exchange risk,
the possible high hedging engagements disconnect the relationship between exchange
rate movements and export pricing.
Keywords: pass-through; foreign exchange volatility; international pricing
I. Introduction
Research on exchange rate pass-through is vital to understanding the relationship between
exchange rates and prices, including import and export prices, and domestic inflation. The
incomplete exchange rate pass-through can be explained by a market power, the imported
inputs, the speed of price adjustment, the asymmetric response to exchange rate fluctuations,
the choice of exchange rates and indices, price rigidity, multinational operations by related
5
and non-related party trade, and the market segmentation by trade costs. Most research on
the pricing behaviors under a theory of imperfect competition concludes that exchange rates
are less than fully passed through in some markets and the market power plays an important
role in local price destabilization (Dunn, 1970; Isard, 1977; Kravis and Lipsey, 1977;
Richardson, 1978; Giovannini, 1988; Knetter, 1989; Feinberg, 1986, 1989 and 1996). In
addition, the degree of pass-through is not only destination-specific but also sector-specific.
It varies both within and across industries due to the differences in product differentiation and
market structure (Caselli, 1996; Athukorala and Menon, 1994; Athukorala, 1991; Parsley,
1993; Menon, 1991). In general, the ability of adjusting the markup in favor of export agents
or passing cost shock to consumers is based on the competitiveness of destination markets
following the exchange rate changes.
The export pricing study of manufacturing between the U.S. and Japan indicates that
the U.S. pass-through coefficients are close to but insignificantly different from one in
general machinery, electrical machinery, and transportation equipment (Ohno, 1989).
Japanese pass-through coefficients are less than 80% and significantly different from one.
The declining in the degree of pass-through to the U.S. market in the 1980s is a result of a
growing dependence on imports, changes in the structure of competition in the U.S. market
and unfair practices by foreign firms (Parsley, 1993). The short-run estimate of the pass-
through coefficient for Japanese aggregate exports is 18.4% in six industries. The pass-
through behavior at the industry level is diverse as evident by (1) a zero pass-through for
chemicals, electrical machinery and general machinery and (2) a 20.3% pass-through for
metals and related product, a 26.3% pass-through for textiles and a 26% pass-through for
transportation equipment.
The degree of pass-through is over-estimated, possibly due to exchange rate pass-
through to imported input prices (Athukorala and Menon, 1994). The exchange rate and
6
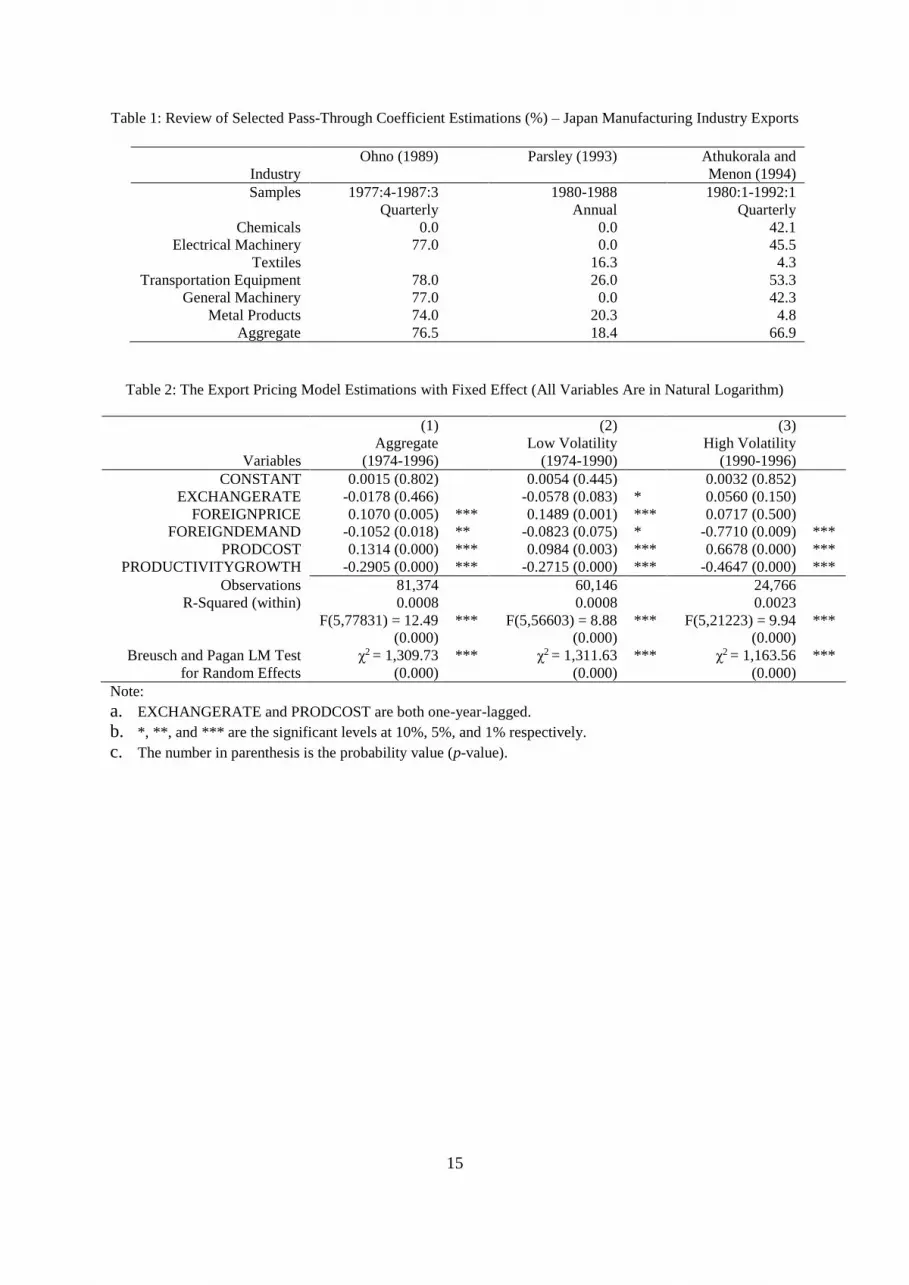
price relationships should be studied with reference to disaggregated data. The selected pass-
through coefficient estimates for Japan are summarized along with the results of Ohno (1989)
and Parsley (1993) in Table 1. The results from these three studies are all consistent in that
high pass-through is found in the same industries. The industries in highly competitive
markets such as chemicals, textiles and metal products are expected to show low pass-
through coefficients. However, only Athukorala and Menon (1994) find a low pass-through
for textiles. A possible explanation is that the degree of competition in these highly
competitive markets is undermined by product differentiation among competitive products.
Analyzing quarterly data from the third quarter of 1981 to the second quarter of 1992,
a pass-through is incomplete for most 40 products with significant differences across
products in Australian imports of manufactures (Menon, 1996). The determinants of pass-
through are decomposed into non-tariff barriers, product characteristics, foreign control and
market structure. In general, the average pass-through for total manufactures is 75.19%,
ranging from 18.48% to 104.5%. The pass-through estimates for selected similar industries
(car parts and accessories 84.73%, passenger motor cars 69.46%, motorcycles and bicycles
58.56%, trucks and busses 55.34%) do not suggest conventional thought. Car parts and
accessories should show a lower pass-through than passenger motor cars because of higher
competition.
The mixed results may be attributed to the product sectors i.e. primary product sectors
(more competitive industries) and manufacturing sectors (less competitive industries).
Normally, the pass-through coefficients on average should be lower in primary product than
manufacturing sectors. However, in the Denmark case, the primary product pass-through
coefficient of 45% is higher than that of 38% in manufacturing sectors (Rahman, 1998). The
German case has many high pass-through coefficient estimates in primary product sectors.
7
Moreover, these empirical findings may be biased without taking into account a user
or non user of hedging and the impact of exchange rate volatility. When the firms apply
financial or operational hedging against exchange risk to protect their trade contract values,
the connection between exchange rates and prices of traded goods may be weakened. A
crucial feature of this study is to introduce and control hedging by using exchange rate
volatility to improve the understanding of the exchange rate and price relationship.
II. Hypothesis and Econometric Methodology
Hypothesis
A firm facing high exchange rate volatility is more likely to hedge its trade returns in a
forward market or by other means. Thus, the export pricing under contract is less likely to be
changed by exchange rate fluctuation. As a result, a pass-through would be incomplete and
low. On the other hand, a firm in a low exchange rate fluctuation environment will be less
likely to hedge its trade returns. The degree of pass-through would not be distorted in this
case. Another integral part to the degree of pass-through is that a producer with a high
market power could pass the exchange rate shock to consumer price (a high pass-through) if
selling to a low volatile exchange rate destination. If selling to a highly volatile exchange
rate destination, this producer would hedge the trade returns. Therefore, the pass-through
would be low or zero (a low pass-through). For a given export product in the mixture of high
and low exchange rate fluctuations, the average exchange rate pass-through estimate would
be lower than normally expected. Based on the issues and discussion raised above, the
following hypothesis is generated for verification of the relationship between exchange rate
and export prices:

8
The average degree of exchange rate pass-through to the prices of any given export
product would be lower than expected due to the differences in exchange rate
volatilities and possible hedging activities, ceteris paribus.
Consequently, the empirical export pricing model is specified as:
0 1 , 1 2 3 4 , 1 5 .f f
ict c t ct ct i t t ictp e p gdp pc pg
where all variables are in natural log and in lower case italic; the subscripts i is the 4-digit
SIC industry; c is export destination country; t is time; ictp is export value in exporter’s
currency such as the U.S. dollar pricing by 4-digit SIC and by country destination over time;
, 1c te is the one-year-lagged bilateral nominal exchange rate for source country (the U.S.)
against each destination; f
ctp is the price of foreign destination competing goods in destination
currency; f
ctgdp is foreign destination GDP in destination currency as a demand shifter;
, 1t tpc is the one-year-lagged U.S. producer price index including unit labor, raw material and
energy costs by 4-digit SIC over time; tpg is the U.S. productivity growth over time and
ict is a disturbance term. The partial derivatives are:
, 1 1( / ) 0;ict c tp e 2( / ) 0;f
ict ctp p 3( / ) 0;f
ict ctp gdp
, 1 4( / ) 0;ict i tp pc 5( / ) 0.ict tp pg
9
Methodology
The cross section and time series data are adopted to test the hypothesis. Due to a relatively
short sample period of annual data (1974-1996), the cointegration analysis for a long run
pass-through relationship is not exercised. Breusch and Pagan Lagrangian multiplier tests for
random effects are performed. With a high value of 2 statistic and at 0% significant level,
all tests reject the null hypothesis assuming that the variance of the cross section (the SIC
industry) is zero. This means the individual differences from cross-sectional industries have
contributed to the various levels of a constant term. Therefore, only the balanced panel fixed
effect regression methodology is used to test the export pricing model.
The scatter plot of exchange rates over the sample period (1974-1996) shows a
mixture of high and low exchange-rate-fluctuation destinations. The exchange rates in the
first sub-sample (1974-1990) are not as volatile as in the second sub-sample (1990-1996).
The financial markets might not be fully developed in the first sub-sample period for
exporters to hedge their trade values. According to the hypothesis, the highly exchange-rate-
volatile period may yield low pass-through estimations while the less-volatile period may
level off the pass-through estimations that reflect the competition and the factors other than
the hedging engagements. Hence, the entire sample and two sub-sample periods are tested
using pooled time series and cross sections or a panel data estimation method.
III. Analysis of Empirical Results
The sample is somewhat limited due to data availability and compatibility considerations.
The unit of observation is the export price of a U.S. industry in a given year to an export
destination because the individual firm data are unavailable. In additional, the linked export

10
pricing dataset is constrained by some key variables such as the values of U.S. domestic
shipment and U.S. factor productivity. These are only available in the 1972 SIC
manufacturing product industries. The dataset is also restricted by the launch of a floating
exchange regime from 1971 to 1973 for most countries and the 1997 Asian financial crisis.
Thus, the best available annual U.S. export data to 69 export destinations across 111 four-
digit Standard Industrial Classification (SIC) industries during 1974 and 1996 are collected.
This data set allows the bilateral nominal exchange rates to be used in this pass-through
study. A balanced panel and bilateral export dataset contains 81,374 observations.
The F statistics in Table 2 are statistically significant at less than 1% level for all three
models with different sample periods: 1974-1996, 1974-1990 and 1990-1996. The testing
indicates that all three regression models properly include and control the variables which
determine the export pricing. The estimation results of the average manufacturing industry-
level pass-through coefficients are consistent with the hypothesis. Column 1 shows that the
coefficient estimate of EXCHANGERATE ( 1 ) or the average pass-through elasticity
estimation across all industries from the entire sample (1974-1996) is zero or statistically
insignificant. Note that the average pass-through elasticity estimation is marginally
significant at 10 % level in the low exchange-rate-fluctuation sample (Column 2) while
insignificant in the high exchange-rate-fluctuation sample (Column 3). The aggregation issue
of combining the two sub-samples may explain the neutralized results in the aggregate export
pricing model pass-through estimation (Column 1).
A zero pass-through in 1974-1996 means that the average export prices in the U.S.
dollar for all industries are unresponsive to the exchange rate movements to 69 U.S. trade
destinations. Assuming a zero markup adjustment, when the U.S. dollar appreciates by
100%, the destination currency price of the U.S. exports may increase by 100%. However, if
the importers of the U.S. exports adjust the markup downward to prevent losing a market
11
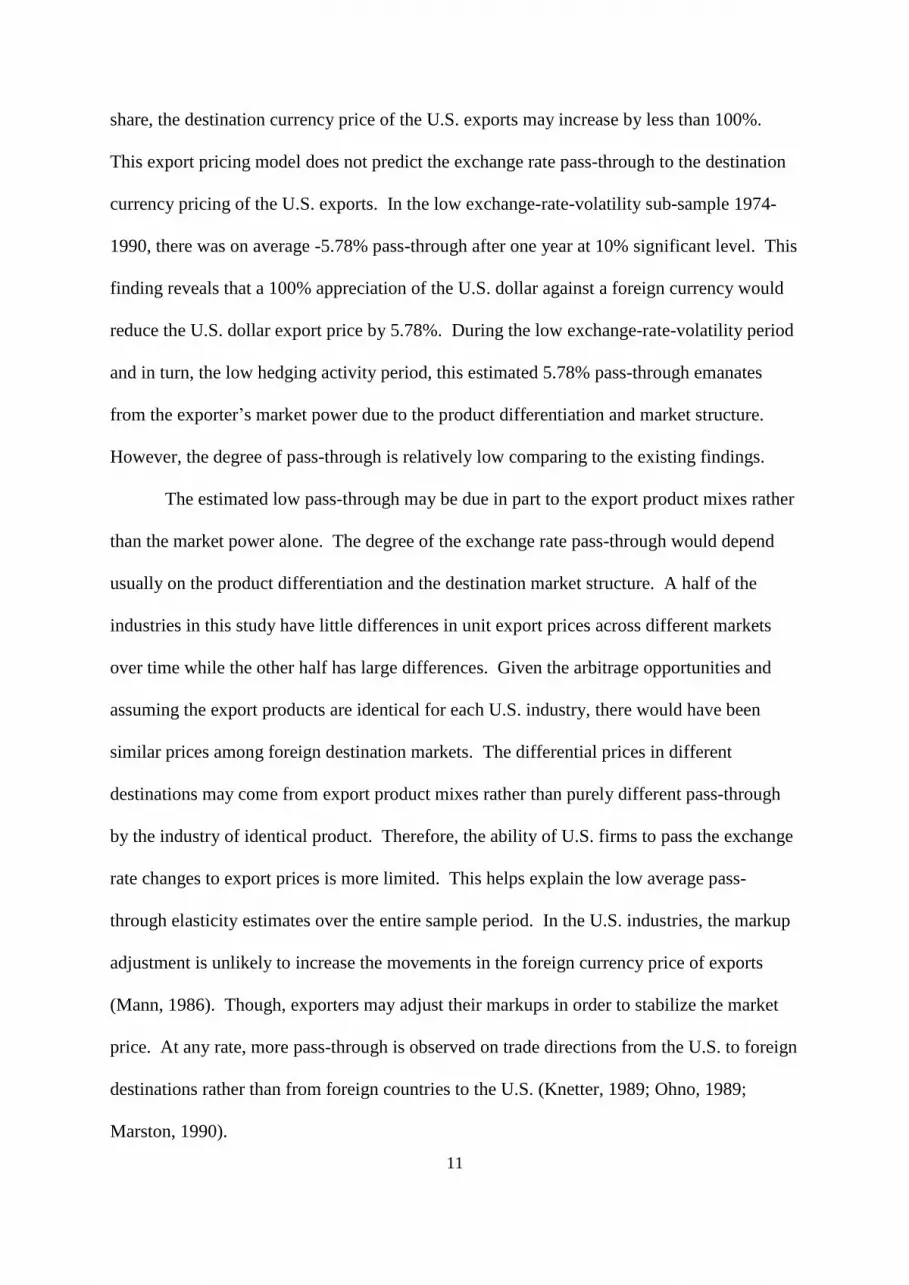
share, the destination currency price of the U.S. exports may increase by less than 100%.
This export pricing model does not predict the exchange rate pass-through to the destination
currency pricing of the U.S. exports. In the low exchange-rate-volatility sub-sample 1974-
1990, there was on average -5.78% pass-through after one year at 10% significant level. This
finding reveals that a 100% appreciation of the U.S. dollar against a foreign currency would
reduce the U.S. dollar export price by 5.78%. During the low exchange-rate-volatility period
and in turn, the low hedging activity period, this estimated 5.78% pass-through emanates
from the exporter’s market power due to the product differentiation and market structure.
However, the degree of pass-through is relatively low comparing to the existing findings.
The estimated low pass-through may be due in part to the export product mixes rather
than the market power alone. The degree of the exchange rate pass-through would depend
usually on the product differentiation and the destination market structure. A half of the
industries in this study have little differences in unit export prices across different markets
over time while the other half has large differences. Given the arbitrage opportunities and
assuming the export products are identical for each U.S. industry, there would have been
similar prices among foreign destination markets. The differential prices in different
destinations may come from export product mixes rather than purely different pass-through
by the industry of identical product. Therefore, the ability of U.S. firms to pass the exchange
rate changes to export prices is more limited. This helps explain the low average pass-
through elasticity estimates over the entire sample period. In the U.S. industries, the markup
adjustment is unlikely to increase the movements in the foreign currency price of exports
(Mann, 1986). Though, exporters may adjust their markups in order to stabilize the market
price. At any rate, more pass-through is observed on trade directions from the U.S. to foreign
destinations rather than from foreign countries to the U.S. (Knetter, 1989; Ohno, 1989;
Marston, 1990).

12
Other control variables are all significant with the correct signs except the foreign
demand variable (foreign GDP). The estimates confirm that the higher the foreign
competitor’s prices and the higher the cost of production, the higher the U.S. dollar unit
export prices in all sample periods. Furthermore, the productivity growth reduces the export
prices in all samples. However, the foreign demand actually reduces prices, which is not
economically intuitive.
IV. Conclusions
An average zero or insignificant pass-through estimate for all industries in the highly
exchange-rate-fluctuation sub-sample of 1990-1996 confirms the theoretical prediction. The
possible high hedging engagements in this period of high exchange risk disconnect the
relationship between exchange rate movements and export pricing. Any willingness to pass
changes in exchange rates to export price has been eliminated by possibly hedging on export
contract values. This important finding points out that the resulting zero pass-through
estimation might be explained in the existing literature to have the lack of the ability rather
than the willingness to pass the cost shocks to prices instead of other factors such as hedging
possibility. The exporters trading with highly exchange-rate-fluctuation foreign destinations
usually face a larger exchange risk and therefore would be more likely to protect their trade
contract values by involving in some hedging activities, thus a low pass-through should
result. Consequently, the exporters trading with a low exchange-rate-fluctuation environment
facing a low exchange risk would be less likely to invest in hedging on the trade contract
values. Further research may be specifically directed at tariff pass-through to import prices
presented by Feenstra (1989) in a more nuanced study of the exchange rate pass-through.

13
More and better data can be gathered to calibrate the model, especially to characterize the
outside U.S. economy.
References
Athukorala, P. & Menon, J. (1994). Pricing to market behavior and exchange rate pass-
through in Japanese exports, the Economic Journal, 104, 271-281.
Athukorala, P. (1991). Exchange rates pass-through: the case of Korean exports of
manufactures, Economics Letters, 35 (1), 79-84.
Caselli, P. (1996). Pass-through and export prices: an empirical test for the leading European
countries, International Review of Applied Economics, 10 (2), 249-261.
Dunn, R. M. (1970). Flexible exchange rates and oligopoly pricing: a study of Canadian
markets, Journal of Political Economy, 78, 140-151.
Feenstra, R. C. (1989). Symmetric pass-through of tariffs and exchange rates under imperfect
competition: an empirical test, Journal of International Economics, 27, 25-45.
Feinberg, R. M. (1986). The interaction of foreign exchange and market power effects on
German domestic prices, Journal of Industrial Economics, 35 (1), 61-70.
Feinberg, R. M. (1989). The effects of foreign exchange movements on U.S. domestic prices,
the Review of Economics and Statistics, 71, 505-511.
Feinberg, R. M. (1996). A simultaneous analysis of exchange-rate passthrough into prices of
imperfectly substitutable domestic and import goods, International Review of
Economics and Finance, 5 (4), 407-416.
Giovannini, A. (1988). Exchange rates and traded goods prices, Journal of International
Economics, 24, 45-68.

14
Isard, P. (1977). How far can we push the ‘law of one price?’ The American Economic
Review, 67, 942-948.
Knetter, M. M. (1989). Price discrimination by U.S. and German exporters, the American
Economic Review, 79 (1), 198-210.
Kravis, I. B. & Lipsey, R. E. (1977). Export prices and the transmission of inflation, the
American Economic Review, 67, 155-163.
Mann, C. L. (1986). Prices, profit margins, and exchange rates, Federal Reserve Bulletin, 72,
366-379.
Marston, R. C. (1990). Pricing to market in Japanese manufacturing, Journal of International
Economics, 29, 217-236.
Menon, J. (1991). Exchange rate changes and the pricing of Australian manufactured exports,
IAESR Working Paper Series, 387, University of Melbourne.
Menon, J. (1996). The degree and determinations of exchange rate pass-through: market
structure, non-tariff barriers and multinational corporations, the Economic Journal,
106, 434-444.
Ohno, K. (1989). Export pricing behavior of manufacturing: a U.S.-Japan comparison,
International Monetary Fund Staff Papers, 36 (3), 550-579.
Parsley, D. C. (1993). Exchange rate pass-through: evidence from aggregate Japanese
exports, Southern Economic Journal, 60 (2), 454-462.
Rahman, J. (1998). Exchange rate pass-through for exports: a cross-country, cross-product
analysis, Ph.D. thesis, American University.
Richardson, J. D. (1978). Some empirical evidence on commodity arbitrage and the law of
one price, Journal of International Economics, 8, 341-351.
15
Table 1: Review of Selected Pass-Through Coefficient Estimations (%) – Japan Manufacturing Industry Exports
Industry
Ohno (1989) Parsley (1993) Athukorala and
Menon (1994)
Samples 1977:4-1987:3
Quarterly
1980-1988
Annual
1980:1-1992:1
Quarterly
Chemicals 0.0 0.0 42.1
Electrical Machinery 77.0 0.0 45.5
Textiles 16.3 4.3
Transportation Equipment 78.0 26.0 53.3
General Machinery 77.0 0.0 42.3
Metal Products 74.0 20.3 4.8
Aggregate 76.5 18.4 66.9
Table 2: The Export Pricing Model Estimations with Fixed Effect (All Variables Are in Natural Logarithm)
(1) (2) (3)
Variables
Aggregate
(1974-1996)
Low Volatility
(1974-1990)
High Volatility
(1990-1996)
CONSTANT 0.0015 (0.802) 0.0054 (0.445) 0.0032 (0.852)
EXCHANGERATE -0.0178 (0.466) -0.0578 (0.083) * 0.0560 (0.150)
FOREIGNPRICE 0.1070 (0.005) *** 0.1489 (0.001) *** 0.0717 (0.500)
FOREIGNDEMAND -0.1052 (0.018) ** -0.0823 (0.075) * -0.7710 (0.009) ***
PRODCOST 0.1314 (0.000) *** 0.0984 (0.003) *** 0.6678 (0.000) ***
PRODUCTIVITYGROWTH -0.2905 (0.000) *** -0.2715 (0.000) *** -0.4647 (0.000) ***
Observations 81,374 60,146 24,766
R-Squared (within) 0.0008 0.0008 0.0023
F(5,77831) = 12.49
(0.000)
*** F(5,56603) = 8.88
(0.000)
*** F(5,21223) = 9.94
(0.000)
***
Breusch and Pagan LM Test
for Random Effects
χ2 = 1,309.73
(0.000)
*** χ2 = 1,311.63
(0.000)
*** χ2 = 1,163.56
(0.000)
***
Note:
a. EXCHANGERATE and PRODCOST are both one-year-lagged.
b. *, **, and *** are the significant levels at 10%, 5%, and 1% respectively.
c. The number in parenthesis is the probability value (p-value).