Embed Size (px)
Citation preview
67
PREVALENCE AND SONOGRAPHIC PATTERNS OF UTERINE FIBROID AMONG GHANAIAN WOMEN (Uterine Fibroid- The Ghanaian situation)
Eric Kwasi Ofori1a , William Kwadwo Antwi1 , Ekow Ansah Arthur 1 . Edmund Kwadwo Brakohiapa2, Benjamin
Dabo Sarkodie2, Dzefi-Tettey, Klenam2, Harriet Obeng2, Patrick KwadwoAdjei3, Jerry Coleman4 1&2Department of Radiography, University of Ghana, Korle-Bu-Accra, Ghana 2Radiology
Department, Korle-Bu Teaching Hospital, Korle-Bu-Accra, Ghana 3Department of Medicine, University of Ghana Medical School, Korle-Bu-Accra
4Department of Obstetrics and Gynaecology, Korle-Bu Teaching Hospital, Korle-Bu-Accra
E-mail: [email protected]
ABSTRACT Uterine fibroid represent a major public health problem and is regarded as the most common benign gynecologic tumors affecting premenopausal women. It is associated with considerable hospitalization and morbidity. The study aimed to establish the prevalence and characteristics of uterine fibroid among Ghanaian women. A retrospective cross-sectional study was carried out to analyze 584 trans-abdomino pelvic ultrasound images and reports of women (aged, 35.03 ± 6.64 years and range 20-74 years). The images and their corresponding reports were analyzed by a team of three sonographers concurrently. The number of fibroid nodules, location in the uterus, sonographic pattern and classification were assessed descriptively and inferentially using the statistical package for Social Scientists version 17. The average number of fibroid nodules, diameter and volume of the largest nodule were estimated as, 3.38 ± 1.30, 4.31cm ± 3.40 and 154.74 cm3 ±473.80 respectively. The study indicated that 24.50% (143/584) of the images evaluated had fibroid. The highest prevalence (53.80%) of the fibroid case was found among women aged 30-39 years and the lowest were recorded among women aged > 49 years. Forty-four (44) percent of the fibroids were intramural with only 5.60 % been submucosal. Most (59.40%) of the fibroids were located within the corpus of the uterus and the most popular (85.3%) pattern of presentation of the nodules was hypoechoic. The prevalence and sonographic pattern of uterine fibroid among Ghanaian women have been assessed which could aid in appropriate surgical interventions and treatment in the country. Keywords: Uterine Fibroid, Sonographic patterns, Classification INTRODUCTION Ultrasound is regarded as a first choice imaging modality in the field of gynecology1. During ultrasound scanning, both dynamic and static images can be produced and displayed as a spectrum. Ultrasound, which is non-ionizing radiation has no known adverse bio-effects and has excellent soft tissue and pelvic organ resolution and hence its preference in gynecological investigations. One common diagnostic investigation employing the use of ultrasound is uterine leiomyomas also referred to as myoma, fibromyoma, or fibroid. Uterine leiomyomas represent a major public health problem and the most common benign gynecologictumors affecting premenopausal women2,3and are often associated with considerable hospitalization and morbidity 4,5.Fibroid is considered as the most common masses of the female pelvis which is estimated to occur in 20-40% of women during their reproductive years6-7 and is believed that these tumors develop in the majority of American women and become symptomatic in one-third of these women2, 8. Fibroids are the most frequent indication for hysterectomy (abdominal and vaginal) and a
Volume 4, June 2012 Journal of Medical and Applied Biosciences
© 2012 Cenresin Publications www.cenresin.org ISSN 2277-0054
68
leading cause of hospitalizations for gynecologic disorders9,10, accounting for approximately one third of all procedures performed annually in the United States and is suggested that black women have a greater fibroid burden than whites 11-12. Although the etiology of fibroids remains unknown, the ovarian hormones estrogen and progesterone are hypothesized to enhance fibroid13-14. The exact data on prevalence of fibroid condition are lacking, primarily because of limited population-based research, varying symptomatologies15and differences in case definitions across studies.A population-based study16 in the United States found a cumulative incidence of uterine fibroids of greater than 66% by ultrasound examination of women approaching age 50 years. Statistics 16 from the Chinese Society of Health Management for nearly 500,000 adult Chinese women who had health examinations during the year 2008 showed a prevalence of ultrasound diagnosed uterine fibroids of 14.7%. It has been suggested that the natural history of fibroids is poorly understood, which makes it difficult to advise asymptomatic women with fibroids on the risk of developing clinical symptoms in the future5. Previous studies17 on fibroids have been focused on symptomatic white women, with limited study of African-American women or women with asymptomatic disease. Literature search both electronic and manual indicated a gap in terms of documentation on the prevalence of fibroid cases among Ghanaian women as well as effort to promote and create awareness on fibroid among the populace. It is against this backdrop that this study was undertaken to establish the prevalence and characteristics of uterine fibroid among Ghanaian women. The intention was to identify the sonographic patterns which could aid in appropriate surgical interventions that will solve the problem of spontaneous miscarriages among the Ghanaian women. MATERIALS AND METHODS A. Characteristics of the ultrasound machine used in the study The ultrasound scanning machineused in the study has the following characteristics;
• Mobile Ultrasound machine • Model: MINDRAY diagnostic ultrasound system. • Probe type: Curvilinear array transducer of frequency 3.5 MHz
B. Method: A retrospective cross sectional study was carried out to analyze 584 trans-abdominal pelvic ultrasound scan images of women aged >20years which were produced at Wellness Laboratories Ltd in Ghana. The images were produced between June and December, 2011 andwere stored in the memory drive of the ultrasound machine in the centre and the images and their associated reports were retrieved and analyzed. The number of fibroid nodules was recorded and to ensure consistency of measurement, only the largest fibroid nodule for each image was taken. The mean diameter (dm) of the largest nodule was
calculated as: dm= ��������
�, where d1, d2 and d3are the diameters of the largest nodule
measured in three perpendicular planes. The volume (V) of the largest fibroid nodule was
calculated using the formula for the volume of a sphere (V = ���
�). The locations of
individual fibroid in the uterus, sonographic pattern as well as its classification were assessed.
Eric Kwasi Ofori , William Kwadwo Antwi , Ekow Ansah Arthur Edmund Kwadwo Brakohiapa, Benjamin Dabo Sarkodie, Dzefi-Tettey, Klenam, Harriet Obeng, Patrick KwadwoAdjei and Jerry
Coleman,
Prevalence and Sonographic Patterns of Uterine Fibroid among Ghanaian Women (Uterine Fibroid- The Ghanaian Situation)
69
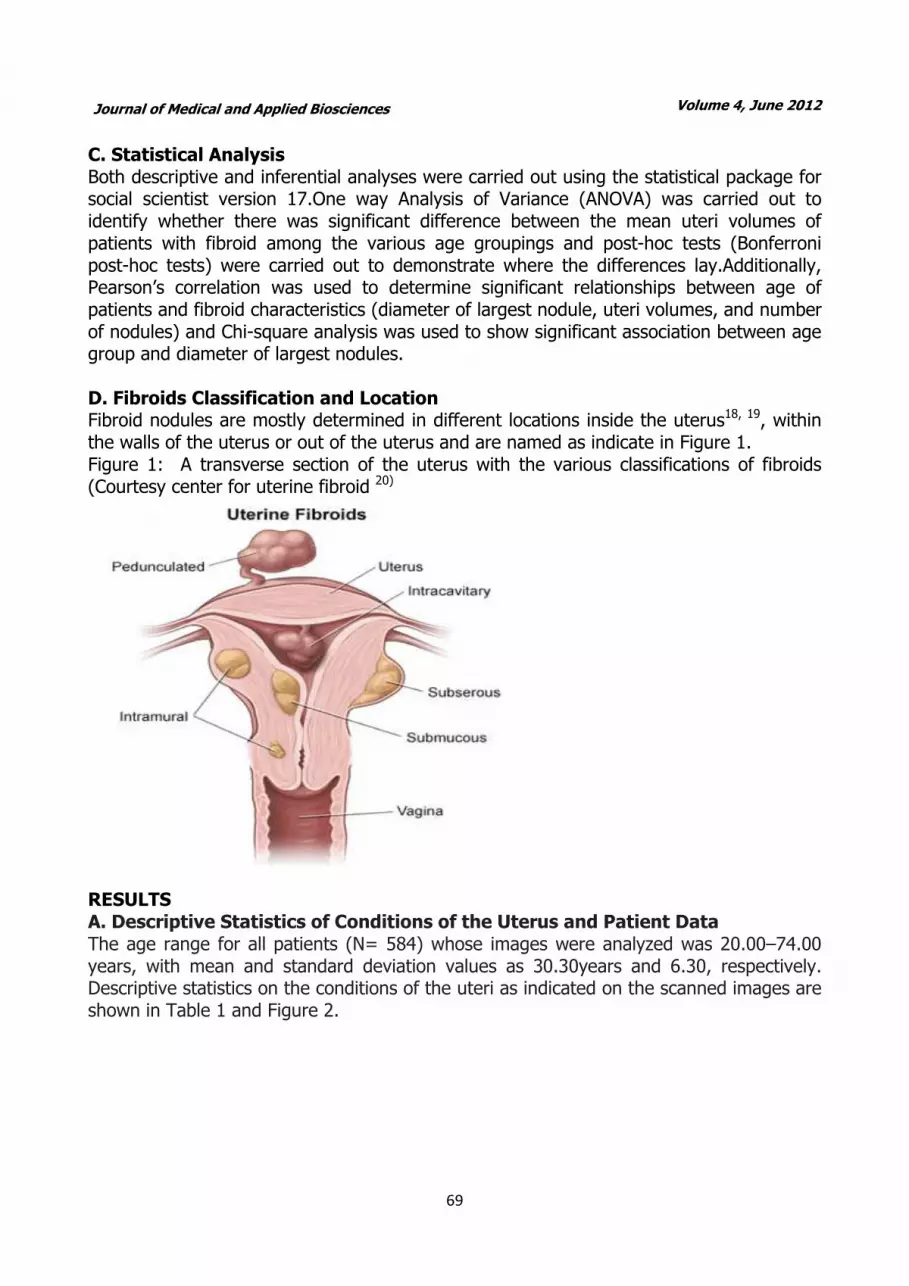
C. Statistical Analysis Both descriptive and inferential analyses were carried out using the statistical package for social scientist version 17.One way Analysis of Variance (ANOVA) was carried out to identify whether there was significant difference between the mean uteri volumes of patients with fibroid among the various age groupings and post-hoc tests (Bonferroni post-hoc tests) were carried out to demonstrate where the differences lay.Additionally, Pearson’s correlation was used to determine significant relationships between age of patients and fibroid characteristics (diameter of largest nodule, uteri volumes, and number of nodules) and Chi-square analysis was used to show significant association between age group and diameter of largest nodules. D. Fibroids Classification and Location Fibroid nodules are mostly determined in different locations inside the uterus18, 19, within the walls of the uterus or out of the uterus and are named as indicate in Figure 1. Figure 1: A transverse section of the uterus with the various classifications of fibroids (Courtesy center for uterine fibroid 20)
RESULTS A. Descriptive Statistics of Conditions of the Uterus and Patient Data The age range for all patients (N= 584) whose images were analyzed was 20.00–74.00 years, with mean and standard deviation values as 30.30years and 6.30, respectively. Descriptive statistics on the conditions of the uteri as indicated on the scanned images are shown in Table 1 and Figure 2.
Volume 4, June 2012 Journal of Medical and Applied Biosciences
70
Table 1: Frequency and percentage of findings of the conditions of the uterus
Uterus condition Frequency Percentage
Pregnancy only 223 38.20
Normal Empty 217 37.20
Fibroid only 122 20.90
Pregnancy with Fibroid
22 3.80
Total 584 100.00
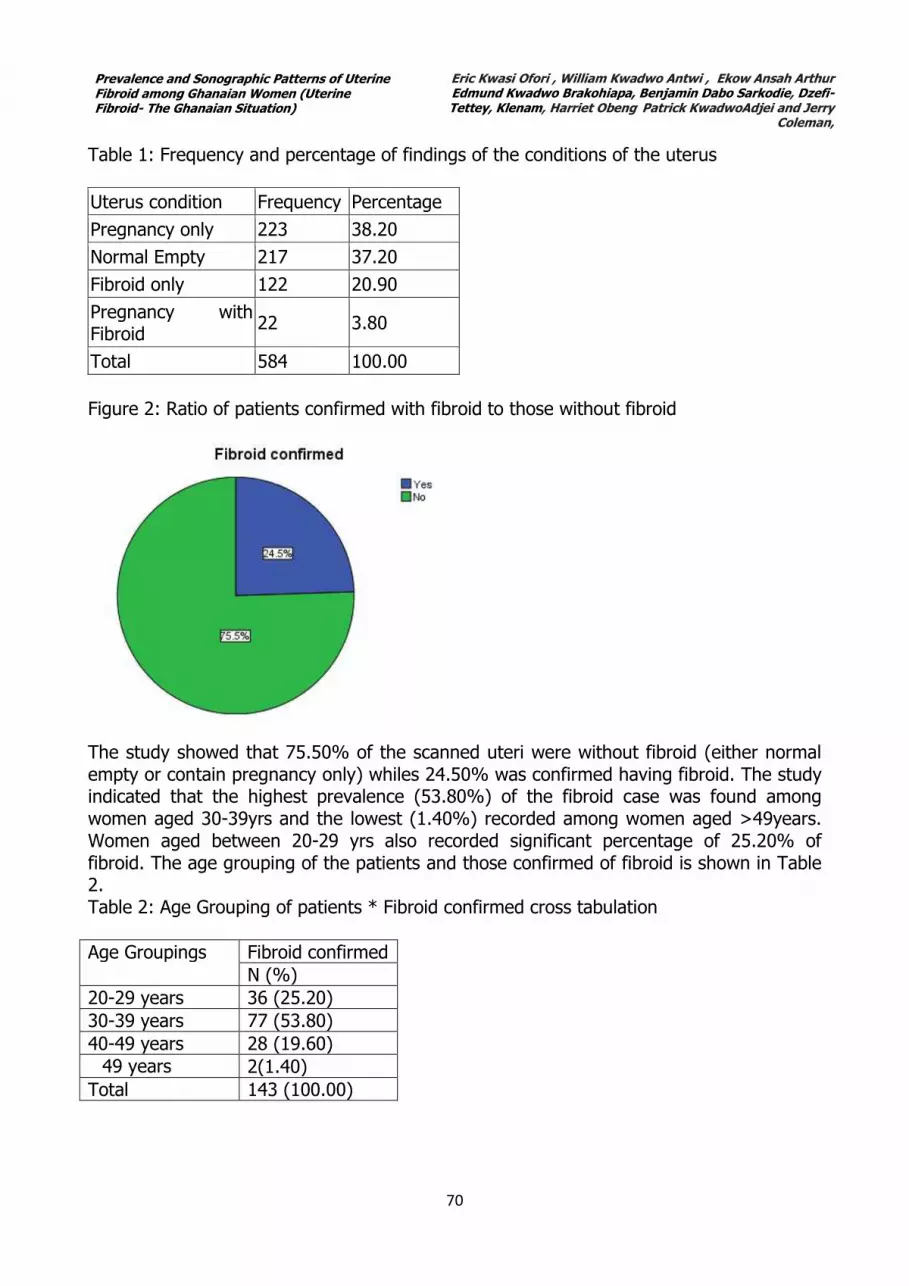
Figure 2: Ratio of patients confirmed with fibroid to those without fibroid
The study showed that 75.50% of the scanned uteri were without fibroid (either normal empty or contain pregnancy only) whiles 24.50% was confirmed having fibroid. The study indicated that the highest prevalence (53.80%) of the fibroid case was found among women aged 30-39yrs and the lowest (1.40%) recorded among women aged >49years. Women aged between 20-29 yrs also recorded significant percentage of 25.20% of fibroid. The age grouping of the patients and those confirmed of fibroid is shown in Table 2. Table 2: Age Grouping of patients * Fibroid confirmed cross tabulation
Age Groupings Fibroid confirmed
N (%)
20-29 years 36 (25.20)
30-39 years 77 (53.80)
40-49 years 28 (19.60)
�49 years 2(1.40)
Total 143 (100.00)
Eric Kwasi Ofori , William Kwadwo Antwi , Ekow Ansah Arthur Edmund Kwadwo Brakohiapa, Benjamin Dabo Sarkodie, Dzefi-Tettey, Klenam, Harriet Obeng, Patrick KwadwoAdjei and Jerry
Coleman,
Prevalence and Sonographic Patterns of Uterine Fibroid among Ghanaian Women (Uterine Fibroid- The Ghanaian Situation)
71
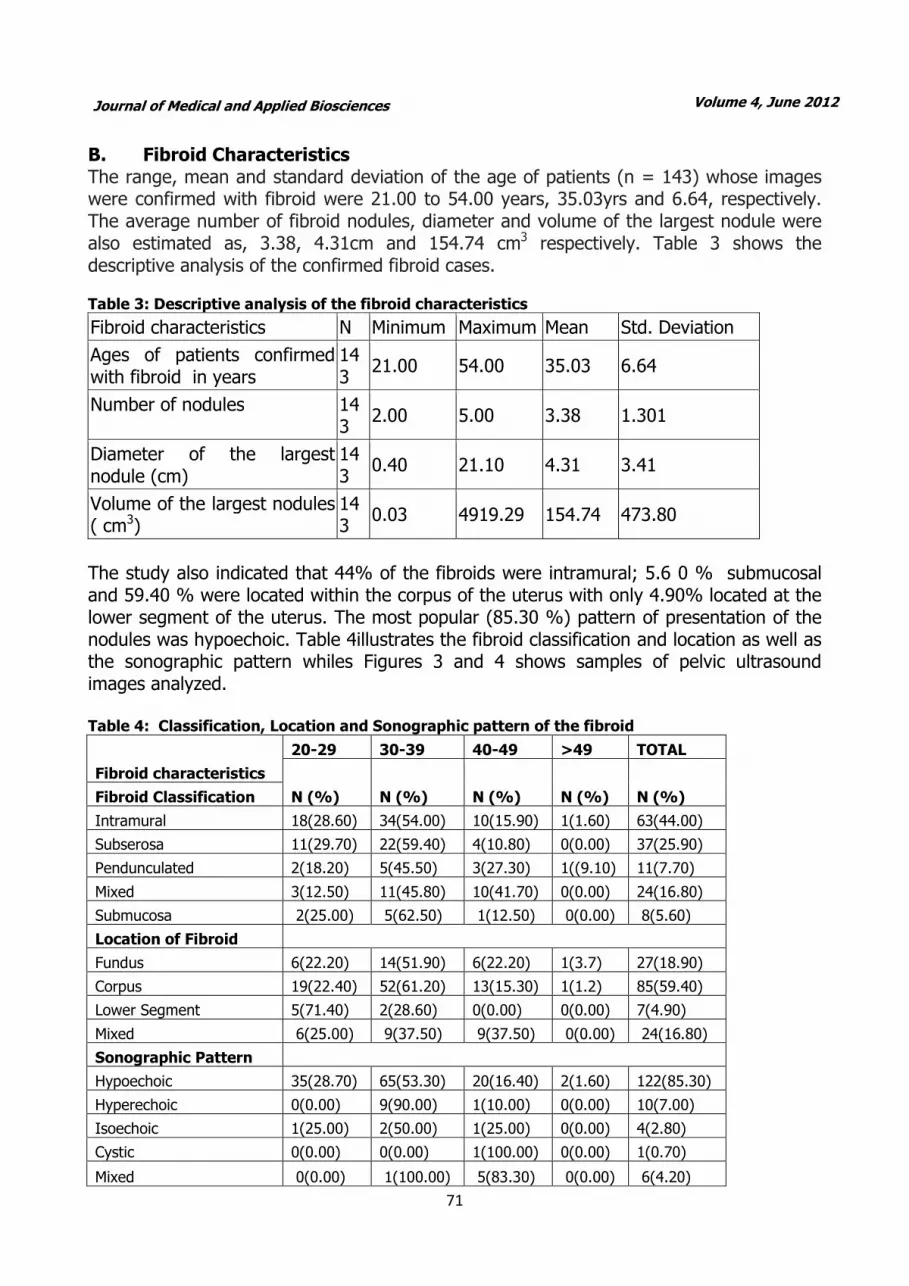
B. Fibroid Characteristics The range, mean and standard deviation of the age of patients (n = 143) whose images were confirmed with fibroid were 21.00 to 54.00 years, 35.03yrs and 6.64, respectively. The average number of fibroid nodules, diameter and volume of the largest nodule were also estimated as, 3.38, 4.31cm and 154.74 cm3 respectively. Table 3 shows the descriptive analysis of the confirmed fibroid cases.
Table 3: Descriptive analysis of the fibroid characteristics
Fibroid characteristics N Minimum Maximum Mean Std. Deviation
Ages of patients confirmed with fibroid in years
143
21.00 54.00 35.03 6.64
Number of nodules 143
2.00 5.00 3.38 1.301
Diameter of the largest nodule (cm)
143
0.40 21.10 4.31 3.41
Volume of the largest nodules ( cm3)
143
0.03 4919.29 154.74 473.80
The study also indicated that 44% of the fibroids were intramural; 5.6 0 % submucosal and 59.40 % were located within the corpus of the uterus with only 4.90% located at the lower segment of the uterus. The most popular (85.30 %) pattern of presentation of the nodules was hypoechoic. Table 4illustrates the fibroid classification and location as well as the sonographic pattern whiles Figures 3 and 4 shows samples of pelvic ultrasound images analyzed. Table 4: Classification, Location and Sonographic pattern of the fibroid
Fibroid characteristics
20-29 30-39 40-49 >49 TOTAL
N (%) N (%) N (%) N (%) N (%) Fibroid Classification
Intramural 18(28.60) 34(54.00) 10(15.90) 1(1.60) 63(44.00)
Subserosa 11(29.70) 22(59.40) 4(10.80) 0(0.00) 37(25.90)
Pendunculated 2(18.20) 5(45.50) 3(27.30) 1((9.10) 11(7.70)
Mixed 3(12.50) 11(45.80) 10(41.70) 0(0.00) 24(16.80)
Submucosa 2(25.00) 5(62.50) 1(12.50) 0(0.00) 8(5.60)
Location of Fibroid
Fundus 6(22.20) 14(51.90) 6(22.20) 1(3.7) 27(18.90)
Corpus 19(22.40) 52(61.20) 13(15.30) 1(1.2) 85(59.40)
Lower Segment 5(71.40) 2(28.60) 0(0.00) 0(0.00) 7(4.90)
Mixed 6(25.00) 9(37.50) 9(37.50) 0(0.00) 24(16.80)
Sonographic Pattern
Hypoechoic 35(28.70) 65(53.30) 20(16.40) 2(1.60) 122(85.30)
Hyperechoic 0(0.00) 9(90.00) 1(10.00) 0(0.00) 10(7.00)
Isoechoic 1(25.00) 2(50.00) 1(25.00) 0(0.00) 4(2.80)
Cystic 0(0.00) 0(0.00) 1(100.00) 0(0.00) 1(0.70)
Mixed 0(0.00) 1(100.00) 5(83.30) 0(0.00) 6(4.20)
Volume 4, June 2012 Journal of Medical and Applied Biosciences

72
Figure 3: A pelvic scan image without fibroid
Figure 4: Pelvic scan image with uterine fibroid
C: Analysis of mean differences and correlation Analysis of Variance (ANOVA) was carried out to identify whether there was significant difference between the mean uteri volumesof patients with fibroid among the various age groupings. There was significant difference in the mean uteri volumes of patients withfibroid among the four age groups (f= 4.042; p= 0.009). However the mean number of nodules did not show significant difference among the age groups as shown in Table 5.
Eric Kwasi Ofori , William Kwadwo Antwi , Ekow Ansah Arthur Edmund Kwadwo Brakohiapa, Benjamin Dabo Sarkodie, Dzefi-Tettey, Klenam, Harriet Obeng, Patrick KwadwoAdjei and Jerry
Coleman,
Prevalence and Sonographic Patterns of Uterine Fibroid among Ghanaian Women (Uterine Fibroid- The Ghanaian Situation)

73
Table 5: Analysis of variance (ANOVA) of the prevalence of the fibroid characteristics (number
of nodules and uteri volumes) among the age groupings
Fibroid Characteristics Age Group N Mean Std. dev F-value P-value
Number of nodules
20-29 years 36 3.11 1.28
1.272
0.286
30-39 years 77 3.38 1.32
40-49 years 28 3.75 1.24
>49 years 2 3.50 2.12
Total 143 3.38 1.31
Volume of the uterus 20-29 years 36 99.80 85.47
4.042
0.009
Additionally, post-hoc tests were carried out to demonstrate where the differences lay (Bonferroni post-hoc tests). The findings show that there was significance difference between the mean uteri volumes of patients with fibroid in the age groups 30-39 yrs and 40-49 yrs (p= 0.009). However, all the other age groups were not significant as shown in Table 6. Table 6: Post hoc test (Bonferroni) of the prevalence of the fibroid characteristics (number of nodules and uteri volumes) among the age groupings
Dependent Variable
(I) Age Grouping of patients
(J) Age Grouping of patients
Mean Difference (I-J)
P-value 95% C.I.
Volume of uterus
20-29 years
30-39 years 15.674 1.000 -49.194 80.543
40-49 years -71.329 0.125 -152.953 10.296
>49 years 99.798 1.000 -133.123 332.719
30-39 years
20-29 years -15.674 1.000 -80.543 49.194
40-49 years -87.0032* 0.009 -158.834 -15.172
>49 years 84.123 1.000 -145.549 313.796
40-49 years
20-29 years 71.329 0.125 -10.296 152.953
30-39 years 87.0032* 0.009 15.172 158.834
>49 years 171.127 0.319 -63.829 406.082
>49 years
20-29 years -99.798 1.000 -332.719 133.123
30-39 years -84.123 1.000 -313.796 145.549
40-49 years -171.127 0.319 -406.082 63.829
Pearson’s correlation was used to determine significant relationships between age of patients and fibroid characteristics (diameter of largest nodule, uteri volumes, and number of nodules). Significant correlations were found between age and diameter of largest nodules (r = 0.209; p = 0.012) and number of nodules (r = 0.208; p= 0.012).Chi-square analysis showed significant association between age group and diameter of largest nodules (p = 0.025), location of fibroid (p = 0.050) and sonographic pattern (p = 0.009).
Volume 4, June 2012 Journal of Medical and Applied Biosciences

74
DISCUSSION A. Demography and Fibroid A total of 584 trans-abdominal pelvic ultrasound scanned images of women were analyzed out of which 143 representing 24.50% were confirmed to have fibroid. The finding is consistent with available data20 which suggest that fibroids are the most common pelvic tumour in women, causing symptoms in approximately 25% of reproductive age women with the overall prevalence of fibroids increasing to over 70%. The mean, standard deviation and range of the age of the sampled population (confirmed fibroid cases; n = 143) were 35.03 years, 6.64 and 21-54 years respectively. The study indicated that the highest prevalence (53.80%) of the fibroid cases was found among women aged 30-39 years and the lowest (1.40%) recorded among women aged greater than 49years. The current study showed that women aged between 20-29 years also recorded significant percentage of 25.20% of fibroid. The above results agree with similar findings conducted elsewhere20, 21 which suggest that uterine fibroid by sonography is very common among women in their late 30's and 40's and usually shrink after menopause with a prevalence of two to five times more in black women than white women. This study however, is in contrast with that of Lurie et a.l, (2005)22 which estimated the prevalence of uterine fibroid as 4% in women aged 20-30 years, 11 to 18% in women between 30-40 years and 33% in women between 40-60 years. Having fibroids much younger may be related to a strong family history and the increased risk of uterine leiomyoma in people of African descent. In the lower age group, this may result in infertility and problems with childbearing. The recorded situation in Ghana is worrying in view of health and other risk implications. Fibroid has social, economic and medical implications in the women populace. Premenopausal women (18-45yrs) in Ghana constitute about 40% of the Ghanaian population23 and are strong component of the country’s workforce and thus contribute immensely to the economy. Their role in the development of the economy therefore cannot be over emphasised. The Ghanaian woman is engaged in government and non-governmental businesses and has seen a tremendous growth which is an indication that women are gradually taking up more equally demanding responsibilities aside their traditional roles24. Therefore managing the health of the Ghanaian woman is essential for the socio-economic growth of the country. Fibroids can cause a wide range of clinical symptoms such as heavy menstrual periods, pressure symptoms to surrounding organs and infertility problems25 and are associated with spontaneous miscarriages 26. Fibroid tumours are asymptomatic and could be associated with menorrhagia, pelvic pain, urinary obstructive symptoms, infertility, and pregnancy loss27.The clinical convention symptoms and the need for treatment are directly linked to the type of fibroid, the position of the fibroid, and the size of the fibroid27. B. Fibroid Characteristics The average number of fibroid nodules, diameter and volume of the largest nodule were estimated as, 3.38, 4.31cm and 154.74 cm3 respectively. In women of child bearing age this may be associated with frequent miscarriages and may also be a cause of dysmenorrhea and menorrhagia. Significant correlations were found between age and diameter of largest nodules (r = 0.209; p = 0.012) and number of nodules (r = 0.208; p= 0.012). This lends credence to the fact that fibroids are responsive to the reproductive
Eric Kwasi Ofori , William Kwadwo Antwi , Ekow Ansah Arthur Edmund Kwadwo Brakohiapa, Benjamin Dabo Sarkodie, Dzefi-Tettey, Klenam, Harriet Obeng, Patrick KwadwoAdjei and Jerry
Coleman,
Prevalence and Sonographic Patterns of Uterine Fibroid among Ghanaian Women (Uterine Fibroid- The Ghanaian Situation)

75
hormones estrogen and progesterone 28. In premenopausal women, larger fibroid sizes are expected. Growing evidence 6 suggest that fibroids grow from tiny uterine muscle cells and may be initially diagnosed by an imaging procedure as small nodules and can grow to larger sizes where they are palpated through the abdominal wall with size ranging from 2 to 7.5 cm. Moreover, fibroids can be present without showing any symptom in many women and on the average, six to seven fibroid nodules may be detected on the affected uterus 20.The average number (3.38) of nodules recorded in the sample population is lower than reported. Evidence from other studies also indicates that black women are more likely to have larger and more symptomatic tumors than white women 29
The results presented herein show that there were significant association between age group and diameter of largest nodules (p = 0.025), location of fibroid (p = 0.050) and sonographic pattern (p = 0.009) and is confirmed by Evans and Brunsel ( 2007) 26 who observed that uterine fibroid increases with age and may occur in 30% of women between 40-60 years of age. The results of the study also indicated that 63 out of 143 (44 %) of the fibroids were intramural with only 5.60% been submucosal. Fibroids are muscular in origin which therefore follows that they may be more intramural leiomyoma’s compared to the rest. Most (59.40%) of the fibroids were located within the corpus of the uterus with only 4.9 % located at the lower segment of the uterus. The corpus is the commonest site for location of intrmural fibroids and corroborates the results of earlier studies. The most popular (85.3%) pattern of presentation (sonographic) of the nodules was hypoechoic. The hypo echogenic nodules reflect the younger age of onset and thus less calcification in the nodules. Fibroid nodules are mostly determined in different locations inside the uterus, within the walls of the uterus or out of the uterus27, 30. Intra-mural fibroids located entirely within the uterine wall are noted to be the most common classification. This was consistent with the current study. Sub-mucosal fibroids which recorded the least (5.6%) is located beneath the mucosa or the endometrial lining of the uterus which is indirectly adjacent to the uterine cavity and are clinically noted 27,30 as the greatest cause of irregular bleeding and reproductive out comes due to their closeness to the endometrium and also distort the endometrial lining based on their size. This often results in problems with implantation of the embryo and bleeding. Sub-serosal fibroids recorded the second highest (25.9%). It lies beneath the serosa as they are located at the outer layer of the uterus and distend to distort the outer contour of the uterus. The pedunculated which recorded 7.7% of all the fibroid cases are noted to be attached to the uterus by a stalk and usually grow bigger into the abdomen27. Hypo echoic pattern of fibroid nodules was the most common recorded fibroid (85.3%). This finding was consistent with previous studies 31as themost common (79%) echo pattern noted in diagnosed fibroid nodules using sonography and followed by mixed (heterogeneous) echo texture (14.3%). Child bearing plays a pivotal role in the Ghanaian family32 system which makes infertility a key health and social concern because women in this category could face stigmatization. Fibroids create marital problems relating to intercourse due to frequent and excessive bleeding, blood changes associated with menstrual cramps and heavy bleeds and therefore a health condition that requires attention.
Volume 4, June 2012 Journal of Medical and Applied Biosciences
76
The study has shown the prevalence rate of fibroid among Ghanaian women as 24.5% and the most popular (85.3%) pattern of presentation of the fibroid nodules among the Ghanaian women washypoechoicwith 44% of the fibroids been intramural. The presented hereincould aid in appropriate surgical interventions that will contribute to the provision of high-quality care in the country. The findings of this study demonstrate the importance of creating awareness on fibroid among the clinicians in Ghana in order to improve the quality of diagnosis and the need of implementing appropriate quality measures that will contribute to the provision of high-quality care in the country. ACKNOWLEDGMENTS The authors acknowledge the support and cooperation received from the staff of the Wellness Laboratories Ltd in Ghana for access to the ultrasounds images and reports used for this study. We are also grateful toDavid Nana Adjei of School of Allied Health Sciences and Professor A. Adjei of University of Ghana for their support. Disclosure Statement: This research work was self-financed by the authors. No Company or Institution hasany financial interest or conflict of interest whatsoever. REFERENCE
1. Ratha, J., and Ramar, K. (2010).Segmentation and feature extraction of fluid – filled uterine fibroid- Knowledge based approach, 1905-7873.
2. Northington GM, Arya LA (2006) Uterine Leiomyoma.Obstetrics and
Gynecology. Board Review Manual. Obstetrics and Gynecology Volume 10, Part 1
3. Goodwin S.C, Spices J.B, Worthington-Kirsch R, Peterson E, Prong Li S., Myers E.R (2008). Uterine Artery Embplization For Treatment of leiomyomata: Long Term Out comes From Fibroid Registry. Obset. Gynecol. 111(1): 22-33.
4. Lumsden, M.A. (2010). Morden Management of fibroids.Obstetrics,Gynaecology And Reproductive Medicine. 20:3 Gynecol vol.188, no. 1.
5. Flake GP, Andersen J, Dixon D (2003) Etiology and Pathogenesis of Uterine Leiomyomas: A Review. Environmental Health Perspectives 2003; 111:1037-1054
6. Viswanathan, M., Hartmann K., McKoy, N., et al. (2007).Management of Uterine Fibroids: An update of evidence. Agency for Healthcare Research and Quality (AHRQ): Summary, Evidence Report/Technology Assessment: Number 154. AHRQ Publication No. 01-E051.
7. Akinnyemi B.O, Adewoye B.R, Fakya T.A (2004).Uterine fibroid; a review. Nigerian Journal of Medicine, vol. 13, no. 4, pp. 318-329.
8. Flake GP, Andersen J, Dixon D (2003) Etiology and Pathogenesis of Uterine
Leiomyomas: A Review. Environmental Health Perspectives 2003; 111:1037-1054
Eric Kwasi Ofori , William Kwadwo Antwi , Ekow Ansah Arthur Edmund Kwadwo Brakohiapa, Benjamin Dabo Sarkodie, Dzefi-Tettey, Klenam, Harriet Obeng, Patrick KwadwoAdjei and Jerry
Coleman,
Prevalence and Sonographic Patterns of Uterine Fibroid among Ghanaian Women (Uterine Fibroid- The Ghanaian Situation)
77
9. Velebil P, Wingo PA, Xia Z, et al (1995)Rate of hospitalization for gynecologic disorders among reproductive-age women in the United States. Obstet Gynecology 1995;86:764–9.
10. Wilcox LS, Koonin LM, Polras R, et al. (1994) Hysterectomy in the United States, 1988–1990.Obstet Gynecology 1994;83:549–55.
11. Chao-Ru C, Germaine M. B, Norman G. C, Kimberly M. P, and Jean W-
W(2001)Risk Factors for Uterine Fibroids among Women Undergoing Tubal Sterilization. American Journal of Epidemiology (153):1. USA
12. Peddada SD, Laughlin SK, Miner K, Guyon JP, Haneke K, Vahdat HL, Semelka RC, Kowalik A, Armao D, Davis B, Baird DD.Growth of uterine leiomyomata among premenopausal black and white women. ProcNatlAcadSci USA 2008; 105:19887-19892.
13. Goodwin S.C, Spices J.B, Worthington-Kirsch R, Peterson E, Prong Li S., Myers E.R (2008). Uterine Artery EmbplizationFor Treatment of leiomyomata: Long Term Out comes From Fibroid Registry. Obset. Gynecol. 111(1): 22-33.
14. Blake RE. (2007). Leiomyomata uteri: hormonal and molecular determinants of growth. J Natl Med Association; 99:1170-1184.
15. Vollenhoven BJ, Lawrence AS, Healy DL. 1990. Uterine fibroids: a clinical review. Br J ObstetGynaecol 97:285–298
16. Wu Hai-Yun, Ling-Ling Yang, Shan Zhou (2010)Impact of periodic health examination on surgical treatment for uterine fibroids in Beijing: a case control study.BMC Health Services Research 2010, 10:329. http://www.biomedcentral.com/1472-6963/10/329.
17. Kjerulff KH, Langenberg P, Seidman JD, Stolley PD, Guzinski GM. 1996. Uterine leiomyomas. Racial differences in severity, symptoms and age at diagnosis. J Reprod Med 41:483–490.
18. Sagba F (2010). Uterine Leiomyoma: Urogenital, Obstetrics and Gynecology. Tag. Uterus Article ID 10915. Radiopaedia. Org.
19. Evans P, Brunsel S (2007). Uterine fibroid tumors : Diagnosis And Treatment. Am Fam Physician.75;1503-8.Georgetown University-Providence Hospital Family Practice Residency Program, 4151 Bladensburg Rd., Colmar Manor, MD 20722.
20. Center for Fibroids (2008).Brigham and Women’s Hospital 77 Avenue Louis Pasteur New Research Building. Boston, MA 02115.
21. Baird D.D., Dunson D.B, Hill M.C, Cousin D, SchectmanJ.M(2003). High Commulative Incidence of Uterine Leiomyoma In Black And White Women :Ultrasound Evidence. AmJObstetGynecol 188:100-7.
Volume 4, June 2012 Journal of Medical and Applied Biosciences
78
22. Lurie S, Piper I, Woliovitch I, GleZeman M (2005). Age Related prevalence of Sonographically Confirmed Uterine Myoma. J ObstetGynaecol 25:42-4.
23. Ghana Statistical Services (GSS), Noguchi Memorial Institute for Medical Research (NMIMR), and ORC Macro.Ghana demographic and health survey 2003. Calverton, Maryland: GSS, NMIMR and ORC Macro; 2004. P.11. Accessed from: http://www.measuredhs.com. Available by email from: [email protected]
24. Ghana Statistical Service (2006).Women and Men in Ghana: A Statistical Compendium.P.62.
25. Fiore K. (2011). Fibroid Surgery May Up Birth Rates After Recurrent Miscarriage. Medpage Today UK.
26. Parker WH. (2007). Etiology, symptomatology, and diagnosis of uterinemyomas. FertilSteril 2007; 87:725-736.
27. Evans P, Brunsel S (2007). Uterine fibroid tumors : Diagnosis And Treatment Am Fam Physicianl;75;150-8.
28. Strissel P. L, Swiatek J, Oppelt P, Renner S. P, Beckmann M. W and Strick R. (2007).Transcriptional analysis of steroid hormone receptors in smooth muscle uterine leiomyoma tumours of postmenopausal patients. Journal of Steroid Biochemistry and Molecular Biology. vol. 107, no. 1-2, pp. 42–47
29. Ligon A.H, Morton C.C (2001). Leiomyomata: heritability and cytogenetic studies.Hum Reprod Update 7:8-14
30. Sagba F (2010). Uterine Leiomyoma: Urogenital, Obstetrics andGynaecology. Tag. Uterus Article ID 10915. Radiopaedia. Org.
31. Samir F. A. A and Mohammed k. A. (2011). Behaviour of Leiomyoma during Pregnancy as Evaluated by Ultrasound. Obstetrics and Gynecology Dept. and Radilogy Dept. Al-Azhar University.
32. Fledderjohann JJ. (2012).‘Zero is not good for me”: implications of infertility in Ghana. Hum Reprod. 27(5):1383-90. Epub 2012 Feb 21.
Figure Legend Figure 1: A transverse section of the uterus with the various classifications of fibroids (Courtesy center for uterine fibroid 20) Figure 2: Ratio of patients confirmed with fibroid to those without fibroid Figure 3: A Pelvic scan image without fibroid Figure 4: A Pelvic scan image with uterine fibroid
Eric Kwasi Ofori , William Kwadwo Antwi , Ekow Ansah Arthur Edmund Kwadwo Brakohiapa, Benjamin Dabo Sarkodie, Dzefi-Tettey, Klenam, Harriet Obeng, Patrick KwadwoAdjei and Jerry
Coleman,
Prevalence and Sonographic Patterns of Uterine Fibroid among Ghanaian Women (Uterine Fibroid- The Ghanaian Situation)


