Embed Size (px)
Citation preview

1
A Comparative Study of VoIP Quality A Comparative Study of VoIP Quality Measurement from G.711 and G.729 Measurement from G.711 and G.729
Using PESQ and Thai SpeechUsing PESQ and Thai SpeechPresented by:Presented by:
Kiattisak YochanangKiattisak Yochanang
Dept. of Information TechnologyDept. of Information TechnologyFaculty of Information TechnologyFaculty of Information Technology
King Mongkut’s University of Technology North Bangkok King Mongkut’s University of Technology North Bangkok ThailandThailand

2
ContentsContents• Introduction• Background • Methodology• Results & Discussion• Conclusion & Future Work• References• Acknowledgment
3
IntroductionIntroduction• VoIP quality measurement is one of the interesting issues referring
to VoIP technology. Particularly, research on VoIP quality measurement based on Thai speech is very interesting because
Thai is a tonal language, which is unique. • At this moment, it still requires deep investigation, although some
issues with the Thai language have been studied already, for example, subjective MOS studies with G-family codecs using
subjective tests and Speex using PESQ [1-2]. • Therefore, this study has been conducted in order to investigate
VoIP quality measurement using PESQ with Thai speech, which has been applied to the Thai Speech Set for Telephonometry
(TSST) [3], with unofficial collaboration between Faculty of Information Technology, KMUTNB, and School of Information
Technology, KMUTT.
4
Background: Background: Subjective MethodsSubjective Methods• VoIP quality measurement methods have been classified into
subjective methods and objective methods [4] [5].• Subjective result of voice quality is necessary to be benchmarked
for objective measurement tool calibration. It is agreed that subjective result of voice quality evaluation gives better reliability
that the result from objective measurement [2]. • Subjective testing seems a very simple idea to obtain Mean Opinion Score (MOS) [6]. MOS is the average of scores, using a
5-point scale from individual scores. For reliability of MOS, it requires 16 subjects or more, requiring controlled conditions in a
quiet environment, such as a soundproof room [7]. • Absolute Category Rating (ACR) testing is one of the better known subjective methods. Its result is a MOS of listening quality, which refers to how subjects rate what they hear during a call or speech sample [6-7]. It is used to obtain the absolute quality of
the voice sample, through the direct hearing of the speech sample, without a reference speech sample [7].
5
Background: Background: Subjective MethodsSubjective Methods• ACR testing requires standard speech files; otherwise,
variability in scores might be high. That means the MOS result might suffer from unreliability. Nevertheless, some effects such
as delay effects cannot be tested using this method.• Conversation testing can be an alternative, particularly to evaluate conversational quality, which refers to how subjects
rate the overall quality of a call impacted by, for example, echo and/or delay effects, thus it is the most realistic atmosphere recommended by ITU-T because this method can reach the same standard of realism [5] [7] [8]. Moreover, this method
does not require speech files, while each round of testing can provide two scores. Therefore, with the same numbers of
subjects, it should be able to decrease time of 50% to gather scores.
6
Background: Background: Objective MethodsObjective Methods• Even though there is no objective measurement method that
can replace subjective measurement method perfectly, objective measurement method has several advantages, such
as, shorter time consumption, no collaboration with a lot of subjects and fewer endeavors [2] [9].
• There are several objective measurement methods for speech communications, However, the major methods are PESQ for
intrusive methods and E-model for non-intrusive methods.• It has been found from the search in IEEEXplore® that the
results of PESQ (41 papers) are higher than results of the E-model (37 papers), during Jan 2009 – Aug 2013 [10] [11].
7
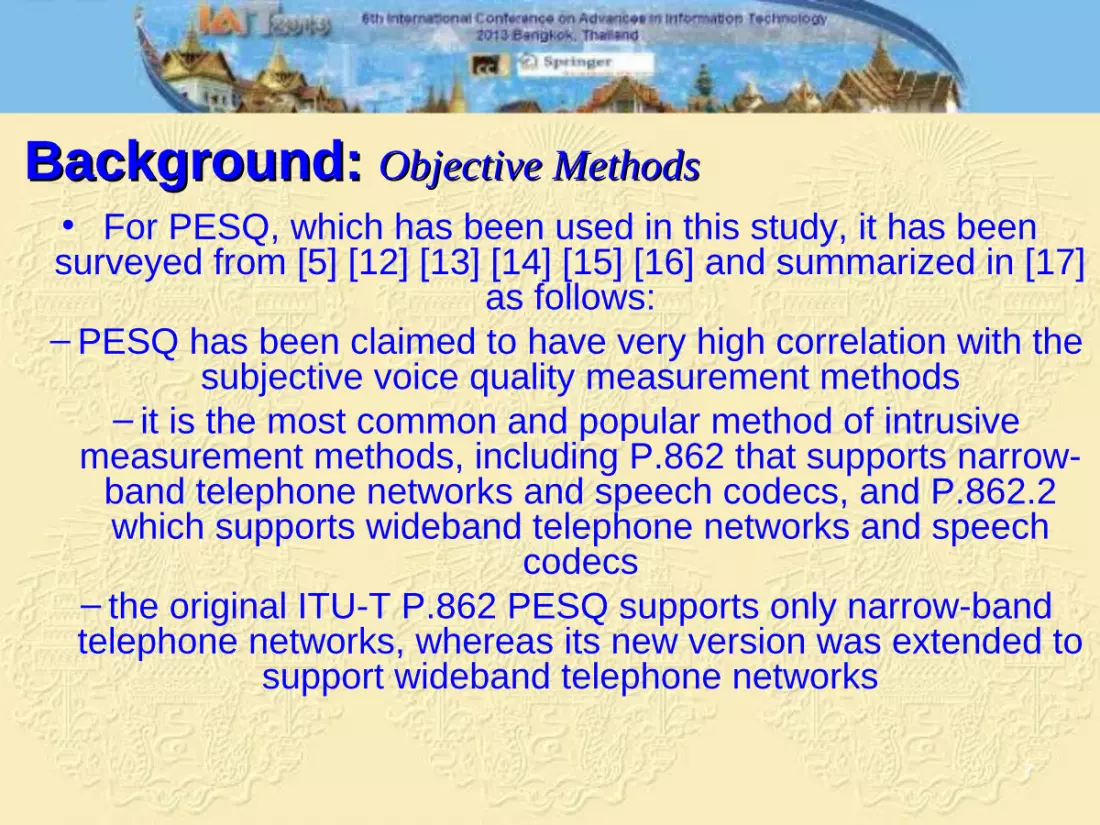
Background: Background: Objective MethodsObjective Methods• For PESQ, which has been used in this study, it has been surveyed from [5] [12] [13] [14] [15] [16] and summarized in [17]
as follows:– PESQ has been claimed to have very high correlation with the
subjective voice quality measurement methods– it is the most common and popular method of intrusive
measurement methods, including P.862 that supports narrow-band telephone networks and speech codecs, and P.862.2 which supports wideband telephone networks and speech
codecs– the original ITU-T P.862 PESQ supports only narrow-band telephone networks, whereas its new version was extended to
support wideband telephone networks
8
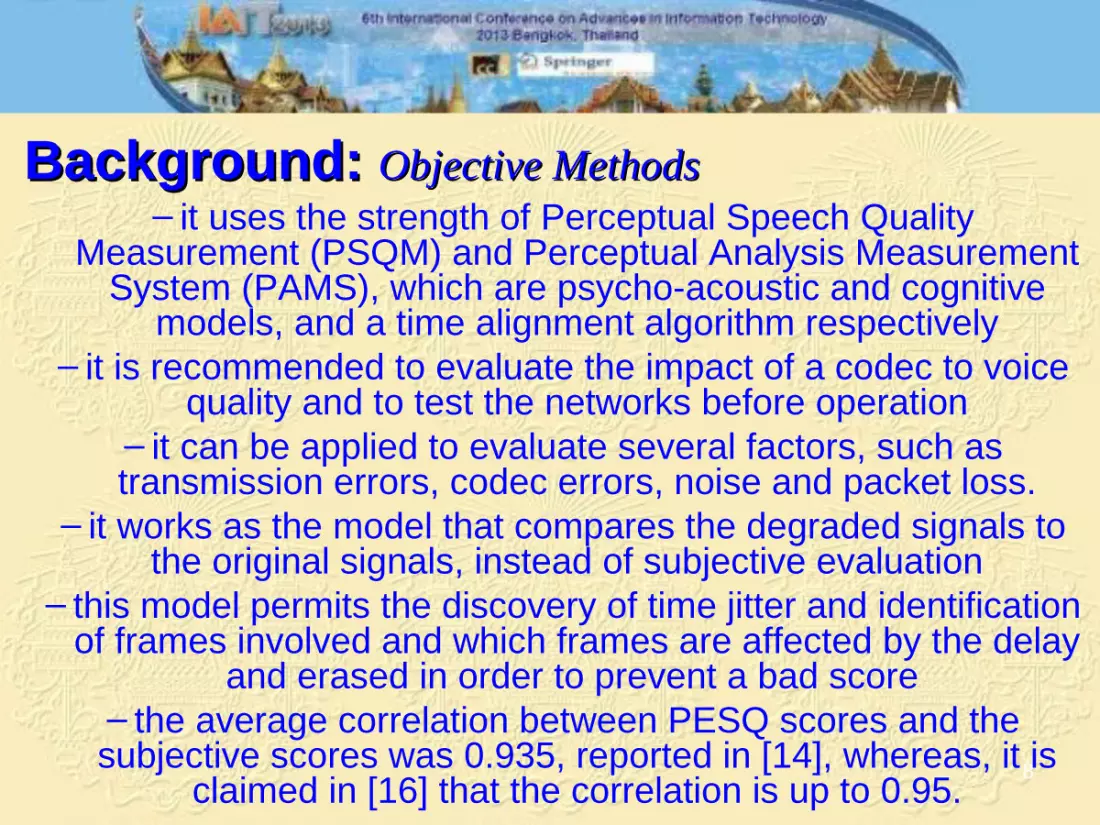
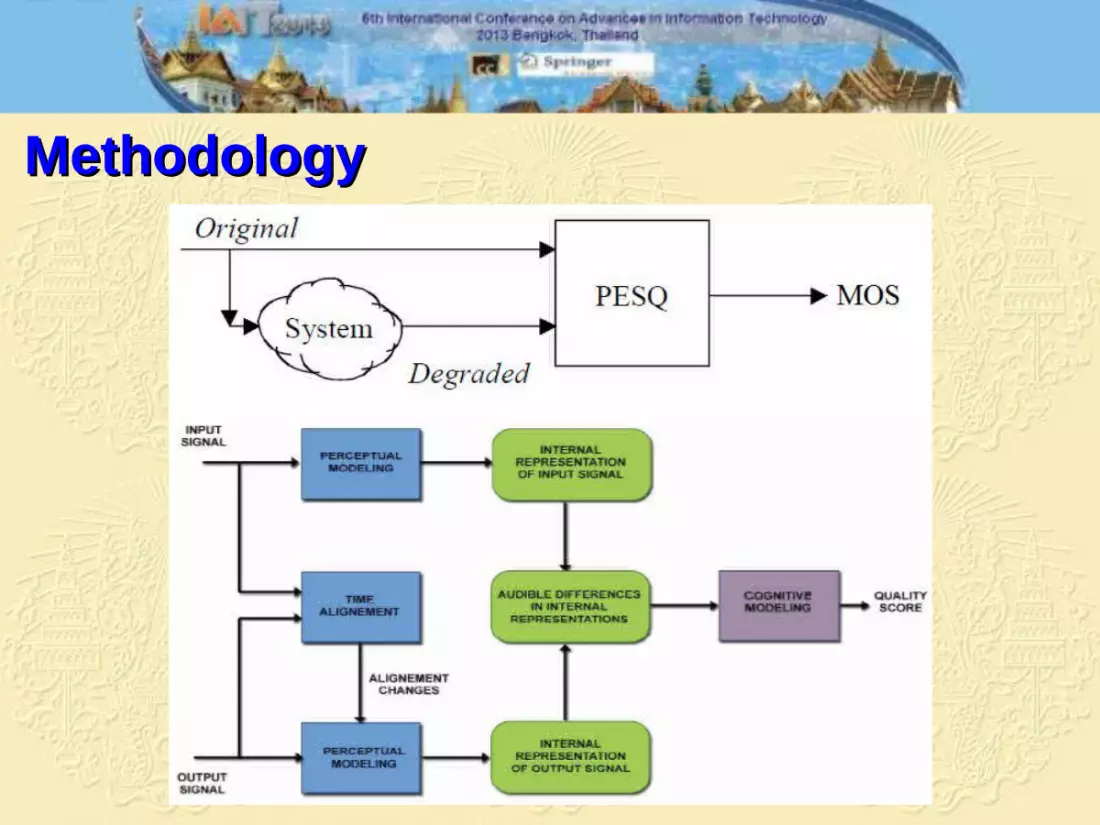
Background: Background: Objective MethodsObjective Methods– it uses the strength of Perceptual Speech Quality
Measurement (PSQM) and Perceptual Analysis Measurement System (PAMS), which are psycho-acoustic and cognitive
models, and a time alignment algorithm respectively– it is recommended to evaluate the impact of a codec to voice
quality and to test the networks before operation– it can be applied to evaluate several factors, such as transmission errors, codec errors, noise and packet loss.
– it works as the model that compares the degraded signals to the original signals, instead of subjective evaluation
– this model permits the discovery of time jitter and identification of frames involved and which frames are affected by the delay
and erased in order to prevent a bad score – the average correlation between PESQ scores and the subjective scores was 0.935, reported in [14], whereas, it is
claimed in [16] that the correlation is up to 0.95.
9
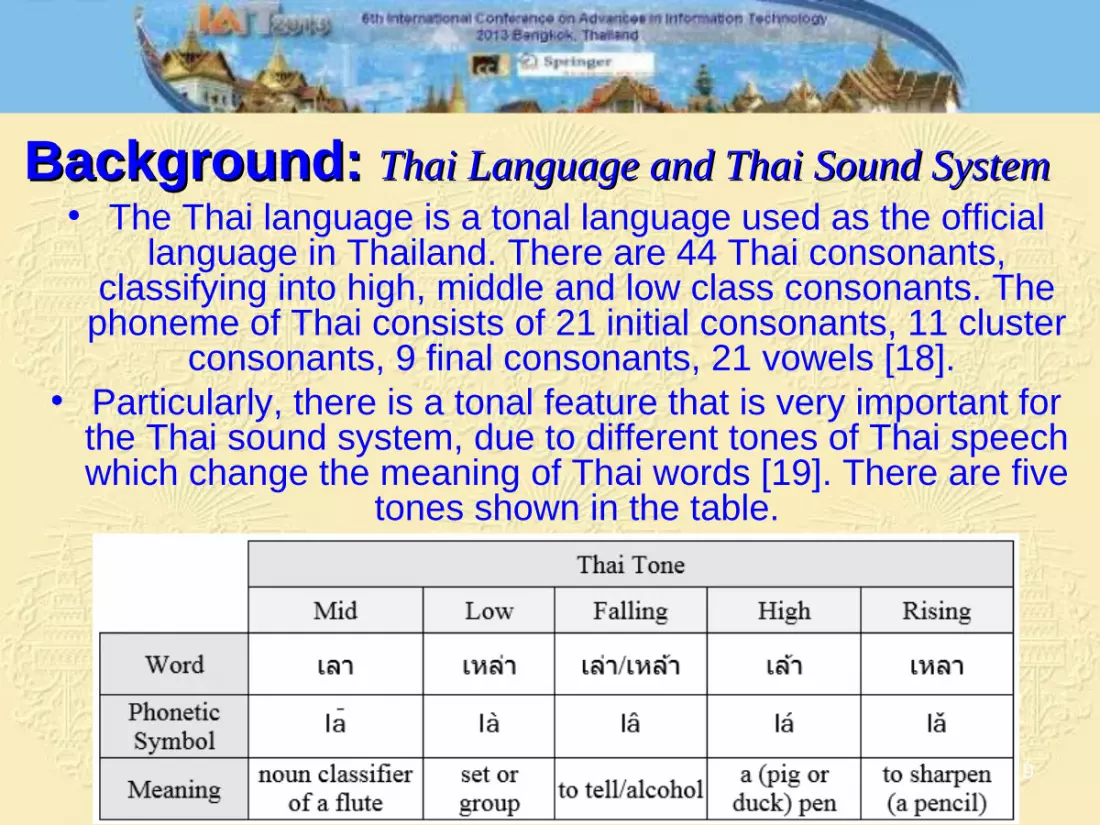
Background: Background: Thai Language and Thai Sound SystemThai Language and Thai Sound System• The Thai language is a tonal language used as the official
language in Thailand. There are 44 Thai consonants, classifying into high, middle and low class consonants. The
phoneme of Thai consists of 21 initial consonants, 11 cluster consonants, 9 final consonants, 21 vowels [18].
• Particularly, there is a tonal feature that is very important for the Thai sound system, due to different tones of Thai speech which change the meaning of Thai words [19]. There are five
tones shown in the table.
10
Background: Background: Thai Language and Thai Sound SystemThai Language and Thai Sound System• Moreover, from the research on neuroscience, it has been
reported in [20] that from the study using Electroencephalogram technique and Low-Resolution Brain Electromagnetic Tomography (LORETA) with the Mismatch
Negativity (MMN), with 9 Thai native listeners who do not have Chinese knowledge, that only the left hemisphere (LH) of Thai native speakers were activated significantly when listening to
the condition with Thai speech which is their mother language, whereas, their right hemisphere (RH) were activated when
listening to the condition with Chinese speech. • Besides, it has been reported in [21] that the part of LH was
predominant in the perception of the prosody of Thai speech sound, while the prosody of Chinese speech sound was dominated by part of the RH. That means only the left
hemisphere can significantly respond to native speech sounds.
11
Background: Background: Thai Speech SamplesThai Speech Samples• For speech samples that are necessary for the listening tests
and different kinds of objective voice quality tests, ITU-T recommended that the speech samples must be meaningful
and easy to understand [5], therefore, the ‘Harvard sentences’ that have been used widely cannot be used for voice or speech quality measurement in Thailand, due to those
sentences are only in English [22]. • Instead of using a set of Thai speech from the ‘Multi-lingual
speech database for telephonometry 1994’ that’s provided by NTT-AT with expensive costs [22], local Thai speech sets have
been considered. However, instead of following [2] using the well-known Thai speech corpus ‘LOTUS’, which has been noted that many sentences are not simple when compared
with the Thai Speech Set for Telephonometry (TSST) [3] [4]. TSST has therefore been considered for application, following
[23] for further investigation.
12
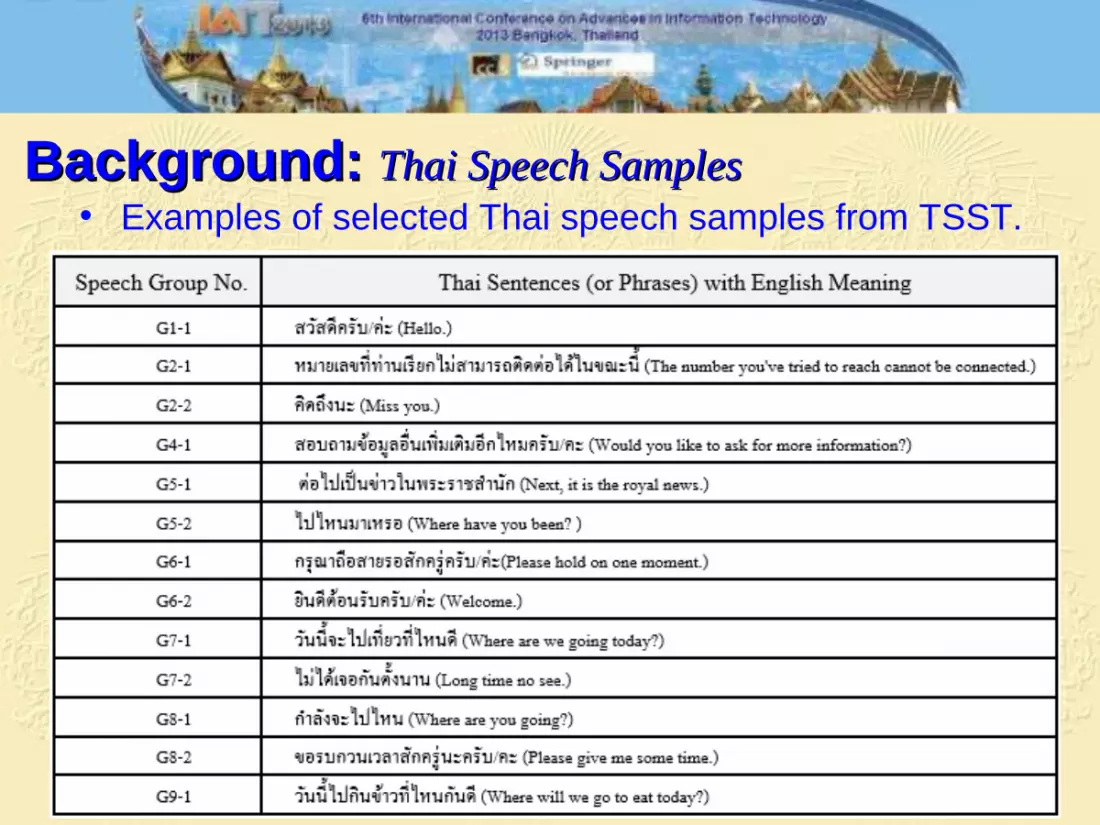
Background: Background: Thai Speech SamplesThai Speech Samples• Examples of selected Thai speech samples from TSST.
13
Background: Background: Related WorksRelated Works• It was reported in [24], the study with English and Dutch speech with
loss effects using PESQ, that the voice quality from male speech is higher than the voice quality from female speech.
• In [12], it was presented the study of voice quality with the GSM codec, English speech and six conditions. It has been found that the voice quality from male speech using PESQ is higher than the voice
quality from female speech, similar to [24]. While it is inconsistent with [24] when using 3SQM, it was found that the voice quality from female speech is higher than the voice quality from male speech.
• Similar to [25], the study with G.711 and G.729 using PESQ, it has been observed that the results from the experiment with delay effects of the voice quality from English female speech is slightly higher than the voice quality
from English male speech. • However, it has been observed from [25] that it is inconsistent with Chinese
speech because the voice quality of Chinese male speech is slightly higher than the voice quality of Chinese female speech. Nevertheless, with loss effects, it has not been observed clearly from the experiment with G.711 about the differences of the voice quality from English male speech and
English female speech, while the result of Chinese speech is consistent with the result of the experiment with delay effects.
14
Background: Background: Related WorksRelated Works• For the study with Thai, both male and female speech, with Speex
codec using PESQ [2], the result from the experiment with Thai speech is consistent with [24], and [12] that used PESQ tests. It has
been observed that the voice quality from Thai male speech is higher than the voice quality from Thai female speech.
• However, all above were mainly from objective tests using PESQ, the results are inconsistent with the result from the subjective tests,
because it has been shown in [26] from interview tests, the voice quality from the female interviewer is slightly higher than the voice quality from the male interviewer. Besides, it has been compared
between G.711 and G.729 referring to loss effects in [8] using conversation tests but it did not analyze type or gender of speech. • Therefore, it is still necessary to investigate and analyze Thai
speech, both male and female.

15
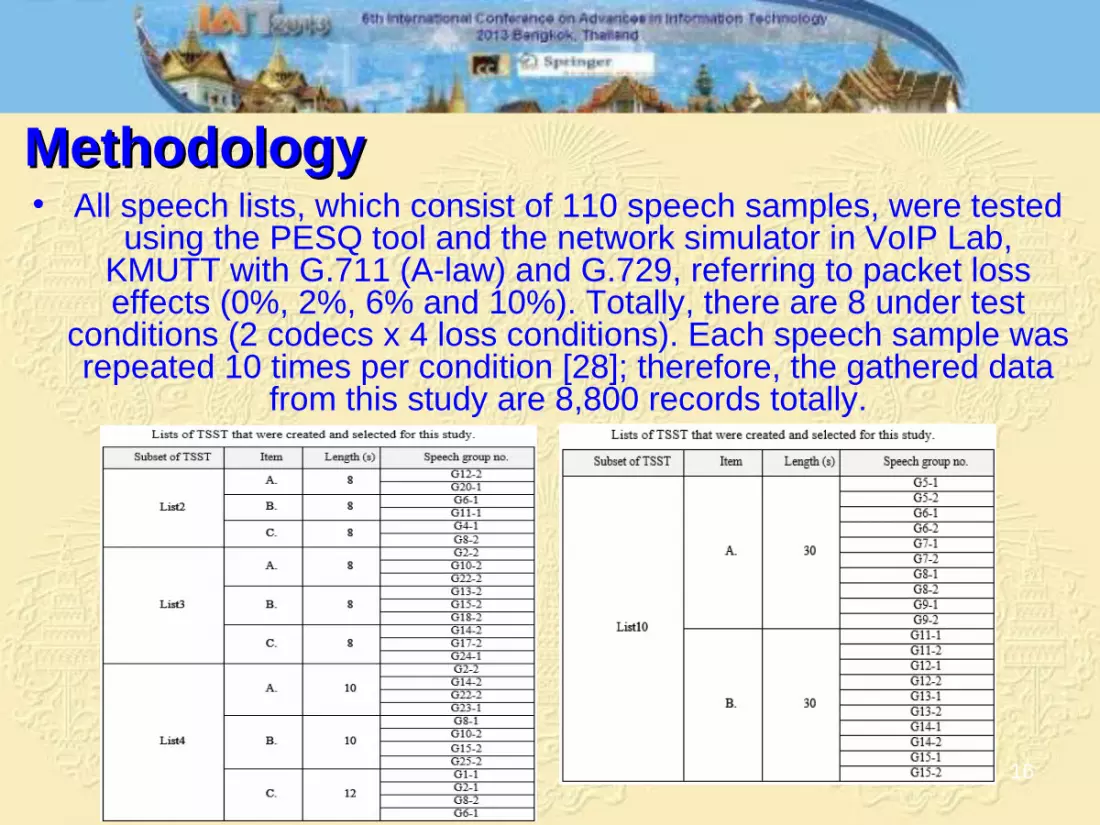
MethodologyMethodology• 4 speech lists [27] were applied in this study as follows:
1) List2: there are three forms of speech samples (A, B and C). Each speech sample, with the length of 8 s, consists of two speech
sentences. For each form, there are 2 child speech samples (a boy and a girl), 4 female speech samples and 4 male speech samples.
Totally, there are 30 speech samples.• List3: there are three forms of speech samples (A, B and C). Each
speech sample, with the length of 8 s, consists of three speech sentences. Similar to List2, totally there are 30 speech samples.
• List4: there are three forms of speech samples (A, B and C). Each speech sample, with the length of 10-12 s, consists of four speech sentences. Similar to List2, totally there are 30 speech samples.
• List10: there are three forms of speech samples (A and B). Each speech sample, with the length of 30 s, consists of ten speech
sentences. So, there are 20 speech samples totally.
16
MethodologyMethodology• All speech lists, which consist of 110 speech samples, were tested
using the PESQ tool and the network simulator in VoIP Lab, KMUTT with G.711 (A-law) and G.729, referring to packet loss effects (0%, 2%, 6% and 10%). Totally, there are 8 under test
conditions (2 codecs x 4 loss conditions). Each speech sample was repeated 10 times per condition [28]; therefore, the gathered data
from this study are 8,800 records totally.
MethodologyMethodology
18
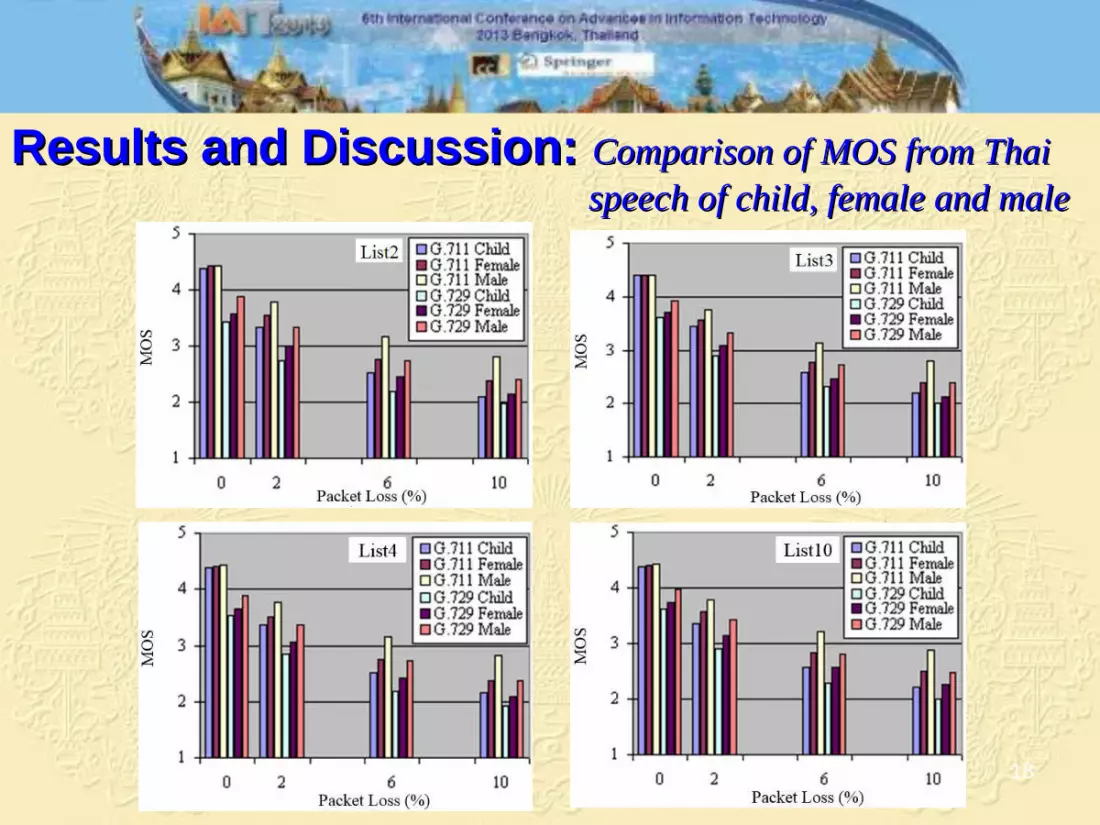
Results and Discussion: Results and Discussion: Comparison of MOS from Thai Comparison of MOS from Thai speech of child, female and malespeech of child, female and male
19
Results and Discussion: Results and Discussion: Comparison of MOS from Thai Comparison of MOS from Thai speech of child, female and malespeech of child, female and male
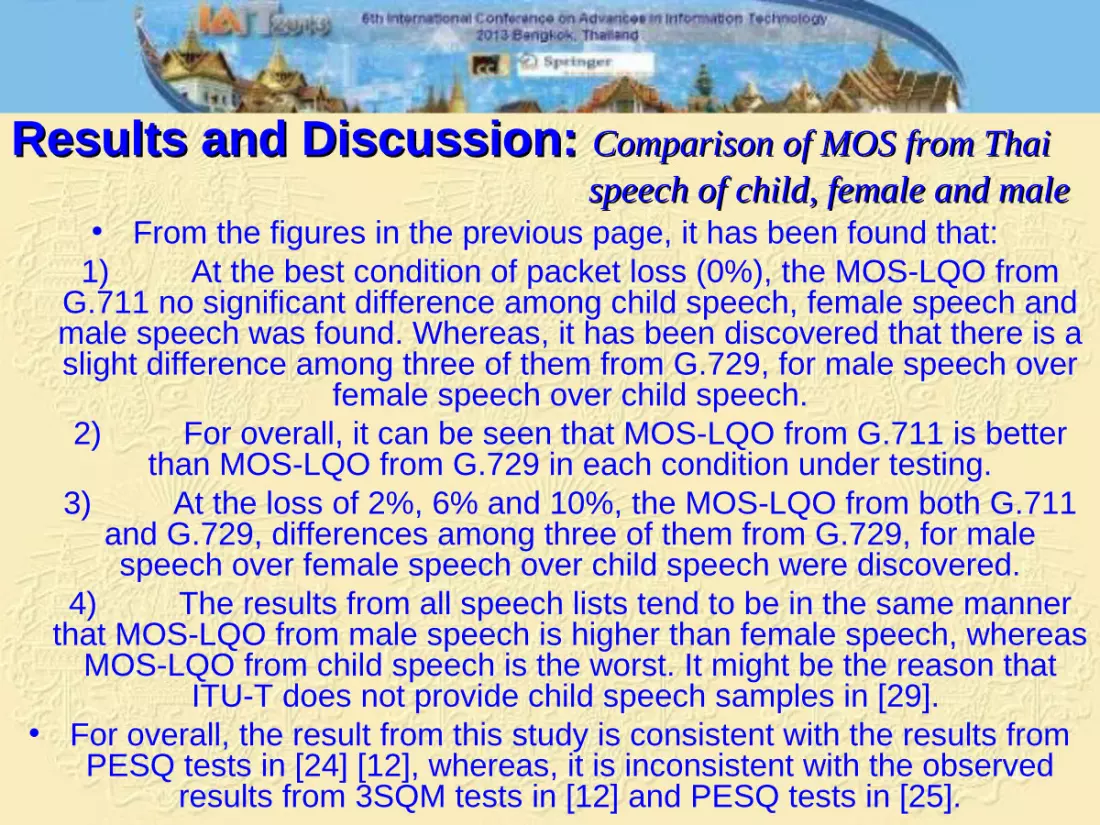
• From the figures in the previous page, it has been found that: 1) At the best condition of packet loss (0%), the MOS-LQO from
G.711 no significant difference among child speech, female speech and male speech was found. Whereas, it has been discovered that there is a slight difference among three of them from G.729, for male speech over
female speech over child speech.2) For overall, it can be seen that MOS-LQO from G.711 is better
than MOS-LQO from G.729 in each condition under testing.3) At the loss of 2%, 6% and 10%, the MOS-LQO from both G.711
and G.729, differences among three of them from G.729, for male speech over female speech over child speech were discovered.
4) The results from all speech lists tend to be in the same manner that MOS-LQO from male speech is higher than female speech, whereas
MOS-LQO from child speech is the worst. It might be the reason that ITU-T does not provide child speech samples in [29].
• For overall, the result from this study is consistent with the results from PESQ tests in [24] [12], whereas, it is inconsistent with the observed
results from 3SQM tests in [12] and PESQ tests in [25].
20
Results and Discussion: Results and Discussion: Comparison of MOS from four Comparison of MOS from four speech lists speech lists
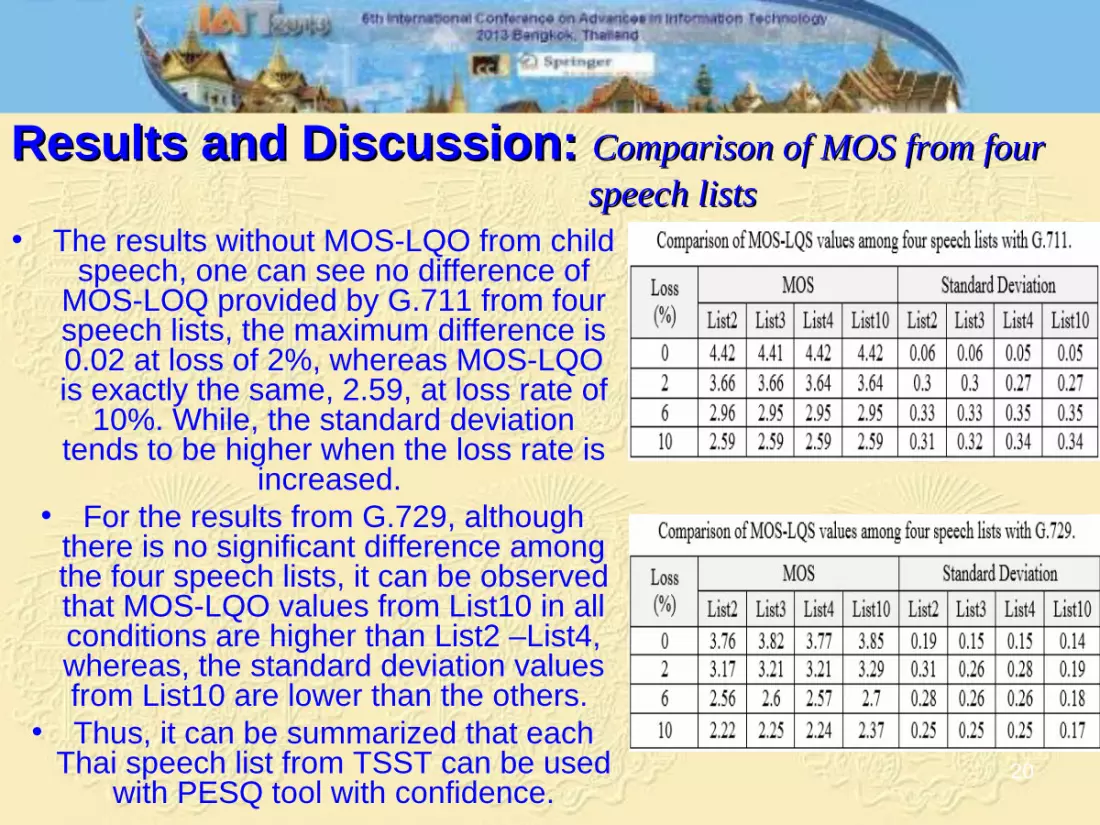
• The results without MOS-LQO from child speech, one can see no difference of
MOS-LOQ provided by G.711 from four speech lists, the maximum difference is 0.02 at loss of 2%, whereas MOS-LQO is exactly the same, 2.59, at loss rate of
10%. While, the standard deviation tends to be higher when the loss rate is
increased. • For the results from G.729, although
there is no significant difference among the four speech lists, it can be observed that MOS-LQO values from List10 in all conditions are higher than List2 –List4, whereas, the standard deviation values from List10 are lower than the others.
• Thus, it can be summarized that each Thai speech list from TSST can be used
with PESQ tool with confidence.
21
Results and Discussion: Results and Discussion: Comparison of objective MOS Comparison of objective MOS and subjective MOSand subjective MOS
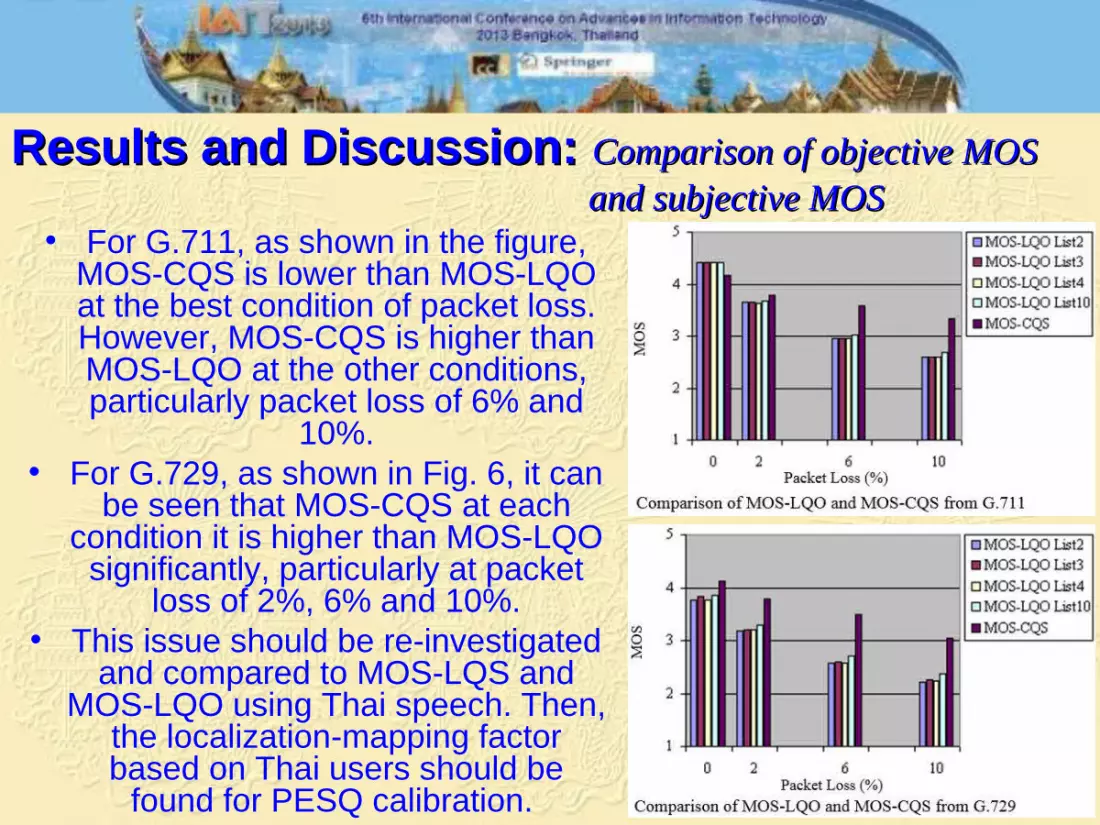
• For G.711, as shown in the figure, MOS-CQS is lower than MOS-LQO at the best condition of packet loss. However, MOS-CQS is higher than MOS-LQO at the other conditions, particularly packet loss of 6% and
10%.• For G.729, as shown in Fig. 6, it can
be seen that MOS-CQS at each condition it is higher than MOS-LQO
significantly, particularly at packet loss of 2%, 6% and 10%.
• This issue should be re-investigated and compared to MOS-LQS and
MOS-LQO using Thai speech. Then, the localization-mapping factor based on Thai users should be
found for PESQ calibration.
22
Conclusion and Future WorkConclusion and Future Work• This paper presents the comparative study of VoIP quality
measurement from G.711(A-law) at 64 Kbps and G.729 at 8 Kbps using PESQ and Thai speech, referring to packet loss effects.
• From this study with Thai speech, firstly, it has been found referring to packet loss that MOS-LQO from G.711 is slightly higher than
MOS-LQO from G.729 in each condition. • Also, it has been found that MOS-LQO from Thai male speech is
higher than MOS-LQO from Thai female speech. Whereas, MOS-LQO from Thai child speech is the lowest, compared to the others.
• Therefore, it can be summarized that PESQ tends to give higher values of MOS-LQO for speech sample that have low fundamental frequency like male speech, due to the fundamental frequency of male speech is lower than female and child speech. Thus, PESQ
should be improved to include this issue as future work.
23
Conclusion and Future WorkConclusion and Future Work• Secondly, it has been found that there is no significant difference
from this study that MOS-LQO from four speech lists (List2, List3, List4 and List10), although MOS-LQO from List10 seems slightly
higher that MOS-LQO from others. Therefore, each of them can be used with confidence.
• Lastly, it has been found that there are significant differences between objective MOS from PESQ and subjective MOS from
conversation tests. Therefore, the MOS-LQS should be conducted using the four speech lists in this paper and then compared with
MOS-LQO from this study as future work, in order to modify PESQ for Thai speech especially.
24
ReferencesReferences1. T Daengsi, C Wutiwiwatchai, A Preechayasomboon and S Sukparungsee. A Study of VoIP Quality Evaluation: User Perception of
Voice Quality from G.729, G.711 and G.722. Proc. 9th IEEE-CCNC’2012, Las Vegas, NV. 2012, p. 342-345.2. T Triyason and P Kanthamanon. Perceptual Evaluation of Speech Quality Measurement on Speex Codec VoIP with Tonal
Language Thai. Proc. 5th International Conference IAIT, Bangkok, Thailand, 2012, p. 181-190.3. T Daengsi et al. The Development of a Thai Speech Set for Telephonometry. Available from: http://desceco.org/O-
COCOSDA2010/proceedings/paper_53.pdf, accessed November 2012.4. T Daengsi, A Preechayasomboon, S Sukparungsee and C Wutiwiwatchai. Thai Text Resource: A Recommended Thai Text Set
for Voice Quality Measurements and Its Comparative Study. KKU Science Journal. Vol. 40, No. 4, pp. 1114-1127, 2012.5. ITU-T Recommendation P.800 (Methods for subjective determination of transmission quality). Available at:
http://www.itu.int/rec/T-REC-P.800-199608-I/en, accessed November 2012.6. Telchemy. Voice Quality Measurement (Application Note). Available at: http://
www.telchemy.com/appnotes/TelchemyVoiceQualityMeasurement.pdf, accessed August 2013. 7. F D Rango et al. Overview on VoIP: Subjective and Objective Measurement Methods. IJCSNC. Vol. 6, pp. 140-153, 2006.8. T Daengsi, S Sukparungsee, C Wutiwiwatchai and A Preechayasomboon. Comparison of Perceptual Voice Quality of VoIP
Provided by G.711 and G.729 Using Conversation-Opinion Tests. IJCIM, Vol. 20, No. 1, pp. 21-26, 2012.9. T Daengsi, C Wutiwiwatchai, A Preechayasomboon and S Sukparungsee. VoIP Quality Measurement: Insignificant Voice Quality
of G.711 and G.729 Codecs in Listening-Opinion Tests by Thai Users. Information Technology Journal. Vol. 8 (1), pp. 77-82, 2012.
10. http://ieeexplore.ieee.org/search/searchresult.jsp?queryText%3DVoIP+Quality+E-model& addRange=2009_2013_Publication_Year&pageNumber=1&resultAction=REFINE, accessed August 2013.
11. http://ieeexplore.ieee.org/search/searchresult.jsp?queryText%3DVoIP+Quality+PESQ&add Range=2009_2013_Publication_Year&pageNumber=1&resultAction=REFINE, accessed August 2013.
12. M Goudarzi and L Sun. Performance analysis and comparison of PESQ and 3SQM in live 3G mobile networks. Available from : http://www.tech.plym.ac.uk/spmc/staff/mgoudarzi/ Perform ance%20analysis%20and%20comparison%20of%20PESQ%20and%203SQM.pdf, accessed August 2013.
13. ITU-T Recommendation P.862. Perceptual evaluation of speech quality (PESQ): An objective method for end-to-end speech quality assessment of narrow-band telephone. 2001.
14. ITU-T Recommendation P.862.2. Wideband extension to Recommendation P.862 for the assessment of wideband telephone networks and speech codecs. November, 2007.
15. S Karapantazis and F-N Pavlidou. Voip: A comprehensive survey on a promising technology. Computer Networks, Vol. 53. pp. 2050-2090, 2009.
25
ReferencesReferences16. Ditech Networls. Limitations of PESQ for Measuring Voice Quality in Mobile and VoIP Networks. Available from :
https://www.google.co.th/url?sa=t&rct=j&q=&esrc=s&source =web&cd=1&ved=0CDEQFjAA&url=http%3A%2F%2Fwww.packagingdigest.com%2Ffile%2F4534-white_paper_on_the_limitations_of_PESQ.pdf%3Fforce%3Dtrue&ei= NTdFUoXmHIHQrQfU2oHoDw&usg=AFQjCNGKfvZ5aWrk_kD2wr8IkamNfku5zw&bvm=bv.53217764,d.bmk, accessed September 2013.
17. T Daengsi. VoIP Quality Measurement: Recommendation of MOS and Enhance Objective Measurement Method for Standard Spoken Thai Language. Ph.D. Thesis, Faculty of Information Technology, King Mongkut’s University of Technology North Bangkok, November 2012.
18. M Sodanil, S Nitsuwat and C Haruechaiyasak. Thai Word Recognition Using Hybrid MLP-HMM. IJCSNS, Vol..10, No.3, pp. 103-110, 2010.
19. C Wutiwiwatchai and S Furui. Thai speech processing technology: A review. Speech communication, Vol. 49, pp. 8-27, 2007.20. W Sittiprapaporn, C Chindaduangratn and N Kotchabhakdi. Brain electric activity during the preattentive perception of speech
sounds in tonal languages. SJST. Vol. 26, pp. 439-445, 2004.21. W Sittiprapaporn, C Chindaduangratn and N Kotchabhakdi. Functional Specialization of the Human Auditory Cortex in Processing
of Speech Prosody: A Low Resolution Electromagnetic Tomography (LORETA) Study. Available from : http://anchan. lib.ku.ac.th/ kukr/bitstream/003/17786/1/KC4205011.pdf, accessed December 2012.
22. IEEE. Recommended practice for speech quality measurements. IEEE Trans. on Audio Electroacoust., Vol. 17, No. 3, pp. 225–246, 1969.
23. K Suayroop et al. A VoIP Quality Measurement Study with Thai Speech Sets Using PESQ and G.711A-law. Proc. 34th Electricall Engineering Conference (EECON-34). Chonburi, Thailand, 2011.
24. L Sun and E Ifeachor. Perceived Speech Quality Prediction for Voice over IP-based Networks. Proc. IEEE Int. Conf. Communications 2002 (ICC’02). New York, NY, 2002, p. 2573-2577.
25. J Ren, H Zhang, Y Zhu and C Goa. Assessment of effects of different language in VOIP. Proc. Int. Conf. Audio, Language and Image Processing 2008 (ICALIP 2008). Shanghai, China, 2008, p. 1624-1628.
26. T Daengsi, C Wutiwiwatchai, A Preechayasomboon and S Sukparungsee. Speech Quality Assessment of VoIP: G.711 VS G.722 Based on Interview Tests with Thai Users. IJITCS, Vol. 4, No.2, pp.19-25, March 2012.
27. ITU-T Recommendation P.862.3 (Application guide for objective quality measurement base on Recommendations P.862, P.862.1 and P.862.2). November 2007.
28. J Lee, K Nam and D Kim. Effect of Network factors on VoIP. Proc. 13th Int. Conf. Advanced Communication Technology (ICACT). Korea, February 2011, p. 1130-1135.
29. Annex B Speech files, ITU-T Recommendation P.501. Available from: http:// www.itu.int/net/itu-t/sigdb/genaudio/AudioForm-g.aspx?val=10000501, accessed August 2013.
26
AcknowledgmentAcknowledgmentThank you to the VoIP Lab, School of Information Technology, KMUTT for the PESQ Thank you to the VoIP Lab, School of Information Technology, KMUTT for the PESQ tool and the network simulator used to gain these results. Thank you so much Mr. Gary tool and the network simulator used to gain these results. Thank you so much Mr. Gary Sherriff, the international coordinator, Faculty of Information Technology for editing.Sherriff, the international coordinator, Faculty of Information Technology for editing.

Thank you very muchThank you very muchfor your attention.for your attention.


