Embed Size (px)
Citation preview

© 2015 Knechtle et al. This work is published by Dove Medical Press Limited, and licensed under Creative Commons Attribution – Non Commercial (unported, v3.0) License. The full terms of the License are available at http://creativecommons.org/licenses/by-nc/3.0/. Non-commercial uses of the work are permitted without any further
permission from Dove Medical Press Limited, provided the work is properly attributed. Permissions beyond the scope of the License are administered by Dove Medical Press Limited. Information on how to request permission may be found at: http://www.dovepress.com/permissions.php
Open Access Journal of Sports Medicine 2015:6 277–290
Open Access Journal of Sports Medicine Dovepress
submit your manuscript | www.dovepress.com
Dovepress 277
R e v i e w
open access to scientific and medical research
Open Access Full Text Article
http://dx.doi.org/10.2147/OAJSM.S85310
Variables that influence Ironman triathlon performance – what changed in the last 35 years?
Beat Knechtle1,2
Raphael Knechtle2
Michael Stiefel2
Matthias Alexander Zingg2
Thomas Rosemann2
Christoph Alexander Rüst2
1Gesundheitszentrum St Gallen, St Gallen, 2institute of Primary Care, University of Zurich, Zurich, Switzerland
Correspondence: Beat Knechtle Gesundheitszentrum St Gallen, vadianstrasse 26, 9001 St Gallen, Switzerland Tel +41 71 226 8282 Fax +41 71 226 8272 email [email protected]
Objective: This narrative review summarizes findings for Ironman triathlon performance and
intends to determine potential predictor variables for Ironman race performance in female and
male triathletes.
Methods: A literature search was performed in PubMed using the terms “Ironman”, “triathlon”,
and “performance”. All resulting articles were searched for related citations.
Results: Age, previous experience, sex, training, origin, anthropometric and physiological
characteristics, pacing, and performance in split disciplines were predictive. Differences exist
between the sexes for anthropometric characteristics. The most important predictive variables for
a fast Ironman race time were age of 30–35 years (women and men), a fast personal best time
in Olympic distance triathlon (women and men), a fast personal best time in marathon (women
and men), high volume and high speed in training where high volume was more important than
high speed (women and men), low body fat, low skin-fold thicknesses and low circumference of
upper arm (only men), and origin from the United States of America (women and men).
Conclusion: These findings may help athletes and coaches to plan an Ironman triathlon career.
Age and previous experience are important to find the right point in the life of a triathlete to
switch from the shorter triathlon distances to the Ironman distance. Future studies need to
correlate physiological characteristics such as maximum oxygen uptake with Ironman race
time to investigate their potential predictive value and to investigate socio-economic aspects
in Ironman triathlon.
Keywords: swimming, cycling, running, age, body fat, sex
IntroductionA triathlon is a multistage competition involving the completion of three continuous
and sequential endurance disciplines swimming, cycling, and running. The ”Ironman
Hawaii”, covering 3.8 km swimming, 180 km cycling, and 42.195 km running, is
the best-known long-distance triathlon. The “Ironman Hawaii” triathlon is the World
Championship of Ironman triathlon races1 and is considered as one of the 12 toughest
endurance races in the world.2 Each year, tens of thousands of athletes try to qualify in
Ironman qualifier races all around the world to finally qualify for “Ironman Hawaii”.3,4
In both the qualifiers and in “Ironman Hawaii”, athletes are ranked either as pro athletes
or age group athletes.3,4
The intention of this narrative review is to give an overview of recent findings of
potential predictor variables for a successful outcome in an Ironman triathlon. The
findings might help athletes and coaches to plan a future career as Ironman triathlete.
A literature search was performed using the data base PubMed5 using the terms

Open Access Journal of Sports Medicine 2015:6submit your manuscript | www.dovepress.com
Dovepress
Dovepress
278
Knechtle et al
“Ironman” and “triathlon” leading to 176 results. We then
refined the search using the terms “Ironman”, “triathlon”, and
“performance”. This search resulted in 76 publications. We
then refined to studies investigating potential associations
of selected variables with performance in Ironman triathlon
races. The references of the selected studies were checked
for further studies. We found age (ten publications), previous
experience (six publications), sex (six publications), training
(nine publications), anthropometry (18 publications), and
origin (three publications) as potential predictors for Ironman
race time. From a practical point of view, we further looked
for publications investigating results of laboratory and blood
analyses with practical relevance for athletes and coaches.
We defined practical relevance as the fact that blood results
could be replicated by a primary care physician, and the
primary care physician would be able to explain his or her
athlete the relevance of the blood results to change life and/
or training. A further search using the term “long-distance
triathlon” resulted in the same references.
Predictive characteristicsAgeAge has been shown as an important predictor variable in
both Half-Ironman6 and Ironman7–9 triathlon performance.
The age of peak triathlon performance was higher in longer
race distances in both women and men. For elite athletes
competing in Olympic distance, Half-Ironman, and Ironman
races at a high level, the ages of peak triathlon performance
were 27.1±4.9, 28.0±3.8, and 35.1±3.6 years, respectively,
for men, and 26.6±4.4, 31.6±3.4, and 34.4±4.4 years, respec-
tively, for women.10 In Half-Ironman, women achieved
their best race performances at the age of 25–39 years,
whereas men attained their fastest race times between 18 and
39 years.11 Future studies would need to define more precisely
the age of the best Half-Ironman performance. For Ironman,
the age of the best triathlon performance was at the age of
30–35 years.11–13 Both women and men peaked at a similar
age of 32–33 years with no sex difference.12,13
In a longitudinal study investigating the age of peak
athletic performance in “Ironman Switzerland” from 1995
to 2010, no sex difference in the age of the best Ironman
performance was found.12 For split disciplines, the ages of
the best swimming, cycling, and running performance were
different between women and men.13 In athletes competing
in the qualifier “Ironman Switzerland” between 1995 and
2011, the best male swimmers were significantly younger
(29±3 years) than the best male runners (35±5 years).13 For
women, the ages of peak split performances were not sig-
nificantly different between the three disciplines.13 When the
ages of the top ten finishers for all qualifier races for “Ironman
Hawaii” and “Ironman Hawaii” itself were determined in
2010, the age of peak Ironman triathlon performance was
32.2±1.5 years for men and 33.0±1.6 years for women with
no sex difference.12
However, the age of the annual ten fastest triathletes
increased across the last 30 years in “Ironman Hawaii”.14
This is in accordance with relative improvements of Iron-
man performances in older age groups.8,15 The mean age of
the annual ten fastest finishers increased nonlinearly (ie,
polynomial fifth degree) in women (Figure 1) and in men
(Figure 2). Race times of the annual ten fastest decreased
nonlinearly (ie, polynomial fifth degree) in women (Figure 3)
201978 1980 1982 1984 1986 1988 1990 1992 1994
Year
Ag
e o
f fa
stes
t to
tal r
ace
per
form
ance
(ye
ars)
Women
1996 1998 2000 2002 2004 2006 2008 2010 2012 2014
22
24
26
28
30
32
34
36
38
40Polynomial regressionLinear
Figure 1 Age (years) of the annual ten fastest women in ironman Hawaii from 1978 to 2014.Note: The results are presented as mean ± SD.

Open Access Journal of Sports Medicine 2015:6 submit your manuscript | www.dovepress.com
Dovepress
Dovepress
279
Predictor for ironman performance
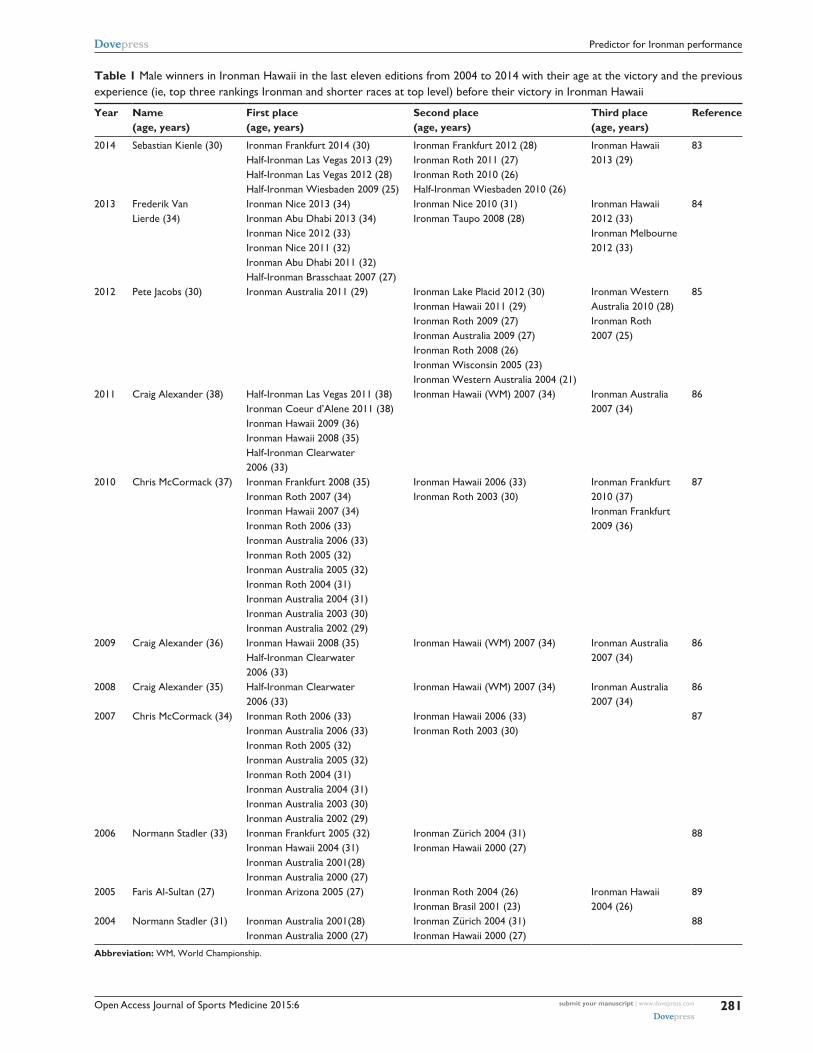
and men (Figure 4). Considering male winners in “Ironman
Hawaii” in the last 11 years from 2004 to 2014, their mean
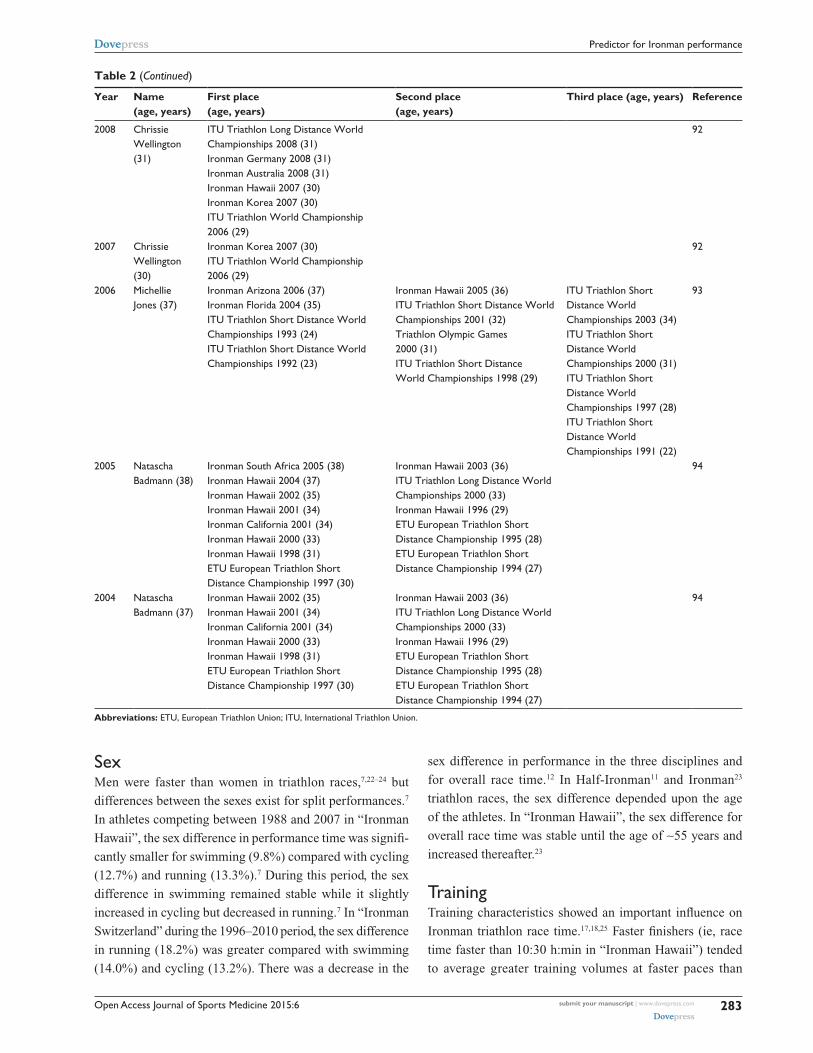
age was 33.2±3.4 years (Table 1). For female winners, the
mean age was identical at 33.4±3.0 years (Table 2).
The age-related decline in triathlon performance
depended on the race distance. With advancing age, the
performance decline was less pronounced in Olympic dis-
tance triathlon compared with Ironman distance triathlon in
cycling (.55 years) and running (.50 years), respectively.7
In contrast, an age-related decline in swimming performance
was independent of the race distance.7 The age-related
decline in triathlon performance was specific to each
split discipline, with cycling showing a lower decline in
performance with increasing age compared with swimming
and running.7
Age was an important predictive variable for qualifying
for “Ironman Hawaii” since there were differences in terms
of participation and performance for athletes in different age
groups between “Ironman Hawaii” and its qualifier races.4
In “Ironman Hawaii”, men and athletes aged 25–49 years
were underrepresented compared to the qualifiers.4 Similarly,
women and athletes younger than 25 years and older than
50 years were relatively over-represented. Therefore, men
and younger (,25 years) and older (.50 years) athletes
had a lower chance to qualify for “Ironman Hawaii” than
women.4
1978 1980 1982 1984 1986 1988 1990 1992 1994
Year1996 1998 2000 2002 2004 2006 2008 2012 2014
20Ag
e o
f fa
stes
t to
tal r
ace
per
form
ance
(ye
ars)
22
24
26
28
30
32
34
36
38
40Polynomial regressionLinear
Men
2010
Figure 2 Age (years) of the annual ten fastest men in ironman Hawaii from 1978 to 2014.Note: The results are presented as mean ± SD.
1978500
550
600
650
700
750
800
850
950
900
1980 1982 1984 1986 1988 1990 1992 1994
Year
Fas
test
to
tal r
ace
per
form
ance
(m
inu
tes)
Women
1996 1998 2000 2002 2004 2006 2008 2010 2012 2014
Polynomial regressionLinear
Figure 3 Overall race time of the annual ten fastest women in ironman Hawaii from 1978 to 2014.Note: The results are presented as mean ± SD.

Open Access Journal of Sports Medicine 2015:6submit your manuscript | www.dovepress.com
Dovepress
Dovepress
280
Knechtle et al
Previous experienceThe number of completed previous triathlon races6 and the
personal best times in Ironman triathlon and in shorter races
such as Olympic distance triathlon16–20 were highly predic-
tive for a fast Ironman race time. In Half-Ironman, faster
athletes had completed more Half-Ironman races than slower
athletes.6 The personal best time in an Olympic distance
triathlon has been found as a strong predictor variable for a
fast Ironman race time in female16,20 and male16,17,19 Ironman
triathletes.
The personal best marathon time has also been found
a strong predictor variable for Ironman race time in both
female20 and male19 triathletes. The personal best marathon
time was significantly and positively related to the run split
time in an Ironman triathlon for male triathletes.17 The com-
bination of both a fast personal best time in marathon and
a fast personal best time in Olympic distance triathlon was
highly predictive for a fast Ironman race time. In male Iron-
man triathletes, running speed during training, personal best
marathon time, and personal best time in an Olympic distance
triathlon were related to Ironman race time and explained
64% of the variance for Ironman race time.17 Previous best
performances in Olympic distance triathlon coupled with
weekly cycling distances and longest training rides could
partially predict (57% of the variance) overall Ironman tri-
athlon performance.16 Additionally, the personal best time
in Ironman triathlons was a strong predictor variable for
Ironman race time in both female and male triathletes.18 For
athletes and coaches, Ironman race time (minutes) might be
partially predicted in men using the formula: Ironman race
time (minutes) = 152.1 minutes + 1.964 × personal best time
in Olympic distance triathlon (minutes) + 1.332 × personal
best time in a marathon (minutes).19 For women, the equation
is Ironman race time (minutes) = 186.3 minutes + 1.595 ×
personal best time in Olympic distance triathlon (minutes) +
1.318 × personal best time in a marathon (minutes).20
Considering male (Table 1) and female (Table 2) win-
ners in “Ironman Hawaii” in the last 11 years from 2004 to
2014, all female and male winners won at least one Ironman
triathlon prior to their victory in “Ironman Hawaii”. Female
winners (Table 2) seemed to have larger previous experi-
ence in Ironman races and shorter races than male winners
(Table 1). In women, several athletes (eg, Mirinda Carfrae,
Leanda Cave, Chrissie Wellington, Michellie Jones, and
Natascha Badmann) finished in Olympic Games, in a World
Championship or in a Continental Championship within
the first three (Table 2). The Swiss triathlete Nicola Spirig
(born 1982) is an outstanding example showing that previ-
ous experience in Olympic distance triathlon and marathon
road running are important predictors for a fast Ironman race
time.21 Nicola Spirig won in November 2014 at the age of
32 years “Ironman Cozumel” in Mexico while competing
in her first Ironman ever. A few months before this victory,
Nicola Spirig came second in the Swiss national champi-
onship in marathon road running and 24th in the European
championship in marathon road running. In spring 2015, she
came second in the “Zürich Marathon”.21 In 2012, Nicola
Spirig was Olympic champion in Olympic distance triathlon
in the London Olympic Games at the age of 30 years. In
2009, 2010, 2011, and 2014, she was European Champion
in Olympic distance triathlon. And during her career, she
won several Half-Ironman triathlons.21
1978 1980 1982 1984 1986 1988 1990 1992 1994
Year1996 1998 2000 2002 2004 2006 2008 2012 20142010
450
500
550
600
650
700
750
800
850
900
950
1,000
1,050 Polynomial regressionLinear
Men
Fas
test
to
tal r
ace
per
form
ance
(m
inu
tes)
Figure 4 Overall race time of the annual ten fastest men in ironman Hawaii from 1978 to 2014.Note: The results are presented as mean ± SD.
Open Access Journal of Sports Medicine 2015:6 submit your manuscript | www.dovepress.com
Dovepress
Dovepress
281
Predictor for ironman performance
Table 1 Male winners in ironman Hawaii in the last eleven editions from 2004 to 2014 with their age at the victory and the previous experience (ie, top three rankings ironman and shorter races at top level) before their victory in ironman Hawaii
Year Name (age, years)
First place (age, years)
Second place (age, years)
Third place (age, years)
Reference
2014 Sebastian Kienle (30) ironman Frankfurt 2014 (30) Half-ironman Las vegas 2013 (29) Half-ironman Las vegas 2012 (28) Half-ironman wiesbaden 2009 (25)
ironman Frankfurt 2012 (28) ironman Roth 2011 (27) ironman Roth 2010 (26) Half-ironman wiesbaden 2010 (26)
ironman Hawaii 2013 (29)
83
2013 Frederik van Lierde (34)
ironman Nice 2013 (34) ironman Abu Dhabi 2013 (34) ironman Nice 2012 (33) ironman Nice 2011 (32) ironman Abu Dhabi 2011 (32) Half-ironman Brasschaat 2007 (27)
ironman Nice 2010 (31) ironman Taupo 2008 (28)
ironman Hawaii 2012 (33) ironman Melbourne 2012 (33)
84
2012 Pete Jacobs (30) ironman Australia 2011 (29) ironman Lake Placid 2012 (30) ironman Hawaii 2011 (29) ironman Roth 2009 (27) ironman Australia 2009 (27) ironman Roth 2008 (26) ironman wisconsin 2005 (23) ironman western Australia 2004 (21)
ironman western Australia 2010 (28) ironman Roth 2007 (25)
85
2011 Craig Alexander (38) Half-ironman Las vegas 2011 (38) ironman Coeur d’Alene 2011 (38) ironman Hawaii 2009 (36) ironman Hawaii 2008 (35) Half-ironman Clearwater 2006 (33)
ironman Hawaii (wM) 2007 (34) ironman Australia 2007 (34)
86
2010 Chris McCormack (37) ironman Frankfurt 2008 (35) ironman Roth 2007 (34) ironman Hawaii 2007 (34) ironman Roth 2006 (33) ironman Australia 2006 (33) ironman Roth 2005 (32) ironman Australia 2005 (32) ironman Roth 2004 (31) ironman Australia 2004 (31) ironman Australia 2003 (30) ironman Australia 2002 (29)
ironman Hawaii 2006 (33) ironman Roth 2003 (30)
ironman Frankfurt 2010 (37) ironman Frankfurt 2009 (36)
87
2009 Craig Alexander (36) ironman Hawaii 2008 (35) Half-ironman Clearwater 2006 (33)
ironman Hawaii (wM) 2007 (34) ironman Australia 2007 (34)
86
2008 Craig Alexander (35) Half-ironman Clearwater 2006 (33)
ironman Hawaii (wM) 2007 (34) ironman Australia 2007 (34)
86
2007 Chris McCormack (34) ironman Roth 2006 (33) ironman Australia 2006 (33) ironman Roth 2005 (32) ironman Australia 2005 (32) ironman Roth 2004 (31) ironman Australia 2004 (31) ironman Australia 2003 (30) ironman Australia 2002 (29)
ironman Hawaii 2006 (33) ironman Roth 2003 (30)
87
2006 Normann Stadler (33) ironman Frankfurt 2005 (32) ironman Hawaii 2004 (31) ironman Australia 2001(28) ironman Australia 2000 (27)
ironman Zürich 2004 (31) ironman Hawaii 2000 (27)
88
2005 Faris Al-Sultan (27) ironman Arizona 2005 (27) ironman Roth 2004 (26) ironman Brasil 2001 (23)
ironman Hawaii 2004 (26)
89
2004 Normann Stadler (31) ironman Australia 2001(28) ironman Australia 2000 (27)
ironman Zürich 2004 (31) ironman Hawaii 2000 (27)
88
Abbreviation: wM, world Championship.

Open Access Journal of Sports Medicine 2015:6submit your manuscript | www.dovepress.com
Dovepress
Dovepress
282
Knechtle et al
Table 2 Female winners in ironman Hawaii in the last eleven editions from 2004 to 2014 with their age at the victory and the previous experience (ie, top three rankings ironman and shorter races at top level) before their victory in ironman Hawaii
Year Name (age, years)
First place (age, years)
Second place (age, years)
Third place (age, years)
Reference
2014 Mirinda Carfrae (33)
ironman Roth 2014 (33) ironman Hawaii 2013 (32) ironman Hawaii 2010 (29) Half-ironman Clearwater 2007 (26)
ironman Florida 2012 (31) ironman Hawaii 2011 (30) ironman New Zealand 2011 (30) ironman Hawaii 2009 (28) iTU world Long Distance Triathlon Championship 2005 (24) iTU Triathlon world Championship U23 2003 (22)
ironman Hawaii 2012 (31) ironman Melbourne 2012 (31) Half-ironman Clearwater 2006 (25)
90
2013 Mirinda Carfrae (32)
ironman Hawaii 2010 (29) Half-ironman Clearwater 2007 (26)
ironman Florida 2012 (31) ironman Hawaii 2011 (30) ironman New Zealand 2011 (30) ironman Hawaii 2009 (28) iTU world Long Distance Triathlon Championship 2005 (24) iTU Triathlon world Championship U23 2003 (22)
ironman Hawaii 2012 (31) ironman Melbourne 2012 (31) Half-ironman Clearwater 2006 (25)
90
2012 Leanda Cave (34)
Half-ironman Las vegas 2012 (34) ironman Arizona 2011 (33) iTU Triathlon Long Distance world Championships 2007 (29) iTU Triathlon Short Distance world Championships 2002 (24) eTU european Triathlon Short Distance Championships U23 2001 (23)
iTU Triathlon Long Distance world Championships 2011 (33) ironman Abu Dhabi 2010 (32) Half-ironman Clearwater 2010 (32) ironman Arizona 2008 (30) eTU european Triathlon Short Distance Championships 2002 (24)
ironman Hawaii 2011 (33) ironman Arizona 2011 (33) Half-ironman Clearwater 2007 (29)
91
2011 Chrissie wellington (34)
ironman Roth 2011 (34) ironman South Africa 2011 (34) ironman Arizona 2010 (33) ironman Roth 2010 (33) ironman Hawaii 2009 (32) ironman Roth 2009 (32) ironman Australia 2009 (32) ironman Hawaii 2008 (31) iTU Triathlon Long Distance world Championships 2008 (31) ironman Germany 2008 (31) ironman Australia 2008 (31) ironman Hawaii 2007 (30) ironman Korea 2007 (30) iTU Triathlon world Championship 2006 (29)
92
2010 Mirinda Carfrae (29)
Half-ironman Clearwater 2007 (26) ironman Hawaii 2009 (28) iTU world Long Distance Triathlon Championship 2005 (24) iTU Triathlon world Championship U23 2003 (22)
Half-ironman Clearwater 2006 (25)
90
2009 Chrissie wellington (32)
ironman Roth 2009 (32) ironman Australia 2009 (32) ironman Hawaii 2008 (31) iTU Triathlon Long Distance world Championships 2008 (31) ironman Germany 2008 (31) ironman Australia 2008 (31) ironman Hawaii 2007 (30) ironman Korea 2007 (30) iTU Triathlon world Championship 2006 (29)
92
(Continued)
Open Access Journal of Sports Medicine 2015:6 submit your manuscript | www.dovepress.com
Dovepress
Dovepress
283
Predictor for ironman performance
SexMen were faster than women in triathlon races,7,22–24 but
differences between the sexes exist for split performances.7
In athletes competing between 1988 and 2007 in “Ironman
Hawaii”, the sex difference in performance time was signifi-
cantly smaller for swimming (9.8%) compared with cycling
(12.7%) and running (13.3%).7 During this period, the sex
difference in swimming remained stable while it slightly
increased in cycling but decreased in running.7 In “Ironman
Switzerland” during the 1996–2010 period, the sex difference
in running (18.2%) was greater compared with swimming
(14.0%) and cycling (13.2%). There was a decrease in the
sex difference in performance in the three disciplines and
for overall race time.12 In Half-Ironman11 and Ironman23
triathlon races, the sex difference depended upon the age
of the athletes. In “Ironman Hawaii”, the sex difference for
overall race time was stable until the age of ∼55 years and
increased thereafter.23
TrainingTraining characteristics showed an important influence on
Ironman triathlon race time.17,18,25 Faster finishers (ie, race
time faster than 10:30 h:min in “Ironman Hawaii”) tended
to average greater training volumes at faster paces than
Table 2 (Continued)
Year Name (age, years)
First place (age, years)
Second place (age, years)
Third place (age, years) Reference
2008 Chrissie wellington (31)
iTU Triathlon Long Distance world Championships 2008 (31) ironman Germany 2008 (31) ironman Australia 2008 (31) ironman Hawaii 2007 (30) ironman Korea 2007 (30) iTU Triathlon world Championship 2006 (29)
92
2007 Chrissie wellington (30)
ironman Korea 2007 (30) iTU Triathlon world Championship 2006 (29)
92
2006 Michellie Jones (37)
ironman Arizona 2006 (37) ironman Florida 2004 (35) iTU Triathlon Short Distance world Championships 1993 (24) iTU Triathlon Short Distance world Championships 1992 (23)
ironman Hawaii 2005 (36) iTU Triathlon Short Distance world Championships 2001 (32) Triathlon Olympic Games 2000 (31) iTU Triathlon Short Distance world Championships 1998 (29)
iTU Triathlon Short Distance world Championships 2003 (34) iTU Triathlon Short Distance world Championships 2000 (31) iTU Triathlon Short Distance world Championships 1997 (28) iTU Triathlon Short Distance world Championships 1991 (22)
93
2005 Natascha Badmann (38)
ironman South Africa 2005 (38) ironman Hawaii 2004 (37) ironman Hawaii 2002 (35) ironman Hawaii 2001 (34) ironman California 2001 (34) ironman Hawaii 2000 (33) ironman Hawaii 1998 (31) eTU european Triathlon Short Distance Championship 1997 (30)
ironman Hawaii 2003 (36) iTU Triathlon Long Distance world Championships 2000 (33) ironman Hawaii 1996 (29) eTU european Triathlon Short Distance Championship 1995 (28) eTU european Triathlon Short Distance Championship 1994 (27)
94
2004 Natascha Badmann (37)
ironman Hawaii 2002 (35) ironman Hawaii 2001 (34) ironman California 2001 (34) ironman Hawaii 2000 (33) ironman Hawaii 1998 (31) eTU european Triathlon Short Distance Championship 1997 (30)
ironman Hawaii 2003 (36) iTU Triathlon Long Distance world Championships 2000 (33) ironman Hawaii 1996 (29) eTU european Triathlon Short Distance Championship 1995 (28) eTU european Triathlon Short Distance Championship 1994 (27)
94
Abbreviations: eTU, european Triathlon Union; iTU, international Triathlon Union.

Open Access Journal of Sports Medicine 2015:6submit your manuscript | www.dovepress.com
Dovepress
Dovepress
284
Knechtle et al
slower finishers.26 However, sex differences exist for training
characteristics regarding their association with Ironman race
time18 although female and male Ironman triathletes show no
differences between volume and speed in training.26 A sum-
mary of recent studies showed that weekly training hours in
swimming, cycling, and running were similar between female
and male Ironman triathletes (Table 3). However, men were
training more kilometers and at a higher speed compared
with women (Table 3).
This results in different associations between training
characteristics and both split and overall race times. Overall
weekly training hours were related to Ironman race perfor-
mance in women18 but not in men.27 Running speed during
training was related to marathon split time in female Iron-
man triathletes28 and to overall race time in male Ironman
triathletes.17 In male Ironman triathletes, weekly swimming
kilometers were related to the swim split time29 and speed
in cycling training was related to split time in cycling in the
Ironman.29–31 In female Ironman triathletes, weekly cycling
kilometers were related to overall race time.20 Considering
swimming, no associations were reported for female Iron-
man triathletes.
The intensity during training also influences Ironman race
time where a lower training intensity was associated with
faster race times.32 Ironman triathletes trained mainly at a
low intensity (ie, zone 1, low intensity, , aerobic threshold),
whereas the Ironman race was primarily performed at the
intensity in zone 2 (ie, moderate intensity, between aerobic
and anaerobic threshold).32 There was a significant inverse
correlation between both total training time and training
time in zone 1 and Ironman race time.32 In contrast, a mod-
erate and positive correlation between total training time in
zone 2 and Ironman race time and a strong positive correla-
tion between percentage of total training time in zone 2 and
Ironman race time was reported.32 In other terms, a too high
intensity during Ironman training might be a disadvantage
for a fast race performance.
Anthropometric characteristicsAnthropometric characteristics are of high importance for
Ironman race performance.18,33–35 Kandel et al showed that
somatotype was a strong predictor variable of Ironman
race performance in male athletes competing in “Ironman
Switzerland” where the endomorphy component (ie, having
a rounded, stocky body structure with a tendency to obesity)
was the most important predictor.33 A reduction in endomor-
phy and an increase in ectomorphy (ie, having a light, slender
body structure) leads to significant and substantial improve-
ments in Ironman race performance.33 Lower body mass,
lower body mass index, and lower body fat were associated
with both a faster Ironman race and a faster run split.34
Among the anthropometric characteristics, body fat was
the most important predictor variable for Half-Ironman6 and
Ironman27,29–31,34,36,37 race performance. In Half-Ironman,
faster athletes had lower body fat than slower ones.6 Percent
body fat was differentially related to split and overall perfor-
mance regarding the sex of the athletes.18 In male Ironman
triathletes, percent body fat was inversely related to overall
race time18,27,37 and in the split times in cycling37 and running.29
In female Ironman triathletes, however, percent body fat was
not related to overall Ironman race time.18,20,27
Skin-fold thicknesses were important for split and overall
race time in Ironman triathlon.31 However, differences do
exist between the sexes in skin-fold thicknesses.37 In male
Ironman triathletes, the skin-fold thicknesses at abdominal
and iliacal site were associated with race time. The abdominal
and iliacal skin-fold thicknesses were related to cycling split
times in the Ironman race.31 The sum of upper body skinfolds
Table 3 weekly volume in hours (h) and kilometers (km) and speed in training (km/h) in female and male ironman triathletes
Total Swimming Cycling Running Reference
h h km km/h h km km/h h km km/h
Men 13.5 2.4 6.4 3.0 7.3 206.0 29.0 3.7 41.0 11.7 3614.7 6.0 2.8 189.6 28.1 44.8 11.2 1714.8 2.5 6.7 2.7 8.0 220.5 27.3 4.0 42.0 10.0 2713.9 2.6 6.3 2.9 7.1 194.4 28.4 4.3 45.0 11.6 19
8.8 270.0 58.2 1613.9 2.5 6.2 2.9 7.1 194.0 28.4 4.3 45.0 11.5 34
Mean ± SD 14.2±0.7 2.5±0.1 6.8±1.1 2.8±0.1 7.5±0.5 216.1±32.4 28.2±0.7 4.0±0.3 46.2±6.9 11.1±0.8women 13.9 2.4 5.5 2.1 7.5 192.3 25.0 4.0 45.0 10.3 27
5.5 190.0 42.0 3914.1 2.8 6.2 2.8 7.4 196.6 26.0 4.1 41.0 10.7 31
Mean ± SD 14.0±0.1 2.6±0.3 5.4±0.4 2.4±0.5 7.4±0.1 192.9±3.3 25.5±0.7 4.0±0.1 42.7±2.1 10.5±0.3
Abbreviation: SD, standard deviation.

Open Access Journal of Sports Medicine 2015:6 submit your manuscript | www.dovepress.com
Dovepress
Dovepress
285
Predictor for ironman performance
and the sum of eight skinfolds were related to cycling speed
in the cycle split and to overall race time.37 In females Iron-
man triathletes, however, none of the skinfold thicknesses
showed an association with overall race time or speed in the
split disciplines in the Ironman race.37
Limb circumferences were related to Ironman split times.
In male Ironman triathletes, lower circumferences of upper
arm and thigh were related to a faster run split.34 Upper arm
circumference was also related to overall race time.30
A further aspect regarding anthropometry is the loss in
body mass during a triathlon race such as a Half-Ironman.38
For example, in a Half-Ironman, the change in body mass
correlated positively with race time where greater reductions
in body mass were found in faster athletes.38 In Ironman
triathletes, however, changes in body mass differ between
the sexes.39,40 While male Ironman triathletes lost body mass
during the race,40,41 body mass remained unchanged in female
Ironman triathletes.39 The loss in body mass in male Ironman
triathletes was mainly due to a loss in skeletal muscle mass
due to glycogen depletion.41,42
Origin of the athletesThe “Ironman Hawaii” was invented in Hawaii, USA.43 Since
its first edition, women and men from the USA dominated
both participation and performance in “Ironman Hawaii”.44
Between 1985 and 2012, most of the finishers originated
from the USA (47.5%) followed by athletes from Germany
(11.7%), Japan (7.9%), Australia (6.7%), Canada (5.2%),
Switzerland (2.9%), France (2.3%), Great Britain (2.0%),
New Zealand (1.9%), and Austria (1.5%).44 Regarding the
fastest race times ever, the fastest women originated from the
USA followed by Great Britain, and Switzerland. In men,
the fastest finishers originated from the USA, Germany, and
Australia.44
For the qualifiers for “Ironman Hawaii”, however, dif-
ferences do exist when all finishers in 2010 in both “Iron-
man Hawaii” and in the qualifier races were analyzed.3
Considering sex, a higher percentage of women (27.2%)
finished in “Ironman Hawaii” compared with the qualifier
races where only 18.9% of women finished. Considering
men, however, a higher percentage (81.1%) finished in the
qualifiers compared with “Ironman Hawaii” where only
72.8% finished.3 Most of the finishers originated from the
USA in both “Ironman Hawaii” and its qualifier races. Behind
US-athletes, competitors from Germany and Canada finished
also very frequently.3 When sex and origin was investigated,
there were also differences in “Ironman Hawaii” and its
qualifier races. In “Ironman Hawaii”, the percentage of
women was lower for US and Canadian athletes and higher
for German athletes. For men, the percentage was higher for
athletes from the USA and Germany but lower for athletes
from Canada.3
Apart from the differences in participation and finishers
trends, there were also differences in performance trends
between “Ironman Hawaii” and its qualifier races. Overall
races times were faster in both women and men in the quali-
fier races compared with “Ironman Hawaii”.3 In the qualifier
races, the fastest women originated from the USA, Germany,
and Switzerland. In “Ironman Hawaii”, however, women
from the USA, Australia, and Germany achieved the fastest
race times.3 Women from Germany, Canada, Switzerland,
and New Zealand competed faster in the qualifier races than
in “Ironman Hawaii”.3 For men, athletes from Germany,
Australia, and Great Britain obtained the fastest race times
in the qualifier races.3 In “Ironman Hawaii”, US American,
German, and Australian finishers were the fastest.3 Men from
France, Great Britain, Switzerland, and Canada were faster in
the qualifier races compared with “Ironman Hawaii”.3 Most
probably the qualifying system for “Ironman Hawaii” is not
respecting the different nationalities of the athletes.
Physiological characteristicsElite triathletes have high values for maximum oxygen
uptake (VO2max).45 Although VO
2max is a predictor of
performance in triathletes of mixed abilities, it cannot be
used to predict performance within homogenous groups of
elite performers.45 Elite triathletes have significantly higher
VO2max values than subelite triathletes, and high VO
2max
levels are required to succeed in triathlons.45 VO2max was
higher in male compared with female Ironman triathletes.46
VO2max at maximal exercise was, for males and females,
respectively, 68.8 mL kg−1 min−1, 65.9 mL kg−1 min−1 on the
treadmill, 66.7 mL kg−1 min−1, 61.6 mL kg−1 min−1 on the cycle
ergometer, and 49.1 mL kg−1 min−1, 39.7 mL kg−1 min−1 on
the arm ergometer.46 In contrast to elite Ironman triathletes,46
recreational Ironman triathletes have lower values for male
(58.1±8.6 mL kg−1 min−1) and female (52.8±5.7 mL kg−1
min−1) Ironman triathletes.47
Laboratory results may be used to predict triathlon race
performance.48–52 For Olympic distance triathlon, the five most
significant predictors of triathlon performance were blood
lactate measured during steady-state cycling at a workload
of 4 W kg−1 body mass, blood lactate while running at 15
km/hour, peak sustained power output, peak treadmill run-
ning velocity, and VO2peak during cycling.52 The intensity
at anaerobic threshold has been shown to be too high for the

Open Access Journal of Sports Medicine 2015:6submit your manuscript | www.dovepress.com
Dovepress
Dovepress
286
Knechtle et al
required intensity during an Ironman triathlon, and VO2 values
at the lactate (ie, exercise intensity at which lactate starts to
accumulate in the blood) and ventilatory thresholds (ie, point
during exercise at which pulmonary ventilation becomes
disproportionately high with respect to oxygen consumption)
were not highly related to bike finish time.49 VO2 at anaerobic
threshold, percentage of VO2max at anaerobic threshold, and
peak power to body mass ratio were not related to Ironman
race times.53 Regarding split disciplines, fractional utilization
of peak VO2 (% peak VO
2), heart rate, and % peak heart rate
at thresholds were not related to bike finish time.51 Ironman
triathletes cycled during the Ironman race at a heart rate
intensity that approximated to heart rate at the ventilatory
threshold but at a power output that was significantly below
power output at the ventilatory threshold.50
A long-distance triathlon such as a Half-Ironman also
leads to changes in laboratory results. Puggina et al showed
an increase in creatinine in the blood and an increased
excretion of protein, erythrocytes and leucocytes in the
urine.54 In male Ironman triathletes, seasonal relationships
between hematology and lymphocyte function, independent
of endurance training were found and possibly affecting
performance.55 After an Ironman triathlon, liver enzymes
were considerably increased and remained elevated for
5–6 days after the race.56 Similarly, serum glucose, glycerol,
and nonesterified fatty acids were increased postrace.56
Pacing and performance in split disciplinesPacing and the performances in the single split disciplines
were also related to Ironman race performance.54,55 There
were differences regarding the performance in the split dis-
ciplines swimming, cycling, and running. In long-distance
triathlon, times spent during cycling and running during
the race were significantly related to overall race time.
However, swimming time was not related to overall race
time.53 Pacing during a triathlon also has an influence on
overall performance.57 During an Ironman triathlon, cycling
and running pacing on downhill segments predicted relative
overall race success.58
Other influences on performance in ironman and ultra-triathlonApart from studies investigating associations with potential
predictor variables with race times, also other aspects need
to be addressed to explain the demands for athletes compet-
ing in these races.
Aspects of fluid metabolismSeveral studies investigated fluid59–69 and energy69–71 intake in
Ironman triathlon. For Ironman triathletes, dehydration has
been reported as a cause of fatigue, and exercise-associated
hyponatremia has been highlighted as a major concern during
such races.72 Dehydration and electrolyte balance are impor-
tant for a successful race. Dehydration is common and exer-
cise-associated hyponatremia is the predominant electrolyte
disturbance in the “Ironman Hawaii”.73 An Ironman can lead
to exercise-associated hyponatremia65,67,74 caused mainly by
fluid overload65 as a consequence of excessive drinking.62,74
Especially women seem to be at high risk for complications
due to exercise-associated hyponatremia.75,76 However, also
in male Ironman triathletes, exercise-associated hypona-
tremia can lead to serious problems.77 Ad libitum fluid intake
is the best way to maintain plasma sodium concentration in
Ironman triathletes.78
Changes in body mass were related to changes in
serum [Na+] in both female and male Ironman triathletes.60
Sodium ingestion during an Ironman was associated with
a decrease in the extent of body mass loss. However, there
is no evidence that sodium ingestion significantly influ-
ences changes in serum [Na+] during an Ironman68 most
probably due to the fact that an Ironman is not leading to
large sodium losses.65 However, slowing down during the
marathon in an Ironman could be due to hyperthermia and
a reduction in plasma sodium concentration.79 For a Half-
Ironman, however, oral salt supplementation improved
performance.80 Additionally, oral salt supplementation was
effective to lessen body mass loss and to increase serum
electrolyte concentration.80
Aspects of energy metabolismSeveral studies investigated energy69–71 intake in Ironman
triathlon. Athletes competing in an Ironman triathlon
ingest ∼3,643 kcal and expend ∼11,009 kcal leading to
an energy deficit of ∼7,365 kcal.70 Apart from fluid and
electrolyte metabolism, carbohydrate depletion during an
Ironman triathlon might also impair performance. Overall
Ironman race time was inversely related to carbohydrate
intake during the marathon in male Ironman triathletes
but not for female athletes.71 In both female and male
Ironman triathletes, total carbohydrate intake rates were
negatively correlated to overall race time.69 An increased
carbohydrate intake during the marathon might also be
a useful strategy for improving Ironman performance in
male triathletes.71

Open Access Journal of Sports Medicine 2015:6 submit your manuscript | www.dovepress.com
Dovepress
Dovepress
287
Predictor for ironman performance
Neuromuscular fatigueAn Ironman triathlon is associated with changes in body
composition (ie, decrease in fat and muscle mass) as well as
decreases in neuromuscular function. Peak power, peak veloc-
ity, jump height, and rate of force development decreased dur-
ing an Ironman triathlon.81 Total and positive impulses during
a countermovement jump were reduced after the triathlon,
while both negative impulses were not different before and
after the Ironman.81 Absolute peak force remained constant
during countermovement jump and squat jump.81 Maximal
voluntary ground reaction force and peak stiffness during
multiple one-legged hopping were decreased after the Iron-
man.81 The neuromuscular deficit after the Ironman race was
due to impairments in force transmission, resulting in a lower
average positive force during countermovement jump because
of a slower rate of force development.81 An idea to prevent
muscular problems could be the use of compression socks.
However, Del Coso et al demonstrated for Half-Ironman
triathletes that wearing compression stockings showed no
advantage for maintaining muscle function or reducing blood
markers of muscle damage.82
Limitations and perspectivesData from the selected studies were mainly obtained from
subelite or recreational athletes. Data from elite athletes
competing at world class level are missing. Future studies
should investigate anthropometric and physiological vari-
ables from elite Ironman triathletes. A striking finding is that
mainly athletes from the “first world” such as United States
of America, Germany, Japan, Australia, Canada, Switzerland,
France, Great Britain, New Zealand, and Austria compete in
qualifiers and in “Ironman Hawaii”.3,44 Future studies need
to investigate socioeconomic aspects in Ironman triathlon.
Future studies also need to correlate physiological character-
istics such as VO2max with Ironman race time to investigate
their predictive value for race performance. For “Ironman
Hawaii”, the pacing during the split disciplines, especially
in cycling and running, might be investigated to understand
how these athletes pace during their races. When the personal
best marathon time is a strong predictor variable for Ironman
race time, future studies might investigate the “history” of
Ironman triathletes whether they originate from swimming,
cycling, or running.
ConclusionThe most important predictive variables for a fast Ironman
race time were age of 30–35 years (women and men), a fast
personal best time in Olympic distance triathlon (women
and men), a fast personal best time in marathon (women
and men), high volume and high intensity in training where
a higher volume was more predictive than a higher intensity
(women and men), low body fat, low skin-fold thicknesses
and low circumference of upper arm (only men), and origin
from the United States of America (women and men). Table 4
presents the most important predictors for potential future
Ironman winners. Future studies need to correlate physi-
ological characteristics such as VO2max with Ironman race
performance to investigate whether these characteristics are
predictive for race performance.
DisclosureThe authors report no conflicts of interest in this work.
References1. Ironman World Championship. Available from: http://www.
ironman.com/triathlon/events/americas/ironman/world-championship.aspx#axzz3J9L4ftoT. Accessed March 22, 2015.
2. The 12 Hardest Races in the World. Available from: http://www.fitbie.com/slideshow/12-hardest-races-world. Accessed March 22, 2015.
3. Stiefel M, Knechtle B, Rüst CA, Rosemann T. Analysis of performances at the ‘Ironman Hawaii triathlon’ and its qualifier events with respect to nationality. J Sci Cycling. 2013;2:27–34.
4. Stiefel M, Rüst CA, Rosemann T, Knechtle B. A comparison of partici-pation and performance trends in age group finishers competing in and qualifying for ‘Ironman Hawaii’. Int J Gen Med. 2013;6:67–77.
Table 4 Propose of a new profile of winners
Female Male
Origin from United States . Great Britain . Switzerland
Origin from United States . Germany . Australia
Age 32–33 years Age 32–33 yearsFast personal best time in Olympic distance triathlon (#2:10 h:min)
Fast personal best time in Olympic distance triathlon (#2:32 h:min)
Fast personal best time in marathon running (#3:13 h:min)
Fast personal best time in marathon running (#3:50 h:min)
Low percent body fat (#13%–15% body fat)Low sum of skin-fold thicknesses (eight sites) (#70 mm)Low circumference of upper arm (#30 cm)Low circumference of thigh (#54 cm)weekly training hours (#14 hours)
weekly swimming kilometers (#7 km/week)
weekly cycling kilometers (#190 km/week)
Cycling speed during training (#28 km/h)
Running speed during training (#10.5 km/h)
Running speed during training (#11 km/h)
High maximum oxygen uptake ($66.7 mL kg−1 min−1)
High maximum oxygen uptake ($61.6 mL kg−1 min−1)
Abbreviations: h, hours; min, minutes.

Open Access Journal of Sports Medicine 2015:6submit your manuscript | www.dovepress.com
Dovepress
Dovepress
288
Knechtle et al
5. PubMed.gov [database on the Internet]. Bethesda, MD: National Center for Biotechnology Information, US Library of Medicine. Available from: http://www.ncbi.nlm.nih.gov/pubmed. Accessed March 22, 2015.
6. Gilinsky N, Hawkins KR, Tokar TN, Cooper JA. Predictive variables for half-Ironman triathlon performance. J Sci Med Sport. 2014;17: 300–305.
7. Lepers R, Sultana F, Bernard T, Hausswirth C, Brisswalter J. Age-related changes in triathlon performances. Int J Sports Med. 2010;31: 251–256.
8. Lepers R, Rüst CA, Stapley P, Knechtle B. Relative improvements in endurance performance with age: Evidence from 25 years of Hawaii Ironman racing. Age (Dordr). 2013;35:953–962.
9. Lepers R, Knechtle B, Stapley P. Trends in triathlon performance: effects of sex and age. Sports Med. 2013;43:851–863.
10. Knechtle R, Rüst CA, Rosemann T, Knechtle B. The best triathletes are older in longer race distances – a comparison between Olympic, Half-Ironman and Ironman distance triathlon. SpringerPlus. 2014;3:538.
11. Knechtle B, Rüst CA, Rosemann T, Lepers R. Age- and gender dif-ferences in half-Ironman triathlon performances – the Ironman 70.3 Switzerland from 2007 to 2010. Open Access J Sports Med. 2012;3: 59–66.
12. Stiefel M, Knechtle B, Rüst CA, Rosemann T, Lepers R. The age of peak performance in Ironman triathlon – a cross-sectional and longitudinal data analysis. Extrem Physiol Med. 2013;2:27.
13. Rüst CA, Knechtle B, Knechtle P, Rosemann T, Lepers R. Age of peak performance in elite male and female Ironman triathletes competing in Ironman Switzerland, a qualifier for the Ironman world champion-ship, ‘Ironman Hawaii’ from 1995 to 2011. Open Access J Sports Med. 2012;3:175–182.
14. Gallmann D, Knechtle B, Rüst CA, Rosemann T, Lepers R. Elite triathletes in ‘Ironman Hawaii’ get older but faster. Age (Dordr). 2014;36:407–416.
15. Stiefel M, Knechtle B, Lepers R. Master triathletes have not reached limits in their Ironman triathlon performance. Scand J Med Sci Sports. 2014;24:89–97.
16. Gulbin JP, Gaffney PT. Ultraendurance triathlon participation: typical race preparation of lower level triathletes. J Sports Med Phys Fitness. 1999;39:12–15.
17. Knechtle B, Wirth A, Rosemann T. Predictors of race time in male Iron-man triathletes: physical characteristics, training or pre race experience? Percept Mot Skills. 2010;111:437–446.
18. Knechtle B, Wirth A, Baumann B, Knechtle P, Rosemann T. Personal best time, percent body fat and training volume are differently associ-ated with race time in male and female Ironman triathletes. Res Q Exerc Sport. 2010;81:62–68.
19. Rüst CA, Knechtle B, Knechtle P, Rosemann T, Lepers R. Personal best times in an Olympic distance triathlon and a marathon predict Ironman race time in recreational male triathletes. Open Access J Sports Med. 2011;2:121–129.
20. Rüst CA, Knechtle B, Wirth A, et al. Personal best times in an Olympic distance triathlon and a marathon predict an Ironman race time for recreational female triathletes. Chin J Physiol. 2012;55:156–162.
21. Personal website of Nicola Spirig. Available from: http://www.nicolaspirig.ch/Erfolge.6.0.html. Accessed April 22, 2015.
22. Lepers R. Analysis of Hawaii Ironman performances in elite triathletes from 1981 to 2007. Med Sci Sports Exerc. 2008;40:1828–1834.
23. Lepers R, Maffiuletti NA. Age and gender interactions in ultraendur-ance performance: insight from the triathlon. Med Sci Sports Exerc. 2011;43:134–139.
24. Stevenson JL, Song H, Cooper JA. Age and sex differences pertaining to modes of locomotion in triathlon. Med Sci Sports Exerc. 2013;45: 976–984.
25. Neal CM, Hunter AM, Galloway SD. A 6-month analysis of training-intensity distribution and physiological adaptation in Ironman triathletes. J Sports Sci. 2011;29:1515–1523.
26. O’Toole ML. Training for ultraendurance triathlons. Med Sci Sports Exerc. 1989;21:S209–S213.
27. Knechtle B, Wirth A, Knechtle P, Baumann B, Rosemann T, Senn O. Differential correlations between anthropometry, training volume and performance in male and female Ironman triathletes. J Strength Cond Res. 2010;24:2785–2793.
28. Rüst CA, Knechtle B, Knechtle P, Rosemann T. A comparison of anthropometric and training characteristics between recreational female marathoners and female Ironman triathletes. Chin J Physiol. 2013;56:1–10.
29. Gianoli D, Knechtle B, Knechtle P, Barandun U, Rüst CA, Rosemann T. Comparison between recreational male Ironman triathletes and mara-thon runners. Percept Mot Skills. 2012;115:283–299.
30. Knechtle B, Knechtle P, Rüst CA, Rosemann T. A comparison of anthropometric and training characteristics among Ironman and Triple Iron triathletes. J Sports Sci. 2011;29:1373–1380.
31. Rüst CA, Knechtle B, Knechtle P, Wirth A, Rosemann T. A compari-son of anthropometric and training characteristics among recreational male Ironman triathletes and ultra-endurance cyclists. Chin J Physiol. 2012;55:114–124.
32. Muñoz I, Cejuela R, Seiler S, Larumbe E, Esteve-Lanao J. Training-intensity distribution during an ironman season: relationship with com-petition performance. Int J Sports Physiol Perform. 2014;9:332–339.
33. Kandel M, Baeyens JP, Clarys P. Somatotype, training and performance in Ironman athletes. Eur J Sport Sci. 2014;14:301–308.
34. Knechtle B, Wirth A, Rüst CA, Rosemann T. Relationship between anthropometry and split performance in recreational male Ironman triathletes. Asian J Sports Med. 2011;2:23–30.
35. Silva DA, Benedetti TR, Ferrari EP, et al. Anthropometric profiles of elite older triathletes in the Ironman Brazil compared with those of young Portuguese triathletes and older Brazilians. J Sports Sci. 2012;30:479–484.
36. Bernheim A, Attenhofer Jost CH, et al. The right ventricle best predicts the race performance in amateur Ironman athletes. Med Sci Sports Exerc. 2013;45:1593–1599.
37. Knechtle B, Knechtle P, Rosemann T. Upper body skin-fold thickness is related to race performance in male Ironman triathletes. Int J Sports Med. 2011;32:20–27.
38. Del Coso J, González C, Abian-Vicen J, et al. Relationship between physiological parameters and performance during a half-ironman triathlon in the heat. J Sports Sci. 2014;32:1680–1687.
39. Knechtle B, Wirth A, Baumann B, et al. An ironman triathlon does not lead to a change in body mass in female triathletes. Res Sports Med. 2010;18:115–126.
40. Knechtle B, Baumann B, Wirth A, Knechtle P, Rosemann T. Male Ironman triathletes lose skeletal muscle mass. Asia Pac J Clin Nutr. 2010;19:91–97.
41. Mueller SM, Anliker E, Knechtle P, Knechtle B, Toigo M. Changes in body composition in triathletes during an Ironman race. Eur J Appl Physiol. 2013;113:2343–2352.
42. Cuddy JS, Slivka DR, Hailes WS, Dumke CL, Ruby BC. Metabolic profile of the Ironman World Championships: a case study. Int J Sports Physiol Perform. 2010;5:570–576.
43. The Ironman Story, available from: http://www.ironman.com/triathlon/history.aspx#axzz3J9L4ftoT. Accessed March 22, 2015.
44. Dähler P, Rüst CA, Rosemann T, Lepers R, Knechtle B. Nation related participation and performance trends in ‘Ironman Hawaii’ from 1985 to 2012. BMC Sports Sci Med Rehabil. 2014;6:16.
45. Sleivert GG, Rowlands DS. Physical and physiological factors associ-ated with success in the triathlon. Sports Med. 1996;22:8–18.
46. O’Toole ML, Hiller DB, Crosby LO, Douglas PS. The ultraendurance triathlete: a physiological profile. Med Sci Sports Exerc. 1987;19: 45–50.
47. Leischik R, Spelsberg N. Endurance sport and “cardiac injury”: a prospective study of recreational ironman athletes. Int J Environ Res Public Health. 2014;11:9082–9100.

Open Access Journal of Sports Medicine 2015:6 submit your manuscript | www.dovepress.com
Dovepress
Dovepress
289
Predictor for ironman performance
48. Hue O. Prediction of drafted-triathlon race time from submaximal labora-tory testing in elite triathletes. Can J Appl Physiol. 2003;28:547–560.
49. Laursen PB, Rhodes EC. Factors affecting performance in an ultraen-durance triathlon. Sports Med. 2001;31:195–209.
50. Laursen PB, Rhodes EC, Langill RH, McKenzie DC, Taunton JE. Relationship of exercise test variables to cycling performance in an Ironman triathlon. Eur J Appl Physiol. 2002;87:433–440.
51. O’Toole ML, Douglas PS, Hiller WD. Lactate, oxygen uptake, and cycling performance in triathletes. Int J Sports Med. 1989;10:413–418.
52. Schabort EJ, Killian SC, St Clair Gibson A, Hawley JA, Noakes TD. Prediction of triathlon race time from laboratory testing in national triathletes. Med Sci Sports Exerc. 2000;32:844–849.
53. Whyte G, Lumley S, George K, et al. Physiological profile and predic-tors of cycling performance in ultra-endurance triathletes. J Sports Med Phys Fitness. 2000;40:103–109.
54. Puggina EF, Machado DR, Tourinho Filho H, Barbanti VJ. Half-ironman induces changes in the kidney function of triathletes. An Acad Bras Cienc. 2014;86:429–436.
55. Broadbent S. Seasonal changes in haematology, lymphocyte transferrin receptors and intracellular iron in Ironman triathletes and untrained men. Eur J Appl Physiol. 2011;111:93–100.
56. Holly RG, Barnard RJ, Rosenthal M, Applegate E, Pritikin N. Triathlete characterization and response to prolonged strenuous competition. Med Sci Sports Exerc. 1986;18:123–127.
57. Wu SS, Peiffer JJ, Brisswalter J, Nosaka K, Abbiss CR. Factors influenc-ing pacing in triathlon. Open Access J Sports Med. 2014;5:223–234.
58. Johnson EC, Pryor JL, Casa DJ, et al. Bike and run pacing on downhill segments predict Ironman triathlon relative success. J Sci Med Sport. 2015;18:82–87.
59. Sharwood K, Collins M, Goedecke J, Wilson G, Noakes T. Weight changes, sodium levels, and performance in the South African Ironman Triathlon. Clin J Sport Med. 2002;12:391–399.
60. Pahnke MD, Trinity JD, Zachwieja JJ, Stofan JR, Hiller WD, Coyle EF. Serum sodium concentration changes are related to fluid balance and sweat sodium loss. Med Sci Sports Exerc. 2010;42: 1669–1674.
61. Rüst CA, Knechtle B, Knechtle P, Rosemann T. Higher prevalence of exercise-associated hyponatremia in triple iron ultra-triathletes than reported for ironman triathletes. Chin J Physiol. 2012;55:147–155.
62. Speedy DB, Noakes TD, Rogers IR, et al. Hyponatremia in ultradistance triathletes. Med Sci Sports Exerc. 1999;31:809–815.
63. Speedy DB, Rogers IR, Noakes TD, et al. Exercise-induced hypona-tremia in ultradistance triathletes is caused by inappropriate fluid retention. Clin J Sport Med. 2000;10:272–278.
64. Speedy DB, Rogers IR, Noakes TD, et al. Diagnosis and preven-tion of hyponatremia at an ultradistance triathlon. Clin J Sport Med. 2000;10:52–58.
65. Speedy DB, Noakes TD, Rogers IR, et al. A prospective study of exercise-associated hyponatremia in two ultradistance triathletes. Clin J Sport Med. 2000;10:136–141.
66. Speedy DB, Noakes TD, Kimber NE, et al. Fluid balance during and after an ironman triathlon. Clin J Sport Med. 2001;11:44–50.
67. Speedy DB, Noakes TD, Boswell T, Thompson JM, Rehrer N, Boswell DR. Response to a fluid load in athletes with a history of exercise induced hyponatremia. Med Sci Sports Exerc. 2001;33: 1434–1442.
68. Speedy DB, Thompson JM, Rodgers I, Collins M, Sharwood K, Noakes TD. Oral salt supplementation during ultradistance exercise. Clin J Sport Med. 2002;12:279–284.
69. Pfeiffer B, Stellingwerff T, Hodgson AB, et al. Nutritional intake and gastrointestinal problems during competitive endurance events. Med Sci Sports Exerc. 2012;44: 344–351.
70. Barrero A, Erola P, Bescós R. Energy balance of triathletes during an ultra-endurance event. Nutrients. 2014;7:209–222.
71. Kimber NE, Ross JJ, Mason SL, Speedy DB. Energy balance during an ironman triathlon in male and female triathletes. Int J Sport Nutr Exerc Metab. 2002;12:47–62.
72. Robins A. Nutritional recommendations for competing in the Ironman triathlon. Curr Sports Med Rep. 2007;6:241–248.
73. Hiller WD. Dehydration and hyponatremia during triathlons. Med Sci Sports Exerc. 1989;21:S219–S221.
74. Noakes TD, Sharwood K, Collins M, Perkins DR. The dipsomania of great distance: water intoxication in an Ironman triathlete. Br J Sports Med. 2004;38:E16.
75. Richter S, Betz C, Geiger H. Severe hyponatremia with pulmonary and cerebral edema in an Ironman triathlete. Dtsch Med Wochenschr. 2007;132:1829–1832.
76. Severac M, Orban JC, Leplatois T, Ichai C. A near-fatal case of exercise-associated hyponatremia. Am J Emerg Med. 2014;32:813. e1–813. e2.
77. Stefanko G, Lancashire B, Coombes JS, Fassett RG. Pulmonary oedema and hyponatraemia after an ironman triathlon. BMJ Case Rep. Epub August 17, 2009.
78. Meyer M, Knechtle B, Bürge J, et al. Ad libitum fluid intake leads to no leg swelling in male Ironman triathletes – an observational field study. J Int Soc Sports Nutr. 2012;9:40.
79. Laursen PB, Watson G, Abbiss CR, Wall BA, Nosaka K. Hyperthermic fatigue precedes a rapid reduction in serum sodium in an ironman tri-athlete: a case report. Int J Sports Physiol Perform. 2009;4:533–537.
80. Del Coso J, González-Millán C, Salinero JJ, et al. Effects of oral salt supplementation on physical performance during a half-ironman: a randomized controlled trial. Scand J Med Sci Sports. Epub February 14, 2015.
81. Mueller SM, Knechtle P, Knechtle B, Toigo M. An Ironman triathlon reduces neuromuscular performance due to impaired force transmission and reduced leg stiffness. Eur J Appl Physiol. 2015;115:795–802.
82. Del Coso J, Areces F, Salinero JJ, et al. Compression stockings do not improve muscular performance during a half-ironman triathlon race. Eur J Appl Physiol. 2014;114:587–595.
83. Personal website of Sebastian Kienle. Available from: http://www.sebastiankienle.de. Accessed April 22, 2015.
84. Personal website of Frederik Van Lierde. Available from: http://www.frederikvanlierde.com. Accessed April 22, 2015.
85. Personal website of Pete Jacobs. Available from: http://www.petejacobs.com. Accessed April 22, 2015.
86. Personal website of Craig Alexander. Available from: http://www.craigalexander.net. Accessed April 22, 2015.
87. Personal website of Chris McCormack. Available from: http://www.chrismccormack.com. Accessed April 22, 2015.
88. Personal website of Norman Stadler. Available from: http://www.normann-stadler.de. Accessed April 22, 2015.
89. Personal website of Faris Al-Sultan. Available from: http://www.faris-al-sultan.de. Accessed April 22, 2015.
90. Personal website of Mirinda Carfrae. Available from: http://mirindacarfrae.com. Accessed April 22, 2015.
91. Personal website of Leanda Cave. Available from: http://leandacave.com. Accessed April 22, 2015.
92. Personal website of Chrissie Wellington. Available from: http://www.chrissiewellington.org. Accessed April 22, 2015.
93. International Triathlon Union. [webpage on the Internet]. Race results for Michellie Jones. Available from: http://www.triathlon.org/athletes/results/5499/michellie_jones. Accessed April 22, 2015.
94. SportsStats World. [webpage on the Internet]. Race results for Natascha Badmann. http://www.9stunden.com/?id=2. Accessed April 22, 2015.

Open Access Journal of Sports Medicine
Publish your work in this journal
Submit your manuscript here: http://www.dovepress.com/open-access-journal-of-sports-medicine-journal
Open Access Journal of Sports Medicine is an international, peer-reviewed, open access journal publishing original research, reports, reviews and commentaries on all areas of sports medicine. The manuscript management system is completely online and includes a very quick and fair peer-review system.
Visit http://www.dovepress.com/testimonials.php to read real quotes from published authors.
Open Access Journal of Sports Medicine 2015:6submit your manuscript | www.dovepress.com
Dovepress
Dovepress
Dovepress
290
Knechtle et al


