Embed Size (px)
Citation preview
Journal of Sports Analytics 7 (2021) 169–183DOI 10.3233/JSA-200480IOS Press
169
Predicting the winning percentage oflimited-overs cricket using the Pythagoreanformula
Hasika K.W. Senevirathnea and Ananda B. W. Manageb,∗aDepartment of Mathematics & Statistics, Old Dominion University, Norfolk, Virginia, USAbDepartment of Mathematics & Statistics, Sam Houston State University, Huntsville, Texas, USA
Abstract. The Pythagorean Win-Loss formula can be effectively used to estimate winning percentages for sporting events.This formula was initially developed by baseball statistician Bill James and later was extended by other researchers to sportssuch as football, basketball, and ice hockey. Although one can calculate actual winning percentages based on the outcomesof played games, that approach does not take into account the margin of victory. The key benefit of the Pythagorean formulais its utilization of actual average runs scored and actual average runs allowed. This article presents the application of thePythagorean Win-Loss formula to two different types of limited-overs cricket formats, namely One Day International cricket(ODI) and Twenty20 cricket. The data for the application was used from the matches played by the top 10 International CricketCouncil (ICC) members who participated in the 2019 ICC Cricket World Cup. For matches for which the second battingteam won, runs scored were estimated by considering the remaining amount of resources, based on the Duckworth–Lewismethod.
Keywords: Pythagorean formula, winning percentage, runs allowed, runs scored, maximum likelihood, least squares
1. Introduction
The Pythagorean Win-Loss formula, which wasdeveloped by Bill James in the early 1980s, is a sportsanalytics formula that can be effectively used to cal-culate winning percentages for sporting events. Thiscalculation is based on the average number of runsscored (RS) and the average number of runs allowed(RA) by a team. In particular, the Pythagorean Win-Loss formula with Pythagorean exponent γ is givenas follows.
Winning Percentage = RSγ
RSγ + RAγ (1)
One can directly predict the expected number ofmatches a team will win in a future series based on
∗Corresponding author: Ananda B. W. Manage, Departmentof Mathematics & Statistics, Sam Houston State University,Huntsville, Texas, USA. E-mail: [email protected].
the observed winning percentage for the period so far.For example, the observed winning percentage of thematches played from the end of the last ODI cricketworld cup to the beginning of the next world cup canbe used to predict the number of matches expected tobe won by a team in the next world cup. One can do abetter prediction using the Pythagorean winning per-centage, which can be calculated using Equation (1).The added value of the Pythagorean winning percent-age over the regular winning percentage is that it takesinto account more accurate defensive and offensivestrengths of the teams by using the actual runs scoredand actual runs allowed. The regular winning percent-age does not have a way to accommodate the actualscores and it uses the binary outcome of a game (winor lose). However, with the appropriate Pythagoreanexponent (γ), the Pythagorean winning percentageutilizes additional information of the actual scores,which in return provides predictions that are more
ISSN 2215-020X © 2021 – The authors. Published by IOS Press. This is an Open Access article distributed under the termsof the Creative Commons Attribution-NonCommercial License (CC BY-NC 4.0).
170 H.K.W. Senevirathne and A.B.W. Manage / Limited-overs cricket using the Pythagorean formula
practical. Initially, this formula was used by base-ball statisticians, and the Pythagorean exponent wasassumed to be 2. However, a later empirical studyby Miller (2006) has shown that a better agreementcan be attained when the exponent was about 1.82.Miller (2006) was also the first to show the theoreticaljustification of the formula by assuming indepen-dent Weibull distributions for runs scored and runsallowed. Often this formula is used to predict the endof the season standing of a team, based on its per-formance halfway through the season (Miller, 2006).Several researchers have used this Pythagorean for-mula to determine the winning percentages of othersports as well by finding appropriate γ values for thespecific sport. According to Schatz (2003), statis-tician Daryl Morey’s research has proven that thePythagorean formula can be applied to all the majorsports, with different exponents for each; in particu-lar, he has shown that theγ value for National FootballLeague (NFL) was about 2.37. Dayaratna and Miller(2012) have shown that the Pythagorean Win-Lossformula can be used as an evaluative tool in hockey.They have further shown that the maximum likeli-hood estimate of γ is almost always slightly above2 for all three National Hockey League (NHL) sea-sons they considered. Oliver (2004) has shown thatthe appropriate value of γ for basketball is around14. Rosenfeld et al. (2010) have used the formula topredict overtime outcomes in the National FootballLeague (NFL), Major League Baseball (MLB), andNational Basketball Association (NBA). Heumann(2016) described a new version of the Win-Loss for-mula, which was called pairwise Pythagorean win.Chen and Li (2018) have introduced a shrinkagefactor to increase the accuracy of the PythagoreanWin-Loss formula.
Application of the Pythagorean formula to crickethas been more limited, as the authors are aware ofonly a single relevant study. In that study, Vine (2016)used the Pythagorean formula to estimate the win-ning percentage of the Twenty20 Cricket Big BashLeague, an Australian domestic competition. Vine(2016) has further shown that the appropriate γ valuefor the Twenty20 Cricket Big Bash League was 7.41.Vine (2006) also suggested that for the cases wherethe second batting team wins the match without usingall the allocated resources, the dependency issuebetween runs scored and runs allowed could be elim-inated by extrapolating the second team’s run total,by using the Duckworth–Lewis resources table. It isobvious that, as in any other sport, there could be asignificant difference in the performance parameters
between international level games and regional levelgames such as Big Bash League. Our effort in thispaper is therefore to extend Vine’s results to interna-tional limited over cricket. Specifically, the objectiveof this paper is to calculate the winning percentage ofthe top 10 teams of the International Cricket Coun-cil (ICC); in particular, the goal is to estimate theappropriate Pythagorean exponent for both of thelimited-over cricket formats, Twenty20 and One DayInternational (ODI).
1.1. Limited-overs cricket
Cricket is one of the most popular games in theworld, especially among Commonwealth countries.The three main types of cricket matches are testcricket, One Day International (ODI), and Twenty20.The two formats, ODI and Twenty20 cricket matches,have a limited number of overs and are known aslimited-overs cricket. An over consists of six deliv-eries from bowler to batsman. An innings in ODIand Twenty20 consists of 50 overs and 20 oversrespectively. For all major cricket formats, a teamconsists of 11 players, and the match starts with acoin toss to determine the first batting team. Thatteam’s goal is to score the maximum number of runsby using the available resources (number of oversand wickets). The second batting team then attemptsto score at least one more run than the first team’stotal. If they succeed, the second batting team winsthe match, but if they fail, the first batting teamwins.
Duckworth and Lewis (1998) introduced a wayof revising targets for games that are shortened dueto weather interruptions. This is the current methodused by the ICC to revise the target for weather inter-rupted cricket matches. It is based on the idea that thebatting team has two resources: (i) a certain num-ber of overs to face and (ii) a limited number ofwickets in hand. Based on a mathematical model, theDuckworth-Lewis method provides a table with theremaining percentage resources at any given stageof a game. For example, at the beginning, a teamwith all the wickets and all the overs remaining, has100% of the resources. If it rains, and the game isdelayed by several overs, then the team does notget the 100% resource available to that team. TheDuckworth-Lewis method is used to calculate therevised target based on the remaining percentageof resources after the interruption is over. Completedetails of the method can be found in Duckworth andLewis (1998), which provides a two-way table for the
H.K.W. Senevirathne and A.B.W. Manage / Limited-overs cricket using the Pythagorean formula 171
available number of overs and the number of wicketslost, to ease calculations.
In particular, for our study, if the second battingteam wins the match with wickets and overs arestill remaining, their total will be extrapolated usingthe Duckworth-Lewis resources table, as suggestedby Vine (2016). In cricket, when the second bat-ting team surpasses the target score set by the firstbatting team, the game ends, and the second teamis declared as the winner. However, had the secondteam been given the opportunity, it would have con-tinued to score while using the remaining amountof resources allocated to it. When the game endsthis way, using the second team’s actual scores asthe runs scored distorts the true offensive strength ofthe second team. Therefore, it would be more appro-priate to adjust the score incorporating the unused(remaining) amount of resources as well. This can bedone using the Duckworth-Lewis method. In particu-lar, the second team’s score can be extrapolated as if itwas allowed to consume 100% of available resources.For details about the Duckworth-Lewis method, referto Duckworth and Lewis (1998). Perera and Swartz(2013) also has an insightful discussion about usingthe Duckworth-Lewis method to analyze tactics inTwenty20 cricket.
The remainder of this paper is structured as fol-lows. Section II describes the data used in thisstudy. Section III describes the methodology usedto determine the γ and the winning percentages. Italso discusses the goodness of fit of the Weibulldistribution and the validity of the assumption ofindependence between runs scored and runs allowed.Furthermore, it presents the data analysis and results.Section IV presents the conclusions. Throughout thepaper, the terms runs scored and runs allowed areused in reference to the second batting team in orderto facilitate the consistency of arguments.
2. Description of data
In this study, we have used data from ODI matchesplayed by the top 10 national teams of the Interna-tional Cricket Council (ICC) during the time periodbetween the 2015 and 2019 ICC World Cups. Theseteams are Afghanistan, Australia, Bangladesh, Eng-land, India, New Zealand, Pakistan, Sri Lanka, SouthAfrica, and West Indies. For Twenty20 cricket, inorder to have sufficient data, we used data for allmatches played by the above 10 teams between2012 and 2018. Matches with no results and matches
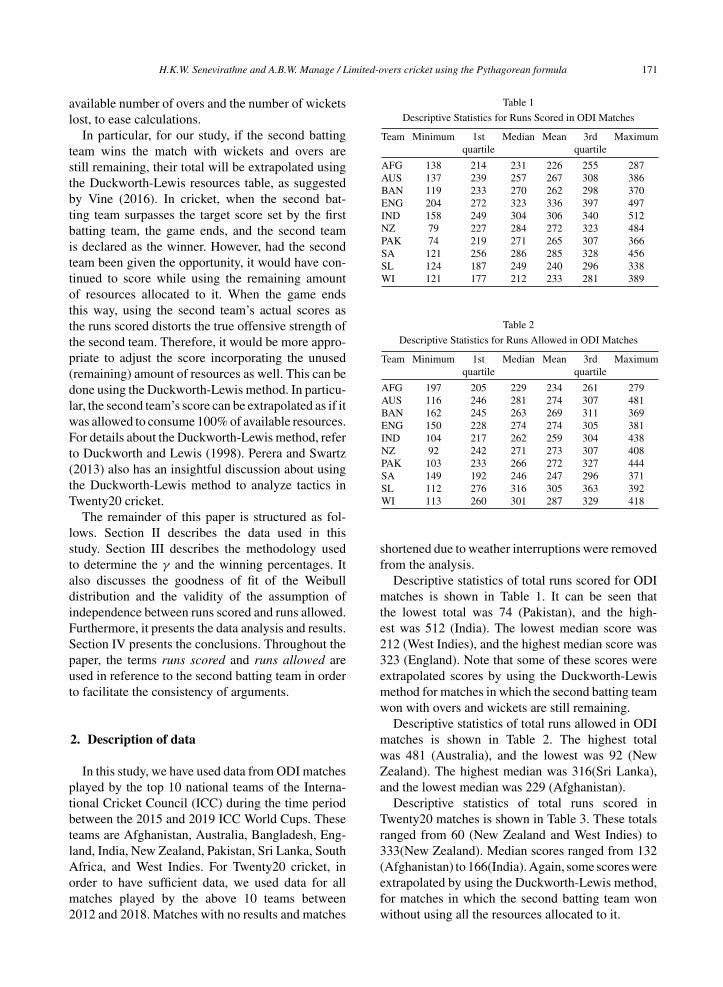
Table 1
Descriptive Statistics for Runs Scored in ODI Matches
Team Minimum 1st Median Mean 3rd Maximumquartile quartile
AFG 138 214 231 226 255 287AUS 137 239 257 267 308 386BAN 119 233 270 262 298 370ENG 204 272 323 336 397 497IND 158 249 304 306 340 512NZ 79 227 284 272 323 484PAK 74 219 271 265 307 366SA 121 256 286 285 328 456SL 124 187 249 240 296 338WI 121 177 212 233 281 389
Table 2
Descriptive Statistics for Runs Allowed in ODI Matches
Team Minimum 1st Median Mean 3rd Maximumquartile quartile
AFG 197 205 229 234 261 279AUS 116 246 281 274 307 481BAN 162 245 263 269 311 369ENG 150 228 274 274 305 381IND 104 217 262 259 304 438NZ 92 242 271 273 307 408PAK 103 233 266 272 327 444SA 149 192 246 247 296 371SL 112 276 316 305 363 392WI 113 260 301 287 329 418
shortened due to weather interruptions were removedfrom the analysis.
Descriptive statistics of total runs scored for ODImatches is shown in Table 1. It can be seen thatthe lowest total was 74 (Pakistan), and the high-est was 512 (India). The lowest median score was212 (West Indies), and the highest median score was323 (England). Note that some of these scores wereextrapolated scores by using the Duckworth-Lewismethod for matches in which the second batting teamwon with overs and wickets are still remaining.
Descriptive statistics of total runs allowed in ODImatches is shown in Table 2. The highest totalwas 481 (Australia), and the lowest was 92 (NewZealand). The highest median was 316(Sri Lanka),and the lowest median was 229 (Afghanistan).
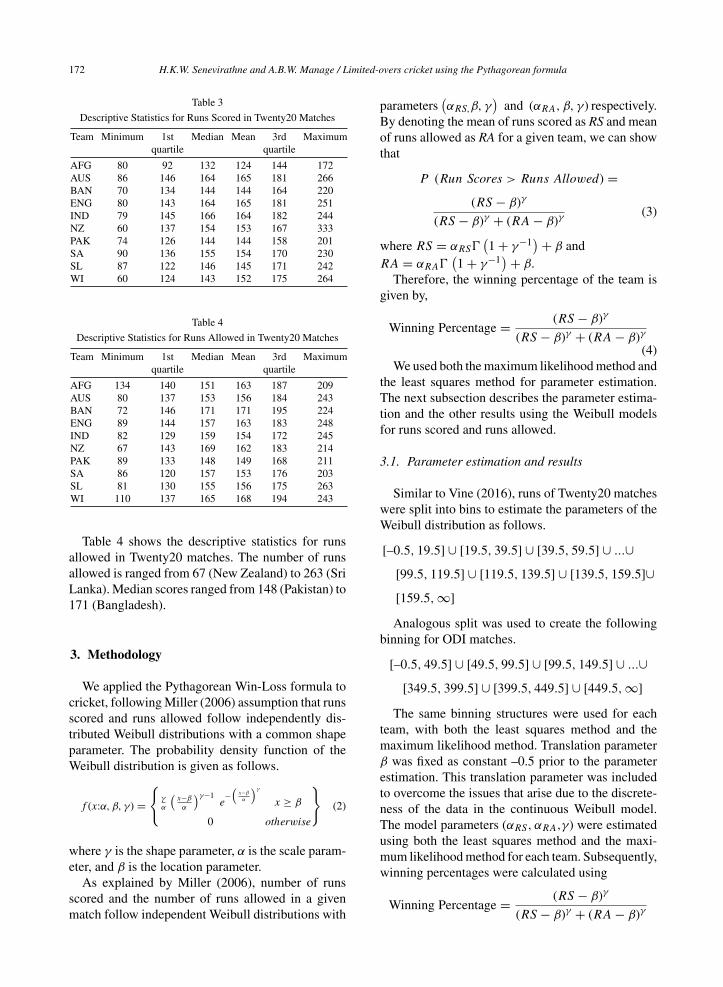
Descriptive statistics of total runs scored inTwenty20 matches is shown in Table 3. These totalsranged from 60 (New Zealand and West Indies) to333(New Zealand). Median scores ranged from 132(Afghanistan) to 166(India). Again, some scores wereextrapolated by using the Duckworth-Lewis method,for matches in which the second batting team wonwithout using all the resources allocated to it.
172 H.K.W. Senevirathne and A.B.W. Manage / Limited-overs cricket using the Pythagorean formula
Table 3
Descriptive Statistics for Runs Scored in Twenty20 Matches
Team Minimum 1st Median Mean 3rd Maximumquartile quartile
AFG 80 92 132 124 144 172AUS 86 146 164 165 181 266BAN 70 134 144 144 164 220ENG 80 143 164 165 181 251IND 79 145 166 164 182 244NZ 60 137 154 153 167 333PAK 74 126 144 144 158 201SA 90 136 155 154 170 230SL 87 122 146 145 171 242WI 60 124 143 152 175 264
Table 4
Descriptive Statistics for Runs Allowed in Twenty20 Matches
Team Minimum 1st Median Mean 3rd Maximumquartile quartile
AFG 134 140 151 163 187 209AUS 80 137 153 156 184 243BAN 72 146 171 171 195 224ENG 89 144 157 163 183 248IND 82 129 159 154 172 245NZ 67 143 169 162 183 214PAK 89 133 148 149 168 211SA 86 120 157 153 176 203SL 81 130 155 156 175 263WI 110 137 165 168 194 243
Table 4 shows the descriptive statistics for runsallowed in Twenty20 matches. The number of runsallowed is ranged from 67 (New Zealand) to 263 (SriLanka). Median scores ranged from 148 (Pakistan) to171 (Bangladesh).
3. Methodology
We applied the Pythagorean Win-Loss formula tocricket, following Miller (2006) assumption that runsscored and runs allowed follow independently dis-tributed Weibull distributions with a common shapeparameter. The probability density function of theWeibull distribution is given as follows.
f (x:α, β, γ) ={
γ
α
(x−β
α
)γ−1e−(
x−β
α
)γ
x ≥ β
0 otherwise
}(2)
where γ is the shape parameter, α is the scale param-eter, and β is the location parameter.
As explained by Miller (2006), number of runsscored and the number of runs allowed in a givenmatch follow independent Weibull distributions with
parameters(αRS,β, γ
)and (αRA, β, γ) respectively.
By denoting the mean of runs scored as RS and meanof runs allowed as RA for a given team, we can showthat
P (Run Scores > Runs Allowed) =(RS − β)γ
(RS − β)γ + (RA − β)γ(3)
where RS = αRS�(1 + γ−1
) + β andRA = αRA�
(1 + γ−1
) + β.Therefore, the winning percentage of the team is
given by,
Winning Percentage = (RS − β)γ
(RS − β)γ + (RA − β)γ(4)
We used both the maximum likelihood method andthe least squares method for parameter estimation.The next subsection describes the parameter estima-tion and the other results using the Weibull modelsfor runs scored and runs allowed.
3.1. Parameter estimation and results
Similar to Vine (2016), runs of Twenty20 matcheswere split into bins to estimate the parameters of theWeibull distribution as follows.
[–0.5, 19.5] ∪ [19.5, 39.5] ∪ [39.5, 59.5] ∪ ...∪[99.5, 119.5] ∪ [119.5, 139.5] ∪ [139.5, 159.5]∪[159.5, ∞]
Analogous split was used to create the followingbinning for ODI matches.
[–0.5, 49.5] ∪ [49.5, 99.5] ∪ [99.5, 149.5] ∪ ...∪[349.5, 399.5] ∪ [399.5, 449.5] ∪ [449.5, ∞]
The same binning structures were used for eachteam, with both the least squares method and themaximum likelihood method. Translation parameterβ was fixed as constant –0.5 prior to the parameterestimation. This translation parameter was includedto overcome the issues that arise due to the discrete-ness of the data in the continuous Weibull model.The model parameters (αRS, αRA,γ) were estimatedusing both the least squares method and the maxi-mum likelihood method for each team. Subsequently,winning percentages were calculated using
Winning Percentage = (RS − β)γ
(RS − β)γ + (RA − β)γ
H.K.W. Senevirathne and A.B.W. Manage / Limited-overs cricket using the Pythagorean formula 173
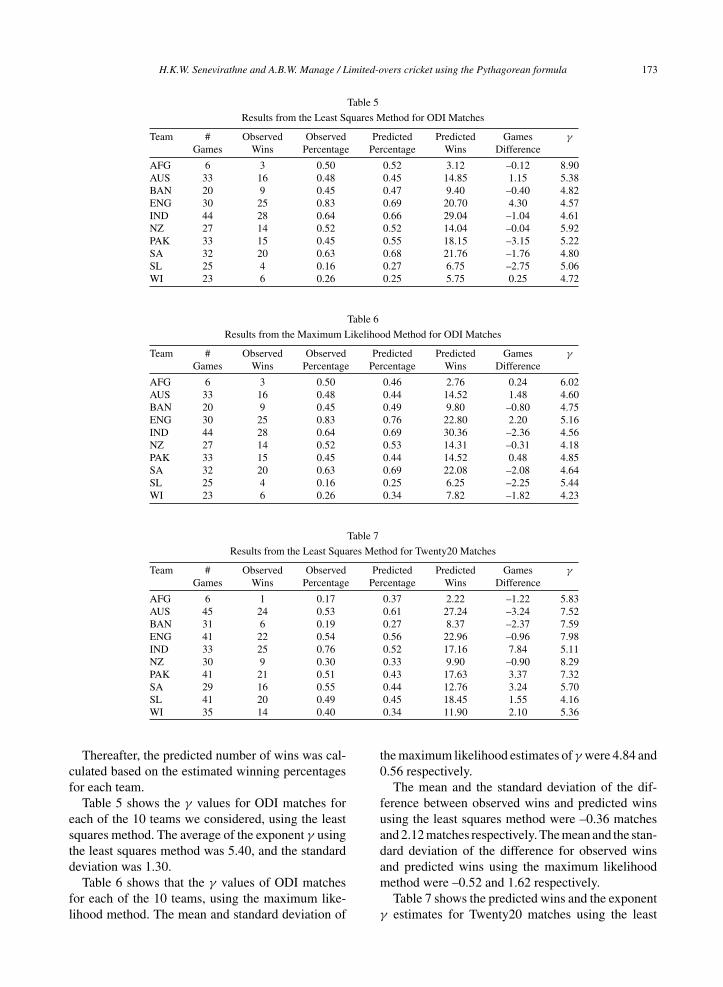
Table 5
Results from the Least Squares Method for ODI Matches
Team # Observed Observed Predicted Predicted Games γ
Games Wins Percentage Percentage Wins Difference
AFG 6 3 0.50 0.52 3.12 –0.12 8.90AUS 33 16 0.48 0.45 14.85 1.15 5.38BAN 20 9 0.45 0.47 9.40 –0.40 4.82ENG 30 25 0.83 0.69 20.70 4.30 4.57IND 44 28 0.64 0.66 29.04 –1.04 4.61NZ 27 14 0.52 0.52 14.04 –0.04 5.92PAK 33 15 0.45 0.55 18.15 –3.15 5.22SA 32 20 0.63 0.68 21.76 –1.76 4.80SL 25 4 0.16 0.27 6.75 –2.75 5.06WI 23 6 0.26 0.25 5.75 0.25 4.72
Table 6
Results from the Maximum Likelihood Method for ODI Matches
Team # Observed Observed Predicted Predicted Games γ
Games Wins Percentage Percentage Wins Difference
AFG 6 3 0.50 0.46 2.76 0.24 6.02AUS 33 16 0.48 0.44 14.52 1.48 4.60BAN 20 9 0.45 0.49 9.80 –0.80 4.75ENG 30 25 0.83 0.76 22.80 2.20 5.16IND 44 28 0.64 0.69 30.36 –2.36 4.56NZ 27 14 0.52 0.53 14.31 –0.31 4.18PAK 33 15 0.45 0.44 14.52 0.48 4.85SA 32 20 0.63 0.69 22.08 –2.08 4.64SL 25 4 0.16 0.25 6.25 –2.25 5.44WI 23 6 0.26 0.34 7.82 –1.82 4.23
Table 7
Results from the Least Squares Method for Twenty20 Matches
Team # Observed Observed Predicted Predicted Games γ
Games Wins Percentage Percentage Wins Difference
AFG 6 1 0.17 0.37 2.22 –1.22 5.83AUS 45 24 0.53 0.61 27.24 –3.24 7.52BAN 31 6 0.19 0.27 8.37 –2.37 7.59ENG 41 22 0.54 0.56 22.96 –0.96 7.98IND 33 25 0.76 0.52 17.16 7.84 5.11NZ 30 9 0.30 0.33 9.90 –0.90 8.29PAK 41 21 0.51 0.43 17.63 3.37 7.32SA 29 16 0.55 0.44 12.76 3.24 5.70SL 41 20 0.49 0.45 18.45 1.55 4.16WI 35 14 0.40 0.34 11.90 2.10 5.36
Thereafter, the predicted number of wins was cal-culated based on the estimated winning percentagesfor each team.
Table 5 shows the γ values for ODI matches foreach of the 10 teams we considered, using the leastsquares method. The average of the exponent γ usingthe least squares method was 5.40, and the standarddeviation was 1.30.
Table 6 shows that the γ values of ODI matchesfor each of the 10 teams, using the maximum like-lihood method. The mean and standard deviation of
the maximum likelihood estimates of γ were 4.84 and0.56 respectively.
The mean and the standard deviation of the dif-ference between observed wins and predicted winsusing the least squares method were –0.36 matchesand 2.12 matches respectively. The mean and the stan-dard deviation of the difference for observed winsand predicted wins using the maximum likelihoodmethod were –0.52 and 1.62 respectively.
Table 7 shows the predicted wins and the exponentγ estimates for Twenty20 matches using the least
174 H.K.W. Senevirathne and A.B.W. Manage / Limited-overs cricket using the Pythagorean formula
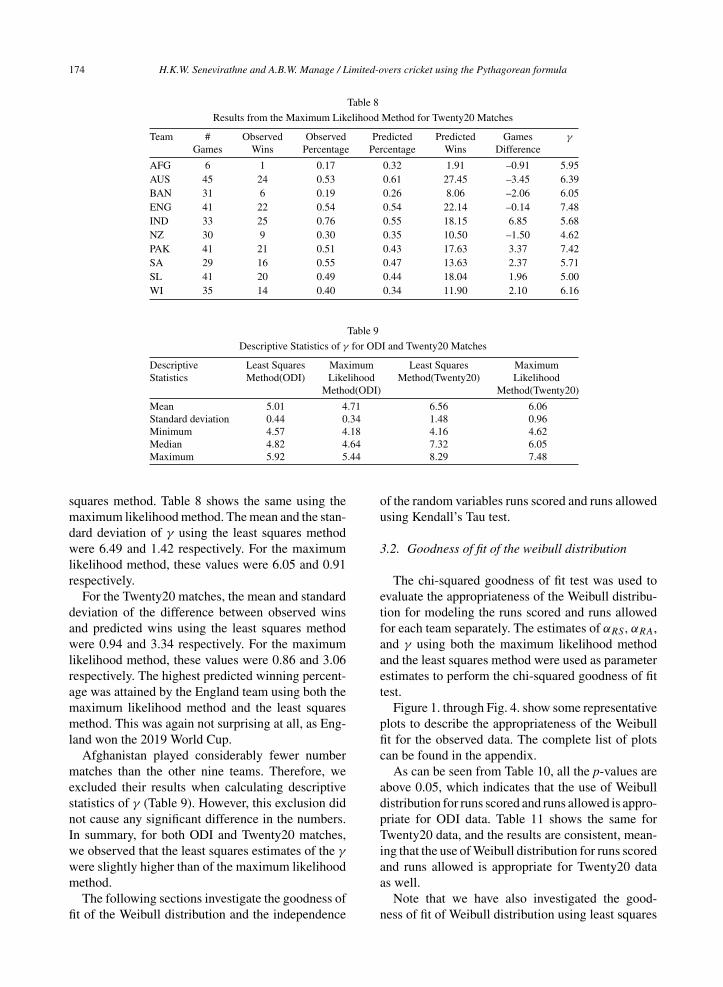
Table 8
Results from the Maximum Likelihood Method for Twenty20 Matches
Team # Observed Observed Predicted Predicted Games γ
Games Wins Percentage Percentage Wins Difference
AFG 6 1 0.17 0.32 1.91 –0.91 5.95AUS 45 24 0.53 0.61 27.45 –3.45 6.39BAN 31 6 0.19 0.26 8.06 –2.06 6.05ENG 41 22 0.54 0.54 22.14 –0.14 7.48IND 33 25 0.76 0.55 18.15 6.85 5.68NZ 30 9 0.30 0.35 10.50 –1.50 4.62PAK 41 21 0.51 0.43 17.63 3.37 7.42SA 29 16 0.55 0.47 13.63 2.37 5.71SL 41 20 0.49 0.44 18.04 1.96 5.00WI 35 14 0.40 0.34 11.90 2.10 6.16
Table 9
Descriptive Statistics of γ for ODI and Twenty20 Matches
Descriptive Least Squares Maximum Least Squares MaximumStatistics Method(ODI) Likelihood Method(Twenty20) Likelihood
Method(ODI) Method(Twenty20)
Mean 5.01 4.71 6.56 6.06Standard deviation 0.44 0.34 1.48 0.96Minimum 4.57 4.18 4.16 4.62Median 4.82 4.64 7.32 6.05Maximum 5.92 5.44 8.29 7.48
squares method. Table 8 shows the same using themaximum likelihood method. The mean and the stan-dard deviation of γ using the least squares methodwere 6.49 and 1.42 respectively. For the maximumlikelihood method, these values were 6.05 and 0.91respectively.
For the Twenty20 matches, the mean and standarddeviation of the difference between observed winsand predicted wins using the least squares methodwere 0.94 and 3.34 respectively. For the maximumlikelihood method, these values were 0.86 and 3.06respectively. The highest predicted winning percent-age was attained by the England team using both themaximum likelihood method and the least squaresmethod. This was again not surprising at all, as Eng-land won the 2019 World Cup.
Afghanistan played considerably fewer numbermatches than the other nine teams. Therefore, weexcluded their results when calculating descriptivestatistics of γ (Table 9). However, this exclusion didnot cause any significant difference in the numbers.In summary, for both ODI and Twenty20 matches,we observed that the least squares estimates of the γ
were slightly higher than of the maximum likelihoodmethod.
The following sections investigate the goodness offit of the Weibull distribution and the independence
of the random variables runs scored and runs allowedusing Kendall’s Tau test.
3.2. Goodness of fit of the weibull distribution
The chi-squared goodness of fit test was used toevaluate the appropriateness of the Weibull distribu-tion for modeling the runs scored and runs allowedfor each team separately. The estimates of αRS, αRA,and γ using both the maximum likelihood methodand the least squares method were used as parameterestimates to perform the chi-squared goodness of fittest.
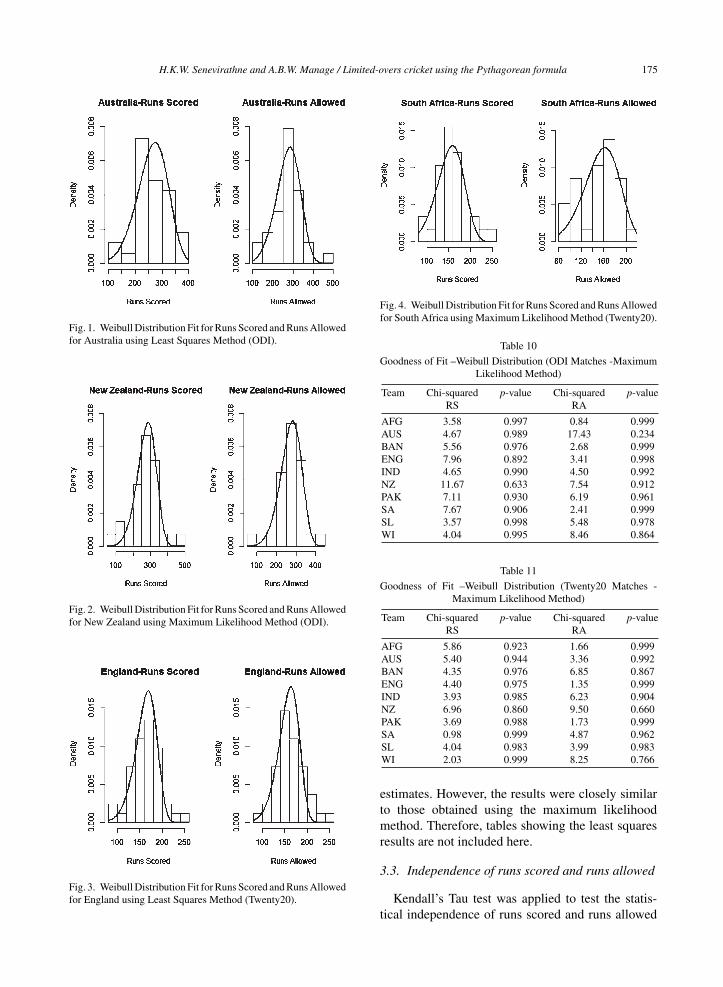
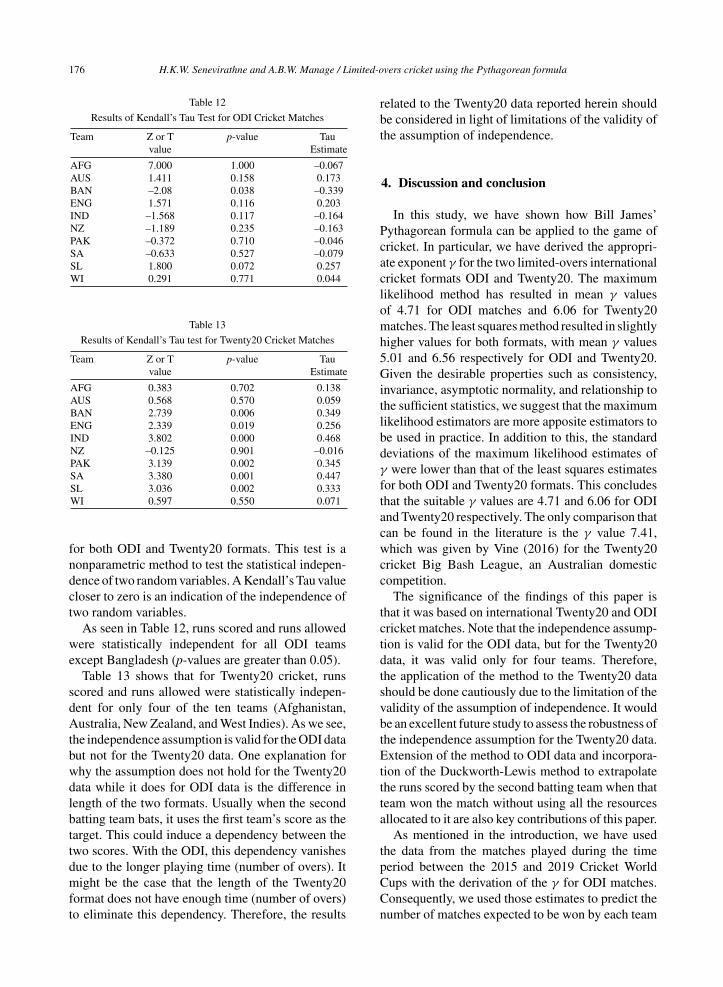
Figure 1. through Fig. 4. show some representativeplots to describe the appropriateness of the Weibullfit for the observed data. The complete list of plotscan be found in the appendix.
As can be seen from Table 10, all the p-values areabove 0.05, which indicates that the use of Weibulldistribution for runs scored and runs allowed is appro-priate for ODI data. Table 11 shows the same forTwenty20 data, and the results are consistent, mean-ing that the use of Weibull distribution for runs scoredand runs allowed is appropriate for Twenty20 dataas well.
Note that we have also investigated the good-ness of fit of Weibull distribution using least squares
H.K.W. Senevirathne and A.B.W. Manage / Limited-overs cricket using the Pythagorean formula 175
Fig. 1. Weibull Distribution Fit for Runs Scored and Runs Allowedfor Australia using Least Squares Method (ODI).
Fig. 2. Weibull Distribution Fit for Runs Scored and Runs Allowedfor New Zealand using Maximum Likelihood Method (ODI).
Fig. 3. Weibull Distribution Fit for Runs Scored and Runs Allowedfor England using Least Squares Method (Twenty20).
Fig. 4. Weibull Distribution Fit for Runs Scored and Runs Allowedfor South Africa using Maximum Likelihood Method (Twenty20).
Table 10
Goodness of Fit –Weibull Distribution (ODI Matches -MaximumLikelihood Method)
Team Chi-squared p-value Chi-squared p-valueRS RA
AFG 3.58 0.997 0.84 0.999AUS 4.67 0.989 17.43 0.234BAN 5.56 0.976 2.68 0.999ENG 7.96 0.892 3.41 0.998IND 4.65 0.990 4.50 0.992NZ 11.67 0.633 7.54 0.912PAK 7.11 0.930 6.19 0.961SA 7.67 0.906 2.41 0.999SL 3.57 0.998 5.48 0.978WI 4.04 0.995 8.46 0.864
Table 11
Goodness of Fit –Weibull Distribution (Twenty20 Matches -Maximum Likelihood Method)
Team Chi-squared p-value Chi-squared p-valueRS RA
AFG 5.86 0.923 1.66 0.999AUS 5.40 0.944 3.36 0.992BAN 4.35 0.976 6.85 0.867ENG 4.40 0.975 1.35 0.999IND 3.93 0.985 6.23 0.904NZ 6.96 0.860 9.50 0.660PAK 3.69 0.988 1.73 0.999SA 0.98 0.999 4.87 0.962SL 4.04 0.983 3.99 0.983WI 2.03 0.999 8.25 0.766
estimates. However, the results were closely similarto those obtained using the maximum likelihoodmethod. Therefore, tables showing the least squaresresults are not included here.
3.3. Independence of runs scored and runs allowed
Kendall’s Tau test was applied to test the statis-tical independence of runs scored and runs allowed
176 H.K.W. Senevirathne and A.B.W. Manage / Limited-overs cricket using the Pythagorean formula
Table 12
Results of Kendall’s Tau Test for ODI Cricket Matches
Team Z or T p-value Tauvalue Estimate
AFG 7.000 1.000 –0.067AUS 1.411 0.158 0.173BAN –2.08 0.038 –0.339ENG 1.571 0.116 0.203IND –1.568 0.117 –0.164NZ –1.189 0.235 –0.163PAK –0.372 0.710 –0.046SA –0.633 0.527 –0.079SL 1.800 0.072 0.257WI 0.291 0.771 0.044
Table 13
Results of Kendall’s Tau test for Twenty20 Cricket Matches
Team Z or T p-value Tauvalue Estimate
AFG 0.383 0.702 0.138AUS 0.568 0.570 0.059BAN 2.739 0.006 0.349ENG 2.339 0.019 0.256IND 3.802 0.000 0.468NZ –0.125 0.901 –0.016PAK 3.139 0.002 0.345SA 3.380 0.001 0.447SL 3.036 0.002 0.333WI 0.597 0.550 0.071
for both ODI and Twenty20 formats. This test is anonparametric method to test the statistical indepen-dence of two random variables. A Kendall’s Tau valuecloser to zero is an indication of the independence oftwo random variables.
As seen in Table 12, runs scored and runs allowedwere statistically independent for all ODI teamsexcept Bangladesh (p-values are greater than 0.05).
Table 13 shows that for Twenty20 cricket, runsscored and runs allowed were statistically indepen-dent for only four of the ten teams (Afghanistan,Australia, New Zealand, and West Indies). As we see,the independence assumption is valid for the ODI databut not for the Twenty20 data. One explanation forwhy the assumption does not hold for the Twenty20data while it does for ODI data is the difference inlength of the two formats. Usually when the secondbatting team bats, it uses the first team’s score as thetarget. This could induce a dependency between thetwo scores. With the ODI, this dependency vanishesdue to the longer playing time (number of overs). Itmight be the case that the length of the Twenty20format does not have enough time (number of overs)to eliminate this dependency. Therefore, the results
related to the Twenty20 data reported herein shouldbe considered in light of limitations of the validity ofthe assumption of independence.
4. Discussion and conclusion
In this study, we have shown how Bill James’Pythagorean formula can be applied to the game ofcricket. In particular, we have derived the appropri-ate exponent γ for the two limited-overs internationalcricket formats ODI and Twenty20. The maximumlikelihood method has resulted in mean γ valuesof 4.71 for ODI matches and 6.06 for Twenty20matches. The least squares method resulted in slightlyhigher values for both formats, with mean γ values5.01 and 6.56 respectively for ODI and Twenty20.Given the desirable properties such as consistency,invariance, asymptotic normality, and relationship tothe sufficient statistics, we suggest that the maximumlikelihood estimators are more apposite estimators tobe used in practice. In addition to this, the standarddeviations of the maximum likelihood estimates ofγ were lower than that of the least squares estimatesfor both ODI and Twenty20 formats. This concludesthat the suitable γ values are 4.71 and 6.06 for ODIand Twenty20 respectively. The only comparison thatcan be found in the literature is the γ value 7.41,which was given by Vine (2016) for the Twenty20cricket Big Bash League, an Australian domesticcompetition.
The significance of the findings of this paper isthat it was based on international Twenty20 and ODIcricket matches. Note that the independence assump-tion is valid for the ODI data, but for the Twenty20data, it was valid only for four teams. Therefore,the application of the method to the Twenty20 datashould be done cautiously due to the limitation of thevalidity of the assumption of independence. It wouldbe an excellent future study to assess the robustness ofthe independence assumption for the Twenty20 data.Extension of the method to ODI data and incorpora-tion of the Duckworth-Lewis method to extrapolatethe runs scored by the second batting team when thatteam won the match without using all the resourcesallocated to it are also key contributions of this paper.
As mentioned in the introduction, we have usedthe data from the matches played during the timeperiod between the 2015 and 2019 Cricket WorldCups with the derivation of the γ for ODI matches.Consequently, we used those estimates to predict thenumber of matches expected to be won by each team
H.K.W. Senevirathne and A.B.W. Manage / Limited-overs cricket using the Pythagorean formula 177
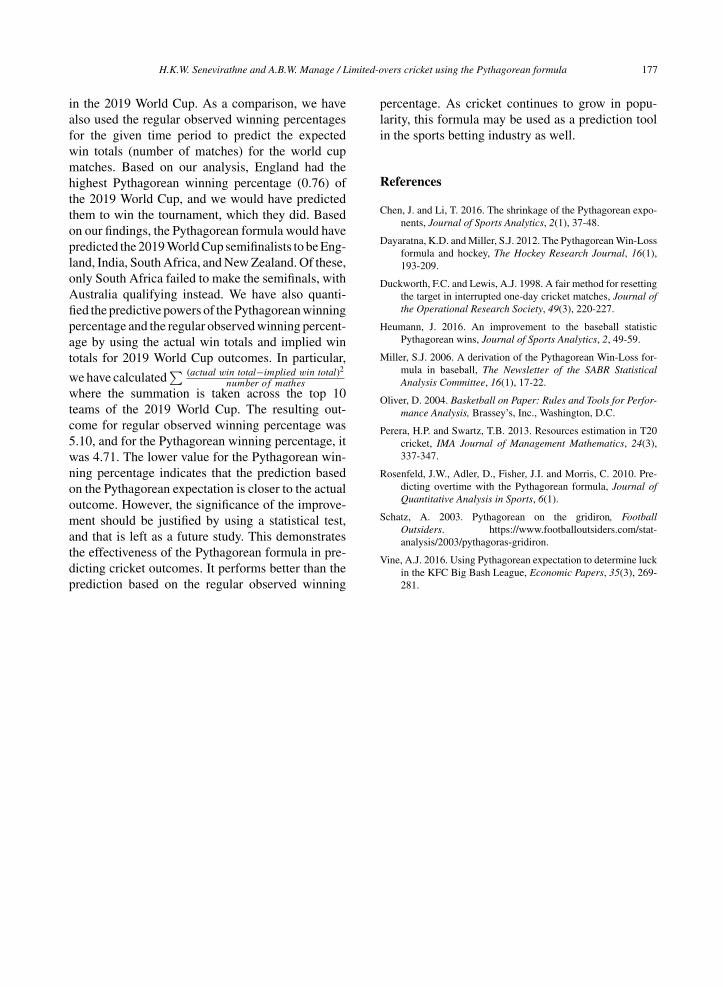
in the 2019 World Cup. As a comparison, we havealso used the regular observed winning percentagesfor the given time period to predict the expectedwin totals (number of matches) for the world cupmatches. Based on our analysis, England had thehighest Pythagorean winning percentage (0.76) ofthe 2019 World Cup, and we would have predictedthem to win the tournament, which they did. Basedon our findings, the Pythagorean formula would havepredicted the 2019 World Cup semifinalists to be Eng-land, India, South Africa, and New Zealand. Of these,only South Africa failed to make the semifinals, withAustralia qualifying instead. We have also quanti-fied the predictive powers of the Pythagorean winningpercentage and the regular observed winning percent-age by using the actual win totals and implied wintotals for 2019 World Cup outcomes. In particular,
we have calculated∑ (actual win total−implied win total)2
number of matheswhere the summation is taken across the top 10teams of the 2019 World Cup. The resulting out-come for regular observed winning percentage was5.10, and for the Pythagorean winning percentage, itwas 4.71. The lower value for the Pythagorean win-ning percentage indicates that the prediction basedon the Pythagorean expectation is closer to the actualoutcome. However, the significance of the improve-ment should be justified by using a statistical test,and that is left as a future study. This demonstratesthe effectiveness of the Pythagorean formula in pre-dicting cricket outcomes. It performs better than theprediction based on the regular observed winning
percentage. As cricket continues to grow in popu-larity, this formula may be used as a prediction toolin the sports betting industry as well.
References
Chen, J. and Li, T. 2016. The shrinkage of the Pythagorean expo-nents, Journal of Sports Analytics, 2(1), 37-48.
Dayaratna, K.D. and Miller, S.J. 2012. The Pythagorean Win-Lossformula and hockey, The Hockey Research Journal, 16(1),193-209.
Duckworth, F.C. and Lewis, A.J. 1998. A fair method for resettingthe target in interrupted one-day cricket matches, Journal ofthe Operational Research Society, 49(3), 220-227.
Heumann, J. 2016. An improvement to the baseball statisticPythagorean wins, Journal of Sports Analytics, 2, 49-59.
Miller, S.J. 2006. A derivation of the Pythagorean Win-Loss for-mula in baseball, The Newsletter of the SABR StatisticalAnalysis Committee, 16(1), 17-22.
Oliver, D. 2004. Basketball on Paper: Rules and Tools for Perfor-mance Analysis, Brassey’s, Inc., Washington, D.C.
Perera, H.P. and Swartz, T.B. 2013. Resources estimation in T20cricket, IMA Journal of Management Mathematics, 24(3),337-347.
Rosenfeld, J.W., Adler, D., Fisher, J.I. and Morris, C. 2010. Pre-dicting overtime with the Pythagorean formula, Journal ofQuantitative Analysis in Sports, 6(1).
Schatz, A. 2003. Pythagorean on the gridiron, FootballOutsiders. https://www.footballoutsiders.com/stat-analysis/2003/pythagoras-gridiron.
Vine, A.J. 2016. Using Pythagorean expectation to determine luckin the KFC Big Bash League, Economic Papers, 35(3), 269-281.
178 H.K.W. Senevirathne and A.B.W. Manage / Limited-overs cricket using the Pythagorean formula
Appendix
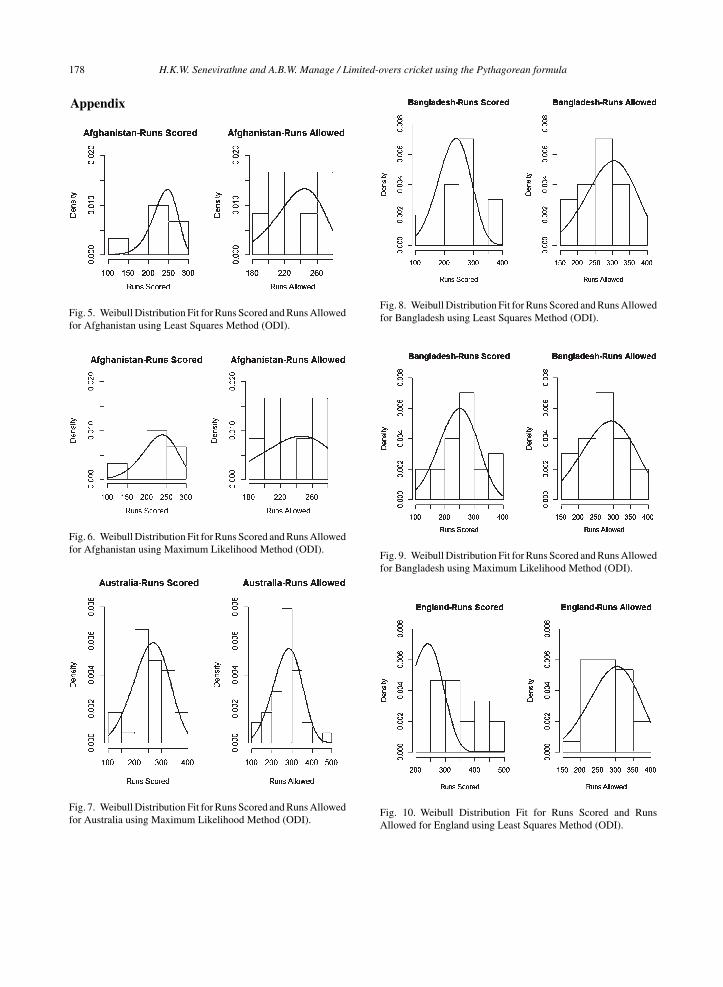
Fig. 5. Weibull Distribution Fit for Runs Scored and Runs Allowedfor Afghanistan using Least Squares Method (ODI).
Fig. 6. Weibull Distribution Fit for Runs Scored and Runs Allowedfor Afghanistan using Maximum Likelihood Method (ODI).
Fig. 7. Weibull Distribution Fit for Runs Scored and Runs Allowedfor Australia using Maximum Likelihood Method (ODI).
Fig. 8. Weibull Distribution Fit for Runs Scored and Runs Allowedfor Bangladesh using Least Squares Method (ODI).
Fig. 9. Weibull Distribution Fit for Runs Scored and Runs Allowedfor Bangladesh using Maximum Likelihood Method (ODI).
Fig. 10. Weibull Distribution Fit for Runs Scored and RunsAllowed for England using Least Squares Method (ODI).
H.K.W. Senevirathne and A.B.W. Manage / Limited-overs cricket using the Pythagorean formula 179
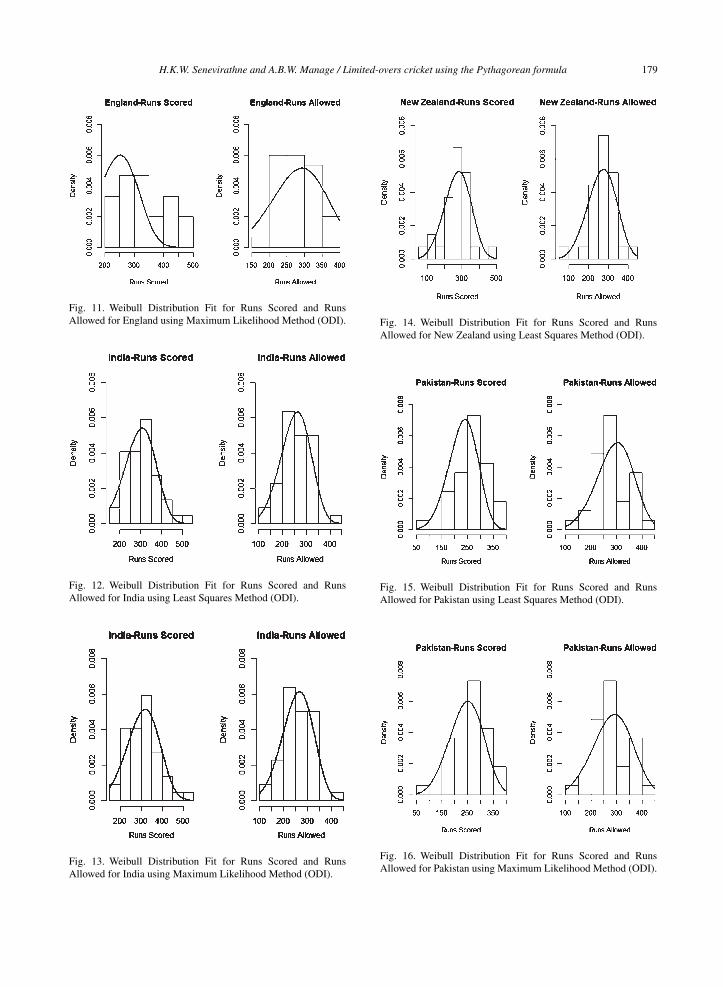
Fig. 11. Weibull Distribution Fit for Runs Scored and RunsAllowed for England using Maximum Likelihood Method (ODI).
Fig. 12. Weibull Distribution Fit for Runs Scored and RunsAllowed for India using Least Squares Method (ODI).
Fig. 13. Weibull Distribution Fit for Runs Scored and RunsAllowed for India using Maximum Likelihood Method (ODI).
Fig. 14. Weibull Distribution Fit for Runs Scored and RunsAllowed for New Zealand using Least Squares Method (ODI).
Fig. 15. Weibull Distribution Fit for Runs Scored and RunsAllowed for Pakistan using Least Squares Method (ODI).
Fig. 16. Weibull Distribution Fit for Runs Scored and RunsAllowed for Pakistan using Maximum Likelihood Method (ODI).
180 H.K.W. Senevirathne and A.B.W. Manage / Limited-overs cricket using the Pythagorean formula
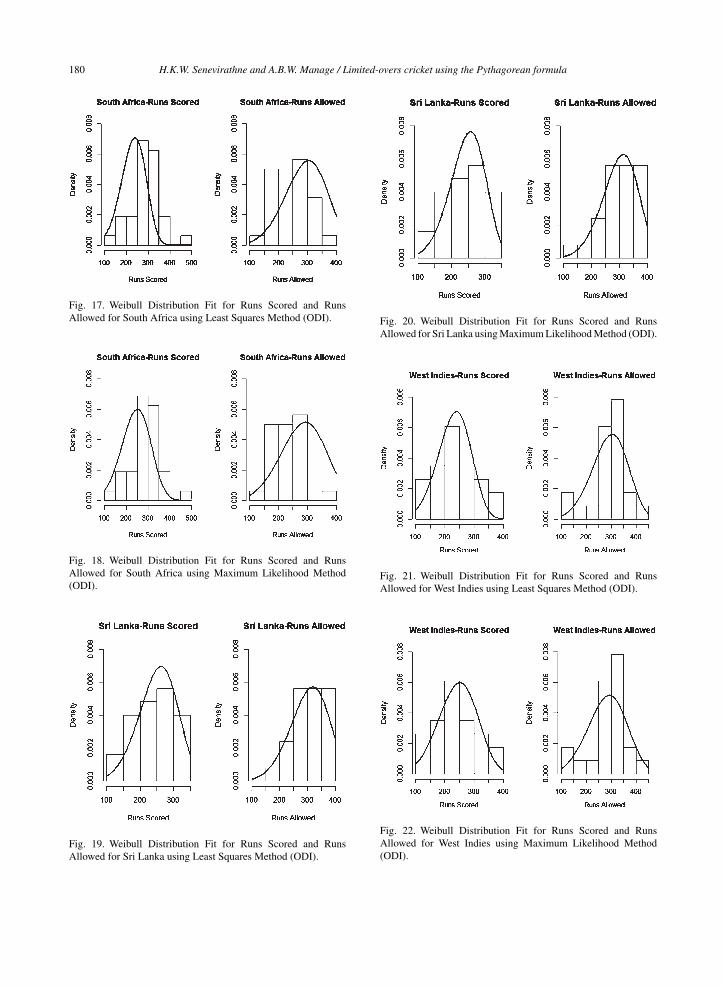
Fig. 17. Weibull Distribution Fit for Runs Scored and RunsAllowed for South Africa using Least Squares Method (ODI).
Fig. 18. Weibull Distribution Fit for Runs Scored and RunsAllowed for South Africa using Maximum Likelihood Method(ODI).
Fig. 19. Weibull Distribution Fit for Runs Scored and RunsAllowed for Sri Lanka using Least Squares Method (ODI).
Fig. 20. Weibull Distribution Fit for Runs Scored and RunsAllowed for Sri Lanka using Maximum Likelihood Method (ODI).
Fig. 21. Weibull Distribution Fit for Runs Scored and RunsAllowed for West Indies using Least Squares Method (ODI).
Fig. 22. Weibull Distribution Fit for Runs Scored and RunsAllowed for West Indies using Maximum Likelihood Method(ODI).
H.K.W. Senevirathne and A.B.W. Manage / Limited-overs cricket using the Pythagorean formula 181
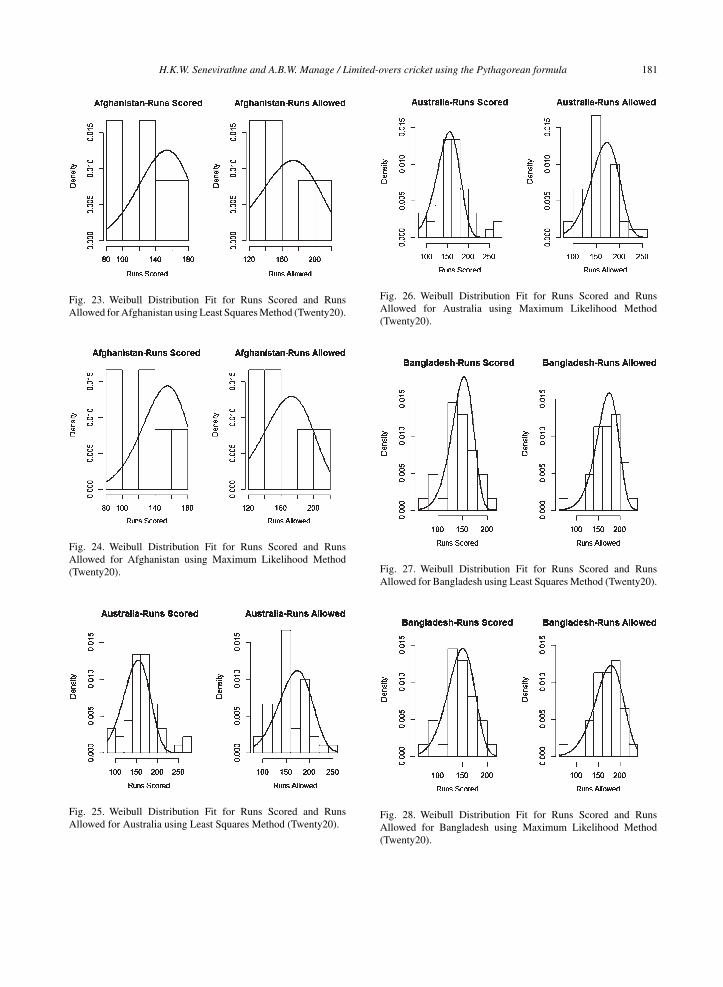
Fig. 23. Weibull Distribution Fit for Runs Scored and RunsAllowed for Afghanistan using Least Squares Method (Twenty20).
Fig. 24. Weibull Distribution Fit for Runs Scored and RunsAllowed for Afghanistan using Maximum Likelihood Method(Twenty20).
Fig. 25. Weibull Distribution Fit for Runs Scored and RunsAllowed for Australia using Least Squares Method (Twenty20).
Fig. 26. Weibull Distribution Fit for Runs Scored and RunsAllowed for Australia using Maximum Likelihood Method(Twenty20).
Fig. 27. Weibull Distribution Fit for Runs Scored and RunsAllowed for Bangladesh using Least Squares Method (Twenty20).
Fig. 28. Weibull Distribution Fit for Runs Scored and RunsAllowed for Bangladesh using Maximum Likelihood Method(Twenty20).
182 H.K.W. Senevirathne and A.B.W. Manage / Limited-overs cricket using the Pythagorean formula
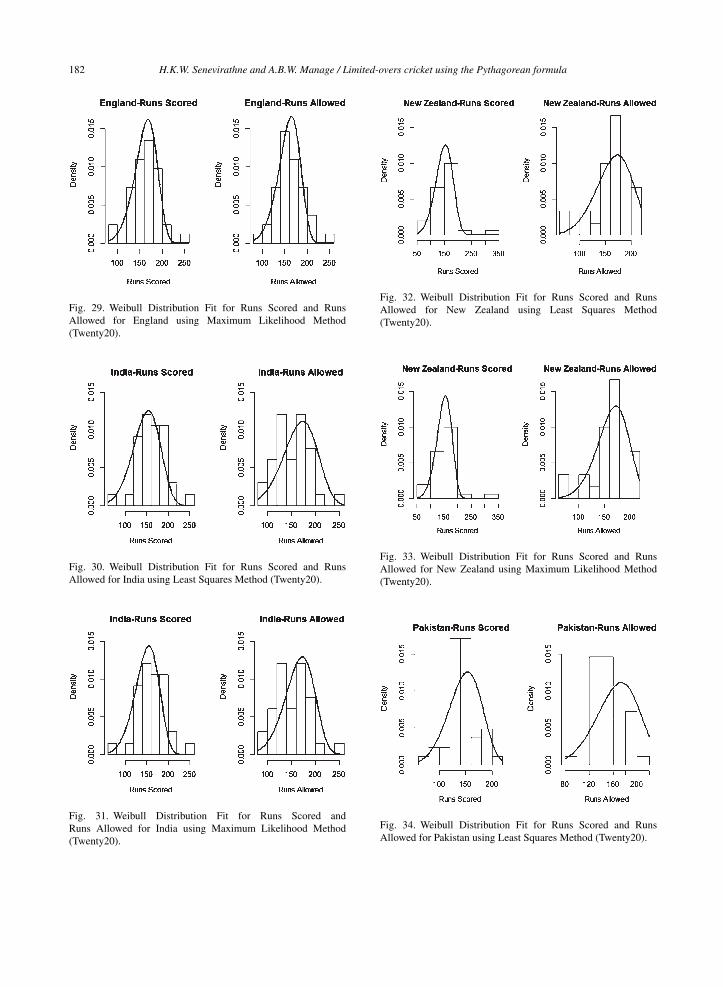
Fig. 29. Weibull Distribution Fit for Runs Scored and RunsAllowed for England using Maximum Likelihood Method(Twenty20).
Fig. 30. Weibull Distribution Fit for Runs Scored and RunsAllowed for India using Least Squares Method (Twenty20).
Fig. 31. Weibull Distribution Fit for Runs Scored andRuns Allowed for India using Maximum Likelihood Method(Twenty20).
Fig. 32. Weibull Distribution Fit for Runs Scored and RunsAllowed for New Zealand using Least Squares Method(Twenty20).
Fig. 33. Weibull Distribution Fit for Runs Scored and RunsAllowed for New Zealand using Maximum Likelihood Method(Twenty20).
Fig. 34. Weibull Distribution Fit for Runs Scored and RunsAllowed for Pakistan using Least Squares Method (Twenty20).
H.K.W. Senevirathne and A.B.W. Manage / Limited-overs cricket using the Pythagorean formula 183
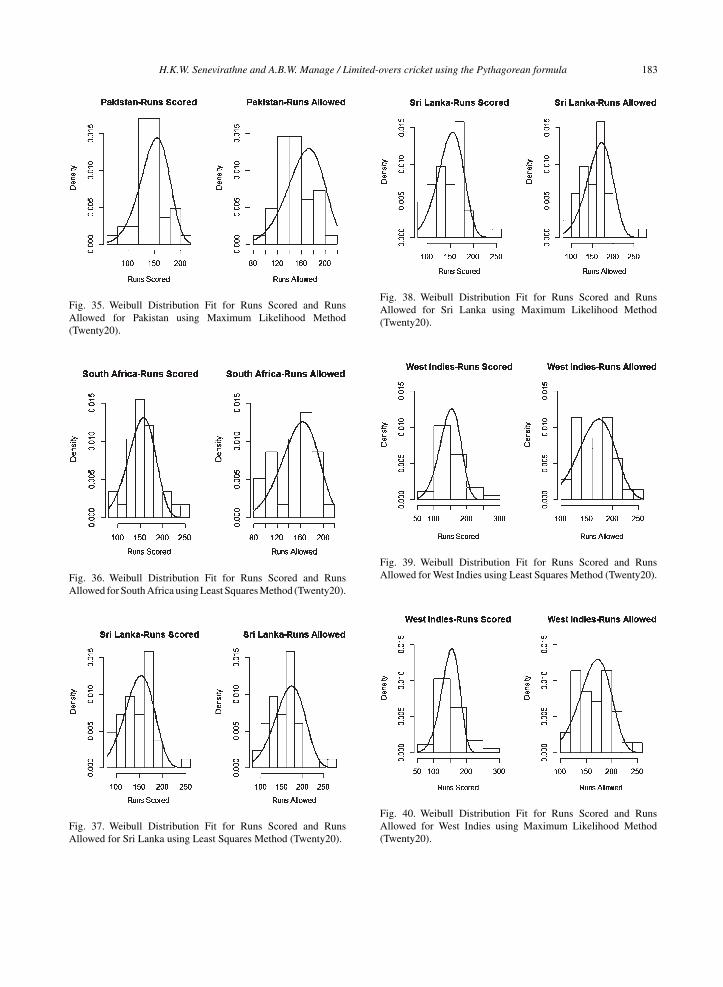
Fig. 35. Weibull Distribution Fit for Runs Scored and RunsAllowed for Pakistan using Maximum Likelihood Method(Twenty20).
Fig. 36. Weibull Distribution Fit for Runs Scored and RunsAllowed for South Africa using Least Squares Method (Twenty20).
Fig. 37. Weibull Distribution Fit for Runs Scored and RunsAllowed for Sri Lanka using Least Squares Method (Twenty20).
Fig. 38. Weibull Distribution Fit for Runs Scored and RunsAllowed for Sri Lanka using Maximum Likelihood Method(Twenty20).
Fig. 39. Weibull Distribution Fit for Runs Scored and RunsAllowed for West Indies using Least Squares Method (Twenty20).
Fig. 40. Weibull Distribution Fit for Runs Scored and RunsAllowed for West Indies using Maximum Likelihood Method(Twenty20).


