Embed Size (px)
Citation preview
Practical Guide Industrial Flue Gas Analysis
Emissions and process measurement guidelines3rd, revised edition

Copyrights, warranty and liability
The information put together in this Practical Guide is protected by copyright. All rights belong exclusively to Testo SE & Co. KGaA. The contents and pictures may not be commercially reproduced, modified or used for purposes other than the intended application described without the prior written consent of Testo SE & Co. KGaA.
The information in this Practical Guide has been produced with the utmost care. Nevertheless, the information provided is not binding, and Testo SE & Co. KGaA reserves the right to make changes or additions. Testo SE & Co. KGaA therefore offers no guarantee or warranty for the correctness and completeness of the information provided. Testo AG accepts no liability for damages resulting directly or indirectly from the use of this guide, insofar as these cannot be attributed to wilful intent or negligence.
Testo SE & Co. KGaA, in January 2018
Foreword
Dear Reader
Determining flue gas concentrations
allows legally required emission limit
values to be monitored, thus enabling
protection of the environment. On the
other hand, gas concentrations or gas
matrices generated during the process
often provide a very good indication
of the existing process quality, which
ultimately has a considerable influence
on the product quality.
This Practical Guide contains the basic
principles of common combustion
processes, with a specific focus on
their use in industrial applications. The
available measurement methods, the
characteristics associated with the
measuring tasks, the expected gas
measurement parameters, concentra-
tions and their significance with regard
to the process are also described. This
is a useful reference guide for using
portable gas analyzers in industry,
based on the experiences of global
users of Testo measuring instruments.
Additional ideas and suggestions for
improvement are always welcome.
Happy reading!
Prof. Burkart Knospe,
Chairman of the Board of Directors
2
Contents
Foreword 11. The combustion process 5 1.1 Energy and combustion 5 1.2 Combustion plants 8 1.3 Fuels 10 1.4 Combustion air, air ratio 11 1.4.1 Ideal combustion, fuel-air ratio, material balance 11 1.4.2 Determining the air ratio 14 1.4.3 Combustion air requirement 16 1.4.4 Gas volume, diluting effect, reference value 16 1.5 Flue gas (exhaust gas) and its composition 19 1.6 Gross calorific value, net calorific value, efficiency 23 1.7 Dew point, condensate 262. Gas analysis for industrial flue gases 29 2.1 Combustion optimization 31 2.2 Process control 34 2.2.1 Process heaters 34 2.2.2 Industrial combustion plants 35 2.2.3 Thermal surface treatment 36 2.2.4 Safety measurements 37 2.3 Emission control 38 2.3.1 Legal framework in Germany 39 2.3.2 Guidelines in Germany (German Federal Immission Control Ordi-
nance (BImSchV) and TI Air (TA-Luft)) 41 2.3.3 Situation in the USA 48 2.3.4 Procedures for purifying flue gas 503. Gas analysis technology 54 3.1 Terminology used in gas analysis technology 54 3.1.1 Concentration, standard conditions 54 3.1.2 Sample preparation, condensate, heating 60 3.1.3 Cross-sensitivity 62 3.1.4 Calibration 64 3.2 Gas analyzers 65 3.2.1 Terminology and use 65 3.2.2 Measuring principles 70

3
4. Industrial gas analysis applications 79 4.1 Power generation 80 4.1.1 Solid-fuel firing systems 80 4.1.2 Gas-fired installations 82 4.1.3 Gas turbines 84 4.1.4 Oil-fired installations 86 4.1.5 Coal-fired power plants 88 4.1.6 Cogeneration plants 91 4.1.7 Combined cycle power plants 93 4.2 Waste disposal 94 4.2.1 Waste incineration 94 4.2.2 Waste pyrolysis 96 4.2.3 Thermal afterburning 98 4.3 Non-metallic minerals industry 100 4.3.1 Cement production 100 4.3.2 Ceramics/porcelain production 102 4.3.3 Brickworks 104 4.3.4 Glass production 106 4.3.5 Lime production 109 4.4 Metal/ore industry 111 4.4.1 Sintering plants 111 4.4.2 Iron production 113 4.4.3 Steel production 115 4.4.4 Coking plants 117 4.4.5 Aluminium production 119 4.4.6 Surface treatment 121 4.5 Chemical industry 123 4.5.1 Process heaters 123 4.5.2 Refineries 124 4.5.3 Flare stack measurements 126 4.5.4 Residue incineration 127 4.6 Other 129 4.6.1 Crematoria 129 4.6.2 Engine test beds 1305. Testo gas analysis technology 131 5.1 The company 131 5.2 Typical instrument features 133 5.3 Overview of gas analyzers 135 5.4 Overview of accessories 139
Addresses 143 Index 144

4
1. The combustion process
5
1. The combustion process
1.1 Energy and combustion
Energy
(from the Greek) means “acting force”
and is defined as the ability of a
substance, body or system to carry
out work. Energy can be assigned to
certain energy types depending on
their form.
Energy can be classified into six cat-
egories:
• Mechanical energy (flowing water,
driving car, helical spring)
• Thermal energy (boiling water, gas
flame)
• Chemical energy (chemical reac-
tions, combustion, explosion)
• Electrical energy (car battery, electric
current)
• Electromagnetic energy (light, ther-
mal radiation)
• Nuclear energy (nuclear fission)
The various forms of energy can be
converted from one form into other,
whereby, within an ideally closed sys-
tem, the sum of all energies remains
constant (conservation of energy).
This actually applies in respect of
the universe as a system. In practice,
however, energy is lost to a greater or
lesser extent when energy is convert-
ed, and this loss affects the efficiency
of the conversion process. The natural
energy carriers (coal, natural gas,
petroleum, solar radiation, hydro-
power, etc.) are described as primary
energies, while the forms generated
through energy conversions (electrici-
ty, heat, etc.) are called secondary en-
ergies. These energy carriers differ not
only in their appearance, but also in
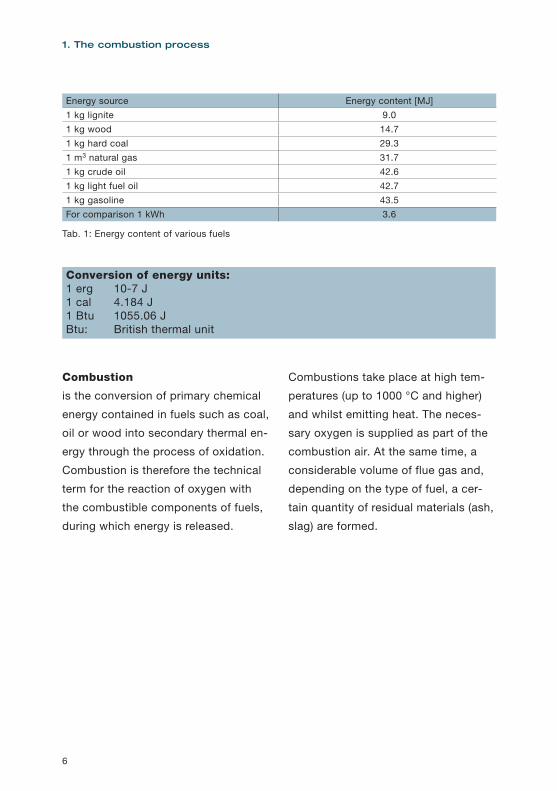
their energy content. For the purposes
of comparison, the quantity of energy
that could be released if a given quan-
tity of the energy source were fully
burned is generally specified. Table 1
gives a few examples to illustrate this.
The measuring unit for energy is the
joule (J).
6
1. The combustion process
Combustion
is the conversion of primary chemical
energy contained in fuels such as coal,
oil or wood into secondary thermal en-
ergy through the process of oxidation.
Combustion is therefore the technical
term for the reaction of oxygen with
the combustible components of fuels,
during which energy is released.
Combustions take place at high tem-
peratures (up to 1000 °C and higher)
and whilst emitting heat. The neces-
sary oxygen is supplied as part of the
combustion air. At the same time, a
considerable volume of flue gas and,
depending on the type of fuel, a cer-
tain quantity of residual materials (ash,
slag) are formed.
Conversion of energy units:1 erg 10-7 J1 cal 4.184 J1 Btu 1055.06 JBtu: British thermal unit
Energy source Energy content [MJ]1 kg lignite 9.01 kg wood 14.71 kg hard coal 29.31 m3 natural gas 31.71 kg crude oil 42.61 kg light fuel oil 42.71 kg gasoline 43.5For comparison 1 kWh 3.6
Tab. 1: Energy content of various fuels
7
Oxidation
Term for all chemical reactions during
which a substance combines with
oxygen. During oxidation, energy is
released. Oxidation is of great signif-
icance when it comes to technology
(combustion) and biology (respiration).
Greenhouse effect
In principle, the greenhouse effect is
a natural phenomenon and a prereq-
uisite for life on earth. Without this
effect, the average global temperature
near the Earth’s surface would be
-18 °C instead of +15 °C today; the
earth would be uninhabitable! The
cause of this natural effect is primar-
ily the water vapour content of the
atmosphere near the Earth’s surface,
which allows solar radiation to pass
through, but prevents the long-wave
thermal radiation that develops on the
ground from escaping; this is reflect-
ed back to the Earth’s surface. The
heat management of greenhouses is
also based on this principle. Howev-
er, excessive burning of fossil fuels
(carbon dioxide emissions) and the
release of substances from chemicals
and agriculture (CFCs, methane, etc.)
considerably intensify this natural
effect, which leads to a slow increase
in the Earth’s temperature and affects
climatic conditions, etc.
More details on the topic of combus-
tion can be found in Section 1.4.
8
1.2 Combustion plants
Combustion plants are facilities for
generating heat by burning solid, liquid
or gaseous fuels. They are needed for
many different purposes, for example
• For heating purposes (heating plants
and building heating systems)
• For generating electricity
• For generating steam or hot wa-
ter (used in processing plants, for
example)
• For manufacturing certain materials
(for use in the cement, glass or ce-
ramics industry, for example)
• For thermal surface treatment of
metallic workpieces
• For burning waste and scrap materi-
als (waste, used tyres etc.)
Please refer to the detailed application
examples in Section 4.
The combustion takes place in a
furnace; other parts of the plant supply
and distribute the fuel, supply the
combustion air, transfer the heat and
carry away the combustion gases and
combustion residues (ash and slag).
Solid fuels are burnt either in a fixed
bed, a fluidized bed or in an entrained
dust cloud. Via a burner, liquid fuels
are fed to the combustion chamber
together with the combustion air in the
form of mist; gaseous fuels are already
mixed with the combustion air in the
burner.
Flue gas from combustion plants
contains the reaction products of fuel
and combustion air as well as residual
substances, generating primarily dust,
sulphur and nitrogen oxides and also
carbon monoxide. During the combus-
tion of coal, HCl and HF, and during
the combustion of scrap material, their
constituents (HCl and HF, but also var-
ious hydrocarbons, heavy metals, etc.)
may also be present in the flue gas.
1. The combustion process

9
Within the context of environmental
protection, the flue gas from combus-
tion plants is subject to strict regu-
lations with regard to the limit values
of pollutants such as dust, sulphur
and nitrogen oxides and also carbon
monoxide which are permissible in
the clean gas (when released into the
atmosphere). To comply with these
limit values, combustion plants are
equipped with extensive facilities for
cleaning flue gas, such as dust filters
and various flue gas scrubbers. In Ger-
many, the specific requirements are
laid down in the 13th and 17th Federal
Immission Control Ordinance (BIm-
SchV) and in TI Air. Further information
about this can be found in Section 2.3.
10
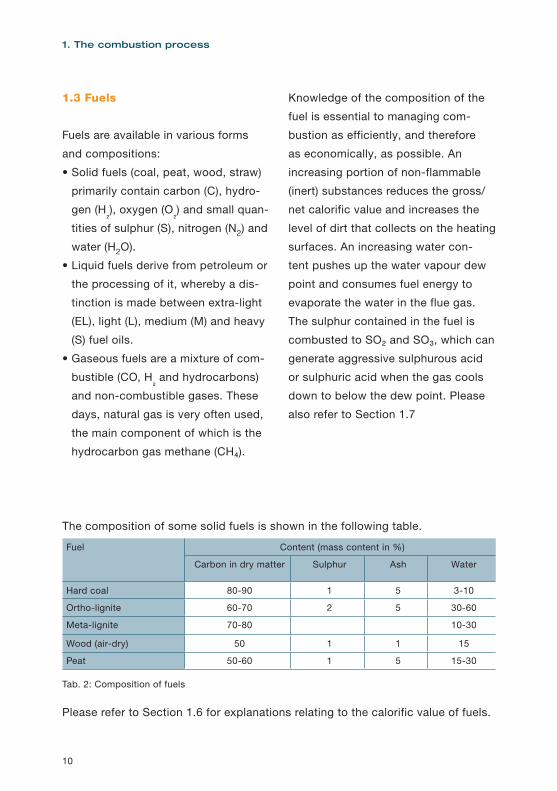
The composition of some solid fuels is shown in the following table.
Please refer to Section 1.6 for explanations relating to the calorific value of fuels.
1.3 Fuels
Fuels are available in various forms
and compositions:
• Solid fuels (coal, peat, wood, straw)
primarily contain carbon (C), hydro-
gen (H₂), oxygen (O₂) and small quan-
tities of sulphur (S), nitrogen (N2) and
water (H2O).
• Liquid fuels derive from petroleum or
the processing of it, whereby a dis-
tinction is made between extra-light
(EL), light (L), medium (M) and heavy
(S) fuel oils.
• Gaseous fuels are a mixture of com-
bustible (CO, H₂ and hydrocarbons)
and non-combustible gases. These
days, natural gas is very often used,
the main component of which is the
hydrocarbon gas methane (CH₄).
Knowledge of the composition of the
fuel is essential to managing com-
bustion as efficiently, and therefore
as economically, as possible. An
increasing portion of non-flammable
(inert) substances reduces the gross/
net calorific value and increases the
level of dirt that collects on the heating
surfaces. An increasing water con-
tent pushes up the water vapour dew
point and consumes fuel energy to
evaporate the water in the flue gas.
The sulphur contained in the fuel is
combusted to SO₂ and SO₃, which can
generate aggressive sulphurous acid
or sulphuric acid when the gas cools
down to below the dew point. Please
also refer to Section 1.7
1. The combustion process
Tab. 2: Composition of fuels
Fuel Content (mass content in %)
Carbon in dry matter Sulphur Ash Water
Hard coal 80-90 1 5 3-10
Ortho-lignite 60-70 2 5 30-60
Meta-lignite 70-80 10-30
Wood (air-dry) 50 1 1 15
Peat 50-60 1 5 15-30
11
1.4 Combustion air, air ratio
The combustion air provides the
oxygen required for combustion. It
consists of nitrogen (N₂), oxygen (O₂),
a small proportion of noble gases and
a variable proportion of water vapour
(Tab. 3). In some cases, even pure ox-
ygen or an oxygen/air mixture is used
for combustion.
Essential combustion air constituents
(except the oxygen used in the com-
bustion process) can all be found in
the flue gas.
Component Volume content [%]Nitrogen 78.07Oxygen 20.95Carbon dioxide 0.03Hydrogen 0.01Argon 0.93Neon 0.0018
Tab. 3: Composition of pure and dry air on the Earth’s surface
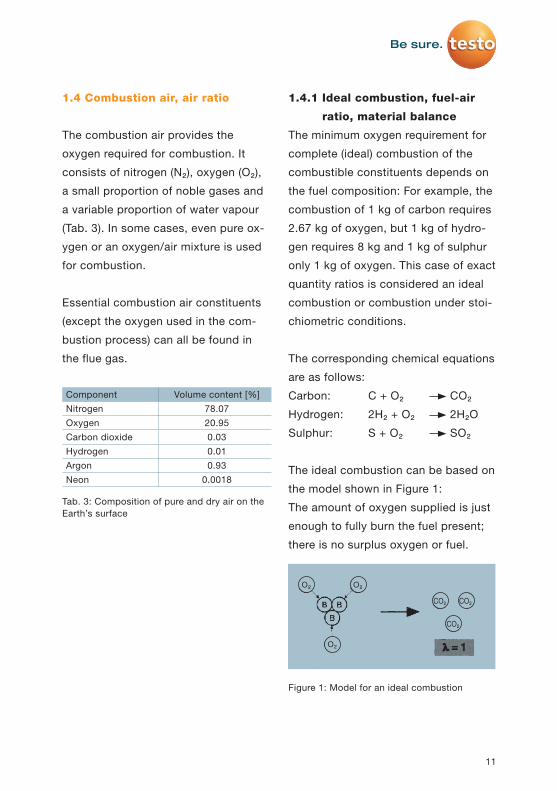
1.4.1 Ideal combustion, fuel-air
ratio, material balance
The minimum oxygen requirement for
complete (ideal) combustion of the
combustible constituents depends on
the fuel composition: For example, the
combustion of 1 kg of carbon requires
2.67 kg of oxygen, but 1 kg of hydro-
gen requires 8 kg and 1 kg of sulphur
only 1 kg of oxygen. This case of exact
quantity ratios is considered an ideal
combustion or combustion under stoi-
chiometric conditions.
The corresponding chemical equations
are as follows:
Carbon: C + O₂ CO₂
Hydrogen: 2H₂ + O₂ 2H₂O
Sulphur: S + O₂ SO₂
The ideal combustion can be based on
the model shown in Figure 1:
The amount of oxygen supplied is just
enough to fully burn the fuel present;
there is no surplus oxygen or fuel.
O₂ O₂
CO₂ CO₂
CO₂
O₂
Figure 1: Model for an ideal combustion
12
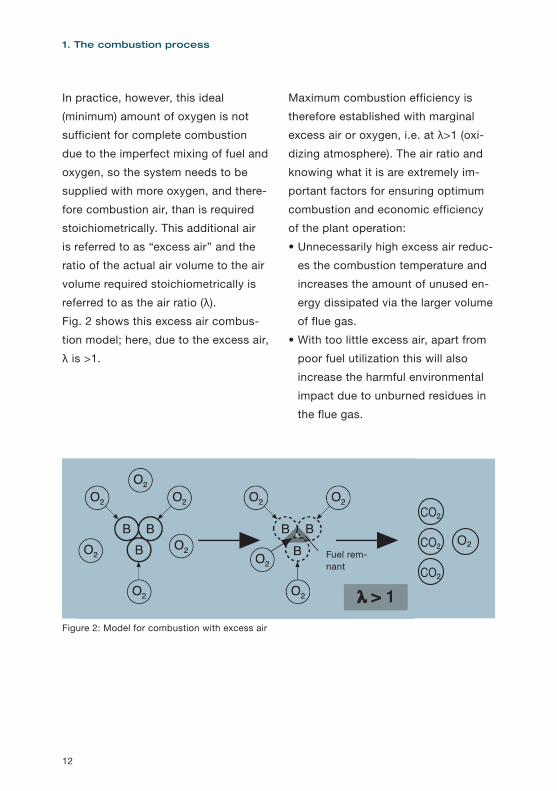
In practice, however, this ideal
(minimum) amount of oxygen is not
sufficient for complete combustion
due to the imperfect mixing of fuel and
oxygen, so the system needs to be
supplied with more oxygen, and there-
fore combustion air, than is required
stoichiometrically. This additional air
is referred to as “excess air” and the
ratio of the actual air volume to the air
volume required stoichiometrically is
referred to as the air ratio (λ).
Fig. 2 shows this excess air combus-
tion model; here, due to the excess air,
λ is >1.
Maximum combustion efficiency is
therefore established with marginal
excess air or oxygen, i.e. at λ>1 (oxi-
dizing atmosphere). The air ratio and
knowing what it is are extremely im-
portant factors for ensuring optimum
combustion and economic efficiency
of the plant operation:
• Unnecessarily high excess air reduc-
es the combustion temperature and
increases the amount of unused en-
ergy dissipated via the larger volume
of flue gas.
• With too little excess air, apart from
poor fuel utilization this will also
increase the harmful environmental
impact due to unburned residues in
the flue gas.
1. The combustion process
Figure 2: Model for combustion with excess air
Fuel rem-nant
CO₂
CO₂
CO₂ O₂
13
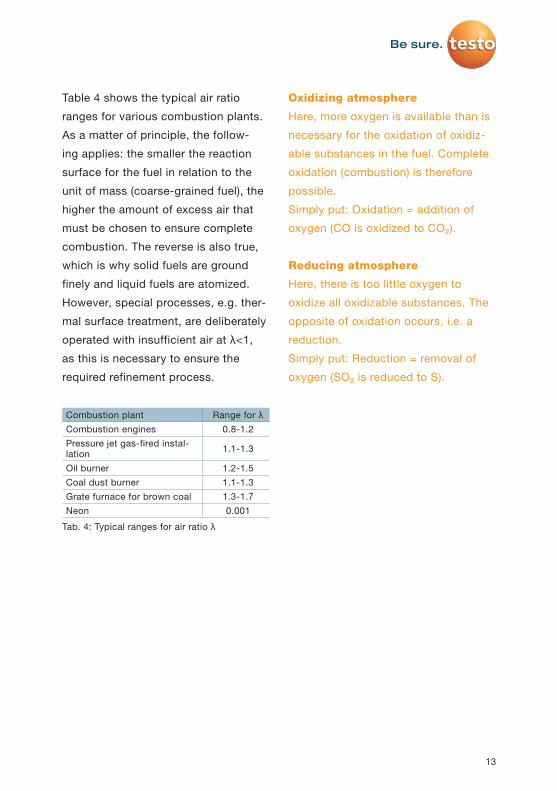
Table 4 shows the typical air ratio
ranges for various combustion plants.
As a matter of principle, the follow-
ing applies: the smaller the reaction
surface for the fuel in relation to the
unit of mass (coarse-grained fuel), the
higher the amount of excess air that
must be chosen to ensure complete
combustion. The reverse is also true,
which is why solid fuels are ground
finely and liquid fuels are atomized.
However, special processes, e.g. ther-
mal surface treatment, are deliberately
operated with insufficient air at λ<1,
as this is necessary to ensure the
required refinement process.
Combustion plant Range for λCombustion engines 0.8-1.2Pressure jet gas-fired instal-lation 1.1-1.3
Oil burner 1.2-1.5Coal dust burner 1.1-1.3Grate furnace for brown coal 1.3-1.7Neon 0.001
Tab. 4: Typical ranges for air ratio λ
Oxidizing atmosphere
Here, more oxygen is available than is
necessary for the oxidation of oxidiz-
able substances in the fuel. Complete
oxidation (combustion) is therefore
possible.
Simply put: Oxidation = addition of
oxygen (CO is oxidized to CO₂).
Reducing atmosphere
Here, there is too little oxygen to
oxidize all oxidizable substances. The
opposite of oxidation occurs, i.e. a
reduction.
Simply put: Reduction = removal of
oxygen (SO₂ is reduced to S).
14
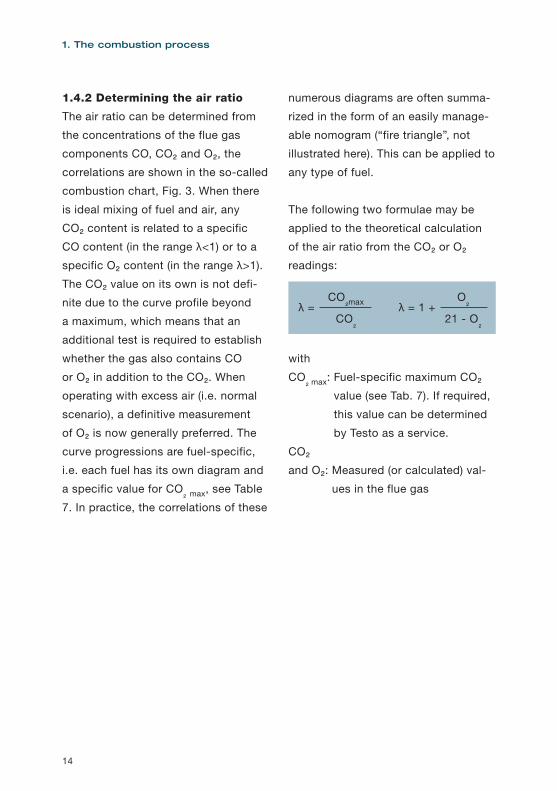
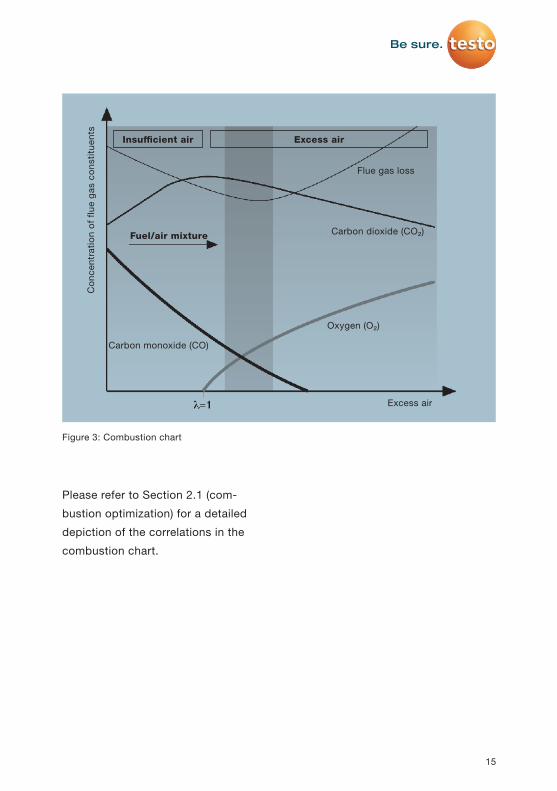
1.4.2 Determining the air ratio
The air ratio can be determined from
the concentrations of the flue gas
components CO, CO₂ and O₂, the
correlations are shown in the so-called
combustion chart, Fig. 3. When there
is ideal mixing of fuel and air, any
CO₂ content is related to a specific
CO content (in the range λ<1) or to a
specific O₂ content (in the range λ>1).
The CO₂ value on its own is not defi-
nite due to the curve profile beyond
a maximum, which means that an
additional test is required to establish
whether the gas also contains CO
or O₂ in addition to the CO₂. When
operating with excess air (i.e. normal
scenario), a definitive measurement
of O₂ is now generally preferred. The
curve progressions are fuel-specific,
i.e. each fuel has its own diagram and
a specific value for CO₂ max, see Table
7. In practice, the correlations of these
numerous diagrams are often summa-
rized in the form of an easily manage-
able nomogram (“fire triangle”, not
illustrated here). This can be applied to
any type of fuel.
The following two formulae may be
applied to the theoretical calculation
of the air ratio from the CO₂ or O₂
readings:
λ = λ = 1 +CO₂max O₂
CO₂ 21 - O₂
with
CO₂ max: Fuel-specific maximum CO₂
value (see Tab. 7). If required,
this value can be determined
by Testo as a service.
CO₂
and O₂: Measured (or calculated) val-
ues in the flue gas
1. The combustion process
15
Please refer to Section 2.1 (com-
bustion optimization) for a detailed
depiction of the correlations in the
combustion chart.
Flue gas loss
Fuel/air mixture Carbon dioxide (CO₂)
Carbon monoxide (CO)
Oxygen (O₂)
Excess air
Con
cent
ratio
n of
flu
e ga
s co
nstit
uent
s
Insufficient air Excess air
Figure 3: Combustion chart
16
1.4.3 Combustion air requirement
The actual air requirement is calculated
• From the minimum oxygen required
for ideal combustion (this depends
on the fuel)
• The required excess oxygen and
• The relative oxygen content in the
air. For dry air under atmospheric
pressure, this is 20.95 %. In practice,
however, the ambient air used as
combustion air is never completely
dry, which means that the humidity
also has to be factored into the cal-
culation of the air volume to ensure
an exact process.
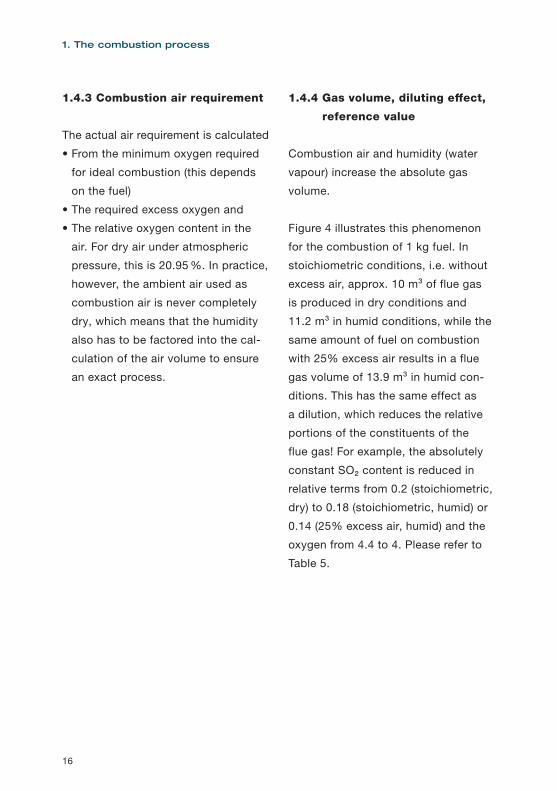
1.4.4 Gas volume, diluting effect,
reference value
Combustion air and humidity (water
vapour) increase the absolute gas
volume.
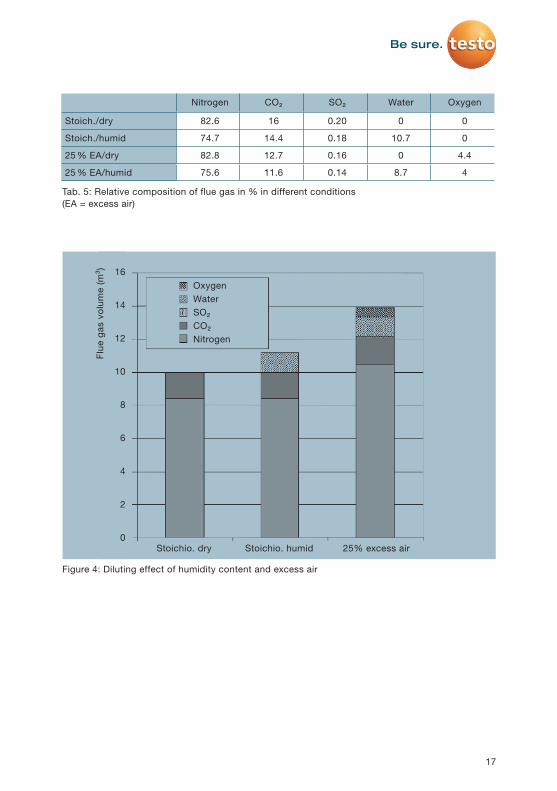
Figure 4 illustrates this phenomenon
for the combustion of 1 kg fuel. In
stoichiometric conditions, i.e. without
excess air, approx. 10 m³ of flue gas
is produced in dry conditions and
11.2 m³ in humid conditions, while the
same amount of fuel on combustion
with 25% excess air results in a flue
gas volume of 13.9 m³ in humid con-
ditions. This has the same effect as
a dilution, which reduces the relative
portions of the constituents of the
flue gas! For example, the absolutely
constant SO₂ content is reduced in
relative terms from 0.2 (stoichiometric,
dry) to 0.18 (stoichiometric, humid) or
0.14 (25% excess air, humid) and the
oxygen from 4.4 to 4. Please refer to
Table 5.
1. The combustion process
17
Nitrogen CO₂ SO₂ Water Oxygen
Stoich./dry 82.6 16 0.20 0 0
Stoich./humid 74.7 14.4 0.18 10.7 0
25 % EA/dry 82.8 12.7 0.16 0 4.4
25 % EA/humid 75.6 11.6 0.14 8.7 4
Tab. 5: Relative composition of flue gas in % in different conditions (EA = excess air)
OxygenWaterSO₂CO₂Nitrogen
Stoichio. dry Stoichio. humid 25% excess air
16
14
12
10
8
6
4
2
0
Figure 4: Diluting effect of humidity content and excess air
Flue
gas
vol
ume
(m³)
18
Reference values
From the depicted correlations, it is
clear that concentration observations
can usually only be made in conjunc-
tion with reference values. It is only
then that the readings have any mean-
ing and can be compared with other
measurement results, and in particular
with statutory requirements! In prac-
tice, the following are used:
• Reference to a specific dilution due
to excess air; a measure of this is
the oxygen content, the reference is
expressed by e.g.”Reference value
8% oxygen”.
This reference to the oxygen value
is generally applied in the specifica-
tions of the TI Air; however, it is also
used outside of the TI Air: for a plant,
the reference point is defined close
to the oxygen content when the plant
is started up.
• Reference to a specific dilution due
to the humidity content of the gas; a
measure of this is the temperature of
the gas, the reference is expressed,
for example, by “based on dry flue
gas” or “at dew point 4 °C”.
• Reference to the normal state of a
gas. This pertains to the dependence
of a gas volume on the actual values
of pressure and temperature, please
refer to Section 3.1.1
1. The combustion process
19
1.5 Flue gas (exhaust gas) and its
composition
The flue gas generated in combus-
tion processes is also referred to as
exhaust gas. Its composition depends
on the fuel and the combustion con-
ditions, e.g. the air ratio. Many of the
constituents of flue gas are classified
as air pollutants, and must therefore
be removed from the flue gas before
it is released into the atmosphere
via cleaning processes, which are
extremely time-consuming and costly
in some cases, in conformity with
statutory regulations (please refer to
Section 2.3). Flue gas in its original
composition after combustion is also
referred to as crude gas, and once it
has passed through the cleaning stag-
es it is called clean gas.
The most important flue gas compo-
nents are explained below.
Nitrogen (N₂)
At 79 vol.%, nitrogen is the main
component of the air. This colour-
less, odourless and tasteless gas is
supplied via the combustion air, but
does not play a direct role in the actual
combustion process; it is carried as a
ballast and a waste heat carrier and is
returned to the atmosphere. However,
parts of the nitrogen, in combination
with the nitrogen contained in the fuel,
contribute to the formation of the haz-
ardous nitrogen oxides (see below).
Carbon dioxide (CO₂)
Carbon dioxide is a colourless and
odourless gas with a slightly sour
taste, which is generated in all com-
bustion processes and by breathing.
Due to its property of filtering radiated
heat, it is a major contributor to the
greenhouse effect. Natural air only
contains 0.03 %; the permissible MAC
(maximum allowable concentration)
is 0.5 %; concentrations of more than
15 % in the air inhaled by humans
cause unconsciousness.
Water vapour (humidity)
The hydrogen contained in the fuel
combines with oxygen to form water
(H₂O). Together with the water from the
fuel and the combustion air, depend-
ing on the flue gas temperature (FT)
this is discharged as flue gas humidity
(at high FT) or as condensate (at low
FT).
20
Oxygen (O₂)
Oxygen that has not been used in
combustion in the event of excess air
is discharged as a gaseous flue gas
component and is a measure of com-
bustion efficiency. It is used for the
determination of combustion parame-
ters and as a reference value.
Carbon monoxide (CO)
Carbon monoxide is a colourless
and odourless toxic gas. It is main-
ly generated during the incomplete
combustion of fossil fuels (furnaces)
and automotive fuels (motor vehicles)
and other materials containing carbon.
CO is generally innocuous to humans,
since it soon bonds with the oxygen
in the air to form CO₂. However, within
enclosed spaces CO is very danger-
ous, because a concentration of only
700 ppm in the air inhaled by humans
will cause death within a few hours.
The MAC value is 50 ppm.
Nitrogen oxides (NO and NO₂, total
formula NOX)
In combustion processes, the nitrogen
from the fuel and, at high tempera-
tures, also from the combustion air,
is combined to a certain extent with
the combustion air/oxygen, initially
forming nitrogen monoxide NO (fuel
NO and thermal NO), which in the
presence of oxygen is oxidized in a
further step to form the hazardous
nitrogen dioxide (NO₂) in the flue gas
duct and later in the atmosphere. Both
oxides are toxic; NO₂ in particular is a
dangerous respiratory poison and, in
combination with sunlight, contributes
to the formation of ozone. Sophisti-
cated technologies such as the SCR
process are used to clean flue gases
containing NOX. Special combustion
measures, e.g. staged air supply, are
used to reduce nitrogen oxides during
combustion.
Sulphur dioxide (SO₂)
Sulphur dioxide is a colourless, toxic
gas with a pungent smell. It is pro-
duced as a result of the oxidation of
the sulphur contained in the fuel. The
MAC value is 5 ppm. In combination
with water or condensate, sulphur-
ous acid (H₂SO₃) and sulphuric acid
(H₂SO₄) are produced, both of which
are linked to numerous types of envi-
ronmental damage to vegetation and
building fabrics. Flue gas desulphuri-
zation plants (FGD) are used to reduce
sulphur oxides.
1. The combustion process
21
Hydrogen sulphide (H₂S)
Hydrogen sulphide is a toxic and ex-
tremely malodorous gas, even in very
low concentrations (approx. 2.5 µg/
m³). It is a naturally occurring constit-
uent of natural gas and petroleum and
is therefore present in refineries and
natural gas processing plants, but also
in tanneries, agricultural business-
es and, last but not least, following
incomplete combustion in vehicle cat-
alytic converters. Combustion to SO₂,
certain absorption processes or, in the
case of larger quantities, conversion
to elemental sulphur in a Claus plant
are some of the processes used to
eliminate H₂S from flue gases.
Hydrocarbons
(HC or CXHY)
Hydrocarbons are an extensive group
of chemical compounds composed ex-
clusively of carbon and hydrogen. HCs
are the most important substances in
organic chemistry; they occur naturally
in petroleum, natural gas or carbon.
HCs can be emitted both when HC
products are manufactured (e.g. in
refineries) but also when they are used
and disposed of (solvents, plastics,
paints, fuels, waste etc.). Incomplete
combustions are a particular source
of HC emissions. This also includes
forest and bush fires as well as ciga-
rettes, for example. HCs contribute to
the greenhouse effect.
Examples of HCs include methane
(CH₄), butane (C₄H10) and benzene
(C₆H₆), but also the carcinogenic sub-
stance benzo[a]pyrene. The whole po-
tential of a flue gas for volatile organic
compounds is often referred to as the
total C or Ctotal. This total is usually
determined in the flue gas.
Hydrogen cyanide (HCN)
Hydrogen cyanide (also known as
hydrocyanic acid) is a very toxic liquid
with a boiling point of 25.6 °C; it exists
in flue gases, if present, in gaseous
form. HCN may exist in waste inciner-
ation plants.
22
Ammonia (NH₃)
Ammonia plays a role in flue gases in
conjunction with the SCR process for
flue gas denitrification. In the denitrifi-
cation reactors, it is added to the flue
gas in precisely metered quantities
and causes the conversion of the ni-
trogen oxides into nitrogen and water.
The unused residue (NH₃ slip) is great-
ly reduced via downstream cleaning
stages, and in the clean gas is usually
at or below 2 mg/m³.
Halogen halides (HCl, HF)
During the combustion of coal and/or
waste materials, the hydrogen halides
HCl and HF may form, and these form
aggressive acids in combination with
humid atmospheres. These substanc-
es are largely washed out of the flue
gas by the flue gas cleaning plants
(scrubbers).
Solids (dust, soot)
Solid pollutants in the flue gas come
from the incombustible components of
solid and liquid fuels. These include,
for example, the oxides of silicon,
aluminium, calcium etc. in the case of
coal and the sulphates of various sub-
stances in the case of heavy fuel oil.
The harmful effect of dust on humans
is mainly due to the accumulation of
toxic and carcinogenic substances in
the dust particles.
1. The combustion process

23
1.6 Gross calorific value, net
calorific value, efficiency, flue
gas loss
Gross calorific value, net calorific
value
The gross calorific value (formerly
referred to as the upper net calorific
value) is a characteristic value for
fuel and refers to the energy released
during full combustion in relation to
the quantity of fuel used. The net cal-
orific value (formerly referred to as the
lower net calorific value), on the other
hand, is the released energy minus the
evaporation heat of the water vapour
generated during combustion at 25 °C,
again in relation to the quantity of fuel
used.
Basically, the net calorific value is less
than the gross calorific value.
Condensing boiler
Condensing boilers are boilers which,
in addition to the combustion heat,
also make use of the condensa-
tion heat of the flue gas by means
of heat exchangers. In terms of the
net calorific value, these boilers can
achieve combustion efficiencies of
107%. However, the condensate that
is generated and contaminated with
pollutants must be disposed of in an
environmentally friendly manner.
Efficiency of a combustion
The efficiency is a variable determined
from performance values while the
plant is in stationary operation. The ef-
ficiency (this is always less than 100%)
is the ratio of the energy supplied to
the combustion chamber overall to the
energy required or used to carry out
the process (heating, melting, sin-
tering, etc.). Efficiency is made up of
several components:
• The combustion efficiency describes
the proportion of the total input
power (energy per time unit) that is
available in the combustion chamber
after combustion. This makes it an
important factor for the quality of the
combustion.
• The furnace efficiency, which largely
depends on its design, describes the
quality of the furnace and the oper-
ation via the relationship between
the supplied energy and the energy
available in the furnace.
• The total efficiency is obtained by
multiplying the combustion and fur-
nace efficiencies.
24
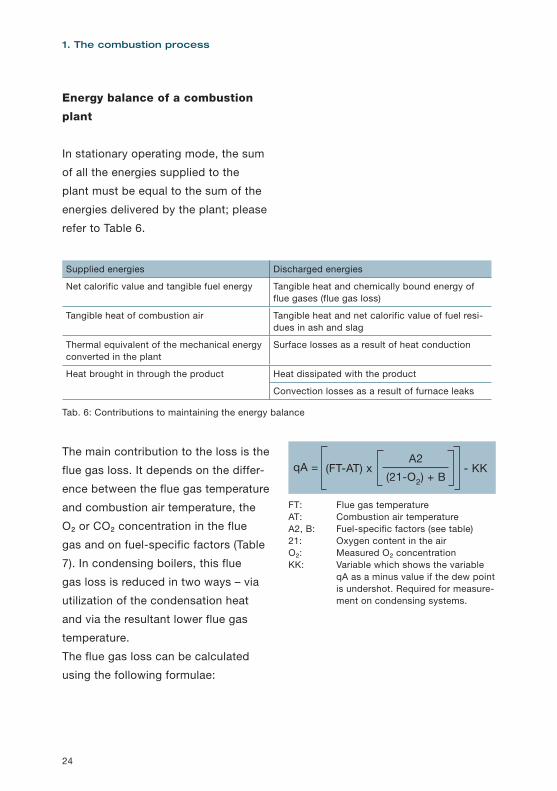
Energy balance of a combustion
plant
In stationary operating mode, the sum
of all the energies supplied to the
plant must be equal to the sum of the
energies delivered by the plant; please
refer to Table 6.
The main contribution to the loss is the
flue gas loss. It depends on the differ-
ence between the flue gas temperature
and combustion air temperature, the
O₂ or CO₂ concentration in the flue
gas and on fuel-specific factors (Table
7). In condensing boilers, this flue
gas loss is reduced in two ways – via
utilization of the condensation heat
and via the resultant lower flue gas
temperature.
The flue gas loss can be calculated
using the following formulae:
FT: Flue gas temperatureAT: Combustion air temperatureA2, B: Fuel-specific factors (see table)21: Oxygen content in the airO₂: Measured O₂ concentrationKK: Variable which shows the variable
qA as a minus value if the dew point is undershot. Required for measure-ment on condensing systems.
1. The combustion process
qA = (FT-AT) x - KKA2
(21-O2) + B
Supplied energies Discharged energies
Net calorific value and tangible fuel energy Tangible heat and chemically bound energy of flue gases (flue gas loss)
Tangible heat of combustion air Tangible heat and net calorific value of fuel resi-dues in ash and slag
Thermal equivalent of the mechanical energy converted in the plant
Surface losses as a result of heat conduction
Heat brought in through the product Heat dissipated with the product
Convection losses as a result of furnace leaks
Tab. 6: Contributions to maintaining the energy balance
25
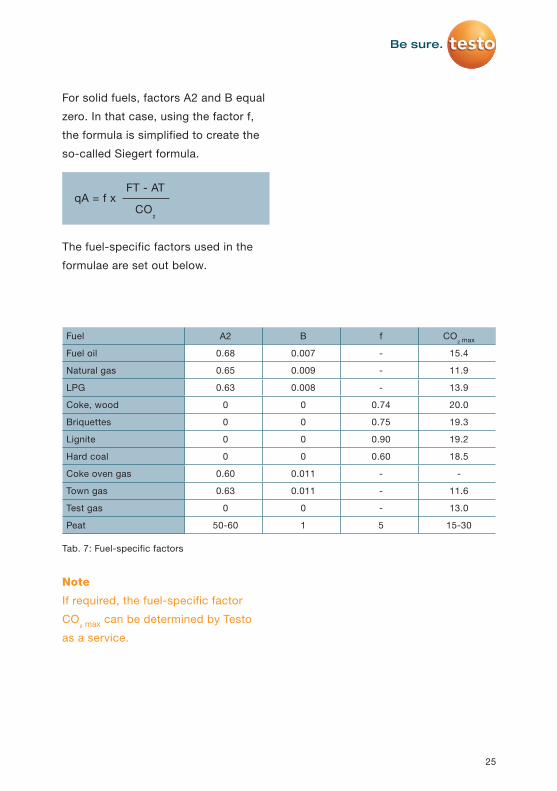
For solid fuels, factors A2 and B equal
zero. In that case, using the factor f,
the formula is simplified to create the
so-called Siegert formula.
The fuel-specific factors used in the
formulae are set out below.
Note
If required, the fuel-specific factor
CO₂ max can be determined by Testo
as a service.
qA = f xFT - AT
CO₂
Fuel A2 B f CO₂ max
Fuel oil 0.68 0.007 - 15.4
Natural gas 0.65 0.009 - 11.9
LPG 0.63 0.008 - 13.9
Coke, wood 0 0 0.74 20.0
Briquettes 0 0 0.75 19.3
Lignite 0 0 0.90 19.2
Hard coal 0 0 0.60 18.5
Coke oven gas 0.60 0.011 - -
Town gas 0.63 0.011 - 11.6
Test gas 0 0 - 13.0
Peat 50-60 1 5 15-30
Tab. 7: Fuel-specific factors
26
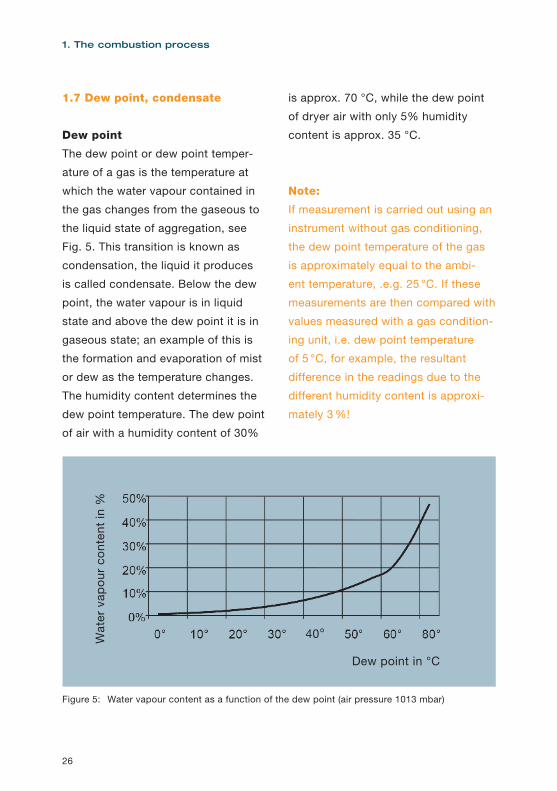
1.7 Dew point, condensate
Dew point
The dew point or dew point temper-
ature of a gas is the temperature at
which the water vapour contained in
the gas changes from the gaseous to
the liquid state of aggregation, see
Fig. 5. This transition is known as
condensation, the liquid it produces
is called condensate. Below the dew
point, the water vapour is in liquid
state and above the dew point it is in
gaseous state; an example of this is
the formation and evaporation of mist
or dew as the temperature changes.
The humidity content determines the
dew point temperature. The dew point
of air with a humidity content of 30%
is approx. 70 °C, while the dew point
of dryer air with only 5% humidity
content is approx. 35 °C.
Note:
If measurement is carried out using an
instrument without gas conditioning,
the dew point temperature of the gas
is approximately equal to the ambi-
ent temperature, .e.g. 25 °C. If these
measurements are then compared with
values measured with a gas condition-
ing unit, i.e. dew point temperature
of 5 °C, for example, the resultant
difference in the readings due to the
different humidity content is approxi-
mately 3 %!
1. The combustion process
40°
Dew point in °C
Wat
er v
apou
r co
nten
t in
%
Figure 5: Water vapour content as a function of the dew point (air pressure 1013 mbar)

27
Heated lines,
measuring gas coolers
Flue gases with 8% humidity, for
example, have a dew point of about
40°C, which means that condensate
forms below this temperature. This
has two important consequences for
the plant as a whole as well as for the
measuring equipment:
• If the flue gas contains sulphur
dioxides, for instance, then at
temperatures below 40 °C (e.g. in
unheated pipes) these combine with
the condensing water vapour to form
sulphurous acid (H₂SO₃) and sulphu-
ric acid (H₂SO₄), both of which are
extremely corrosive and can cause
considerable damage to the system
components that come into contact
with them. For this reason, the tem-
perature of the flue gas in the plant
is kept above the dew point (i.e.
above 40 °C in the case of the above
example) until the flue gas reaches
the scrubber.
The same applies to those com-
ponents of measuring instruments
through which the flue gas flows and
above all to the components of the
sampling device, such as probes
and hoses. For this reason, heated
probes and measurement gas lines
are used and their temperature is
kept above the dew point of the gas.
Failure to observe this measure will
result in damage to the measuring
instruments and incorrect measure-
ments!
• Testo’s newly developed and patent-
ed method of particularly high gas
flow velocity combined with a spe-
cially coated surface of the meas-
urement gas lines offers a further
alternative for preventing the forma-
tion of condensation. As a result, it
is no longer necessary to heat the
lines, which is extremely important
for mobile devices in view of the re-
sulting reduction in power consump-
tion. Water vapour is absent from the
cooled flue gas to a greater or lesser
extent depending on the temperature
to which the gas is cooled, with the
result that the other components of
the gas, such as CO, which have not
changed quantitatively form a higher
relative portion of the flue gas; the
corresponding readings are then
higher than in the moist flue gas! For
comparable readings, the respective
measurement gas must therefore
have the same temperatures and
therefore the same humidity content.
28
As a consequence, measuring gas
coolers (they could also be called
measuring gas dryers) are used in the
gas analysis upstream of the analyzer;
these bring the gas to a defined tem-
perature and therefore a defined level
of drying and keep it there.
Note
• Cooling gas means drying gas.
• In dry gas, the readings for gas com-
ponents are comparatively higher
than those in humid gas.
Testo instruments use what is known
as a Peltier cooler for measurement
gas cooling, its function is based on
the fact that the interface between two
different types of metals heats up or
cools down depending on the direction
of current flow. This cooler can cool
the measurement gas in the testo 350
to +3 °C and keep it constant.
Permeation coolers, which are also
common on the market, have the
disadvantage of not being able to
maintain a defined dew point; moreo-
ver, they are susceptible to clogging
by dust particles, which leads to
increased spare parts costs.
1. The combustion process
29
Gas analysis (measuring technolo-
gy for analyzing the composition of
gases) is an indispensable tool for
economical and safe process control
in practically all industrial sectors.
The focus is on combustion process-
es, although this is a generic term
that encompasses a large number of
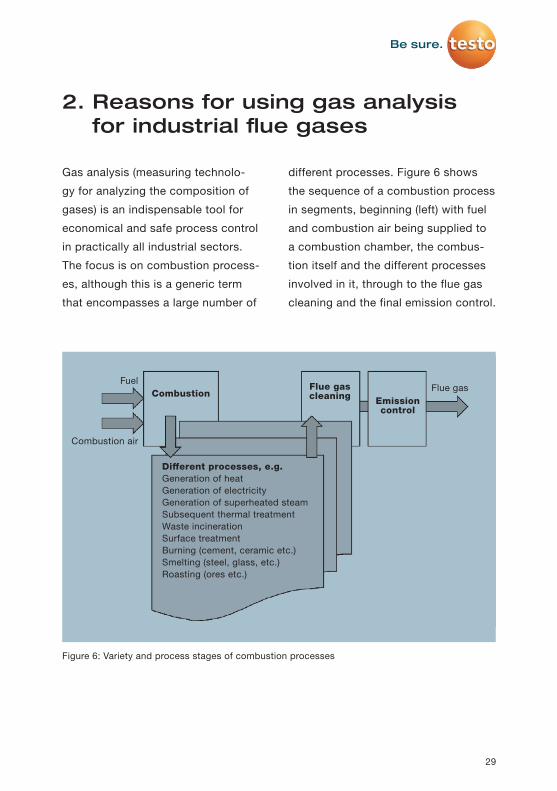
different processes. Figure 6 shows
the sequence of a combustion process
in segments, beginning (left) with fuel
and combustion air being supplied to
a combustion chamber, the combus-
tion itself and the different processes
involved in it, through to the flue gas
cleaning and the final emission control.
2. Reasons for using gas analysis for industrial flue gases
FuelFlue gas
CombustionFlue gas cleaning Emission
control
Combustion air
Different processes, e.g.Generation of heatGeneration of electricityGeneration of superheated steamSubsequent thermal treatmentWaste incinerationSurface treatmentBurning (cement, ceramic etc.)Smelting (steel, glass, etc.)Roasting (ores etc.)
Figure 6: Variety and process stages of combustion processes
30
Gas analysis provides information
about the composition of combustion
and flue gases at all stages of this
process chain. This makes it an in-
dispensable tool for economical, safe
plant operation that complies with the
official regulations and, at the same
time, for guaranteeing production
quality and efficiency.
Gas analyzers are offered by many
manufacturers in different designs
and based on a variety of measuring
principles; more details can be found
in Section 3 of this Guide.
Testo’s gas analyzers are widely used
in industry for analyzing combustion
gases, and they are by no means
limited to emissions monitoring. The
following areas of application are well
established, with a certain degree of
overlap:
1. Adjustment and servicing work for
general monitoring, for example
following plant maintenance, for
troubleshooting in the event of
unstable processes, in preparation
for official measurements, following
repairs etc.
2. Process measurements for combus-
tion optimization of fuel, combustion
air, burner and within the combus-
tion chamber, with the aim of saving
fuel, improving efficiency and ex-
tending the service life of the plant.
These applications are also related
to the emission measurements
(hereinafter referred to as points 4
and 5), since optimized combustion
usually also leads to a reduction in
emission levels.
3. Process measurements for moni-
toring a defined gas atmosphere in
boiler rooms or in special combus-
tion chambers or furnaces during
processes such as burning, roast-
ing, surface treatment etc.
4. Process and emissions measure-
ments for monitoring flue gas clean-
ing equipment to make sure that it
is functioning properly.
5. Emissions measurements for
monitoring compliance with limit
values for pollutants in the flue gas
upstream of or at the stack.
2. Reasons for using gas analysis for industrial flue gases
31
2.1 Gas analysis for combustion
optimization
Major contributions to combustion
optimization are made by
• The composition of fuel and com-
bustion air (gas analysis field of
application)
• The ignition behaviour and the com-
bustion temperature
• The design of the burner and com-
bustion chamber, as well as
• The fuel/combustion air ratio (gas
analysis field of application).
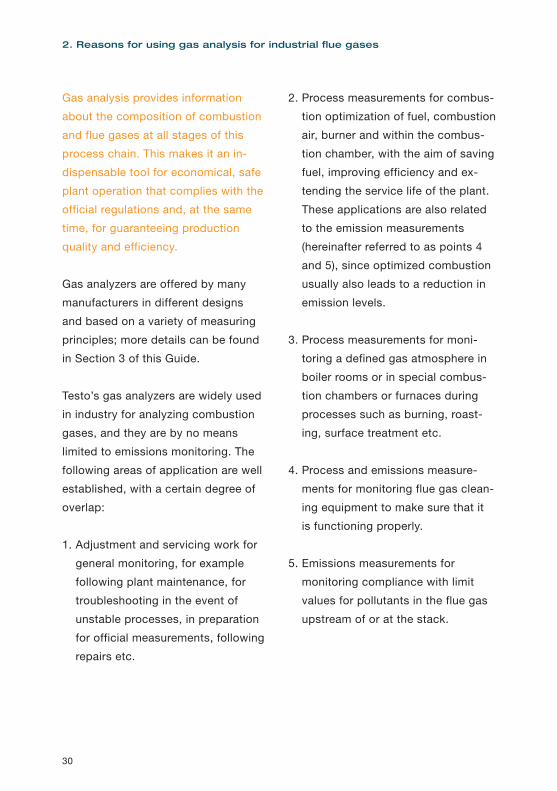
The optimum ratio of fuel to combus-
tion air (air quantity λ) for a given plant
and a given fuel can be determined
from gas analysis readings using the
combustion chart (see Fig. 7). Here,
the concentration progressions of the
gas components CO, CO₂ and O₂ are
shown in relation to the air ratio. The
line representing ideal combustion
with 0 excess air (λ =1) is in the middle
of the diagram, to the right of this, the
volume of excess air increases and to
the left is the increasing air deficien-
cy range (insufficient air also means
insufficient oxygen!).
The concentration progressions shown
provide the following information:
Left-hand area at λ<1 Flue gas loss
Fuel/air mixture Carbon dioxide (CO₂)
Carbon monoxide (CO)
Oxygen (O₂)
Excess air
Con
cent
ratio
n of
flu
e ga
s co
nstit
uent
s
Insufficient air Excess air
Figure 7: Combustion chart

32
2. Reasons for using gas analysis for industrial flue gases
chamber is not uniform. The particle
size of the fuel is also significant: the
smaller the particle, the more inten-
sive the contact with oxygen is and
the less excess air is required.
• CO₂, on the other hand, decreas-
es again relative to its maximum
value at λ=1, however not due to a
chemical reaction, but as a diluting
effect due to the increasing amount
of combustion air, which brings in
virtually no CO₂ itself.
Conclusion
Optimum combustion is achieved
if there is sufficient excess air and
therefore oxygen to burn all the CO (λ
range = 1.0 to approx. 1.3), but at the
same time there is a low ceiling on the
amount of excess air, so that as little
hot flue gas and therefore thermal en-
ergy as possible is lost to the atmos-
phere as a result of unnecessarily high
amounts of excess air.
(Insufficient air)
• When there is insufficient air, CO is
present because there is not enough
oxygen available to oxidize all CO to
CO₂. Due to its toxicity, CO that is
present in the event of insufficient air
is extremely dangerous when it leaks
out of the plant!
• As the insufficient air decreases,
i.e. the O₂ concentration increases,
the CO concentration decreases
through oxidation to CO₂ and the
CO₂ concentration increases ac-
cordingly. This process is completed
at or a little above λ=1, CO ap-
proaches zero and CO₂ reaches its
maximum.
• Oxygen is not present in this range
or is not measurable, as any oxygen
added is immediately used to oxidize
the CO.
Right-hand area at λ>1
(Excess air)
• In the range λ>1, O₂ increases
because the oxygen supplied as the
excess air increases is no longer
consumed through oxidation due to
a lack of CO. In practice, however,
a certain amount of excess air is
always required to ensure complete
combustion, as the distribution
of oxygen across the combustion
33
Economic relevance
Apart from reducing emissions, the
main aim of optimizing combustion by
operating a plant with the optimum,
i.e. generally the minimum possible,
amount of excess air is to reduce
costs by saving fuel.
A rule of thumb, which is common in
practice and documented in the liter-
ature, states that by lowering the ex-
cess oxygen by one percentage point
(not by 1% relative!), i.e. from 4.5 to
3.5%, for example, the efficiency of a
combustion plant can be increased by
1% and the fuel costs can be reduced
accordingly.
For example, with monthly fuel costs
of $15 million for a medium-sized
power plant, this results in monthly
savings of $30,000 if, by means of gas
analysis, regular plant operation can
be implemented at only 0.2% points
closer to the optimum excess air
value than before! Similar savings are
possible if short-term deviations from
the optimum operating conditions can
be detected and remedied at an early
stage through the use of gas analysis.
The energy-optimized λ range for a
combustion plant (this also depends
on plant-specific data) can be deter-
mined by measuring the two compo-
nents CO₂ and CO (CO₂ on its own is
ambiguous due to the curve progres-
sion over a maximum!) or by meas-
uring O₂ alone. The latter option of
measuring O₂ is now widely used.
Depending on the plant and its oper-
ator, the measuring or gas sampling
points can be located at various points
in the combustion chamber.
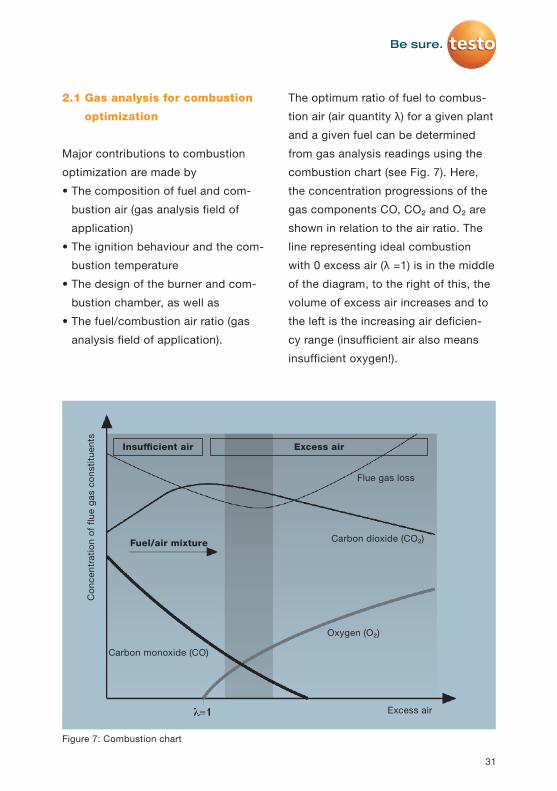
The correlations between air ratio,
excess air and typical oxygen content
in dry flue gas shown in the diagram
are given in figures in Tab. 8 for the
combustion of hard coal.
Air ratio λ Excess air as % Oxygen con-tent as %
0.9 Insufficient air Insufficient oxygen
1.0 0 01.1 10% 21.2 20% 3.51.3 30% 4.81.4 40% 6.2
Tab. 8: Correlation between excess air and oxygen content in dry flue gas from a hard-coal-fired facility
34
2. Reasons for using gas analysis for industrial flue gases
Gas analysis makes it possible to
assess these process steps with
regard to excess air, to calculate false
air flows and to balance the individual
plant components separately. This is
important for the calciner performance
(measurement of CO₂ and O₂), for
example, since insufficient calcination
can cause significant malfunctions in
the furnace operation.
In processes of this kind, substanc-
es can pass from the product being
processed into the flue gas, increasing
the usual emissions produced by the
combustion plant. In certain cases,
however, pollutants can conversely be
passed from the gas into the product
being processed or into specially des-
ignated substances (slag). An example
of this is the cement or lime industry,
where the sulphur in the fuel becomes
a constituent of the product as sulphur
oxide in the combustion process.
Conversely, during the production of
glass or bricks, sulphur oxides are re-
leased from the product being burned,
increasing the flue gas concentration
2.2 Gas analysis
for process control
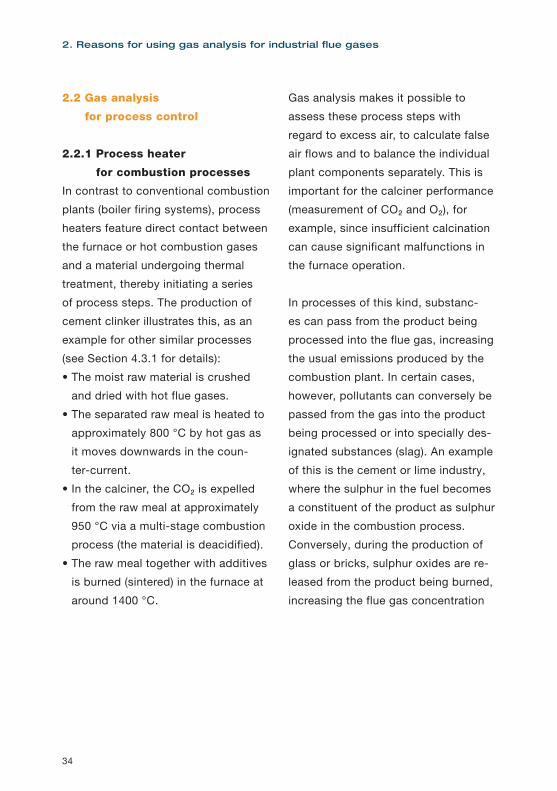
2.2.1 Process heater
for combustion processes
In contrast to conventional combustion
plants (boiler firing systems), process
heaters feature direct contact between
the furnace or hot combustion gases
and a material undergoing thermal
treatment, thereby initiating a series
of process steps. The production of
cement clinker illustrates this, as an
example for other similar processes
(see Section 4.3.1 for details):
• The moist raw material is crushed
and dried with hot flue gases.
• The separated raw meal is heated to
approximately 800 °C by hot gas as
it moves downwards in the coun-
ter-current.
• In the calciner, the CO₂ is expelled
from the raw meal at approximately
950 °C via a multi-stage combustion
process (the material is deacidified).
• The raw meal together with additives
is burned (sintered) in the furnace at
around 1400 °C.
35
2.2.2 Industrial combustion plants
The term “industrial combustion plant”
refers to combustion plants that are
used in industry for generating steam
and hot water or heating up other heat
transfer media. This also includes
combustion plants for converting ma-
terials, in refineries or coking plants,
for example. The heat output of indus-
trial combustion plants is generally in
the megawatt range. As a result, they
are predominantly covered by the TI
Air emissions regulations, and in rare
cases (capacity > 50 MW or > 100 MW
for gas-fired installations) the Large
Combustion Plant Ordinance (13th
BImSchV) applies.
Here, the gas analysis tasks relate to
optimizing combustion, controlling the
flue gas cleaning and monitoring the
limit values.
considerably. The same applies to
increased CO emissions in processes
operated counter-currently to input
material and flue gas (e.g. in rotary
kilns). In remote zones away from the
furnace, there may be insufficient ox-
ygen, resulting in incomplete combus-
tion with increased CO concentration.
Heavy metals may be integrated into
the incinerator charge (cement, lime)
or released from this into the flue gas
(metal industry, glass production).
Through process-related measures
such as furnace chamber design,
flame conduction, incinerator charge
and furnace chamber temperature,
combustion air supply, etc., pro-
cess-related emissions can be greatly
reduced. Gas analysis provides the
necessary information to achieve this.

36
2. Reasons for using gas analysis for industrial flue gases
In all cases, gas analysis is required
both for optimum plant operation
(reduced costs and safety) and for
monitoring the process-specific gas
atmosphere (product quality, including
documentation in accordance with ISO
9000 ff.). The most important compo-
nents for analysis are O₂, CO, CO₂ and
SO₂. Please refer to the application
example in Section 4.4.6.
2.2.3 Thermochemical surface
treatment
This is a heat treatment process,
which changes the chemical compo-
sition of a workpiece or its surface
through the diffusion in or out of
certain elements from the surrounding
gas atmosphere. This is used primar-
ily to harden steel, but also to bake
glazing and paints in the ceramics
industry. These processes almost
exclusively use gas as a treatment
medium (in rare cases powder as well),
and they are characterized by the na-
ture and concentration of the elements
diffused in (e.g. nitrogen for nitration,
chromium for chrome plating) and
process temperatures (approximately
400 - 1100 °C). Continuous flow and
batch furnaces come in a wide range
of different designs.
37
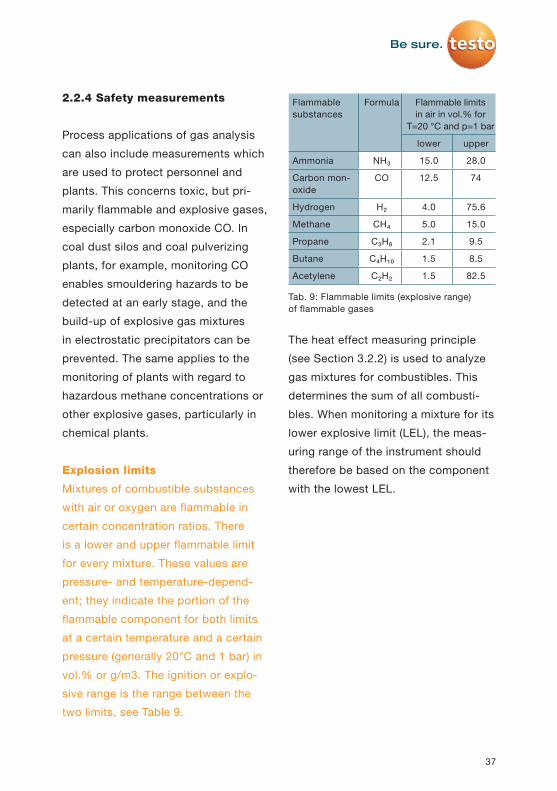
The heat effect measuring principle
(see Section 3.2.2) is used to analyze
gas mixtures for combustibles. This
determines the sum of all combusti-
bles. When monitoring a mixture for its
lower explosive limit (LEL), the meas-
uring range of the instrument should
therefore be based on the component
with the lowest LEL.
2.2.4 Safety measurements
Process applications of gas analysis
can also include measurements which
are used to protect personnel and
plants. This concerns toxic, but pri-
marily flammable and explosive gases,
especially carbon monoxide CO. In
coal dust silos and coal pulverizing
plants, for example, monitoring CO
enables smouldering hazards to be
detected at an early stage, and the
build-up of explosive gas mixtures
in electrostatic precipitators can be
prevented. The same applies to the
monitoring of plants with regard to
hazardous methane concentrations or
other explosive gases, particularly in
chemical plants.
Explosion limits
Mixtures of combustible substances
with air or oxygen are flammable in
certain concentration ratios. There
is a lower and upper flammable limit
for every mixture. These values are
pressure- and temperature-depend-
ent; they indicate the portion of the
flammable component for both limits
at a certain temperature and a certain
pressure (generally 20°C and 1 bar) in
vol.% or g/m3. The ignition or explo-
sive range is the range between the
two limits, see Table 9.
Tab. 9: Flammable limits (explosive range) of flammable gases
Flammable substances
Formula Flammable limits in air in vol.% for
T=20 °C and p=1 bar
lower upper
Ammonia NH₃ 15.0 28.0
Carbon mon-oxide
CO 12.5 74
Hydrogen H₂ 4.0 75.6
Methane CH₄ 5.0 15.0
Propane C₃H₈ 2.1 9.5
Butane C₄H₁₀ 1.5 8.5
Acetylene C₂H₂ 1.5 82.5

38
2. Reasons for using gas analysis for industrial flue gases
Emission
The air pollutions, noises, vibra-
tions, heat etc. coming out of a plant
(source)
Immission
The air pollutions, noises, vibrations
etc. acting on people, animals, plants,
soil, buildings etc.
2.3 Gas analysis for emission
control
In most countries, many types of
industrial plants (major power sta-
tions, steelworks, cement works, glass
works, chemical plants and lots more)
and local authority facilities, right
through to small production sites, are
subject to strict regulations governing
flue gas emissions into the atmos-
phere. Suitable measures must be tak-
en to ensure and regularly verify that
the components defined as pollutants
do not exceed certain limit values in
the flue gas. Individual countries have
passed laws and regulations in this
area, extensive regulations in some
cases; in Germany there is the Fed-
eral Immission Control Act, while its
counterpart in the USA is the Clean Air
Act. There are no standard regulations
governing Europe as a whole or the
Asian region. Many countries there-
fore base their national regulations on
the provisions of the BImSchG or the
Clean Air Act.
Gas analysis plays a key role in imple-
menting and monitoring the measures
required to limit emissions.
39
The Federal Immission Control Act is
broken down into the following sec-
tions, among others:
1. General Provisions §§ 1 - 3
2. Establishment and Operation of
Installations §§ 4 – 31
3. Nature of Installations, Substances,
Products, Fuels and Lubricants;
Greenhouse Gas Reduction in Fuels
§§ 32 – 37g
4. Nature and Operation of Vehicles,
Construction of and Alterations to
Roads and Railtracks §§ 38 – 43
5. Monitoring of Air Pollution and Im-
provement of Air Quality, Clean Air
Plans and Noise Abatement Plans
§§ 44 – 47
6. Noise Abatement Plans
§§ 47a – 47f
7. General regulations
§§ 48 – 62
8. Final provisions
§§ 66 - 73
2.3.1 Legal framework for
emissions/immissions in the
Federal Republic of Germany
The legal framework for all environ-
mental protection regulations in Ger-
many comprises:
• The German Federal Immission Con-
trol Act (BImschG) for the protection
of the environment in its version
dated 2017; and based on this
• Numerous legal regulations (German
Federal Immission Control Ordinance
(BImSchV)) to implement this law,
and finally
• TI Air which contains special tech-
nical instructions for the authorities
with specific requirements in terms
of the approval and monitoring of
plants in accordance with the 4th
German Federal Immission Control
Ordinance (BImSchV).
40
2. Reasons for using gas analysis for industrial flue gases
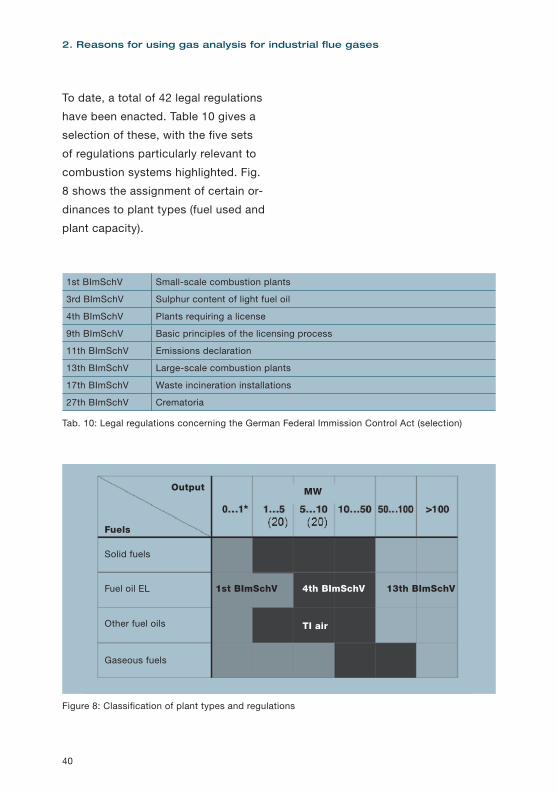
To date, a total of 42 legal regulations
have been enacted. Table 10 gives a
selection of these, with the five sets
of regulations particularly relevant to
combustion systems highlighted. Fig.
8 shows the assignment of certain or-
dinances to plant types (fuel used and
plant capacity).
Tab. 10: Legal regulations concerning the German Federal Immission Control Act (selection)
1st BImSchV Small-scale combustion plants
3rd BImSchV Sulphur content of light fuel oil
4th BImSchV Plants requiring a license
9th BImSchV Basic principles of the licensing process
11th BImSchV Emissions declaration
13th BImSchV Large-scale combustion plants
17th BImSchV Waste incineration installations
27th BImSchV Crematoria
Output MW
1st BImSchV 4th BImSchV
TI air
13th BImSchV
Fuels
Solid fuels
Fuel oil EL
Other fuel oils
Gaseous fuels
Figure 8: Classification of plant types and regulations
41
2.3.2 Specifications from the
German Federal Immission
Control Act (BImschG) for
Germany (selection)
Ordinance on small-scale combus-
tion plants (1st German Federal
Immission Control Ordinance
(BImSchV))
This regulation applies to all combus-
tion plants that do not require licenses,
with an output of up to 1, 5 or 10 MW
(depending on the fuel, see Fig. 8). The
chimney sweep is the officer in charge
of monitoring these plants. He or she
must establish once a year whether
the requirements for heating plants in
respect of emissions limits are being
met.
In the case of solid fuel plants, dust-
like emissions and, in certain cases,
carbon monoxide (CO) are determined.
In the case of oil-fired and gas-fired
installations, the flue gas loss is
determined as a parameter from the
measurement of the oxygen or carbon
dioxide content in the flue gas and the
difference between the flue gas tem-
perature and room temperature (the
temperature of the combustion air cor-
responds largely to room temperature).
The smoke number is also determined
for oil-fired installations.
Emission values and emission
limit values
• Emission values are standards with
a liability ranging below emission
limit values; emission values for air
pollution control are specified in TI
Air. These are defined as values, “the
exceeding of which can be avoided
by applying state of the art technol-
ogy”.
• Emission limit values are legislative
emission standards and are therefore
directly binding for those affected.
These values are set out, for ex-
ample, in the 1st German Federal
Immission Control Ordinance (BIm-
SchV), 4th BImSchV/TI Air, and the
13th, 17th and 27. BImSchV
42
2. Reasons for using gas analysis for industrial flue gases
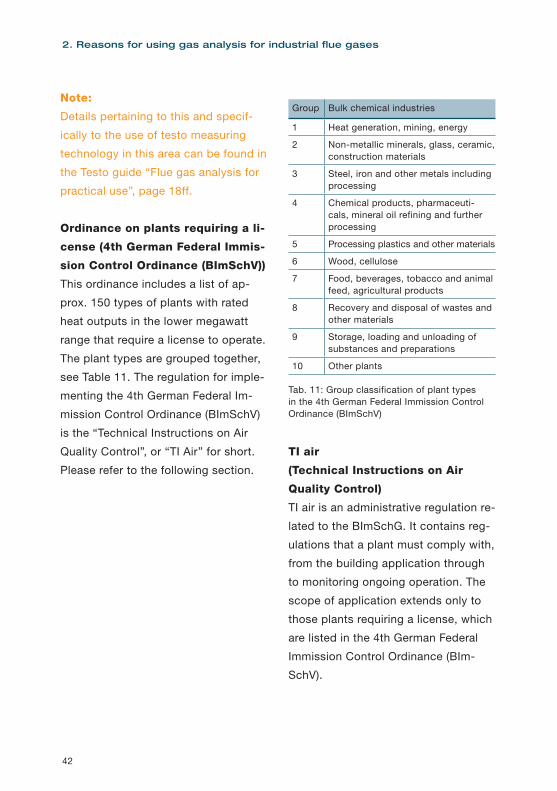
Group Bulk chemical industries
1 Heat generation, mining, energy
2 Non-metallic minerals, glass, ceramic, construction materials
3 Steel, iron and other metals including processing
4 Chemical products, pharmaceuti-cals, mineral oil refining and further processing
5 Processing plastics and other materials
6 Wood, cellulose
7 Food, beverages, tobacco and animal feed, agricultural products
8 Recovery and disposal of wastes and other materials
9 Storage, loading and unloading of substances and preparations
10 Other plants
Tab. 11: Group classification of plant types in the 4th German Federal Immission Control Ordinance (BImSchV)
TI air
(Technical Instructions on Air
Quality Control)
TI air is an administrative regulation re-
lated to the BImSchG. It contains reg-
ulations that a plant must comply with,
from the building application through
to monitoring ongoing operation. The
scope of application extends only to
those plants requiring a license, which
are listed in the 4th German Federal
Immission Control Ordinance (BIm-
SchV).
Note:
Details pertaining to this and specif-
ically to the use of testo measuring
technology in this area can be found in
the Testo guide “Flue gas analysis for
practical use”, page 18ff.
Ordinance on plants requiring a li-
cense (4th German Federal Immis-
sion Control Ordinance (BImSchV))
This ordinance includes a list of ap-
prox. 150 types of plants with rated
heat outputs in the lower megawatt
range that require a license to operate.
The plant types are grouped together,
see Table 11. The regulation for imple-
menting the 4th German Federal Im-
mission Control Ordinance (BImSchV)
is the “Technical Instructions on Air
Quality Control”, or “TI Air” for short.
Please refer to the following section.

43
metrologically flawless measurement
of emissions;
• Emissions of air pollutants for which
limits have been defined in the ap-
proval notice, are to be established
via initial and recurrent individual
measurements;
• In the event of particularly high
mass flows of substances subject
to emissions limits, these are to be
monitored via continuous measure-
ments, and
• Individual readings must be taken
on a regular basis for particularly
hazardous substances for which
continuous measurement would be
desirable but technically unviable.
Individual measurements accord-
ing to TI Air (measurement in ac-
cordance with § 26, 28 BImSchG)
Prior to the individual measurement,
an initial measurement is carried out
by an approved test centre following
new installation or substantial modifi-
cation of a plant. This initial measure-
ment can be regarded as an accept-
ance of the plant and is performed
within 3-12 months of commissioning.
The individual measurements are then
carried out every 3 years after this.
The concentrations of the noxious
gases subject to measurement are de-
termined as a mean value over a half-
hour measuring period and checked
TI Air is broken down into four parts:
Part 1: Regulations for applicability
Part 2: General regulations on air pol-
lution control
Part 3: Requirements for limiting and
setting emissions
Part 4: Redevelopment of old plants
Part 3 of TI Air is particularly relevant
to gas analysis technology. This con-
tains the main requirements for limiting
emissions in plants requiring a license.
Section 2.1 sets out the general rules,
with substances classified into four
classes according to their harmful ef-
fects: the limit value for the most haz-
ardous substances (Class I, e.g. arsine
or phosgene) is 1 mg/m3, whereas
the limit value for sulphur oxides or
nitrogen oxides (Class IV), for example,
is 500 mg/m³. These requirements are
generally applicable. However, in spe-
cific cases described in more detail in
Section 2.3, they are replaced by more
stringent special requirements.
Section 2.2 deals specifically with the
procedure for measuring and monitor-
ing emissions and specifies, among
other things, that
• When approving plants, appropri-
ate sampling points and measuring
stations are to be designated, which
will facilitate representative and
44
2. Reasons for using gas analysis for industrial flue gases
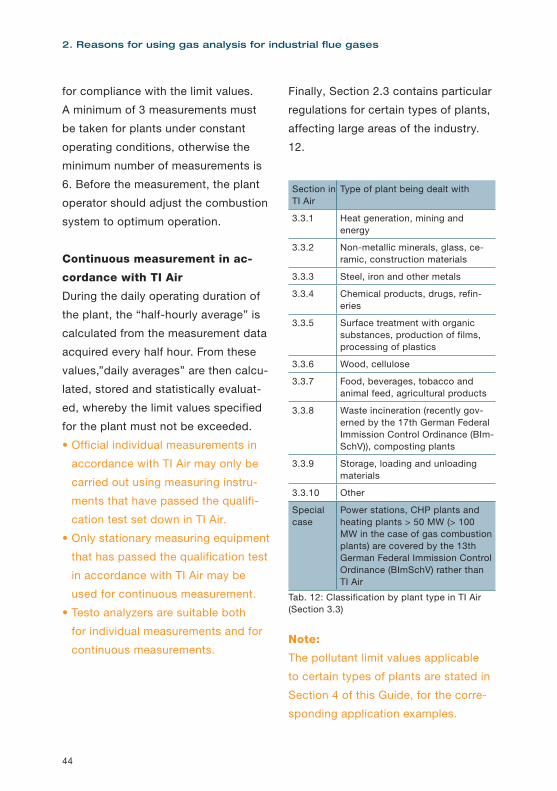
Finally, Section 2.3 contains particular
regulations for certain types of plants,
affecting large areas of the industry.
12.
Tab. 12: Classification by plant type in TI Air (Section 3.3)
Note:
The pollutant limit values applicable
to certain types of plants are stated in
Section 4 of this Guide, for the corre-
sponding application examples.
for compliance with the limit values.
A minimum of 3 measurements must
be taken for plants under constant
operating conditions, otherwise the
minimum number of measurements is
6. Before the measurement, the plant
operator should adjust the combustion
system to optimum operation.
Continuous measurement in ac-
cordance with TI Air
During the daily operating duration of
the plant, the “half-hourly average” is
calculated from the measurement data
acquired every half hour. From these
values,”daily averages” are then calcu-
lated, stored and statistically evaluat-
ed, whereby the limit values specified
for the plant must not be exceeded.
• Official individual measurements in
accordance with TI Air may only be
carried out using measuring instru-
ments that have passed the qualifi-
cation test set down in TI Air.
• Only stationary measuring equipment
that has passed the qualification test
in accordance with TI Air may be
used for continuous measurement.
• Testo analyzers are suitable both
for individual measurements and for
continuous measurements.
Section in TI Air
Type of plant being dealt with
3.3.1 Heat generation, mining and energy
3.3.2 Non-metallic minerals, glass, ce-ramic, construction materials
3.3.3 Steel, iron and other metals
3.3.4 Chemical products, drugs, refin-eries
3.3.5 Surface treatment with organic substances, production of films, processing of plastics
3.3.6 Wood, cellulose
3.3.7 Food, beverages, tobacco and animal feed, agricultural products
3.3.8 Waste incineration (recently gov-erned by the 17th German Federal Immission Control Ordinance (BIm-SchV)), composting plants
3.3.9 Storage, loading and unloading materials
3.3.10 Other
Special case
Power stations, CHP plants and heating plants > 50 MW (> 100 MW in the case of gas combustion plants) are covered by the 13th German Federal Immission Control Ordinance (BImSchV) rather than TI Air
45
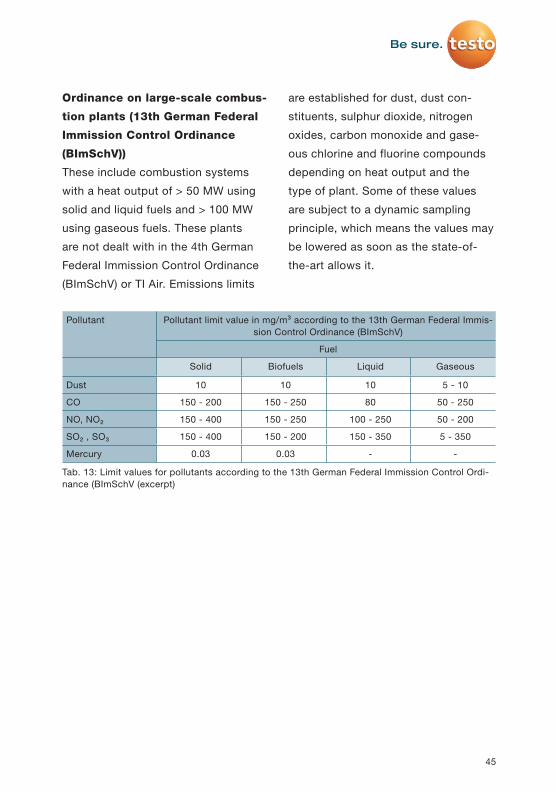
are established for dust, dust con-
stituents, sulphur dioxide, nitrogen
oxides, carbon monoxide and gase-
ous chlorine and fluorine compounds
depending on heat output and the
type of plant. Some of these values
are subject to a dynamic sampling
principle, which means the values may
be lowered as soon as the state-of-
the-art allows it.
Ordinance on large-scale combus-
tion plants (13th German Federal
Immission Control Ordinance
(BImSchV))
These include combustion systems
with a heat output of > 50 MW using
solid and liquid fuels and > 100 MW
using gaseous fuels. These plants
are not dealt with in the 4th German
Federal Immission Control Ordinance
(BImSchV) or TI Air. Emissions limits
Tab. 13: Limit values for pollutants according to the 13th German Federal Immission Control Ordi-nance (BImSchV (excerpt)
Pollutant Pollutant limit value in mg/m³ according to the 13th German Federal Immis-sion Control Ordinance (BImSchV)
Fuel
Solid Biofuels Liquid Gaseous
Dust 10 10 10 5 - 10
CO 150 - 200 150 - 250 80 50 - 250
NO, NO₂ 150 - 400 150 - 250 100 - 250 50 - 200
SO₂ , SO₃ 150 - 400 150 - 200 150 - 350 5 - 350
Mercury 0.03 0.03 - -
46
2. Reasons for using gas analysis for industrial flue gases
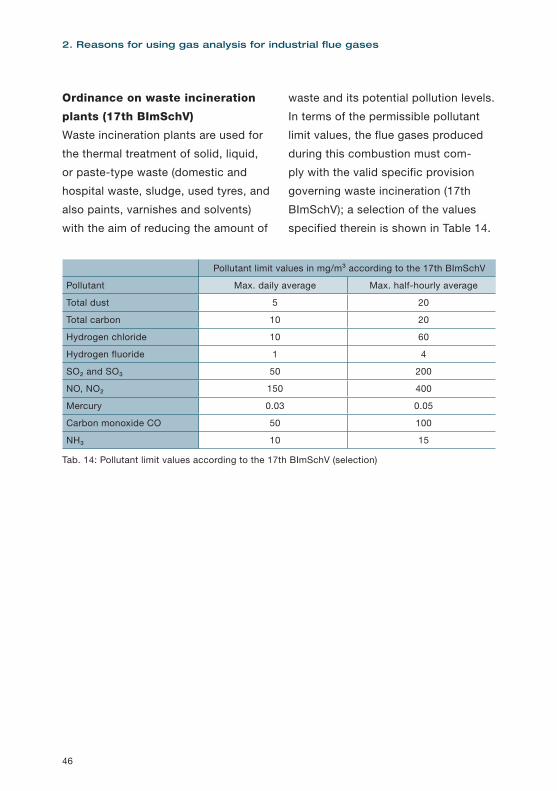
waste and its potential pollution levels.
In terms of the permissible pollutant
limit values, the flue gases produced
during this combustion must com-
ply with the valid specific provision
governing waste incineration (17th
BImSchV); a selection of the values
specified therein is shown in Table 14.
Ordinance on waste incineration
plants (17th BImSchV)
Waste incineration plants are used for
the thermal treatment of solid, liquid,
or paste-type waste (domestic and
hospital waste, sludge, used tyres, and
also paints, varnishes and solvents)
with the aim of reducing the amount of
Tab. 14: Pollutant limit values according to the 17th BImSchV (selection)
Pollutant limit values in mg/m³ according to the 17th BImSchV
Pollutant Max. daily average Max. half-hourly average
Total dust 5 20
Total carbon 10 20
Hydrogen chloride 10 60
Hydrogen fluoride 1 4
SO₂ and SO₃ 50 200
NO, NO₂ 150 400
Mercury 0.03 0.05
Carbon monoxide CO 50 100
NH₃ 10 15
47
Due to high flue gas temperatures,
high humidity and dust contents and
also aggressive flue gas components,
the measuring tasks also place par-
ticular requirements on the sampling
process. Moreover, when carrying out
sampling, it is important to bear in
mind that the sampling is represent-
ative of the plant, which, in the case
of plants with high temporal and/or
spatial variability of the pollutants,
requires grid measurements or distrib-
uted individual measuring points, for
example.
Qualification test for measuring
instruments
Only measuring instruments that
have successfully demonstrated their
qualification for this purpose may be
used to monitor air pollution control
in line with the requirements of the
German Federal Immission Control Act
(BImschG).
According to this principle, sufficient
quality and comparability of measure-
ments must be ensured, as well as
uniform practice for plant monitoring.
The qualification test is conducted
according to prescribed guidelines
(minimum requirements); it is complet-
ed by means of laboratory tests and a
Ordinance on crematoria (27th
German Federal Immission Control
Ordinance (BImSchV))
These define measures to be taken in
terms of monitoring emissions from
crematoria. (Please also refer to Sec-
tion 4.6.1)
Analyzers for monitoring emis-
sions in accordance with the
German Federal Immission Control
Act (BImschG)
The analytical methods used for emis-
sions monitoring in accordance with
the German Federal Immission Control
Act (BImschG) work according to the
same physical or chemical principles
that are used in other areas of gas
analysis. However, the requirements
for the instruments are specified here
and the instruments must prove that
they meet the specifications in a qual-
ification test.
The large number of components in
the flue gas require sufficient selectiv-
ity from the methods and instruments,
as well as low and known degrees of
cross-sensitivity. The measuring meth-
ods must be reliable and reproducible
and allow calibration. High availability
must also be ensured, along with virtu-
ally maintenance-free operation.
48
2. Reasons for using gas analysis for industrial flue gases
2.3.3 Emissions monitoring
in the USA
1. Emissions monitoring in the USA is
based on the Clean Air Act and its
amendments (Clean Air Act Amend-
ments, CAAA) from 1991. CAAA is
a federal law. With reference to this
law, the EPA (Environmental Pro-
tection Agency) passed framework
regulations designed to reduce and
monitor emissions. In particular,
there was a shift from monitoring
very large emitters to smaller sourc-
es (titles 5 and 7, see below).
2. CAAA divides emitters into 7
sections (titles) according to their
size, three of which are particularly
relevant to the use of Testo instru-
ments:
Title 4: Power plants
Title 5: Industrial sources
Title 7: Smaller sources
The assessment of an emitter is
carried out according to various cri-
teria, e.g. the thermal output or its
potential to emit a certain quantity
of specified pollutants, e.g. 100 t
NOX/year. Further subdivisions fo-
cus on the permissible limit values
(parts) and standards/guidelines for
measuring instruments (methods)
for certain types of plant.
field test by a few specially approved
test institutions. Proof of a success-
fully completed qualification test is
supplied in the form of a certificate or
public announcement of the results by
the responsible Ministry in the relevant
Ministerial Gazette.
The testo 350 analyzer has passed the
qualification test for O₂, CO, NO, NO₂
and SO₂ for measuring tasks defined
in the 13th and 17th German Federal
Immission Control Ordinance (BIm-
SchV) and in TI Air.
49
of specific regulations and meas-
urement methods, including those
for the use of mobile devices to
determine NOX.
5. A special procedure has been
established for small emitters in
accordance with title 7. The ap-
proximately 34,000 plants affected
are to be assessed on the basis of
relatively relaxed regulations (com-
pliance assurance monitoring, CAM)
by the authorities of the individual
states, at their discretion, to estab-
lish any need for measures. Meas-
uring methods are neither specified
nor expressly prohibited here! This
paves the way for new processes
and instruments.
6. The EPA does not carry out equip-
ment testing or certification, but it
defines test methods which de-
scribe the application of a particular
instrument technology for specific
measurement tasks. An example
of this is the method for measuring
certain gas components with elec-
trochemical sensors: This method
is generally approved for O₂, for
NOX approval has been granted by
SCAQMD, it is not disqualified from
being used for SO₂ and efforts are
currently under way to approve it
for CO.
3. The shift towards smaller plants
also has consequences for measur-
ing technology. Continuous emis-
sion monitoring systems (CEMs)
are still prescribed for monitoring
large emitters. These entail an initial
investment of several $100,000
with annual maintenance costs of
$30,000 and up. There is no way
that smaller emitters can justify
this expense, and the EPA has now
cleared the way for other, smaller
metrological solutions (see point 7).
4. Within the USA, there is a division of
responsibilities between the federal
authorities and those of the individ-
ual states. Title 4 generally comes
under the jurisdiction of the Federal
Government, while title 7 comes
under the jurisdiction of the States;
in the case of title 5, the States
have jurisdiction, provided that they
demonstrate relevant implemen-
tation activities. To exercise their
responsibility, there are authorities
(Departments of Environmental
Quality, DEQ) in the individual states
that are empowered to introduce the
standard set down by the EPA or
impose more stringent regulations.
The DEQ in California (known as the
South cost air quality management
district, SCAQMD) employs 2,400
people and has introduced a variety
50
2. Reasons for using gas analysis for industrial flue gases
2.3.4 Methods for purifying
flue gas
Air pollutant emissions from flue gas
can be considerably reduced by taking
appropriate measures or installing the
necessary components in the plant:
• The emission of particulate matter
is reduced or virtually eliminated by
using a dust separator.
• The emission of gaseous pollutants
can be reduced to a certain extent
by using low-emission fuels. Howev-
er, crucial reduction is achieved by
optimizing combustion and purify-
ing the flue gas produced through
absorption or adsorption reactions
or via afterburning. In these proce-
dures, gas analysis plays a decisive
role in monitoring and optimizing the
measures taken!
7. The testo 350 complies with test
methods 1 (for gas flow), 3 (for CO₂
and O₂), 6c (for SO₂) and 7e in com-
bination with what is referred to as
the conditional test method 022 (for
NOX).
51
ily used to clean extremely large
volumes of gas in power stations,
ironworks, metallurgical works or
cement works, for example.
In principle, electrostatic precipitators
may explode due to the formation of
an explosive gas mixture within the
electrical field. For effective protection,
the CO concentration upstream of the
filter should be monitored.
• Separation via adhesive forces in
e.g. fabric filters
In this form, the particles are
separated in or on the surface of
certain filter media (membrane,
fabric, grains) which the gas passes
through. The most common are bag
or pocket filters made from fibres.
Depth filters include primarily packed
bed filters, where separation is car-
ried out on the surface of grains, as
a layer that the gas flows through.
• Separation via droplet formation in
e.g. spray scrubbers
Here, the particles are bound to a
scrubbing liquid introduced to the
gas flow and are separated together
with it. The disadvantage of this pro-
cess is the generation of a contami-
nated scrubbing liquid.
Dedusting methods
Plants for dedusting gas flows (dust
separators) work on the basis of a
variety of principles:
• Separation via centrifugal force or
gravity
Here, the particles are channelled via
their gravity or via centrifugal forces
into such separator zones which are
outside the flue gas flow. Particularly
well-known examples of this type
of separation are the separators
based on centrifugal force known
as cyclones, in which the particles
gain a moment of momentum from a
specially designed gas inlet aperture
which transports the particles into a
separating chamber. From there they
are fed to a dust collector.
• Separation via electrical forces in
electrostatic precipitators
Electrostatic precipitators utilize the
force effect on charged particles in
an electric field for dust separation.
The dust particles are first charged
by adding negative ions and are
then, as a result of this charge,
conducted to a collecting electrode
in the electrical field. There the dust
is deposited as a layer; the layer
is loosened (cleaned) by knocking
against the electrode and the dust is
transported into a bunker. Elec-
trostatic precipitators are primar-

52
2. Reasons for using gas analysis for industrial flue gases
flow via appropriate measures, and
this creates a circulating fluidized bed.
The fluidized-bed process offers sig-
nificant advantages: the fuel particles
come into particularly close contact
with the oxygen in the combustion air
and the combustion is therefore near
complete. The combustion tempera-
ture is around 900 °C, which prevents
the formation of thermal nitrogen ox-
ides in nearly all cases; adding lime to
the fuel also enables desulphurization
during combustion.
Staged air supply
Staged air supply is also a very
effective primary measure, since it
suppresses the formation of both fuel
NO and thermal NO. This reduces
the air supply at the burner (primary
air), the air ratio is therefore <1, CO
formation increases, the NOX content
remains low and is further reduced
by the formation of stable N₂ mole-
cules. More combustion air (burnt-out
air) is then added above the burner
in a further stage and ensures that
combustion continues. As a result, the
CO is greatly reduced, but hardly any
NO is formed as the nitrogen is already
present as stable N₂ molecules.
Denitrification methods
Primary and/or secondary measures
are used for denitrifying flue gases
(or to be more exact, the removal of
nitrogen oxides NO and NO₂).
• Primary measures include the staged
air supply method, fluidized-bed
combustion and the use of special
burners. All of these measures will
considerably reduce the formation of
nitrogen oxides during combustion.
• One secondary measure (these
impact on the flue gas after it leaves
the combustion chamber) which
has become widely accepted is the
Selective Catalytic Reduction (SCR)
process. In this process, the flue
gas is enriched with a mixture of
ammonia (NH₃) and air, after which
the nitrogen oxides are converted
into nitrogen and water in a chemical
reaction. The abbreviation DENOX is
also used for these types of plants.
Fluidized-bed combustion
In fluidized-bed combustion systems,
the pulverized fuel is supplied to the
combustion chamber, above a base
that is equipped with nozzles. The
combustion air flows through the
nozzles from underneath, causing the
fuel particles to form a fluidized bed.
The particles not burned or not fully
burned are conducted back into the
combustion chamber from the flue gas
53
Thermal afterburning
Please refer to the application example
4.2.3
Low NOX burners
Similar to the staged air supply in the
combustion chamber, these burn-
ers operate with an air supply that
is distributed over several different
spots within the burner and include
internal air recirculation. This results
in complete combustion with reduced
formation of nitrogen oxides.
Desulphurization process
Among the many methods of flue gas
desulphurization, wet scrubbing with
lime/limestone (secondary measure)
is the most common. In a wash tower,
the flue gas is sprayed with a washing
suspension (finely ground limestone in
water), as a result of which most of the
sulphur dioxide (SO₂) is bonded via a
chemical reaction. The gaseous SO₂
is initially turned into a solution before
it is bonded as calcium sulphate dihy-
drate (gypsum). The gypsum generat-
ed in large quantities is at least partly
reused as a construction material. The
abbreviation FGD (flue gas desulphur-
ization plant) is also used for these
plants.
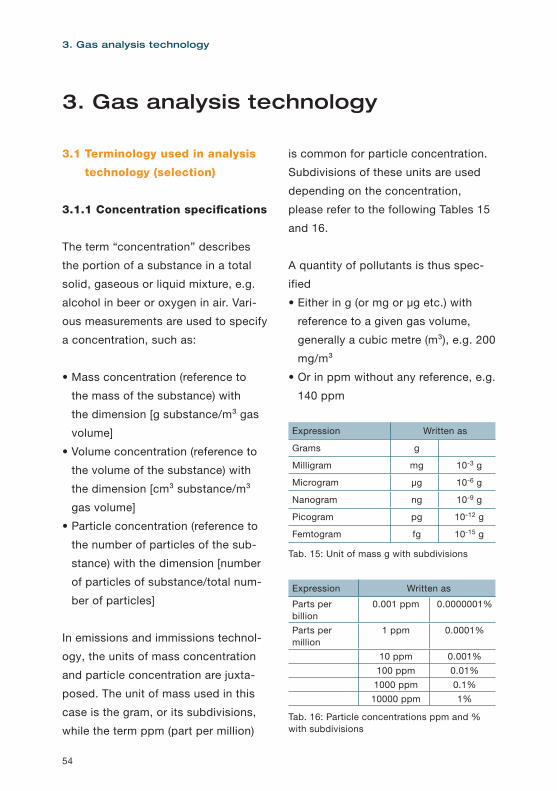
54
3. Gas analysis technology
3.1 Terminology used in analysis
technology (selection)
3.1.1 Concentration specifications
The term “concentration” describes
the portion of a substance in a total
solid, gaseous or liquid mixture, e.g.
alcohol in beer or oxygen in air. Vari-
ous measurements are used to specify
a concentration, such as:
• Mass concentration (reference to
the mass of the substance) with
the dimension [g substance/m³ gas
volume]
• Volume concentration (reference to
the volume of the substance) with
the dimension [cm³ substance/m³
gas volume]
• Particle concentration (reference to
the number of particles of the sub-
stance) with the dimension [number
of particles of substance/total num-
ber of particles]
In emissions and immissions technol-
ogy, the units of mass concentration
and particle concentration are juxta-
posed. The unit of mass used in this
case is the gram, or its subdivisions,
while the term ppm (part per million)
is common for particle concentration.
Subdivisions of these units are used
depending on the concentration,
please refer to the following Tables 15
and 16.
A quantity of pollutants is thus spec-
ified
• Either in g (or mg or μg etc.) with
reference to a given gas volume,
generally a cubic metre (m³), e.g. 200
mg/m³
• Or in ppm without any reference, e.g.
140 ppm
Expression Written as
Grams g
Milligram mg 10-3 g
Microgram μg 10-6 g
Nanogram ng 10-9 g
Picogram pg 10-12 g
Femtogram fg 10-15 g
Tab. 15: Unit of mass g with subdivisions
Expression Written as
Parts per billion
0.001 ppm 0.0000001%
Parts per million
1 ppm 0.0001%
10 ppm 0.001%100 ppm 0.01%
1000 ppm 0.1%10000 ppm 1%
Tab. 16: Particle concentrations ppm and % with subdivisions
3. Gas analysis technology
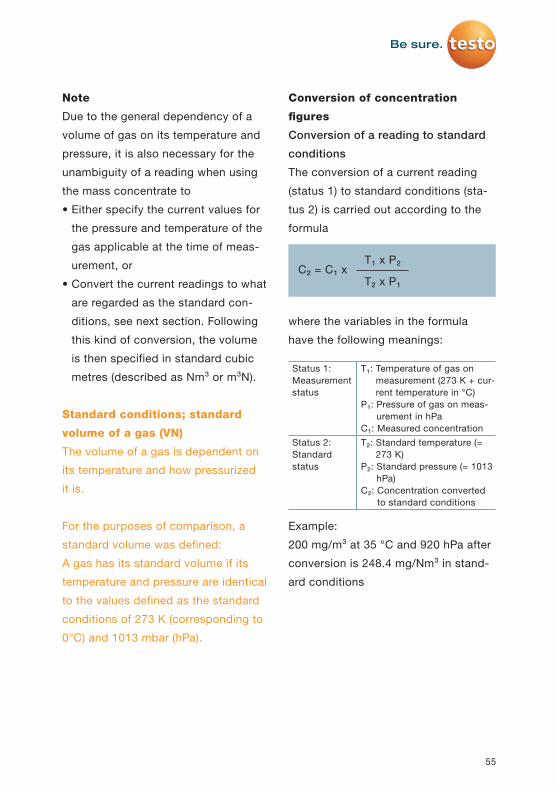
55
Conversion of concentration
figures
Conversion of a reading to standard
conditions
The conversion of a current reading
(status 1) to standard conditions (sta-
tus 2) is carried out according to the
formula
C₂ = C₁ xT₁ x P₂
T₂ x P₁
where the variables in the formula
have the following meanings:
Status 1: Measurement status
T₁: Temperature of gas on measurement (273 K + cur-rent temperature in °C)
P₁: Pressure of gas on meas-urement in hPa
C₁: Measured concentrationStatus 2: Standard status
T₂: Standard temperature (= 273 K)
P₂: Standard pressure (= 1013 hPa)
C₂: Concentration converted to standard conditions
Example:
200 mg/m³ at 35 °C and 920 hPa after
conversion is 248.4 mg/Nm³ in stand-
ard conditions
Note
Due to the general dependency of a
volume of gas on its temperature and
pressure, it is also necessary for the
unambiguity of a reading when using
the mass concentrate to
• Either specify the current values for
the pressure and temperature of the
gas applicable at the time of meas-
urement, or
• Convert the current readings to what
are regarded as the standard con-
ditions, see next section. Following
this kind of conversion, the volume
is then specified in standard cubic
metres (described as Nm³ or m³N).
Standard conditions; standard
volume of a gas (VN)
The volume of a gas is dependent on
its temperature and how pressurized
it is.
For the purposes of comparison, a
standard volume was defined:
A gas has its standard volume if its
temperature and pressure are identical
to the values defined as the standard
conditions of 273 K (corresponding to
0°C) and 1013 mbar (hPa).
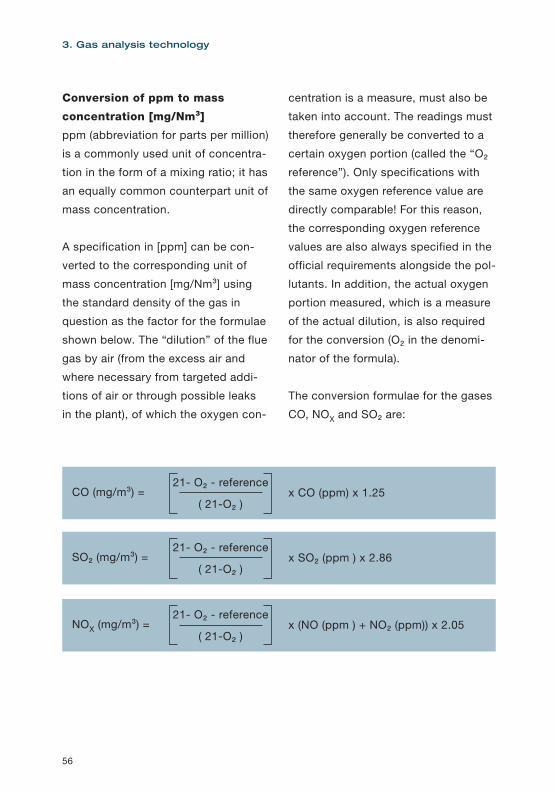
56
3. Gas analysis technology
centration is a measure, must also be
taken into account. The readings must
therefore generally be converted to a
certain oxygen portion (called the “O₂
reference”). Only specifications with
the same oxygen reference value are
directly comparable! For this reason,
the corresponding oxygen reference
values are also always specified in the
official requirements alongside the pol-
lutants. In addition, the actual oxygen
portion measured, which is a measure
of the actual dilution, is also required
for the conversion (O₂ in the denomi-
nator of the formula).
The conversion formulae for the gases
CO, NOX and SO₂ are:
Conversion of ppm to mass
concentration [mg/Nm³]
ppm (abbreviation for parts per million)
is a commonly used unit of concentra-
tion in the form of a mixing ratio; it has
an equally common counterpart unit of
mass concentration.
A specification in [ppm] can be con-
verted to the corresponding unit of
mass concentration [mg/Nm³] using
the standard density of the gas in
question as the factor for the formulae
shown below. The “dilution” of the flue
gas by air (from the excess air and
where necessary from targeted addi-
tions of air or through possible leaks
in the plant), of which the oxygen con-
CO (mg/m³) = x CO (ppm) x 1.2521- O₂ - reference
( 21-O₂ )
SO₂ (mg/m³) = x SO₂ (ppm ) x 2.8621- O₂ - reference
( 21-O₂ )
NOX (mg/m³) = x (NO (ppm ) + NO₂ (ppm)) x 2.0521- O₂ - reference
( 21-O₂ )
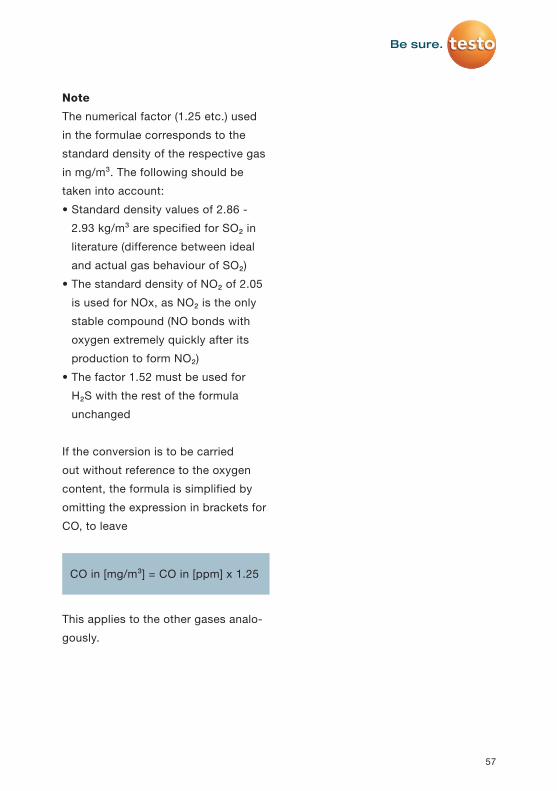
57
Note
The numerical factor (1.25 etc.) used
in the formulae corresponds to the
standard density of the respective gas
in mg/m³. The following should be
taken into account:
• Standard density values of 2.86 -
2.93 kg/m³ are specified for SO₂ in
literature (difference between ideal
and actual gas behaviour of SO₂)
• The standard density of NO₂ of 2.05
is used for NOx, as NO₂ is the only
stable compound (NO bonds with
oxygen extremely quickly after its
production to form NO₂)
• The factor 1.52 must be used for
H₂S with the rest of the formula
unchanged
If the conversion is to be carried
out without reference to the oxygen
content, the formula is simplified by
omitting the expression in brackets for
CO, to leave
CO in [mg/m³] = CO in [ppm] x 1.25
This applies to the other gases analo-
gously.
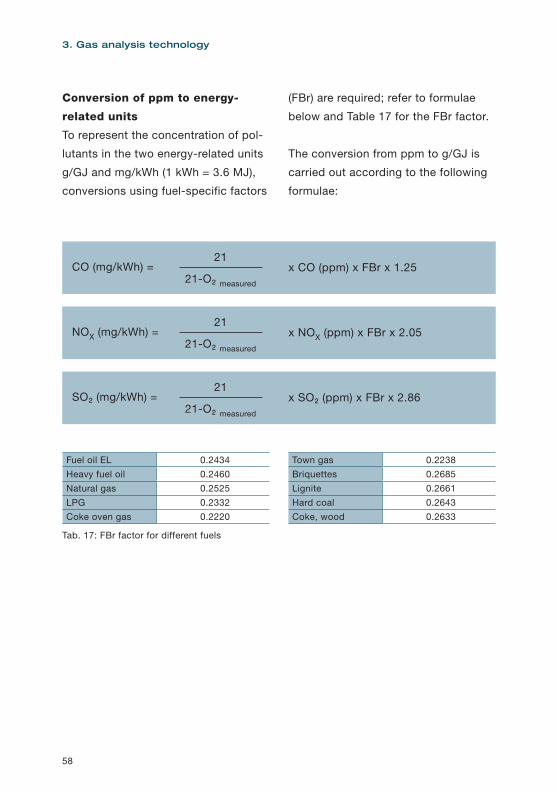
58
3. Gas analysis technology
Conversion of ppm to energy-
related units
To represent the concentration of pol-
lutants in the two energy-related units
g/GJ and mg/kWh (1 kWh = 3.6 MJ),
conversions using fuel-specific factors
CO (mg/kWh) =
NOX (mg/kWh) =
SO₂ (mg/kWh) =
x CO (ppm) x FBr x 1.25
x NOX (ppm) x FBr x 2.05
x SO₂ (ppm) x FBr x 2.86
21
21
21
21-O₂ measured
21-O₂ measured
21-O₂ measured
(FBr) are required; refer to formulae
below and Table 17 for the FBr factor.
The conversion from ppm to g/GJ is
carried out according to the following
formulae:
Tab. 17: FBr factor for different fuels
Fuel oil EL 0.2434Heavy fuel oil 0.2460Natural gas 0.2525LPG 0.2332Coke oven gas 0.2220
Town gas 0.2238Briquettes 0.2685Lignite 0.2661Hard coal 0.2643Coke, wood 0.2633
59
The applicable factor of 3.6 must be
included when converting from ppm to
mg/kWh with the rest of the formulae
remaining unchanged:
CO (mg/kWh) =
NOX (mg/kWh) =
SO₂ (mg/kWh) =
x CO (ppm) x FBr x 3.6 x 1.25
x NOX (ppm) x FBr x 3.6 x 2.05
x SO₂ (ppm) x FBr x 3.6 x 2.86
21
21
21
21-O₂ measured
21-O₂ measured
21-O₂ measured

60
3. Gas analysis technology
The advantages of this measurement
concept are
• Separation and protection of the
sensitive analyzer technology from
the extremely harsh conditions in the
process stream
• Via the conditioning procedure, the
sample gas can be transformed into
a practicable and constant (and
therefore comparable) condition
• More than one analyzer may be op-
erated with one sampling unit or one
analyzer may be connected to sever-
al sampling points (via a changeover
switch).
3.1.2 Sampling, gas conditioning
Extractive sampling
In most gas analysis methods, the
measurement gas is extracted as a
representative portion of the process
gas (hence the term extractive meth-
ods, in contrast to in-situ methods),
conditioned and fed to the analyzer.
Conditioning, also referred to as sam-
ple preparation, is understood to mean
cleaning the gas using a filter and
primarily cooling, and therefore drying,
the gas to a defined constant value.
Sampling probe, heated where nec-essary, with coarse filter
Flue gas or process gas
Condensate drain
Cables, heated where
necessary
Gas cooler with fine filter
Analyzer with input filter
Figure 9: Sample gas extraction and conditioning (schematic)
Gas sampling and conditioning

61
aggressive solutions formed, for
example, through the reaction of SO₂
with water. Measurement gas coolers
are used to remove the majority of
water vapour (humidity) from the
measuring gas by cooling it to a
fixed temperature, e.g. 4°C and to
keep the remaining level of humidity
constant, and therefore comparable,
by maintaining a constant temper-
ature. The resulting condensate is
usually discharged via peristaltic or
diaphragm pumps.
• The measuring gas lines or hoses
are either unheated (in the case of
non-critical gases or extremely high
ambient temperatures) or heated to
keep the gas above the dew point
and thus to prevent the formation of
condensate.
• Depending on the manufacturer, the
analyzer may also have a gas filter
and in some cases a condensate
separator or an internal heater.
Instruments for extracting and condi-
tioning the gas are either designed as
separate units or combined in one or
two compact units. In simple terms,
the functions are as follows:
• Gas sampling is carried out via a
heated or unheated sampling probe
made of different materials and for
different temperature ranges (up
to 1200 °C and above). A coarse
ceramic filter is built into the probe
head, and some probes (e.g. the
Testo multifunction probe) have addi-
tional sensors for determining the
pressure and temperature.
• The measuring gas cooler is located
between the probe and analyzer.
Flue and process gases always carry
a certain amount of water, which
at high temperatures (above the
dew point) exists as water vapour
and at low temperatures (below
the dew point) as water droplets.
In both cases, the measuring result
is distorted by chemical reactions
between other components of the
measuring gas and the water. Fur-
thermore, the measuring equipment
may be attacked and destroyed by
62
3. Gas analysis technology
3.1.3 Cross-sensitivity
The cross-sensitivity of a detection
system is caused by the fact that its
specific resolution is not unlimited.
The detection system is therefore often
sensitive not only to the component
of interest that is being measured,
but also to a certain extent to other
(associated) components present in
the measuring gas. Changes in the
concentrations of these components
will have an effect on the reading of
the component actually being meas-
ured, which must be corrected within
the device or retrospectively. To this
end, the associated components must
also be measured. Cross-sensitivity is
expressed by the effect (increase or
decrease) that an associated compo-
nent of the measurement gas has on
the reading of the component being
analyzed. The extent of cross-sensitiv-
ity depends on the type of detection
system (i.e. it is instrument-specific!)
and on the concentration of the as-
sociated components. Please refer to
Table 18 for the testo 350.
The gas humidity content is an ex-
tremely critical variable when it comes
to gas analysis,
in two respects:
• As vapour, it dilutes the flue gas, and
if the humidity should fluctuate, this
dilution will also fluctuate, as will the
readings.
• As water, it forms compounds with
certain components of the gas,
changing their concentration and
consequently the readings too.
Remedial measures:
• Always measure the humidity level,
which is an important variable, si-
multaneously.
• Bring the humidity to a defined, and
therefore comparable level using a
measuring gas cooler.
• Always prevent the formation of
condensate over components or all
of the measuring equipment by using
a heating system throughout!
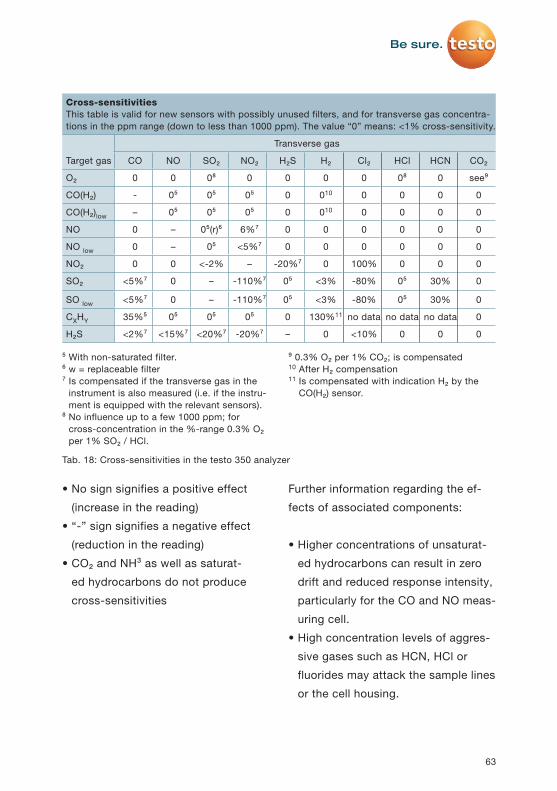
63
Further information regarding the ef-
fects of associated components:
• Higher concentrations of unsaturat-
ed hydrocarbons can result in zero
drift and reduced response intensity,
particularly for the CO and NO meas-
uring cell.
• High concentration levels of aggres-
sive gases such as HCN, HCl or
fluorides may attack the sample lines
or the cell housing.
• No sign signifies a positive effect
(increase in the reading)
• “-” sign signifies a negative effect
(reduction in the reading)
• CO₂ and NH³ as well as saturat-
ed hydrocarbons do not produce
cross-sensitivities
Tab. 18: Cross-sensitivities in the testo 350 analyzer
⁵ With non-saturated filter. ⁶ w = replaceable filter ⁷ Is compensated if the transverse gas in the
instrument is also measured (i.e. if the instru-ment is equipped with the relevant sensors).
⁸ No influence up to a few 1000 ppm; for cross-concentration in the %-range 0.3% O₂ per 1% SO₂ / HCl.
⁹ 0.3% O₂ per 1% CO₂; is compensated 10 After H₂ compensation 11 Is compensated with indication H₂ by the
CO(H₂) sensor.
Cross-sensitivitiesThis table is valid for new sensors with possibly unused filters, and for transverse gas concentra-tions in the ppm range (down to less than 1000 ppm). The value “0” means: <1% cross-sensitivity.
Target gas
Transverse gas
CO NO SO₂ NO₂ H₂S H₂ Cl₂ HCl HCN CO₂
O₂ 0 0 0⁸ 0 0 0 0 0⁸ 0 see⁹
CO(H₂) - 0⁵ 0⁵ 0⁵ 0 010 0 0 0 0
CO(H₂)low – 0⁵ 0⁵ 0⁵ 0 010 0 0 0 0
NO 0 – 0⁵(r)⁶ 6%⁷ 0 0 0 0 0 0
NO low 0 – 0⁵ <5%⁷ 0 0 0 0 0 0
NO₂ 0 0 <-2% – -20%⁷ 0 100% 0 0 0
SO₂ <5%⁷ 0 – -110%⁷ 0⁵ <3% -80% 0⁵ 30% 0
SO low <5%⁷ 0 – -110%⁷ 0⁵ <3% -80% 0⁵ 30% 0
CXHY 35%⁵ 0⁵ 0⁵ 0⁵ 0 130%11 no data no data no data 0
H₂S <2%⁷ <15%⁷ <20%⁷ -20%⁷ – 0 <10% 0 0 0
64
3. Gas analysis technology
as possible. This process involves
making changes to the instrument.
Official Calibration
Official Calibration of a measuring
instrument is very similar to calibra-
tion, but it may only be carried out by
official bodies. Official Calibration is
a legally defined and protected term
for an official quality inspection, with
appropriate labelling.
Test gas
A gas whose composition is known
with a high degree of precision, and
certified. Test gases are used to cali-
brate a gas analyzer.
Zero gas
Test gas is used to adjust the zero
point of a gas analyzer. It must not
contain the component being analyzed
(process gas without the component
being analyzed, or e.g. nitrogen).
Associated gas
Measuring gas without the component
to be analyzed.
3.1.4 Calibration, adjustment
Calibration
As per DIN 1319, Part 1, calibration in
measuring technology is understood to
refer to the process of determining and
recording the existing measurement
deviation on the instrument when it is
ready and operational. In the case of
displaying measuring instruments, the
discrepancy between the display and
the correct value for the parameter,
or the value assumed to be correct, is
determined and recorded using factors
or functions. Unlike adjustment, cali-
bration does not involve making any
changes to the measuring instrument.
Calibration is an essential element
of quality assurance in emissions
monitoring. Reference materials whose
composition is known very precisely
within certain margins are used for
calibration. Calibration gases (also
called test gases) are used for gas
analysis.
Adjustment
In line with DIN 1319, Part 1, adjust-
ment in measuring technology is un-
derstood to refer to the process of ad-
justing a measuring instrument so that
the error of measurement is as small
65
stack, cement kiln, upstream of the
electrostatic precipitator, at a distil-
lation tower, etc.) in extremely harsh
operating conditions in some cases.
From this, the differences to laboratory
analysis, where discrete samples are
taken from a process and examined
centrally in a laboratory under con-
trolled and stable laboratory condi-
tions, are clear.
The measuring results are used
• To control the process by, for
example, measuring additives and
optimizing processes
• For plant safety, by checking for
explosive gas mixtures
• For product quality, by monitoring
processes and product specifica-
tions, and
• For environmental protection, by
monitoring the flue gases for compli-
ance with permissible emission limits
for pollutants.
3.2 Gas analyzers
3.2.1 Terminology and use
Process analysis
Process analysis, as distinct from lab-
oratory analysis, refers to the usually
continuous measuring processes used
to determine the physical or chem-
ical properties and concentrations
of chemical components in process
media on site in a plant.
The most common process analysis
applications are those in plants for the
chemical and petrochemical indus-
tries, power generation, metals and
minerals, foodstuffs and luxury foods,
paper and pulp, non-metallic minerals,
but also in engine construction and re-
search and development, for example.
In the case of gaseous process media
(i.e. combustion gases, process gases,
flue gases, also air), this is referred to
as process gas analysis.
Measuring points with the continuous
sampling and the measuring instru-
ments (gas analyzers) are distributed
throughout the plants (at the boiler,
66
3. Gas analysis technology
Thanks to recent developments, in-
struments that combine mobility with
the suitability for stationary continu-
ous measurements are also available:
One example of this is the testo 350
analyzer, which is easily transportable
yet also suitable and approved for
long-term measurements over several
weeks.
Analyzers
The core element of every analyzer is
made up of substance-specific sen-
sors or sensor systems. Their function
is based on physical or chemical prin-
ciples such as absorption, adsorption,
transmission, ionization, heat effect or
paramagnetic or electrochemical prop-
erties. The sensors react to a change
in the measurement parameter with a
corresponding change in their prop-
erties (e.g. increased light absorption
or reduced conductivity), from which a
measurement signal can be obtained.
In terms of design, a distinction is
made between:
• Mobile, lightweight and portable
analyzers for short-time measure-
ments at a range of different loca-
tions and
• Stationary analyzers, permanently
installed in the plant for continu-
ous long-term measurements over
months and years, and between
• Analyzers that measure directly in
the process stream (“in-situ” instru-
ments) and
• Analyzers to which a sample that is
extracted from the process stream
and prepared is brought for meas-
urement (“extractive” instruments).
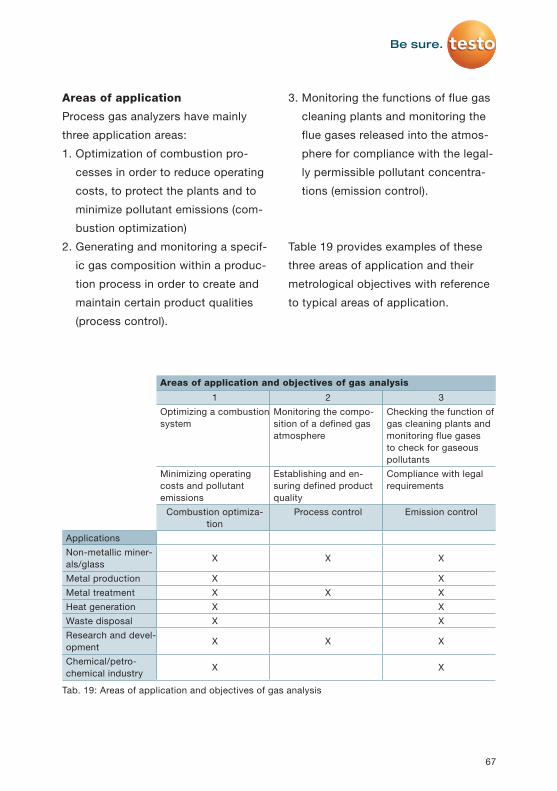
67
3. Monitoring the functions of flue gas
cleaning plants and monitoring the
flue gases released into the atmos-
phere for compliance with the legal-
ly permissible pollutant concentra-
tions (emission control).
Table 19 provides examples of these
three areas of application and their
metrological objectives with reference
to typical areas of application.
Areas of application
Process gas analyzers have mainly
three application areas:
1. Optimization of combustion pro-
cesses in order to reduce operating
costs, to protect the plants and to
minimize pollutant emissions (com-
bustion optimization)
2. Generating and monitoring a specif-
ic gas composition within a produc-
tion process in order to create and
maintain certain product qualities
(process control).
Tab. 19: Areas of application and objectives of gas analysis
Areas of application and objectives of gas analysis
1 2 3Optimizing a combustion system
Monitoring the compo-sition of a defined gas atmosphere
Checking the function of gas cleaning plants and monitoring flue gases to check for gaseous pollutants
Minimizing operating costs and pollutant emissions
Establishing and en-suring defined product quality
Compliance with legal requirements
Combustion optimiza-tion
Process control Emission control
ApplicationsNon-metallic miner-als/glass
X X X
Metal production X XMetal treatment X X XHeat generation X XWaste disposal X XResearch and devel-opment
X X X
Chemical/petro-chemical industry
X X
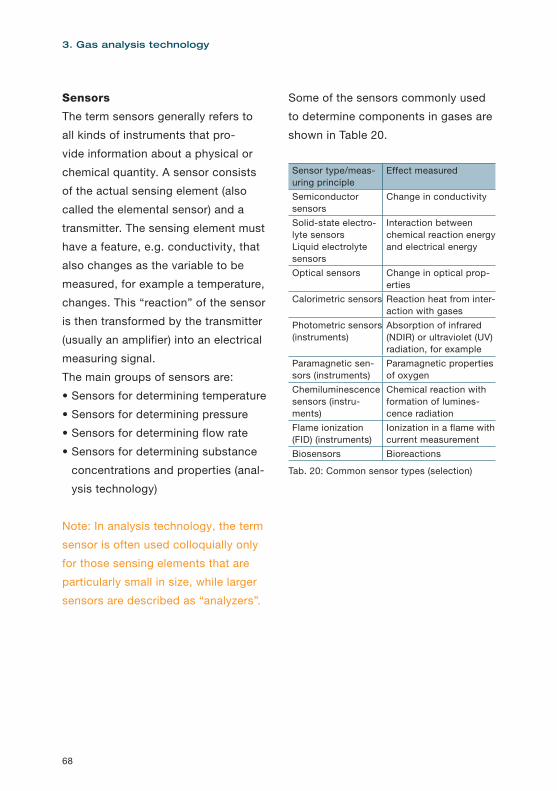
68
3. Gas analysis technology
Some of the sensors commonly used
to determine components in gases are
shown in Table 20.
Sensor type/meas-uring principle
Effect measured
Semiconductor sensors
Change in conductivity
Solid-state electro-lyte sensors Liquid electrolyte sensors
Interaction between chemical reaction energy and electrical energy
Optical sensors Change in optical prop-erties
Calorimetric sensors Reaction heat from inter-action with gases
Photometric sensors (instruments)
Absorption of infrared (NDIR) or ultraviolet (UV) radiation, for example
Paramagnetic sen-sors (instruments)
Paramagnetic properties of oxygen
Chemiluminescence sensors (instru-ments)
Chemical reaction with formation of lumines-cence radiation
Flame ionization (FID) (instruments)
Ionization in a flame with current measurement
Biosensors Bioreactions
Tab. 20: Common sensor types (selection)
Sensors
The term sensors generally refers to
all kinds of instruments that pro-
vide information about a physical or
chemical quantity. A sensor consists
of the actual sensing element (also
called the elemental sensor) and a
transmitter. The sensing element must
have a feature, e.g. conductivity, that
also changes as the variable to be
measured, for example a temperature,
changes. This “reaction” of the sensor
is then transformed by the transmitter
(usually an amplifier) into an electrical
measuring signal.
The main groups of sensors are:
• Sensors for determining temperature
• Sensors for determining pressure
• Sensors for determining flow rate
• Sensors for determining substance
concentrations and properties (anal-
ysis technology)
Note: In analysis technology, the term
sensor is often used colloquially only
for those sensing elements that are
particularly small in size, while larger
sensors are described as “analyzers”.
69
The testo 350 is a portable extractive
measuring instrument which, due to
its specific features (measuring gas
cooler, automatic calibration, etc.), can
also be used for stationary installa-
tions over a certain period of time.
With this, it therefore opens up a new
area of application and offers the user
an extremely cost-effective solution for
lots of tasks. Ideally, electrochemical
gas sensors, which are well suited
to portable devices in terms of their
weight, space requirement and power
consumption, are used. However, its
functional principle requires a con-
siderable level of expertise in order to
ensure the requisite accuracy, reli-
ability, operating life and operability
when designing the appropriate sensor
environment.
Portable devices
The demands placed on portable ana-
lyzers in the process industry present
a particular challenge for the instru-
ment manufacturer. The usually ex-
tremely harsh measuring environment
and the level of measuring accuracy
and reliability required, set against the
instrument’s small dimensions and
low weight, create a profile of require-
ments that was impossible to fulfil
only a few years ago. The design of
the testo 350 and predecessor models
have set new standards in this regard,
which have been impressively proven
by the fact that these instruments have
been granted official approvals.
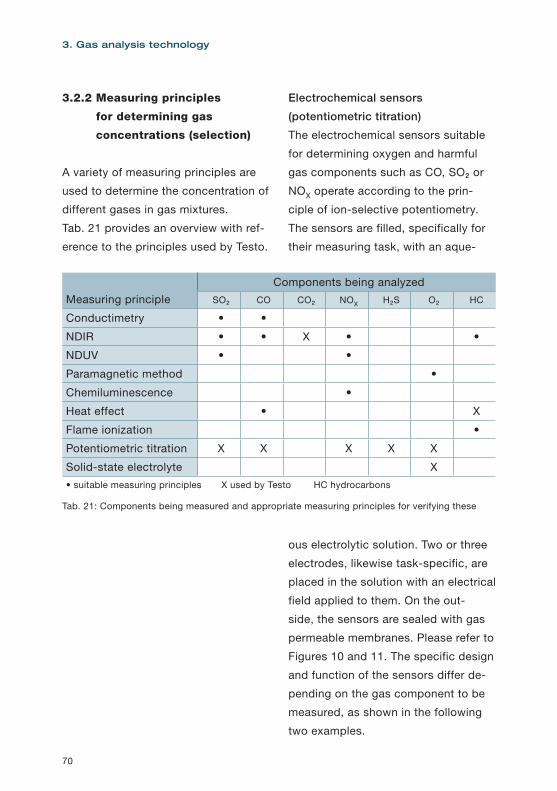
70
3. Gas analysis technology
Electrochemical sensors
(potentiometric titration)
The electrochemical sensors suitable
for determining oxygen and harmful
gas components such as CO, SO₂ or
NOX operate according to the prin-
ciple of ion-selective potentiometry.
The sensors are filled, specifically for
their measuring task, with an aque-
ous electrolytic solution. Two or three
electrodes, likewise task-specific, are
placed in the solution with an electrical
field applied to them. On the out-
side, the sensors are sealed with gas
permeable membranes. Please refer to
Figures 10 and 11. The specific design
and function of the sensors differ de-
pending on the gas component to be
measured, as shown in the following
two examples.
3.2.2 Measuring principles
for determining gas
concentrations (selection)
A variety of measuring principles are
used to determine the concentration of
different gases in gas mixtures.
Tab. 21 provides an overview with ref-
erence to the principles used by Testo.
Measuring principleComponents being analyzed
SO₂ CO CO₂ NOX H₂S O₂ HC
Conductimetry • •
NDIR • • X • •
NDUV • •
Paramagnetic method •
Chemiluminescence •
Heat effect • X
Flame ionization •
Potentiometric titration X X X X X
Solid-state electrolyte X • suitable measuring principles X used by Testo HC hydrocarbons
Tab. 21: Components being measured and appropriate measuring principles for verifying these
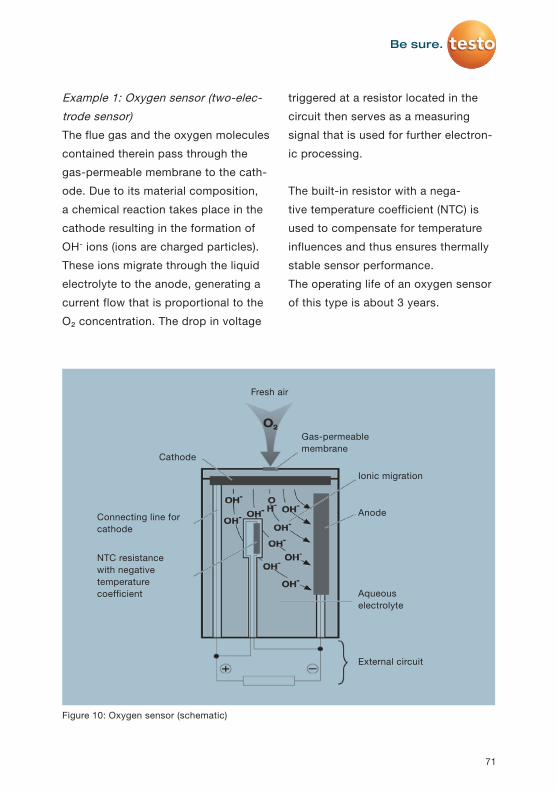
71
Example 1: Oxygen sensor (two-elec-
trode sensor)
The flue gas and the oxygen molecules
contained therein pass through the
gas-permeable membrane to the cath-
ode. Due to its material composition,
a chemical reaction takes place in the
cathode resulting in the formation of
OH- ions (ions are charged particles).
These ions migrate through the liquid
electrolyte to the anode, generating a
current flow that is proportional to the
O₂ concentration. The drop in voltage
triggered at a resistor located in the
circuit then serves as a measuring
signal that is used for further electron-
ic processing.
The built-in resistor with a nega-
tive temperature coefficient (NTC) is
used to compensate for temperature
influences and thus ensures thermally
stable sensor performance.
The operating life of an oxygen sensor
of this type is about 3 years.
Ionic migration
Gas-permeable membrane
Fresh air
Anode
Aqueous electrolyte
External circuit
NTC resistance with negative temperature coefficient
Connecting line for cathode
Cathode
Figure 10: Oxygen sensor (schematic)

72
3. Gas analysis technology
The carbon monoxide (CO) molecules
pass through the gas-permeable
membrane to the sensing electrode,
where H⁺ ions are formed as a result
of a chemical reaction. In the electri-
cal field, these migrate to the coun-
ter-electrode, where a current flow is
generated in the external circuit by
means of a further chemical reaction
triggered by the oxygen (O₂) from the
fresh air that is also supplied. The
third electrode (reference electrode) is
used to stabilize the sensor signal. The
operating life of this type of sensor is
about 2 years.
Chemical equations of the oxygen
sensor:
At the cathode:
O₂ + 2H₂O + 4e- 4OH-
At the anode:
2Pb + 4OH- 2PbO + 2H₂O + 4e-
Overall:
2Pb + O₂ 2PbO
Example 2: Sensors for CO, SO₂ and
NOX (three-electrode sensor)
Sensors with three electrodes are used
to determine gas components such as
CO, SO₂ or NOX. The function is ex-
plained using a CO sensor; transfer to
the other components is evident from
the chemical equations.
Flue gas
Fresh air
Sensing electrode
Reference elec-trode
Counter-electrode
External circuit
Gas-permeable membrane
Gas-permeable membrane
Sensor currentAqueous electrolyte
Figure 11: Sensor for CO and other gases (schematic)
73
In the non-dispersive methods (NDIR
method), the previous spectral disper-
sion is dispensed with. After modula-
tion, such as by a rotating diaphragm
wheel, broadband radiation passes
through the measuring chamber. There
are then two methods for detecting the
level of absorption:
• A detector filled with the component
to be analyzed measures the residual
radiation remaining after passing
through the measuring chamber,
where necessary in comparison with
unattenuated radiation. The resulting
pressure fluctuations (caused by
variable heating of the volume of gas
due to absorption) are detected via a
membrane capacitor or a microflow
sensor and converted into an electri-
cal signal.
• Alternatively, however, the radia-
tion passes through the absorption
section and is subsequently restrict-
ed by an interference filter to the
wavelength range required for CO₂,
for example, and detected with an IR
radiation detector. As the gas con-
centration increases, more radiation
is absorbed and the detector signal
is reduced accordingly.
Chemical equations for CO
Anode:
CO + H₂O CO₂ + 2H⁺ + 2e-
Cathode:
1/2O₂ + 2H⁺ + 2e- H₂O
Further chemical equations
SO₂ + 2H₂O H₂SO₄ + 2H⁺ + 2e-
NO + 2H₂O HNO₃ + 3H⁺ + 3e-
NO₂ + 2H⁺ + 2e- NO + H₂O
Infrared absorption (IR method)
Infrared radiation is absorbed by
gases such as CO, CO₂, SO₂ or NO at
a wavelength that is typical for each
component (wavelength range several
µm). The weakening of a particular
infrared radiation range as a volume
of gas passes through is therefore a
measure of the concentrations of the
gas component in the measuring gas
that has passed through. There are
two methods for selecting only one
component:
In the dispersive method, the radiation
is spectrally dispersed by prisms or
gratings before passing through the
volume of gas, and then only radiation
with the wavelength that is typical of
the component in question to be ana-
lyzed is conducted through the volume
of gas (measuring chamber). This
principle is mainly used in laboratory
equipment.
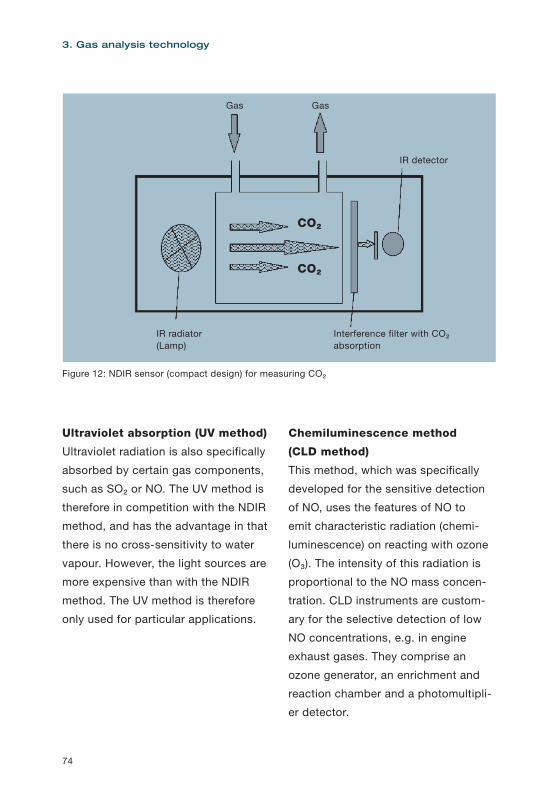
74
3. Gas analysis technology
Chemiluminescence method
(CLD method)
This method, which was specifically
developed for the sensitive detection
of NO, uses the features of NO to
emit characteristic radiation (chemi-
luminescence) on reacting with ozone
(O₃). The intensity of this radiation is
proportional to the NO mass concen-
tration. CLD instruments are custom-
ary for the selective detection of low
NO concentrations, e.g. in engine
exhaust gases. They comprise an
ozone generator, an enrichment and
reaction chamber and a photomultipli-
er detector.
Ultraviolet absorption (UV method)
Ultraviolet radiation is also specifically
absorbed by certain gas components,
such as SO₂ or NO. The UV method is
therefore in competition with the NDIR
method, and has the advantage in that
there is no cross-sensitivity to water
vapour. However, the light sources are
more expensive than with the NDIR
method. The UV method is therefore
only used for particular applications.
IR detector
Interference filter with CO₂ absorption
IR radiator (Lamp)
Gas Gas
Figure 12: NDIR sensor (compact design) for measuring CO₂
CO₂
CO₂
75
Thermal conductivity
Thermal conductivity analyzers (stand-
ard thermal conductivity detectors)
use the different thermal conductivity
values of measurement and reference
gas. A filament measuring bridge is
flushed in sections, both by the meas-
urement gas and also by a reference
gas with a thermal conductivity that is
appropriate to the measuring task. The
different cooling of the filaments re-
sults in a detuning of the bridge, which
is used as the effect measured.
Heat effect
This measuring principle is based on
the combustion heat of the combus-
tibles in the measurement gas. These
are catalytically converted on an elec-
trically preheated body (wire or bead)
and as they burn they increase the
temperature of the body, altering its
electrical resistance. This measuring
principle will only work if there is suffi-
cient oxygen available in the measure-
ment gas for the combustion.
The change in resistance is a measure
of the content of (all!) combustibles in
the measurement gas. These are main-
ly hydrocarbons (abbreviated HC, also
referred to as CXHY), but also CO or
H₂. Cross-sensitivities therefore exist
Paramagnetic method
Oxygen is the only gas that is strongly
paramagnetic, i.e. oxygen molecules
are highly attracted by a magnetic
field. This effect is used to determine
the oxygen concentration. Modern
instruments are available primarily in
two different designs:
In the case of dumbbell type analyz-
ers, a dumbbell with two nitrogen-filled
glass spheres is mounted on a rotating
suspension in the measuring chamber,
which in turn is placed in an inhomo-
geneous magnetic field. When oxygen
is present in the measurement gas, the
O₂ molecules are drawn into the mag-
netic field, which causes a force to act
on the dumbbell. This force is com-
pensated by a spring acting against it,
which results in a usable measurement
parameter.
Differential pressure analyzers use the
effect whereby a pressure difference
is generated between two gases with
different magnetic characteristics
when the interface of both gases is
exposed to a magnetic field. This
feature is used for determining oxygen
in a measurement gas in interaction
with an oxygen-free reference gas,
e.g. nitrogen. The resulting pressure
difference generates a gas flow, which
is detected by a flow sensor and con-
verted into a measuring signal.
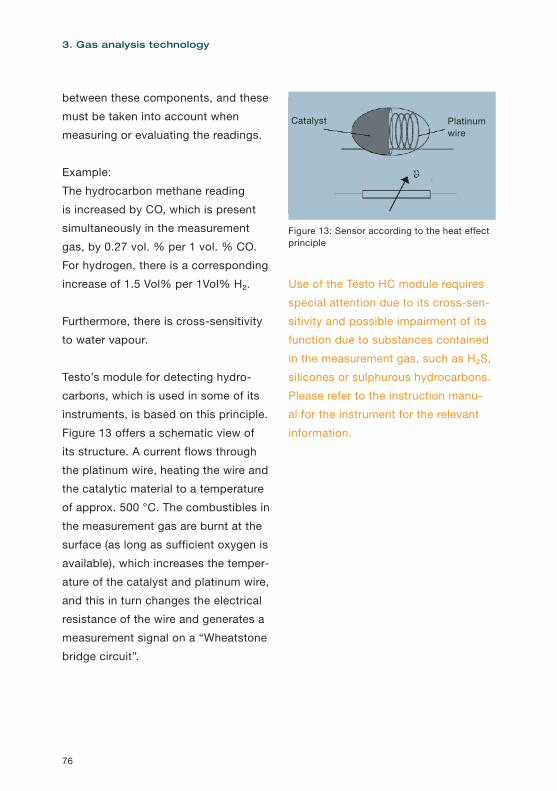
76
3. Gas analysis technology
Use of the Testo HC module requires
special attention due to its cross-sen-
sitivity and possible impairment of its
function due to substances contained
in the measurement gas, such as H₂S,
silicones or sulphurous hydrocarbons.
Please refer to the instruction manu-
al for the instrument for the relevant
information.
between these components, and these
must be taken into account when
measuring or evaluating the readings.
Example:
The hydrocarbon methane reading
is increased by CO, which is present
simultaneously in the measurement
gas, by 0.27 vol. % per 1 vol. % CO.
For hydrogen, there is a corresponding
increase of 1.5 Vol% per 1Vol% H₂.
Furthermore, there is cross-sensitivity
to water vapour.
Testo’s module for detecting hydro-
carbons, which is used in some of its
instruments, is based on this principle.
Figure 13 offers a schematic view of
its structure. A current flows through
the platinum wire, heating the wire and
the catalytic material to a temperature
of approx. 500 °C. The combustibles in
the measurement gas are burnt at the
surface (as long as sufficient oxygen is
available), which increases the temper-
ature of the catalyst and platinum wire,
and this in turn changes the electrical
resistance of the wire and generates a
measurement signal on a “Wheatstone
bridge circuit”.
Platinum wire
Catalyst
Figure 13: Sensor according to the heat effect principle
77
current through the electrolyte. If the
oxygen concentration is the same on
both sides, the effects are eliminat-
ed, and at different concentrations a
usable electrical signal is generated. If
there is a reference gas with a known
O₂ concentration on one side, the O₂
content in the measuring gas can be
determined from this signal.
Instruments operating according to
this principle are known as “zirconium
oxide probes” or “oxygen probes”.
They are generally installed directly in
the hot flue gas (in-situ principle) and
therefore measure the gas in its orig-
inal state, i.e. including its humidity!
However, since humidity has a diluting
effect on the other gas components,
the O₂ readings of these probes are
generally lower than O₂ readings
which, using any method whatsoever,
are measured on the same flue gas but
at lower gas temperatures, i.e. drier
flue gas.
Flame ionization detector (FID)
The organic carbon compounds
contained in the measurement gas are
introduced into a flame (usually hydro-
gen/helium), where they are burned
and ionized. The ions generated are
measured as an ion stream, which as
a first approximation is proportional to
the organic carbon atoms involved in
the process. The varying degrees of
sensitivity of the process to different
organic compounds is taken into ac-
count by applying response factors.
Solid-state electrolyte sensor
A unique but very common oxygen
measuring principle in rough operating
conditions uses a solid-state electro-
lyte made of doped zirconium dioxide
ceramics, on whose opposing sur-
faces electron-conductive layers are
deposited as electrodes. As a specific
property, this solid electrolyte contains
oxygen vacancies in its crystal lattice
that facilitate conductivity for oxygen
ions at high temperatures. The oxygen
(O₂) molecules in the process gas to
be measured are converted to oxygen
ions on contact with the electrode ma-
terial; at a sufficiently high electrolyte
temperature (>500°C), these trigger a
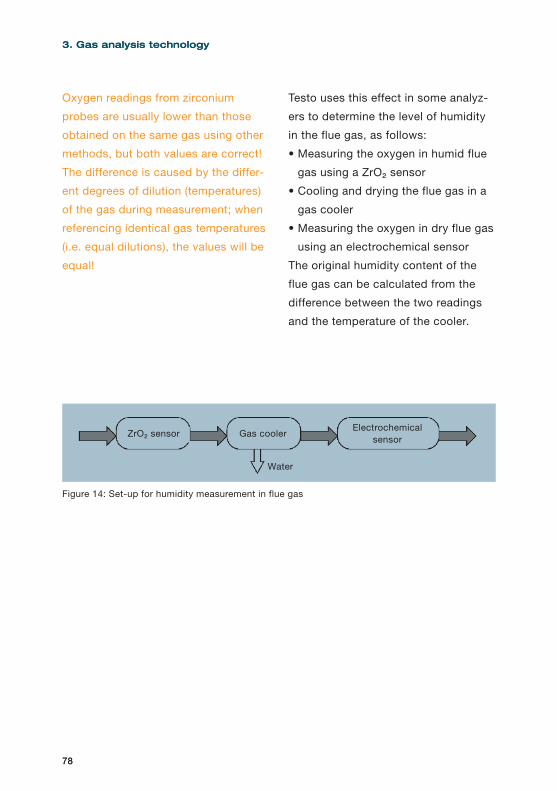
78
3. Gas analysis technology
Testo uses this effect in some analyz-
ers to determine the level of humidity
in the flue gas, as follows:
• Measuring the oxygen in humid flue
gas using a ZrO₂ sensor
• Cooling and drying the flue gas in a
gas cooler
• Measuring the oxygen in dry flue gas
using an electrochemical sensor
The original humidity content of the
flue gas can be calculated from the
difference between the two readings
and the temperature of the cooler.
Oxygen readings from zirconium
probes are usually lower than those
obtained on the same gas using other
methods, but both values are correct!
The difference is caused by the differ-
ent degrees of dilution (temperatures)
of the gas during measurement; when
referencing identical gas temperatures
(i.e. equal dilutions), the values will be
equal!
78
3. Gas analysis technology
ZrO₂ sensor Gas cooler
Water
Electrochemical sensor
Figure 14: Set-up for humidity measurement in flue gas
• Furthermore, components being
analyzed with typical concentration
ranges are listed, along with certain
limit values according to the reg-
ulations valid in Germany. These
examples, too, are only intended as
a guide; they are based on practical
experience of using Testo gas ana-
lyzers, although it is often the case
that not all possible components
have been measured. As a result,
the reading and measuring range
information is incomplete in some
illustrations, and in a few cases this
was completely dispensed with.
• In practical applications, the actual
situation should always be referred
to.
Preliminary comment
• The gas analysis applications
described below should be con-
sidered as examples. The objective
is to demonstrate in concise form
the many different processes and
methods and the associated gas
analysis application options (mo-
tives, benefits). The respective plants
and methods can only be displayed
schematically and mentioned briefly.
In reality, deviations from these can
be assumed in all cases, in view of
the variety of different processes, the
plant constructors, the local condi-
tions and the specific concepts of
the operating company. The same
applies to the indicated measuring
point positions.
4. Application examples
79

4.1 Power generation
4.1.1 Solid-fuel firing systems
Solid-fuel firing systems are facilities
for generating heat by burning solid
fuels such as hard coal, lignite, wood,
etc. Usually the fuels are broken down
substantially, coal is even ground
into pulverized coal and fed into the
combustion chamber, where it is
burnt either in a fixed bed, a fluidized
bed or an entrained dust cloud. The
combustion air is supplied by powerful
fans, sometimes already mixed with
pulverized coal. In terms of pollutant
concentration, the flue gases must
comply with the regulations of TI Air,
and plants with a thermal output of
more than 50 MW must comply with
the regulations of the 13th German
Federal Immission Control Ordinance
(BImSchV).
Use of gas analysis, e.g. for
• Optimum adjustment of the plant
• Drawing up the energy balance
• Monitoring compliance with limit
values in the flue gas
80
4. Application examples
Solid fuel supply
Incinerator
Gas/air mixture
MP 1
MP 2
Scrubber
Combustion residue
Stack
Figure 15: Process flow chart for a solid fuel combustion system with measuring points
Process flow chart and measuring points
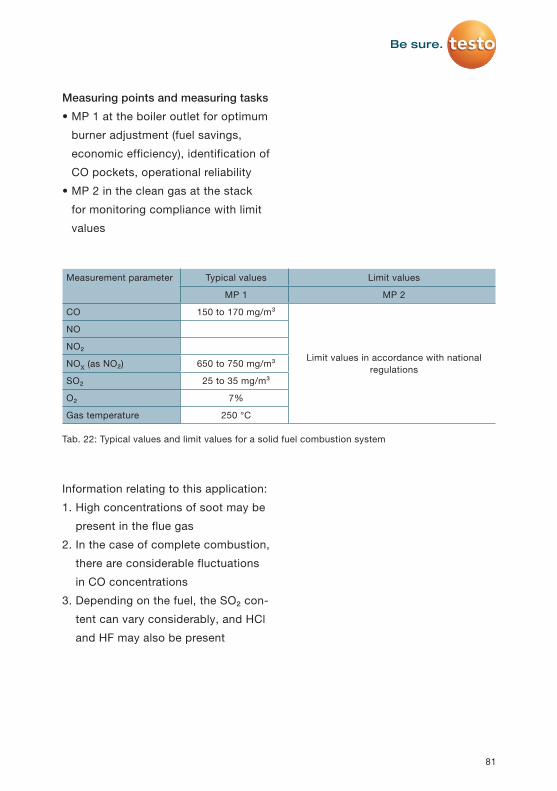
Measuring points and measuring tasks
• MP 1 at the boiler outlet for optimum
burner adjustment (fuel savings,
economic efficiency), identification of
CO pockets, operational reliability
• MP 2 in the clean gas at the stack
for monitoring compliance with limit
values
Information relating to this application:
1. High concentrations of soot may be
present in the flue gas
2. In the case of complete combustion,
there are considerable fluctuations
in CO concentrations
3. Depending on the fuel, the SO₂ con-
tent can vary considerably, and HCl
and HF may also be present
81
Measurement parameter Typical values Limit values
MP 1 MP 2
CO 150 to 170 mg/m³
Limit values in accordance with national regulations
NO
NO₂
NOX (as NO₂) 650 to 750 mg/m³
SO₂ 25 to 35 mg/m³
O₂ 7%
Gas temperature 250 °C
Tab. 22: Typical values and limit values for a solid fuel combustion system

4.1.2 Gas-fired installations
Gas-fired installations are facilities for
generating heat by burning gaseous
fuels such as natural gas, industrial
gas, blast furnace gas, etc. They facil-
itate combustion that is largely free of
pollutants and residues. In small-scale
plants, the fuel and air is supplied by
gas blowers, and in larger plants by
high-pressure burners. In terms of their
pollutant concentration, the flue gases
must comply with the regulations of
TI Air, and where applicable to those
of the 13th German Federal Immission
Control Ordinance (BImSchV).
Use of gas analysis, e.g. for
• Optimum adjustment of the plant
• Drawing up the energy balance
• Monitoring compliance with limit
values in the flue gas
82
4. Application examples
Pump
Gas
Air
Burner
BoilerTurbine/generator
Scrubber Stack
MP 2MP 1
Figure 16: Process flow chart for a gas combustion system with measuring points
Process flow chart and measuring points
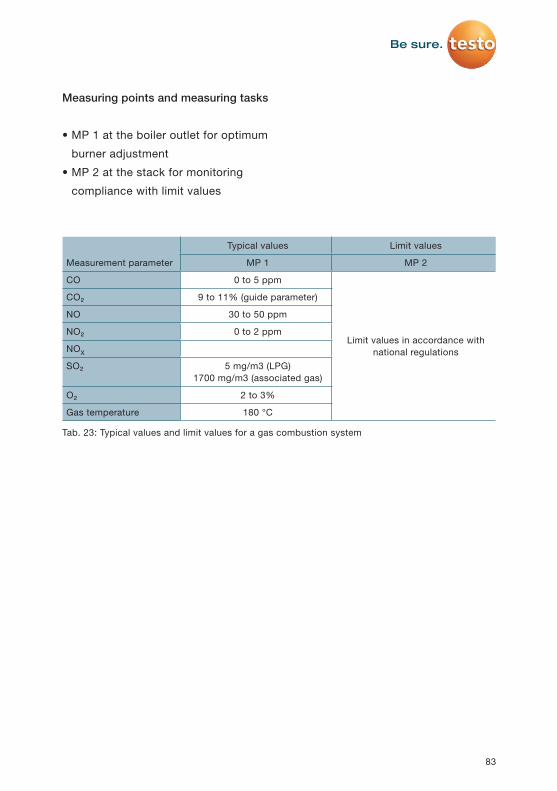
Measuring points and measuring tasks
• MP 1 at the boiler outlet for optimum
burner adjustment
• MP 2 at the stack for monitoring
compliance with limit values
83
Tab. 23: Typical values and limit values for a gas combustion system
Measurement parameter
Typical values Limit values
MP 1 MP 2
CO 0 to 5 ppm
Limit values in accordance with national regulations
CO₂ 9 to 11% (guide parameter)
NO 30 to 50 ppm
NO₂ 0 to 2 ppm
NOX
SO₂ 5 mg/m3 (LPG)1700 mg/m3 (associated gas)
O₂ 2 to 3%
Gas temperature 180 °C
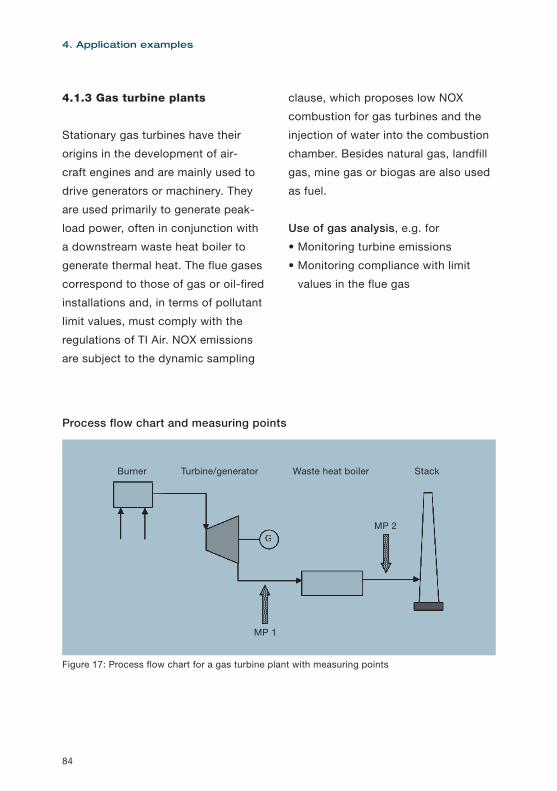
4.1.3 Gas turbine plants
Stationary gas turbines have their
origins in the development of air-
craft engines and are mainly used to
drive generators or machinery. They
are used primarily to generate peak-
load power, often in conjunction with
a downstream waste heat boiler to
generate thermal heat. The flue gases
correspond to those of gas or oil-fired
installations and, in terms of pollutant
limit values, must comply with the
regulations of TI Air. NOX emissions
are subject to the dynamic sampling
clause, which proposes low NOX
combustion for gas turbines and the
injection of water into the combustion
chamber. Besides natural gas, landfill
gas, mine gas or biogas are also used
as fuel.
Use of gas analysis, e.g. for
• Monitoring turbine emissions
• Monitoring compliance with limit
values in the flue gas
84
4. Application examples
MP 1
MP 2
Burner Turbine/generator Waste heat boiler Stack
Figure 17: Process flow chart for a gas turbine plant with measuring points
Process flow chart and measuring points
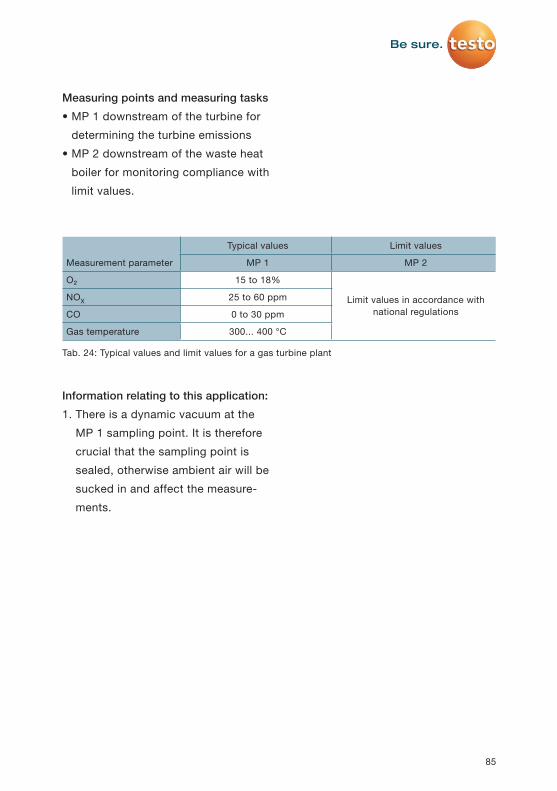
Measuring points and measuring tasks
• MP 1 downstream of the turbine for
determining the turbine emissions
• MP 2 downstream of the waste heat
boiler for monitoring compliance with
limit values.
Information relating to this application:
1. There is a dynamic vacuum at the
MP 1 sampling point. It is therefore
crucial that the sampling point is
sealed, otherwise ambient air will be
sucked in and affect the measure-
ments.
85
Tab. 24: Typical values and limit values for a gas turbine plant
Measurement parameter
Typical values Limit values
MP 1 MP 2
O₂ 15 to 18%
Limit values in accordance with national regulations
NOX 25 to 60 ppm
CO 0 to 30 ppm
Gas temperature 300... 400 °C
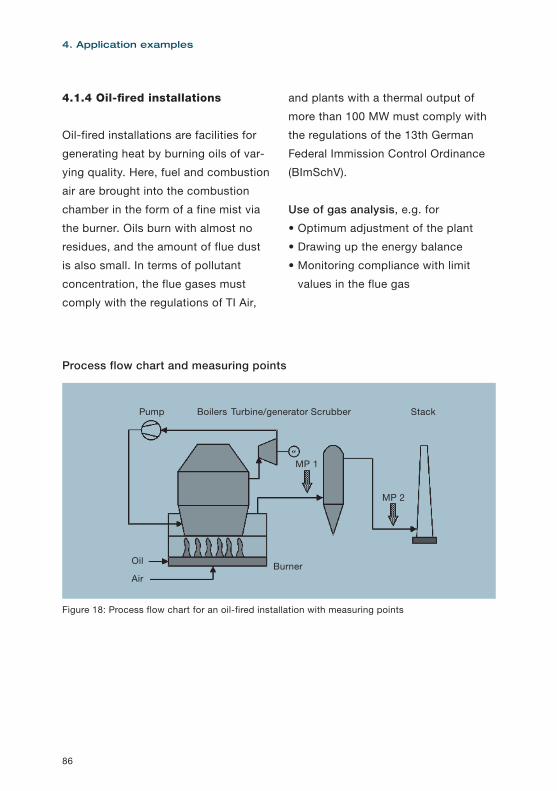
4.1.4 Oil-fired installations
Oil-fired installations are facilities for
generating heat by burning oils of var-
ying quality. Here, fuel and combustion
air are brought into the combustion
chamber in the form of a fine mist via
the burner. Oils burn with almost no
residues, and the amount of flue dust
is also small. In terms of pollutant
concentration, the flue gases must
comply with the regulations of TI Air,
and plants with a thermal output of
more than 100 MW must comply with
the regulations of the 13th German
Federal Immission Control Ordinance
(BImSchV).
Use of gas analysis, e.g. for
• Optimum adjustment of the plant
• Drawing up the energy balance
• Monitoring compliance with limit
values in the flue gas
86
4. Application examples
Pump
Oil
AirBurner
Boilers Turbine/generator Scrubber
MP 1
MP 2
Stack
Figure 18: Process flow chart for an oil-fired installation with measuring points
Process flow chart and measuring points

Measuring points and measuring tasks
• MP 1 at the boiler outlet for optimum
burner adjustment (fuel savings, eco-
nomic efficiency), plant balance
• MP 2 in the clean gas at the stack
for monitoring compliance with limit
values
87
Tab. 25: Typical values and limit values for an oil-fired installation
Measurement parameter
Typical values Limit values
MP 1 MP 2
O₂ 2.5 to 3.5%
Limit values in accordance with national regulations
CO 0 to 5 ppm
CO₂ 13 to 15%
NO 50 to 150 ppm
NO₂ 0 to 5 ppm
NOX (as NO₂)
SO₂ 50 to 100 ppm
Gas temperature 200 °C

In Germany, in terms of their per-
missible concentration of pollutants,
the flue gases from coal-fired power
plants must comply with the regula-
tions of TI Air or, as in most instances,
plants with a thermal output of >50
MW must comply with the regulations
of the 13th German Federal Immission
Control Ordinance (BImSchV).
Use of gas analysis, e.g. for
• Optimum adjustment of the com-
bustion system (fuel and emission
limitation)
• Monitoring the function of flue gas
cleaning plants
• Monitoring compliance with emission
limit values
• Safety of personnel and plants (risk
of fire and explosion)
4.1.5 Coal-fired power plant
Coal-fired power plants are thermal
power plants in which coal (the prima-
ry energy) is used to generate electric-
ity (the secondary energy). Both lignite
and hard coal are used as fuel.
The coal is coarsely crushed, dried
and finely ground in a coal mill. To-
gether with the air pre-heated in the
air pre-heater, it is then blown into
the combustion chamber of the boiler
in the form of a dust/air mixture and
burnt at a temperature of approx.
1000 °C. The steam generator sur-
rounds the combustion chamber and
comprises a pipe system with boiler
feed water flowing through it. The
water is heated until it becomes live
steam at a pressure of approx. 200
bar, and in this form it drives the tur-
bine. The flue gases escape upwards,
pass through the various gas scrub-
bers and are discharged via the stack.
The steam, which has expanded and
cooled down after passing through
the turbine, is once again liquefied in
the condenser via further cooling and
returned to the circuit in the form of
water.
88
4. Application examples
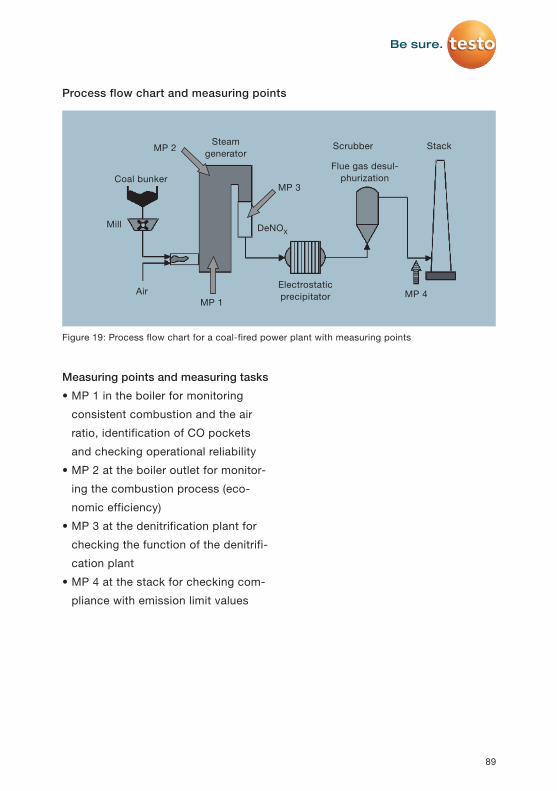
Measuring points and measuring tasks
• MP 1 in the boiler for monitoring
consistent combustion and the air
ratio, identification of CO pockets
and checking operational reliability
• MP 2 at the boiler outlet for monitor-
ing the combustion process (eco-
nomic efficiency)
• MP 3 at the denitrification plant for
checking the function of the denitrifi-
cation plant
• MP 4 at the stack for checking com-
pliance with emission limit values
89
Steam generator
Coal bunker
MP 2
MP 3
DeNOXMill
Electrostatic precipitator
Scrubber
Flue gas desul-phurization
Stack
MP 4MP 1
Air
Figure 19: Process flow chart for a coal-fired power plant with measuring points
Process flow chart and measuring points
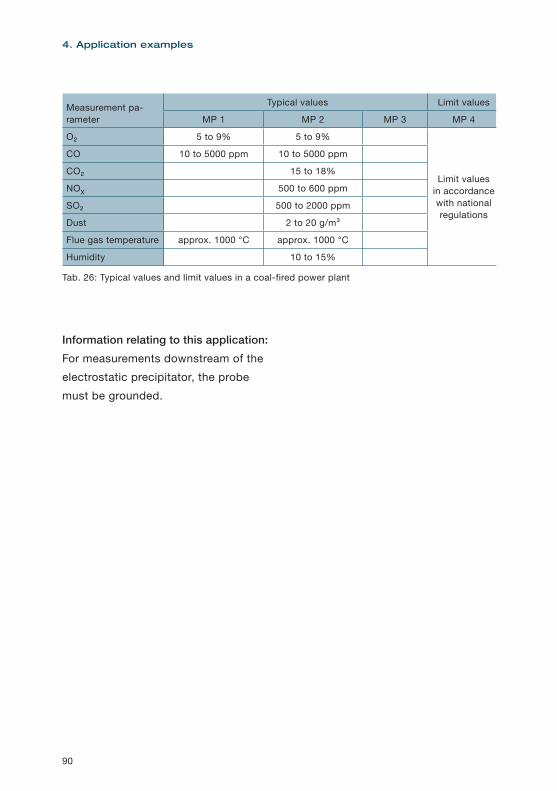
Information relating to this application:
For measurements downstream of the
electrostatic precipitator, the probe
must be grounded.
90
4. Application examples
Tab. 26: Typical values and limit values in a coal-fired power plant
Measurement pa-rameter
Typical values Limit values
MP 1 MP 2 MP 3 MP 4
O₂ 5 to 9% 5 to 9%
Limit values in accordance with national regulations
CO 10 to 5000 ppm 10 to 5000 ppm
CO₂ 15 to 18%
NOX 500 to 600 ppm
SO₂ 500 to 2000 ppm
Dust 2 to 20 g/m³
Flue gas temperature approx. 1000 °C approx. 1000 °C
Humidity 10 to 15%
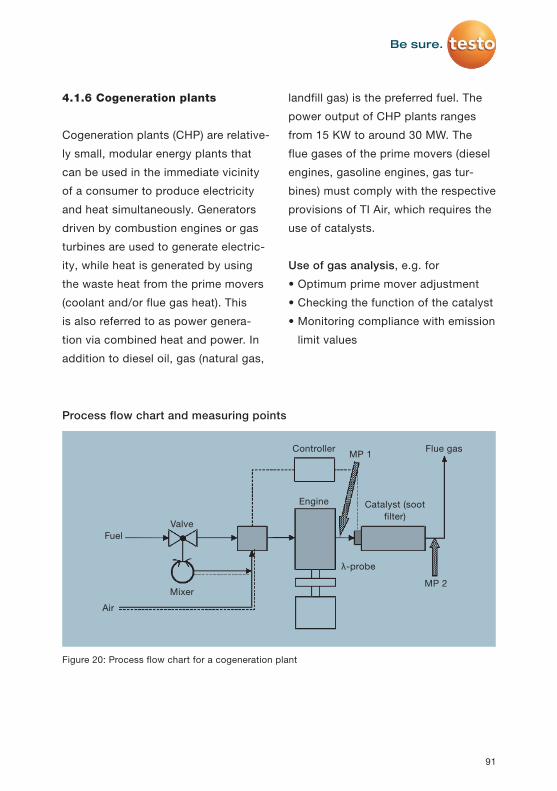
4.1.6 Cogeneration plants
Cogeneration plants (CHP) are relative-
ly small, modular energy plants that
can be used in the immediate vicinity
of a consumer to produce electricity
and heat simultaneously. Generators
driven by combustion engines or gas
turbines are used to generate electric-
ity, while heat is generated by using
the waste heat from the prime movers
(coolant and/or flue gas heat). This
is also referred to as power genera-
tion via combined heat and power. In
addition to diesel oil, gas (natural gas,
landfill gas) is the preferred fuel. The
power output of CHP plants ranges
from 15 KW to around 30 MW. The
flue gases of the prime movers (diesel
engines, gasoline engines, gas tur-
bines) must comply with the respective
provisions of TI Air, which requires the
use of catalysts.
Use of gas analysis, e.g. for
• Optimum prime mover adjustment
• Checking the function of the catalyst
• Monitoring compliance with emission
limit values
91
Generator
Controller Flue gas
Catalyst (soot filter)
Engine
λ-probe
Valve
Mixer
Fuel
Air
MP 1
MP 2
Figure 20: Process flow chart for a cogeneration plant
Process flow chart and measuring points
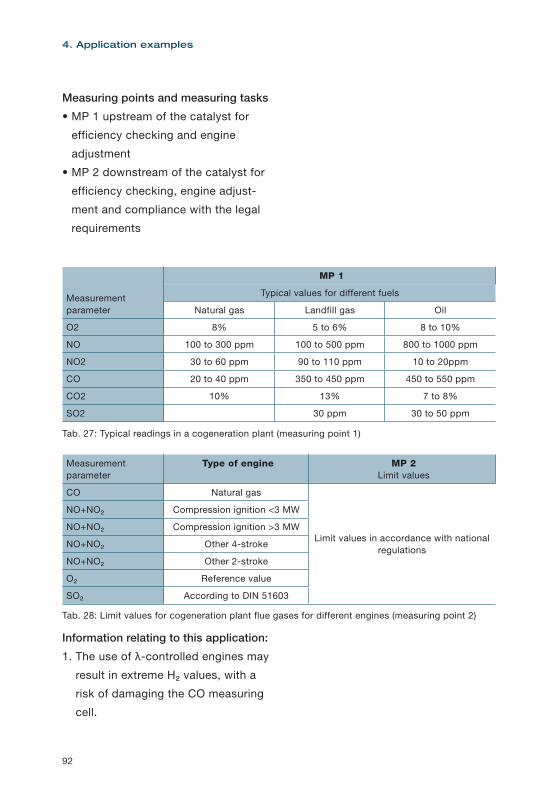
Measuring points and measuring tasks
• MP 1 upstream of the catalyst for
efficiency checking and engine
adjustment
• MP 2 downstream of the catalyst for
efficiency checking, engine adjust-
ment and compliance with the legal
requirements
Information relating to this application:
1. The use of λ-controlled engines may
result in extreme H₂ values, with a
risk of damaging the CO measuring
cell.
92
4. Application examples
Tab. 27: Typical readings in a cogeneration plant (measuring point 1)
Measurement parameter
MP 1
Typical values for different fuels
Natural gas Landfill gas Oil
O2 8% 5 to 6% 8 to 10%
NO 100 to 300 ppm 100 to 500 ppm 800 to 1000 ppm
NO2 30 to 60 ppm 90 to 110 ppm 10 to 20ppm
CO 20 to 40 ppm 350 to 450 ppm 450 to 550 ppm
CO2 10% 13% 7 to 8%
SO2 30 ppm 30 to 50 ppm
Tab. 28: Limit values for cogeneration plant flue gases for different engines (measuring point 2)
Measurement parameter
Type of engine MP 2 Limit values
CO Natural gas
Limit values in accordance with national regulations
NO+NO₂ Compression ignition <3 MW
NO+NO₂ Compression ignition >3 MW
NO+NO₂ Other 4-stroke
NO+NO₂ Other 2-stroke
O₂ Reference value
SO₂ According to DIN 51603
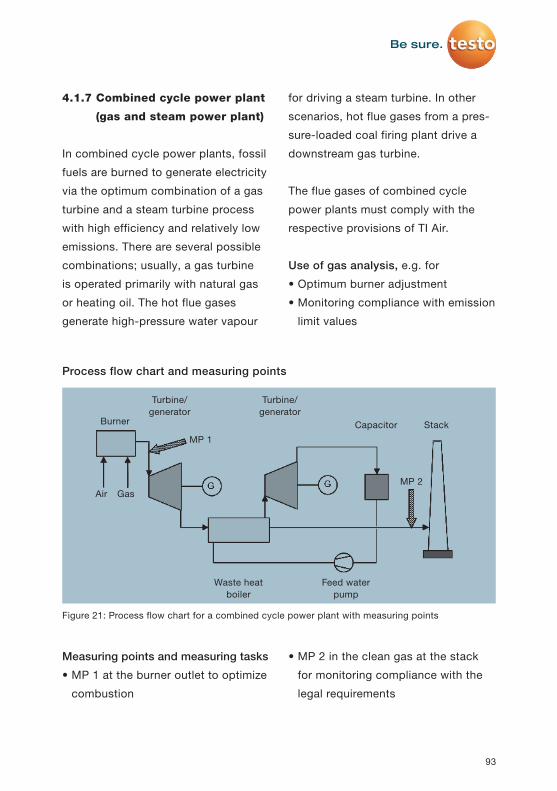
Measuring points and measuring tasks
• MP 1 at the burner outlet to optimize
combustion
4.1.7 Combined cycle power plant
(gas and steam power plant)
In combined cycle power plants, fossil
fuels are burned to generate electricity
via the optimum combination of a gas
turbine and a steam turbine process
with high efficiency and relatively low
emissions. There are several possible
combinations; usually, a gas turbine
is operated primarily with natural gas
or heating oil. The hot flue gases
generate high-pressure water vapour
for driving a steam turbine. In other
scenarios, hot flue gases from a pres-
sure-loaded coal firing plant drive a
downstream gas turbine.
The flue gases of combined cycle
power plants must comply with the
respective provisions of TI Air.
Use of gas analysis, e.g. for
• Optimum burner adjustment
• Monitoring compliance with emission
limit values
• MP 2 in the clean gas at the stack
for monitoring compliance with the
legal requirements
93
Burner
Turbine/ generator
Turbine/ generator
Capacitor Stack
Feed water pump
Waste heat boiler
Air Gas
MP 1
MP 2
Figure 21: Process flow chart for a combined cycle power plant with measuring points
Process flow chart and measuring points

4.2 Waste disposal
4.2.1 Waste incineration
Nowadays, solid, liquid and paste-
like waste materials such as house-
hold, hazardous and industrial waste,
sludges, used tyres, etc. are disposed
of predominantly via thermal treat-
ment (pyrolysis, incineration) using
the energy released, rather than
landfilling. In pyrolysis plants (see
4.2.2), the waste materials are largely
decomposed without oxygen, gen-
erating pyrolysis gas for further use.
More common are waste incineration
plants where the waste is incinerat-
ed in rotary kilns, muffle furnaces or
fluidized-bed furnaces at temperatures
up to 1200°C. The resulting flue gases
are cleaned in various stages before
being discharged into the atmosphere.
In Germany, their permissible level
of pollutants is regulated by the 17th
German Federal Immission Control
Ordinance (BImSchV).
Use of gas analysis, e.g. for
• Controlled waste supply (reduced
filter load and emission levels)
• Keeping the gross calorific value
constant
• Monitoring the function of the clean-
ing stages
• Compliance with emission limit
values
94
4. Application examples
Waste treat-ment
High-temper-ature incineration Scrubber StackPyrolysis
MP 1 MP 2 MP 3+4
Residue treat-ment
Refuse bunker
Power gener-ation
Electrostatic precipitator
Figure 22: Process flow chart for a waste incineration plant with measuring points
Process flow chart and measuring points
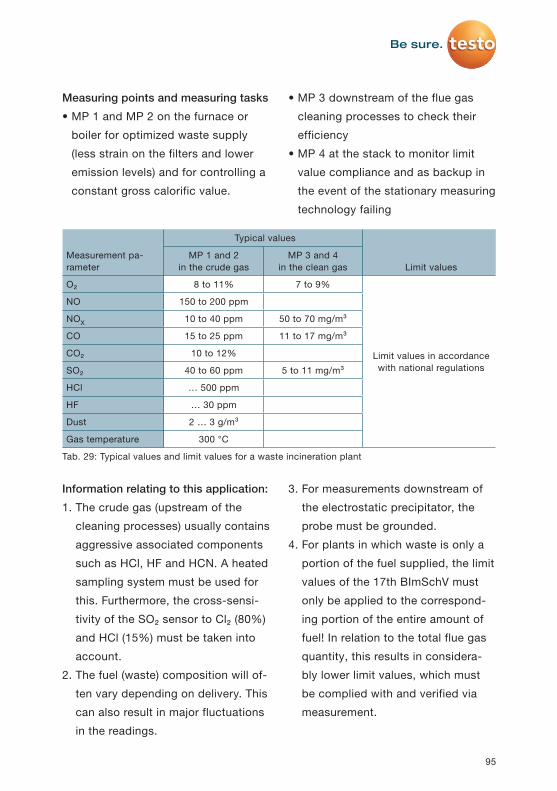
Information relating to this application:
1. The crude gas (upstream of the
cleaning processes) usually contains
aggressive associated components
such as HCl, HF and HCN. A heated
sampling system must be used for
this. Furthermore, the cross-sensi-
tivity of the SO₂ sensor to Cl₂ (80%)
and HCl (15%) must be taken into
account.
2. The fuel (waste) composition will of-
ten vary depending on delivery. This
can also result in major fluctuations
in the readings.
3. For measurements downstream of
the electrostatic precipitator, the
probe must be grounded.
4. For plants in which waste is only a
portion of the fuel supplied, the limit
values of the 17th BImSchV must
only be applied to the correspond-
ing portion of the entire amount of
fuel! In relation to the total flue gas
quantity, this results in considera-
bly lower limit values, which must
be complied with and verified via
measurement.
Measuring points and measuring tasks
• MP 1 and MP 2 on the furnace or
boiler for optimized waste supply
(less strain on the filters and lower
emission levels) and for controlling a
constant gross calorific value.
• MP 3 downstream of the flue gas
cleaning processes to check their
efficiency
• MP 4 at the stack to monitor limit
value compliance and as backup in
the event of the stationary measuring
technology failing
95
Tab. 29: Typical values and limit values for a waste incineration plant
Measurement pa-rameter
Typical values
Limit valuesMP 1 and 2
in the crude gasMP 3 and 4
in the clean gas
O₂ 8 to 11% 7 to 9%
Limit values in accordance with national regulations
NO 150 to 200 ppm
NOX 10 to 40 ppm 50 to 70 mg/m³
CO 15 to 25 ppm 11 to 17 mg/m³
CO₂ 10 to 12%
SO₂ 40 to 60 ppm 5 to 11 mg/m³
HCl … 500 ppm
HF … 30 ppm
Dust 2 … 3 g/m³
Gas temperature 300 °C
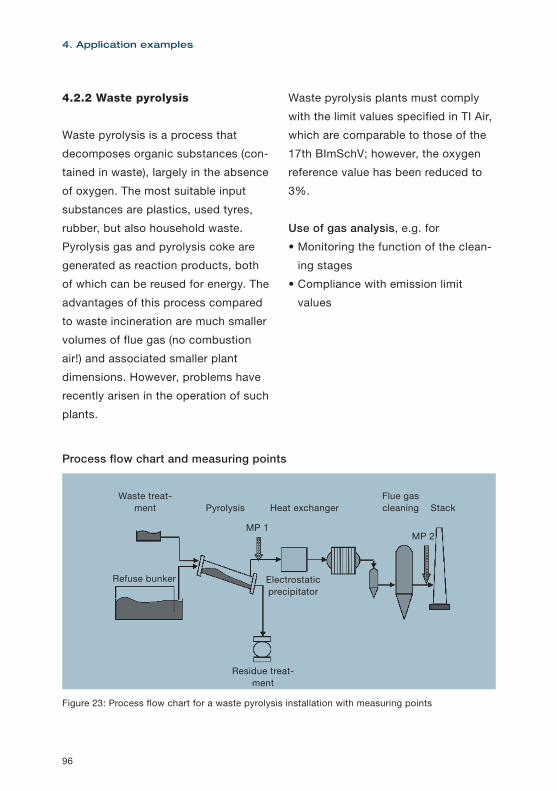
4.2.2 Waste pyrolysis
Waste pyrolysis is a process that
decomposes organic substances (con-
tained in waste), largely in the absence
of oxygen. The most suitable input
substances are plastics, used tyres,
rubber, but also household waste.
Pyrolysis gas and pyrolysis coke are
generated as reaction products, both
of which can be reused for energy. The
advantages of this process compared
to waste incineration are much smaller
volumes of flue gas (no combustion
air!) and associated smaller plant
dimensions. However, problems have
recently arisen in the operation of such
plants.
Waste pyrolysis plants must comply
with the limit values specified in TI Air,
which are comparable to those of the
17th BImSchV; however, the oxygen
reference value has been reduced to
3%.
Use of gas analysis, e.g. for
• Monitoring the function of the clean-
ing stages
• Compliance with emission limit
values
96
4. Application examples
Waste treat-ment Pyrolysis Heat exchanger
Electrostatic precipitator
Residue treat-ment
Flue gas cleaning Stack
MP 1MP 2
Refuse bunker
Figure 23: Process flow chart for a waste pyrolysis installation with measuring points
Process flow chart and measuring points

Measuring points and measuring tasks
• MP 1 in the flue gas of the pyrolysis
furnace to monitor optimum waste
supply and the pyrolysis process
• MP 2 at the stack to monitor compli-
ance with limit values in accordance
with national regulations
97
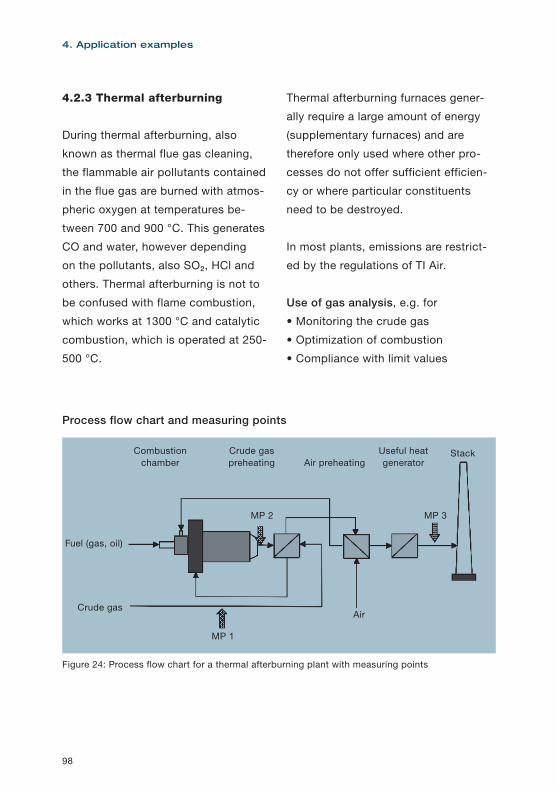
4.2.3 Thermal afterburning
During thermal afterburning, also
known as thermal flue gas cleaning,
the flammable air pollutants contained
in the flue gas are burned with atmos-
pheric oxygen at temperatures be-
tween 700 and 900 °C. This generates
CO and water, however depending
on the pollutants, also SO₂, HCl and
others. Thermal afterburning is not to
be confused with flame combustion,
which works at 1300 °C and catalytic
combustion, which is operated at 250-
500 °C.
Thermal afterburning furnaces gener-
ally require a large amount of energy
(supplementary furnaces) and are
therefore only used where other pro-
cesses do not offer sufficient efficien-
cy or where particular constituents
need to be destroyed.
In most plants, emissions are restrict-
ed by the regulations of TI Air.
Use of gas analysis, e.g. for
• Monitoring the crude gas
• Optimization of combustion
• Compliance with limit values
98
4. Application examples
Combustion chamber
Crude gas preheating Air preheating
Air
Useful heat generator
Stack
MP 1
MP 3MP 2
Fuel (gas, oil)
Crude gas
Figure 24: Process flow chart for a thermal afterburning plant with measuring points
Process flow chart and measuring points
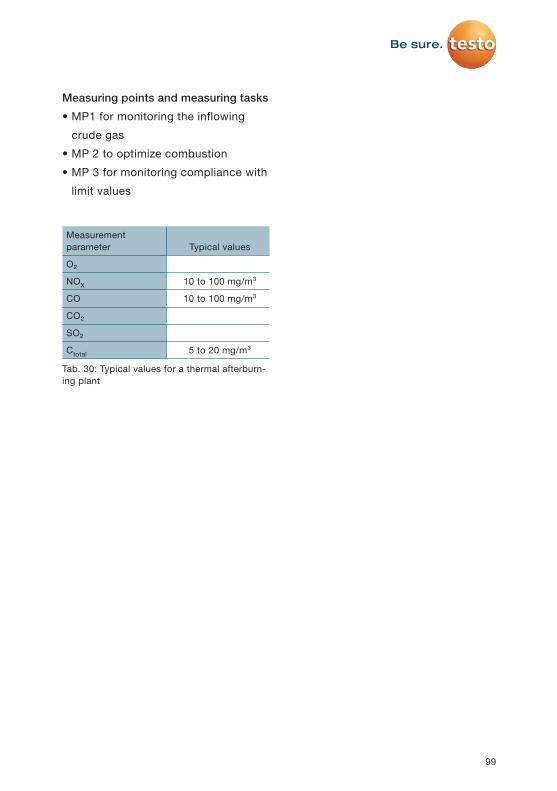
Measuring points and measuring tasks
• MP1 for monitoring the inflowing
crude gas
• MP 2 to optimize combustion
• MP 3 for monitoring compliance with
limit values
99
Tab. 30: Typical values for a thermal afterburn-ing plant
Measurement parameter Typical values
O₂
NOX 10 to 100 mg/m³
CO 10 to 100 mg/m³
CO₂
SO₂
Ctotal 5 to 20 mg/m³
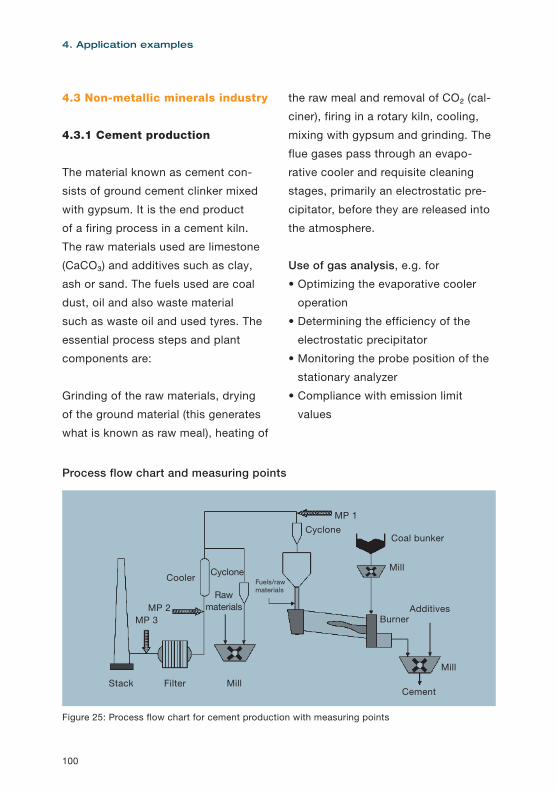
4.3 Non-metallic minerals industry
4.3.1 Cement production
The material known as cement con-
sists of ground cement clinker mixed
with gypsum. It is the end product
of a firing process in a cement kiln.
The raw materials used are limestone
(CaCO₃) and additives such as clay,
ash or sand. The fuels used are coal
dust, oil and also waste material
such as waste oil and used tyres. The
essential process steps and plant
components are:
Grinding of the raw materials, drying
of the ground material (this generates
what is known as raw meal), heating of
the raw meal and removal of CO₂ (cal-
ciner), firing in a rotary kiln, cooling,
mixing with gypsum and grinding. The
flue gases pass through an evapo-
rative cooler and requisite cleaning
stages, primarily an electrostatic pre-
cipitator, before they are released into
the atmosphere.
Use of gas analysis, e.g. for
• Optimizing the evaporative cooler
operation
• Determining the efficiency of the
electrostatic precipitator
• Monitoring the probe position of the
stationary analyzer
• Compliance with emission limit
values
100
4. Application examples
MP 3MP 2
Stack MillCement
MillFuels/raw materials
BurnerAdditives
Mill
Raw materials
Cyclone
CycloneCoal bunker
Filter
MP 1
Cooler
Figure 25: Process flow chart for cement production with measuring points
Process flow chart and measuring points

Information relating to this application
1. Very high dust load in the crude gas
and sometimes in the ambient air
2. Very high CO₂ concentrations, par-
tially outside the measuring range.
3. At high O₂ concentrations, the O₂
sensor is cross-sensitive to high
CO₂ concentrations!
4. Flow measurement is not possible
with high dust loads and high gas
velocities
5. The probe must be grounded when
mounted at a stack built of bricks!
6. Depending on the fuel, limit values
for lead (as dust) as well as for thal-
lium and cadmium also need to be
complied with.
Measuring points and measuring tasks
• MP 1 between calciner and evap-
orative cooler to draw up a plant
balance
• MP 2 upstream of the electrostatic
precipitator to draw up a plant bal-
ance and to record efficiency
• MP 3 in the clean gas at the stack to
monitor compliance with emission
limit values
101
Tab. 31: Typical values and limit values for cement production
Measurement parameter
MP 1 in the crude gas MP 3 and 4 in the clean gas
Limit values
Typical values Measuring range
(MR extension)
Typical values
Measuring range
(MR extension)
O₂ Up to 10% 0 to 21% Like crude gas
Limit values in accordance with national regulations
CO 100 to 10000 ppm
0 to 10000 ppm (0.1 to 20%)
Like crude gas
CO₂ Approx. 20 to 40%
0 to 25% (0.1 to 100%)
Like crude gas
SO₂ low 0 to 5000 ppm
NOX 200 to 700 ppm
0 to 5000 ppm
Dust Up to 100 g/m³
Up to 100 mg/m³
Temperature 300 to 400 °C 100 to 150 °C
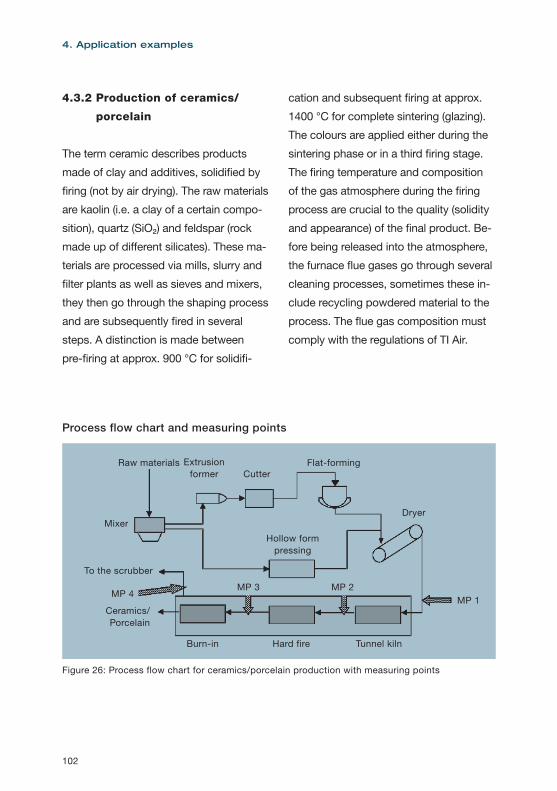
4.3.2 Production of ceramics/
porcelain
The term ceramic describes products
made of clay and additives, solidified by
firing (not by air drying). The raw materials
are kaolin (i.e. a clay of a certain compo-
sition), quartz (SiO₂) and feldspar (rock
made up of different silicates). These ma-
terials are processed via mills, slurry and
filter plants as well as sieves and mixers,
they then go through the shaping process
and are subsequently fired in several
steps. A distinction is made between
pre-firing at approx. 900 °C for solidifi-
cation and subsequent firing at approx.
1400 °C for complete sintering (glazing).
The colours are applied either during the
sintering phase or in a third firing stage.
The firing temperature and composition
of the gas atmosphere during the firing
process are crucial to the quality (solidity
and appearance) of the final product. Be-
fore being released into the atmosphere,
the furnace flue gases go through several
cleaning processes, sometimes these in-
clude recycling powdered material to the
process. The flue gas composition must
comply with the regulations of TI Air.
102
4. Application examples
Raw materials
Burn-in Hard fire Tunnel kiln
Ceramics/ Porcelain
Flat-forming
Dryer
Extrusion former Cutter
Hollow form pressing
MP 1MP 4
MP 2MP 3
Mixer
To the scrubber
Figure 26: Process flow chart for ceramics/porcelain production with measuring points
Process flow chart and measuring points
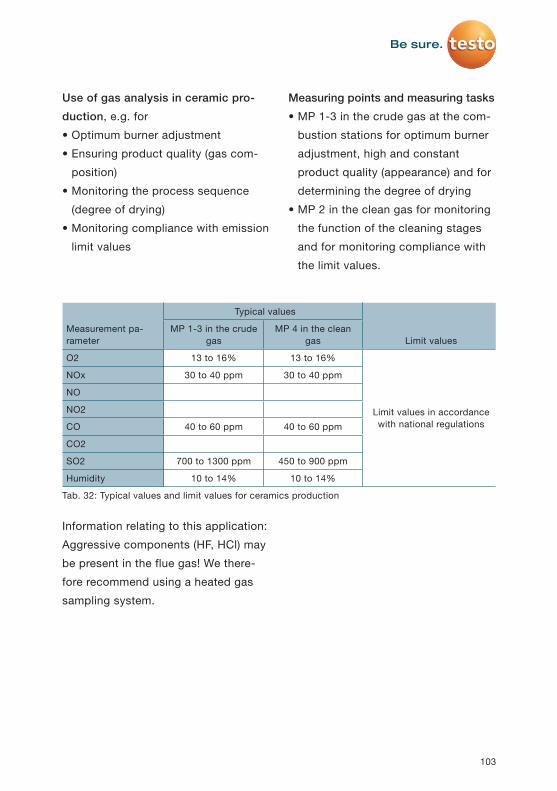
Information relating to this application:
Aggressive components (HF, HCl) may
be present in the flue gas! We there-
fore recommend using a heated gas
sampling system.
Use of gas analysis in ceramic pro-
duction, e.g. for
• Optimum burner adjustment
• Ensuring product quality (gas com-
position)
• Monitoring the process sequence
(degree of drying)
• Monitoring compliance with emission
limit values
Measuring points and measuring tasks
• MP 1-3 in the crude gas at the com-
bustion stations for optimum burner
adjustment, high and constant
product quality (appearance) and for
determining the degree of drying
• MP 2 in the clean gas for monitoring
the function of the cleaning stages
and for monitoring compliance with
the limit values.
103
Tab. 32: Typical values and limit values for ceramics production
Measurement pa-rameter
Typical values
Limit valuesMP 1-3 in the crude
gasMP 4 in the clean
gas
O2 13 to 16% 13 to 16%
Limit values in accordance with national regulations
NOx 30 to 40 ppm 30 to 40 ppm
NO
NO2
CO 40 to 60 ppm 40 to 60 ppm
CO2
SO2 700 to 1300 ppm 450 to 900 ppm
Humidity 10 to 14% 10 to 14%
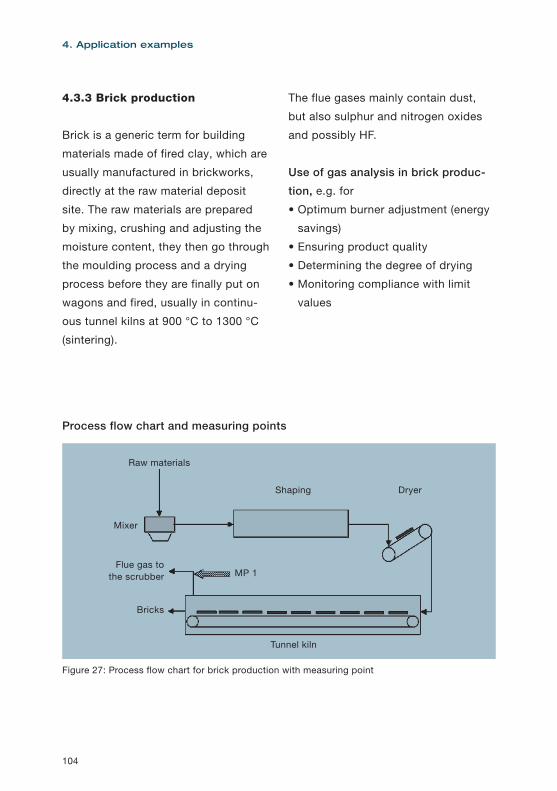
4.3.3 Brick production
Brick is a generic term for building
materials made of fired clay, which are
usually manufactured in brickworks,
directly at the raw material deposit
site. The raw materials are prepared
by mixing, crushing and adjusting the
moisture content, they then go through
the moulding process and a drying
process before they are finally put on
wagons and fired, usually in continu-
ous tunnel kilns at 900 °C to 1300 °C
(sintering).
The flue gases mainly contain dust,
but also sulphur and nitrogen oxides
and possibly HF.
Use of gas analysis in brick produc-
tion, e.g. for
• Optimum burner adjustment (energy
savings)
• Ensuring product quality
• Determining the degree of drying
• Monitoring compliance with limit
values
104
4. Application examples
Raw materials
Tunnel kiln
Shaping Dryer
MP 1
Mixer
Flue gas to the scrubber
Bricks
Figure 27: Process flow chart for brick production with measuring point
Process flow chart and measuring points
Measuring points and measuring tasks
• MP 1 at the tunnel kiln for optimum
burner adjustment, high and con-
stant product quality (appearance)
and for determining the degree of
drying
• MP 2 in the clean gas (not shown
in the picture!) for monitoring the
function of the cleaning stages and
for monitoring compliance with the
limit values.
105

4.3.4 Glass production
Glass production includes a wide vari-
ety of different products, with the main
emphasis on hollow glassware (for
containers and all kinds of consumer
goods) and flat glass, which is mostly
refined into higher quality products.
The raw materials vary considerably
depending on the product; in general,
sand, soda and limestone are impor-
tant, with specific substances (e.g.
metal oxides) subsequently added to
them. Recycled glass is also widely
used. The raw materials are crushed,
mixed and fed into the melting furnace
as a conglomerate. A distinction
is made between pot furnaces for
discontinuous operation and tank or
tunnel furnaces for continuous opera-
tion, with melting temperatures usually
at 1500°C or above. Furnace and firing
details vary depending on the appli-
cation. Natural gas, heating oil and
electricity are used as energy sources.
Additives such as nitric acid are used
to homogenize the melt.
The flue gases mainly contain dust,
sulphur oxides, nitrogen oxides (result-
ing from the high temperatures) as well
as fluorine and sulphur compounds
from the raw materials or waste glass.
They have to go through various
cleaning processes before being re-
leased into the atmosphere, and their
composition must comply with the
regulations of TI Air.
106
4. Application examples
Air
Fuel Fuel
Melting tank
Scrubber Stack
Catalyst
Scrubber electrostatic precipitator
MP 1
MP 2
Figure 28: Process flow chart for glass production plant with measuring points
Process flow chart and measuring points
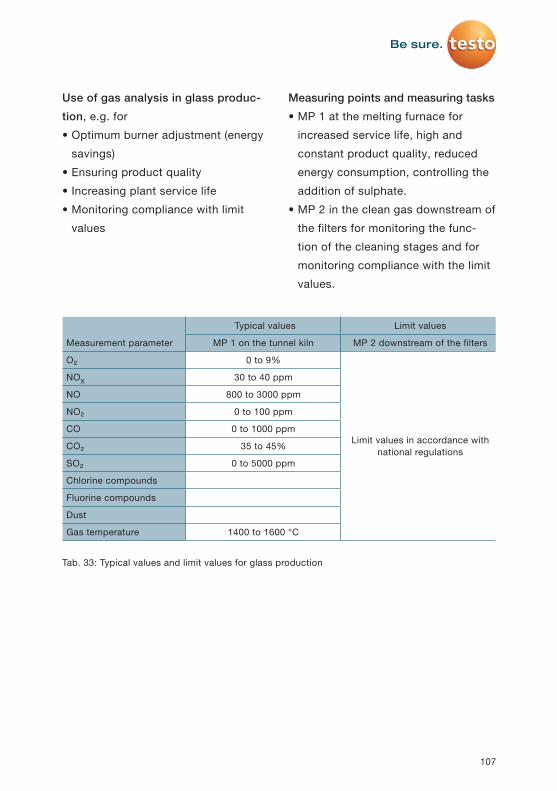
Measuring points and measuring tasks
• MP 1 at the melting furnace for
increased service life, high and
constant product quality, reduced
energy consumption, controlling the
addition of sulphate.
• MP 2 in the clean gas downstream of
the filters for monitoring the func-
tion of the cleaning stages and for
monitoring compliance with the limit
values.
Use of gas analysis in glass produc-
tion, e.g. for
• Optimum burner adjustment (energy
savings)
• Ensuring product quality
• Increasing plant service life
• Monitoring compliance with limit
values
107
Tab. 33: Typical values and limit values for glass production
Measurement parameter
Typical values Limit values
MP 1 on the tunnel kiln MP 2 downstream of the filters
O₂ 0 to 9%
Limit values in accordance with national regulations
NOX 30 to 40 ppm
NO 800 to 3000 ppm
NO₂ 0 to 100 ppm
CO 0 to 1000 ppm
CO₂ 35 to 45%
SO₂ 0 to 5000 ppm
Chlorine compounds
Fluorine compounds
Dust
Gas temperature 1400 to 1600 °C
4. The temperature in the vicinity of
the plant may rise up to 70 °C.
Therefore it is essential to use a
heated sampling hose.
5. The dust content in the crude gas
is usually very fine-grained and can
reach 400 mg/m³
Practical information relating to this
application:
1. The flue gas may be very humid,
resulting in abrupt evaporation in
the sampling probe. It is therefore
essential to use a heated gas sam-
pling system!
2. The CO₂ concentrations are very
high and therefore outside of the
measuring range.
3. The oxygen content in the vicinity of
the plant may drop below 21%. The
fresh-air hose should therefore be
routed to the outside.
108
4. Application examples
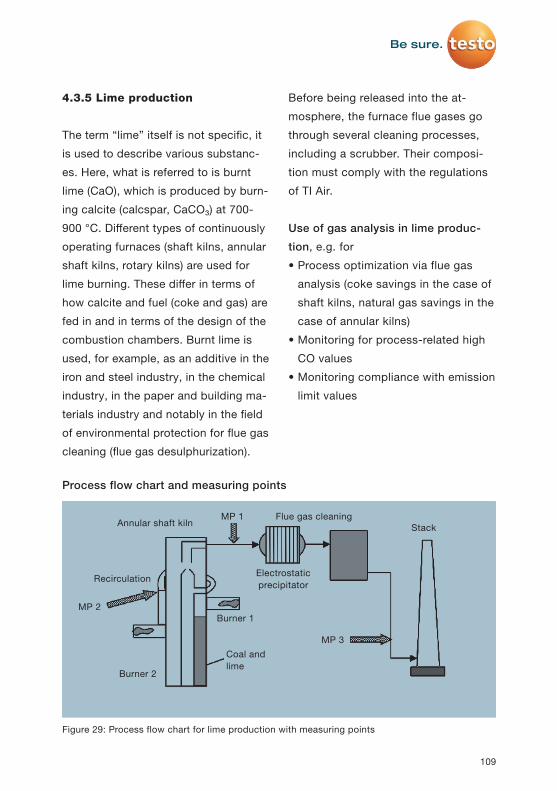
4.3.5 Lime production
The term “lime” itself is not specific, it
is used to describe various substanc-
es. Here, what is referred to is burnt
lime (CaO), which is produced by burn-
ing calcite (calcspar, CaCO₃) at 700-
900 °C. Different types of continuously
operating furnaces (shaft kilns, annular
shaft kilns, rotary kilns) are used for
lime burning. These differ in terms of
how calcite and fuel (coke and gas) are
fed in and in terms of the design of the
combustion chambers. Burnt lime is
used, for example, as an additive in the
iron and steel industry, in the chemical
industry, in the paper and building ma-
terials industry and notably in the field
of environmental protection for flue gas
cleaning (flue gas desulphurization).
Before being released into the at-
mosphere, the furnace flue gases go
through several cleaning processes,
including a scrubber. Their composi-
tion must comply with the regulations
of TI Air.
Use of gas analysis in lime produc-
tion, e.g. for
• Process optimization via flue gas
analysis (coke savings in the case of
shaft kilns, natural gas savings in the
case of annular kilns)
• Monitoring for process-related high
CO values
• Monitoring compliance with emission
limit values
109
Annular shaft kiln
Burner 2
Coal and lime
Burner 1
Recirculation
Flue gas cleaning
Electrostatic precipitator
StackMP 1
MP 2
MP 3
Figure 29: Process flow chart for lime production with measuring points
Process flow chart and measuring points
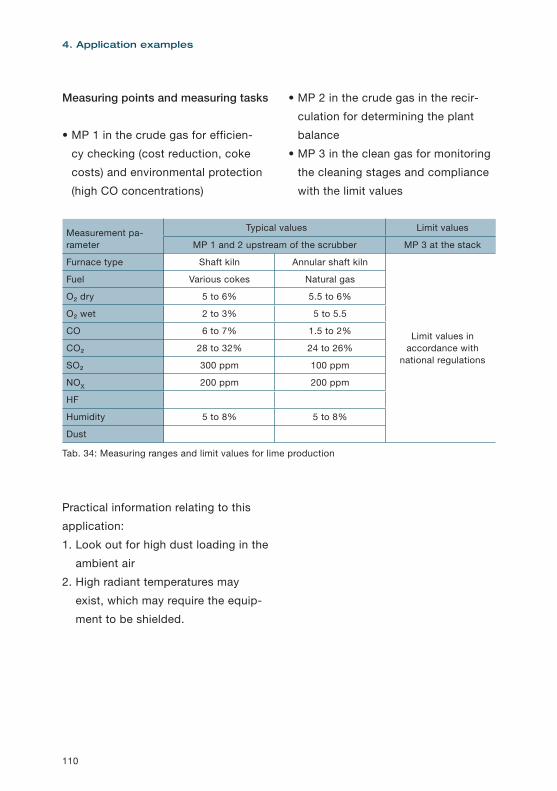
110
4. Application examples
Practical information relating to this
application:
1. Look out for high dust loading in the
ambient air
2. High radiant temperatures may
exist, which may require the equip-
ment to be shielded.
Measuring points and measuring tasks
• MP 1 in the crude gas for efficien-
cy checking (cost reduction, coke
costs) and environmental protection
(high CO concentrations)
• MP 2 in the crude gas in the recir-
culation for determining the plant
balance
• MP 3 in the clean gas for monitoring
the cleaning stages and compliance
with the limit values
Tab. 34: Measuring ranges and limit values for lime production
Measurement pa-rameter
Typical values Limit values
MP 1 and 2 upstream of the scrubber MP 3 at the stack
Furnace type Shaft kiln Annular shaft kiln
Limit values in accordance with
national regulations
Fuel Various cokes Natural gas
O₂ dry 5 to 6% 5.5 to 6%
O₂ wet 2 to 3% 5 to 5.5
CO 6 to 7% 1.5 to 2%
CO₂ 28 to 32% 24 to 26%
SO₂ 300 ppm 100 ppm
NOX 200 ppm 200 ppm
HF
Humidity 5 to 8% 5 to 8%
Dust
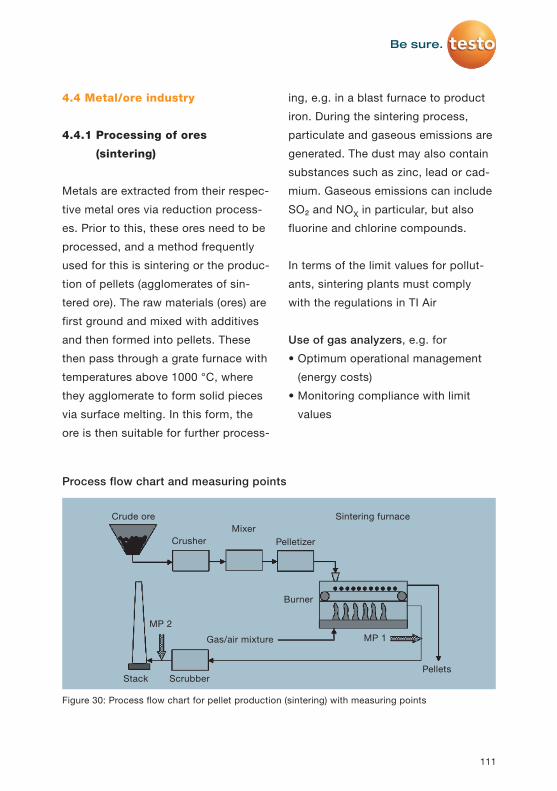
111
4.4 Metal/ore industry
4.4.1 Processing of ores
(sintering)
Metals are extracted from their respec-
tive metal ores via reduction process-
es. Prior to this, these ores need to be
processed, and a method frequently
used for this is sintering or the produc-
tion of pellets (agglomerates of sin-
tered ore). The raw materials (ores) are
first ground and mixed with additives
and then formed into pellets. These
then pass through a grate furnace with
temperatures above 1000 °C, where
they agglomerate to form solid pieces
via surface melting. In this form, the
ore is then suitable for further process-
ing, e.g. in a blast furnace to product
iron. During the sintering process,
particulate and gaseous emissions are
generated. The dust may also contain
substances such as zinc, lead or cad-
mium. Gaseous emissions can include
SO₂ and NOX in particular, but also
fluorine and chlorine compounds.
In terms of the limit values for pollut-
ants, sintering plants must comply
with the regulations in TI Air
Use of gas analyzers, e.g. for
• Optimum operational management
(energy costs)
• Monitoring compliance with limit
values
Crude ore
CrusherMixer
Pelletizer
Sintering furnace
Burner
ScrubberStackPellets
Gas/air mixture
MP 2MP 1
Figure 30: Process flow chart for pellet production (sintering) with measuring points
Process flow chart and measuring points

112
4. Application examples
Measuring points and measuring tasks
• MP 1 in the crude gas downstream
of the furnace for furnace optimiza-
tion
• MP 2 in the clean gas at the stack
for monitoring the function of the flue
gas cleaning and for monitoring the
limit values
Tab. 35: Typical values and limit values in a sintering plant
Measurement pa-rameter
Typical values Limit values
MP 1 MP 2
SO₂ 500 to 3000 mg/m³
Limit values in accordance with national regulations
NOX 150 to 350 mg/m³
Fluorine compounds 2 to 10 mg/m³
Chlorine compounds 20 to 60 mg/m³
Dust up to 3000 mg/m³
Temperature 1000 to 1200 °C
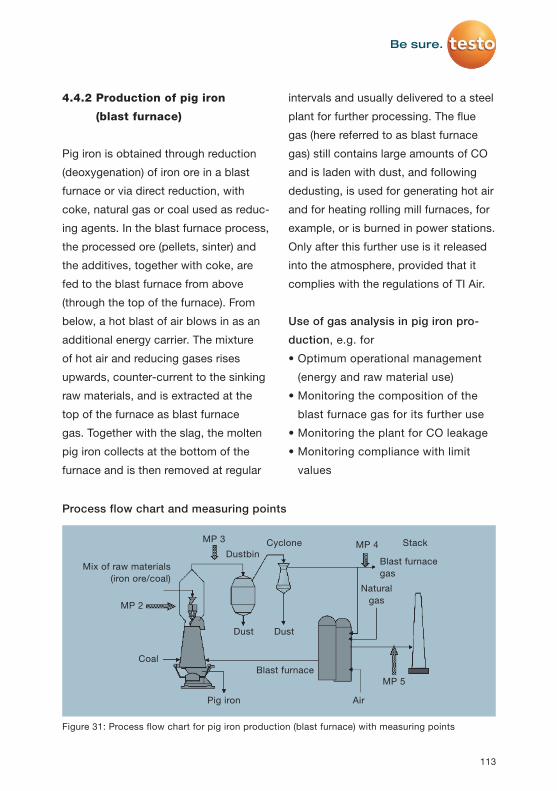
113
4.4.2 Production of pig iron
(blast furnace)
Pig iron is obtained through reduction
(deoxygenation) of iron ore in a blast
furnace or via direct reduction, with
coke, natural gas or coal used as reduc-
ing agents. In the blast furnace process,
the processed ore (pellets, sinter) and
the additives, together with coke, are
fed to the blast furnace from above
(through the top of the furnace). From
below, a hot blast of air blows in as an
additional energy carrier. The mixture
of hot air and reducing gases rises
upwards, counter-current to the sinking
raw materials, and is extracted at the
top of the furnace as blast furnace
gas. Together with the slag, the molten
pig iron collects at the bottom of the
furnace and is then removed at regular
intervals and usually delivered to a steel
plant for further processing. The flue
gas (here referred to as blast furnace
gas) still contains large amounts of CO
and is laden with dust, and following
dedusting, is used for generating hot air
and for heating rolling mill furnaces, for
example, or is burned in power stations.
Only after this further use is it released
into the atmosphere, provided that it
complies with the regulations of TI Air.
Use of gas analysis in pig iron pro-
duction, e.g. for
• Optimum operational management
(energy and raw material use)
• Monitoring the composition of the
blast furnace gas for its further use
• Monitoring the plant for CO leakage
• Monitoring compliance with limit
values
DustbinCyclone
Natural gas
Blast furnace gas
DustDust
Stack
AirPig iron
CoalBlast furnace
Mix of raw materials (iron ore/coal)
MP 4
MP 5
MP 3
MP 2
Figure 31: Process flow chart for pig iron production (blast furnace) with measuring points
Process flow chart and measuring points

114
4. Application examples
Note: At measuring point 2, there are
stringent temperature- and dust-re-
lated requirements for gas extraction
(specialist manufacturer).
Measuring points and measuring tasks
• MP 1 (not included in the illustra-
tion!) inside the raw material silo for
monitoring CO
• MP 2 in the riser pipe of the blast
furnace as a guide parameter for
furnace operation
• MP 3 in the downpipe, upstream of
the dustbin for determining the plant
balance and for fire hazard preven-
tion due to CO in the dustbin
• MP 4 at the blast furnace gas dis-
charge downstream of the dustbin
for monitoring the composition of
the blast furnace gas (plant balance;
further use of the blast furnace gas)
• MP 5 at the stack for monitoring
compliance with limit values
Tab. 36: Typical values and limit values for pig iron production (blast furnace)
Measurement parameter
Typical values Limit values
MP 1 MP 2 MP 3 MP 4 MP 5
0 to 50 ppm 0 to 50% 0 to 50% 0 to 50%
Limit values in
accordance with national regulations
CO₂ 0 to 30% 0 to 30% 0 to 30%
CH₄ 0 to 4% 0 to 1% 0 to 1%
H₂ 0 to 15% 0 to 10%
Dust 50 to 100 g/m3 1 to 10 g/m3
Temperature Up to 1300 °C 100 to 500 °C 100 to 150 °C
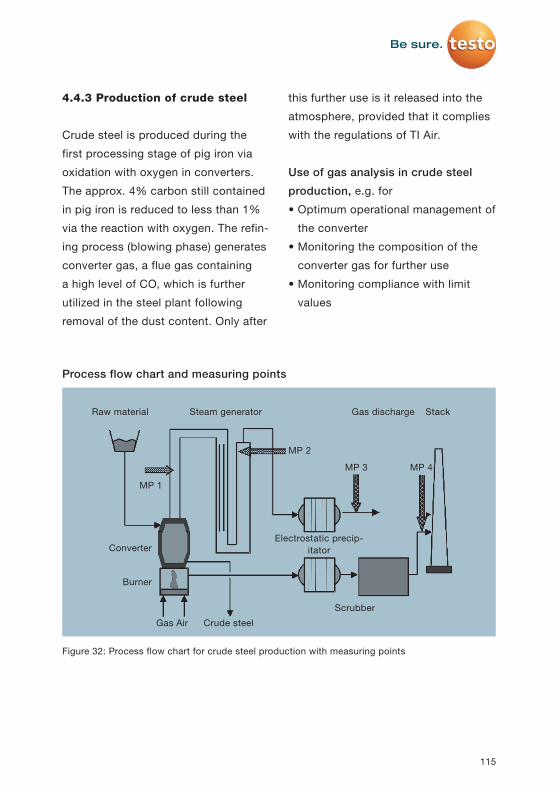
115
4.4.3 Production of crude steel
Crude steel is produced during the
first processing stage of pig iron via
oxidation with oxygen in converters.
The approx. 4% carbon still contained
in pig iron is reduced to less than 1%
via the reaction with oxygen. The refin-
ing process (blowing phase) generates
converter gas, a flue gas containing
a high level of CO, which is further
utilized in the steel plant following
removal of the dust content. Only after
this further use is it released into the
atmosphere, provided that it complies
with the regulations of TI Air.
Use of gas analysis in crude steel
production, e.g. for
• Optimum operational management of
the converter
• Monitoring the composition of the
converter gas for further use
• Monitoring compliance with limit
values
Converter
Burner
Raw material Steam generator StackGas discharge
Scrubber
Crude steelGas Air
Electrostatic precip-itator
MP 3 MP 4
MP 2
MP 1
Process flow chart and measuring points
Figure 32: Process flow chart for crude steel production with measuring points
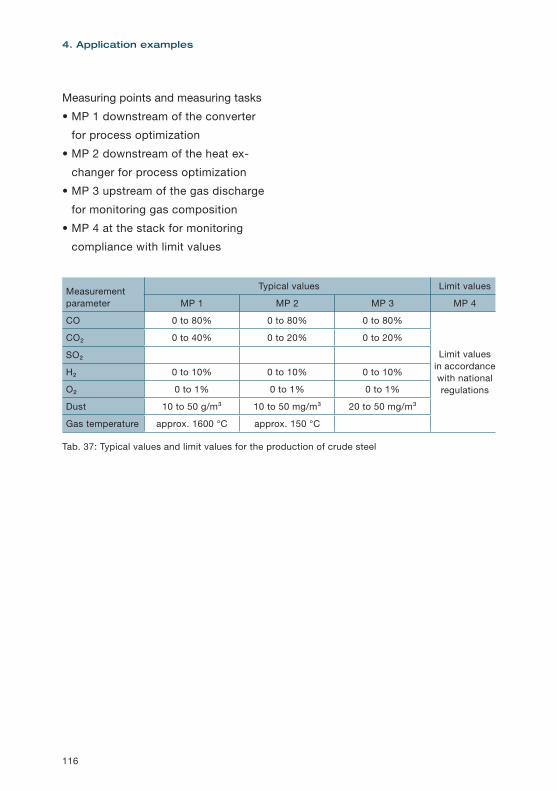
116
4. Application examples
Measuring points and measuring tasks
• MP 1 downstream of the converter
for process optimization
• MP 2 downstream of the heat ex-
changer for process optimization
• MP 3 upstream of the gas discharge
for monitoring gas composition
• MP 4 at the stack for monitoring
compliance with limit values
Tab. 37: Typical values and limit values for the production of crude steel
Measurement parameter
Typical values Limit values
MP 1 MP 2 MP 3 MP 4
CO 0 to 80% 0 to 80% 0 to 80%
Limit values in accordance with national regulations
CO₂ 0 to 40% 0 to 20% 0 to 20%
SO₂
H₂ 0 to 10% 0 to 10% 0 to 10%
O₂ 0 to 1% 0 to 1% 0 to 1%
Dust 10 to 50 g/m³ 10 to 50 mg/m³ 20 to 50 mg/m³
Gas temperature approx. 1600 °C approx. 150 °C
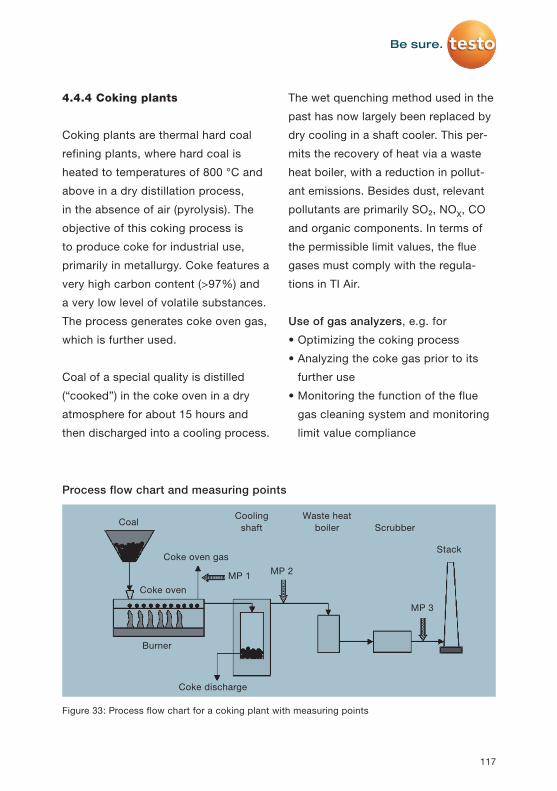
117
4.4.4 Coking plants
Coking plants are thermal hard coal
refining plants, where hard coal is
heated to temperatures of 800 °C and
above in a dry distillation process,
in the absence of air (pyrolysis). The
objective of this coking process is
to produce coke for industrial use,
primarily in metallurgy. Coke features a
very high carbon content (>97%) and
a very low level of volatile substances.
The process generates coke oven gas,
which is further used.
Coal of a special quality is distilled
(“cooked”) in the coke oven in a dry
atmosphere for about 15 hours and
then discharged into a cooling process.
The wet quenching method used in the
past has now largely been replaced by
dry cooling in a shaft cooler. This per-
mits the recovery of heat via a waste
heat boiler, with a reduction in pollut-
ant emissions. Besides dust, relevant
pollutants are primarily SO₂, NOX, CO
and organic components. In terms of
the permissible limit values, the flue
gases must comply with the regula-
tions in TI Air.
Use of gas analyzers, e.g. for
• Optimizing the coking process
• Analyzing the coke gas prior to its
further use
• Monitoring the function of the flue
gas cleaning system and monitoring
limit value compliance
Coal
Stack
ScrubberWaste heat
boilerCooling
shaft
Coke oven gas
Coke oven
Burner
Coke discharge
MP 2
MP 3
MP 1
Process flow chart and measuring points
Figure 33: Process flow chart for a coking plant with measuring points

118
4. Application examples
Measuring points and measuring tasks
MP 1 at the gas discharge for evaluat-
ing the coke gas
MP 2 downstream of the cooling shaft
for optimizing the coke drying process
MP 3 at the stack for monitoring com-
pliance with the limit values
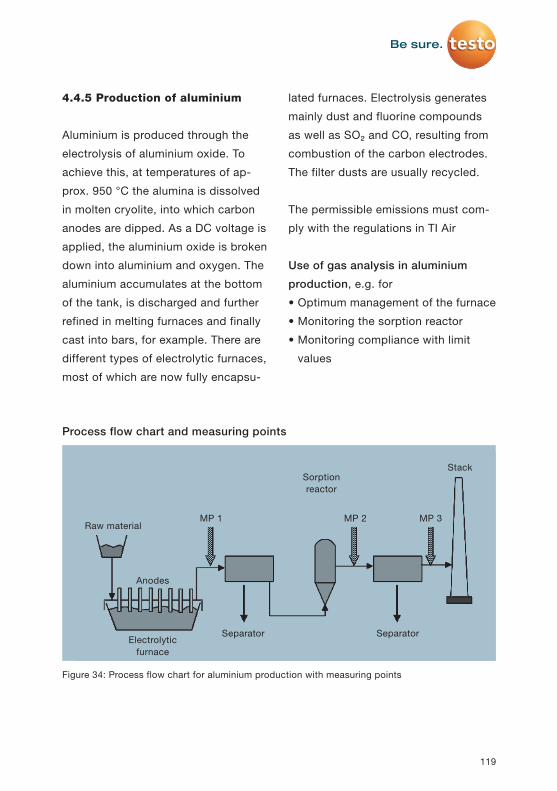
119
4.4.5 Production of aluminium
Aluminium is produced through the
electrolysis of aluminium oxide. To
achieve this, at temperatures of ap-
prox. 950 °C the alumina is dissolved
in molten cryolite, into which carbon
anodes are dipped. As a DC voltage is
applied, the aluminium oxide is broken
down into aluminium and oxygen. The
aluminium accumulates at the bottom
of the tank, is discharged and further
refined in melting furnaces and finally
cast into bars, for example. There are
different types of electrolytic furnaces,
most of which are now fully encapsu-
lated furnaces. Electrolysis generates
mainly dust and fluorine compounds
as well as SO₂ and CO, resulting from
combustion of the carbon electrodes.
The filter dusts are usually recycled.
The permissible emissions must com-
ply with the regulations in TI Air
Use of gas analysis in aluminium
production, e.g. for
• Optimum management of the furnace
• Monitoring the sorption reactor
• Monitoring compliance with limit
values
StackSorption reactor
Raw material
Electrolytic furnace
Anodes
Separator Separator
MP 2 MP 3MP 1
Process flow chart and measuring points
Figure 34: Process flow chart for aluminium production with measuring points

120
4. Application examples
Measuring points and measuring tasks
• MP 1 downstream of the melting
tank for plant optimization
• MP 2 downstream of the sorption
reactor
• MP 3 at the stack for monitoring
compliance with limit values
121
Heat treatment is carried out in furnac-
es, in batch or continuous operation
(continuous belt) at 800-1200 °C, with
the processed parts discharged into a
quenching bath. Sealing of the furnace
(retort) vis-a-vis the conveyor belt,
insertion of the defined treatment gas
and monitoring the plant for leaks are
all key procedures for the plant to be
able to function correctly.
Use of gas analysis, e.g. for
• Monitoring the furnace atmosphere
• Analyzing the treatment gas and the
heating gas
4.4.6 Thermal surface treatment
Heat treatment is a collective term for
all processes in which workpieces,
primarily made of metal, are exposed
to temperature changes in order to
obtain certain characteristics in the
workpiece, specifically in its surface
(crystal structure). The composition of
the surrounding atmosphere is of vital
importance here:
• In some processes, surface oxida-
tion via O₂, CO₂ or H₂O needs to be
inhibited during heat treatment (tem-
pering, hardening). This is achieved
by maintaining a controlled, neutral
gas atmosphere, which has no oxi-
dizing or reducing effects.
• When it comes to other processes,
in addition to heat treatment, the
objective is to specifically influence
the surface properties via a specific
atmospheric composition. During
carburizing, for example, carbon
is implanted into the surface and,
during the carbonitriding process,
nitrogen is also. For certain applica-
tions, the removal of carbon from the
surface via decarbonization is also
required.
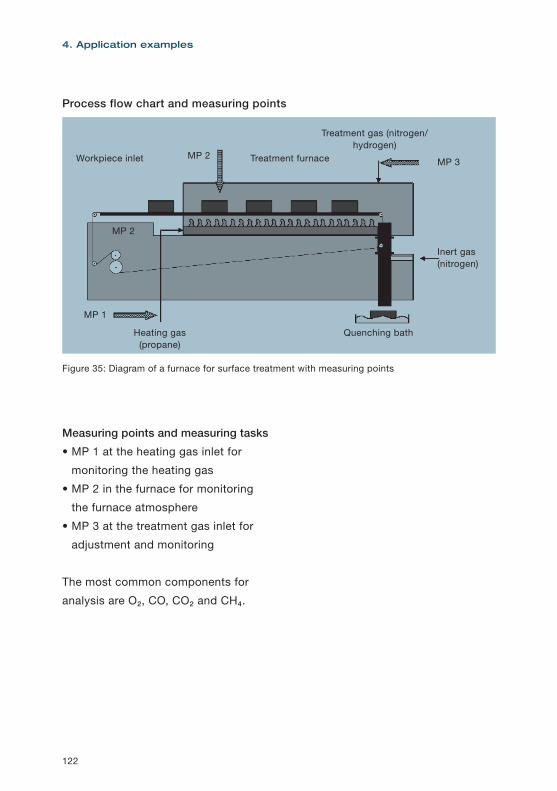
122
4. Application examples
Measuring points and measuring tasks
• MP 1 at the heating gas inlet for
monitoring the heating gas
• MP 2 in the furnace for monitoring
the furnace atmosphere
• MP 3 at the treatment gas inlet for
adjustment and monitoring
The most common components for
analysis are O₂, CO, CO₂ and CH₄.
Workpiece inlet Treatment furnace
Quenching bathHeating gas (propane)
Treatment gas (nitrogen/hydrogen)
MP 3
Inert gas(nitrogen)
MP 2
MP 1
MP 2
Process flow chart and measuring points
Figure 35: Diagram of a furnace for surface treatment with measuring points
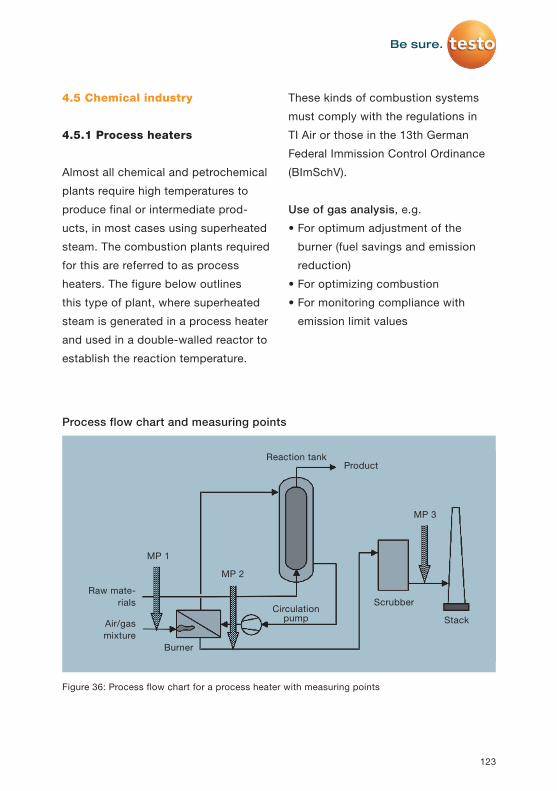
123
4.5 Chemical industry
4.5.1 Process heaters
Almost all chemical and petrochemical
plants require high temperatures to
produce final or intermediate prod-
ucts, in most cases using superheated
steam. The combustion plants required
for this are referred to as process
heaters. The figure below outlines
this type of plant, where superheated
steam is generated in a process heater
and used in a double-walled reactor to
establish the reaction temperature.
These kinds of combustion systems
must comply with the regulations in
TI Air or those in the 13th German
Federal Immission Control Ordinance
(BImSchV).
Use of gas analysis, e.g.
• For optimum adjustment of the
burner (fuel savings and emission
reduction)
• For optimizing combustion
• For monitoring compliance with
emission limit values
Reaction tankProduct
Scrubber
Air/gas mixture
Raw mate-rials
Circulation pump Stack
Burner
MP 1
MP 2
MP 3
Process flow chart and measuring points
Figure 36: Process flow chart for a process heater with measuring points
124
4. Application examples
lates obtained during further process-
ing into lighter hydrocarbons (cracking
units) and subsequently refine them
(reformer units). Both these processes
are carried out using catalysts at tem-
peratures around 500 °C or above, of-
ten using fluidized-bed processes. The
figure below outlines the distillation
columns, the discharge of finished and
raw products as well as the treatment
of flue gases (tail gas) via incineration
and cleaning.
Refineries are emission sources for
pollutants such as SO₂, NOX, H₂S,
particulate matter and many hydrocar-
bons. The emissions come from both
fugitive and stack (primarily com-
bustion processes) sources. Emis-
sion reduction is achieved by using
low-emission fuels, taking combustion
measures and flue gas cleaning plants.
For example, in Germany, refineries
and their individual plants must com-
ply with the regulations in TI Air, and
combustion plants specifically may
also fall within the scope of the 13th
BImSchV, depending on their thermal
output.
4.5.2 Refineries
Refineries (or to be more exact,
petroleum oil refineries) comprise a
number of processing plants in which
marketable petroleum products such
as gasoline, diesel oil, plastics, fibres,
detergents, solvents, along with many
others, are produced from crude oil
in several processing steps. These
processing stages all run at high
temperatures, which requires the use
of numerous combustion plants (see
4.5.1).
The processing of the crude oil starts
with distillation at atmospheric pres-
sure and approx. 350 °C, whereby
gasoline, petroleum and gas oil (diesel
fuel), for example, are generated; the
residue is made up of components
that can be utilized as heavy fuel oil or
further processed in a vacuum distil-
lation at approx. 400 °C, e.g. to create
lubricating oil or bitumen.
However, the great variety of products
required by the market cannot possibly
be realized via distillation alone. Spe-
cial processes are used for this; these
break down the heavy petroleum distil-
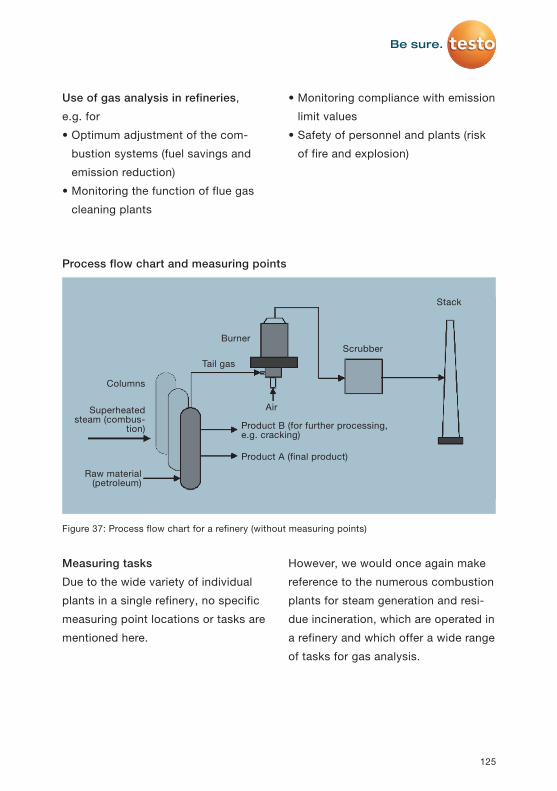
125
Measuring tasks
Due to the wide variety of individual
plants in a single refinery, no specific
measuring point locations or tasks are
mentioned here.
However, we would once again make
reference to the numerous combustion
plants for steam generation and resi-
due incineration, which are operated in
a refinery and which offer a wide range
of tasks for gas analysis.
Use of gas analysis in refineries,
e.g. for
• Optimum adjustment of the com-
bustion systems (fuel savings and
emission reduction)
• Monitoring the function of flue gas
cleaning plants
• Monitoring compliance with emission
limit values
• Safety of personnel and plants (risk
of fire and explosion)
Columns
Burner
Superheated steam (combus-
tion)
Raw material (petroleum)
Product B (for further processing, e.g. cracking)
Product A (final product)
Scrubber
Tail gas
Air
Stack
Process flow chart and measuring points
Figure 37: Process flow chart for a refinery (without measuring points)
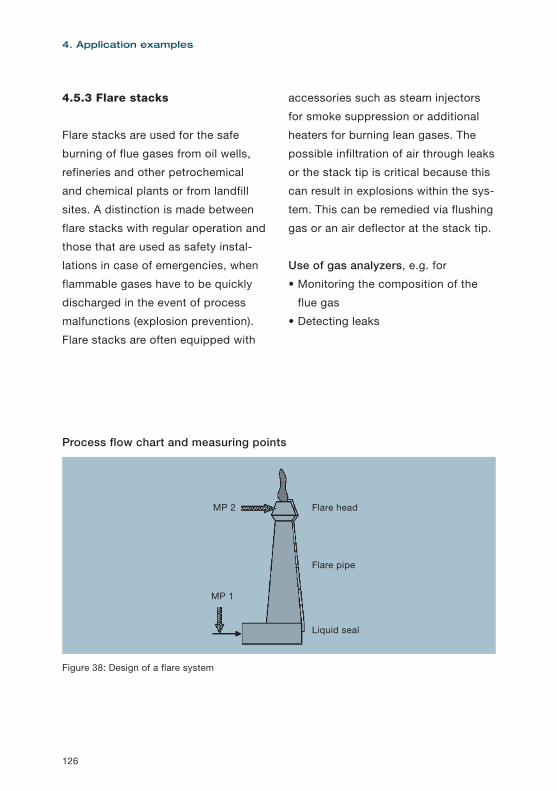
126
4. Application examples
4.5.3 Flare stacks
Flare stacks are used for the safe
burning of flue gases from oil wells,
refineries and other petrochemical
and chemical plants or from landfill
sites. A distinction is made between
flare stacks with regular operation and
those that are used as safety instal-
lations in case of emergencies, when
flammable gases have to be quickly
discharged in the event of process
malfunctions (explosion prevention).
Flare stacks are often equipped with
accessories such as steam injectors
for smoke suppression or additional
heaters for burning lean gases. The
possible infiltration of air through leaks
or the stack tip is critical because this
can result in explosions within the sys-
tem. This can be remedied via flushing
gas or an air deflector at the stack tip.
Use of gas analyzers, e.g. for
• Monitoring the composition of the
flue gas
• Detecting leaks
Flare head
Flare pipe
Liquid seal
MP 1
MP 2
Process flow chart and measuring points
Figure 38: Design of a flare system
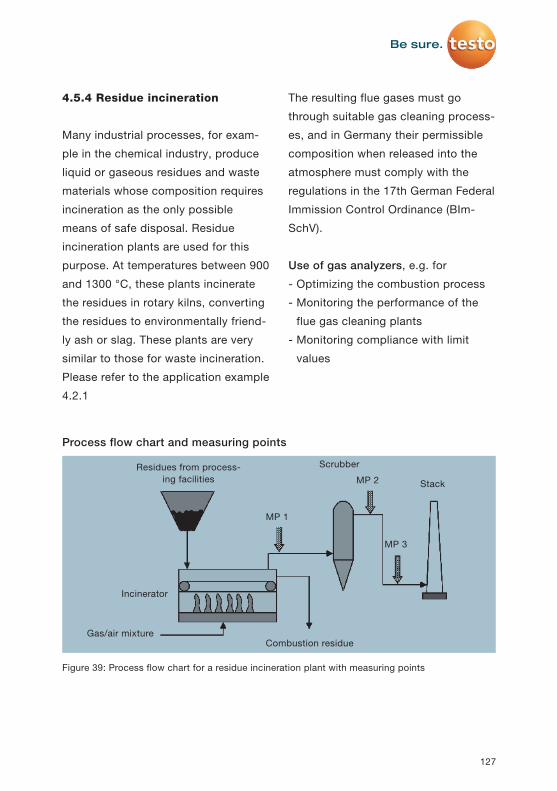
127
4.5.4 Residue incineration
Many industrial processes, for exam-
ple in the chemical industry, produce
liquid or gaseous residues and waste
materials whose composition requires
incineration as the only possible
means of safe disposal. Residue
incineration plants are used for this
purpose. At temperatures between 900
and 1300 °C, these plants incinerate
the residues in rotary kilns, converting
the residues to environmentally friend-
ly ash or slag. These plants are very
similar to those for waste incineration.
Please refer to the application example
4.2.1
The resulting flue gases must go
through suitable gas cleaning process-
es, and in Germany their permissible
composition when released into the
atmosphere must comply with the
regulations in the 17th German Federal
Immission Control Ordinance (BIm-
SchV).
Use of gas analyzers, e.g. for
- Optimizing the combustion process
- Monitoring the performance of the
flue gas cleaning plants
- Monitoring compliance with limit
values
Incinerator
Gas/air mixture
Stack
Residues from process-ing facilities
Scrubber
Combustion residue
MP 1
MP 2
MP 3
Process flow chart and measuring points
Figure 39: Process flow chart for a residue incineration plant with measuring points
128
4. Application examples
Measuring tasks
• MP 1 at the boiler for optimized
material supply and incineration
conditions
• MP 2 at or between the flue gas
cleaning installations for perfor-
mance monitoring
• MP 3 at the stack for monitoring
compliance with limit values
Information relating to this application
• The crude gas (prior to the cleaning
processes) often contains aggressive
associated components such as
HCl, HF and HCN. A heated sam-
pling system must be used for this.
Furthermore, the cross-sensitivity of
the SO₂ sensor to Cl₂ (80%) and HCl
(15%) must be taken into account.
• The fuel (residue) composition will
often vary depending on delivery.
This can also result in major fluctua-
tions in the readings.
• For measurements downstream of
the electrostatic precipitator, the
probe must be grounded.
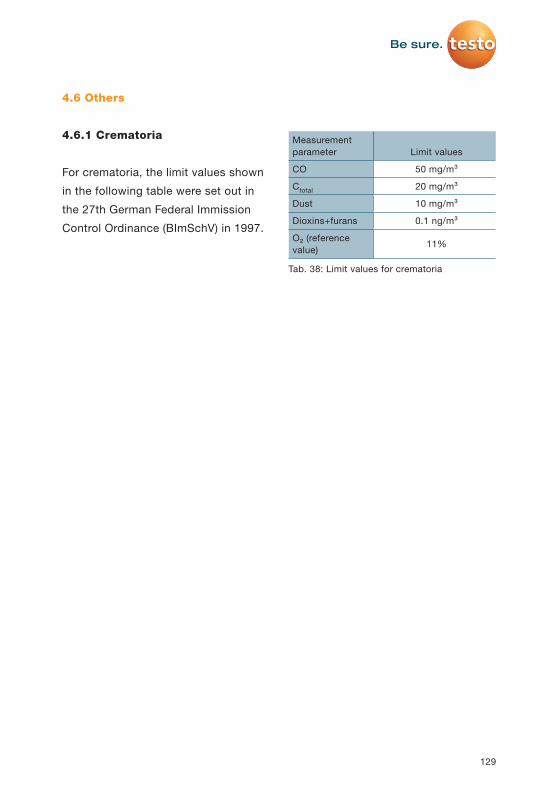
129
4.6 Others
4.6.1 Crematoria
For crematoria, the limit values shown
in the following table were set out in
the 27th German Federal Immission
Control Ordinance (BImSchV) in 1997.
Tab. 38: Limit values for crematoria
Measurement parameter Limit values
CO 50 mg/m³
Ctotal 20 mg/m³
Dust 10 mg/m³
Dioxins+furans 0.1 ng/m³
O₂ (reference value)
11%
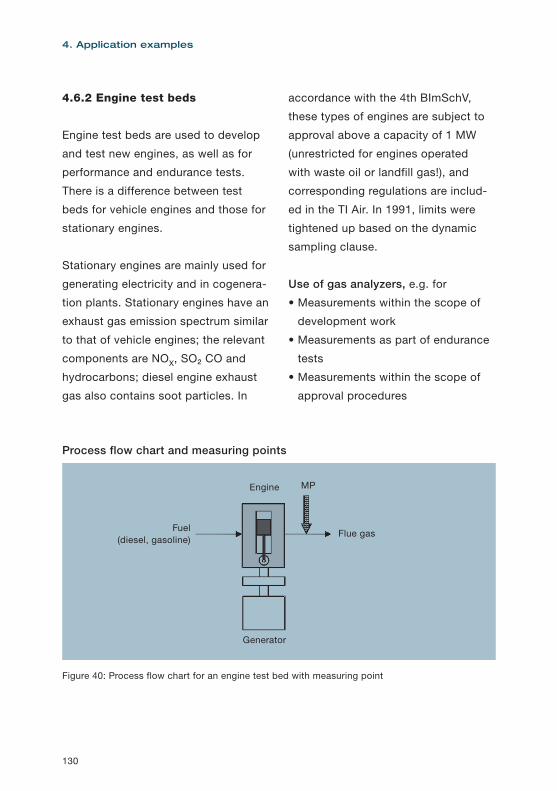
130
4. Application examples
accordance with the 4th BImSchV,
these types of engines are subject to
approval above a capacity of 1 MW
(unrestricted for engines operated
with waste oil or landfill gas!), and
corresponding regulations are includ-
ed in the TI Air. In 1991, limits were
tightened up based on the dynamic
sampling clause.
Use of gas analyzers, e.g. for
• Measurements within the scope of
development work
• Measurements as part of endurance
tests
• Measurements within the scope of
approval procedures
4.6.2 Engine test beds
Engine test beds are used to develop
and test new engines, as well as for
performance and endurance tests.
There is a difference between test
beds for vehicle engines and those for
stationary engines.
Stationary engines are mainly used for
generating electricity and in cogenera-
tion plants. Stationary engines have an
exhaust gas emission spectrum similar
to that of vehicle engines; the relevant
components are NOX, SO₂ CO and
hydrocarbons; diesel engine exhaust
gas also contains soot particles. In
Flue gasFuel (diesel, gasoline)
Generator
Engine MP
Process flow chart and measuring points
Figure 40: Process flow chart for an engine test bed with measuring point
5.1 The company
Electronic measurement of physi-
cal and chemical parameters with
portable instruments.
This has been the focus of the exper-
tise of the Testo Group of Compa-
nies in Lenzkirch in the Black Forest,
for over 60 years. Ever since it was
founded in 1957, Testo SE & Co.
KGaA, a medium-sized company, has
been involved in the development,
manufacture and worldwide distribu-
tion of probes and portable measuring
instruments for
• Temperature and humidity
• Flow and pressure
• Components in gases (gas analysis)
• Analytics in liquids (liquid analysis)
• Light, sound and speed
• Electrical measurement parameters
With this broad range of applications,
Testo is involved in numerous industries
such as air conditioning & refrigera-
tion, food, heating, power generation,
non-metallic minerals, chemistry and
process engineering, with tradespeople
and authorities as well as in industry.
All over the world, Testo has become a
highly respected partner thanks to the
performance, quality and user orienta-
tion of its products.
Portable measuring instruments differ
considerably from stationary instru-
ments which are permanently installed
at the place of measurement. The main
differences are obvious:
• For stationary instruments, the envi-
ronment for operating the instrument
can be optimally designed (air-condi-
tioned housing or analysis container,
stabilized power supply, etc.). and
the instruments themselves can be
developed to the highest levels of
accuracy, operational reliability and
ease of use without any significant
restrictions in terms of weight or
dimensions.
• Mobile devices, on the other hand,
are operated in harsh, constantly
changing environmental conditions.
5. Testo gas analysis technology
131
5. Testo gas analysis technology
In most cases, they have to manage
without a power supply and have
to meet the demands for porta-
bility in terms of their weight and
dimensions. This poses a particu-
lar challenge for development and
production.
In view of these conflicting constraints
when it comes to developing and in-
stalling the instruments, various fields
of application have been established,
particularly in the field of gas analysis
for portable and stationary instru-
ments, which complement each other
well and have thus far seldom over-
lapped.
However, through consistent develop-
ment work, Testo has recently suc-
ceeded in making portable devices so
powerful that they are able to advance
into some of the task areas of station-
ary devices, without sacrificing any
“portability”. Heated gas ducts, meas-
urement gas coolers, gas sampling
probes with automatic air purging,
instrument heating and cooling, and
the use of laptops and bus technol-
ogies for operation, data processing
and communication are all examples
of this progress.
Testo offers portable gas analyzers
which are approved for long-term
measurements and have successfully
passed demanding qualification tests
such as those for the 17th German
Federal Immission Control Ordinance
(BImSchV) in Germany or approv-
al tests in the USA. As a result, the
instruments have a considerably ex-
panded range of application compared
with earlier versions, which can best
be described as “measurements of
combustion exhaust gases in most
industrial sectors”. Section 4 of this
Guide provides numerous examples
of this.
The following pages offer an overview
of the current product range of Testo
gas analyzers. The aim is to illustrate
the variety of instruments and their
features, and thus help the user to
make the right choice for his or her
analysis task.
However, for detailed information
please always refer to the specific
instrument documentation.
132

ance for cross-sensitivities, reliable
processing of the measurement gas
and, last but not least, easy replace-
ment by the user.
Testo takes full account of the fast
pace of innovation in measuring tech-
nology! 70% of sales are from prod-
ucts that are younger than 3 years old.
This innovative capacity is coupled
with a marked focus on quality. Testo
was awarded the ISO 9001 quality
certificate back in 1992, and this was
reaffirmed in 1997.
The testo gas analyzers can be
characterized as follows:
• The instruments are either handheld
or the size of a small suitcase, still
with the option of transportation
manually or via a transport cart. The
instruments measure continuously.
• The product range is extensive and
includes instruments for all kinds of
purposes, with suitable equipment
and appropriate performance data.
There are instruments for determin-
ing individual gas components and
those for the simultaneous determi-
nation of multiple gas components.
5.2 Typical features
General information
For more than 30 years, Testo gas ana-
lyzers have proven their worth all over
the world in industry, with the author-
ities and in trade. More than 200,000
instruments are in use, testifying to the
performance of this modern measuring
technology on a daily basis.
Testo gas analyzers predominantly use
electrochemical measuring cells (Fig-
ure 41) to analyze gas components.
Through its own research and devel-
opment, Testo has made this low-cost
and space-saving technology, which is
nonetheless challenging with respect
to its operating conditions, available
for the application of routine meas-
uring technology in harsh operating
conditions. This applies to both the
measuring cells themselves and also
their environment, such as optimiza-
tion of the sample lines, correct allow-
133
Figure 41: Electrochemical sensor

5. Testo gas analysis technology
at installations subject to the 13th
and 17th German Federal Immission
Control Ordinance (BImSchV) and TI
Air (TA Luft).
• The qualification test in accordance
with DIN EN 50379-1 and -2 for
portable measuring instruments for
carrying out measurements at TI Air
plants. This test was also passed
unreservedly for the fuels coal, nat-
ural gas, digester gas, oil, wood and
household waste in these types of
plant: steam boilers, gas and diesel
engines, gas turbines and waste
incineration plants.
• In the USA, testo 350 meets the
performance specifications for
measuring NOX, CO and O₂ as well
as the requirements of the condition-
al test method CTM-030 and 034.
Moreover, it is approved as a backup
instrument in the event of a station-
ary measuring device malfunctioning.
The measuring accuracy according
to the TÜV test for DIN 33962 for all
components is less than 1.5% of the
MR final value (Table 39) and therefore
more than 3 times better than required
in DIN 33962 (5%).
• The devices have successfully
passed numerous certification and
suitability tests, including the test
known to be particularly demanding
with respect to the 17th German
Federal Immission Control Ordinance
(BImSchV).
• The instruments are remarkably
cost-effective compared to other gas
analyzers.
• The instruments are very easy to
maintain and are therefore inexpen-
sive to operate. Users can do a lot of
the maintenance themselves.
• The instruments come with very
detailed documentation. In addition,
Testo endeavours to support users
by providing specialist information
(e.g. this Guide).
Performance
The testo 350 gas analyzer success-
fully passed several qualification tests
which demonstrate the high level of
performance of the Testo instrument
technology:
• The qualification test for continuous
emission measurements was carried
out on a waste incineration plant
for the components NO, NO₂, SO₂,
CO and O₂. As a result, the testo
350 was certified unreservedly as
suitable for use in continuous oper-
ation (maintenance interval 14 days)
134
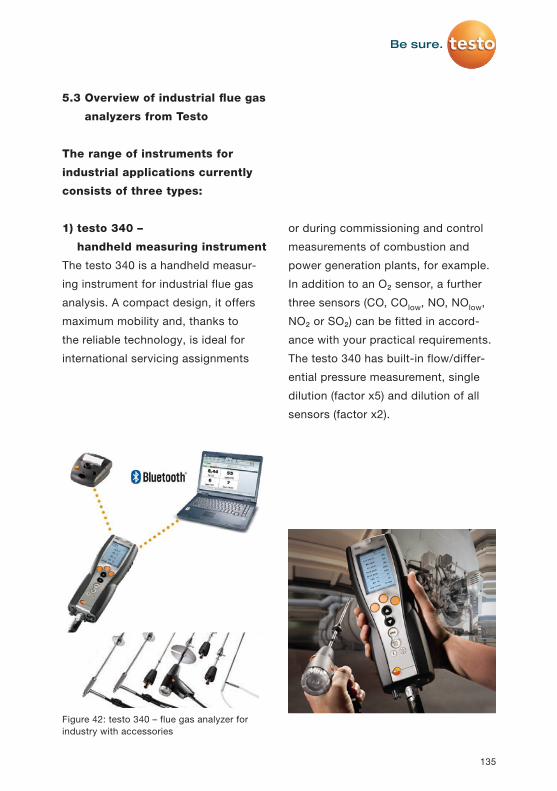
or during commissioning and control
measurements of combustion and
power generation plants, for example.
In addition to an O₂ sensor, a further
three sensors (CO, COlow, NO, NOlow,
NO₂ or SO₂) can be fitted in accord-
ance with your practical requirements.
The testo 340 has built-in flow/differ-
ential pressure measurement, single
dilution (factor x5) and dilution of all
sensors (factor x2).
5.3 Overview of industrial flue gas
analyzers from Testo
The range of instruments for
industrial applications currently
consists of three types:
1) testo 340 –
handheld measuring instrument
The testo 340 is a handheld measur-
ing instrument for industrial flue gas
analysis. A compact design, it offers
maximum mobility and, thanks to
the reliable technology, is ideal for
international servicing assignments
135
Figure 42: testo 340 – flue gas analyzer for industry with accessories
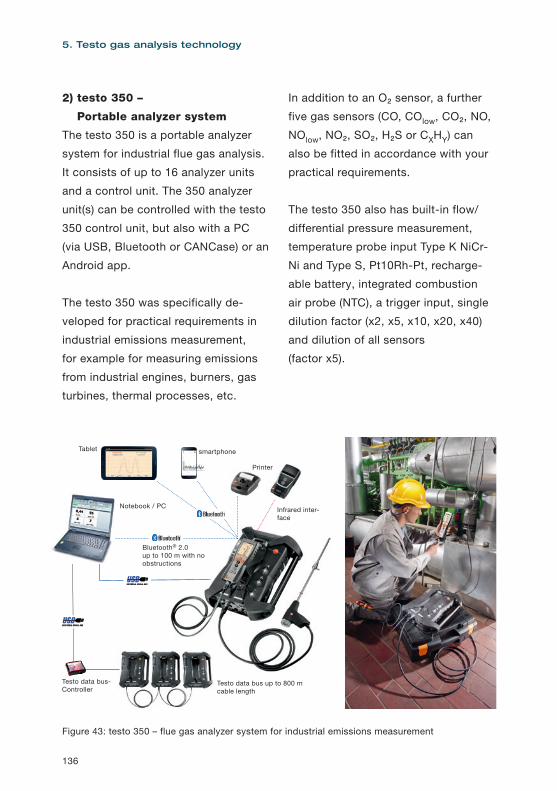
5. Testo gas analysis technology
In addition to an O₂ sensor, a further
five gas sensors (CO, COlow, CO₂, NO,
NOlow, NO₂, SO₂, H₂S or CXHY) can
also be fitted in accordance with your
practical requirements.
The testo 350 also has built-in flow/
differential pressure measurement,
temperature probe input Type K NiCr-
Ni and Type S, Pt10Rh-Pt, recharge-
able battery, integrated combustion
air probe (NTC), a trigger input, single
dilution factor (x2, x5, x10, x20, x40)
and dilution of all sensors
(factor x5).
2) testo 350 –
Portable analyzer system
The testo 350 is a portable analyzer
system for industrial flue gas analysis.
It consists of up to 16 analyzer units
and a control unit. The 350 analyzer
unit(s) can be controlled with the testo
350 control unit, but also with a PC
(via USB, Bluetooth or CANCase) or an
Android app.
The testo 350 was specifically de-
veloped for practical requirements in
industrial emissions measurement,
for example for measuring emissions
from industrial engines, burners, gas
turbines, thermal processes, etc.
136
Bluetooth® 2.0 up to 100 m with no obstructions
Testo data bus up to 800 m cable length
Printer
smartphone
Notebook / PC
Tablet
Testo data bus-Controller
Infrared inter-face
Figure 43: testo 350 – flue gas analyzer system for industrial emissions measurement
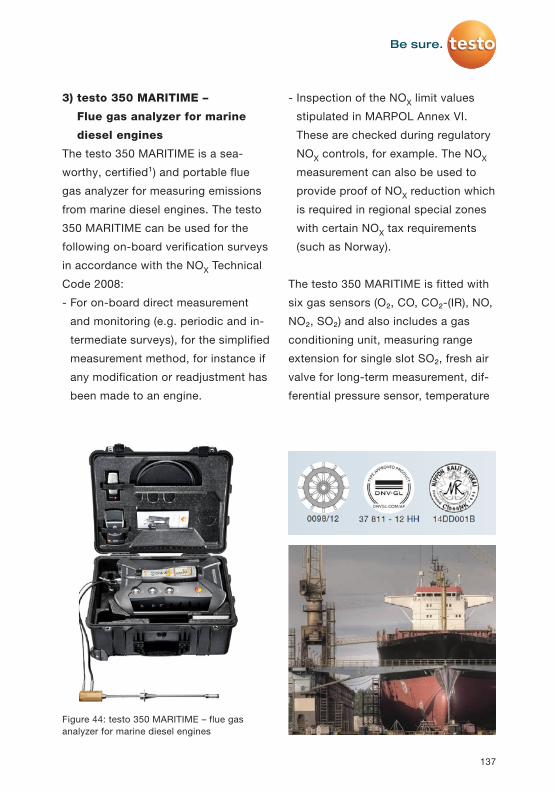
- Inspection of the NOX limit values
stipulated in MARPOL Annex VI.
These are checked during regulatory
NOX controls, for example. The NOX
measurement can also be used to
provide proof of NOX reduction which
is required in regional special zones
with certain NOX tax requirements
(such as Norway).
The testo 350 MARITIME is fitted with
six gas sensors (O₂, CO, CO₂-(IR), NO,
NO₂, SO₂) and also includes a gas
conditioning unit, measuring range
extension for single slot SO₂, fresh air
valve for long-term measurement, dif-
ferential pressure sensor, temperature
3) testo 350 MARITIME –
Flue gas analyzer for marine
diesel engines
The testo 350 MARITIME is a sea-
worthy, certified¹) and portable flue
gas analyzer for measuring emissions
from marine diesel engines. The testo
350 MARITIME can be used for the
following on-board verification surveys
in accordance with the NOX Technical
Code 2008:
- For on-board direct measurement
and monitoring (e.g. periodic and in-
termediate surveys), for the simplified
measurement method, for instance if
any modification or readjustment has
been made to an engine.
137
Figure 44: testo 350 MARITIME – flue gas analyzer for marine diesel engines
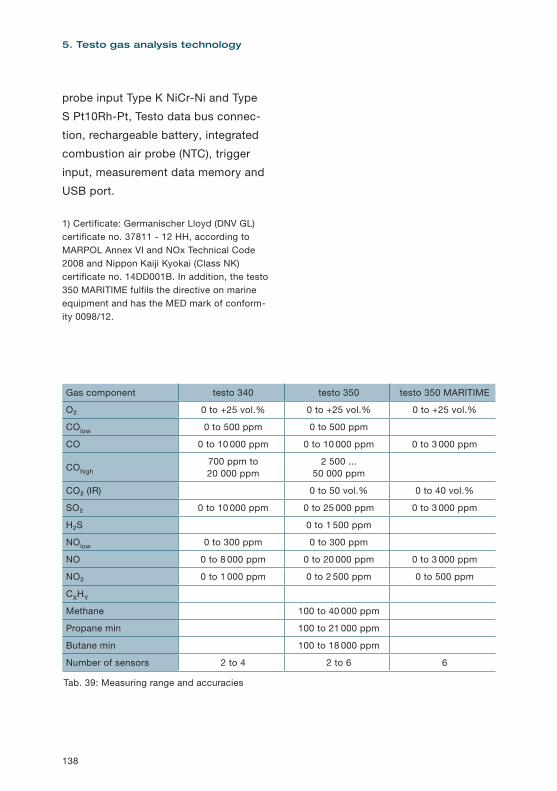
5. Testo gas analysis technology
probe input Type K NiCr-Ni and Type
S Pt10Rh-Pt, Testo data bus connec-
tion, rechargeable battery, integrated
combustion air probe (NTC), trigger
input, measurement data memory and
USB port.
1) Certificate: Germanischer Lloyd (DNV GL) certificate no. 37811 - 12 HH, according to MARPOL Annex VI and NOx Technical Code 2008 and Nippon Kaiji Kyokai (Class NK) certificate no. 14DD001B. In addition, the testo 350 MARITIME fulfils the directive on marine equipment and has the MED mark of conform-ity 0098/12.
138
Gas component testo 340 testo 350 testo 350 MARITIME
O₂ 0 to +25 vol.% 0 to +25 vol.% 0 to +25 vol.%
COlow 0 to 500 ppm 0 to 500 ppm
CO 0 to 10 000 ppm 0 to 10 000 ppm 0 to 3 000 ppm
COhigh700 ppm to 20 000 ppm
2 500 ... 50 000 ppm
CO₂ (IR) 0 to 50 vol.% 0 to 40 vol.%
SO₂ 0 to 10 000 ppm 0 to 25 000 ppm 0 to 3 000 ppm
H₂S 0 to 1 500 ppm
NOlow 0 to 300 ppm 0 to 300 ppm
NO 0 to 8 000 ppm 0 to 20 000 ppm 0 to 3 000 ppm
NO₂ 0 to 1 000 ppm 0 to 2 500 ppm 0 to 500 ppm
CXHY
Methane 100 to 40 000 ppm
Propane min 100 to 21 000 ppm
Butane min 100 to 18 000 ppm
Number of sensors 2 to 4 2 to 6 6
Tab. 39: Measuring range and accuracies
Accessories for sample gas
extraction and conditioning
Sample taking and preparation is
crucial to achieving accuracy and
consistency in the measurement
results and to the service life of the
measuring equipment. The process
needs to eliminate two sources of error
in particular:
• Damage to the measuring equipment
from components of the flue gas (ag-
gressive components and dirt) and
• Falsification of the measurement re-
sults due to non-defined elimination
of gas components through reac-
tions with the flue gas humidity prior
to the measurement
Please refer to the explanatory com-
ments in Section 3.1.2.
5.4 Overview of accessories
With the relevant accessories, the ana-
lyzer (handheld measuring instrument
or analyzer unit) becomes a function-
al measuring system. The following
table shows the different categories of
accessories, which include essential
sampling equipment, additional data
output options and enhancements and
supplements for operating in specific
conditions.
Some accessories are analyzer-specif-
ic, but others are universally appli-
cable. For details, please refer to the
instrument documentation.
139
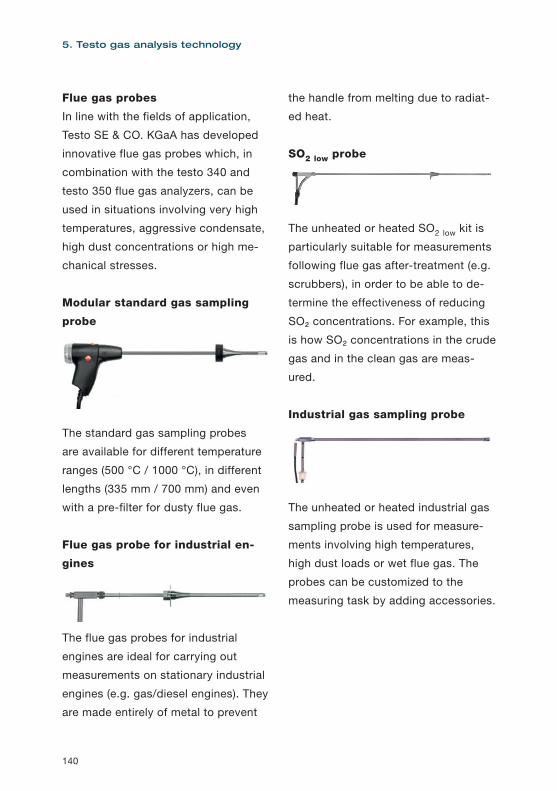
5. Testo gas analysis technology
the handle from melting due to radiat-
ed heat.
SO2 low probe
The unheated or heated SO2 low kit is
particularly suitable for measurements
following flue gas after-treatment (e.g.
scrubbers), in order to be able to de-
termine the effectiveness of reducing
SO₂ concentrations. For example, this
is how SO₂ concentrations in the crude
gas and in the clean gas are meas-
ured.
Industrial gas sampling probe
The unheated or heated industrial gas
sampling probe is used for measure-
ments involving high temperatures,
high dust loads or wet flue gas. The
probes can be customized to the
measuring task by adding accessories.
Flue gas probes
In line with the fields of application,
Testo SE & CO. KGaA has developed
innovative flue gas probes which, in
combination with the testo 340 and
testo 350 flue gas analyzers, can be
used in situations involving very high
temperatures, aggressive condensate,
high dust concentrations or high me-
chanical stresses.
Modular standard gas sampling
probe
The standard gas sampling probes
are available for different temperature
ranges (500 °C / 1000 °C), in different
lengths (335 mm / 700 mm) and even
with a pre-filter for dusty flue gas.
Flue gas probe for industrial en-
gines
The flue gas probes for industrial
engines are ideal for carrying out
measurements on stationary industrial
engines (e.g. gas/diesel engines). They
are made entirely of metal to prevent
140
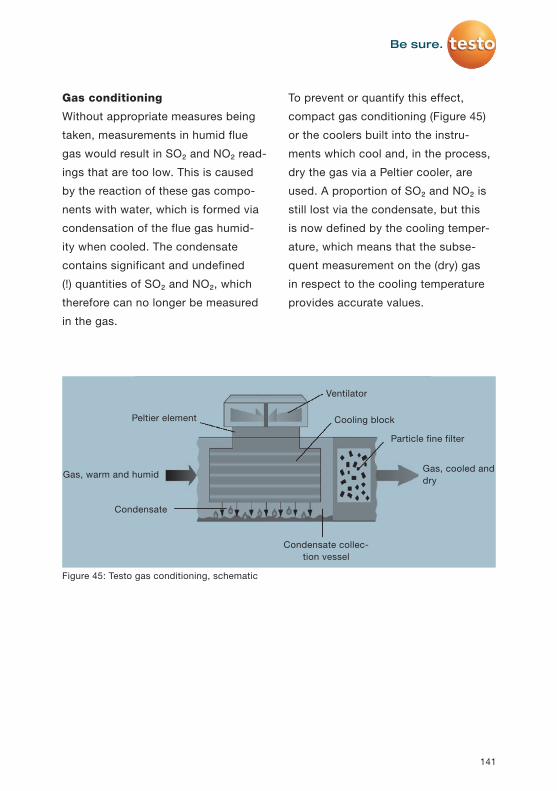
To prevent or quantify this effect,
compact gas conditioning (Figure 45)
or the coolers built into the instru-
ments which cool and, in the process,
dry the gas via a Peltier cooler, are
used. A proportion of SO₂ and NO₂ is
still lost via the condensate, but this
is now defined by the cooling temper-
ature, which means that the subse-
quent measurement on the (dry) gas
in respect to the cooling temperature
provides accurate values.
Gas conditioning
Without appropriate measures being
taken, measurements in humid flue
gas would result in SO₂ and NO₂ read-
ings that are too low. This is caused
by the reaction of these gas compo-
nents with water, which is formed via
condensation of the flue gas humid-
ity when cooled. The condensate
contains significant and undefined
(!) quantities of SO₂ and NO₂, which
therefore can no longer be measured
in the gas.
141
Peltier element
Gas, warm and humid
Condensate
Ventilator
Condensate collec-tion vessel
Cooling block
Particle fine filter
Gas, cooled and dry
Figure 45: Testo gas conditioning, schematic
5. Testo gas analysis technology
System solutions
A complete system for sample gas
extraction and conditioning consists of
a gas sampling probe, gas lines (tubes
or hoses), coarse and fine filters and a
cooling unit. Testo has coordinated its
sampling accessories, so that perfect
system solutions can be created by
combining the modules. Some of the
instruments are already equipped with
sample conditioning units, e.g. the
testo 350 with its built-in measurement
gas cooler.
Special gas pipes
The formation of condensate and thus
the influence on the concentrations of
SO₂ and NO₂ also depend on the time
that is available for a reaction. High
flow velocities have a positive effect
here. With this in mind, testo has now
undertaken a patented new develop-
ment in which the hose no longer has
to be heated. The hose conducting
the gas has a small diameter, which
creates high velocities. The material
used is PTFE, which is known for its
very low absorption.
142

Testo’s head office
Testo SE & Co. KGaA
Testo-Strasse 1
D-79853 Lenzkirch, Germany
Phone: +49 7653 681-700
Fax: +49 7653 681-701
www.testo.com
You will find the contact details for our
subsidiaries and agencies all over the
world at www.testo.com
143
144
Index
Electrochemical sensors 70
Emission limit value 41
Emission, emission control 29, 38
Emissions monitoring (USA) 48
Energy balance 24
Energy content 6
Engine test beds 130
Explosive limit 37
Extractive devices 66
Flame ionization method (FID) 68, 77
Flammable limit 37
Flare stacks 126
Flow velocity 27, 142
Flue gas 8, 19ff
Flue gas cleaning 50
Flue gas loss 23ff
Fluidized-bed combustion 52
Forms of energy 5
Fuel, also composition 10
Gas analyzer, general 65ff
Gas analyzers (Testo) 135ff
Gas combustion plant 82ff
Gas sampling probes 140
Gas turbine plant 84ff
Gas volume 16
Glass production 106ff
Greenhouse effect 7
Gross calorific value, condensing boiler 23ff
Heat effect method 37, 75ff
Heated lines 27ff
Humidity content 17, 26, 62
Humidity measurement 78
Hydrocarbons 21, 76
Hydrogen sulphide 21
Ideal combustion 11
Air ratio, excess air 11ff, 14
Aluminium production 119ff
Ammonia 22, 37, 52
Applications 79ff
BImSchG, BImSchV 39ff
Brick production 104ff
Calibration 64
Carbon oxides 19ff
Cement production 100ff
Ceramic/porcelain production 102ff
Chemiluminescence method 74
Clean Air Act 38, 48
Coal-fired power plant 88ff
Cogeneration plant 91
Coking plants 117ff
Combined cycle power plant 93
Combustion 5ff
Combustion air 8, 11, 16
Combustion chart 15, 31
Combustion optimization 31ff
Combustion plants 8ff
Concentration specifications 54ff
Condensate 26
Continuous measurement 43ff
Conversions, of concentrations 55ff
Cremation 47
Cross-sensitivity 62ff
Dedusting process 51
Denitrification methods 52
Desulphurization process 53
Dew point 26ff
Dilution effect 17
Dust 8ff, 22
Economic efficiency 12
Efficiency 23ff
145
Sintering plants 111
Small combustion plants 41
Solid fuel combustion system 80ff
Solid-state electrolyte 68, 70, 77
Staged air supply 20, 52
Standard conditions 55
Steel production 115ff
Stoichiometric conditions 11, 16
Sulphur dioxide 20
Surface treatment 36, 121
Test gas 64
Testo, instrument data 138
Testo, overview of accessories 139
Testo, overview of instruments 135ff
Testo, the company 131
Thermal afterburning 98
Thermal conductivity method 75
Thermal surface treatment 36, 121
TI air 41ff
Total carbon (Total C) 21
USA, legislation 48ff
UV method 74
Waste incineration 21, 44, 94ff
Waste pyrolysis 97ff
Zero gas 64
Zirconium dioxide probe 77
Immission 38
Individual measurement 43
Industrial combustion plant 35
Infrared method 73
In-situ devices 77
Insufficient air 15, 31ff
Iron production 113ff
Large combustion plants 45
Lime production 109ff
MAC value 19ff
Measuring accuracy, Testo 138
Measuring gas cooler 27, 61, 69, 142
Measuring principles for gases 70ff
Net calorific value 23
Nitrogen, nitrogen oxides 19ff
Oil-fired installation 86ff
Ore processing 111
Oxidation 7
Paramagnetic method 75
Peltier cooler 28, 141
Portable devices 69
ppm 54ff
Process analysis 65
Process control 34
Process heater 34, 123
Qualification test 47, 132ff
Reducing atmosphere 13
Reference value 16, 18
Refineries 124ff
Residue incineration 127
Safety measurements 37
Sampling 60ff
SCR process 20, 22, 52
Sensor, sensor system 65
Siegert formula 25

www.testo.com
Sub
ject
to
chan
ge w
ithou
t no
tice.
29
80 x
xxx/
TT/0
1.20
18
Testo SE & Co. KGaATesto-Strasse 1, D-79853 Lenzkirch, Germany
Phone +49 7653 681-700Fax +49 7653 681-701
e-mail [email protected]


