Embed Size (px)
Citation preview
Oncogene (2021) 40:2355–2366https://doi.org/10.1038/s41388-021-01707-7
ARTICLE
PPAR-gamma induced AKT3 expression increases levels ofmitochondrial biogenesis driving prostate cancer
Laura C. A. Galbraith 1,2● Ernest Mui1 ● Colin Nixon1
● Ann Hedley1 ● David Strachan1● Gillian MacKay1 ●
David Sumpton1● Owen J. Sansom 1,2
● Hing Y. Leung 1,2● Imran Ahmad 1,2
Received: 1 October 2019 / Revised: 5 February 2021 / Accepted: 9 February 2021 / Published online: 2 March 2021© The Author(s) 2021. This article is published with open access
AbstractPeroxisome Proliferator-Activated Receptor Gamma (PPARG) is one of the three members of the PPAR family oftranscription factors. Besides its roles in adipocyte differentiation and lipid metabolism, we recently demonstrated anassociation between PPARG and metastasis in prostate cancer. In this study a functional effect of PPARG on AKT serine/threonine kinase 3 (AKT3), which ultimately results in a more aggressive disease phenotype was identified. AKT3 haspreviously been shown to regulate PPARG co-activator 1 alpha (PGC1α) localisation and function through its action onchromosome maintenance region 1 (CRM1). AKT3 promotes PGC1α localisation to the nucleus through its inhibitoryeffects on CRM1, a known nuclear export protein. Collectively our results demonstrate how PPARG over-expression drivesan increase in AKT3 levels, which in turn has the downstream effect of increasing PGC1α localisation within the nucleus,driving mitochondrial biogenesis. Furthermore, this increase in mitochondrial mass provides higher energetic output in theform of elevated ATP levels which may fuel the progression of the tumour cell through epithelial to mesenchymal transition(EMT) and ultimately metastasis.
Introduction
Prostate cancer (PC) is the most common cancer in adultmales in the developed world and the second leading causeof cancer deaths [1]. It has long been known that PC pro-gression is dependent on androgens [2] and as such manytreatments centre around inhibition of androgens and theandrogen receptor. However, some PCs develop resistanceto these treatments, developing a “castrate resistant” state,which ultimately results in metastasis and death [3]. It is thiscohort of patients that have the greatest unmet need, and forwhich new therapies are desperately sought.
In a transposon-based Sleeping- Beauty genetic screen [4],PPARG was identified as being expressed at elevated levelsin advanced, metastatic PC. Further analysis of prostatetumour lysates revealed that up-regulation of PPARG cor-related with increased levels of its downstream metaboliceffectors such as Fatty acid synthase (FASN), acetyl-CoAcarboxylase (ACC) and ATP citrate lyase (ACLY) [4, 5].Phenotypically this was associated with increased lung andlymph-nodes metastasis, suggesting a way of stratifyingpatients with PPARG or FASN activation to targetedtreatments for their aggressive disease. In this study wefurther investigate the mechanism by which PPARG drivesaggressive PC by identifying a link between PPARG andelevated mitochondrial biogenesis through its effects onAKT3, and PGC1α.
PGC1α is a well-known regulator of mitochondrial bio-genesis [6] and is highly expressed in tissues where energydemand is high [7, 8]. As its name suggests PGC1α is a co-factor for PPARG [8], and as well as being the masterregulator for mitochondrial biogenesis, also affects thetranscription of key genes required for oxidative metabo-lism [9], consequently affecting mitochondrial function andATP output.
* Imran [email protected]
1 Cancer Research UK Beatson Institute, Switchback Road,Bearsden, Glasgow G61 1BD, UK
2 Institute of Cancer Sciences, University of Glasgow, Bearsden,Glasgow G61 1QH, UK
Supplementary information The online version containssupplementary material available at https://doi.org/10.1038/s41388-021-01707-7.
1234
5678
90();,:
1234567890();,:
AKT3 is one of three isoforms of AKT (AKT1 &AKT2 being the other isoforms) that regulate a numberof diverse cellular processes including metabolism,proliferation, cell survival, growth and angiogenesis[10]. Each isoform performs a number of distinct func-tions that cannot be compensated for by another [11, 12].AKT3 has been shown to affect mitochondrial massand function [13, 14], by influencing the localisationof PGC1α [14], which is fundamental for its role in mito-chondrial biogenesis [15]. Mechanistically, AKT3 affectsthe stability of CRM1, the major nuclear export protein,which exports PGC1α from the nucleus to the cytoplasm[15].
In this study we identify a previously unknown role forPPARG in up-regulating AKT3, which promotes PGC1αlocalisation to the nucleus and consequently increasesmitochondrial mass and function, increasing ATP levels,tumour growth and metastasis.
Methods
Orthograft prostate cancer model
For prostate orthograft animal experiments, CD1-nude malemice were obtained from Charles River Research Models &Services (UK) at 6–8 weeks of age and cells injected intothe anterior prostate lobes. Further details given in supple-mentary methods.
RNA-seq
Quality of the purified RNA was tested on an Agilent 2200Tapestation using RNA screentape. Libraries for clustergeneration and DNA sequencing were prepared followingan adapted method from Fisher et al. 2011 [16] usingIllumina TruSeq Stranded mRNA LT Kit. Quality andquantity of the DNA libraries was assessed on an Agilent2200 Tapestation (D1000 screentape) and Qubit (ThermoFisher Scientific) respectively. The libraries were run onthe Illumina Next Seq 500 using the High Output 75cycles kit (2x36cycles, paired end reads, single index).Quality checks on the raw RNASeq data files were doneusing fastqc version 0.10.1 [17] and fastq_screen version0.4.2 [18]. RNASeq reads were aligned to the GRCh38[19] version of the human genome using tophat2 version2.0.13 [20] with Bowtie version 2.4.4.0 [21]. Expressionlevels were determined and statistically analysed by acombination of HTSeq version 0.9.1 [22], the R 3.3.3environment, utilising packages from the Bioconductordata analysis suite and differential gene expression ana-lysis based on the negative binomial distribution using theDESeq2 [23].
Statistical analysis
Statistical analyses, with the exception of that described forthe RNA-seq data, was undertaken using GraphPad Prismv8.1.1(224). The tests used comprised of un-paired twotailed t-tests, Mann–Whitney, ratio t-test, Spearman corre-lation and Two and One-way Anova, with post tests formultiple comparisons (detailed in figure legends). Allexperiments (with the exception of those involving mice)were performed in biological replicates, with technicalreplicates for each experiment given in the methods. Formouse experiments six mice were used for each cell linederived clone. For technical reasons only five mice wereavailable at endpoint for mice from the KO1 and KO2cohorts.
Results
PPARG is required for in vivo tumour growth
Using the established PC cell lines DU145 and PC3-M,stable cell lines exhibiting over-expression or knockout ofPPARG were generated. In PC3-M cells, which expresshigh endogenous levels of PPARG [4], knockdown ofPPARG was achieved using CRISPR/CAS9 technology.Three clones were selected, two with almost completeknockdown of PPARG (KO1 and KO2) and one withpartial knockdown (KO8) in addition to the non-targetingcontrol (NTS), verified by immunoblot and qPCR (Fig. 1A, B).CD1 nude mice were orthotopically implanted with PC3-MPPARG KO clones and NTS control into the anteriorprostates of male mice. Mice implanted with NTS controlproduced tumours that were significantly bigger than thosefrom KO clones (Fig. 1C, D). Mice implanted with KOclones produced very small or no tumour at all. Immuno-histochemistry (IHC) analysis on those KO tumours that diddevelop showed that all expressed PPARG (Fig. 1E andSupplementary Fig. 1A). In addition the levels of Ki67,indicating proliferating cells, and downstream effector ofPPARG, FASN [24], were also similar to NTS control inthese tumours, with FASN expression levels correlatingwith PPARG (Supplementary Fig. 1B–D). The PPARGCRISPR construct used to generate the clones also con-tained the gene for red fluorescent protein (RFP), thus IHCfor RFP could be used to determine if the tumours that haddeveloped had derived from cells still expressing this con-struct. None of the tumours derived from KO1, 2 and 8implanted cells expressed RFP (Supplementary Fig. 1E).Furthermore RNA-scope in situ hybridisation for humanpeptidyl Isomerase B (HuPPIB), demonstrated detectablelevels in the NTS and all K0 tumours (SupplementaryFig. 1F, G), suggesting that in the tumours arose from a
2356 L. C. A. Galbraith et al.
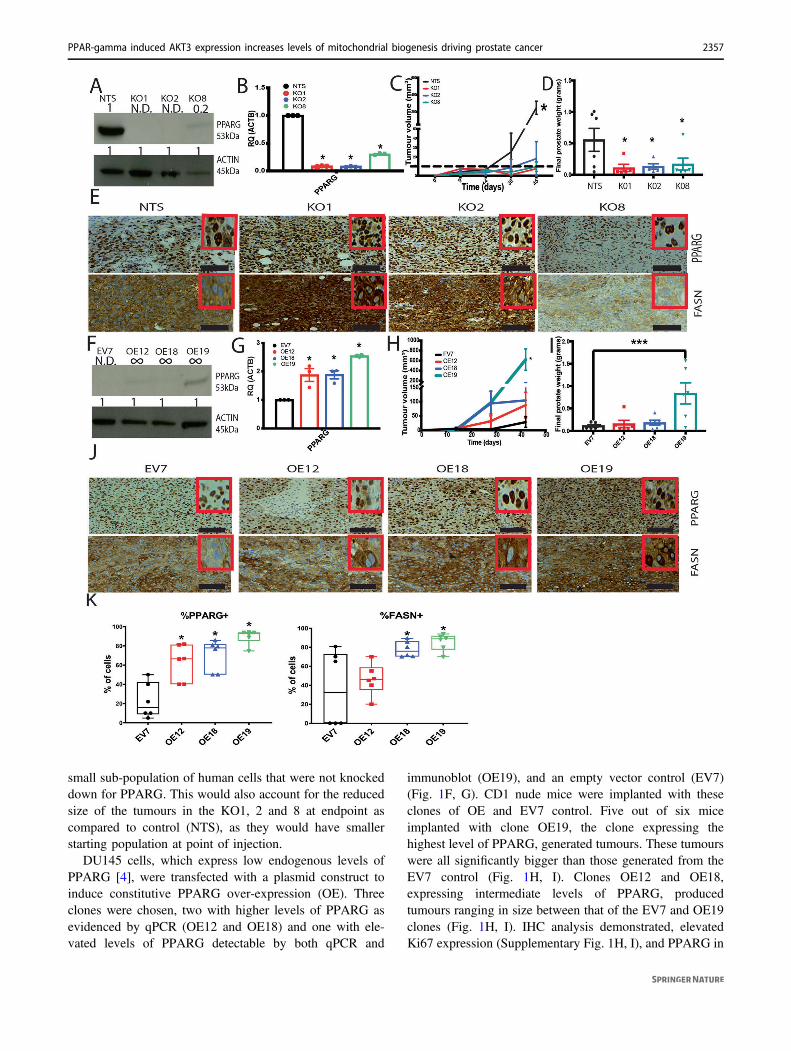
small sub-population of human cells that were not knockeddown for PPARG. This would also account for the reducedsize of the tumours in the KO1, 2 and 8 at endpoint ascompared to control (NTS), as they would have smallerstarting population at point of injection.
DU145 cells, which express low endogenous levels ofPPARG [4], were transfected with a plasmid construct toinduce constitutive PPARG over-expression (OE). Threeclones were chosen, two with higher levels of PPARG asevidenced by qPCR (OE12 and OE18) and one with ele-vated levels of PPARG detectable by both qPCR and
immunoblot (OE19), and an empty vector control (EV7)(Fig. 1F, G). CD1 nude mice were implanted with theseclones of OE and EV7 control. Five out of six miceimplanted with clone OE19, the clone expressing thehighest level of PPARG, generated tumours. These tumourswere all significantly bigger than those generated from theEV7 control (Fig. 1H, I). Clones OE12 and OE18,expressing intermediate levels of PPARG, producedtumours ranging in size between that of the EV7 and OE19clones (Fig. 1H, I). IHC analysis demonstrated, elevatedKi67 expression (Supplementary Fig. 1H, I), and PPARG in
PPAR-gamma induced AKT3 expression increases levels of mitochondrial biogenesis driving prostate cancer 2357
all tumours derived from the OE clones as compared toEV7. FASN levels were also significantly elevated in clonesOE18 and OE19 as compared to EV7 and observed tocorrelate with the increased PPARG levels (Fig. 1J, K andSupplementary Fig. 1J).
Together this data suggests an increase in proliferationand lipid metabolism regulated by PPARG, as previouslyobserved [4]. There appears to be a requirement forPPARG in tumour growth and development in vivo, as noPPARG negative tumours developed, it suggests that notonly is PPARG able to accelerate tumour growth anddevelopment, but it may be essential for the tumourestablishment.
Metabolic effects of PPARG in prostate cancer
FASN, a downstream effector of PPARG [24], was elevatedin OE orthotopic tumour samples (Fig. 1J, K), suggesting a
metabolic effect of PPARG. To further investigate thisSeahorse bioscience stress test assays, measuring cellularoxygen consumption, were performed.
PC3-M KO clones demonstrated a significantly reducedoxygen consumption rate (OCR), for all three KO clones ascompared to NTS control, with KO1 and KO2 being sig-nificantly different to NTS in all phases of the assay(Fig. 2A, B). Furthermore, there appeared to be a “dose”dependent effect of PPARG on OCR. The partial knock-down clone KO8 displayed an OCR between that of theNTS control (on average 20% less than NTS) and completeknockouts KO1 and KO2 which had even lower OCR (onaverage 50% less than NTS). The DU145 PPARG over-expressing (OE) cells revealed no reciprocal advantage withincreased PPARG levels (Fig. 2C, D).
A change in OCR results from differences in mito-chondrial function and/or mass. Therefore, IHC was per-formed on the OE and EV7 derived tumours for VDAC1, amitochondrial voltage dependant anion channel, used hereas a surrogate measure for mitochondrial mass (Fig. 2E). Itwas observed that VDAC1 was significantly elevated inOE18 and OE19 as compared to EV7 (Fig. 2F), indicatingan increase in mitochondrial mass. To determine if thisincreased mass was affecting metabolic output 13C labelledglucose metabolomics was performed on OE cells grown in3D spheroid culture. A significant increase in ATP wasobserved in the OE19 clones as compared to EV7 (Fig. 2G),indicating elevated energy output concurrent with the ele-vated mitochondrial mass observed. To find the linkbetween elevated mitochondrial mass, ATP production andPPARG; RNA-Seq (of orthograft samples) was undertaken(using De-Seq2 method, details in material and methods).From this we identified the top ten significant hits (Fig. 2H,full list given in Supplementary Fig. 2A). Within the topten, and with a fold change of 1.8 and −7.3 for EV7 vsOE19 and NTS vs K02 respectively, AKT3 appeared aninteresting candidate given its presumptive role in mito-chondrial biogenesis through CRM1 and PGC1α andmetabolism [13–15, 25]. This result was validated by RNA-scope in situ hybridisation confirming statistically sig-nificant elevated AKT3 mRNA expression in DU145 OEtumours, compared to EV7 tumours (Fig. 2I, J). Interest-ingly, given initial immunoblotting for PPARG (Fig. 1A,F), AKT3 levels appeared higher in OE19 as compared toNTS. When PPARG expression from in vivo experiments iscompared, it does in fact appear that OE19 tumours havesignificantly higher PPARG expression than NTS tumours,which could account for the elevated AKT3 levels observedin OE19 tumours (Supplementary Fig. 1K).
Further validation of PPARG’s effect on this pathwaywas established through immunoblot of tumour lysatesprobing for PPARG, AKT3, PGC1α, CRM1 and VDAC1(Fig. 2K and Supplementary Fig. 2B, C). Tumours derived
Fig. 1 PPARG expression is necessary for tumour developmentin vivo. A Immunoblot of PC3-M CRISPR knockdown of PPARGclones (KO1, 2 & 8) and Scrambled control (Scrm), representativeimage of three experiments. Values above each band indicate densi-tometry value of band as normalised to Actin loading control andcompared to first band (NTS), N.D not detected. B qPCR analysis forPPARG levels in clones KO1, 2 & 8, and control Scrm, three inde-pendent experiments and three technical replicates per experiment,error bars show SEM. C Ultrasound measurement of tumour size (KOclones & Scrm control) over time in days, ‘*’ denotes statistical sig-nificance p ≤ 0.05 as determined by 2-way Anova and Dunnett’smultiple comparison test. D Final tumour weight (KO clones & Scrmcontrol) upon necropsy, ‘*’ denotes statistical significance p ≤ 0.05 asdetermined by one-way Anova and Holm-Sidaks multiple comparisontest. For both C and D graphs represent 23 mice, at least 5 mice percell line; ultrasound performed every two weeks until endpoint. Allmice taken at the same time when the first mouse reachedendpoint. E IHC images of PPARG KO derived orthograft tumours.Representative images from PPARG KO tumours stained for PPARGand FASN, scale bar shows 100 μm. F Immunoblot of DU145 PPARGover-expressing clones (OE12, 18 & 19) and control (EV7), repre-sentative image of three independent experiments. Values above eachband indicate densitometry value of band as normalised to Actinloading control and compared to first band (EV7), N.D not detected. GqPCR analysis for PPARG levels in OE12, 18 & 19 and control EV7qPCR three independent experiments and three technical replicates perexperiment, error bars show SEM. H Ultrasound measurement oftumour size over days in OE clones & EV7 control, statistical sig-nificance is denoted by * where p ≤ 0.05 as determined by 2-wayAnova and Dunnetts multiple comparison test. I Final tumour weightupon necropsy in OE clones & EV7 control. Statistical significance isdenoted by * where p ≤ 0.05 determined by one-way Anova and Holm-Sidak’s multiple comparisons test. For H and I graphs represent 24mice, 6 mice per cell line, ultrasound performed every two weeks untilendpoint. All mice were taken at the same time when the first mousereached endpoint. J IHC images of PPARG OE derived orthografttumours. Representative images from tumours stained for PPARG andFASN, scale bar shows 100 μm. K IHC image analysis for PPARGand FASN. Graph displays average percentage positive cells over atleast three samples per clone with error bars giving SEM. Statisticalsignificance, where found, denoted by * with p ≤ 0.05 determined byMann–Whitney.
2358 L. C. A. Galbraith et al.
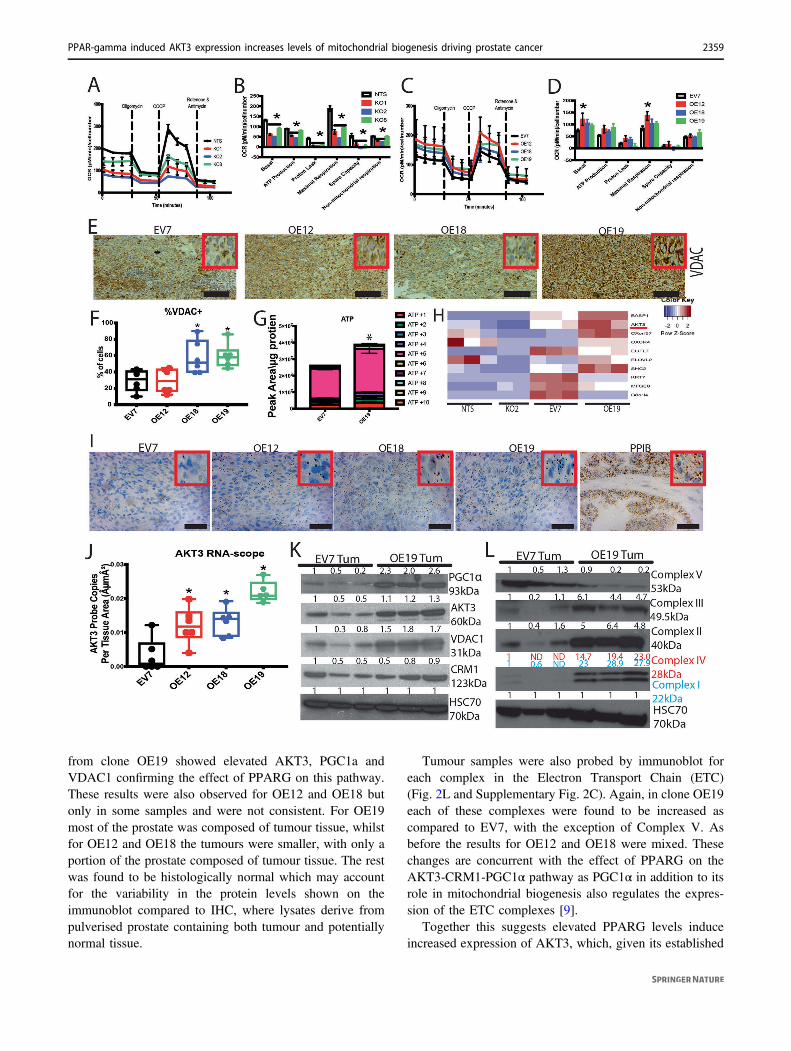
from clone OE19 showed elevated AKT3, PGC1a andVDAC1 confirming the effect of PPARG on this pathway.These results were also observed for OE12 and OE18 butonly in some samples and were not consistent. For OE19most of the prostate was composed of tumour tissue, whilstfor OE12 and OE18 the tumours were smaller, with only aportion of the prostate composed of tumour tissue. The restwas found to be histologically normal which may accountfor the variability in the protein levels shown on theimmunoblot compared to IHC, where lysates derive frompulverised prostate containing both tumour and potentiallynormal tissue.
Tumour samples were also probed by immunoblot foreach complex in the Electron Transport Chain (ETC)(Fig. 2L and Supplementary Fig. 2C). Again, in clone OE19each of these complexes were found to be increased ascompared to EV7, with the exception of Complex V. Asbefore the results for OE12 and OE18 were mixed. Thesechanges are concurrent with the effect of PPARG on theAKT3-CRM1-PGC1α pathway as PGC1α in addition to itsrole in mitochondrial biogenesis also regulates the expres-sion of the ETC complexes [9].
Together this suggests elevated PPARG levels induceincreased expression of AKT3, which, given its established
PPAR-gamma induced AKT3 expression increases levels of mitochondrial biogenesis driving prostate cancer 2359
functional link to PGC1α and mitochondrial biogenesis [15]would explain the increased mitochondrial mass and ATPlevels observed upon PPARG over-expression. Thisincrease in ATP levels may fuel the increase in growth andmetastasis observed upon increased levels of PPARG.
PPARG contributes to epithelial to mesenchymaltransformation
When culturing the KO and OE clones in 2D conditions noobvious effects of altered PPARG expression were observed,however striking differences were observed when growingthem as 3D spheroids. The EV7 clones grew as uniform
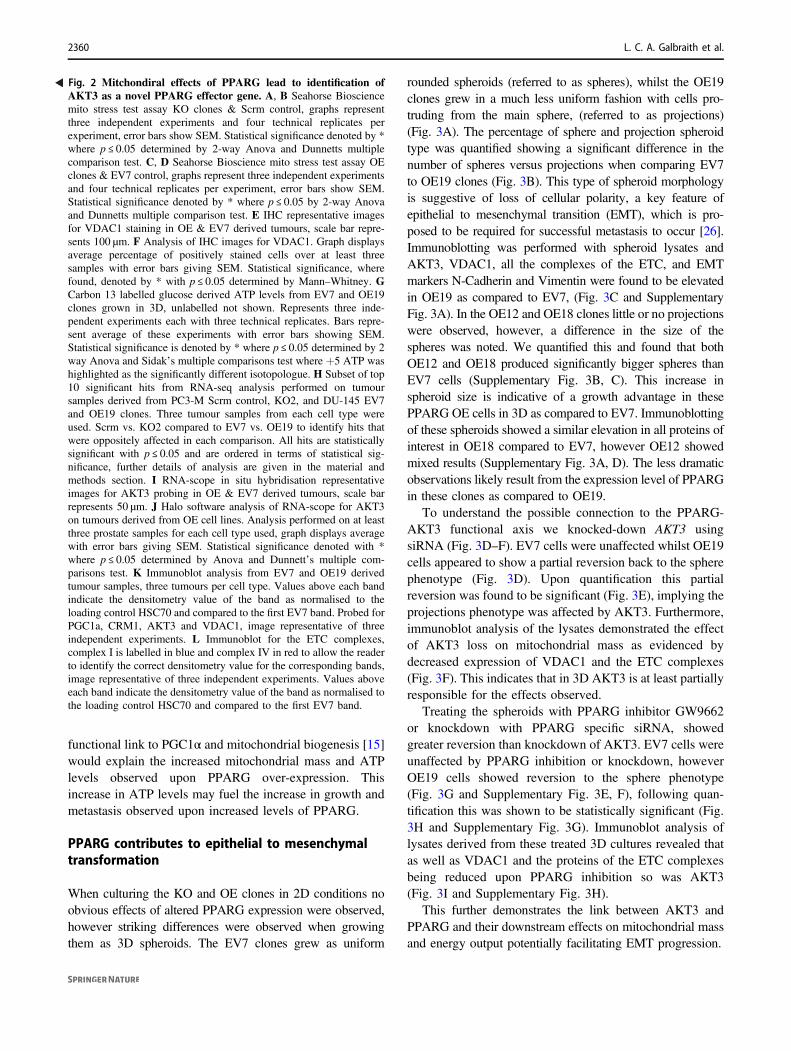
rounded spheroids (referred to as spheres), whilst the OE19clones grew in a much less uniform fashion with cells pro-truding from the main sphere, (referred to as projections)(Fig. 3A). The percentage of sphere and projection spheroidtype was quantified showing a significant difference in thenumber of spheres versus projections when comparing EV7to OE19 clones (Fig. 3B). This type of spheroid morphologyis suggestive of loss of cellular polarity, a key feature ofepithelial to mesenchymal transition (EMT), which is pro-posed to be required for successful metastasis to occur [26].Immunoblotting was performed with spheroid lysates andAKT3, VDAC1, all the complexes of the ETC, and EMTmarkers N-Cadherin and Vimentin were found to be elevatedin OE19 as compared to EV7, (Fig. 3C and SupplementaryFig. 3A). In the OE12 and OE18 clones little or no projectionswere observed, however, a difference in the size of thespheres was noted. We quantified this and found that bothOE12 and OE18 produced significantly bigger spheres thanEV7 cells (Supplementary Fig. 3B, C). This increase inspheroid size is indicative of a growth advantage in thesePPARG OE cells in 3D as compared to EV7. Immunoblottingof these spheroids showed a similar elevation in all proteins ofinterest in OE18 compared to EV7, however OE12 showedmixed results (Supplementary Fig. 3A, D). The less dramaticobservations likely result from the expression level of PPARGin these clones as compared to OE19.
To understand the possible connection to the PPARG-AKT3 functional axis we knocked-down AKT3 usingsiRNA (Fig. 3D–F). EV7 cells were unaffected whilst OE19cells appeared to show a partial reversion back to the spherephenotype (Fig. 3D). Upon quantification this partialreversion was found to be significant (Fig. 3E), implying theprojections phenotype was affected by AKT3. Furthermore,immunoblot analysis of the lysates demonstrated the effectof AKT3 loss on mitochondrial mass as evidenced bydecreased expression of VDAC1 and the ETC complexes(Fig. 3F). This indicates that in 3D AKT3 is at least partiallyresponsible for the effects observed.
Treating the spheroids with PPARG inhibitor GW9662or knockdown with PPARG specific siRNA, showedgreater reversion than knockdown of AKT3. EV7 cells wereunaffected by PPARG inhibition or knockdown, howeverOE19 cells showed reversion to the sphere phenotype(Fig. 3G and Supplementary Fig. 3E, F), following quan-tification this was shown to be statistically significant (Fig.3H and Supplementary Fig. 3G). Immunoblot analysis oflysates derived from these treated 3D cultures revealed thatas well as VDAC1 and the proteins of the ETC complexesbeing reduced upon PPARG inhibition so was AKT3(Fig. 3I and Supplementary Fig. 3H).
This further demonstrates the link between AKT3 andPPARG and their downstream effects on mitochondrial massand energy output potentially facilitating EMT progression.
Fig. 2 Mitchondiral effects of PPARG lead to identification ofAKT3 as a novel PPARG effector gene. A, B Seahorse Biosciencemito stress test assay KO clones & Scrm control, graphs representthree independent experiments and four technical replicates perexperiment, error bars show SEM. Statistical significance denoted by *where p ≤ 0.05 determined by 2-way Anova and Dunnetts multiplecomparison test. C, D Seahorse Bioscience mito stress test assay OEclones & EV7 control, graphs represent three independent experimentsand four technical replicates per experiment, error bars show SEM.Statistical significance denoted by * where p ≤ 0.05 by 2-way Anovaand Dunnetts multiple comparison test. E IHC representative imagesfor VDAC1 staining in OE & EV7 derived tumours, scale bar repre-sents 100 μm. F Analysis of IHC images for VDAC1. Graph displaysaverage percentage of positively stained cells over at least threesamples with error bars giving SEM. Statistical significance, wherefound, denoted by * with p ≤ 0.05 determined by Mann–Whitney. GCarbon 13 labelled glucose derived ATP levels from EV7 and OE19clones grown in 3D, unlabelled not shown. Represents three inde-pendent experiments each with three technical replicates. Bars repre-sent average of these experiments with error bars showing SEM.Statistical significance is denoted by * where p ≤ 0.05 determined by 2way Anova and Sidak’s multiple comparisons test where +5 ATP washighlighted as the significantly different isotopologue. H Subset of top10 significant hits from RNA-seq analysis performed on tumoursamples derived from PC3-M Scrm control, KO2, and DU-145 EV7and OE19 clones. Three tumour samples from each cell type wereused. Scrm vs. KO2 compared to EV7 vs. OE19 to identify hits thatwere oppositely affected in each comparison. All hits are statisticallysignificant with p ≤ 0.05 and are ordered in terms of statistical sig-nificance, further details of analysis are given in the material andmethods section. I RNA-scope in situ hybridisation representativeimages for AKT3 probing in OE & EV7 derived tumours, scale barrepresents 50 μm. J Halo software analysis of RNA-scope for AKT3on tumours derived from OE cell lines. Analysis performed on at leastthree prostate samples for each cell type used, graph displays averagewith error bars giving SEM. Statistical significance denoted with *where p ≤ 0.05 determined by Anova and Dunnett’s multiple com-parisons test. K Immunoblot analysis from EV7 and OE19 derivedtumour samples, three tumours per cell type. Values above each bandindicate the densitometry value of the band as normalised to theloading control HSC70 and compared to the first EV7 band. Probed forPGC1a, CRM1, AKT3 and VDAC1, image representative of threeindependent experiments. L Immunoblot for the ETC complexes,complex I is labelled in blue and complex IV in red to allow the readerto identify the correct densitometry value for the corresponding bands,image representative of three independent experiments. Values aboveeach band indicate the densitometry value of the band as normalised tothe loading control HSC70 and compared to the first EV7 band.
2360 L. C. A. Galbraith et al.
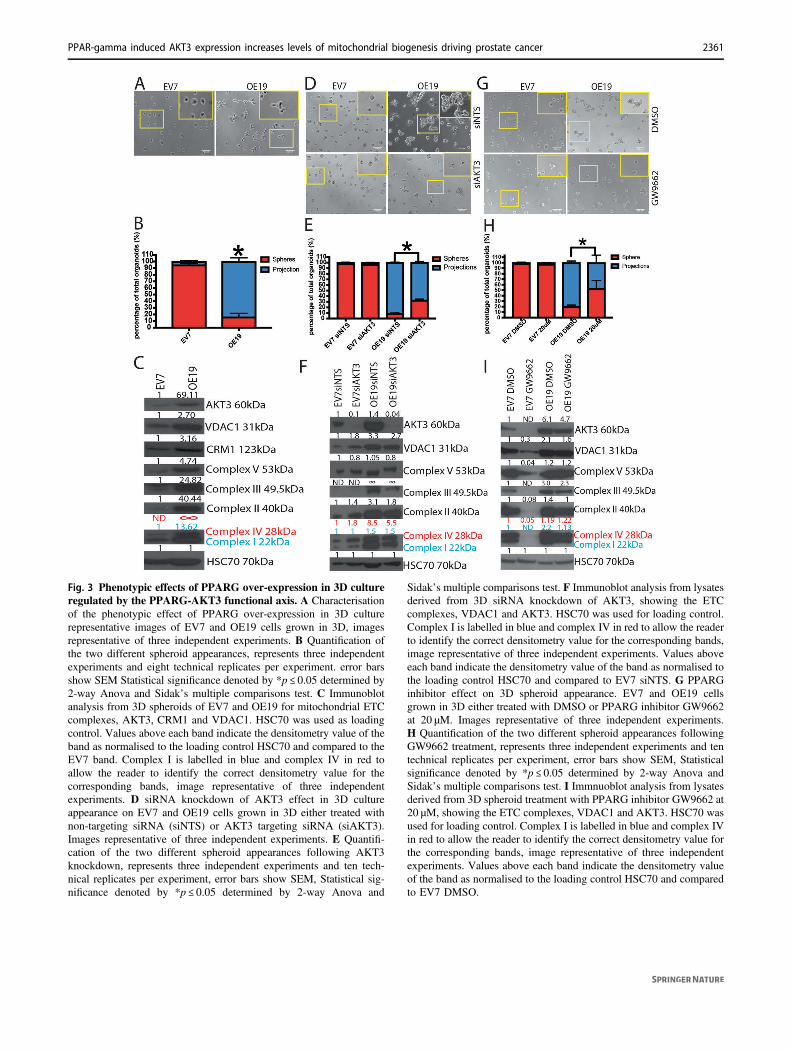
Fig. 3 Phenotypic effects of PPARG over-expression in 3D cultureregulated by the PPARG-AKT3 functional axis. A Characterisationof the phenotypic effect of PPARG over-expression in 3D culturerepresentative images of EV7 and OE19 cells grown in 3D, imagesrepresentative of three independent experiments. B Quantification ofthe two different spheroid appearances, represents three independentexperiments and eight technical replicates per experiment. error barsshow SEM Statistical significance denoted by *p ≤ 0.05 determined by2-way Anova and Sidak’s multiple comparisons test. C Immunoblotanalysis from 3D spheroids of EV7 and OE19 for mitochondrial ETCcomplexes, AKT3, CRM1 and VDAC1. HSC70 was used as loadingcontrol. Values above each band indicate the densitometry value of theband as normalised to the loading control HSC70 and compared to theEV7 band. Complex I is labelled in blue and complex IV in red toallow the reader to identify the correct densitometry value for thecorresponding bands, image representative of three independentexperiments. D siRNA knockdown of AKT3 effect in 3D cultureappearance on EV7 and OE19 cells grown in 3D either treated withnon-targeting siRNA (siNTS) or AKT3 targeting siRNA (siAKT3).Images representative of three independent experiments. E Quantifi-cation of the two different spheroid appearances following AKT3knockdown, represents three independent experiments and ten tech-nical replicates per experiment, error bars show SEM, Statistical sig-nificance denoted by *p ≤ 0.05 determined by 2-way Anova and
Sidak’s multiple comparisons test. F Immunoblot analysis from lysatesderived from 3D siRNA knockdown of AKT3, showing the ETCcomplexes, VDAC1 and AKT3. HSC70 was used for loading control.Complex I is labelled in blue and complex IV in red to allow the readerto identify the correct densitometry value for the corresponding bands,image representative of three independent experiments. Values aboveeach band indicate the densitometry value of the band as normalised tothe loading control HSC70 and compared to EV7 siNTS. G PPARGinhibitor effect on 3D spheroid appearance. EV7 and OE19 cellsgrown in 3D either treated with DMSO or PPARG inhibitor GW9662at 20 μM. Images representative of three independent experiments.H Quantification of the two different spheroid appearances followingGW9662 treatment, represents three independent experiments and tentechnical replicates per experiment, error bars show SEM, Statisticalsignificance denoted by *p ≤ 0.05 determined by 2-way Anova andSidak’s multiple comparisons test. I Immnuoblot analysis from lysatesderived from 3D spheroid treatment with PPARG inhibitor GW9662 at20 μM, showing the ETC complexes, VDAC1 and AKT3. HSC70 wasused for loading control. Complex I is labelled in blue and complex IVin red to allow the reader to identify the correct densitometry value forthe corresponding bands, image representative of three independentexperiments. Values above each band indicate the densitometry valueof the band as normalised to the loading control HSC70 and comparedto EV7 DMSO.
PPAR-gamma induced AKT3 expression increases levels of mitochondrial biogenesis driving prostate cancer 2361
PPARG alters PGC1α localisation and functionthrough AKT3
AKT3 has been shown to increase mitochondrial biogenesisthrough blocking PGC1α export from the nucleus viaCRM1 [15]. It should be noted that the localisation ofPGC1α within the cell rather than just the absolute
abundance is important to its functionality [15]. Usingimmunofluorescence (IF) it is possible to observe PGC1αlocalisation within the cells of 3D spheroids and quantifythis (Fig. 4A, B and Supplementary Fig. 3I), revealing thatOE19 spheroids display a higher nuclear to cytoplasmicratio of PGC1α than the EV7 control (Fig. 4B). To deter-mine if this effect was truly dependent on AKT3, the
2362 L. C. A. Galbraith et al.
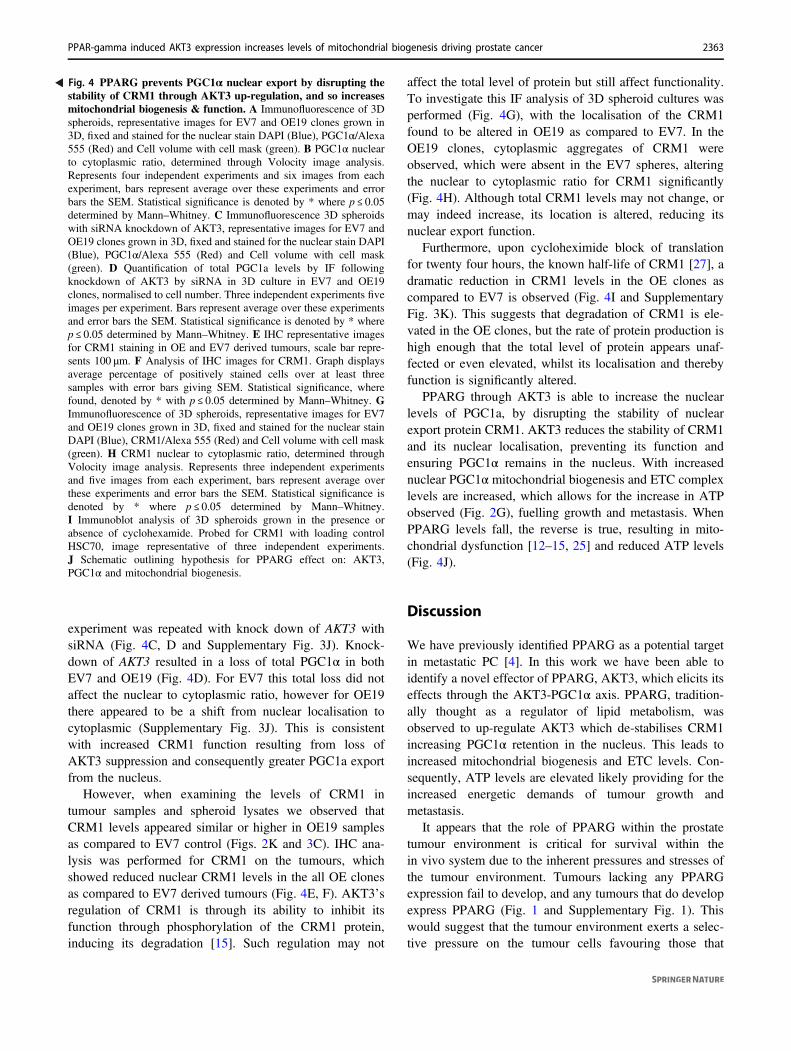
experiment was repeated with knock down of AKT3 withsiRNA (Fig. 4C, D and Supplementary Fig. 3J). Knock-down of AKT3 resulted in a loss of total PGC1α in bothEV7 and OE19 (Fig. 4D). For EV7 this total loss did notaffect the nuclear to cytoplasmic ratio, however for OE19there appeared to be a shift from nuclear localisation tocytoplasmic (Supplementary Fig. 3J). This is consistentwith increased CRM1 function resulting from loss ofAKT3 suppression and consequently greater PGC1a exportfrom the nucleus.
However, when examining the levels of CRM1 intumour samples and spheroid lysates we observed thatCRM1 levels appeared similar or higher in OE19 samplesas compared to EV7 control (Figs. 2K and 3C). IHC ana-lysis was performed for CRM1 on the tumours, whichshowed reduced nuclear CRM1 levels in the all OE clonesas compared to EV7 derived tumours (Fig. 4E, F). AKT3’sregulation of CRM1 is through its ability to inhibit itsfunction through phosphorylation of the CRM1 protein,inducing its degradation [15]. Such regulation may not
affect the total level of protein but still affect functionality.To investigate this IF analysis of 3D spheroid cultures wasperformed (Fig. 4G), with the localisation of the CRM1found to be altered in OE19 as compared to EV7. In theOE19 clones, cytoplasmic aggregates of CRM1 wereobserved, which were absent in the EV7 spheres, alteringthe nuclear to cytoplasmic ratio for CRM1 significantly(Fig. 4H). Although total CRM1 levels may not change, ormay indeed increase, its location is altered, reducing itsnuclear export function.
Furthermore, upon cycloheximide block of translationfor twenty four hours, the known half-life of CRM1 [27], adramatic reduction in CRM1 levels in the OE clones ascompared to EV7 is observed (Fig. 4I and SupplementaryFig. 3K). This suggests that degradation of CRM1 is ele-vated in the OE clones, but the rate of protein production ishigh enough that the total level of protein appears unaf-fected or even elevated, whilst its localisation and therebyfunction is significantly altered.
PPARG through AKT3 is able to increase the nuclearlevels of PGC1a, by disrupting the stability of nuclearexport protein CRM1. AKT3 reduces the stability of CRM1and its nuclear localisation, preventing its function andensuring PGC1α remains in the nucleus. With increasednuclear PGC1α mitochondrial biogenesis and ETC complexlevels are increased, which allows for the increase in ATPobserved (Fig. 2G), fuelling growth and metastasis. WhenPPARG levels fall, the reverse is true, resulting in mito-chondrial dysfunction [12–15, 25] and reduced ATP levels(Fig. 4J).
Discussion
We have previously identified PPARG as a potential targetin metastatic PC [4]. In this work we have been able toidentify a novel effector of PPARG, AKT3, which elicits itseffects through the AKT3-PGC1α axis. PPARG, tradition-ally thought as a regulator of lipid metabolism, wasobserved to up-regulate AKT3 which de-stabilises CRM1increasing PGC1α retention in the nucleus. This leads toincreased mitochondrial biogenesis and ETC levels. Con-sequently, ATP levels are elevated likely providing for theincreased energetic demands of tumour growth andmetastasis.
It appears that the role of PPARG within the prostatetumour environment is critical for survival within thein vivo system due to the inherent pressures and stresses ofthe tumour environment. Tumours lacking any PPARGexpression fail to develop, and any tumours that do developexpress PPARG (Fig. 1 and Supplementary Fig. 1). Thiswould suggest that the tumour environment exerts a selec-tive pressure on the tumour cells favouring those that
Fig. 4 PPARG prevents PGC1α nuclear export by disrupting thestability of CRM1 through AKT3 up-regulation, and so increasesmitochondrial biogenesis & function. A Immunofluorescence of 3Dspheroids, representative images for EV7 and OE19 clones grown in3D, fixed and stained for the nuclear stain DAPI (Blue), PGC1α/Alexa555 (Red) and Cell volume with cell mask (green). B PGC1α nuclearto cytoplasmic ratio, determined through Volocity image analysis.Represents four independent experiments and six images from eachexperiment, bars represent average over these experiments and errorbars the SEM. Statistical significance is denoted by * where p ≤ 0.05determined by Mann–Whitney. C Immunofluorescence 3D spheroidswith siRNA knockdown of AKT3, representative images for EV7 andOE19 clones grown in 3D, fixed and stained for the nuclear stain DAPI(Blue), PGC1α/Alexa 555 (Red) and Cell volume with cell mask(green). D Quantification of total PGC1a levels by IF followingknockdown of AKT3 by siRNA in 3D culture in EV7 and OE19clones, normalised to cell number. Three independent experiments fiveimages per experiment. Bars represent average over these experimentsand error bars the SEM. Statistical significance is denoted by * wherep ≤ 0.05 determined by Mann–Whitney. E IHC representative imagesfor CRM1 staining in OE and EV7 derived tumours, scale bar repre-sents 100 μm. F Analysis of IHC images for CRM1. Graph displaysaverage percentage of positively stained cells over at least threesamples with error bars giving SEM. Statistical significance, wherefound, denoted by * with p ≤ 0.05 determined by Mann–Whitney. GImmunofluorescence of 3D spheroids, representative images for EV7and OE19 clones grown in 3D, fixed and stained for the nuclear stainDAPI (Blue), CRM1/Alexa 555 (Red) and Cell volume with cell mask(green). H CRM1 nuclear to cytoplasmic ratio, determined throughVolocity image analysis. Represents three independent experimentsand five images from each experiment, bars represent average overthese experiments and error bars the SEM. Statistical significance isdenoted by * where p ≤ 0.05 determined by Mann–Whitney.I Immunoblot analysis of 3D spheroids grown in the presence orabsence of cyclohexamide. Probed for CRM1 with loading controlHSC70, image representative of three independent experiments.J Schematic outlining hypothesis for PPARG effect on: AKT3,PGC1α and mitochondrial biogenesis.
PPAR-gamma induced AKT3 expression increases levels of mitochondrial biogenesis driving prostate cancer 2363
express PPARG. The KO1 and KO2 cell lines in vitroexpress no PPARG (Fig. 1A), yet in vivo expressedequivalent levels to the NTS control (Fig. 1E and Supple-mentary Fig. 1A). A similar effect was observed in the OEclones, where EV7 developed a few small tumours, yet onceagain all of these were PPARG positive. During the sametime period clone OE19 was able to develop end-pointtumours in all but one mouse, clearly indicating a require-ment for PPARG for in vivo prostate tumour development.Seahorse stress test assays identified a reduced mitochon-drial function in the PC3-M KO cells when PPARG levelswere reduced, yet, DU145 OE clones showed no differencesin OCR. This was also true for a number of 2D in vitroassays performed (data not shown) for both DU145 OE andPC3-M KO cells, suggesting optimal growth conditions in2D culture are not sufficiently representative of the stressesof the in vivo environment for the advantages of PPARGexpression to be evidenced. Seahorse assays provide aslightly elevated level of stress due to the reduced serumconcentration required, which may account for the observedeffect in the PC3-M KO cells, yet this level of stress was notsufficient to demonstrate the effects of PPARG over-expression in DU145 cells. PPARG only appears to becomefunctionally essential in vivo and in 3D culture conditions,which are more physiologically relevant.
The FASN (Fig. 1E, J, K and Supplementary Fig. 1C, D,J) and Seahorse data suggested a metabolic effect ofPPARG, which influenced mitochondrial mass (Fig. 2E, F,K) and ATP levels (Fig. 2G). Given the known function ofPPARG we anticipated this would result from up-regulationof genes involved in lipid metabolism. Surprisingly datafrom RNA-Seq of the tumour samples identified AKT3(Fig. 2H) as a novel target of PPARG and the probable linkbetween PPARG and the observed changes at the mito-chondrial level given the known role of AKT3 in PGC1aregulation and mitochondrial biogenesis [14, 15, 25].Indeed, using the eukaryotic promotor database twoPPARG binding motifs are predicted within the AKT3 genepromotor, suggesting a possible mode of action for PPARGon AKT3 [28]. There are many regulators of AKT3;including VEGF, PDGF and IGF1, which may also play arole in AKT3’s function in PC, perhaps either in addition toor in synergy with PPARG and provide interesting avenuesfor future investigation [14, 29–31].
Growing the OE clones as spheroids highlighted a verystriking phenotypic differences between the OE clones andtheir EV7 control, suggestive of a loss of cellular polarity,reminiscent of an EMT like phenotype (Fig. 3A, B andSupplementary Fig. 2G). Knockdown of AKT3 reduced thiseffect significantly, but not completely (Fig. 3D–F), sug-gesting perhaps in addition to its role in the AKT3/PGC1αpathway PPARG may also be affecting other pathways.This is supported by the data from the PPARG inhibitor and
siRNA studies showing a more pronounced reversion ofphenotype (Fig. 3G–I and Supplementary Fig. 2H–K). Asthe inhibitor and siRNA are acting on PPARG and thereforeupstream of AKT3 it not only reduces PPARG’s effect onAKT3 but also on any other potential downstream effectors,resulting in the more pronounced effect
PPARG is a ligand activated nuclear receptor known forits roles in adipocyte differentiation and lipid metabolism.Its activity is governed by ligand binding, cellular locali-sation and post translational modifications the latterappearing to have an inhibitory role [32–34]. In our handsits activity was evidenced through increases in downstreameffectors of lipid metabolism (Fig. 1E, J, K and Supple-mentary Fig. 1C, D, J) [4]. These lipogenic enzymes areobserved by others to be regulated in a PGC1α dependantpro-tumourgenic manner [35]. Therefore, it is possible thatthese additional functional effects of PPARG and PGC1aare, along with PPARG’s ability to increase exogenous fattyacid uptake [36, 37], synergistic with the mitochondrialbiogenesis effects of PPARG, and could account for someadditional functions of PPARG in prostate cancer notattributable to AKT3.
The effect of PPARG driven AKT3 up-regulation resultsin an accumulation of PGC1α (Fig. 2K), which drivesmitochondrial biogenesis and tumour growth and develop-ment [7, 8]. This appears to be at odds with the work frompreviously published studies [38, 39], which describe howPGC1α can supress PC metastasis and aggressiveness. Inthe Torrano et al. study PGC1α up-regulation drivesoestrogen-related receptor alpha (ERRα) target gene tran-scription instigating a metabolic switch to a catabolic pro-gram, which inhibits PC progression [38]. This effect isalmost completely dependent upon the transcription factorERRα, a PGC1α co-factor. Similarly, the Kaminski et al.study links PGC1α’s suppressive effects to ERRα and c-Myc and downstream polyamine synthesis [39]. However,PGC1α is a co-activator for numerous transcription factors,such as PPARG and the other PPAR’s (alpha and beta), aswell as ERR alpha, beta and gamma, Fox01, hepatocytenuclear factor 4α (HNF4α) and nuclear respiratory factor 1(NRF1) [6, 8, 40–44]. Notably both these studies [38, 39]focus on the PGC1α/ERRa relationship and the subset ofgenes they regulate as the cause of PGC1α suppression ofmetastasis. The PPARs and ERRs (with PGC1α) are knownto regulate different gene sets [40] and perhaps it is thisdifference in the genes transcribed that determines if PGC1ais pro or anti-tumour progression. Where PPARG levels arehigh, as in our case, perhaps it is the effect of PGC1α ratherthan ERRα which is determining the gene signature.
Indeed, examining PGC1α levels in vivo by immunoblotrevealed it to be elevated in OE tumours. IF analysis of 3Dspheroids showed the nuclear localisation of PGC1a to besimilarly affected (Fig. 4A, B). This effect appeared to be
2364 L. C. A. Galbraith et al.
lost upon knockdown of AKT3, which may explain thephenotypic effects observed on spheroid growth uponAKT3 knockdown observed earlier (Fig. 4C, D). CRM1however, initially appeared to contradict the hypothesis. ForPGC1α to remain nuclear a reduction in CRM1 levels wasanticipated in conjunction with the increased AKT3 func-tion driven by PPARG.
The action of AKT3 upon the major nuclear exportprotein CRM1, affects the subcellular localisation ofPGC1α. Given AKT3’s classification as a Serine/ThreonineKinase, it is suggested its effects on CRM1 could be viaphosphorylation [15, 45]. Indeed serine 1054 of CRM1 wasidentified as crucial to AKT3’s ability to inhibit CRM1 [15],however no evidence of AKT3 directly phosphorylating thissite has yet been observed. IHC analysis for CRM1 showedsignificantly reduced CRM1 levels in OE18 and OE19(Fig. 4E, F), but immunoblotting did not appear to reflectthis (Figs. 2K and 3C). Performing IF for CRM1 on the 3Dspheroids (Fig. 4G, H) demonstrated large non-nuclearaggregates of CRM1 were present in clone OE19 and not inEV7. For CRM1 to export PGC1a from the nucleus it mustbe localised to the nucleus. The presence of these aggre-gates’ accounts for the lack of change in CRM1 levelswhilst allowing for PGC1α to remain in the nucleus at ahigher level than in EV7 cells. Blocking translation usingcycloheximide, confirmed that indeed in the OE clonesCRM1 was being degraded at an elevated rate (Fig. 4I),suggesting that PPARG through AKT3 affects the stability,and consequently function of the CRM1 protein and therebyretention of PGC1α in the nucleus.
Here we provide evidence for a previously unidentifiedfunctional link between PPARG-AKT3-PGC1a, mitochon-drial biogenesis and mitochondrial output (Fig. 4J). Thisfunction of PPARG allows for the provision of energy(ATP) which may fuel tumour growth and progression inPC. The failure of PPARG negative tumours to developsuggests that PPARG is essential for tumour growth andprogression in vivo. This absolute requirement for PPARGhighlights its crucial role in PC development, suggestingthat targeted therapies against PPARG could prove to be ahighly efficient avenue for treatment of advanced PC.
Funding This work was supported by Cancer Research UK ClinicianScientist Fellowship award to (C49745/A19661; IA) and CRUK coreaward to CRUK Beatson Institute A17196 (OJS, CN, AH, DS, DS,& GM).
Author contributions Conception and design: LCAG, IA and HYL.Development of methodology: LCAG, IA, DS, and HYL. Acquisitionof Data (provided animals, provided facilities etc.): LCAG, IA, DS,EM, GM, DS, AH, OJS, and HYL. Analysis and interpretation of data(e.g., statistical analysis, biostatistics, computational analysis): LCAG,AH, IA, and HYL. Writing, review, and/or revision of the manuscript:LCAG, IA, GM, and HYL.
Compliance with ethical standards
Conflict of interest The authors declare no competing interests.
Publisher’s note Springer Nature remains neutral with regard tojurisdictional claims in published maps and institutional affiliations.
Open Access This article is licensed under a Creative CommonsAttribution 4.0 International License, which permits use, sharing,adaptation, distribution and reproduction in any medium or format, aslong as you give appropriate credit to the original author(s) and thesource, provide a link to the Creative Commons license, and indicate ifchanges were made. The images or other third party material in thisarticle are included in the article’s Creative Commons license, unlessindicated otherwise in a credit line to the material. If material is notincluded in the article’s Creative Commons license and your intendeduse is not permitted by statutory regulation or exceeds the permitteduse, you will need to obtain permission directly from the copyrightholder. To view a copy of this license, visit http://creativecommons.org/licenses/by/4.0/.
References
1. Siegel RL, Miller KD, Jemal A. Cancer statistics, 2015. CACancer J Clin 2015;65:5–29.
2. Huggins CaH CV. Studies on Prostatic Cancer: I. The effect ofcastration, of estrogen, and of androgen injection on serumphosphatases in metastatic carcinoma of the prostate. Cancer Res.1941;1:293–7.
3. Feldman BJ, Feldman D. The development of androgen-independent prostate cancer. Nat Rev Cancer. 2001;1:34–45.
4. Ahmad I, Mui E, Galbraith L, Patel R, Tan EH, Salji M, et al.Sleeping Beauty screen reveals Pparg activation in metastaticprostate cancer. Proc Natl Acad Sci USA. 2016;113:8290–5.
5. March HN, Rust AG, Wright NA, ten Hoeve J, de Ridder J,Eldridge M, et al. Insertional mutagenesis identifies multiplenetworks of cooperating genes driving intestinal tumorigenesis.Nat Genet. 2011;43:1202–9.
6. Wu Z, Puigserver P, Andersson U, Zhang C, Adelmant G, MoothaV, et al. Mechanisms controlling mitochondrial biogenesis andrespiration through the thermogenic coactivator PGC-1. Cell.1999;98:115–24.
7. Fernandez-Marcos PJ, Auwerx J. Regulation of PGC-1alpha, anodal regulator of mitochondrial biogenesis. Am J Clin Nutr.2011;93:884S–90.
8. Puigserver P, Wu Z, Park CW, Graves R, Wright M, SpiegelmanBM. A cold-inducible coactivator of nuclear receptors linked toadaptive thermogenesis. Cell. 1998;92:829–39.
9. Handschin C, Spiegelman BM. Peroxisome proliferator-activatedreceptor gamma coactivator 1 coactivators, energy homeostasis,and metabolism. Endocr Rev. 2006;27:728–35.
10. Manning BD, Cantley LC. AKT/PKB signaling: navigatingdownstream. Cell. 2007;129:1261–74.
11. Phung TL, Du W, Xue Q, Ayyaswamy S, Gerald D, Antonello Z,et al. Akt1 and akt3 exert opposing roles in the regulation ofvascular tumor growth. Cancer Res. 2015;75:40–50.
12. Ding L, Biswas S, Morton RE, Smith JD, Hay N, Byzova TV,et al. Akt3 deficiency in macrophages promotes foam cell for-mation and atherosclerosis in mice. Cell Metab. 2012;15:861–72.
13. Ding L, Zhang L, Kim M, Byzova T, Podrez E. Akt3 kinasesuppresses pinocytosis of low-density lipoprotein by macrophagesvia a novel WNK/SGK1/Cdc42 protein pathway. J Biol Chem.2017;292:9283–93.
PPAR-gamma induced AKT3 expression increases levels of mitochondrial biogenesis driving prostate cancer 2365
14. Wright GL, Maroulakou IG, Eldridge J, Liby TL, Sridharan V,Tsichlis PN, et al. VEGF stimulation of mitochondrial biogenesis:requirement of AKT3 kinase. FASEB J. 2008;22:3264–75.
15. Corum DG, Tsichlis PN, Muise-Helmericks RC. AKT3 controlsmitochondrial biogenesis and autophagy via regulation of themajor nuclear export protein CRM-1. FASEB J. 2014;28:395–407.
16. Fisher S, Barry A, Abreu J, Minie B, Nolan J, Delorey TM, et al.A scalable, fully automated process for construction of sequence-ready human exome targeted capture libraries. Genome Biol.2011;12:R1.
17. http://www.bioinformatics.bbsrc.ac.uk/projects/fastqc.18. http://www.bioinformatics.babraham.ac.uk/projects/fastq_screen/.19. Church DM, Schneider VA, Graves T, Auger K, Cunningham F,
Bouk N, et al. Modernizing reference genome assemblies. PLoSBiol. 2011;9:e1001091.
20. Kim D, Pertea G, Trapnell C, Pimentel H, Kelley R, Salzberg SL.TopHat2: accurate alignment of transcriptomes in the presence ofinsertions, deletions and gene fusions. Genome Biol. 2013;14:R36.
21. Langmead B, Salzberg SL. Fast gapped-read alignment withBowtie 2. Nat Methods. 2012;9:357–9.
22. http://www-huber.embl.de/users/anders/HTSeq/doc/overview.html.
23. Love MI, Huber W, Anders S. Moderated estimation of foldchange and dispersion for RNA-seq data with DESeq2. GenomeBiol. 2014;15:550.
24. Galbraith L, Leung HY, Ahmad I. Lipid pathway deregulation inadvanced prostate cancer. Pharm Res. 2018;131:177–84.
25. Kim M, Kim YY, Jee HJ, Bae SS, Jeong NY, Um JH, et al. Akt3knockdown induces mitochondrial dysfunction in human cancercells. Acta Biochim Biophys Sin. 2016;48:447–53.
26. Geiger TR, Peeper DS. Metastasis mechanisms. Biochim BiophysActa. 2009;1796:293–308.
27. Fornerod M, van Deursen J, van Baal S, Reynolds A, Davis D,Murti KG, et al. The human homologue of yeast CRM1 is in adynamic subcomplex with CAN/Nup214 and a novel nuclear porecomponent Nup88. EMBO J. 1997;16:807–16.
28. https://epd.epfl.ch/cgi-bin/get_doc?db=hgEpdNew&format=genome&entry=AKT3_1.
29. Madhunapantula SV, Robertson GP. The PTEN-AKT3 signalingcascade as a therapeutic target in melanoma. Pigment Cell Mel-anoma Res. 2009;22:400–19.
30. Testa JR, Bellacosa A. AKT plays a central role in tumorigenesis.Proc Natl Acad Sci USA. 2001;98:10983–5.
31. Datta SR, Brunet A, Greenberg ME. Cellular survival: a play inthree Akts. Genes Dev. 1999;13:2905–27.
32. Floyd ZE, Stephens JM. Controlling a master switch of adipocytedevelopment and insulin sensitivity: Covalent modifications ofPPAR gamma. Bba-Mol Basis Dis. 2012;1822:1090–5.
33. Brunmeir R, Xu F. Functional regulation of PPARs through post-translational modifications. Int J Mol Sci. 2018;19:1738.
34. Burns KA, Heuvel JPV. Modulation of PPAR activity via phos-phorylation. Bba-Mol Cell Biol L. 2007;1771:952–60.
35. Bhalla K, Hwang BJ, Dewi RE, Ou L, Twaddel W, Fang HB, et al.PGC1alpha promotes tumor growth by inducing gene expressionprograms supporting lipogenesis. Cancer Res. 2011;71:6888–98.
36. Tontonoz P, Nagy L, Alvarez JG, Thomazy VA, Evans RM.PPARgamma promotes monocyte/macrophage differentiation anduptake of oxidized LDL. Cell. 1998;93:241–52.
37. Nagy L, Tontonoz P, Alvarez JG, Chen H, Evans RM. OxidizedLDL regulates macrophage gene expression through ligand acti-vation of PPARgamma. Cell. 1998;93:229–40.
38. Torrano V, Valcarcel-Jimenez L, Cortazar AR, Liu X, Urosevic J,Castillo-Martin M, et al. The metabolic co-regulator PGC1alphasuppresses prostate cancer metastasis. Nat Cell Biol. 2016;18:645–56.
39. Kaminski L, Torrino S, Dufies M, Djabari Z, Haider R, RoustanFR, et al. PGC1alpha inhibits polyamine synthesis to suppressprostate cancer aggressiveness. Cancer Res. 2019;79:3268–80.
40. Fan W, Evans RPPARs. and ERRs: molecular mediators ofmitochondrial metabolism. Curr Opin Cell Biol. 2015;33:49–54.
41. Vega RB, Huss JM, Kelly DP. The coactivator PGC-1 cooperateswith peroxisome proliferator-activated receptor alpha in tran-scriptional control of nuclear genes encoding mitochondrial fattyacid oxidation enzymes. Mol Cell Biol. 2000;20:1868–76.
42. Huss JM, Kopp RP, Kelly DP. Peroxisome proliferator-activatedreceptor coactivator-1alpha (PGC-1alpha) coactivates the cardiac-enriched nuclear receptors estrogen-related receptor-alpha and-gamma. Identification of novel leucine-rich interaction motifwithin PGC-1alpha. J Biol Chem. 2002;277:40265–74.
43. Puigserver P, Rhee J, Donovan J, Walkey CJ, Yoon JC, Oriente F,et al. Insulin-regulated hepatic gluconeogenesis through FOXO1-PGC-1alpha interaction. Nature. 2003;423:550–5.
44. Yoon JC, Puigserver P, Chen G, Donovan J, Wu Z, Rhee J, et al.Control of hepatic gluconeogenesis through the transcriptionalcoactivator PGC-1. Nature. 2001;413:131–8.
45. Wu Z, Jiang Q, Clarke PR, Zhang C. Phosphorylation of Crm1 byCDK1-cyclin-B promotes Ran-dependent mitotic spindle assembly.J Cell Sci. 2013;126:3417–28.
2366 L. C. A. Galbraith et al.


![Total cross section in [gamma][gamma] collisions at LEP](https://img.dokumen.tips/doc/110x75/6362da1004ad0ea83504089f/total-cross-section-in-gammagamma-collisions-at-lep.jpg)


