Embed Size (px)
Citation preview

Dublin Institute of TechnologyARROW@DIT
Articles School of Food Science and Environmental Health
2010-01-01
Postharvest Hardness and Color Evolution ofWhite Button Mushrooms (Agaricus bisporus).Debabandya MohapatraUniversity College Cork, [email protected]
Zuberi M. BiraUniversity College Cork
Joseph KerryUniversity College Cork, [email protected]
Jesus Maria FriasDublin Institute of Technology, [email protected]
Fernanda A.R. OliveiraUniversity College Cork
Follow this and additional works at: http://arrow.dit.ie/schfsehartPart of the Food Processing Commons
This Article is brought to you for free and open access by the School ofFood Science and Environmental Health at ARROW@DIT. It has beenaccepted for inclusion in Articles by an authorized administrator ofARROW@DIT. For more information, please [email protected], [email protected].
This work is licensed under a Creative Commons Attribution-Noncommercial-Share Alike 3.0 License
Recommended CitationMohapatra , D., Bira, Z.M., Kerry J., Frías, J.M., Oliveira, F.A.R (2010) Postharvest Hardness and Color Evolution of WhiteButtonMushrooms (Agaricus bisporus). Journal of Food Science 75(3) E146-E152
1
Postharvest Hardness and Color Evolution of White Button Mushrooms (Agaricus 1
bisporus) 2
3
Debabandya Mohapatra 1,4
, Zuberi M. Bira2,5
, Joe P. Kerry2, Jesus M. Frías
3 and Fernanda A. 4
Rodrigues 1*
5
6
7
8
9
10
11
12
13
14
1 Process and Chemical Engineering Department, University College Cork, Cork City, 15
Ireland 16
2 Food and Nutritional Sciences Department, University College Cork, Cork City, Ireland 17
3 School of Food Science and Environmental Health, Dublin Institute of Technology, Cathal 18
Brugha Street, Dublin 1, Ireland 19
4 Current Address: Faculty of Food Processing Technology and Bio-energy, Anand 20
Agricultural University, Anand, Gujarat, India 21
5 Current Address: Agricultural Research institute, Ilonga, Kilosa, Morogoro, Tanzania22

2
Abstract: 23
The quality evaluation of mushrooms was studied by storing fresh white button mushroom 24
(Agaricus bisporus) for 6-8 days, at various controlled temperature conditions (3.5 -15 C) 25
and measuring the instrumental textural hardness and color of the mushroom cap for different 26
product batches. A non linear mixed effect weibull model was used to describe mushroom 27
cap texture and color kinetics during storage considering the batch variability into account. 28
Storage temperature was found to play a significant role in controlling texture and colour 29
degradation. On lowering storage temperature i) the extent of the final browning extent in the 30
mushroom after storage was reduced; and ii) the rate textural hardness losses was slowed 31
down. A linear dependence of the final browning index with temperature was found. An 32
Arrhenius type relationship was found to exist between the temperature of storage and 33
storage time with respect to textural hardness. The average batch energy of activation was 34
calculated to be 207 42 kJ/mol in a temperature range of 3.5-20°C. 35
Practical application 36
This article evaluates how temperature abuse affects mushroom texture and colour, applying 37
methods that allow for the consideration of the natural product variability that is inherent in 38
mushrooms. Its result apply to mushroom producers, retail distribution and supermarkets for 39
effective storage management. 40
41

3
Introduction: 42
Mushroom marketers often face difficulties in choosing a safe storage conditions on receiving 43
different batches of mushrooms. Mushrooms may vary in their harvesting date and time, 44
cultivated mushroom variety, harvest batches, storage conditions adopted and cold chain 45
regime followed (Hertog and others 2007a; Aguirre and others 2008). Post-harvest, 46
mushrooms immediately start to soften and begin to brown in color due to enzymatic 47
breakdown of plant cells and loss of moisture through respiration (Burton and others 1987, 48
Jolivet and others 1998, Brennan and others 2000; Zivanovic and others 2003; Zivanovic and 49
others 2004; Lespinard and others 2009). This results in reduced product acceptability, as 50
consumer’s preference and demand is for white, unblemished and hard textured mushrooms. 51
Additionally, bruising and storage at elevated temperatures enhances the degradation process 52
and reduces mushroom shelf-life (Burton, 1986). Consequently, monitoring cold-chain 53
storage conditions that will preserve the quality of mushrooms is both critical and challenging 54
(Aguirre and others, 2009) 55
Quality control during postharvest requires precise methodologies to estimate the 56
acceptability of fresh produce of varying batches, growers, cultivation practices and post 57
harvest treatments. In an ideal situation, all products should arrive with the same 58
homogeneity as if it was from an experimental station unit, however, food retailers face an 59
input of produce arising from different growers, possibly harvested on different dates and 60
locations and using very different cultural practices. Taken together, this has a significant 61
effect on the homogeneity of the product and its’ time to reach the limit of marketability 62
(Hertog and others 2007b; Schouten and others 2004). Moreover, there is biological variation 63
contributed by micro nutrients, growing conditions, etc. for each batch of produce. Different 64
units of an individual batch may behave differently, even when stored under similar storage 65
conditions (Brennan and others 2000; Hertog and others 2007a). 66

4
Modeling the quality kinetics of fresh products attempts to better understand the fate of 67
quality during storage, taking not only the primary modeling variable (time) into account, but 68
more importantly, the secondary variables that may be controlled during storage to optimally 69
maintain the quality attributes of the product. Such information would be helpful to both 70
producers and sellers in enabling them to optimize product storage conditions and in 71
identifying the significant factors affecting product shelf-life. Modeling may also reveal the 72
ways in which variability affects the quality during operating storage conditions, which may 73
in turn be used to define limits beyond which the quality of product may be compromised 74
within a certain tolerance (Lavelli and others 2006). 75
An assessment of fresh produce shelf-life requires proper understanding of the two 76
phenomena affecting the process i) biological metabolism, and ii) underlying variability. 77
Model building is employed to assess the shelf-life, normally based on experimental data that 78
is generated through repetitive quality measurements, either by destructive or non–destructive 79
methods carried out in real-situation or laboratory conditions. The repetitive measurements 80
form a longitudinal data structure which is well correlated with the subject within a batch, but 81
are independent of the intra batch variability (Lammertyn and others 2003). Least squares 82
regression is commonly used to analyze the data by averaging repeated measurements. 83
Although this statistical method is robust to build models within normal food experiments, it 84
accumulates all the variation in one error term and does not allow for the estimation of the 85
different possible sources of variation. While this is sufficient for use with many experiments, 86
it may be more desirable to estimate other and different sources of variability. In particular, 87
postharvest technology is a field where this approach might prove to be interesting from a 88
number of different perspectives, such as; i) to be able to estimate the weight of different 89
variability sources (within batch, between batches, between producers), which will help to 90
make clearer purchasing decisions ii) to identify if variability can be reduced at any particular 91
5
storage condition and iii) to evaluate through a scenario analysis if making an hypothetical 92
optimization in the cold chain, this optimisation will actually result in an appreciable 93
improvement of the shelf life taking account of product variability. Mixed-effects models 94
may be useful for those cases where one has to deal with within-subject, as well as between-95
subject variability, especially when having to deal with a biological commodity. A mixed 96
effects model has two components i) fixed effect term, which deals with the trend 97
components and ii) random effect term, which deals with subject specific intercepts and 98
variance (Pinheiro and Bates, 2000). Moreover, it allows for the presence of missing data and 99
can allow for time-varying or unbalanced designs with unequal numbers of subjects across 100
experimental groups (Pinheiro and Bates 2000; Lammertyn and others 2003). Several studies 101
have been undertaken to predict the quality kinetics of fresh produce using mixed effect 102
models (Lammertyn and others 2003; Piagentini and others 2005; Latreille and others 2006; 103
Schouten and others 2007; Aguirre et al. 2009). A mixed effect model that addresses a 104
hierarchical level of variation has been employed by various researchers (Fonseca and others 105
2002; Montanez and others 2002; Ketelaere and others 2006). Mushrooms are known to have 106
a very short shelf- life and susceptible to browning and moisture loss due to the enzymatic 107
activity and lack of cell wall. The quality deterioration is even faster at higher storage 108
temperature conditions, due to enhanced metabolic activity. Therefore modeling the quality 109
deterioration with respect to storage conditions provides ample opportunity for the mushroom 110
growers and marketers to modify the storage and handling conditions in order to have higher 111
shelf-life, thus reducing the economic loss. In this study, attempts were made to model 112
product instrumental texture and color characteristics in order to predict mushroom shelf-life 113
under different temperature storage conditions, taking batch variation into consideration, 114
using a non-linear mixed effect model. 115
116

6
2.0 Materials and methods: 117
Closed cup Agaricus Bisporus button mushrooms (white, close, uniform, clear, fresh, L 118
value= 90±5, a=0.3±0.8, b=10±2), sourced from the Ranairee mushroom farm (Macroom, 119
Ireland) and commonly destined for retail supermarket sales, were delivered to the laboratory 120
using a temperature monitored distribution chain (6 2°C, 80 ± 15% RH) in 7 kg crates 121
without any individual packaging. Bruised and damaged samples were discarded and samples 122
for analysis were taken at random from each batch of crates. Half of the mushrooms from the 123
same batch were stored in temperature controlled cold rooms at different temperatures (5, 10, 124
15 0.6°C) and the corresponding relative humidity was monitored (86 7%). The other half 125
of the sample was kept in a domestic refrigerator that reproduced the ideal storage 126
temperature during retail and distribution of 3-4°C (3.5 1.5°C, RH 92 5%) and served as 127
the control sample to observe differences between ideal storage and the temperature used for 128
each individual batch tested. The temperature range of 3.5-15°C was chosen considering the 129
practical temperature distribution chain of mushrooms i.e. during post-harvest handling, 130
transportation and storage. Texture and color measurement were performed after the 131
mushrooms reached equilibrium temperature and every 24 hr thereafter, until the end of the 132
storage experiment, which varied between 6-8 days, depending on storage temperature, 133
taking random samples from the lot. A total of 14 batches of experiments were performed, 134
covering a period of 1 year of production. 135
136
2.1 Instrumental texture measurement: 137
Texture measurement is a complex measurement, especially in a highly variable and 138
anisotropic solid as mushrooms (McGarry and Burton 1994). Stored mushrooms were 139
removed from storage and held at room temperature for 0.5 hr before performing textural 140
assays. All such experiments were carried out using a texture profile analyser (Texture Expert 141
7
Exceed, Stable Microsystems, UK), with a 5 kg load cell following a modification of the 142
method proposed by Gonzalez-Fandos and others (2000). The crosshead speed of the spindle 143
for the pre-test, post-test and test speed were kept at 1 mm/min. Only the mushroom caps 144
were used for texture hardness measurements. In order to obtain a sample with the same 145
tissue orientation and dimensions, a cylindrical sample of 10 mm diameter was bored out 146
from the mushroom cap using a steel borer and cut to 10 mm length using a sharp knife and 147
was then compressed to 50% of the original height using a 35 mm aluminium cylindrical 148
probe so as to achieve compression of the mushroom sample. Product hardness was the 149
variable analyzed for each sample. Tests were performed on 5 replicate mushroom samples, 150
from each storage condition, on each storage day, during the whole course of the trial period, 151
accounting for over 700 measurements. 152
153
2.2 Color measurement: 154
The color of the mushroom cap was measured using a Minolta Chroma Meter (Model CR-155
331, Minolta Camera Co., Osaka, Japan), using the Hunter Lab Color Scale. The color was 156
measured at three equidistant points on each mushroom cap using an aperture diameter of 157
4mm. Five mushrooms were randomly selected from each batch per day for the color 158
measurement, accounting for over 2800 measurements of color. Mushroom color has been 159
commonly measured using the L value of the Hunter scale (Brennan and others 2000; Jolivet, 160
1998; Cliffe-Byrnes and O’Beirne 2007), however some studies have pointed to changes in 161
other parameters of the hunter scale (a* and b*) related to browning (Aguirre and others 162
2008; Vizhanyo and Felföldi, 2000; Burton, 1998). In order to capture this variation in a 163
single index that would be related to a turn towards brown colour, the Browning index (BI) 164
was calculated using the following expression (Maskan 2001; Bozkurt and Bayram 2006): 165

8
17.0
31.0100
XBI , where
*)012.3*645.5(
)75.1*(
baL
LaX , L, a*, b* values represent the 166
lightness, redness and greenness of the sample. 167
168
1.0 Mathematical modeling 169
The mathematical model to predict mushroom shelf-life was carried out using the data 170
generated from measurement of the textural hardness and color (as indicated by the browning 171
index). 172
Model building was performed using the following procedure: 173
1. An ANOVA analysis of the quality parameters clearly showed that they were all affected 174
by temperature and storage time (p < 0.05). The primary modeling of the data was then 175
performed using suitable mathematical models for individual temperatures and batch 176
experiments. After a graphical, the first order model, the biexponential model, the logistic 177
model and the weibull model were used as candidate models to describe the kinetics of 178
texture and browning. The most appropriate model which gave maximum determination 179
coefficient R2, a low standard error, lower Akaike's Information Criterion (AIC) and 180
Bayesian Information Criterion (BIC) was chosen. The AIC and BIC are model 181
discrimination criteria used for selection nonlinear models, which consider the goodness 182
of fit of the model and the number of parameters employed. The smaller the value of the 183
AIC and BIC the better a model performs (Pinheiro and Bates, 2000). 184
2. The secondary modeling of the data considered two components: i) dependence of the 185
texture and browning primary model parameters was described following the equations 186
proposed in section 3.3 below ii) batch variation would be expected to follow the 187
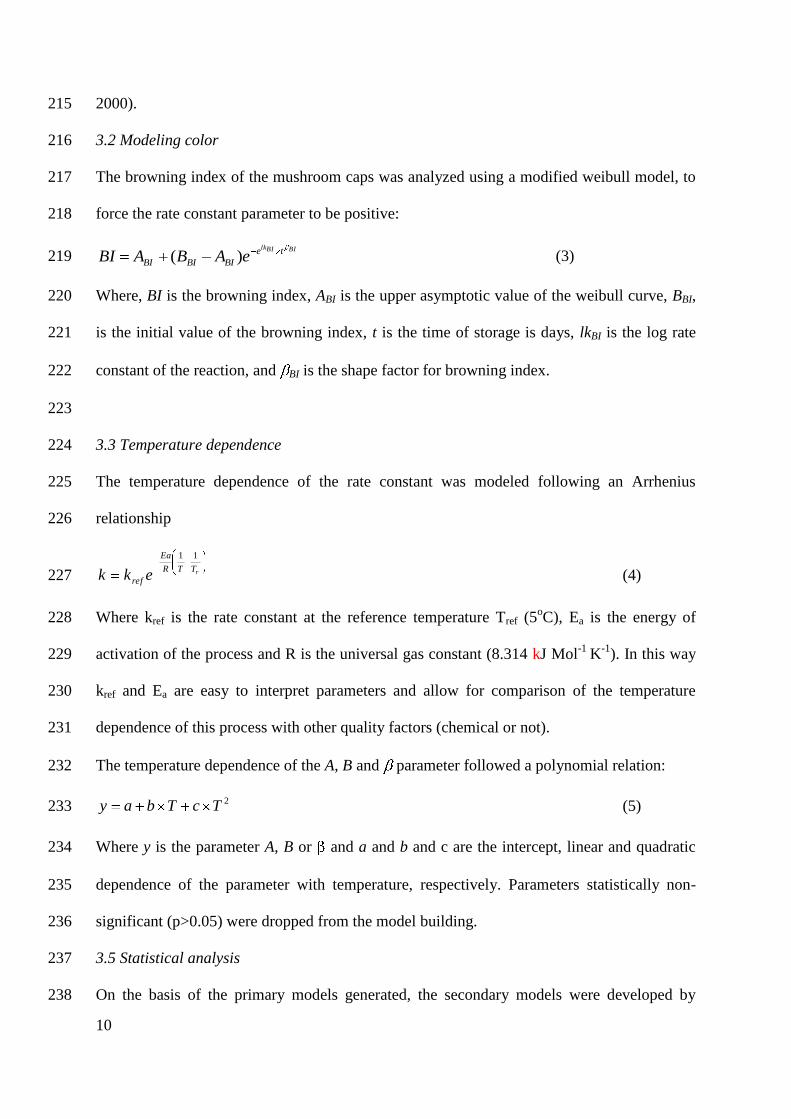
hypothesis of Hertog and others (2007a) that each individual product and batch has 188
perturbation at the initial state at which it is processed. Extra random effects were 189
9
introduced following this and its addition tested using a log-likelihood ratio test. A 190
likelihood-ratio test is a statistical test for making a decision between two models where 191
the hypothesis is based on the value of the log-likelihood ratio of the two models 192
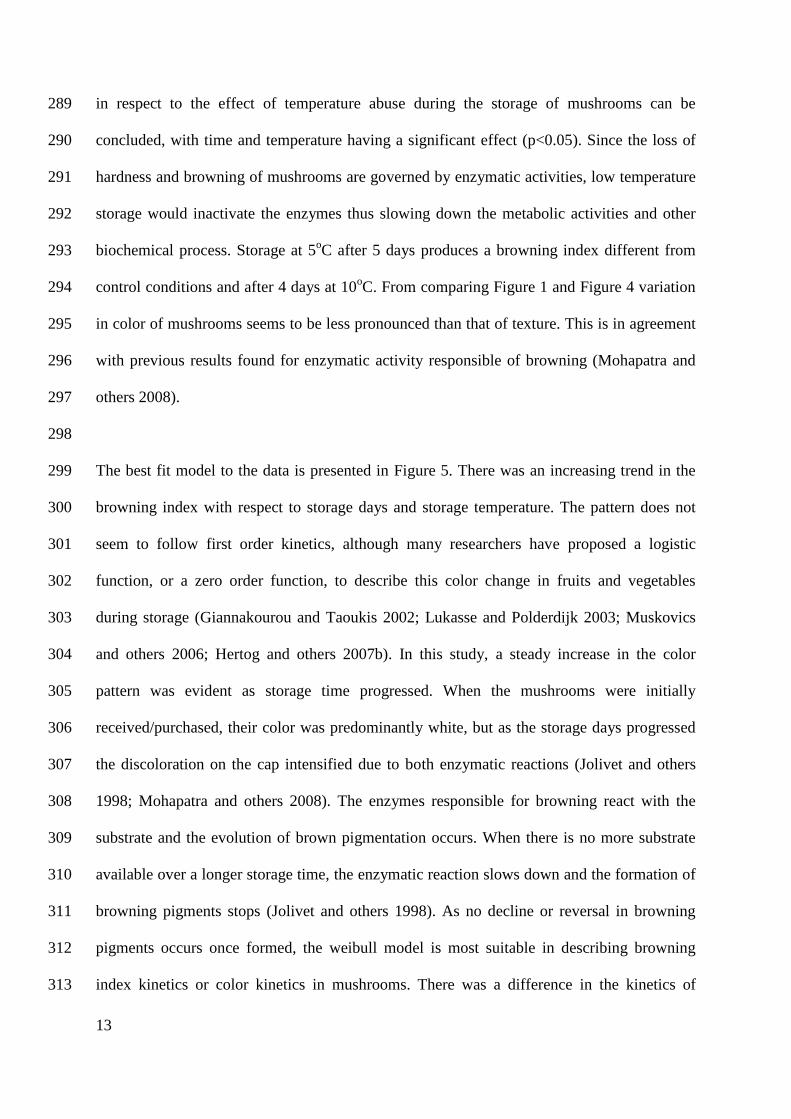
following a chi-square distribution (Bates and Watts, 1988). The log-likelihood ratio test 193
is a conservative test that will check for statistical significance of adding further nested 194
random effects to a model (Pinheiro and Bates, 2000). The test requires that the two 195
models must be nested, this is, that if one of the models can be transformed into the other 196
by fixing one parameter. 197
3. Finally prediction plots using the Best Linear Unbiased Prediction (BLUP), which depict 198
the model prediction of each individual experiment considering the random effects 199
assigned to it in the model (Pinheiro and Bates, 2000), were made to confirm the 200
suitability of the candidate models. 201
4. An iterative procedure was used to find the best candidate secondary model that could 202
describe, with a minimum set of parameters, that data that resulted from the 203
experimentation. 204
3.1 Modeling texture 205
The best candidate primary model to describe the texture and browning kinetics, in a similar 206
way as with Kong and others (2007). 207
The textural hardness of the mushrooms was described by the weibull model as follows: 208
HHlkte
HHH eBABH )( (2) 209
Where, H is the textural hardness of the mushroom cap, AH, and BH are the initial and final 210
hardness of mushroom cap during storage, t is the time of storage (day), lkH is the natural 211
logarithm of the rate constant of the reaction and H is the dimensionless shape parameter. 212
The shape parameter accounts for upward concavity of the curve ( H < 1), a linear curve ( H 213
= 1) as in case of first order kinetics, and downward concavity ( H > 1) (Pinheiro and Bates, 214
10
2000). 215
3.2 Modeling color 216
The browning index of the mushroom caps was analyzed using a modified weibull model, to 217
force the rate constant parameter to be positive: 218
BIBIlkte
BIBIBI eABABI )( (3) 219
Where, BI is the browning index, ABI is the upper asymptotic value of the weibull curve, BBI, 220
is the initial value of the browning index, t is the time of storage is days, lkBI is the log rate 221
constant of the reaction, and BI is the shape factor for browning index. 222
223
3.3 Temperature dependence 224
The temperature dependence of the rate constant was modeled following an Arrhenius 225
relationship 226
rTTR
Ea
ref ekk
11
(4) 227
Where kref is the rate constant at the reference temperature Tref (5oC), Ea is the energy of 228
activation of the process and R is the universal gas constant (8.314 kJ Mol-1
K-1
). In this way 229
kref and Ea are easy to interpret parameters and allow for comparison of the temperature 230
dependence of this process with other quality factors (chemical or not). 231
The temperature dependence of the A, B and parameter followed a polynomial relation: 232
2TcTbay (5) 233
Where y is the parameter A, B or and a and b and c are the intercept, linear and quadratic 234
dependence of the parameter with temperature, respectively. Parameters statistically non-235
significant (p>0.05) were dropped from the model building. 236
3.5 Statistical analysis 237
On the basis of the primary models generated, the secondary models were developed by 238

11
including the random effect terms that addressed batch and individual variance effects on 239
quality evolution. The non-linear mixed modeling was performed using the nlme library 240
(Pinheiro and Bates, 2000) from the R 2.9.1 software (R Development Core Team 2007), for 241
textural hardness and browning index. 242
243
4.0 Results and discussion 244
4.1 Textural hardness 245
The textural hardness kinetics of button mushrooms stored at different temperatures is shown 246
(Figure 1). It was evident that the while cap hardness could be maintained with storage at 247
3.5oC, higher temperatures produced a decline in textural hardness that was more pronounced 248
with the increase in storage temperature. If storage temperature was changed to 10 o
C, after 4 249
days the mushrooms would have a texture different (p<0.05) from the control at 3.5 o
C and if 250
changed at 15oC after the 2
nd day of storage. 251
The estimated fixed and random effect parameters of the final model are outlined in table 1 252
with 95% confidence intervals, all parameters being significant (p<0.05). Initial models were 253
built considering within-lot and within-batch variability similar to Mohapatra and others 254
2008. When performing individual fits in each batch, it was observed that the standard 255
deviation of the estimated power terms was very low compared to the average (2.2±0.2). In 256
this way, the random effect associated to the term was removed from the model. 257
As indicated in Figure 1, the kinetics, and therefore the rate constant, of texture decay was 258
found to be dependent on the storage temperature. In order to study this, an Ahrrenius plot 259
with the random effects associated to the k parameter of a model without temperature 260
dependence was built (see Figure 2) which confirmed this dependence. From the slope of the 261
linear regression of Figure 2, energy of activation of 190±40 kJ/mol could be estimated. This 262
value was used as an initial estimate for the one-step estimation of the model parameters. 263

12
The activation energies at the 95% confidence level and the estimates of the initial and final 264
values of hardness and the power term for the final model are shown (Table 1). The 265
activation energy for the loss of mushroom hardness (207±42 kJmol-1
) value was well within 266
the range of other quality characteristics for other reported forms of stored vegetables 267
(Giannakourou and Taoukis 2003; Piagentini and others 2005). The estimated power term 268
(2.2 > 1) suggested that the kinetics had a downward concavity feature that made texture 269
kinetics depart from conventional first order kinetics. The best fitted values for mushroom 270
textural hardness when stored under different temperature-time for different batches of 271
mushrooms are shown (Figure 3). It can be seen that the model describes the kinetics and the 272
differences between abuse storage temperature and control. Despite the natural variability, 273
mushrooms abused suffer a decrease in hardness that is apportioned to the temperature abuse 274
and that the model built in the present study is able to reproduce. 275
276
The random effect terms in Table 1 suggest that the final value of the mushroom hardness at 277
the end of storage ( BH) did not vary much among batches, compared to the variation in 278
initial textural hardness ( A-BH), which is 5 times higher. The structure of the best model fit 279
and the estimated parameters point to the interesting hypothesis that as a result of storage, the 280
variation between batches of mushrooms will decrease. The variation of the reaction rate 281
constant between batches showed a coefficient of variation of over the 30%, (Table 1). This 282
is characteristic of the high variability associated to fresh produce for retail in general and in 283
particular of mushrooms (Aguirre and others 2009) 284
285
4.2 Browning index 286
The kinetics of the average browning index for different temperatures of storage is shown in 287
(Figure 4). From a graphical inspection similar conclusions can be drawn as with the texture 288
13
in respect to the effect of temperature abuse during the storage of mushrooms can be 289
concluded, with time and temperature having a significant effect (p<0.05). Since the loss of 290
hardness and browning of mushrooms are governed by enzymatic activities, low temperature 291
storage would inactivate the enzymes thus slowing down the metabolic activities and other 292
biochemical process. Storage at 5oC after 5 days produces a browning index different from 293
control conditions and after 4 days at 10oC. From comparing Figure 1 and Figure 4 variation 294
in color of mushrooms seems to be less pronounced than that of texture. This is in agreement 295
with previous results found for enzymatic activity responsible of browning (Mohapatra and 296
others 2008). 297
298
The best fit model to the data is presented in Figure 5. There was an increasing trend in the 299
browning index with respect to storage days and storage temperature. The pattern does not 300
seem to follow first order kinetics, although many researchers have proposed a logistic 301
function, or a zero order function, to describe this color change in fruits and vegetables 302
during storage (Giannakourou and Taoukis 2002; Lukasse and Polderdijk 2003; Muskovics 303
and others 2006; Hertog and others 2007b). In this study, a steady increase in the color 304
pattern was evident as storage time progressed. When the mushrooms were initially 305
received/purchased, their color was predominantly white, but as the storage days progressed 306
the discoloration on the cap intensified due to both enzymatic reactions (Jolivet and others 307
1998; Mohapatra and others 2008). The enzymes responsible for browning react with the 308
substrate and the evolution of brown pigmentation occurs. When there is no more substrate 309
available over a longer storage time, the enzymatic reaction slows down and the formation of 310
browning pigments stops (Jolivet and others 1998). As no decline or reversal in browning 311
pigments occurs once formed, the weibull model is most suitable in describing browning 312
index kinetics or color kinetics in mushrooms. There was a difference in the kinetics of 313
14
browning index at higher temperatures. The estimates of both fixed and random parameters 314
are listed (Table 2). The final candidate model indicates that when storage temperatures are 315
very low, there will be no change in the BI with time, however, as temperature increases the 316
final value of the BI at long storage times will be higher. From the structure of the model it 317
can be inferred that no significant increase of browning index would be found theoretically at 318
0oC (through extrapolation). Therefore the best policy would be to employ the lowest 319
refrigeration temperature possible, where the least color variation would be found. This 320
points to the need of ensuring cold chains in mushrooms that ensure the lowest level of 321
browning by maintaining the lowest temperature (Aguirre and others 2009). In terms of 322
slowing down browning as no significant dependence of the rate constant (lkBI) or the shape 323
parameter ( ) with temperature browning kinetics will proceed in the same way 324
independently of the temperature. This seems to be in disagreement with previous results 325
found for frozen mushrooms (Giannakourou and Taoukis, 2002). This is possibly due to the 326
biological processes associated to fresh products where possibly an enzyme expression 327
process is taking place due to the natural senescence of the mushroom (Mohapatra, 2008), 328
instead of the slower temperature controlled processes in frozen foods. However the 329
significant temperature effect found in the parameter BBI-ABI indicates that the higher the 330
temperature the higher the final browning stage of the mushrooms will be. Previous studies 331
(Mohapatra and others 2008) have pointed to an earlier over expression of browning related 332
enzymes associated with temperature abuse, which would be in agreement with this result. 333
While the initial stages of browning might be controlled by the integrity of the mushroom 334
tissues, the integrated effect of an earlier induction of high activity of browning enzymes by 335
temperature abuse would create higher color formation over time. The random effect 336
components of the models represent the effect that the product variability have on the 337
uncertainty of both quality index. As such, the BBI-ABI associated to browning is the 338
15
parameter with a bigger variability (70% CV at 3.5oC) followed by the initial value of the BI 339
ABI (30%), whereas for the texture the lkH is the parameter most affected by product 340
variability (30% CV). This means that the biggest uncertainty resides in controlling the final 341
browning stage of the mushrooms, and then the rate of hardness losses will present the 342
biggest variability. Because of this under the present temperature range, the optimization of 343
texture through temperature control might appear more manageable than the control of 344
browning. However, the policy for controlling browning is clear despite of variability, the 345
lower the temperature the lower the extent of the browning. 346
347
5.0 Conclusion 348
This study has demonstrated the ability to predict the quality of fresh mushrooms stored 349
under isothermal conditions, using models that take into account not only the instrumental 350
error as a source of variance, but also components of variability arising from product 351
variability. The temperature dependence of these qualities gives further insight into the ability 352
to choose proper time-temperature management during storage. Storage under low 353
temperature would delay the biological decay process associated to texture and would extend 354
the shelf-life of the product. In the same way, lower temperature will produce lower levels of 355
browning. The models built can be useful in predicting the quality attributes of fresh 356
mushrooms under a temperature range of 3.5-15°C, which is adopted by most conventional 357
distribution chains and more specifically, during the commercial storage of mushrooms. 358
Browning seems to be the quality index most influenced by product variability, especially in 359
the final value at long storage times. However a strategy of minimising storage temperature 360
warrants a minimum browning appearance. 361
362
Acknowledgements 363

16
This material is based upon works supported by the Science Foundation Ireland under Grant 364
No. 04/BR/E0073. Sincere thanks are due to the Renaniree Mushroom Farm for the supply of 365
mushrooms. 366
367
17
References 368
Aguirre L, Frías JM, Barry-Ryan C, and Grogan H. 2008. Assessing the effect of product 369
variability on the management of the quality of mushrooms (Agaricus 370
bisporus). Postharvest Biol Technol 49:247–254. 371
Aguirre L, Frías JM, Barry-Ryan C and Grogan H. 2009. Modelling browning and brown 372
spotting of mushrooms (Agaricus bisporus) stored in controlled environmental 373
conditions using image analysis. J Food Eng 91(2):280-286. 374
Bates DM and Watts DG. 1988. Nonlinear regression analysis and its applications. Wiley 375
Series in Probability and Statistics. Wiley Interscience, London, UK. 376
Beecher TM, Magan N and Burton, KS. 2001. Water potentials and soluble carbohydrate 377
concentrations in tissues of freshly harvested and stored mushrooms (Agaricus 378
bisporus). Postharvest Biol & Tech 22(2):121-131. 379
Bozkurt H, Bayram M. 2006. Color and textural attributes of sucuk during ripening. Meat 380
Sci 73(2): 344-50. 381
Brennan M, Le Port G, Gormley R. 2000. Post-harvest treatment with citric acid or hydrogen 382
peroxide to extend the shelf life of fresh sliced mushrooms. Leben Wiseen Tech 33: 383
285-9. 384
Burton KS. 1986. Quality - investigations into mushroom browning. Mushroom J. 158:68-385
70. 386
Burton KS. 1989. The quality and storage life of Agaricus bisporus. Mushroom Sci. 12:287–387
293. 388
Burton KS, Frost, CE and Atkey, PT. 1987. Effect of vacuum cooling on mushroom 389
browning. Int J of Food Sci & Tech 22:599-606. 390
Cliffe-Byrnes V, O’Beirne D. 2007. Effects of gas atmosphere and temperature on the 391
respiration rates of whole and sliced mushrooms (Agaricus bisporus)—implications 392

18
for film permeability in modified atmosphere packages. J. Food Sci. 72, 197–204. 393
Fonseca SC, Oliveira FAR, Frías JM, Brecth, JK. 2002. Application of mathematical 394
modeling and computer simulation to the design of modified atmosphere packages 395
accounting for product variability. Computational Techniques in Food Engineering, 396
Chapter 5, Balsa-Canto E, Mora J, Banga JR, Onate E. (editors), p. 70-84. 397
Giannakourou MC, Taoukis PS. 2002. Systematic application of time temperature integrators 398
as tools for control of frozen vegetable quality. J of Food Sci 67(6):2221-2228. 399
Giannakourou MC, Taoukis PS. 2003. Kinetic modeling of vitamin C loss in frozen green 400
vegetables under variable storage conditions. Food Chem 83: 33-41. 401
Gonzalez-Fandos E, Giménez M, Olarte C, Sanz S and Simón 2000. Effect of packaging 402
conditions on the growth of micro-organisms and the quality characteristics of fresh 403
mushrooms (Agaricus bisporus) stored at inadequate temperatures. J of Appl Micr 404
89:624-632. 405
Hertog MLATM, Lammertyn J, Scheerlinck N, Nicolaï BM. 2007a.The impact of biological 406
variation on postharvest behavior: the case of dynamic temperature conditions. 407
Postharvest Biol Technol 43: 183-92. 408
Hertog MLATM, Scheerlinck N, Lammertyn J, Nicolaï BM. 2007b. The impact of biological 409
variation on postharvest behavior of Belgian endive: the case of multiple stochastic 410
variables. Postharvest Biol Technol 43: 78-88. 411
Jolivet S, Arpin N, Wicher HJ, Pellon G. 1998 Agaricus bisporus browning: a review. Mycol 412
Res 102: 1459-83. 413
Ketelaere BD, Stulens J, Lammertyn J, Cuong NV, Baerdemaeker JD. 2006. A 414
methodological approach for the identification and quantification of sources of 415
biological variance in postharvest research. Postharvest Biol Technol 39: 1–9. 416
Kong F, Tang J, Rasco B, Crapo C. 2007. Kinetics of salmon quality changes during thermal 417

19
processing. J Food Eng 83: 510-20. 418
Lammertyn J, De Ketelaere B, Marquenie D, Molenberghs G, Nicolaı BM. 2003. Mixed 419
models for multicategorical repeated response: modeling the time effect of physical 420
treatments on strawberry sepal quality. Postharvest Biol Technol 30: 195-/207. 421
Latreille J, Mauger E, Ambroisine L, Tenenhaus M, Vincent M, Navarro S, Guinot C. 2006. 422
Measurement of the reliability of sensory panel performances. Food Qual Pref 17: 423
369-75. 424
Lavelli V, Pagliarini E, Ambrosoli R, Minati JL, Zanoni B. 2006. Physicochemical, 425
microbial, and sensory parameters as indices to evaluate the quality of minimally-426
processed carrots. Postharvest Biol Technol 40: 34-40. 427
Lespinard AR, Goni SM, Salgado PR, Mascheroni RH. 2009. Experimental determination 428
and modelling of size variation, heat transfer and quality indexes during mushroom 429
blanching. J Food Eng 92:8-17. 430
Lukasse LJS, Polderdijk JJ. 2003. Predictive modeling of post-harvest quality evolution in 431
perishables, applied to mushrooms. J Food Eng 59: 191–8. 432
Maskan M 2001 Kinetics of colour change of kiwi fruits during hot air and microwave 433
drying. J of Food Eng 48: 169–75. 434
McGarry A and Burton KS. 1994. Mechanical properties of the mushroom, Agaricus 435
bisporus. Mycol Res 98(2):241-5. 436
Mohapatra D, Frías JM, Oliveira FAR, Bira ZM, Kerry J. 2008. Development and validation 437
of a model to predict enzymatic activity during storage of cultivated mushrooms 438
(Agaricus bisporus) J. Food Eng 86:39–48. 439
Montanez JC, Frías, JM, Fonseca SC, Luna R, Fernandez P, Oliveira FAR. 2002. 440
Mathematical modeling accounting for food product variability using mixed effects 441
models. In the Proceedings of International Conference on Simulation in Food and 442

20
Bio-Industry, Cork, Ireland, p 35 -9. 443
Muskovics G, Felföldi J, Kovács E, Perlaki R, Kállay T. 2006. Changes in physical 444
properties during fruit ripening of Hungarian sweet cherry (Prunus avium L.) 445
cultivars. Postharvest Biol Technol 40: 56-63. 446
Piagentini AM, Mendez JC, Guemes DR, Pirovani ME. 2005. Modelling changes of sensory 447
attributes for individual and mixed fresh-cut leafy vegetables. Postharvest Biol 448
Technol 38: 202-12. 449
Pinheiro JC, Bates DM. 2000. Mixed-Effects Models in S and S-Plus. Springer-Verlag, New 450
York. 451
R Development Core Team. 2007. R: a language and environment for statistical computing. 452
R Foundation for Statistical Computing, Available from: http://www.R-project.org 453
Schouten RE, Huijben TPM, Tijskens LMM, Van Kooten O. 2007. Modeling quality 454
attributes of truss tomatoes: Linking color and firmness maturity. Postharvest Biol 455
Technol 45: 298-306. 456
Schouten RE, Jongbloed G, Tijskens LMM, Van Kooten O. 2004. Batch variability and 457
cultivar keeping quality of cucumber. Postharvest Biol Technol 32: 299–310. 458
Vizhanyo, T., Felföldi, J., 2000. Enhancing colour differences in images of diseased 459
mushrooms. Comp Elec Agric 26, 187–198. 460
Zivanovic S, Buescher R and Kim SK 2003 Mushroom texture, cell wall composition, color, 461
and ultrastructure as affected by pH and temperature. J of Food Sci 68(5):1860-1865 462
Zivanovic S and Buescher R 2004 Changes in mushroom texture and cell wall composition 463
affected by thermal processing. J of Food Sci 69(1): SNQ44-49 464
465
466

21
List of abbreviations 467
Standard deviation 468
A-BH Variation in the hardness value at the initial stage, N 469
ABI Variation in the browning index value at the final stage 470
ABI-ABI Variation in the browning index value at the final stage 471
BH Variation in the hardness value at the final stage, N 472
BI Dimensionless Shape factor for browning index. 473
H Dimensionless shape parameter for hardness 474
lkBI Variation in the log rate constant of the weibull curve for browning index 475
lkH Variation in the log rate constant of the weibull curve for hardness 476
a,b,c Constants of polynomial equation 477
ABI Upper asymptotic value of the weibull curve 478
AH Initial hardness of mushroom cap, N 479
AIC Akaike's Information Criterion 480
BBI Initial value of the browning index 481
BH Final hardness of mushroom cap, N 482
BI Browning Index 483
BIC Bayesian Information Criterion 484
BLUP Best linear unbiased prediction 485
CV Coefficient of Variation 486
Ea Activation Energy of the process, kJmol-1
487
H Textural hardness, N 488
k Rate constant for weibull distribution 489
kref Rate constant at the reference temperature 490
lkBI Log rate constant of the browning reaction 491
22
lkH The rate constant of texture decay at the reference temperature 492
p Probability 493
R Universal gas constant, 8.314 kJ Mol-1
K-1
494
R2 Coefficient of determination 495
REML Restricted maximum likelihood 496
t Storage duration (day) 497
Tref Reference temperature (278K) 498
499

23
List of Figures 500
501
Figure 1 Average textural hardness kinetics of mushrooms at different storage temperatures 502
15°C, 10°C, + 5°C, 3.5°C (control). Error bars represent 95% confidence intervals 503
based on the t-distribution for each time/temperature combination. 504
505
Figure 2 Arrhenius plot of the individually fitted parameter for each batch studied. 506
507
Figure 3 Typical textural hardness kinetics of mushrooms batches at different storage 508
temperatures with their respective control and best linear unbiased predictors 509
(BLUP) of the model described in Table 1 (a) 15°C (observed), - 510
15°C(BLUP),(b)o 10°C (observed), - 10°C (BLUP), (c) 5°C (observed), - 5°C 511
(BLUP), Δ 3.5°C(observed), --- 3.5°C (BLUP) 512
513
Figure 4 Average Browning Index kinetics of mushrooms at different storage temperatures 514
15°C, 10°C, + 5°C, 3.5°C (control). Error bars represent 95% Gaussian confidence 515
intervals based on the t-distribution for each time/temperature combination. 516
517
Figure 5 Typical browning index kinetics of mushrooms at different storage temperatures 518
fitted to weibull model (a) 15°C (observed), - 15°C(predicted),(b)o 10°C (observed), 519
- 10°C (predicted), (c) 5°C (observed), - 5°C (predicted), Δ 3.5°C(observed), --- 520
3.5°C (predicted). It can be seen that mushroom storage temperature has an effect on 521
the average browning kinetics and how inherent mushroom variability influences the 522
whole process. 523
524

24
525
526
527
Figure 1 Typical textural hardness kinetics of mushrooms at different storage temperatures 528
15°C, 10°C, Δ 5°C, × 3.5°C (control) 529
530
0
20
40
60
80
100
120
0 2 4 6 8 10
Storage Days
Ha
rd
ness
, N
15°C
10°C
5°C
3.5°C

25
531
532
Figure 2 Typical textural hardness kinetics of mushrooms at different storage 533
temperatures fitted to weibull model (a) 15°C (observed), - 15°C(predicted),(b)o 534
10°C (observed), - 10°C (predicted), (c) 5°C (observed), - 5°C (predicted), Δ 535
3.5°C(observed), --- 3.5°C (predicted) 536
537
0
20
40
60
80
100
120
0 1 2 3 4 5 6 7
Storage Days
(a)
Ha
rd
ness
, N
0
10
20
30
40
50
60
70
80
0 1 2 3 4 5 6 7 8
Storage Days
(b)
Ha
rd
ness
, N
0
20
40
60
80
100
120
0 1 2 3 4 5 6 7 8 9
Storage Days
(c)
Ha
rd
ness
, N

26
538
539
540
Figure 3 Normal distribution plot for the proposed weibull model fitted to the textural 541
hardness data of mushrooms stored under controlled conditions of temperature considering 542
the batch variability 543
544
545
546

27
547
Figure 4 Typical browning index kinetics of mushrooms at different storage temperatures 548
15°C, 10°C, Δ 5°C, × 3.5°C (control) 549
550
0
5
10
15
20
25
30
35
40
0 1 2 3 4 5 6 7 8 9
Storage Days
Bro
wn
ing
In
dex
15°C 10°C 5°C 3.5°C

28
551
552
Figure 5 Typical browning index kinetics of mushrooms at different storage 553
temperatures fitted to weibull model (a) 15°C (observed), - 15°C(predicted),(b)o 554
10°C (observed), - 10°C (predicted), (c) 5°C (observed), - 5°C (predicted), Δ 555
3.5°C(observed), --- 3.5°C (predicted) 556
557
0
5
10
15
20
25
30
35
40
45
0 1 2 3 4 5 6 7
Storage Days
(a)
Bro
wn
ing
In
dex
0
5
10
15
20
25
30
35
40
45
0 1 2 3 4 5 6 7 8
Storage Days
(b)
Bro
wn
ing
In
dex
0
5
10
15
20
25
30
35
0 1 2 3 4 5 6 7 8 9
Storage Days
(c)
Bro
wn
ing
In
dex

29
558
559
560
561
562
Figure 6 Normal distribution plot for the proposed weibull model fitted to the browning index 563
of mushrooms stored under controlled conditions of temperature considering the batch 564
variability 565
566

30
Table 1 Parameter estimates of the Weibull model for predicting the textural hardness of 567
mushroom 568
Fixed Parameters
Parameter Low 95% CI Estimate Up95%CI
A 13.241 15.726 18.211
A-B -55.322 -49.876 -44.429
n 1.840 2.234 2.628
.(Intercept) -1.443 -0.263 0.917
. [1/Temperature] -179252.8 -127525.4 -75798.1
Random parameters
Parameter Low 95% CI Estimate Up95%CI
(A) 0.444 1.913 8.252
(A-B) 6.945 10.250 15.126
( [Intercept]) 0.830 1.207 1.755
* shows the direct temperature effect on the rate constant of the hardness 569
570
571

31
Table 2 Parameter estimates of the Weibull model for predicting the browning index of 572
mushroom 573
Fixed Parameters
Parameter Low 95% CI Estimate Up95%CI
Asymp 17.542 21.470 25.397
Initial 11.462 12.184 12.905
I 1.307 1.540 1.772
2.212 3.005 3.799
Random parameters
Parameter Low 95% CI Estimate Up95%CI
(Asymp) 5.588 8.135 11.842
(Initial) 1.082 1.540 2.192
(I ) 0.250 0.392 0.615
0.668 0.936 1.312
574
575
576


