Embed Size (px)
Citation preview

Bird Conservation International (2010) 20:440–455. ª BirdLife International, 2010
doi:10.1017/S0959270910000298
Population estimates and habitat use by theCritically Endangered Taita Apalis Apalisfuscigularis in south-eastern Kenya
LUCA BORGHESIO, DAINA SAMBA, MWANGI GITHIRU
LEON BENNUN and KEN NORRIS
Summary
The Taita Apalis Apalis fuscigularis (IUCN category: Critically Endangered) is a species endemicto south-eastern Kenya. We assessed population size and habitat use in the three forest sites inwhich it is known to occur (Ngangao, Chawia and Vuria, totalling 257 ha). The estimate of totalpopulation size, derived from distance sampling at 412 sample points, ranged from 310 to 654
individuals, with the northern section of Ngangao fragment having 10-fold higher densities thanChawia (2.47–4.93 versus 0.22–0.41 birds ha�1). Ngangao north alone hosted 50% of the globalpopulation of the species. The highly degraded Vuria fragment also had moderately highdensities (1.63–3.72 birds ha�1) suggesting that the species tolerates some human disturbance.Taita Apalis prefers vegetation with abundant climbers, but the predictive power of habitat usemodels was low, suggesting that habitat structure is not a primary cause for the low density ofthe species in Chawia. Protecting the subpopulation in the northern section of Ngangao isa priority, as is identifying factors responsible of the low abundance in Chawia, becauseameliorating conditions in this large fragment could substantially increase the population ofTaita Apalis.
Introduction
The Taita Hills of south-eastern Kenya are an ancient mountain massif forming the northern-most reach of the Eastern Arc Mountains range, one of 34 global biodiversity hotspots(Mittermeier et al. 2004). The tiny forest remnants of the Taita Hills boast a remarkableamount of endemic biodiversity, including plants, vertebrates and invertebrates (Burgess et al.2007), but the survival of these species is threatened by a rapidly expanding human population.Currently, natural forest in the hills is restricted to 12 small fragments embedded in a landscapedominated by smallholder agriculture and villages, where the human population is approxi-mately 250,000 and density reaches 1,400 individuals km�2 (BirdLife International 2008a).
Two species of birds, Taita Thrush Turdus helleri and Taita Apalis Apalis fuscigularis areendemic to the Taita, while a third one (Taita White-eye Zosterops silvanus, also found onnearby Mount Kasigau) has been treated as a full species or a subspecies of the more broadly-ranging Montane White-eye Zosterops poliogastrus (Collar et al. 1994, Stattersfield et al. 2000).All these taxa are threatened by degradation of their extremely restricted ranges, but while morework has been done on the thrush (Lens et al. 1998, 2002a, Lens and Eggermont 2008, Galbuseraet al. 2000) and on the white-eye (Mulwa et al. 2007), very limited information is currentlyavailable on the apalis. Apalis fuscigularis is listed as ’Critically Endangered’ in the IUCN RedList (BirdLife International 2008b), but no accurate assessment of its population size and ecologyhas ever been published.
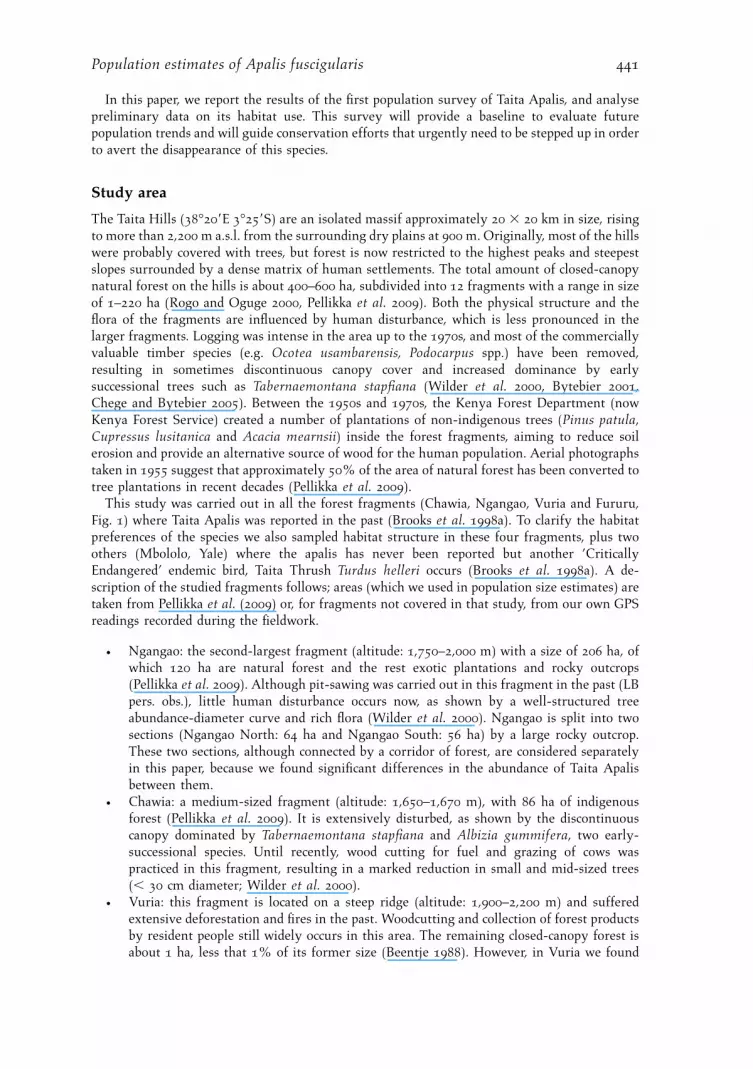
In this paper, we report the results of the first population survey of Taita Apalis, and analysepreliminary data on its habitat use. This survey will provide a baseline to evaluate futurepopulation trends and will guide conservation efforts that urgently need to be stepped up in orderto avert the disappearance of this species.
Study area
The Taita Hills (38�209E 3�259S) are an isolated massif approximately 20 3 20 km in size, risingto more than 2,200 m a.s.l. from the surrounding dry plains at 900 m. Originally, most of the hillswere probably covered with trees, but forest is now restricted to the highest peaks and steepestslopes surrounded by a dense matrix of human settlements. The total amount of closed-canopynatural forest on the hills is about 400–600 ha, subdivided into 12 fragments with a range in sizeof 1–220 ha (Rogo and Oguge 2000, Pellikka et al. 2009). Both the physical structure and theflora of the fragments are influenced by human disturbance, which is less pronounced in thelarger fragments. Logging was intense in the area up to the 1970s, and most of the commerciallyvaluable timber species (e.g. Ocotea usambarensis, Podocarpus spp.) have been removed,resulting in sometimes discontinuous canopy cover and increased dominance by earlysuccessional trees such as Tabernaemontana stapfiana (Wilder et al. 2000, Bytebier 2001,Chege and Bytebier 2005). Between the 1950s and 1970s, the Kenya Forest Department (nowKenya Forest Service) created a number of plantations of non-indigenous trees (Pinus patula,Cupressus lusitanica and Acacia mearnsii) inside the forest fragments, aiming to reduce soilerosion and provide an alternative source of wood for the human population. Aerial photographstaken in 1955 suggest that approximately 50% of the area of natural forest has been converted totree plantations in recent decades (Pellikka et al. 2009).
This study was carried out in all the forest fragments (Chawia, Ngangao, Vuria and Fururu,Fig. 1) where Taita Apalis was reported in the past (Brooks et al. 1998a). To clarify the habitatpreferences of the species we also sampled habitat structure in these four fragments, plus twoothers (Mbololo, Yale) where the apalis has never been reported but another ’CriticallyEndangered’ endemic bird, Taita Thrush Turdus helleri occurs (Brooks et al. 1998a). A de-scription of the studied fragments follows; areas (which we used in population size estimates) aretaken from Pellikka et al. (2009) or, for fragments not covered in that study, from our own GPSreadings recorded during the fieldwork.
d Ngangao: the second-largest fragment (altitude: 1,750–2,000 m) with a size of 206 ha, ofwhich 120 ha are natural forest and the rest exotic plantations and rocky outcrops(Pellikka et al. 2009). Although pit-sawing was carried out in this fragment in the past (LBpers. obs.), little human disturbance occurs now, as shown by a well-structured treeabundance-diameter curve and rich flora (Wilder et al. 2000). Ngangao is split into twosections (Ngangao North: 64 ha and Ngangao South: 56 ha) by a large rocky outcrop.These two sections, although connected by a corridor of forest, are considered separatelyin this paper, because we found significant differences in the abundance of Taita Apalisbetween them.
d Chawia: a medium-sized fragment (altitude: 1,650–1,670 m), with 86 ha of indigenousforest (Pellikka et al. 2009). It is extensively disturbed, as shown by the discontinuouscanopy dominated by Tabernaemontana stapfiana and Albizia gummifera, two early-successional species. Until recently, wood cutting for fuel and grazing of cows waspracticed in this fragment, resulting in a marked reduction in small and mid-sized trees(, 30 cm diameter; Wilder et al. 2000).
d Vuria: this fragment is located on a steep ridge (altitude: 1,900–2,200 m) and sufferedextensive deforestation and fires in the past. Woodcutting and collection of forest productsby resident people still widely occurs in this area. The remaining closed-canopy forest isabout 1 ha, less that 1% of its former size (Beentje 1988). However, in Vuria we found
Population estimates of Apalis fuscigularis 441

Taita Apalis also outside of true forest, in the extensive (51 ha) montane scrubland withscattered trees that surrounds the forest remnants.
d Fururu: a disturbed fragment (altitude: 1,700–1,800 m), with a total area of 62 ha, ofwhich only 8 ha are natural forest, and the rest exotic tree plantations (Pellikka et al.2009). Taita Apalis occurred in this fragment until recent times (Brooks et al. 1998b).
d Yale: a fragment at about 1,950 m altitude, with 16 ha of natural forest (Pellikka et al.2009) and relatively good arboreal vegetation (Chege and Bytebier 2005). Even thoughTaita Apalis has never been reported, Taita Thrush occurs here, suggesting that otherlocally endemic species might also be present.
d Mbololo: the largest forest fragment (220 ha), with the best preserved vegetation andrichest flora, dominated by primary forest trees such as Aningeria adolfi-frederici andStrombosia schlefferi (Wilder et al. 2000) at 1,400–1,800 m. Mbololo is the mostimportant stronghold for Taita Thrush (Lens et al. 2002a), but Taita Apalis has neverbeen observed.
Field methods
Bird counts
We estimated population density in Ngangao, Chawia and Vuria with unlimited distance pointcounts carried out in two rounds between 24 February and 6 June 2001 (round 1) and between 29
June and 15 September 2001 (round 2). Sample points were located in natural habitats (i.e. we
Figure 1. Map of the Taita Hills and of the forest fragments where this survey was carried out.The grey line marks the 1,000 m contour.
L. Borghesio et al. 442
excluded exotic tree plantations) and formed a grid with 75 m-sized cells that covered the entirearea of the sampled fragments. During each of the two rounds of counts, we sampled points alongalternate lines of the grid (i.e. lines sampled during each round were laterally spaced by 150 m,and points were placed at 75 m intervals along each line). Thus, half of the grid in each fragmentwas sampled in each round, and each fragment was covered with approximately equal samplingeffort in the two rounds. We used compass and measuring tape to navigate between points, andwe surveyed 412 points (Chawia: 130, Ngangao North: 102, Ngangao South: 85, Vuria: 95).Survey effort ranged between 1.5 (Chawia) and 1.8 (Vuria) points ha�1 due to inaccessibility ofa few points located on very steep slopes. The survey team consisted of three observers in orderto maximise the number of records of this rare and secretive species. Observers counted birds for20 minutes, recording both visual and aural signs of presence of the target species. We visuallyestimated distances from the census point to the birds. We also recorded the time elapsed fromthe start of the count to each detection. All counts were carried out in clear weather conditions,and observers practiced estimating distances before the start of the survey. Since preliminaryobservations suggested that vocal activity of the species did not vary much through time, countswere carried out at all times of the day, except in the early hours (06h00–08h00) when intensevocal activity of other species made detection of apalis calls more difficult.
Habitat description
We recorded 11 habitat descriptors to assess habitat use and differences between occupied andunoccupied forest fragments. In Chawia, Ngangao and Vuria, data were collected inside 10 m-radius plots centred on the sample points where the bird count was carried out. Due to practicalconstraints (e.g. steep slopes or meteorological conditions), the number of points where habitatdata were recorded (383) is lower than the total number of points where the bird counts werecarried out (412). We also recorded habitat data at 183 additional points in Mbololo, Yale andFururu (Taita Apalis absent). In these fragments, habitat data were recorded at 75 m intervalsalong randomly located transects running through the fragment. Eight structural habitatdescriptors were recorded: the number of tree stems in four classes of diameter at breast height(, 10 cm, 10–20 cm, 20–30 cm, .30 cm), the number of cut woody stems (an estimator ofintensity of human activity), and visual estimates of percentage canopy cover, average canopyheight and percentage of trees covered by climbers. Three floristic habitat descriptors were alsovisually estimated: percentage cover of two gap-selecting heliophilous species (the bracken fernPteridium aquilinum and the shrub Plectranthus barbatus) and percentage cover of onesciaphilous forest understory species, the shrub Dracaena laxissima.
Data analysis
Population estimates
To generate estimates of density and population size in each fragment, we used the softwareDISTANCE 5.0 (Thomas et al. 2006). We plotted a frequency histogram of all observationdistances, which suggested heaping (i.e. a tendency to round distances to certain preferredvalues); distances were therefore grouped into bands (0–16, 17–24, 25–40 and 41–60 m) in orderto smooth the irregularities. We discarded 11 observations beyond 60 m (9% of total) to improvethe fit of the detection functions. In order to verify if data collected in different fragments andseparate census rounds could be pooled into a single detection function, we fitted preliminarydetection functions to the observations recorded in each fragment and in the two census rounds,and compared values of the Akaike Information Criterion (AIC) for the global and the stratifieddata. Data pooling is acceptable if the sum of the AICs for the stratified data is higher than thatof the pooled data (Buckland et al. 2001).
Population estimates of Apalis fuscigularis 443

Census duration is a critical factor in the estimation of density by distance sampling. Shorttimes can cause g(0), the detection function at zero distance, to be less than 1 due to individualsthat escape detection despite being close to the observers (Bachler and Liechti 2007). Thisproduces negative bias in the estimates of population density. On the contrary, long count timesbias estimates up due to double-counting and to individuals that move into the detection rangeduring the count time. In order to assess optimal census duration, we grouped our observationsinto subsets of progressively increasing duration (6-8-10-15-20 minutes) and produced densityestimates for each of these subsets. We also assessed if detection distances increased with time,which is an indication of movements of birds into the detection range during the count (Lee andMarsden 2008a).
As most (87%) of the observations were auditory and group size cannot be accuratelyestimated by aural detections (Hayward et al. 1991), we generated a single estimate of group sizeand of its standard error (1.67 6 0.16) using the 15 visual observations that were obtained duringthe survey (one in Chawia, five in Ngangao and nine in Vuria; range 1–3 individuals). All thesegroups were observed well (less than 15 m from the observers), and we found no differencebetween fragments or count rounds (Mann-Whitney test, P . 0.05 in all pairwise comparisons).We therefore assumed constant group size across sites and census rounds.
We used AIC to select the model that best fitted the distribution of observation distances.Models whose AIC differed by less than four units were considered acceptable and averaged(Buckland et al. 2001) using 999 bootstrap replications to generate, separately for each fragment,final estimates of density of groups of Taita Apalis as well as their log-normally distributed 95%confidence intervals (Buckland et al. 2001). Density of individuals and total population size werecalculated by multiplying estimated group size by estimates of group density (groups ha�1)produced by DISTANCE for each fragment. Confidence intervals for these calculated values weregenerated with the delta method (Seber 1982).
As a final step, we tested if subpopulations of Taita Apalis located in Chawia, the two sections ofNgangao and Vuria had different density. However, our density estimates cannot be directlycompared between forest fragments, because they are not statistically independent, as weassumed constant group size and detection function. Therefore, we used Z-tests to compareencounter rates, and we assume that different encounter rates in two fragments are an indicationthat those fragments also have different densities of the focal species.
Habitat use
In order to find if there was any difference in the habitats of occupied versus unoccupiedfragments, we used univariate ANOVAs to compare the eleven habitat descriptors across all theforest fragments. For these analyses, counts were log-transformed and percentages arcsine-square-root transformed. As habitat descriptors are usually correlated and show complex patternsof variation that are not easily highlighted by univariate analyses, we further explored thevariability in habitat structure using non-metric multidimensional scaling (NMDS: Legendre andLegendre 1998) to draw a two-dimensional graphic representation of vegetation structure acrossstudy sites. NMDS is particularly suited to the analysis of ecological data, as it is a robustordination technique making no assumptions on the distribution or the shape of the relationshipsbetween variables. NMDS produces an ordination of the sampling units (the plots where habitatstructure was assessed) on an arbitrarily chosen number of axes correlated to the originalvariables, and can therefore summarise general patterns of variation within complex datasets.
We also compared the characteristics of the sample points where Taita Apalis was found withthe points were the species was absent. This analysis was done only within the fragments whereTaita Apalis was observed (Chawia, Ngangao and Vuria), because sites in unoccupied fragmentsmay be empty for reasons not related to habitat characteristics (Lens et al. 2002b). Since werecorded habitat descriptors in 10 m-radius plots centred on the census point, and most of thebirds contacted during the counts were more than 10 m from the observers, there is a risk that
L. Borghesio et al. 444

habitat measurements did not reflect the habitat used by birds located far from the observers.Therefore, we first analysed the entire set of presence records of Taita Apalis, but then repeatedthe analyses with subsets including only records obtained at , 40 m, , 20 m and , 10 m (n 5
118, 82, 54 and 13 observations respectively). We used a generalised linear model with binomialerror and logit link to model the presence/absence. We reduced multicolinearity in the dataset bycalculating pairwise correlations (Spearman’s Rho) between pairs of habitat variables andretaining only one habitat descriptor (the one with highest univariate fit to the Taita Apalispresence data as suggested by AIC) in each pair of variables with Rho $ 0.4. This resulted ina total of six habitat descriptors assessed (cover of Dracaena and Plectranthus, abundance of treeswith diameter between 10 and 20 cm, canopy height, cover of climbers and number of cut stems).Interactions between factors as well as squared terms were not considered to avoid the risk ofoverfitting the model (Burnham and Anderson 2002).
Spatial autocorrelation in the data was indicated by significant (P , 0.05) Moran’s I index(Moran 1950), ranging between 0.22 and 0.32 up to 300 m around the sample points.Autocorrelation causes increased type I (false positive) error in statistical tests (Legendre andLegendre 1998), therefore we controlled it by adding two additional factors in the models. Thefirst (SITE) had levels corresponding to each of the four sites (Ngangao South and North, Vuriaand Chawia) and represented variation in observation frequency across forest fragments. Thesecond was an autoregressive term (Rangel et al. 2006):
Y5 qWY þ e
where q is the autoregression parameter and the matrix W contains weights wij calculated as aninverse function of geographical distances between couples of sample points. Autocorrelation canbe caused by the response of the target species to spatially structured habitat features, whichmeans that controlling spatial autocorrelation can lead to underestimating the environmentalfactors that control the distribution of a species (Dormann et al. 2007). For this reason, besidesspatially-corrected models (six habitat descriptors + site or autoregressive term), we alsoconsider partial models including habitat factors alone.
Model selection was carried out using an information-theoretic approach (Burnham andAnderson 2002). We tested all the possible combinations of variables, and all the models with AICvalues within four units from the minimum were considered acceptable. We assessed modelperformance with Cohen’s kappa (Cohen 1960), an estimator of the agreement between observedand modelled data that controls for agreement occurring by chance alone. Values of kappabetween 0 and 0.40 indicate slight to fair, 0.41–0.60 moderate, and values above 0.61 good modelperformance.
Results
Population estimates
We found Taita Apalis in only three fragments (Ngangao, Vuria and Chawia). In Ngangao andChawia, the species only occurred in natural forest, but in Vuria it was observed mainly in thescrub-like vegetation with scattered remnant trees that forms most of the natural vegetation ofthis fragment. These three fragments were the object of the population survey, which yielded 129
records of the focal species, of which 118 were inside the 60 m truncation distance (Chawia: 130
points and 6 records; Ngangao North: 102 and 55; Ngangao South: 85 and 19; Vuria: 95 and 38).As AIC values of a global detection function were . 4 units lower than summed AICs for the
stratified data, we pooled all the observations across fragments and census rounds in a singledetection function. A model with Hazard-rate key function and no adjustments scored the lowestAIC value, but two others (Half-normal + cosine and Uniform + polynomial) were also possiblecandidates (D AIC , 4; Fig. 2).
Population estimates of Apalis fuscigularis 445

Density estimates produced by all candidate models increased with count duration (Fig. 3). Thelongest count time (20 min) produced estimates more than twice larger than those produced bythe shortest count time (6 min). However, all models estimated a global population of less than1,000 individuals (Table 1).
Average detection distances (28.2 m, n 5 129) did not increase with count duration (Least-squares regression, r2 5 0.006, P 5 0.43). Substantial numbers of detections at less than 20 mfrom the observers were obtained even towards the end of the 20-min count (Fig. 4).
Encounter rates varied between fragments. Chawia had lower rates than all other fragments,and Ngangao North had higher encounter rates than Ngangao South for all count durations (Z-test, all P , 0.05). Vuria did not differ from Ngangao North, but had significantly higherencounter rates than Ngangao South at 10 and 20 min count durations (Z-test, P , 0.05).
Habitat use
There were highly significant differences between the mean values of all 11 habitat descriptors inthe forest fragments (Table 2). In general, larger fragments (Mbololo, Ngangao north and south)had higher densities of trees in all diameter classes, lower number of cut woody stems, highercover of Dracaena and lower of Plectranthus and Pteridium. However, Chawia, despite being
Figure 2. Histograms of the observations (scaled by detection distances) with fitted detectionfunctions
L. Borghesio et al. 446

a fairly large fragment (91 ha), with a discontinuous but tall canopy, scored the lowest densitiesof trees in the classes between 0 and 30 cm diameter.
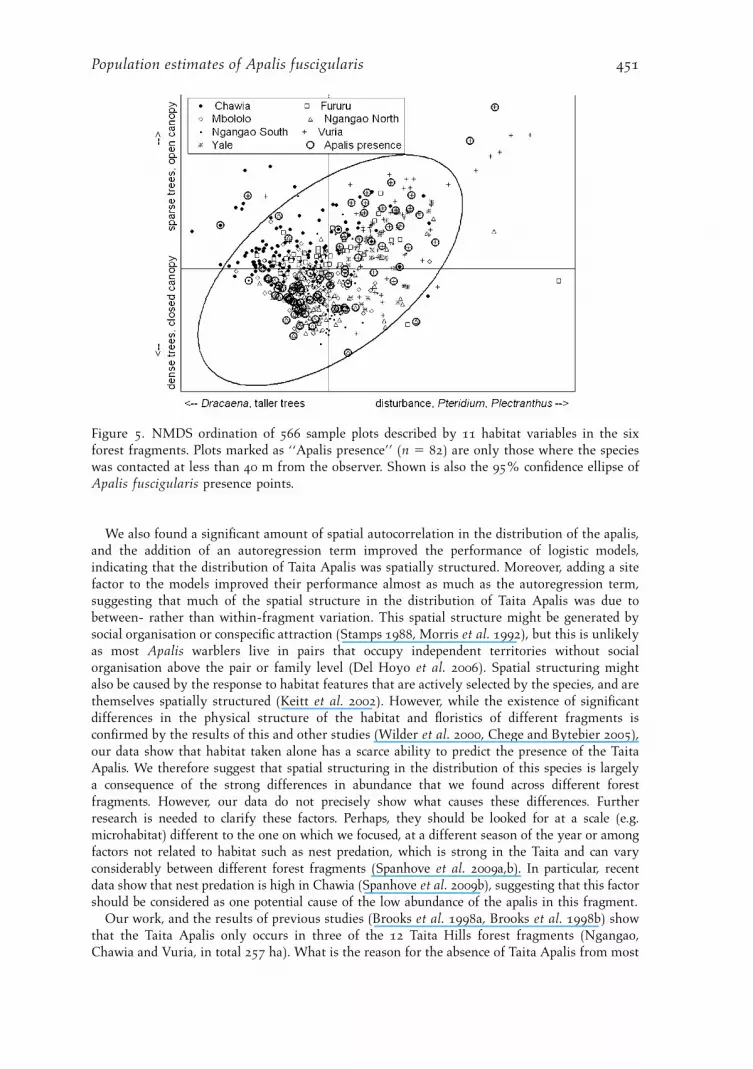
NMDS produced a two-dimensional ordination that captured a substantial proportion of thevariability in the original data (cumulative r2 between ordination distance and original data 5
0.82). Axis 1 (x-axis in Fig. 5) represented a gradient from tall, continuous canopy withDracaena undergrowth to low, discontinuous thicket with high human disturbance and densePteridium and Plectranthus. Axis 2 (y-axis in Fig. 5) was a gradient of decreasing tree density(high negative correlations with number of trees in all diameter classes). Figure 4 shows that thesample plots were mostly arranged along a line from bottom-left toward top-right, representinga gradient from dense, little disturbed to open, bushy and severely disturbed. Even though somedifferences between forest fragments are evident in Fig 5 (e.g. most plots in Vuria are in the topright and most of those in Chawia in the top left quarter of the plot), much overlap in thevegetation structure of different fragments is also evident.
Modelling of habitat use suggested a substantial amount of spatial structuring in thedistribution of the observations, as models that included either the site factor or theautoregression term performed better than those containing only habitat variables, as suggestedby lower AIC and higher Cohen’s kappa (Table 3). In general, models that included theautoregression term had slightly better performance than those with the site factor, except in the10 m data subset, where performance of the two model structures was similar (D AIC , 2, Table 3).Models that included all the observations selected similar sets of variables to those obtained fromsubsets including only birds at 40, 20 or 10 m from the observer. The species showed a preference forsites with higher cover of climbers and, to a lesser extent, of Dracaena. When the site factor and theautoregression term were not included in the models, there was also a preference for denser treecover, lower canopies and more dense cover of Plectranthus, but the predictive power of habitatdescriptors alone was poor (Cohen’s kappa always , 0.15, Table 3). The absence of strongpreferences for any of the habitat descriptors is confirmed by the broad scattering of Taita Apalispresence points in the entire NMDS ordination plot (Fig. 5).
Discussion
This survey reports the first estimates of density and population size for Taita Apalis. Our workwas complicated by the characteristics of the focal species, a small bird that lives in dense
0
0.5
1
1.5
2
0 5 10 15 20 25
Count duration (minutes)
Est
imat
ed d
ensi
ty (g
roup
s/ha
)
Hazard rateHalf-normal cosine Uniform cosine
Figure 3. Relationship between estimated density (6 SE) of Apalis fuscigularis and duration ofthe count time (6-8-10-15-20 min). Points have been slightly staggered along the x-axis toimprove readability.
Population estimates of Apalis fuscigularis 447
vegetation and can be difficult to detect when it is silent. The choice of the detection functionaffected the estimates, as AIC values did not differ enough to allow secure distinction amongmodels. We suggest that, in order to achieve better distinction between candidate functions,future surveys should aim to collect larger sample sizes and more accurate measurements ofsighting distances (e.g. by using laser rangefinders, which were not available to us). Densityestimates were also affected by count duration, as the longest count time (20 min) generatedestimates twice as large as the shortest time (6 min). Upward bias in density estimates can becaused by double counting (multiple detections of the same individuals) or by birds entering intothe detection range during count time. Double counting usually occurs with species that areactive, sing infrequently, and move tens of meters between songs (Cimprich 2009). This appliesonly in part to Taita Apalis, which in our experience does sing infrequently but also spends longtimes foraging on the same tree and rarely moves long distances between one foraging locationand the next. Moreover, birds moving into the detection range should cause increasing detectiondistances towards the end of the count time (Lee and Marsden 2008a), which was not the case inour survey. This suggests that Taita Apalis did not move much during the count time. Thus, biascaused by movement and double counting was probably not major. Instead, we suggest thatestimates at short count times were biased low due to incomplete detection of silent birds close tothe observer. As count duration increased, these individuals were detected when they sang.Indeed, in our survey, birds close to the observers were observed even at the end of the 20 mincount time, suggesting that, at the shortest count durations, probability of detection at zero
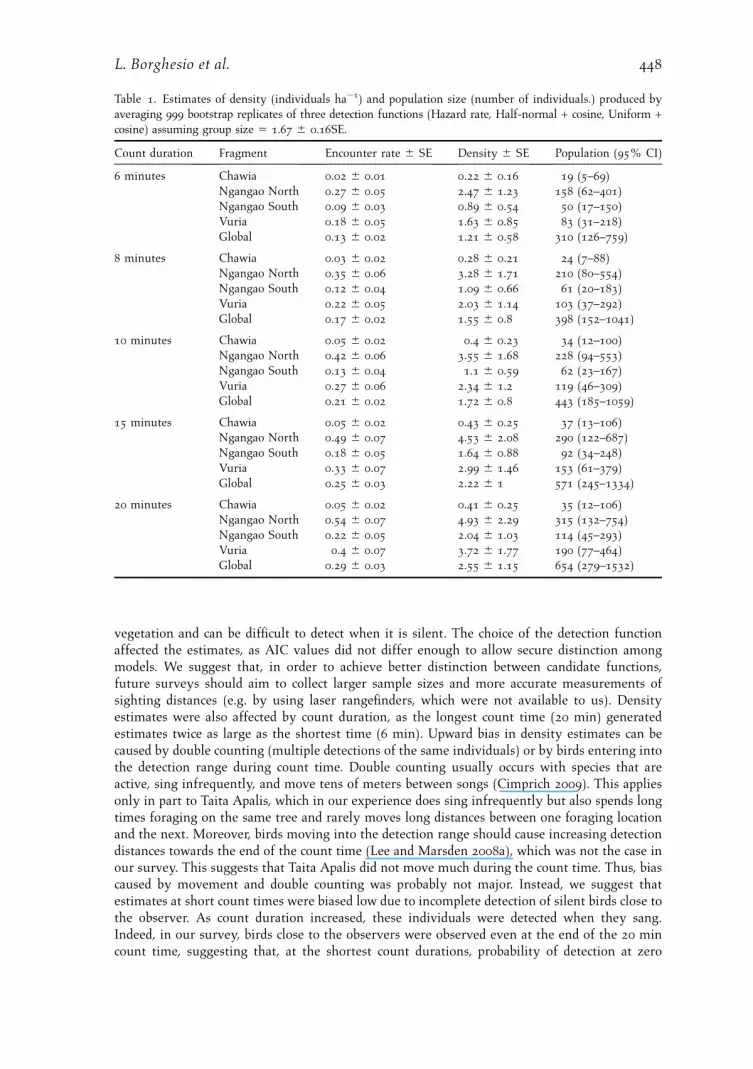
Table 1. Estimates of density (individuals ha�1) and population size (number of individuals.) produced byaveraging 999 bootstrap replicates of three detection functions (Hazard rate, Half-normal + cosine, Uniform +cosine) assuming group size 5 1.67 6 0.16SE.
Count duration Fragment Encounter rate 6 SE Density 6 SE Population (95% CI)
6 minutes Chawia 0.02 6 0.01 0.22 6 0.16 19 (5–69)Ngangao North 0.27 6 0.05 2.47 6 1.23 158 (62–401)Ngangao South 0.09 6 0.03 0.89 6 0.54 50 (17–150)Vuria 0.18 6 0.05 1.63 6 0.85 83 (31–218)Global 0.13 6 0.02 1.21 6 0.58 310 (126–759)
8 minutes Chawia 0.03 6 0.02 0.28 6 0.21 24 (7–88)Ngangao North 0.35 6 0.06 3.28 6 1.71 210 (80–554)Ngangao South 0.12 6 0.04 1.09 6 0.66 61 (20–183)Vuria 0.22 6 0.05 2.03 6 1.14 103 (37–292)Global 0.17 6 0.02 1.55 6 0.8 398 (152–1041)
10 minutes Chawia 0.05 6 0.02 0.4 6 0.23 34 (12–100)Ngangao North 0.42 6 0.06 3.55 6 1.68 228 (94–553)Ngangao South 0.13 6 0.04 1.1 6 0.59 62 (23–167)Vuria 0.27 6 0.06 2.34 6 1.2 119 (46–309)Global 0.21 6 0.02 1.72 6 0.8 443 (185–1059)
15 minutes Chawia 0.05 6 0.02 0.43 6 0.25 37 (13–106)Ngangao North 0.49 6 0.07 4.53 6 2.08 290 (122–687)Ngangao South 0.18 6 0.05 1.64 6 0.88 92 (34–248)Vuria 0.33 6 0.07 2.99 6 1.46 153 (61–379)Global 0.25 6 0.03 2.22 6 1 571 (245–1334)
20 minutes Chawia 0.05 6 0.02 0.41 6 0.25 35 (12–106)Ngangao North 0.54 6 0.07 4.93 6 2.29 315 (132–754)Ngangao South 0.22 6 0.05 2.04 6 1.03 114 (45–293)Vuria 0.4 6 0.07 3.72 6 1.77 190 (77–464)Global 0.29 6 0.03 2.55 6 1.15 654 (279–1532)
L. Borghesio et al. 448
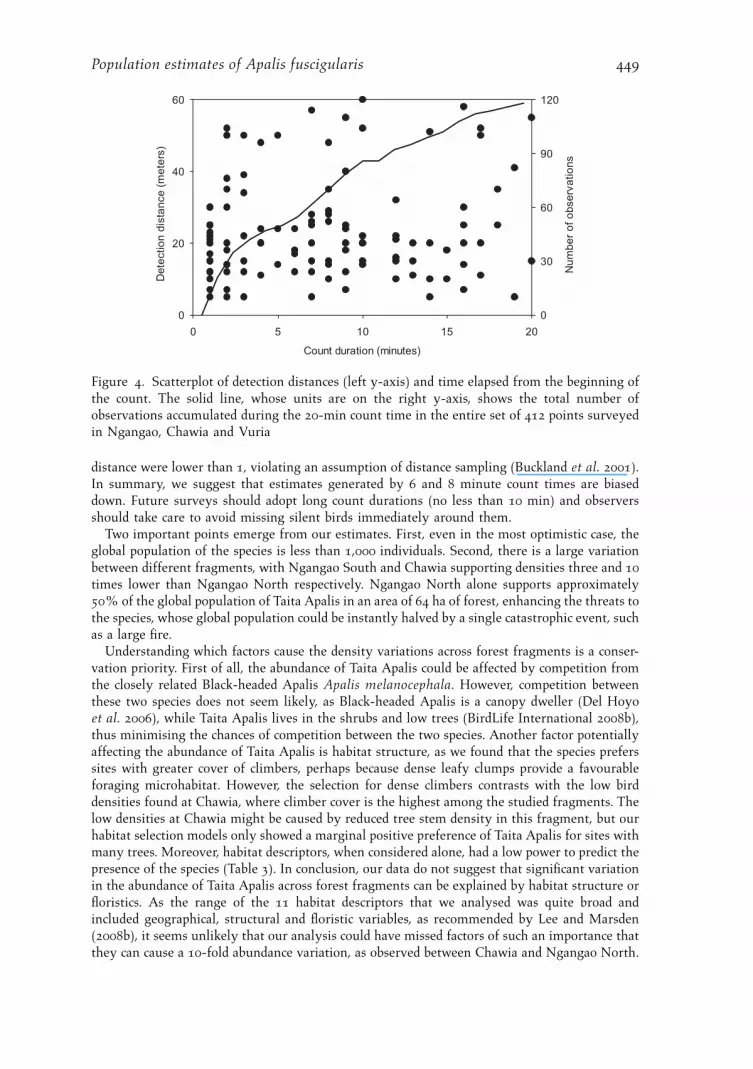
distance were lower than 1, violating an assumption of distance sampling (Buckland et al. 2001).In summary, we suggest that estimates generated by 6 and 8 minute count times are biaseddown. Future surveys should adopt long count durations (no less than 10 min) and observersshould take care to avoid missing silent birds immediately around them.
Two important points emerge from our estimates. First, even in the most optimistic case, theglobal population of the species is less than 1,000 individuals. Second, there is a large variationbetween different fragments, with Ngangao South and Chawia supporting densities three and 10
times lower than Ngangao North respectively. Ngangao North alone supports approximately50% of the global population of Taita Apalis in an area of 64 ha of forest, enhancing the threats tothe species, whose global population could be instantly halved by a single catastrophic event, suchas a large fire.
Understanding which factors cause the density variations across forest fragments is a conser-vation priority. First of all, the abundance of Taita Apalis could be affected by competition fromthe closely related Black-headed Apalis Apalis melanocephala. However, competition betweenthese two species does not seem likely, as Black-headed Apalis is a canopy dweller (Del Hoyoet al. 2006), while Taita Apalis lives in the shrubs and low trees (BirdLife International 2008b),thus minimising the chances of competition between the two species. Another factor potentiallyaffecting the abundance of Taita Apalis is habitat structure, as we found that the species preferssites with greater cover of climbers, perhaps because dense leafy clumps provide a favourableforaging microhabitat. However, the selection for dense climbers contrasts with the low birddensities found at Chawia, where climber cover is the highest among the studied fragments. Thelow densities at Chawia might be caused by reduced tree stem density in this fragment, but ourhabitat selection models only showed a marginal positive preference of Taita Apalis for sites withmany trees. Moreover, habitat descriptors, when considered alone, had a low power to predict thepresence of the species (Table 3). In conclusion, our data do not suggest that significant variationin the abundance of Taita Apalis across forest fragments can be explained by habitat structure orfloristics. As the range of the 11 habitat descriptors that we analysed was quite broad andincluded geographical, structural and floristic variables, as recommended by Lee and Marsden(2008b), it seems unlikely that our analysis could have missed factors of such an importance thatthey can cause a 10-fold abundance variation, as observed between Chawia and Ngangao North.
0
20
40
60
0 5 10 15 20
Count duration (minutes)
Det
ectio
n di
stan
ce (
met
ers)
0
30
60
90
120
Num
ber
of o
bser
vatio
ns
Figure 4. Scatterplot of detection distances (left y-axis) and time elapsed from the beginning ofthe count. The solid line, whose units are on the right y-axis, shows the total number ofobservations accumulated during the 20-min count time in the entire set of 412 points surveyedin Ngangao, Chawia and Vuria
Population estimates of Apalis fuscigularis 449
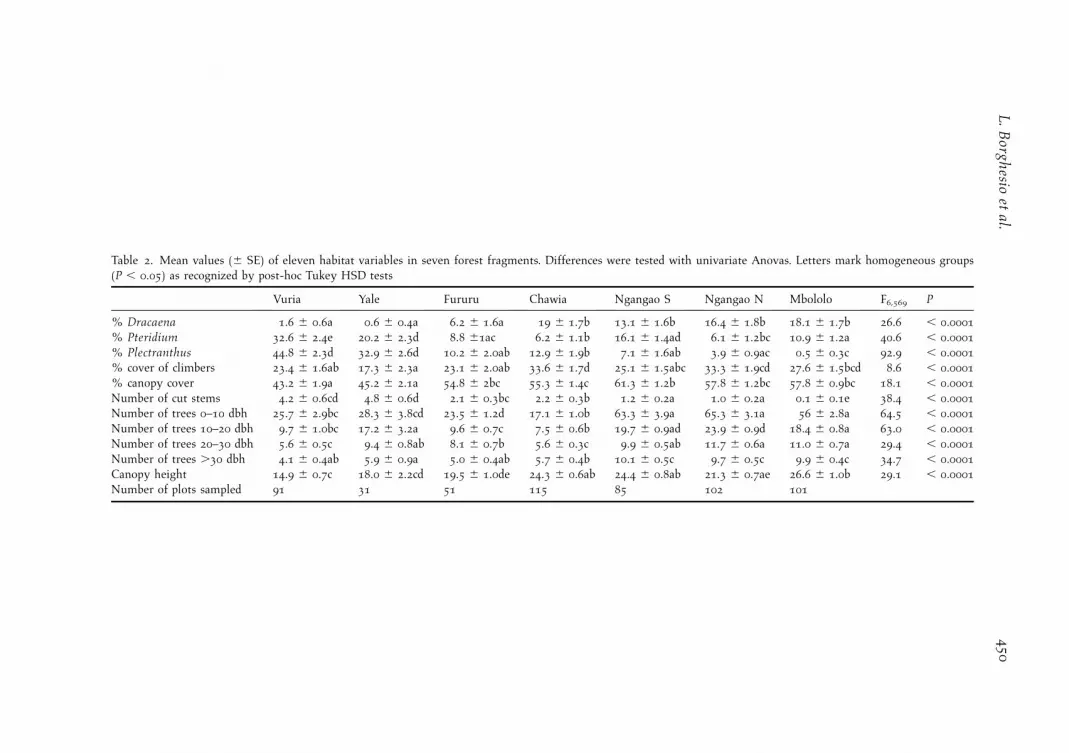
Table 2. Mean values (6 SE) of eleven habitat variables in seven forest fragments. Differences were tested with univariate Anovas. Letters mark homogeneous groups(P , 0.05) as recognized by post-hoc Tukey HSD tests
Vuria Yale Fururu Chawia Ngangao S Ngangao N Mbololo F6,569
P
% Dracaena 1.6 6 0.6a 0.6 6 0.4a 6.2 6 1.6a 19 6 1.7b 13.1 6 1.6b 16.4 6 1.8b 18.1 6 1.7b 26.6 , 0.0001
% Pteridium 32.6 6 2.4e 20.2 6 2.3d 8.8 61ac 6.2 6 1.1b 16.1 6 1.4ad 6.1 6 1.2bc 10.9 6 1.2a 40.6 , 0.0001
% Plectranthus 44.8 6 2.3d 32.9 6 2.6d 10.2 6 2.0ab 12.9 6 1.9b 7.1 6 1.6ab 3.9 6 0.9ac 0.5 6 0.3c 92.9 , 0.0001
% cover of climbers 23.4 6 1.6ab 17.3 6 2.3a 23.1 6 2.0ab 33.6 6 1.7d 25.1 6 1.5abc 33.3 6 1.9cd 27.6 6 1.5bcd 8.6 , 0.0001
% canopy cover 43.2 6 1.9a 45.2 6 2.1a 54.8 6 2bc 55.3 6 1.4c 61.3 6 1.2b 57.8 6 1.2bc 57.8 6 0.9bc 18.1 , 0.0001
Number of cut stems 4.2 6 0.6cd 4.8 6 0.6d 2.1 6 0.3bc 2.2 6 0.3b 1.2 6 0.2a 1.0 6 0.2a 0.1 6 0.1e 38.4 , 0.0001
Number of trees 0–10 dbh 25.7 6 2.9bc 28.3 6 3.8cd 23.5 6 1.2d 17.1 6 1.0b 63.3 6 3.9a 65.3 6 3.1a 56 6 2.8a 64.5 , 0.0001
Number of trees 10–20 dbh 9.7 6 1.0bc 17.2 6 3.2a 9.6 6 0.7c 7.5 6 0.6b 19.7 6 0.9ad 23.9 6 0.9d 18.4 6 0.8a 63.0 , 0.0001
Number of trees 20–30 dbh 5.6 6 0.5c 9.4 6 0.8ab 8.1 6 0.7b 5.6 6 0.3c 9.9 6 0.5ab 11.7 6 0.6a 11.0 6 0.7a 29.4 , 0.0001
Number of trees .30 dbh 4.1 6 0.4ab 5.9 6 0.9a 5.0 6 0.4ab 5.7 6 0.4b 10.1 6 0.5c 9.7 6 0.5c 9.9 6 0.4c 34.7 , 0.0001
Canopy height 14.9 6 0.7c 18.0 6 2.2cd 19.5 6 1.0de 24.3 6 0.6ab 24.4 6 0.8ab 21.3 6 0.7ae 26.6 6 1.0b 29.1 , 0.0001
Number of plots sampled 91 31 51 115 85 102 101
L.
Borgh
esioet
al.4
50
We also found a significant amount of spatial autocorrelation in the distribution of the apalis,and the addition of an autoregression term improved the performance of logistic models,indicating that the distribution of Taita Apalis was spatially structured. Moreover, adding a sitefactor to the models improved their performance almost as much as the autoregression term,suggesting that much of the spatial structure in the distribution of Taita Apalis was due tobetween- rather than within-fragment variation. This spatial structure might be generated bysocial organisation or conspecific attraction (Stamps 1988, Morris et al. 1992), but this is unlikelyas most Apalis warblers live in pairs that occupy independent territories without socialorganisation above the pair or family level (Del Hoyo et al. 2006). Spatial structuring mightalso be caused by the response to habitat features that are actively selected by the species, and arethemselves spatially structured (Keitt et al. 2002). However, while the existence of significantdifferences in the physical structure of the habitat and floristics of different fragments isconfirmed by the results of this and other studies (Wilder et al. 2000, Chege and Bytebier 2005),our data show that habitat taken alone has a scarce ability to predict the presence of the TaitaApalis. We therefore suggest that spatial structuring in the distribution of this species is largelya consequence of the strong differences in abundance that we found across different forestfragments. However, our data do not precisely show what causes these differences. Furtherresearch is needed to clarify these factors. Perhaps, they should be looked for at a scale (e.g.microhabitat) different to the one on which we focused, at a different season of the year or amongfactors not related to habitat such as nest predation, which is strong in the Taita and can varyconsiderably between different forest fragments (Spanhove et al. 2009a,b). In particular, recentdata show that nest predation is high in Chawia (Spanhove et al. 2009b), suggesting that this factorshould be considered as one potential cause of the low abundance of the apalis in this fragment.
Our work, and the results of previous studies (Brooks et al. 1998a, Brooks et al. 1998b) showthat the Taita Apalis only occurs in three of the 12 Taita Hills forest fragments (Ngangao,Chawia and Vuria, in total 257 ha). What is the reason for the absence of Taita Apalis from most
Figure 5. NMDS ordination of 566 sample plots described by 11 habitat variables in the sixforest fragments. Plots marked as ‘‘Apalis presence’’ (n 5 82) are only those where the specieswas contacted at less than 40 m from the observer. Shown is also the 95% confidence ellipse ofApalis fuscigularis presence points.
Population estimates of Apalis fuscigularis 451
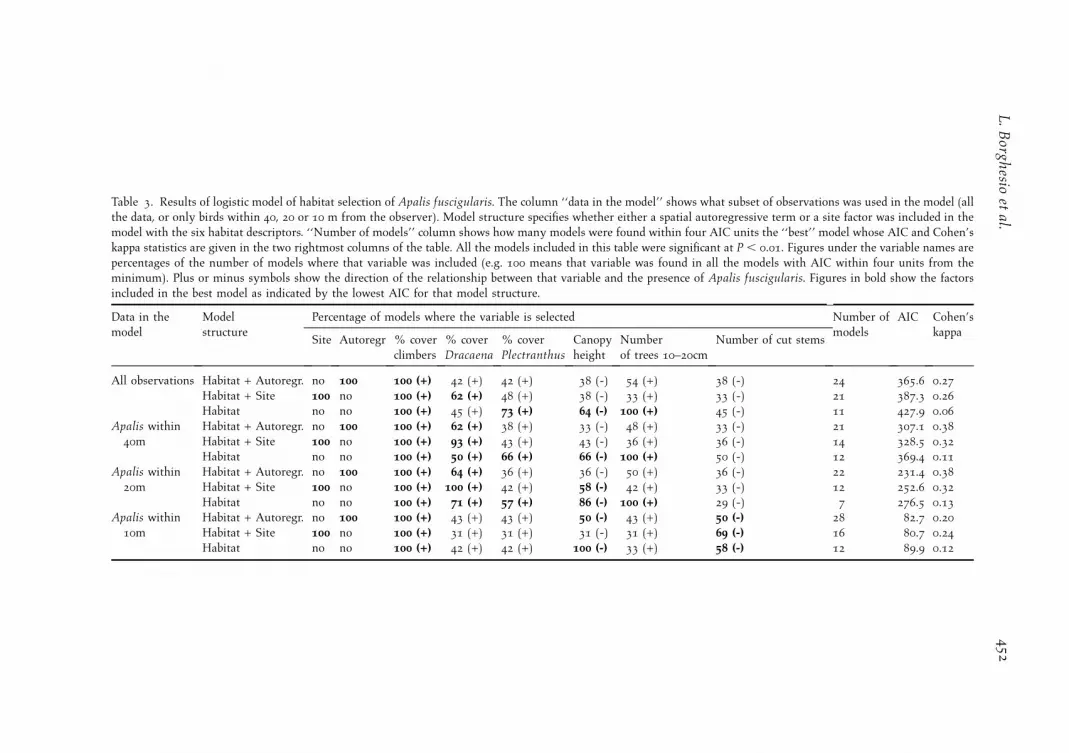
Table 3. Results of logistic model of habitat selection of Apalis fuscigularis. The column ‘‘data in the model’’ shows what subset of observations was used in the model (allthe data, or only birds within 40, 20 or 10 m from the observer). Model structure specifies whether either a spatial autoregressive term or a site factor was included in themodel with the six habitat descriptors. ‘‘Number of models’’ column shows how many models were found within four AIC units the ‘‘best’’ model whose AIC and Cohen’skappa statistics are given in the two rightmost columns of the table. All the models included in this table were significant at P , 0.01. Figures under the variable names arepercentages of the number of models where that variable was included (e.g. 100 means that variable was found in all the models with AIC within four units from theminimum). Plus or minus symbols show the direction of the relationship between that variable and the presence of Apalis fuscigularis. Figures in bold show the factorsincluded in the best model as indicated by the lowest AIC for that model structure.
Data in themodel
Modelstructure
Percentage of models where the variable is selected Number ofmodels
AIC Cohen’skappa
Site Autoregr % coverclimbers
% coverDracaena
% coverPlectranthus
Canopyheight
Numberof trees 10–20cm
Number of cut stems
All observations Habitat + Autoregr. no 100 100 (+) 42 (+) 42 (+) 38 (-) 54 (+) 38 (-) 24 365.6 0.27
Habitat + Site 100 no 100 (+) 62 (+) 48 (+) 38 (-) 33 (+) 33 (-) 21 387.3 0.26
Habitat no no 100 (+) 45 (+) 73 (+) 64 (-) 100 (+) 45 (-) 11 427.9 0.06
Apalis within40m
Habitat + Autoregr. no 100 100 (+) 62 (+) 38 (+) 33 (-) 48 (+) 33 (-) 21 307.1 0.38
Habitat + Site 100 no 100 (+) 93 (+) 43 (+) 43 (-) 36 (+) 36 (-) 14 328.5 0.32
Habitat no no 100 (+) 50 (+) 66 (+) 66 (-) 100 (+) 50 (-) 12 369.4 0.11
Apalis within20m
Habitat + Autoregr. no 100 100 (+) 64 (+) 36 (+) 36 (-) 50 (+) 36 (-) 22 231.4 0.38
Habitat + Site 100 no 100 (+) 100 (+) 42 (+) 58 (-) 42 (+) 33 (-) 12 252.6 0.32
Habitat no no 100 (+) 71 (+) 57 (+) 86 (-) 100 (+) 29 (-) 7 276.5 0.13
Apalis within10m
Habitat + Autoregr. no 100 100 (+) 43 (+) 43 (+) 50 (-) 43 (+) 50 (-) 28 82.7 0.20
Habitat + Site 100 no 100 (+) 31 (+) 31 (+) 31 (-) 31 (+) 69 (-) 16 80.7 0.24
Habitat no no 100 (+) 42 (+) 42 (+) 100 (-) 33 (+) 58 (-) 12 89.9 0.12
L.
Borgh
esioet
al.4
52
of the Taita forest fragments? In the Taita Hills, bird persistence in forest fragments is largelydetermined by mobility and tolerance of habitat disturbance. These two factors alone explained88% of the variation in forest occupancy in a group of eight bird species of the Taita Hills, wherethe most widespread species had either higher mobility or more ability to tolerate habitatdisturbance (Lens et al. 2002b). Despite intensive bird ringing efforts, dispersal across forestfragments has never been observed in Taita Apalis (Lens et al. 2002b), suggesting that thisspecies has a low mobility. On the other hand, a positive result emerging from our study is thatTaita Apalis was frequent in the disturbed, scrub-like vegetation of Vuria. This suggests that thespecies is tolerant of the effects of woodcutting and disturbance by humans. Moreover, in anNMDS ordination, presence points of Taita Apalis were broadly scattered over the entiremultivariate space, suggesting that the absence of the species from Yale, Fururu and Mbololo isnot due to the absence of suitable habitat in these fragments. The absence of Taita Apalis fromthe majority of the Taita Hills forest fragments might therefore be a consequence of stochasticextinction and inability to recolonise these fragments due to low mobility. From a practicalconservation point of view, reintroduction of Taita Apalis to the forest fragments from where itis currently absent should be possible at least with regards to the availability of suitable habitatin these fragments (even though other factors, such as predation should be taken into account).Human-aided translocation might compensate the low dispersal ability of this species.
In summary, we confirm that the conservation status of Taita Apalis is extremely precarious.We found the species in three forest fragments (Ngangao, Vuria, Chawia), whose total area isapproximately 257 ha, but not in a fourth one (Fururu), where it had been observed in the past(Brooks et al. 1998b). These fragments are separated by a matrix of farmland and there is noevidence that the species can disperse between these fragments (Lens et al. 2002b), makingnatural recolonisation of unoccupied sites unlikely. Moreover, Chawia supports such a lowpopulation (probably less than 50 individuals), that the survival of this subpopulation is unlikelyin the long term in the absence of conservation actions. Taita Apalis thus qualifies for ’CriticallyEndangered’ under IUCN criterion B2a+b (Area of occupancy , 10 km2, severely fragmentedand continuing decline in number of locations and subpopulations (IUCN 2001).
Acknowledgements
Funding for this research was provided by Wellcome Trust Grant No. 057622. Special thanks goto Silvester Karimi and Robert Kang’ara for their assistance gathering the data. We also thankPhil Atkinson, Steve Buckland, Thomas Brooks and Luc Lens for providing useful comments onan earlier draft of the paper, and the Kenya Forest Service and the Forest Guards of Taita Districtfor their assistance.
References
Bachler, E. and Liechti, F. (2007) On the impor-tance of g(0) for estimating bird populationdensities with standard distance-sampling:implications from a telemetry study anda literature review. Ibis 149: 693–700.
Beentje, H. J. (1988) An ecological and floris-tic study of the forests of the Taita Hills,Kenya. Utafiti 1: 23–66.
BirdLife International (2008a) BirdLife’s on-line world bird database: the site for birdconservation. Version 2.1. Cambridge, UK:BirdLife International. http://www.birdlife.org [accessed 7/4/2009].
BirdLife International (2008b) Species fact-sheet: Apalis fuscigularis. Cambridge, UK:BirdLife International. http://www.birdlife.org [accessed 7/4/2009].
Brooks, T., Lens, L., Barnes, J., Barnes, R.,Kageche Kihuria, J. and Wilder, C. (1998a)The conservation status of the forest birdsof the Taita Hills, Kenya. Bird Conserv. Int.8: 119–139.
Brooks, T., Lens, L., De Meyer, M., Waiyaki,E. and Wilder, C. (1998b) Avian biogeog-raphy of the Taita Hills, Kenya. J. East Afr.Nat. Hist. 87: 189–194.
Population estimates of Apalis fuscigularis 453

Buckland, S. T., Anderson, D. R., Burnham, K.P., Laake, J. L., Borchers, D. L. and Thomas,L. (2001) Introduction to distance sampling.Estimating abundance of biological popula-tions. Oxford, UK: Oxford University Press.
Burgess, N. D., Butynski, T. M., Cordeiro, N. J.,Doggart, N. H., Fjeldsa, J., Howell, K. M.,Kilahama, F. B., Loader, S. P., Lovett, J. C.,Mbilinyi, B., Menegon, M., Moyer, D. C.,Nashanda, E., Perkin, A., Rovero, F., Stanley,W. T. and Stuart, S. N. (2007) The biologicalimportance of the Eastern Arc Mountains ofTanzania and Kenya. Biol. Conserv. 134:209–231.
Burnham, K. P. and Anderson, D. R. (2002)Model selection and multimodel inference:a practical information-theoretic approach.New York: Springer.
Bytebier, B. (2001) Taita Hills biodiversityproject report. Nairobi, Kenya: NationalMuseums of Kenya.
Chege, J. and Bytebier, B. (2005) Vegetationstructure of four small forest fragments inTaita Hills, Kenya. J. East Afr. Nat. History94: 231–234.
Cimprich, D. A. (2009) Effect of count dura-tion on abundance estimates of Black-capped Vireos. J. Field Ornith. 80: 94–100.
Cohen, J. (1960) A coefficient of agreementfor nominal scales. Educ. Psychol. Meas.20: 37–46.
Collar, N. J., Crosby, M. J. and Stattersfield, A.J. (1994) Birds to watch: the world list ofthreatened birds. Cambridge, UK and Gland,Switzerland: BirdLife International andIUCN. (BirdLife Conservation Series no 4).
Del Hoyo, J., Elliot, A. and Christie, D., eds.(2006) Handbook of the birds of the world.Volume 11: Old World flycatchers to OldWorld warblers. Barcelona, Spain: LynxEdicions.
Dormann, C. F., McPherson, J. M., Araujo, M.B., Bivand, R., Bolliger, J., Carl, G., Davies, R.G., Hirzel, A., Jetz, W. and Kissling, W. D.(2007) Methods to account for spatial auto-correlation in the analysis of species distribu-tional data: a review. Ecography 30: 609–628.
Galbusera, P., Lens, L., Schenck, T., Waiyaki,E. and Matthysen, E. (2000) Genetic vari-ability and gene flow in the globally,critically-endangered Taita thrush. Con-serv. Genet. 1: 45–55.
Hayward, G. D., Kepler, C. B. and Scott, J. M.(1991) Point counts from clustered popula-tions: lessons from an experiment withHawaiian Crows. Condor 93: 676–682.
IUCN (2001) IUCN Red List categories andcriteria: Version 3.1. Gland, Switzerlandand Cambridge, UK: IUCN Species Sur-vival Commission.
Keitt, T. H., Bjørnstad, O. N., Dixon, P. M.and Citron-Pousty, S. (2002) Accountingfor spatial pattern when modeling organ-ism-environment interactions. Ecography25: 616–625.
Lee, D. C. and Marsden, S. J. (2008a) Adjust-ing count period strategies to improve theaccuracy of forest bird abundance estimatesfrom point transect distance sampling sur-veys. Ibis 150: 315–325.
Lee, D. C. and Marsden, S. J. (2008b) In-creasing the value of bird-habitat studies intropical forests: choice of approach andhabitat measures. Bird Conserv. Int. 18
(Suppl. 1): S109–S124.Legendre, P. and Legendre, L. (1998) Numer-
ical ecology. Amsterdam, The Netherlandsand New York, USA: Elsevier.
Lens, L. and Eggermont, H. (2008) Fluctuatingasymmetry as a putative marker of human-induced stress in avian conservation. BirdConserv. Int. 18 (Suppl. 1): S125–S143.
Lens, L., Galbusera, P., Brooks, T., Waiyaki, E.and Schenck, T. (1998) Highly skewed sexratios in the critically endangered Taitathrush as revealed by CHD genes. Biodiv.Conserv. 7: 869–873.
Lens, L., Van Dongen, S. and Matthysen, E.(2002a) Fluctuating asymmetry as an earlywarning system in the critically endan-gered Taita Thrush. Conserv. Biol. 16:479–487.
Lens, L., Van Dongen, S., Norris, K., Githiru,M. and Matthysen, E. (2002b) Avian per-sistence in fragmented rainforest. Science298: 1236–1238.
Mittermeier, R. A., Robles Gil, P., Hoffmann,M., Pilgrim, J., Brooks, T., Mittermeier, C. G.,Lamoreux, J. and da Fonseca, G. A. B. (2004)Hotspots revisited: Earth’s biologically rich-est and most endangered terrestrial ecore-gions. Mexico City, Mexico: Cemex.
Moran, P. A. P. (1950) Notes on continuousstochastic phenomena. Biometrika 37: 17–33.
L. Borghesio et al. 454
Morris, W. F., Wiser, S. D. and Klepetka, B.(1992) Causes and consequences of spatialaggregation in the phytophagous beetleAltica tombacina. J. Anim. Ecol. 61: 49–58.
Mulwa, R. K., Bennun, L. A., Ogol, C. K. P.O. and Lens, L. (2007) Population statusand distribution of Taita White-eye Zoster-ops silvanus in the fragmented forests ofTaita Hills and Mount Kasigau, Kenya.Bird Conserv. Int. 17: 141–150.
Pellikka, P. K. E., Lotjonen, M., Siljander, M.and Lens, L. (2009) Airborne remote sens-ing of spatiotemporal change (1955–2004)in indigenous and exotic forest cover in theTaita Hills, Kenya. Int. J. Appl. Earth Obs.11: 221–232.
Rangel, T. F. L. V. B., Diniz-Filho, J. A. F. andBini, L. M. (2006) Towards an integratedcomputational tool for spatial analysis inmacroecology and biogeography. GlobalEcol. Biogeogr. 15: 321–327.
Rogo, L. and Oguge, N. (2000) The Taita Hillsforest remnants: a disappearing world her-itage. Ambio 29: 522–523.
Seber, G. A. F. (1982) The estimation of animalabundance. New York, USA: Hafner.
Spanhove, T., Lehouck, V., Boets, P. and Lens,L. (2009a) Forest fragmentation relaxes
natural nest predation in an Afromontaneforest. Anim. Conserv. 12: 267–275.
Spanhove, T., Lehouck, V. and Lens, L.(2009b) Inverse edge effect on nest pre-dation in a Kenyan forest fragment: anexperimental case study. Bird Conserv. Int.19: 367–378.
Stamps, J. A. (1988) Conspecific attractionand aggregation in territorial species. Am.Nat. 131: 329–347.
Stattersfield, A. J., Capper, D. R. and Dutson,G. C. L. (2000) Threatened birds of theworld. Cambridge, UK and Barcelona,Spain: BirdLife International and LynxEdicions.
Thomas, L., Laake, J. L., Strindberg, S.,Marques, F. F. C., Buckland, S. T., Borchers,D. L., Anderson, D. R., Burnham, K. P.,Hedley, S. L., Pollard, J. H., Bishop, J. R. B.and Marques, T. A. (2006) Distance 5.0.Release 2. St. Andrews, UK: University ofSt. Andrews, Research Unit for WildlifePopulation Assessment. http://www.ruwpa.st-and.ac.uk/distance.
Wilder, C., Brooks, T. and Lens, L. (2000)Vegetation structure and composition ofthe Taita Hills forests. J. East Afr. Nat.History 87: 181–187.
LUCA BORGHESIO*Department of Biological Sciences, University of Illinois at Chicago MC066, 60607 Chicago, IL,
USA. and Department of Zoology, National Museums of Kenya, P.O. Box 40658-00100,Nairobi, Kenya.
DAINA SAMBA, MWANGI GITHIRUDepartment of Zoology, National Museums of Kenya, P.O. Box 40658-00100, Nairobi, Kenya.
LEON BENNUNBirdLife International, Wellbrook Court, Girton Road, Cambridge CB3 0NA, UK and
Department of Zoology, National Museums of Kenya, P.O. Box 40658-00100, Nairobi, Kenya.
KEN NORRISCentre for Agri-Environmental Research, University of Reading, P.O. Box 237, Reading RG6
6AR, UK.
*Author for correspondence; e-mail: [email protected]
Received 23 July 2009; revision accepted 2 January 2010;Published online 26 April 2010
Population estimates of Apalis fuscigularis 455


