Embed Size (px)
Citation preview

POLYVINYL ALCOHOL SIZE RECOVERY AND REUSE VIA
VACUUM FLASH EVAPORATION
A Thesis
Presented to
The Academic Faculty
By
Kishor Kumar Gupta
In Partial Fulfillment
Of the Requirements for the Degree
Doctor of Philosophy in
Polymer, Textile and Fiber Engineering
Georgia Institute of Technology
May, 2009
Copyright© Kishor Kumar Gupta 2009

POLYVINYL ALCOHOL SIZE RECOVERY AND REUSE VIA
VACUUM FLASH EVAPORATION
Approved by:
Dr. Fred L. Cook, Advisor
School of Polymer, Textile and Fiber
Engineering
Georgia Institute of Technology
Dr. Wallace W. Carr
School of Polymer, Textile and Fiber
Engineering
Georgia Institute of Technology
Dr. Matthew J. Realff
School of Chemical and Biomolecular
Engineering
Georgia Institute of Technology
Dr. John D. Muzzy
School of Chemical and Biomolecular
Engineering
Georgia Institute of Technology
Dr. Radhakrishnaiah Parachuru
School of Polymer, Textile and Fiber
Engineering
Georgia Institute of Technology
Date Approved: April 2, 2009

iii
To the everlasting affection and support of
my mom, dad,
my wife Preeti,
my daughter Arulita and son Anirudhha

iv
ACKNOWLEDGEMENTS
First and foremost, I express my gratitude to my advisor, Dr. Fred L. Cook, for his
unwavering guidance and support through years, despite his busy schedule. He had full
faith in me and gave me freedom to create ideas for my work and helped me surmount
problems as and when they arose. He has been the best mentor and teacher I have had. I
especially thank Drs. Wallace W. Carr, Matthew J. Realff, John D. Muzzy and
Radhakrishnaiah Parachuru for serving on my thesis advisory committee and for
providing valuable inputs and suggestions to my thesis research.
I express my sincere thanks to our Industrial Project Partners, E. I. Dupont Co.,
Springs Industries, Inc., WestPoint Home, Inc. and VACOM, LLC for their valuable
suggestions and support. I also express my gratitude and appreciation to Dr. Ian Hardin
and Mrs. Mary Sue Brewer for allowing use of the Webtex Pilot Slasher at the University
of Georgia, Athens, GA. I also thank Mr. Larry Cowan of Leesona LLC for repairing our
bench scale winder unit, Mr. Tom Klaas of Testfabrics, Inc. for helping us in procuring
yarn for the pilot scale up trials, Frontier Mills for providing the yarn, Mr. George
Robinson of E. I. DuPont Co., for providing T-66 PVA size, Mr. Charles Stewart of
Seydel-Woolley & Co., Inc for providing wax, Mr. Matthew Doyle of Organic Dyestuffs
Corporation for providing tracer dye, Mr. Nigel Neely of Spring Industries for providing
yarn and Dr. Naresh Thadhani for allowing use of the high-magnification microscope in
his lab.
Finally, I especially express my appreciation and gratitude to Dr. Sunghyun Nam
for helping in my experiments at UGA, Mr. Dan Brooks for helping build the bench

v
slasher and my graduate friends Vibhor Jain, Shamal Mhetre, Murari Gupta, Sarang
Deodhar, Henna Lee, Ramasubramani K. R. T., Sudhakar Jagannathan, Jasmeet Kaur,
Mihir Oka, Chris Hubbell and other associates for the encouragement and support
extended by them during the course of the thesis research.

vi
TABLE OF CONTENTS
ACKNOWLEDGEMENTS .......................................................................................... IV
LIST OF TABLES ..................................................................................................... XIII
LIST OF FIGURES .................................................................................................... XIV
LIST OF SYMBOLS ................................................................................................... XX
LIST OF ABBREVIATIONS ................................................................................... XXII
SUMMARY ............................................................................................................ XXIII
CHAPTER 1: INTRODUCTION ....................................................................................1
CHAPTER 2: LITERATURE REVIEW ..........................................................................7
2.1 INTRODUCTION .....................................................................................................7
2.1.1 Energy Consumption in the Textile Industry .................................................7
2.1.2 Slashing .......................................................................................................8
2.1.3 Desizing ..................................................................................................... 10
2.1.4 Pollution from Desizing.............................................................................. 11
2.1.5 Size Recovery ............................................................................................ 12
2.1.6 Cotton Impurities ....................................................................................... 15
2.2 POLYVINYL ALCOHOL ......................................................................................... 15
2.2.1 Introduction ................................................................................................ 15
2.2.2 PVA Homopolymer .................................................................................... 16
vii
2.3 ULTRAFILTRATION ............................................................................................. 21
2.3.1 Introduction ................................................................................................ 21
2.3.2 Recovered Polymer .................................................................................... 22
2.3.3 Fouling and Cleaning of UF Membranes .................................................... 24
2.3.4 Effect of Recycled Size on Weaving Efficiency .......................................... 25
2.3.5 Effect of Variables on UF Process .............................................................. 26
2.3.6 Effect of UF Process Variables on PVA Properties ..................................... 28
2.3.7 Efficiency of UF Membrane ....................................................................... 28
2.3.8 Economic Benefits of the UF Process ......................................................... 30
2.4 VACUUM FLASH EVAPORATION........................................................................... 31
2.4.1 Introduction ................................................................................................ 31
2.4.2 Effect of VFE Process Variables on Mass Flow .......................................... 33
2.4.3 Economic Benefits of the VFE Process....................................................... 35
2.4.4 VFE Plant Operations ................................................................................. 36
CHAPTER 3: OBJECTIVES AND TECHNICAL APPROACH ................................... 38
3.1 OBJECTIVES .......................................................................................................... 38
3.2 TECHNICAL APPROACH ......................................................................................... 39
3.2.1 Effect of Cotton Impurities on Recycled Size Films and Slashed Yarns ......... 39
3.2.2 Effect of Cotton Impurities, Wax and their Combinations on Recycled Size
Films and Slashed Yarns ........................................................................................ 43
3.2.3 Proof of Concept Trials Conducted on Pilot Slasher ...................................... 48
3.2.4 Economic Feasibility ..................................................................................... 53

viii
CHAPTER 4: RAW MATERIALS AND EXPERIMENTAL PROCEDURES .............. 54
4.1 RAW MATERIALS .................................................................................................. 54
4.2 EQUIPMENT .......................................................................................................... 56
4.3 EXPERIMENTAL PROCEDURES ................................................................................ 60
4.3.1 Size Formulation ........................................................................................... 60
4.3.1.1 Simulated Recycled Slashing Solution .................................................... 61
4.3.1.2 Recycled Size Formulation ..................................................................... 61
4.3.2 Cotton Chemical Impurities ........................................................................... 62
4.3.3 Yarn Slashing ................................................................................................ 63
4.3.4 Yarn Desizing ............................................................................................... 65
4.3.4.1 Two-Step Yarn Desizing Process ............................................................ 65
4.3.4.2 Three-Step Desizing Process .................................................................. 66
4.3.5 Size Recovery ............................................................................................... 67
4.3.6 Size Formulation Viscosities with Impurities ................................................. 68
4.3.7 Desizing Efficiency ....................................................................................... 68
4.3.8 Slashed Yarn Add-On ................................................................................... 69
4.3.9 Recycled T-66 PVA Film Preparation and Testing ........................................ 69
4.3.9.1 Tensile Testing of Cast Films ................................................................. 70
4.3.9.2 Water Contact Angle on Cast Films ........................................................ 71
4.3.10 Slashed Yarn Testing................................................................................... 72
4.3.10.1 Tensile Testing ..................................................................................... 72
4.3.10.2 Yarn Hairiness ...................................................................................... 72
4.3.10.3 Yarn Abrasion ...................................................................................... 73

ix
4.3.10.4 Bending Length .................................................................................... 74
4.3.10.5 Bust Rod Resistance ............................................................................. 75
4.3.10.6 Size Diffusion ....................................................................................... 76
4.3.11 Thermogravimetric Analysis ....................................................................... 77
4.3.12 Intrinsic Viscosity of Size Formulations ...................................................... 77
4.3.13 Desized Yarn Color ..................................................................................... 80
CHAPTER 5: RESULTS AND DISCUSSION .............................................................. 82
5.1 VFE EVAPORATION PROCESS ................................................................................ 82
5.2 YARN IMPURITIES ................................................................................................. 83
5.3 EFFECTS OF COTTON CHEMICAL IMPURITIES ON RECYCLED T-66 PVA FILMS AND
SLASHED YARNS ........................................................................................................ 83
5.3.1 Tensile Properties of Recycled T-66 PVA Films ........................................... 83
5.3.1.1 Breaking Strength ................................................................................... 83
5.3.1.2 Elongation at Break ................................................................................ 84
5.3.1.3 Modulus of Elasticity............................................................................. 85
5.3.2 Wet Ability ................................................................................................... 86
5.3.3 Viscosity ....................................................................................................... 87
5.3.4 Tensile Properties of Slashed Yarns .............................................................. 88
5.3.4.1 Yarn Tenacity ......................................................................................... 88
5.3.4.2 Work of Rupture..................................................................................... 89
5.3.5 Bust Rod Resistance ...................................................................................... 90
5.3.6 Summary of the Effects of Occluded Cotton Chemical Impurities on Recycled
T-66 PVA Films and Slashed Yarns ....................................................................... 91
x
5.4 EFFECTS OF WAX, COTTON CHEMICAL IMPURITIES AND THEIR COMBINATIONS ON
RECYCLED T-66 PVA FILMS AND SLASHED YARNS ..................................................... 92
5.4.1 Tensile Properties of Recycled T-66 PVA Films ........................................... 92
5.4.1.1 Breaking Strength ................................................................................... 92
5.4.1.2 Elongation at Break ................................................................................ 94
5.4.2 Tensile Properties of Slashed Yarns .............................................................. 96
5.4.2.1 Tenacity at Break.................................................................................... 96
5.4.2.3 Slashed Yarn Hairiness ........................................................................... 99
5.4.2.4 Bust Rod Resistance ............................................................................. 105
5.4.2.5 Abrasion Cycles to First Yarn Breaks ................................................... 106
5.4.2.6 Summary of Effects of Wax, Cotton Chemical Impurities and their
Combinations on Recycled T-66 PVA Films and Slashed Yarns ...................... 109
5.5 EFFECTS OF UP TO 100% COTTON CHEMICAL IMPURITIES ON THE PROPERTIES OF
RECYCLED SIZE SLASHED YARNS ............................................................................. 109
5.5.1 Yarn Tenacity ............................................................................................. 109
5.5.2 Yarn Work of Rupture ................................................................................. 110
5.5.3 Yarn Hairiness ............................................................................................ 111
5.5.4 Bust Rod Resistance .................................................................................... 112
5.5.5 Yarn Abrasion Cycles ................................................................................. 113
5.5.6 Summary of Effects of up to 100% Cotton Chemical Impurities on Simulated
Recycled Size Slashed Yarns ............................................................................... 114
5.6 PROOF OF CONCEPT SCALE-UP TRIALS UTILIZING WEBTEX® PILOT SLASHER ...... 115
5.6.1 Recycled T-66 PVA Size Formulation Film Tensile Properties .................... 118
5.6.1.1 Breaking Strength ................................................................................. 118
5.6.1.2 Elongation at Break .............................................................................. 119

xi
5.6.2 Size Add-On ............................................................................................... 120
5.6.3 Desized Efficiency of Recycled T-66 PVA Slashed Yarns ........................... 122
5.6.4 Influence of Low Molecular Weight Cotton Chemical Impurities on Viscosity
Average Molecular Weight of Recycled T-66 PVA Size ...................................... 123
5.6.5 Change of Cotton Chemical Impurities Concentration in Size vs. Number of
Slashing Cycles.................................................................................................... 125
5.6.6 Size Penetration .......................................................................................... 127
5.6.7 Slashed Yarn Tensile Properties .................................................................. 133
5.6.7.1 Load at Break and Tenacity .................................................................. 133
5.6.8 Work of Rupture of Recycled T-66 PVA Slashed Yarns .............................. 136
5.6.9 Bending Length ........................................................................................... 136
5.6.10 Yarn Hairiness .......................................................................................... 138
5.6.11 Abrasion Resistance .................................................................................. 138
5.6.12 Desized Yarn Color ................................................................................... 140
5.7 ECONOMIC VIABILITY OF VFE INCORPORATION .................................................. 142
CHAPTER 6: CONCLUSIONS................................................................................... 145
CHAPTER 7: RECOMMENDATIONS ...................................................................... 151
APPENDIX 1: TEARING BEHAVIOUR OF SIZE FILM .......................................... 153
APPENDIX 2: IMPURITIES PERCENTAGE CALCULATION IN PILE AND
GROUND SIZE FORMULATION ............................................................................. 154
APPENDIX 3: COTTON CHEMICAL IMPURITIES CALCULATIONS .................. 156
APPENDIX 4: TERRY LOOM, SIDE VIEW .............................................................. 157

xii
APPENDIX 5: ECONOMIC VIABILITY OF VFE PROCESS ................................... 158
REFERENCES ............................................................................................................ 162

xiii
LIST OF TABLES
Table 3.1: Experimental Plan Phase 1: Effects of Cotton Chemical Impurities
Concentration on Films and Slashed Yarn Properties ............................................. 41
Table 3.2: Combination of Wax and Impurity Percentages for Film Preparation ............ 43
Table 3.3: Experimental Plan: Effects of Cotton Chemical Impurities Concentration on
Films and Slashed Yarns Properties ....................................................................... 45
Table 3.4: Experimental Plan: Effects of Cotton Chemical Impurities Concentration on
Films and Slashed Yarns Properties ....................................................................... 50
Table 5.1: Summary of Simulated Recycled Size Slashed Yarn Properties vs. Impurities
Concentration Compared to Springs Industries Conventional Slashed Yarn ......... 115
xiv
LIST OF FIGURES
Figure 2.1: Heddles and Reed Positions in Weaving .......................................................8
Figure 2.2: Section of Size Box ......................................................................................9
Figure 2.3: Fiber Size Binding in a Yarn ........................................................................9
Figure 2.4: Chemistry of Polyvinyl Alcohol Manufacturing .......................................... 16
Figure 2.5: Hydrolysis of Polyvinyl Acetate to Polyvinyl Alcohol ................................. 17
Figure 2.6: PVA Copolymer Manufacturing ................................................................. 18
Figure 2.7: Hydrolysis of PVAc Copolymer to PVA Copolymer ................................... 18
Figure 2.8: Water Solubility of PVA at 140oF .............................................................. 19
Figure 2.9: Water Solubility of Heat Set PVA Film ...................................................... 20
Figure 2.10: Size Removal as a Function of Washing Temperature for (a) Elvanol® T-66
PVA, and (b) Intermediately Hydrolyzed PVA ...................................................... 20
Figure 2.11: Schematic of Hyperfiltration Process ........................................................ 21
Figure 2.12: Koch Membrane System for Polyvinyl Alcohol Recovery ......................... 22
Figure 2.13: Comparison of Molecular Weight Distribution of Elvanol® T-25* Before
and After UF Recovery (a) Permeate; (b) Original Copolymer Before Size
Preparation; (c) Ultrafiltrate and (d) Feed to the UF Unit ...................................... 23
Figure 2.14: Membrane Permeability After Various Cleaning Methods ........................ 25
Figure 2.15: Effects of Different Membrane Types on the Permeate Flux at 80oC, 0.135
MPa and 500 rpm Mixer Speed ............................................................................. 27
Figure 2.16: Theoretical Flow Rate as a Function of Concentration .............................. 29
Figure 2.17: Visualization of VFE Phenomena ............................................................. 31
Figure 2.18: Evolution of mev vs. Time at a Pressure of 50 mbar ................................... 34
Figure 2.19: Evaporated Mass Flow Rate vs. Time at 50 mbar Pressures ...................... 34

xv
Figure 2.20: Evolution of Evaporated Mass vs. Initial Temperature .............................. 35
Figure 2.21: Flow Chart of Vacuum Flash Evaporation Process ..................................... 37
Figure 4.1: Photograph of the Two-End Bench Slasher .................................................. 56
Figure 4.2: Sections of Webtex© Slasher ....................................................................... 58
Figure 4.3: Yarn Flow Chart of the Bench Slasher ......................................................... 63
Figure 4.4: Line Diagram of Two-Step Desizing Process ............................................... 66
Figure 4.5: Line Diagram of Three-Step Desizing Process ............................................. 67
Figure 4.6: Auto-Draw III Film Casting Instrument ...................................................... 70
Figure 4.7: Distilled Water Drop on Recycled Size Film ................................................ 71
Figure 4.8: Number of Frays Plotted against Fray Length to Determine the Origin ........ 73
Figure 4.9: Line Diagram of Sulzer Ruti Webtester........................................................ 74
Figure 4.10: (a) Typical Leasing/Bust Rod System and (b) Diagram of Sample Mounting
.............................................................................................................................. 76
Figure 5.1: Changes in Strength of Recycled T-66 PVA Films with Impurities
Concentration ........................................................................................................ 84
Figure 5.2: Changes in Elongation at Break of Recycled T-66 PVA Films with Impurities
Concentration ........................................................................................................ 85
Figure 5.3: Changes in Modulus of Elasticity of Recycled T-66 PVA Films with
Impurities Concentration ........................................................................................ 86
Figure 5.4: Changes in Contact Angle of Water Droplets on Recycled T-66 PVA Size
Films with Impurities Concentration ...................................................................... 87
Figure 5.5: Pick-Up vs. Viscosity of PVA Solution ....................................................... 88
Figure 5.6: Changes in Viscosities of Recycled T-66 PVA Size Formulations at
Constant Concentration (5% w/w) with Impurities Concentration .......................... 88
Figure 5.7: Changes in Yarn Tenacity at Break of Recycled T-66 PVA Slashed Yarn vs.
Impurities Concentration in the Size Film .............................................................. 89

xvi
Figure 5.8: Yarn Work of Rupture of Recycled T-66 PVA Slashed Yarn with Impurities
Concentration in the Size Formulation ................................................................... 90
Figure 5.9: Bust Rod Resistance and Size Add-On of Recycled T-66 PVA Slashed Yarn
with Impurities Concentrations in the Size Formulation ......................................... 91
Figure 5.10: Changes in Strength of Recycled T-66 PVA Films vs. Wax Percentage at
Different Impurities Concentration in the Size Formulation ................................... 93
Figure 5.11: Changes in Strength of Recycled T-66 PVA Films vs. Impurities
Concentration at Different Wax Percentage in the Size Formulation ...................... 94
Figure 5.12: Changes in Elongation at Break of Recycled T-66 PVA Films vs. Wax
Percentages at Different Impurities Concentration in Size Formulations................. 95
Figure 5.13: Changes in Elongation at Break of Recycled T-66 PVA Films vs. Impurities
Concentration at Different Wax Percentage in the Size Formulations ..................... 95
Figure 5.14: Changes in Yarn Tenacity at Break of Recycled T-66 PVA Slashed Yarn vs.
Impurities Concentration at Different Wax Percentage in the Size Formulations .... 96
Figure 5.15: Changes in Yarn Tenacity at Break of Recycled T-66 PVA Slashed Yarn vs.
Wax Percentage at Different Impurities Concentration in the Size Formulations .... 97
Figure 5.16: Changes in Recycled T-66 PVA Slashed Yarn Work of Rupture vs.
Impurities Concentration at Different Wax Percentage in the Size Formulation ...... 98
Figure 5.17: Changes in Recycled T-66 PVA Slashed Yarn Work of Rupture vs. Wax
Percentage at Different Impurities Concentration in the Size Formulation .............. 99
Figure 5.18: Changes in Recycled T-66 PVA Slashed Yarn Hairiness (2 mm) vs. Wax
Percentage at Different Impurities Concentration in the Size Formulation ............ 101
Figure 5.19: Changes in Recycled T-66 PVA Slashed Yarn Hairiness (2 mm) vs.
Impurities Concentration at Different Wax Percentage in the Size Formulation .... 102
Figure 5.20: Changes in Recycled T-66 PVA Slashed Yarn Hairiness (1.5 mm) vs. Wax
Percentage at Different Impurities Concentration in the Size Formulation ............ 102
Figure 5.21: Changes in Recycled T-66 PVA Slashed Yarn Hairiness (1.5 mm) vs.
Impurities Concentration at Different Wax Levels in the Size Formulation .......... 103
Figure 5.22: Changes in Recycled T-66 PVA Slashed Yarn Hairiness with Wax
Percentage at Zero Percent Impurity Concentration in the Size Formulation ......... 104

xvii
Figure 5.23: Changes in Recycled T-66 PVA Slashed Yarn Hairiness vs. Impurity
Concentration at Zero Percent Wax in the Size Formulation ................................. 104
Figure 5.24: Bust Rod Resistance of Recycled T-66 PVA Slashed Yarn vs. Wax
Percentage at Different Impurities Concentration in the Size Formulation ............ 106
Figure 5.25: Bust Rod Resistance of Recycled T-66 PVA Slashed Yarn vs. Impurities
Concentration at Different Wax Percentage in the Size Formulation .................... 106
Figure 5.26: Number of Abrasion Cycles to First Yarn Breaks of Recycled T-66 PVA
Slashed Yarn vs. Impurities Concentration at Different Wax Percentage in the Size
Formulation ......................................................................................................... 108
Figure 5.27: Number of Abrasion Cycles to First Yarn Breaks of Recycled T-66 PVA
Slashed Yarn vs. Wax Percentage at Different Impurities Concentration in the Size
Formulation ......................................................................................................... 108
Figure 5.28: Tenacity at Break of Recycled Size Slashed Yarn vs. Impurities
Concentration in the Size Formulation ................................................................. 110
Figure 5.29: Work of Rupture of Recycled T-66 PVA Slashed Yarn vs. Impurities
Concentration in the Size Formulation ................................................................. 111
Figure 5.30: Changes in Recycled T-66 PVA Slashed Yarn Hairiness vs. Impurities
Concentration in the Size Formulation ................................................................. 112
Figure 5.31: Bust Rod Resistance of Recycled T-66 PVA Slashed Yarn vs. Impurities
Concentration in the Size Formulation ................................................................. 113
Figure 5.32: Number of Abrasion Cycles to First Yarn Breaks of Recycled T-66 PVA
Slashed Yarn vs. Impurities Concentration Levels in the Size Formulation .......... 114
Figure 5.33: Calculated Impurities Concentration in T-66 PVA Size Formulations vs.
Number of Slashing Cycles for Both Pile and Ground Yarns ................................ 117
Figure 5.34: Changes in Breaking Strength of Recycled T-66 PVA Size Film vs. Slashing
Cycles .................................................................................................................. 119
Figure 5.35: Changes in Elongation at Break of Recycled T-66 PVA Films vs. Slashing
Cycles .................................................................................................................. 120
Figure 5.36: Size Solids Add-On of Recycled T-66 PVA Slashed Yarn vs. Slashing
Cycles .................................................................................................................. 121
Figure 5.37: Yarn Tex of Recycled T-66 PVA Slashed Yarn vs. Slashing Cycles ........ 121

xviii
Figure 5.38: Desize Efficiency of Recycled T-66 PVA Slashed Yarn vs. Slashing Cycles
............................................................................................................................ 122
Figure 5.39: Viscosity vs. Concentration of Pure T-66 PVA Size in First Slashing Cycle
(Conventional) Formulation ................................................................................. 124
Figure 5.40: Viscosity vs. Concentration of Recycled T-66 PVA/Cotton Impurities
Blended Size in Final Third Slashing Cycle Formulation ..................................... 124
Figure 5.41: Changes in Weight Percentage of Desized Solids vs. Temperature ........... 126
Figure 5.42: Percentage Cotton Impurities in Recycled T-66 PVA Size vs. Slashing
Cycles .................................................................................................................. 126
Figure 5.43: Size Penetration in Pure T-66 PVA Slashed Pile Yarn ............................. 127
Figure 5.44: Size Penetration in First Recycle T-66 PVA Slashed Pile Yarn ................ 128
Figure 5.45: Size Penetration in Second Recycle T-66 PVA Size Slashed Pile Yarn .... 128
Figure 5.46: Size Penetration in Third Recycle T-66 PVA Slashed Pile Yarn ............... 129
Figure 5.47: Size Penetration in Fourth Recycle T-66 PVA Slashed Pile Yarn ............. 129
Figure 5.48: Size Penetration in Fifth Recycle T-66 PVA Slashed Pile Yarn ................ 130
Figure 5.49: Size Penetration in Pure T-66 PVA Slashed Ground Yarn ........................ 130
Figure 5.50: Size Penetration in First Recycle T-66 PVA Slashed Ground Yarn .......... 131
Figure 5.51: Size Penetration in Second Recycle T-66 PVA Slashed Ground Yarn ...... 131
Figure 5.52: Size Penetration in Third Recycle T-66 PVA Slashed Ground Yarn ......... 132
Figure 5.53: Size Penetration in Fourth Recycle T-66 PVA Slashed Ground Yarn ....... 132
Figure 5.54: Size Penetration in Fifth Recycle T-66 PVA Slashed Ground Yarn .......... 133
Figure 5.55: Load at Break of Recycled T-66 PVA Slashed Yarn vs. Slashing Cycles 134
Figure 5.56: Tenacity at Break of Recycled T-66 PVA Slashed Yarn vs. Slashing Cycles
............................................................................................................................ 134
Figure 5.57: Elongation at Break of Recycled T-66 PVA Slashed Yarn vs. Slashing
Cycles .................................................................................................................. 135
xix
Figure 5.58: Work of Rupture of Recycled T-66 PVA Slashed Yarn vs. Slashing Cycles
............................................................................................................................ 136
Figure 5.59: Bending Length of Recycled T-66 PVA Slashed Yarn vs. Slashing Cycles
............................................................................................................................ 137
Figure 5.60: Recycled T-66 PVA Slashed Yarn Hairiness vs. Slashing Cycles ............. 138
Figure 5.61: Abrasion Cycles to First Yarn Break of Recycled T-66 PVA Slashed Yarn
vs. Slashing Cycles .............................................................................................. 140
Figure 5.62: Desized Yarn CIE L, a and b Values vs. Slashing Cycles ................. 141
Figure 5.63: Desized Yarn CIE E Values vs. Slashing Cycles .................................... 142

xx
LIST OF SYMBOLS
A Horizontal cross-sectional area of flash chamber [m2]
cp Specific heat of liquid [J/kg K]
H Height of liquid [m]
hfg Latent heat of vaporization [J/kg]
mev Evaporated mass of liquid [kg]
evm.
Instantaneous evaporated mass flow [kg/s]
To Initial temperature of water [oC]
ρ1 Density of liquid [kg/m3]
hfg Latent heat of vaporization [J/kg]
m Mass of liquid [kg]
T Temperature of water [oC]
Δm Change in mass [kg]
dT Change in temperature [oC]
W Wet yarn weight / length
D Dry yarn weight / length
S Slashed solution concentration
t Flow time of solution
c Concentration of the solution
red Reduced viscosity
sp Specific viscosity
red Reduced viscosity

xxi
r Relative viscosity,
[] Intrinsic viscosity
kH Huggins constant
inh Inherent viscosity
kA Kraemer constant
K, M H constants
M Viscosity-average molecular weight
m Slope of the line
b Intercept on y axis
c Concentration

xxii
LIST OF ABBREVIATIONS
VFE Vacuum flash evaporation
UF Ultrafiltration
PVA Polyvinyl alcohol
COD Chemical oxygen demand
POTW Primary oxygenation treatment of water
UGA University of Georgia
ROI Return on investment
BOD Biological oxygen demand
MW Molecular weight

xxiii
SUMMARY
Polyvinyl alcohol (PVA) desize effluent is a major Chemical Oxygen Demand
(COD) contributor to a textile plant's Primary Oxygenation Treatment of Water (POTW)
operation, and being biologically inert, it presents a threat to the environment.
Unfortunately, no effective and efficient means to treat PVA desize effluent has been
implemented in the textile industry. Ultrafiltration (UF) reverse osmosis technology for
the recovery and recycling of PVA size is more than 35 years old, but it is not used
widely because of its many disadvantages. The situation necessitates a new technology
for the recovery and recycling of PVA size which can reduce energy and water
consumption in an economical and environmentally-friendly manner.
A new technology that would eliminate the disadvantages of the current
ultrafiltration process in the recovery of PVA from desize effluent is vacuum flash
evaporation (VFE). The VFE process for recovery and concentration has been used in a
variety of other industries, but has never been demonstrated for size recovery in the
textile industry.
The reported research is concerned with the VFE process and its economics, and
the properties/utilization of the recovered PVA emanating from the process. This research
was divided into four parts. In the first and second parts, simulated, recycled PVA size
formulations at different impurities concentration were prepared with or without wax,
films were made and yarns were slashed to determine their changes in properties as a
function of cotton chemical impurities concentraion from 0% to 100%. In the third part
and building on the bench scale results, the slashing process was optimized and the

xxiv
concept was demonstrated using the University of Georgia (UGA) Webtex® Pilot
Slasher. In this demonstration, both ground and pile yarns of a common residential
towel construction were slashed, with one conventional cycle followed by five size
recovery/recycle slashings. The last part involved the economical feasibility of the VFE
technology in recovery and recycling of PVA size.
With VFE recovery, recycled size was found to contain extracted cotton chemical
impurities which decreased the apparent molecular weight of the recycled PVA size, as
they (fatty acids, alcohols, waxes, etc.) were of low molecular weight, thus decreasing the
breaking strength of the recycled size film. The initial studies were conducted without the
addition of wax to the size. In conventional slashing with wax added to the PVA, film
strength also decreased. With the occluded cotton impurities present in the recycled PVA
film, no wax was required to be added to the recovered size, as the impurities performed
the same film physical property modifications as the wax.
An increase in elongation at break of recycled PVA film can render weaving
processes more efficient. Mostly cotton is used in the towel industry, but 100% PVA size
without substantial added wax (~8%) cannot be used to slash the pile yarns of the
construction because PVA slashed yarn is stiff in nature, making it difficult to form the
loops. However, the recovered PVA size from the developed VFE process showed a
decrease in bending length, facilitating the use of PVA size in the towel industry.
As recovered PVA was added along with virgin PVA in the size box, the cotton
yarn chemical impurity levels continued to increase and reached a steady state after ~five
slashing cycles in a size recovery/reuse sequence. At constant solids concentration,
viscosity decreased with the number of size recycles, which aided size yarn penetration at

xxv
the application temperature (70oC). A small increase and then decrease in slashed yarn
load at break occurred with impurities concentration increase in the film; however,
slashed yarn load-at-break was always more than 20% that of un-slashed yarn. Slashed
yarn elongation at break initially increased then decreased with recycling, but it was
always more than or close to that of un-slashed yarn. Slashed yarn hairiness remained
nearly constant with recycling. Slashed yarn abrasion cycles to first yarn break initially
increased, but remained nearly constant on further recycling. Desized yarn color was also
constant with recycling. The overall research results quantified an improvement in
recycled size slashed yarn properties over those of greige yarn for towel weaving.
Size must be removed from fabric after weaving in a desizing operation (part of
the preparation wet process) to facilitate subsequent dyeing and finishing. The recycled
size film was easy to wet, which aided the desizing of slashed yarns.
Based on the pilot scale trial results, comparative economics were developed
for model towel manufacturing plant implementation of the VFE concentration
technology for all-PVA size towel weaving, implementation of the analogous UF
concentration technology, and the current PVA/starch/wax blend size process with no
material/water recovery. Incorporation of the VFE technology for PVA size recovery
and recycling resulted in ~$3.2M/year in operational savings over the conventional
PVA/starch/wax process with no size recycling, yielding a raw return on investment
(ROI) of less than one year, based on a $3M turnkey capital investment [1].
The results confirmed that VFE can be successfully implemented to recover and
reuse PVA size, not only by developed nations, but also by the growing economies like
China and India which are hesitant to use the present technology of UF due to its clear

xxvi
disadvantages and operating cost ineffectiveness. Widespread use of VFE to recover and
reuse PVA size will aid in minimizing water pollution and chemical, energy and water
consumptions in the global textile industry, thereby contributing to a greener, cleaner
world.

1
CHAPTER 1
INTRODUCTION
The world is facing the gigantic task of meeting its ever-rising energy and potable
water requirements while reducing pollution loads. World energy demand is expected to
increase from 447 quadrillion Btu in 2004 to 702 quadrillion Btu in 2030 [2]. In 2004,
94% of the total energy consumption came from non-renewable resources. The demand
for petroleum is projected to increase by 40%, coal 74% and natural gas 62% by 2030
[2]. Unrestricted burning of fossil fuel will further contribute to the green house effect
and global warming. One third of the world’s population does not have enough potable
water, and this fraction will increase to two thirds by 2025 [3]. The greatest challenge is
to solve the crisis of exhausting non-renewable energy resources and increasing demand
without affecting world development and growth. An urgent need exists to save energy,
chemicals and water in industrial processes while reducing pollution loads at every front,
either by developing new technologies or by innovative applications of existing
technologies in different areas.
The textile industry is one of the oldest in history and provides a basic
requirement of all human beings. Unfortunately, the industry is one of the most water
consumptive and polluting, and a huge consumer of energy [4-7]. In the textile
manufacturing process of slashing, yarn is coated with a polymeric size to improve its
weaving properties [4]. Polyvinyl alcohol (PVA) and starch are the sizes that are widely
used in the textile industry, often as a blend. After weaving, size is removed from the

2
fabrics in the preparation process of desizing. Voluminous hot water is utilized in
desizing, and if both PVA and starch are present, the effluent is a high Biological Oxygen
Demand (BOD)/Chemical Oxygen Demand (COD) contributor to the plant’s Primary
Oxygenation Treatment of Water (POTW) operation. Starch itself contributes 50% of
BOD in composite textile effluents (100,000-600,000 mg L-1) [4, 8], whereas no known
bacteria has yet evolved to generate enzymes that attack and degrade the synthetic PVA
polymer backbone (PVA was invented only ~85 years ago) [9]. The desize pollution
streams containing synthetic PVA are a threat to the environment [4-7], so textile plants
have to carefully process the desize effluent sent to the POTW. The treatment of such
large volumes of desize effluent is costly. When an all-PVA/wax size is used, significant
incentives exist to recover the size material from the desize wash water stream,
concentrate it and reuse it. Unfortunately, no effective and efficient means to do this has
ever been implemented in the industry. Ultrafiltration (UF), operating on the principle of
reverse osmosis and based on spiral-wound, polymeric membrane films, has been used
for this purpose in the U. S. on a very limited basis, mainly where forced by regulatory
authorities. However, this technique has not found widespread industrial acceptance
because of high capital investment, high operating costs and poor effectiveness. Starch
size is not appropriate for significant recovery and repeated reuse cycles because the
natural material is subject to chemical/biological breakdown by starchase enzyme-
producing bacteria with time, i.e., the formulation “sours” [4-7, 10].
In UF, the semi-permeable membrane excludes the high molecular weight PVA of
the desize effluent stream, whereas low molecular weight PVA and water passes through
the membrane. The hot permeate containing the low molecular weight tail of the PVA

3
distribution is sometimes re-used in “dirty” applications, e.g., as make-up water for wash
boxes in preparation processes after scouring [11], whereas the recovered PVA is mixed
with virgin PVA (usually in a 70:30 weight ratio) [11] and is reused in slashing. The UF
process in recovery and recycling of PVA has the following limitations and
disadvantages [5, 12]:
- The spiral wound polymeric membranes can foul, requiring process shutdown
for cleaning, adding to operational costs. The membranes also degrade and decompose in
use, requiring expensive, periodic replacements.
- A heavy pressure drop (up to 500 kPa) exists across the membranes, requiring
high pumping pressures to force the water through the filters, leading to high electrical
consumption.
- Loss of much of the low molecular weight (MW) “tail” from the PVA
distribution contained in the desized stream which passes through the UF filter under the
high pumping pressures (~3-5% of the total mass available). The contamination of the
separated water stream with the low MW PVA results in added PVA costs and restricts
the potential reuse of the exiting hot water in other textile processes in the plant, e.g., as
dye bath make-up water because of the process interference factor presented by the PVA
in, for example, pastel shade development.
A new technology that would eliminate the disadvantages of the current PVA UF
recovery process is Vacuum Flash Evaporation (VFE). Some of the commercial uses of
VFE evaporation include separating volatile matter from polymer solutions [13], water
from crude 1,4-butanediol [14] and water from clay slurries [15]. The VFE process for
recovery and concentration has been used in a variety of industries, but has never been

4
demonstrated for PVA size recovery in the textile industry. In this technology, the
excess water in the dilute PVA desize stream is vacuum flash evaporated in a controlled
pressure manner [16]. The steam that is produced from the VFE unit is condensed and
utilized as hot, clean make-up water in any plant wet processes (dyeing, preparation,
washing, etc.). The energy “penalty” incurred by installing a VFE unit and phase
transforming water (~1000 Btu’s/lb. of water) is thus minimized, as approximately the
same energy used to concentrate the PVA size would be used anyway by the plant in the
form of boiler feed energy to produce steam for heating water in the facility’s existing
wet processes. In addition, all of the water contained in the desize stream is recovered
and recycled back into the plant, giving a true closed-loop character to the overall
desizing-size concentration/reuse sequence of processes and aiding the overall process
economics. In the reported case of PVA size recovery by VFE, the concentrated PVA
stream exiting the VFE process also contains the low molecular weight “tail” of the PVA
distribution that is currently lost in the UF process, and thus the former will have more
favorable material balance economics than the latter. The reported thesis research
investigated the VFE process and its economics in PVA size recovery/concentration, and
the properties/utilization/performance of the recovered PVA emanating from the process.
In the VFE process, when abrupt pressure drops occur on a water surface, surplus
heat in the liquid is transferred into latent heat of vaporization. Following Fick’s Law of
diffusion, the abrupt drop in pressure increases the mass flow rate 10-12 times more than
that of simple thermal evaporation. A super cooled and super heated heterogeneous
profile is developed on the liquid surface due to flash evaporation [16]. To make the
process more efficient, the liquid is injected into the evaporator by a spray nozzle [17].

5
VFE can thus operate at lower temperatures to phase transform water from the
liquid to the vapor phase, e.g., 30oC [18]. At a low liquid temperature, high vacuum is
required, whereas at a high temperature, low vacuum is needed [16]. The heat exchanger
incorporated directly into the VFE unit works very efficiently. The VFE unit
manufactured by VACOM LLC claims that up to 90% of the heating energy is recovered
by the unit’s heat exchanger [19]. As a result, the energy required to heat the incoming
desize effluent stream at steady state is substantially lowered. The desize effluent stream
available for flash evaporation is normally < 90oC in temperature. Because of its
relatively high temperature, the vacuum required for flash evaporation of the stream is
very low. Energy input into the VFE process is thus needed mainly for pumping water
and operating vacuum pumps. VACOM, LLC reported that for its VFE equipment, the
total energy costs for running a suitably-sized VFE unit for the selected model plant
desize effluent volume/hour was an average of $0.006/feed gallon [1]. When processing
desize water at ~90oC, energy costs will thus be less than for a stream entering the VFE
process at ambient temperature. First, low vacuum is needed because of the high
temperature of the incoming desize effluent stream. Second, evaporation at higher
temperature increases the mass flow rate.
One gallon of desize effluent contains 0.083 lb of PVA if the initial concentration
of PVA is 1%, and this mass has a value of $0.08316, considering the virgin PVA cost at
~$1/lb [16]. If the desize effluent of a large operating plant is 100,000 gallons/day and
the plant operates 350 days/year, the savings in recycled PVA alone would be
$2.9M/year. VFE unit manufacturers claim that if the recovered material has some

6
inherent value, then the raw ROI of installing a plant-size unit for PVA concentration and
recovery could be as little as a few months to a year [20].

7
CHAPTER 2
LITERATURE REVIEW
2.1 Introduction
2.1.1 Energy Consumption in the Textile Industry
Textile manufacturing is one of the oldest industries in history and serves a basic
requirement of all human beings. The global textile industry is one of the largest
consumers of energy [4-7]. The world’s energy consumption per year required for
desizing alone is more than the total annual household energy consumption of some
countries [21, 22]. The world is facing the gigantic task of meeting its ever-increasing
energy requirements. World energy demand is expected to increase from 447 quadrillion
Btu in 2004 to 702 quadrillion Btu in 2030 [2]. In 2004, 94% of the total energy
consumption came from non-renewable resources. The global demand for petroleum is
projected to increase by 40%, coal 74% and natural gas 62% by 2030 [2]. Unrestricted
burning of fossil fuels will further contribute to the green house effect and global
warming. The greatest challenge is to solve the crisis of exhausting non-renewable
resources and increasing demand without affecting global development and growth. An
urgent need exists to save energy at every front, either by developing new technologies or
by innovative applications of existing technologies in multiple arenas.

8
2.1.2 Slashing
Weaving is a process in which heddles move up and down and a reed moves
forward and backward at high speed (Figure 2.1) [23]. Warp yarns undergo excessive
stress, strain, abrasion, etc., due to these moving metal parts.
Figure 2.1: Heddles and Reed Positions in Weaving [23]
Greige warp yarns are weak, and they frequently break in modern high-speed
weaving processes. In order to make the warp yarns more weave able, their properties
(tensile strength, abrasion resistance, etc.) must be improved by a process known as
slashing. In slashing, greige warp yarns are dipped in a polymeric size solution, squeezed
between rollers to a predetermined pickup and then dried and the size film cured on
steam drying cans. After slashing, yarns have a thin film of size on them with some size
penetration (Figures 2.2-2.3). The purpose of slashing is to improve the warp yarns’
weave ability by increasing their tensile strength, flexibility, abrasion resistance, etc.
These properties help in improving weave ability, but they need to be optimized, because
after certain critical points, continued increases in these properties actually decreases the

9
weave ability, e.g., a too-high increase in yarn tensile strength leads to a decrease in
elongation at break.
Figure 2.2: Section of Size Box [24]
Figure 2.3: Fiber Size Binding in a Yarn [25]
10
An ideal size increases the strength of warp yarns by cementing the fibers in the structure
and preventing fiber slippages [26], which leads to a corresponding decrease in
elongation at break (the latter should not go below 20% of the corresponding greige yarn
elongation at break) [25, 27].
Control of size penetration into the individual yarn diameter is needed as
increased size penetration decreases flexibility and increases stiffness. Flexibility of the
yarn is an important property because warp yarns bend under tension as heddles move up
and down with the harnesses. Size film on slashed yarns may crack, leading to an
increase in friction if the warp yarns are not flexible and causing warp yarn breakages in
weaving. In towel weaving, if the pile slashed yarn is very stiff, it becomes difficult for
the terry weaving machine to form the loop. Efficient slashing should create a uniform,
smooth size film on the yarn, which will reduce friction and hold the surface fibers in
place. The most common slashing agents are PVA and starch, most commonly in PVA-
heavy blends of the two, e.g., 60:40 or 70:30 [28, 29]. Filling (weft) yarns in weaving are
not slashed.
2.1.3 Desizing
Slashing is conducted to facilitate the weaving process. After weaving, the fabric
needs to be desized to facilitate colorant/chemical uptake in subsequent wet processes,
e.g., dyeing and printing. The desizing process is critically important for quality dyeing
and printing. In desizing, applied size is removed from the woven cloth by passing it
through wash boxes at high temperature. The temperature of the wash box and the
number of wash boxes required in series are dependent upon the desizing process and
type of cloth. Desize ability of the size is measured by considering two factors: the

11
percentage of size left in the fabric, and the concentration of the size in the desize effluent
stream. Enzymes are most commonly employed for desizing of starch-slashed fabric.
Enzyme desizing is performed at controlled temperature, pH and electrolytes. The PVA
copolymer size Elvanol® T-66 utilized in this research can be removed up to 97% level
using hot water alone at 95oC [30]. E. I. DuPont Co. recommends using only hot water
for Elvanol© T-66 PVA desizing if the size is to be recovered from the desize effluent
stream and reused.
2.1.4 Pollution from Desizing
In the process of slashing, yarns are coated with a polymeric size that improves its
weaving properties [4]. Polyvinyl alcohol (PVA) and starch are the sizes that are widely
used in the textile industries, often as a blend. After weaving, size is removed from the
fabrics in the preparation process of desizing. Voluminous hot water is utilized in
desizing, and if both PVA and starch are present, the effluent is a high Biological Oxygen
Demand (BOD)/Chemical Oxygen Demand (COD) contributor to the plant’s Primary
Oxygenation Treatment of Water (POTW) operation. Starch itself contributes 50% of
BOD in composite textile effluents (100,000-600,000 mg L-1) [4, 8], whereas no known
bacteria has yet evolved to generate enzymes that attack and degrade the synthetic PVA
polymer backbone(PVA was invented only ~85 years ago) [9]. The desize pollution
streams containing synthetic PVA are a threat to the environment [4-7], so textile plants
have to carefully process the desize effluent sent to the POTW. There are four ways of
separating size from desize effluent stream: biodegradation; bioelimination (adsorption
by sludge); precipitation; and ultrafiltration (UF) [7, 31, 32]. Biodegradation is used for
natural sizes, whereas the last three are used for synthetic sizes. The first three processes

12
produce copious quantities of sludge which requires disposal; however, in UF and VFE
size concentration systems, the PVA is recovered and recycled with no sludge formation.
2.1.5 Size Recovery
The treatment of large volumes of desize effluent is costly. When an all-
PVA/wax size is used, significant incentives exist to recover the size material from the
desize wash water stream, concentrate it and reuse it. Unfortunately, no effective and
efficient means to do this has ever been implemented in the industry. Ultrafiltration
(UF), operating on the principle of reverse osmosis and based on spiral-wound, polymeric
membrane films, has been used for this purpose in the U. S. on a very limited basis,
mainly where forced by regulatory authorities. However, this technique has not found
widespread industrial acceptance because of high capital investment, high operating costs
and poor effectiveness. Starch size is not appropriate for significant recovery and
repeated reuse cycles because the natural material is subject to chemical/biological
breakdown by starchase enzyme-producing bacteria with time, i.e., the formulation
“sours” [4-7, 10].
In UF, the semi-permeable membrane excludes the high molecular weight PVA of
the desize effluent stream, whereas low molecular weight PVA and water passes through
the membrane. The hot permeate containing the low molecular weight tail of the PVA
distribution is sometimes re-used in “dirty” applications, e.g., as make-up water for wash
boxes in preparation processes after scouring [11], whereas the recovered PVA is mixed
with virgin PVA (usually in a 70:30 weight ratio) [11] reused in slashing. The UF
process in recovery and recycling of PVA has the following limitations and
disadvantages [5, 12]:

13
- The spiral wound polymeric membranes can foul, requiring process shutdown
for cleaning, adding to operational costs. The membranes also degrade and decompose in
use, requiring expensive, periodic replacements.
- A heavy pressure drop (up to 500 kPa) exists across the membranes, requiring
high pumping pressures to force the water through the filters, leading to high electrical
consumption.
- Loss of much of the low molecular weight (MW) “tail” from the PVA
distribution contained in the desized stream which passes through the UF filter under the
high pumping pressures (~3-5% of the total mass available). The contamination of the
separated water stream with the low MW PVA results in added PVA costs and restricts
the potential reuse of the exiting hot water in other textile processes in the plant, e.g., as
dye bath make-up water because of the process interference factor presented by the PVA
in, for example, pastel shade development.
A new technology that would eliminate the disadvantages of the current PVA UF
recovery process is Vacuum Flash Evaporation (VFE). Some of the commercial uses of
VFE evaporation include separating volatile matter from polymer solutions [13], water
from crude 1,4-butanediol [14] and water from clay slurries [15]. The VFE process for
recovery and concentration has been used in a variety of industries, but has never been
demonstrated for PVA size recovery in the textile industry. In this technology, the
excess water in the dilute PVA desize stream is vacuum flash evaporated in a controlled
pressure manner [16]. The steam that is produced from the VFE unit is condensed and
utilized as hot, clean make-up water in any plant wet processes (dyeing, preparation,
washing, etc.). The energy “penalty” incurred by installing a VFE unit and phase

14
transforming water (~1000 Btu’s/lb. of water) is thus minimized, as approximately the
same energy used to concentrate the PVA size would be used anyway by the plant in the
form of boiler feed energy to produce steam for heating water in the facility’s existing
wet processes. In addition, all of the water contained in the desize stream is recovered
and recycled back into the plant, giving a true closed-loop character to the overall
desizing-size concentration/reuse sequence of processes and aiding the overall process
economics. In the reported case of PVA size recovery by VFE, the concentrated PVA
stream exiting the VFE process also contains the low molecular weight “tail” of the PVA
distribution that is currently lost in the UF process, and thus the former will have more
favorable material balance economics than the latter. The reported thesis research
investigated the VFE process and its economics in PVA size recovery/concentration, and
the properties/utilization/performance of the recovered PVA emanating from the process.
In the VFE process, when abrupt pressure drops occur on a water surface, surplus
heat in the liquid is transferred into latent heat of vaporization. Following Fick’s Law of
diffusion, the abrupt drop in pressure increases the mass flow rate 10-15 times more than
that of simple thermal evaporation. A super cooled and super heated heterogeneous
profile is developed on the liquid surface due to flash evaporation [16]. To make the
process more efficient, the liquid is injected into the evaporator by a spray nozzle [17].
VFE can thus operate at lower temperatures to phase transform water from the
liquid to the vapor phase, e.g., 30oC [18]. At a low liquid temperature, high vacuum is
required, whereas at a high temperature, low vacuum is needed [16]. The heat exchanger
incorporated directly into the VFE unit works very efficiently. The VFE unit
manufactured by VACOM LLC claims that up to 95% of the heating energy is recovered

15
by the unit’s heat exchanger [19]. As a result, the energy required to heat the incoming
desize effluent stream at steady state is substantially lowered. The desize effluent stream
available for flash evaporation is normally < 90oC in temperature. Because of its
relatively high temperature, the vacuum required for flash evaporation of the stream is
very low. Energy input into the VFE process is thus needed mainly for pumping water
and operating vacuum pumps.
2.1.6 Cotton Impurities
In the case of size recovery using UF, some cotton chemical impurities along with
low molecular weight PVA pass through the membrane, whereas in VFE, they remain in
the recovered size. Impurities in the cotton mainly depend upon the soil and climate of
the region where it grows and the variety of the cotton. Peters and Trotman detailed the
constituents of typical raw cotton fiber as: cellulose, 88.0-96.0% by weight; proteins, 1.1-
1.9%; pectic substances, 0.7-1.2%; ash, 0.7-1.6%; waxes, 0.4-1.0%; maleic, citric and
other organic acids, 0.5-1.0%; total sugars, 0.3%; and pigment traces and others, 0.9%
[33, 34]. The cellulose weight percentage after scouring and bleaching of cotton fibers
reaches as high as 99%.
2.2 Polyvinyl Alcohol
2.2.1 Introduction
PVA is one of the most commonly used sizes in today’s market, and was first
introduced into the textile industry in 1965. PVA can be used with or without other sizing
agents, e.g. starch, polyester resin, CMC and acrylic size. PVA/starch blend sizes are
most commonly used in slashing. The stronger PVA film provides better resistance to

16
warp yarns against abrasion in high speed weaving than does a pure starch film, while
starch ameliorates the strength of the PVA film while reducing the cost of the overall size
formulation [25].
2.2.2 PVA Homopolymer
PVA is manufactured from vinyl acetate monomer (VAc). VAc is the starting raw
material for PVA, as the monomer vinyl alcohol does not exist in nature (spontaneously
tautomerizes to the more-stable acetaldehyde). Manufacturing PVA from VAc is a two
stage process as shown in Figure 2.4. First VAc is polymerized to polyvinyl acetate
(PVAc), and the PVAc is then hydrolyzed with NaOH to PVA:
Figure 2.4: Chemistry of Polyvinyl Alcohol Manufacturing [35]
In the hydrolysis, acetate groups are largely replaced by alcohol groups (Figure
2.5), and the percentage of acetate groups replaced determines the degree of hydrolysis. If
86-88% of the acetate groups in the precursor PVAc are replaced by alcohol groups, the
17
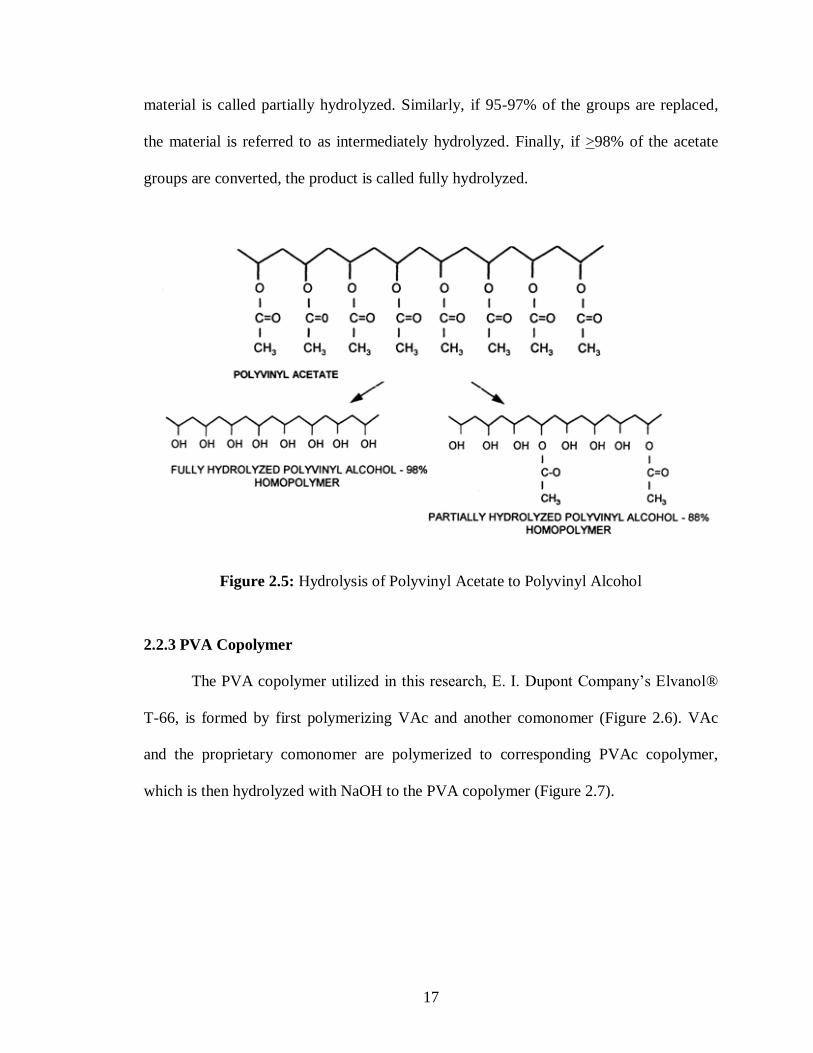
material is called partially hydrolyzed. Similarly, if 95-97% of the groups are replaced,
the material is referred to as intermediately hydrolyzed. Finally, if >98% of the acetate
groups are converted, the product is called fully hydrolyzed.
Figure 2.5: Hydrolysis of Polyvinyl Acetate to Polyvinyl Alcohol
2.2.3 PVA Copolymer
The PVA copolymer utilized in this research, E. I. Dupont Company’s Elvanol®
T-66, is formed by first polymerizing VAc and another comonomer (Figure 2.6). VAc
and the proprietary comonomer are polymerized to corresponding PVAc copolymer,
which is then hydrolyzed with NaOH to the PVA copolymer (Figure 2.7).

18
Figure 2.6: PVA Copolymer Manufacturing [35]
The comonomer employed is non-hydrolysable and makes the copolymer more stable to
hydrolysis. The degree of hydrolysis of the copolymer is close to that of the PVAc
homopolymer.
Figure 2.7: Hydrolysis of PVAc Copolymer to PVA Copolymer [35]
Some of the properties required by a PVA slashing agent include the following:
compatible with other sizing agents; readily soluble in water; easily removed from the
fabric in desizing; and should not be altered chemically by the concentration/recovery

19
process. PVA grades below 88% hydrolysis are not 100% soluble in hot water (~140oF,
Figure 2.8), whereas all PVA grades above 88% hydrolysis are soluble.
Figure 2.8: Water Solubility of PVA at 140oF [25]
PVA film becomes heat set during drying/curing on steam cans in the slashing
process, causing a water solubility decrease and requiring a higher temperature to desize
(Figure 2.9). The solubility rate of heat set PVA film can be increased by increasing the
desize water temperature. Acceptable desizing for all grades of PVA slashed yarn can be
achieved at temperatures from 170 –190oF, but DuPont Elvanol® T-66 PVA is easy to
desize (Figure 2.10).

20
Figure 2.9: Water Solubility of Heat Set PVA Film [25]
Figure 2.10: Size Removal as a Function of Washing Temperature for (a) Elvanol® T-66
PVA, and (b) Intermediately Hydrolyzed PVA [30]

21
2.3 Ultrafiltration
2.3.1 Introduction
In UF, a semi-permeable polymeric membrane is used to exclude high molecular
weight polymeric size, whereas water, low molecular weight polymer and some cotton
impurities pass through it as permeate [10, 12, 22, 31, 36, 37]. UF and related
hyperfiltration (HF) processes have been used for textile waste water treatment since
1971 [38], but the first plant for recovery and recycling PVA size was installed in the J.
P. Stevens Co. facility at Clemson, S. C. in 1973 [39]. Initially, this technology was
used for treating composite textile waste, i.e., water waste from all wet processes [40]. In
1973, Brandon et al. used a dynamic HF membrane specifically for concentration and
reuse of dyeing waste water (Figure 2.11) [41, 42]. Brandon observed no detectable
difference between samples dyed with water recovered from the UF process and normal
plant dye make-up water. The Brandon group results encouraged the eventual use of the
UF process in the recovery and recycling of PVA size.
Figure 2.11: Schematic of Hyperfiltration Process [41]

22
Government regulations targeted to bring the textile discharge of pollutants to
zero by 1985 [22] necessitated improvement of the UF size recovery process to make
more efficient and economical. In 1979, Porter and Black observed that high molecular
weight PVA size is retained by UF membranes [22]. Recovery and reuse of the PVA
size reduced the plant COD level up to 93.5%. Potter studied carbon tubular, stainless
steel tubular and polyvinyl sulfone spiral-wound film membranes for the recovery of
PVA size (Figure 2.12) [5].
Figure 2.12: Koch Membrane System for Polyvinyl Alcohol Recovery [5]
2.3.2 Recovered Polymer
In UF, a polymeric film membrane is used to separate molecules. This membrane
has pores of different sizes and separates molecules according to their physical size. The

23
desize effluent stream entering the UF process contains water, wax and PVA of
molecular dimension 2 Å, 40 Å and 4000-5000 Å, respectively, plus various cotton
chemical impurities [30]. PVA has a broad range of molecular weights and in UF water,
wax low molecular weight PVA and some cotton chemical impurities pass through the
membrane [29]. DuPont determined the effect of UF in PVA-co-methyl methacrylate
copolymer recovery. The researchers measured the molecular weights using GPC of the
PVA copolymer used in sizing with a number average degree of polymerization of 1000
before slashing, after desizing, and recovered PVA copolymer from UF and UF permeate
(Figure 2.13).
Figure 2.13: Comparison of Molecular Weight Distribution of Elvanol® T-25* Before
and After UF Recovery (a) Permeate; (b) Original Copolymer Before Size Preparation;
(c) Ultrafiltrate and (d) Feed to the UF Unit [30]
*Elvanol® T-25 is another PVA copolymer in the same series of E. I. DuPont, Co. sizes
as its T-66.

24
The low molecular weight shoulder peak can be seen in the desize effluent stream plot.
Shifts in the peak towards low molecular weight shows that the permeate contains low
molecular weight polymer. The UF generated concentrate shows a narrowed distribution
of the molecular weight, again indicating a loss of low molecular weight PVA to the
permeate.
2.3.3 Fouling and Cleaning of UF Membranes
Buckley found fouling of the spiral-wound polysulfone (PS) film UF membrane
was a problem that could be controlled by periodic rinsing with hot water and sodium
peroxide [12]. The membrane was cleaned at weekly intervals with a 0.5% w/v sodium
peroxide solution. However, the efficiency of the PS membrane decreased to 80-90% if
cleaned with 0.2M NaOH solution at 25oC and then with hot water at 70–80
oC [43]. The
authors observed a decrease in membrane efficiency with time upon repeated fouling and
cleaning, necessitating periodic replacement. Buckley studied the effect of various
cleaning methods on the permeability of the membrane (Figure 2.14) [44].
Buckley and Flemmer developed a mathematical model to calculate the
membrane flux [45, 46], and utilized it to evaluate the effect of membrane cleaning and
fouling on the efficiency of the UF process. The authors calculated that significant
savings could be achieved by optimizing the UF process parameters.

25
Figure 2.14: Membrane Permeability After Various Cleaning Methods [44]
2.3.4 Effect of Recycled Size on Weaving Efficiency
Buckley et al. [12] and other [32, 47-50] researchers showed the weaving
performance of recycled size slashed yarn was actually better than that of the virgin PVA
slashed yarn. Langer observed that the recycled size had a narrower molecular weight
distribution, as the low molecular weight PVA passed through the membrane and high
molecular weight PVA remained in the recycled size [48]. UF recycled PVA slashed yarn
showed increases in weaving efficiency of 1-2% over that of virgin PVA. The high
molecular weight average, UF-recovered PVA size exhibited improved adhesiveness, and

26
as a result, recycled PVA slashed yarn also reduced dust emissions in the plant, which not
only improved working conditions but also increased the life of the weaving machines
[47].
The researchers above did not consider the effect of cotton impurities in the
concentrated, recovered size emanating from the UF process. In fact, losing the low
molecular weight PVA tail to the permeate should lead to a poorer warp yarn weaving
performance and a stiffer size film in the subsequent slashing with recycled size. The
increase in weaving performance observed by the various authors was likely due to the
occlusion of cotton chemical impurities into the recycled PVA films.
2.3.5 Effect of Variables on UF Process
Lin and Lan studied the effects of membranes and working conditions on the
efficiency of the UF process in size recovery [10, 51, 52]. The researchers observed that
an increase in temperature, pressure and mixer speed all increased the efficiency of the
UF process, but an increase in any of these variables increased the processing cost. They
observed that for a UF process, the optimum values of temperature, pressure and mixer
speed were 80oC, 200 kPa and 500 rpm, respectively. Temperatures below 80
oC
decreased the UF efficiency significantly because of an increase in viscosity, whereas,
high mixer speeds prevented the blockage of the membrane as it avoided polarization of
PVA. The researchers used three types of membranes from the Amicon (Amicon, Inc.,
Beverly, Massachusetts, USA), two of which were hydrophilic (Amicon YM 30 and YM
100 with 30,000 and 100,000 molecular weight cutoff), and one was hydrophobic
(Amicon PM 30 with a 30,000 molecular weight cutoff). The hydrophilic membrane with
low molecular weight cut off exhibited good performance, while the hydrophobic

27
membrane performed well in polymer permeation and retention but had the lowest
reusability (Figure 2.15). On the contrary, Andre et al. [49] studied the effect of
recycling using UF on properties of recovered size.
Figure 2.15: Effects of Different Membrane Types on the Permeate Flux at 80oC, 0.135
MPa and 500 rpm Mixer Speed [51]
The authors observed that the viscosity of the size did not change although a large
mass of low molecular weight material passed through the membrane. The adhesive
power of the size was reduced by 5-7%. Cheng and Pan [53] observed that up to 53% of
the UF permeate flux can be enhanced by a gas distributor.
28
2.3.6 Effect of UF Process Variables on PVA Properties
In the UF process of size recovery and recycling, desize water
undergoes thermal stresses and mechanical shear forces, and it contains salts and organic
chemical impurities extracted from the cotton under the desizing conditions. Michaela
and Wolfgard observed that PVA is not affected by alkali earth salt (calcium chloride
dehydrate), whereas it is attacked by alkali salts [54]. The authors also found that the
thermal and mechanical stabilities of PVA were good under the UF process conditions.
When the recovered PVA size was kept at 80oC for three days in a drying chamber, the
viscosity did not change. In another experiment, PVA size was subjected to mechanical
shear forces, and it was resistant to degradation under the conditions. The cotton
impurities in the regenerated size acted as a good source of nutrients for bacterial growth.
Adding 0.5% of 35% hydrogen peroxide to the concentrated size controlled the growth of
bacteria.
2.3.7 Efficiency of UF Membrane
The pH of the desize effluent stream affected the efficiency of the UF membrane.
Lee et al. observed that the permeation flux was doubled under alkaline conditions [43].
Gunter used KMB polyamide capillary tube membranes for UF size recovery and
observed fluid flow through the capillary tube due to hydrostatic pressure, making such
membranes economically efficient [6]. Langer studied the effect of concentration of
desize effluent on the efficiency of the UF membrane and observed that the efficiency
decreased with an increase in concentration (Figure 2.16) [48, 55].

29
Figure 2.16: Theoretical Flow Rate as a Function of Concentration [48]
Langer attributed this to the formation of a second layer of desize effluent over the UF
membrane. The process did not remain economically viable once the desize effluent
achieved concentration of 5-7% by weight solids. However, Lee et al. used polysulfone
membranes and observed that UF was not economically viable at concentrations above
3% and after achieving the breakeven point, because the low permeation rate cost of
energy increased [43]. Langer suggested the use of an evaporative thermal technique for
further concentrating the size [48].
Buckley et al. conducted studies for 16 months using a UF pilot plant for closed
loop cycling of textile desize effluent [12]. The researchers desized PVA sized cloth at
98oC using 2 l/kg of water. In the UF process, the temperature of desize water was kept
at 95oC with concentrations ranging from 1% to 6%. A total of 8% virgin PVA was
added to each recycled size formulation. The researchers reported that only 75% of size
was recovered using the UF pilot plant. Robinson [56] also reported recovery of PVA
30
size up to 70% by the UF process, whereas Potter et al. [22], Brandon et al. [38] and
Ulrich [57] mentioned PVA recoveries up to 84-90%. The UF process ran for four years
without any major failure, which confirmed the reliability of the process.
2.3.8 Economic Benefits of the UF Process
The textile industry uses up to 50% of its energy consumption in heating water
[38]. Out of the total effluent load in the finishing process, 50-60% is contributed by the
sizing agent [48]. If a UF process of recovery and recycling is used, a plant which uses
346,000 gallons of water per day in conventional desizing can reduce its consumption to
158,000 gallons per day, and energy consumption in heating this water is reduced from
274 million Btu/day to 165 million Btu/day [58]. Potter estimated in 1979 that the U.S.
industry consumed 5 trillion Btu of energy in the desizing process [22]. Brandon et al.
showed that if an effective UF process is used in PVA size recovery and recycling of
water, then savings totaling $79 million in recovered size value and $264 million in
energy could be realized annually by the U.S. textile industry [38]. The group also
concluded that UF is cost effective if energy recovery is >90%. Potter discussed the
economic aspects of the UF process and concluded that the U.S. industry could save up to
$500 million a year with incorporation of UF technology for PVA size recovery and
reuse [5]. Potter estimated that the payback period of a UF PVA size recovery and
recycling process was less than two years. Ulrich, however, estimated it to be less than
five years [57].
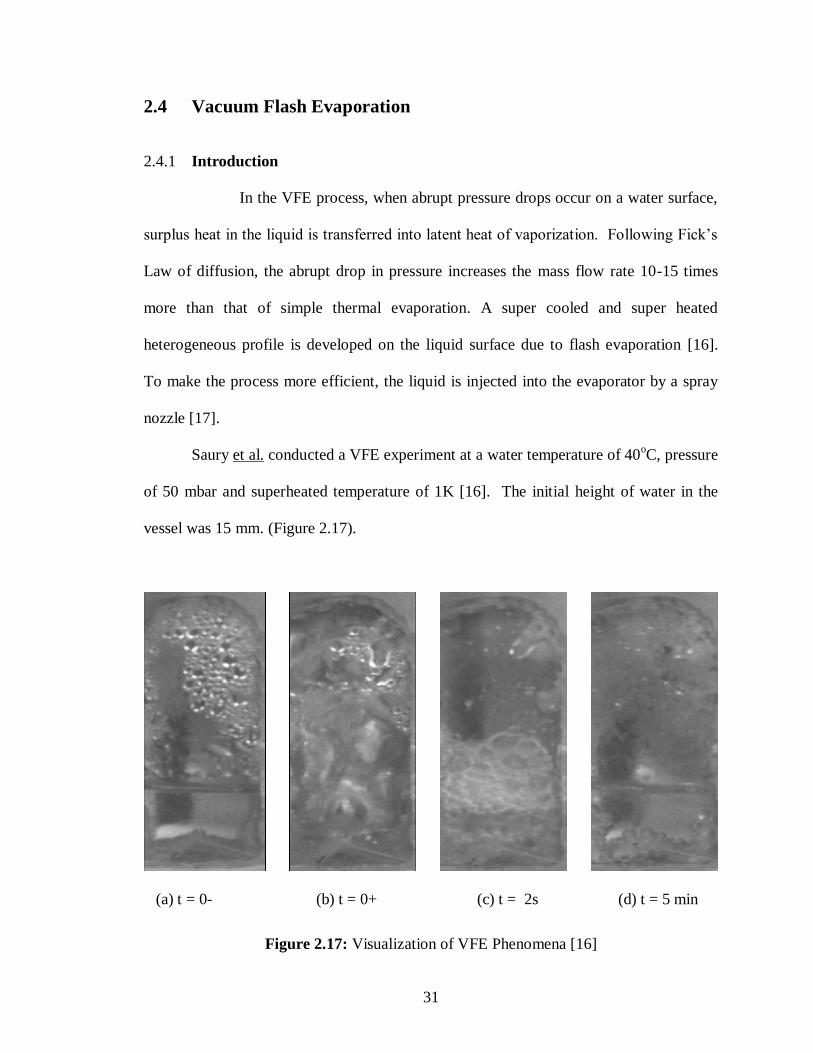
31
2.4 Vacuum Flash Evaporation
2.4.1 Introduction
In the VFE process, when abrupt pressure drops occur on a water surface,
surplus heat in the liquid is transferred into latent heat of vaporization. Following Fick’s
Law of diffusion, the abrupt drop in pressure increases the mass flow rate 10-15 times
more than that of simple thermal evaporation. A super cooled and super heated
heterogeneous profile is developed on the liquid surface due to flash evaporation [16].
To make the process more efficient, the liquid is injected into the evaporator by a spray
nozzle [17].
Saury et al. conducted a VFE experiment at a water temperature of 40oC, pressure
of 50 mbar and superheated temperature of 1K [16]. The initial height of water in the
vessel was 15 mm. (Figure 2.17).
(a) t = 0- (b) t = 0+ (c) t = 2s (d) t = 5 min
Figure 2.17: Visualization of VFE Phenomena [16]

32
The Figure 2.17a photograph was taken just before starting the experiment, where water
at 40oC in the flash evaporation vessel was at rest. The Figure 2.17b photograph was
taken just after opening the vacuum valve, where the liquid reached a state of turmoil.
The Figure 2.17c photograph, which was taken two seconds after the vacuum valve was
opened, showed less turmoil, but the water was still boiling. The last photograph (Figure
2.17d) was taken five minutes after opening the vacuum valve, and showed the water
again standing at rest. Evaporation was more rapid due to the generated turmoil (Figure
2.17b).
Gopalakrishna [59] determined the mass flow rate experimentally by measuring
the height of the liquid in the flash vessel. Saury [11] calculated the mass flow rate for the
VFE process using the energy balance (Eqn. 2.1):
(m – δm) cp (T – dT) – m cp T – δm hfg = 0 Eqn. 2.1 [16]
cp Specific heat of liquid [J/kg K]
hfg Latent heat of vaporization [J/kg]
m Mass of liquid [kg]
T Temperature of water [oC]
δm Change in mass [kg]
dT Change in temperature [oC]
and the evaporated mass flow equation (Eqn. 2.2):

33
dt
dT
Thc
hcHA
dt
dmm
ofgp
fgpevev .
)./(1
/..1
.
Eqn. 2.2 [16]
A Horizontal cross-sectional area of flash chamber [m2]
cp Specific heat of liquid [J/kg K]
H Height of liquid [m]
hfg Latent heat of vaporization [J/kg]
mev Evaporated mass of liquid [kg]
evm.
Instantaneous evaporated mass flow [kg/s]
To Initial temperature of water [oC]
ρ1 Density of liquid [kg/m3]
2.4.2 Effect of VFE Process Variables on Mass Flow
Saury plotted Figures 2.18 and 2.19 using an evaporated mass flow rate equation,
and observed that the evaporated mass of water initially increased with time, but
remained constant after 6 seconds of vacuum flash evaporation [16]. Figures 2.18 and
2.19 show that the evaporated mass and evaporated mass flow rate decreased with time:

34
Figure 2.18: Evolution of mev vs. Time at a Pressure of 50 mbar [16]
Figure 2.19: Evaporated Mass Flow Rate vs. Time at 50 mbar Pressures [16]

35
Saury also observed that the evaporated mass increased with an increase in initial
temperature, but decreased with an increase in initial pressure (Figure 2.20).
Figure 2.20: Evolution of Evaporated Mass vs. Initial Temperature [16]
2.4.3 Economic Benefits of the VFE Process
Heat energy recovered in the VFE process is up to 95%, and the turbulence in the
recycled stream reduces fouling inside the heat exchanger [19]. The processes operate at
temperatures as low as 35oC [18, 20, 60, 61]. Some of the applications of the VFE
concentration process are desalination, distillation of 1,4-butanediol, concentration of
clay slurries, removal of volatile matter from polymer solutions and treatment of waste
streams from polyvinyl acetate glue, oil refinery, rolling stock, etc., processes [13-15, 18-
20, 60-62]. According to VACOM, LLC and the Led Italia Co., the energy cost of
operating a plant-scale VFE system is $0.0125/feed gallon (concentrating liquid from 1%

36
to 25% [1]) and $13.55/feed ton, respectively, with raw ROI of less than a year with both
company systems. A VFE process can increase concentration of the target polymer up to
90 - 95% [60, 63]. One gallon of desize water contains 37.8 grams of PVA if the initial
concentration of PVA is 1%, with a value of $0.08316 (considering a virgin PVA cost
$1/lb). If the desize effluent of a large operating plant is 100,000 gallons/day and the
plant operates 350 days/year, projected savings in recycled PVA alone would be
$2.9M/year, coupled with hot water savings of approximately ~100,000 gallons/day.
2.4.4 VFE Plant Operations
A VFE unit consists mainly of three components: feeding unit, evaporation unit
and heat exchanger (Figure 2.21). The maximum and minimum levels of liquid in the
evaporator are fixed, and when the level goes below the minimum level, the feeding unit
receives the signal and automatically fills the evaporator. The feeding unit feeds directly
into the evaporator or via a heat exchanger, depending on the temperature of the feed
liquid and the temperature inside the evaporator. The liquid in the evaporation unit is
exposed to a sudden pressure drop and evaporates; this pressure is controlled by a flash
valve. Evaporated steam passes from the evaporation unit to the heat exchanger. When
the desired concentration of PVA is achieved, the concentrate is drained from the
evaporator and passed to the slashing operation. The temperature of the liquid inside the
evaporator is maintained by passing the liquid continuously through the heat exchanger.
The steam is passed through the heat exchanger and condensed, resulting in a stream of
clean, hot water that has unrestricted reuse in the plant’s wet processes.
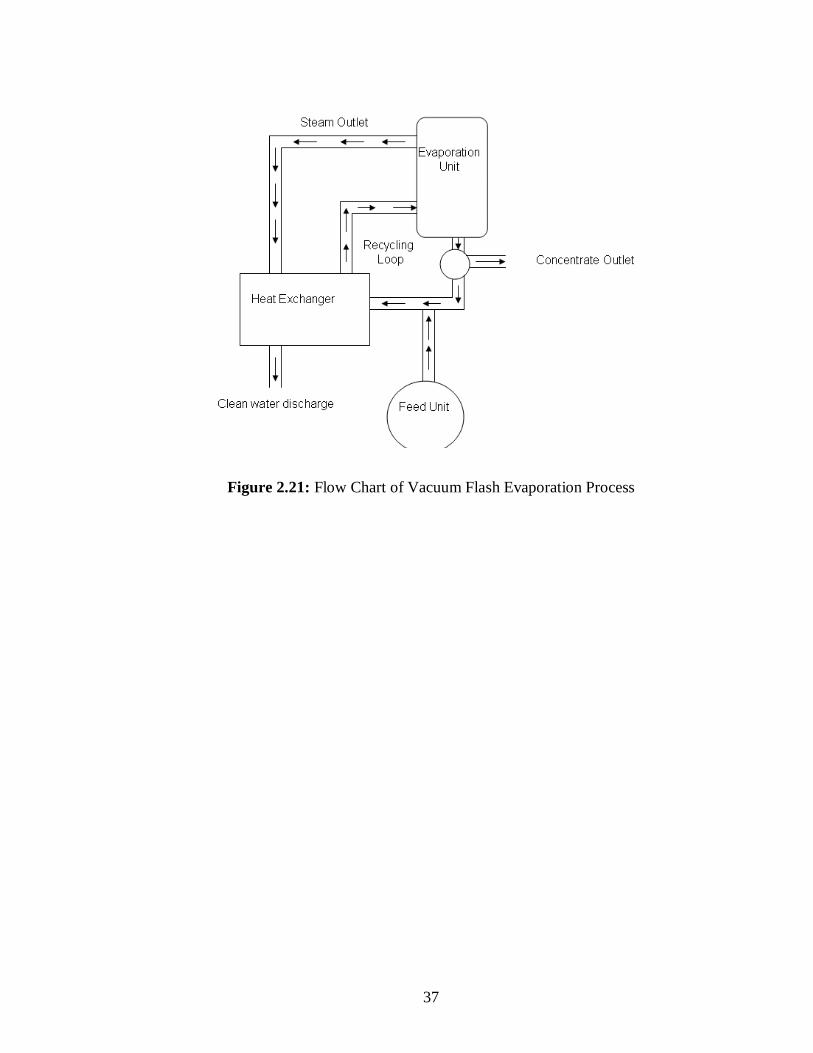
37
Figure 2.21: Flow Chart of Vacuum Flash Evaporation Process

38
CHAPTER 3
OBJECTIVES AND TECHNICAL APPROACH
3.1 Objectives
In earlier research on the UF process of recovery and recycling of PVA size, more
emphasis was given to the process itself, but little attention was given to the properties of
the recovered size. The main objectives of this research were:
To study the technical and economic feasibilities of the VFE process in the
concentration/recovery and subsequent recycling of PVA size, and how the VFE
process can avoid the major disadvantages of the analogous UF process.
To investigate the recycled PVA polymer plus cotton chemical impurity blended
size, and determine the effects of film property changes as a function of recycle
sequence number, i.e., increasing impurity level.
To study the effects of cotton impurities in recycled PVA size on the weaving
performance of slashed warp yarns.
To study the effects of cotton impurities along with wax in the size formulation on
the film properties.
To study the effects of cotton impurities along with wax in recycled PVA size on
the weaving performance of slashed yarns.
39
To demonstrate the feasibility of the VFE process to concentrate and recover PVA
size, using a Webtex Pilot (12 end warp) Slasher to slash cotton towel pile and
ground yarns.
3.2 Technical Approach
The research was divided into four phases:
1. To determine the effects of cotton impurities on recycled size films and
slashed yarns.
2. To determine the effects of cotton impurities, wax and their combinations on
recycled size films and slashed yarns.
3. To conduct scale up, proof of concept trials by applying the optimized bench
scale results to a Webtex Pilot (12 end warp) Slasher.
4. To calculate the economic feasibility of incorporating the demonstrated VFE
PVA size recovery/reuse process into a model plant.
3.2.1 Effect of Cotton Impurities on Recycled Size Films and Slashed Yarns
The first phase of the research investigated the effects of cotton impurities on
recycled PVA polymer and determined the film and slashed yarn properties as a function
of recycle sequence number. The tests conducted to determine cast, recycled size film
and slashed yarn properties are summarized in Table 3.1. Film and slashed yarn samples
were made from simulated, recycled PVA solutions. In the VFE process, water is
evaporated and the concentrated solution consists of PVA, wax and extracted cotton
chemical impurities. Cotton chemical impurities are extracted from the slashed yarns

40
during the desizing process. In the simulated samples, yarn impurities were first extracted
from cotton yarns by conducting the desizing process on greige yarns, and the
concentrated impurity solution was mixed with virgin PVA powder to reach established
concentrations of both. Impurity levels of 0%, 14.3%, 25%, 33.3% and 40% by weight
solids were utilized for the recycled PVA film and slashed yarn preparations. Recycled
PVA films were assessed for tensile properties (breaking strength, elongation at break,
elastic modulus, etc.). As slashed warp yarns undergo repeated cycles of stress and strain
during the weaving process, their tensile properties were also assessed. Other important
properties such as film wettability, bust rod resistance and viscosity were tested. The
slashed yarns were desized under optimized conditions, and the ease of the desizing
process was measured by film wettability.
Industry normally controls the slashing process through size formulation
viscosity/concentration, so the effects that recycling the PVA/cotton impurity had on size
solution viscosity were established. In slashing, the sheet of yarns exiting from squeeze
rollers is dried on steam cans. In this sheet, some of the yarns are stuck together by
bridged PVA film. To individualize the sized yarn, this sheet is divided into two sheets,
or leases, of alternate yarn by a metal rod called a bust or leasing rod. The bust rod is
located between the yarn sheets or leases. Most of the yarn breaks and hairiness
generation take place at this point of the slashing process, so the bust rod resistance was
studied.

41
Table 3.1: Experimental Plan Phase 1: Effects of Cotton Chemical Impurities Concentration on Films and Slashed Yarn Properties
Test Materials Sample Compositions Observation Purpose
Tensile
Properties
Virgin and Recycled
PVA Size Film
Five Impurities Concentration:
0%, 14.3%, 25%, 33.3% and 40%
Change in Breaking
Strength, Elongation at
Break and Elastic Modulus
with impurities
Important for Weave
Ability
Contact Angle
Virgin and Recycled
PVA Size Film
Five Impurities Concentration:
0%, 14.3%, 25%, 33.3% and 40%
Change in Contact Angle
with Impurities
Good Desizing Properties
are Required
Viscometry
Virgin and Recycled
PVA Size Film
Five Impurities Concentration:
0%, 14.3%, 25%, 33.3% and 40%
Change in Viscosity with
Impurities
Industry Control Sizing
Process from its Viscosity
Tensile
Properties
Slashed Yarn with
Recycled Size
Five Impurities Concentration:
0%, 14.3%, 25%, 33.3% and 40%
Change in Tenacity and
Work of Rupture with
Impurity
Important for Weave
Ability

42
Table 3.1 (contd.): Experimental Plan 1: Effects of Cotton Chemical Impurities Concentration on Films and Slashed Yarn Properties
Test Materials Sample Compositions Observation Purpose
Size Add-On
Slashed Yarn with
Recycled Size
Five Impurities Concentration:
0%, 14.3%, 25%, 33.3% and 40%
Change in Size Add-On
with Impurities
Size Yarn Properties
Depend on Size Add-On
Bust Rod
Resistance
Slashed Yarn with
Recycled Size
Five Impurities Concentration:
0%, 14.3%, 25%, 33.3% and 40%
Change in Bust Rod
Resistance with Impurities
Most of the Breakages
Take Place at Bust Rod
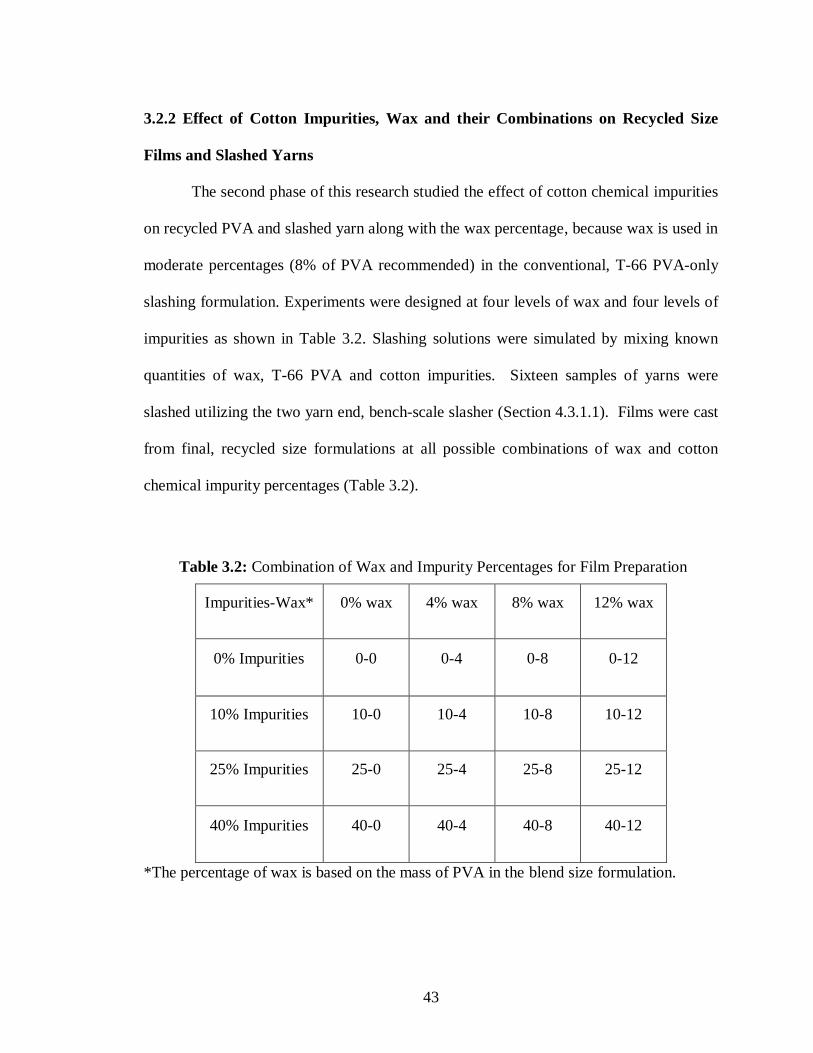
43
3.2.2 Effect of Cotton Impurities, Wax and their Combinations on Recycled Size
Films and Slashed Yarns
The second phase of this research studied the effect of cotton chemical impurities
on recycled PVA and slashed yarn along with the wax percentage, because wax is used in
moderate percentages (8% of PVA recommended) in the conventional, T-66 PVA-only
slashing formulation. Experiments were designed at four levels of wax and four levels of
impurities as shown in Table 3.2. Slashing solutions were simulated by mixing known
quantities of wax, T-66 PVA and cotton impurities. Sixteen samples of yarns were
slashed utilizing the two yarn end, bench-scale slasher (Section 4.3.1.1). Films were cast
from final, recycled size formulations at all possible combinations of wax and cotton
chemical impurity percentages (Table 3.2).
Table 3.2: Combination of Wax and Impurity Percentages for Film Preparation
Impurities-Wax* 0% wax 4% wax 8% wax 12% wax
0% Impurities 0-0 0-4 0-8 0-12
10% Impurities 10-0 10-4 10-8 10-12
25% Impurities 25-0 25-4 25-8 25-12
40% Impurities 40-0 40-4 40-8 40-12
*The percentage of wax is based on the mass of PVA in the blend size formulation.

44
Films were tested for their tensile properties, whereas slashed yarns were tested for
tensile properties, bust rod resistance, size add-on, hairiness, abrasion cycles to first yarn
breaks, etc. (Table 3.3).
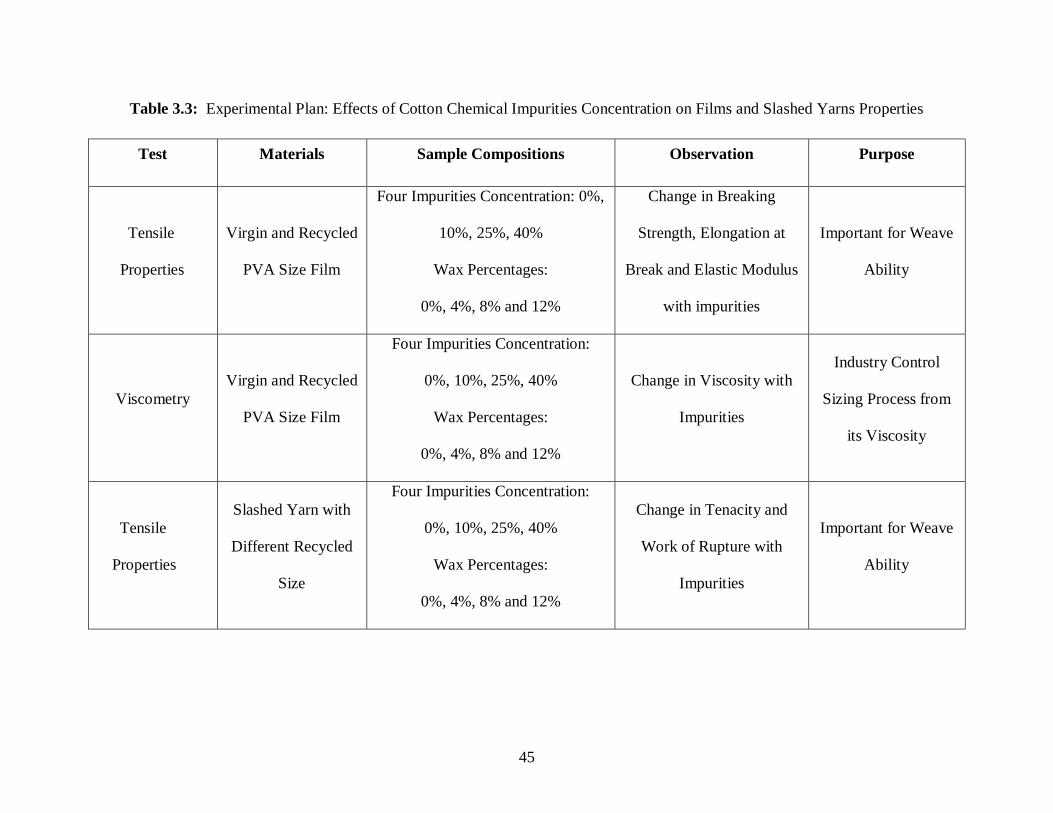
45
Table 3.3: Experimental Plan: Effects of Cotton Chemical Impurities Concentration on Films and Slashed Yarns Properties
Test Materials Sample Compositions Observation Purpose
Tensile
Properties
Virgin and Recycled
PVA Size Film
Four Impurities Concentration: 0%,
10%, 25%, 40%
Wax Percentages:
0%, 4%, 8% and 12%
Change in Breaking
Strength, Elongation at
Break and Elastic Modulus
with impurities
Important for Weave
Ability
Viscometry
Virgin and Recycled
PVA Size Film
Four Impurities Concentration:
0%, 10%, 25%, 40%
Wax Percentages:
0%, 4%, 8% and 12%
Change in Viscosity with
Impurities
Industry Control
Sizing Process from
its Viscosity
Tensile
Properties
Slashed Yarn with
Different Recycled
Size
Four Impurities Concentration:
0%, 10%, 25%, 40%
Wax Percentages:
0%, 4%, 8% and 12%
Change in Tenacity and
Work of Rupture with
Impurities
Important for Weave
Ability

46
Table 3.3 (contd.): Experimental Plan: Effects of Cotton Chemical Impurities Concentration on Films and Slashed Yarns Properties
Test Materials Sample Compositions Observation Purpose
Size Add-On
Slashed Yarn with
Different Recycled
Size
Four Impurities Concentration:
0%, 10%, 25%, 40%
Wax Percentages:
0%, 4%, 8% and 12%
Change in Size Add-On
with Impurities
Size Yarn Properties
Depend on Size Add-
On
Bust Rod
Resistance
Slashed Yarn with
Different Recycled
Size
Four Impurities Concentration:
0%, 10%, 25%, 40%
Wax Percentages:
0%, 4%, 8% and 12%
Change in Bust Rod
Resistance with Impurities
Most of the
Breakages Takes
Place at Bust Rod

47
Table 3.3 (contd.): Experimental Plan: Effects of Cotton Chemical Impurities Concentration on Films and Slashed Yarns Properties
Test Materials Sample Compositions Observation Purpose
Hairiness
Slashed Yarn with
Different Recycled
Size
Four Impurities Concentration:
0%, 10%, 25%, 40%
Wax Percentages:
0%, 4%, 8% and 12%
Change in Hairiness with
Impurities
Hairiness Cause
Breakage on Loom
Abrasion Cycles
to First Yarn
Breaks
Slashed Yarn with
Different Recycled
Size
Four Impurities Concentration:
0%, 10%, 25%, 40%
Wax Percentages:
0%, 4%, 8% and 12%
Change in Abrasion Cycles
with Impurities
Main Concern of
Sizing to Improve
Weave Ability

48
3.2.3 Proof of Concept Trials Conducted on Pilot Slasher
In the third phase of this research, optimized results obtained from the bench top
research were applied in scale up studies using the continuous Webtex© Pilot Slasher
(Section 4.3.3). The cotton chemical impurity concentration plateau in the recycled size
was achieved in ~five slashing cycles. In consultation with WestPoint Homes, size solids
add-ons of 10% and 3% by yarn weight were fixed for ground and pile yarns
respectively. Conventional residential towels manufactured by WestPoint Homes (WPH)
have ground, pile and filling yarns in a 1:6:1 mass ratio, respectively. Ground and pile
yarns were slashed in adequate volumes to generate the respective masses of slashed
yarns corresponding to the WPH towel ratio. The first slashing cycle was conducted as a
conventional slashing (93% T-66 PVA/7% Seyco Superwax S), then five slashing cycles
were conducted using recovered plus virgin PVA formulations (no wax was added to the
recycle formulations that contained the extracted cotton impurities). A 10 ml aliquot of a
4 g/l solution of C.I. Basic Violet 10 dye was added to each size formulation to provide a
visual interpretation of size penetration into the yarn diameters.
In towels, ground and pile yarns are slashed, whereas filling yarn is greige
(unsized), so when desizing towels, filling yarn impurities are also extracted into the
desize effluent stream. Towel desizing was simulated by mixing slashed ground, slashed
pile and greige filling yarns in the same mass ratio (1:6:1) as existing in WPH’s
residential towels. After VFE concentration of the desize streams and addition of the
optimized mass of virgin T-66 PVA to complete the size formulations for the next
slashing cycles, films were cast from the final size formulation, and their breaking
strengths, elastic moduli and elongations to break were all tested. Slashed pile and ground

49
yarn physical properties, i.e., tenacity, load at break, elongation at break, work of rupture,
bending length, abrasion resistance, degree of hairiness, size penetration, yarn color and
size add-on, were all quantified (Table 3.4).
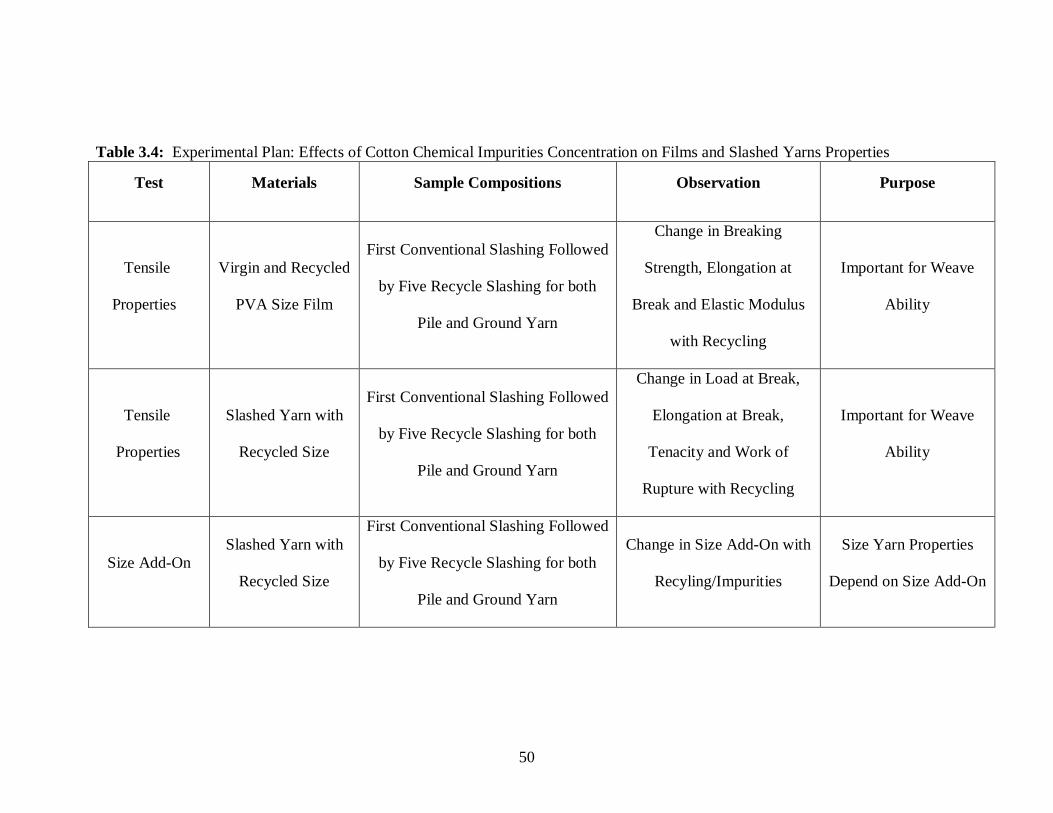
50
Table 3.4: Experimental Plan: Effects of Cotton Chemical Impurities Concentration on Films and Slashed Yarns Properties
Test Materials Sample Compositions Observation Purpose
Tensile
Properties
Virgin and Recycled
PVA Size Film
First Conventional Slashing Followed
by Five Recycle Slashing for both
Pile and Ground Yarn
Change in Breaking
Strength, Elongation at
Break and Elastic Modulus
with Recycling
Important for Weave
Ability
Tensile
Properties
Slashed Yarn with
Recycled Size
First Conventional Slashing Followed
by Five Recycle Slashing for both
Pile and Ground Yarn
Change in Load at Break,
Elongation at Break,
Tenacity and Work of
Rupture with Recycling
Important for Weave
Ability
Size Add-On
Slashed Yarn with
Recycled Size
First Conventional Slashing Followed
by Five Recycle Slashing for both
Pile and Ground Yarn
Change in Size Add-On with
Recyling/Impurities
Size Yarn Properties
Depend on Size Add-On
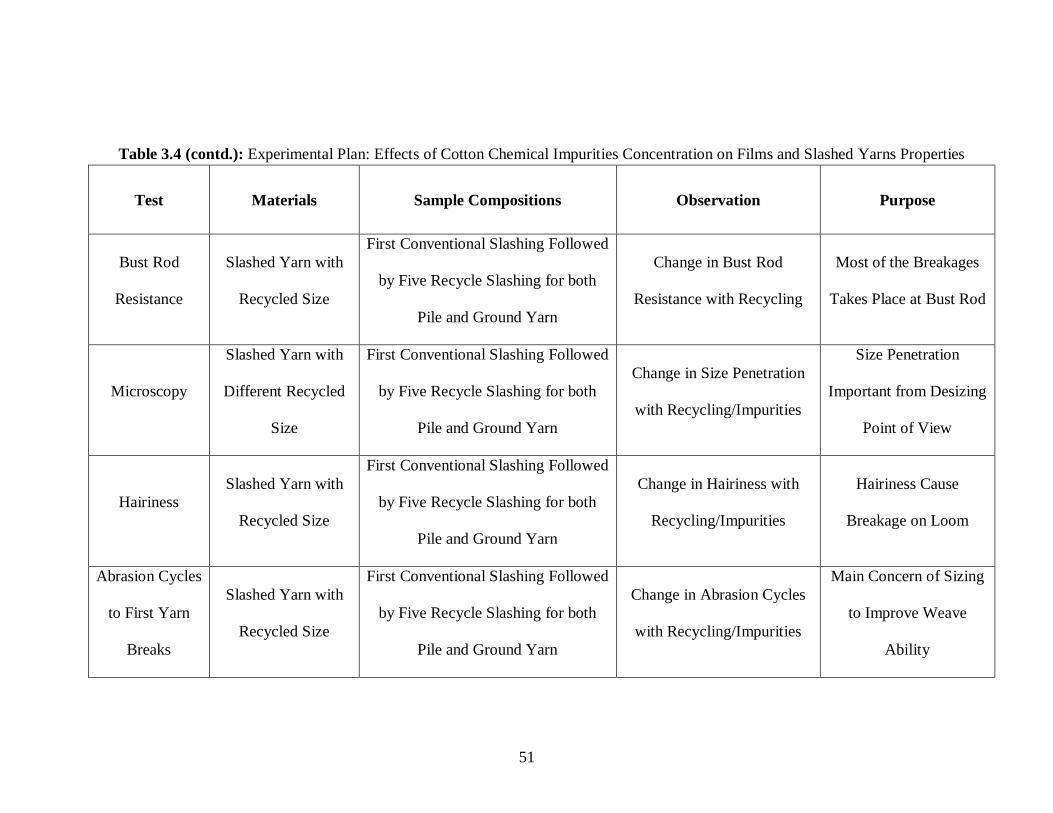
51
Table 3.4 (contd.): Experimental Plan: Effects of Cotton Chemical Impurities Concentration on Films and Slashed Yarns Properties
Test Materials Sample Compositions Observation Purpose
Bust Rod
Resistance
Slashed Yarn with
Recycled Size
First Conventional Slashing Followed
by Five Recycle Slashing for both
Pile and Ground Yarn
Change in Bust Rod
Resistance with Recycling
Most of the Breakages
Takes Place at Bust Rod
Microscopy
Slashed Yarn with
Different Recycled
Size
First Conventional Slashing Followed
by Five Recycle Slashing for both
Pile and Ground Yarn
Change in Size Penetration
with Recycling/Impurities
Size Penetration
Important from Desizing
Point of View
Hairiness
Slashed Yarn with
Recycled Size
First Conventional Slashing Followed
by Five Recycle Slashing for both
Pile and Ground Yarn
Change in Hairiness with
Recycling/Impurities
Hairiness Cause
Breakage on Loom
Abrasion Cycles
to First Yarn
Breaks
Slashed Yarn with
Recycled Size
First Conventional Slashing Followed
by Five Recycle Slashing for both
Pile and Ground Yarn
Change in Abrasion Cycles
with Recycling/Impurities
Main Concern of Sizing
to Improve Weave
Ability

52
Table 3.4. (contd.): Experimental Plan: Effects of Cotton Chemical Impurities Concentration on Films and Slashed Yarns Properties
Test Materials Sample Compositions Observation Purpose
TGA Desize Solid Five Disizing Cycles
Change in Impurity with
Desizing
Impurity Percentage in
Slashing Solution
Dilute Solution
Viscometry
PVA and Desize
Solid
Desize solid
Change in Intrinsic Viscosity
with Recyling/Impurity
Change in Molecular
Weight
Desizing
Efficiency
Desize Yarn/Solid Five Desizing Cycles
Percentage Solid Remove in
Desizing
Further Processing of
Fabric
Color Variation Desize Yarn Five Desizing Cycles Desize Yarn Color
Further Processing of
Fabric
Bending Length
Slashed Yarn with
Recycled Size
First Conventional Slashing Followed
by Five Recycle Slashing for both
Pile and Ground Yarn
Change in Bending Length
with Recycling/Impurities
Slashing Pile Yarn

53
3.2.4 Economic Feasibility
Determination of the developed VFE PVA recovery and recycling process’
economic feasibility was conducted in consultation with VFE instrument manufacturer
VACOM, LLC. A model industrial plant producing desize effluent at a rate of ~100,000
gallons per day was considered and savings from incorporation of the VFE technology
for PVA size recovery and recycling over the conventional PVA/starch/wax process with
no size recycling was calculated.
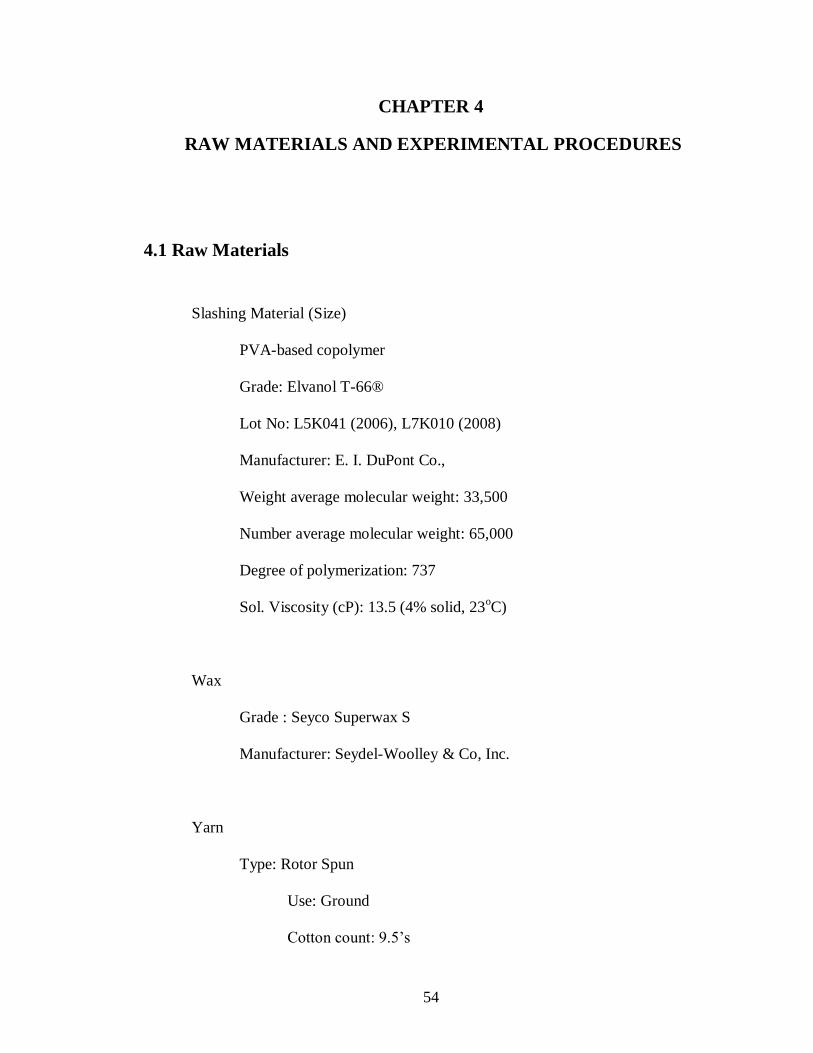
54
CHAPTER 4
RAW MATERIALS AND EXPERIMENTAL PROCEDURES
4.1 Raw Materials
Slashing Material (Size)
PVA-based copolymer
Grade: Elvanol T-66®
Lot No: L5K041 (2006), L7K010 (2008)
Manufacturer: E. I. DuPont Co.,
Weight average molecular weight: 33,500
Number average molecular weight: 65,000
Degree of polymerization: 737
Sol. Viscosity (cP): 13.5 (4% solid, 23oC)
Wax
Grade : Seyco Superwax S
Manufacturer: Seydel-Woolley & Co, Inc.
Yarn
Type: Rotor Spun
Use: Ground
Cotton count: 9.5’s

55
Supplier: Spring Industries
Type: Rotor Spun
Use: Pile
Cotton count: 12’s
Supplier: Spring Industries
Type: Rotor Spun
Use: Ground, Filling
Cotton count: 10’s
Supplier: Frontier Spinning Mills
Type: Rotor Spun
Use: Pile
Cotton count: 12’s
Supplier: Frontier Spinning Mills
Tracer Dye
Trade Name: C.I. Basic Violet 10
CAS #: [81-88-9]
Supplier: Organic Dyestuffs Corporation, Rhode Island, USA
Antibacterial Agent

56
Trade Name: Bioban DXN
Manufacturer: Dow Chemical Company, Midland
4.2 Equipment
Polymer Film Formation
Model: Auto-Draw III
Manufacturer: Industry Tech, Florida
Bench Yarn Slasher (2 End Slasher)
Manufacturer: Developed in-house using old machine parts
Figure 4.1: Photograph of the Two-End Bench Slasher
Yarn Slashing Machine (at UGA, Athens, GA)
Model: Webtex
Manufacturer: Alma Works Todmorden, Lancs

57
(a) Side View of Webtex Slasher
(b) Size Box (c) Warp Creel

58
(d) Drying Cans (e) Squeeze Roller
(f) Winding Spool (g) Tension Rod (h) Bust Rod
Figure 4.2: Sections of Webtex© Slasher
Thermogravimetric Analyzer (TGA)
Model: TGAQ5000-0307
Manufacturer: TA Instrument
Instron
Model: 5567
Manufacturer: Instron, Norwood

59
Toray Fray Counter
Model: DT-104 with S-Head
Manufacturer: Toray Industries, Inc. Charlotte
Sulzer Ruti Webtester,
Model: Reutlinzer Webtester
Manufacturer: Sulzer Ruti Machinery Works Ltd
Bending Stiffness
Model: FRL Cantilever Bending Tester
Manufacturer: Testing Machines Inc. New York
Contact Angle
Model: VCA Optima
Manufacturer: AST Products Inc.
Hunter MiniScan Portable Spectrocolorimeter
Model: MiniScan MS/S-4000L
Manufacturer: Hunter Associates Laboratory Inc. Virginia
Rotary Evaporator
Model: Heidolph Collegiate Laborota 4000 G1
Manufacturer: Brinkmann

60
Vacuum Oven
Model: M-3608-5
Manufacturer: Lab Line Instruments Inc. Melrose
Oven
Model: Isotemp Oven
Manufacturer: Fisher Scientific
Viscometer
Model: DV-1
Manufacturer: Brookfield
Microscope
Model: LEICA DM IRM, Software Image Pro 6.2
Manufacturer: Leica Microsystems
4.3 Experimental Procedures
4.3.1 Size Formulation
The size formulation and make-up procedure were supplied by the T-66 PVA size
manufacturer, E. I. DuPont Co. [64]. The required amount of water was stirred with a

61
magnetic bar in a beaker at room temperature and measured quantities of the powdered
Elvanol T-66 PVA and flaked Seyco Superwax S were sequentially added. The
temperature of the beaker was raised to 90oC via hot plate, and maintained at this
temperature with stirring for 30 min.
4.3.1.1 Simulated Recycled Slashing Solution
In VFE, excess water is evaporated to steam, and the size concentrate stream
containing extracted cotton impurities exits the process. Cotton impurities alone were
obtained by desizing greige yarn using the initially-developed, two-step desizing method
(4.3.4.1). Known quantities of cotton impurities and T-66 PVA were mixed with water to
generate a simulated, recycled size formulation. Industry controls the slashing process
either by controlling viscosity or controlling concentration of the slashing solution.
Viscosity of the size formulation was kept constant at 10 cP. Other conditions and
procedures for making size formulations were the same as detailed by the E. I. DuPont
Co. [64].
4.3.1.2 Recycled Size Formulation
In discussions with WPH, residential towel compositions were manufactured in
the mass ratio of 1:6:1, respectively, for ground, pile and filling yarns [28]. In the towel,
only ground and pile yarns are slashed, whereas filling yarn remains greige. In this work,
the yarns were mixed in the same mass ratio as the WPH residential towel and desized
using the developed, three-step desizing process (Section 4.3.4.2). Solids in the desize
effluent were calculated (Section 4.3.7), and the effluent stream was then divided in the
volume ratio 5:9 for ground yarn and pile yarn, respectively. The desize effluent stream
fractions were then concentrated using the Rotary Evaporator to 2.4% and 6% total solids

62
concentrations for pile and ground yarn, respectively (Section 4.3.5), bringing the
solutions to the calculated final volumes required for the recycled size formulations.
Calculated quantities of virgin PVA were added in the concentrated effluent fractions for
pile and ground yarn to generate the final size formulations for the subsequent slashing
cycles. The temperature of the size formulations was raised to 90oC and maintained for
30 minutes, and the tracer dye was then added to the formulation. The solids
concentrations were kept constant at 10% and 3% w/v for ground and pile yarns,
respectively. Ground and pile yarns were slashed using their respective solutions, and the
desize stream solids concentration/recycled size reuse process was then repeated five
times with each yarn type.
4.3.2 Cotton Chemical Impurities
The total mass of cotton chemical impurities that were released during desizing
was calculated using a mass balance. Greige cotton yarn was dried in an oven at 50oC for
two hours and then conditioned at 72oF and 65% RH for 24 hours. The yarn was weighed
and then desized. The desized yarn was dried in the oven and conditioned as above. The
dried and conditioned desized yarn was weighed again, and the percentage loss in weight
was calculated. The percentage by yarn weight of cotton impurities extracted from the
yarns corresponded to the percentage loss in yarn weight occurring in the desize process.
The cotton impurities percentage by weight extracted from the greige yarn under
the desizing conditions was confirmed through a different route by evaporating the water
from the desize effluent stream in a convection oven. A clean, empty beaker with
aluminum foil was dried in the oven. The beaker was sealed with the aluminum foil and
weighed after cooling for 10 minutes. The aluminum foil was removed from the beaker,

63
and the desize effluent stream water was evaporated from the beaker first in the
convection oven and then in a vacuum oven. After achieving total dryness of the residual
cotton impurities, the beaker was sealed with the aluminum foil, cooled for 10 minutes,
and weighed again. The percentage of cotton impurities was calculated from the dry
impurities’ mass weight.
4.3.3 Yarn Slashing
Slashing experiments were conducted using two slashing lines. Bench top
experiments were conducted using the two-yarn-end bench slasher (Figures 4.1 and 4.3).
Simulated recycled size formulations were prepared by mixing known quantities of T-66
PVA and cotton impurities. Size formulation viscosity was kept constant at 10 cP. Size
box temperature was maintained at 70oC. Slashing speed was kept constant, and the
slashed yarn was passed through squeeze rolls at constant pressure to attain the
proscribed wet pickup. Finally, the slashed yarns passed through a 12 inch tube furnace
set at ~200oC for drying. Over-drying of the slashed yarn was prevented by appropriately
synchronizing the oven temperature.
Figure 4.3: Yarn Flow Chart of the Bench Slasher
Yarn Flow on Bench Slasher
Yarn
PackageSize Box
Squeeze
Roller
Heater
for
Drying
Yarn
Winder

64
In the scale-up experiments, the Webtex© Pilot Slasher was utilized to slash 12
warp yarn ends (Figure 4.2). The maximum number of yarns ends that were allowed on
the slasher (30) were reduced to 12 and new small size box was fabricated because of the
following problems:
The full Webtex size box temperature was not uniform.
No stirring mechanism was built into the size box.
Due to the large volume of the size box, evaporation was rapid at the application
temperature (70oC), rendering control of the size formulation concentrations
difficult.
Because of the large size box, a huge quantity of yarn was required to be slashed
and then desized, generating a large volume of desize effluent. Evaporating a high
volume of desized effluent was difficult and time-consuming on the simulated
VFE, rotary evaporator system.
The level of the size formulation in the box was maintained and its temperature
was kept constant at 70oC with continuous stirring using a hot plate magnetic stirrer with
Teflon©-coated bar. Impregnated yarn was squeezed by rolls to the proscribed wet
pickup (~100%) at constant, minimum pressure. The slashed yarns were then dried in line
on the electric-fired drying cans. Four drying cans were traversed in series, and the can
temperatures were controlled in the 120-140oC range. The slashed yarn was passed
successfully from the drying cans through the slasher’s guides, bust rods, tensioning bar
and finally to the winding spool of the line. Size formulation concentrations for the
ground and pile yarns were kept constant at 10% and 3% w/v, respectively. The linear

65
yarn speed (10 m/minute) was kept constant for slashing ground and pile yarns to achieve
the required add-ons. Size solids add-ons required for pile and ground yarns were also
3% and 10% on the weight of the yarns, respectively. Size solids add-ons were checked
intermittently by physically removing slashed yarn samples just after the squeeze rollers
and measuring their weights and lengths to calculate the add-ons:
Size addon =W−D
D∗
S
100∗ 100 Eqn. (4.1)
W: Wet Yarn Weight / Length
D: Dry Yarn Weight / Length
S: Size Formulation Concentration
4.3.4 Yarn Desizing
Desizing process conditions were optimized so that >95% of the size was
removed from the slashed yarns. Two desizing methods were developed. Both methods
removed up to >95% of the size and the same ~2.3% percentage of cotton chemical
impurities based on yarn weight. The first developed desizing method was a two-step
process, utilizing fresh water in both steps. After visiting WPH, a new desizing method
was developed which better simulated the WPH desizing process. The second method
was a three-step process, utilizing fresh and used (recycled) wash water.
4.3.4.1 Two-Step Yarn Desizing Process
Slashed yarn was desized in two steps as shown in Figure 4.4. In the first step,
the liquor ratio was maintained at 20:1. The desized bath was heated to 95oC and sized

66
yarn was then immersed into it. Yarn in the water was stirred continuously for four
minutes. Yarn was then taken out and squeezed by hand to remove the excess liquid. In
the second step, the liquor ratio was maintained at 10:1. The desize bath was heated to
85oC, and then the first-step desized yarn was immersed into it. The bath was stirred
continuously for two minutes. The yarn was then removed and squeezed by hand. The
desize effluent streams from both steps were collected and combined for
concentration/recycling.
Figure 4.4: Line Diagram of Two-Step Desizing Process
4.3.4.2 Three-Step Desizing Process
Desizing of the slashed yarns was conducted in three steps as shown in Figure 4.5.
The desizing conditions were the same in all three steps:
Temperature: 95 oC
Time: 8 minutes
Liquor Ratio: 15:1

67
Figure 4.5: Line Diagram of Three-Step Desizing Process
Slashed yarn was first desized using the desize effluent stream obtained from the second
desize box. The yarn was squeezed and the effluent stream was stored for size recovery.
Squeezed yarn was desized again using the effluent stream obtained from the third desize
box. Yarn was squeezed and the desized effluent was again stored to use in the first step.
In the last step, squeezed yarn was desized again in fresh water and the effluent stream
was kept for the second step. The wash water was topped-off with fresh water in the first
and second steps.
4.3.5 Size Recovery
After discussions with the VFE manufacturer partner, VACOM, LLC, a Laborota
4000 G1 Rotary Evaporator was used for the fundamental studies instead of a true VFE
unit, as the former is a good bench simulation of the full-scale industrial process (Section
4.2). The desize effluent stream was filtered through a sieve to remove solids (short fiber,
dust and dirt) and stored in an oven at 90oC. The desize effluent stream was concentrated
at 65oC using the rotary evaporator at constant vacuum. The desize effluent stream
properties were not affected by storing at 90oC, and the industry also stores PVA desize

68
effluent streams at this temperature. Recovered PVA size was used with or without added
virgin PVA for the preparation of films and for subsequent-cycle slashing of yarns.
4.3.6 Size Formulation Viscosities with Impurities
Cotton chemical impurities were isolated from greige yarns as detailed earlier
(Section 4.3.2). Size formulations were prepared as recommended by the E. I. DuPont
Co. (Section 4.3.1). In preparing size formulations for recycle runs, a known quantity of
cotton impurities was added instead of wax. Concentrations of all the solutions were kept
constant. The final size formulations were kept stirred and air cooled to room
temperature. The temperatures of all the samples were kept constant (27oC). The solution
viscosities were measured using a Brookfield Viscometer (Section 4.2).
4.3.7 Desizing Efficiency
Efficiency of the desizing process was checked by mass balance. A clean, empty
glass beaker with aluminum foil was dried in an oven (~120oC). The beaker was sealed
with aluminum foil and weighed after cooling for 10 minutes. Total desize effluent
stream was measured and water was evaporated from a known quantity of it, first by
heating in the convection oven (~120oC), and then fully drying the residuals in a vacuum
oven. The beaker was then sealed with the aluminum foil and weighed again after cooling
for 10 minutes. From the two beaker weights, the total solids content in the desize
effluent stream was calculated. Theoretical and experimental values of solid content in
the desize effluent stream were compared.

69
4.3.8 Slashed Yarn Add-On
The slashed yarn sheet consisted of 12 ends, and one meter of slashed yarn sheet
was cut from 12 different places. Each pile and ground yarn sample thus contained 144
meters of yarn. Greige and slashed yarns weights were measured after being conditioned
at 65% RH and 72oF for 24 hours.
Add − On % =Wei ght of Slashed Yarn −Weight of Greige Yarn
Weight of Greige Yarn∗ 100 Eqn. (4.2)
Yarn Tex =Weight of the Yarn g
Length of the Yarn (m)∗ 1000 Eqn. (4.3)
4.3.9 Recycled T-66 PVA Film Preparation and Testing
Films were cast from virgin and recycled T-66 PVA size using the Auto Draw III
(Figure 4.6) device. The instrument included a glass plate and a coating rod.
Approximately 15 ml of size solution was poured on the glass plate and spread
mechanically with the help of the coating rod. The purpose of the coating rod was to lay a
uniform layer of solution on the glass plate. The cast film was left overnight to air-dry,
and then carefully removed from the glass plate by hand-peeling.

70
Figure 4.6: Auto-Draw III Film Casting Instrument [65]
4.3.9.1 Tensile Testing of Cast Films
Cast films were dried at 50oC for two hours in a convection oven and then
conditioned for 24 hours before testing at 65% relative humidity and 72oF. Pure and
recovered size films were tested for the tensile properties using ASTM Test Method
D882-02 [66]. Samples of one cm width and five cm gauge length were prepared and
tested for this study. Thickness of the samples was measured at four places using a
micrometer. Breaking strength, breaking elongation and modulus of elasticity were
calculated:
Breaking Strength
Breaking Strength =Load at Break (N)
Width of the Film mm ∗Thickness of the Film (mm ) Eqn (4.4)

71
Breaking Extension
Breaking Extension =Elongation at Break mm
Initial Length (mm )∗ 100 Eqn. (4.5)
Modulus of Elasticity
Modulus of Elasticity =Strength
Strain Eqn. (4.6)
4.3.9.2 Water Contact Angle on Cast Films
The contact angle of a distilled water droplet placed on the cast film was
determined. VCA Optima instrument and VCA Optima XC software was used to
measure the contact angle (Figure 4.7). A syringe of 100 micro liters was cleaned five
times with distilled water. The syringe was filled with distilled water and placed back in
the slot. The tip of the syringe was cleaned with paper towels and left to dry for 10-15
minutes. Drop size (0.3 micro liters), speed (high) and syringe size (100 micro liters)
values were entered into the software. The contact angles of distilled water drops were
measured at 10 places on the film, and the values averaged.
Figure 4.7: Distilled Water Drop on Recycled Size Film
72
4.3.10 Slashed Yarn Testing
Slashed yarns were dried in a convection oven at 50oC for two hours. The dried
yarns were then conditioned for 24 hours at 65% RH and 72oF.
4.3.10.1 Tensile Testing
Greige and slashed yarns were tested for tensile properties using ASTM Test
Method D2256-02 [67]. Samples of 10 cm gauge length were tested for tensile
properties. Load at break, elongation at break, tenacity and work of rupture were
obtained:
Tenacity at Break
Tenacity at Break =Load at Break (N)
Yarn Linear Density Tex Eqn. (4.7)
Breaking Extension
Breaking Extension =Elongation at Break mm
Initial Length (mm )∗ 100 Eqn. (4.8)
Work of Rupture
Work of Rupture = Area under Load Elongation Curve (gf. cm) Eqn. (4.9)
4.3.10.2 Yarn Hairiness
A Toray Fray Counter in S mode was used to determine the hairiness of the
slashed yarns. Hairs of a spun yarn whose length was more than the set value were

73
counted. Hair length was set using a scale and dial. Ten samples of four meters each
were taken from different places of the slashed yarn. Each sample was tested four times
to achieve a valid representation of the hairs. Hairs were counted at different hair lengths
and a graph was plotted of the numbers of hairs vs. hair length. Initially, the numbers of
hairs increased with hair length, but after a critical hair length, the number of hairs began
decreasing (Figure 4.8). This critical hair length was considered as a base line, i.e., true
origin of hair length, and the number of hairs more than 1.5 and 2 mm hair length were
counted. The number of hairs per meter was then calculated.
Figure 4.8: Number of Frays Plotted against Fray Length to Determine the Origin
4.3.10.3 Yarn Abrasion
Fifteen slashed yarns per test were abraded against square and round pins on the
Ruti Webtester, and the number of abrasion cycles to first yarn breaks were recorded
(Figure 4.9). Sixty samples of one yard length were tested. The experiment was

74
conducted at 500 abrasion cycles/minute. The tensioning device in the instrument was
calibrated using a 10 N load. The total value of the tension was calculated and set using a
two inch wide fabric. The tension employed with the yarn was 2.5-3.0 cN/tex. This value
was multiplied by yarn tex and 15, as 15 yarn samples were mounted at a time. The set of
15 samples was repeated four times. The arithmetic mean of the number of abrasion
cycles completed before first yarn break occurring in the four tests was calculated.
Figure 4.9: Line Diagram of Sulzer Ruti Webtester
4.3.10.4 Bending Length
Yarn was laid on the FRL Cantilever Bending Length Tester and a slider was
placed on top. The yarn was moved forward like a cantilever with the help of the slider.

75
The slider was moved forward mechanically at a constant speed. The yarn hung like a
cantilever as it moved forward at a constant rate until its hanging end bent under its own
weight and touched a platform which was fixed at a constant angle (41.5o) from the
horizontal. The distance moved by the slider, i.e., hanging length of the yarn, was
recorded. The average bending length of 25 samples was calculated.
4.3.10.5 Bust Rod Resistance
A typical yarn lease/bust rod system operating on a conventional slasher is shown
in Figure 4.10a. The bust rod resistance of slashed yarns was measured on an Instron
Model 5567 Tester. Two warp yarns adhered to each other by bridging size film were
used for this experiment. Separated ends of the two warp yarns were held by the moving
jaw of the Instron, whereas a metal paper clip used as the bust rod was held by the fixed
jaw (Figure 4.10b). The other ends of the warp yarns adhering to each other were free.
Resistance provided by the paper clip bust rod was measured by the load cell.
(a)
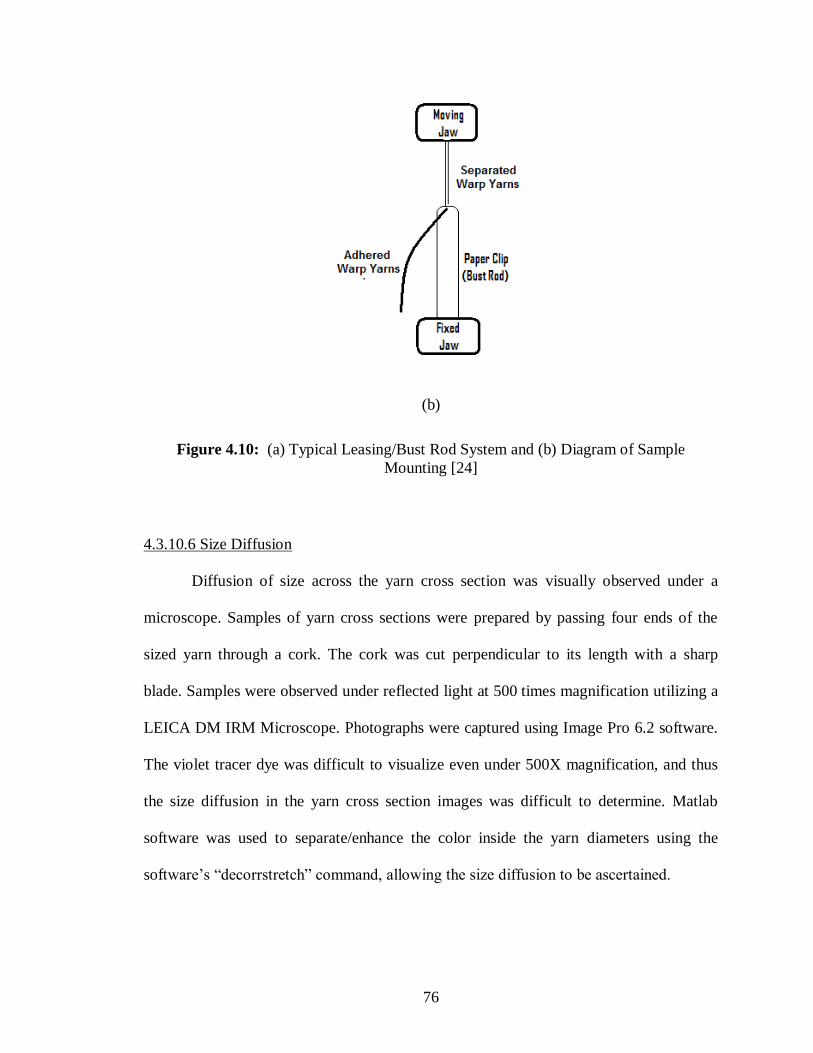
76
(b)
Figure 4.10: (a) Typical Leasing/Bust Rod System and (b) Diagram of Sample
Mounting [24]
4.3.10.6 Size Diffusion
Diffusion of size across the yarn cross section was visually observed under a
microscope. Samples of yarn cross sections were prepared by passing four ends of the
sized yarn through a cork. The cork was cut perpendicular to its length with a sharp
blade. Samples were observed under reflected light at 500 times magnification utilizing a
LEICA DM IRM Microscope. Photographs were captured using Image Pro 6.2 software.
The violet tracer dye was difficult to visualize even under 500X magnification, and thus
the size diffusion in the yarn cross section images was difficult to determine. Matlab
software was used to separate/enhance the color inside the yarn diameters using the
software’s “decorrstretch” command, allowing the size diffusion to be ascertained.

77
4.3.11 Thermogravimetric Analysis
The combined cotton chemical impurities/T-66 PVA mass in the desize effluent
stream was measured using TGA. Samples were prepared by first evaporating the bulk
water from the desize effluent stream (convection oven, ~1200C, 4-5 hours) until dryness
was achieved. Ash contents in the pure T-66 PVA size, in the cotton chemical impurities
extracted from the greige yarns and in the isolated desize combined solids were
determined at 650oC using TGA. Samples were first heated to 120
oC at 10
oC per minute
and then kept isothermal at 120oC for 60 minutes to achieve dryness. The temperature
was then raised to 650oC at 10
oC per minute heating rate. Knowing the ash content of
pure T-66 PVA and of the cotton chemical impurities extracted from the greige yarns,
and determining the combined ash content of the desize effluent stream at 650oC, the
percentage by weight of impurities contained in the desize effluent stream was calculated
(Appendix 1):
I % = Ash % in the Sample −Ash % in the Elvanol T66
(Ash % in the Cotton Impurities −Ash % in the Elvanol T66)∗ 100 Eqn. (4.10)
I% = Impurity % of Desize Effluent
4.3.12 Intrinsic Viscosity of Size Formulations
Viscosity aids in estimating the average molecular weight of a polymer: the
higher the molecular weight, the more viscous the polymer solution. Formulations from
virgin T-66 PVA and recycled size were prepared at 0.4, 0.8, 1.2 and 1.6 g/dL
concentrations, respectively. Recycled size formulations were prepared from the third
slashing cycle of pile yarn. Solution viscosity was measured by the flow time taken by

78
the constant volume of water (solvent) and solution, as it was directly proportional to the
flow time. Relative viscosity, r, was the ratio of the viscosity of the polymer solution to
the viscosity of the solvent at a given concentration [68]:
0t
tr
Eqn. (4.11)
t = Flow time of solution
t0 = Flow time of solvent
Specific viscosity, sp, was the difference in the flow time of the polymer solution and the
pure solvent, relative to the flow time of the pure solvent:
10
0
rspt
tt
Eqn. (4.12)
Reduced viscosity red, was the ratio of specific viscosity to the concentration of the
solution:
c
sp
red
Eqn…..(4.13)
c = Concentration of the solution
The plot between reduced viscosity on the ordinate and concentration on the abscissa
gave a straight line with positive slope, i.e., followed the equation of a straight line in
slope intercept form:

79
Y = b + mc Eqn. (4.14)
m: Slope of the line
b: Intercept on y axis
c: Concentration
The empirical equation relating molecular weight to the viscosity was by Huggins [68]:
red = [] + kH[]2c Eqn. (4.15)
[] = Intrinsic viscosity
kH = Huggins constant
From equation 4.14 and 4.15, kH[]2 was m, the slope of the line, and [] was b, the y-
intercept. Inherent viscosity, inh , was the ratio of the natural logarithm of the relative
viscosity to the concentration of the polymer solution:
c
rinh
)ln(
Eqn. (4.16)
A plot between inherent viscosity on the ordinate and polymer concentration on the
abscissa was a straight line with negative slope. The empirical equation relating
molecular weight to the viscosity was by Kraemer [68]:

80
inh = [] + kA[]2c Eqn. (4.17)
kA = Kraemer constant
From equation 4.14 and 4.17, kA[]2 was the slope of the line where as [] was
the intercept of the line. From a plot of both methods together, the two lines meeting at
their common intercept provided the intrinsic viscosity. Finally, the polymer molecular
weight was calculated using [] and the Mark-Houwink Equation:
[] = KM Eqn. (4.18)
K, = Constants
M = Viscosity-average molecular weight
4.3.13 Desized Yarn Color
Samples were made by wrapping desized yarns under slight tension and touching
each other on a piece of cardboard to produce a fabric-like flat surface. The Hunter
MiniScan (MS/S-4000L) Reflectometer was first standardized using a white tile. The
reflectometer was then placed on the sample and CIE L, a, b and E values were
recorded [69]. A positive value of L indicates that the sample (desized yarn) is lighter
than the standard, whereas a negative value indicates it is darker than the standard. A
positive value of a indicates that the sample is redder than the standard, whereas a
negative value dictates that the sample is greener than the standard. Similarly, a positive
value of b shows that the sample is yellower than the standard, and a negative value
indicates that the sample is bluer than the standard. The total color variation of the sample
81
from the standard is given by the overall color difference, E, which is calculated in the
CIE formula from the three input parameters, L, a and b.

82
CHAPTER 5
RESULTS AND DISCUSSION
5.1 VFE Evaporation Process
In the case of UF concentration of a desize effluent stream, a semi-permeable
membrane excludes the high molecular weight PVA, whereas low molecular weight
PVA, water and some cotton chemical impurities permeate through it. The loss of the
low molecular weight PVA “tail” of the distribution changes the properties of the
recovered PVA film. In the case of VFE, water is evaporated under vacuum at low
temperatures, and thus all extracted cotton impurities, water and PVA remain in the
concentrate. The PVA film properties are modified because of the addition of cotton
impurities. In VFE, the desize stream water is evaporated and then condensed to generate
pure, hot water, which enjoys unrestricted reuse as make-up water in the plant’s many
wet processes. The energy required in the VFE process to generate steam is thus an
approximate trade-off with plant boiler energy that would normally go to generate the hot
water required by the plant. Water recovered in the UF process as permeate contains low
molecular weight PVA and cotton impurities, which restricts its use in the plant. In VFE,
no polymeric spiral-wound film membrane exists to foul or degrade, and no high pump
pressures are required to overcome pressure differentials across the membrane, thus
lowering electrical costs. No effluent is discharged from the VFE process. Pure,
condensed hot water is recovered and reused in the plant (up to 70% of the desize effluent
feed stream in the case of towel manufacturing), and ~30% of the water remains with the
83
PVA and cotton impurities in the concentrate. Up to 90% of the total thermal input
energy to the VFE process is recovered [1]. An increase in apparent size mass recovery
occurs with VFE over UF, as the recovered size in the former contains all of the desized
PVA MW distribution as well as the extracted cotton chemical impurities.
5.2 Yarn Impurities
Griege cotton yarns used in both the towel pile and ground constructions were
tested for impurity levels (Section 4.3.2). Impurities extracted from both yarns under the
optimized desizing process conditions (two-step method, Section 4.3.4.1) constituted
~2.3% of the yarn masses.
5.3 Effects of Cotton Chemical Impurities on Recycled T-66 PVA Films
and Slashed Yarns
To study the effect of cotton chemical impurities on the physical properties of
recycled size films and yarns, wax was not used in these experiments. Size formulations
were developed at 0%, 14.3%, 25%, 33.3% and 40% w/w impurities concentrations.
5.3.1 Tensile Properties of Recycled T-66 PVA Films
5.3.1.1 Breaking Strength
Samples were prepared and tested on the Instron Model 5567 Tester using ASTM
Test Method D 882-02. The breaking strength of the simulated, recycled T-66 PVA size
film decreased with an increase in cotton chemical impurities level (Figure 5.1). The
decrease in breaking strength was due to the low molecular weight cotton chemical
impurities which were occluded in the recycled size. Upon increasing the concentration

84
of cotton chemical impurities in the recycled size, the strengths of the blend films
continued to decrease (Figure 5.1).
In conventional slashing, wax is added to the T-66 PVA to decrease the strength
and increase the flexibility of the blended film. With the added cotton chemical
impurities, less or no wax was projected to be added to the recovered size, similar to the
earlier UF studies where wax was not added to the recycled PVA size formulations [12,
32, 48, 49], because the impurities perform the same functions in the blend film as the
wax, e.g., lower the film strength and add toughness, lubricity and flexibility. All of the
impurity-added traits to the recycled size film improve subsequent weave ability.
Figure 5.1: Changes in Strength of Recycled T-66 PVA Films with Impurities
Concentration
5.3.1.2 Elongation at Break
Elongation at break of recycled T-66 PVA size film initially decreased with an
increase in cotton chemical impurities, but at an impurity level of 15% w/w, it began to
R2 = 0.96
0
10
20
30
40
0 10 20 30 40
Fil
m S
tre
ng
th (
MP
a)
Impurities Concentration (%)
Trendline

85
increase (Figure 5.2). The increase in elongation at break was due to slippage of the T-66
PVA molecular chains, which was enhanced because of the presence of the low
molecular weight impurities. Studies showed that films of recovered size isolated by the
rotary evaporator, which simulates the VFE process, exhibited improved elongation at
break performance over virgin PVA films. An increase in elongation at break avoids the
cracking of size film on the slashed yarn surface and keeps it smooth. Smooth surfaces
reduce the friction among yarns and between yarns and weaving machine parts, such as
drop wires and heddles, thereby reducing the number of warp yarn breakages.
Figure 5.2: Changes in Elongation at Break of Recycled T-66 PVA Films with
Impurities Concentration
5.3.1.3 Modulus of Elasticity
In towel weaving, all-PVA size is normally not used in slashing pile yarns. PVA-
slashed yarns are stiff in nature and difficult to form into loops. Recycled T-66 PVA size
R2 = 0.92
0
50
100
150
200
250
300
0 10 20 30 40
Elo
ng
ati
on
at
Bre
ak (
%)
Impurities Concentration (%)
-Trendline
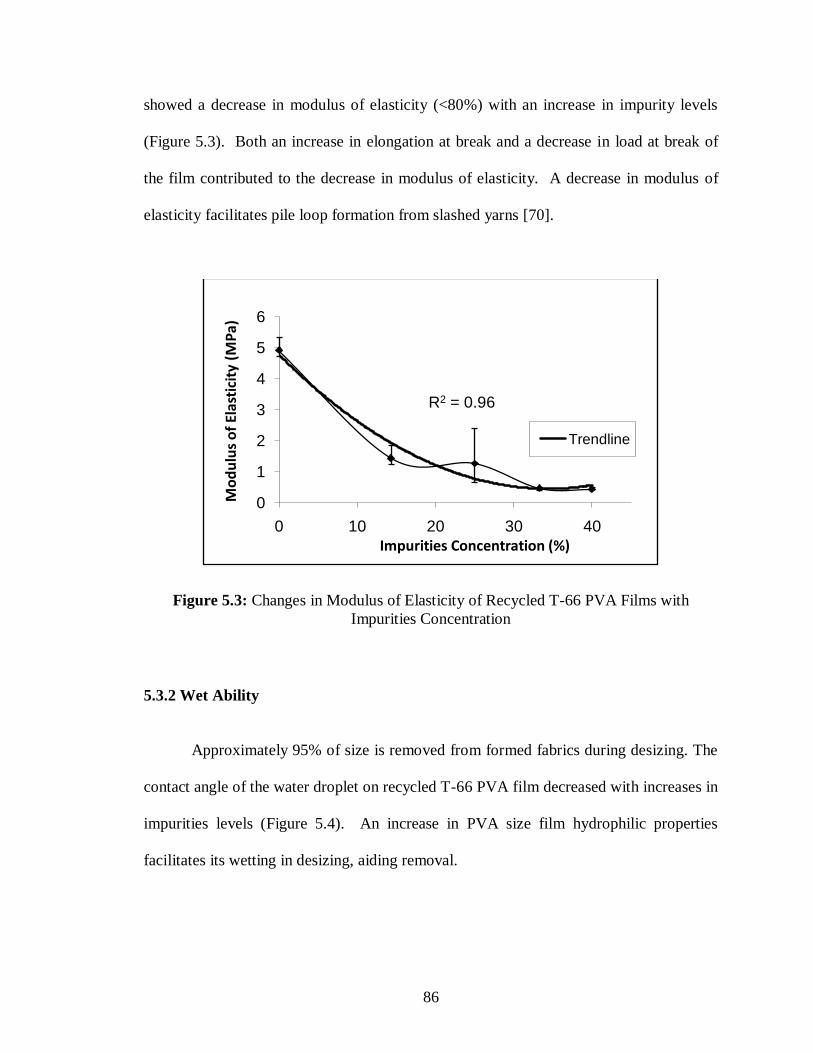
86
showed a decrease in modulus of elasticity (<80%) with an increase in impurity levels
(Figure 5.3). Both an increase in elongation at break and a decrease in load at break of
the film contributed to the decrease in modulus of elasticity. A decrease in modulus of
elasticity facilitates pile loop formation from slashed yarns [70].
Figure 5.3: Changes in Modulus of Elasticity of Recycled T-66 PVA Films with
Impurities Concentration
5.3.2 Wet Ability
Approximately 95% of size is removed from formed fabrics during desizing. The
contact angle of the water droplet on recycled T-66 PVA film decreased with increases in
impurities levels (Figure 5.4). An increase in PVA size film hydrophilic properties
facilitates its wetting in desizing, aiding removal.
R2 = 0.96
0
1
2
3
4
5
6
0 10 20 30 40
Mo
du
lus
of
Elas
tici
ty (
MP
a)
Impurities Concentration (%)
Trendline

87
Figure 5.4: Changes in Contact Angle of Water Droplets on Recycled T-66 PVA Size
Films with Impurities Concentration
5.3.3 Viscosity
Industry controls the slashing process with the viscosity/concentration of the size
solution. Size add-on decreases with increase in viscosity up to a minimum, but very
high viscosities increase the size add-on (Figure 5.5). Figure 5.5 shows size formulation
viscosities in the ~5-30 cP range give similar pick-ups. Low size formulation viscosity is
required for effective slashing [71]. To decrease the viscosity at a given concentration,
the temperature of the size formulation must be increased. The viscosities of recycled T-
66 PVA size formulations decreased with increased cotton chemical impurity
concentrations, allowing slashing at a relatively low size box temperature (70oC, Figure
5.6). Figure 5.6 was plotted at a constant 5% w/w size formulation concentration.
0
10
20
30
40
0 10 20 30 40
Co
nta
ct
An
gle
(d
eg
ree)
Impurities Concentration (%)

88
Figure 5.5: Pick-Up vs. Viscosity of PVA Solution [30]
Figure 5.6: Changes in Viscosities of Recycled T-66 PVA Size Formulations at
Constant Concentration (5% w/w) with Impurities Concentration
5.3.4 Tensile Properties of Slashed Yarns
5.3.4.1 Yarn Tenacity
The tenacity of yarns slashed with recycled T-66 PVA initially decreased, but
after the 15% cotton chemical impurities level was reached, it remained nearly constant
0
4
8
12
16
20
0 10 20 30 40
Vis
co
cit
y (
cP
)
Impurities Concentration (%)

89
with increased impurity levels (Figure 5.7). When wax is added to the size formulation
in all-PVA slashing, the yarn tenacity is also decreased. Figure 5.1 shows that the
recycled T-66 PVA film strength decreased with an increase in impurities concentration,
but the blend recycled size better penetrated the yarn and thus increased the yarn strength.
As a result, little change occurred in the tenacity of the yarn slashed with the recycled T-
66 PVA size formulations with increasing cotton chemical impurities content in the film.
Figure 5.7: Changes in Yarn Tenacity at Break of Recycled T-66 PVA Slashed Yarn vs.
Impurities Concentration in the Size Film
5.3.4.2 Work of Rupture
Work of rupture of the slashed yarns initially decreased with an increase in
impurities, but became nearly constant after the 15% w/w impurities level was reached
(Figure 5.8). Addition of wax also reduced the work of rupture, as it reduced the load at
0
4
8
12
16
20
0 10 20 30 40
Ten
acit
y (g
f/te
x)
Impurities Concentration (%)
Slashed Yarn Grey yarn

90
break of the slashed yarn, but further increases in cotton chemical impurities maintained
the work of rupture level, as impurity-contaminated size penetrated deeper inside the
yarn.
Figure 5.8: Yarn Work of Rupture of Recycled T-66 PVA Slashed Yarn with Impurities
Concentration in the Size Formulation
5.3.5 Bust Rod Resistance
The bust rod resistance of slashed yarn initially increased with an increase in
impurities concentration, but after 15% size add-on, it decreased (Figure 5.9). The low
molecular weight cotton chemical impurities in the recycled T-66 PVA size thus
decreased the strength of the bridging film between the slashed yarns.
0
50
100
150
200
250
0 10 20 30 40
Wo
rk o
f R
up
ture
(gf-
cm)
Impurities Concentration (%)
Slashed Yarn Greige Yarn

91
Figure 5.9: Bust Rod Resistance and Size Add-On of Recycled T-66 PVA Slashed Yarn
with Impurities Concentrations in the Size Formulation
5.3.6 Summary of the Effects of Occluded Cotton Chemical Impurities on Recycled
T-66 PVA Films and Slashed Yarns
In VFE, recycled size entrains extracted yarn impurities (~2.3% of yarn weight
per desizing cycle). The apparent molecular weight average of the recycled size
decreased, as the cotton chemical impurities were lower in molecular weight than the
polymeric T-66 PVA. The breaking strength of the recycled size films decreased with
increasing impurities concentration, and the addition of wax to T-66 PVA size
formulations also decreased the film strength. With the occluded cotton impurities
present, little or no wax was added to the recovered size in subsequent development of
the technology. Elongation at break of the recycled size film increased with impurit ies
concentration, while the modulus of elasticity decreased. The viscosity of the recycled
size film decreased with impurities concentration. The contact angle of a water droplet on
the recycled size film decreased with increasing impurities concentration, indicating
0
4
8
12
16
20
0
0.1
0.2
0.3
0.4
0.5
0 5 10 15 20 25 30 35 40
Ad
d-o
n (%
)
Bu
st
Ro
d R
esis
tan
ce (
N)
Impurities Concentration (%)
Bust Rod Resistance Add-on

92
increased wet ability and ease of removal in desizing. Bust rod resistance initially
increased, but at higher impurities concentrations in subsequent cycles, it decreased.
Slashed yarn tenacity and work of rupture slightly decreased on initial size recycle
sequences, but remained constant on further increases of impurities concentrations in
subsequent cycles.
5.4 Effects of Wax, Cotton Chemical Impurities and their Combinations
on Recycled T-66 PVA Films and Slashed Yarns
Experiments were designed at four levels of wax and four levels of impurities as
shown in Table 3.2. Ground yarns were slashed with simulated formulations devised by
mixing known quantities of wax, T-66 PVA and cotton chemical impurities (~15% solids
pickup). Sixteen samples of ground yarn were produced using the two-end bench slasher
(Section 4.2), and films were made from recycled size at all 16 combinations of wax and
cotton chemical impurity percentages (Table 3.2). Films were tested for tensile strength
and elongation at break, whereas slashed yarns were tested for tenacity, work of rupture,
bust rod resistance, size add-on, hairiness and abrasion resistance.
5.4.1 Tensile Properties of Recycled T-66 PVA Films
5.4.1.1 Breaking Strength
Sixteen samples of simulated, recycled T-66 PVA films were tested on the Instron
Model 5567 Tester using ASTM Test Method D 882-02. The breaking strength of the
recycled T-66 PVA size film showed a decreasing trend with increases in wax
percentages at different impurities levels, but after 8% of PVA mass wax level, further

93
increases in wax in the size formulations had little impact on the film breaking strengths
(Figure 5.10). A similar trend was found when impurities percentage was increased at
different wax percentage levels (Figure 5.11). After the 25% of total solids impurities
concentration level was reached, further increases in impurities had little impact on the
breaking strength of recycled T-66 PVA films. In essence, impurities acted like wax in
modifying the film properties. In conventional slashing, approximately 8% of wax is
added to the virgin PVA. With occluded cotton impurities present in the recycled T-66
PVA films, wax additions to the recycled size formulations was concluded to be
unnecessary.
Figure 5.10: Changes in Strength of Recycled T-66 PVA Films vs. Wax Percentage at
Different Impurities Concentration in the Size Formulation
0
5
10
15
20
25
30
35
0 2 4 6 8 10 12
Fil
m S
tren
gth
(M
Pa)
Wax (%)
0% Impurity
10% Impurity
25% Impurity
40% Impurty
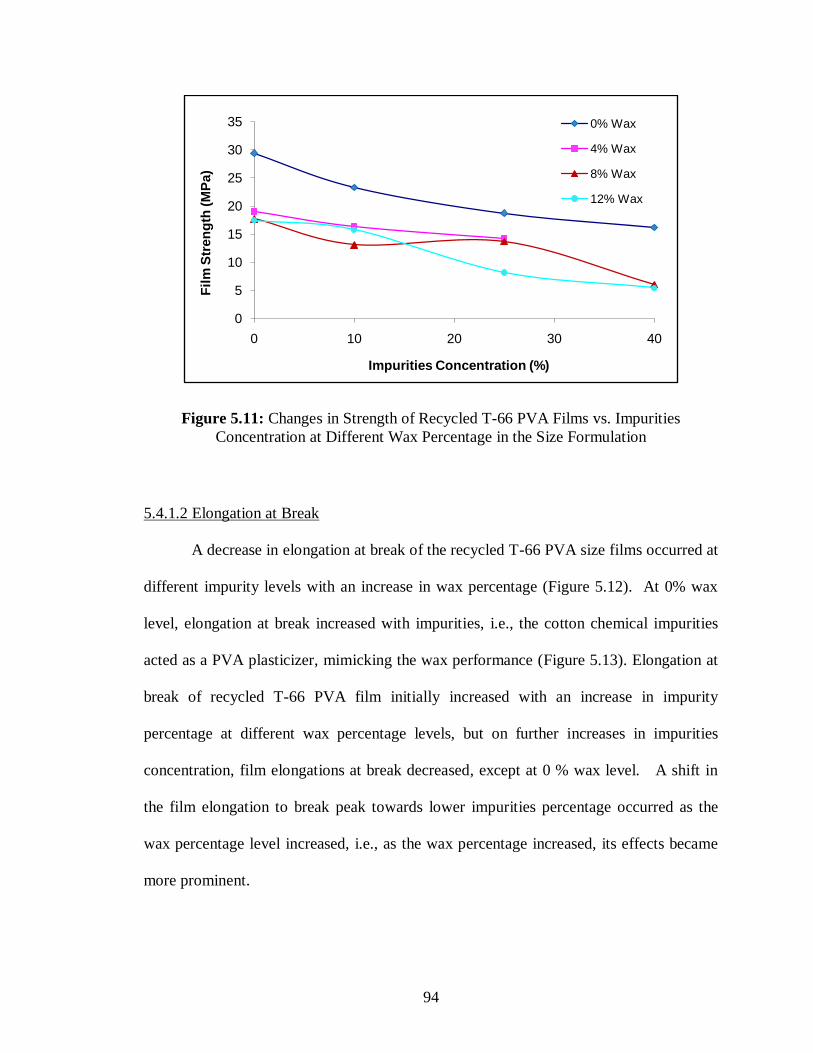
94
Figure 5.11: Changes in Strength of Recycled T-66 PVA Films vs. Impurities
Concentration at Different Wax Percentage in the Size Formulation
5.4.1.2 Elongation at Break
A decrease in elongation at break of the recycled T-66 PVA size films occurred at
different impurity levels with an increase in wax percentage (Figure 5.12). At 0% wax
level, elongation at break increased with impurities, i.e., the cotton chemical impurities
acted as a PVA plasticizer, mimicking the wax performance (Figure 5.13). Elongation at
break of recycled T-66 PVA film initially increased with an increase in impurity
percentage at different wax percentage levels, but on further increases in impurities
concentration, film elongations at break decreased, except at 0 % wax level. A shift in
the film elongation to break peak towards lower impurities percentage occurred as the
wax percentage level increased, i.e., as the wax percentage increased, its effects became
more prominent.
0
5
10
15
20
25
30
35
0 10 20 30 40
Fil
m S
tren
gth
(M
Pa)
Impurities Concentration (%)
0% Wax
4% Wax
8% Wax
12% Wax

95
Figure 5.12: Changes in Elongation at Break of Recycled T-66 PVA Films vs. Wax
Percentages at Different Impurities Concentration in Size Formulations
Figure 5.13: Changes in Elongation at Break of Recycled T-66 PVA Films vs.
Impurities Concentration at Different Wax Percentage in the Size Formulations
0
50
100
150
200
250
300
0 3 6 9 12
Elo
ng
ati
on
at
Bre
ak
(%
)
Wax (%)
0% Impurity
10% Impurity
25% Impurity
40% Impurity
0
50
100
150
200
250
300
0 10 20 30 40
Elo
ng
ati
on
at
Bre
ak
(%
)
Impurities Concentration (%)
0% Wax 4% Wax
8% Wax 12% Wax
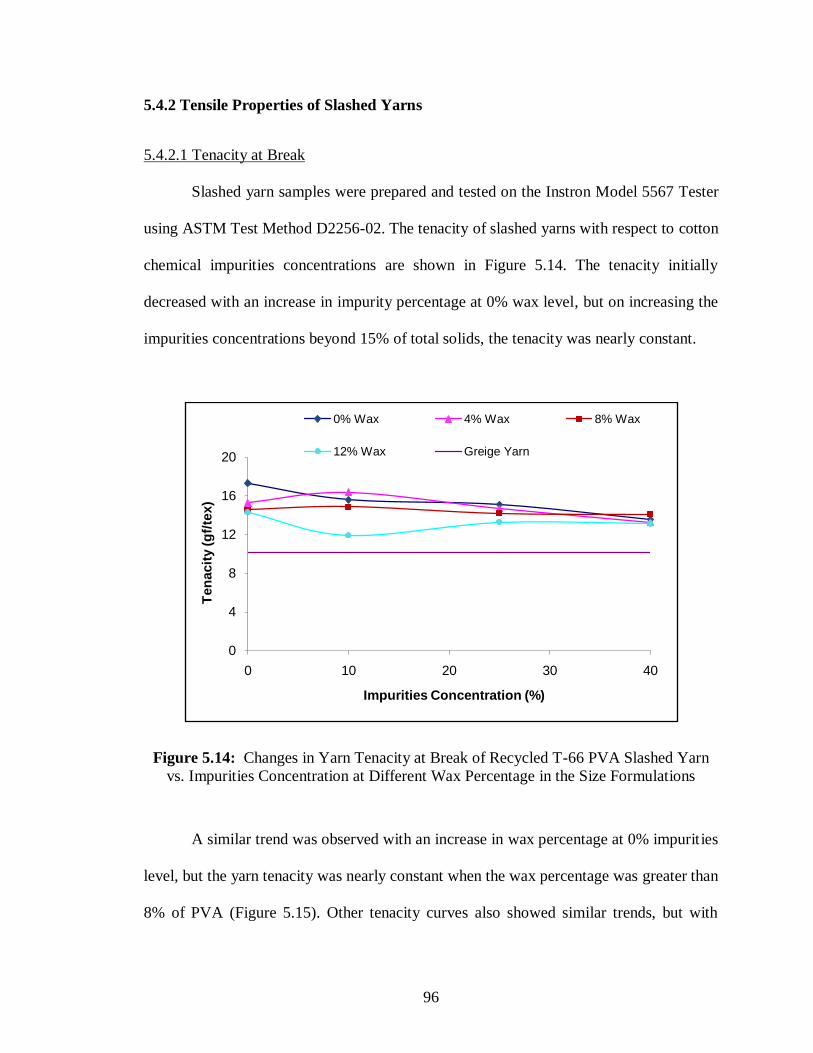
96
5.4.2 Tensile Properties of Slashed Yarns
5.4.2.1 Tenacity at Break
Slashed yarn samples were prepared and tested on the Instron Model 5567 Tester
using ASTM Test Method D2256-02. The tenacity of slashed yarns with respect to cotton
chemical impurities concentrations are shown in Figure 5.14. The tenacity initially
decreased with an increase in impurity percentage at 0% wax level, but on increasing the
impurities concentrations beyond 15% of total solids, the tenacity was nearly constant.
Figure 5.14: Changes in Yarn Tenacity at Break of Recycled T-66 PVA Slashed Yarn
vs. Impurities Concentration at Different Wax Percentage in the Size Formulations
A similar trend was observed with an increase in wax percentage at 0% impurities
level, but the yarn tenacity was nearly constant when the wax percentage was greater than
8% of PVA (Figure 5.15). Other tenacity curves also showed similar trends, but with
0
4
8
12
16
20
0 10 20 30 40
Ten
acit
y (g
f/te
x)
Impurities Concentration (%)
0% Wax 4% Wax 8% Wax
12% Wax Greige Yarn

97
some variability, as the greige ground yarn itself exhibited some variability in tenacity.
With an increase in either wax or impurities in the size formulation, the T-66 PVA
percentage decreased in the resulting film, which caused a corresponding decrease in
overall yarn tenacity. Cotton chemical impurities are of relatively low molecular weight,
and their occlusion in a recycled PVA size formulation decreases the viscosity and thus
enhances size penetration into the yarn diameter. Slashed yarn, together with the added
impurities/PVA, becomes a composite structure, which aids in maintaining the tenacity.
After slashing, yarn loads at break should increase by 20% compared to greige yarn, i.e.,
tenacity should increase by 20% [27, 64]. Although yarn slashed with recycled T-66 PVA
size formulations containing the cotton chemical impurities showed a decrease in
tenacity, the latter still remained 20% greater than that of the corresponding greige yarn.
Similar trends were observed with wax addition to the PVA film. The observations
confirmed the earlier conclusion that impurities perform like wax in the PVA film, and
can thus effectively substitute for wax in the recycled size formulations.
Figure 5.15: Changes in Yarn Tenacity at Break of Recycled T-66 PVA Slashed Yarn
vs. Wax Percentage at Different Impurities Concentration in the Size Formulations
0
4
8
12
16
20
0 2 4 6 8 10 12
Ten
acit
y (g
f/te
x)
wax (%)
0% Impurity 10% Impurity 25% Impurity
40% Impurity Greige Yarn

98
5.4.2.2 Work of Rupture
As the slashed warp yarns undergo repeated cycles of stress and strain in weaving,
the energy/work required to break the yarn is critical, i.e., work of rupture. Slashed yarn
load at break should increase 20% compared to the greige yarn, but at the cost of
reducing its elongation at break. Elongation at break should not be reduced below 20% of
the greige yarn after slashing [27, 64]. Work of rupture was calculated as the area under
the load vs. elongation curve. By extension, the work of rupture of the slashed yarn
should approximate that of the corresponding greige yarn. Figure 5.16 shows that the
slashed yarn work of rupture at 0% wax level initially decreased, but remained nearly
constant after 25% impurities concentration level was reached.
Figure 5.16: Changes in Recycled T-66 PVA Slashed Yarn Work of Rupture vs.
Impurities Concentration at Different Wax Percentage in the Size Formulation
0
40
80
120
160
0 10 20 30 40
Wo
rk o
f R
up
ture
(g
f.cm
)
Impurities Concentration %
0% Wax 4% Wax
8% Wax 12% Wax
Greige Yarn
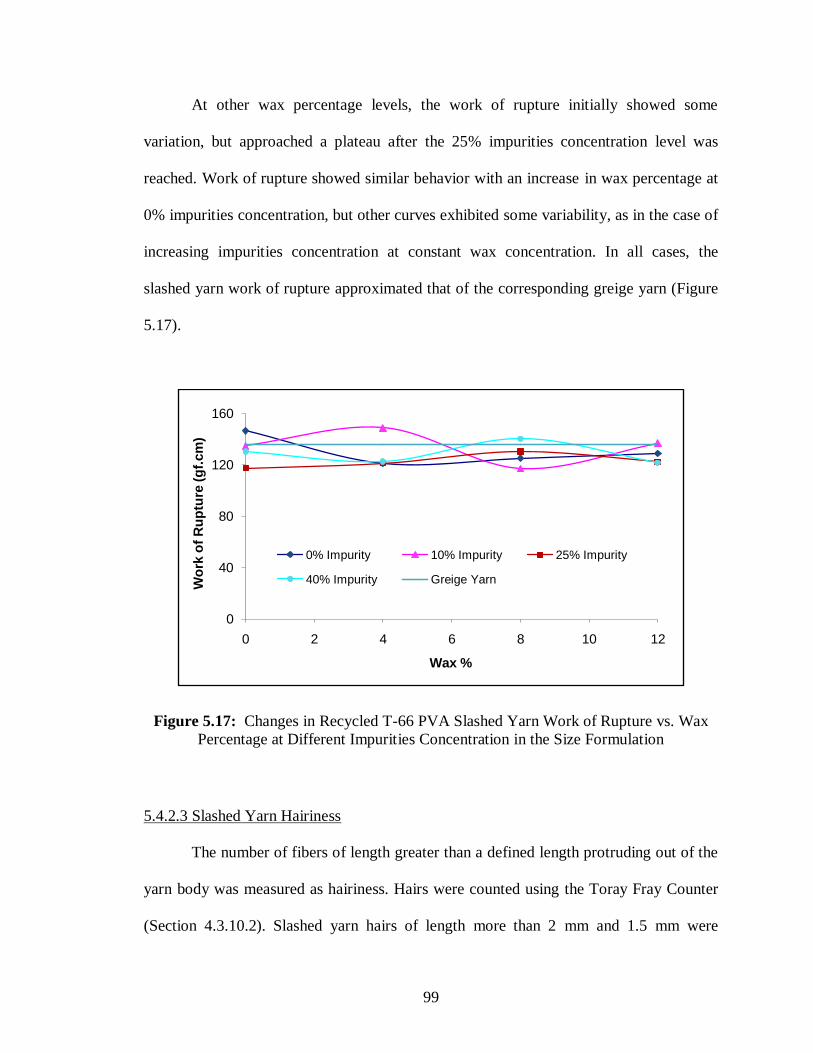
99
At other wax percentage levels, the work of rupture initially showed some
variation, but approached a plateau after the 25% impurities concentration level was
reached. Work of rupture showed similar behavior with an increase in wax percentage at
0% impurities concentration, but other curves exhibited some variability, as in the case of
increasing impurities concentration at constant wax concentration. In all cases, the
slashed yarn work of rupture approximated that of the corresponding greige yarn (Figure
5.17).
Figure 5.17: Changes in Recycled T-66 PVA Slashed Yarn Work of Rupture vs. Wax
Percentage at Different Impurities Concentration in the Size Formulation
5.4.2.3 Slashed Yarn Hairiness
The number of fibers of length greater than a defined length protruding out of the
yarn body was measured as hairiness. Hairs were counted using the Toray Fray Counter
(Section 4.3.10.2). Slashed yarn hairs of length more than 2 mm and 1.5 mm were
0
40
80
120
160
0 2 4 6 8 10 12
Wo
rk o
f R
up
ture
(g
f.cm
)
Wax %
0% Impurity 10% Impurity 25% Impurity
40% Impurity Greige Yarn

100
counted as recommended by the instrument manufacturer. The number of 2 mm and 1.5
mm hairs decreased considerably compared to the greige yarn after slashing with all
combination of wax and impurity percentages (Figures 5.18-5.21). The same ground yarn
slashed by Springs Industries, using the conventional slashing formulation ((PVA T-
25+Elastech 2002)/Starch/Wax: (41+15)/35/9), was also compared with the recycled T-
66 PVA slashed yarn.
Figures 5.18-5.21 confirmed a considerable decrease in hairiness of all slashed
yarns compared to the greige ground yarn. The decrease in hairiness was due to size film
formed on the surface of the warp yarns during slashing, i.e., in essence, the surface hairs
were “glued” to the yarn body. All the combinations of wax and impurity percentages
resulted in reduced slashed yarn hairiness below or near that of the Spring Industries
slashed yarn, indicating that the performance of the recycled T-66 PVA size film at the
bust rods of slashing was comparable to that of the Springs Industries size formulation
film.

101
Figure 5.18: Changes in Recycled T-66 PVA Slashed Yarn Hairiness (2 mm) vs. Wax
Percentage at Different Impurities Concentration in the Size Formulation
0.0
5.0
10.0
15.0
20.0
25.0
30.0
0 3 6 9 12
Hair
s / M
ete
r
Wax (%)
0% Impurity 10% Impurity
25% Impurity 40% Impurity
Greige Yarn Springs Ind. Slashed Yarn

102
Figure 5.19: Changes in Recycled T-66 PVA Slashed Yarn Hairiness (2 mm) vs.
Impurities Concentration at Different Wax Percentage in the Size Formulation
Figure 5.20: Changes in Recycled T-66 PVA Slashed Yarn Hairiness (1.5 mm) vs. Wax
Percentage at Different Impurities Concentration in the Size Formulation
0.0
5.0
10.0
15.0
20.0
25.0
30.0
0 10 20 30 40
Hair
s / M
ete
r
Impurities Concentration (%)
0% Wax 4% Wax 8% Wax
12% Wax Greige Yarn Springs Ind. Slashed Yarn
0.0
15.0
30.0
45.0
60.0
0 2 4 6 8 10 12
Hair
s / M
ete
r
Wax (%)
0% Impurity 10% Impurity
25% Impurity 40% Impurity
Springs Ind. Slashed Yarn Greige Ground Yarn

103
Figure 5.21: Changes in Recycled T-66 PVA Slashed Yarn Hairiness (1.5 mm) vs.
Impurities Concentration at Different Wax Levels in the Size Formulation
Figures 5.22 and 5.23 show that at 0% wax with increase in impurities
concentration and 0% impurity with increase in wax percentage level with increase in
impurity and wax percentage, respectively, slashed yarn hairiness first decreased and then
increased. Initially, the simulated recycled size formulations contained an elevated
percentage of T-66 PVA and formed a thick, high-strength film located mainly on the
yarn surface. Impurities were of lower molecular weight than T-66 PVA, and as their
percentage increased and the size formulation viscosity correspondingly decreased, more
size penetration into the yarn occurred, resulting in an albeit weaker, but substantially
thinner, cured film on the surface. The overall result was increased yarn hairiness at the
higher wax or impurities concentration levels in the film.
0.0
15.0
30.0
45.0
60.0
0 10 20 30 40
Hair
s / M
ete
r
Impurities Concentration (%)
0% Wax 4% Wax
8% Wax 12% Wax
Springs Ind. Slashed Yarn Greige Ground Yarn

104
Figure 5.22: Changes in Recycled T-66 PVA Slashed Yarn Hairiness with Wax
Percentage at Zero Percent Impurity Concentration in the Size Formulation
Figure 5.23: Changes in Recycled T-66 PVA Slashed Yarn Hairiness vs. Impurity
Concentration at Zero Percent Wax in the Size Formulation
0.0
5.0
10.0
15.0
0 3 6 9 12
Hair
s / M
ete
r
Wax (%)
1.5 mm Hair Length and 0% Impurity
2 mm Hair Length and 0% Impurity
1.5 mm Hair Springs Ind. Slashed Yarn
2 mm Hair Springs Ind. Slashed Yarn
0.0
5.0
10.0
15.0
0 10 20 30 40
Hair
s / M
ete
r
Impurities Concentration (%)
1.5 mm Hair Length and 0% Wax
2 mm Hair Length and 0% Wax
1.5 mm Hair Length Springs Ind. Slashed yarn
2 mm Hair Length Springs Ind. Slashed Yarn

105
5.4.2.4 Bust Rod Resistance
After drying the slashed yarns on steam cans and thus forming/curing the size
film, the warp is in a sheet form, i.e.,yarns are attached to neighboring yarns by bridged
films. The bust rod separates the yarns by breaking the bridged films, and in this process,
yarns sometimes break and short fibers (hairs) are always pulled out of the separated
staple yarns. Excessive hairiness creates problems in air jet weaving, as the warp yarns
are close to each other in space, and protruding hairs can disrupt the air flows emitting
from booster jets positioned across the lay of the loom. At 0% impurity level in the T-66
PVA/varying percentages of wax size formulations, bust rod resistance increased, but on
increasing the wax percentage above 8% on mass of PVA, bust rod resistance decreased
(Figure 5.24). A decrease in resistance was directly due to the wax concentration increase
in the film, as it reduced film strength. A similar effect was observed at 0% wax level
with an increase in impurities concentration up to 15% (Figure 5.25). When the
impurities concentration surpassed 15%, the bust rod resistance decreased. Other
combinations of impurities and wax in the recycled size resulted in decreased slashed
yarn bust rod resistance because of a corresponding decrease in film tear strength
(Appendix 1).

106
Figure 5.24: Bust Rod Resistance of Recycled T-66 PVA Slashed Yarn vs. Wax
Percentage at Different Impurities Concentration in the Size Formulation
Figure 5.25: Bust Rod Resistance of Recycled T-66 PVA Slashed Yarn vs. Impurities
Concentration at Different Wax Percentage in the Size Formulation
5.4.2.5 Abrasion Cycles to First Yarn Breaks
In weaving, warp yarns undergo repeated cycles of abrasion with various machine
parts. The Ruti Webtester provides a simulation of the weaving process and tests this
0.00
0.20
0.40
0.60
0.80
0 2 4 6 8 10 12
Bu
st
Ro
d R
esis
tan
ce (
N)
Wax (%)
0% Impurity 10% Impurity
25% Impurity 40% Impurity
0.00
0.20
0.40
0.60
0.80
0 10 20 30 40
Bu
st
Ro
d R
esis
tan
ce (
N)
Impurities Concentration (%)
0% Wax 4% Wax 8% Wax 12% Wax

107
critical property, i.e., the number of abrasion cycles of 15 slashed yarns to achieve a first
break (Section 4.3.10.3). Slashed yarn samples were tested as recommended by the
Webtester manufacturer. Fifteen samples were mounted at a time and experiments were
repeated four times. Figures 5.26 and 5.27 show the average abrasion cycles to first yarn
breaks in four experiments. The numbers of abrasion cycles to first yarn breaks initially
showed increasing trends with an increases in impurities and wax concentrations in the
simulated recycled PVA formulations. With slashed yarn, both wax and cotton impurities
reduce friction by increasing surface lubricity, and thus increase the number of abrasion
cycles required to achieve first yarn breaks. On further increases in impurities and wax
concentrations, however, the numbers of abrasion cycles to first yarn breaks decreased
due to the corresponding decreased T-66 PVA percentages in the recycled size
formulations. A decrease in polymeric T-66 PVA reduced the film thickness on the yarn
surface, whereas increasing low molecular weight impurities/wax concentrations
facilitate penetration of the size formulations inside of the yarn diameters and away from
the abrading surface. Higher wax and impurities concentrations thus decreased the
number of abrasion cycles to first yarn failures, but the values were always greater than
or equal to those achieved with the Springs Industries slashed yarn on the Ruti
Webtester® , and much greater than those of the corresponding greige yarn.

108
Figure 5.26: Number of Abrasion Cycles to First Yarn Breaks of Recycled T-66 PVA
Slashed Yarn vs. Impurities Concentration at Different Wax Percentage in the Size
Formulation
Figure 5.27: Number of Abrasion Cycles to First Yarn Breaks of Recycled T-66 PVA
Slashed Yarn vs. Wax Percentage at Different Impurities Concentration in the Size
Formulation
0
400
800
1200
1600
2000
0 10 20 30 40
Ab
rasio
n C
ycle
s t
o F
irst
Yarn
B
reaks (
Nu
mb
er)
Impurities Concentration (%)
0% wax 4% Wax
12% Wax 8% Wax
Greige Ground Yarn Springs Ind. Slashed yarn
0
400
800
1200
1600
2000
0 2 4 6 8 10 12Ab
rasio
n C
ycle
s t
o F
irst
Yarn
B
reaks (
Nu
mb
er)
Wax (%)
0% Impurity 25% Impurity
40% Impurity 10% Impurity
Greige Ground Yarn Springs Ind. Slashed Yarn

109
5.4.2.6 Summary of Effects of Wax, Cotton Chemical Impurities and their Combinations
on Recycled T-66 PVA Films and Slashed Yarns
Cotton chemical impurities acted like wax in the simulated, recycled T-66 PVA
size films and resultant recycled size slashed yarns, with mechanical properties of the
latter similar or improved compared to those of Springs Industries’ conventional slashed
yarn. Recycled T-66 PVA slashed yarn experiments were conducted with up to 40%
impurities concentration and compared to Spring Industries slashed yarn. To determine
the break-even point of the impurities concentration in the size film to maintain required
slashed yarn properties, experiments were next extended up to 100% impurities at 0%
wax level in the simulated, recycled size formulations.
5.5 Effects of up to 100% Cotton Chemical Impurities on the Properties
of Recycled Size Slashed Yarns
Slashing experiments were conducted on ground yarn constructions at 55%, 75%
and 100% impurities concentrations in the size formulations. The simulated recycled size
formulations were prepared as detailed earlier (Section 4.3.1.1).
5.5.1 Yarn Tenacity
The tenacity of the recycled size slashed yarn initially decreased, but for
impurities concentrations greater than 40%, it was nearly constant (Figure 5.28). The
observed recycled size slashed yarn tenacity was higher than that of slashed yarn
provided by Springs Industries at any percentage of impurities in the formulation. The
yarn tenacity results revealed that the 100% level of impurities size formulation, i.e., the
one containing no T-66 PVA, yielded slashed yarn with a tenacity >20% higher than that
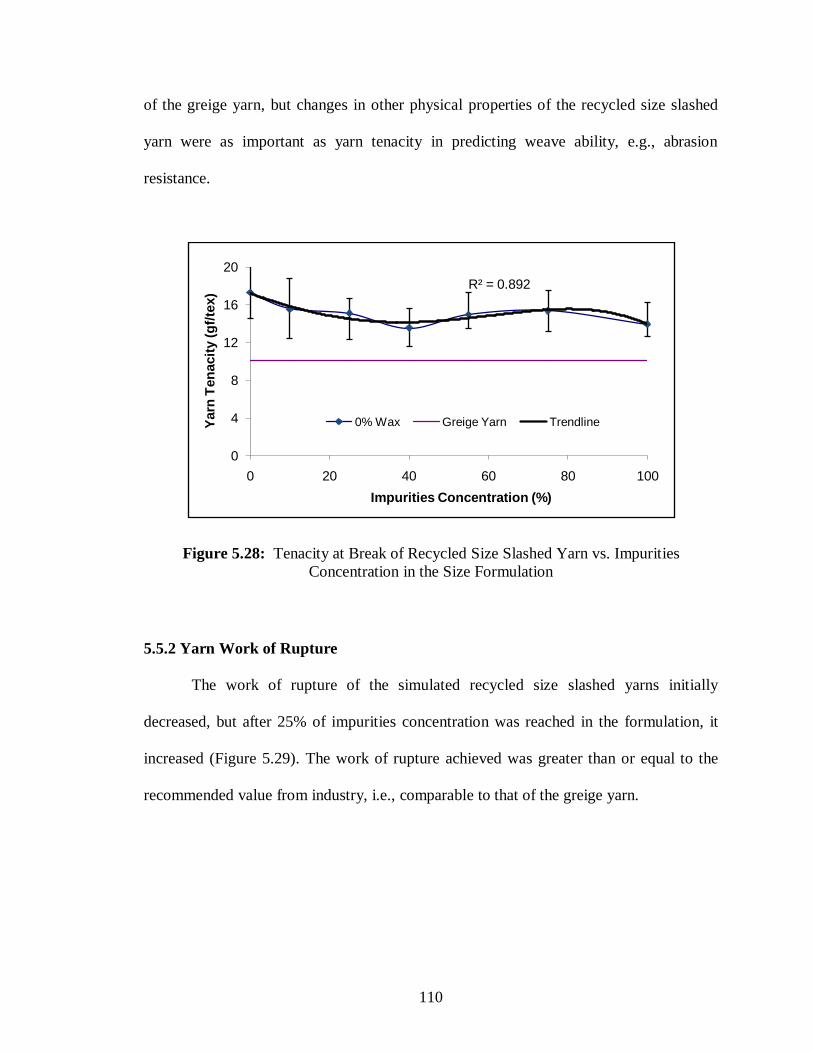
110
of the greige yarn, but changes in other physical properties of the recycled size slashed
yarn were as important as yarn tenacity in predicting weave ability, e.g., abrasion
resistance.
Figure 5.28: Tenacity at Break of Recycled Size Slashed Yarn vs. Impurities
Concentration in the Size Formulation
5.5.2 Yarn Work of Rupture
The work of rupture of the simulated recycled size slashed yarns initially
decreased, but after 25% of impurities concentration was reached in the formulation, it
increased (Figure 5.29). The work of rupture achieved was greater than or equal to the
recommended value from industry, i.e., comparable to that of the greige yarn.
R² = 0.892
0
4
8
12
16
20
0 20 40 60 80 100
Yarn
Ten
acit
y (
gf/
tex)
Impurities Concentration (%)
0% Wax Greige Yarn Trendline
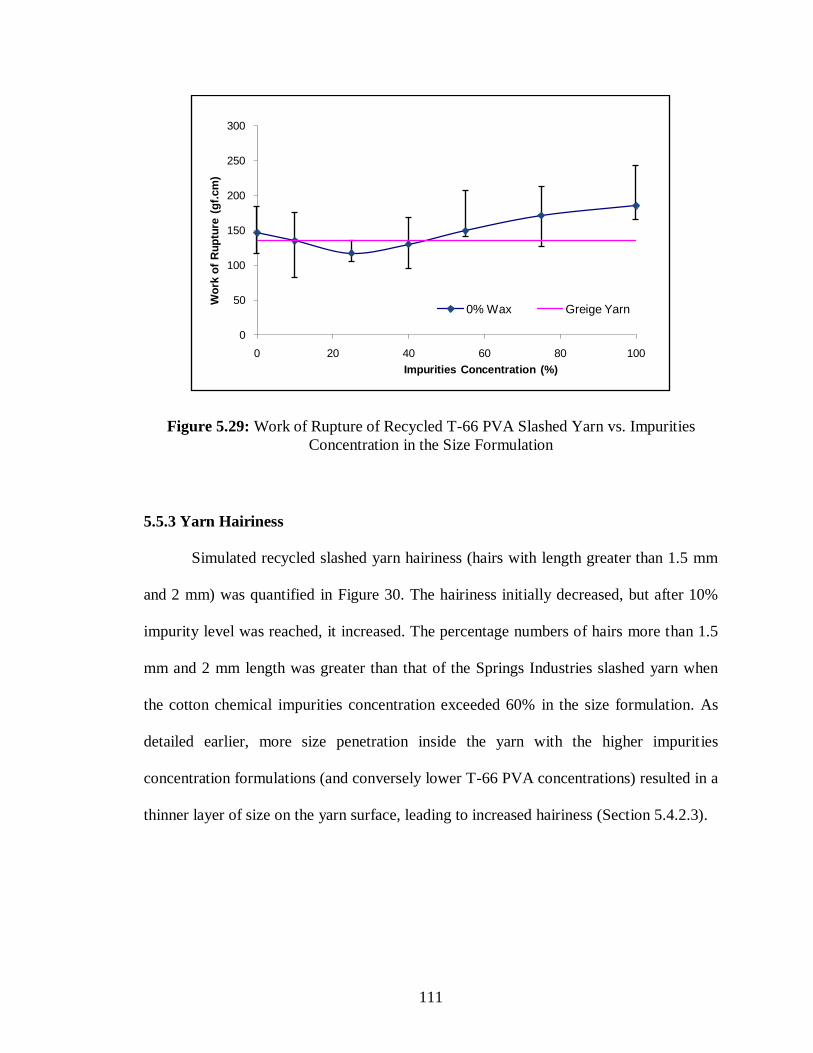
111
Figure 5.29: Work of Rupture of Recycled T-66 PVA Slashed Yarn vs. Impurities
Concentration in the Size Formulation
5.5.3 Yarn Hairiness
Simulated recycled slashed yarn hairiness (hairs with length greater than 1.5 mm
and 2 mm) was quantified in Figure 30. The hairiness initially decreased, but after 10%
impurity level was reached, it increased. The percentage numbers of hairs more than 1.5
mm and 2 mm length was greater than that of the Springs Industries slashed yarn when
the cotton chemical impurities concentration exceeded 60% in the size formulation. As
detailed earlier, more size penetration inside the yarn with the higher impurities
concentration formulations (and conversely lower T-66 PVA concentrations) resulted in a
thinner layer of size on the yarn surface, leading to increased hairiness (Section 5.4.2.3).
0
50
100
150
200
250
300
0 20 40 60 80 100
Wo
rk o
f R
up
ture
(g
f.cm
)
Impurities Concentration (%)
0% Wax Greige Yarn
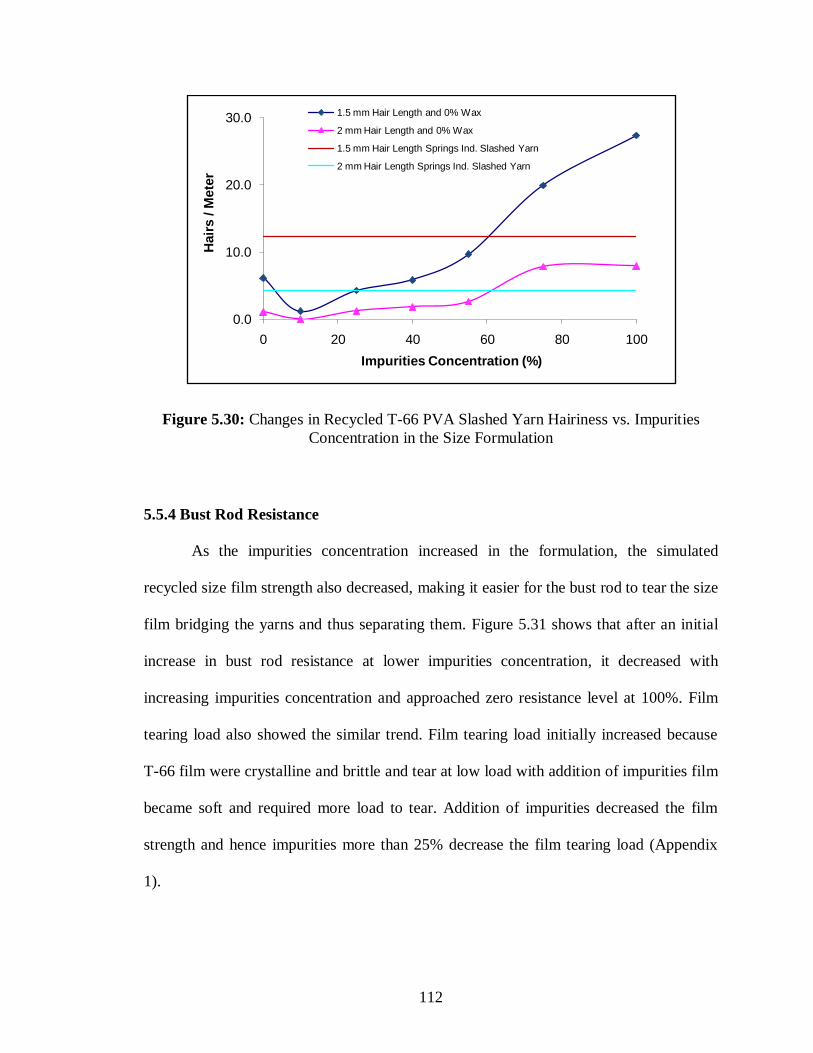
112
Figure 5.30: Changes in Recycled T-66 PVA Slashed Yarn Hairiness vs. Impurities
Concentration in the Size Formulation
5.5.4 Bust Rod Resistance
As the impurities concentration increased in the formulation, the simulated
recycled size film strength also decreased, making it easier for the bust rod to tear the size
film bridging the yarns and thus separating them. Figure 5.31 shows that after an initial
increase in bust rod resistance at lower impurities concentration, it decreased with
increasing impurities concentration and approached zero resistance level at 100%. Film
tearing load also showed the similar trend. Film tearing load initially increased because
T-66 film were crystalline and brittle and tear at low load with addition of impurities film
became soft and required more load to tear. Addition of impurities decreased the film
strength and hence impurities more than 25% decrease the film tearing load (Appendix
1).
0.0
10.0
20.0
30.0
0 20 40 60 80 100
Hair
s / M
ete
r
Impurities Concentration (%)
1.5 mm Hair Length and 0% Wax
2 mm Hair Length and 0% Wax
1.5 mm Hair Length Springs Ind. Slashed Yarn
2 mm Hair Length Springs Ind. Slashed Yarn
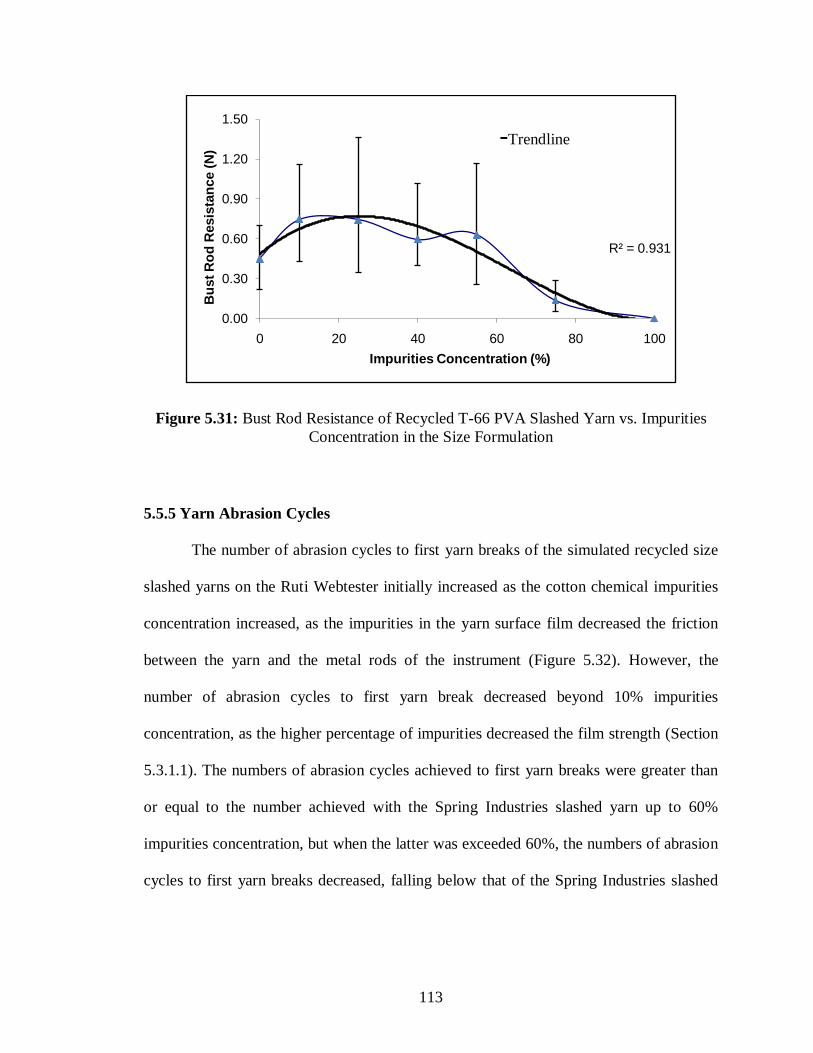
113
Figure 5.31: Bust Rod Resistance of Recycled T-66 PVA Slashed Yarn vs. Impurities
Concentration in the Size Formulation
5.5.5 Yarn Abrasion Cycles
The number of abrasion cycles to first yarn breaks of the simulated recycled size
slashed yarns on the Ruti Webtester initially increased as the cotton chemical impurities
concentration increased, as the impurities in the yarn surface film decreased the friction
between the yarn and the metal rods of the instrument (Figure 5.32). However, the
number of abrasion cycles to first yarn break decreased beyond 10% impurities
concentration, as the higher percentage of impurities decreased the film strength (Section
5.3.1.1). The numbers of abrasion cycles achieved to first yarn breaks were greater than
or equal to the number achieved with the Spring Industries slashed yarn up to 60%
impurities concentration, but when the latter was exceeded 60%, the numbers of abrasion
cycles to first yarn breaks decreased, falling below that of the Spring Industries slashed
R² = 0.931
0.00
0.30
0.60
0.90
1.20
1.50
0 20 40 60 80 100
Bu
st
Ro
d R
esis
tan
ce (
N)
Impurities Concentration (%)
-Trendline

114
yarn standard. At 100% impurities concentration in the size formulation, the numbers of
abrasion cycles to first yarn breaks were the same as those achieved with greige yarn.
Figure 5.32: Number of Abrasion Cycles to First Yarn Breaks of Recycled T-66 PVA
Slashed Yarn vs. Impurities Concentration Levels in the Size Formulation
5.5.6 Summary of Effects of up to 100% Cotton Chemical Impurities on Simulated
Recycled Size Slashed Yarns
Table 5.1 summarizes the results of the extended research of increasing impurities
concentration in the simulated recycled size. The simulated recycled size slashed yarn
properties showed that tenacity, work of rupture and bust rod resistance were acceptable
up to a 100% impurity level, whereas degree of hairiness and abrasion resistance above
60% impurities concentration were below those of the Springs Industries conventional
slashed yarn, and essentially approaching those of greige yarn.
R² = 0.553
0
200
400
600
800
1000
0 20 40 60 80 100
Ab
rasio
n C
ycle
s t
o F
irst
Yarn
B
reaks (
Nu
mb
er)
Impurities Concentration (%)
0% Wax
Greige Ground Yarn
Springs Ind. Slashed Yarn
Trendline

115
Table 5.1: Summary of Simulated Recycled Size Slashed Yarn Properties vs. Impurities
Concentration Compared to Springs Industries Conventional Slashed Yarn
Impurity Levels (%) 10 20 30 40 50 60 70 80 90 10
0 Slashed Yarn Tenacity
Work of Rupture
Bust Rod Resistance
Hairiness (1.5 mm)
Hairiness (2 mm)
Abrasion Cycles to First Yarn Break
5.6 Proof of Concept Scale-Up Trials Utilizing Webtex® Pilot Slasher
Using the bench scale results and in consultation with the industrial partners, the
maximum cotton chemical impurities concentrations in the recycled T-66 PVA size for
both pile and ground yarns were optimized for weave ability. The optimized, maximum
allowable concentration of impurities in the recycled T-66 PVA size formulation for
towel pile yarns was determined to be 60% (Table 5.1), whereas with ground yarns, the
value was concluded to be 45%. Towel ground yarns undergo excessive stress, strain,
abrasion, etc., as they traverse moving parts of the weaving machine, and thus require a
higher size solids add-on (10% by yarn weight) than pile yarn (3%, see Appendix 3).
Although the bench studies showed that < 60% impurities concentrations in recycled size
formulations for ground yarns were acceptable in maintaining weave ability, a safety

116
margin was incorporated for ground yarns, designating the 45% impurities concentration
limit in their recycled size formulations.
Griege cotton pile and ground yarns supplied for the scale-up trials by Frontier
Spinning Mills were tested for cotton chemical impurities concentration achieved under
the optimized, three-step desizing process (Section 4.3.2). Impurities extracted from both
yarn constructions under the optimized desizing conditions constituted ~2.1% of the yarn
masses. Yarn supplied by Frontier Spinning Mills was used for the thesis research work
now onward and concluding the thesis.
The amount of virgin T-66 PVA to be added to the size formulation in each
consecutive cycle of a recycling sequence to remain below the critical, maximum
impurity concentration levels defined in the bench research were calculated for both pile
and ground yarns. The calculated mass of virgin PVA to be added to each cycle’s final
size formulation for pile yarn was 20% of the original PVA mass used in the first slashing
of the sequence, i.e., the conventional cycle, and for ground yarn, 40% (Figure 5.33,
Appendix 2).
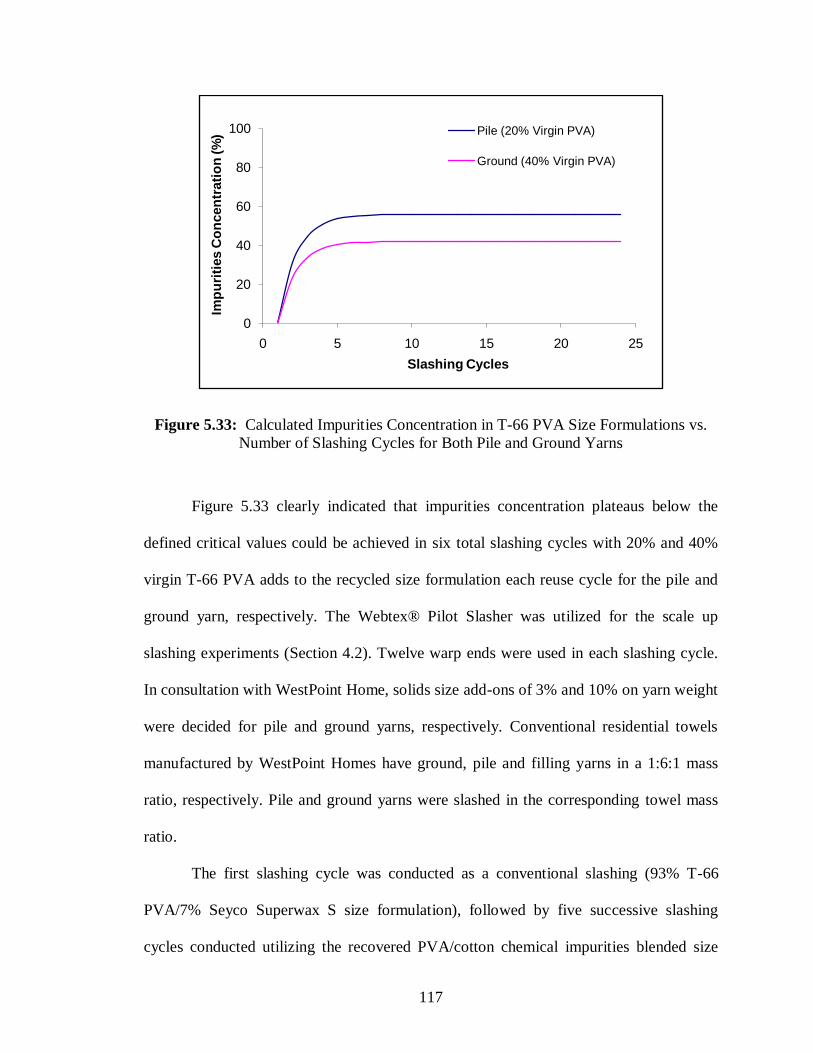
117
Figure 5.33: Calculated Impurities Concentration in T-66 PVA Size Formulations vs.
Number of Slashing Cycles for Both Pile and Ground Yarns
Figure 5.33 clearly indicated that impurities concentration plateaus below the
defined critical values could be achieved in six total slashing cycles with 20% and 40%
virgin T-66 PVA adds to the recycled size formulation each reuse cycle for the pile and
ground yarn, respectively. The Webtex® Pilot Slasher was utilized for the scale up
slashing experiments (Section 4.2). Twelve warp ends were used in each slashing cycle.
In consultation with WestPoint Home, solids size add-ons of 3% and 10% on yarn weight
were decided for pile and ground yarns, respectively. Conventional residential towels
manufactured by WestPoint Homes have ground, pile and filling yarns in a 1:6:1 mass
ratio, respectively. Pile and ground yarns were slashed in the corresponding towel mass
ratio.
The first slashing cycle was conducted as a conventional slashing (93% T-66
PVA/7% Seyco Superwax S size formulation), followed by five successive slashing
cycles conducted utilizing the recovered PVA/cotton chemical impurities blended size
0
20
40
60
80
100
0 5 10 15 20 25
Imp
uri
ties C
on
cen
trati
on
(%
)
Slashing Cycles
Pile (20% Virgin PVA)
Ground (40% Virgin PVA)

118
from the developed, three-step desizing/simulated VFE concentration process augmented
by the proscribed, added virgin T-66 PVA (Section 4.3.4.2, Figure 5.33). Towel ground
and pile yarns were slashed, whereas filling yarn was left as greige yarn.
When desizing constructed towels, filling yarn impurities are also extracted into
the desize solution. Constructed towel desizing was simulated by mixing slashed ground,
slashed pile and greige filling yarns in the same mass ratio as used in the WPH residential
towel construction (1:6:1). Films were made from final pile and ground yarn recycled
size formulations at every slashing cycle, and their tensile properties were tested.
Similarly, slashed pile and ground yarn properties, e.g., tensile, abrasion resistance,
hairiness, size penetration, yarn color and size add-on, were also tested.
5.6.1 Recycled T-66 PVA Size Formulation Film Tensile Properties
5.6.1.1 Breaking Strength
Film samples were prepared from the final recycled T-66 PVA size formulations
and tested on the Instron Model 5567 Tester using ASTM Test Method D882-02. From
Figure 5.34, the breaking strengths of the final recycled T-66 PVA formulation films for
ground yarn increased after the first recycle (the second cycle size formulation) because
wax was not added and the cotton chemical impurities had not built to a concentration
sufficient to fully replace the effects of the 8% wax contained in the conventional size
formulation, a fact beneficial to weaving efficiency. However, as predicted in the bench
scale simulation studies, the recycled T-66 PVA size formulation film strength decreased
in subsequent cycles, approaching a constant value plateau after the fourth slashing, as
did the cotton chemical impurities concentration in the size. In the case of pile yarn, the
recycled T-66 PVA size formulation film strength decreased with recycling because the

119
percentage of impurities in the first recycle size formulation was higher. With pile yarn,
20% based on original virgin T-66 PVA was added to the final size formulation each
cycle, whereas with ground yarn, 40% was added. In the second slashing cycle with pile
yarn, the impurities concentration in the final size formulation was close to that achieved
in the fourth slashing cycle of the ground yarn, confirming the calculated levels (Figure
5.33). The breaking strengths of the recycled T-66 PVA size formulation films in the
second and fourth slashing cycles of pile and ground yarn, respectively, were similar
because of similar impurities concentrations in the size (Figure 5.33).
Figure 5.34: Changes in Breaking Strength of Recycled T-66 PVA Size Film vs.
Slashing Cycles
5.6.1.2 Elongation at Break
With ground yarns, the elongations at break of recycled T-66 PVA size
formulation films increased in the first size recycle, as most of the wax was replaced by
0.0
5.0
10.0
15.0
20.0
25.0
0 1 2 3 4 5 6
Bre
akin
g St
ren
gth
(Mp
a)
Slashing Cycles
Ground Yarn
Pile Yarn
Trendline (Ground Yarn)
Trendline (Pile Yarn)

120
cotton chemical impurities and the impurities acted as a plasticizer in the corresponding
film (Figure 5.35). Further increases in impurities decreased the films’ elongations at
break, approaching a plateau after 3-4 recycles. In the case of pile yarns, size film
elongations at break behaved in a similar pattern to those for the ground yarns.
Figure 5.35: Changes in Elongation at Break of Recycled T-66 PVA Films vs. Slashing
Cycles
5.6.2 Size Add-On
The size formulation mass concentrations were kept constant at 10% w/v for
ground yarns and 3% w/v for pile yarns. Other slashing parameters, e.g., slashing speed,
temperature and pressure were also kept constant. Although viscosities of the slashing
formulations decreased with an increase in impurities (Section 5.3.3), size add-on showed
consistency (10% of yarn weight for ground yarns, 3% for pile yarns, Figure 5.36).
Linear density of the yarn, i.e., the yarn’s tex, depended upon the size solids add-on.
Because of the consistency in size add-on, recycled T-66 PVA slashed yarn linear density
was nearly constant with the number of slashing cycles (Figure 5.37).
0.0
50.0
100.0
150.0
200.0
250.0
300.0
0 1 2 3 4 5 6
Elo
nga
tio
n a
t B
reak
(%
)
Slashing Cycles
Ground Yarn
Pile Yarn
Trendline (Ground Yarn)
Trendline (Pile Yarn)

121
Figure 5.36: Size Solids Add-On of Recycled T-66 PVA Slashed Yarn vs. Slashing
Cycles
Figure 5.37: Yarn Tex of Recycled T-66 PVA Slashed Yarn vs. Slashing Cycles
0
3
6
9
12
1 2 3 4 5 6
Size
Ad
d-o
n (%
)
Slashing Cycles
Ground Yarn
Pile Yarn
0
20
40
60
80
0 1 2 3 4 5 6
Yar
n T
ex
Slashing Cycles
Ground Yarn
Pile Yarn

122
5.6.3 Desized Efficiency of Recycled T-66 PVA Slashed Yarns
Desize efficiency of slashed yarn is important for further wet processing of the
woven towel. Parallel to the WPH industrial desizing process, the developed three-step
desizing method was used for the scale-up research trials (Section 4.3.4.2). Desize
parameters such as temperature, time and liquor ratio were optimized so that 95% of the
total size material was removed from the yarn. Using theoretical and experimental values
(mass balance) of desize solids, desize efficiency was calculated. A desize efficiency
close to 100% was achieved (Figure 5.38). The desize method was developed so that
>95% of total size material can be removed. More than 100% desize efficiency indicated
removal of >95% of total size material.
Figure 5.38: Desize Efficiency of Recycled T-66 PVA Slashed Yarn vs. Slashing Cycles
80
100
120
1 2 3 4 5
Effi
cien
cy (%
)
Desize Cycles

123
5.6.4 Influence of Low Molecular Weight Cotton Chemical Impurities on Viscosity
Average Molecular Weight of Recycled T-66 PVA Size
Cotton chemical impurities extracted during the desize process were of low
molecular weight, and their incorporation in the recycled size decreased the apparent
average molecular weight of the material. Using dilute solution viscometry, the intrinsic
viscosities of the pure T-66 PVA size and the recovered T-66 PVA/cotton chemical
impurities blended size in the final formulation, i.e., after the proscribed virgin PVA add
(20% of original), were measured for only the pile yarn in the second reuse cycle (Figures
5.39 and 5.40). The apparent intrinsic viscosity of the size dropped from 0.6 g/dL for the
pure T-66 PVA to 0.4 g/dL for the size blend (recycled T-66 PVA/cotton chemical
impurities/proscribed added virgin T-66 PVA) utilized for the third pile yarn slashing
cycle of the reuse sequence. Considering the Mark-Houwink Equation, the values of
constants K and were assumed to be the same for both pure and recovered size.
[] = KM
K, = constant
M = Viscosity-average molecular weight
A decrease in apparent intrinsic viscosity thus indicated a corresponding decrease in
apparent viscosity average molecular weight of the size material.

124
Figure 5.39: Viscosity vs. Concentration of Pure T-66 PVA Size in First Slashing Cycle
(Conventional) Formulation
Figure 5.40: Viscosity vs. Concentration of Recycled T-66 PVA/Cotton Impurities
Blended Size in Final Third Slashing Cycle Formulation
y = 0.185x + 0.575
y = -0.025x + 0.588
0
0.2
0.4
0.6
0.8
1
0 0.5 1 1.5 2
Red
uced
/In
here
nt V
isco
sit
y (
dL
/g)
Concentration (g/dL)
Reduced Viscosity
Inherent Viscosity
Linear (Reduced Viscosity)
Linear (Inherent Viscosity)
y = 0.063x + 0.366
y = -0.011x + 0.368
0
0.2
0.4
0.6
0 0.5 1 1.5 2
Red
uced
/In
here
nt V
isco
sit
y (
dL
/g)
Concentration (g/dL)
Reduced ViscosityInherent ViscosityLinear (Reduced Viscosity)Linear (Inherent Viscosity)

125
5.6.5 Change of Cotton Chemical Impurities Concentration in Size vs. Number of
Slashing Cycles
Cotton chemical impurities concentration in the recycled size continued
increasing each cycle early in a size reuse sequence, but after the fifth slashing cycle,
they reached a plateau. The efficiency of desizing including removal of both T-66 PVA
and cotton chemical impurities from the slashed yarns was calculated using mass balance,
and the efficiency was determined to be close to 100%. The calculated and actual
impurities concentrations in the recycled sizes were very close. Thermogravimetric
Analysis (TGA) was used to measure the impurity percentage in the recycled size. Pure
T-66 PVA, isolated cotton chemical impurities and the solids obtained by evaporating the
water from the recycled blended size were separately incinerated at 650oC using TGA
(nitrogen gas flow) and their ash weights were measured (Figure 5.41). Using these data,
the percentages of T-66 PVA and cotton chemical impurities in the desize solids were
calculated. The cotton impurities and T-66 PVA theoretical and experimental values were
very close (Figure 5.42, Appendix 1).

126
Figure 5.41: Changes in Weight Percentage of Desized Solids vs. Temperature
Figure 5.42: Percentage Cotton Impurities in Recycled T-66 PVA Size vs. Slashing
Cycles
0
20
40
60
80
100
120
0 100 200 300 400 500 600 700
Wei
ght
(%)
Temperature (ͦC)
Pure PVA100% Impurities1st Desize2nd Desize3rd Desize4th Desize5th Desize
0
20
40
60
80
0 1 2 3 4 5 6
Imp
uri
ties
(%)
Desize Cycles
Experimental Calculated

127
5.6.6 Size Penetration
The efficiency of size diffusion inside the slashed yarn was visually observed by
adding tracer dye (C. I. Basic Violet 10) to the size formulation. Samples of slashed pile
yarn (3% of yarn weight solids add-on) cross sections were made and viewed under the
Leica Microscope (Section 4.3.10.6). The micrographs indicated that the bulk of the size
was concentrated on the surface of the yarn in the initial cycles of a slashing sequence,
but with an increase in the number of slashing cycles, the size penetrated deeply inside
the yarn core. In the fifth slashing cycle, the size actually penetrated to the core of the
yarn (Figures 5.43-5.48). A similar trend was seen with the ground yarn (10% of yarn
weight solids add-on, Figures 5.49-5.54). As the low molecular weight cotton chemical
impurities increased in concentration in the final size formulations, apparent viscosity
decreased, facilitating size penetration into the yarn diameter.
Figure 5.43: Size Penetration in Pure T-66 PVA Slashed Pile Yarn

128
Figure 5.44: Size Penetration in First Recycle T-66 PVA Slashed Pile Yarn
Figure 5.45: Size Penetration in Second Recycle T-66 PVA Size Slashed Pile Yarn
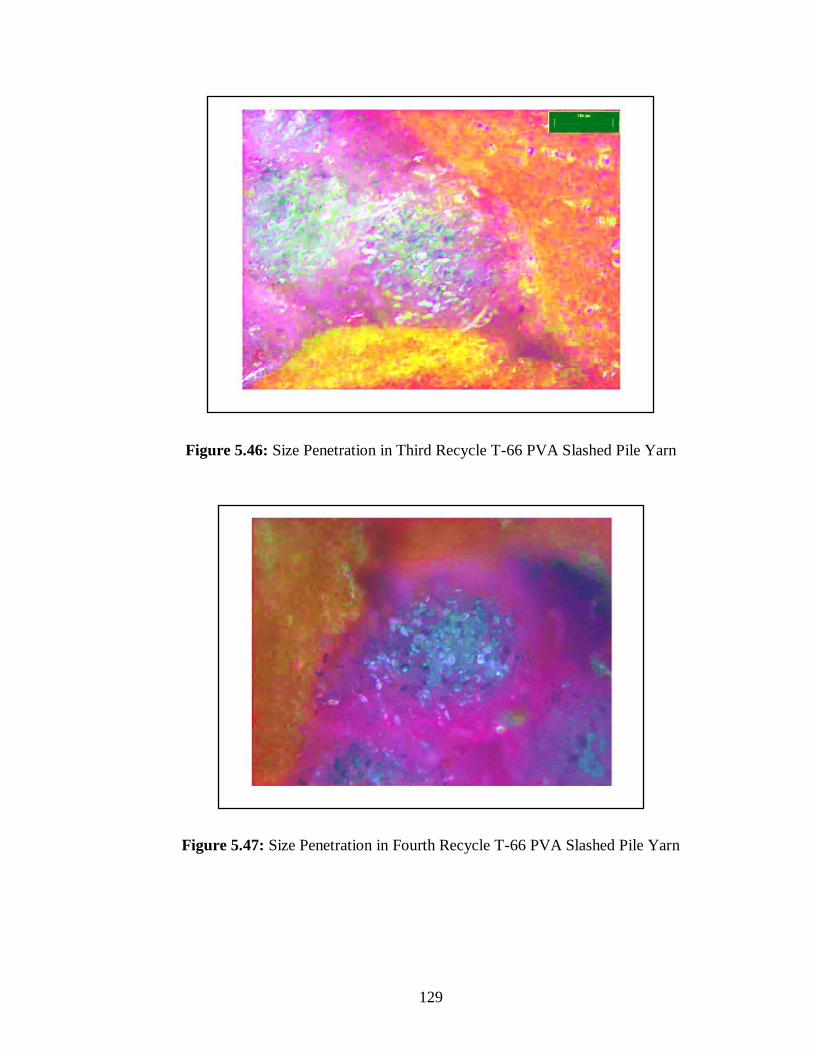
129
Figure 5.46: Size Penetration in Third Recycle T-66 PVA Slashed Pile Yarn
Figure 5.47: Size Penetration in Fourth Recycle T-66 PVA Slashed Pile Yarn

130
Figure 5.48: Size Penetration in Fifth Recycle T-66 PVA Slashed Pile Yarn
Figure 5.49: Size Penetration in Pure T-66 PVA Slashed Ground Yarn
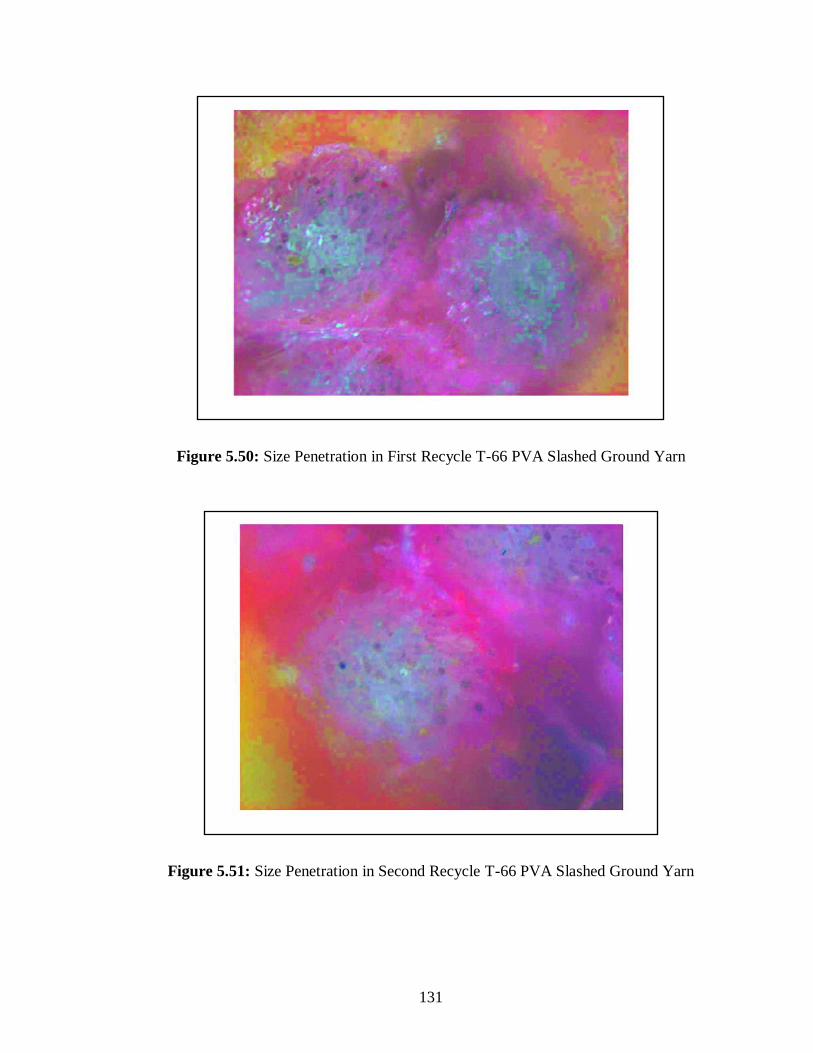
131
Figure 5.50: Size Penetration in First Recycle T-66 PVA Slashed Ground Yarn
Figure 5.51: Size Penetration in Second Recycle T-66 PVA Slashed Ground Yarn

132
Figure 5.52: Size Penetration in Third Recycle T-66 PVA Slashed Ground Yarn
Figure 5.53: Size Penetration in Fourth Recycle T-66 PVA Slashed Ground Yarn

133
Figure 5.54: Size Penetration in Fifth Recycle T-66 PVA Slashed Ground Yarn
5.6.7 Slashed Yarn Tensile Properties
5.6.7.1 Load at Break and Tenacity
As expected, recycled T-66 PVA slashed yarn showed an increase in load at
break. In Figure 5.55, loads at break for both pile and ground yarns increased more than
20% over that of greige yarn, and as a result, tenacities of the slashed yarns also increased
(Figure 5.56). Load at break initially increased as wax was replaced by impurities, but on
further increase in impurities concentration in the size, load at break and tenacity
decreased. After the first size reuse cycles for both yarns, the slashed yarn loads at break
and tenacities were nearly constant for subsequent slashings.

134
Figure 5.55: Load at Break of Recycled T-66 PVA Slashed Yarn vs. Slashing Cycles
Figure 5.56: Tenacity at Break of Recycled T-66 PVA Slashed Yarn vs. Slashing Cycles
5.6.7.2 Yarn Elongation at Break
The elongation at break of slashed yarn was expected to decrease compared to
that of greige yarn, as fibers in the slashed yarn stick to each other and prohibit both
0
3
6
9
12
1 2 3 4 5 6
Load
at
Bre
ak (
N)
Slashing Cycles
Slashed Ground Yarn Slashed Pile Yarn
Greige Ground Yarn Greige Pile Yarn
0
4
8
12
16
20
1 2 3 4 5 6
Yar
n T
enac
ity
(gf/
tex)
Slashing Cycles
Slashed Ground Yarn Slashed Pile Yarn
Greige Ground Yarn Greige Pile Yarn

135
elongation of individual fibers and fiber slippages. In the case of slashing with recycled
T-66 PVA size, yarn elongation at break increased because of low molecular weight
cotton chemical impurities occluded in the recycled size. The low molecular weight
impurities, apart from lubricating fibers to facilitate slippage, acted as plasticizers in the
recycled T-66 PVA size films, increasing their elongations at break (Section 5.6.2.2).
Figure 5.57 shows that elongation at break of slashed ground yarns (10% solids add-on)
decreased after the third slashing cycle because of the increased impurities concentration
in the recycled size. Pile yarns (3% solids add-on) showed a decrease in elongation at
break after the first (conventional) slashing because of the high percentage of impurities
in the first recycled size formulation. In both yarn cases, the elongation at break of
recycled T-66 PVA slashed yarn was closer to the proscribed industrial limit (decrease
not less than 20% of the elongation to break of the corresponding greige yarns).
Figure 5.57: Elongation at Break of Recycled T-66 PVA Slashed Yarn vs. Slashing
Cycles
0
5
10
15
20
1 2 3 4 5 6
Elo
nga
tio
n a
t B
reak
(%
)
Slashing Cycles
Slashed Ground Yarn Slashed Pile Yarn
Greige Ground Greige Pile

136
5.6.8 Work of Rupture of Recycled T-66 PVA Slashed Yarns
In Figure 5.58, the work of rupture of recycled T-66 PVA slashed ground yarns
initially increased with cotton chemical impurities concentration, but decreased after the
third slashing cycle. The work of rupture decreased because the higher concentrations of
impurities in later size reuse sequence cycles decreased both the breaking load and the
breaking elongation of the yarn. Similar behavior was observed with the pile yarn. Both
ground and pile yarn works of rupture were more than or near the proscribed limit for the
slashed yarns (~those of the corresponding greige yarns).
Figure 5.58: Work of Rupture of Recycled T-66 PVA Slashed Yarn vs. Slashing Cycles
5.6.9 Bending Length
Slashed yarn stiffness was measured by its bend in length under its own weight at
a constant angle (41.5o). With slashed ground yarn, the bending length initially decreased
with increasing cotton chemical impurities concentration in the recycled size, but after
0
300
600
900
1200
1500
1800
1 2 3 4 5 6
Wo
rk o
f R
up
ture
(gf-
cm)
Slashing Cycles
Slashed Ground Yarn Slashed Pile Yarn
Greige Ground Yarn Greige Pile Yarn
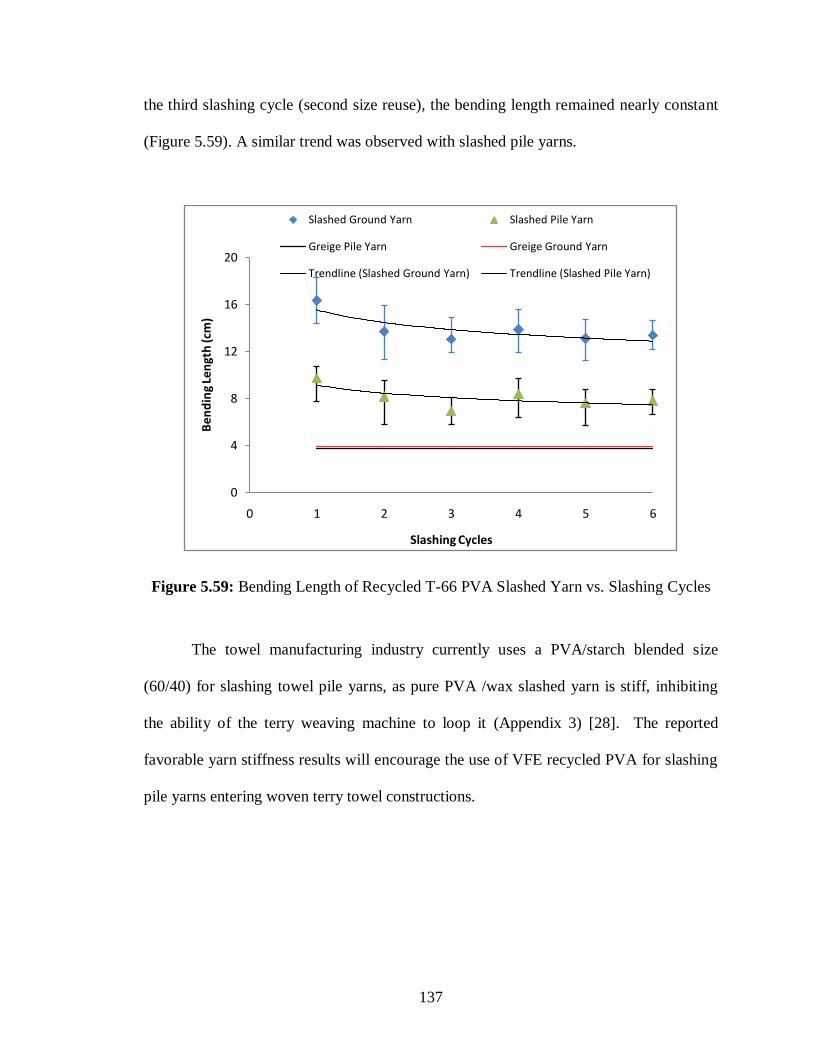
137
the third slashing cycle (second size reuse), the bending length remained nearly constant
(Figure 5.59). A similar trend was observed with slashed pile yarns.
Figure 5.59: Bending Length of Recycled T-66 PVA Slashed Yarn vs. Slashing Cycles
The towel manufacturing industry currently uses a PVA/starch blended size
(60/40) for slashing towel pile yarns, as pure PVA /wax slashed yarn is stiff, inhibiting
the ability of the terry weaving machine to loop it (Appendix 3) [28]. The reported
favorable yarn stiffness results will encourage the use of VFE recycled PVA for slashing
pile yarns entering woven terry towel constructions.
0
4
8
12
16
20
0 1 2 3 4 5 6
Be
nd
ing
Len
gth
(cm
)
Slashing Cycles
Slashed Ground Yarn Slashed Pile Yarn
Greige Pile Yarn Greige Ground Yarn
Trendline (Slashed Ground Yarn) Trendline (Slashed Pile Yarn)

138
5.6.10 Yarn Hairiness
Samples were prepared and the hairs were measured using the Tray Fray Counter.
In Figure 5.60, recycled T-66 PVA slashed yarn hairiness was nearly constant in both the
pile and ground constructions. Compared to the corresponding greige yarn, the slashed
ground yarn hairiness (2 mm hair length) dropped approximately 90% because of the
high percentage (10% of yarn weight) of size add-on, whereas slashed pile yarn hairiness
dropped approximately 50% compared to the greige yarn because of the lower size add-
on (3% of yarn weight).
Figure 5.60: Recycled T-66 PVA Slashed Yarn Hairiness vs. Slashing Cycles
5.6.11 Abrasion Resistance
Abrasion resistance is an important property of slashed towel ground yarns, and to
a lesser extent pile yarns, as abrasion against metal parts of modern high-speed weaving
0
4
8
12
16
20
24
0 1 2 3 4 5 6
Hai
rs (2
mm
)/M
eter
Slashing Cycles
Slashed Ground Yarn Slashed Pile Yarn
Greige Ground Yarn Greige Pile Yarn

139
machines is a major factor in warp yarn breaks. The number of abrasion cycles to first
yarn break as determined on the Ruti Webtester is an indirect measurement of the weave
ability of slashed warp yarns (Section 4.3.10.3). Fifteen yarn samples (either slashed
ground or pile yarns) were mounted and the number of abrasion cycles achieved against
the vertical round/square metal rods of the instrument to first yarn break was recorded.
The average of four such tests was then calculated for each slashed yarn type (Figure
5.61). After the first (conventional) slashing cycle, the number of abrasion cycles to first
yarn break achieved with the ground construction increased, but after the second slashing
(first size reuse) cycle, it remained nearly constant. The 8% wax in the initial
(conventional) T-66 PVA size formulation reduced the yarn surface friction, which aided
in increasing the number of abrasion cycles to first yarn break beyond that of the greige
yarn. At the same time, an increase in cotton chemical impurities concentration in the
recycled size reduced the film thickness on the yarn. Ground yarns slashed in subsequent
size reuse cycles maintained similar abrasion resistance, as the increased concentration of
cotton impurities mimicked the wax’s lubricity and PVA film plasticization performances
in the first slashing cycle. A similar trend was initially seen for the slashed pile yarns,
but after the third slashing (second size reuse) cycle, the number of abrasion cycles to
first yarn break decreased slightly with recycle number because of the low size solids
add- on (3% of yarn weight vs. 10% for the ground yarn) and the increasing impurities
concentration in the recycled size films.

140
Figure 5.61: Abrasion Cycles to First Yarn Break of Recycled T-66 PVA Slashed Yarn
vs. Slashing Cycles
5.6.12 Desized Yarn Color
The color of the recycled size formulations turned yellow then light brown in
slashing sequences because of increases in cotton impurities concentrations as well as
chromophore formation due to PVA degradation on the steam cans, similar to what has
been reported in UF PVA size concentration/recycling processes [28, 29]. The light
brown color of the recycled size formulation caused the slashed yarns to appear slightly
darker than both the greige yarns and the first cycle (conventional) slashed yarns. For
dyeing light pastel shades, all of the colored impurities should be removed during
desizing. Samples were made by randomly wrapping under slight tension both desized
ground and pile yarns close to each other on piece of rectangle cardboard previously
covered with a piece of white photocopy paper to give a relatively smooth, fabric-like
surface. Desized yarn CIE color values L, a and b were measured on the MiniScan
0
100
200
300
400
500
600
700
1 2 3 4 5 6
Ab
rasi
on
Cyc
les
to F
irst
Bre
aks
(Nu
mb
er)
Slashing Cycles
Slashed Ground Yarn Slashed Pile Yarn
Greige Ground Yarn Greige Pile yarn

141
Reflectometer using the white tile as the standard, whereas the overall color difference,
E, was calculated using the first cycle (conventional) slashed desized yarn as the
standard (Section 4.3.13). The desized yarns’ L, a and b values were similar, the
calculated E was approximately one (Figure 5.62-5.63).
Figure 5.62: Desized Yarn CIE L, a and b Values vs. Slashing Cycles
-8
-6
-4
-2
0
2
4
6
8
10
1 2 3 4 5 6
CIE
del
ta L
, del
ta a
an
d d
elt
a b
Slashing Cycles
delta L
delta a
delta b

142
Figure 5.63: Desized Yarn CIE E Values vs. Slashing Cycles
5.7 Economic Viability of VFE Incorporation
Economic studies were first conducted at a model towel plant scale (~100,000
gal/day of desize effluent stream treated) on recovery and recycling of T-66 PVA size
using VFE as the concentrating technology. The results were compared with those
calculated for the conventional PVA/starch (60:40) blend slashing process without size
recovery and with POTW treatment of the desize effluent (Appendix 5). For calculating
the operating costs of the model plant-scale VFE unit, energy, labor and maintenance
costs were considered. To calculate the benefits from VFE incorporation, savings from
reduced water consumption, reduced energy to heat water, T-66 PVA recycling, wax
deletion in recycled size formulations and reduced waste water treatment costs were
considered. The overall VFE economic study was conducted in consultation with the
partner manufacturer, VACOM, LLC, coupled with data available from the literature [1,
0
0.5
1
1.5
2
2 3 4 5 6
CIE
de
lta
E
Slashing Cycles
143
5, 63, 72]. Assumptions made in the study was, no loss of water or size mass occurred in
the handling/transportation of the materials, e.g., pipe losses.
A commercial-size model towel manufacturing plant was considered whose
capacity was 143,700 lb of product/day. The model plant produced ~100,000 gallons of
1% w/w solids desize effluent stream/day when all-PVA/wax was used as the size in
slashing irrespective of what size concentration technology was incorporated, whereas it
produced ~175,000 gallons of 1% w/w solids desize effluent stream/day when a
conventional PVA/starch (60:40) blended size was used in slashing with no size recycle.
Conventional slashing in the model plant produced more desize liquor because of the
higher size solid add-ons utilized than for the PVA/wax size (7% solids add-on for pile
yarn and 20% for ground yarn in the conventional PVA/starch process, 3% for pile and
10% for ground yarns in the PVA/wax process) [28, 36]. For the model towel
manufacturing plant, incorporation of the VFE technology for PVA recovery and
recycling resulted in ~$3.2M a year in savings compared to the current PVA/starch
process with no size recycling (Appendix 5).
Surprisingly, the effect of a rise in energy prices had little impact on the cost
savings. In this study, the current energy price of natural gas (the normal energy supply
for plant boilers) was $10/MBtu. If the price suddenly doubled as it did in July, 2008, i.e.,
to $20/MBtu, than in the case of VFE incorporation into the model plant the total
operational cost savings over the conventional size blend process with no recovery would
increase to only ~$3.4M/year, with the increase in savings of $0.2 M/year due to the
recovered hot water stream emanating from the condensed steam. The VACOM, LLC
VFE unit recovers up to 90% of the total energy input to the process [1]. The energy

144
required to operate the VFE unit is less than the energy required to heat water from 16oC
to 90oC.
The raw return on capital investment (R0I) period for VFE incorporation in the
model plant was less than one year, based on an ~$3M total capital investment cost for
the model plant provided by VACOM, LLC. VFE unit manufacturers also claim that if
the recovered material has some inherent value, then the raw ROI of installing a plant-
size unit for material concentration and recovery could be as little as a few months to a
year [20].
145
CHAPTER 6
CONCLUSIONS
Based on the results obtained from the bench research on the properties/utilization
of recovered T-66 PVA size films and subsequent slashed yarns, no added wax was
required in the final recycled size formulations, as the cotton chemical impurities
extracted into the desize effluents performed the same functions on the slashed yarns as
the wax. The maximum cotton chemical impurities concentration levels in the recycled
size for viable towel weaving were determined to be 60% for the pile yarn and 45% for
the ground yarn, respectively. Correspondingly, the optimum adds of virgin T-66 PVA to
the final recycled size formulations were determined to be 20% of original mass for pile
yarn slashing, and 40% of original mass for ground yarn slashing, respectively. The
optimized results from the bench scale research were successfully used to conduct proof
of concept, scale-up slashing trials with both pile and ground towel yarns on a continuous
Webtex® Pilot (12 end warp) Slasher.
Conclusions from the bench scale research were:
In VFE, the recycled T-66 PVA desize effluent stream entrained extracted
cotton yarn chemical impurities (~2.3% of yarn weight per desize cycle,
Springs Industries 100% cotton constructions). The apparent MW average
of the recycled T-66 PVA size decreased accordingly, as the impurities
were of lower molecular weight than the polymeric T-66 PVA.
The breaking strength of the recycled T-66 PVA size film initially
decreased with increasing impurities concentration in the size, and reached
146
a plateau at >25% impurities concentration. The addition of wax to pure
T-66 PVA size decreased the film strength in a similar manner. With the
occluded cotton impurities performing the same functions on the slashed
yarn as wax, no wax adds to the final recycled T-66 PVA size
formulations were required.
Elongations at break of recycled T-66 PVA size films initially increased
with impurities concentrations in the size, but at >35% concentration, the
elongation to break decreased. In a like manner, the pure T-66 PVA size
films’ elongations to break also decreased with increasing wax
percentages. An increase in elongation at break of recycled T-66 PVA film
leads to more efficient weaving processes compared to the pure polymer
film [73].
The modulus of elasticity of recycled T-66 PVA size film decreased with
increasing cotton chemical impurities concentration, facilitating terry
towel weaving.
The contact angle of water droplet (wet ability) on recycled T-66 PVA
size film decreased with increasing impurities concentration. The VFE
recycled T-66 PVA size film is thus easy to wet, facilitating effective
desizing of the fabric.
The viscosities of the final recycled T-66 PVA size formulations
decreased with increasing impurities concentrations, aiding in uniform
size pick-up in slashing at low temperatures.

147
The bust rod resistance forces of the bridged films of the recycled T-66
PVA slashed yarns initially increased with increases in impurities
concentrations, but at >25% impurities concentration in the size, they
decreased, reaching zero at 100% impurities level (no PVA in the size). A
similar trend was observed with increasing wax percentages in pure T-66
PVA films. In slashing, since most of the yarn breaks and generation of
hairiness occur at the bust rods, any decrease in bust rod resistance will
decrease both.
Although at constant total solids concentration the viscosities of the
recycled size formulations decreased, the resulting slashed yarns exhibited
constant size solids add-ons. This trait should lead to more facile control
of the slashing process (Section 5.3.3).
Slashed yarn load at break initially increased with recycling number, but
after the third recycle, it decreased slightly and then remained constant.
The slashed yarn loads at break for all the processed materials were at or
near acceptable levels, i.e., 20% greater than those of the corresponding
greige yarns (Section 5.4.2.1).
The slashed ground yarn elongations at break initially increased with size
recycling number and remained constant on further slashing cycles. The
slashed pile yarn elongation at break decreased with size recycling
number, but it was greater or near to the acceptable limit in all cases, e.g.,
>80% of that of the greige yarn.

148
Slashed ground and pile yarn works of rupture initially increased and then
decreased with size recycling number, but they were more than or close to
the acceptable limit, e.g., approximately equal to that of the corresponding
greige yarns.
Ground yarn hairiness decreased after slashing, but remained constant
throughout the size recovery/recycling sequences. This characteristic will
lead to fewer warp yarn breaks in air jet weaving.
Abrasion cycles to first slashed ground yarn breaks increased after
slashing compared to the greige yarns, but remained constant throughout
the size recovery/recycling sequences. This trait will reduce warp yarn
breaks in weaving, improving efficiencies.
The conclusions from the proof of concept scale-up slashing trials utilizing
recycled T-66 PVA size formulations were:
The scale up trials confirmed the recycled T-66PVA film and slashed yarn
results, i.e., the recycled size film breaking strengths and elongations at
break, coupled with slashed yarn loads at break, tenacities, elongations at
break, works of rupture, abrasion cycles to first yarn breaks, hairiness and
bust rod resistances, were all maintained throughout the six cycle slashing
sequences at levels sufficient for effective towel weave ability.
The scale up trials verified that 20% (pile yarns) and 40% (ground yarns)
virgin PVA mass adds based on the original slashing PVA mass into the

149
final recycled T-66 PVA size formulations achieved the required slashed
yarn properties for effective terry towel weaving.
The bending length of the recycled T-66 PVA slashed pile yarn decreased
with recycling number, facilitating loop formation on the terry towel loom.
Similarly, the bending length of the slashed ground yarn also decreased
with recycling number. The decreased bending lengths of the recycled T-
66 PVA slashed pile yarns provide an additional incentive for towel
manufacturers currently operating on PVA/starch blend sizes with no
recycle to convert to VFE recovery and recycle of all-PVA size
formulations.
Desized yarn CIE L, a and b values remain constant with recycling.
Overall color difference, E, values were near one, which confirmed the
visual conclusion that the desized yarn color build-up with recycle number
was difficult to differentiate by the human eye. The minor color developed
in the desized yarns should not interfere with dyeing pastel shades on the
subsequent woven towels, even if it is not completely removed in the
preparation processes that normally follow desizing (scouring and
bleaching).
Diffusion of the recycled T-66 PVA size across the yarn cross-sections
increased with recycling number, but the desizing efficiencies remained
constant (~99%). This trait is important for further wet processing of the
desized towels, e.g., dyeing, printing and finishing (Section 2.1.3).

150
The technical feasibility of implementing the VFE technology for PVA
recovery and recycling was proven.
Based on the economic studies, the following conclusions were drawn:
The overall cost savings of incorporating the VFE all-PVA concentration
technology into a commercial-scale, conventional model towel
manufacturing plant (143,700 lbs/day production, generating 100,000
gal/day of 1% solids concentration desize effluent stream) over the same
model plant operating on a PVA/starch (60/40) size blend platform with
no recycle was ~$3.2M/year.
The VFE implementation savings were only slightly affected with
increases in energy prices, i.e, for model plant on increasing natural gas
price from $10/MBtu to $20/MBtu projected saving increase $0.2M/ year.
The raw return on capital investment (R0I) period for VFE incorporation
in the model plant was less than one year, based on an ~$3M total capital
investment cost for the model plant provided by VACOM, LLC (Section
5.7).
151
CHAPTER 7
RECOMMENDATIONS
The reported research confirmed the technical and economic viabilities of the
VFE process for PVA size recovery and reuse at a pilot scale. To transfer the research
into commercial practice, the research results should be first translated to long-term,
industrial-scale plant trials.
Industrial trials should be conducted using a large (10,000 gal/day of desize
effluent stream capacity) pilot scale VACOM, LLC VFE unit, an appropriate number of
terry towel looms for comparative weaving efficiency studies, an industrial slasher and a
segregated desizing line. Initially, first weaving cycle towels should be produced by
using ground and pile yarns slashed by the E. I. DuPont recommended all T-66 PVA/wax
slashing formulation (93/7). For subsequent slashing cycles and after desizing the first
(conventional) cycle towels, the VFE concentrated PVA size supplemented with virgin
PVA adds at the proscribed levels for pile (20% of original PVA) and ground (40%)
yarns should be used for subsequent slashing cycles. The resulting woven towels should
be made from recycled size slashed yarns while monitoring weaving efficiency, and the
products should then be desized separately so that PVA can be recovered via the VFE
unit from the desized effluent stream. Six total cycles (one conventional and five size
recovery and reuse) should be conducted in a sequence, and the results should be
compared to those generated in the reported research. If the results of the plant trials
parallel those reported in the research, then the slashing sequence should be extended to
12, 18 and 24 total sequences, with yarn properties and weaving efficiencies monitored

152
and compared with the initial (conventional) slashing at every step. Finally, a detailed
economic study should be conducted comparing the operational costs of the overall VFA
all-PVA size recovery and reuse process with the plant’s existing PVA/starch size blend
process with no size recycling, and a decision reached on full plant implementation of the
VFE technology.

153
APPENDIX 1
TEARING BEHAVIOUR OF SIZE FILM
Maximum Tear Load Exerted by Simulated Recycled T-66 PVA Size Film vs.
Impurities Percentage
0
0.5
1
1.5
2
2.5
3
3.5
0 10 20 30 40
Max. T
ear
Lo
ad
(N
)
Impurities Percentage (%)
Simulated Recycled T-66 PVA
T-66 PVA

154
APPENDIX 2
IMPURITIES PERCENTAGE CALCULATION IN PILE AND
GROUND SIZE FORMULATION
Add-On on Ground Yarn % G 10
Add-On on Pile Yarn % P 3
Ratio of Pile to Ground Yarn P/G L 6
Ratio of Filling to Ground Yarn F/G M 1
Impurity % in Pile Yarn x 2.1
Impurity % in Ground Yarn y 2.1
Impurity % in Filling Yarn z 2.1
Virgin % in Pile A 20
virgin % in Ground B 40
Size left in the yarn Q 5
Total Yarn (1+L+M) T 8
N1 =P ∗ L
T ∗ 100
N2 =G
T ∗ 100
N3 = N1 + N2
D = 100 − Q ∗N3
100
N6 =x ∗ L
T ∗ 100
N7 =y
T ∗ 100
N8 = z ∗ M
T ∗ 100
E = N6 + N7 + N8
F = D + E
Size Add-On on Pile N1 0.0225
Size Add-On on Ground N2 0.0125

155
Total Size Add-On N3 0.035
Size Desize D 0.03325
Imp. From Pile N6 0.01575
Imp. From Ground N7 0.002625
Imp. From Filling N8 0.002625
Total Imp E 0.021
Total Solid After Desizing F 0.05425
S1 =P ∗ L ∗ (100 − A)
100,00 ∗ T
S2 =G ∗ (100 − B)
100,00 ∗ T
Recycle Size in Pile S1 0.018
Recycle Size in Ground S2 0.0075
𝐴𝑛 = 100 − 𝑄 ∗𝐼𝑝 𝑛 − 1 + 𝐼𝑔 𝑛 − 1
100+ 𝐸
Impurities in Pile Size Formulation = Ipn =S1 ∗ An
F
Impurities in Ground Size Formulation = Ign =S2 ∗ An
F
Ipn % = Ipn ∗100
N1
Ign % = Ign ∗100
N2

156
APPENDIX 3
COTTON CHEMICAL IMPURITIES CALCULATIONS
Percentage of Pure T-66 Left at 650 oC: Ta%
Percentage Pure of Cotton Impurities Left at 650 oC: Ca%
Percentage of Desized Solid Left at 650 oC: Da%
Desized Solid Compositions are Pure T-66 and Pure Cotton Impurities.
If a sample of 100 gm. Desized Solid have A gm of Pure Cotton Impurities than
Percentage of Pure T-66 is (100-A) gm.
Cotton Impurities Left in the Desize Solid at 650 oC: 𝐴 ∗
𝐶𝑎
100 (1)
T-66 Left in the Desized Solid at 650 oC: 100 − 𝐴 ∗
𝑇𝑎
100 (2)
So Desized Solid Left at 650 oC: 𝐷𝑎 = 𝐴 ∗
𝐶𝑎
100+ 100 − 𝐴 ∗
𝑇𝑎
100
On Simplifying:
𝐴% = 𝐷𝑎 − 𝑇𝑎
(𝐶𝑎 − 𝑇𝑎)∗ 100
𝐼𝑚𝑝𝑢𝑟𝑖𝑡𝑦 % = 𝐴𝑠ℎ % 𝑖𝑛 𝑡ℎ𝑒 𝑆𝑎𝑚𝑝𝑙𝑒 − 𝐴𝑠ℎ % 𝑖𝑛 𝑡ℎ𝑒 𝐸𝑙𝑣𝑎𝑛𝑜𝑙 𝑇66
(𝐴𝑠ℎ % 𝑖𝑛 𝑡ℎ𝑒 𝐶𝑜𝑡𝑡𝑜𝑛 𝐼𝑚𝑝𝑢𝑟𝑖𝑡𝑦 − 𝐴𝑠ℎ % 𝑖𝑛 𝑡ℎ𝑒 𝐸𝑙𝑣𝑎𝑛𝑜𝑙 𝑇66)∗ 100

157
APPENDIX 4
TERRY LOOM, SIDE VIEW
(Source: PTFE 3720 Class Slides, Spring 2009)

158
APPENDIX 5
ECONOMIC VIABILITY OF VFE PROCESS
VFE
(PVA/Wax)
Without Recycling
(PVA/Starch/Wax)
Towel Production/Day (lbs)
(Towel Construction
Ground:Pile:Filling::1:6:1)[28]
143,700 143,700
Size Used in Pile Yarns (lbs)
All-PVA/Wax Slashing Pile Add-Ons 3%,
Conventional-PVA/Starch/Wax Slashing Pile
Add-Ons 7% [28, 70]
3,233 7,544
Size Used in Ground Yarns (lbs)
All-PVA/Wax Slashing Ground Add-Ons
10%,
Conventional-PVA/Starch/Wax Slashing
Ground Add-Ons 20%
1,796 3,592
Impurities Extracted in Desizing (lbs) 3,305 3,305
Total Solids in Desize Effluents (lbs) 8,334 14,441
OPERATING COSTS OF PVA
RECOVERY/REUSE SYSTEM

159
Desize Effluents/Day
(Gallons)
100,000
175,000
Plant Costs
(Capacity 100,000 gallons/day)[1] $ 3,000,000 $ 0
Energy/ Gallon
(MBtu)[1] 0.000595 $ 0
Energy/ Day
(MBtu) 59.5 $ 0
Energy Price/MBtu
(Natural Gas) $ 10 $ 0
Energy Costs/Day $ 595 $ 0
Labor/Gallon
(VFE: 1 operator per 12-hour shift. Operators
Salary =2* ~$65,000/yr, Benefits =2*
~$17,550)[1]
$ 0.0045 $ 0
Labor/Day $ 450 $ 0
Maintenance Costs /Gallon [1] $ 0.0036 $ 0
Maintenance Costs /Day $ 360 $ 0
Total Operation Costs/Day
(Energy, Labor, Maintenance) $ 1,405 $ 0
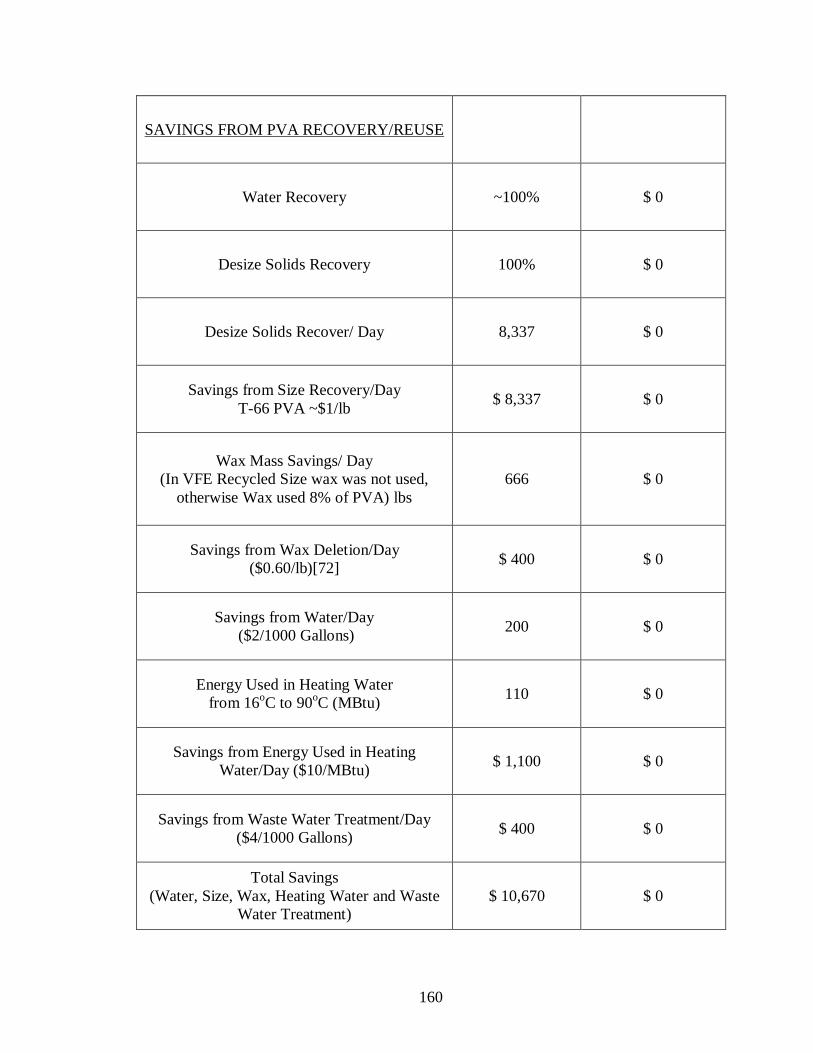
160
SAVINGS FROM PVA RECOVERY/REUSE
Water Recovery ~100% $ 0
Desize Solids Recovery 100% $ 0
Desize Solids Recover/ Day 8,337 $ 0
Savings from Size Recovery/Day
T-66 PVA ~$1/lb $ 8,337 $ 0
Wax Mass Savings/ Day
(In VFE Recycled Size wax was not used,
otherwise Wax used 8% of PVA) lbs
666 $ 0
Savings from Wax Deletion/Day
($0.60/lb)[72] $ 400 $ 0
Savings from Water/Day
($2/1000 Gallons) 200 $ 0
Energy Used in Heating Water
from 16oC to 90
oC (MBtu)
110 $ 0
Savings from Energy Used in Heating
Water/Day ($10/MBtu) $ 1,100 $ 0
Savings from Waste Water Treatment/Day
($4/1000 Gallons) $ 400 $ 0
Total Savings
(Water, Size, Wax, Heating Water and Waste
Water Treatment)
$ 10,670 $ 0

161
Net Savings/Day
(Total Savings/Day - Total Operation
Costs/Day)
$ 9,265 $ 0
Net Savings/Year
(350 Working Days/Year) $ 3,161,178 $ 0
Need for POTW for Desize Effluent Stream?
No Yes

162
REFERENCES
1. Wright, B., 212 Resources, Personal Communications, March, 2009.
2. World Energy Consumption and Forecasting.
http://www.eia.doe.gov/oiaf/ieo/pdf/world.pdf June 13, 2007.
3. Water Scarcity. http://news.bbc.co.uk/1/hi/sci/tech/3747724.stm June 13, 2007.
4. AATCC Symposium. Textile Chemist and Colorist, 1991. 23(6): p. 31-38.
5. Porter, J.J., Recovery of Polyvinyl Alcohol and Hot Water from the Textile
Wastewater Using Thermally Stable Membranes. Journal of Membrane Science,
1998. 151(1): p. 45-53.
6. Wysocki, G., Size Recovery by Ultrafiltration. Melliand Textilberichte (English
Edition), 1977(February): p. 113-115.
7. Hao, J. and Q. Zhao, The Development of Membrane Technology for Wastewater
Treatment in The Textile Industry in China. Desalination, 1994. 98(1-3): p. 353-
360.
8. Starch Contribute 50% Bod.
http://www.p2pays.org/ref/11/10489/sectors75ad.html June 13, 2007.
9. Thermoplastic Poly (Vinyl Alcohol) (PVOH).
http://www.azom.com/Details.asp?ArticleID=266, March 19, 2009.
10. Lin, S.H. and W.J. Lan, Ultrafiltration Recovery of Polyvinyl-Alcohol from
Desizing Waste-Water. Journal of Environmental Science and Health Part A-
Toxic/Hazardous Substances & Environmental Engineering, 1995. 30(7): p. 1377-
1386.
11. Lanier, E., West Point Home, Inc., Private Communications, 2007-2008.
12. Buckley, C.A., R.B. Townsend, and G.R. Groves, Performance of an
Ultrafiltration Pilot-Plant for the Closed Loop Recycling of Textile Desizing
Effluents. Water Science and Technology, 1982. 14(6/7): p. 705-713.
13. Fujitaka, T., et al., Method for Removing Volatile Matter from Polymer Solution
Composition in USP 6,353,088. 2002.
14. Caracciolo, V.P., Distillation of 1,4-butanediol in USP 4,419,189. 1983.
163
15. Greig, C.R., P.J. Tait, and P.J. Noble, Evaporative Concentration of Clay Slurries
in USP 5,730,836. 1998.
16. Saury, D., S. Harmand, and M. Siroux, Experimental Study of Flash Evaporation
of a Water Film. International Journal of Heat and Mass Transfer, 2002. 45(16):
p. 3447-3457.
17. Miyatake, O., et al., Effect of Liquid Temperature on Spray Flash Evaporation.
Desalination, 1981. 37(3): p. 351-366.
18. Truchi, E. and R. Re, Treatment of Wastes from the Washing of Rolling Stock.
Wire Industry, 2002(October): p. 538-539.
19. Schleiffarth, J.W., Apparatus and Method for Vapor Compression Distillation in
USP 6,365,005. 2002.
20. Turchi, E., Treatment of Waste Water through Vacuum Evaporation. Wire
Industry, 2003(1): p. 24-25.
21. Energy Consumption Country Wise.
http://www.eia.doe.gov/pub/international/iealf/tablee1.xls June 13, 2007.
22. Porter, J.J. and D.E. Black, Water, Energy and Chemical Recovery from
Desizing. American Dyestuff Reporter, 1979. 68(12): p. 46-54.
23. Adanur, S., ed. Handbook of weaving. 1960.
24. Lord, P.R. and M.H. Mohamed, eds. Weaving : Conversion of Yarn to Fabric.
1982.
25. Goswami, B.C., R.D. Anandjiwala, and D.M. Hall, eds. Textile Sizing. Marcel
Dekker Inc.: Auburn.
26. Seydel, P.V., ed. Warp sizing. 1958, L. A. Lee Company, Inc.: Atlanta.
27. Parachuru, K., Georgia Institute of Technology, Personal Communications, 2005-
2009.
28. Odom, W. and C. Turner, WestPoint Home, Inc., Personal Communication, 2007-
2008.
29. Neely, N., Spring Industries, Personal Communications, 2005-2007.
30. Flinch, C.A., ed. Polyvinyl Alcohol Properties and Application. John Wiley &
Sons. 1973.

164
31. Porter, J.J. and T.N. Sargent, Waste Treatment vs. Waste Recovery. Textile
Chemist and Colorist, 1977. 9(11): p. 38-42.
32. Leitner, H., Recycling of Synthetic Sizes - Polyacrylates. Melliand English,
1994(10): p. E 205 - E209.
33. Peters, R.H., ed. Textile Chemistry. Vol. II. 1967, Elsevier Publishing Company:
New York.
34. Trotman, E.R., ed. Dyeing and Chemical Technology of Textile Fibers. 4 ed.
1970, Charles Griffin and Company Limited: London.
35. Robinson, G.D., Tech Talk #33 Polyvinyl Alcohol Manufacture and Hydrolysis
E. I. DuPont Co., 1996.
36. Robinson, G.D., The Technology of Polyvinyl Alcohol Warp Sizing Recovery.
Technical Textiles International, 1993(2): p. 13-15.
37. Seydel, S., International-Symposium - Textile Sizing. American Dyestuff
Reporter, 1980. 69(8): p. 46-49.
38. Brandon, C.A., et al., Hot Textile Process Effluent Recycle by Membrane
Separation. AIChE Symposium Series, 1979. 75(190): p. 140-147.
39. Editorial, Knitting Times, 1978. 47(May): p. 25.
40. Energy Conservation Through Point Source Recycle. EPA Grant R803875,
Clemson University.
41. Brandon, C.A., et al., Complete Reuse of Textile Dyeing Wastes Processed with
Dynamic Membrane Hyperfiltration. Textile Chemist and Colorist, 1973. 5(7): p.
35-134.
42. Brandon, C.A., E.A. Nasher, and J.J. Porter, Hyperfiltration Pilot Plant for Textile
Wastewater Renovation. American Dyestuff Reporter, 1975. 64(10): p. 20-32.
43. Lee, S.W., et al., Ultrafiltration of Desizing Waste Water Containing PVA in
Bench Scale Test. Environmental Technology, 1999. 20(3): p. 277-283.
44. Buckley, C.A., R.L.C. Flemmer, and G.R. Groves, Fouling Studies and
Mathematical Modelling of Ultrafiltration of Textile Desizing Effluents.
Desalination, 1983. 47: p. 171-179.
45. Flemmer, R.L.C., C.A. Buckley, and G.R. Groves, An Analysis of the
Performance of a Spiral-Wound Ultrafiltration Membrane. Desalination, 1982.
41: p. 25-32.

165
46. Flemmer, R.L.C., Performance of a Spiral-Wound Ultrafiltration Membrane with
Turbulance Promoting Net Under Condition of Strong Pressure Gradient and
Fouling.
47. Recovery System for Indigo, Caustic Soda and size Melliand International,
1995(4): p. 270.
48. Langer, J., Current Technology for the Recycling of Polyvinyl Alcohol Sizing
Agents. Melliand English, 1994(10): p. E 203 - E204.
49. Glawe, A., et al., Investigations of Selected Size Products on their Suitability for
Ultrafiltration and on Improving their Effectiveness in Weaving. Melliand
English, 1995(1-2): p. E 8 - E 11.
50. Buckley, C.A. and G.R. Groves, Membrane Seperation Processes for Industrial
Effluent Treatment, in South African Institution of Chemical Engineers. 1980:
University of Stellenbosch.
51. Lin, S.H. and W.J. Lan, Polyvinyl Alcohol Recovery by Ultrafiltration: Effects of
Membrane Type and Operating Conditions. Separations Technology, 1995. 5(2):
p. 97-103.
52. Lin, S.H. and W.J. Lan, Semi-Batch Recovery of Polyvinyl Alcohol from
Aqueous Solution by Ultrafiltration. Journal of Dispersion Science and
Technology, 1997. 18(5): p. 463 - 475.
53. Cheng, T.W. and S.Y. Pan, Recovery of Sizing Agent by Gas Sparging
Ultrafiltration. Journal of Chinese Institute of Chemical Engineeres, 2001. 32(5):
p. 431-436.
54. Diehl, M. and W. Schindler, Size Recycling by Ultrafiltration of Size Mixtures
Containing Polyvinyl Alcohol - Part 2. Melliand English, 1995(3): p. E 34 -36.
55. Bassetti, F.J., L. Peres, and J.C.C. Petrus, Recuperation of polyvinyl alcohol
(PVA) through microporous membranes. Latin American Applied Research,
2001. 31(5): p. 547-550.
56. Robinson, G.D., Textile Asia, 1993. 24(2): p. 58-62.
57. Rott, U., Multiple Use of Water in Industry - The Textile Industry Case. Journal
of Environmental Science and Health Part a-Toxic/Hazardous Substances &
Environmental Engineering, 2003. 38(8): p. 1629-1639.

166
58. Black, D.E. and J.J. Porter, Energy Conservation through Wastewater Recycle on
a Continuous Preparation Range. Book of Papers, National Technical Conference
- AATCC 1978: p. 179-190.
59. Gopalakrishna, G., V.M. Purushothaman, and N. Lior, An Experimental Study of
Flash Evaporation from Liquid Pools. Desalination, 1987. 65: p. 139-151.
60. Turchi, E., Reducing Cost. Process worldwide, 2004(2): p. 30-31.
61. Turchi, E., Vacuum Evaporation when Water Waste Equals Zero. Water
conditioning and purification, 2004(June): p. 14-16.
62. Takao, H., Y. Inoue, and H. Yamazaki, Process for Separating a Polymer from a
Solution Containing the Same in USP 4,942,223. 1990.
63. http://www.vacomllc.com/system.htm (July 28, 2006).
64. Warp Sizing With DuPont Elvanol T-Grades.
http://www2.dupont.com/Elvanol/en_US/assets/downloads/elvanol_warp_sizing.
pdf, March 20, 2009.
65. Auto-Draw III. http://www.industrytech.net/products_auto_dd_III_machine.htm,
March 20, 2009.
66. Standard Test Method for Testing Tensile Properties of Thin Plastic Sheeting
D882-02 ASTM, 2002.
67. Standard Test Method for Tensile Properties of Yarn by Single Strand Method
D2256-02. ASTM, 1997.
68. Rodriguez, F., et al., Principle of Polymer System. 2003: Taylor & Francis.
69. Insight on Color. HunterLabs Applications Note, 2008. 8(7).
70. Robinson, G.D., Tech Talk #25 New Developments in Size Recovery using
Ultrafiltration. E.I. DuPont Co., 1990.
71. Thin Boiling Starch
http://www.honestglobal.com/Thin%20Boiling%20Starch/product.html, March
20, 2009.
72. Stewart, C., Seydel-Woolley & Co., Inc., Personal communications, 2005-2009.
73. Robinson, G.D., E. I. DuPont Co., Personal Communications, 2005-2008.


