Embed Size (px)
Citation preview
POLITECNICO DI TORINOMaster degree course in Aerospace Engineering
Master Degree Thesisin
Aerospace Engineering
Pollutant emissions estimation fromsubsonic and hypersonic civil aircraftStudy of emissions in subsonic, supersonic and hypersonic flight, based on
the Boeing Fuel Flow Method
SupervisorsProf. Roberta FusaroProf. Nicole ViolaProf. Davide Ferretto
CandidatesElia Mantelli
matricola: s265662
2020 - 2021


A Lidia ed Aldo
Abstract
The aim of the thesis is to analyze and compare the emissions of subsonic, supersonicand hypersonic aircraft through the Boeing Fuel Flow Method. In the first part of thework, a relationship was searched between the fundamental quantities of each subsonicengine, Overall Pressure Ratio and By Pass Ratio, and polluting emissions, through theanalysis of the ICAO database. A Matlab code was therefore used to read and save thedata reported in the Excel database, then interpolating them according to various criteria.Subsequently, starting from the same data, a Matlab code was developed to calculate theEmission Index of each engine through the Fuel Flow Method, and to be able to havean indicative value of emissions during a typical mission. In the last section concerningsubsonic flight, FFM was implemented even in the case of liquid hydrogen, rather thankerosene. In the supersonic field, after a brief introduction on the different architecturesof supersonic engines, an analysis of the data of the Stratofly hypersonic engine (DualMode Ramjet) was carried out. Finally, a possible adaptation of the Fuel Flow Methodto the supersonic and hypersonic flight, and an example of calculation using the Stratoflyscramjet data, are proposed.

Contents
1 Aviation and Environment 51.1 Actual situation . . . . . . . . . . . . . . . . . . . . . . . . . . . . . . . . . 51.2 Local Air Quality: LAQ . . . . . . . . . . . . . . . . . . . . . . . . . . . . 71.3 Polluting emissions: Status and Reduction . . . . . . . . . . . . . . . . . . 9
1.3.1 CO . . . . . . . . . . . . . . . . . . . . . . . . . . . . . . . . . . . . 101.3.2 CO2 . . . . . . . . . . . . . . . . . . . . . . . . . . . . . . . . . . . 101.3.3 NOx . . . . . . . . . . . . . . . . . . . . . . . . . . . . . . . . . . . 111.3.4 H2O . . . . . . . . . . . . . . . . . . . . . . . . . . . . . . . . . . . 11
1.4 Noise . . . . . . . . . . . . . . . . . . . . . . . . . . . . . . . . . . . . . . . 131.5 Sustainable Aviation Fuel and hydrogen fuel . . . . . . . . . . . . . . . . . 15
1.5.1 Infrastructure requirements for hydrogen fuel . . . . . . . . . . . . . 17
2 Subsonic flight 212.1 Subsonic engine architectures . . . . . . . . . . . . . . . . . . . . . . . . . 21
2.1.1 Turboprop . . . . . . . . . . . . . . . . . . . . . . . . . . . . . . . . 222.1.2 Turboshaft . . . . . . . . . . . . . . . . . . . . . . . . . . . . . . . . 232.1.3 Turbojet . . . . . . . . . . . . . . . . . . . . . . . . . . . . . . . . . 242.1.4 Turbofan . . . . . . . . . . . . . . . . . . . . . . . . . . . . . . . . . 25
2.2 Decreasing consumption . . . . . . . . . . . . . . . . . . . . . . . . . . . . 272.2.1 Changes to improve performance to classic architecture . . . . . . . 28
2.3 Innovative technologies and architectures . . . . . . . . . . . . . . . . . . . 31
3 Data analysis for subsonic flight 353.1 Fourth degree polynomial . . . . . . . . . . . . . . . . . . . . . . . . . . . 35
3.1.1 Turbofan separated flow . . . . . . . . . . . . . . . . . . . . . . . . 363.1.2 Turbofan with mixer . . . . . . . . . . . . . . . . . . . . . . . . . . 39
3.2 Curve fitting . . . . . . . . . . . . . . . . . . . . . . . . . . . . . . . . . . . 413.2.1 Turbofan separated flow . . . . . . . . . . . . . . . . . . . . . . . . 433.2.2 Turbofan with mixer . . . . . . . . . . . . . . . . . . . . . . . . . . 45
3.3 Final results . . . . . . . . . . . . . . . . . . . . . . . . . . . . . . . . . . . 47
4 Subsonic Emission Method during LTO and CCD 494.1 Calculation of the quantity of emissions . . . . . . . . . . . . . . . . . . . . 494.2 Fuel Flow Method 2 . . . . . . . . . . . . . . . . . . . . . . . . . . . . . . 51
4.2.1 Methodology . . . . . . . . . . . . . . . . . . . . . . . . . . . . . . 56
3
4.2.2 Matlab Code . . . . . . . . . . . . . . . . . . . . . . . . . . . . . . 574.3 Fuel Flow Method for LH2 combustion . . . . . . . . . . . . . . . . . . . . 59
5 Hypersonic flight 635.1 Ramjet . . . . . . . . . . . . . . . . . . . . . . . . . . . . . . . . . . . . . . 645.2 Scramjet . . . . . . . . . . . . . . . . . . . . . . . . . . . . . . . . . . . . . 665.3 Air Turbo Ramjet (ATR) . . . . . . . . . . . . . . . . . . . . . . . . . . . 68
5.3.1 LACE . . . . . . . . . . . . . . . . . . . . . . . . . . . . . . . . . . 705.3.2 SABRE . . . . . . . . . . . . . . . . . . . . . . . . . . . . . . . . . 71
6 Supersonic emission method 736.1 Modifications to the subsonic method . . . . . . . . . . . . . . . . . . . . . 73
7 Application of supersonic emission method 777.1 Emissions during supersonic mission . . . . . . . . . . . . . . . . . . . . . 817.2 Comparison between Stratofly and A380 . . . . . . . . . . . . . . . . . . . 82
8 Conclusions 87
Bibliography 89
4
Chapter 1
Aviation and Environment
1.1 Actual situationThe growth of air traffic is having an increasing environmental impact. Concerns aboutclimate change are also increasing, and aviation is expected to contain the growth of itscarbon footprint in the context of the global efforts to reduce CO2 emissions.
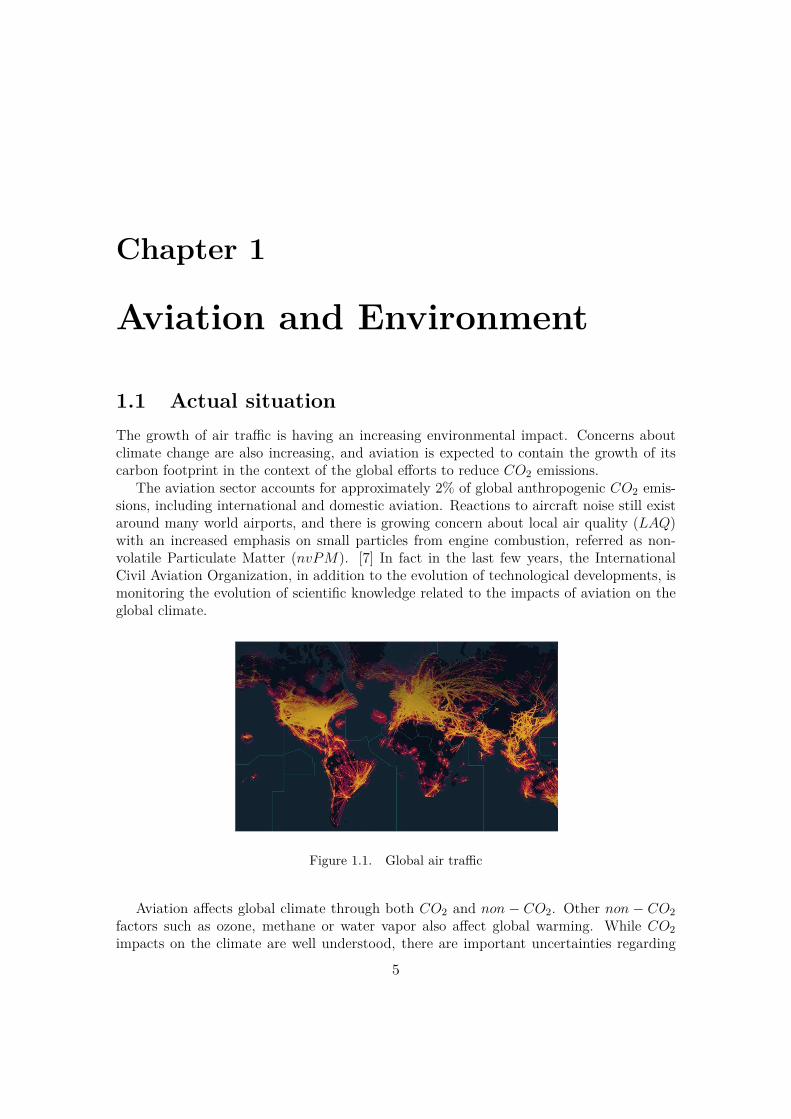
The aviation sector accounts for approximately 2% of global anthropogenic CO2 emis-sions, including international and domestic aviation. Reactions to aircraft noise still existaround many world airports, and there is growing concern about local air quality (LAQ)with an increased emphasis on small particles from engine combustion, referred as non-volatile Particulate Matter (nvPM). [7] In fact in the last few years, the InternationalCivil Aviation Organization, in addition to the evolution of technological developments, ismonitoring the evolution of scientific knowledge related to the impacts of aviation on theglobal climate.
Figure 1.1. Global air traffic
Aviation affects global climate through both CO2 and non − CO2. Other non − CO2factors such as ozone, methane or water vapor also affect global warming. While CO2impacts on the climate are well understood, there are important uncertainties regarding
5
1 – Aviation and Environment
some of the non−CO2 impacts and the underlying physical processes. That is why, since1997, ICAO has requested scientific institutions to further investigate these effects in orderto develop appropriate measures.[7]
This resulted in the publication of the “IPCC Aviation and the Global Atmosphere re-port” in 1999, which provided the scientific basis for impacts of aviation on global climateand highlighted the state of understanding, the aviation technology and the socio-economicissues associated with aviation. Twenty years after the publication of this report, theseestimates of aviation climate changing could be enhanced by a new international scientificassessment. In the absence of such report, in order to update and strengthen the scien-tific base, the information contained in the IPCC 1999 report is being supplemented bythe work carried out by ICAO and the Committee for Aviation Environmental Protection(CAEP).
For climate change, the primary concerns are emissions of CO2, NOx and nvPM . Alsoof concern are persistent contrails which lead to cirrus clouds when the atmosphere isice-super-saturated. A significant complication arises because the emissions (or their sub-sequent transformations) have different residence times in the atmosphere.
CO2 is of particular concern because of its exceptionally long residence time (thousandsof years). Although nvPM is implicated in cloud formation, the processes are less wellunderstood. Contrails, leading to cirrus clouds and aircraft induced cloudiness, have largeenvironmental impacts but have short life (hours). There is high confidence in the esti-mation of global warming due to CO2 whereas for all other emissions there is a significantlevel of uncertainty which has to be reduced.
Optimization of air traffic management and operational procedures is a key element toavoid greenhouse gas emissions from aviation. The Global Air Navigation Plan (GANP )and the Aviation System Block Upgrades (ASBUs) are major initiatives developed byICAO to that end. The GANP is a strategy to achieve a global interoperable air naviga-tion system, that is directed to all users during all phases of flight. It meets agreed levels
6
1.2 – Local Air Quality: LAQ
of safety, provides for optimum economic operations, is environmentally sustainable andmeets national security requirements. The ASBUs provide a roadmap to assist air naviga-tion service providers in the development of their individual strategic plans and investmentdecisions.
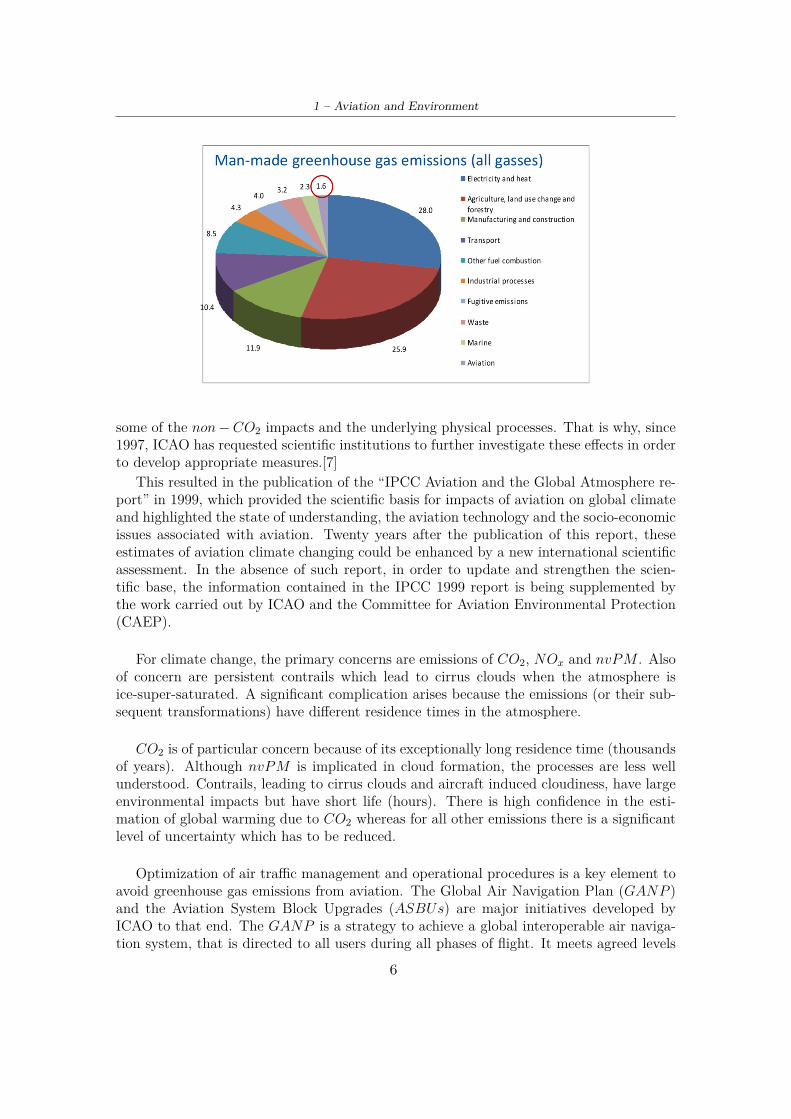
Also Sustainable Aviation Fuels (SAF ) have an important role in reducing CO2 emis-sions from aviation. They are an important element of ICAO’s measures to mitigate climatechange. [7]
Figure 1.2. Contribution of measures for reducing international aviation net CO2 emissions
1.2 Local Air Quality: LAQOne of ICAO’s environmental goals is to limit or reduce the impact of aviation emissions onlocal air quality (LAQ). Starting the late 1970s, ICAO has been performing measurementsof emissions generated by aircraft engines in the proximity of the airport and by relevantairport sources. The Volume II of Annex 16 to the Convention on International CivilAviation contains Standards for aircraft engine emissions and is accompanied by the relatedguidance material and technical documentation. Following the latest successful adoptionof the CAEP/10 nvPM Standard based on visibility criterion, CAEP/11 agreed on nvPMmass and number Standard, moving it towards consideration for adoption by the ICAOCouncil in the next year. ICAO provisions on LAQ also address liquid fuel venting, smoke(which is expected to be superseded by the nvPM Standard), and the main gaseous exhaustemissions from jet engines, namely: hydrocarbons (HC), oxides of nitrogen (NOx), carbonmonoxide (CO). [7]
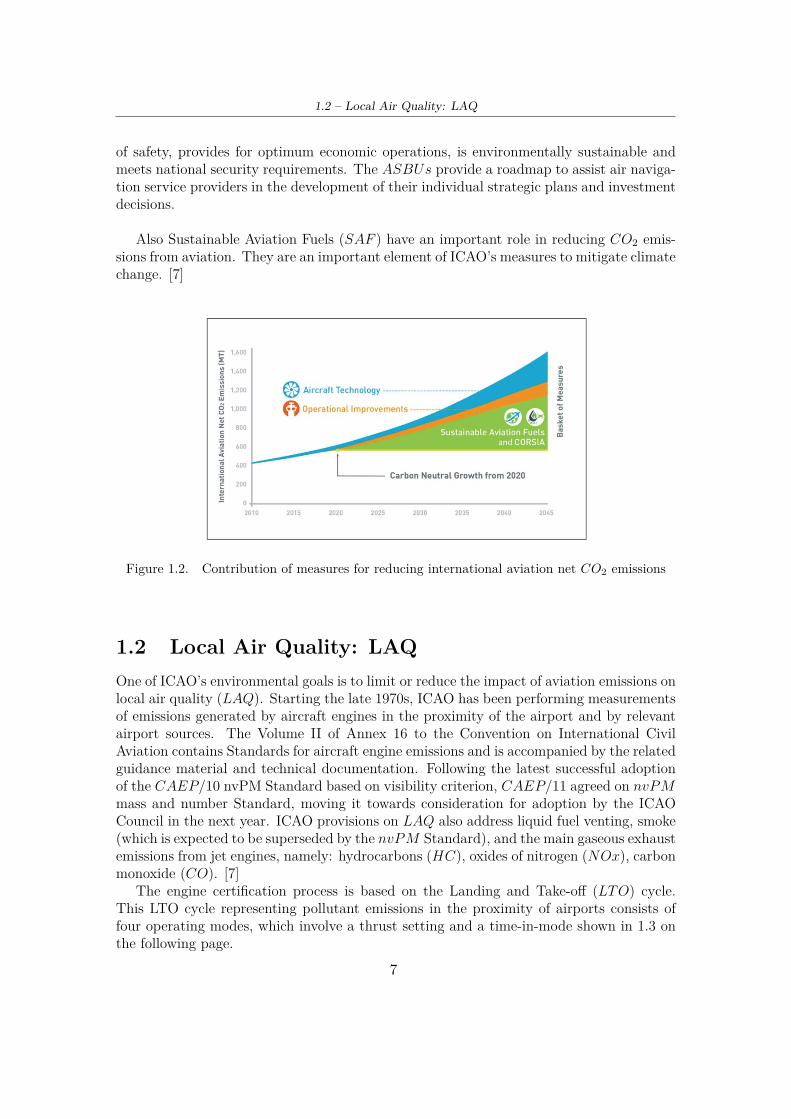
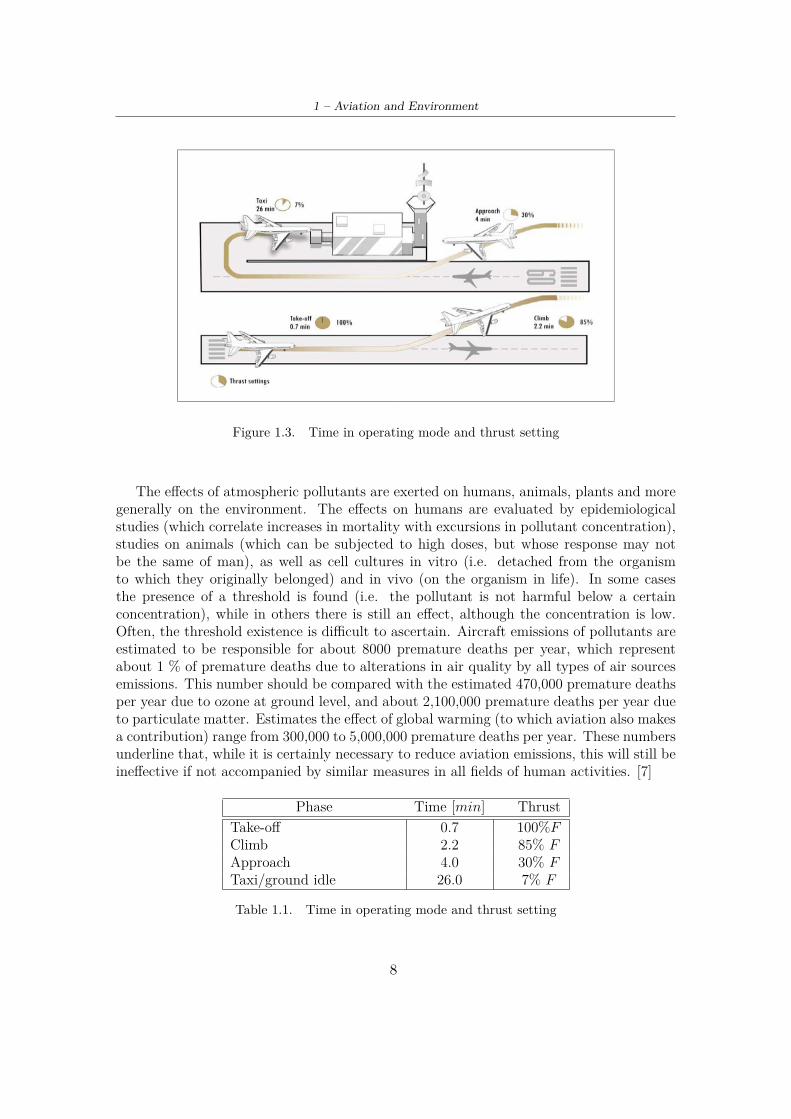
The engine certification process is based on the Landing and Take-off (LTO) cycle.This LTO cycle representing pollutant emissions in the proximity of airports consists offour operating modes, which involve a thrust setting and a time-in-mode shown in 1.3 onthe following page.
7
1 – Aviation and Environment
Figure 1.3. Time in operating mode and thrust setting
The effects of atmospheric pollutants are exerted on humans, animals, plants and moregenerally on the environment. The effects on humans are evaluated by epidemiologicalstudies (which correlate increases in mortality with excursions in pollutant concentration),studies on animals (which can be subjected to high doses, but whose response may notbe the same of man), as well as cell cultures in vitro (i.e. detached from the organismto which they originally belonged) and in vivo (on the organism in life). In some casesthe presence of a threshold is found (i.e. the pollutant is not harmful below a certainconcentration), while in others there is still an effect, although the concentration is low.Often, the threshold existence is difficult to ascertain. Aircraft emissions of pollutants areestimated to be responsible for about 8000 premature deaths per year, which representabout 1 % of premature deaths due to alterations in air quality by all types of air sourcesemissions. This number should be compared with the estimated 470,000 premature deathsper year due to ozone at ground level, and about 2,100,000 premature deaths per year dueto particulate matter. Estimates the effect of global warming (to which aviation also makesa contribution) range from 300,000 to 5,000,000 premature deaths per year. These numbersunderline that, while it is certainly necessary to reduce aviation emissions, this will still beineffective if not accompanied by similar measures in all fields of human activities. [7]
Phase Time [min] ThrustTake-off 0.7 100%FClimb 2.2 85% FApproach 4.0 30% FTaxi/ground idle 26.0 7% F
Table 1.1. Time in operating mode and thrust setting
8
1.3 – Polluting emissions: Status and Reduction
1.3 Polluting emissions: Status and Reduction
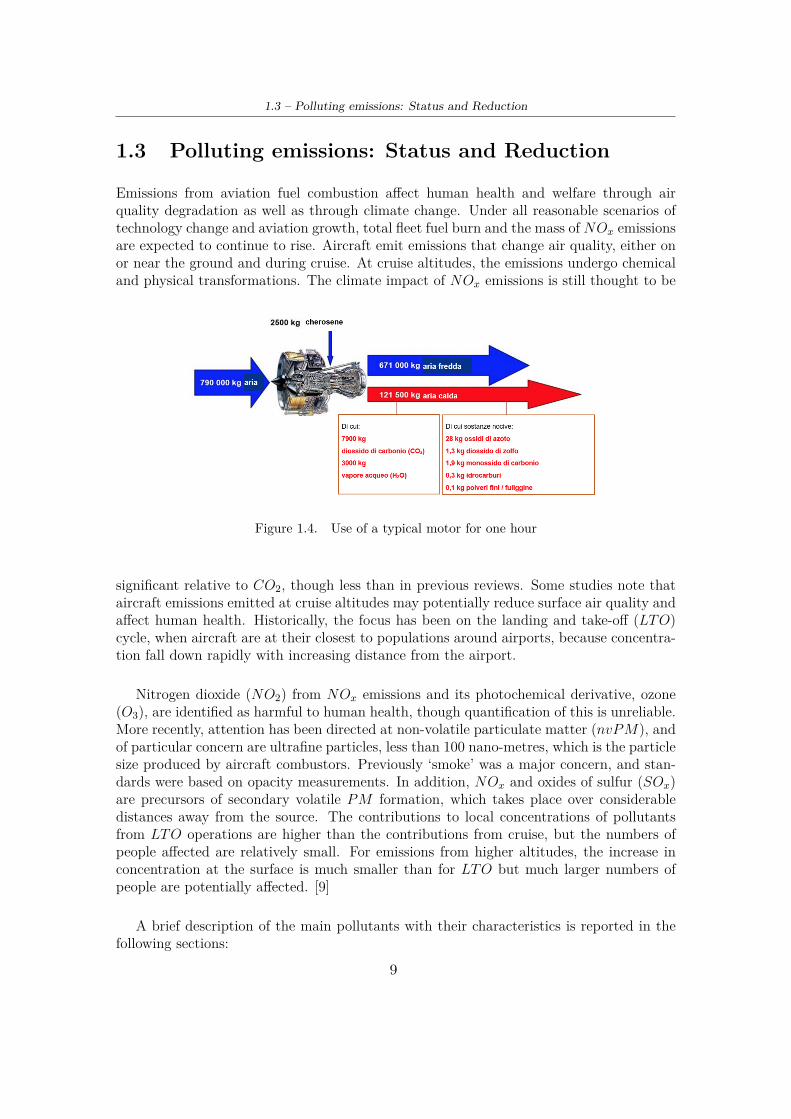
Emissions from aviation fuel combustion affect human health and welfare through airquality degradation as well as through climate change. Under all reasonable scenarios oftechnology change and aviation growth, total fleet fuel burn and the mass of NOx emissionsare expected to continue to rise. Aircraft emit emissions that change air quality, either onor near the ground and during cruise. At cruise altitudes, the emissions undergo chemicaland physical transformations. The climate impact of NOx emissions is still thought to be
Figure 1.4. Use of a typical motor for one hour
significant relative to CO2, though less than in previous reviews. Some studies note thataircraft emissions emitted at cruise altitudes may potentially reduce surface air quality andaffect human health. Historically, the focus has been on the landing and take-off (LTO)cycle, when aircraft are at their closest to populations around airports, because concentra-tion fall down rapidly with increasing distance from the airport.
Nitrogen dioxide (NO2) from NOx emissions and its photochemical derivative, ozone(O3), are identified as harmful to human health, though quantification of this is unreliable.More recently, attention has been directed at non-volatile particulate matter (nvPM), andof particular concern are ultrafine particles, less than 100 nano-metres, which is the particlesize produced by aircraft combustors. Previously ‘smoke’ was a major concern, and stan-dards were based on opacity measurements. In addition, NOx and oxides of sulfur (SOx)are precursors of secondary volatile PM formation, which takes place over considerabledistances away from the source. The contributions to local concentrations of pollutantsfrom LTO operations are higher than the contributions from cruise, but the numbers ofpeople affected are relatively small. For emissions from higher altitudes, the increase inconcentration at the surface is much smaller than for LTO but much larger numbers ofpeople are potentially affected. [9]
A brief description of the main pollutants with their characteristics is reported in thefollowing sections:
9
1 – Aviation and Environment
1.3.1 CO
Carbon monoxide has a very strong affinity for blood hemoglobin, 220 times stronger thanoxygen, causing the formation of carboxyhemoglobin. When the concentration of COexceeds the very low background atmospheric values (i.e. measured far from sources ofpollution), as can happen indoors, in the city (due to vehicular traffic), or in the proxim-ity of airports, it leads to non-negligible concentrations of carboxyhemoglobin (unable tocarry oxygen) in the blood. It can be lethal for prolonged exposure (8 hours), already forconcentrations of carbon monoxide in the air XCO= 0.02 %. [5]
The background concentration of CO is higher in the northern hemisphere, around 120ppb, where there are most of the emissions. In the southern hemisphere, lower valuesare recorded (50 - 60 ppb). Since the average life relatively short; around 0.2 years,this amount is largely destroyed by natural processes before its concentration can becomeuniform throughout the earth’s atmosphere. The concentration in cities, near airports andin closed environments can be much higher and therefore be dangerous.
1.3.2 CO2
The contaminants CO2, CH4, N2O and others contribute to the greenhouse effect, whilethe nitrogen oxides NOx and also the N2O contribute to the depletion of the stratosphericozone layer.Nowadays, CO2 emissions are the most understood and the most popular way to measurethe aviation impact on climate. Aircraft combustion engines emit 3.15 kilograms of CO2for every kilogram of kerosene burned in flight. This CO2 remains in the upper atmospherefor 50 to 100 years. [10]
To calculate the emissions of CO2 the following formula is used:
CO2 = (1/SAR)AV G(RFG)0.24
The 1/SAR value is established according to the 3 possible masses of the aircraft:
• high gross mass: 92%MTOM
• simple arithmetich average of high gross mass and low gross
• low gross mass: (0.45MTOM) + (0.63MTOM0.924)
The following symbols appear in this formula: SAR is the specific air range (km/kg),AV G is the average, and RFG is the reference geometric factor.
The CO2 emissions should not exceed the defined value. For airplanes with a maximumtake-off mass less than or equal to 60 000kg, maximum permitted value is
10−2.7378+(0.68131log(MTOM))+(−0.0277861(log(MTOM))2 . For the airplane with a maximumtake-off mass greater than 60 000 kg, and less than or equal to 70 395 kg, maximumpermitted value is 0.764. [10]
The maximum permitted value for airplanes with take-off mass greater than 70 395 kgis 10−1.412742+(−0.020517log(MTOM))+(0.0593831(log(MTOM))2
10
1.3 – Polluting emissions: Status and Reduction
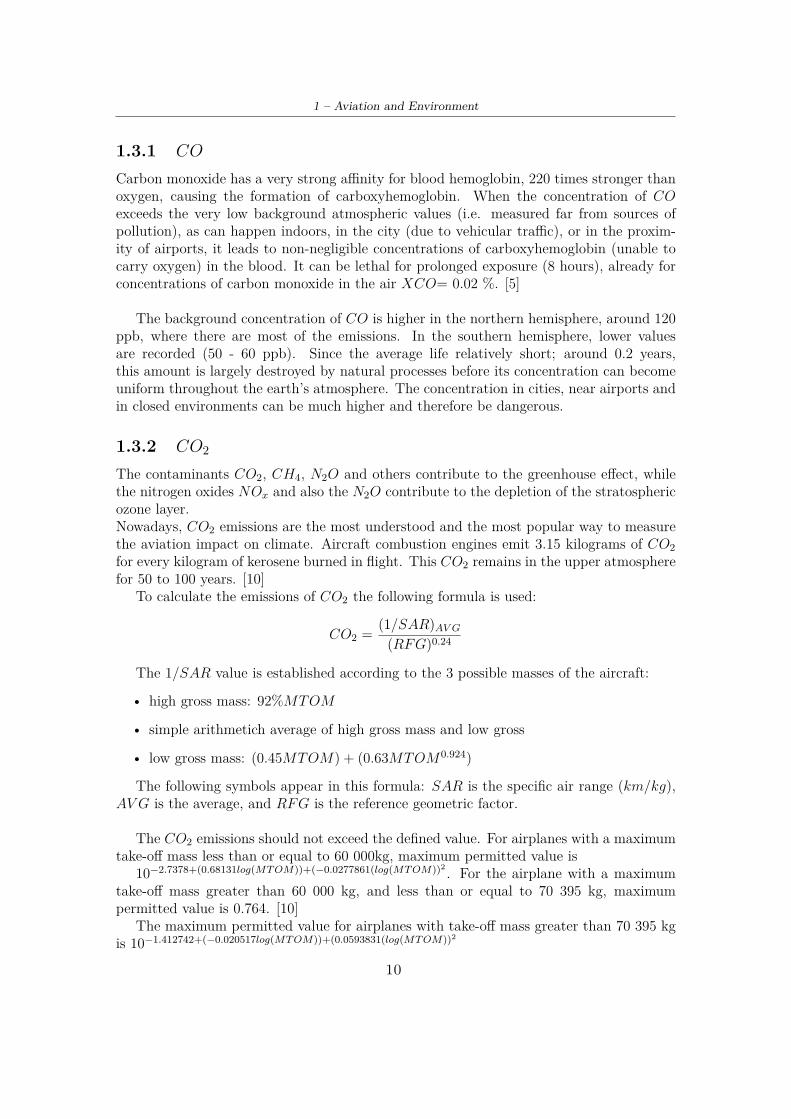
Figure 1.5. Emissions of CO2 pro capite
1.3.3 NOx
Nitrogen oxides are the other (in addition to SOx) main contributor to acid rain (contribut-ing for about 25 - 30 % of the total, as nitrogen dioxide NO2, in contact with humidity air,generates nitric acid). They are respiratory irritants (in particular nitrogen dioxide NO2 isalready detected in a concentration of about 1 ppb in unpolluted air), and promote, in thepresence of hydrocarbons in the air, the formation at ground level of ozone and secondaryparticles. They also promote the depletion of the stratospheric ozone layer (but it mustbe said that CFCs - chlorofluorocarbons are much more harmful), and nitrous oxide N2Ois also a powerful greenhouse gas. [5]
1.3.4 H2O
The effect of clouds on heating is twofold: on the one hand they reflect the incident sunlightduring the day, thus decreasing the fraction that reaches the ground, on the other handthey retain part of the outgoing infrared radiation at night. For low-altitude clouds, thefirst effect prevails over the second, thus leading to cooling.
As for the contrails, it was recently ascertained (based on the climatic trends recordedin the United States in the days immediately following the attacks of 11 September 2001,when the airspace was closed for several days) that the the resulting balance determinesa positive contribution to the growth of the earth’s temperature, thus contributing to thegreenhouse effect. In particular, it was verified that in those days the diurnal temperatureexcursion (difference between the maximum and minimum daily temperatures) was about1.1 ◦ C wider than normal (precisely because the absence of contrails determined highermaximum temperatures during the day, and lower minimum temperatures at night). Tounderstand the effect of this increased excursion on global warming, it is necessary to con-sider that the power of the radiation emitted per unit of surface from the Earth (thereforeoutgoing) is proportional to σT 4, where σ = 5.67 · 10−8 W
(m2K4) is the Stefan–Boltzmannconstant, and T the value of the local terrestrial (absolute) temperature. Due to the non-linearity of this relationship, the positive temperature peaks determine an increase in the
11
1 – Aviation and Environment
radiative flux outgoing from the Earth ∆(σT 4)+ in an absolute value greater than the re-duction ∆(σT 4)− which occurs in correspondence to negative peaks, with the consequencethat the net flow out of the Earth is greater as the diurnal temperature excursion increases.The presence of contrails, reducing the diurnal temperature range, therefore reduces theheat flow out of the Earth, thus aggravating global warming. [5]
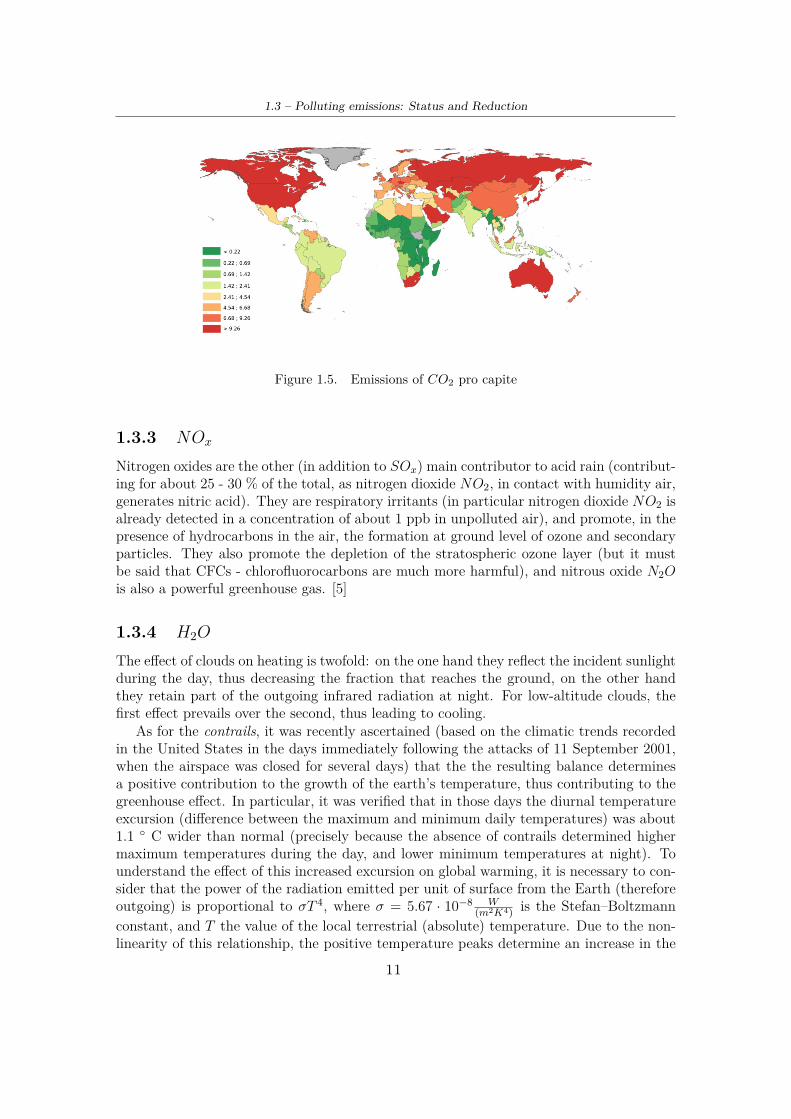
Figure 1.6. Global warming
It has been estimated that the contribution of contrails to global warming is approxi-mately 1.1 % of the total, which must be added to the contribution of 2 % of carbon dioxideemissions from aircraft engines. This could lead to an increase in terrestrial temperatureof an entity estimated between 0.01 and 0.1 degrees Celsius per decade (this wide field ofuncertainty is indicative of the still incomplete understanding of the phenomenon).
To limit the contrails and their negative effects, the aircraft’s cruise flight altitude couldbe adjusted. In particular, it has been found that it would be necessary to increase it atmedium latitudes (in order to fly in drier air), and instead reduce it near the tropics(in order to fly where the air is warmer), but both these options pose problems. Flyingat higher altitudes means flying where the ozone concentration is higher, resulting in agreater effect of NOx emissions from engines. Flying at lower altitudes would lead togreater crowding of low-altitude airways, with consequent traffic control problems. Amuch less penalizing approach would be to reduce the flight altitude only when weatherconditions favorable to the persistence of the contrails occur, or to avoid crossing areaswhere conditions favorable to persistence exist. However, this presupposes a real-timemonitoring of weather conditions, and a consequent redefinition of the airways as a functionof them, still posing significant problems to air traffic management. We could then, in
12
1.4 – Noise
theory, concentrate the flights in the periods of the day less favorable to the formationof contrails (sunrise / sunset), but this obviously would limit in an unacceptable way theproductivity of an airplane, as well as being inapplicable for long routes. It has also beenthought to break up the ice crystals of the contrails by means of microwave or ultrasound,but these studies are still in its infancy.[1]
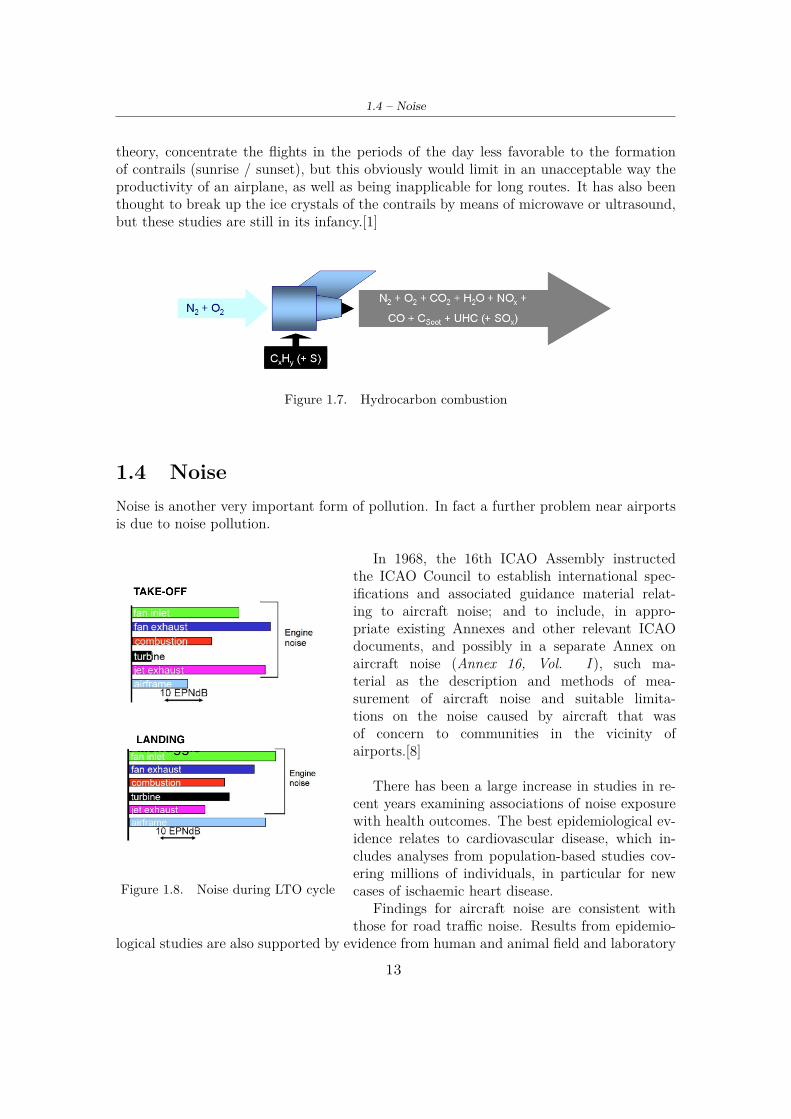
Figure 1.7. Hydrocarbon combustion
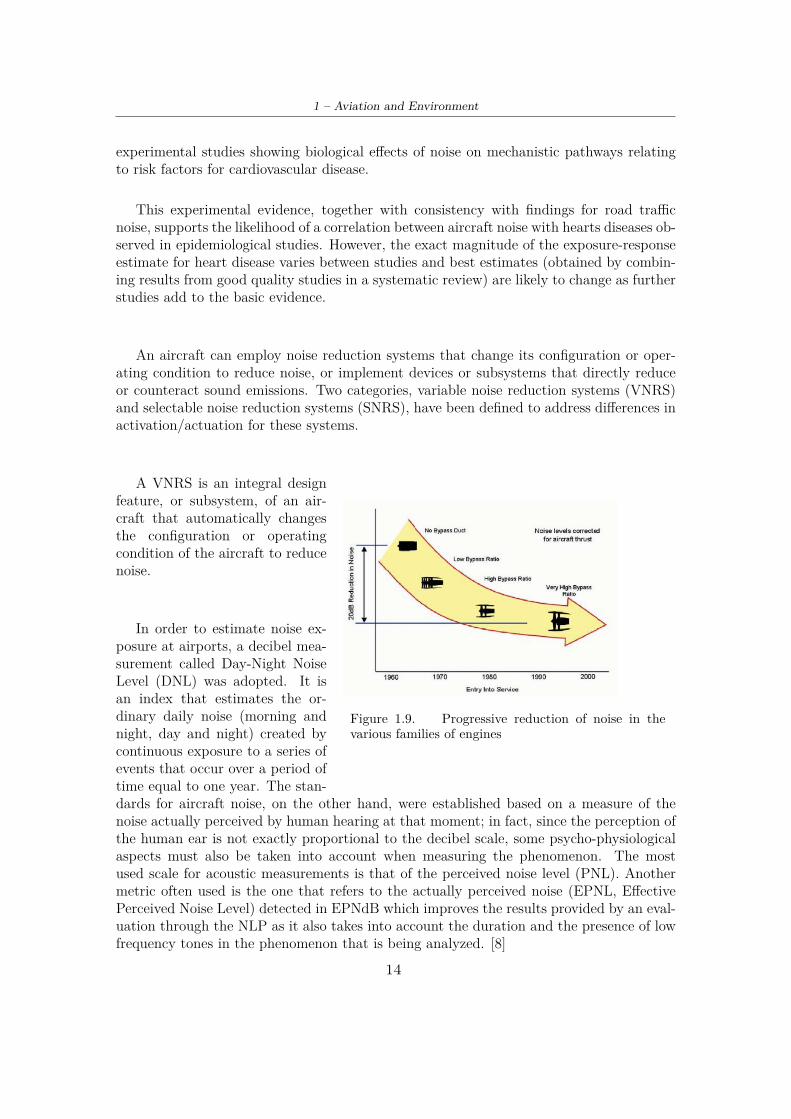
1.4 NoiseNoise is another very important form of pollution. In fact a further problem near airportsis due to noise pollution.
Figure 1.8. Noise during LTO cycle
In 1968, the 16th ICAO Assembly instructedthe ICAO Council to establish international spec-ifications and associated guidance material relat-ing to aircraft noise; and to include, in appro-priate existing Annexes and other relevant ICAOdocuments, and possibly in a separate Annex onaircraft noise (Annex 16, Vol. I ), such ma-terial as the description and methods of mea-surement of aircraft noise and suitable limita-tions on the noise caused by aircraft that wasof concern to communities in the vicinity ofairports.[8]
There has been a large increase in studies in re-cent years examining associations of noise exposurewith health outcomes. The best epidemiological ev-idence relates to cardiovascular disease, which in-cludes analyses from population-based studies cov-ering millions of individuals, in particular for newcases of ischaemic heart disease.
Findings for aircraft noise are consistent withthose for road traffic noise. Results from epidemio-
logical studies are also supported by evidence from human and animal field and laboratory
13
1 – Aviation and Environment
experimental studies showing biological effects of noise on mechanistic pathways relatingto risk factors for cardiovascular disease.
This experimental evidence, together with consistency with findings for road trafficnoise, supports the likelihood of a correlation between aircraft noise with hearts diseases ob-served in epidemiological studies. However, the exact magnitude of the exposure-responseestimate for heart disease varies between studies and best estimates (obtained by combin-ing results from good quality studies in a systematic review) are likely to change as furtherstudies add to the basic evidence.
An aircraft can employ noise reduction systems that change its configuration or oper-ating condition to reduce noise, or implement devices or subsystems that directly reduceor counteract sound emissions. Two categories, variable noise reduction systems (VNRS)and selectable noise reduction systems (SNRS), have been defined to address differences inactivation/actuation for these systems.
Figure 1.9. Progressive reduction of noise in thevarious families of engines
A VNRS is an integral designfeature, or subsystem, of an air-craft that automatically changesthe configuration or operatingcondition of the aircraft to reducenoise.
In order to estimate noise ex-posure at airports, a decibel mea-surement called Day-Night NoiseLevel (DNL) was adopted. It isan index that estimates the or-dinary daily noise (morning andnight, day and night) created bycontinuous exposure to a series ofevents that occur over a period oftime equal to one year. The stan-dards for aircraft noise, on the other hand, were established based on a measure of thenoise actually perceived by human hearing at that moment; in fact, since the perception ofthe human ear is not exactly proportional to the decibel scale, some psycho-physiologicalaspects must also be taken into account when measuring the phenomenon. The mostused scale for acoustic measurements is that of the perceived noise level (PNL). Anothermetric often used is the one that refers to the actually perceived noise (EPNL, EffectivePerceived Noise Level) detected in EPNdB which improves the results provided by an eval-uation through the NLP as it also takes into account the duration and the presence of lowfrequency tones in the phenomenon that is being analyzed. [8]
14
1.5 – Sustainable Aviation Fuel and hydrogen fuel
1.5 Sustainable Aviation Fuel and hydrogen fuel
Sustainable aviation fuels (SAF) are one element of the ICAO basket of measures to re-duce aviation emissions, which also includes technology and standards, operational im-provements, and the Carbon Offsetting and Reduction Scheme for International Aviation(CORSIA).
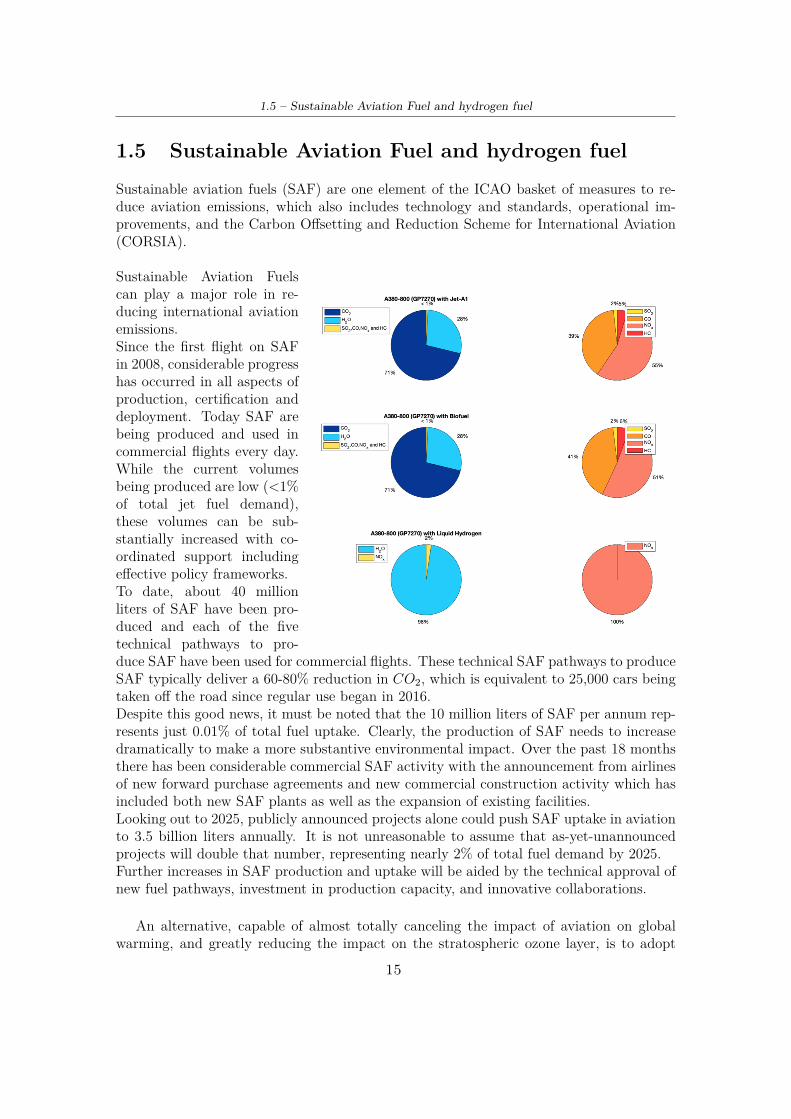
Sustainable Aviation Fuelscan play a major role in re-ducing international aviationemissions.Since the first flight on SAFin 2008, considerable progresshas occurred in all aspects ofproduction, certification anddeployment. Today SAF arebeing produced and used incommercial flights every day.While the current volumesbeing produced are low (<1%of total jet fuel demand),these volumes can be sub-stantially increased with co-ordinated support includingeffective policy frameworks.To date, about 40 millionliters of SAF have been pro-duced and each of the fivetechnical pathways to pro-duce SAF have been used for commercial flights. These technical SAF pathways to produceSAF typically deliver a 60-80% reduction in CO2, which is equivalent to 25,000 cars beingtaken off the road since regular use began in 2016.Despite this good news, it must be noted that the 10 million liters of SAF per annum rep-resents just 0.01% of total fuel uptake. Clearly, the production of SAF needs to increasedramatically to make a more substantive environmental impact. Over the past 18 monthsthere has been considerable commercial SAF activity with the announcement from airlinesof new forward purchase agreements and new commercial construction activity which hasincluded both new SAF plants as well as the expansion of existing facilities.Looking out to 2025, publicly announced projects alone could push SAF uptake in aviationto 3.5 billion liters annually. It is not unreasonable to assume that as-yet-unannouncedprojects will double that number, representing nearly 2% of total fuel demand by 2025.Further increases in SAF production and uptake will be aided by the technical approval ofnew fuel pathways, investment in production capacity, and innovative collaborations.
An alternative, capable of almost totally canceling the impact of aviation on globalwarming, and greatly reducing the impact on the stratospheric ozone layer, is to adopt
15
1 – Aviation and Environment
hydrogen as fuel instead of kerosene. Since there is no carbon in the fuel, carbon diox-ide emissions would be totally eliminated. However, the use of hydrogen poses severalproblems. The hydrogen low density leads to a somewhat lower energy release per unitof volume, thus requiring more tanks bulky, for releasing energy per unit of mass equalto about 2.8 times that of kerosene. Assuming that hydrogen is stored on board in liquidform, therefore in the cryogenic state (which means, at atmospheric pressure, at tempera-tures of no more than 20 K, or -253 ◦C), its density would be just 71 kg/m3 (compared toabout 800 kg/m3 for kerosene), so the energy density per unit of volume is 3.9 times lowerthan that of kerosene. This therefore requires very bulky tanks (therefore heavy, whichcause an increase in the wet surface of the aircraft, resulting in greater aerodynamic drag);the problem is accentuated by the need to provide thermal insulation around the tanks(and also to the fuel lines). The tanks can then be subjected to an stress due to the factthat it is desirable to keep the pressure inside the tanks at an approximately atmosphericvalue, instead of letting it drop to the ambient value at high altitude (because the boilingtemperature of liquid hydrogen drops further as pressure decreases). The tank walls musttherefore resist the difference between internal and external pressure, which implies theneed to adopt thicker, therefore heavier, walls. These bulky tanks could be placed at thetop of the fuselage. [3]
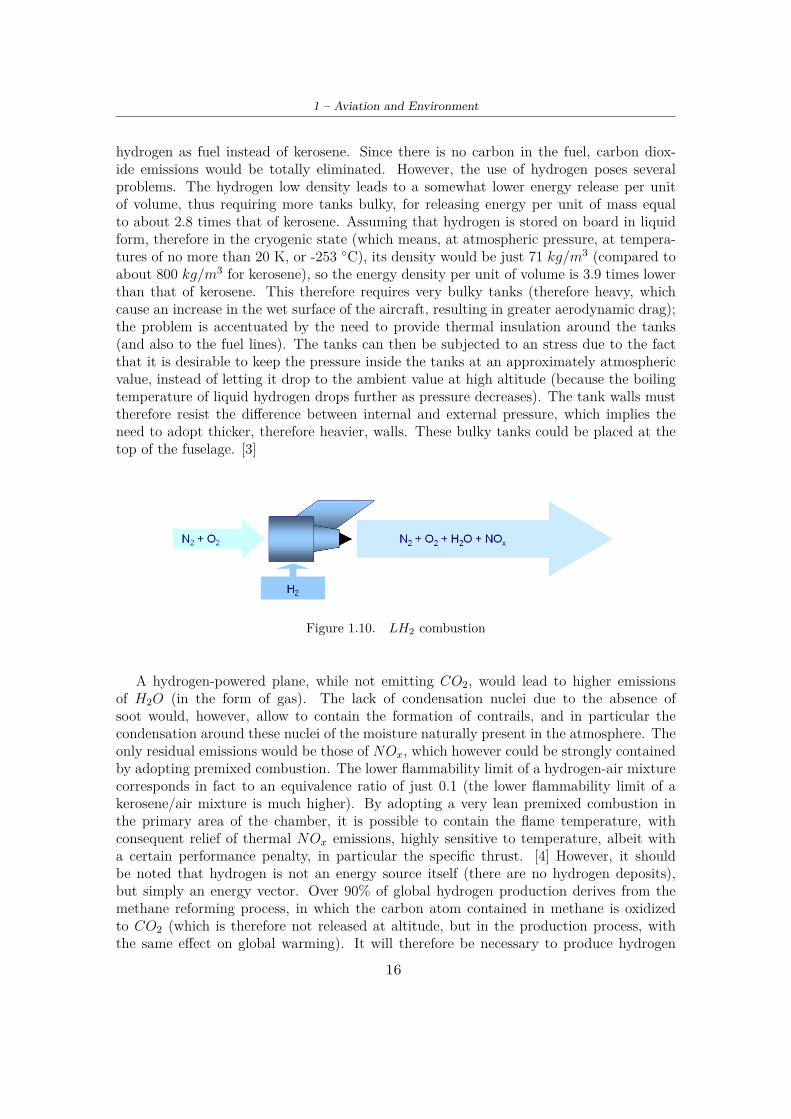
Figure 1.10. LH2 combustion
A hydrogen-powered plane, while not emitting CO2, would lead to higher emissionsof H2O (in the form of gas). The lack of condensation nuclei due to the absence ofsoot would, however, allow to contain the formation of contrails, and in particular thecondensation around these nuclei of the moisture naturally present in the atmosphere. Theonly residual emissions would be those of NOx, which however could be strongly containedby adopting premixed combustion. The lower flammability limit of a hydrogen-air mixturecorresponds in fact to an equivalence ratio of just 0.1 (the lower flammability limit of akerosene/air mixture is much higher). By adopting a very lean premixed combustion inthe primary area of the chamber, it is possible to contain the flame temperature, withconsequent relief of thermal NOx emissions, highly sensitive to temperature, albeit witha certain performance penalty, in particular the specific thrust. [4] However, it shouldbe noted that hydrogen is not an energy source itself (there are no hydrogen deposits),but simply an energy vector. Over 90% of global hydrogen production derives from themethane reforming process, in which the carbon atom contained in methane is oxidizedto CO2 (which is therefore not released at altitude, but in the production process, withthe same effect on global warming). It will therefore be necessary to produce hydrogen
16
1.5 – Sustainable Aviation Fuel and hydrogen fuel
through electrolysis of water (which produces only hydrogen and oxygen), using electricityproduced from renewable sources (ie not from the combustion of fossil fuels). It shouldalso be noted that the production of liquid hydrogen is about 170 t/d in the USA, 19 t/din Europe, while only for intra-European flights it would be necessary, assuming that theentire air fleet was converted hydrogen, 30,000 t/d. It is therefore necessary to provide foradequate infrastructures, which include in particular plants for the production of hydrogenby electrolysis near airports. [3]
1.5.1 Infrastructure requirements for hydrogen fuelSustainable and environmentally friendly production processes including photolysis, elec-trolysis and biomass gasification are being developed and will produce ‘green hydrogen’within the coming decades. Furthermore Munich Airport has built and proven, on a small-scale, that a hydrogen based infrastructure at an airport can run efficiently and affordably.Combined with innovative and currently working solutions for the transport of hydrogen,during the period from 2025 to 2040, a smooth transition to liquid hydrogen compatibleairports and aircraft is expected. Twenty to thirty years will be needed to build prototypeaircraft that can fully test a liquid hydrogen fuel and powerplant system. Overall thereare two main requirements for a successful implementation of this concept: the aircraftand airport must work on liquid hydrogen and the total cost must not be any higher thanflying with kerosene. [2]
Beyond the implications for aircraft design discussed in the next chapters, switching toLH2 would have major implications for the fuel supply chain, airport infrastructure andoperations, and the air travel system as a whole.
In order to analyze the required infrastructure, we consider two scenarios for aircraftdeployment.In the efficient decarbonization scenario; hydrogen plays a role where it is the most costefficient means of decarbonization. In this scenario, aircraft up to medium-range will startto be replaced with hydrogen aircraft by 2030-2040, representing the earliest potentialentry into service dates of aircraft in each segment. After a ramp up of manufacturingcapacity over three to four years, all new aircraft in commuter and short-range and 50%of medium-range aircraft would be powered by hydrogen. In this scenario, 40 percent ofall aircraft are switched to LH2 by 2050, while the remainder would be powered by othersustainable aviation fuels like synfuel and/or biofuels. [2]In amaximum decarbonization scenario; hydrogen aircraft would start to replace all aircraftfor ranges of up to 10,000 kilometers after 2028-2038, representing the first conceivableentry-into-service dates with ambitious assumptions. After a ramp-up of manufacturingcapacity over three to four years, all new aircraft up to a 10,000 km range would be poweredby hydrogen. In this scenario, 60 percent of all aircraft are switched to LH2 by 2050, andthe rest would be powered by synfuel and/or biofuels.In these two scenarios, the global demand for hydrogen would reach approximately 10 or40 million tons of LH2 by 2040 per annum, and approximately 40 or 130 million tons by2050. [1]
In the early years, given the amount of refueling required and the primary focus on
17
1 – Aviation and Environment
regional airports – which already often use refueling trucks – a major overhaul of therefueling infrastructure at airports is not likely to be needed. The number of refuelingtrucks required is roughly double the number needed for kerosene or synfuel but comprisesonly a small share of the total existing refueling fleet in this time frame, so the implicationson ground traffic would be limited. These LH2 refueling trucks are very different to existingrefueling trucks and would require a different training and a safety assurance framework foroperations, but these are manageable challenges to overcome. In addition, refueling timeswould likely stay within the required turnaround times of shorter-range aircraft. LH2 hosescould attain the same flow rate in the short-term as kerosene/synfuel hoses – about 900liters per minute – if the right investments are made to accommodate the hoses’ heavierweight and lower maneuverability. Given LH2’s lower volumetric density, LH2 refuelingwould still be much slower, but if the amount of hoses were doubled from one to two, therefueling of a sample short-range airplane would take from 20 to 30 minutes, which wouldstill be within turnaround times. The major remaining question concerns safety and takingthe necessary precautions when refueling, which could potentially compromise the abilityto conduct parallel operations during the turnaround.
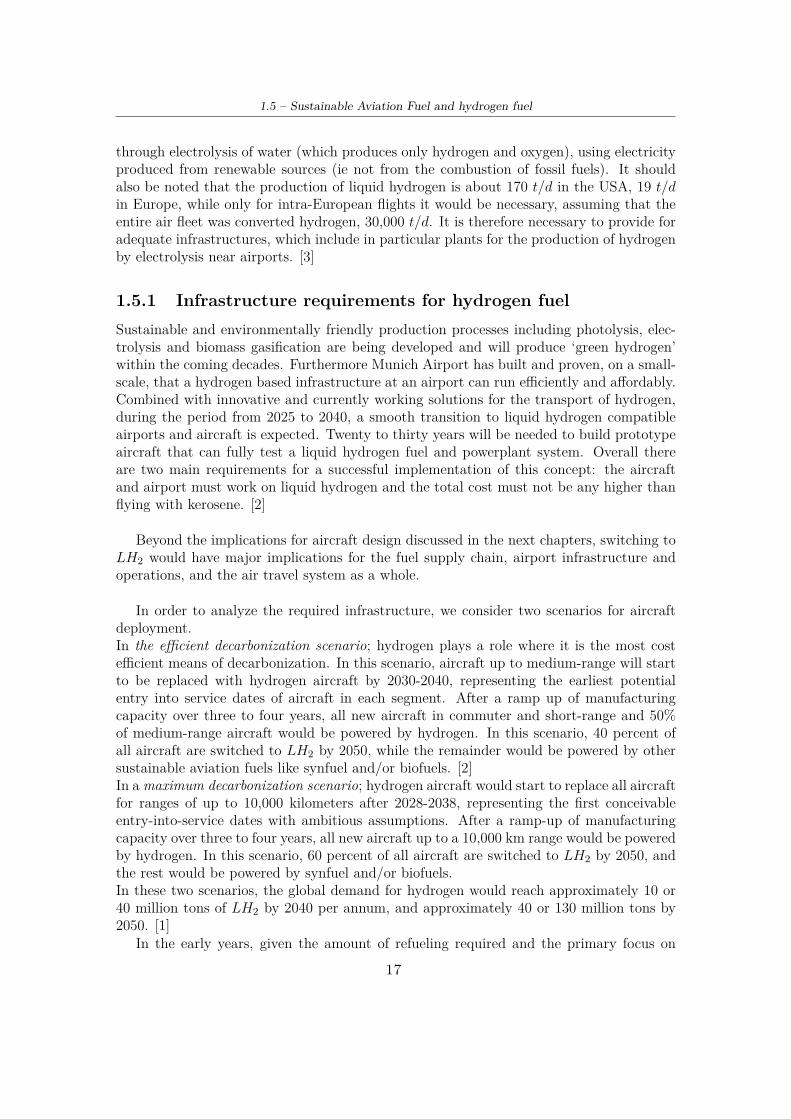
Figure 1.11. Production, distribution and use of liquid hydrogen
If LH2 is truckedin from outside, lique-faction would not haveto take place at theairport. The neededthree-day storage of LH2(around 90 tons for re-gional airports) would re-quire only limited space(about 100 square me-ters). The size of therequired safety perimeteraround this storage space– as mandated by theSEVESO Directive in theEU, which regulates haz-ardous chemicals – is notyet known, but the re-gional airports that would likely be early movers tend to have more space and mightaccommodate this additional infrastructure more easily. Finally, in early years when notall airports have an LH2 infrastructure, it is worth noting that flights that are divertedmay get stuck at an airfield waiting for LH2 resupply by truck if that airfield is not clearedfor LH2 refueling. Diversions are common across the industry, so this would be an earlystage-challenge. While these challenges exist, all in all, the technical feasibility of estab-lishing LH2 infrastructure in the early years (up to 2040 in the efficient decarbonizationscenario and 2035 in the maximum decarbonization scenario) is strong, even within theconstraints of the current infrastructure. The major challenge will likely be in ensuring therequired coordination between fuel providers, airports, aircraft manufacturers, and airlinesas they develop the new industry in tandem.
18
1.5 – Sustainable Aviation Fuel and hydrogen fuel
While supply-side challenges will be significant in 2050, they will not be unique in a fu-ture energy system that partially relies on hydrogen. The challenges affecting the airportrefueling infrastructure and operations are unique, however, and will require significantdevelopment and planning to overcome. They include searching for scalable refueling tech-nology, optimizing refueling practices, and reconfiguring airport infrastructure to introduceparallel fuel systems.
The first challenge to develop scalable refueling technologies. In many large airportstoday, hydrant pipelines are used to refuel aircraft. These pipelines could be easily adaptedto synfuel. To the contrary, by 2040 cryogenic hydrant refueling systems for LH2 seemto be cost-technically infeasible, as their cost may be as much as five times the cost ofconventional hydrant systems. Given this fact, the most viable near-term LH2 refuelingtechnology seems to be the LH2 refueling truck. These trucks work well at smaller airports,where kerosene refueling trucks are used today, but at larger airports they could greatlyincrease ground traffic and pose logistical challenges.
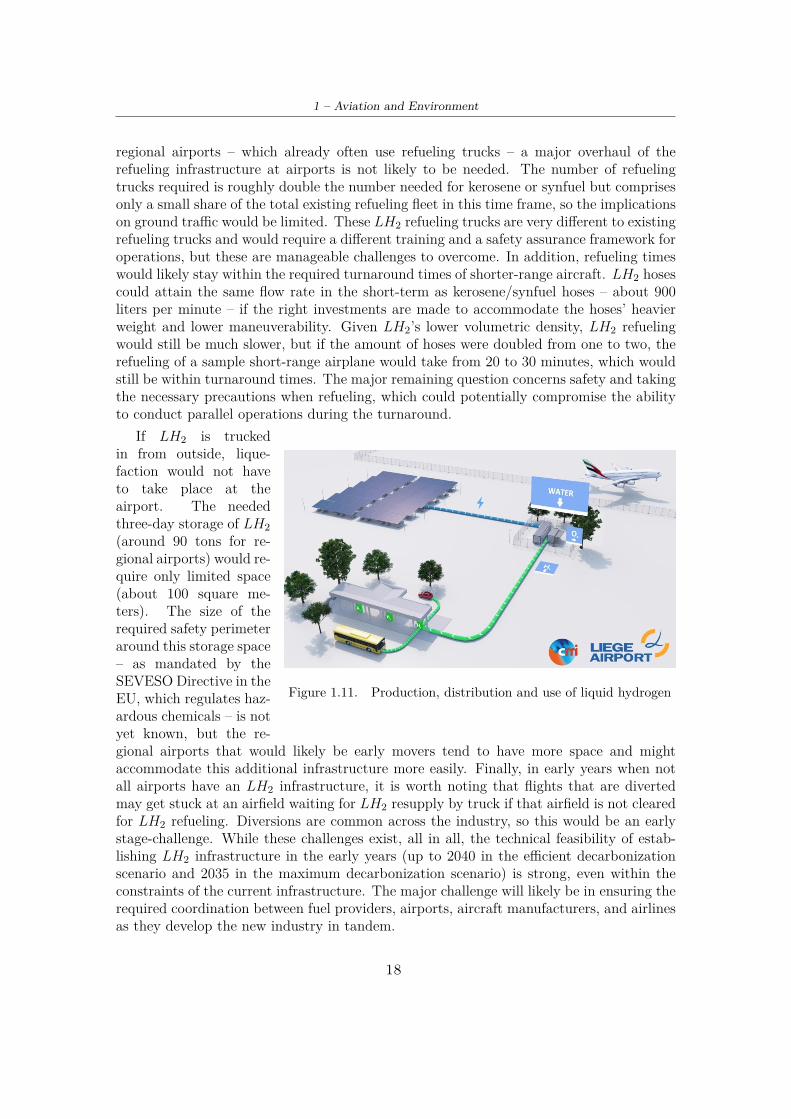
Figure 1.12. Liquid hydrogen tank
For now, the optimal solu-tion is unclear. Larger mobilerefueling platforms or evenrefueling station lots awayfrom boarding gates may bean option. The latter maysound cost-technically infea-sible given today’s requiredturnaround times but con-sidering the lengthier refuel-ing times needed for medium-and long-range LH2 aircraft,an economic case could bemade for refueling station lotsif they greatly optimize re-fueling times. In the longerterm, LH2 hydrant pipelinesystems may become a vi-able solution. Refueling prac-tices and operations will alsoneed to be reviewed. Unlike
shorter-range aircraft segments, refueling times for long-range aircraft may extend beyondtheir current standard turnaround times. For instance, if a long-range plane has a tankthat is 75 percent empty, refueling the tank with kerosene/synfuel using two hoses maytake up to 65 minutes, assuming a flow rate of 900 liters per minute per hose. Assumingthe same flow rates for LH2, even with twice as many hoses, refueling would take 140minutes. The standard turnaround time for a large jumbo jet is about 120 minutes today.Further research and development will be important to develop economic solutions to pushrefueling flow rates above 1,000 liters per minute per hose. For large aircraft refue- ling,automated tank solutions that can handle higher weights of hoses for higher refueling ratesmay even allow for flow rates at multiples of kerosene today. [2]
19
1 – Aviation and Environment
Beyond longer refueling times, it is unclear whether all or some of the usual turnaroundoperations could happen in parallel. First, doubling the amount of hoses will cause addi-tional spatial constraints around the aircraft and leave less room for other operations totake place. In addition, it is not certain which turnaround operations would be permittedfrom a regulatory and safety perspective. Experts agree that new regulations will needto be developed to ensure adequate and safe handling of low temperature LH2 and itsunique properties (for instance, the possible spontaneous ignition on contact with water,asphyxiation risk, and vertical dispersion). The impact on aspects such as ignition freezones around refueling trucks is as yet unclear. For example, some experts suggest thatthe periphery required around refueling trucks may even be smaller, as LH2 would notform a pool on the ground but rather evaporate upwards in the air. This shows that safetyconsiderations are still highly preliminary and need to be refined through further researchand on-the-ground testing.
The final challenge is to find the capacity to set up two parallel refueling systemsat busy, spatially constrained hubs. Spatial requirements are likely to be moderate; forexample, if hydrogen production happens off-site, large airports using 500 tons of LH2would need less than 25,000 square meters for liquefaction and storage equipment, orabout 0.2 percent of Heathrow’s footprint today. However, additional capacity may beneeded if refueling lots must be installed away from gates and/or gate space is locked forlonger periods due to longer refueling times. Finally, airport box sizes may not always beable to accommodate the additional 10 to 15 meters in length needed for the suggestedLH2 medium-range and long-range aircraft designs, which could potentially lead to theneed for sizable infrastructure investments. Alternatively, this could lead to constraintson aircraft gate assignments, which would further increase turnaround times and reduceoverall infrastructure flexibility. [2]
20
Chapter 2
Subsonic flight
A subsonic aircraft is an aircraft with a maximum speed that is less than the speed ofsound (Mach=1). The term technically describes an aircraft that flies below its criticalMach number, typically around Mach 0.8. All current civil aircrafts, including airliners,helicopters and airships, as well as many military types, are subsonic.
Subsonic flight is aerodynamically characterised by incompressible flow, where dynamicpressure changes due to motion through the air cause the air to flow away from areas ofhigh dynamic pressure to areas of lower dynamic pressure, leaving the static pressure anddensity of the surrounding air constant. At high subsonic speeds, compressibility effectsbegin to appear.
The propeller is one of the most efficient sources of thrust available and is common onsubsonic airplanes and airships. Sometimes it is enclosed in the form of a ducted fan. Athigher subsonic speeds and at high altitudes, such as those attained by most airliners, thehigh-bypass turbofan becomes necessary.
2.1 Subsonic engine architecturesThe main engine architectures for subsonic flights are the following:
• Turboprop
• Turboshaft
• Turbofan (separated flow or with mixer)
• Turbojet
In the following paragraphs will be described the different types of engines, but the wholechapter will be only focused on turbofans, as they are the most used in civil transport.
21
2 – Subsonic flight
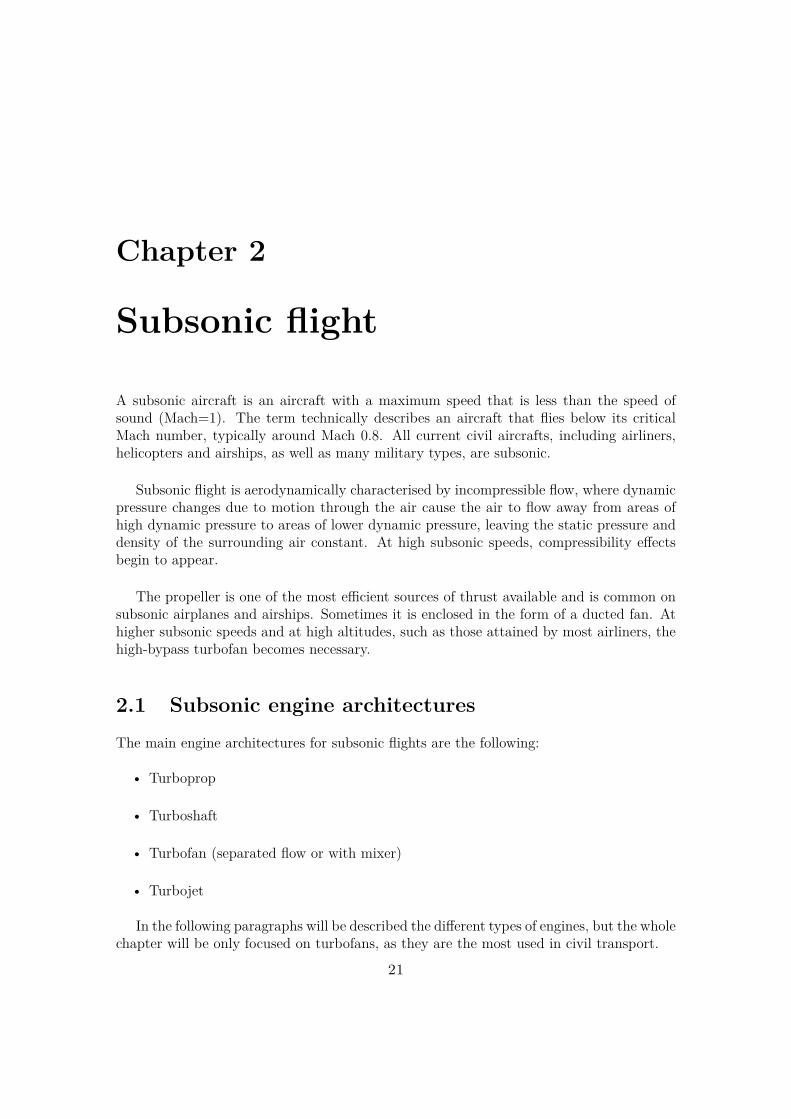
2.1.1 TurbopropA turboprop engine is a turbine engine that drives an aircraft propeller.
Figure 2.1. Turboprop in GSP
In its simplest form a turboprop consists of an intake, a compressor, a combustor, aturbine, and a propelling nozzle. Air is drawn into the intake and compressed by thecompressor. Fuel is then added to the compressed air in the combustor, where the fuel-airmixture then combusts. The hot combustion gases expand through the turbine. Some ofthe power generated by the turbine is used to drive the compressor. Thrust is obtainedby the combusting gases, pushing toward a (vectored) surface in front of the expanding gas.
The remaining power is transmitted through the reduction gearing to the propeller.Further expansion of the gases occurs in the propelling nozzle, where the gases exhaustto atmospheric pressure. The propelling nozzle provides a relatively small portion of thethrust generated by a turboprop.
Figure 2.2. Turboprop
In contrast to a turbojet, the en-gine’s exhaust gases do not generallycontain enough energy to create signifi-cant thrust, since almost all of the en-gine’s power is used to drive the pro-peller.
The thrust generated by the propelleris generally very small and hence not suit-able for flights with high payloads. For thisreason it is not considered in this thesiswork that deals with international flightsor flights with a large number of passen-gers, in order to have a comparison withthe European Stratofly project.
Compared to the turbojet, the turboprop engine allows generally lower cruising speedsand a higher noise level than the turbofan engines, but has lower fuel consumption, greaterthrust during take-off and greater efficiency at low altitudes. The possibility of reversingthe pitch of the propeller also makes it possible to land in much smaller spaces. The most
22
2.1 – Subsonic engine architectures
delicate part of the engine is the gear reducer, subjected to intense stress.
2.1.2 Turboshaft
Figure 2.3. Turboshaft in GSP
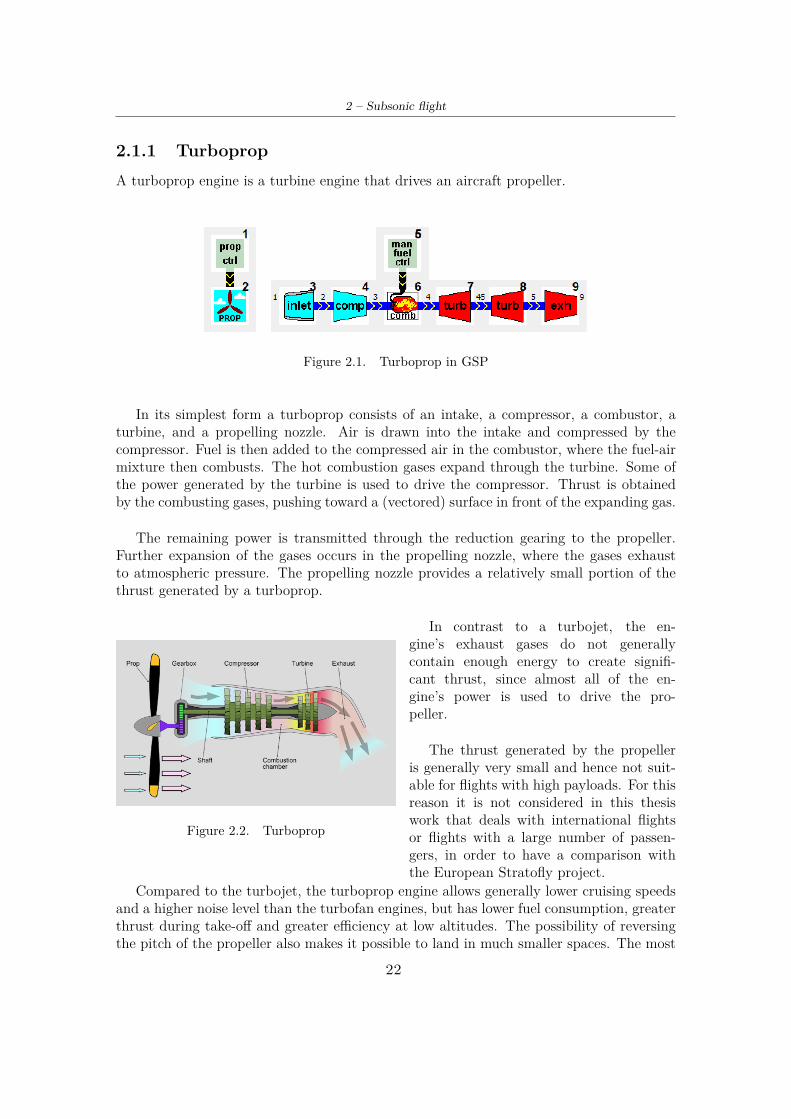
A turboshaft engine is a form of gas turbine that is optimized to produce shaftpowerrather than jet thrust. Conceptually, turboshaft engines are very similar to turboprops,with only minor differences.
Turboshaft engines are commonly used in applications that require a sustained highpower output, high reliability, small size, and light weight. These include helicopters, aux-iliary power units, boats and ships, tanks and hovercraft.
A turboshaft engine may be made up of two major parts assemblies: the ’gas generator’and the ’power section’.
Figure 2.4. Turboshaft
The gas generator consists of a compres-sor, a combustion chambers with ignitorsand fuel nozzles, and one or more stages ofturbine. The power section consists of ad-ditional stages of turbines, a gear reductionsystem, and the shaft output. The gas gen-erator creates the hot expanding gases thatdrive the power section.
In most designs, the gas generator andpower section are mechanically separatedsuch that they can each rotate at differ-ent speeds appropriate for the conditions.This configuration is called "free power tur-bine" and can be an extremely useful designfeature for vehicles, as it allows the designto forgo the weight and cost of complexmultiple-ratio transmissions and clutches.
23
2 – Subsonic flight
2.1.3 Turbojet
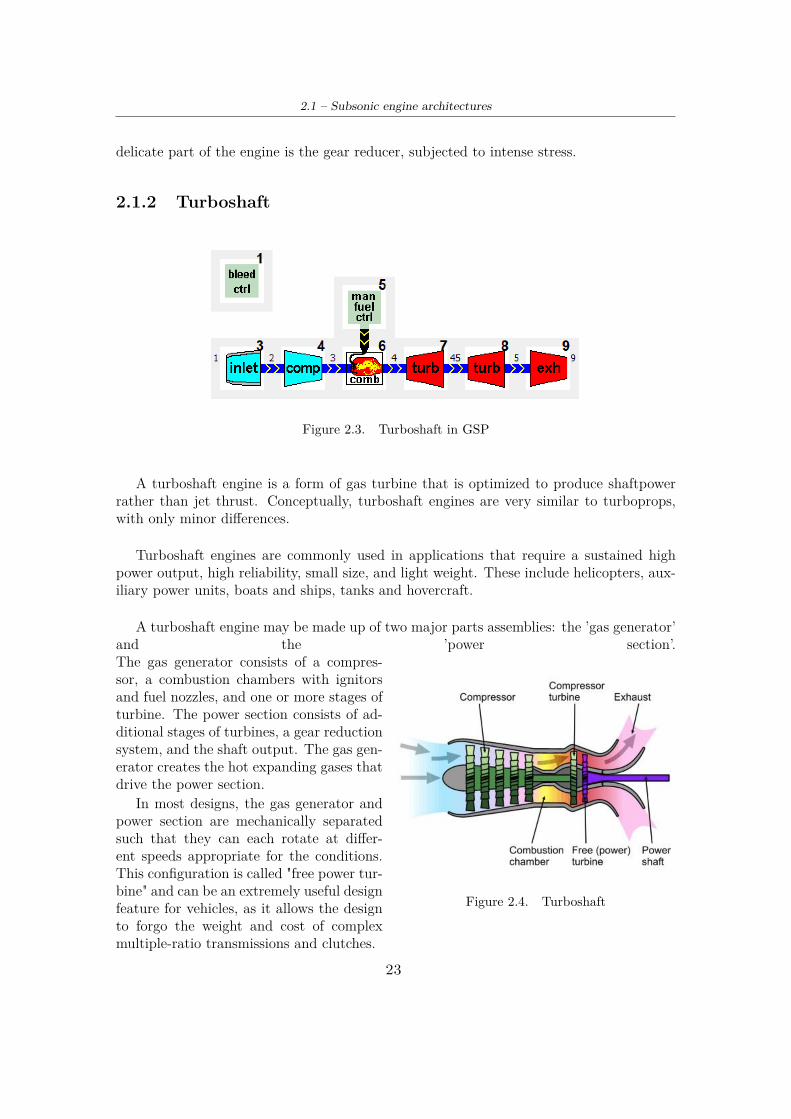
The turbojet is an airbreathing jet engine, typically used in aircraft. It consists of a gasturbine with a propelling nozzle.
Figure 2.5. Turbojet in GSP
The gas turbine has an air inlet, a compressor, a combustion chamber, and a turbine(that drives the compressor). The compressed air from the compressor is heated by aburning fuel in the combustion chamber and then allowed to expand through the turbine.The turbine exhaust is then expanded in the propelling nozzle where it is accelerated tohigh speed to provide thrust.
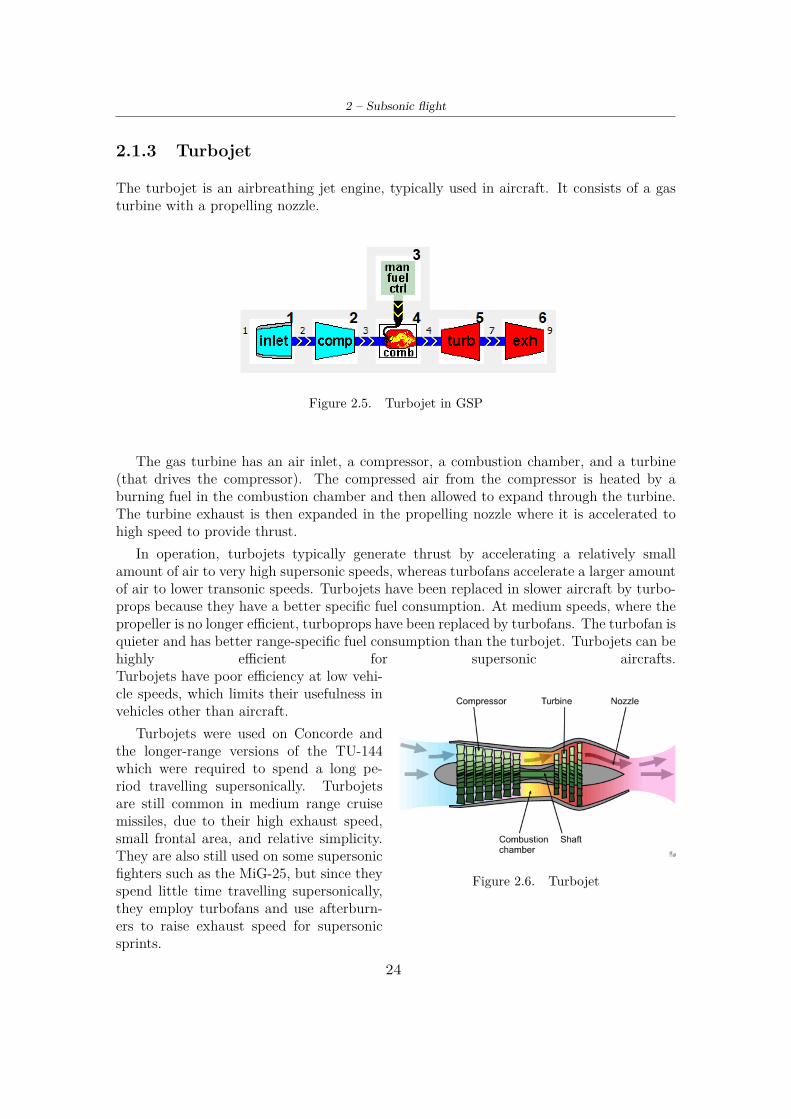
In operation, turbojets typically generate thrust by accelerating a relatively smallamount of air to very high supersonic speeds, whereas turbofans accelerate a larger amountof air to lower transonic speeds. Turbojets have been replaced in slower aircraft by turbo-props because they have a better specific fuel consumption. At medium speeds, where thepropeller is no longer efficient, turboprops have been replaced by turbofans. The turbofan isquieter and has better range-specific fuel consumption than the turbojet. Turbojets can behighly efficient for supersonic aircrafts.
Figure 2.6. Turbojet
Turbojets have poor efficiency at low vehi-cle speeds, which limits their usefulness invehicles other than aircraft.
Turbojets were used on Concorde andthe longer-range versions of the TU-144which were required to spend a long pe-riod travelling supersonically. Turbojetsare still common in medium range cruisemissiles, due to their high exhaust speed,small frontal area, and relative simplicity.They are also still used on some supersonicfighters such as the MiG-25, but since theyspend little time travelling supersonically,they employ turbofans and use afterburn-ers to raise exhaust speed for supersonicsprints.
24
2.1 – Subsonic engine architectures
2.1.4 TurbofanThe turbofan is a type of airbreathing jet engine that is widely used in aircraft propulsion.The word "turbofan" is a portmanteau of "turbine" and "fan": the turbo portion refersto a gas turbine engine which achieves mechanical energy from combustion, and the fanto a ducted fan that uses the mechanical energy from the gas turbine to accelerate airrearwards. Therefore, whereas all the air taken in by a turbojet passes through the turbine(through the combustion chamber), in a turbofan some of that air bypasses the turbine.A turbofan can hence be thought of as a turbojet being used to drive a ducted fan, withboth of these contributing to the thrust.
The ratio of the mass-flow of air bypassing the engine core divided by the mass-flow ofair passing through the core is referred to as the bypass ratio. The engine produces thrustthrough a combination of these two portions working together; engines that use more jetthrust relative to fan thrust are known as low-bypass turbofans, conversely those that haveconsiderably more fan thrust than jet thrust are known as high-bypass. Most commercialaviation jet engines in use today are of the high-bypass type.Afterburners are not used onhigh-bypass turbofan engines but may be used on either low-bypass turbofan or turbojetengines.
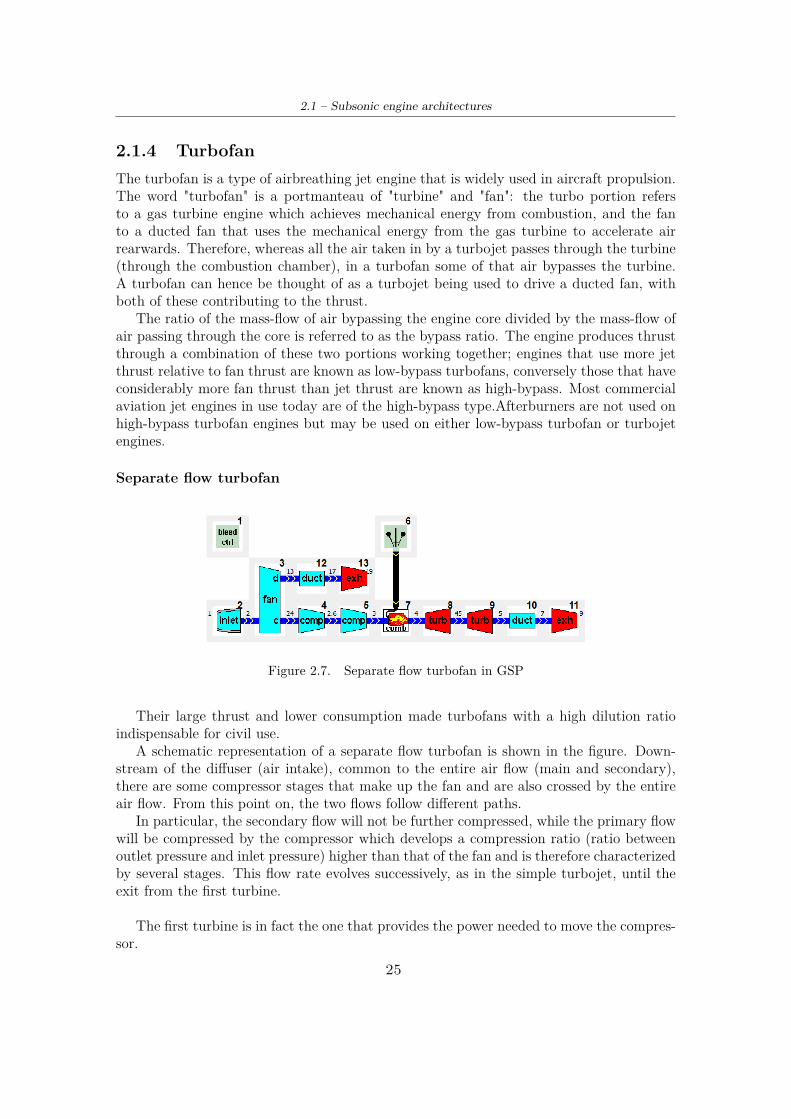
Separate flow turbofan
Figure 2.7. Separate flow turbofan in GSP
Their large thrust and lower consumption made turbofans with a high dilution ratioindispensable for civil use.
A schematic representation of a separate flow turbofan is shown in the figure. Down-stream of the diffuser (air intake), common to the entire air flow (main and secondary),there are some compressor stages that make up the fan and are also crossed by the entireair flow. From this point on, the two flows follow different paths.
In particular, the secondary flow will not be further compressed, while the primary flowwill be compressed by the compressor which develops a compression ratio (ratio betweenoutlet pressure and inlet pressure) higher than that of the fan and is therefore characterizedby several stages. This flow rate evolves successively, as in the simple turbojet, until theexit from the first turbine.
The first turbine is in fact the one that provides the power needed to move the compres-sor.
25
2 – Subsonic flight
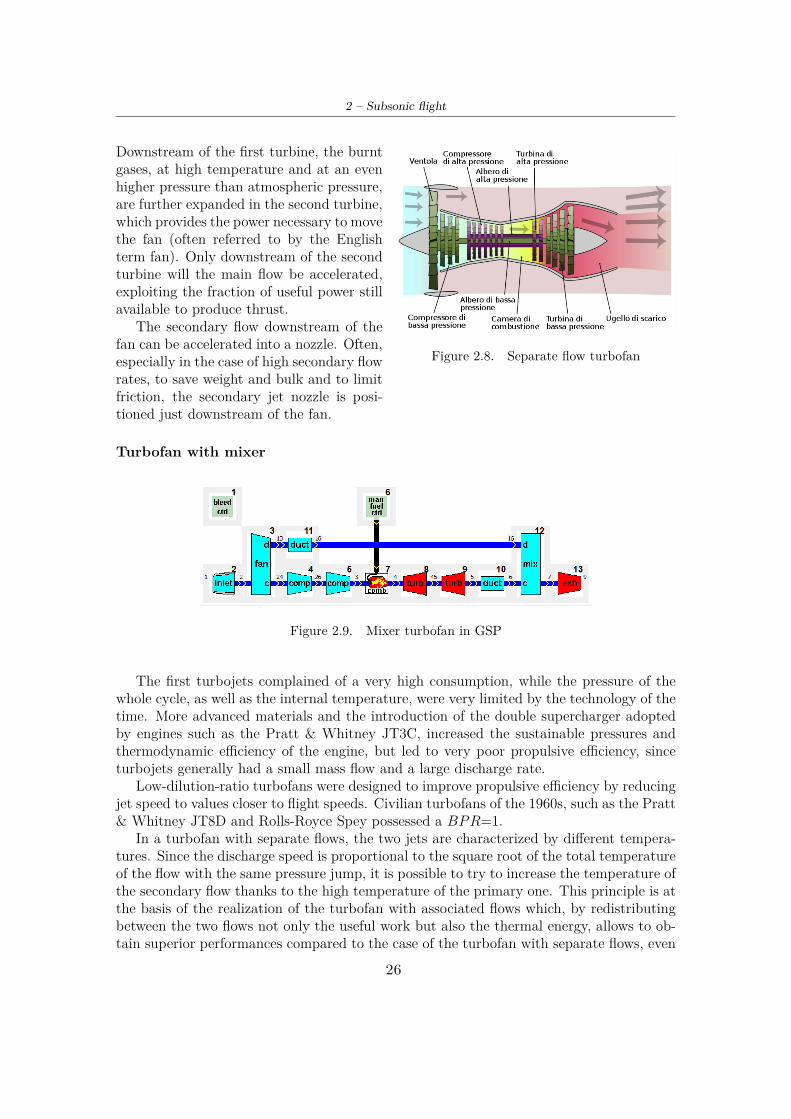
Figure 2.8. Separate flow turbofan
Downstream of the first turbine, the burntgases, at high temperature and at an evenhigher pressure than atmospheric pressure,are further expanded in the second turbine,which provides the power necessary to movethe fan (often referred to by the Englishterm fan). Only downstream of the secondturbine will the main flow be accelerated,exploiting the fraction of useful power stillavailable to produce thrust.
The secondary flow downstream of thefan can be accelerated into a nozzle. Often,especially in the case of high secondary flowrates, to save weight and bulk and to limitfriction, the secondary jet nozzle is posi-tioned just downstream of the fan.
Turbofan with mixer
Figure 2.9. Mixer turbofan in GSP
The first turbojets complained of a very high consumption, while the pressure of thewhole cycle, as well as the internal temperature, were very limited by the technology of thetime. More advanced materials and the introduction of the double supercharger adoptedby engines such as the Pratt & Whitney JT3C, increased the sustainable pressures andthermodynamic efficiency of the engine, but led to very poor propulsive efficiency, sinceturbojets generally had a small mass flow and a large discharge rate.
Low-dilution-ratio turbofans were designed to improve propulsive efficiency by reducingjet speed to values closer to flight speeds. Civilian turbofans of the 1960s, such as the Pratt& Whitney JT8D and Rolls-Royce Spey possessed a BPR=1.
In a turbofan with separate flows, the two jets are characterized by different tempera-tures. Since the discharge speed is proportional to the square root of the total temperatureof the flow with the same pressure jump, it is possible to try to increase the temperature ofthe secondary flow thanks to the high temperature of the primary one. This principle is atthe basis of the realization of the turbofan with associated flows which, by redistributingbetween the two flows not only the useful work but also the thermal energy, allows to ob-tain superior performances compared to the case of the turbofan with separate flows, even
26
2.2 – Decreasing consumption
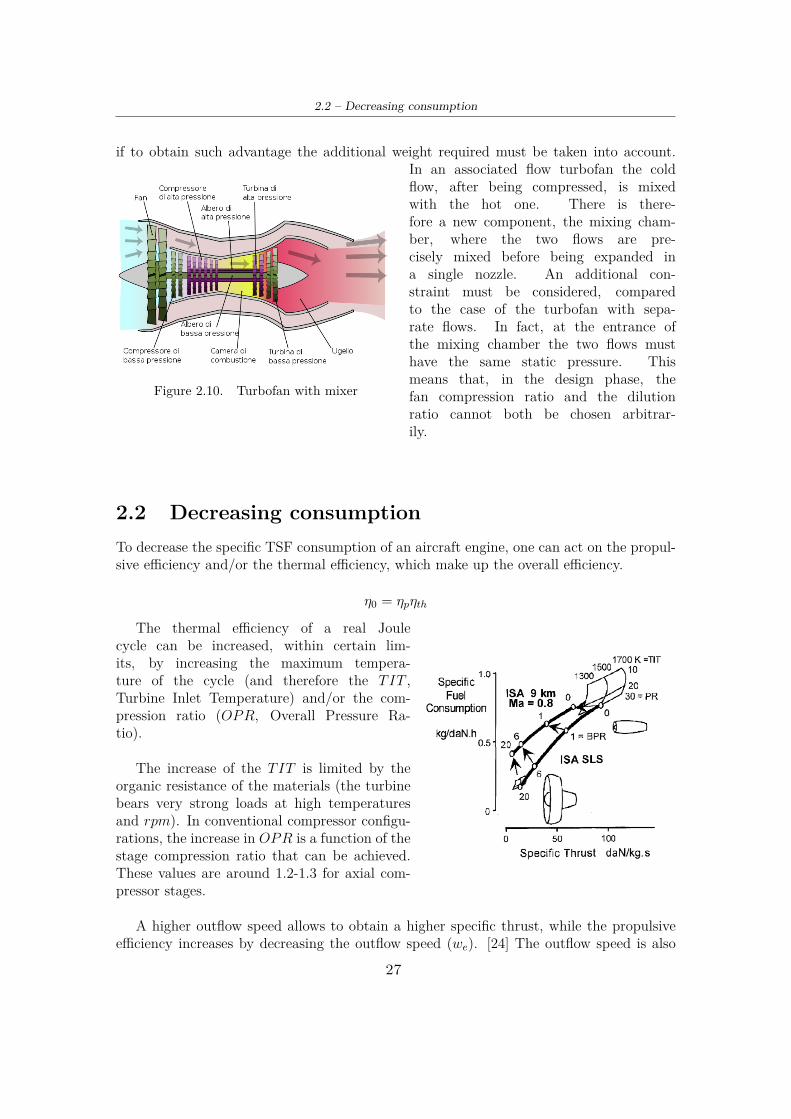
if to obtain such advantage the additional weight required must be taken into account.
Figure 2.10. Turbofan with mixer
In an associated flow turbofan the coldflow, after being compressed, is mixedwith the hot one. There is there-fore a new component, the mixing cham-ber, where the two flows are pre-cisely mixed before being expanded ina single nozzle. An additional con-straint must be considered, comparedto the case of the turbofan with sepa-rate flows. In fact, at the entrance ofthe mixing chamber the two flows musthave the same static pressure. Thismeans that, in the design phase, thefan compression ratio and the dilutionratio cannot both be chosen arbitrar-ily.
2.2 Decreasing consumptionTo decrease the specific TSF consumption of an aircraft engine, one can act on the propul-sive efficiency and/or the thermal efficiency, which make up the overall efficiency.
η0 = ηpηth
The thermal efficiency of a real Joulecycle can be increased, within certain lim-its, by increasing the maximum tempera-ture of the cycle (and therefore the TIT ,Turbine Inlet Temperature) and/or the com-pression ratio (OPR, Overall Pressure Ra-tio).
The increase of the TIT is limited by theorganic resistance of the materials (the turbinebears very strong loads at high temperaturesand rpm). In conventional compressor configu-rations, the increase in OPR is a function of thestage compression ratio that can be achieved.These values are around 1.2-1.3 for axial com-pressor stages.
A higher outflow speed allows to obtain a higher specific thrust, while the propulsiveefficiency increases by decreasing the outflow speed (we). [24] The outflow speed is also
27
2 – Subsonic flight
linked to TIT and OPR. In fact:
we =ñ
2(h0e − he) =
ó2cpTe0
è1−
1pep0e
2 γ−1γé
Total temperature T 0 and P 0 are functions of the TIT and the BPR. It is thereforenecessary to try to decouple the system by introducing another degree of freedom. Thisis what happens in the case of double-flow machines, in turbofans: a core flow with highthermal efficiency is associated with a cold flow with high propulsive efficiency.
So, in conclusion, the thermal efficiency increases with TIT and OPR, while the propul-sive efficiency increases with the value of BPR.
The choice of the thermodynamic cycle and engine architecture affects emissions. Thepressure and temperature levels have different effects on various pollutants. Low specificconsumption (low fuel consumption) and high specific thrusts (low weight engine) reduceCO2 and H2O emissions. High TIT temperatures increase NOx.[24]
2.2.1 Changes to improve performance to classic architecture
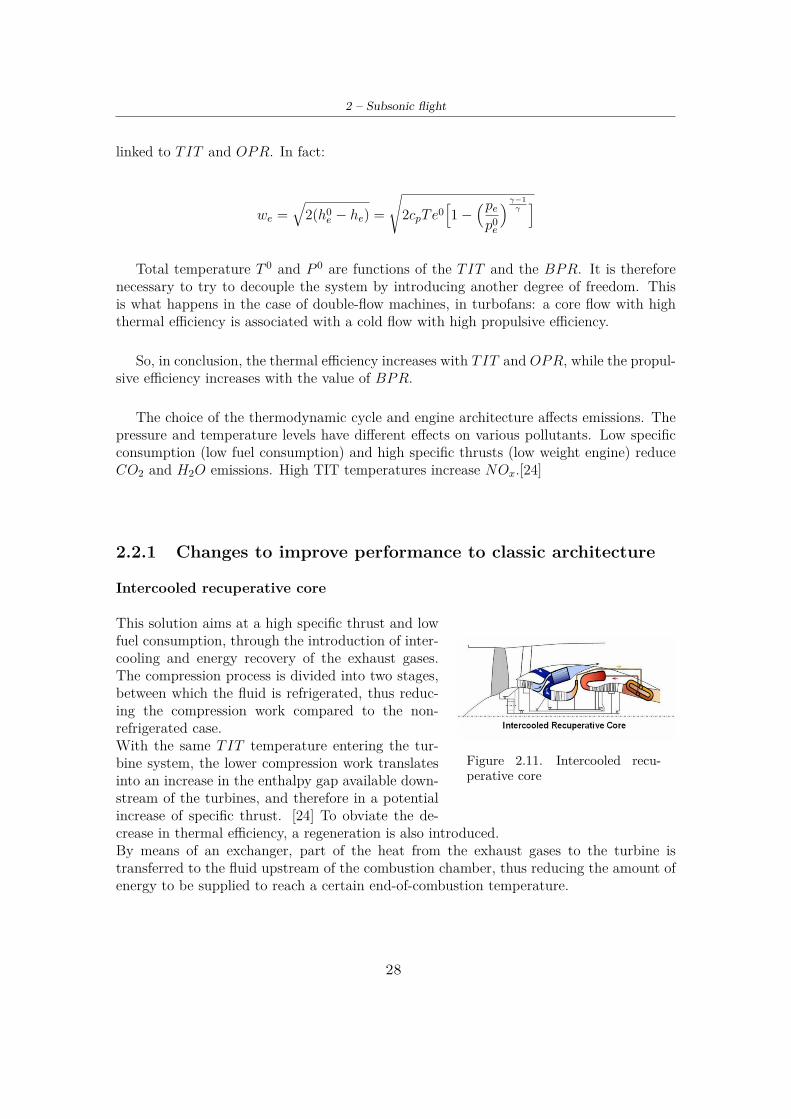
Intercooled recuperative core
Figure 2.11. Intercooled recu-perative core
This solution aims at a high specific thrust and lowfuel consumption, through the introduction of inter-cooling and energy recovery of the exhaust gases.The compression process is divided into two stages,between which the fluid is refrigerated, thus reduc-ing the compression work compared to the non-refrigerated case.With the same TIT temperature entering the tur-bine system, the lower compression work translatesinto an increase in the enthalpy gap available down-stream of the turbines, and therefore in a potentialincrease of specific thrust. [24] To obviate the de-crease in thermal efficiency, a regeneration is also introduced.By means of an exchanger, part of the heat from the exhaust gases to the turbine istransferred to the fluid upstream of the combustion chamber, thus reducing the amount ofenergy to be supplied to reach a certain end-of-combustion temperature.
28
2.2 – Decreasing consumption
Figure 2.12. Intercooled core
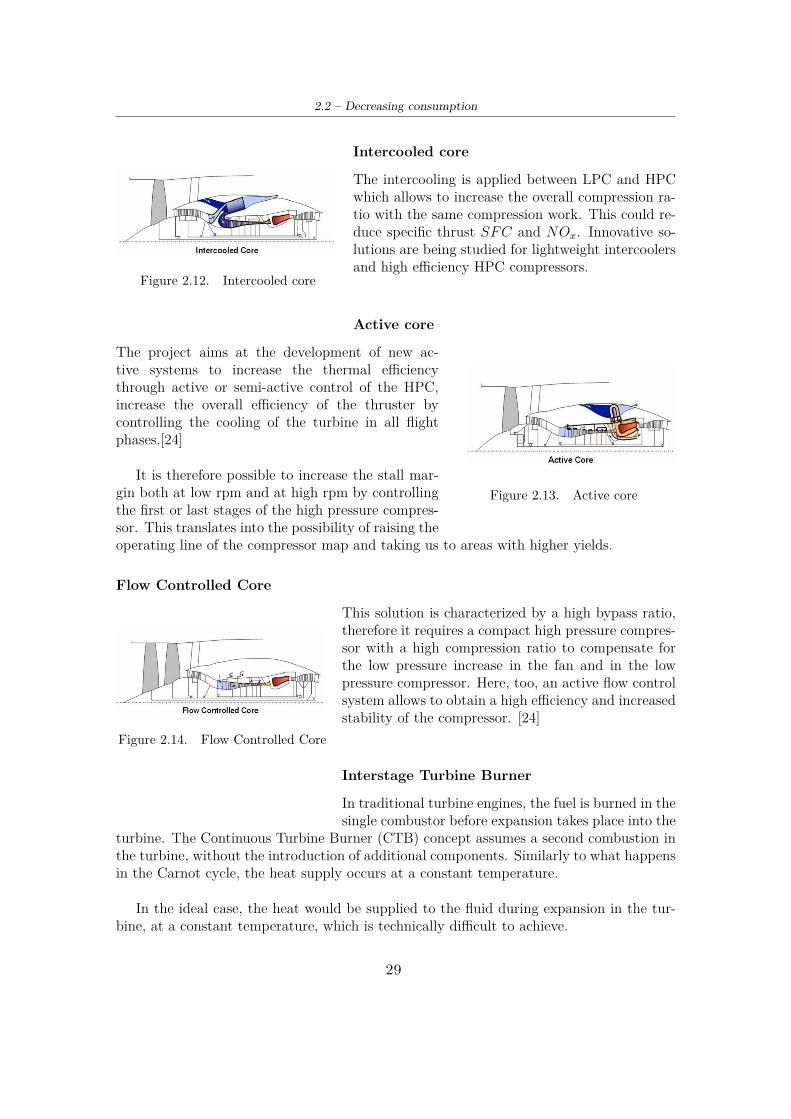
Intercooled core
The intercooling is applied between LPC and HPCwhich allows to increase the overall compression ra-tio with the same compression work. This could re-duce specific thrust SFC and NOx. Innovative so-lutions are being studied for lightweight intercoolersand high efficiency HPC compressors.
Active core
Figure 2.13. Active core
The project aims at the development of new ac-tive systems to increase the thermal efficiencythrough active or semi-active control of the HPC,increase the overall efficiency of the thruster bycontrolling the cooling of the turbine in all flightphases.[24]
It is therefore possible to increase the stall mar-gin both at low rpm and at high rpm by controllingthe first or last stages of the high pressure compres-sor. This translates into the possibility of raising theoperating line of the compressor map and taking us to areas with higher yields.
Flow Controlled Core
Figure 2.14. Flow Controlled Core
This solution is characterized by a high bypass ratio,therefore it requires a compact high pressure compres-sor with a high compression ratio to compensate forthe low pressure increase in the fan and in the lowpressure compressor. Here, too, an active flow controlsystem allows to obtain a high efficiency and increasedstability of the compressor. [24]
Interstage Turbine Burner
In traditional turbine engines, the fuel is burned in thesingle combustor before expansion takes place into the
turbine. The Continuous Turbine Burner (CTB) concept assumes a second combustion inthe turbine, without the introduction of additional components. Similarly to what happensin the Carnot cycle, the heat supply occurs at a constant temperature.
In the ideal case, the heat would be supplied to the fluid during expansion in the tur-bine, at a constant temperature, which is technically difficult to achieve.
29
2 – Subsonic flight
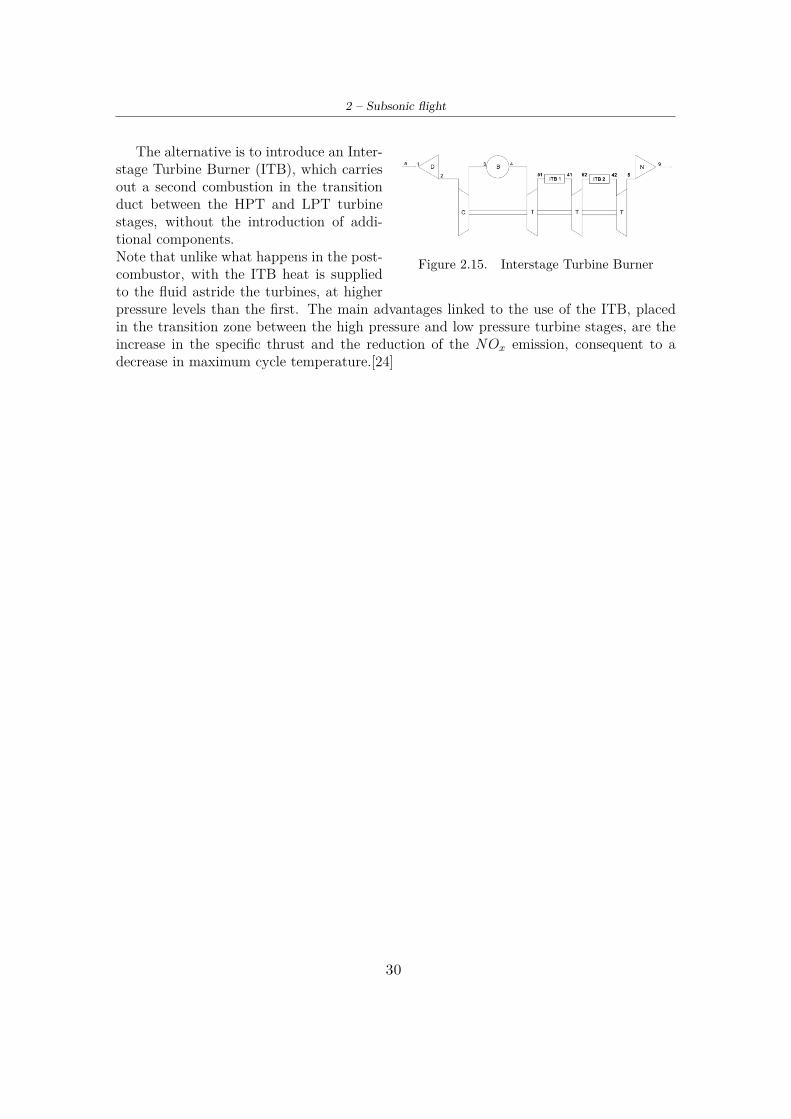
Figure 2.15. Interstage Turbine Burner
The alternative is to introduce an Inter-stage Turbine Burner (ITB), which carriesout a second combustion in the transitionduct between the HPT and LPT turbinestages, without the introduction of addi-tional components.Note that unlike what happens in the post-combustor, with the ITB heat is suppliedto the fluid astride the turbines, at higherpressure levels than the first. The main advantages linked to the use of the ITB, placedin the transition zone between the high pressure and low pressure turbine stages, are theincrease in the specific thrust and the reduction of the NOx emission, consequent to adecrease in maximum cycle temperature.[24]
30
2.3 – Innovative technologies and architectures
2.3 Innovative technologies and architectures
Figure 2.16. Partially Turboelectric
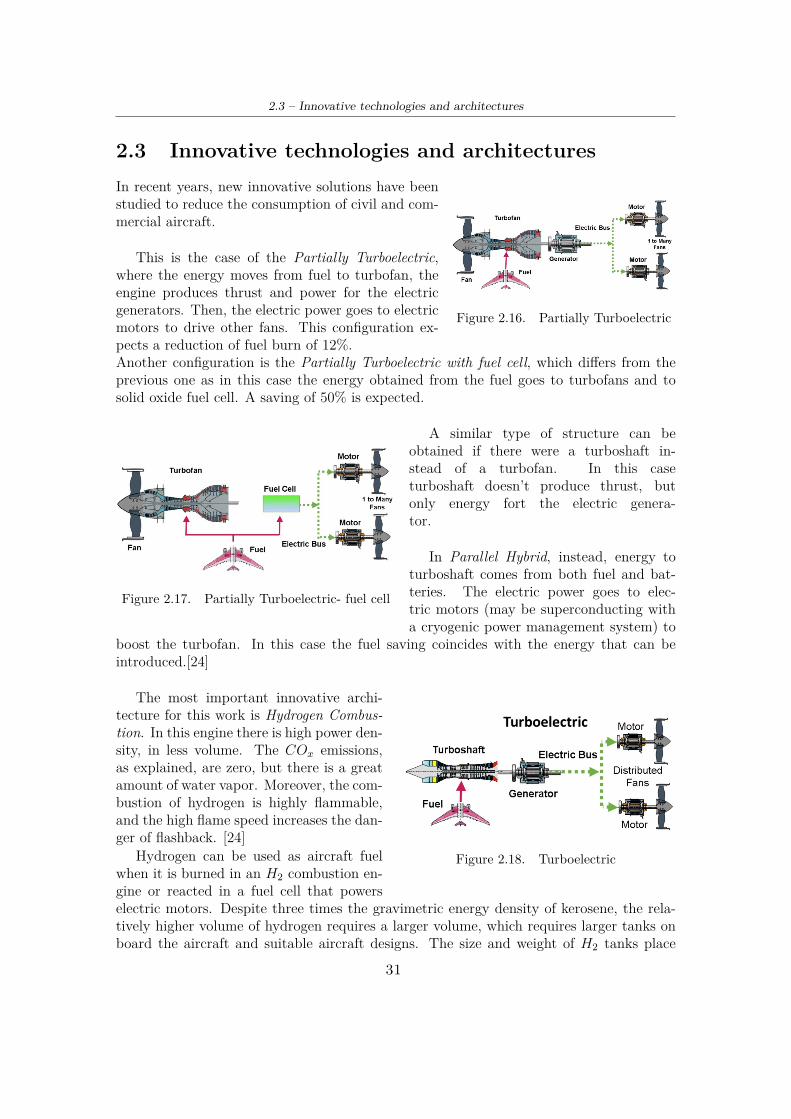
In recent years, new innovative solutions have beenstudied to reduce the consumption of civil and com-mercial aircraft.
This is the case of the Partially Turboelectric,where the energy moves from fuel to turbofan, theengine produces thrust and power for the electricgenerators. Then, the electric power goes to electricmotors to drive other fans. This configuration ex-pects a reduction of fuel burn of 12%.Another configuration is the Partially Turboelectric with fuel cell, which differs from theprevious one as in this case the energy obtained from the fuel goes to turbofans and tosolid oxide fuel cell. A saving of 50% is expected.
Figure 2.17. Partially Turboelectric- fuel cell
A similar type of structure can beobtained if there were a turboshaft in-stead of a turbofan. In this caseturboshaft doesn’t produce thrust, butonly energy fort the electric genera-tor.
In Parallel Hybrid, instead, energy toturboshaft comes from both fuel and bat-teries. The electric power goes to elec-tric motors (may be superconducting witha cryogenic power management system) to
boost the turbofan. In this case the fuel saving coincides with the energy that can beintroduced.[24]
Figure 2.18. Turboelectric
The most important innovative archi-tecture for this work is Hydrogen Combus-tion. In this engine there is high power den-sity, in less volume. The COx emissions,as explained, are zero, but there is a greatamount of water vapor. Moreover, the com-bustion of hydrogen is highly flammable,and the high flame speed increases the dan-ger of flashback. [24]
Hydrogen can be used as aircraft fuelwhen it is burned in an H2 combustion en-gine or reacted in a fuel cell that powerselectric motors. Despite three times the gravimetric energy density of kerosene, the rela-tively higher volume of hydrogen requires a larger volume, which requires larger tanks onboard the aircraft and suitable aircraft designs. The size and weight of H2 tanks place
31
2 – Subsonic flight
major limitations on the high energy demand on long-haul flights, potentially reducingcosts significantly for long-haul aircraft.As for the tanks installed on board the aircraft, hydrogen can be stored as pressurized gasor in liquid form. While gaseous storage may be suitable for shorter flights and is commer-cially available, this study focuses on liquid hydrogen (LH2) storage tanks as they requireabout half the volume and, as a result, are significantly lighter than tanks. for gaseoushydrogen. Compared to kerosene, LH2 tanks are still about four times larger. Since LH2must remain cold and heat transfer must be minimized to avoid vaporization of hydrogen,spherical or cylindrical tanks are required to keep losses low. To efficiently integrate thetanks into the aircraft fuselage, the airframe will need to be extended, which increases theaircraft’s operational empty weight.
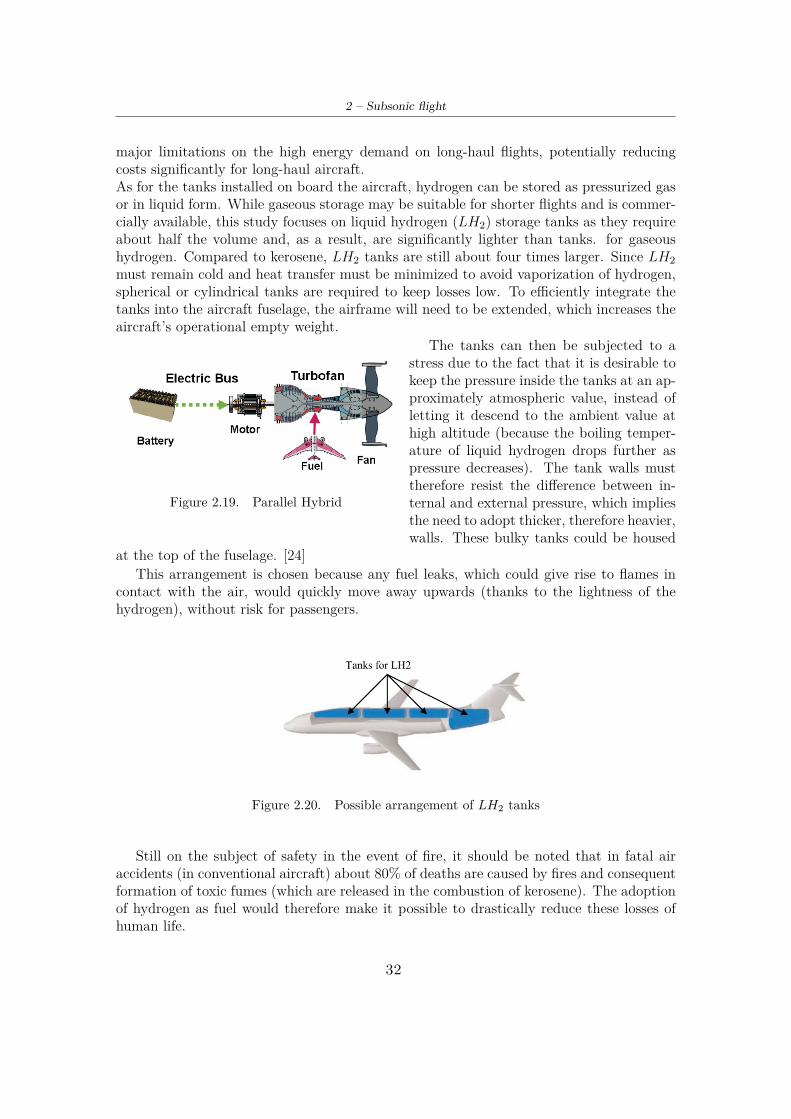
Figure 2.19. Parallel Hybrid
The tanks can then be subjected to astress due to the fact that it is desirable tokeep the pressure inside the tanks at an ap-proximately atmospheric value, instead ofletting it descend to the ambient value athigh altitude (because the boiling temper-ature of liquid hydrogen drops further aspressure decreases). The tank walls musttherefore resist the difference between in-ternal and external pressure, which impliesthe need to adopt thicker, therefore heavier,walls. These bulky tanks could be housed
at the top of the fuselage. [24]This arrangement is chosen because any fuel leaks, which could give rise to flames in
contact with the air, would quickly move away upwards (thanks to the lightness of thehydrogen), without risk for passengers.
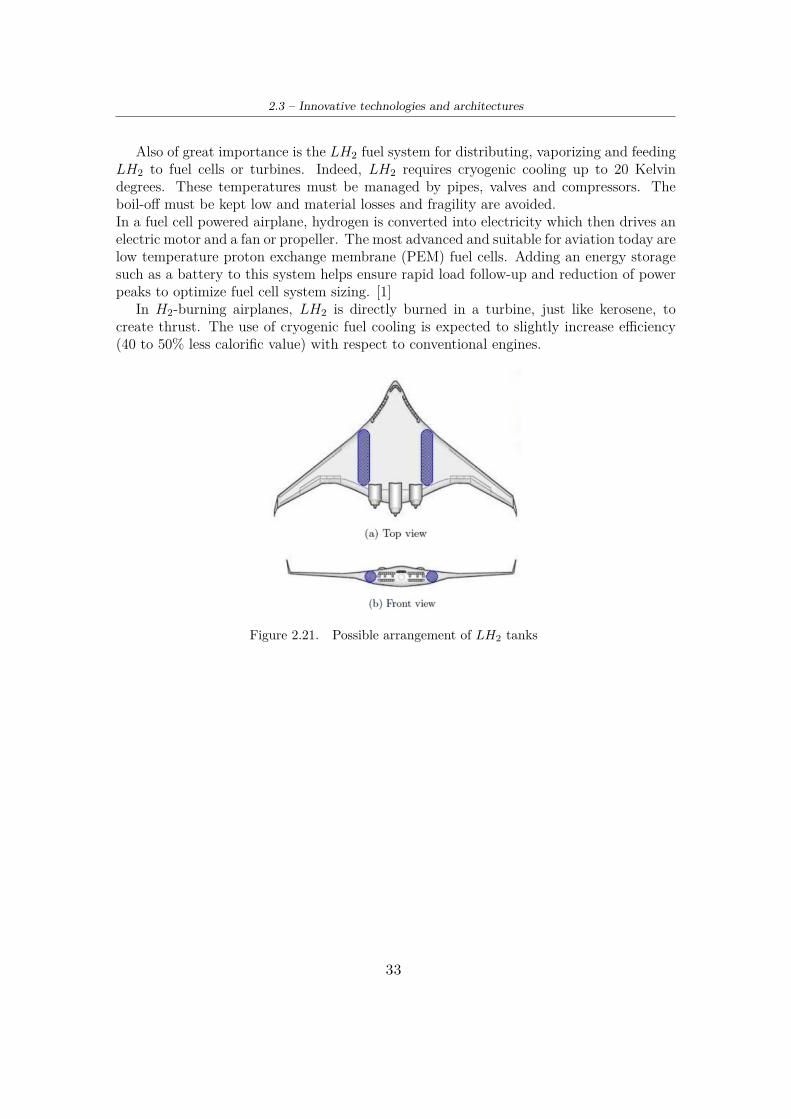
Figure 2.20. Possible arrangement of LH2 tanks
Still on the subject of safety in the event of fire, it should be noted that in fatal airaccidents (in conventional aircraft) about 80% of deaths are caused by fires and consequentformation of toxic fumes (which are released in the combustion of kerosene). The adoptionof hydrogen as fuel would therefore make it possible to drastically reduce these losses ofhuman life.
32
2.3 – Innovative technologies and architectures
Also of great importance is the LH2 fuel system for distributing, vaporizing and feedingLH2 to fuel cells or turbines. Indeed, LH2 requires cryogenic cooling up to 20 Kelvindegrees. These temperatures must be managed by pipes, valves and compressors. Theboil-off must be kept low and material losses and fragility are avoided.In a fuel cell powered airplane, hydrogen is converted into electricity which then drives anelectric motor and a fan or propeller. The most advanced and suitable for aviation today arelow temperature proton exchange membrane (PEM) fuel cells. Adding an energy storagesuch as a battery to this system helps ensure rapid load follow-up and reduction of powerpeaks to optimize fuel cell system sizing. [1]
In H2-burning airplanes, LH2 is directly burned in a turbine, just like kerosene, tocreate thrust. The use of cryogenic fuel cooling is expected to slightly increase efficiency(40 to 50% less calorific value) with respect to conventional engines.
Figure 2.21. Possible arrangement of LH2 tanks
33

34
Chapter 3
Data analysis for subsonicflight
In this chapter will be analyzed the ICAO database, which collects data on the emissionsand consumption of many engines during their LTO cycle.
In the Emissions Databank is described the identification number of each engine, theengine manufacturer, and obviously the engine type ( TF = turbofan, MTF = mixed tur-bofan). For each engine can be found the By Pass Ratio BPR, Overall Pressure Ratio PR,maximum rated Thrust T [kN ], and many other technical information. Moreover, a lot ofdata about emissions are collected. For example there are the values of hydrocarbon emis-sions during different phases of the mission: take off, climb, approach and idle (expressedin g/kg). As for hydrocarbons, the same data are reported for carbon monoxide, nitrogenoxides and smoke number. Also the fuel flow used during the LTO cycle (expressed inkg/sec).
Having this big amount of data (about 600 engines), it was possible to try to relatethe different variables and seek a relationship at experimental level. Dividing the enginesbetween separate flow turbofans and mixer turbofans the independent variables used are:
• Bypass Ratio BPR;
• Pressure Ratio PR;
and the dependent ones:
• total emission of carbon monoxide during LTO cycle CO in g/kg
• total emission of hydrocarbons during LTO cycle HC in g/kg
• total emission of nitrogen oxides during LTO cycle NOx in g/kg
3.1 Fourth degree polynomialInitially we tried to find a relationship between the different variables using the classicmatlab functions: spline, polyfit and polyval, considering a fourth degree polynomial.
35
3 – Data analysis for subsonic flight
Figure 3.1. Matlab code for reading data
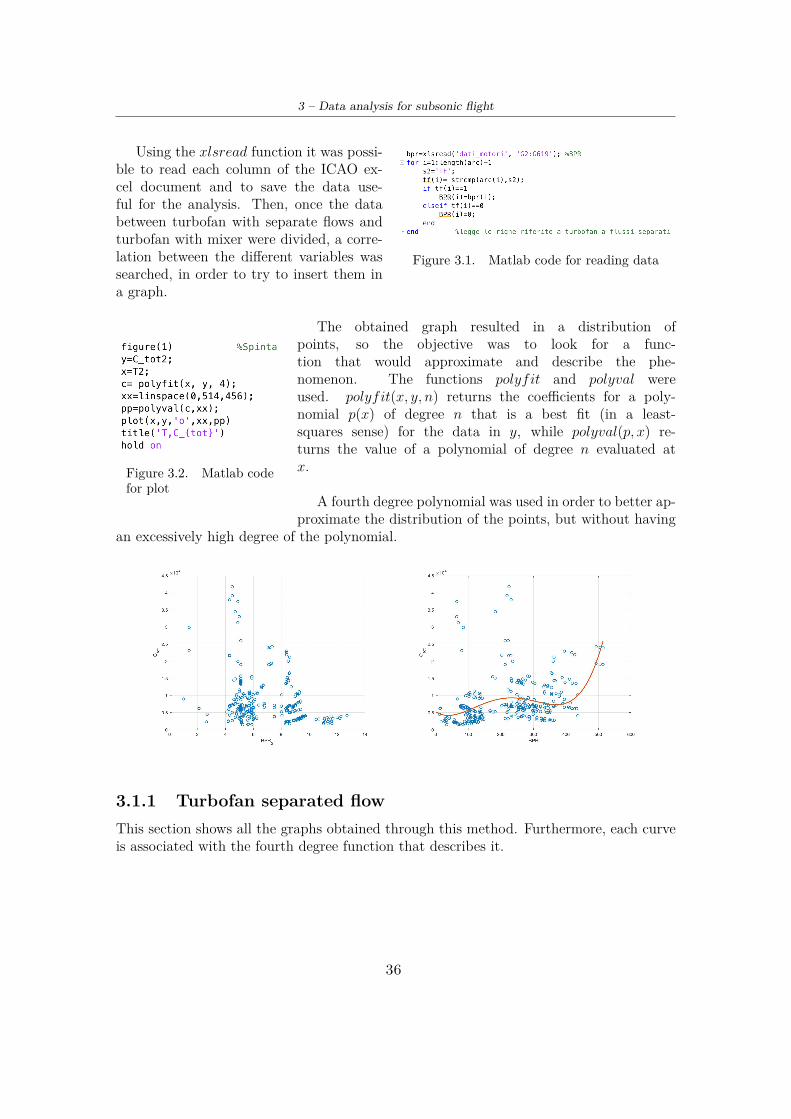
Using the xlsread function it was possi-ble to read each column of the ICAO ex-cel document and to save the data use-ful for the analysis. Then, once the databetween turbofan with separate flows andturbofan with mixer were divided, a corre-lation between the different variables wassearched, in order to try to insert them ina graph.
Figure 3.2. Matlab codefor plot
The obtained graph resulted in a distribution ofpoints, so the objective was to look for a func-tion that would approximate and describe the phe-nomenon. The functions polyfit and polyval wereused. polyfit(x, y, n) returns the coefficients for a poly-nomial p(x) of degree n that is a best fit (in a least-squares sense) for the data in y, while polyval(p, x) re-turns the value of a polynomial of degree n evaluated atx.
A fourth degree polynomial was used in order to better ap-proximate the distribution of the points, but without having
an excessively high degree of the polynomial.
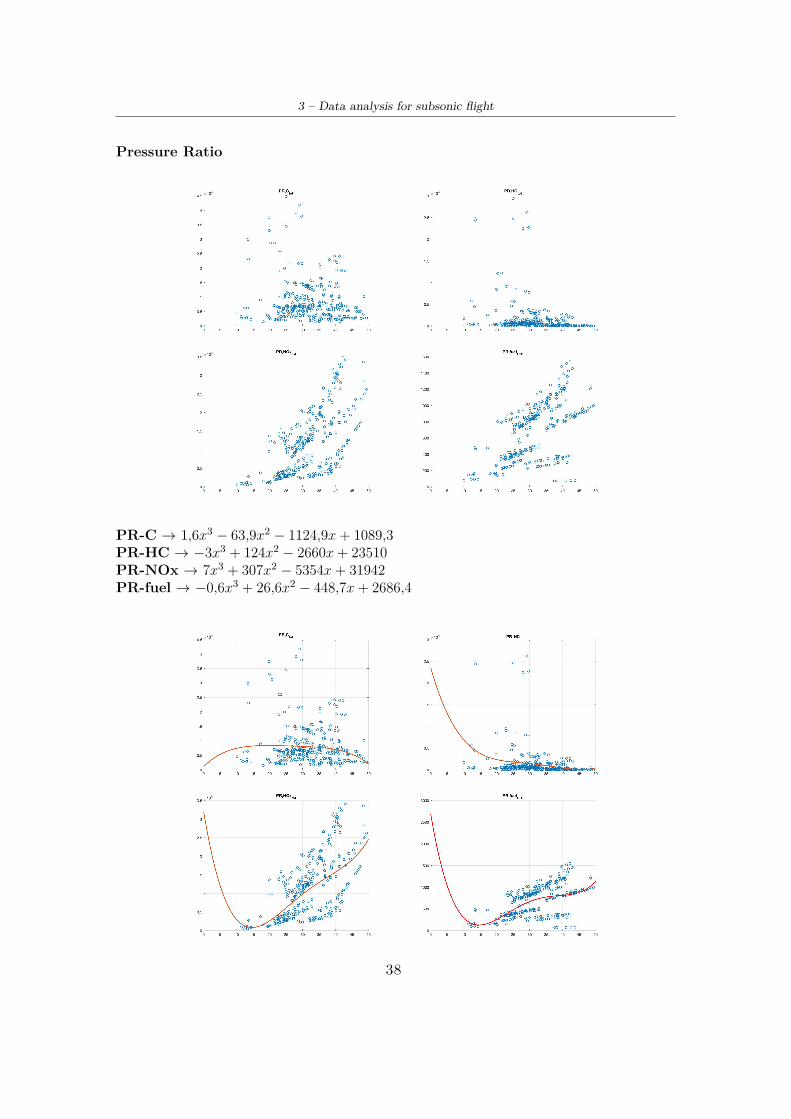
3.1.1 Turbofan separated flowThis section shows all the graphs obtained through this method. Furthermore, each curveis associated with the fourth degree function that describes it.
36
3.1 – Fourth degree polynomial
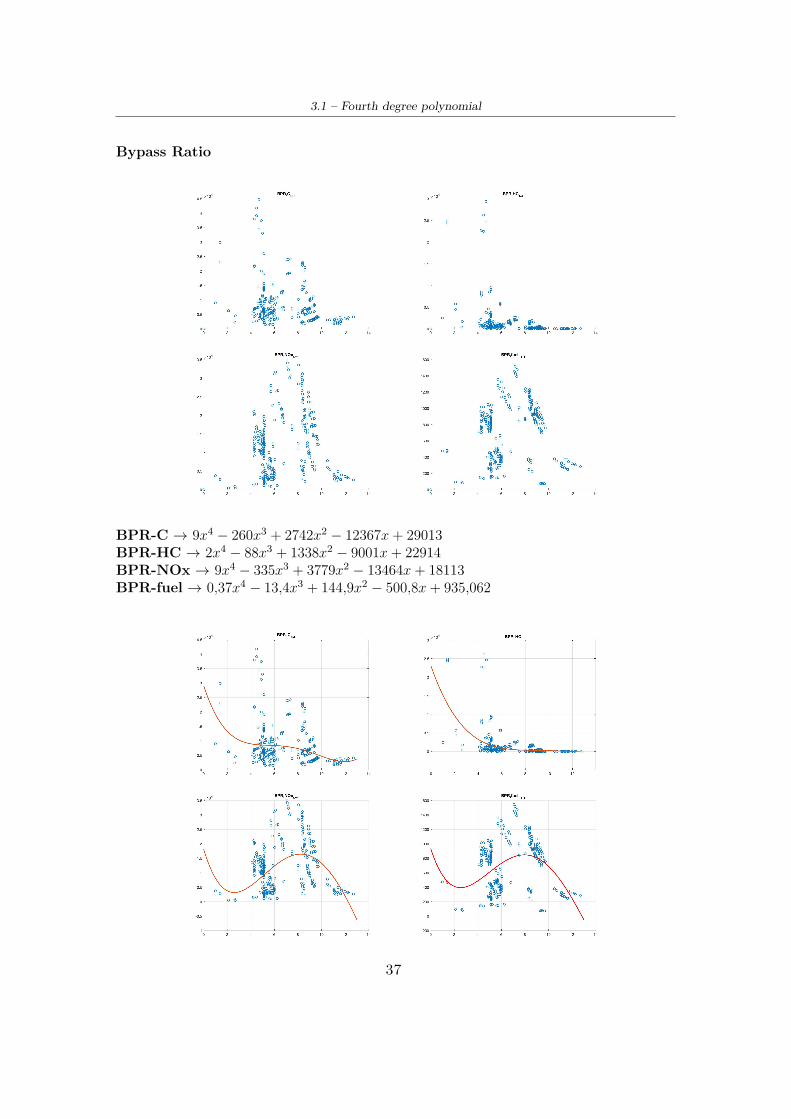
Bypass Ratio
BPR-C → 9x4 − 260x3 + 2742x2 − 12367x+ 29013BPR-HC → 2x4 − 88x3 + 1338x2 − 9001x+ 22914BPR-NOx → 9x4 − 335x3 + 3779x2 − 13464x+ 18113BPR-fuel → 0,37x4 − 13,4x3 + 144,9x2 − 500,8x+ 935,062
37
3 – Data analysis for subsonic flight
Pressure Ratio
PR-C → 1,6x3 − 63,9x2 − 1124,9x+ 1089,3PR-HC → −3x3 + 124x2 − 2660x+ 23510PR-NOx → 7x3 + 307x2 − 5354x+ 31942PR-fuel → −0,6x3 + 26,6x2 − 448,7x+ 2686,4
38
3.1 – Fourth degree polynomial
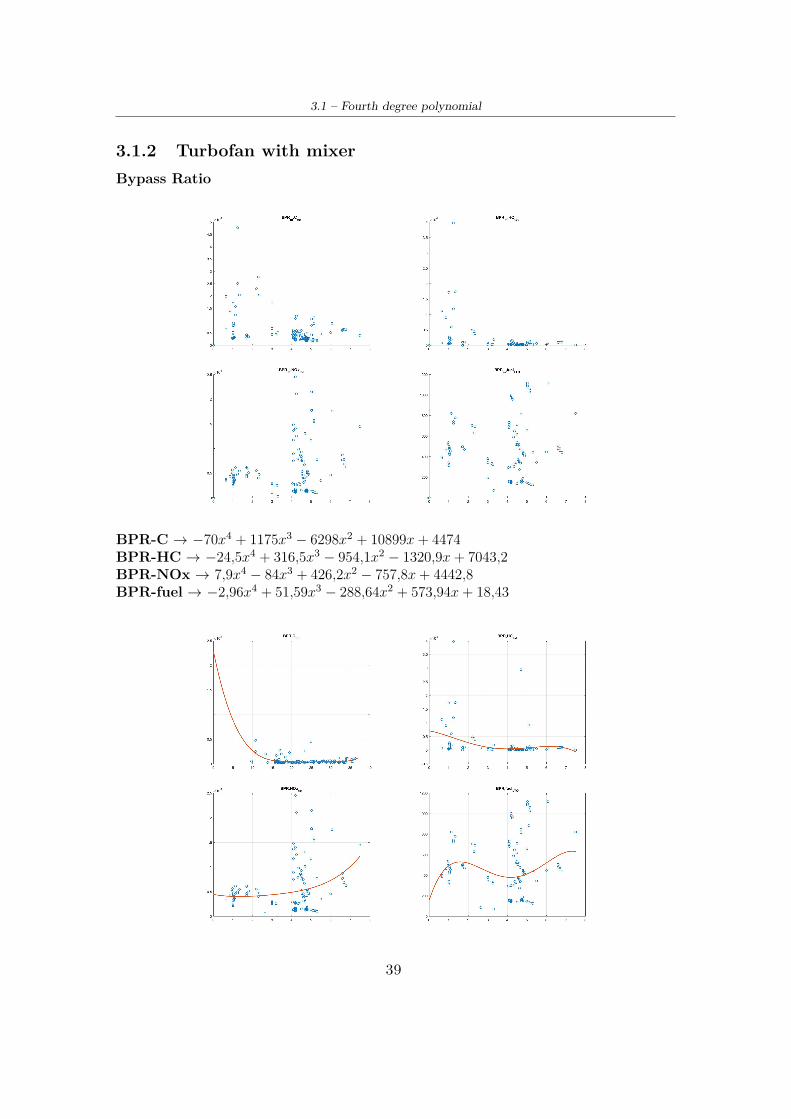
3.1.2 Turbofan with mixerBypass Ratio
BPR-C → −70x4 + 1175x3 − 6298x2 + 10899x+ 4474BPR-HC → −24,5x4 + 316,5x3 − 954,1x2 − 1320,9x+ 7043,2BPR-NOx → 7,9x4 − 84x3 + 426,2x2 − 757,8x+ 4442,8BPR-fuel → −2,96x4 + 51,59x3 − 288,64x2 + 573,94x+ 18,43
39
3 – Data analysis for subsonic flight
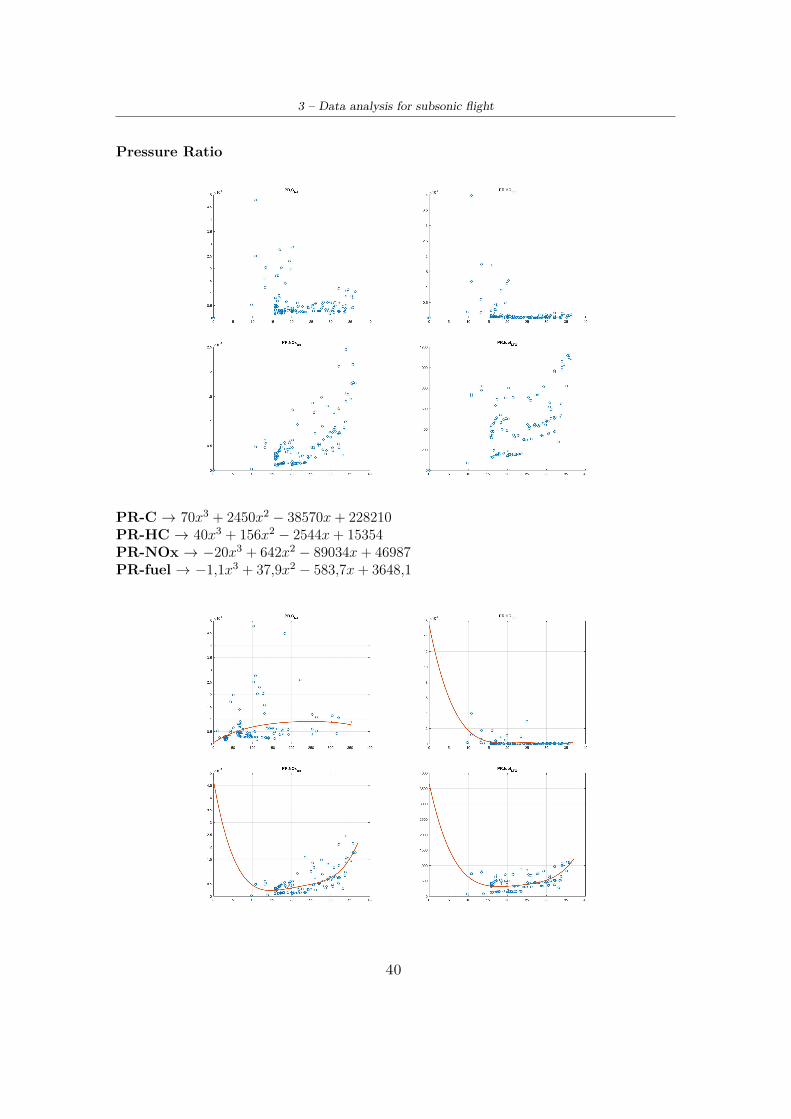
Pressure Ratio
PR-C → 70x3 + 2450x2 − 38570x+ 228210PR-HC → 40x3 + 156x2 − 2544x+ 15354PR-NOx → −20x3 + 642x2 − 89034x+ 46987PR-fuel → −1,1x3 + 37,9x2 − 583,7x+ 3648,1
40

3.2 – Curve fitting
3.2 Curve fittingA more optimized model was then used to carry out this study: the Curve Fitting. Withthis Tool in Matlab App, is possible choosen among various functions to rappresentandinterpolate data. After having chosen the function, and set the parameters, Matlab returnsthe errors and results.The 2-3 variables to be analyzed and the name of the interpolation curve are selected. Thenthe data approximation function is selected: each one has characteristics or parameters thatcan be modified at will, if necessary.There are many possible functions that can be implemented in order to interpolate theentered data:
• Exponential
• Fourier
• Gaussian
• Interpolant
• Linear Fitting
• Polynomial
• Power
• Rationall
• Smoothing Spline
• Sum of Sine
• Weibull
All these functions are obviously adaptable to the different specific cases. In fact, forexample, it is possible to select the degree of polynomials or the degree of power.The results obtained are:
• RMSE: Root Mean Squared Error, the most important datum; it rapresents thesquare root of the mean of the difference between model prediction and target value(look for smaller values);
• R−Squared: indicates the proportionate amount of variation in the response variabley explained by the independent variables x in the linear regression model. The largerthe R-Squared is, the more variability is explained by the linear regression model(look for R-squared close to 1);
• SSE: Standard Deviation is a statistical dispersion index, which is an estimate ofthe variability of a population of data or a random variable. It is one of the ways toexpress the dispersion of data around a position index;
• Adjusted R− Squared
41

3 – Data analysis for subsonic flight
Once the model has been selected, it is possible to use the yfit = name.predictFcn(x)function in the workspace, so as to insert a value of the independent variable and obtain,through the selected regression model, the corresponding value of the dependent variable.
It is necessary to highlight that the analysis carried out and the obtained graphs areonly a basis on which to develop assumptions and to have reference values that can becompared with the analysis in the supersonic field. They were not suitable for a specificstudy on a subsonic motor model.
42
3.2 – Curve fitting
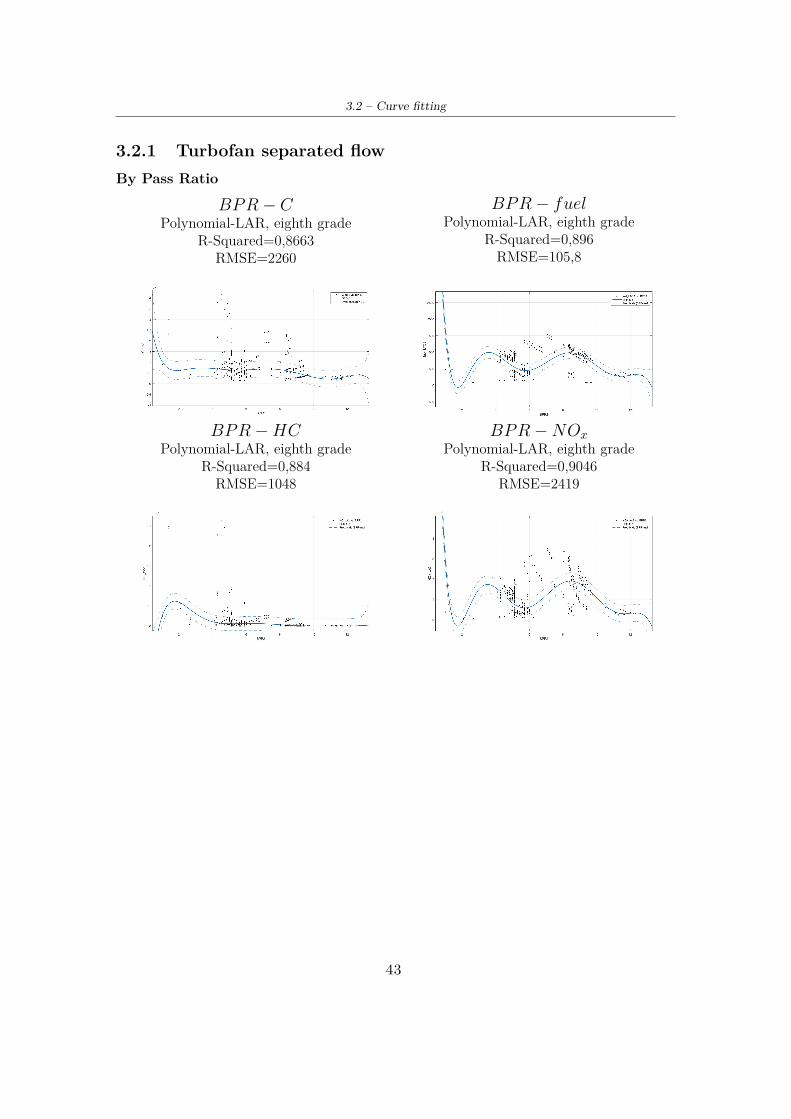
3.2.1 Turbofan separated flowBy Pass Ratio
BPR− CPolynomial-LAR, eighth grade
R-Squared=0,8663RMSE=2260
BPR− fuelPolynomial-LAR, eighth grade
R-Squared=0,896RMSE=105,8
BPR−HCPolynomial-LAR, eighth grade
R-Squared=0,884RMSE=1048
BPR−NOxPolynomial-LAR, eighth grade
R-Squared=0,9046RMSE=2419
43
3 – Data analysis for subsonic flight
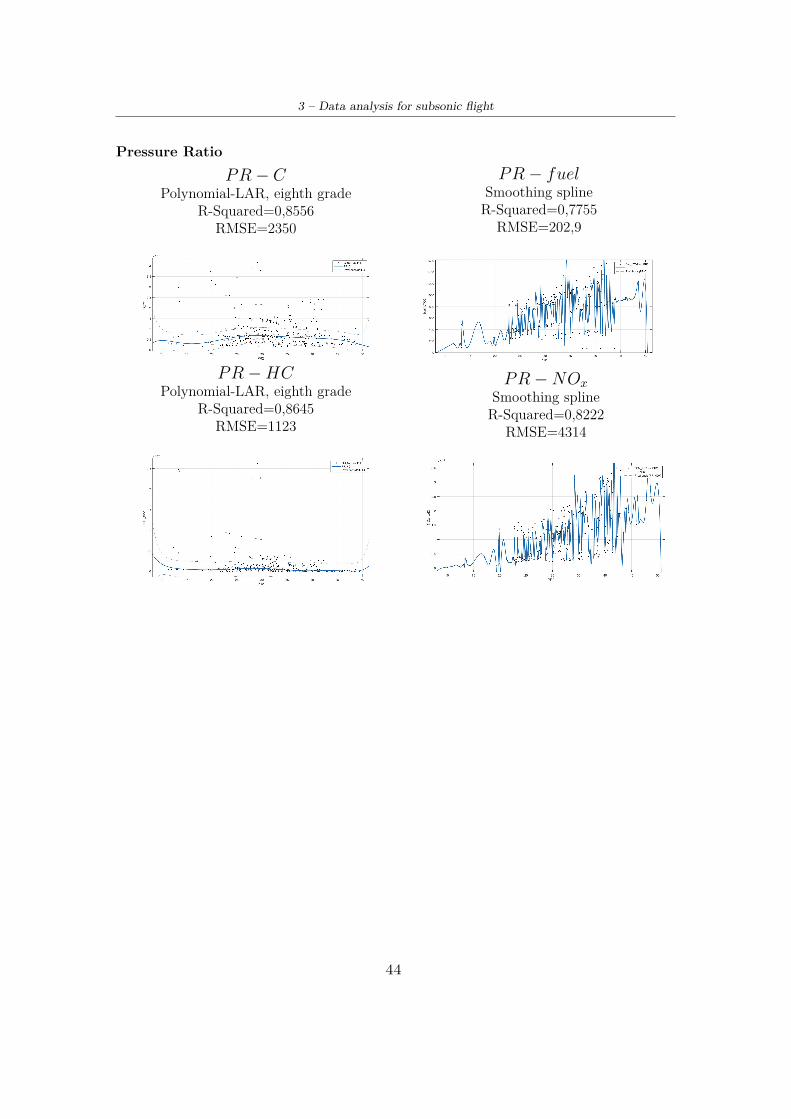
Pressure RatioPR− C
Polynomial-LAR, eighth gradeR-Squared=0,8556
RMSE=2350
PR− fuelSmoothing splineR-Squared=0,7755
RMSE=202,9
PR−HCPolynomial-LAR, eighth grade
R-Squared=0,8645RMSE=1123
PR−NOxSmoothing splineR-Squared=0,8222
RMSE=4314
44
3.2 – Curve fitting
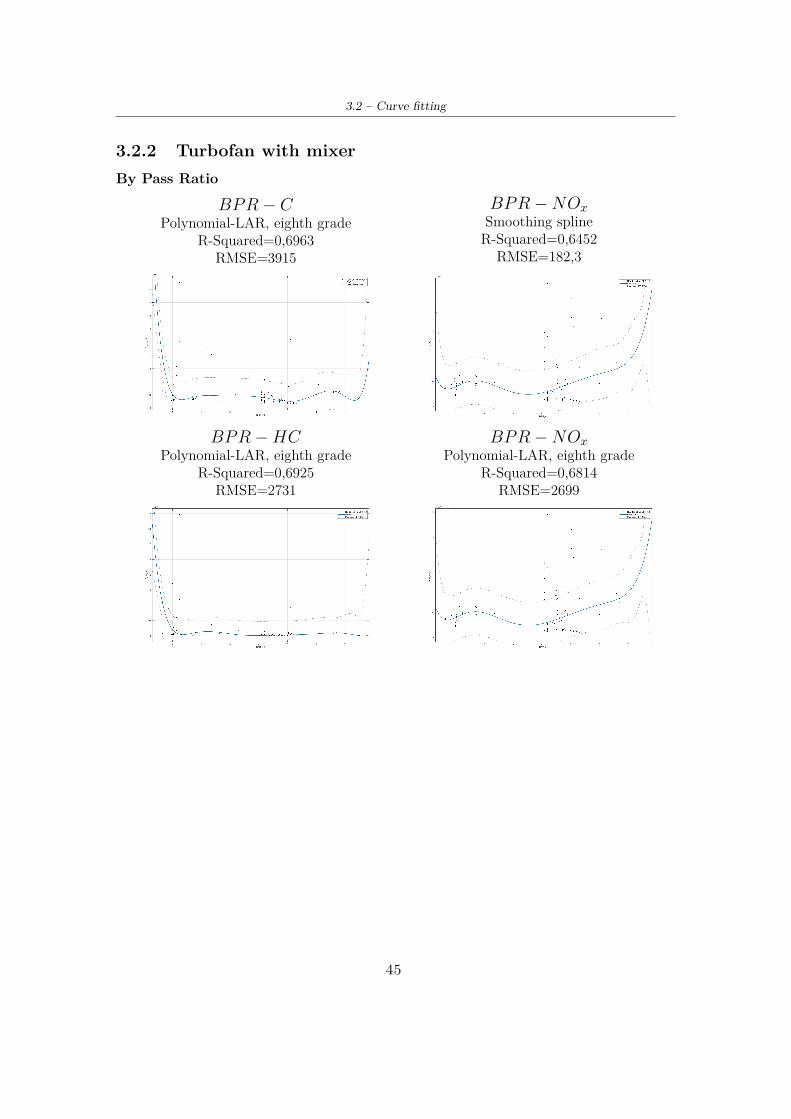
3.2.2 Turbofan with mixerBy Pass Ratio
BPR− CPolynomial-LAR, eighth grade
R-Squared=0,6963RMSE=3915
BPR−NOxSmoothing splineR-Squared=0,6452
RMSE=182,3
BPR−HCPolynomial-LAR, eighth grade
R-Squared=0,6925RMSE=2731
BPR−NOxPolynomial-LAR, eighth grade
R-Squared=0,6814RMSE=2699
45
3 – Data analysis for subsonic flight
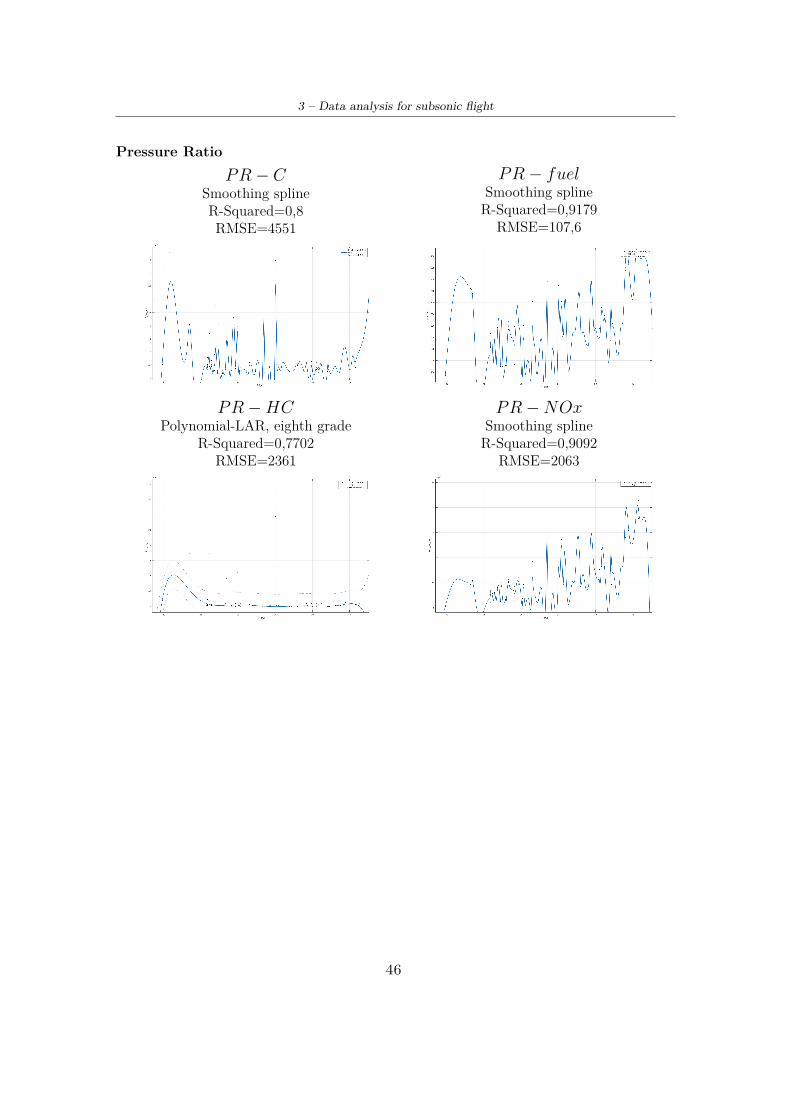
Pressure RatioPR− C
Smoothing splineR-Squared=0,8RMSE=4551
PR− fuelSmoothing splineR-Squared=0,9179
RMSE=107,6
PR−HCPolynomial-LAR, eighth grade
R-Squared=0,7702RMSE=2361
PR−NOxSmoothing splineR-Squared=0,9092
RMSE=2063
46
3.3 – Final results
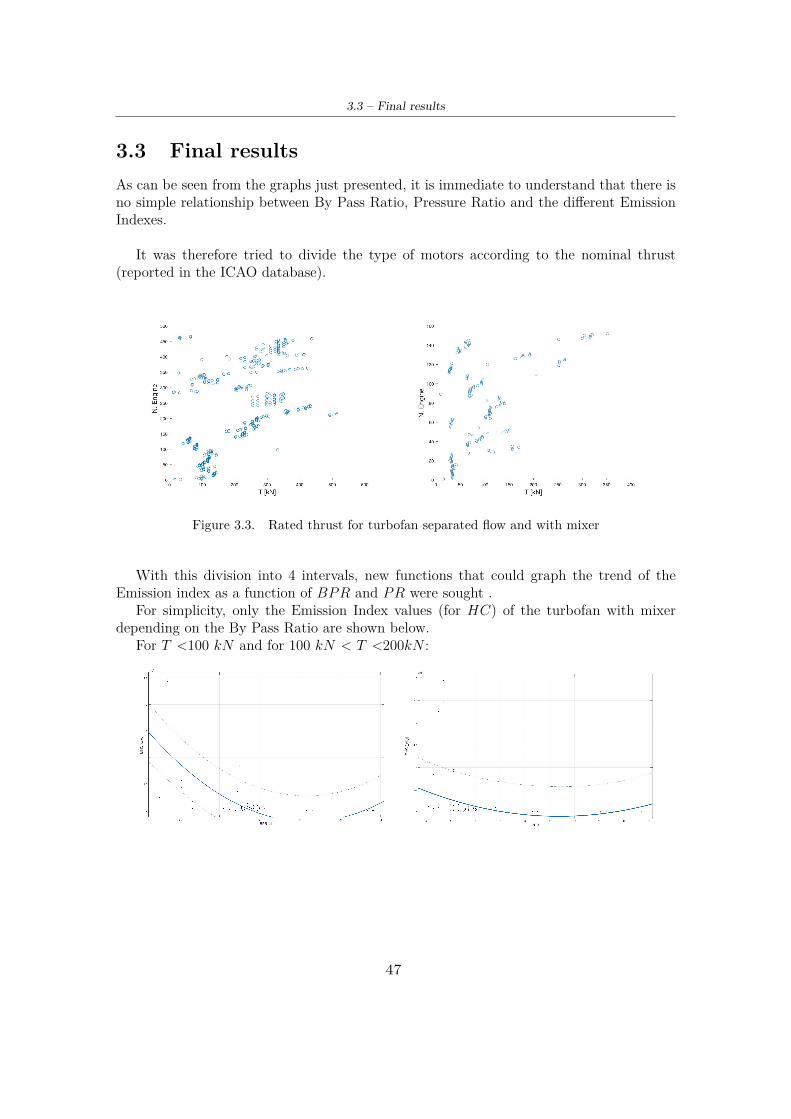
3.3 Final resultsAs can be seen from the graphs just presented, it is immediate to understand that there isno simple relationship between By Pass Ratio, Pressure Ratio and the different EmissionIndexes.
It was therefore tried to divide the type of motors according to the nominal thrust(reported in the ICAO database).
Figure 3.3. Rated thrust for turbofan separated flow and with mixer
With this division into 4 intervals, new functions that could graph the trend of theEmission index as a function of BPR and PR were sought .
For simplicity, only the Emission Index values (for HC) of the turbofan with mixerdepending on the By Pass Ratio are shown below.
For T <100 kN and for 100 kN < T <200kN :
47
3 – Data analysis for subsonic flight
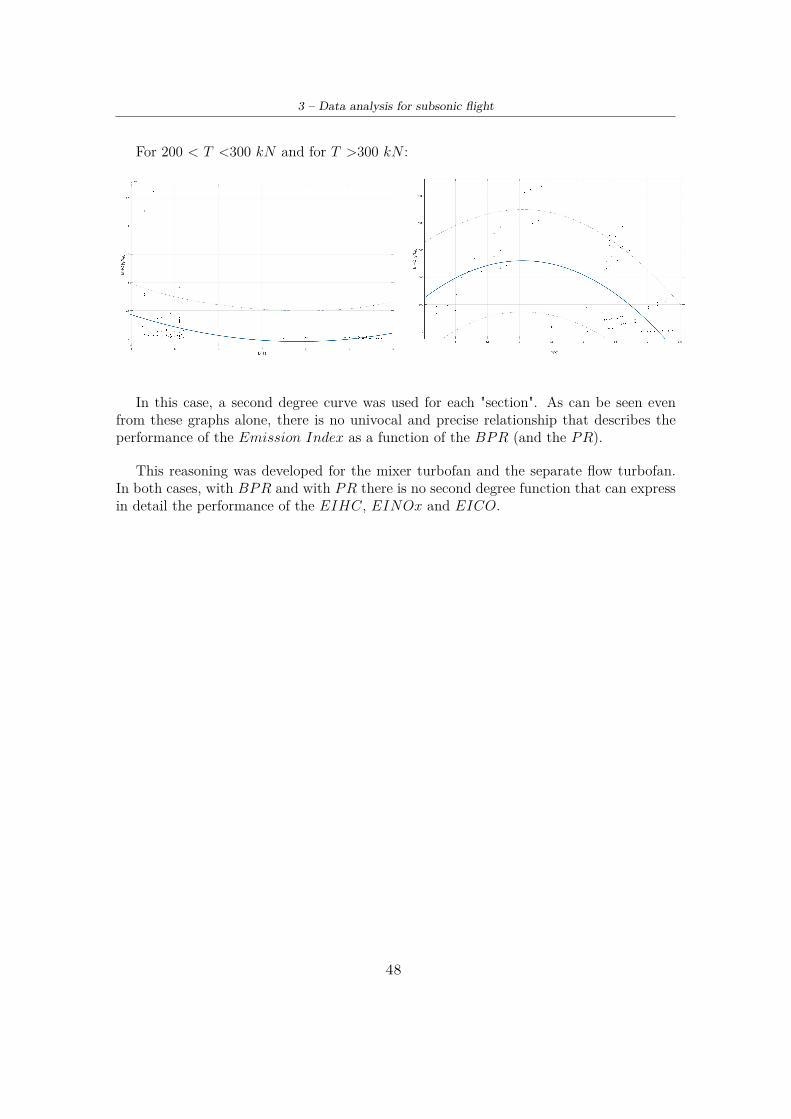
For 200 < T <300 kN and for T >300 kN :
In this case, a second degree curve was used for each "section". As can be seen evenfrom these graphs alone, there is no univocal and precise relationship that describes theperformance of the Emission Index as a function of the BPR (and the PR).
This reasoning was developed for the mixer turbofan and the separate flow turbofan.In both cases, with BPR and with PR there is no second degree function that can expressin detail the performance of the EIHC, EINOx and EICO.
48
Chapter 4
Subsonic Emission Methodduring LTO and CCD
4.1 Calculation of the quantity of emissionsThis section presents a model to calculate the quantity and type of emissions emitted bythe engines of subsonic civil aircraft.
From the ICAO database it is possible to read the emission index data [ gkgfuel
] for HC,CO and NOx in the 4 different phases of the Landing-Take off cycle.
Furthermore, there are the fuel flow [kgs ] values for each of these phases: take off, climb,approach, taxi/idle. For each phase of the LTO cycle, the duration in the time intervaland the percentage of nominal thrust used are known.
Phase Time [min] ThrustTake-off 0.7 100%FClimb 2.2 85% FApproach 4.0 30% FTaxi/ground idle 26.0 7% F
Table 4.1. Time in operating mode and thrust setting
For the calculation of the emission quantity, the following simple formula is applied:
Emissioni,k = EIi,kwf,k∆t
Where the subscript i corresponds to the type of emission and k, to the phase of the LTOcycle to be analyzed.
The emissions of H2O, SOx and CO2 can also be analyzed. In fact, the emission indexesof these particular emissions can be considered constant, and are shown below:
EICO2 = 3160 g
kg
49
4 – Subsonic Emission Method during LTO and CCD
EIH2O = 1240 g
kg
EISOx = 0.6 g
kg
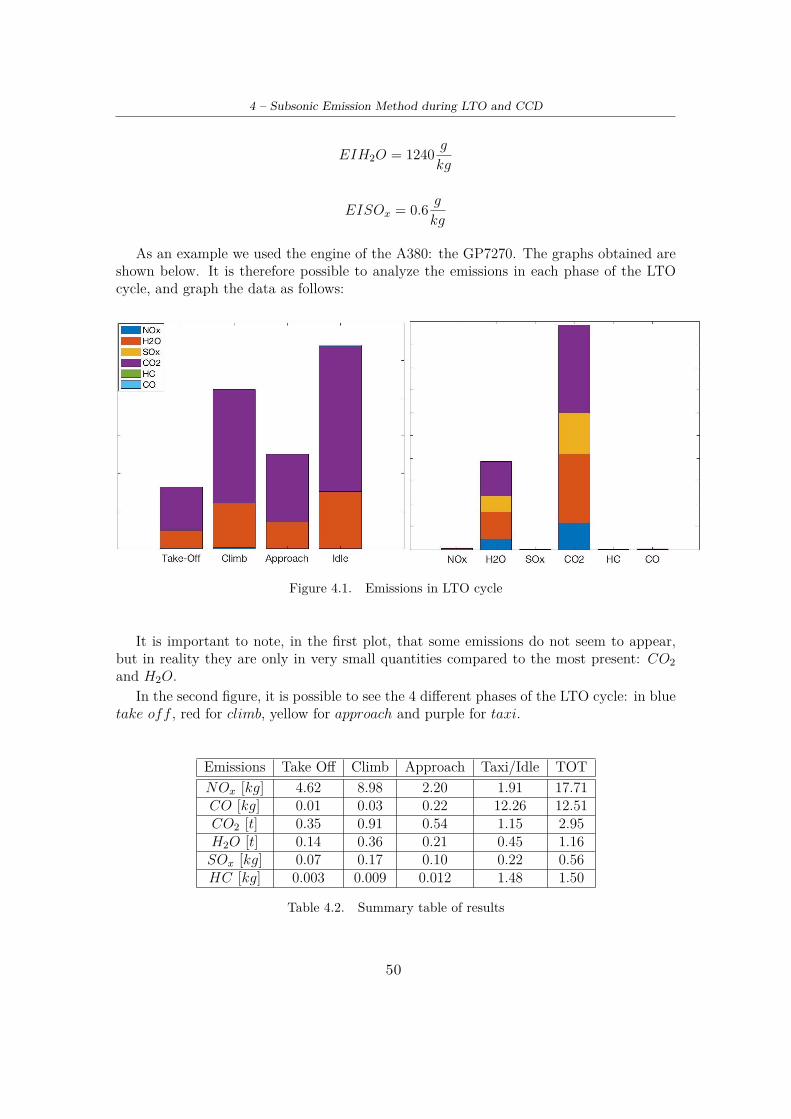
As an example we used the engine of the A380: the GP7270. The graphs obtained areshown below. It is therefore possible to analyze the emissions in each phase of the LTOcycle, and graph the data as follows:
Figure 4.1. Emissions in LTO cycle
It is important to note, in the first plot, that some emissions do not seem to appear,but in reality they are only in very small quantities compared to the most present: CO2and H2O.
In the second figure, it is possible to see the 4 different phases of the LTO cycle: in bluetake off , red for climb, yellow for approach and purple for taxi.
Emissions Take Off Climb Approach Taxi/Idle TOTNOx [kg] 4.62 8.98 2.20 1.91 17.71CO [kg] 0.01 0.03 0.22 12.26 12.51CO2 [t] 0.35 0.91 0.54 1.15 2.95H2O [t] 0.14 0.36 0.21 0.45 1.16SOx [kg] 0.07 0.17 0.10 0.22 0.56HC [kg] 0.003 0.009 0.012 1.48 1.50
Table 4.2. Summary table of results
50
4.2 – Fuel Flow Method 2
4.2 Fuel Flow Method 2The method for calculating aircraft engine emissions requires the knowledge of the engineinternal gas path parameters at the high compressor exit /combustor inlet. These are totalpressure P3, total temperature T3 and, obviously, the engine fuel flow WF . For calculatingNOx emissions is required the knowledge of ambient atmospheric humidity.
In order to obtain the emission index for HC, CO and NOx it is necessary to definethe aircraft mission, and after that to execute a code that predicts airplane performance.The code’s outputs are thrust and fuel flow in different points along the mission.
This information is then used as input to an engine performance model. This modelcalculates P3 and T3 for each point of the mission. Then, it is possible to use these data tocalculate the emission indexes at sea level (EINOx,sl, EICOsl, EIHCsl). These referenceemission indexes are therefore corrected to flight conditions using the following equations:
EICOalt = EICOsl(P3,sl
P3,alt)x( FARsl
FARalt)z
EIHCalt = EIHCsl(P3,sl
P3,alt)x( FARsl
FARalt)z
EINOx,alt = EINOx,sl(P3,alt
P3,sl)y(FARalt
FARsl)zeH
The exponents y and x are combustor unique and are empirically derived by the manu-facturers. The value for the NOx pressure exponent y has been seen to range between 0.2and 0.5. Theoretically the value of y is 0.5, while published empirical data would suggest atypical value of 0.43. The value of exponent x, for the HC and CO pressure, is assumed tobe 1.0. The exponent z is actually 0 for conventional rich front and single annular combus-tors and so this term drops out of the equations. The NOx equation includes a humidityfactor, eH which was originally developed from 19 engine samples of JT9D’s production.[26]
The P3T3 method determines the emission indexes firstly by using the T3 at altitudein order to look for an Emission Index at sea level, and then applying a pressure correc-tion. Using the P3T3 method requires deep knowledges of aircraft engine and access toproprietary performance models. It is therefore necessary to use a different method to beable to calculate the emission index. A method based on the most commonly available nonproprietary indicator of engine power setting was pursued, the engine fuel flow. Enginepower in flight can be known as fuel flow, therefore if a means can correlate T3 and fuelflow then a basis for a “Fuel Flow Method” could be investigated.
Therefore emissions are correlated with T3 and then a pressure correction is applied.The first method was called “Fuel Flow Method 1”, but, compared to P3T3 method, animproved approach was necessary. This variation from Fuel Flow Method 1 is based onan energy balance across the combustor that shows that it exists a fuel flow correlationessentially represents the difference in airflow rates through the combustor between sealevel and flight conditions. [26]
51
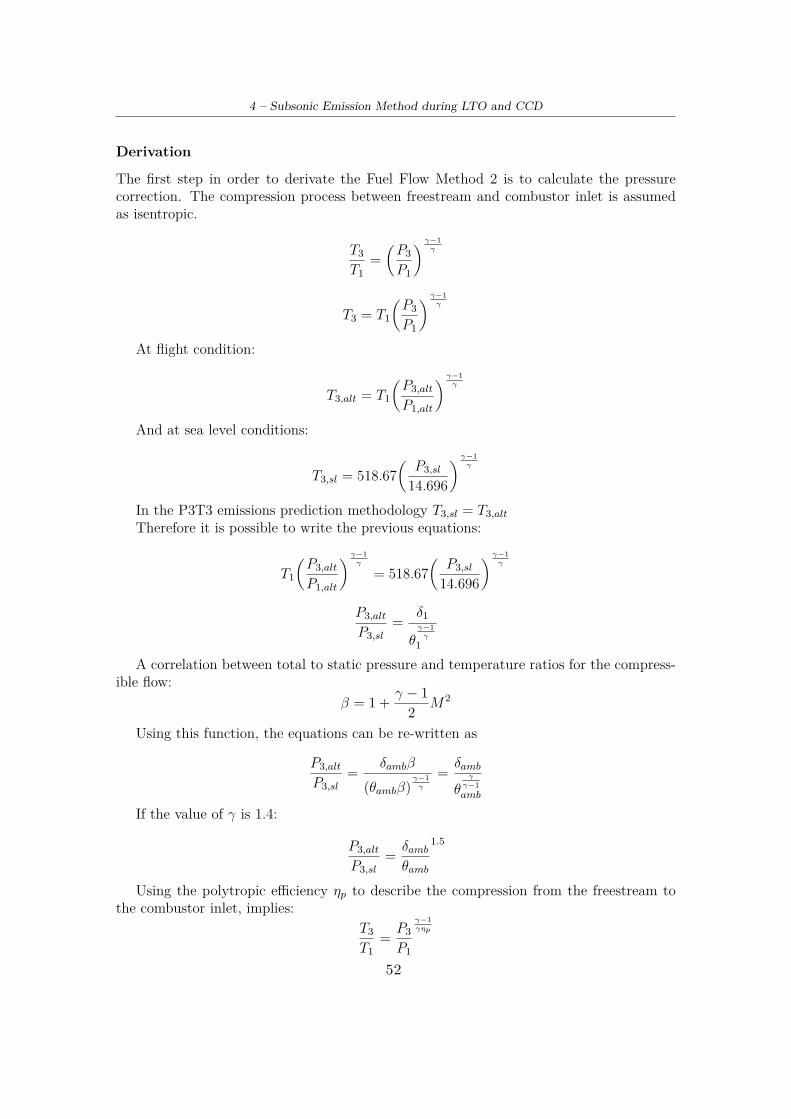
4 – Subsonic Emission Method during LTO and CCD
Derivation
The first step in order to derivate the Fuel Flow Method 2 is to calculate the pressurecorrection. The compression process between freestream and combustor inlet is assumedas isentropic.
T3
T1=3P3
P1
4 γ−1γ
T3 = T1
3P3
P1
4 γ−1γ
At flight condition:
T3,alt = T1
3P3,alt
P1,alt
4 γ−1γ
And at sea level conditions:
T3,sl = 518.673P3,sl
14.696
4 γ−1γ
In the P3T3 emissions prediction methodology T3,sl = T3,altTherefore it is possible to write the previous equations:
T1
3P3,alt
P1,alt
4 γ−1γ
= 518.673P3,sl
14.696
4 γ−1γ
P3,alt
P3,sl= δ1
θγ−1γ
1
A correlation between total to static pressure and temperature ratios for the compress-ible flow:
β = 1 + γ − 12 M2
Using this function, the equations can be re-written as
P3,alt
P3,sl= δambβ
(θambβ)γ−1γ
= δamb
θγγ−1amb
If the value of γ is 1.4:
P3,alt
P3,sl= δambθamb
1.5
Using the polytropic efficiency ηp to describe the compression from the freestream tothe combustor inlet, implies:
T3
T1= P3
P1
γ−1γηp
52
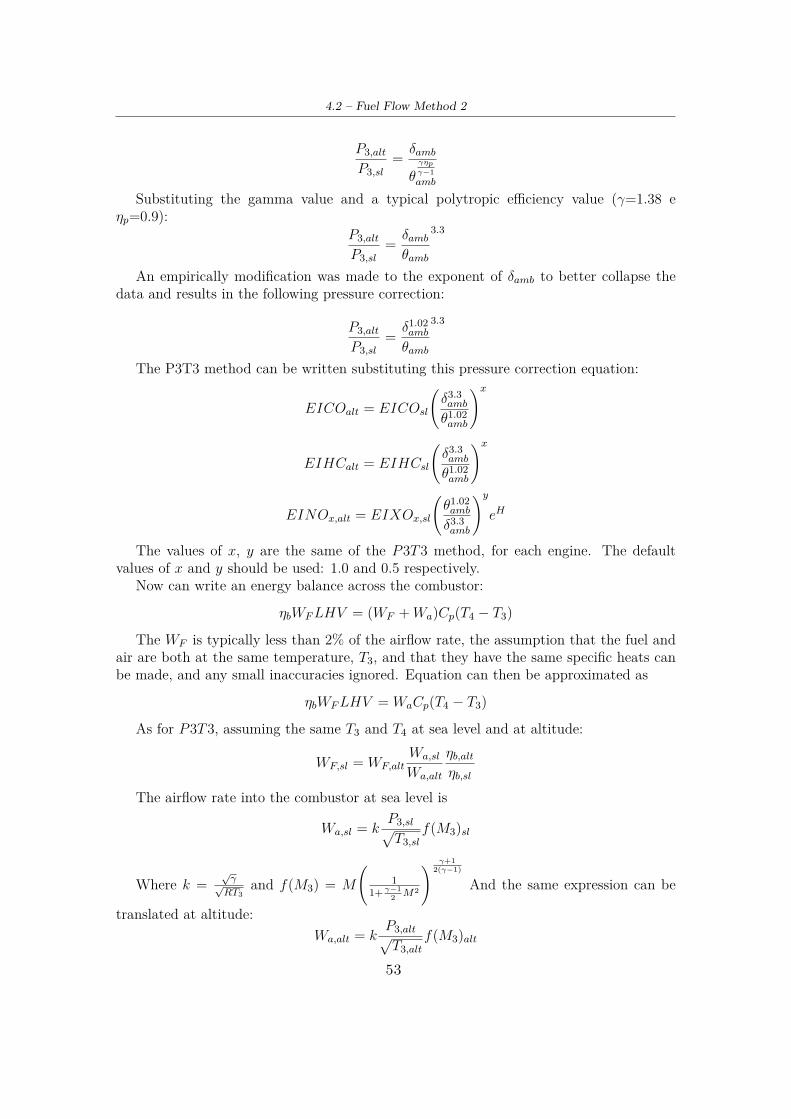
4.2 – Fuel Flow Method 2
P3,alt
P3,sl= δamb
θγηpγ−1amb
Substituting the gamma value and a typical polytropic efficiency value (γ=1.38 eηp=0.9):
P3,alt
P3,sl= δambθamb
3.3
An empirically modification was made to the exponent of δamb to better collapse thedata and results in the following pressure correction:
P3,alt
P3,sl= δ1.02
amb
θamb
3.3
The P3T3 method can be written substituting this pressure correction equation:
EICOalt = EICOsl
Aδ3.3amb
θ1.02amb
Bx
EIHCalt = EIHCsl
Aδ3.3amb
θ1.02amb
Bx
EINOx,alt = EIXOx,sl
Aθ1.02amb
δ3.3amb
ByeH
The values of x, y are the same of the P3T3 method, for each engine. The defaultvalues of x and y should be used: 1.0 and 0.5 respectively.
Now can write an energy balance across the combustor:
ηbWFLHV = (WF +Wa)Cp(T4 − T3)
The WF is typically less than 2% of the airflow rate, the assumption that the fuel andair are both at the same temperature, T3, and that they have the same specific heats canbe made, and any small inaccuracies ignored. Equation can then be approximated as
ηbWFLHV = WaCp(T4 − T3)
As for P3T3, assuming the same T3 and T4 at sea level and at altitude:
WF,sl = WF,altWa,sl
Wa,alt
ηb,altηb,sl
The airflow rate into the combustor at sea level is
Wa,sl = kP3,slðT3,sl
f(M3)sl
Where k =√γ√RT3
and f(M3) = M
A1
1+ γ−12 M2
B γ+12(γ−1)
And the same expression can be
translated at altitude:Wa,alt = k
P3,altðT3,alt
f(M3)alt
53
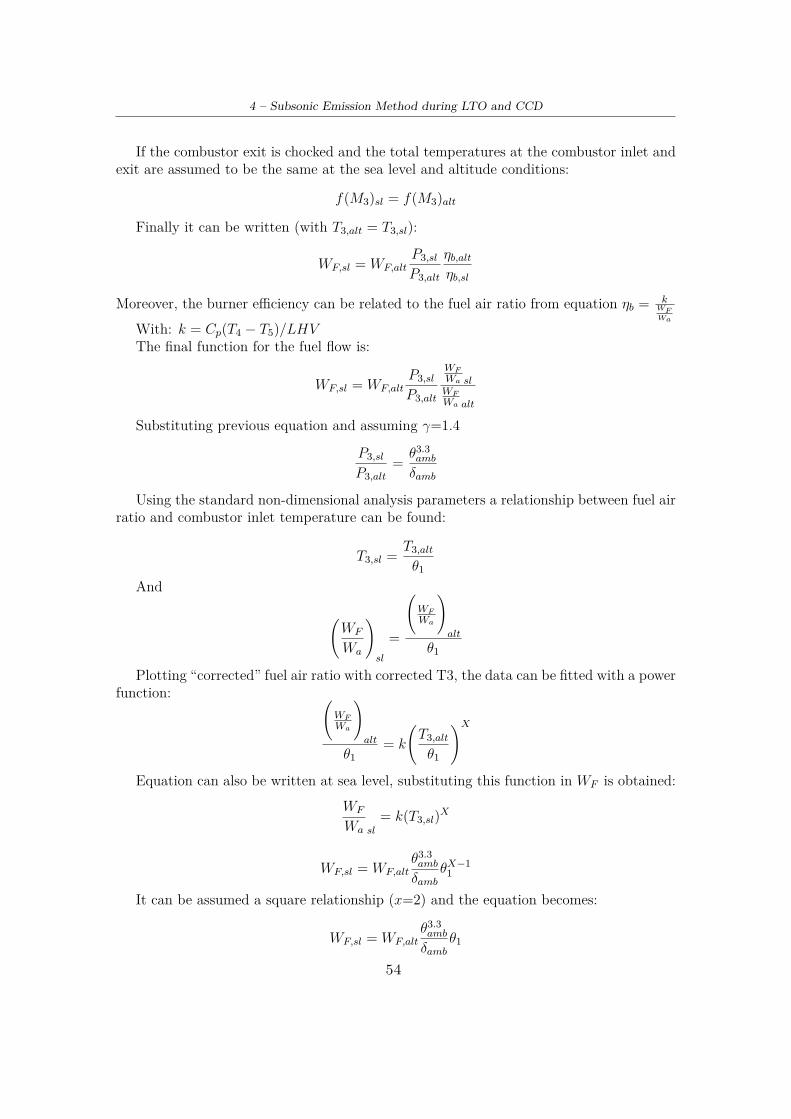
4 – Subsonic Emission Method during LTO and CCD
If the combustor exit is chocked and the total temperatures at the combustor inlet andexit are assumed to be the same at the sea level and altitude conditions:
f(M3)sl = f(M3)alt
Finally it can be written (with T3,alt = T3,sl):
WF,sl = WF,altP3,sl
P3,alt
ηb,altηb,sl
Moreover, the burner efficiency can be related to the fuel air ratio from equation ηb = kWFWa
With: k = Cp(T4 − T5)/LHVThe final function for the fuel flow is:
WF,sl = WF,altP3,sl
P3,alt
WF
Wa slWF
Wa alt
Substituting previous equation and assuming γ=1.4
P3,sl
P3,alt= θ3.3
amb
δamb
Using the standard non-dimensional analysis parameters a relationship between fuel airratio and combustor inlet temperature can be found:
T3,sl = T3,alt
θ1
And
AWF
Wa
Bsl
=
AWF
Wa
Balt
θ1
Plotting “corrected” fuel air ratio with corrected T3, the data can be fitted with a powerfunction: A
WF
Wa
Balt
θ1= k
AT3,alt
θ1
BXEquation can also be written at sea level, substituting this function in WF is obtained:
WF
Wa sl
= k(T3,sl)X
WF,sl = WF,altθ3.3amb
δambθX−1
1
It can be assumed a square relationship (x=2) and the equation becomes:
WF,sl = WF,altθ3.3amb
δambθ1
54
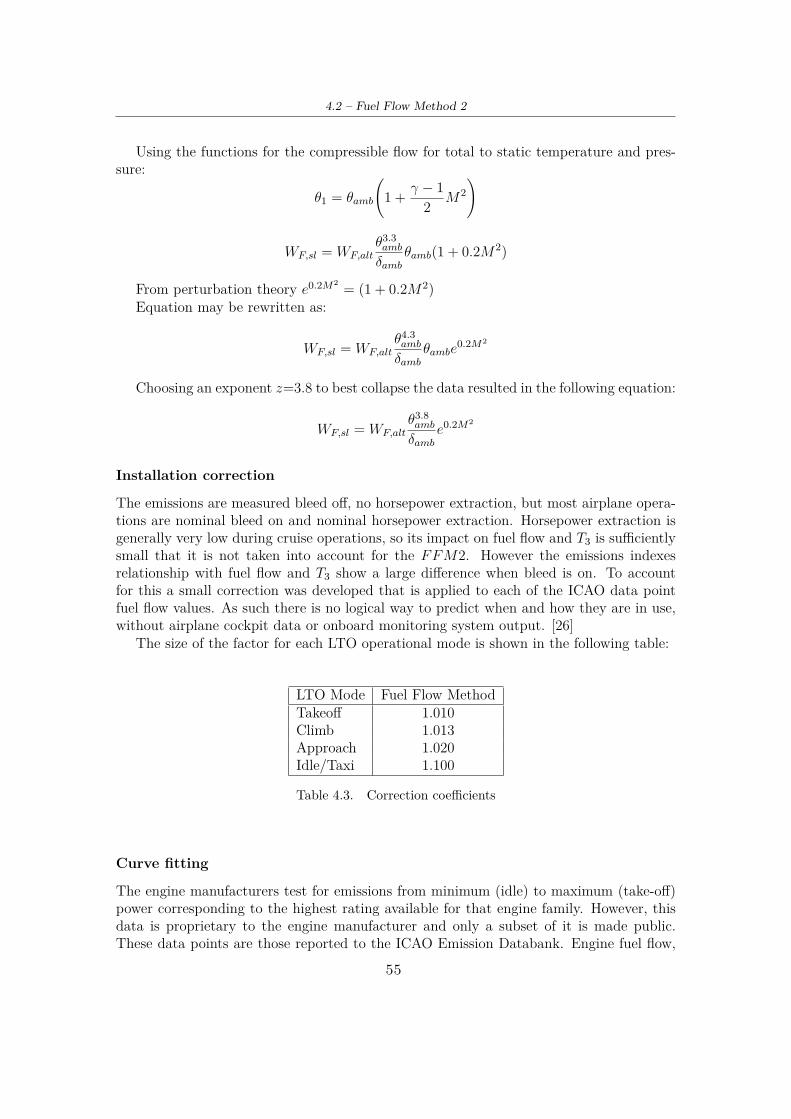
4.2 – Fuel Flow Method 2
Using the functions for the compressible flow for total to static temperature and pres-sure:
θ1 = θamb
A1 + γ − 1
2 M2B
WF,sl = WF,altθ3.3amb
δambθamb(1 + 0.2M2)
From perturbation theory e0.2M2 = (1 + 0.2M2)Equation may be rewritten as:
WF,sl = WF,altθ4.3amb
δambθambe
0.2M2
Choosing an exponent z=3.8 to best collapse the data resulted in the following equation:
WF,sl = WF,altθ3.8amb
δambe0.2M2
Installation correction
The emissions are measured bleed off, no horsepower extraction, but most airplane opera-tions are nominal bleed on and nominal horsepower extraction. Horsepower extraction isgenerally very low during cruise operations, so its impact on fuel flow and T3 is sufficientlysmall that it is not taken into account for the FFM2. However the emissions indexesrelationship with fuel flow and T3 show a large difference when bleed is on. To accountfor this a small correction was developed that is applied to each of the ICAO data pointfuel flow values. As such there is no logical way to predict when and how they are in use,without airplane cockpit data or onboard monitoring system output. [26]
The size of the factor for each LTO operational mode is shown in the following table:
LTO Mode Fuel Flow MethodTakeoff 1.010Climb 1.013Approach 1.020Idle/Taxi 1.100
Table 4.3. Correction coefficients
Curve fitting
The engine manufacturers test for emissions from minimum (idle) to maximum (take-off)power corresponding to the highest rating available for that engine family. However, thisdata is proprietary to the engine manufacturer and only a subset of it is made public.These data points are those reported to the ICAO Emission Databank. Engine fuel flow,
55
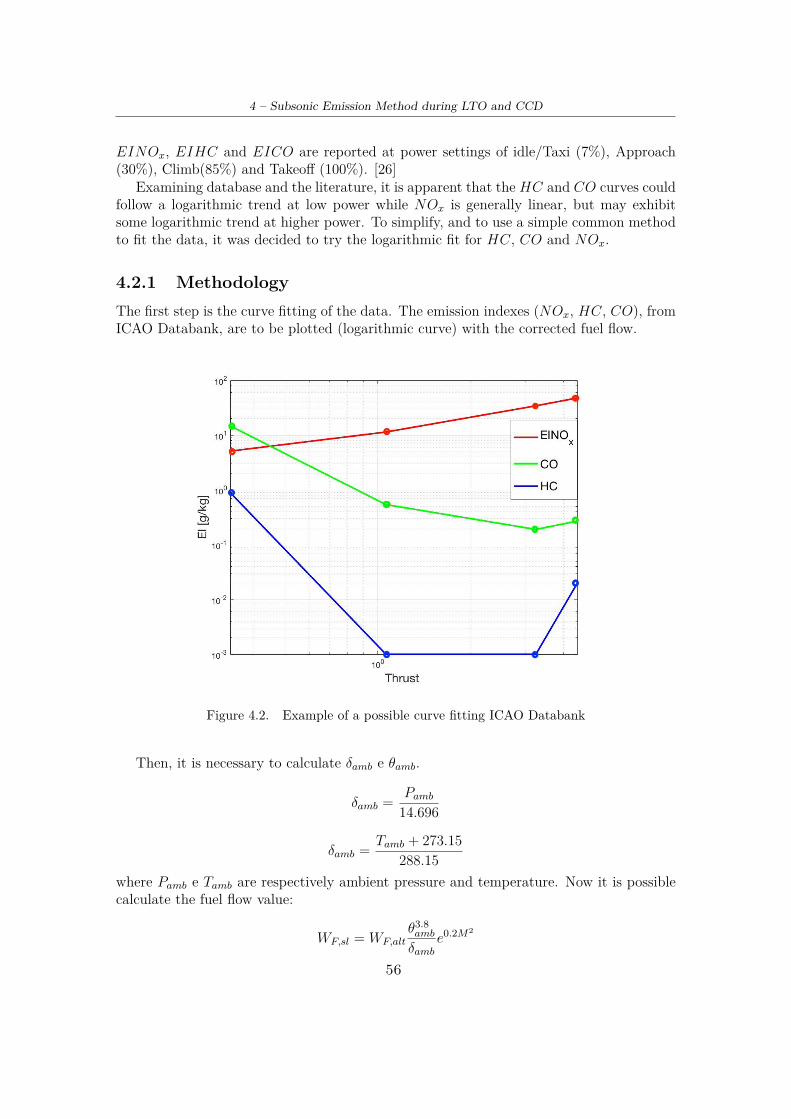
4 – Subsonic Emission Method during LTO and CCD
EINOx, EIHC and EICO are reported at power settings of idle/Taxi (7%), Approach(30%), Climb(85%) and Takeoff (100%). [26]
Examining database and the literature, it is apparent that the HC and CO curves couldfollow a logarithmic trend at low power while NOx is generally linear, but may exhibitsome logarithmic trend at higher power. To simplify, and to use a simple common methodto fit the data, it was decided to try the logarithmic fit for HC, CO and NOx.
4.2.1 MethodologyThe first step is the curve fitting of the data. The emission indexes (NOx, HC, CO), fromICAO Databank, are to be plotted (logarithmic curve) with the corrected fuel flow.
Figure 4.2. Example of a possible curve fitting ICAO Databank
Then, it is necessary to calculate δamb e θamb.
δamb = Pamb14.696
δamb = Tamb + 273.15288.15
where Pamb e Tamb are respectively ambient pressure and temperature. Now it is possiblecalculate the fuel flow value:
WF,sl = WF,altθ3.8amb
δambe0.2M2
56
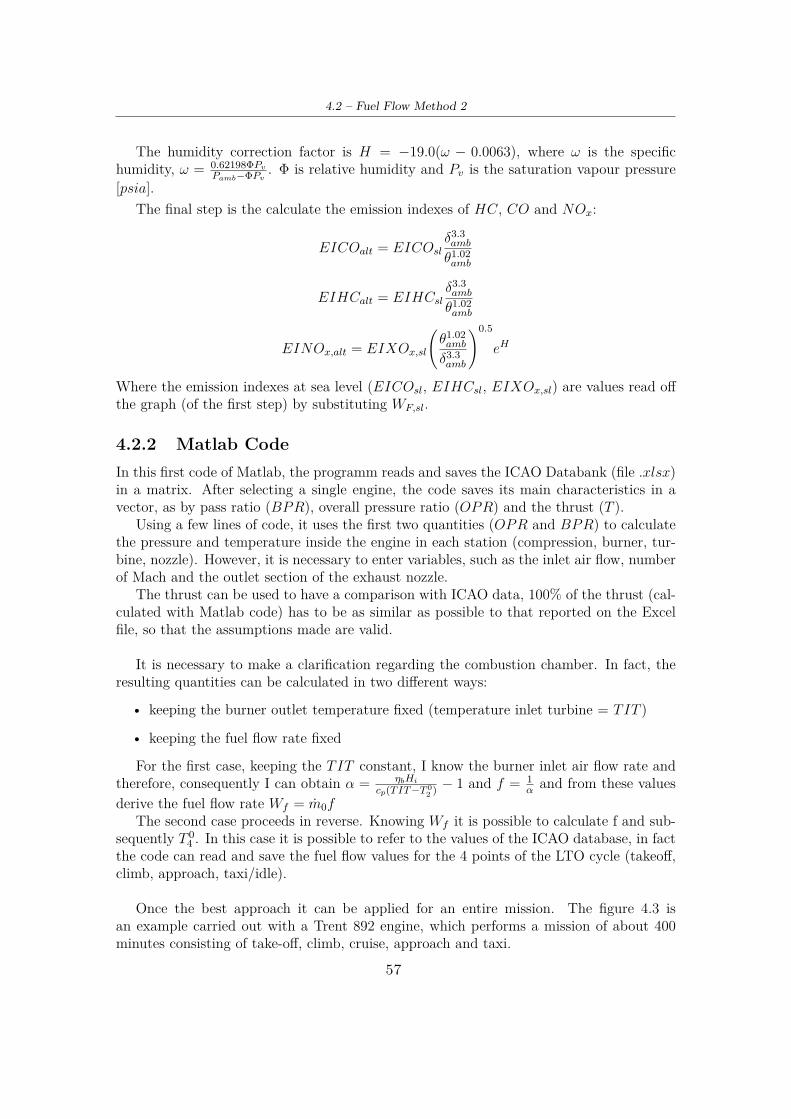
4.2 – Fuel Flow Method 2
The humidity correction factor is H = −19.0(ω − 0.0063), where ω is the specifichumidity, ω = 0.62198ΦPv
Pamb−ΦPv . Φ is relative humidity and Pv is the saturation vapour pressure[psia].
The final step is the calculate the emission indexes of HC, CO and NOx:
EICOalt = EICOslδ3.3amb
θ1.02amb
EIHCalt = EIHCslδ3.3amb
θ1.02amb
EINOx,alt = EIXOx,sl
Aθ1.02amb
δ3.3amb
B0.5
eH
Where the emission indexes at sea level (EICOsl, EIHCsl, EIXOx,sl) are values read offthe graph (of the first step) by substituting WF,sl.
4.2.2 Matlab CodeIn this first code of Matlab, the programm reads and saves the ICAO Databank (file .xlsx)in a matrix. After selecting a single engine, the code saves its main characteristics in avector, as by pass ratio (BPR), overall pressure ratio (OPR) and the thrust (T ).
Using a few lines of code, it uses the first two quantities (OPR and BPR) to calculatethe pressure and temperature inside the engine in each station (compression, burner, tur-bine, nozzle). However, it is necessary to enter variables, such as the inlet air flow, numberof Mach and the outlet section of the exhaust nozzle.
The thrust can be used to have a comparison with ICAO data, 100% of the thrust (cal-culated with Matlab code) has to be as similar as possible to that reported on the Excelfile, so that the assumptions made are valid.
It is necessary to make a clarification regarding the combustion chamber. In fact, theresulting quantities can be calculated in two different ways:
• keeping the burner outlet temperature fixed (temperature inlet turbine = TIT )
• keeping the fuel flow rate fixed
For the first case, keeping the TIT constant, I know the burner inlet air flow rate andtherefore, consequently I can obtain α = ηbHi
cp(TIT−T 02 ) − 1 and f = 1
α and from these valuesderive the fuel flow rate Wf = m0f
The second case proceeds in reverse. Knowing Wf it is possible to calculate f and sub-sequently T 0
4 . In this case it is possible to refer to the values of the ICAO database, in factthe code can read and save the fuel flow values for the 4 points of the LTO cycle (takeoff,climb, approach, taxi/idle).
Once the best approach it can be applied for an entire mission. The figure 4.3 isan example carried out with a Trent 892 engine, which performs a mission of about 400minutes consisting of take-off, climb, cruise, approach and taxi.
57
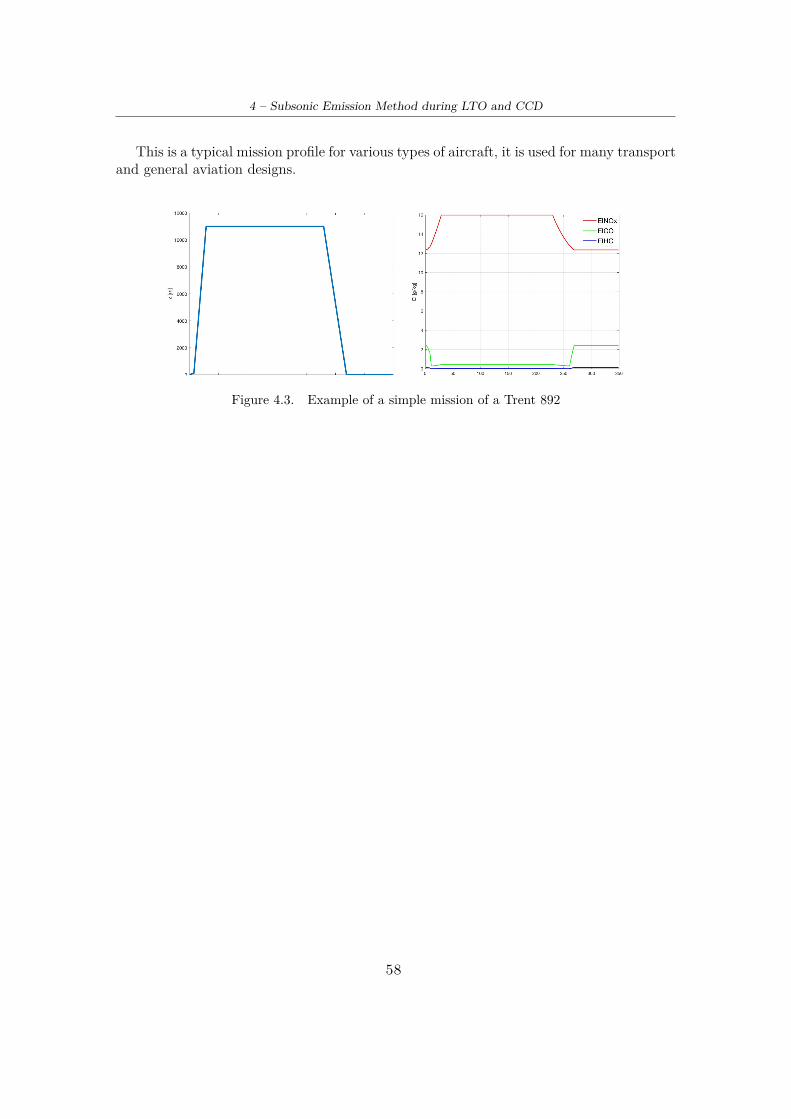
4 – Subsonic Emission Method during LTO and CCD
This is a typical mission profile for various types of aircraft, it is used for many transportand general aviation designs.
Figure 4.3. Example of a simple mission of a Trent 892
58
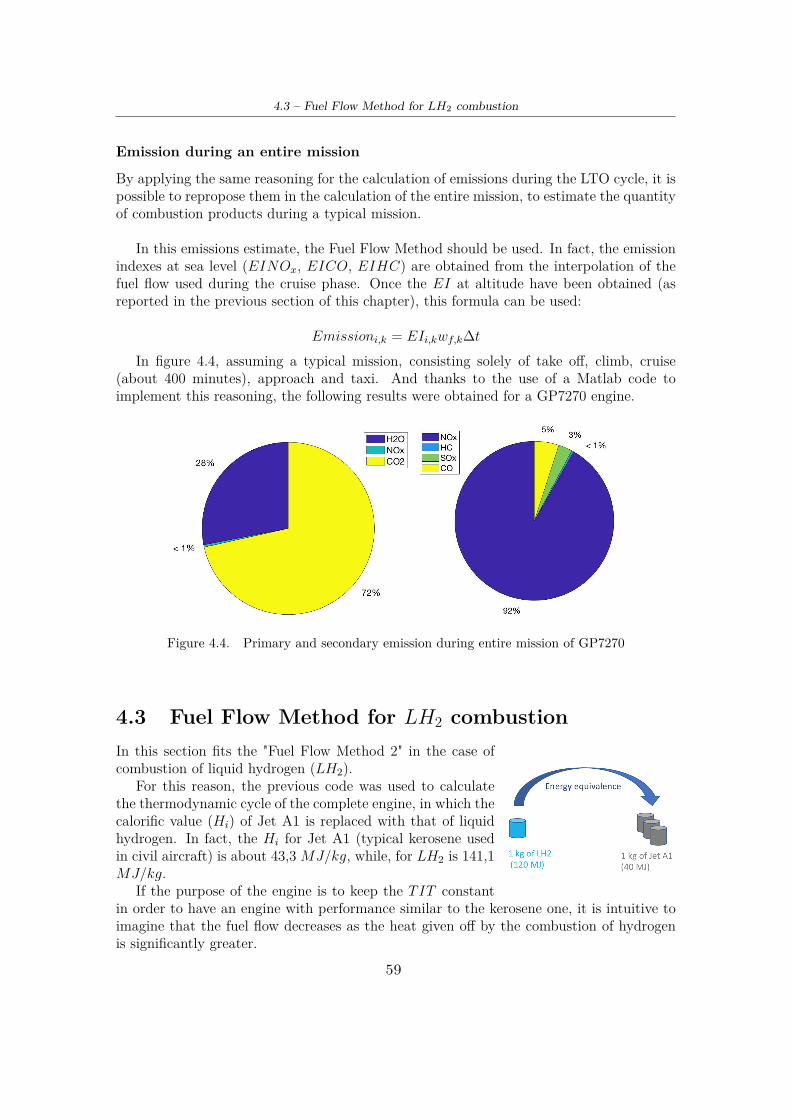
4.3 – Fuel Flow Method for LH2 combustion
Emission during an entire mission
By applying the same reasoning for the calculation of emissions during the LTO cycle, it ispossible to repropose them in the calculation of the entire mission, to estimate the quantityof combustion products during a typical mission.
In this emissions estimate, the Fuel Flow Method should be used. In fact, the emissionindexes at sea level (EINOx, EICO, EIHC) are obtained from the interpolation of thefuel flow used during the cruise phase. Once the EI at altitude have been obtained (asreported in the previous section of this chapter), this formula can be used:
Emissioni,k = EIi,kwf,k∆tIn figure 4.4, assuming a typical mission, consisting solely of take off, climb, cruise
(about 400 minutes), approach and taxi. And thanks to the use of a Matlab code toimplement this reasoning, the following results were obtained for a GP7270 engine.
Figure 4.4. Primary and secondary emission during entire mission of GP7270
4.3 Fuel Flow Method for LH2 combustionIn this section fits the "Fuel Flow Method 2" in the case ofcombustion of liquid hydrogen (LH2).
For this reason, the previous code was used to calculatethe thermodynamic cycle of the complete engine, in which thecalorific value (Hi) of Jet A1 is replaced with that of liquidhydrogen. In fact, the Hi for Jet A1 (typical kerosene usedin civil aircraft) is about 43,3MJ/kg, while, for LH2 is 141,1MJ/kg.
If the purpose of the engine is to keep the TIT constantin order to have an engine with performance similar to the kerosene one, it is intuitive toimagine that the fuel flow decreases as the heat given off by the combustion of hydrogenis significantly greater.
59
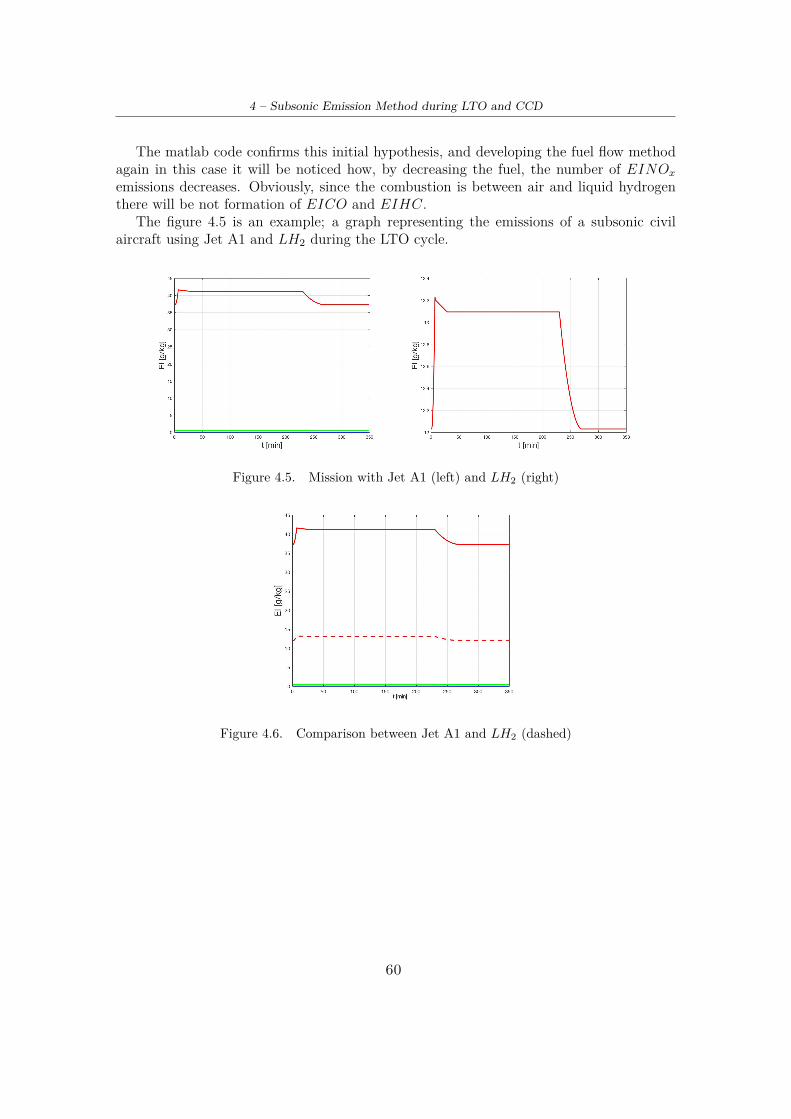
4 – Subsonic Emission Method during LTO and CCD
The matlab code confirms this initial hypothesis, and developing the fuel flow methodagain in this case it will be noticed how, by decreasing the fuel, the number of EINOxemissions decreases. Obviously, since the combustion is between air and liquid hydrogenthere will be not formation of EICO and EIHC.
The figure 4.5 is an example; a graph representing the emissions of a subsonic civilaircraft using Jet A1 and LH2 during the LTO cycle.
Figure 4.5. Mission with Jet A1 (left) and LH2 (right)
Figure 4.6. Comparison between Jet A1 and LH2 (dashed)
60
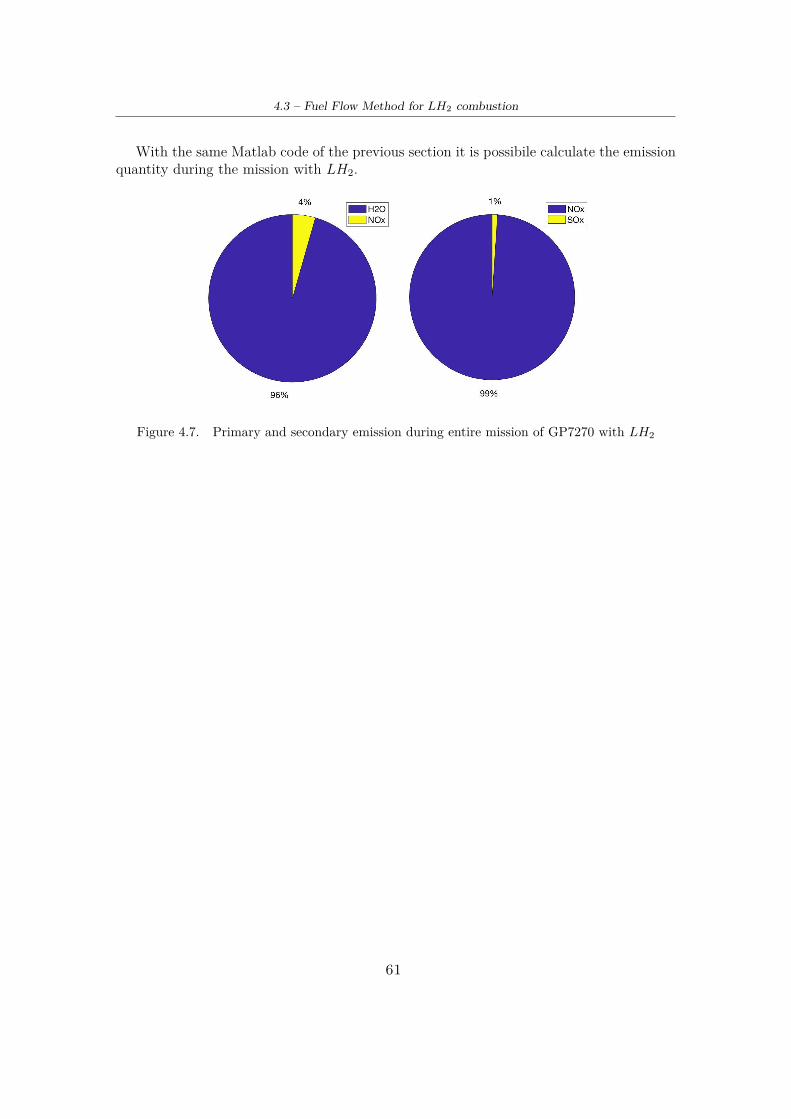
4.3 – Fuel Flow Method for LH2 combustion
With the same Matlab code of the previous section it is possibile calculate the emissionquantity during the mission with LH2.
Figure 4.7. Primary and secondary emission during entire mission of GP7270 with LH2
61

62
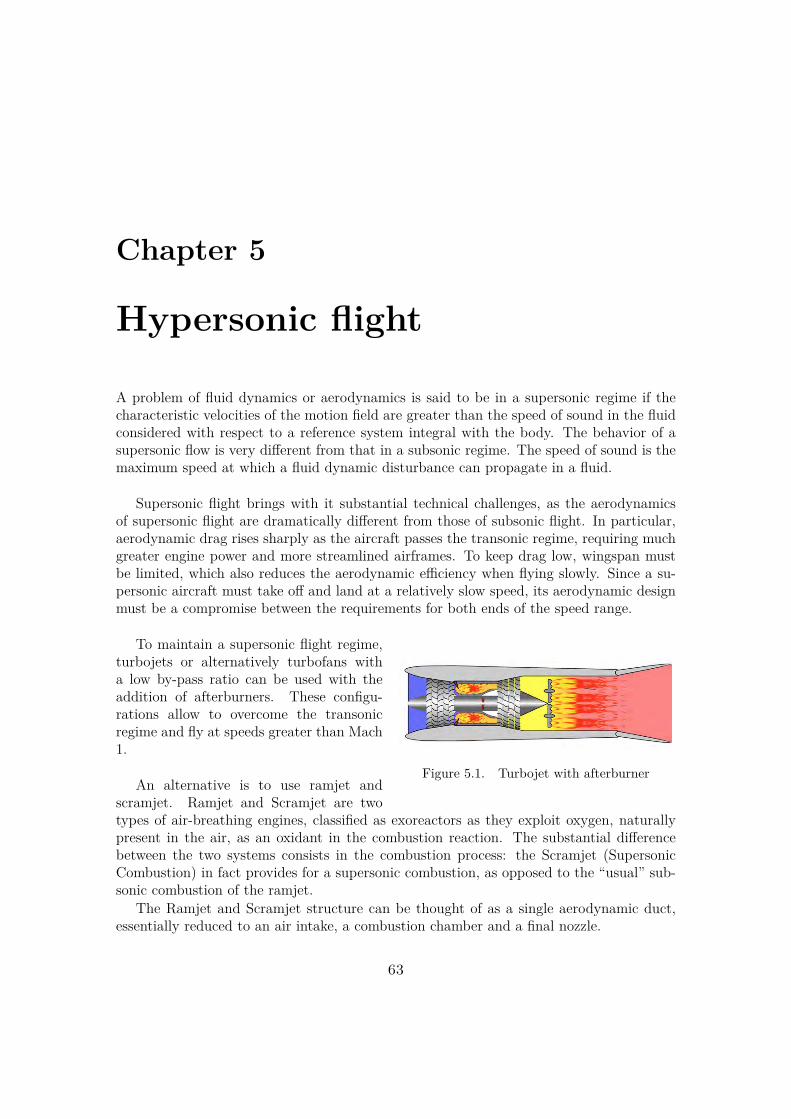
Chapter 5
Hypersonic flight
A problem of fluid dynamics or aerodynamics is said to be in a supersonic regime if thecharacteristic velocities of the motion field are greater than the speed of sound in the fluidconsidered with respect to a reference system integral with the body. The behavior of asupersonic flow is very different from that in a subsonic regime. The speed of sound is themaximum speed at which a fluid dynamic disturbance can propagate in a fluid.
Supersonic flight brings with it substantial technical challenges, as the aerodynamicsof supersonic flight are dramatically different from those of subsonic flight. In particular,aerodynamic drag rises sharply as the aircraft passes the transonic regime, requiring muchgreater engine power and more streamlined airframes. To keep drag low, wingspan mustbe limited, which also reduces the aerodynamic efficiency when flying slowly. Since a su-personic aircraft must take off and land at a relatively slow speed, its aerodynamic designmust be a compromise between the requirements for both ends of the speed range.
Figure 5.1. Turbojet with afterburner
To maintain a supersonic flight regime,turbojets or alternatively turbofans witha low by-pass ratio can be used with theaddition of afterburners. These configu-rations allow to overcome the transonicregime and fly at speeds greater than Mach1.
An alternative is to use ramjet andscramjet. Ramjet and Scramjet are twotypes of air-breathing engines, classified as exoreactors as they exploit oxygen, naturallypresent in the air, as an oxidant in the combustion reaction. The substantial differencebetween the two systems consists in the combustion process: the Scramjet (SupersonicCombustion) in fact provides for a supersonic combustion, as opposed to the “usual” sub-sonic combustion of the ramjet.
The Ramjet and Scramjet structure can be thought of as a single aerodynamic duct,essentially reduced to an air intake, a combustion chamber and a final nozzle.
63
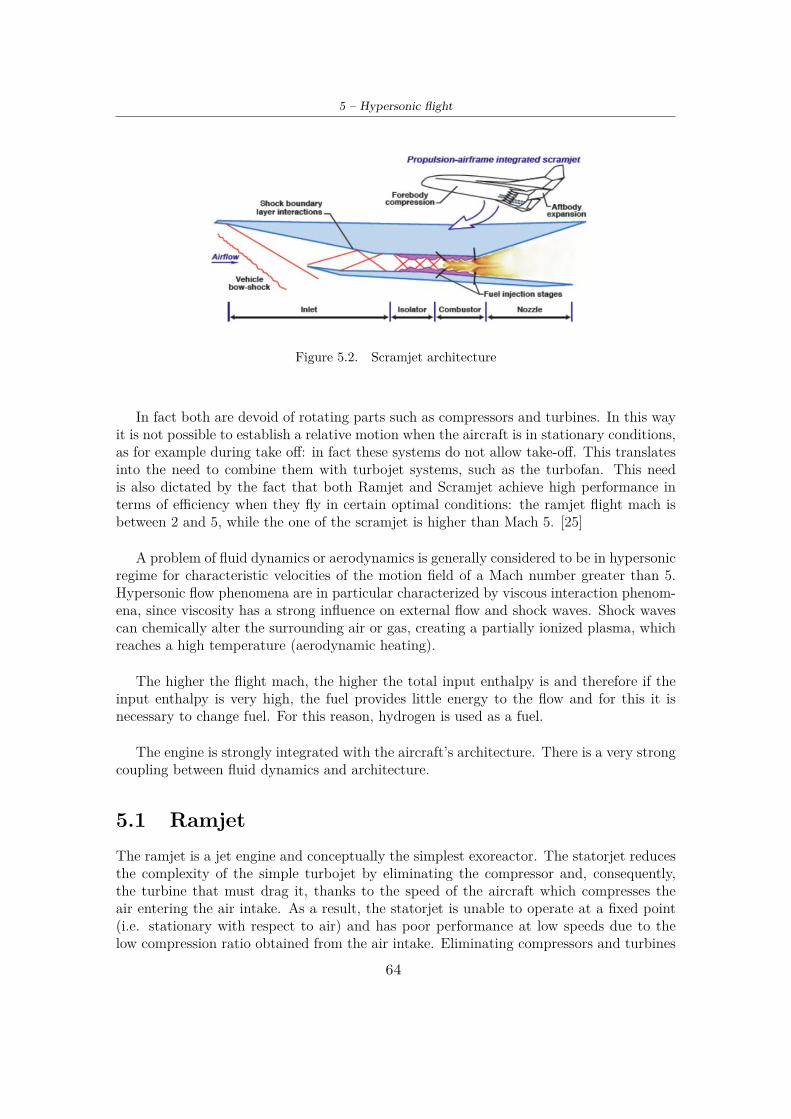
5 – Hypersonic flight
Figure 5.2. Scramjet architecture
In fact both are devoid of rotating parts such as compressors and turbines. In this wayit is not possible to establish a relative motion when the aircraft is in stationary conditions,as for example during take off: in fact these systems do not allow take-off. This translatesinto the need to combine them with turbojet systems, such as the turbofan. This needis also dictated by the fact that both Ramjet and Scramjet achieve high performance interms of efficiency when they fly in certain optimal conditions: the ramjet flight mach isbetween 2 and 5, while the one of the scramjet is higher than Mach 5. [25]
A problem of fluid dynamics or aerodynamics is generally considered to be in hypersonicregime for characteristic velocities of the motion field of a Mach number greater than 5.Hypersonic flow phenomena are in particular characterized by viscous interaction phenom-ena, since viscosity has a strong influence on external flow and shock waves. Shock wavescan chemically alter the surrounding air or gas, creating a partially ionized plasma, whichreaches a high temperature (aerodynamic heating).
The higher the flight mach, the higher the total input enthalpy is and therefore if theinput enthalpy is very high, the fuel provides little energy to the flow and for this it isnecessary to change fuel. For this reason, hydrogen is used as a fuel.
The engine is strongly integrated with the aircraft’s architecture. There is a very strongcoupling between fluid dynamics and architecture.
5.1 RamjetThe ramjet is a jet engine and conceptually the simplest exoreactor. The statorjet reducesthe complexity of the simple turbojet by eliminating the compressor and, consequently,the turbine that must drag it, thanks to the speed of the aircraft which compresses theair entering the air intake. As a result, the statorjet is unable to operate at a fixed point(i.e. stationary with respect to air) and has poor performance at low speeds due to thelow compression ratio obtained from the air intake. Eliminating compressors and turbines
64
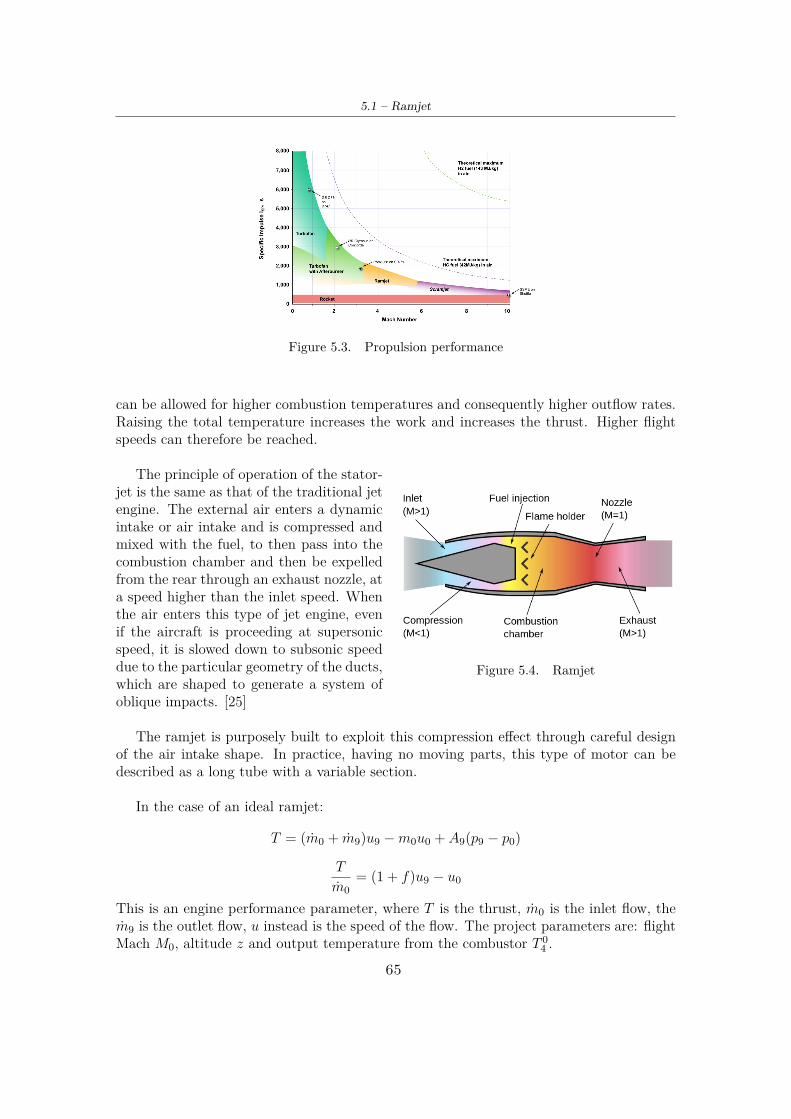
5.1 – Ramjet
Figure 5.3. Propulsion performance
can be allowed for higher combustion temperatures and consequently higher outflow rates.Raising the total temperature increases the work and increases the thrust. Higher flightspeeds can therefore be reached.
Figure 5.4. Ramjet
The principle of operation of the stator-jet is the same as that of the traditional jetengine. The external air enters a dynamicintake or air intake and is compressed andmixed with the fuel, to then pass into thecombustion chamber and then be expelledfrom the rear through an exhaust nozzle, ata speed higher than the inlet speed. Whenthe air enters this type of jet engine, evenif the aircraft is proceeding at supersonicspeed, it is slowed down to subsonic speeddue to the particular geometry of the ducts,which are shaped to generate a system ofoblique impacts. [25]
The ramjet is purposely built to exploit this compression effect through careful designof the air intake shape. In practice, having no moving parts, this type of motor can bedescribed as a long tube with a variable section.
In the case of an ideal ramjet:
T = (m0 + m9)u9 −m0u0 + A9(p9 − p0)
T
m0= (1 + f)u9 − u0
This is an engine performance parameter, where T is the thrust, m0 is the inlet flow, them9 is the outlet flow, u instead is the speed of the flow. The project parameters are: flightMach M0, altitude z and output temperature from the combustor T 0
4 .
65
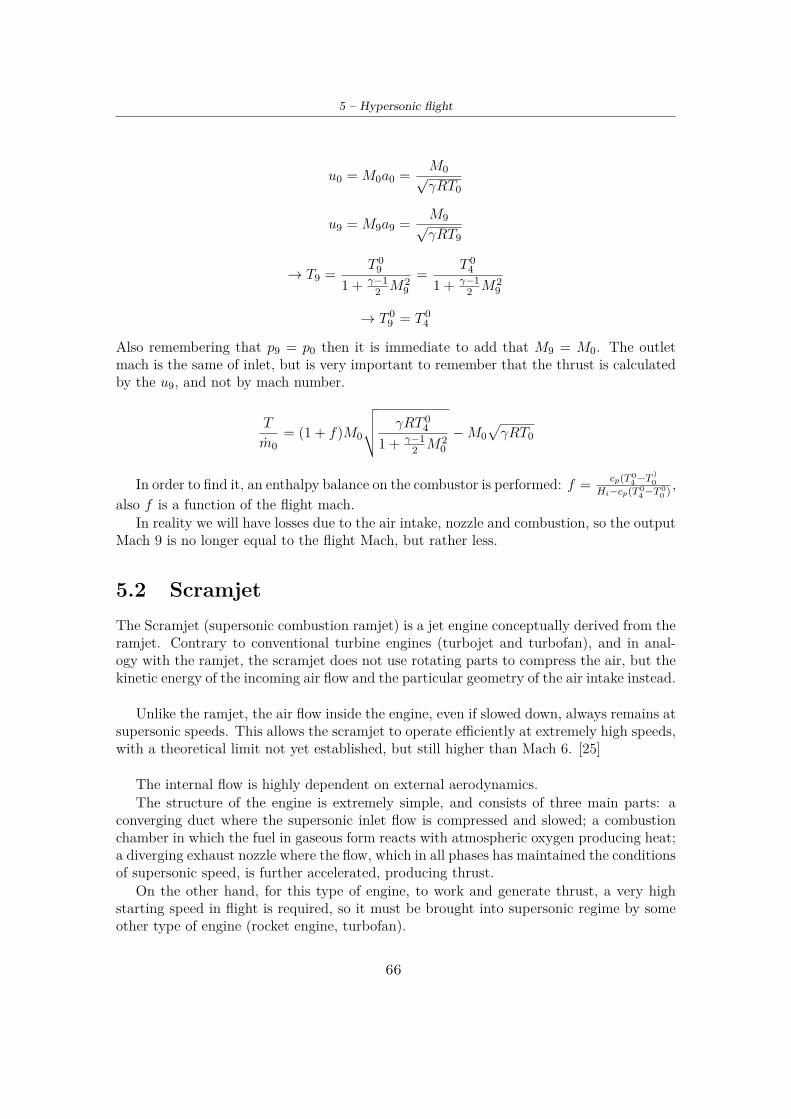
5 – Hypersonic flight
u0 = M0a0 = M0√γRT0
u9 = M9a9 = M9√γRT9
→ T9 = T 09
1 + γ−12 M2
9= T 0
41 + γ−1
2 M29
→ T 09 = T 0
4
Also remembering that p9 = p0 then it is immediate to add that M9 = M0. The outletmach is the same of inlet, but is very important to remember that the thrust is calculatedby the u9, and not by mach number.
T
m0= (1 + f)M0
öõõô γRT 04
1 + γ−12 M2
0−M0
ðγRT0
In order to find it, an enthalpy balance on the combustor is performed: f = cp(T 04−T
)0
Hi−cp(T 04−T 0
0 ) ,also f is a function of the flight mach.
In reality we will have losses due to the air intake, nozzle and combustion, so the outputMach 9 is no longer equal to the flight Mach, but rather less.
5.2 ScramjetThe Scramjet (supersonic combustion ramjet) is a jet engine conceptually derived from theramjet. Contrary to conventional turbine engines (turbojet and turbofan), and in anal-ogy with the ramjet, the scramjet does not use rotating parts to compress the air, but thekinetic energy of the incoming air flow and the particular geometry of the air intake instead.
Unlike the ramjet, the air flow inside the engine, even if slowed down, always remains atsupersonic speeds. This allows the scramjet to operate efficiently at extremely high speeds,with a theoretical limit not yet established, but still higher than Mach 6. [25]
The internal flow is highly dependent on external aerodynamics.The structure of the engine is extremely simple, and consists of three main parts: a
converging duct where the supersonic inlet flow is compressed and slowed; a combustionchamber in which the fuel in gaseous form reacts with atmospheric oxygen producing heat;a diverging exhaust nozzle where the flow, which in all phases has maintained the conditionsof supersonic speed, is further accelerated, producing thrust.
On the other hand, for this type of engine, to work and generate thrust, a very highstarting speed in flight is required, so it must be brought into supersonic regime by someother type of engine (rocket engine, turbofan).
66
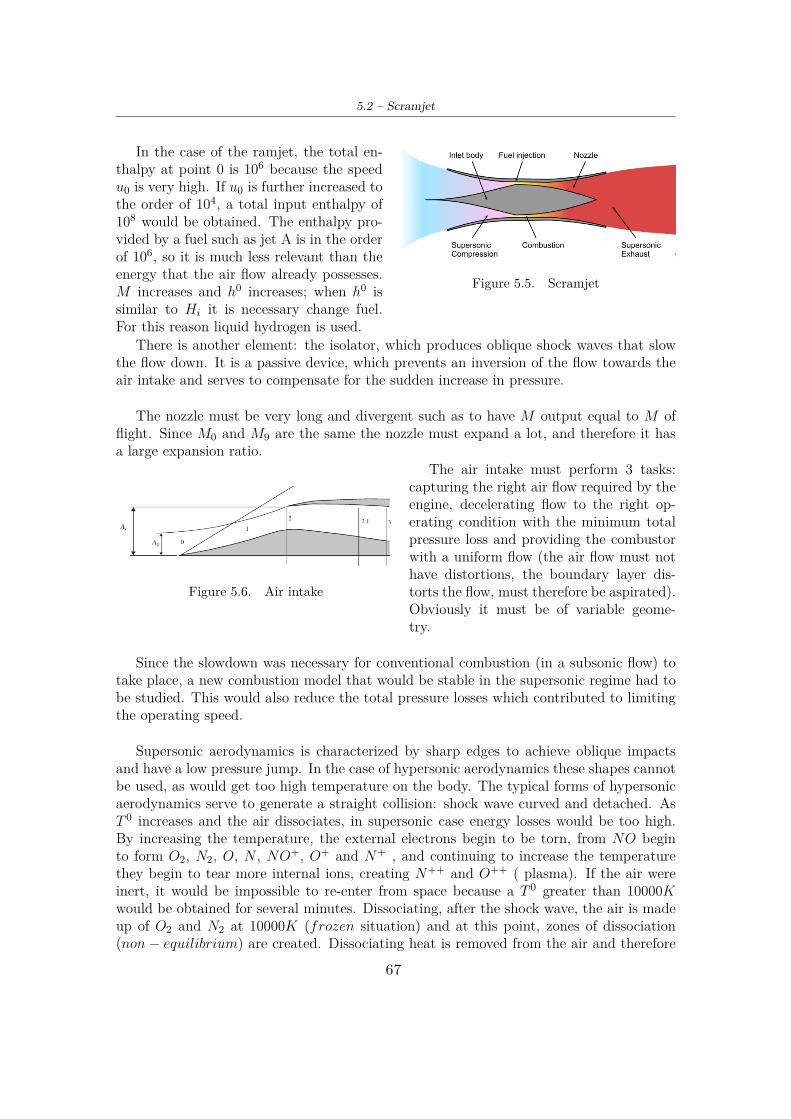
5.2 – Scramjet
Figure 5.5. Scramjet
In the case of the ramjet, the total en-thalpy at point 0 is 106 because the speedu0 is very high. If u0 is further increased tothe order of 104, a total input enthalpy of108 would be obtained. The enthalpy pro-vided by a fuel such as jet A is in the orderof 106, so it is much less relevant than theenergy that the air flow already possesses.M increases and h0 increases; when h0 issimilar to Hi it is necessary change fuel.For this reason liquid hydrogen is used.
There is another element: the isolator, which produces oblique shock waves that slowthe flow down. It is a passive device, which prevents an inversion of the flow towards theair intake and serves to compensate for the sudden increase in pressure.
The nozzle must be very long and divergent such as to have M output equal to M offlight. Since M0 and M9 are the same the nozzle must expand a lot, and therefore it hasa large expansion ratio.
Figure 5.6. Air intake
The air intake must perform 3 tasks:capturing the right air flow required by theengine, decelerating flow to the right op-erating condition with the minimum totalpressure loss and providing the combustorwith a uniform flow (the air flow must nothave distortions, the boundary layer dis-torts the flow, must therefore be aspirated).Obviously it must be of variable geome-try.
Since the slowdown was necessary for conventional combustion (in a subsonic flow) totake place, a new combustion model that would be stable in the supersonic regime had tobe studied. This would also reduce the total pressure losses which contributed to limitingthe operating speed.
Supersonic aerodynamics is characterized by sharp edges to achieve oblique impactsand have a low pressure jump. In the case of hypersonic aerodynamics these shapes cannotbe used, as would get too high temperature on the body. The typical forms of hypersonicaerodynamics serve to generate a straight collision: shock wave curved and detached. AsT 0 increases and the air dissociates, in supersonic case energy losses would be too high.By increasing the temperature, the external electrons begin to be torn, from NO beginto form O2, N2, O, N , NO+, O+ and N+ , and continuing to increase the temperaturethey begin to tear more internal ions, creating N++ and O++ ( plasma). If the air wereinert, it would be impossible to re-enter from space because a T 0 greater than 10000Kwould be obtained for several minutes. Dissociating, after the shock wave, the air is madeup of O2 and N2 at 10000K (frozen situation) and at this point, zones of dissociation(non− equilibrium) are created. Dissociating heat is removed from the air and therefore
67
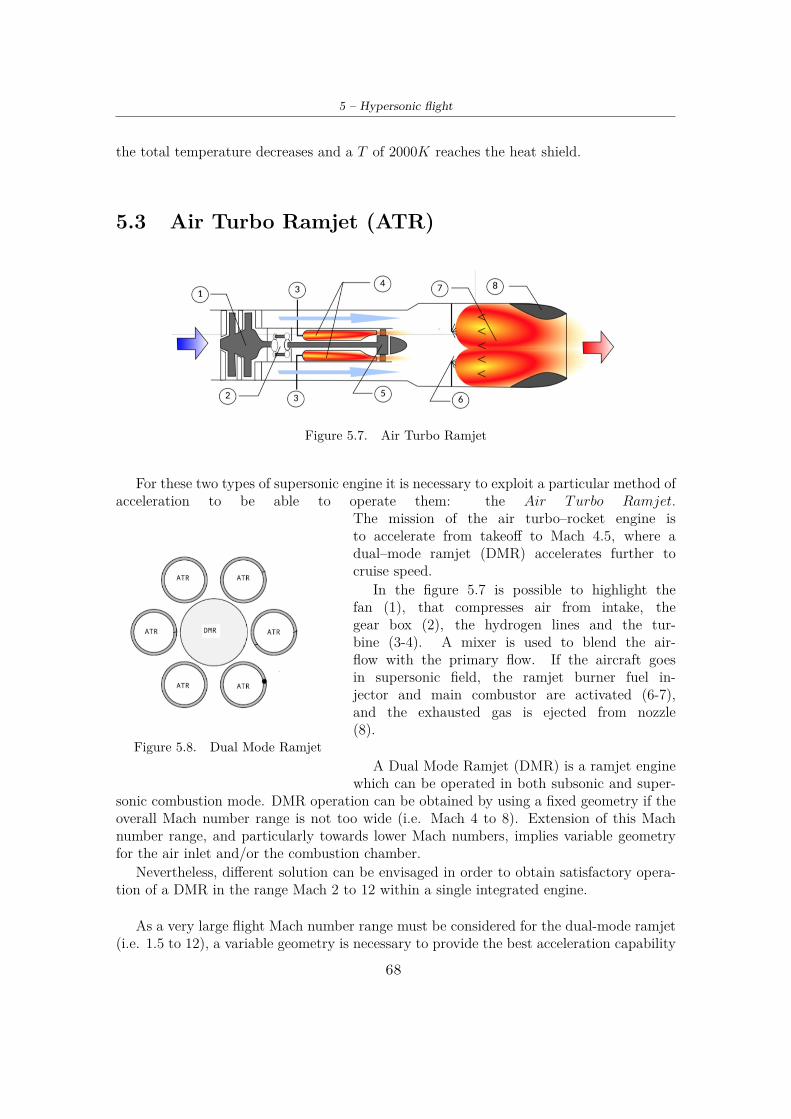
5 – Hypersonic flight
the total temperature decreases and a T of 2000K reaches the heat shield.
5.3 Air Turbo Ramjet (ATR)
Figure 5.7. Air Turbo Ramjet
For these two types of supersonic engine it is necessary to exploit a particular method ofacceleration to be able to operate them: the Air Turbo Ramjet.
Figure 5.8. Dual Mode Ramjet
The mission of the air turbo–rocket engine isto accelerate from takeoff to Mach 4.5, where adual–mode ramjet (DMR) accelerates further tocruise speed.
In the figure 5.7 is possible to highlight thefan (1), that compresses air from intake, thegear box (2), the hydrogen lines and the tur-bine (3-4). A mixer is used to blend the air-flow with the primary flow. If the aircraft goesin supersonic field, the ramjet burner fuel in-jector and main combustor are activated (6-7),and the exhausted gas is ejected from nozzle(8).
A Dual Mode Ramjet (DMR) is a ramjet enginewhich can be operated in both subsonic and super-
sonic combustion mode. DMR operation can be obtained by using a fixed geometry if theoverall Mach number range is not too wide (i.e. Mach 4 to 8). Extension of this Machnumber range, and particularly towards lower Mach numbers, implies variable geometryfor the air inlet and/or the combustion chamber.
Nevertheless, different solution can be envisaged in order to obtain satisfactory opera-tion of a DMR in the range Mach 2 to 12 within a single integrated engine.
As a very large flight Mach number range must be considered for the dual-mode ramjet(i.e. 1.5 to 12), a variable geometry is necessary to provide the best acceleration capability
68
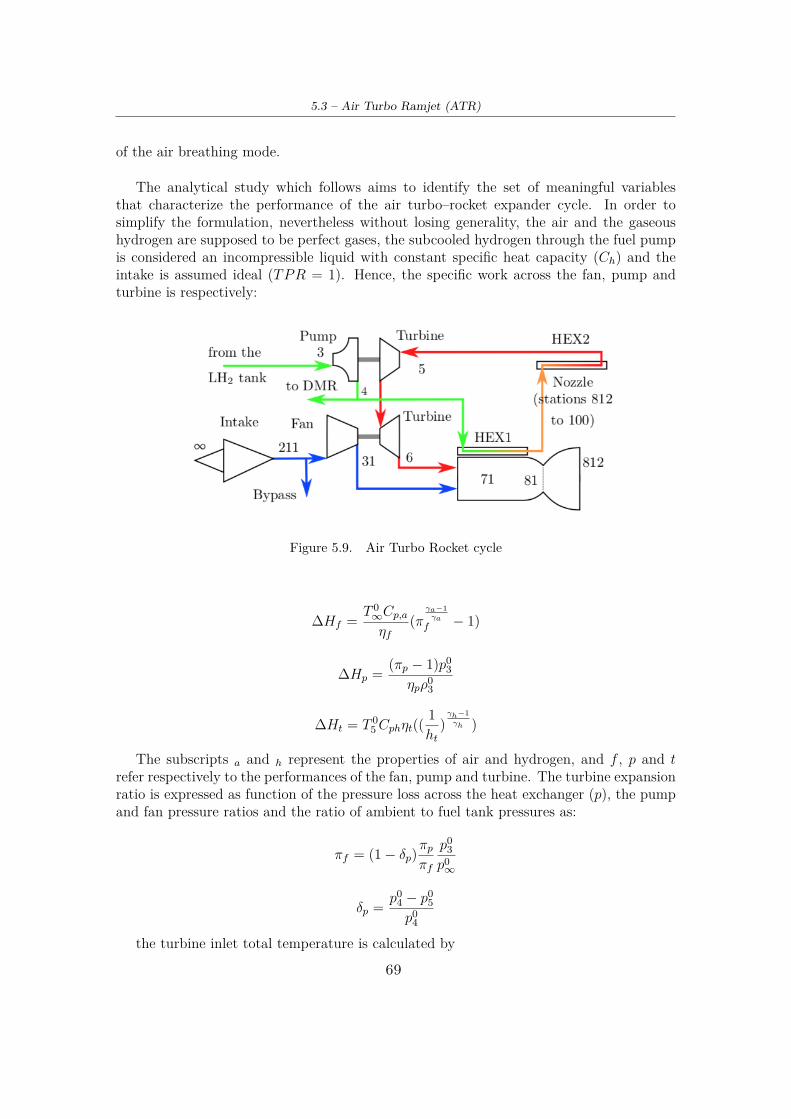
5.3 – Air Turbo Ramjet (ATR)
of the air breathing mode.
The analytical study which follows aims to identify the set of meaningful variablesthat characterize the performance of the air turbo–rocket expander cycle. In order tosimplify the formulation, nevertheless without losing generality, the air and the gaseoushydrogen are supposed to be perfect gases, the subcooled hydrogen through the fuel pumpis considered an incompressible liquid with constant specific heat capacity (Ch) and theintake is assumed ideal (TPR = 1). Hence, the specific work across the fan, pump andturbine is respectively:
Figure 5.9. Air Turbo Rocket cycle
∆Hf = T 0∞Cp,aηf
(πγa−1γa
f − 1)
∆Hp = (πp − 1)p03
ηpρ03
∆Ht = T 05Cphηt((
1ht
)γh−1γh )
The subscripts a and h represent the properties of air and hydrogen, and f , p and trefer respectively to the performances of the fan, pump and turbine. The turbine expansionratio is expressed as function of the pressure loss across the heat exchanger (p), the pumpand fan pressure ratios and the ratio of ambient to fuel tank pressures as:
πf = (1− δp)πpπf
p03
p0∞
δp = p04 − p0
5p0
4
the turbine inlet total temperature is calculated by
69
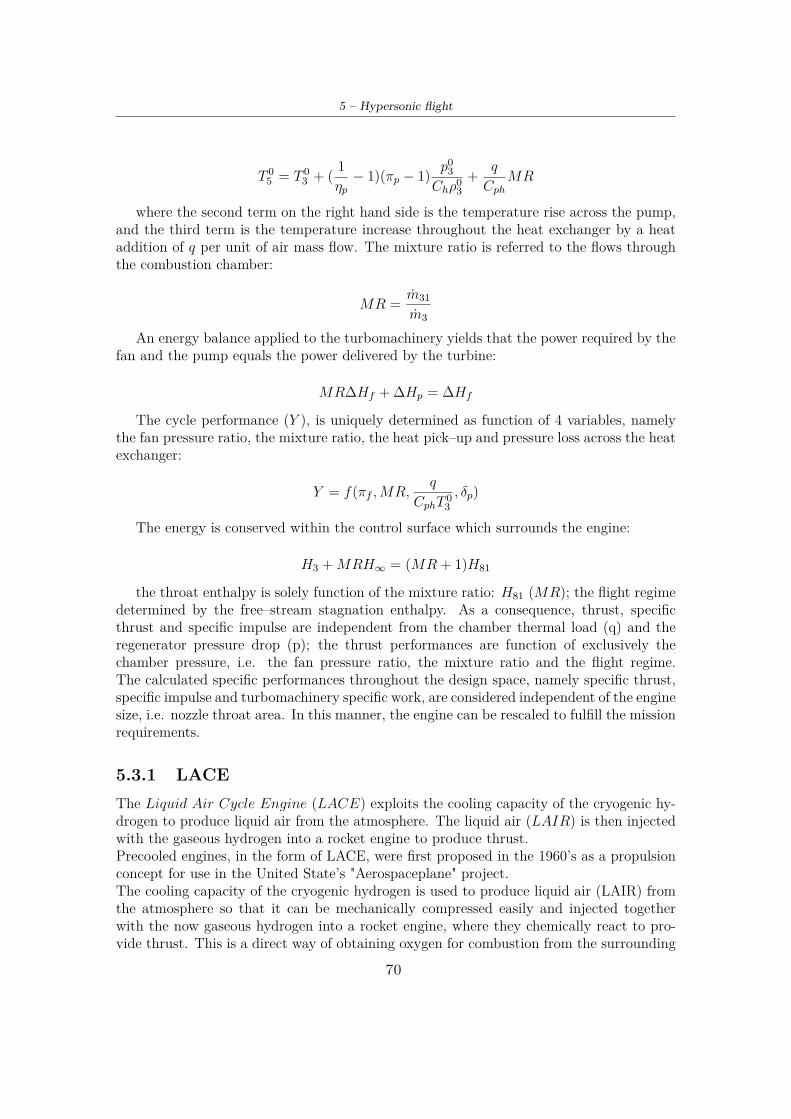
5 – Hypersonic flight
T 05 = T 0
3 + ( 1ηp− 1)(πp − 1) p0
3Chρ0
3+ q
CphMR
where the second term on the right hand side is the temperature rise across the pump,and the third term is the temperature increase throughout the heat exchanger by a heataddition of q per unit of air mass flow. The mixture ratio is referred to the flows throughthe combustion chamber:
MR = m31
m3
An energy balance applied to the turbomachinery yields that the power required by thefan and the pump equals the power delivered by the turbine:
MR∆Hf + ∆Hp = ∆Hf
The cycle performance (Y ), is uniquely determined as function of 4 variables, namelythe fan pressure ratio, the mixture ratio, the heat pick–up and pressure loss across the heatexchanger:
Y = f(πf ,MR,q
CphT 03, δp)
The energy is conserved within the control surface which surrounds the engine:
H3 +MRH∞ = (MR + 1)H81
the throat enthalpy is solely function of the mixture ratio: H81 (MR); the flight regimedetermined by the free–stream stagnation enthalpy. As a consequence, thrust, specificthrust and specific impulse are independent from the chamber thermal load (q) and theregenerator pressure drop (p); the thrust performances are function of exclusively thechamber pressure, i.e. the fan pressure ratio, the mixture ratio and the flight regime.The calculated specific performances throughout the design space, namely specific thrust,specific impulse and turbomachinery specific work, are considered independent of the enginesize, i.e. nozzle throat area. In this manner, the engine can be rescaled to fulfill the missionrequirements.
5.3.1 LACEThe Liquid Air Cycle Engine (LACE) exploits the cooling capacity of the cryogenic hy-drogen to produce liquid air from the atmosphere. The liquid air (LAIR) is then injectedwith the gaseous hydrogen into a rocket engine to produce thrust.Precooled engines, in the form of LACE, were first proposed in the 1960’s as a propulsionconcept for use in the United State’s "Aerospaceplane" project.The cooling capacity of the cryogenic hydrogen is used to produce liquid air (LAIR) fromthe atmosphere so that it can be mechanically compressed easily and injected togetherwith the now gaseous hydrogen into a rocket engine, where they chemically react to pro-vide thrust. This is a direct way of obtaining oxygen for combustion from the surrounding
70
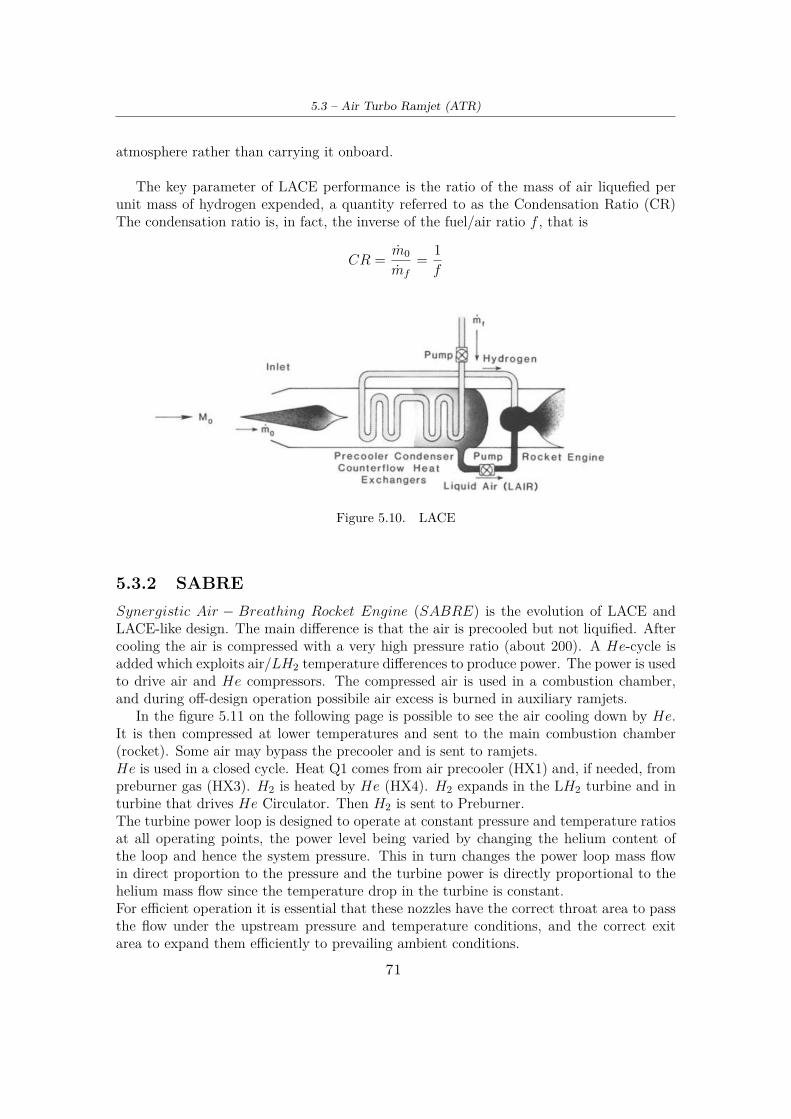
5.3 – Air Turbo Ramjet (ATR)
atmosphere rather than carrying it onboard.
The key parameter of LACE performance is the ratio of the mass of air liquefied perunit mass of hydrogen expended, a quantity referred to as the Condensation Ratio (CR)The condensation ratio is, in fact, the inverse of the fuel/air ratio f , that is
CR = m0
mf= 1f
Figure 5.10. LACE
5.3.2 SABRESynergistic Air − Breathing Rocket Engine (SABRE) is the evolution of LACE andLACE-like design. The main difference is that the air is precooled but not liquified. Aftercooling the air is compressed with a very high pressure ratio (about 200). A He-cycle isadded which exploits air/LH2 temperature differences to produce power. The power is usedto drive air and He compressors. The compressed air is used in a combustion chamber,and during off-design operation possibile air excess is burned in auxiliary ramjets.
In the figure 5.11 on the following page is possible to see the air cooling down by He.It is then compressed at lower temperatures and sent to the main combustion chamber(rocket). Some air may bypass the precooler and is sent to ramjets.He is used in a closed cycle. Heat Q1 comes from air precooler (HX1) and, if needed, frompreburner gas (HX3). H2 is heated by He (HX4). H2 expands in the LH2 turbine and inturbine that drives He Circulator. Then H2 is sent to Preburner.The turbine power loop is designed to operate at constant pressure and temperature ratiosat all operating points, the power level being varied by changing the helium content ofthe loop and hence the system pressure. This in turn changes the power loop mass flowin direct proportion to the pressure and the turbine power is directly proportional to thehelium mass flow since the temperature drop in the turbine is constant.For efficient operation it is essential that these nozzles have the correct throat area to passthe flow under the upstream pressure and temperature conditions, and the correct exitarea to expand them efficiently to prevailing ambient conditions.
71
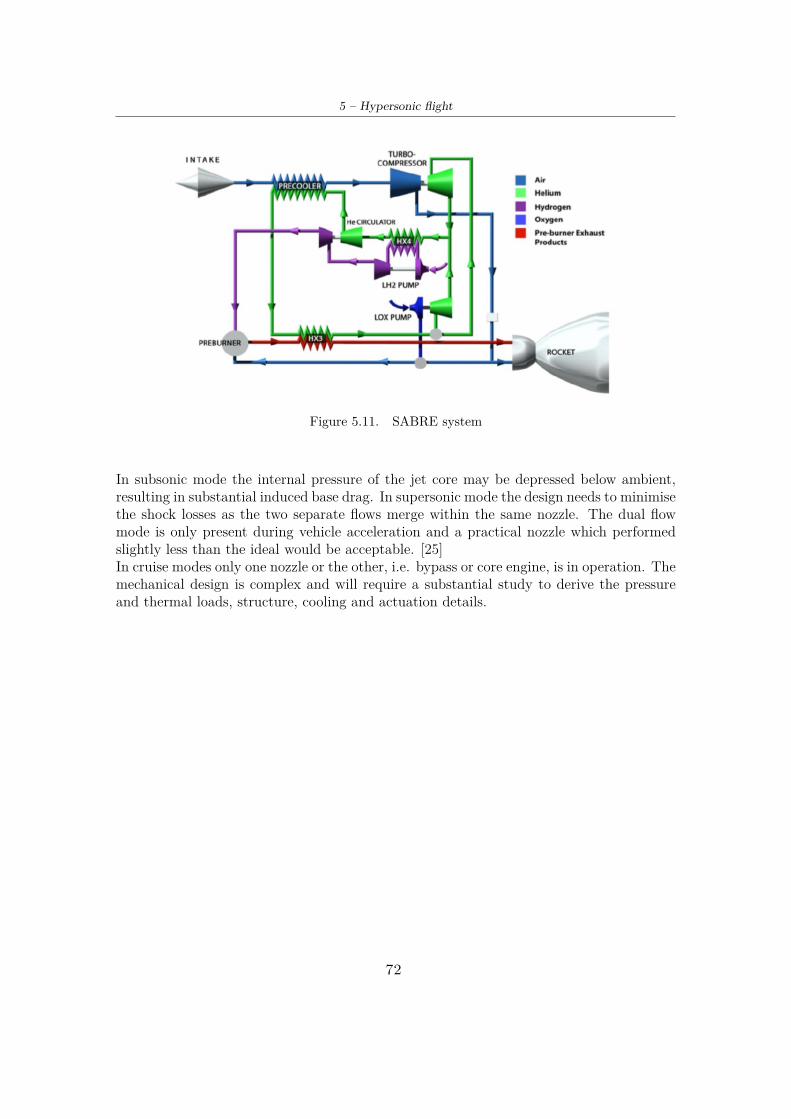
5 – Hypersonic flight
Figure 5.11. SABRE system
In subsonic mode the internal pressure of the jet core may be depressed below ambient,resulting in substantial induced base drag. In supersonic mode the design needs to minimisethe shock losses as the two separate flows merge within the same nozzle. The dual flowmode is only present during vehicle acceleration and a practical nozzle which performedslightly less than the ideal would be acceptable. [25]In cruise modes only one nozzle or the other, i.e. bypass or core engine, is in operation. Themechanical design is complex and will require a substantial study to derive the pressureand thermal loads, structure, cooling and actuation details.
72
Chapter 6
Supersonic emission method
This chapter aims to make changes to the Boeing Fuel Flow Method 2, in order to applyit to the supersonic case.In fact, if the formulas of the subsonic case are used, as in chapter 4, for the high velocitiesof the supersonic or hypersonic field, the results cannot be considered valid.
An example of this statement can be seen immediately by observing the exponent ofthe Mach number in the formula for calculating the fuel flow at sea level. In fact it is equalto two. This implies that for a high Mach number the value of Wf,sl becomes too high andunreliable.
WF,sl = WF,altθ3.3amb
δambθamb(1 + 0.2M2)
6.1 Modifications to the subsonic methodThe whole derivation of the Fuel Flow Method is then retraced, highlighting the main steps.
The first step is the analysis of the X and Y exponents of the combustors. Their values,as previously mentioned, are based on experimental data and are different for each engine.From the various bibliographic sources no method has emerged for calculating them andthey are always assumed as values taken from a statistical study. For this reason, even inthis thesis work, it is necessary to consider them constant to the previous case, as it is notpossible specify them for ATR, ramjet and scramjet. And so:
X = 1
Y = 0.2− 0.5
After this, the relationship between station number 1 (inlet) and station number 3(combustor) was modified. In fact, an isentropic relationship is used in the paper, becauseit still has a good degree of approximation. This relationship can then be modified and a
73
6 – Supersonic emission method
polytropic or, in the case of ramjet and scramjet, law of compression of the shock wavescan be used.
T3
T1=3P3
P1
4 γ−1γηp
Or with normal shock wave:
P2
P1= 2γM2
1 − γ + 1γ + 1
In case a oblique shock wave is considered, is simply needed use a relation betweennormal velocities and geometry.
After this, there is the assumption that the temperature at station 3 is the same ataltitude and at sea level. In the following section, it is assumed that this relationship isnot verified and through some supersonic aircraft data it is attempted to interpolate themwith a curve and look for a relationship between the temperature difference at sea leveland at altitude, with the Mach number.
This data can be confirmed with a quick theoretical reasoning: in fact, with the samenumber of flight Mach, the thrust of the engine is proportional to the inlet air flow. Theinlet air flow is equal to:
m = ρuA
For this reason, as the altitude increases, the density decreases and therefore: ρz < ρ0And so, the thrust at sea level at constant Mach is greater than the thrust at altitude. Itis therefore intuitive to think that the temperature of the combustor, at high altitude, islower than the one at sea level.
Tz < T0
T3,z < T3,sl
Analyzing the Matlab code and the data reported in the paper STRATOFLY MR3 –how to reduce the environmental impact of high-speed transportation, it was possible to getto the following statement:
T3,sl − T3,alt = 16M2 + 86
Surely this interpolation has given such satisfactory results because it is flawed by thefew data available. However, I believe that it can represent how the variation between thetemperature at sea level and at altitude is greater and that it cannot be neglected duringsupersonic flight.
Another delicate step is the consideration of the inlet section of the combustor. Consid-ering that a mobile geometry will be used, it is believed that also for the supersonic case
74
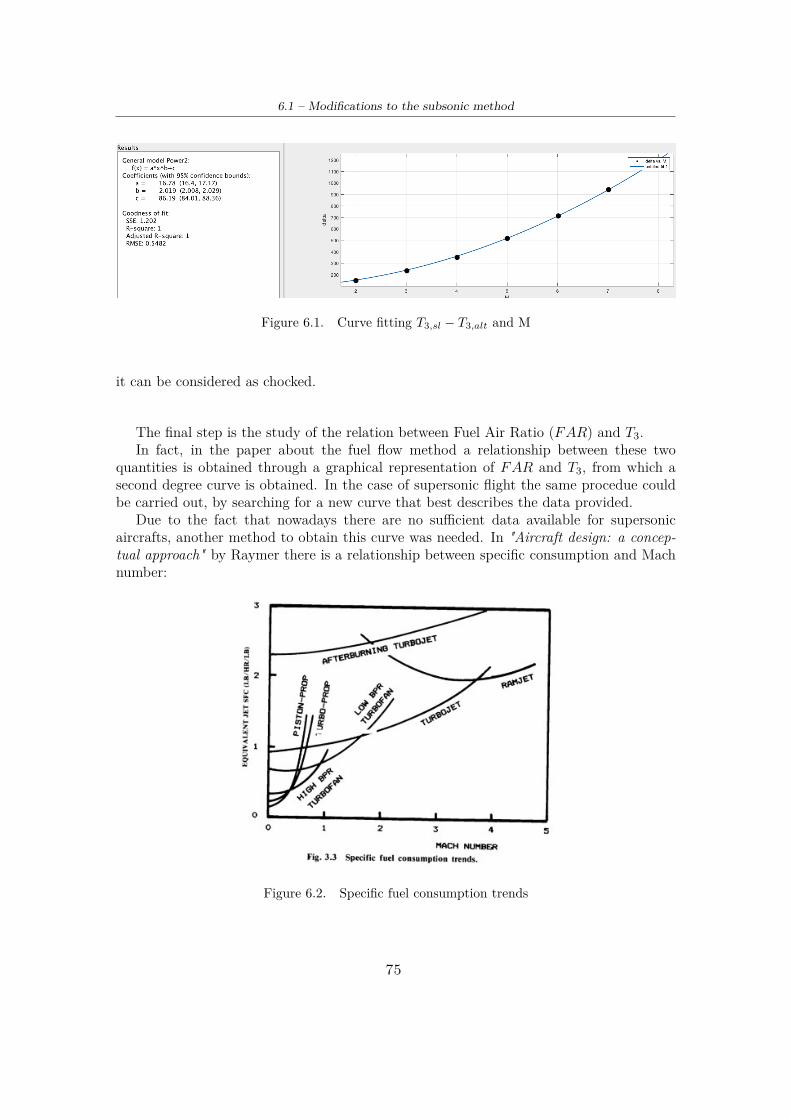
6.1 – Modifications to the subsonic method
Figure 6.1. Curve fitting T3,sl − T3,alt and M
it can be considered as chocked.
The final step is the study of the relation between Fuel Air Ratio (FAR) and T3.In fact, in the paper about the fuel flow method a relationship between these two
quantities is obtained through a graphical representation of FAR and T3, from which asecond degree curve is obtained. In the case of supersonic flight the same procedue couldbe carried out, by searching for a new curve that best describes the data provided.
Due to the fact that nowadays there are no sufficient data available for supersonicaircrafts, another method to obtain this curve was needed. In "Aircraft design: a concep-tual approach" by Raymer there is a relationship between specific consumption and Machnumber:
Figure 6.2. Specific fuel consumption trends
75
6 – Supersonic emission method
How it can be seen in the previous figure, the turbofan is represented with a seconddegree curve. A DMR is instead similar to a turbojet engine during the take-off and to aramjet engine in cruise.
Thus, comparing this graph with a possible FAR-T3 graph during the supersonic flightof a DMR, it is possible to assume that the function represented is not of second degree,but lower.
The conclusion is that there is a lower dependance on the Mach number in the calcu-lation of the fuel flow with respect to the subsonic case.
And so, the final function is:
Wf,sl = Wf,altθγηpγ−1amb
δamb
3T3,sl
T3,alt
4 γ−1−γηpγηp
+xθx−1
1
Wf,sl = Wf,altθγηpγ−1 +x−1amb
δamb
31 + γ − 1
2 M24x−1 T3,sl
T3,alt
γ−1γηp
+x−1
from which the emission indexes are calculated:
EICOalt = EICOsl
3P3,sl
P3,alt
4X3 FARslFARalt
4Z
EIHCalt = EIHCsl
3P3,sl
P3,alt
4X3 FARslFARalt
4Z
EINOxalt = EINOxsl
3P3,alt
P3,sl
4YeH3FARaltFARsl
4Z
The only variable to be determined is therefore the exponent x for the calculation ofthe fuel flow. For a more precise analysis it would be advisable to determine exactly thevalue of the exponents X, Y and Z, typical of each type of combustor.
76
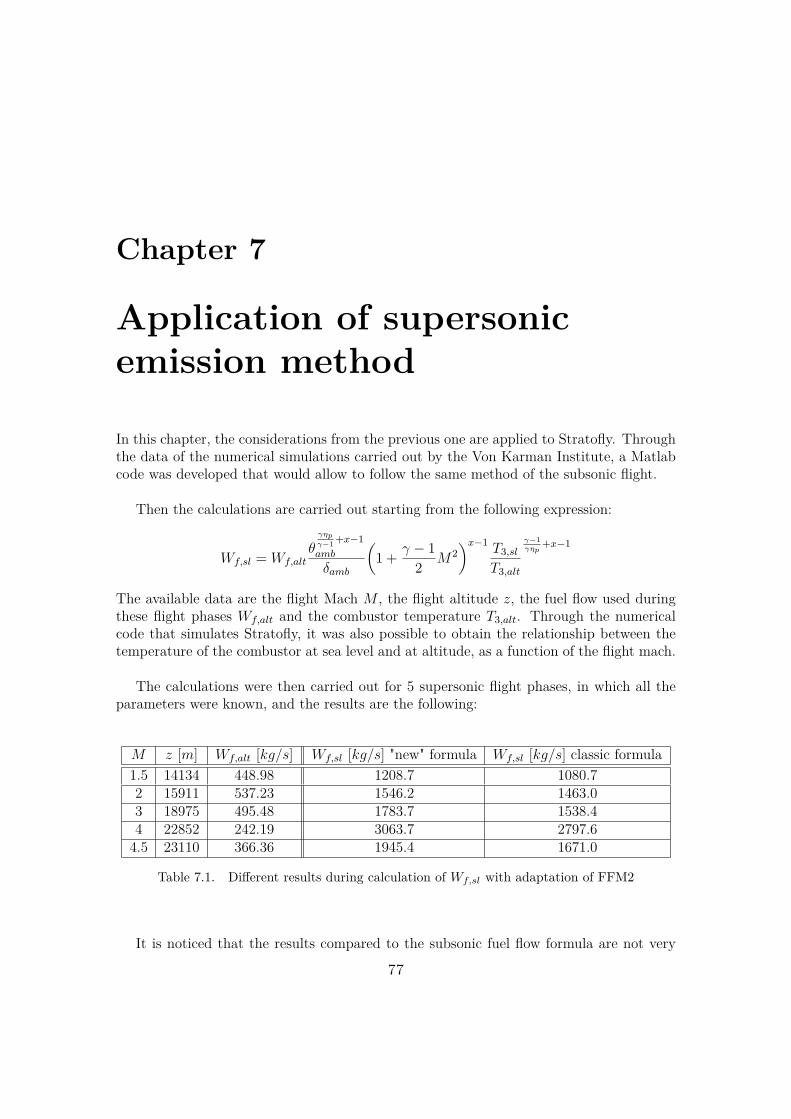
Chapter 7
Application of supersonicemission method
In this chapter, the considerations from the previous one are applied to Stratofly. Throughthe data of the numerical simulations carried out by the Von Karman Institute, a Matlabcode was developed that would allow to follow the same method of the subsonic flight.
Then the calculations are carried out starting from the following expression:
Wf,sl = Wf,altθγηpγ−1 +x−1amb
δamb
31 + γ − 1
2 M24x−1 T3,sl
T3,alt
γ−1γηp
+x−1
The available data are the flight Mach M , the flight altitude z, the fuel flow used duringthese flight phases Wf,alt and the combustor temperature T3,alt. Through the numericalcode that simulates Stratofly, it was also possible to obtain the relationship between thetemperature of the combustor at sea level and at altitude, as a function of the flight mach.
The calculations were then carried out for 5 supersonic flight phases, in which all theparameters were known, and the results are the following:
M z [m] Wf,alt [kg/s] Wf,sl [kg/s] "new" formula Wf,sl [kg/s] classic formula1.5 14134 448.98 1208.7 1080.72 15911 537.23 1546.2 1463.03 18975 495.48 1783.7 1538.44 22852 242.19 3063.7 2797.64.5 23110 366.36 1945.4 1671.0
Table 7.1. Different results during calculation of Wf,sl with adaptation of FFM2
It is noticed that the results compared to the subsonic fuel flow formula are not very
77
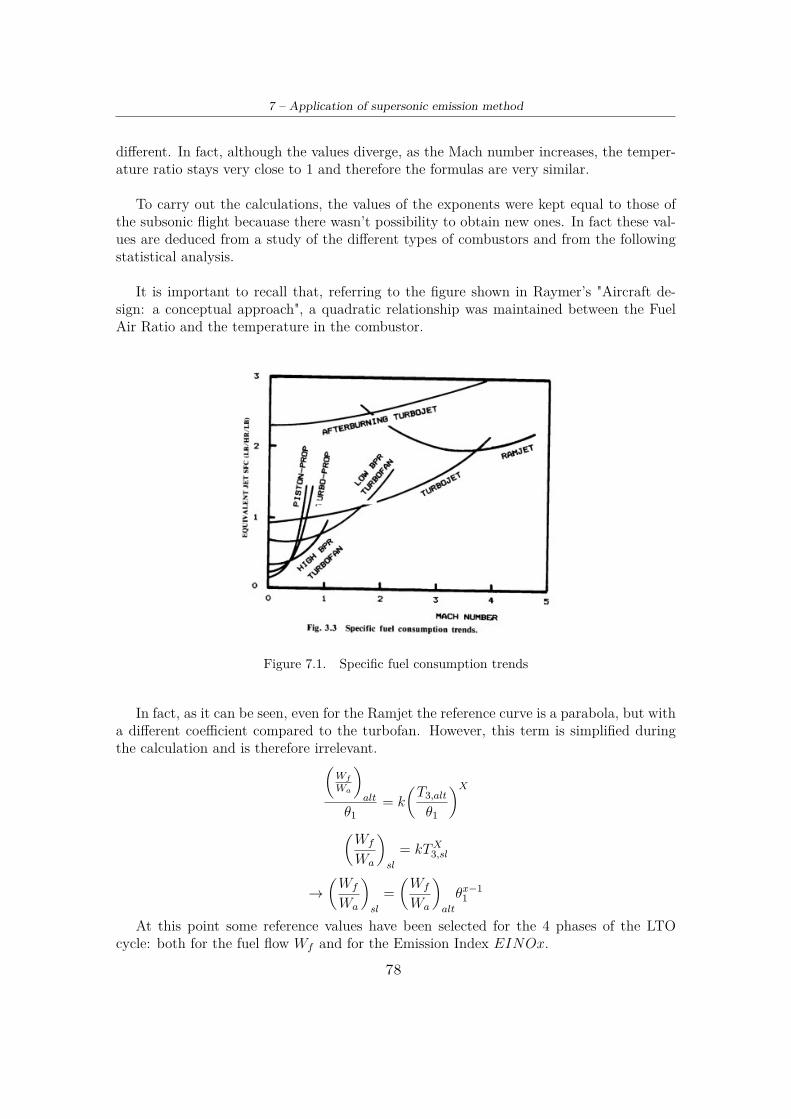
7 – Application of supersonic emission method
different. In fact, although the values diverge, as the Mach number increases, the temper-ature ratio stays very close to 1 and therefore the formulas are very similar.
To carry out the calculations, the values of the exponents were kept equal to those ofthe subsonic flight becauase there wasn’t possibility to obtain new ones. In fact these val-ues are deduced from a study of the different types of combustors and from the followingstatistical analysis.
It is important to recall that, referring to the figure shown in Raymer’s "Aircraft de-sign: a conceptual approach", a quadratic relationship was maintained between the FuelAir Ratio and the temperature in the combustor.
Figure 7.1. Specific fuel consumption trends
In fact, as it can be seen, even for the Ramjet the reference curve is a parabola, but witha different coefficient compared to the turbofan. However, this term is simplified duringthe calculation and is therefore irrelevant.3
Wf
Wa
4alt
θ1= k
3T3,alt
θ1
4X3Wf
Wa
4sl
= kTX3,sl
→3Wf
Wa
4sl
=3Wf
Wa
4alt
θx−11
At this point some reference values have been selected for the 4 phases of the LTOcycle: both for the fuel flow Wf and for the Emission Index EINOx.
78
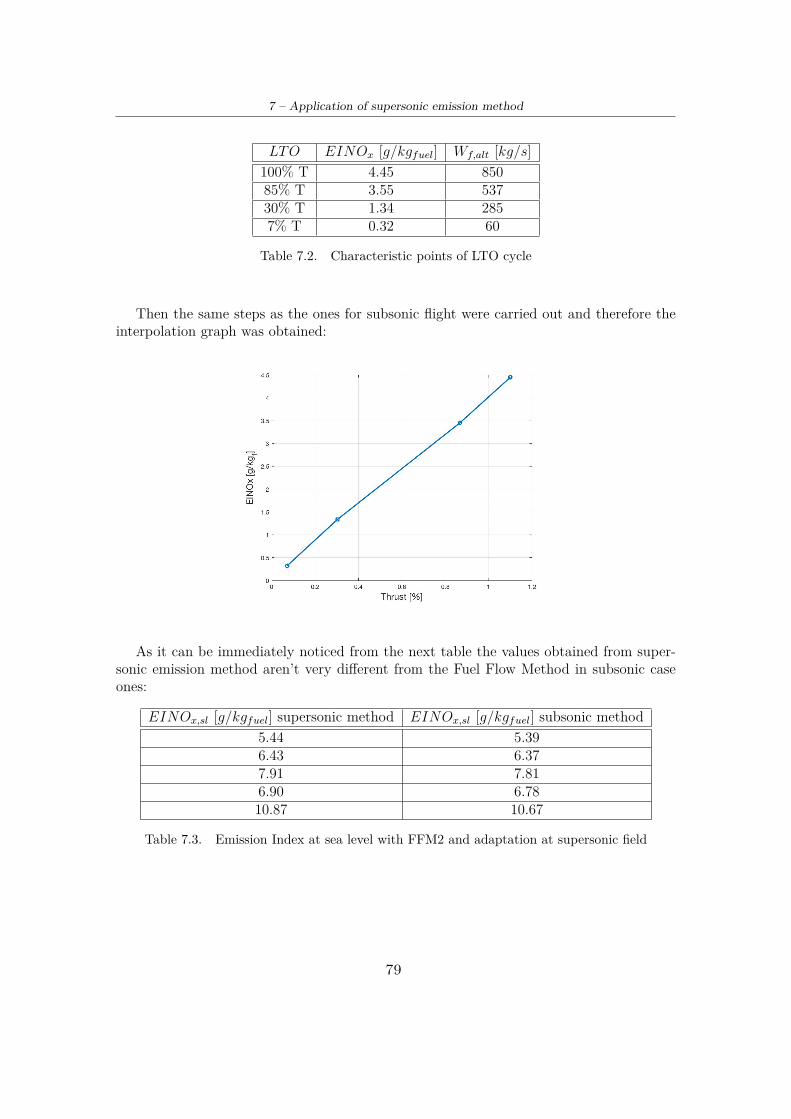
7 – Application of supersonic emission method
LTO EINOx [g/kgfuel] Wf,alt [kg/s]100% T 4.45 85085% T 3.55 53730% T 1.34 2857% T 0.32 60
Table 7.2. Characteristic points of LTO cycle
Then the same steps as the ones for subsonic flight were carried out and therefore theinterpolation graph was obtained:
As it can be immediately noticed from the next table the values obtained from super-sonic emission method aren’t very different from the Fuel Flow Method in subsonic caseones:
EINOx,sl [g/kgfuel] supersonic method EINOx,sl [g/kgfuel] subsonic method5.44 5.396.43 6.377.91 7.816.90 6.7810.87 10.67
Table 7.3. Emission Index at sea level with FFM2 and adaptation at supersonic field
79
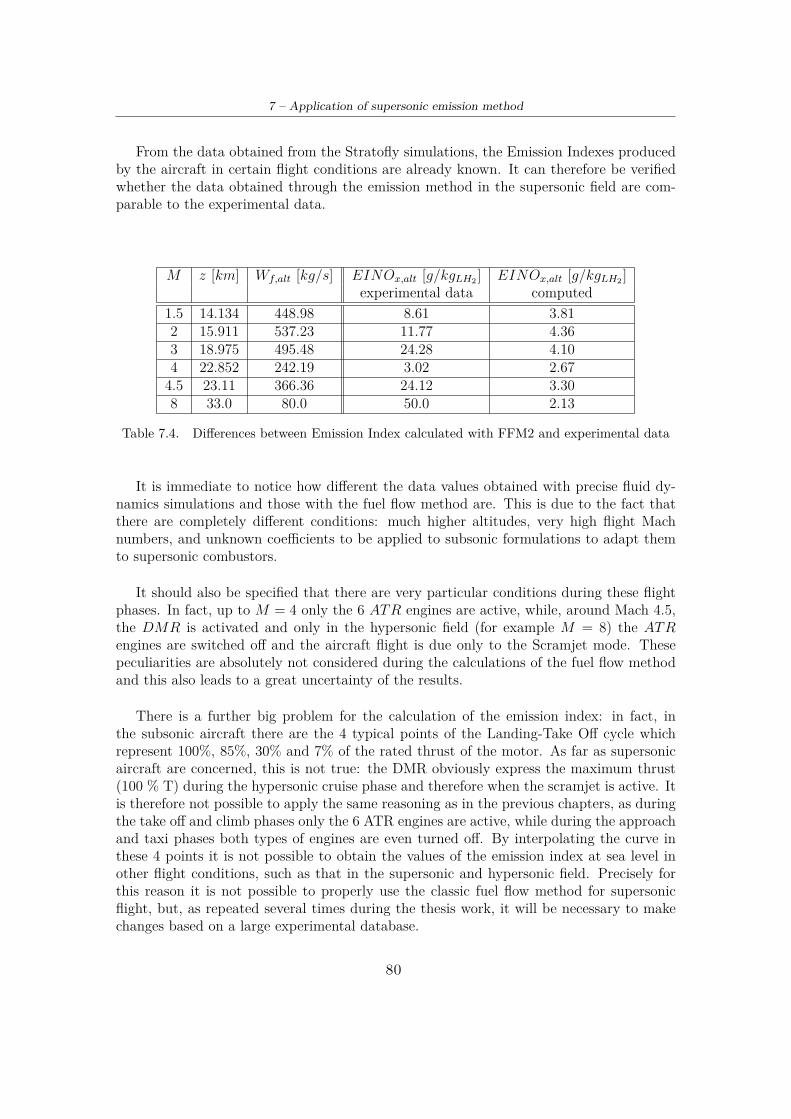
7 – Application of supersonic emission method
From the data obtained from the Stratofly simulations, the Emission Indexes producedby the aircraft in certain flight conditions are already known. It can therefore be verifiedwhether the data obtained through the emission method in the supersonic field are com-parable to the experimental data.
M z [km] Wf,alt [kg/s] EINOx,alt [g/kgLH2 ] EINOx,alt [g/kgLH2 ]experimental data computed
1.5 14.134 448.98 8.61 3.812 15.911 537.23 11.77 4.363 18.975 495.48 24.28 4.104 22.852 242.19 3.02 2.674.5 23.11 366.36 24.12 3.308 33.0 80.0 50.0 2.13
Table 7.4. Differences between Emission Index calculated with FFM2 and experimental data
It is immediate to notice how different the data values obtained with precise fluid dy-namics simulations and those with the fuel flow method are. This is due to the fact thatthere are completely different conditions: much higher altitudes, very high flight Machnumbers, and unknown coefficients to be applied to subsonic formulations to adapt themto supersonic combustors.
It should also be specified that there are very particular conditions during these flightphases. In fact, up to M = 4 only the 6 ATR engines are active, while, around Mach 4.5,the DMR is activated and only in the hypersonic field (for example M = 8) the ATRengines are switched off and the aircraft flight is due only to the Scramjet mode. Thesepeculiarities are absolutely not considered during the calculations of the fuel flow methodand this also leads to a great uncertainty of the results.
There is a further big problem for the calculation of the emission index: in fact, inthe subsonic aircraft there are the 4 typical points of the Landing-Take Off cycle whichrepresent 100%, 85%, 30% and 7% of the rated thrust of the motor. As far as supersonicaircraft are concerned, this is not true: the DMR obviously express the maximum thrust(100 % T) during the hypersonic cruise phase and therefore when the scramjet is active. Itis therefore not possible to apply the same reasoning as in the previous chapters, as duringthe take off and climb phases only the 6 ATR engines are active, while during the approachand taxi phases both types of engines are even turned off. By interpolating the curve inthese 4 points it is not possible to obtain the values of the emission index at sea level inother flight conditions, such as that in the supersonic and hypersonic field. Precisely forthis reason it is not possible to properly use the classic fuel flow method for supersonicflight, but, as repeated several times during the thesis work, it will be necessary to makechanges based on a large experimental database.
80
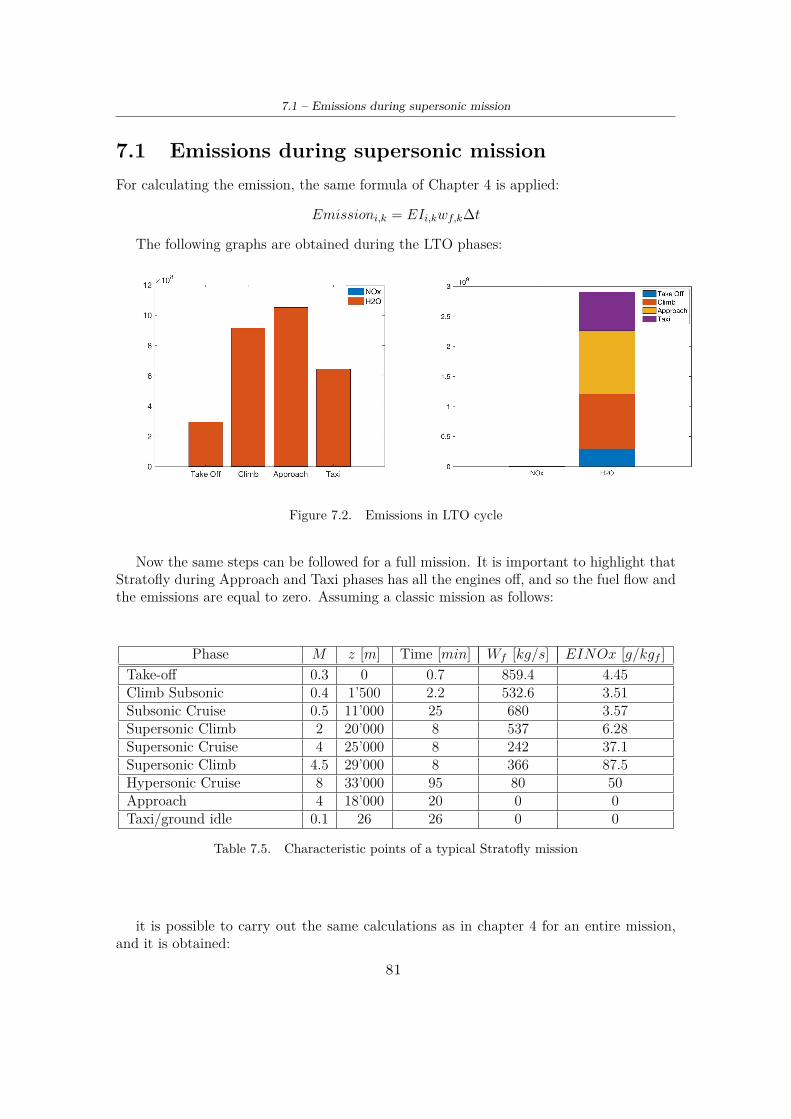
7.1 – Emissions during supersonic mission
7.1 Emissions during supersonic missionFor calculating the emission, the same formula of Chapter 4 is applied:
Emissioni,k = EIi,kwf,k∆t
The following graphs are obtained during the LTO phases:
Figure 7.2. Emissions in LTO cycle
Now the same steps can be followed for a full mission. It is important to highlight thatStratofly during Approach and Taxi phases has all the engines off, and so the fuel flow andthe emissions are equal to zero. Assuming a classic mission as follows:
Phase M z [m] Time [min] Wf [kg/s] EINOx [g/kgf ]Take-off 0.3 0 0.7 859.4 4.45Climb Subsonic 0.4 1’500 2.2 532.6 3.51Subsonic Cruise 0.5 11’000 25 680 3.57Supersonic Climb 2 20’000 8 537 6.28Supersonic Cruise 4 25’000 8 242 37.1Supersonic Climb 4.5 29’000 8 366 87.5Hypersonic Cruise 8 33’000 95 80 50Approach 4 18’000 20 0 0Taxi/ground idle 0.1 26 26 0 0
Table 7.5. Characteristic points of a typical Stratofly mission
it is possible to carry out the same calculations as in chapter 4 for an entire mission,and it is obtained:
81
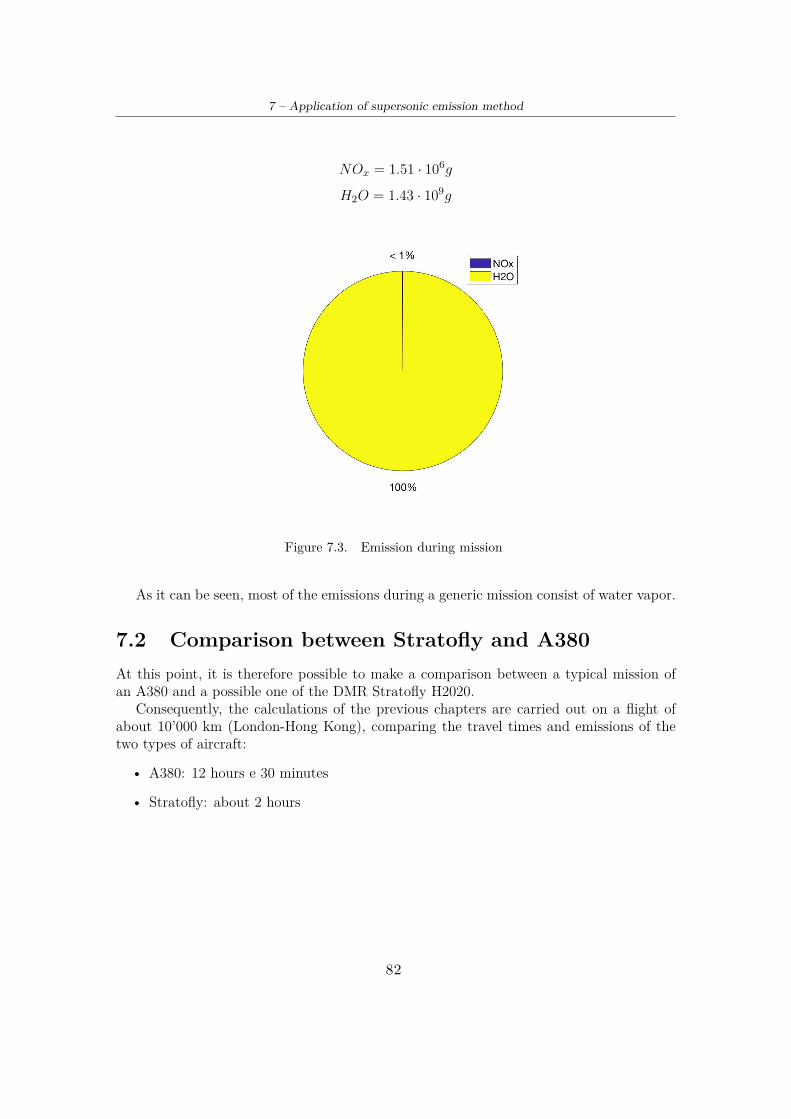
7 – Application of supersonic emission method
NOx = 1.51 · 106g
H2O = 1.43 · 109g
Figure 7.3. Emission during mission
As it can be seen, most of the emissions during a generic mission consist of water vapor.
7.2 Comparison between Stratofly and A380At this point, it is therefore possible to make a comparison between a typical mission ofan A380 and a possible one of the DMR Stratofly H2020.
Consequently, the calculations of the previous chapters are carried out on a flight ofabout 10’000 km (London-Hong Kong), comparing the travel times and emissions of thetwo types of aircraft:
• A380: 12 hours e 30 minutes
• Stratofly: about 2 hours
82
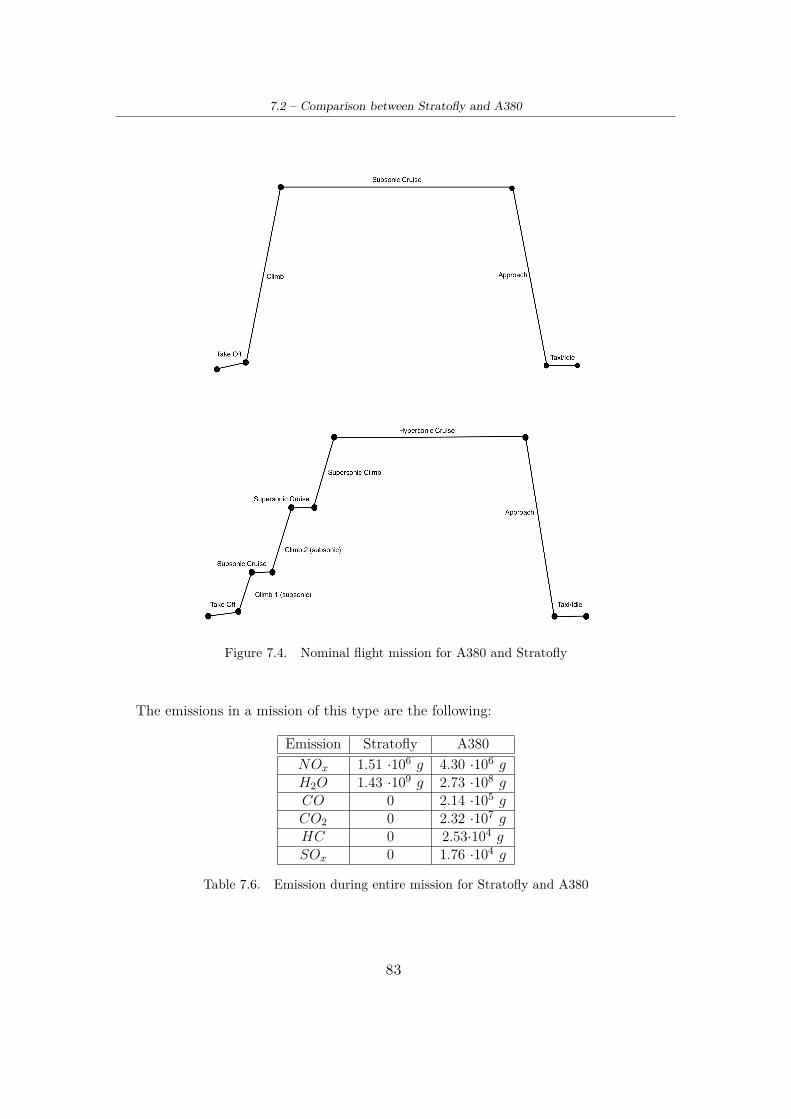
7.2 – Comparison between Stratofly and A380
Figure 7.4. Nominal flight mission for A380 and Stratofly
The emissions in a mission of this type are the following:
Emission Stratofly A380NOx 1.51 ·106 g 4.30 ·106 gH2O 1.43 ·109 g 2.73 ·108 gCO 0 2.14 ·105 gCO2 0 2.32 ·107 gHC 0 2.53·104 gSOx 0 1.76 ·104 g
Table 7.6. Emission during entire mission for Stratofly and A380
83
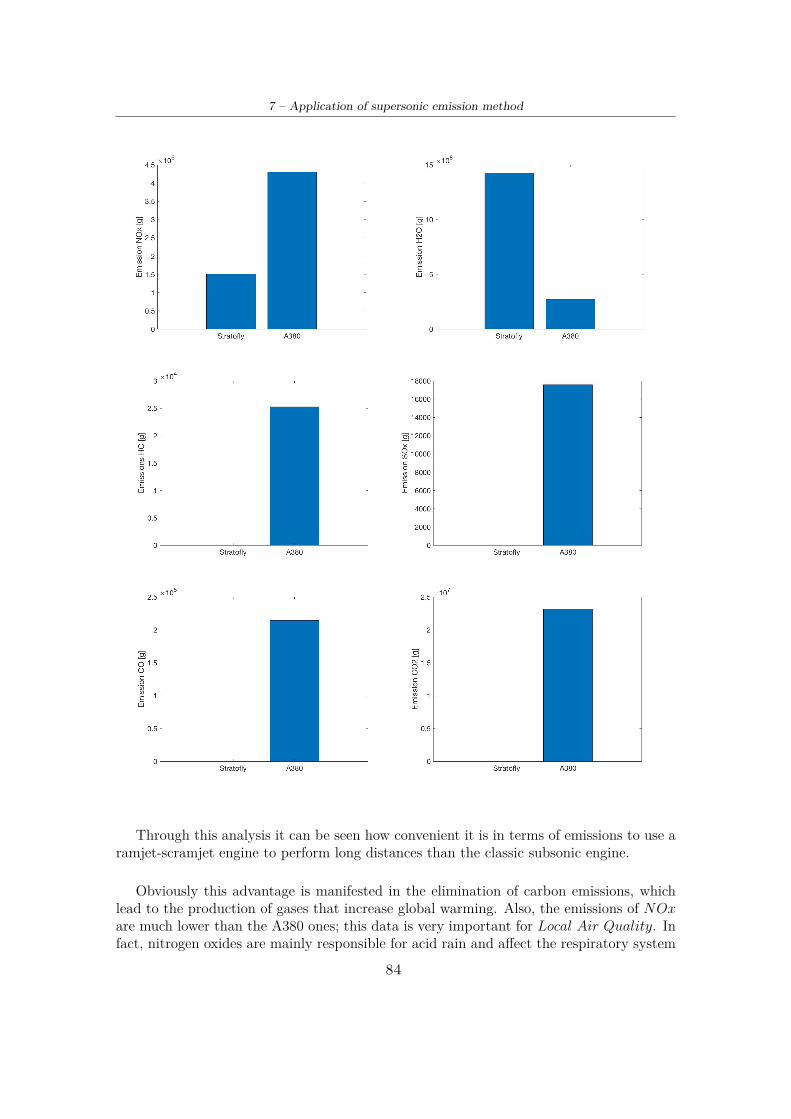
7 – Application of supersonic emission method
Through this analysis it can be seen how convenient it is in terms of emissions to use aramjet-scramjet engine to perform long distances than the classic subsonic engine.
Obviously this advantage is manifested in the elimination of carbon emissions, whichlead to the production of gases that increase global warming. Also, the emissions of NOxare much lower than the A380 ones; this data is very important for Local Air Quality. Infact, nitrogen oxides are mainly responsible for acid rain and affect the respiratory system
84

7.2 – Comparison between Stratofly and A380
of human beings. Precisely for this reason they must be monitored and kept under control,especially near airports, as LAQ could be damaged.
85

86
Chapter 8
Conclusions
In this thesis work, environmental problems are linked to the air traffic increase. It startedby studying the Emission Indexes of aircrafts in circulation at an international level, basedon the Icao Database. From this set of data, the first reasonings are developed in order totry to visualize a relationship between the quantity of emissions and the characteristics ofthe engine. Subsequently, the Boeing Fuel Flow Method was applied, a theory that madeit possible to obtain the Emission Indexes of the aircraft along the entire mission profileand not only during the Taxe off and Landing cycle. Once the Emission Indexes have beenobtained it was possible to calculate the quantities of emissions (both during the LTO cycleand during the entire mission) for each type: NOx, SOx, H2O, CO, CO2 and HC.
After this first part, focused on subsonic flight, was completed, the one, concerningsupersonic flight, begins. An attempt was made to adapt the Fuel Flow Method to thesupersonic and hypersonic case, retracing the steps taken for subsonic flight. Some simpli-fications or some steps that would be relevant to high Mach numbers have not been carriedout. Subsequently, the formulas with the data obtained by the Von Karman Institute andthe "Centro Italiano di Ricerca Aerospaziale" were applied and it was highlighted that thechanges made do not particularly differ from the results obtained in the subsonic flightcase. Unfortunately, it has not been possible to carry out a statistical analysis for super-sonic flight. The available data are not sufficient and there is not a large number of enginesused exclusively for supersonic and hypersonic cruises. In fact, ramjets and scramjets arerelatively new types of engines and not many examples exist today.
In conclusion, on the one hand for subsonic flight it was not possible to find a relationshipbetween the different types of emissions and the characteristics of each engine (OPR andBPR). On the other hand, it was possible to apply the classic Boeing Fuel Flow Method,which made it possible to obtain the Emission Index during all flight phases. From thesevalues it is immediate to calculate the amount of emissions during an entire typical mission.
In the supersonic and hypersonic field, it was possible to calculate the amount of emis-sions of a Dual Mode Ramjet engine, through the knowledge of some critical points of
87
8 – Conclusions
a typical mission. An attempt was made to calculate the Emission Indexes at a precisepoint of the supersonic mission using the Fuel Flow Method, to see if the data obtainedare comparable to the experimental ones. Unfortunately, the data do not match and arevery different: this is because coefficients and exponents typical of subsonic combustors areincluded in the formulas of the fuel flow method and for this reason they must be modi-fied. Furthermore, it must not be forgetten that during the Stratofly mission the DMR isswitched on and the six ATR engines are switched off. This important feature will have tobe considered in future formulas too, in order to calculate the Emission Index during thetypical mission (without knowing the manufacturer’s proprietary data).
In the future, having a database of supersonic and hypersonic engines available, itwould be interesting to develop a statistical analysis, in order to characterize the emissionsof these engines according to their reference parameters.A database would allow to compute new exponents and coefficients for the fuel flow methodin the supersonic case, refining and improving the formulas for calculating the EmissionIndex.
88
Bibliography
[1] Seeckt K., Conceptual Design and Investigation of Hydrogen-Fueled Regional, Stock-holm, 2010
[2] Hydrogen-powered aviation, Luxembourg, 2020[3] Corchero G. and Montanes J. L. An approach to the use of hydrogen for commercial
aircraft engines, Madrid, 2005[4] Nout van Zon Liquid Hydrogen Powered Commercial Aircraft, Delft, 2008[5] Lentini D., Impatto ambientale dei motori aeronautici, Roma, 2018[6] Ingenito A., Modellistica della combustione in regime supersonico, Roma, 2005[7] International Civil Aviation Organization, Aviation and Environmental Report, 2019[8] International Civil Aviation Organization , Annex 16-Environmental Protection Vol-
ume I, Aircraft Noise, 2017[9] International Civil Aviation Organization , Annex 16-Environmental Protection Vol-
ume II, Aircraft engine emissions, 2017[10] International Civil Aviation Organization , Annex 16-Environmental Technical Man-
ual, Volume III, Procedures for the CO2 emission certification , 2018[11] Raymer P. Daniel, Aircraft design: a conceptual approach, Washington, 1992[12] Fernandez Villacè V., Simulation, design and analysis of air–breathing Combined–cycle
engines for high speed propulsion, Madrid, 2013[13] Longo J. M. A., Dittrich R., Banuti D., Sippel M., Klevanski J., Atanassov U., Carrier
G., Duveau P., Salah El Din I., Thepot R., Loubeau A., Coulouvrat F., Jarsla R., RabiaH., Perigo D., Steelant J., Concept Study for a Mach 6 Transport Aircraft, Orlando,2009
[14] Okai K., Sippel M., Component Analysis of TBCC Propulsion for a Mach 4.5 Super-sonic Cruise Airliner, Brussels, 2007
[15] Jivraj F., Varvill R., Bond A., Paniagua G. The Scimitar Precooled Mach 5 Engine,Brussels, 2007
[16] Murray N., Steelant J., Methodologies involved in the Design of LAPCAT-MR1: aHypersonic Cruise Passenger Vehicle, Bremen, 2009
[17] C.Paridaens C., Verstraete D., Hendrick P., Performance Assessment of a Pre-CooledTurbofan for Hypersonic Vehicle Acceleration, Brussels, 2011
[18] Amabile S., Cutrone L., Tuccillo R., Battista F., Analysis of a Low-Emission Combus-tion Strategy for a High Performance Trans- Atmospheric Aircraft Engine, Nashville,2010
[19] Haidn O. J., Slavinskava N. A., Reduced Chemical Mechanism for Methane Combus-tion, Toulouse, 2007
89
Bibliography
[20] Battista F., Cutrone L., Ranuzzi G., Borreca S., Supersonic Combustion Models Ap-plication in Advanced Propulsion Concepts, Dayton, 2008
[21] Langener T., Erb S., Steelant J., Trajectory simulation and optimization of the Lapcat-MR2 hypersonic cruiser concept, St. Petersburg, 2014
[22] Fernandez Villace V., Paniagua G., Steelant J.,Installed performance of an Air-Turbo-Rocket Expander Cycle, Cologne, 2014
[23] Jivraj F., Varvill R., Bond A., Paniagua G., The Scimitar Precooled Mach 5 Engine,Brussels, 2007
[24] Ferlauto M., Appunti del corso di Propulsione Aerospaziale Avanzata, Torino, 2020[25] Marsilio R. Appunti del corso di Propulsione Aerospaziale Avanzata, Torino, 2020[26] DuBois D., Paynter G. C., "Fuel Flow Method2" for Estimating Aircraft Emissions,
2006
90


