Embed Size (px)
Citation preview
European Journal of Political Economy 27 (2011) 181–200
Contents lists available at ScienceDirect
European Journal of Political Economy
j ourna l homepage: www.e lsev ie r.com/ locate /e jpe
Political competition, electoral participation and public finance in 20thcentury Latin America
Toke S. Aidt a,b,⁎, Dalibor S. Eterovic c,1
a Faculty of Economics, University of Cambridge, Cambridge CB3 9DD, United Kingdomb CESifo, Munich, Germanyc School of Government, Universidad Adolfo Ibañez, Diagonal Las Torres 2640, Santiago, Chile
a r t i c l e i n f o
⁎ Corresponding author. Faculty of Economics, UnivE-mail addresses: [email protected] (T.S. A
1 Tel.: +56 2 5198268.
0176-2680/$ – see front matter © 2010 Elsevier B.V.doi:10.1016/j.ejpoleco.2010.06.006
a b s t r a c t
Article history:Received 21 June 2009Received in revised form 6 April 2010Accepted 27 June 2010Available online 29 July 2010
Rational choice models predict that political competition and political participation haveopposite effects on the size of government. We investigate these theories using data from apanel of 18 Latin American countries during the 20th century. Our research builds evidence forthe prediction that reforms enhancing political competition tend to limit the size ofgovernment, while reforms increasing political participation tend to increase the size ofgovernment. Furthermore, we find that reforms which remove literacy requirements fromfranchise laws are associated with governmental expansion, while changes in women'ssuffrage laws have no impact on the size of government. Our findings demonstrate theempirical relevance of the distinction between political competition and participation.
© 2010 Elsevier B.V. All rights reserved.
JEL classification:D7H11
Keywords:Political competitionPolitical participationThe extension of the franchiseWomen's suffrageLiteracy requirementsSize of government
1. Introduction
The role of political institutions as the drivers of specific policy choices and more profoundly, as determinants of economicdevelopment, has been the subject of intense theoretical and empirical investigation in recent years (e.g., Acemoglu and Robinson,2006; Boix, 2003; Persson and Tabellini, 2003; Klomp and de Haan, 2009). At least since Dahl (1971), the idea that politicalinstitutions are pivotal players in ensuring economic and social outcomes has enjoyed widespread support. Yet, explaining howpolitical institutions wield their influence has remained a nebulous endeavor. We know that institutions regulate the exactparameters of citizenship rights, determining who votes and how. We know that institutions regulate the degree of competitionamong factions for political power. And we know that institutions determine the autonomy of the legislature and court system.What we don't understand fully is how the different design of these political institutions impact economic and social outcomes.
Crucial to building more clarity in our understanding of these fundamental issues is the distinction between electoralparticipation and political competition. This distinction is implicitly or explicitly embodied in many definitions of democracy (e.g.,Powell, 1982; Przeworski et al., 2000) but is also employed in analysis of broader regime types, as demonstrated, for example, byWintrobe's work on dictatorships (Wintrobe, 1998). Electoral participation and political competition also figure prominently intheoretical research. In Meltzer and Richard (1981), for example, the political inclusion of hitherto disadvantaged or
ersity of Cambridge, Cambridge CB3 9DD, United Kingdom. Tel.: +44 1223 335231; fax: +44 1223 335475idt), [email protected] (D.S. Eterovic).
All rights reserved.
.
182 T.S. Aidt, D.S. Eterovic / European Journal of Political Economy 27 (2011) 181–200
disenfranchised groups is shown to increase the demand for distributive public spending and to expand the size of government. Acontrasting view is provided by Becker (1983) andWittman (1989) who stress the role that political competition plays in limitingthe size of government.
This paper builds new empirical evidence on these theoretical propositions. We show that electoral participation and politicalcompetition have very different implications for the size of government and for the tax structure. We contribute to the existingempirical literature, which isolates the effects of either political competition or electoral participation,2 by studying the twodimensions jointly.
The setting for our study is the particularly fecund political climate of Latin America. Indeed, 20th century Latin Americaprovides an almost perfect laboratory for testing hypothesizes about political institutions. For example, since independence, Peruhas changed or modified its constitution 13 times; Chile has modified its constitution 11 times, while Brazil and Colombia havemade 8 and 12 changes, respectively. These institutional fluctuations not only reflect shifts in the allocation of voting rights andthereby the scope for electoral participation; but, they indicate repeated vacillations between highly competitive democraticenvironments and highly autocratic or dictatorial environments with severely limited competitive frameworks. These factorsmake Latin America an ideal political terrain for exploring through statistical assessment the impact of electoral participationand political competition on fiscal outcomes, in particular on the size of government and on the tax structure.
Our study is two-pronged, first estimating the impact of different competitive and participatory frameworks on fiscaloutcomes. Our second objective is to go into more detail about restrictions on electoral participation and to study the impact ofelectoral literacy requirements and women's suffrage limitations. We believe exploring the outcome of these transitionsstatistically makes contributions to the ongoing debate about the role of political institutions, and provokes urgent questions aboutinstitutional and electoral design. However, we acknowledge the importance of peculiar, local specificities demonstrated in thehistories of the 18 countries we study.
Literacy requirements were themost obdurate of Latin American electoral restrictions. By the late 19th century, most countriesin Latin America were at least nominally democracies, but with much more restricted voting franchise requirements than, forexample, the USA and Canada (Engerman and Sokoloff, 2005). Restrictions could includewealth or income requirements, butmostfrequently, laws contained literacy qualifications. While most wealth or income requirements were abolished in the late 19th andearly 20th century, literacy requirements remained in place in some countries until the 1980s (Engerman et al., 1998). In countriessuch as Peru, Bolivia and Ecuador, which have sizable, predominant Native American populations with high levels of illiteracy,these restrictions likely served the purpose of keeping an elite in control, and excluding themassivemarginalized population frompolitical influence. In a political climate of such divisive restrictions, we build statistical explanations to show how literacy testsrestricting the franchise effected fiscal outcomes.
Suffrage restrictions also excluded vast portions of the population from the electoral process well into the 20th century byvirtue of their gender. The first country to grant women the right to vote was Ecuador in 1929, followed by Uruguay and Brazil in1932. Nearly three decades later, Paraguay followed suit in 1961. Restrictions on female participation in the political process inother contexts, e.g., the USA (Lott and Kenny, 1999) and western Europe (Aidt and Dallal, 2008) have been found to affect fiscaloutcomes. We examine if similar patterns can be found in Latin America.
Our analysis is based on a panel data set with information on fiscal outcomes (for central government) in 18 Latin Americancountries for the period 1920 to 2000. We employ the Polity IV index to measure political competition (Marshall and Jaggers,2007), and turnout in elections and referenda to measure electoral participation (Vanhanen, 2000, 2003b). These choices allow usto track political reforms over long periods of time and exploit the often substantial variation in electoral participation and politicalcompetitionwithin the 18 Latin American countries. The Polity IV index is sometimes interpreted as a measure of democracy moregenerally, but, as we shall detail in Section 2, a careful reading of the Polity IV manual suggests that it is more accurate to interpretit as a measure of political competition. Many studies, e.g., Boix (2003, chapter 5), Mulligan et al. (2004), Persson and Tabellini(2006), Kenny andWiner (2006) use a “world” sample that includes as many countries as possible to study the link between fiscalstructures and political institutions. The advantage of this is that the variation in institutional differences is maximized, but at thesame time, countries included in a world sample represent very different economic, geographical, social and cultural experiences.We believe that the focus on Latin America has the advantage of making the sample more homogenous, as these countries sharecommon cultural and linguistic roots.
We draw three main conclusions from our analysis. First, our fixed effect estimates strongly support the hypothesis thatelectoral participation and political competition have opposite effects on the size of government. A country that instigates reformsenhancing political competition experiences a fall in government expenditure and taxation in percentage of GDP in the order of1.7–2.0 percentage points. In contrast, a country that, through franchise reform or otherwise, experiences an increase of 50% of thepopulation who can participation in elections, subsequently witnesses an increase in government expenditure and taxation as apercentage of GDP by approximately 2.0–2.3 percentage points. Second, we find indirect evidence that part of the reduction in thesize of government associated with enhanced political competition can be attributed to a reduction in spending on securing andmaintaining authority. In short, in environments bereft of political competition, we suggest direct costs are incurred to thegovernment by the elite's attempt to maintain power and control, be it through military or policing measures. Once a morepluralistic, competitive political environment is achieved, the costs of repression diminish. Third, we find that much of the increase
2 See e.g., Hettich and Winer (1991), Hettich and Winer (1988), Husted and Kenny (1997), Boix (2001), Rogers and Rogers (2000), Aidt et al. (2006), Kennyand Winer (2006), Aidt and Jensen (2009a,b).
183T.S. Aidt, D.S. Eterovic / European Journal of Political Economy 27 (2011) 181–200
in government size due to heightened electoral participation can be attributed to reforms which eliminate literacy tests. Women'ssuffrage, in contrast, appears to have no significant impact on the size of government in Latin America.
The paper is organized as follows. In Section 2, we introduce the distinction between political competition and electoralparticipation, deriving testable implications from theoretical literatures and discussing how we obtain operational measures ofpolitical competition and electoral participation. In Section 3, we present our data on the size of government, discuss theeconometric specification, and present the main results. In Section 4, we refine our measure of electoral participation by explicitlyincorporating franchise reforms (removal of literacy tests and women's suffrage) into the analysis. In Section 5, we briefly discussother results that emerge from the analysis. In Section 6, we provide concluding remarks and discuss the issue of causality in detail.Appendix A contains a detailed discussion of data and sources.
2. Political competition and electoral participation: theory and measurement
The anatomy of political systems has been dissected in varied definitions. Some authors stress the contrasting characteristics ofdemocracies and autocracies (or dictatorships) (e.g., Przeworski et al., 2000; Mulligan et al., 2004). Others focus on differences inthe details of political institutions within these broad categories. For example, Wintrobe (1998) identifies and analyzes distincttypes of dictatorship, while Persson and Tabellini (2003) compare democracies that use different election rules or democraciesthat can be classified as either parliamentarian or presidential. Husted and Kenny (1997) and Aidt et al. (2006) study the allocationof voting rights and the extension of the franchise, while Mueller and Stratmann (2003) focus on differences in voter turnout ratesin democratic elections.
A common idea motivating all these classifications is that institutional arrangements create incentives for political leaderswhich not only lead to particular policy choices, but also provide different incentives for agents in the private sector. This, in turn,becomes an important determinant of the development path of a society and the welfare levels attained. Dahl (1971) made animportant distinction between varying dimensions of democracy, two of which we call “political competition” and “electoralparticipation”.
This theory suggests that political institutions create incentives by fostering or hindering political competition and electoralparticipation. By political competition we mean the extent to which political power is, in fact, freely contested by political parties,pressure groups or other organized factions within a defined political structure. Moreover, in an environment of politicalcompetition the legislature enjoys autonomy and constitutional arrangements put constraints on the executive. Electoralparticipation, in contrast, is related to the rights of individual citizens to participate in the selection of their government throughelections and referenda and the extent to which they exercise this right.
Both conceptually and empirically, it is important to consider political arrangements or regimes along participatory andcompetitive dimensions. Fig. 1 illustrates how a participatory-competitive analytical approach can be used to classify politicalregimes.3 Societies with universal suffrage, high electoral turnout, and multi-party elections are located to the Northeast andcharacterized by a high degree of both political competition and electoral participation. Examples in this category includeArgentina, 1873–75; Costa Rica, 1949–2000; and Mexico, 1994–2000. Societies in which the government is controlled by onefaction andmost citizens are barred from participating in the selection of their government are located to the Southwest. Examplesof this include Brazil, 1900–1930; Venezuela, 1920–45; and Guatemala, 1931–43. Societies with a one-party state, but “nominal”elections based on comprehensive suffrage rights are located to the Northwest. Examples include Paraguay, 1961–88; Mexico,1953–93; and Panama, 1983–87. Societies with restricted suffrage, but competition within the elite for political power are locatedto the Southeast. Examples include Argentina, 1890–1911; Chile, 1940–48; and Peru, 1942–54.
2.1. Political competition
Political competition plays an important role across a broad range of political regime types and plays an important role in thepresence and as well as in the absence of free and fair elections. The mechanisms through which political competition wields itsinfluence differ, yet a common feature stands out: contestability of power tends to promote efficient policy. In the context ofestablished democracies with regular elections, the effect of political competition on policy choices is normally conceptualizedwithin the context of spatial votingmodels (Downs, 1957; Lindbeck andWeibull, 1987). Two-party competition produces a strongpull towards the median position in simple Downsian models and can, under some circumstances, lead to Pareto-efficientequilibrium outcomes when voter preferences have a stochastic ideological component (Hettich and Winer, 1999, chapter 4;Coughlin and Nitzan, 1981). Wittman (1989, 1995) and others further stress the efficiency enhancing effects of politicalcompetition within this context. Becker (1983, 1985) takes a broader view and emphasizes the role that pressure groups play inshaping public policy, not only within democratic societies but also in societies ruled by non-elected elites. In Becker (1983), forexample, he argues that competition among pressure groups for and against redistribution leads to efficient methods of taxationbecause political pressure in favor of tax instruments with high deadweight costs is relatively low, while opposition is strong.Ferejohn (1986) and others point to the fact that political competition constraints the ability of political leaders to extract rents. Inshort, there is a strong presumption that political competition is associated with more efficient government, not only indemocracies, but also in autocracies. Although it does not necessary follow from this that political competition leads to less
3 The classification of countries in the Figure is based on the Polity IV index (political competition) and Vanhanen's (2003b) participation index (politicalparticipation). We discuss these measures of democracy in more detail below.
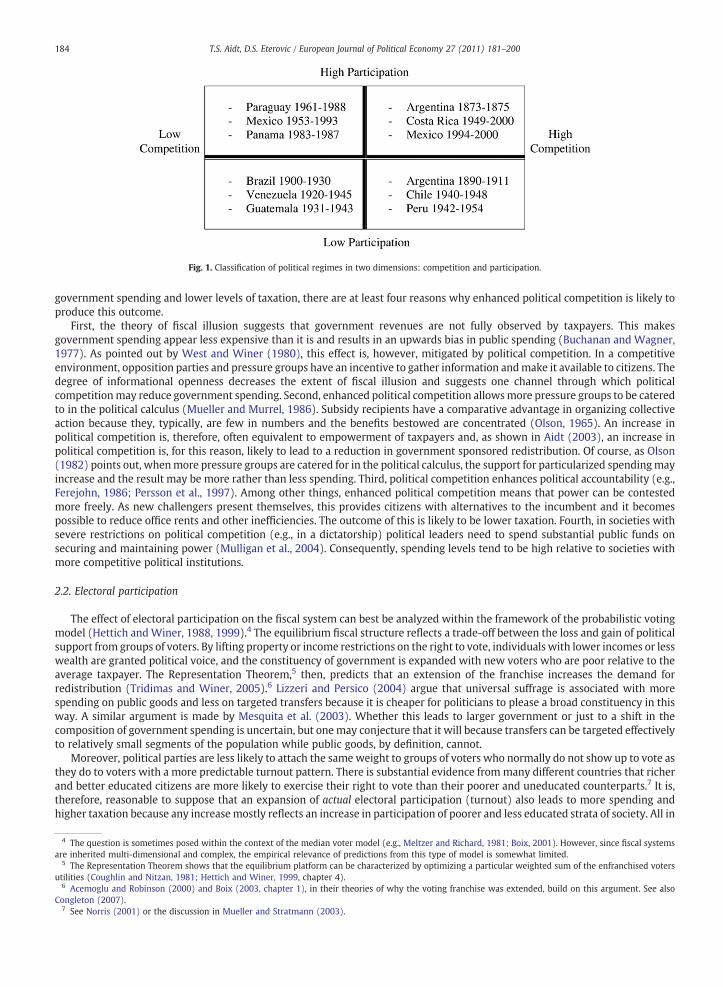
Fig. 1. Classification of political regimes in two dimensions: competition and participation.
184 T.S. Aidt, D.S. Eterovic / European Journal of Political Economy 27 (2011) 181–200
government spending and lower levels of taxation, there are at least four reasons why enhanced political competition is likely toproduce this outcome.
First, the theory of fiscal illusion suggests that government revenues are not fully observed by taxpayers. This makesgovernment spending appear less expensive than it is and results in an upwards bias in public spending (Buchanan and Wagner,1977). As pointed out by West and Winer (1980), this effect is, however, mitigated by political competition. In a competitiveenvironment, opposition parties and pressure groups have an incentive to gather information andmake it available to citizens. Thedegree of informational openness decreases the extent of fiscal illusion and suggests one channel through which politicalcompetitionmay reduce government spending. Second, enhanced political competition allowsmore pressure groups to be cateredto in the political calculus (Mueller and Murrel, 1986). Subsidy recipients have a comparative advantage in organizing collectiveaction because they, typically, are few in numbers and the benefits bestowed are concentrated (Olson, 1965). An increase inpolitical competition is, therefore, often equivalent to empowerment of taxpayers and, as shown in Aidt (2003), an increase inpolitical competition is, for this reason, likely to lead to a reduction in government sponsored redistribution. Of course, as Olson(1982) points out, whenmore pressure groups are catered for in the political calculus, the support for particularized spendingmayincrease and the result may be more rather than less spending. Third, political competition enhances political accountability (e.g.,Ferejohn, 1986; Persson et al., 1997). Among other things, enhanced political competition means that power can be contestedmore freely. As new challengers present themselves, this provides citizens with alternatives to the incumbent and it becomespossible to reduce office rents and other inefficiencies. The outcome of this is likely to be lower taxation. Fourth, in societies withsevere restrictions on political competition (e.g., in a dictatorship) political leaders need to spend substantial public funds onsecuring and maintaining power (Mulligan et al., 2004). Consequently, spending levels tend to be high relative to societies withmore competitive political institutions.
2.2. Electoral participation
The effect of electoral participation on the fiscal system can best be analyzed within the framework of the probabilistic votingmodel (Hettich andWiner, 1988, 1999).4 The equilibrium fiscal structure reflects a trade-off between the loss and gain of politicalsupport from groups of voters. By lifting property or income restrictions on the right to vote, individuals with lower incomes or lesswealth are granted political voice, and the constituency of government is expanded with new voters who are poor relative to theaverage taxpayer. The Representation Theorem,5 then, predicts that an extension of the franchise increases the demand forredistribution (Tridimas and Winer, 2005).6 Lizzeri and Persico (2004) argue that universal suffrage is associated with morespending on public goods and less on targeted transfers because it is cheaper for politicians to please a broad constituency in thisway. A similar argument is made by Mesquita et al. (2003). Whether this leads to larger government or just to a shift in thecomposition of government spending is uncertain, but one may conjecture that it will because transfers can be targeted effectivelyto relatively small segments of the population while public goods, by definition, cannot.
Moreover, political parties are less likely to attach the same weight to groups of voters who normally do not show up to vote asthey do to voters with a more predictable turnout pattern. There is substantial evidence frommany different countries that richerand better educated citizens are more likely to exercise their right to vote than their poorer and uneducated counterparts.7 It is,therefore, reasonable to suppose that an expansion of actual electoral participation (turnout) also leads to more spending andhigher taxation because any increasemostly reflects an increase in participation of poorer and less educated strata of society. All in
4 The question is sometimes posed within the context of the median voter model (e.g., Meltzer and Richard, 1981; Boix, 2001). However, since fiscal systemsare inherited multi-dimensional and complex, the empirical relevance of predictions from this type of model is somewhat limited.
5 The Representation Theorem shows that the equilibrium platform can be characterized by optimizing a particular weighted sum of the enfranchised votersutilities (Coughlin and Nitzan, 1981; Hettich and Winer, 1999, chapter 4).
6 Acemoglu and Robinson (2000) and Boix (2003, chapter 1), in their theories of why the voting franchise was extended, build on this argument. See alsoCongleton (2007).
7 See Norris (2001) or the discussion in Mueller and Stratmann (2003).
185T.S. Aidt, D.S. Eterovic / European Journal of Political Economy 27 (2011) 181–200
all, although there are counter-arguments,8 this suggests that an increase in electoral participation leads to more spending andhigher taxation.
To summarize, while the theoretical literature suggests that political competition tends to reduce while electoral participationtends to increase the size of government, the suggestion is not unambiguous, and it is ultimately an empirical question to establishwhich way the effects go.
2.3. Measurement
To establish the empirical relevance of the theoretical arguments, we need to find separate operational indicators of the twodimensions.9 Among the many alternative indicators that have been proposed in the literature, we have settled on two that weargue effectively and accurately capture the two dimensions we are interested in.
First, electoral participation is relatively straightforward to measure, either as the number of eligible voters (e.g., Aidt et al.,2006; Lindert, 1994) or as the number of voterswho actually vote in elections or referenda (e.g., Mueller and Stratmann, 2003). Forthe purpose at hand, it is better to use a measure of actual rather than potential participation and we draw on Vanhanen'sPolyarchy database (Vanhanen, 2000, 2003b). More specifically, we measure electoral participation by the participation index. It isan aggregate of voter turnout in general elections and in referenda, in proportion to the total population. It takes the value of 0when there are no elections or referenda to participate in.10 Studies that used the Vanhanen's participation index to characterizeelectoral participation include Reiter and Tillman (2002), Fredriksson et al. (2005) and Davenport and Armstrong (2004). InSection 4, we refine the measure of electoral participation by explicitly incorporating two important restrictions on the right toparticipate related to literacy requirements and the exclusion of women.
Second, to measure political competition, we use the Polity IV index developed by Marshall and Jaggers (2007). The Polity IVindex comprises a composite index of democracy and autocracy and has, in a number of recent studies, e.g., Avelino et al. (2005),Rodrik andWacziarg (2004),Mulligan et al. (2004), Lopez-Cordova andMeissner (2008), Papaioannou and Siourounis (2008), andPersson (2005), been used as a general indicator of “democracy”, as a tool to classify political regimes (democracy versusautocracy), or as a tool to define episodes of democratization. A closer look at the definition of the index, however, suggests, as alsonoted by Vanhanen (2000), that it should be viewed as an indicator of political competition rather than as an indicator ofdemocracy or autocracy per se.
The five underlying authority characteristics on which the Polity IV index is based are11: i) competitiveness of executiverecruitment: the extent that prevailing modes of advancement give subordinates equal opportunities to become superordinates;ii) openness of executive recruitment: recruitment of the chief executive is “open” to the extent that all the politically activepopulation has an opportunity, in principle, to attain the position through a regularized process.; iii) executive constraints: theextent of institutionalized constraints on the decision making powers of chief executives, whether individuals or collectivities; iv)regulation of participation: the extent that there are binding rules on when, whether, and how political preferences are expressed;v) competitiveness of participation: the extent to which alternative preferences for policy and leadership can be pursued in thepolitical arena. The first three characteristics clearly relate to how easy it is to contest political power or to constraints on theexecutive. The last two characteristics do refer to “participation” and the regulation of elections. However, the coding of thesevariables by the Polity project does not relay directly on information about the extension of the franchise or on actual turnouts inelections. They are, therefore, largely unrelated to electoral participation as defined in this study and do not reflect suffragereforms directly. This is clear from the Polity IV manual, but more importantly it is also, as we shall show below, clear from theactual data.
A number of other measures of political competition has been proposed in the literature and deserves comment. Holbrook andVan Dunk (1993) and Rogers and Rogers (2000) use the “win-margin” of the incumbent governor as ameasure of competition andSkilling and Zeckhauser (2002) focus on the length of time a party has been in office. All thesemeasures havemerits, but they oftenstart from the presumption that some basic democratic structures are in place. This makes them unsuitable for a study that coversepisodes of autocracy as well as episodes of democracy. In particular, our empirical setup requires that we can account for changesin the degree of competitiveness both when competition is about entry into a largely non-elected elite and when competitiontakes place through orderly elections. The Polity IV index is, therefore, well suited tomeasure competitiveness in this context sinceit focuses largely on competition for executive power, whatever the extent of electoral participation in elections might be. Thealternatives are also problematic because they are not invariant to the choice of election rule and they do not account well for partystructure (Vanhanen, 2000). It is also difficult to trace them for long periods of time. For these reasons, we believe that the Polity IVindex is the best measure of political competition for our purposes, not the least because we are interested in the evolution ofpolitical competition over long time periods and across different societies. The Polity IV index is coded from −10 (restrictedpolitical competition) to +10 (unrestricted political competition). For descriptive purposes, it is convenient to normalize theindex to lay between 0 and 1. The only practical alternative to the Polity IV index is the measure of political competition
8 Aidt et al. (in press), for example, shows that an extension of the franchise can in some cases lead to retrenchment rather than to expansion of governmentspending.
9 Alternatively, we could look for comprehensive indices of, say, democracy, such as those employed by Boix (2003, chapter 2) and Vanhanen (2000, 2003b),that combine aspects of competition and participation. While such indices are useful for many purposes they would not allow us to identify the separate impactof political competition and participation that is the main aim of the this study.10 See Appendix A for a precise definition.11 See Marshall and Jaggers (2007).
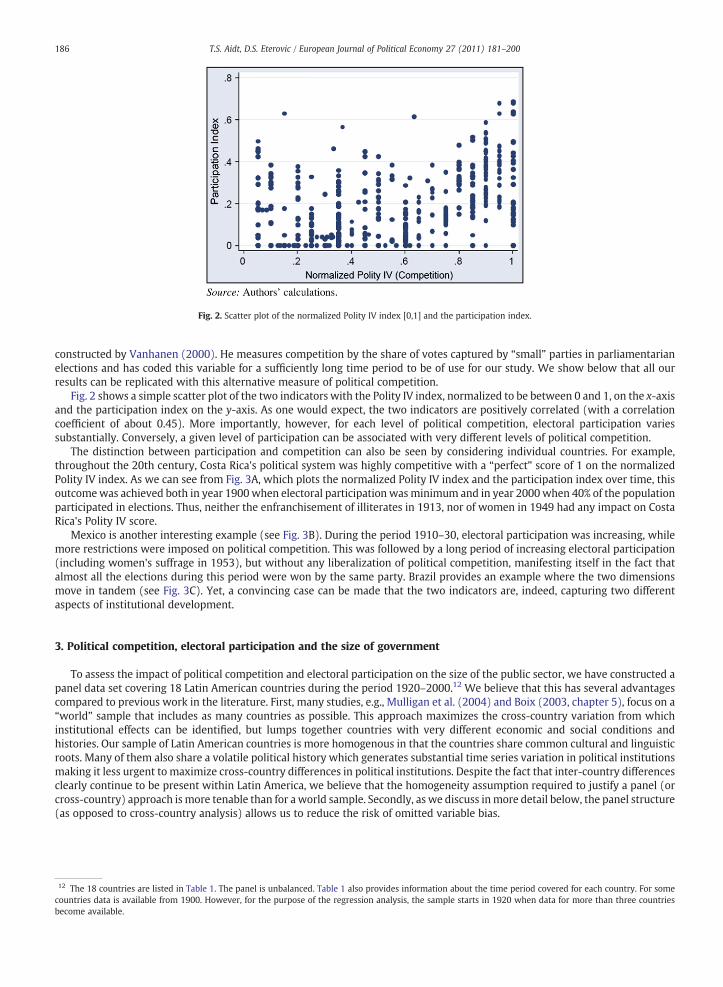
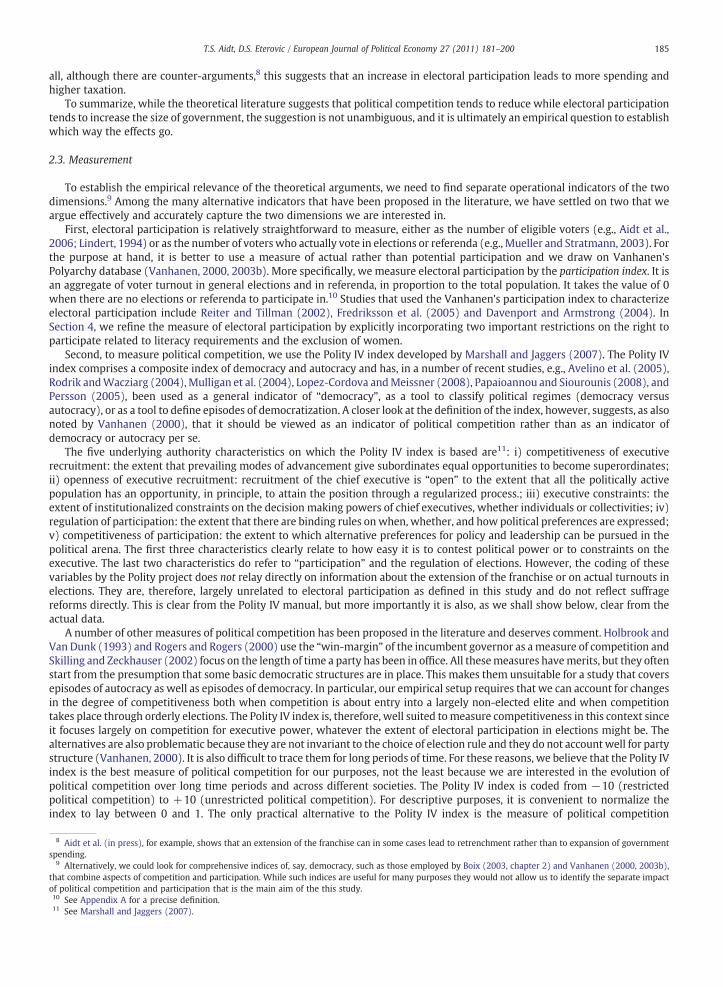
Fig. 2. Scatter plot of the normalized Polity IV index [0,1] and the participation index.
12 The 18 countries are listed in Table 1. The panel is unbalanced. Table 1 also provides information about the time period covered for each country. For somecountries data is available from 1900. However, for the purpose of the regression analysis, the sample starts in 1920 when data for more than three countriesbecome available.
186 T.S. Aidt, D.S. Eterovic / European Journal of Political Economy 27 (2011) 181–200
constructed by Vanhanen (2000). He measures competition by the share of votes captured by “small” parties in parliamentarianelections and has coded this variable for a sufficiently long time period to be of use for our study. We show below that all ourresults can be replicated with this alternative measure of political competition.
Fig. 2 shows a simple scatter plot of the two indicators with the Polity IV index, normalized to be between 0 and 1, on the x-axisand the participation index on the y-axis. As one would expect, the two indicators are positively correlated (with a correlationcoefficient of about 0.45). More importantly, however, for each level of political competition, electoral participation variessubstantially. Conversely, a given level of participation can be associated with very different levels of political competition.
The distinction between participation and competition can also be seen by considering individual countries. For example,throughout the 20th century, Costa Rica's political system was highly competitive with a “perfect” score of 1 on the normalizedPolity IV index. As we can see from Fig. 3A, which plots the normalized Polity IV index and the participation index over time, thisoutcomewas achieved both in year 1900when electoral participation wasminimum and in year 2000when 40% of the populationparticipated in elections. Thus, neither the enfranchisement of illiterates in 1913, nor of women in 1949 had any impact on CostaRica's Polity IV score.
Mexico is another interesting example (see Fig. 3B). During the period 1910–30, electoral participation was increasing, whilemore restrictions were imposed on political competition. This was followed by a long period of increasing electoral participation(including women's suffrage in 1953), but without any liberalization of political competition, manifesting itself in the fact thatalmost all the elections during this period were won by the same party. Brazil provides an example where the two dimensionsmove in tandem (see Fig. 3C). Yet, a convincing case can be made that the two indicators are, indeed, capturing two differentaspects of institutional development.
3. Political competition, electoral participation and the size of government
To assess the impact of political competition and electoral participation on the size of the public sector, we have constructed apanel data set covering 18 Latin American countries during the period 1920–2000.12 We believe that this has several advantagescompared to previous work in the literature. First, many studies, e.g., Mulligan et al. (2004) and Boix (2003, chapter 5), focus on a“world” sample that includes as many countries as possible. This approach maximizes the cross-country variation from whichinstitutional effects can be identified, but lumps together countries with very different economic and social conditions andhistories. Our sample of Latin American countries is more homogenous in that the countries share common cultural and linguisticroots. Many of them also share a volatile political history which generates substantial time series variation in political institutionsmaking it less urgent to maximize cross-country differences in political institutions. Despite the fact that inter-country differencesclearly continue to be present within Latin America, we believe that the homogeneity assumption required to justify a panel (orcross-country) approach is more tenable than for a world sample. Secondly, as we discuss inmore detail below, the panel structure(as opposed to cross-country analysis) allows us to reduce the risk of omitted variable bias.
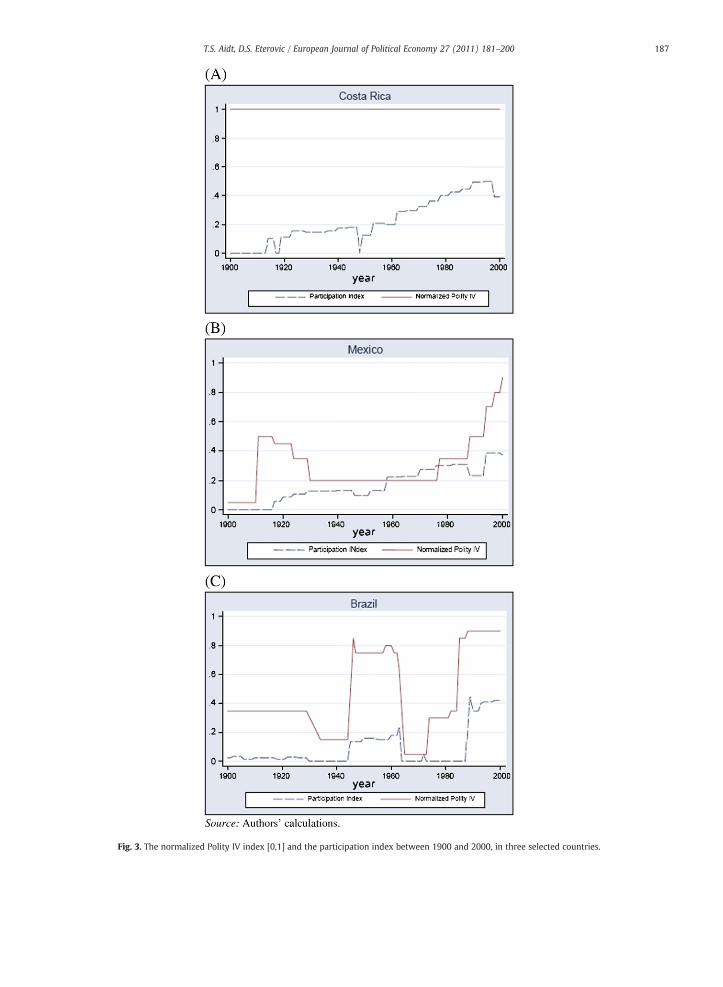
Fig. 3. The normalized Polity IV index [0,1] and the participation index between 1900 and 2000, in three selected countries.
187T.S. Aidt, D.S. Eterovic / European Journal of Political Economy 27 (2011) 181–200
188 T.S. Aidt, D.S. Eterovic / European Journal of Political Economy 27 (2011) 181–200
3.1. The size of the public sector: some facts
We are interested in testing the proposition that political competition reduces the size of the public sector, while electoralparticipation is associated with an expansion. Ideally, we want to study the combined size of central, regional and localgovernment. Data on general government spending is, however, not available for a sufficiently long time period, so all fiscalvariables are for central government. We use two indicators of the size of (central) government: 1) public spending (G/Y) and 2)tax revenues (T/Y), both measured as a percentage of GDP (Y). In addition, to these broad indicators of the size of government, westudy the impact of political competition and electoral participation on the sources of government revenue (the tax structure). Inparticular, we look at 1) income tax revenues (Tincome/Y), 2) commodity tax revenues (Tcommodity/Y) and 3) tariff revenues (Ttariff/Y),all measured as a percentage of GDP. We are also interested in the resources devoted to maintenance of internal security. We donot have fiscal data that measure this directly, so we use data on the number of soldiers as a percentage of the total populationaged between 16 and 59 years old (soldiers per capita aged 16–59) and data on military expenditure as a percentage of GDP(Gdefense/Y) as proxies. These data are only available since 1960 and 1973, respectively.
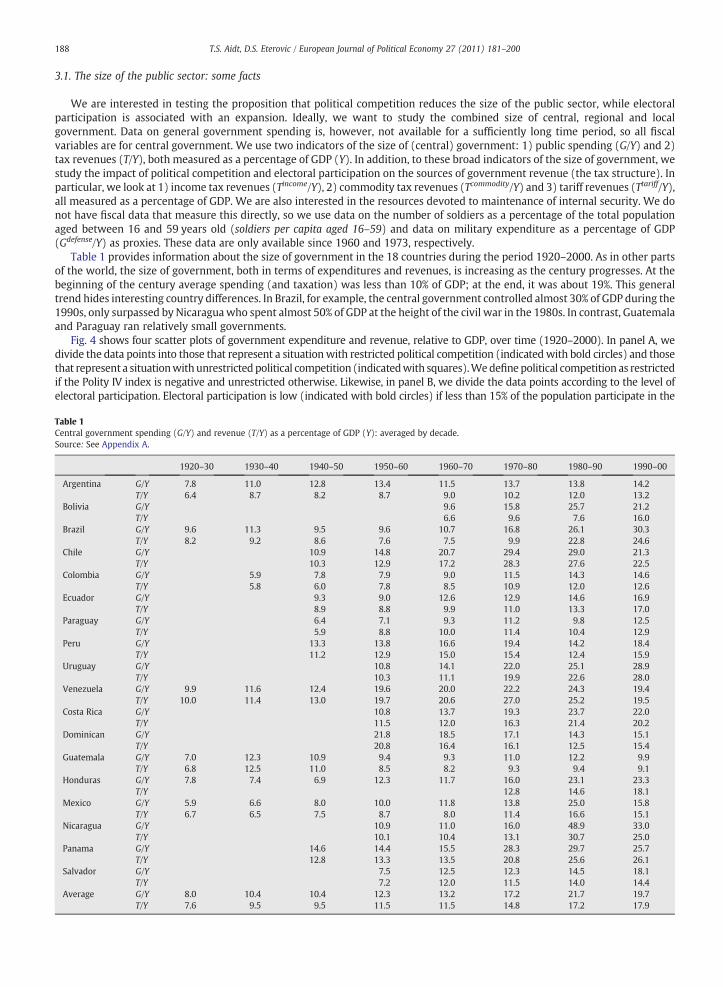
Table 1 provides information about the size of government in the 18 countries during the period 1920–2000. As in other partsof the world, the size of government, both in terms of expenditures and revenues, is increasing as the century progresses. At thebeginning of the century average spending (and taxation) was less than 10% of GDP; at the end, it was about 19%. This generaltrend hides interesting country differences. In Brazil, for example, the central government controlled almost 30% of GDP during the1990s, only surpassed by Nicaraguawho spent almost 50% of GDP at the height of the civil war in the 1980s. In contrast, Guatemalaand Paraguay ran relatively small governments.
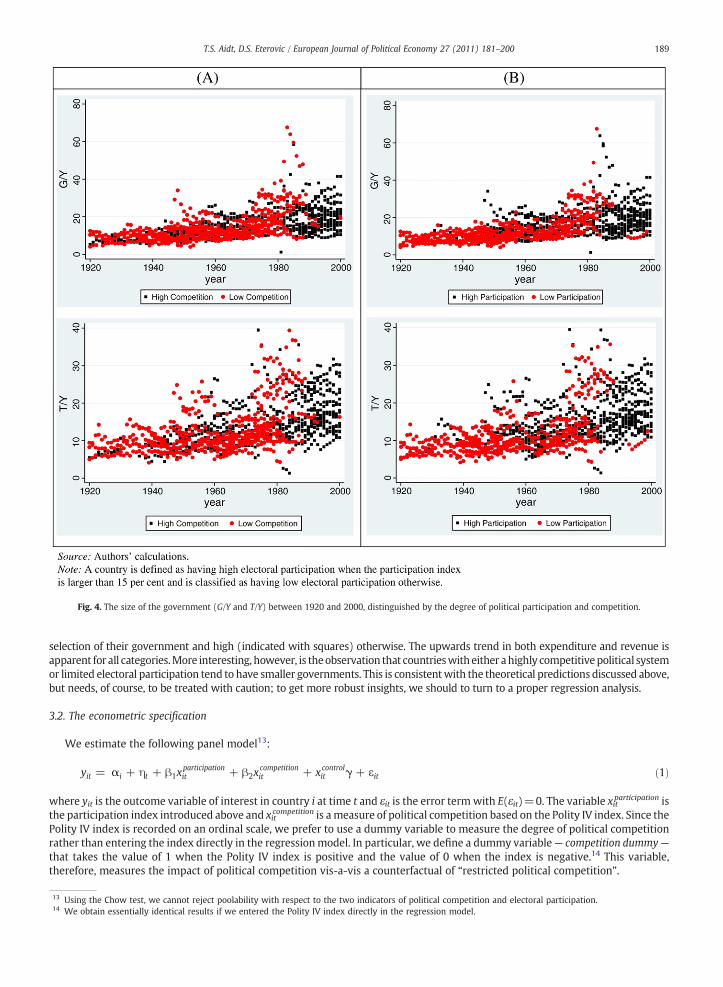
Fig. 4 shows four scatter plots of government expenditure and revenue, relative to GDP, over time (1920–2000). In panel A, wedivide the data points into those that represent a situationwith restricted political competition (indicatedwith bold circles) and thosethat represent a situationwithunrestricted political competition (indicatedwith squares).Wedefinepolitical competition as restrictedif the Polity IV index is negative and unrestricted otherwise. Likewise, in panel B, we divide the data points according to the level ofelectoral participation. Electoral participation is low (indicated with bold circles) if less than 15% of the population participate in the
Table 1Central government spending (G/Y) and revenue (T/Y) as a percentage of GDP (Y): averaged by decade.Source: See Appendix A.
1920–30 1930–40 1940–50 1950–60 1960–70 1970–80 1980–90 1990–00
Argentina G/Y 7.8 11.0 12.8 13.4 11.5 13.7 13.8 14.2T/Y 6.4 8.7 8.2 8.7 9.0 10.2 12.0 13.2
Bolivia G/Y 9.6 15.8 25.7 21.2T/Y 6.6 9.6 7.6 16.0
Brazil G/Y 9.6 11.3 9.5 9.6 10.7 16.8 26.1 30.3T/Y 8.2 9.2 8.6 7.6 7.5 9.9 22.8 24.6
Chile G/Y 10.9 14.8 20.7 29.4 29.0 21.3T/Y 10.3 12.9 17.2 28.3 27.6 22.5
Colombia G/Y 5.9 7.8 7.9 9.0 11.5 14.3 14.6T/Y 5.8 6.0 7.8 8.5 10.9 12.0 12.6
Ecuador G/Y 9.3 9.0 12.6 12.9 14.6 16.9T/Y 8.9 8.8 9.9 11.0 13.3 17.0
Paraguay G/Y 6.4 7.1 9.3 11.2 9.8 12.5T/Y 5.9 8.8 10.0 11.4 10.4 12.9
Peru G/Y 13.3 13.8 16.6 19.4 14.2 18.4T/Y 11.2 12.9 15.0 15.4 12.4 15.9
Uruguay G/Y 10.8 14.1 22.0 25.1 28.9T/Y 10.3 11.1 19.9 22.6 28.0
Venezuela G/Y 9.9 11.6 12.4 19.6 20.0 22.2 24.3 19.4T/Y 10.0 11.4 13.0 19.7 20.6 27.0 25.2 19.5
Costa Rica G/Y 10.8 13.7 19.3 23.7 22.0T/Y 11.5 12.0 16.3 21.4 20.2
Dominican G/Y 21.8 18.5 17.1 14.3 15.1T/Y 20.8 16.4 16.1 12.5 15.4
Guatemala G/Y 7.0 12.3 10.9 9.4 9.3 11.0 12.2 9.9T/Y 6.8 12.5 11.0 8.5 8.2 9.3 9.4 9.1
Honduras G/Y 7.8 7.4 6.9 12.3 11.7 16.0 23.1 23.3T/Y 12.8 14.6 18.1
Mexico G/Y 5.9 6.6 8.0 10.0 11.8 13.8 25.0 15.8T/Y 6.7 6.5 7.5 8.7 8.0 11.4 16.6 15.1
Nicaragua G/Y 10.9 11.0 16.0 48.9 33.0T/Y 10.1 10.4 13.1 30.7 25.0
Panama G/Y 14.6 14.4 15.5 28.3 29.7 25.7T/Y 12.8 13.3 13.5 20.8 25.6 26.1
Salvador G/Y 7.5 12.5 12.3 14.5 18.1T/Y 7.2 12.0 11.5 14.0 14.4
Average G/Y 8.0 10.4 10.4 12.3 13.2 17.2 21.7 19.7T/Y 7.6 9.5 9.5 11.5 11.5 14.8 17.2 17.9
13 Using the Chow test, we cannot reject poolability with respect to the two indicators of political competition and electoral participation.14 We obtain essentially identical results if we entered the Polity IV index directly in the regression model.
Fig. 4. The size of the government (G/Y and T/Y) between 1920 and 2000, distinguished by the degree of political participation and competition.
189T.S. Aidt, D.S. Eterovic / European Journal of Political Economy 27 (2011) 181–200
selection of their government and high (indicated with squares) otherwise. The upwards trend in both expenditure and revenue isapparent for all categories.More interesting, however, is theobservation that countrieswith either ahighly competitivepolitical systemor limited electoral participation tend to have smaller governments. This is consistentwith the theoretical predictions discussed above,but needs, of course, to be treated with caution; to get more robust insights, we should to turn to a proper regression analysis.
3.2. The econometric specification
We estimate the following panel model13:
yit = αi + ηt + β1xparticipationit + β2x
competitionit + xcontrol
it γ + εit ð1Þ
yit is the outcome variable of interest in country i at time t and εit is the error termwith E(εit)=0. The variable xitparticipation is
wherethe participation index introduced above and xitcompetition is ameasure of political competition based on the Polity IV index. Since thePolity IV index is recorded on an ordinal scale, we prefer to use a dummy variable to measure the degree of political competitionrather than entering the index directly in the regressionmodel. In particular, we define a dummy variable— competition dummy—that takes the value of 1 when the Polity IV index is positive and the value of 0 when the index is negative.14 This variable,therefore, measures the impact of political competition vis-a-vis a counterfactual of “restricted political competition”.
190 T.S. Aidt, D.S. Eterovic / European Journal of Political Economy 27 (2011) 181–200
Fiscal choices are affected bymanyother factors than electoral participation and competition.We include the vector xitcontrolof time-varying control variables to take some of these into account.15 First, the variable urbanization rate measures the proportion of thepopulation who lives in urban areas. Urbanization is highly correlated with industrialization and economic and social progress —
factorswhich in themselves are likely to affect the tax structure andwhich through the processes discussed byWagner (1883) shouldincrease the need for public services and for regulation of economic activity.
Second, the age composition of the population may also have an impact on the size of government because of changing needsfor social services (such as pensions and public health). In particular, Lindert (1994) shows that ageing of the populationcontributed significantly to the rise of social spending in Europe and the USA during the period 1880–1930, and we would, thus,expect the proportion of old to affect the size of government positively. We include the percentage of the population aged 60 orabove, population over 60, to allow for this possibility. Third, we include an estimate of PPP adjusted GDP per capita in logarithms,GDP per capita, to control for business cycle effects, and the growth rate of GDP per capita, growth, to proxy for generaldevelopment trends. Fourth, Rodrik (1998) has argued that openness to international trade is associated with more governmentspending because a larger public sector reduces economic volatility and provides insurance. We include the variable tradeopenness, which is defined as export plus import in percentage of GDP, to allow for this possibility. Fifth, some public services areprovided with increasing return to scale. We allow for scale effects by including the variable, population, which records thelogarithm of the population in millions. Sixth, inequality of income and wealth play an important role in many theories of publicfinance. Standard measures of inequality, such as the Gini coefficient, are unavailable for most of the sample period. As a proxy forincome equality, we use the percentage of the total area of cultivated land that is owned by family farmers (Vanhanen, 2003a). Webelieve this is a reasonable proxy in our context. Finally, war and economic crisis can have significant fiscal effects andwe include adummy variable to control for economic crises (economic crisis) and a dummy variable to control for war (war). We also includethe rate of inflation (inflation) to capture the fiscal implications of episodes of high inflation.
Themodel includes country fixed effects (αi) and year fixed effects (ηt). This specification rules out that the inference regardingthe two parameters of interest (β1 and β2) are contaminated by unobserved determinants of fiscal choices that are constant overtime (country fixed effects) or affect all countries at a given point in time in the sameway (year fixed effects). This reduces the riskof omitted variables bias and implies that we are using “within” variation (i.e., variation in political arrangements within a givencountry over time) to identify the impact of electoral participation and political competition on fiscal choices. We are effectivelyseeking an answer to the question: if a given country experienced an increase in electoral participation (or political competition),then, allowing for other potential determinants of the country's fiscal choices, what would we expect the change in fiscal policy tobe. We believe that this goes a long way in identifying the causal effect of electoral participation and political competition on thefiscal structure, but return to a more detailed discussion of this in Section 6.
We estimate the model with a fixed effects estimator allowing for panel-specific standard errors and correlations betweenpanel units, as recommended by Beck and Katz (1995).16,17 We have tested the stationarity of the data using the Fisher Test forpanel unit roots and can in each case reject the null hypothesis that the series are non-stationary for all panel units.18 Weadditionally test the stationarity of the residuals of each of the regressions presented in the next section. In each case, we reject thenull hypothesis that the series are non-stationary for all panel units (see Table 2). Since we are interested in the long-run relationbetween our institutional variables and fiscal outcomes, we do not model dynamics explicitly. We are, however, worried aboutautocorrelation in the residuals and correct for autocorrelation of order one and include a deterministic time trend in eachregression.
3.3. Results
This section, firstly, presents the main results. Secondly, it reports results on possible interactions between politicalcompetition and electoral participation. Thirdly, it discusses alternative measures of political competition. The section concludeswith an overview of the robustness checks we have implemented.
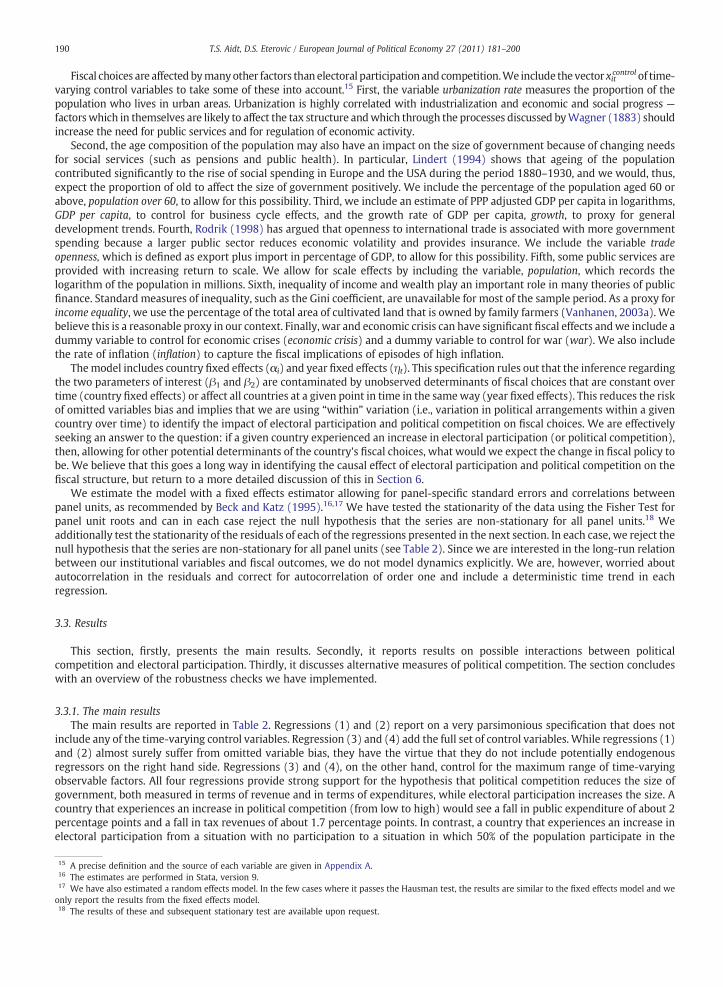
3.3.1. The main resultsThe main results are reported in Table 2. Regressions (1) and (2) report on a very parsimonious specification that does not
include any of the time-varying control variables. Regression (3) and (4) add the full set of control variables. While regressions (1)and (2) almost surely suffer from omitted variable bias, they have the virtue that they do not include potentially endogenousregressors on the right hand side. Regressions (3) and (4), on the other hand, control for the maximum range of time-varyingobservable factors. All four regressions provide strong support for the hypothesis that political competition reduces the size ofgovernment, both measured in terms of revenue and in terms of expenditures, while electoral participation increases the size. Acountry that experiences an increase in political competition (from low to high) would see a fall in public expenditure of about 2percentage points and a fall in tax revenues of about 1.7 percentage points. In contrast, a country that experiences an increase inelectoral participation from a situation with no participation to a situation in which 50% of the population participate in the
15 A precise definition and the source of each variable are given in Appendix A.16 The estimates are performed in Stata, version 9.17 We have also estimated a random effects model. In the few cases where it passes the Hausman test, the results are similar to the fixed effects model and weonly report the results from the fixed effects model.18 The results of these and subsequent stationary test are available upon request.
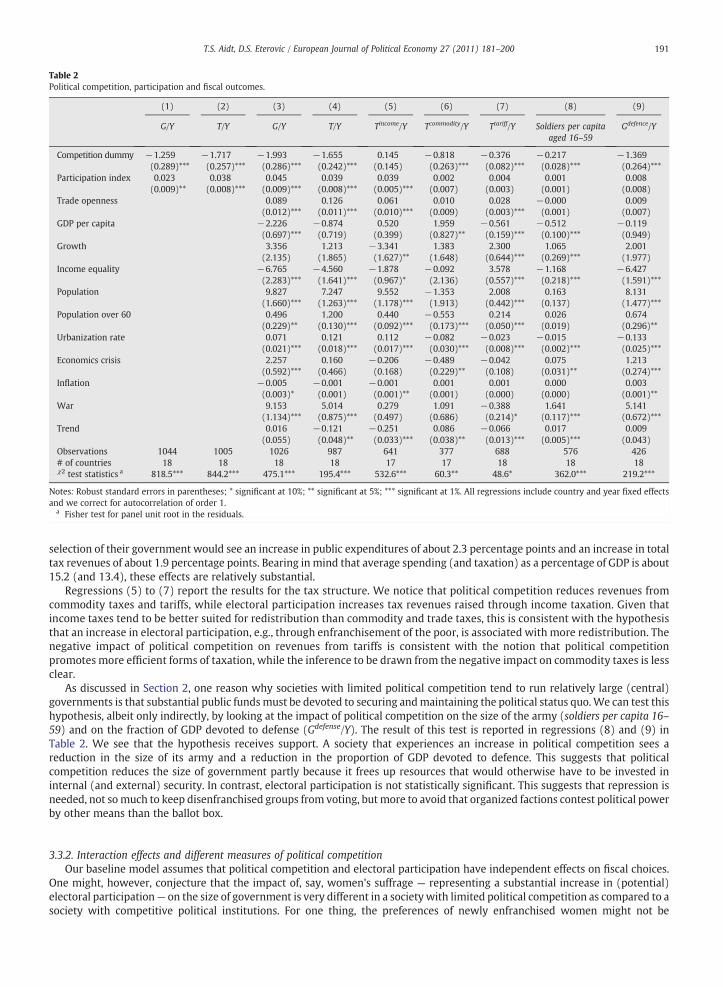
Table 2Political competition, participation and fiscal outcomes.
(1) (2) (3) (4) (5) (6) (7) (8) (9)
G/Y T/Y G/Y T/Y Tincome/Y Tcommodity/Y Ttariff/Y Soldiers per capitaaged 16–59
Gdefence/Y
Competition dummy −1.259 −1.717 −1.993 −1.655 0.145 −0.818 −0.376 −0.217 −1.369(0.289)*** (0.257)*** (0.286)*** (0.242)*** (0.145) (0.263)*** (0.082)*** (0.028)*** (0.264)***
Participation index 0.023 0.038 0.045 0.039 0.039 0.002 0.004 0.001 0.008(0.009)** (0.008)*** (0.009)*** (0.008)*** (0.005)*** (0.007) (0.003) (0.001) (0.008)
Trade openness 0.089 0.126 0.061 0.010 0.028 −0.000 0.009(0.012)*** (0.011)*** (0.010)*** (0.009) (0.003)*** (0.001) (0.007)
GDP per capita −2.226 −0.874 0.520 1.959 −0.561 −0.512 −0.119(0.697)*** (0.719) (0.399) (0.827)** (0.159)*** (0.100)*** (0.949)
Growth 3.356 1.213 −3.341 1.383 2.300 1.065 2.001(2.135) (1.865) (1.627)** (1.648) (0.644)*** (0.269)*** (1.977)
Income equality −6.765 −4.560 −1.878 −0.092 3.578 −1.168 −6.427(2.283)*** (1.641)*** (0.967)* (2.136) (0.557)*** (0.218)*** (1.591)***
Population 9.827 7.247 9.552 −1.353 2.008 0.163 8.131(1.660)*** (1.263)*** (1.178)*** (1.913) (0.442)*** (0.137) (1.477)***
Population over 60 0.496 1.200 0.440 −0.553 0.214 0.026 0.674(0.229)** (0.130)*** (0.092)*** (0.173)*** (0.050)*** (0.019) (0.296)**
Urbanization rate 0.071 0.121 0.112 −0.082 −0.023 −0.015 −0.133(0.021)*** (0.018)*** (0.017)*** (0.030)*** (0.008)*** (0.002)*** (0.025)***
Economics crisis 2.257 0.160 −0.206 −0.489 −0.042 0.075 1.213(0.592)*** (0.466) (0.168) (0.229)** (0.108) (0.031)** (0.274)***
Inflation −0.005 −0.001 −0.001 0.001 0.001 0.000 0.003(0.003)* (0.001) (0.001)** (0.001) (0.000) (0.000) (0.001)**
War 9.153 5.014 0.279 1.091 −0.388 1.641 5.141(1.134)*** (0.875)*** (0.497) (0.686) (0.214)* (0.117)*** (0.672)***
Trend 0.016 −0.121 −0.251 0.086 −0.066 0.017 0.009(0.055) (0.048)** (0.033)*** (0.038)** (0.013)*** (0.005)*** (0.043)
Observations 1044 1005 1026 987 641 377 688 576 426# of countries 18 18 18 18 17 17 18 18 18χ2 test statistics a 818.5*** 844.2*** 475.1*** 195.4*** 532.6*** 60.3** 48.6* 362.0*** 219.2***
Notes: Robust standard errors in parentheses; * significant at 10%; ** significant at 5%; *** significant at 1%. All regressions include country and year fixed effectand we correct for autocorrelation of order 1.
a Fisher test for panel unit root in the residuals.
191T.S. Aidt, D.S. Eterovic / European Journal of Political Economy 27 (2011) 181–200
s
selection of their government would see an increase in public expenditures of about 2.3 percentage points and an increase in totaltax revenues of about 1.9 percentage points. Bearing in mind that average spending (and taxation) as a percentage of GDP is about15.2 (and 13.4), these effects are relatively substantial.
Regressions (5) to (7) report the results for the tax structure. We notice that political competition reduces revenues fromcommodity taxes and tariffs, while electoral participation increases tax revenues raised through income taxation. Given thatincome taxes tend to be better suited for redistribution than commodity and trade taxes, this is consistent with the hypothesisthat an increase in electoral participation, e.g., through enfranchisement of the poor, is associated with more redistribution. Thenegative impact of political competition on revenues from tariffs is consistent with the notion that political competitionpromotes more efficient forms of taxation, while the inference to be drawn from the negative impact on commodity taxes is lessclear.
As discussed in Section 2, one reason why societies with limited political competition tend to run relatively large (central)governments is that substantial public fundsmust be devoted to securing andmaintaining the political status quo.We can test thishypothesis, albeit only indirectly, by looking at the impact of political competition on the size of the army (soldiers per capita 16–59) and on the fraction of GDP devoted to defense (Gdefense/Y). The result of this test is reported in regressions (8) and (9) inTable 2. We see that the hypothesis receives support. A society that experiences an increase in political competition sees areduction in the size of its army and a reduction in the proportion of GDP devoted to defence. This suggests that politicalcompetition reduces the size of government partly because it frees up resources that would otherwise have to be invested ininternal (and external) security. In contrast, electoral participation is not statistically significant. This suggests that repression isneeded, not somuch to keep disenfranchised groups from voting, but more to avoid that organized factions contest political powerby other means than the ballot box.
3.3.2. Interaction effects and different measures of political competitionOur baseline model assumes that political competition and electoral participation have independent effects on fiscal choices.
One might, however, conjecture that the impact of, say, women's suffrage — representing a substantial increase in (potential)electoral participation— on the size of government is very different in a society with limited political competition as compared to asociety with competitive political institutions. For one thing, the preferences of newly enfranchised women might not be
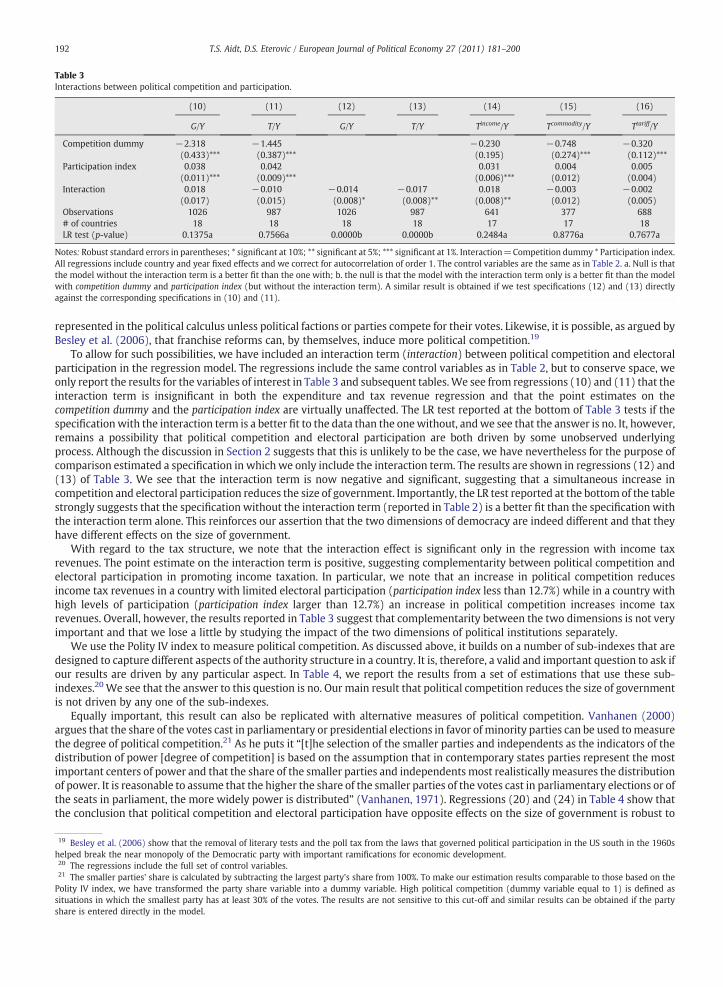
Table 3Interactions between political competition and participation.
(10) (11) (12) (13) (14) (15) (16)
G/Y T/Y G/Y T/Y Tincome/Y Tcommodity/Y Ttariff/Y
Competition dummy −2.318 −1.445 −0.230 −0.748 −0.320(0.433)*** (0.387)*** (0.195) (0.274)*** (0.112)***
Participation index 0.038 0.042 0.031 0.004 0.005(0.011)*** (0.009)*** (0.006)*** (0.012) (0.004)
Interaction 0.018 −0.010 −0.014 −0.017 0.018 −0.003 −0.002(0.017) (0.015) (0.008)* (0.008)** (0.008)** (0.012) (0.005)
Observations 1026 987 1026 987 641 377 688# of countries 18 18 18 18 17 17 18LR test (p-value) 0.1375a 0.7566a 0.0000b 0.0000b 0.2484a 0.8776a 0.7677a
Notes: Robust standard errors in parentheses; * significant at 10%; ** significant at 5%; *** significant at 1%. Interaction=Competition dummy * Participation indexAll regressions include country and year fixed effects and we correct for autocorrelation of order 1. The control variables are the same as in Table 2. a. Null is thathe model without the interaction term is a better fit than the one with; b. the null is that the model with the interaction term only is a better fit than the modewith competition dummy and participation index (but without the interaction term). A similar result is obtained if we test specifications (12) and (13) directlyagainst the corresponding specifications in (10) and (11).
19 Besley et al. (2006) show that the removal of literary tests and the poll tax from the laws that governed political participation in the US south in the 1960shelped break the near monopoly of the Democratic party with important ramifications for economic development.20 The regressions include the full set of control variables.21 The smaller parties' share is calculated by subtracting the largest party's share from 100%. To make our estimation results comparable to those based on thePolity IV index, we have transformed the party share variable into a dummy variable. High political competition (dummy variable equal to 1) is defined assituations in which the smallest party has at least 30% of the votes. The results are not sensitive to this cut-off and similar results can be obtained if the partyshare is entered directly in the model.
192 T.S. Aidt, D.S. Eterovic / European Journal of Political Economy 27 (2011) 181–200
.tl
represented in the political calculus unless political factions or parties compete for their votes. Likewise, it is possible, as argued byBesley et al. (2006), that franchise reforms can, by themselves, induce more political competition.19
To allow for such possibilities, we have included an interaction term (interaction) between political competition and electoralparticipation in the regression model. The regressions include the same control variables as in Table 2, but to conserve space, weonly report the results for the variables of interest in Table 3 and subsequent tables.We see from regressions (10) and (11) that theinteraction term is insignificant in both the expenditure and tax revenue regression and that the point estimates on thecompetition dummy and the participation index are virtually unaffected. The LR test reported at the bottom of Table 3 tests if thespecificationwith the interaction term is a better fit to the data than the onewithout, andwe see that the answer is no. It, however,remains a possibility that political competition and electoral participation are both driven by some unobserved underlyingprocess. Although the discussion in Section 2 suggests that this is unlikely to be the case, we have nevertheless for the purpose ofcomparison estimated a specification in which we only include the interaction term. The results are shown in regressions (12) and(13) of Table 3. We see that the interaction term is now negative and significant, suggesting that a simultaneous increase incompetition and electoral participation reduces the size of government. Importantly, the LR test reported at the bottom of the tablestrongly suggests that the specification without the interaction term (reported in Table 2) is a better fit than the specification withthe interaction term alone. This reinforces our assertion that the two dimensions of democracy are indeed different and that theyhave different effects on the size of government.
With regard to the tax structure, we note that the interaction effect is significant only in the regression with income taxrevenues. The point estimate on the interaction term is positive, suggesting complementarity between political competition andelectoral participation in promoting income taxation. In particular, we note that an increase in political competition reducesincome tax revenues in a country with limited electoral participation (participation index less than 12.7%) while in a country withhigh levels of participation (participation index larger than 12.7%) an increase in political competition increases income taxrevenues. Overall, however, the results reported in Table 3 suggest that complementarity between the two dimensions is not veryimportant and that we lose a little by studying the impact of the two dimensions of political institutions separately.
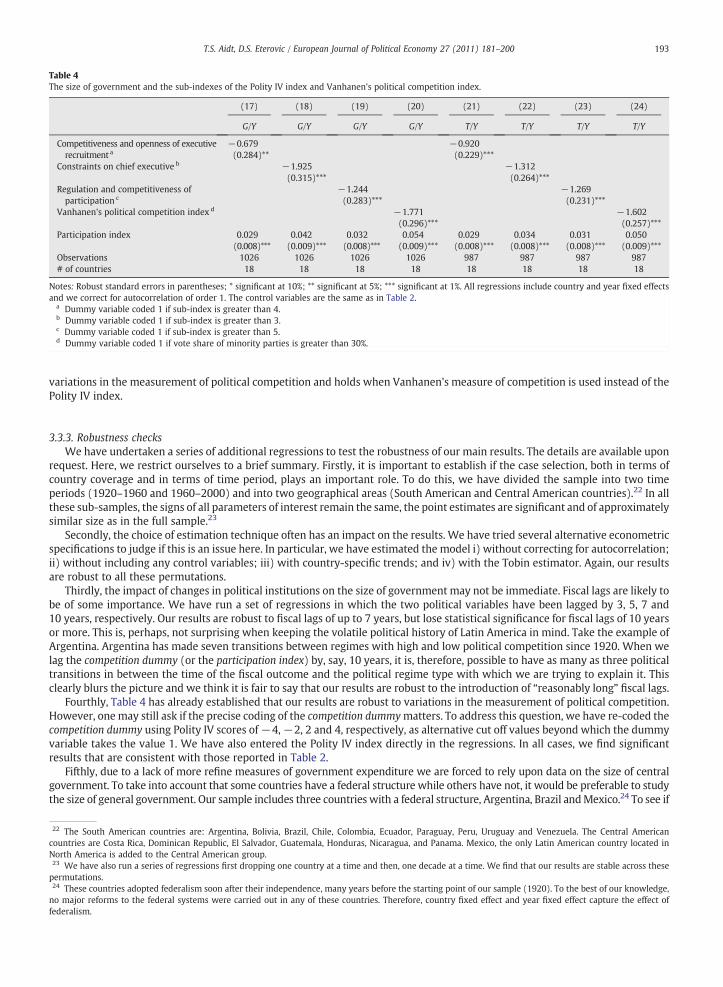
We use the Polity IV index to measure political competition. As discussed above, it builds on a number of sub-indexes that aredesigned to capture different aspects of the authority structure in a country. It is, therefore, a valid and important question to ask ifour results are driven by any particular aspect. In Table 4, we report the results from a set of estimations that use these sub-indexes.20 We see that the answer to this question is no. Our main result that political competition reduces the size of governmentis not driven by any one of the sub-indexes.
Equally important, this result can also be replicated with alternative measures of political competition. Vanhanen (2000)argues that the share of the votes cast in parliamentary or presidential elections in favor of minority parties can be used tomeasurethe degree of political competition.21 As he puts it “[t]he selection of the smaller parties and independents as the indicators of thedistribution of power [degree of competition] is based on the assumption that in contemporary states parties represent the mostimportant centers of power and that the share of the smaller parties and independents most realistically measures the distributionof power. It is reasonable to assume that the higher the share of the smaller parties of the votes cast in parliamentary elections or ofthe seats in parliament, the more widely power is distributed” (Vanhanen, 1971). Regressions (20) and (24) in Table 4 show thatthe conclusion that political competition and electoral participation have opposite effects on the size of government is robust to
22 The South American countries are: Argentina, Bolivia, Brazil, Chile, Colombia, Ecuador, Paraguay, Peru, Uruguay and Venezuela. The Central Americancountries are Costa Rica, Dominican Republic, El Salvador, Guatemala, Honduras, Nicaragua, and Panama. Mexico, the only Latin American country located inNorth America is added to the Central American group.23 We have also run a series of regressions first dropping one country at a time and then, one decade at a time. We find that our results are stable across thesepermutations.24 These countries adopted federalism soon after their independence, many years before the starting point of our sample (1920). To the best of our knowledgeno major reforms to the federal systems were carried out in any of these countries. Therefore, country fixed effect and year fixed effect capture the effect ofederalism.
Table 4The size of government and the sub-indexes of the Polity IV index and Vanhanen's political competition index.
(17) (18) (19) (20) (21) (22) (23) (24)
G/Y G/Y G/Y G/Y T/Y T/Y T/Y T/Y
Competitiveness and openness of executiverecruitment a
−0.679 −0.920(0.284)** (0.229)***
Constraints on chief executive b −1.925 −1.312(0.315)*** (0.264)***
Regulation and competitiveness ofparticipation c
−1.244 −1.269(0.283)*** (0.231)***
Vanhanen's political competition index d −1.771 −1.602(0.296)*** (0.257)***
Participation index 0.029 0.042 0.032 0.054 0.029 0.034 0.031 0.050(0.008)*** (0.009)*** (0.008)*** (0.009)*** (0.008)*** (0.008)*** (0.008)*** (0.009)***
Observations 1026 1026 1026 1026 987 987 987 987# of countries 18 18 18 18 18 18 18 18
Notes: Robust standard errors in parentheses; * significant at 10%; ** significant at 5%; *** significant at 1%. All regressions include country and year fixed effectand we correct for autocorrelation of order 1. The control variables are the same as in Table 2.
a Dummy variable coded 1 if sub-index is greater than 4.b Dummy variable coded 1 if sub-index is greater than 3.c Dummy variable coded 1 if sub-index is greater than 5.d Dummy variable coded 1 if vote share of minority parties is greater than 30%.
193T.S. Aidt, D.S. Eterovic / European Journal of Political Economy 27 (2011) 181–200
s
variations in the measurement of political competition and holds when Vanhanen's measure of competition is used instead of thePolity IV index.
3.3.3. Robustness checksWe have undertaken a series of additional regressions to test the robustness of our main results. The details are available upon
request. Here, we restrict ourselves to a brief summary. Firstly, it is important to establish if the case selection, both in terms ofcountry coverage and in terms of time period, plays an important role. To do this, we have divided the sample into two timeperiods (1920–1960 and 1960–2000) and into two geographical areas (South American and Central American countries).22 In allthese sub-samples, the signs of all parameters of interest remain the same, the point estimates are significant and of approximatelysimilar size as in the full sample.23
Secondly, the choice of estimation technique often has an impact on the results. We have tried several alternative econometricspecifications to judge if this is an issue here. In particular, we have estimated the model i) without correcting for autocorrelation;ii) without including any control variables; iii) with country-specific trends; and iv) with the Tobin estimator. Again, our resultsare robust to all these permutations.
Thirdly, the impact of changes in political institutions on the size of government may not be immediate. Fiscal lags are likely tobe of some importance. We have run a set of regressions in which the two political variables have been lagged by 3, 5, 7 and10 years, respectively. Our results are robust to fiscal lags of up to 7 years, but lose statistical significance for fiscal lags of 10 yearsor more. This is, perhaps, not surprising when keeping the volatile political history of Latin America in mind. Take the example ofArgentina. Argentina has made seven transitions between regimes with high and low political competition since 1920. When welag the competition dummy (or the participation index) by, say, 10 years, it is, therefore, possible to have as many as three politicaltransitions in between the time of the fiscal outcome and the political regime type with which we are trying to explain it. Thisclearly blurs the picture and we think it is fair to say that our results are robust to the introduction of “reasonably long” fiscal lags.
Fourthly, Table 4 has already established that our results are robust to variations in the measurement of political competition.However, one may still ask if the precise coding of the competition dummymatters. To address this question, we have re-coded thecompetition dummy using Polity IV scores of−4,−2, 2 and 4, respectively, as alternative cut off values beyond which the dummyvariable takes the value 1. We have also entered the Polity IV index directly in the regressions. In all cases, we find significantresults that are consistent with those reported in Table 2.
Fifthly, due to a lack of more refine measures of government expenditure we are forced to rely upon data on the size of centralgovernment. To take into account that some countries have a federal structure while others have not, it would be preferable to studythe size of general government. Our sample includes three countries with a federal structure, Argentina, Brazil andMexico.24 To see if
,f
194 T.S. Aidt, D.S. Eterovic / European Journal of Political Economy 27 (2011) 181–200
our results are in some way affected by systematic differences between countries with and without a federal structure, we have re-run the regressions excluding Argentina, Brazil and Mexico. This makes no difference to the results.
Finally, to judge if a particular control variable is essential to the results we have re-estimated the six main specifications fromTable 2 (regressions (3) to (7)) leaving one control variable out at the time. For G/Y and T/Y, none of the controls are essential forthe results, i.e., we get the same sign and approximately the same size and level of significance for the coefficients on theparticipation index and the competition dummy in all cases. For the decomposition of tax revenues, the main results also holdirrespective of which control variable is omitted, with two exceptions. Firstly, in the model for the share of income tax revenues asa share of GDP, the competition dummy is not significant in the main specification, but it does become positive and significant ifpopulation or population over 60 are omitted. Secondly, in themodel for tariff revenues as a share of GDP, the participation index hasa positive and significant effect when growth or income inequality is omitted. Overall, we conclude that the choice of controlvariables is not driving the main results.
3.3.4. Comparison with previous studiesThe main contribution of our analysis so far is to demonstrate that both political competition and electoral participation
exercise important influences on the size of government, but pull in opposite directions. In contrast, most of the existing empiricalwork on the link between fiscal choices and political competition and electoral participation focuses on one aspect in isolation.
The literature that studies the link between political competition and the size of government is not conclusive, although manystudies do point in the direction of a negative relationship between political competition and the size of government. Using datafromU.S. states, Rogers and Rogers (2000) present evidence that increases in political competition, measured by the “win-margin”of the incumbent governor, decreases state government spending. For the OECD countries, Skilling and Zeckhauser (2002) findthat political competition, measured as the length of time the governing party or parties have been in office, improves the primarybalance, mainly through a reduction in the growth of spending. In contrast, Holbrook and Van Dunk (1993) show that politicalcompetition25 increases the size of U.S. state government, through an increase in Medicare generosity and in disability protection.In a recent study of Canada covering 130 years, Ferris et al. (2008) conclude that “the degree of political competition emergesrobustly as the primary, if not the only important political factor in the long run as well as over shorter horizons” and that “itappears that less competition leads temporarily to larger government (relative to its long run path)”.
A number of studies have investigated the impact of the Polity IV index on fiscal outcomes and are, thus, more directlycomparable to ours. Aidt and Jensen (2009a) and Aidt et al. (2006) find in various panels of western European countries during theperiod between 1860 and 1938 that political competition has an asymmetric effect on the government budget: enhancedcompetition reduces expenditure but increases taxation. One interpretation of this is that political competition has the effect ofclosing the gap between expenditures and revenues which is broadly consistent with the view that political competitionencourages smaller government.
The evidence frombroader samples of countries ismoremixed.Mulliganet al. (2004) study a cross sectionofmore than100 countriesand report that the Polity IV index26 has little impact on government consumption, education spending, pensions, andnon-pension socialspending. Instead, the differences seem to arisewith respect to policies that affect the degree of competition for public office, presumablebecause political leaders, to limit competition, need tomake investments in securing andmaintainingpower. The last result is in linewithour findings. Persson and Tabellini (2006) study a panel of about 150 countries over the period 1960–2000 and find that the effect ongovernment spending of reforms that enhance political competition depends on the type of election rule and on the form ofgovernment.27 In particular, in an environment with majority rule and presidential democracy, enhanced political competition reducesgovernment spending by almost 2% of GDP. The opposite is true in an environment with parliamentarian democracy.
The literature on electoral participation and the size of government paints a picture that is mostly consistent with our findingsfor Latin America, but with some important caveats. One branch of this literature has studied the impact of franchise reforms onfiscal choices. Husted and Kenny (1997) draw on a panel of 46 U.S. states, finding that an extension of the voting franchise throughthe removal of poll tax requirements and literacy tests increases social spending substantially and leads to a modest increase intotal government spending. Another strand of the literature, which studies the impact of electoral turnout on fiscal choices, hasfound similar results. For example, Mueller and Stratmann (2003) find, using a world sample, that higher electoral participation isassociated with larger governments and through this, with lower income inequality. Boix (2001, 2003, chapter 5) also studies,using a world sample, the effect of electoral turnout on fiscal choices. Boix is careful to separate the effect of turnout from the effectof having competitive democracy. He finds that electoral participation increases the size of government, and that the effectincreases with the level of economic development.
Yet, there exists evidence, based on careful panel analysis, that points in the opposite direction. Aidt et al. (2006), for example, findthat the extension of the franchise in western Europe before World War II contributed little to the growth in the size of thegovernment, and had an impact mainly by shifting the portfolio of spending towards infrastructure and internal security. Aidt andJensen(2009b), furthermore, report that franchise reforms inwestern Europemighthave reduced the likelihoodof income taxation, atleast initially. In conclusion, it is, therefore, fair to say that jury is still out on this key question, and our results hardly settles thematter.Yet, they do confirm the presumed positive link between franchise reforms and growth in government for Latin America.
25 Political competition is measured as a composite of four factors: i) the percentage of the popular vote won by the winning candidate, ii) the margin of victory,iii) whether the seat was safe and iv) if the race was contested or not.26 They interpret the Polity IV index as a measure of democracy.27 They use the polity2 index from the Polity IV data set and use the terminology that a country is democratic if the polity2 index is strictly positive.
28 Literacy requirements had by the turn of the 19th century replaced wealth or income requirements as a means to keep Native Americans and other poopeople from voting in most countries in the sample. For this reason, we do not attempt to identify the impact of wealth and income restrictions.29 We ran a regression of electoral participation on women's and illiterate suffrage together with our control variables. We find significant evidence of a positivecorrelation between voter turnout and women's suffrage and enfranchisement of illiterate people.30 We understand no turnout to mean that no popular elections took place. The participation index is constructed by dividing total voters' turnout by totapopulation and records positive turnouts only for elections where more than 0.1% of the population voted. Any election where less than 0.1% of the populationvoted is classified as zero turnout. There are some cases where these types of election took place. For example, in Chile in 1924, General Altamirano was electedas interim president by the Congress. Other examples are Peru in 1933 and Uruguay between 1932 and 1933.
Table 5The timing of women's suffrage and the abolishment of literacy tests in the 18 countries.Sources: For Female Franchise: Economic Commission for Latino America and the Caribbean, UN: Participation and Leadership in Latin America and the CaribbeanGender Indicators, December 1999. For Literacy tests: Nohlen (1993) and Engerman and Sokoloff (2005).
Country Women's suffrage introduced Literacy tests abolished
Argentina 1947 1912 a
Bolivia 1952 1952Brazil 1932 1985Chile 1949 1970Colombia 1954 1936 a
Ecuador 1929 1978Paraguay 1961 1870Peru 1955 1979Uruguay 1932 1918Venezuela 1946 1947Costa Rica 1949 1913Dominican Republic 1942 1865El Salvador 1950 1945Guatemala 1946 1946Honduras 1955 1894Mexico 1953 1857Nicaragua 1955 1893Panama 1945 1904
a Restrictions applied on a subset of regions.
195T.S. Aidt, D.S. Eterovic / European Journal of Political Economy 27 (2011) 181–200
:
4. Women's suffrage and literacy tests
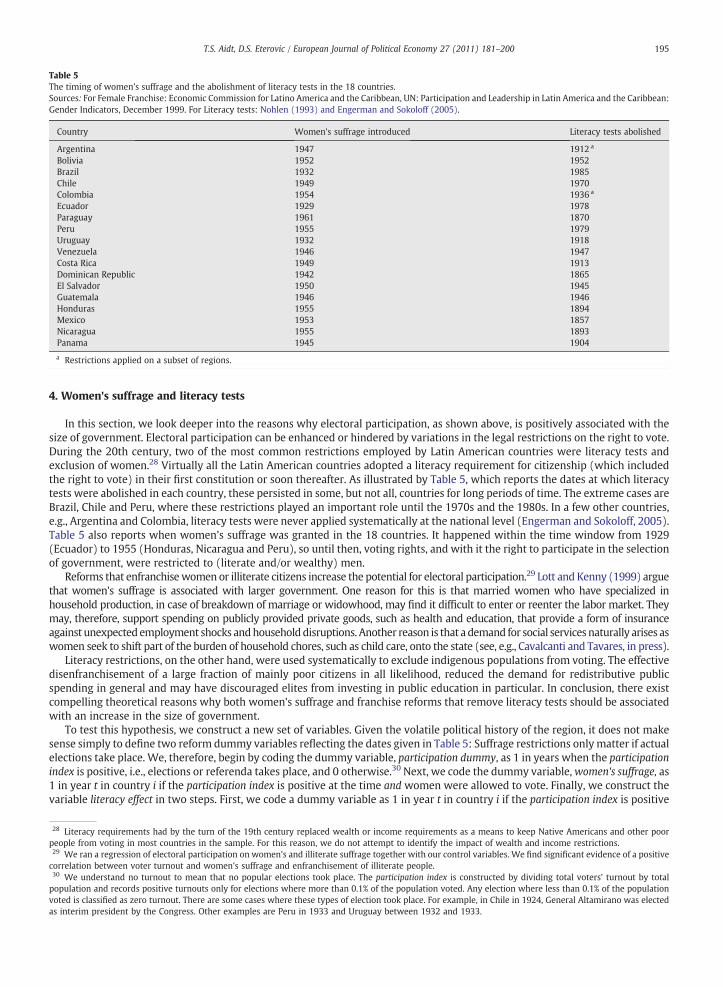
In this section, we look deeper into the reasons why electoral participation, as shown above, is positively associated with thesize of government. Electoral participation can be enhanced or hindered by variations in the legal restrictions on the right to vote.During the 20th century, two of the most common restrictions employed by Latin American countries were literacy tests andexclusion of women.28 Virtually all the Latin American countries adopted a literacy requirement for citizenship (which includedthe right to vote) in their first constitution or soon thereafter. As illustrated by Table 5, which reports the dates at which literacytests were abolished in each country, these persisted in some, but not all, countries for long periods of time. The extreme cases areBrazil, Chile and Peru, where these restrictions played an important role until the 1970s and the 1980s. In a few other countries,e.g., Argentina and Colombia, literacy tests were never applied systematically at the national level (Engerman and Sokoloff, 2005).Table 5 also reports when women's suffrage was granted in the 18 countries. It happened within the time window from 1929(Ecuador) to 1955 (Honduras, Nicaragua and Peru), so until then, voting rights, and with it the right to participate in the selectionof government, were restricted to (literate and/or wealthy) men.
Reforms that enfranchisewomen or illiterate citizens increase the potential for electoral participation.29 Lott and Kenny (1999) arguethat women's suffrage is associated with larger government. One reason for this is that married women who have specialized inhousehold production, in case of breakdown of marriage or widowhood, may find it difficult to enter or reenter the labor market. Theymay, therefore, support spending on publicly provided private goods, such as health and education, that provide a form of insuranceagainst unexpected employment shocks andhouseholddisruptions. Another reason is that a demand for social services naturally arises aswomen seek to shift part of the burden of household chores, such as child care, onto the state (see, e.g., Cavalcanti and Tavares, in press).
Literacy restrictions, on the other hand, were used systematically to exclude indigenous populations from voting. The effectivedisenfranchisement of a large fraction of mainly poor citizens in all likelihood, reduced the demand for redistributive publicspending in general and may have discouraged elites from investing in public education in particular. In conclusion, there existcompelling theoretical reasons why both women's suffrage and franchise reforms that remove literacy tests should be associatedwith an increase in the size of government.
To test this hypothesis, we construct a new set of variables. Given the volatile political history of the region, it does not makesense simply to define two reform dummy variables reflecting the dates given in Table 5: Suffrage restrictions only matter if actualelections take place. We, therefore, begin by coding the dummy variable, participation dummy, as 1 in years when the participationindex is positive, i.e., elections or referenda takes place, and 0 otherwise.30 Next, we code the dummy variable,women's suffrage, as1 in year t in country i if the participation index is positive at the time and women were allowed to vote. Finally, we construct thevariable literacy effect in two steps. First, we code a dummy variable as 1 in year t in country i if the participation index is positive
r
l
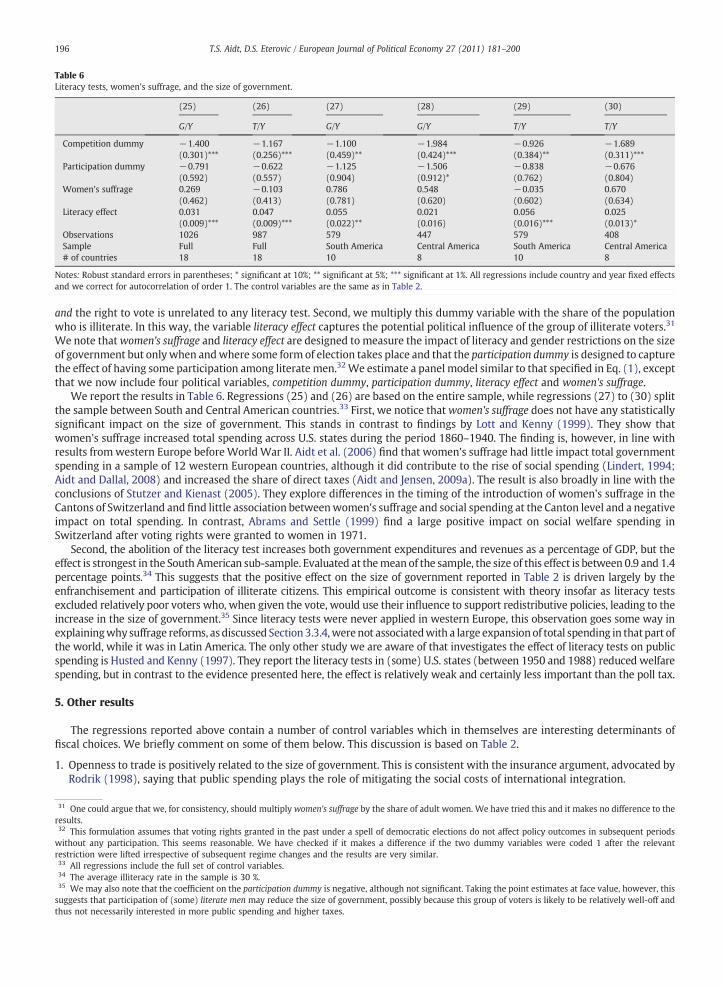
Table 6Literacy tests, women's suffrage, and the size of government.
(25) (26) (27) (28) (29) (30)
G/Y T/Y G/Y G/Y T/Y T/Y
Competition dummy −1.400 −1.167 −1.100 −1.984 −0.926 −1.689(0.301)*** (0.256)*** (0.459)** (0.424)*** (0.384)** (0.311)***
Participation dummy −0.791 −0.622 −1.125 −1.506 −0.838 −0.676(0.592) (0.557) (0.904) (0.912)* (0.762) (0.804)
Women's suffrage 0.269 −0.103 0.786 0.548 −0.035 0.670(0.462) (0.413) (0.781) (0.620) (0.602) (0.634)
Literacy effect 0.031 0.047 0.055 0.021 0.056 0.025(0.009)*** (0.009)*** (0.022)** (0.016) (0.016)*** (0.013)*
Observations 1026 987 579 447 579 408Sample Full Full South America Central America South America Central America# of countries 18 18 10 8 10 8
Notes: Robust standard errors in parentheses; * significant at 10%; ** significant at 5%; *** significant at 1%. All regressions include country and year fixed effectsand we correct for autocorrelation of order 1. The control variables are the same as in Table 2.
196 T.S. Aidt, D.S. Eterovic / European Journal of Political Economy 27 (2011) 181–200
and the right to vote is unrelated to any literacy test. Second, we multiply this dummy variable with the share of the populationwho is illiterate. In this way, the variable literacy effect captures the potential political influence of the group of illiterate voters.31
We note thatwomen's suffrage and literacy effect are designed to measure the impact of literacy and gender restrictions on the sizeof government but onlywhen andwhere some form of election takes place and that the participation dummy is designed to capturethe effect of having some participation among literate men.32We estimate a panel model similar to that specified in Eq. (1), exceptthat we now include four political variables, competition dummy, participation dummy, literacy effect and women's suffrage.
We report the results in Table 6. Regressions (25) and (26) are based on the entire sample, while regressions (27) to (30) splitthe sample between South and Central American countries.33 First, we notice thatwomen's suffrage does not have any statisticallysignificant impact on the size of government. This stands in contrast to findings by Lott and Kenny (1999). They show thatwomen's suffrage increased total spending across U.S. states during the period 1860–1940. The finding is, however, in line withresults from western Europe before WorldWar II. Aidt et al. (2006) find that women's suffrage had little impact total governmentspending in a sample of 12 western European countries, although it did contribute to the rise of social spending (Lindert, 1994;Aidt and Dallal, 2008) and increased the share of direct taxes (Aidt and Jensen, 2009a). The result is also broadly in line with theconclusions of Stutzer and Kienast (2005). They explore differences in the timing of the introduction of women's suffrage in theCantons of Switzerland and find little association betweenwomen's suffrage and social spending at the Canton level and a negativeimpact on total spending. In contrast, Abrams and Settle (1999) find a large positive impact on social welfare spending inSwitzerland after voting rights were granted to women in 1971.
Second, the abolition of the literacy test increases both government expenditures and revenues as a percentage of GDP, but theeffect is strongest in the South American sub-sample. Evaluated at themean of the sample, the size of this effect is between 0.9 and 1.4percentage points.34 This suggests that the positive effect on the size of government reported in Table 2 is driven largely by theenfranchisement and participation of illiterate citizens. This empirical outcome is consistent with theory insofar as literacy testsexcluded relatively poor voters who, when given the vote, would use their influence to support redistributive policies, leading to theincrease in the size of government.35 Since literacy tests were never applied in western Europe, this observation goes some way inexplainingwhy suffrage reforms, asdiscussed Section 3.3.4,werenot associatedwith a large expansionof total spending in that part ofthe world, while it was in Latin America. The only other study we are aware of that investigates the effect of literacy tests on publicspending is Husted and Kenny (1997). They report the literacy tests in (some) U.S. states (between 1950 and 1988) reduced welfarespending, but in contrast to the evidence presented here, the effect is relatively weak and certainly less important than the poll tax.
5. Other results
The regressions reported above contain a number of control variables which in themselves are interesting determinants offiscal choices. We briefly comment on some of them below. This discussion is based on Table 2.
1. Openness to trade is positively related to the size of government. This is consistent with the insurance argument, advocated byRodrik (1998), saying that public spending plays the role of mitigating the social costs of international integration.
31 One could argue that we, for consistency, should multiply women's suffrage by the share of adult women. We have tried this and it makes no difference to theresults.32 This formulation assumes that voting rights granted in the past under a spell of democratic elections do not affect policy outcomes in subsequent periodswithout any participation. This seems reasonable. We have checked if it makes a difference if the two dummy variables were coded 1 after the relevantrestriction were lifted irrespective of subsequent regime changes and the results are very similar.33 All regressions include the full set of control variables.34 The average illiteracy rate in the sample is 30 %.35 We may also note that the coefficient on the participation dummy is negative, although not significant. Taking the point estimates at face value, however, thissuggests that participation of (some) literate men may reduce the size of government, possibly because this group of voters is likely to be relatively well-off andthus not necessarily interested in more public spending and higher taxes.
197T.S. Aidt, D.S. Eterovic / European Journal of Political Economy 27 (2011) 181–200
2. Equality (as measured by the percentage of the total area of cultivated land that is owned by family farmers) is negativelycorrelated with the size of government. This is consistent with the hypothesis that the demand for redistribution is higher inmore equal societies.
3. Population size is positively related to the size of the government. This is consistent with increasing returns in theprovision of public services. The age structure, as captured by the fraction of the population over 60 years of age, is alsopositively related to the size of the government, lending support to the “grey power” hypothesis advocated by Lindert(1994).
4. The narrow version of Wagner's law — that the size of the government increases with GDP per capita — receives little supportfrom our regressions. In fact, GDP per capita is often negatively related to the size of the government. It is, however, likely thatthe forces pushing for growth in government that Wagner (1883) pointed to are better captured by urbanization. We note theurbanization rate is positively related to both government spending and taxation, thus providing support for the broaderinterpretation of Wagner's law.
6. Conclusion
Our analysis demonstrates the empirical relevance of the distinction between political competition and electoral participationfor the size of government. This finding has implications, not only for our understanding of the forces behind growth ingovernment, but also more broadly for quantitative research on political institutions.
Firstly, while in many contexts and for many research questions it may make sense to construct composite indicators ofdemocracy that combine aspects of participation with aspects of competition (Przeworski et al., 2000; Vanhanen, 2000; Boix,2003), one should not overlook the fact that this may conceal important insights because the constituent components can haveoffsetting effects. As pointed out by Persson and Tabellini (2006), the devil may well be in the details.
Secondly, recent research within the political economics literature (e.g., Mulligan et al., 2004; Rodrik and Wacziarg, 2004)tends to interpret the Polity IV index as an index of democracy or changes in the index as a measure of democratization. We haveargued that the index is better interpreted as an index of political competition. Political competition is surely one aspect ofdemocracy, but most definitions would also refer to some notion of electoral participation (e.g., universal suffrage) and civilliberties; surely there is more to democracy than political competition.
In short, the main contribution of this paper lies in using a two-dimensional metric to characterize political regimes and inestablishing a very robust set of relationships between political competition and electoral participation, on the one hand, and fiscaloutcomes, on the other, that go in opposite directions. Even if one questions whether our results are causal, they continue to be ofsubstantial interest, for as Acemoglu (2005) notes, “even non-causal robust relationships are rare in comparative politicaleconomy”.
But are the results casual? This is the ultimate challenge for all empirical research on the link between politicalinstitutions and fiscal outcomes. In order to identify a causal effect running from institutions to fiscal outcomes, theobserved variation in the institutional arrangements must be exogenous to the process that determines the fiscal outcomes.In practise, this often fails. One possible reason is that political reforms might be driven by the same unobserved factorsthat determine fiscal choices. Another reason is reverse causality: Political reforms could be driven by fiscalconsiderations.36 In our context, such problems might arise if, for example, as argued by Acemoglu et al. (2005), theruling elite did what it could to constrain electoral participation and to limit political competition in order to avoid incomeredistribution thought the fiscal state. If so, the de facto power of the elite, which is unobserved, would be negativelycorrelated with political competition, electoral participation and with the size of government. The implication of this wouldbe that our estimate of the effect of political competition is biased towards zero while our estimate of the effect electoralparticipation is biased upwards away from zero.
We have adopted a number of empirical strategies to minimize the likelihood of such biases. Firstly, in all our regressions,we control for country and year fixed effects. This rules out that our inference is contaminated by unobserved determinants thatare constant over time (country fixed effects) or affect all countries at a given point in time in the same way (year fixed effects).This reduces, but does not eliminate, the risk of omitted variable bias. In particular, omitted variables that vary over time withina country and which are correlated with our two political variables and with the size of government pose a problem. The bestdefense against this problem is to control for the “right” set of time-varying observable factors (Acemoglu, 2005). Compared tomany other panel studies, we control for a relatively large number of both economic and demographic factors. For example, wecan interpret the variable Income equality as a proxy for the de facto power of the elite: The more equal a society is, the lesspower does the elite wield over the middle class. Controlling for this variable, therefore, goes a long way in eliminating theproblem of omitted variable bias alluded to above. Secondly, to address the problem of reverse causality, we have run, asdiscussed in Section 3.3.3, a set of regressions with our political variables lagged 3, 5 and 7 years obtaining similar results tothose reported in Table 2. All in all, we find it unlikely that our results are spurious and caused by omitted variables or reversecausality.
36 See, e.g., the discussion in Besley and Case (2000).
198 T.S. Aidt, D.S. Eterovic / European Journal of Political Economy 27 (2011) 181–200
Acknowledgements
We would like to thank Miriam Golden, Julia Shvets, Cassandra Sweet, Guido Tabellini, Jonnanes Wieland, the participants inthe session on political institutions at the LACEA 2005 meeting in Paris, the 2006 meeting of the European Public Choice Societyand the conference on “Institutions, Public Policy and Economic Outcomes” Jesus College, 2007, for helpful comments. We aregrateful for financial support from the Economic and Social Research Council, grant RES 000-22-1743. The usual disclaimer applies.
Appendix A
• G/Y is Consolidated Central Government Expenditures in percentage of GDP (Y).• T/Y is Central Government Revenue in percentage of GDP (Y).• T income/Y is the tax revenue from incomes, profits and capital gains taxes as a percentage of GDP (Y).• Tcommodity/Y is the revenue from taxes on domestic goods as a percentage of GDP (Y).• T tariff/Y is the revenue from taxes on international trade as a percentage of GDP (Y).• Soldiers per capita aged 16–59 is the number of soldiers as percentage of the population aged between 16 and 59 years old.Constructed from military participation rates (military population per 1000 inhabitants).
• Gdefense/Y is total military expenditure as a percentage of GDP (Y).• Competition dummy is a dummy variable that takes the value of 0 when the Polity IV index is equal or less than zero and takes avalue of 1 when the Polity IV index is positive.
• Vanhanen's political competition index is defined as 100 minus the largest party's shares of votes (or seats). In the regressions, weuse a dummy variable equal to 1 if the index is greater than 30%.
• Participation index is the voter turnout in each election as percentage of the total population. In case of indirect elections, onlyvotes cast in the final election are taken into account. If electors have not been elected by citizens, only the number of actualelectors is taken into account, which means that participation drops to 0. If an election to choose electors has been held,participation is calculated from the number and distribution of votes in that election. National referendums increase the variablevalue by five percent and state (regional) referendums by one percent for the year they are held. Referendums can add to thedegree of participation at most by 30% in a given year. Combined participation cannot be higher than 70%, even in cases wherethe sum of participation and referendums would be higher than 70%.
• Participation dummy is a dummy variable that takes the value of 1 when the participation index is positive and is 0 otherwise.• Women's suffrage is a dummy variable that takes the value of one after women were granted the right to vote in societies withpositive electoral participation (participation indexN0).
• Literacy effect is a dummy variable that takes the value of 1 after the literacy restrictions on the right to vote were lifted insocieties with positive electoral participation (participation indexN0) multiplied by the illiteracy rate (the total number ofilliterate adults divided by the total population).
• Economic crisis is a dummy variable that takes the value of 1 in a country every time amajor economic crisis happens. As proxy ofeconomic crisis, we use the dates when a currency change takes place, specifically the dummy is coded 1 two years before amajor currency change and one year after.
• GDP per capita is the logarithm of real GDP, PPP adjusted, divided by the total population of the country.• Growth is the yearly growth rate of GDP per capita.• Inflation is the percentage change in the consumer price index divided by 100.• Income equality is proxied by family farms as a percentage of the total cultivated area or the total area of farm holdings.• Population is the natural logarithm of the total population of the country.• Population over 60 is the percentage of the total population aged 60 or more.• Urbanization rate is the percentage of the total population living in urban areas.• Trade openness is exports plus imports as a percentage of GDP.• War is a dummy variable that takes the value of 0 when there is no war or civil war and takes a value of 1 in the presence of a waror a civil war. In the sample, the dummywar takes the value 1 for Nicaragua from 1978 to 1989 (Sandinistas' revolution) and forEl Salvador from 1982 to 1991 (civil war).
Consolidated central government expenditures (G), central government revenue (T), tax revenue from incomes, profit andcapital gains (T income), revenue from taxes on domestic goods (Tcommodity), revenue from taxes on international trade (T tariff), totalpopulation, real and nominal GDP, inflation and Illiteracy rate, are from the data web site of Department of Latin American studies,Oxford University, UK(http://oxlad.qeh.ox.ac.uk/search.php). Population over 15 and Population over 60 are fromMitchell (2003).Military participation rate (to construct Soldiers per capita 16–59) and total military expenditure as a percentage of total GDP(Gdefense/Y) are from the Statistical abstract of Latin America, various issues, University of California, Center of Latin AmericanStudies. The participation index and political competition index are from Vanhanen (2000, 2003b). Family farms (Income equality)and urban population out of total population (Urbanization rate) are from Vanhanen (2003a). The source for women's suffrage andthe literacy restrictions are CEPAL (1999), Nohlen (1993), and Engerman and Sokoloff (2005).
For some control variables, there are gaps in the series. We have dealt with this by linear interpolation. The Polity IV indexcodes regimes transitions with −88, foreign interruption with−66 and periods of anarchy with−77. In this case, we follow the
199T.S. Aidt, D.S. Eterovic / European Journal of Political Economy 27 (2011) 181–200
suggestions given in the Polity IV user's manual (Marshall and Jaggers, 2007) and treat −66 as “system missing”, −77 areconverted to a polity score of 0 and cases of transition (−88) are pro-rated across the span of the transition.
References
Abrams, B., Settle, R., 1999. Women's suffrage and the growth of the welfare state. Public Choice 100, 289–300.Acemoglu, D., 2005. Constitutions, politics and economics: a review essay on Persson and Tabellini's “The Economic Effects of Constitutions”. Journal of Economic
Literature 43, 1025–1048.Acemoglu, D., Robinson, J., 2000. Why did the West extend the franchise? Democracy, inequality, and growth in historical perspective. Quarterly Journal of
Economics 115, 1167–1199.Acemoglu, D., Robinson, J., 2006. Economic Origins of Dictatorship and Democracy. Cambridge University Press, Cambridge.Acemoglu, D., Johnson, S., Robinson, J., 2005. Institutions as the fundamental cause of long-run economic growth. In: Aghion, P., Durlauf, P. (Eds.), Handbook of
Economic Growth. Elsevier, North Holland, Amsterdam.Aidt, T., 2003. Redistribution and the deadweight costs: the role of political competition. European Journal of Political Economy 19, 205–226.Aidt, T., Dallal, B., 2008. Female voting power: the contribution of women's suffrage to the growth of social spending in western Europe, 1869–1960. Public Choice
134, 391–417.Aidt, T., Jensen, P., 2009a. Tax structure, size of government and the extension of the voting franchise in western Europe, 1860–1938. International Tax and Public
Finance 16, 362–394.Aidt, T., Jensen, P., 2009b. The taxman tools up: an event history study of the introduction of the personal income tax. Journal of Public Economics 93, 160–175.Aidt, T., Dutta, J., Loukoianova, E., 2006. Democracy comes to Europe: franchise extension and fiscal outcomes 1830–1938. European Economic Review 50,
249–283.Aidt, T., Daunton, M., Dutta, J., in press. The Retrenchment hypothesis and the extension of the franchise in England andWales. The Economic Journal. doi:10.1111/
j.1468-0297.2009.02344.x.Avelino, G., Brown, D., Hunter, W., 2005. The effects of capital mobility, trade openness, and democracy on social spending in Latin America, 1980–1999. American
Journal of Political Science 49, 625–641.Beck, N., Katz, J., 1995. What to do (and not to do) with time-series cross-section data. American Political Science Review 89, 634–647.Becker, G., 1983. A theory among pressure groups for political influence. The Quarterly Journal of Economics 98, 371–400.Becker, G., 1985. Public policies, pressure groups, and dead weight costs. Journal of Public Economics 28, 329–347.Besley, T., Case, A., 2000. Unnatural experiments? Estimating the incidence of endogenous policies. The Economic Journal 110, 672–694.Besley, T., Persson, T., Sturm, D., 2006. Political competition and economic performance: theory and evidence from the United States. UnpublishedWorking paper.Boix, C., 2001. Democracy, development, and the public sector. American Journal of Political Science 45, 1–17.Boix, C., 2003. Democracy and Redistribution. Cambridge University Press, Cambridge, UK.Buchanan, J., Wagner, R., 1977. Democracy in Deficit: The Political Legacy of Lord Keynes. Academic Press, New York.Cavalcanti, T., Tavares, J., in press. Women prefer larger governments: growth, structural transformation and government size. Economic Inquiry. doi:10.1111/
j.1465-7295.2010.00315.x.CEPAL (Commission for Latin America and the Caribbean), 1999. Participation and Leadership in Latin America and the Caribbean: Gender Indicators. Economic
Commission for Latin America and the Caribbean, Santiago, Chile.Congleton, R., 2007. From royal to parliamentary rule without revolution: the economics of constitutional exchange within divided governments. European Journal
of Political Economy 23, 261–284.Coughlin, P., Nitzan, S., 1981. Electoral outcomes with probabilistic voting and Nash social welfare maxima. Journal of Public Economics 15, 113–132.Dahl, R., 1971. Polyarchy: Participation and Opposition. Yale University Press, New Haven.Davenport, C., Armstrong, D., 2004. Democracy and the violation of human rights: a statistical analysis from 1976 to 1996. American Journal of Political Science 48,
538–554.Downs, A., 1957. An Economic Theory of Democracy. Harper and Row, New York.Engerman, S., Sokoloff, K., 2005. The evolution of suffrage institutions in the new world. Journal of Economic History 65, 891–921.Engerman, S., Mariscal, E., Sokoloff, K., 1998. Schooling, suffrage, and the persistence of inequality in the Americas, 1800–1945. Unpublished working paper,
University of California at Los Angeles.Ferejohn, J., 1986. Incumbent performance and electoral control. Public Choice 50, 5–26.Ferris, J., Park, S.-B., Winer, S., 2008. Studying the role of political competition in the evolution of government size over long horizons. Public Choice 137, 369–401.Fredriksson, P., Neumayer, E., Damania, R., Gates, S., 2005. Environmentalism, democracy, and pollution control. Journal of Environmental Economics and
Management 49, 343–365.Hettich, W., Winer, S., 1988. Economic and political foundations of tax structure. The American Economic Review 78, 701–712.Hettich, W., Winer, S., 1991. Debt and tariffs: an empirical investigation of the evolution of revenue systems. Journal of Public Economics 45, 215–242.Hettich, W., Winer, S., 1999. Democratic Choice and Taxation: A Theoretical and Empirical Analysis. Cambridge University Press, Cambridge, UK.Holbrook, T., Van Dunk, E., 1993. Electoral competition in the American states. The American Political Science Review 87, 955–962.Husted, T., Kenny, L., 1997. The effect of the expansion of the voting franchise on the size and scope of government. Journal of Political Economy 105, 54–82.Kenny, L., Winer, S., 2006. Taxation in the world: an empirical investigation of the importance of tax bases, collection costs and political regime. International Tax
and Public Finance 13, 181–215.Klomp, J., de Haan, J., 2009. Political institutions and economic volatility. European Journal of Political Economy 25, 311–326.Lindbeck, A., Weibull, J., 1987. Balanced budget redistribution as the outcome of political competition. Public Choice 52, 273–297.Lindert, P., 1994. The rise in social spending 1880–1930. Explorations in Economic History 31, 1–37.Lizzeri, A., Persico, N., 2004. Why did the elites extend the suffrage? democracy and the scope of government, with an application to Britain's "age of reform."
Quarterly Journal of Economics 11, 707–765.Lopez-Cordova, J., Meissner, C., 2008. The globalization of trade and democracy, 1870–2000. World Politics 60, 539–575.Lott, J., Kenny, L., 1999. Did women's suffrage change the size and scope of government? Journal of Political Economy 107, 1163–1198.Marshall, M., Jaggers, K., 2007. Polity IV project. Data set users' manual. Center for International Development and Conflict Management, University of Maryland,
Maryland, USA. [www.bsos.umd.edu/cidcm/inscr/polity].Meltzer, A., Richard, S., 1981. A rational theory of the size of government. Journal of Political Economy 89, 914–927.Mesquita, B., Smith, A., Siverson, R., Morrow, J., 2003. The Logic of Political Survival. MIT Press, Cambridge, Mass.Mitchell, B., 2003. International Historical Statistics: The Americas 1750–2000. Palgrave Macmillan, London.Mueller, D., Murrel, P., 1986. Interest groups and the size of the government. Public Choice 48, 125–145.Mueller, D., Stratmann, T., 2003. The economic effects of democratic participation. Journal of Public Economics 87, 2129–2155.Mulligan, C., Gil, R., Sala-i-Martin, X., 2004. Do democracies have different public policies than nondemocracies? Journal of Economic Perspective 18, 51–74.Nohlen, D., 1993. Enciclopedia Electoral Latino Americana y del Caribe. Instituto Interamericano de Derechos Humanos.Norris, P., 2001. Digital Divide: Civic Engagement, Information Poverty, and the Internet Worldwide. Cambridge University Press, Cambridge, UK.Olson, M., 1965. The Logic of Collective Action. Harvard University Press, Cambridge, Mass.Olson, M., 1982. The Rise and Decline of Nations: Economic Growth, Stagflation, and Social Rigidities. Yale University Press, New Haven.Papaioannou, E., Siourounis, G., 2008. Democratization and growth. The Economic Journal 118, 1520–1551.
200 T.S. Aidt, D.S. Eterovic / European Journal of Political Economy 27 (2011) 181–200
Persson, T., 2005. Forms of democracy, policy and economic development. Unpublished Working Paper, International Economic Studies, Stockholm University.Persson, T., Tabellini, G., 2003. The Economic Effects of Constitutions: What Do the Data Say? MIT Press, Cambridge, Mass.Persson, T., Tabellini, G., 2006. Democracy and development: the devil in the details. American Economic Review, Papers and Proceedings 96, 319–324.Persson, T., Roland, G., Tabellini, G., 1997. Separation of powers and political accountability. Quarterly Journal of Economics 112, 1163–1202.Powell, G., 1982. Contemporary Democracies. Harvard University Press, Cambridge, Mass.Przeworski, A., Alvarez, M., Cheibub, J., Limongi, F., 2000. Democracy and Development: Political Institutions and Material Well-being in the World, 1950–1990.
Cambridge University Press, Cambridge, UK.Reiter, D., Tillman, E., 2002. Public, legislative, and executive constraints on the democratic initiation of conflict. The Journal of Politics 64, 810–826.Rodrik, D., 1998. Why do more open economies have bigger governments? Journal of Political Economy 106, 997–1032.Rodrik, D., Wacziarg, R., 2004. Do democratic transitions produce bad economic outcomes? The American Economic Review 95, 50–55.Rogers, D., Rogers, J., 2000. Political competition and state government size: do tighter elections produce looser budgets? Public Choice 105, 1–21.Skilling, D., Zeckhauser, K., 2002. Political competition and debt trajectories in Japan and the OECD. Japan and the World Economy 14, 121–135.Stutzer, A., Kienast, L., 2005. Demokratische beteiligung und staatsausgaben: Die auswirkungen des frauenstimmrechts. Swiss Journal of Economics and Statistics
2005-IV, article 5.Tridimas, G., Winer, S., 2005. The political economy of government size. European Journal of Political Economy 21, 643–666.Vanhanen, T., 1971. Dependence of power on resources: a comparative study of 114 states in the 1960s. Department of Social Sciences Publications no. 11.
University of Jyvaskyla, Jyvaskyla, Finland.Vanhanen, T., 2000. A new dataset for measuring democracy. Journal of Peace Research 37, 251–265.Vanhanen, T., 2003a. Democratization and power resources 1850–2000. University of Tampere. Department of Political Science and International Relations,
Finnish Social Science Data Archive, Tampere. Finland.Vanhanen, T., 2003b. Democratization: A Comparative Analysis of 170 Countries. Routledge, London.Wagner, A., 1883. Three extracts on public finance. In: Musgrave, R.A., Peacock, A.T. (Eds.), Classics in the Theory of Public Finance. Macmillan, London.West, E., Winer, S., 1980. Optimal fiscal illusion and the size of government. Public Choice 35, 607–622.Wintrobe, R., 1998. The Political Economy of Dictatorship. Cambridge University Press, Cambridge.Wittman, D., 1989. Why democracy produce efficient results. The Journal of Political Economy 97, 1395–1424.Wittman, D., 1995. The Myth of Democratic Failure: Why Political Institutions are Efficient. University of Chicago Press, Chicago.


