Embed Size (px)
Citation preview
lable at ScienceDirect
Journal of Archaeological Science 38 (2011) 852e864
Contents lists avai
Journal of Archaeological Science
journal homepage: http: / /www.elsevier .com/locate/ jas
Points and prey: a quantitative test of the hypothesis that prey size influencesearly Paleoindian projectile point form
Briggs Buchanan a,b,*, Mark Collard a,b, Marcus J. Hamilton c,d,e, Michael J. O’Brien b
a Laboratory of Human Evolutionary Studies, Department of Archaeology, Simon Fraser University, British Columbia, CanadabDepartment of Anthropology, University of Missouri, Columbia, MO, USAcDepartment of Anthropology, University of New Mexico, Albuquerque, NM, USAdDepartment of Biology, University of New Mexico, Albuquerque, NM, USAe Santa Fe Institute, Sante Fe, NM, USA
a r t i c l e i n f o
Article history:Received 16 September 2010Received in revised form15 November 2010Accepted 16 November 2010
Keywords:ClovisFolsomGeometric morphometricsMammothBisonProjectile points
* Corresponding author. Laboratory of Human Evolof Archaeology, Simon Fraser University, 8888 UniveColumbia, Canada V5A 1S6 . Tel.: þ1 778 878 0737.
E-mail address: [email protected] (B. Buchanan).
0305-4403/$ e see front matter � 2010 Elsevier Ltd.doi:10.1016/j.jas.2010.11.007
a b s t r a c t
Understanding the causes of variation within and between projectile point types is an important task forPaleoindian archaeologists since they rely heavily on points to investigate such things as settlementdynamics and hunting practices. One long-held explanation for the variation in early Paleoindian pointform is that prey size influenced the size and shape of projectile points. The study reported here eval-uated this hypothesis with standard and geometric morphometric data recorded on Clovis and Folsompoints from the Southern Plains and Southwest that are associated with mammoth or bison remains.Points used to hunt mammoth were found to be larger and of a different shape than points used to huntbison, which supports the hypothesis. However, when both point type and prey size were taken intoaccount, the results ran counter to predictions. Potential explanations for this discrepancy are discussed.
� 2010 Elsevier Ltd. All rights reserved.
1. Introduction
Clovis and Folsom are the two best-known early archaeologicalcomplexes in North America. Clovis assemblages have been foundthroughout the contiguous United States, southern Canada, andnorthern Mexico (Holliday, 2000; Sanchez, 2001). The oldest Clovisassemblage dates ca. 13,300 calendar years before present (calBP)and the youngest ca. 12,800 calBP (Holliday, 2000). So far, Folsomhas been found only in western North America, mainly in the GreatPlains and Rocky Mountains. It appeared shortly after 13,000 calBPand disappeared around 11,900 calBP (Taylor et al., 1996; Holliday,2000; Collard et al., 2010).
Projectile points are the key diagnostic artifacts of Clovis andFolsom assemblages. Clovis points are bifacially flaked and flutedwith parallel to slightly convex sides and concave bases(Wormington, 1957). Folsom points are lanceolate or lozenge sha-ped (Wormington, 1957). They also tend to be smaller and lighter
utionary Studies, Departmentrsity Drive, Burnaby, British
All rights reserved.
than Clovis points and have more-invasive flutes. Both point typesare thought to have been used with darts delivered by atlatl(Hutchings, 1997).
Prey size has been argued to be amajor influence on the size andshape of Clovis and Folsom points. An early statement to this effectcan be found in Cotter (1938). In explaining the variation in the sizeof Clovis and Folsom points recovered from Blackwater Draw, NewMexico, Cotter hypothesized that large points were designed tohunt mammoth, medium-sized points were intended for bison andgame of moderate size, and small points weremade for small game.Among the other authors who have linked the form of Clovis andFolsom points to prey size are Sellards (1952), Hemmings (1970)and Haynes (1964). The former two authors argued that largeClovis points were used to hunt mammoth, whereas smaller Clovispoints were used for smaller game such as bison and horse. Haynes(1964) suggested that the change from Clovis points to Folsompoints coincided with the shift from hunting mammoth to thehunting of bison.
Currently, the status of these claims is uncertain. Experimentalstudies indicate that a projectile point’s size and shape can affect itsability to penetrate hide and its durability, which is consistent withthe hypothesis (Odell and Cowan,1986; Frison, 1989; Hughes,1998;Cheshier and Kelly, 2006; Sisk and Shea, 2009; Waguespack et al.,

B. Buchanan et al. / Journal of Archaeological Science 38 (2011) 852e864 853
2009). However, Haury et al. (1953, 1959) challenged the linkbetween prey size and point form in the case of Clovis. Theseauthors pointed out that Clovis points of a wide range of sizes areassociated with mammoth at the sites of Naco and Lehner in Ari-zona, and argued that this indicates that Clovis Paleoindians did notpreferentially use large points to hunt mammoth.
In view of this uncertainty, we tested the hypothesis that preysize influenced Clovis and Folsom projectile point form bycomparing the size and shape of points associatedwith the remainsof either Columbian mammoth (Mammuthus columbi) or ancientbison (Bison antiquus). Adult Columbianmammoth are estimated tohave been eight times heavier than adult ancient bison (w8000 kgversusw900 kg) (Smith et al., 2003). Thus, we reasoned that, if thehypothesis is correct, there should be significant differences in thesize and shape of projectile points associated with the two species.
2. Materials and methods
The study included 74 complete, previously typed projectilepoints (Table 1). Eleven are Clovis points associated with bisonremains, 36 are Clovis points associated with mammoth, and 27 areFolsom points associated with bison.
Bison remains have been recovered from a number of Clovissites (Waguespack and Surovell, 2003), but only four sites haveyielded complete Clovis points that can be linked with bisonremainsdBlackwater Draw, Jake Bluff (Oklahoma), Murray Springs(Arizona), and Lehner (Fig. 1). At Blackwater Draw, Sellards exca-vated a Clovis bison kill from the Gray Sands at the south end of theNorth Pit (Hester, 1972). The assemblage included the remains ofleast seven animals and three complete Clovis points. At Jake Bluff,remains of at least 14 bison were found at the bottom of an arroyoalong with four complete Clovis points (Bement and Carter, 2003).Area 4 at Murray Springs yielded the remains of at least 11 bisonplus three complete Clovis points (Haynes and Huckell, 2007). Acomplete Clovis point and bison remains were also recovered fromArea 3 at Murray Springs, but the point was equally close tomammoth remains, so it cannot be linked to either species. Severalcomplete Clovis points were found in association with animalremains at Lehner (Haury et al., 1959). One was recovered fromwithin the ribs of a bison. We included all the complete Clovispoints from Blackwater Draw, Jake Bluff, and Murray Springs thatare associated with bison remains in our sample of Clovis-bisonpoints. We also included the complete point from the bison kill atLehner.
In order to reduce the potential confounding effects ofecological and cultural variation, we limited our sample of Clovis-mammoth points and Folsom-bison points to the two regions inwhich Clovis bison kills have been found, the Southern Plains andSouthwest. The specimens in our sample of Clovis-mammothpoints come from three sites on the Southern PlainsdBlackwaterDraw, Domebo (Oklahoma), and Miami (Texas)dand three sites inthe SouthwestdEscapule (Arizona), Lehner, and Naco (Fig. 1). Thespecimens in our sample of Folsom-bison points come from sixsites on the Southern PlainsdBlackwater Draw, Cooper (Okla-homa), Folsom (New Mexico), Lake Theo (Texas), Lipscomb(Texas), and Lubbock Lake (Texas) (Fig. 1). All the points in ourClovis-mammoth sample are unambiguously and exclusivelyassociated with the remains of mammoth, and all the points in ourFolsom-bison sample are unambiguously and exclusively associ-ated with bison remains.
We obtained both size and shape data from the points. Theformer comprised values for three measurementsdlength, width,and thickness. These values were either taken from publishedsources or recorded by BB with digital calipers. The only points forwhich it was impossible to generate a complete set of size data
were the six Folsom-bison points from Lipscomb. We did notinclude values for thickness for these points because we could notfind the relevant values in the literature and were unable tomeasure the points directly.
The shape analysis methods we used are from the field ofgeometric morphometrics (e.g., Bookstein, 1991; Bookstein et al.,1985; Dryden and Mardia, 1998; Rohlf and Bookstein, 1990; Slice,2005, 2007). The methods allow patterns of variation in shapeand size to be investigated within a well-understood statisticalframework that yields relatively easily interpreted numerical andvisual results. Themethods deal with coordinate data as opposed tothe interlandmark distances of traditional morphometrics andoperate within a non-Euclidean shape space (Kendall, 1984), thegeometric and statistical properties of which are both well definedand highly desirable (O’Higgins, 1999, 2000).
Following Buchanan and Collard (2010), the steps taken inacquiring, processing, and extracting shape variables were asfollows:
1. Image acquisition. Digital images of points were used to capturelandmark data. For nearly flat objects such as projectile points,a two-dimensional approach produces limited information loss(Velhagen and Roth, 1997).
2. Choice and digitization of landmarks. We used three primary and20 secondary landmarks to capture point shape. Two primarylandmarks were located at the base of the point and weredefined by the junctions of the base and the blade edges. Thethird primary landmark was located at the tip. Line segmentswith equally spaced perpendicular lines were used to place thesecondary landmarks along the edges of the blades and thebase. These “combs” were superimposed on each image usingthe MakeFan6 shareware program (www.canisius.edu/wsheets/morphsoft.html). The 23 landmarks digitized foreach artifact are shown in Fig. 2. The landmarks were digitizedusing tpsDig2 shareware (Rohlf, 2004).
3. Superimposition of landmarks. This procedurewas carried out toreduce the confounding effects of the digitizing process and tocontrol for size differences among the specimens (Rohlf, 2003;Rohlf and Slice, 1990). Landmark superimposition entails threesteps. First, the set of landmark coordinates are centered attheir origin or “centroid,” and all the configurations are scaledto unit centroid size. Next, the consensus configuration iscomputed. Lastly, each landmark configuration is rotated so asto minimize the sum-of-squared residuals from the consensusconfiguration. The superimposition of landmarks was carriedout using the tpsSuper program (Rohlf, 2004).
4. Projection to tangent Euclidean space. In order to carry outtraditional statistical analyses, it was necessary to project thelandmarks to tangent Euclidean space (Rohlf, 1998; Slice,2001). This procedure was also carried out using the tpsSuperprogram (Rohlf, 2004). We conducted a regression of thedistances in the tangent space against the Procrustes distancesto determine the fit between the specimens in shape space andlinear tangent space. This test was carried out using thetpsSmall program (Rohlf, 2004). The correlation between thetwo distances was strong (correlation ¼ 0.9999; root MSerror ¼ 0.0001), indicating that the projection was adequate.
5. Extraction of partial warps and the uniform component. Partialwarps are eigenvectors of the bending-energy matrix thatdescribe local deformation along a coordinate axis. Uniformcomponents express global information on deformation. Thefirst uniform component accounts for variation along the x-axisof a configuration, whereas the second uniform componentaccounts for variation along the y-axis. Together, partial warpsand uniform components represent all information about the

Table 1Complete Clovis and Folsom projectile points recovered in association with mammoth or bison.
Type Site No. ofpoints
Catalog nos.a Provenience information Faunalassociation
Age and sex References
Folsom Blackwater Draw 2 937-27, 937-59 Locus 4A D, Station A Bison Unknown Hester, 1972:Figs. 39 and 40;Sellards, 1952: 54e58
Folsom Cooper 5 D, G, J, P, HH Recovered from the upperkill bonebed
Bison Unattributed (calves, yearlings,2e7 year olds; males and females)
Bement, 1999a,b
Folsom Cooper 6 R, S, U, V, Y, Z Recovered from the middlekill bonebed
Bison Unattributed (calf, yearlings,2e5 year olds; males and females)
Bement, 1999a,b
Folsom Cooper 1 T Recovered from the lowerkill bonebed
Bison Unattributed (calf, yearling,2e7 year olds; females)
Bement, 1999a,b
Folsom Folsom 1 AMNH 20.2.5865 Six inches from bison skeleton Bison Unattributedb (calves, yearlings,mature; males and females)
Meltzer, 2006
Folsom Folsom 1 DMNS 1262/1A Found near a rib Bison Unattributed (calves, yearlings,mature; males and females)
Meltzer, 2006
Folsom Folsom 1 CAVO-116 Found in skull Bison Unattributed (calves, yearlings,mature; males and females)
Meltzer, 2006
Folsom Lake Theo 2 A917-40, A917-79 Recovered from bonebed Bison Unknown Buchanan, 2002;Harrison andSmith, 1975
Folsom Lipscomb 1 17002e39 Recovered from the west edgeof the central bone concentration
Bison Unknown Hofman et al., 1989;Schultz, 1943
Folsom Lipscomb 1 17003�39 Associated with proximal radius Bison Unknown Hofman et al., 1989;Schultz, 1943
Folsom Lipscomb 1 17007�39 Associated with distal humerus Bison Unknown Hofman et al., 1989;Schultz, 1943
Folsom Lipscomb 1 17015�39 Associated with radius Bison Unknown Hofman et al., 1989;Schultz, 1943
Folsom Lipscomb 1 17022�39 Associated with skull Bison Unknown Hofman et al., 1989;Schultz, 1943
Folsom Lipscomb 1 17023�39 Associated with radius Bison Unknown Hofman et al., 1989;Schultz, 1943
Folsom Lubbock Lake 1 892e71 Station I, associated withbison remains
Bison Unknown Johnson, 1987: 105;Sellards, 1952: 53
Folsom Lubbock Lake 1 TTU-A1 Associated with remains of bison Bison Unknown Johnson, 1987: 105Clovis Blackwater Draw 3 937-729, 937-739,
937-741“Sellards’ Clovis bison kill” atsouth end of the North Pit, 1955
Bison Unknown Hester, 1972: 46, 47
Clovis Jake Bluff 4 a, b, c, d Recovered from the bonebed Bison Unattributed (calves,yearlings, mature)
Bement andCarter, 2003
Clovis Lehner 1 A-12681 Recovered between the ribs of bison Bison Unknown Haury et al., 1959Clovis Murray Springs 3 110 (949), 111
(952/1007),116 (1067)
Area 4, the Bison Kill Bison Unattributed (2 yearlings,a 2-year old, 5 heifers,and 3 mature cows)
Haynes andHuckell, 2007
Clovis Blackwater Draw 1 25312 (A183) North Bank, southwest of Mammoth#2, El Llano dig no. 1, 1963
Mammoth Nearly mature Hester, 1972;Warnica, 1966
Clovis Blackwater Draw 1 25313 (A186) North Bank, Mammoth #4 bonebed,El Llano dig no. 1, 1963
Mammoth Large adult Hester, 1972;Warnica, 1966
Clovis Blackwater Draw 1 25314 (A200) North Bank, Mammoth #4 bonebed,El Llano dig no. 1, 1963
Mammoth Large adult Hester, 1972;Warnica, 1966
Clovis Blackwater Draw 1 25315 (A201) North Bank, Mammoth #4 bonebednear skull, ribs, and vertebrae,El Llano dig no. 1, 1963
Mammoth Large adult Hester, 1972;Warnica, 1966
Clovis Blackwater Draw 1 25316 (A202) North Bank, Mammoth #4 bonebed,El Llano dig no. 1, 1963
Mammoth Large adult Hester, 1972;Warnica, 1966
Clovis Blackwater Draw 1 25317 (A209) North Bank, Mammoth #4 bonebed,El Llano dig no. 1, 1963
Mammoth Large adult Hester, 1972;Warnica, 1966
Clovis Blackwater Draw 1 24123 (EL10) North Bank, Mammoth #4 bonebed,El Llano dig no. 1, 1963
Mammoth Large adult Hester, 1972;Warnica, 1966
Clovis Blackwater Draw 1 24122 (EL229) North Bank, Mammoth #4 bonebed,El Llano dig no. 1, 1962-3
Mammoth Large adult Hester, 1972;Warnica, 1966
Clovis Blackwater Draw 1 24124 (EL30) North Bank, Mammoth #4 bonebed,El Llano dig no. 1, 1962-3
Mammoth Large adult Hester, 1972;Warnica, 1966
Clovis Blackwater Draw 1 24125 (EL47) North Bank, Mammoth #1 bonebed,El Llano dig no. 1, 1962-3
Mammoth Young adult Hester, 1972;Warnica, 1966
Clovis Blackwater Draw 1 36-19-2 (9-4) 5 cm below vertebra of mammoth #1 Mammoth Adult, 34 AEY, male Cotter, 1937;Boldurian andCotter, 1999;Saunders andDaeschler, 1994
Clovis Blackwater Draw 1 36-19-3 (9-22) Between distal end of ulna andproximal end of humerusof mammoth #2
Mammoth Adult, 35 AEY, female Cotter, 1937;Boldurian andCotter, 1999;Saunders andDaeschler, 1994
B. Buchanan et al. / Journal of Archaeological Science 38 (2011) 852e864854
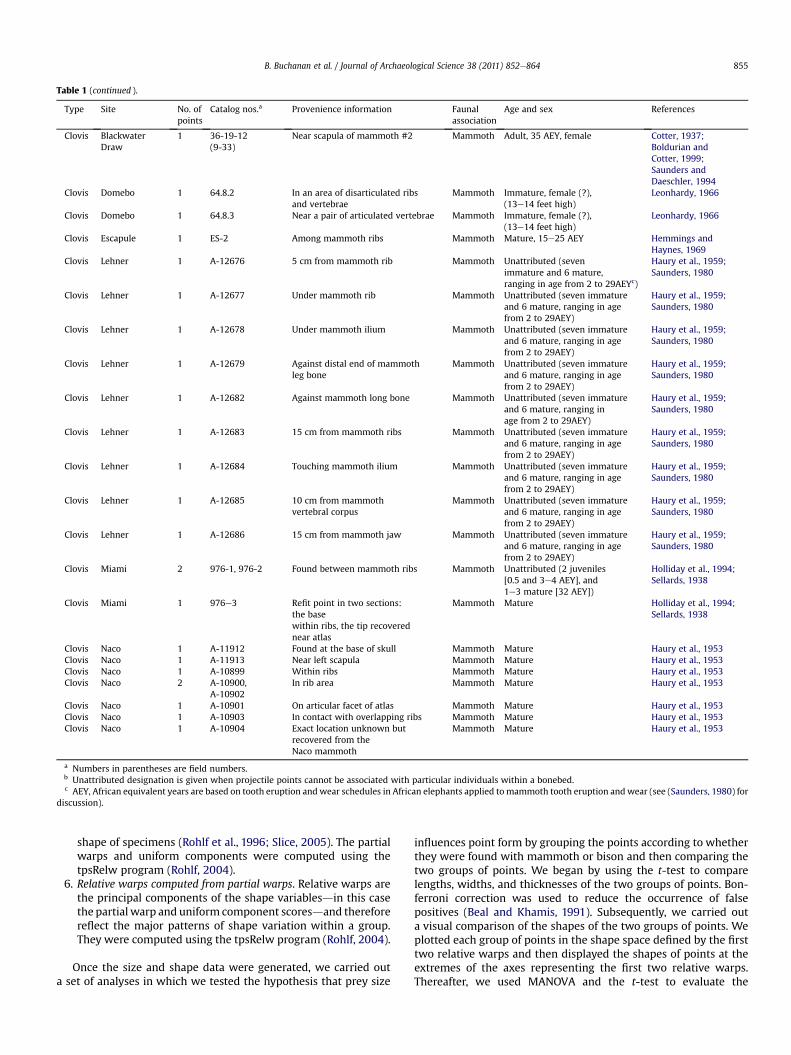
Table 1 (continued ).
Type Site No. ofpoints
Catalog nos.a Provenience information Faunalassociation
Age and sex References
Clovis BlackwaterDraw
1 36-19-12(9-33)
Near scapula of mammoth #2 Mammoth Adult, 35 AEY, female Cotter, 1937;Boldurian andCotter, 1999;Saunders andDaeschler, 1994
Clovis Domebo 1 64.8.2 In an area of disarticulated ribsand vertebrae
Mammoth Immature, female (?),(13e14 feet high)
Leonhardy, 1966
Clovis Domebo 1 64.8.3 Near a pair of articulated vertebrae Mammoth Immature, female (?),(13e14 feet high)
Leonhardy, 1966
Clovis Escapule 1 ES-2 Among mammoth ribs Mammoth Mature, 15e25 AEY Hemmings andHaynes, 1969
Clovis Lehner 1 A-12676 5 cm from mammoth rib Mammoth Unattributed (sevenimmature and 6 mature,ranging in age from 2 to 29AEYc)
Haury et al., 1959;Saunders, 1980
Clovis Lehner 1 A-12677 Under mammoth rib Mammoth Unattributed (seven immatureand 6 mature, ranging in agefrom 2 to 29AEY)
Haury et al., 1959;Saunders, 1980
Clovis Lehner 1 A-12678 Under mammoth ilium Mammoth Unattributed (seven immatureand 6 mature, ranging in agefrom 2 to 29AEY)
Haury et al., 1959;Saunders, 1980
Clovis Lehner 1 A-12679 Against distal end of mammothleg bone
Mammoth Unattributed (seven immatureand 6 mature, ranging in agefrom 2 to 29AEY)
Haury et al., 1959;Saunders, 1980
Clovis Lehner 1 A-12682 Against mammoth long bone Mammoth Unattributed (seven immatureand 6 mature, ranging inage from 2 to 29AEY)
Haury et al., 1959;Saunders, 1980
Clovis Lehner 1 A-12683 15 cm from mammoth ribs Mammoth Unattributed (seven immatureand 6 mature, ranging in agefrom 2 to 29AEY)
Haury et al., 1959;Saunders, 1980
Clovis Lehner 1 A-12684 Touching mammoth ilium Mammoth Unattributed (seven immatureand 6 mature, ranging in agefrom 2 to 29AEY)
Haury et al., 1959;Saunders, 1980
Clovis Lehner 1 A-12685 10 cm from mammothvertebral corpus
Mammoth Unattributed (seven immatureand 6 mature, ranging in agefrom 2 to 29AEY)
Haury et al., 1959;Saunders, 1980
Clovis Lehner 1 A-12686 15 cm from mammoth jaw Mammoth Unattributed (seven immatureand 6 mature, ranging in agefrom 2 to 29AEY)
Haury et al., 1959;Saunders, 1980
Clovis Miami 2 976-1, 976-2 Found between mammoth ribs Mammoth Unattributed (2 juveniles[0.5 and 3e4 AEY], and1e3 mature [32 AEY])
Holliday et al., 1994;Sellards, 1938
Clovis Miami 1 976e3 Refit point in two sections:the basewithin ribs, the tip recoverednear atlas
Mammoth Mature Holliday et al., 1994;Sellards, 1938
Clovis Naco 1 A-11912 Found at the base of skull Mammoth Mature Haury et al., 1953Clovis Naco 1 A-11913 Near left scapula Mammoth Mature Haury et al., 1953Clovis Naco 1 A-10899 Within ribs Mammoth Mature Haury et al., 1953Clovis Naco 2 A-10900,
A-10902In rib area Mammoth Mature Haury et al., 1953
Clovis Naco 1 A-10901 On articular facet of atlas Mammoth Mature Haury et al., 1953Clovis Naco 1 A-10903 In contact with overlapping ribs Mammoth Mature Haury et al., 1953Clovis Naco 1 A-10904 Exact location unknown but
recovered from theNaco mammoth
Mammoth Mature Haury et al., 1953
a Numbers in parentheses are field numbers.b Unattributed designation is given when projectile points cannot be associated with particular individuals within a bonebed.c AEY, African equivalent years are based on tooth eruption and wear schedules in African elephants applied tomammoth tooth eruption and wear (see (Saunders, 1980) for
discussion).
B. Buchanan et al. / Journal of Archaeological Science 38 (2011) 852e864 855
shape of specimens (Rohlf et al., 1996; Slice, 2005). The partialwarps and uniform components were computed using thetpsRelw program (Rohlf, 2004).
6. Relative warps computed from partial warps. Relative warps arethe principal components of the shape variablesdin this casethe partial warp and uniform component scoresdand thereforereflect the major patterns of shape variation within a group.They were computed using the tpsRelw program (Rohlf, 2004).
Once the size and shape data were generated, we carried outa set of analyses in which we tested the hypothesis that prey size
influences point form by grouping the points according to whetherthey were found with mammoth or bison and then comparing thetwo groups of points. We began by using the t-test to comparelengths, widths, and thicknesses of the two groups of points. Bon-ferroni correction was used to reduce the occurrence of falsepositives (Beal and Khamis, 1991). Subsequently, we carried outa visual comparison of the shapes of the two groups of points. Weplotted each group of points in the shape space defined by the firsttwo relative warps and then displayed the shapes of points at theextremes of the axes representing the first two relative warps.Thereafter, we used MANOVA and the t-test to evaluate the
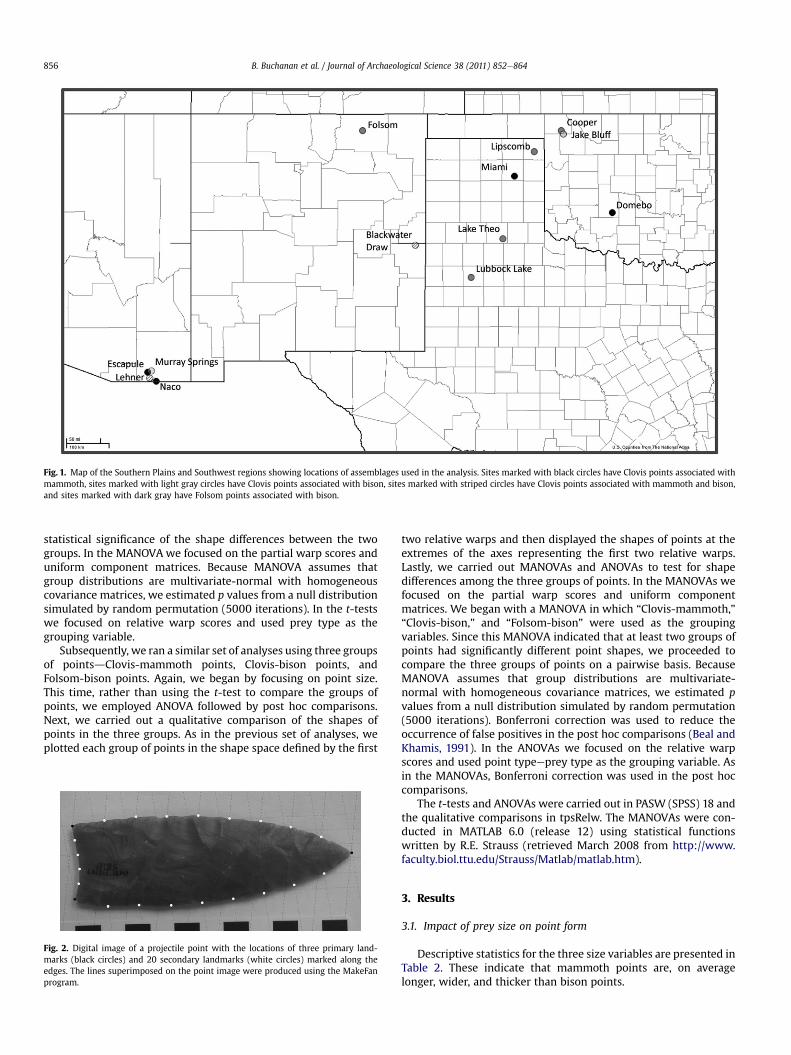
Fig. 1. Map of the Southern Plains and Southwest regions showing locations of assemblages used in the analysis. Sites marked with black circles have Clovis points associated withmammoth, sites marked with light gray circles have Clovis points associated with bison, sites marked with striped circles have Clovis points associated with mammoth and bison,and sites marked with dark gray have Folsom points associated with bison.
B. Buchanan et al. / Journal of Archaeological Science 38 (2011) 852e864856
statistical significance of the shape differences between the twogroups. In the MANOVA we focused on the partial warp scores anduniform component matrices. Because MANOVA assumes thatgroup distributions are multivariate-normal with homogeneouscovariance matrices, we estimated p values from a null distributionsimulated by random permutation (5000 iterations). In the t-testswe focused on relative warp scores and used prey type as thegrouping variable.
Subsequently, we ran a similar set of analyses using three groupsof pointsdClovis-mammoth points, Clovis-bison points, andFolsom-bison points. Again, we began by focusing on point size.This time, rather than using the t-test to compare the groups ofpoints, we employed ANOVA followed by post hoc comparisons.Next, we carried out a qualitative comparison of the shapes ofpoints in the three groups. As in the previous set of analyses, weplotted each group of points in the shape space defined by the first
Fig. 2. Digital image of a projectile point with the locations of three primary land-marks (black circles) and 20 secondary landmarks (white circles) marked along theedges. The lines superimposed on the point image were produced using the MakeFanprogram.
two relative warps and then displayed the shapes of points at theextremes of the axes representing the first two relative warps.Lastly, we carried out MANOVAs and ANOVAs to test for shapedifferences among the three groups of points. In the MANOVAs wefocused on the partial warp scores and uniform componentmatrices. We began with a MANOVA in which “Clovis-mammoth,”“Clovis-bison,” and “Folsom-bison” were used as the groupingvariables. Since this MANOVA indicated that at least two groups ofpoints had significantly different point shapes, we proceeded tocompare the three groups of points on a pairwise basis. BecauseMANOVA assumes that group distributions are multivariate-normal with homogeneous covariance matrices, we estimated pvalues from a null distribution simulated by random permutation(5000 iterations). Bonferroni correction was used to reduce theoccurrence of false positives in the post hoc comparisons (Beal andKhamis, 1991). In the ANOVAs we focused on the relative warpscores and used point typeeprey type as the grouping variable. Asin the MANOVAs, Bonferroni correction was used in the post hoccomparisons.
The t-tests and ANOVAs were carried out in PASW (SPSS) 18 andthe qualitative comparisons in tpsRelw. The MANOVAs were con-ducted in MATLAB 6.0 (release 12) using statistical functionswritten by R.E. Strauss (retrieved March 2008 from http://www.faculty.biol.ttu.edu/Strauss/Matlab/matlab.htm).
3. Results
3.1. Impact of prey size on point form
Descriptive statistics for the three size variables are presented inTable 2. These indicate that mammoth points are, on averagelonger, wider, and thicker than bison points.
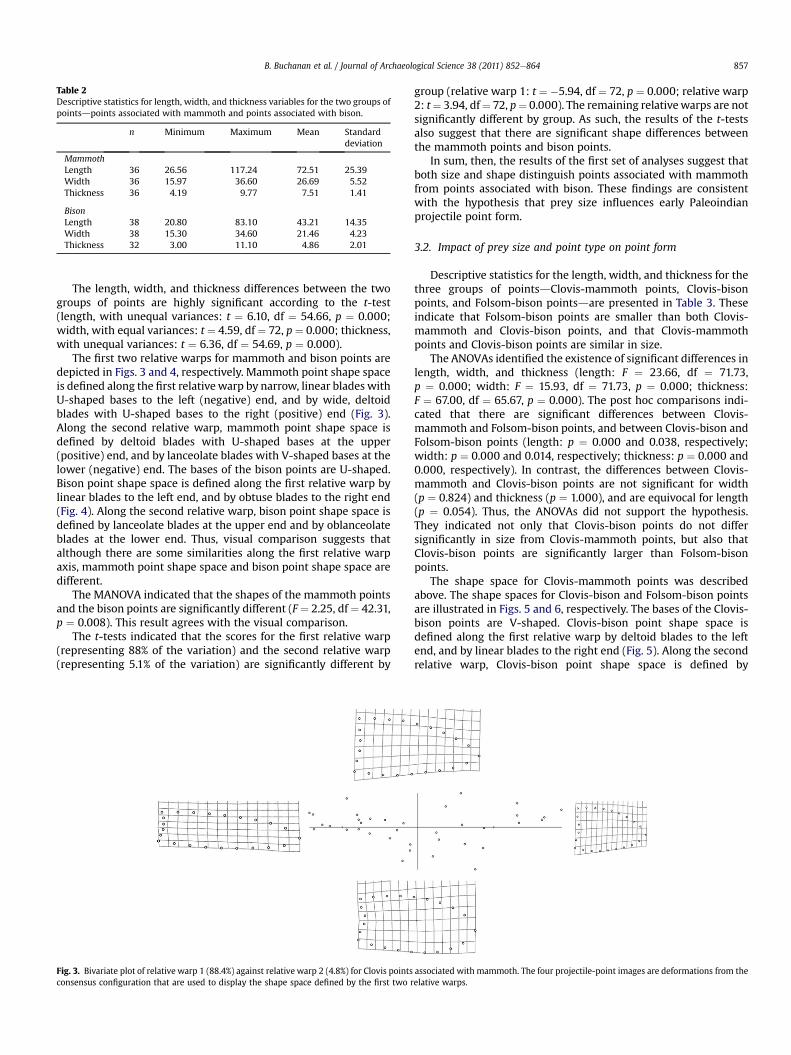
Table 2Descriptive statistics for length, width, and thickness variables for the two groups ofpointsdpoints associated with mammoth and points associated with bison.
n Minimum Maximum Mean Standarddeviation
MammothLength 36 26.56 117.24 72.51 25.39Width 36 15.97 36.60 26.69 5.52Thickness 36 4.19 9.77 7.51 1.41
BisonLength 38 20.80 83.10 43.21 14.35Width 38 15.30 34.60 21.46 4.23Thickness 32 3.00 11.10 4.86 2.01
B. Buchanan et al. / Journal of Archaeological Science 38 (2011) 852e864 857
The length, width, and thickness differences between the twogroups of points are highly significant according to the t-test(length, with unequal variances: t ¼ 6.10, df ¼ 54.66, p ¼ 0.000;width, with equal variances: t ¼ 4.59, df ¼ 72, p ¼ 0.000; thickness,with unequal variances: t ¼ 6.36, df ¼ 54.69, p ¼ 0.000).
The first two relative warps for mammoth and bison points aredepicted in Figs. 3 and 4, respectively. Mammoth point shape spaceis defined along the first relativewarp by narrow, linear blades withU-shaped bases to the left (negative) end, and by wide, deltoidblades with U-shaped bases to the right (positive) end (Fig. 3).Along the second relative warp, mammoth point shape space isdefined by deltoid blades with U-shaped bases at the upper(positive) end, and by lanceolate blades with V-shaped bases at thelower (negative) end. The bases of the bison points are U-shaped.Bison point shape space is defined along the first relative warp bylinear blades to the left end, and by obtuse blades to the right end(Fig. 4). Along the second relative warp, bison point shape space isdefined by lanceolate blades at the upper end and by oblanceolateblades at the lower end. Thus, visual comparison suggests thatalthough there are some similarities along the first relative warpaxis, mammoth point shape space and bison point shape space aredifferent.
The MANOVA indicated that the shapes of the mammoth pointsand the bison points are significantly different (F ¼ 2.25, df ¼ 42.31,p ¼ 0.008). This result agrees with the visual comparison.
The t-tests indicated that the scores for the first relative warp(representing 88% of the variation) and the second relative warp(representing 5.1% of the variation) are significantly different by
Fig. 3. Bivariate plot of relative warp 1 (88.4%) against relative warp 2 (4.8%) for Clovis pointsconsensus configuration that are used to display the shape space defined by the first two r
group (relative warp 1: t ¼ �5.94, df ¼ 72, p ¼ 0.000; relative warp2: t¼ 3.94, df¼ 72, p¼ 0.000). The remaining relativewarps are notsignificantly different by group. As such, the results of the t-testsalso suggest that there are significant shape differences betweenthe mammoth points and bison points.
In sum, then, the results of the first set of analyses suggest thatboth size and shape distinguish points associated with mammothfrom points associated with bison. These findings are consistentwith the hypothesis that prey size influences early Paleoindianprojectile point form.
3.2. Impact of prey size and point type on point form
Descriptive statistics for the length, width, and thickness for thethree groups of pointsdClovis-mammoth points, Clovis-bisonpoints, and Folsom-bison pointsdare presented in Table 3. Theseindicate that Folsom-bison points are smaller than both Clovis-mammoth and Clovis-bison points, and that Clovis-mammothpoints and Clovis-bison points are similar in size.
The ANOVAs identified the existence of significant differences inlength, width, and thickness (length: F ¼ 23.66, df ¼ 71.73,p ¼ 0.000; width: F ¼ 15.93, df ¼ 71.73, p ¼ 0.000; thickness:F ¼ 67.00, df ¼ 65.67, p ¼ 0.000). The post hoc comparisons indi-cated that there are significant differences between Clovis-mammoth and Folsom-bison points, and between Clovis-bison andFolsom-bison points (length: p ¼ 0.000 and 0.038, respectively;width: p ¼ 0.000 and 0.014, respectively; thickness: p ¼ 0.000 and0.000, respectively). In contrast, the differences between Clovis-mammoth and Clovis-bison points are not significant for width(p ¼ 0.824) and thickness (p ¼ 1.000), and are equivocal for length(p ¼ 0.054). Thus, the ANOVAs did not support the hypothesis.They indicated not only that Clovis-bison points do not differsignificantly in size from Clovis-mammoth points, but also thatClovis-bison points are significantly larger than Folsom-bisonpoints.
The shape space for Clovis-mammoth points was describedabove. The shape spaces for Clovis-bison and Folsom-bison pointsare illustrated in Figs. 5 and 6, respectively. The bases of the Clovis-bison points are V-shaped. Clovis-bison point shape space isdefined along the first relative warp by deltoid blades to the leftend, and by linear blades to the right end (Fig. 5). Along the secondrelative warp, Clovis-bison point shape space is defined by
associated with mammoth. The four projectile-point images are deformations from theelative warps.
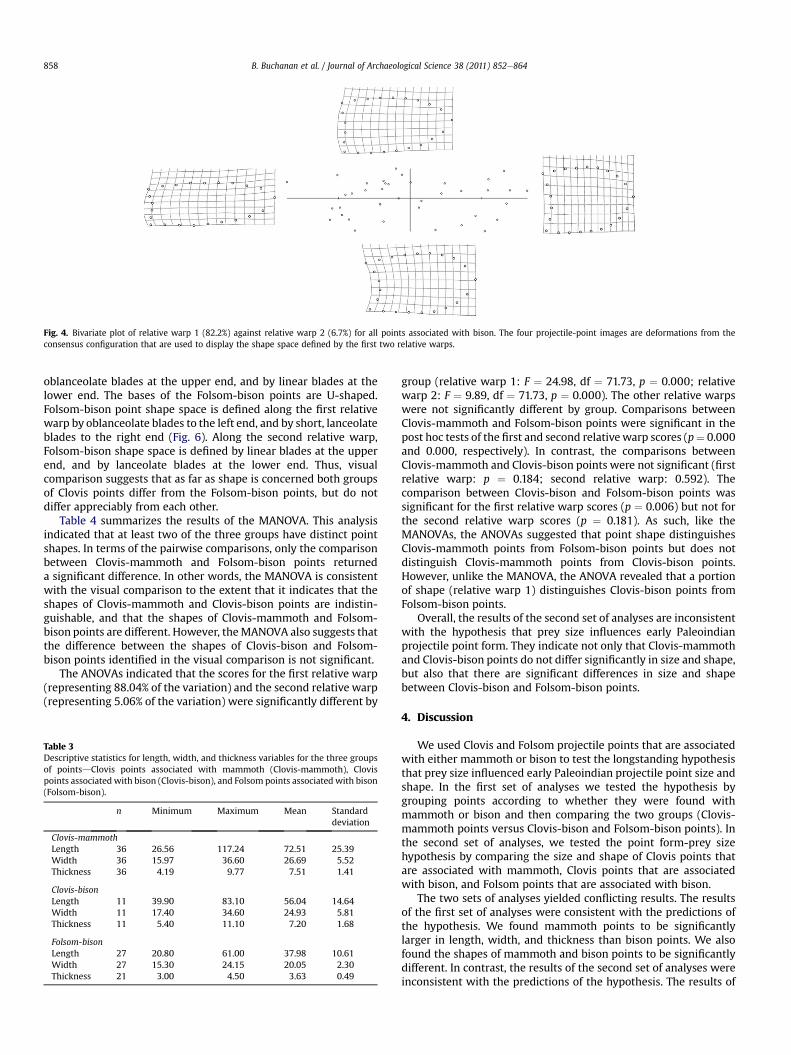
Fig. 4. Bivariate plot of relative warp 1 (82.2%) against relative warp 2 (6.7%) for all points associated with bison. The four projectile-point images are deformations from theconsensus configuration that are used to display the shape space defined by the first two relative warps.
B. Buchanan et al. / Journal of Archaeological Science 38 (2011) 852e864858
oblanceolate blades at the upper end, and by linear blades at thelower end. The bases of the Folsom-bison points are U-shaped.Folsom-bison point shape space is defined along the first relativewarp by oblanceolate blades to the left end, and by short, lanceolateblades to the right end (Fig. 6). Along the second relative warp,Folsom-bison shape space is defined by linear blades at the upperend, and by lanceolate blades at the lower end. Thus, visualcomparison suggests that as far as shape is concerned both groupsof Clovis points differ from the Folsom-bison points, but do notdiffer appreciably from each other.
Table 4 summarizes the results of the MANOVA. This analysisindicated that at least two of the three groups have distinct pointshapes. In terms of the pairwise comparisons, only the comparisonbetween Clovis-mammoth and Folsom-bison points returneda significant difference. In other words, the MANOVA is consistentwith the visual comparison to the extent that it indicates that theshapes of Clovis-mammoth and Clovis-bison points are indistin-guishable, and that the shapes of Clovis-mammoth and Folsom-bison points are different. However, theMANOVA also suggests thatthe difference between the shapes of Clovis-bison and Folsom-bison points identified in the visual comparison is not significant.
The ANOVAs indicated that the scores for the first relative warp(representing 88.04% of the variation) and the second relative warp(representing 5.06% of the variation) were significantly different by
Table 3Descriptive statistics for length, width, and thickness variables for the three groupsof pointsdClovis points associated with mammoth (Clovis-mammoth), Clovispoints associatedwith bison (Clovis-bison), and Folsom points associated with bison(Folsom-bison).
n Minimum Maximum Mean Standarddeviation
Clovis-mammothLength 36 26.56 117.24 72.51 25.39Width 36 15.97 36.60 26.69 5.52Thickness 36 4.19 9.77 7.51 1.41
Clovis-bisonLength 11 39.90 83.10 56.04 14.64Width 11 17.40 34.60 24.93 5.81Thickness 11 5.40 11.10 7.20 1.68
Folsom-bisonLength 27 20.80 61.00 37.98 10.61Width 27 15.30 24.15 20.05 2.30Thickness 21 3.00 4.50 3.63 0.49
group (relative warp 1: F ¼ 24.98, df ¼ 71.73, p ¼ 0.000; relativewarp 2: F ¼ 9.89, df ¼ 71.73, p ¼ 0.000). The other relative warpswere not significantly different by group. Comparisons betweenClovis-mammoth and Folsom-bison points were significant in thepost hoc tests of the first and second relativewarp scores (p¼ 0.000and 0.000, respectively). In contrast, the comparisons betweenClovis-mammoth and Clovis-bison points were not significant (firstrelative warp: p ¼ 0.184; second relative warp: 0.592). Thecomparison between Clovis-bison and Folsom-bison points wassignificant for the first relative warp scores (p ¼ 0.006) but not forthe second relative warp scores (p ¼ 0.181). As such, like theMANOVAs, the ANOVAs suggested that point shape distinguishesClovis-mammoth points from Folsom-bison points but does notdistinguish Clovis-mammoth points from Clovis-bison points.However, unlike the MANOVA, the ANOVA revealed that a portionof shape (relative warp 1) distinguishes Clovis-bison points fromFolsom-bison points.
Overall, the results of the second set of analyses are inconsistentwith the hypothesis that prey size influences early Paleoindianprojectile point form. They indicate not only that Clovis-mammothand Clovis-bison points do not differ significantly in size and shape,but also that there are significant differences in size and shapebetween Clovis-bison and Folsom-bison points.
4. Discussion
We used Clovis and Folsom projectile points that are associatedwith either mammoth or bison to test the longstanding hypothesisthat prey size influenced early Paleoindian projectile point size andshape. In the first set of analyses we tested the hypothesis bygrouping points according to whether they were found withmammoth or bison and then comparing the two groups (Clovis-mammoth points versus Clovis-bison and Folsom-bison points). Inthe second set of analyses, we tested the point form-prey sizehypothesis by comparing the size and shape of Clovis points thatare associated with mammoth, Clovis points that are associatedwith bison, and Folsom points that are associated with bison.
The two sets of analyses yielded conflicting results. The resultsof the first set of analyses were consistent with the predictions ofthe hypothesis. We found mammoth points to be significantlylarger in length, width, and thickness than bison points. We alsofound the shapes of mammoth and bison points to be significantlydifferent. In contrast, the results of the second set of analyses wereinconsistent with the predictions of the hypothesis. The results of
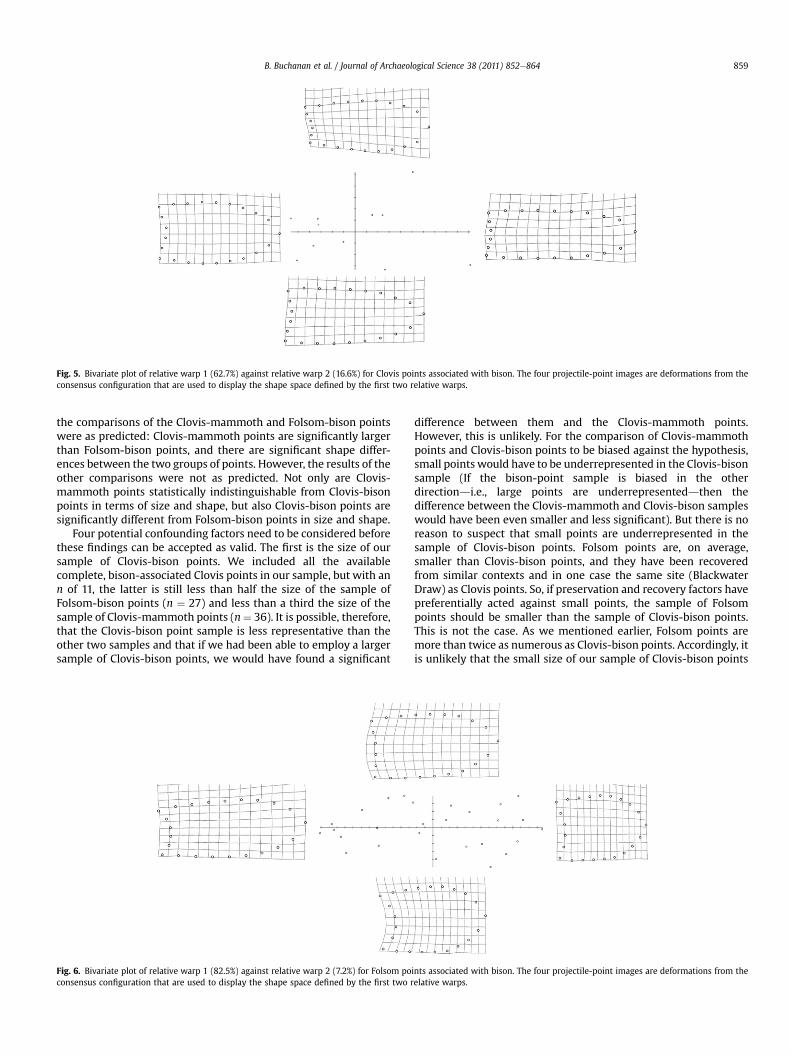
Fig. 5. Bivariate plot of relative warp 1 (62.7%) against relative warp 2 (16.6%) for Clovis points associated with bison. The four projectile-point images are deformations from theconsensus configuration that are used to display the shape space defined by the first two relative warps.
B. Buchanan et al. / Journal of Archaeological Science 38 (2011) 852e864 859
the comparisons of the Clovis-mammoth and Folsom-bison pointswere as predicted: Clovis-mammoth points are significantly largerthan Folsom-bison points, and there are significant shape differ-ences between the two groups of points. However, the results of theother comparisons were not as predicted. Not only are Clovis-mammoth points statistically indistinguishable from Clovis-bisonpoints in terms of size and shape, but also Clovis-bison points aresignificantly different from Folsom-bison points in size and shape.
Four potential confounding factors need to be considered beforethese findings can be accepted as valid. The first is the size of oursample of Clovis-bison points. We included all the availablecomplete, bison-associated Clovis points in our sample, but with ann of 11, the latter is still less than half the size of the sample ofFolsom-bison points (n ¼ 27) and less than a third the size of thesample of Clovis-mammoth points (n¼ 36). It is possible, therefore,that the Clovis-bison point sample is less representative than theother two samples and that if we had been able to employ a largersample of Clovis-bison points, we would have found a significant
Fig. 6. Bivariate plot of relative warp 1 (82.5%) against relative warp 2 (7.2%) for Folsom poconsensus configuration that are used to display the shape space defined by the first two r
difference between them and the Clovis-mammoth points.However, this is unlikely. For the comparison of Clovis-mammothpoints and Clovis-bison points to be biased against the hypothesis,small points would have to be underrepresented in the Clovis-bisonsample (If the bison-point sample is biased in the otherdirectiondi.e., large points are underrepresenteddthen thedifference between the Clovis-mammoth and Clovis-bison sampleswould have been even smaller and less significant). But there is noreason to suspect that small points are underrepresented in thesample of Clovis-bison points. Folsom points are, on average,smaller than Clovis-bison points, and they have been recoveredfrom similar contexts and in one case the same site (BlackwaterDraw) as Clovis points. So, if preservation and recovery factors havepreferentially acted against small points, the sample of Folsompoints should be smaller than the sample of Clovis-bison points.This is not the case. As we mentioned earlier, Folsom points aremore than twice as numerous as Clovis-bison points. Accordingly, itis unlikely that the small size of our sample of Clovis-bison points
ints associated with bison. The four projectile-point images are deformations from theelative warps.
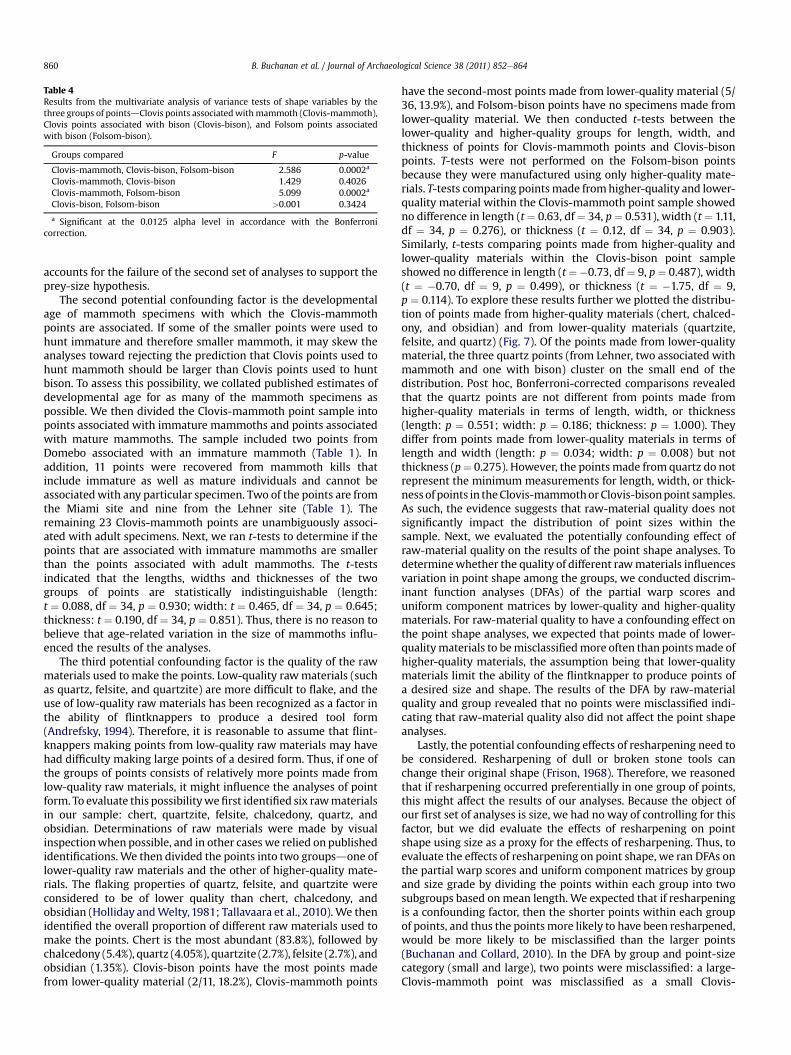
Table 4Results from the multivariate analysis of variance tests of shape variables by thethree groups of pointsdClovis points associatedwithmammoth (Clovis-mammoth),Clovis points associated with bison (Clovis-bison), and Folsom points associatedwith bison (Folsom-bison).
Groups compared F p-value
Clovis-mammoth, Clovis-bison, Folsom-bison 2.586 0.0002a
Clovis-mammoth, Clovis-bison 1.429 0.4026Clovis-mammoth, Folsom-bison 5.099 0.0002a
Clovis-bison, Folsom-bison >0.001 0.3424
a Significant at the 0.0125 alpha level in accordance with the Bonferronicorrection.
B. Buchanan et al. / Journal of Archaeological Science 38 (2011) 852e864860
accounts for the failure of the second set of analyses to support theprey-size hypothesis.
The second potential confounding factor is the developmentalage of mammoth specimens with which the Clovis-mammothpoints are associated. If some of the smaller points were used tohunt immature and therefore smaller mammoth, it may skew theanalyses toward rejecting the prediction that Clovis points used tohunt mammoth should be larger than Clovis points used to huntbison. To assess this possibility, we collated published estimates ofdevelopmental age for as many of the mammoth specimens aspossible. We then divided the Clovis-mammoth point sample intopoints associated with immature mammoths and points associatedwith mature mammoths. The sample included two points fromDomebo associated with an immature mammoth (Table 1). Inaddition, 11 points were recovered from mammoth kills thatinclude immature as well as mature individuals and cannot beassociatedwith any particular specimen. Two of the points are fromthe Miami site and nine from the Lehner site (Table 1). Theremaining 23 Clovis-mammoth points are unambiguously associ-ated with adult specimens. Next, we ran t-tests to determine if thepoints that are associated with immature mammoths are smallerthan the points associated with adult mammoths. The t-testsindicated that the lengths, widths and thicknesses of the twogroups of points are statistically indistinguishable (length:t ¼ 0.088, df ¼ 34, p ¼ 0.930; width: t ¼ 0.465, df ¼ 34, p ¼ 0.645;thickness: t ¼ 0.190, df ¼ 34, p ¼ 0.851). Thus, there is no reason tobelieve that age-related variation in the size of mammoths influ-enced the results of the analyses.
The third potential confounding factor is the quality of the rawmaterials used to make the points. Low-quality rawmaterials (suchas quartz, felsite, and quartzite) are more difficult to flake, and theuse of low-quality raw materials has been recognized as a factor inthe ability of flintknappers to produce a desired tool form(Andrefsky, 1994). Therefore, it is reasonable to assume that flint-knappers making points from low-quality raw materials may havehad difficulty making large points of a desired form. Thus, if one ofthe groups of points consists of relatively more points made fromlow-quality raw materials, it might influence the analyses of pointform. To evaluate this possibilitywefirst identified six rawmaterialsin our sample: chert, quartzite, felsite, chalcedony, quartz, andobsidian. Determinations of raw materials were made by visualinspectionwhen possible, and in other cases we relied on publishedidentifications. We then divided the points into two groupsdone oflower-quality raw materials and the other of higher-quality mate-rials. The flaking properties of quartz, felsite, and quartzite wereconsidered to be of lower quality than chert, chalcedony, andobsidian (Holliday andWelty,1981; Tallavaara et al., 2010). We thenidentified the overall proportion of different raw materials used tomake the points. Chert is the most abundant (83.8%), followed bychalcedony (5.4%), quartz (4.05%), quartzite (2.7%), felsite (2.7%), andobsidian (1.35%). Clovis-bison points have the most points madefrom lower-quality material (2/11, 18.2%), Clovis-mammoth points
have the second-most points made from lower-quality material (5/36, 13.9%), and Folsom-bison points have no specimens made fromlower-quality material. We then conducted t-tests between thelower-quality and higher-quality groups for length, width, andthickness of points for Clovis-mammoth points and Clovis-bisonpoints. T-tests were not performed on the Folsom-bison pointsbecause they were manufactured using only higher-quality mate-rials. T-tests comparing pointsmade fromhigher-quality and lower-quality material within the Clovis-mammoth point sample showedno difference in length (t ¼ 0.63, df¼ 34, p¼ 0.531), width (t ¼ 1.11,df ¼ 34, p ¼ 0.276), or thickness (t ¼ 0.12, df ¼ 34, p ¼ 0.903).Similarly, t-tests comparing points made from higher-quality andlower-quality materials within the Clovis-bison point sampleshowed no difference in length (t¼�0.73, df¼ 9, p¼ 0.487), width(t ¼ �0.70, df ¼ 9, p ¼ 0.499), or thickness (t ¼ �1.75, df ¼ 9,p ¼ 0.114). To explore these results further we plotted the distribu-tion of points made from higher-quality materials (chert, chalced-ony, and obsidian) and from lower-quality materials (quartzite,felsite, and quartz) (Fig. 7). Of the points made from lower-qualitymaterial, the three quartz points (from Lehner, two associated withmammoth and one with bison) cluster on the small end of thedistribution. Post hoc, Bonferroni-corrected comparisons revealedthat the quartz points are not different from points made fromhigher-quality materials in terms of length, width, or thickness(length: p ¼ 0.551; width: p ¼ 0.186; thickness: p ¼ 1.000). Theydiffer from points made from lower-quality materials in terms oflength and width (length: p ¼ 0.034; width: p ¼ 0.008) but notthickness (p¼ 0.275). However, the points made from quartz do notrepresent the minimum measurements for length, width, or thick-ness of points in theClovis-mammothorClovis-bisonpoint samples.As such, the evidence suggests that raw-material quality does notsignificantly impact the distribution of point sizes within thesample. Next, we evaluated the potentially confounding effect ofraw-material quality on the results of the point shape analyses. Todeterminewhether the quality of different rawmaterials influencesvariation in point shape among the groups, we conducted discrim-inant function analyses (DFAs) of the partial warp scores anduniform component matrices by lower-quality and higher-qualitymaterials. For raw-material quality to have a confounding effect onthe point shape analyses, we expected that points made of lower-qualitymaterials to bemisclassifiedmore often than pointsmade ofhigher-quality materials, the assumption being that lower-qualitymaterials limit the ability of the flintknapper to produce points ofa desired size and shape. The results of the DFA by raw-materialquality and group revealed that no points were misclassified indi-cating that raw-material quality also did not affect the point shapeanalyses.
Lastly, the potential confounding effects of resharpening need tobe considered. Resharpening of dull or broken stone tools canchange their original shape (Frison, 1968). Therefore, we reasonedthat if resharpening occurred preferentially in one group of points,this might affect the results of our analyses. Because the object ofour first set of analyses is size, we had no way of controlling for thisfactor, but we did evaluate the effects of resharpening on pointshape using size as a proxy for the effects of resharpening. Thus, toevaluate the effects of resharpening on point shape, we ran DFAs onthe partial warp scores and uniform component matrices by groupand size grade by dividing the points within each group into twosubgroups based onmean length. We expected that if resharpeningis a confounding factor, then the shorter points within each groupof points, and thus the pointsmore likely to have been resharpened,would be more likely to be misclassified than the larger points(Buchanan and Collard, 2010). In the DFA by group and point-sizecategory (small and large), two points were misclassified: a large-Clovis-mammoth point was misclassified as a small Clovis-
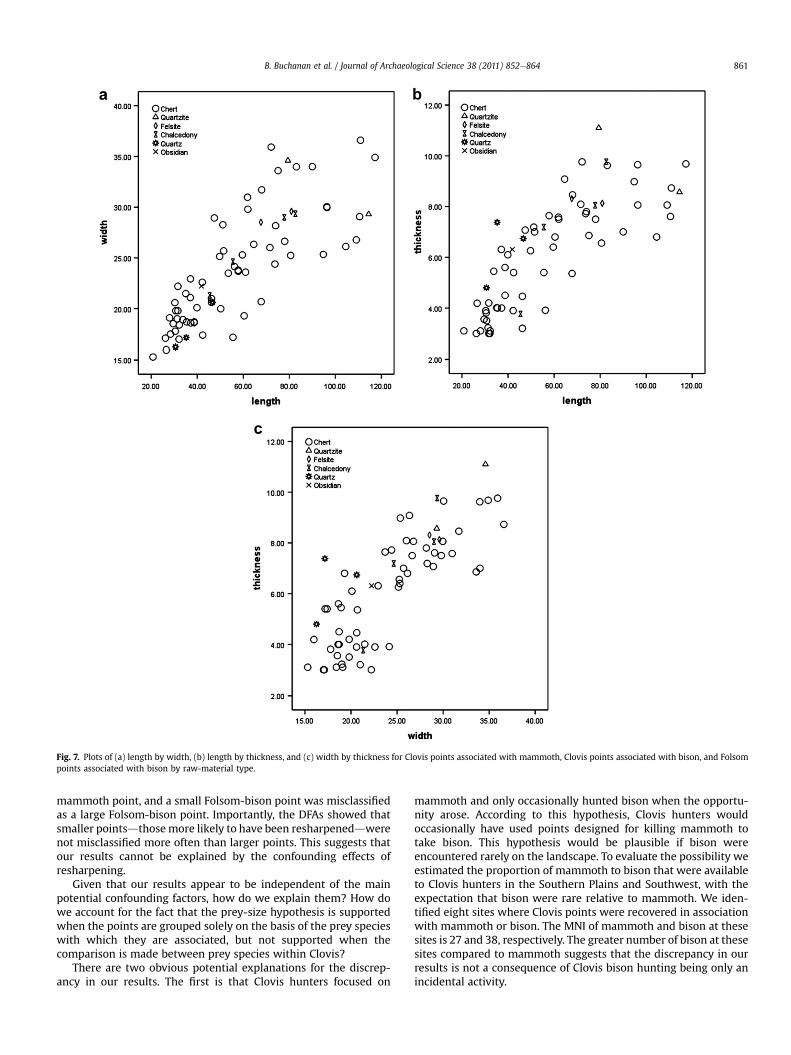
Fig. 7. Plots of (a) length by width, (b) length by thickness, and (c) width by thickness for Clovis points associated with mammoth, Clovis points associated with bison, and Folsompoints associated with bison by raw-material type.
B. Buchanan et al. / Journal of Archaeological Science 38 (2011) 852e864 861
mammoth point, and a small Folsom-bison point was misclassifiedas a large Folsom-bison point. Importantly, the DFAs showed thatsmaller pointsdthosemore likely to have been resharpeneddwerenot misclassified more often than larger points. This suggests thatour results cannot be explained by the confounding effects ofresharpening.
Given that our results appear to be independent of the mainpotential confounding factors, how do we explain them? How dowe account for the fact that the prey-size hypothesis is supportedwhen the points are grouped solely on the basis of the prey specieswith which they are associated, but not supported when thecomparison is made between prey species within Clovis?
There are two obvious potential explanations for the discrep-ancy in our results. The first is that Clovis hunters focused on
mammoth and only occasionally hunted bison when the opportu-nity arose. According to this hypothesis, Clovis hunters wouldoccasionally have used points designed for killing mammoth totake bison. This hypothesis would be plausible if bison wereencountered rarely on the landscape. To evaluate the possibility weestimated the proportion of mammoth to bison that were availableto Clovis hunters in the Southern Plains and Southwest, with theexpectation that bison were rare relative to mammoth. We iden-tified eight sites where Clovis points were recovered in associationwith mammoth or bison. The MNI of mammoth and bison at thesesites is 27 and 38, respectively. The greater number of bison at thesesites compared to mammoth suggests that the discrepancy in ourresults is not a consequence of Clovis bison hunting being only anincidental activity.
B. Buchanan et al. / Journal of Archaeological Science 38 (2011) 852e864862
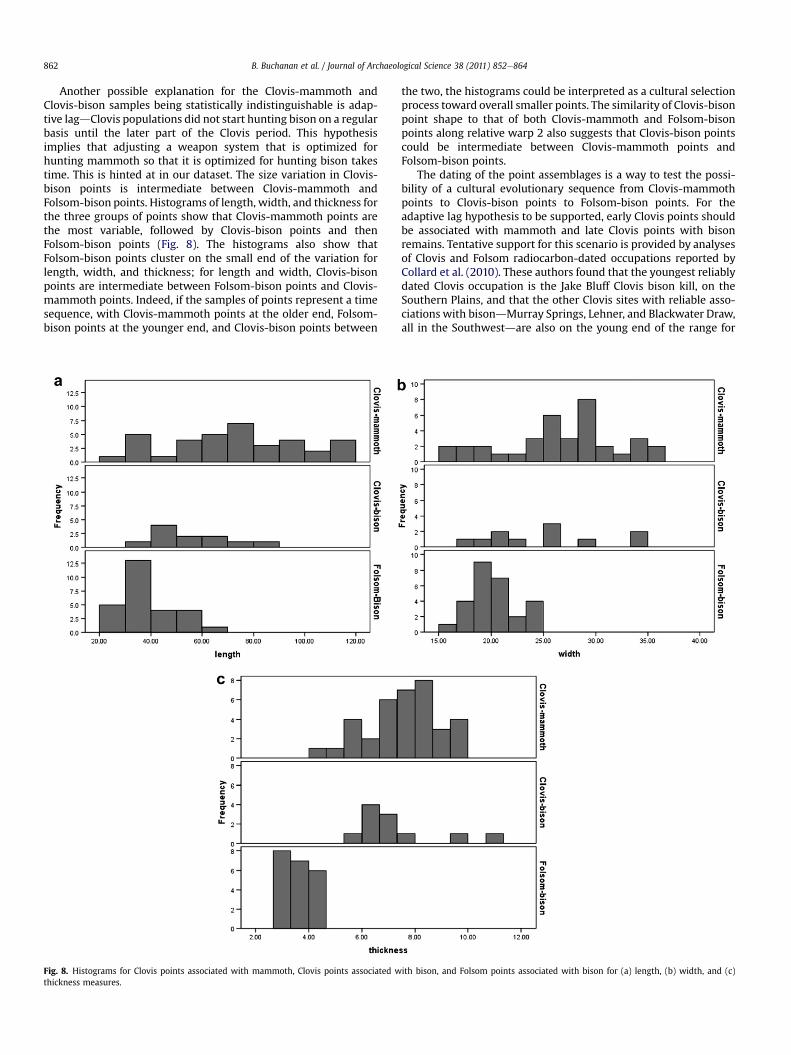
Another possible explanation for the Clovis-mammoth andClovis-bison samples being statistically indistinguishable is adap-tive lagdClovis populations did not start hunting bison on a regularbasis until the later part of the Clovis period. This hypothesisimplies that adjusting a weapon system that is optimized forhunting mammoth so that it is optimized for hunting bison takestime. This is hinted at in our dataset. The size variation in Clovis-bison points is intermediate between Clovis-mammoth andFolsom-bison points. Histograms of length, width, and thickness forthe three groups of points show that Clovis-mammoth points arethe most variable, followed by Clovis-bison points and thenFolsom-bison points (Fig. 8). The histograms also show thatFolsom-bison points cluster on the small end of the variation forlength, width, and thickness; for length and width, Clovis-bisonpoints are intermediate between Folsom-bison points and Clovis-mammoth points. Indeed, if the samples of points represent a timesequence, with Clovis-mammoth points at the older end, Folsom-bison points at the younger end, and Clovis-bison points between
Fig. 8. Histograms for Clovis points associated with mammoth, Clovis points associated wthickness measures.
the two, the histograms could be interpreted as a cultural selectionprocess toward overall smaller points. The similarity of Clovis-bisonpoint shape to that of both Clovis-mammoth and Folsom-bisonpoints along relative warp 2 also suggests that Clovis-bison pointscould be intermediate between Clovis-mammoth points andFolsom-bison points.
The dating of the point assemblages is a way to test the possi-bility of a cultural evolutionary sequence from Clovis-mammothpoints to Clovis-bison points to Folsom-bison points. For theadaptive lag hypothesis to be supported, early Clovis points shouldbe associated with mammoth and late Clovis points with bisonremains. Tentative support for this scenario is provided by analysesof Clovis and Folsom radiocarbon-dated occupations reported byCollard et al. (2010). These authors found that the youngest reliablydated Clovis occupation is the Jake Bluff Clovis bison kill, on theSouthern Plains, and that the other Clovis sites with reliable asso-ciations with bisondMurray Springs, Lehner, and Blackwater Draw,all in the Southwestdare also on the young end of the range for
ith bison, and Folsom points associated with bison for (a) length, (b) width, and (c)

B. Buchanan et al. / Journal of Archaeological Science 38 (2011) 852e864 863
dated Clovis occupations (five of the six youngest Clovis occupa-tions). However, we should note that in some cases, such as MurraySprings and Blackwater Draw, radiocarbon dates were not deriveddirectly from the bison kills. If further evidence supports this trend,it would indicate that concentrated bison hunting by Clovis peopleswas a relatively late occurrence during the Clovis period. Withrespect to this hypothesis, it is worth noting that Bement and Carter(2003) argue that the Jake Bluff Clovis bison kill postdates theextinction of the mammoths, and suggest that Clovis huntersturned to hunting bison when other megafauna became scarce. Ifthis hypothesis is correct, it could explain why Clovis bison kills arerelatively young. It may be that they increase in frequency as thenumber of mammoth on the landscape declines.
5. Conclusions
The hypothesis that early Paleoindian points were designedspecifically for the type of prey being hunted has been consideredsince the establishment of the Clovis point type (Cotter, 1938). Anumber of authors have since argued that larger pointswere used tohunt larger prey and that smaller points were used to hunt smallerprey. Despite the potential importance of this hypothesis forexplaining variation in early Paleoindian point form, there had beenno direct investigation of this hypothesis. Here we provide a quan-titative test of the predictions that there should be significantdifferences in the size and shape of projectile points associatedwithprey of different body sizes. We used a sample of Clovis pointsassociated with mammoth or bison and Folsom points associatedwith bison, and found support for the general prediction that preysize correlates with point size and shape. Points used to huntmammoth were larger and of a different shape than points used tohunt bison. However,whenwe analyzed the points byprey type andpoint type, we found that, contrary to expectations, point size andshape did not distinguish Clovis points found with mammoth fromClovis points foundwith bison. Thus, ourfindings suggest there is nosimple relationship betweenpoint size and prey size. Our results areindependent of four confounding factorsdsample size, age-relatedvariation in mammoth body size, raw-material quality, andresharpening effects. We considered two possible explanations forthe discrepancy in our results, one ofwhich remains plausibledthatbison hunting was a late occurrence in Clovis and thus Clovis pointswere in the process of being adapted to hunting bison rather thanmammoth.
Acknowledgments
We thank Laura Nightengale, head of collections at the TexasArcheological Research Laboratory, University of Texas at Austin, forher help in locating and photographing points from the BlackwaterDraw collection. We also thank Leland Bement of the OklahomaArcheological Survey for photographs and discussions concerningthe assemblages at the Jake Bluff and Cooper sites. In addition, wethank Eastern New Mexico University for access to portions of theBlackwater Draw assemblage, the Museum of the Great Plains foraccess to the Domebo assemblage, the University of Arizona and theArizona State Museum for access to the Murray Springs and Lehnerassemblages, and the PanhandleePlains Historical Museum foraccess to the Lake Theo assemblage. BB and MJO are supported bythe University of Missouri. MC’s work on the study was supportedby the Social Sciences and Humanities Research Council, theCanada Research Chairs Program, the Canada Foundation forInnovation, the British Columbia Knowledge Development Fund,and Simon Fraser University. MJH is supported by the RockefellerFoundation and the National Science Foundation.
References
Andrefsky Jr., W., 1994. Raw-material availability and the organization of tech-nology. Am. Antiq. 59, 21e34.
Beal, K.G., Khamis, H.J., 1991. A problem in statistical analysis: simultaneous infer-ence. Condor 93, 1023e1025.
Bement, L.C., 1999a. Bison Hunting at Cooper Site: Where Lightning Bolts DrewThundering Herds. University of Oklahoma Press, Norman.
Bement, L.C., 1999b. View from a kill: the Cooper site Folsom lithic assemblage. In:Amick, D.S. (Ed.), Folsom Lithic Technology. Explorations in Structure andVariation. International Monographs in Prehistory, Archaeological Series 12.Michigan, Ann Arbor, pp. 111e121.
Bement, L.C., Carter, B.J., 2003. Clovis bison hunting at the Jake Bluff site, NW,Oklahoma. Curr. Res. Pleistocene 20, 5e7.
Boldurian, A.T., Cotter, J.L., 1999. Clovis Revisited. New Perspectives on PaleoindianAdaptations from Blackwater Draw, New Mexico. The University Museum,University of Pennsylvania, Philadelphia.
Bookstein, F.L., 1991. Morphometric Tools for Landmark Data: Geometry andBiology. Cambridge University Press, Cambridge.
Bookstein, F.L., Chernoff, B., Elder, R.L., Humphries Jr., J.M., Smith, G.R., Strauss, R.E.(Eds.), 1985. Morphometrics in Evolutionary Biology. Special Publications 15.Academy of Natural Sciences Press, Philadelphia.
Buchanan, B., 2002. Folsom lithic procurement, tool use, and replacement at theLake Theo site, Texas. Plains Anthropol. 47, 121e146.
Buchanan, B., Collard, M., 2010. A geometric morphometrics-based assessment ofblade shape differences among Paleoindian projectile point types fromwesternNorth America. J. Archaeol. Sci. 37, 350e359.
Cheshier, J., Kelly, R.L., 2006. Projectile point shape and durability: the effect ofthickness: length. Am. Antiq. 71, 353e363.
Collard, M., Buchanan, B., Hamilton, M.J., O’Brien, M.J., 2010. Spatiotemporaldynamics of the CloviseFolsom transition. J. Archaeol. Sci. 37, 2513e2519.
Cotter, J.L., 1937. The occurrence of flints and extinct animals in pluvial depositsnear Clovis, New Mexico: part IV, report on excavation at the gravel pit, 1936.In: Proceedings of the Academy of Natural Sciences of Philadelphia, 89, pp.1e16.
Cotter, J.L., 1938. The occurrence of flints and extinct animals in pluvial depositsnear Clovis, New Mexico: part VI, report on field season of 1937. In: Proceedingsof the Academy of Natural Sciences of Philadelphia, 90, pp. 113e117.
Dryden, I.L., Mardia, K.V., 1998. Statistical Shape Analysis. John Wiley, London.Frison, G.C., 1968. A functional analysis of certain chipped stone tools. Am. Antiq. 33,
149e155.Frison, G.C., 1989. Experimental use of Clovis weaponry and tools on African
elephants. Am. Antiq. 54, 766e784.Harrison, B.R., Smith, H.C., 1975. A test excavation of the Lake Theo site Briscoe
County, Texas. Panhandle Plain. Hist. Rev. 48, 70e106.Haury, E.W., Antevs, E., Lance, J.F., 1953. Artifacts with mammoth remains, Naco,
Arizona. Am. Antiq. 19, 1e24.Haury, E.W., Sayles, E.B., Wasley, W.W., 1959. The Lehner mammoth site, south-
eastern Arizona. Am. Antiq. 25, 2e30.Haynes Jr., C.V., 1964. Fluted projectile points: their age and dispersion. Science 145,
1408e1413.Haynes Jr., C.V., Huckell, B.B. (Eds.), 2007. Murray Springs: A Clovis Site with
Multiple Activity Areas in the San Pedro Valley, Arizona. Anthropological Papersof the University of Arizona Number 71. The University of Arizona Press, Tucson.
Hemmings, E.T., 1970. Early man in the San Pedro Valley, Arizona. PhD dissertation,Department of Anthropology, University of Arizona, Tucson, Arizona.
Hemmings, E.T., Haynes Jr., C.V., 1969. The Escapule mammoth and associatedprojectile points, San Pedro Valley, Arizona. J. Arizona Acad. Sci. 5, 184e188.
Hester, J.J., 1972. Blackwater Draw Locality No. 1: A Stratified Early Man Site inEastern New Mexico Fort Burgwin Research Center Publication No. 8. Ranchosde Taos, New Mexico.
Hofman, J.L., Todd, L.C., Schultz, C.B., Hendy, W., 1989. The Lipscomb bison quarry:continuing investigation at a Folsom kill-butchery site on the Southern Plains.Bull. Texas Archeol. Soc. 60, 149e189.
Holliday, V.T., 2000. The evolution of Paleoindian geochronology and typology onthe Great Plains. Geoarchaeology 15, 227e290.
Holliday, V.T., Welty, C.M., 1981. Lithic tool resources of the eastern Llano Estacado.Bull. Texas Archeol. Soc. 52, 201e214.
Holliday, V.T., Haynes Jr., C.V., Hofman, J.L., Meltzer, D.J., 1994. Geoarchaeology andgeochronology of the Miami (Clovis) site, southern high plains of Texas.Quaternary Res. 41, 234e244.
Hughes, S.S., 1998. Getting to the point: evolutionary change in prehistoric weap-onry. J. Archaeol. Meth. Theor. 5, 345e408.
Hutchings, W.K., 1997. The Paleoindian fluted point: dart or spear armature? Theidentification of paleoindian delivery technology through the analysis of lithicfracture velocity. Unpublished Ph.D. dissertation, Department of Archaeology,Simon Fraser University, Burnaby, British Columbia.
Johnson, E. (Ed.), 1987. Lubbock Lake. Late Quaternary Studies on the Southern HighPlains. Texas A&M University Press, College Station.
Kendall, D.G., 1984. Shape manifolds, procrustean metrics and complex projectivespaces. Bull. Lond. Math. Soc. 16, 81e121.
Leonhardy, F.C. (Ed.), 1966. Domebo: A Paleo-Indian Mammoth Kill in the Prai-rieePlains. Contributions of the Museum of the Great Plains No. 1 Lawton,Oklahoma.

B. Buchanan et al. / Journal of Archaeological Science 38 (2011) 852e864864
Meltzer, D.J., 2006. Folsom: New Archaeological Investigations of a Classic Paleo-indian Bison Kill. University of California Press, Berkeley.
Odell, G.H., Cowan, F., 1986. Experiments with spears and arrows on animal targets.J. Field Archaeol. 13, 195e212.
O’Higgins, P., 1999. Ontogeny and phylogeny: morphometric approaches to thestudy of skeletal growth and evolution. In: Chaplain, M.A.J., Singh, G.D.,McLachlan, J. (Eds.), On Growth and Form: Spatio-temporal Pattern Formationin Biology. Wiley, New York, pp. 373e393.
O’Higgins, P., 2000. Quantitative approaches to the study of craniofacial growth andevolution: advances in morphometric techniques. In: O’Higgins, P., Cohn, M.(Eds.), Vertebrate Ontogeny and Phylogeny: Implications for the Study ofHominid Skeletal Evolution. Academic Press, London, pp. 163e185.
Rohlf, F.J., 1998. On applications of geometric morphometrics to studies of ontogenyand phylogeny. Syst. Biol. 47, 147e158.
Rohlf, F.J., 2003. Bias and error in estimates of mean shape in geometric morpho-metrics. J. Hum. Evol. 44, 665e683.
Rohlf, F.J., 2004. TPS Shareware Series. Department of Ecology and Evolution, StateUniversity of New York, Stony Brook, New York. http://life.bio.sunysb.edu/morph.
Rohlf, F.J., Bookstein, F.L. (Eds.), 1990. Proceedings of the Michigan MorphometricsWorkshop. Special Publication Number 2. University of Michigan Museum ofZoology, Ann Arbor, Michigan.
Rohlf, F.J., Slice, D.E., 1990. Extensions of the Procrustes method for the optimalsuperimposition of landmarks. Syst. Zool. 39, 40e59.
Rohlf, F.J., Loy, A., Corti, M., 1996. Morphometric analysis of old world talpidae(mammalia, insectivora) using partial-warp scores. Syst. Biol. 45, 344e362.
Sanchez, M.G., 2001. A synopsis of Paleo-Indian archaeology in Mexico. Kiva 67,119e136.
Saunders, J.J., 1980. A model for man-mammoth relationships in late PleistoceneNorth America. Can. J. Anthropol. 1, 87e98.
Saunders, J.J., Daeschler, E.B., 1994. Descriptive analyses and taphonomical obser-vations of culturally-modified mammoths excavated at “The Gravel Pit,” nearClovis, New Mexico in 1936. Proc. Acad. Nat. Sci. Philadelphia 145, 1e28.
Schultz, C.B., 1943. Some artifact sites of early man in the Great Plains and adjacentareas. Am. Antiq. 8, 242e249.
Sellards, E.H., 1938. Artifacts associated with fossil elephant. Bull. Geol. Soc. Am. 49,999e1010.
Sellards, E.H., 1952. Early Man in North America. The University of Texas Press,Austin.
Sisk, M.L., Shea, J.J., 2009. Experimental use and quantitative performance analysisof triangular flakes (Levallois points) used as arrowheads. J. Archaeol. Sci. 36,2039e2047.
Slice, D.E., 2001. Landmark coordinates aligned by Procrustes analysis do not lie inKendall’s shape space. Syst. Biol. 50, 141e149.
Slice, D.E. (Ed.), 2005. Modern Morphometrics in Physical Anthropology. Kluwer,New York.
Slice, D.E., 2007. Geometric morphometrics. Annu. Rev. Anthropol. 36, 261e281.Smith, F.A., Lyons, S.K., Ernest, S.K.M., Jones, K.E., Kauffman, D.M., Dayan, T.,
Marquet, P.A., Brown, J.H., Haskell, J.P., 2003. Body mass of Late Quaternarymammals. Ecology 84, 3403.
Tallavaara, M., Manninen, M.A., Hertell, E., Rankama, T., 2010. How flakesshatter e a critical evaluation of quartz fracture analysis. J. Archaeol. Sci. 37,2442e2448.
Taylor, R.E., Haynes Jr., C.V., Stuiver, M., 1996. Clovis and Folsom age estimates:stratigraphic context and radiocarbon calibration. Antiquity 70, 515e525.
Velhagen, W.A., Roth, V.L., 1997. Scaling the mandible in squirrels. J. Morphol. 232,107e132.
Waguespack, N.M., Surovell, T.A., 2003. Clovis hunting strategies, or how to makeout on plentiful resources. Am. Antiq. 68, 333e352.
Waguespack, N.M., Surovell, T.A., Denoyer, A., Dallow, A., Savage, A., Hyneman, J.,Tapster, D., 2009. Making a point: wood-versus stone-tipped projectiles.Antiquity 83, 786e800.
Warnica, J.M., 1966. New discoveries at the Clovis site. Am. Antiq. 31, 345e357.Wormington, H.M., 1957. Ancient Man in North America. Denver Museum of
Natural History, Denver.


