Embed Size (px)
Citation preview
United States Agency for International Development Greenhouse Gas Pollution Prevention Project
Climate Change Supplement (GEP-CCS)
Fostering Climate Change Initiatives for Sustainable Development
Task 1C Development of Computational Tool Kits
By:
The Louis Berger Group, Inc. C-6/7, Safdarjung Development Area
New Delhi 110 016
May 14,2001
Cover Note for Contputotionol Toolkils
CLIN 1: Fostering Climate Chnge Initiatives for Sustainable Development
Development of C o i n p e t a h d Toolkits
The Greenhouse Gas Pollution Prevention Project - Climate Change Supplement (GEP- CCS) is engaged in the building of capacity of project developers and the Climate Change Cmtcrs (CCC) at Devdopmcnt Alttmativcs. One of the major tasks that The Louis Berge~ Group, kc. GEP team (LBGIGEP) is engaged is development of clean magy projects that have psstiilities of carbon off- that can be captured for their pemzived value. The CCCs would play the role of facilitating such projects during and beyond the GEP-CCS LOP. in order to build the capacity of the CCCs, (predominantly DA) LBG/GEP designed Computational Toolkits that help in developing and structuring the Climate Change Mitigahon Projects (ccw)'. LBGIGEP sought help h m professional wnsufting finn, Econergy International Corporation (EIC), which has developed considerable expertise in the clean energy pmjects for financing of the inbaent carbon offsets. Along with EIC and DA LBGIGEP has been able to develop a five-mmponent toolkit, which includes:
P Baseline Development Toolkit; ;;.z.&&, Fmancc ToolkiS
'..'. :.:+.:* v&ficatio; To0&i1: ~. > ;%-& F* Too&r and
9 :fSusiaGble ~evelopment Toolkit
nese toolkits are interlinked and generally operate in the sequence indicated above, except for the SD tool, wbich works m parallel. The CCC would need to gather sufficient experience in project development and structuring, as these tools are by no means a substitute for an experienced consultant. This deliverable briefly d e s m i the component toolkits. Each toolkit is explained by means of a note and a presentation that would help the user understand their usage
Energy generation and use is by far the most emission intensive activity. It is estimated that in India, W ? of the GHG emissions emanate h m energy generation and use. Thus, it would be w t to direct effort towards projects in !his area so as to be most effective. In view of this, LBGKEP has wncenhated upon developing tools to analyze the clean energy pmjects. ThRe is no clear definition of a clean energy project. However, it loosely includes renewable energy technologies like wind, biomass, solar PV and
' CCMP is an accq~tcd tmn worldmdc pdominantly for the Clcan Energy Pmjects that have GHG emissions &tion oppommitin.
C U N I: F d g Uirntc ChDgs kamrcr faS&lc D~dopmmt PW 2 Task I '2 Notcon Coqul.liooal Twlht Dndapmmt
THE Louis Berger Group. M, 2300 N Snw. N W Washingm. DC 20037 USA
The Louis Berger Group, Inc Contract No. 386-C-0&00-00058-00 Sandeep Tandon, CTO
tbamsl cl~., cnaKy efficiarcy improvarrcnt projects like -e bat iscovay. omrbina~ cycle beat md powu, cogcncnlion, fossil finel tdmologies like c b cal unse. sWit>ocleaaafoelscrC.hothawads,ar).~th.1docrkaainasmrof c m i s s i o a o v c r t b c ~ s ~ L b r t h v e p r o ~ m t d w i d d y . h ~ t o m e p C Wdinbnshuetunlpmjc~t~rm+rplofprojcdspat. iototborttbrtbc)p mitiwe GHG cmiaioaP fiom urlmu .divitieq notably, cbc Lrdfill nudmu w p b ~ md u s c p j c c & , v c b i c l e ~ ~ p o ( p . m r U c .
i. Rojd thbtdispkgrid somceted dstricity. ii. ProjdsthtdispLaoff-grid*%
iii. ~cctr~replrce~bamdamgygcnentioa;md N. M~~&ovayprojd
Tbctoo~dbclptkCCCtotcsltbcprojectamaptmddcwkpcbcpopfc t b r w g b t b e p o j c c t c y c k ~ S D t o o l t i t ~ t c s t w b c l b c r t b c C C M P m e a , c b c ~ of m t y . Tkuflu, tk B.Jclinc tool would amble dcvdrrpmcDl of occlrrrior of badk.TbcM&V~wouldbelpin.ssssingtbccostof~
. . cbc
protocolmdmaLetbcOffslpnhubkmdmasunble.Tbccdxm~~ a r o o M b d p i n c ~ ~ t b c o ~ m d n ) u c t b c r o o ~ T b c ~ & F . O d b r g t o d b t arooMpeJcrgctbcproj&1mdidcntifyLbc~efrmdiqBrgmcyforcbcpojar 'Ihm,tbctoolLit~aarboIewouldguidctbc~mdderc~mmrtisgcbcpoj&1 baohblewiihtbccrrboafar&TbctodlriE,.rcdisnmcd
<*,Z$. - bricnywon.
- . - . B.rcli.e Tdki t
Aftcrtbcbrrcliaeis~~c.rbooFmm~toodlidrcbcdcvdopcrindcvdopioe a n d ~ b i J b a ~ j a % T b e ~ p r o j c a c o a r i d c n t i o m ~ ~ ~ po in t sThc too ldc ivc soncbc idc ld f ia~ ioc ld~o f~o fvn ioor typabad by tbc project and the promotas md slso disuscr various stntcgics of miliptian a provishlforiks.
Cover. Note for Con~pufational Toolki~s
The identification of baseline helps in designing and structuring the pmject. However, the project performance is of paramount importance in orda to make the carbon futance flow to the developa and the Carbon Offsets to have credibility. This cannot be achieved unless the project developers have conceptualized the Monitoring & Verification Protocol and identified the necessary capital investment to implement the same. The M&V Protocol not only d d b a the method of monitoring and vaifying the project's performance against the set baseline but it dso measures the current baseline at periodic intervals and revalidates or modifies it. The M&V tool is developed to help the CCC in advising the developer.
Marketing & Fahding Toolkit
Having developed the pmject under the acceptable norms, it is very import& to prepare the pmject proposal by including the desired modules and pnscnt to the funding agencies. Also, it is very essential to identify as many funding agencies so as to select the most appropriate to the developers. The Marketing and Funding tool helps in preparing the pmject documents in the pattern desired by a majority of funding agencies. It also provides the contacts of currently available carbon offsets funding agencies. This toolkit would need periodic revisions by the CCCs.
Sustainable Development Toolkit
One of the goals of the GHG emissions reduction projects is to measure the advase impacl of climate change on social development and devise ways of ~r-g and mitigating the same.. Thus, the CCMP must have sustainabre development as the- prime goal. Sustainable Development tool brings out these faceis of a CCMP and suggests me&ods of measuring the paformance of the CCMP on the sustainable development criteiia. -- ,---- - - . . . .-
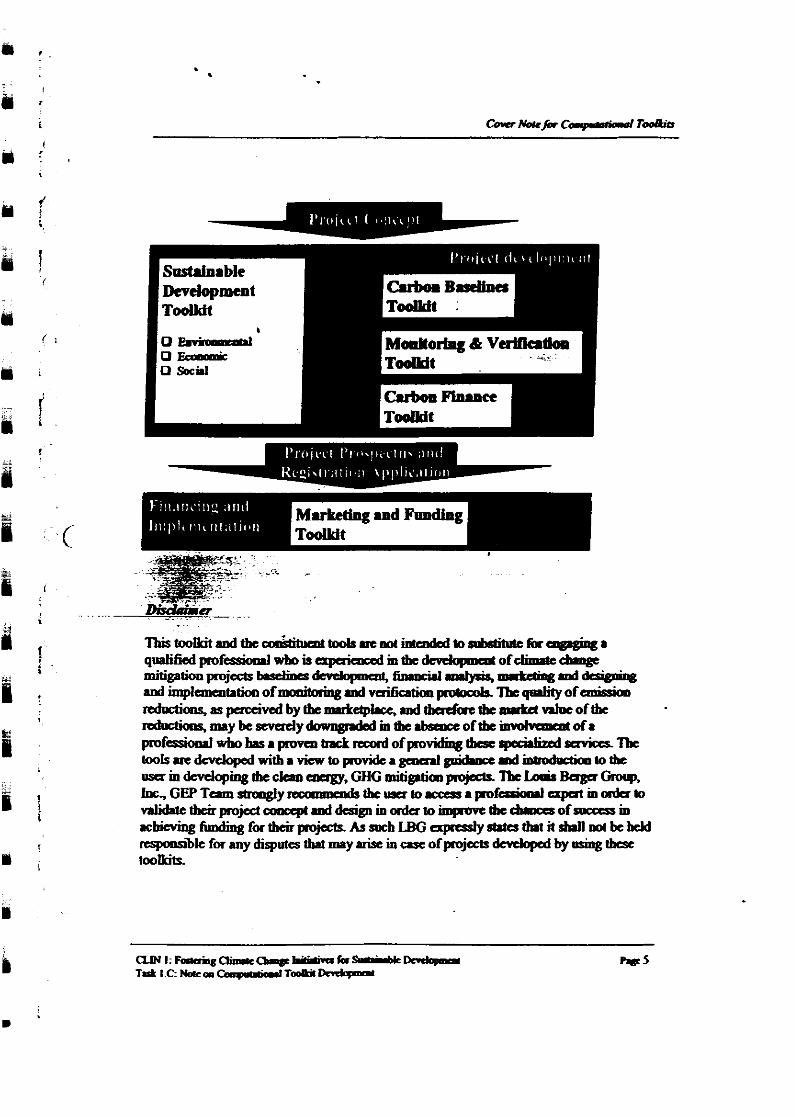
I-e of took '
As mentioned earlier the ta~lkits are linked with eacb 0 t h . The input 6rom the Baseline Development tool helm in calculatina alaorithms of the Carbon Fmance toolkit which in - - hrm heb in the Ma&eting & Funding tool. The M&V toolkit helps in -ting"erifiable *
Csrbon Ofikets of good quality. The Sustainable Development tool helps in satisfying the - - host wuntry goverkentto cdnvince about the project's-caPability to meet the sustahabiiity goals of the nation. When used as a group, these toolkits allow a pioject develom to transform a moiect conce~t (with the uotential to reduce GHG emissions) into a ;able GHG reductionproject whose emissions reductions are wmmoditized a& ready for sale on the open market. The diagram below explains briefly how these toolkits are linked.
' I b i s t o o l k i t a n d t b t ~ o ~ d s m c m t ~ t o ~ ~ r ~ a ~ p r o f ~ w b o i s c q n r i e n c c d i n t h e d e P d o p m c d o f ~ c b m g c mitigation ptvjeas hstlhra dcs-, funmcirl md+s, :mwkaiag ad &si@g a a d i m p t a n c n t r t i o o ~ f m o l l i t o r i n g . a d ~ ~ ~ g n r t i t y ~ f c m i s s i a a reductioaqanprrcindbythemotdptcsdtbadorrtbcmrtcc&oftbe rtdoetioar,nuybescwdyQarngnWiaktbsnccofthc-of. p r o f ~ a r h o b r s a p o v c n b a c k r a o r d o f p r 0 v i d i n g t b a c ~ ~ ' l b c I o o l s ~ d m l o p e d w i t b a v i c a r t o p v i d c a ~ g u i . b o s + a d ~ ~ m c lrsain~ingtbcchcoagy.GHGmiti&~tioaprojcds.TbtLordr&rgaGrorp. ~GEPTamshoagfyrcaaaKods~lrsatowxxsa~fcrdoarlcxpatmordato ~tbeh.pmjataroaptmddaignin&toimpovctbccbrrcsofnrcasin ~bicvinghmdingfortbeb~AssabLBGcrprralyshasifaitsbrl lmtbebcld rcsponsblc for any disputes tht may arise in case of pojacls dcvdoped by using IIICSC toollits.
Computational Tool Kit: Baseline Development
United States Agency for International Development Greenhouse Gas Pollution Prevention Project
Climate Change Supplement (GEP-CCS)
I
ili Fostering Climate Change Inklives for SustainaMe Development
. T
10 i *
~ ~
. ~. . ~. =....*- >. ~
~: :+->-* ~ :
i i i ~. , $.=:4 ;' . -- ;.,v .zZr :,.~.,.m.,;-%. - '~ ~ ~~
i . .. :. . ~. .--. 4- ~ - ~. - - .~ -~ . - .--.:..-. , .:-. -
. .~ ...., - - ~ ~
~ .. . . Task 1C ~om~&tional Tool Kit: Baseline Development
By:
h : The Louis Berger Group, Inc. i C M , Safdarjung Development Area
New Delhi 110 016
f
May 14,2001
EXECUTIVE SUMMARY ........................ - .................................... ......... 1
Intended applications of toolkit ........................................................................... 3 L l n k a g ~ with the othm toolkits ........................................................................... 3 *
2. CONCEPTUAL BACKGROUND ,,-...-....... -... ........ ............ -......".... ...--... 5 . . ~ . . ~
~eihition'and importance of a baseline ..................................................................... 5 ............................................................... Training required for baseline development 5
...................................................................................... Static and dynamic baselines 6 Benchmarking ............................................................................................................. 7
3. IMPLEMENTING THE BASELINE DEVELOPMENT PROCESS ......,-,.,..- 8 ............................................................................ Principles of h e l i n e development 8
............ ............. Project boundary delmation .................................................... 8 . . Critena for data quality ............... : ..................................................... .................... 9 ... ............... ............................................................... Baselme development procedures : 9 Baseline Procdwe 1: CCMPs that disulace mid-generated electricitv ................... 10 - - Baseline Rocedure 2: CCMPs that displace off-grid electricity .............................. 22 Baslline A.ocedure 3: CCMPs that displace t h d &ew generation .................. 26 . . k i i n e Roccdure 4: Methane m v & CCMPs .................................................... 3 1 .&,!.<<.. ...... nation &f jfproccdures to noncaagy CCMPs ; ............................................ 32 . . .
- ~ .... ~ . . -Risk isscsment and nubgabon ................................................................. ; .......... 33 ....... , : , . --- --- ~ --
~ ~
SUPPORTING MATERIALS ,,.-,-...-.--- ".----.--.. -- 34
ANNEX: INTERNATIONAL POLICY DEVELOPMENT ............... 35
CLM 1: Fostaing Climate Change for Sustainable Development Task 1C: Computational Tool Kit
Tabk I: Carbon Cootcnt of Fuels ...................................................................... 17 Table 2: PoaDbhl Sources of Emissions froto Electricity CCMR 20 Table 3: Dirca Global Wuming Potentids (GW) of Sdcdsd Gases. .......-.-----... 2 I Table 4: Potentid Solnces of Emissiom froto T k d CCMPs 29
Agun 1: Ck&ial Rtb Diagnm for B.alioe D c v c ~ ......................................... I Figmr.2: EungkLodDunhboCum ...................................... I4 Figmc 3: Exampk'DDily Lod Profile ..--.---...--..-.-.. YY IS Figmr. 4: Exnnipk Cdcul.tiopS . 19
DISCLAIMER
n i s t & i r n o l ~ t o N 6 0 t i h a e / o r a r g a g i n g a ~ ~ v l o i s a p i e n c e d in the dewlopal of the carbon cniuicmr hawk qfa d u e change mifig&onprojed Ed&hment of a crtdible basdine is &/or On CCMPf. Achieving a mnWk hadime is almnely - f a r m r o i n C ~ . ~ ~ ~ f e m i s s i o n s r e d n c t i o n s ~ a s p m n n l ~ t h ~ ~ a n d ~ b r e * m d t f u b e o f t h e ~ - o n s . ~ b J o m 3 . d o m g m d a d i n * o h r r J l a q f L C C ~ 0 / 0 carbon baseIineprofkimmI who has apmven tmdrawdqfpmviding these spdaIized senicer.
~ ~ 1 ~ 1 : ~ o s t c r i o ~ ~ a n I l g c l n i t u t i v c s f o r ~ k ~ Tulr 1C: Gnqmatiaral Tool Kit
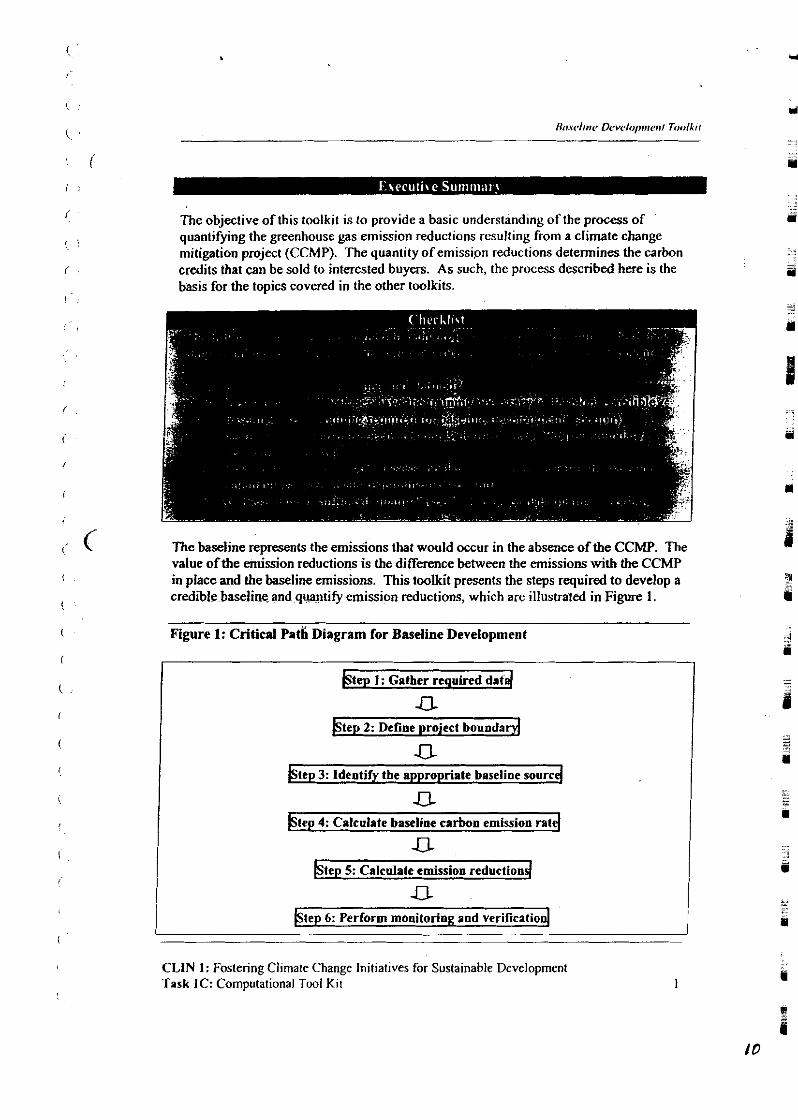
The objective of this toolkit is lo provide a basic understand~ng of the process of quantifying the greenhouse gas emission reductions resulting from a climate change mitigation project (CCMP). The quantity of emission reductions determines the carbon credits that can be sold to interested buyers. As such, the process described here is the basis for the topics covered in the other toolkits.
The baseline rep-& the emissions that would occur in the absence of the CCMP. The value ofthe emission reductions is the difference between the emissions with the CCMP in place and the baseline emissions. This toolkit presents the steps required to develop a credible baseline and quantify emission reductions, which are illustrated in Figure 1.
Figure 1: Critical path Diagram for Baseline Development
/Step I: Gather required data(
n -
/Step 2: Define project boundad
n btep 3: Identify the appropriate baseline sourcd
ptep 4: Calculate baseline carbon emission rat4
btep 5: Calculate emission reduction4
13 btep 6: Perform monitorina and verification]
CLlN 1: Fostering Climate Change Initiatives for Sustainable Development Task IC: Computational Tool Kit
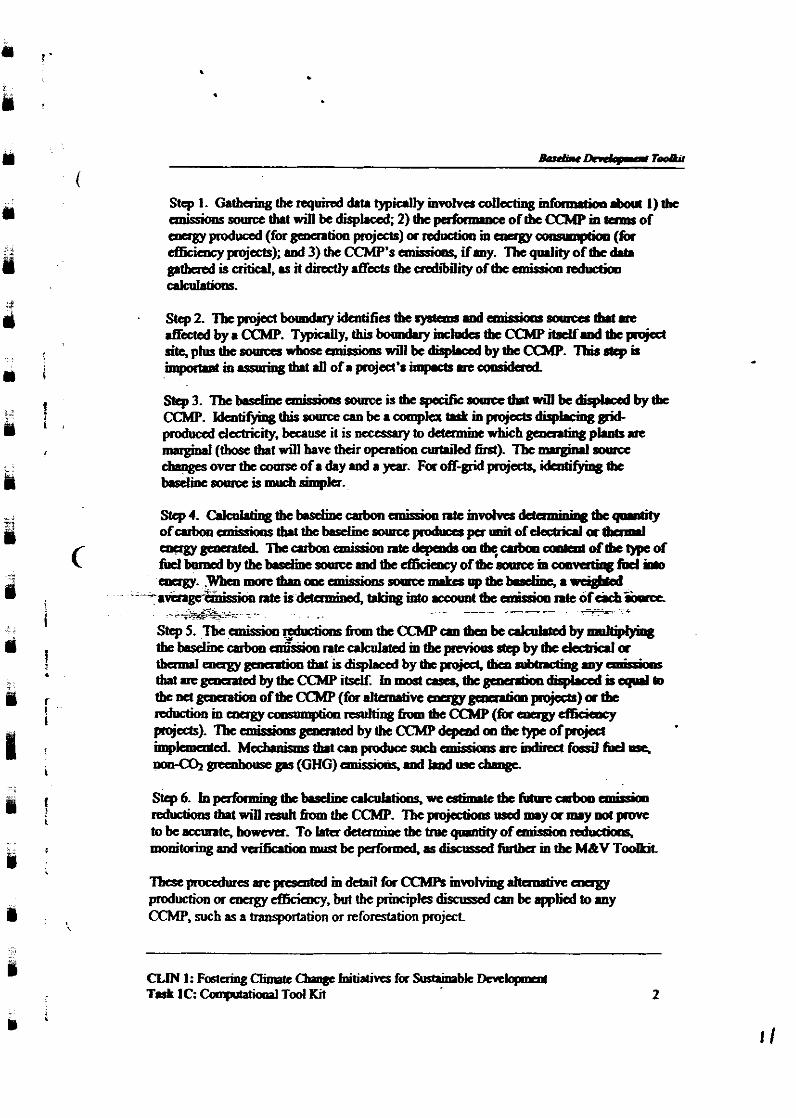
Step 1. Gatbaing tbe required data typkdy iuvoIvcd collating i n f d dua I) tbc cmisionssolmrbtwinkdisp*caf;2)tbeprtammceoftbe~intamsof emEyproduad(forgawnticm~j~)orrtduaiooinaugycanamptica(fa efficicacy md 3) tbe CCMP's ernissku& ifany. Tbc gollity o f I& drt. ~~iscriticll,.sit~.Btdstbedbaityoftbe~rafuctiao
Stcp 2. The ~roject bocmday idaaifics tbe system mid aniniom rotnw tbrt n .ff&tcdbyaCCMP. T y p i a l l y , t h i s b o i m d m y i n c t e d a t h c C C M P ~ d t b c ~ sitc,plnsthesomccswboJtanissiomwinkdispbcsdbytkCCMP. Tliss&ph ~ i m p o l m l t m . s s m i n s t b 8 t . I I o f a p o j & l ' 1 i m p c t s u c ~
St-3. Tbcbasdiuc~sc~mxistbespoci6crrwctbdwinkdirplralbytbc C(h8. Idcn~thisoomaeurka~mpltxPsLinpoj&lsdirphcisggrid- pmhrcatd&tricity,b&nuwit i s ~ t o d e t a m i a w h k h ~ p L a h m c marginal (h b t win hrvc their opaatioll anWd fa). Tbc rrprgirvl nwa c ~ o n r t b e a w ~ t o f a & y d a y c a r . F a o f i - g r i d d - t b e bsdiacsomaismuch*k.
cnaiygmarted T b c a r b o D e m i s r i o o R t c ~ A t k , ~ ~ ~ r m c y p c ~ !itclbmaodbytbeb8sdincsomcemdtbee8Scicocyoftksomam -‘ g f d im eargy. w b a l ~ m o n t h m o o c a n i a r i o n s a w c + q t b e t b e a ~
- - - 8 ~ ~ ~ k ~ ~ ~ v x o m d t b e ~ ~ t c 0 f a c b - ~ - --+*- . ---- - -- *
Steps. T b c c n t i s s i o D ~ 6 m m t b e C C M P c r o t t w k a k o h r o d b y ~ thelmdk~Qltssioaratcalculatcdmtbepcviocrrshpbytbedatriala t b c r r m l c w r g y ~ w i s d i s p ~ b y t h c ~ l b c o r m b ( r u t i o g . o y c m k r a P r thatncgmaataibytbeCCMPirsdf. h ~ m o s t ~ t b c ~ d i s p d i s p h a d k c q P J I ~ tbe nd gaiu8tiar oftbc ClCMP (for .haoltin angy 0-1 pjaa) a tbe ~ m c n a g y a ~ m ~ 6 u m t b e C C M P ( f a a u g y ~
~IbeemipsiOmbythcCCMPdcpcadoatbetypcofpojac hnpkmcntcd M~wcl l lproduccsuebaniss iamrrt iodiIcufoari f ! i tc l t lq m o C O l ~ g . s ( G H G ) a n i s s i o m . d h r d u s c c h s s B r
lbcstpoaduresarcpcJamdin~lforCCMP3mvolviaglhcmrtivcangy ~011orcaergycfljeicacy.butthepiocipksdisclmtd~kappliadto.ny m, sucb as a baosprtation or reforestation project.
CLIN1:FogcringClioPtc~hitiaIivcrfaSuminaMcDcvclopmm T d IC: Compl(rtiocnl Tool Kit
Intended applications of toolkit
This toolkit d m % the essential elements and steps for baseline calculation procedures to be applied to climate change mitigation projects (CCMPs) in India in the energy genemtion and encrgy efficiency sectors. This toolkit is intended only as a road map by which the Climate Change Centers (CCC) and the CCMP developer can gain a strong conceptual undershdng of the baseline characterization that must be established for the projm.
t
The pnxedure-s in this toolkit apply to two broad project typs: 1. Alternative energy production, in which a less carbon-intensive m e
( m a b l e s , natural gas, etc.) is used to gmmte electric or thermal energy 2. Energy efficiency, in which electric or thamal energy consumption is reduced
Both project types can displace carbon emissions b m four different sources: 1. Grid-generated electricity 2. Electricity p$nemtcd off the grid 3. Thermal energy generation 4. Methane sources
Other nokeaergy project types, such as haqmtation or *-use CCMPs, are d e m i in a g c a d way hae. Specific @&mat of such project types is not provided, but the basiiprincip~& p r ~ d bat establish tbc gm&ork f&perfo& baseline d y s l s of such Di?f&.-. it is anticibated that case 'mlcrials based on ~roiects under ,
dkvelo&&t ~ k d i a may be prep& as p~ of i e testing of this took; : > - ~ .
n - 1
Linkages with the other toopits ~. . .
llis Baselime TWM~ is closely linked with the Monitoring aud Verification (MgrV) TooIkit and it provides n&essaryinput to the Sustsiorble Development, Carbon Finance, and Marketing a;nd Funding Toolkits. lie Baseline Toolkit develops the procedures for determining the baseline carbon emissioo rate and quantifying the emission reductions resulting h m the CCMP. The M&V Toolkit identifies the parameters that must be monitored to update the baseline calculations and determine the achial CCMP performance, which will allow the quantification of achtal reductions. The M&V Toolkit presents the p d u r e s for this quantification, which are those included in the Baseline Toolkit. In developing the baseline, there is risk that the baseline does not accurately predict the actual emission reductions hat will occur. M&V addresses this risk, assuring that the buyer of carbon credits gets what they pay for.
The Baseline Toolkit provides necessary input to the other three toolkits. The emission reductions calculated m this toolkit are one yardstick with which to assess the project's environmental sustainability, as discussed in the Sustainable Devefopment Toolkit. They
CLIN 1: Fostering Climate Change Initiatives for Sustainable Development Task 1C: Computational Tool Kit
alsodct&thequrnt i tyofurboacdttchtaobehdcd.~naaeazslry praajuisite to the Carbon Fmancc ad MnLctiqs ad F d n g Toolkits.
c L i N 1 : F o s t a i n g ~ ~ h l i t h t i r e s f a ~ D e v t l a p n e d Task 1C: Compaatiooal Tool Kit
Definition and importance of a baseline
CCMPs imalemented in India will d u c e reductions in &use pas &ions. A distinguis~ng feature of such projdcts is that the commo~ly they pGuce, emission reductions, are. unobscavable, as they an the difference between the emissions with the CCMP in place and the emissions that would occur in the absence of the CCMP. To quantify a project's emissions reductions, it is necessary to w n s t ~ ~ c t the hypothetical baseline, the emi&ions that would occur in a business-as-usual scenario.
Internationally accepted standards demand that selected CCMPs have a credile, qwtifiable and verifiable baseline of emissions, h m which reductions can be measured dverif ied. The establishment of the baseline is the key step in determining the extent to which a CCMP satisfies the requirement of additionaiity under the market based mechanisms relating to carbon-reduction trading regime.
In the absence of a standard baseline set by regulatory authorities, for example a technology standard, baselines must de&mhcd on a project-specific basis that is reasonable and verifiable. The first step for identifying a project-specific baseline is to determine the "system boundaries" within which the GHG emissions are calculated. The svstems boundarv. for exan~~le. mi& be all electricitv generated in a regional mid . - jstcm into whicha renewable energy project feeds, A o p W d to the i t i r e naiional grid Individual CCMPs inbercntly displace the emissions of diaaent sources, depadhggon the type of project and its location in the country. 'As a dt, the system bodarymust be carefully chosen to ensure that the baseline accurately characterhs the w o n reductions h the CCMP. . .
For energy sector proj& considered here, net emission reductions for CCMPs are calculated on the basis of the carbon content of the fossil fuel replaced. Thus, the principal elements that determine the amount of reductions include:
1. The baseline carbon d o n rate 2. The project's energy production rate (for generation projects) or reduction in
energy consumption (for efficiency projects) 3. The project emissions (if any)
These elements must be quantified and measured in order to accurately calculate a CCMP's emission reductions.
Training required for baseline development
For energy sector projects, baseline preparation must typically be performed by individuals with formal training in engine~ing or the physical sciences. Project baseline assessment requires an understanding of the combustion process, for example, and
CLIN 1: Fostering Climate Change Initiatives for Sustainable Development Task 1C: Computational Tool Kit 5
h r g m a J t h c m c x c ~ t i v c a ~ i s , t b e m a c ~ c . r r m C d cmissiooductiommersmcda&stii B m ~ o f n p i d l a d ~ i n d e v d o p i g ~~rmtries,tbetrrnd(mdrtobcthtgridgmartiqBapcityapmrioclb.Pccmnodrecd by ddiag subs!anbal thamal capacity m dditioo to my new byim capcity tb.1 is a ihblc . Ovatime,tbcoewtbmndapnitYtadstohmrponncmaccfficiQt ~ l o g V l o g V T h ~ o v a t i m e , t b c ~ w o f t b c m n g i D l l ~ . n c ( s l c n d t tortiminich
F o r p p c t r ~ b n g r r p o p a l i v e s , d y l P m i c ~ . r e t b a c f a c ~ m a c crcdiWe.ndrobrrdtbnmticbrstiag PmjeckwiUtvitbecyckamacirtodOffPa ' s a l a c o l r m d s o f k a r t b r a f i e ~ w y k R . . o l p M e ~ f a = o f a W slaticbwlinc. ~ w i t h l w g a l i f a c y c k r a ~ s r l c s c m b . a t a m S d a n o c i . t e d O f f s t a l c P l r t i a a p c r i o d s , d k ~ y h l l i q g a + ~ tht d c c & for example, cbaoges (rahdam) m tbc urbcm mtcmity of dcctricity gcacntioorsawbdcinladLL
. . R c g n d l c s s o f w t n t t y p c o f b r s e l h w ~ d o p t o d , o n c o f t b e m o s c ~ ~ . . is thrt it bc prtdic(able. Uocxpatrd cb.qga in tbc basdk, jpsl like t-8 c b s D g e s m ~ ~ t a a o t h a a r r w m i c ~ c q c r a t c r m m * r i s t m d ~ m th project and ~ C I U buym of Offsets aod o k investors motibxxtcd by climalc dtmgc objc4VeS.
BPIclfne Development Twlhir
Bencbmarkhg of d n kinds of technology can serve as a simplified baseline for any subsequent pmjects in that scctor, including CCMPs. For example, the associated ductions of enagy projects can be measwed againsi a best or least& ttcbnology benchmark such as combined-cycle natural gas generation systans. Any subsequent projects that exceed the anissions of that benchmark on a per unit based (i.e. tonncs of C@ per MWh), would have to mitigate their emissions, and other projects that performed better Qan the benchmark would receive credits for their activity which they could then sell or trade.
CLIN 1: Fostcriog Climate Change Initiatives for Sutzinable Development Task 1C: Computational Tool Kit
This section begins with a xlf-evaluation c k k t i a for project dcvdopcrs. Nab the section discusses several general principles of baseline development. F i ~ l l y , the section provides detailed pmcedures for the development of a baseline. The spccifs p m e d u m depend on the typc of project. so the procedures are'debiled for selected pmjd types. The application of these pmcedum to no~nagy CCMPs is also d i s c 4 in this sxlion.
Rinapks of basdine development
In onkr to proceed with the quantification of the baseline scenario for CChBs. we nad to specify the basic priyiptcs, or decision NIL?& by which the baseline scenuio will be defined. Once we have stated these priociils, we csn define ihe analysis required to identify the M i n e -tion s o m a . Then we e m detenninc the anrrspondtllg baseline carbon emission rate against which che CCMR shouM be cwnppcal u, determine aet emission reductions. Fimlly, we will need to consider the updating of these estimates in the future, as an input to the monitoring and venficatioo (M&V) p h .
The delineation of project boundaries is an impatant step in the devclopncat ofa credible projat baseline. The project boundary idcntifm the synans and cmirniom sources that are aHected by a CCMP. Typically, this boundary includes the CCMP i tslf and the project site, plus the sources whose missions will be displaced by the CCMP.
Indirect emission impacts can m l t h project mnsmction, trPnsporcltion of nutcrials and fuel (at 1-1 in the baseline), and ocher upstream or downstream activities. The CCUP's effects should be carefully evaluated to identify any such emissions s o u m a so that hey may be included in the project boundary.
CLlN 1: Fortering Climate Change l~t~ativcs for Sustlinabk Development T ark IC: Computational Tool Kit
Criteria for dat. quality
Data quality is crucial to the construction of a defensible and robust emissions baselide. This is -iallv true in the context of creating a baseline that incm~~zatea antici~ated cbanges tmi.&ions levels, or, in the case of benchmarks for specikc sectors, &ble anangements for updating the benchmark% It is generally easier to obtain aedible data for fuel switching irojc&, where the data sources are typically the project developer itself or its client - which may easily be protected by a confidentiality agreement covering m'tiveunformation - as well as independently verifiable measurements of the , carbon wntent of fuels. However, it is generally much more diflicult to obtain quality
-, data on electricitv omduction since the muirad information (total ncnaotion. fucl consumption, dispatch ordering for indiviiual plants, etc.) is bfkn &~~trolledby state- owned utilities wncemed about divulging such information or private companies that consid- the data commercially sensitive- A- to such current data on a regular basis . may be beyond the capabilities of any given project developer, requiring cooperation with government and sector organizations.
Data quality dL&tiy affects the credibility of the baselime emissions analysis and thus, the quality of the Offsets produced by a CCMP. The data tbat form the basis for the definition of CCMP baseline emissions must be acquired h n a credible source. For an electricity-gxmating CCMP that displaces grid electricity, these data must ultimately be
c athibutable to the o r e t i o n having ownership of the baseline equipment (such as the dectric dtility) or the orgmhtion having &tory ovasight authority over the baseline '&pipmmt(such as the electricity Rgulatory wmmissions).
..- ;'.. . . . .
w.': : "*$<'.i-'-"'l:~:<-.̂ -;, .. : - -20r'cxample, for a CCMP that affects the efficiency of on-site mcrgy-genmting
equipmqt, such as a wood wastbfired cogamation project, b&jgBdata_mug be daival h a site survor during which the baseline e n m cauiument is audited a d anv - - . . . aacssary marsurements are made. Similarly, end-use eneqy efficiency CCMP requires baseline data that are acquired during a site survey that includes an audit of the baseline equipment that will be affected by the CCMP. Such an audit involves making @tic rnamements that are required to quantify the energy savings attributable to tbe efficiency CCMP. Emissions baselines for 4 -use eficiency projects often also require '
analysis of off-site equipment, such as the case in which the energy efficiency project reduces tbe amount of grid-supplied electricity consumed by the host tkility. In this case, the emissions intensity of the electricity generating equipment supplying the grid must be quantified in order to establish the O&ts attributable to the energy efficiency p rs jd
Baseline dcvdopment procedures This section presents the calculation procedures used to quantify emission reductions from selected alternative energy generation and enagy efficiency CCMPS.' These
' Published calculation procedures oftm include the effect of incornplde carbon oxidation in cbe mdnmion of fossil fuels. L th2procchus presented here, this effect is not iacludad, baauoc it has a minimal impact on the anal& (typically I% or las).
CLIN 1: Fostaing Climate Change Initiatives for Sustainable Development Tuk IC: Computational Tool Kit
ul~u~atiorrswil~d~padoa~sollrcc~whicbcmisd~nrtd~.ndirplra~ AS such, three poadunr .n prcseaod, e r b for a diffarat CChSP h/pe:
A f o m t b p o e a h a c i s ~ ~ f o r ~ t h t ~ ~ a t h r r m l a m g y b y b u r n i q e m d h m c m v c n d ~ f a ~ a c a l ~ h D d f i l l a a g r i i b e i l i t y . T b a t ~ r r c o v a y p 0 j c c t s r t d u c c ~ ~ - m two Fird, tby reduce cmboll dioxide anikms by &@dug dahicity a tbsrmlgaation6mm-bsdincnwa.~crrboaQdsPorsdPctiaor.rr ~usingB.st l intRoadureI .2 ,a3 ,u .ppropLtr Sccody,mdm~ rrcovayprojcctsrcducethcemissioruofwch.ne(a~p)byborniqgtbc ~ m a g e w s t o r . ~&cmissionrcdudiom.nqnmtificdnrisg Bascline Roocdure 4.
stqII:c.tharaqdrald.(. l b i g ~ ~ t b c d u . m p I i m i t o a k o k t c t b c a n i n i o a ~ 6 m m a a 3 M P & t d i s p L c c s ~ c k 4 x r k i l y . * S r c p s 2 t o 5 T o r f l u t k ~ o f m a c d m Fromachg ~ ~ ~ g a o m a i n U x ~ @ ~ & t c d b y I & C C M P p o j & S t b c fdlowiag infomation is q u k J (both cunart and pmjadcd hiblrr data). This is Pcqnirsdfacdstingphtsuanllurbos~~paetcdtobcddcdmtbt~
- -crprcitym - --ga#rtioam) - Type of hd mal for aeb p h t - ~hr t~ te (GJm)wpLntnct lhanv le f f ic iavyOC)orpLol .nrmlTud
eorrslmption - Dkptcbing orda, if aniLbk
Tbt fohwing information on the electric grid i s useful if available (both c m m t ad pojadcd future data)
CLJN 1: Fostaiog Chiale amngc htithtins fa Sustaimbk DMlqmd Task 1C: C- T d Kit
- Load duration curve - Typical daily load profile - Projected demand growth rate (%) - Schedule of plant additions and retirements
For the C W , the following information is necessrry (both cumnt and projected future data)
- Installed capacity 0 (generationpmjects only) - Annual eldctricity gumation (MWh/yr) (generation prqiects only) - Reduction m rrmual elechicity consumption (MWWv) (elpcien~yprojecfs only) - Type of fuel used (thermalplants only) - Plant heat rate (GJ/MWh) or plant net thermal efficiency (%) or plant annual fuel
wnsumption (GJtyr) (thetmalplonlr only) - Emissions gcnaated by CCMP (t Uyear)
Step 2: Dc6ne project boundary For a project that displaces grid-generated e l h c i t y , the project boundary will anompsss the project site, the existing electricity generation and transmission qstem to which the project will be mtmonnectcd, and the fu!ure generation and tmn&ssion facilities that may be added to the existing grid.
currently, state electricity boards (SEBs) opeaate electric grids m various states that y of one anotha. ~owev&, these states am grouped in
Thus, the projects' bonadaly would cunmtly be considered as the specific region in whichBg.WMP is being developed As and when the national grid is completed, and . ---> . - power bansfa takes free& aatio&ide, the project's boundary would expa& to include the existing and futurebtricity generation and transmission system for the entire national grid.
Bcca& of this potmtial futme cbange, special attention should be paid to the composition of the electric grid To cmshuci an accutate baseline, it will be critical to identify the specific g& plants that are affected by the project.
In India, most state electric systems are amposed almost exclusively of thermal plants, but several states Qex& Himachal Rakh, Meghdaya, J a m u & Kashmir, Orissa, and Kamataka) do have signi6cant hydro capacity. As a result of the different resource bases of the different regional grids, the marginal source(s) displaced by a particular CCMP, and thus the emission reductions of the CCMP, could be very different depending on its location.
2
Step 3: Identify the appropriate bwciine source To quantify emission reductions h r n CCMPs that displace grid-genexated electricity, it is h t necessary to identify the baseline generation source(s), or the source(s) that will be
CLIN 1: Fostering Climate Chaugc Initiatives for Sustainable Development Task 1C: Computational Tool Kit 11
Bareline Development Toolkit
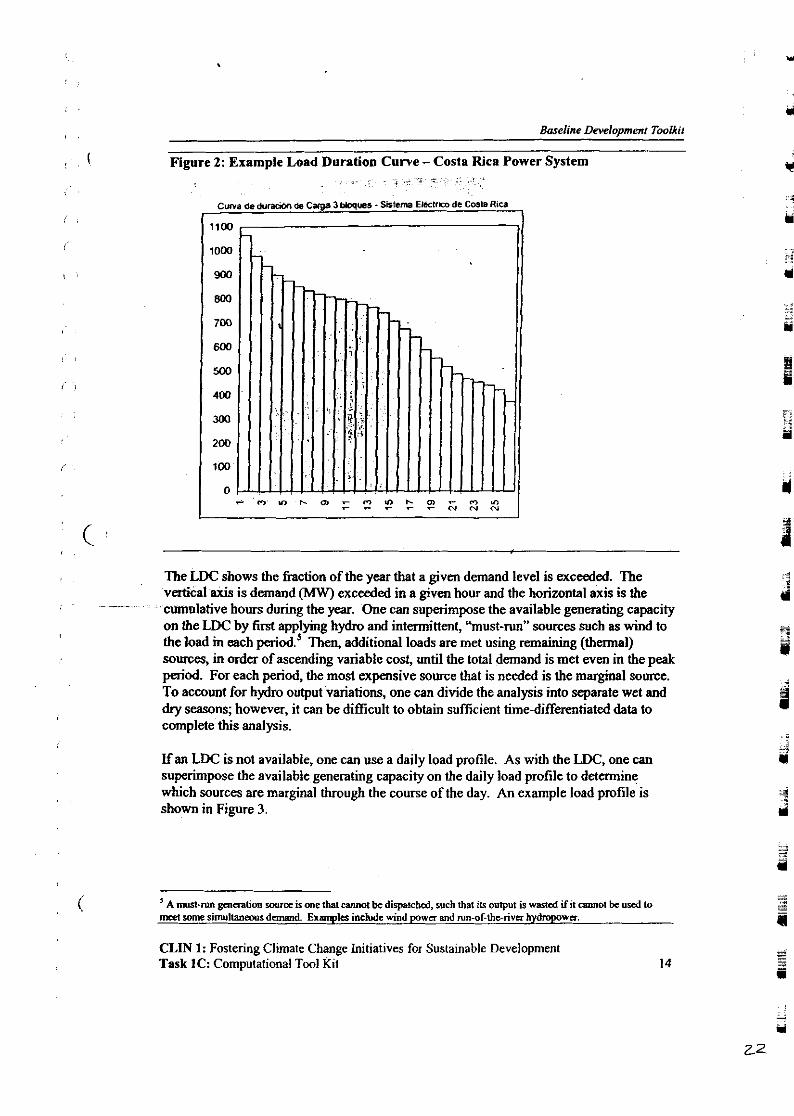
, ( Figure 2: Example Load Duration Curve - Costa Rica Power System
The LDC shows the fraction of the year that a given demand level is exceeded. The vertical axis is demand 0 exceeded in a aiven hour and the horizontal axis is the -
- -- cumolative hours during the year. One can superimpose the available generating capacity on the LDC by first applying hydro and intermittent, "must-run" sources such as wind to the load in each Then, additional loads are met using remahmg (thermal) sources, in order of ascending variable cost, until the total demand is met even in the peak period. For each period, the most expensive source that is needed is the marginal source. To account for hydro output variations, one can divide the analysis into separate wet and dry seasons; however, it can be difficult to obtain sufficient time-differentiated &la to complete this analysis.
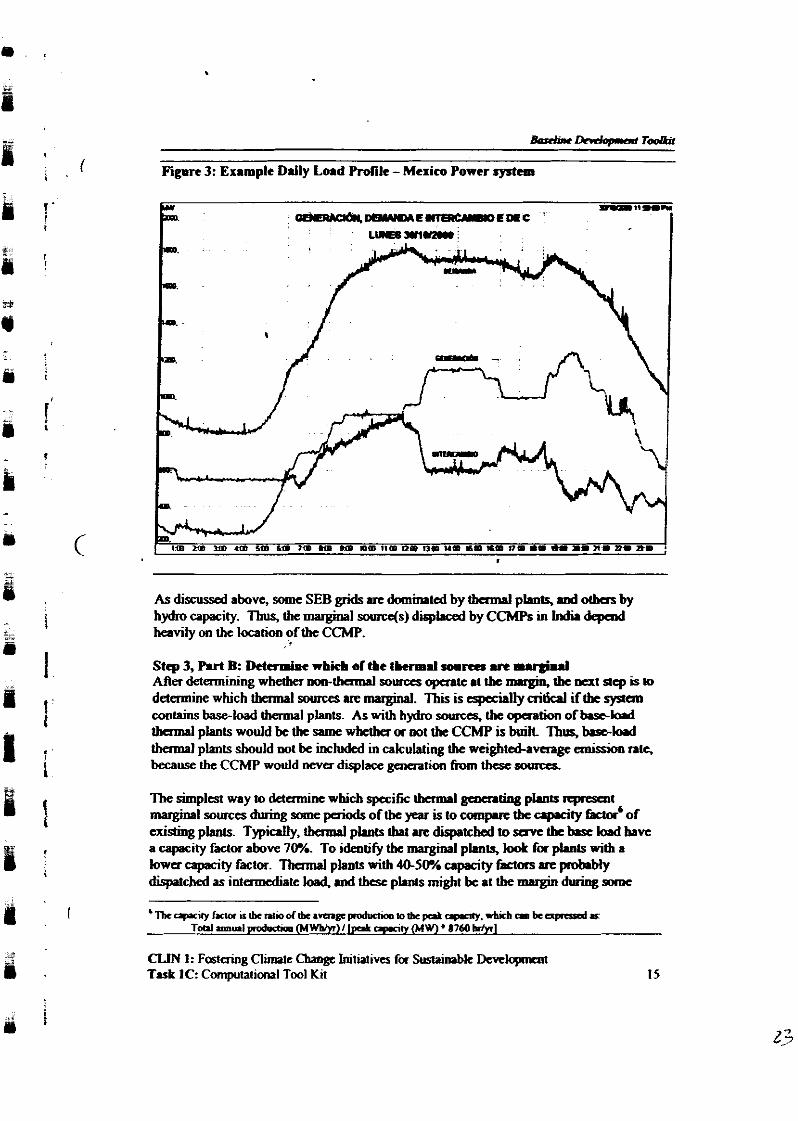
If an LDC is not available. one can use a dailv load ~rofile. As with the LDC. one can superimpose the available generating capacity on the daily load profile to determine which sources are marginal through the course of the day. An example load profile is - - shown in Figure 3.
A muzt-nu, p a a t i o n mrec is one thst CMW~ bc dispatched, such that i output is wmed ifit c m t be uwd to mcd rome simultaamus d-d. ExmpIa include wind pow= and run-of-theriver hydnyowa.
CLIN 1: Fostering Climate Change Initiatives for Sustainable Development Task IC: Computational Tool Kit
~Dndop .a t rooRi l
Figure 3: Example Daily Loakd M l c - Mexico Power system
As discussed above, sow SEB grids m duniited by tbamal phnts, md olbas by hyQo capacity. Thus, the marginal scnrra(s) displuxd by C C M P s in India dcpad heavily on thc laation of the CCMP.
, '9
Stcp 3, Part B: Lktaminc which of tbe lkwd sommr ue m u g i d After &mining whdbcr noo-cbcrmal sourccg opaalc at ibe magin, tk ncxt step is to determine which thamal swrccs m marginal. This is especially aitlcll if tbe ~ y a c m coolains base-load thermal plants. As wirh hyQo swrres. ibe opaation of b b . d thamrl plants would be the same wbdbcr a mt the CCMP is buil Thus, bled thennal plants should mt be included in cakulating the weighted-avargc aoissioa nlc. because the CCMP would never displace g-fkm from thes sounrs.
The simplest way to ddcmrinc which specific thermal pmating plants marginal sources during sow p d of the year is to ~ompuc tk apvity hdor' of existing plants. Typidty, lhanvl plants that m dispatched to s a w tbc bnt load have a capacity factor above 7W.. To identify tbe marginal pLur~~, imt f a plmts with a bwcr capscity factor. Thamal plsats witb 40-5o.h capacity fzcIors m probably dispatched as intcrmcdiab load, and thtsc p b s might be at the mugin during mmc
CLIN I: Fartniog ClimaIe Chaogc Iniliarives fa Sumimbk Dcvclopncnt Task 1C: Computational Tool Kit
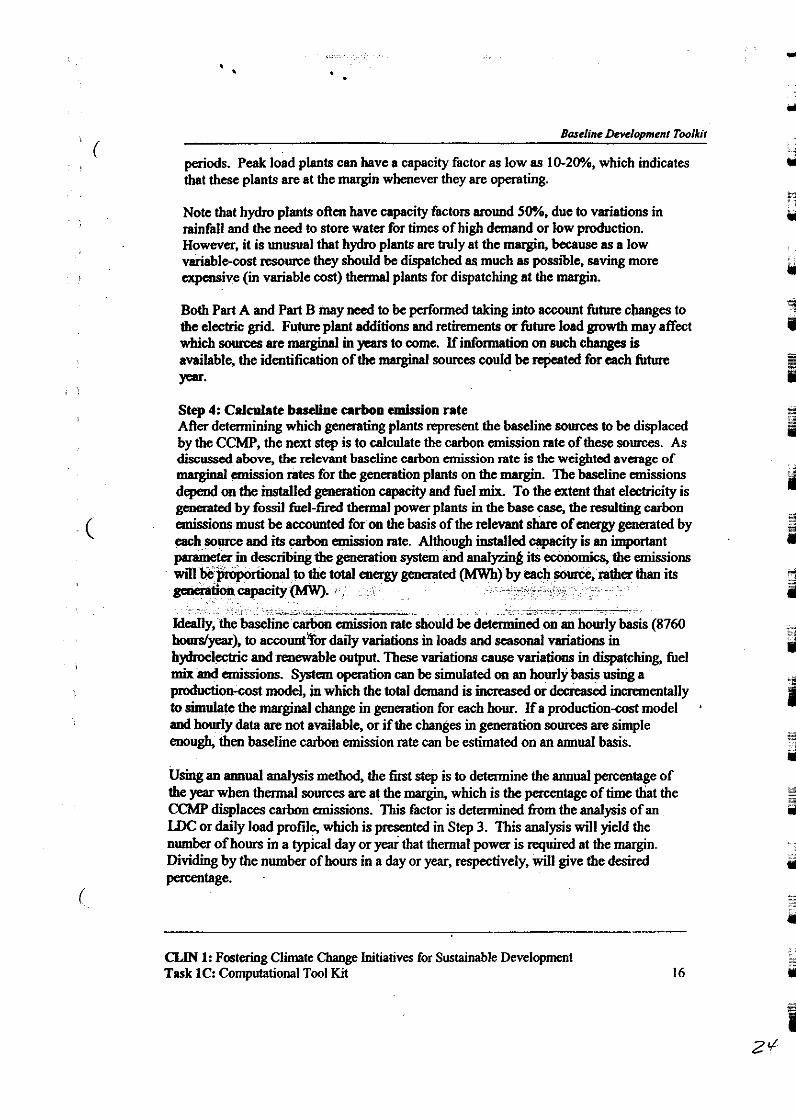
, periods. Peak load plants can have a capacity factor as low as 10-20?4, which indicates that these plants are at the margin whenever they are operating.
Note that hydro plants often have capacity factors around SO0/., due to variations in rainfall and the need to store water for times of high demand or low production. However, it is unusual that hydro plants are huly at the margin, because as a low variable-cost resome they should be dispatched as much as possible, saving more expensive (in variable wst) thermal plants for dispatching at the margin.
Both Part A and Part B may need to be performed taking into account future changes to the electric grid. Future plant additions and retirements or future load growth may affect which sources are marginal in yean to wme. If information on such chaages is available, the identification of the marginal sources could be repeated for tach future year.
Step 4: Calculate baseline arbon emission rate After determining which genmting plants represent the baseline sources to be displaced by the CCMP, the next step is to calculate the carbon emission rate of these sources. As discussed above, the relevant baseline carbon emission rate is the weighted average of marginal emission rates for the genedon plants on the margin. The baseline emissions depend on the installed generation capacity and fuel mix. To the extent that electricity is genaated by fossil fuel-fired thermal power plants in the base case, the resulting carbon
( emissions must be accounted for on the basis of the relevant share of energy generated by each source. and its carbon emission rate. Although installed capacity is an impottant pmme!er in d m i i n g the generation system and analyzing its eco~~mics, the emissions will be pmportional to the generated its s==tioncapacitym.
. -.-.-----. ~. . .~~~. .~ . .~ . . . ~ . . m m o n rate should be determined on an hoily basis (8760
hom+ar), to account%ior daily variations in loads and seasonal variations in hydroelectric and renewable output. These variations cause variations in dispatching, fuel mix and emissions. System operation can be simulated on an hourly basis using a pmduction-cost model, in which the total demand is increased a deereased inmimentally to simulate the marginal change in generation for each hour. If a productioncost model and hourly data are not available, or if the changes in generation so- are simple enough, then baseline carbon emission rate can be estimated on an annual basis.
Using an annual analysis method, the first step is to determine the annual percentage of the year when thermal sources are at the margin, which is the percentage of time that the CCMP displaces &n emissions. This factor is determined h m the analysis of an LDC or daily load profile, which is p-ted in Step 3. This analysis will yield the number of hours in a typical day or ye& that thermal power is required at the margin. Dividing by the number of hours in a day or year, respectively, will give the desired percentage. .
CLIN 1: Fostering Climate Change Initiatives for Sustainable Development Task 1C: Computational Tool Kit 16
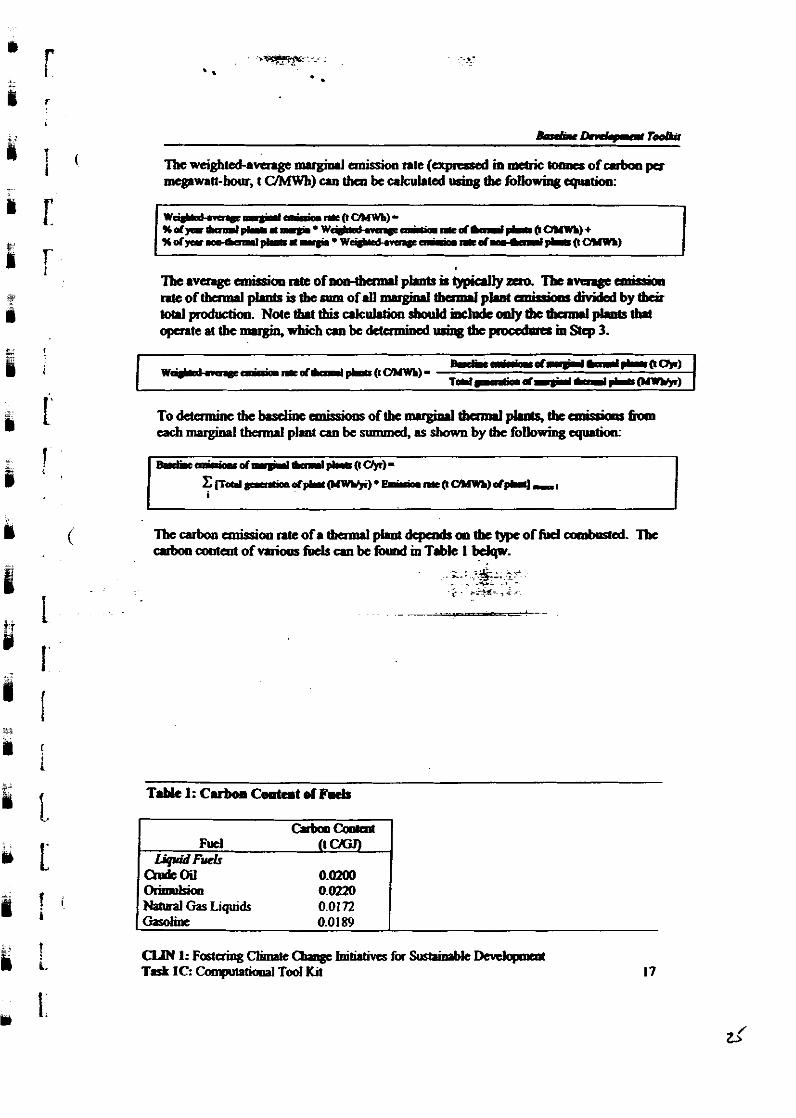
'Ihc weighted-anngc mugrml anission nte (nprrssed in mcbic tolmcs of & per ~ ~ n - h o l r r , t UMWII) cm th- k clfcuhted tgi~g tbc fdlo- ~ t i o ~ :
' I h c a v e n g c ~ n t e o f m m ~ p L n t r h ~ s r m 'Ibc-eminioll ntc of t b d pl.ats is tbe nrm of .If m q i d t b e d plvrt ankhns divided by tbcir tohlpductian. Notctbrttbisakul~sbwldiDChdc~mCtbarml~tbrt o p c n t e a 1 t b e ~ w h i c h c m k ~ l g i q g t b e p o c O m n e r ~ S l e p 3 .
~~ Fud It Cx3-J
LigddFvcLr (lidcoil 0.0200
0.0220 ~ a m a ~ GU ~ i d c 0.0172 easohc 0.0 1 89
each plant. In addition, if upgrades are plmed for any plants, these may incmsc their efficiency, so projected future heat rates would be used. With this pmjated information. the weighted-average marginal mission rate for each future year can be estimated. This is a critical step in estimating future emission reductions ftum the CCMP.
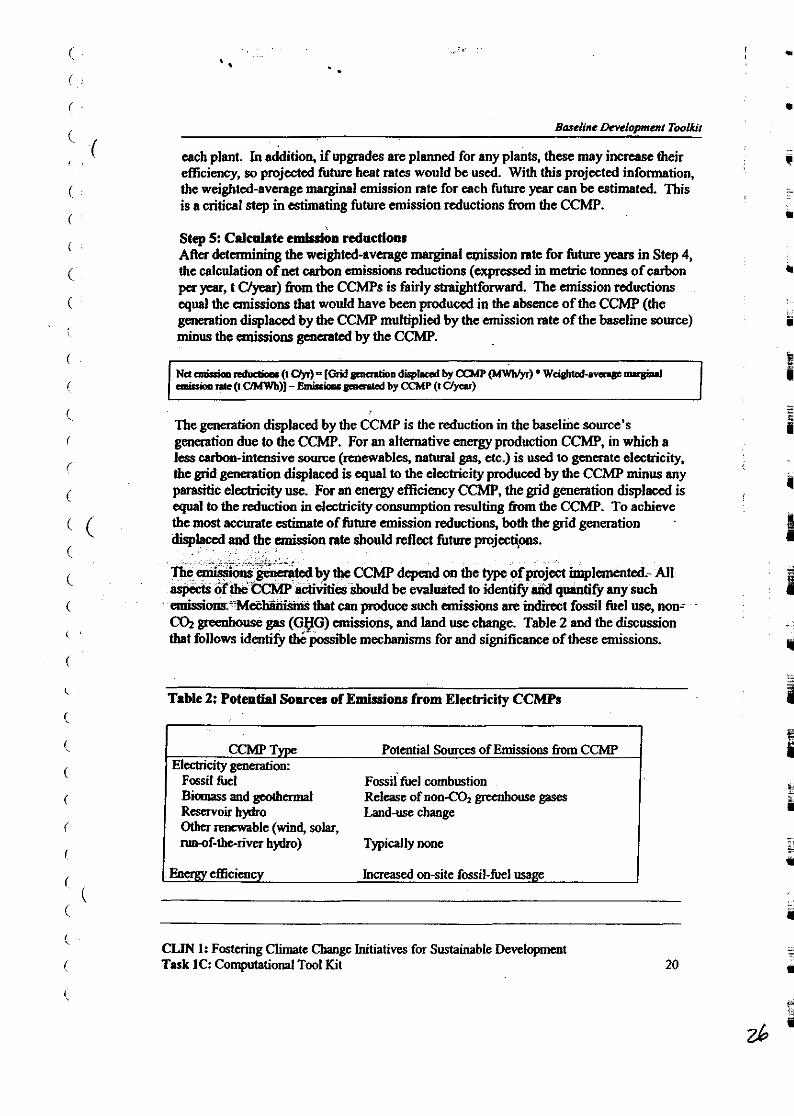
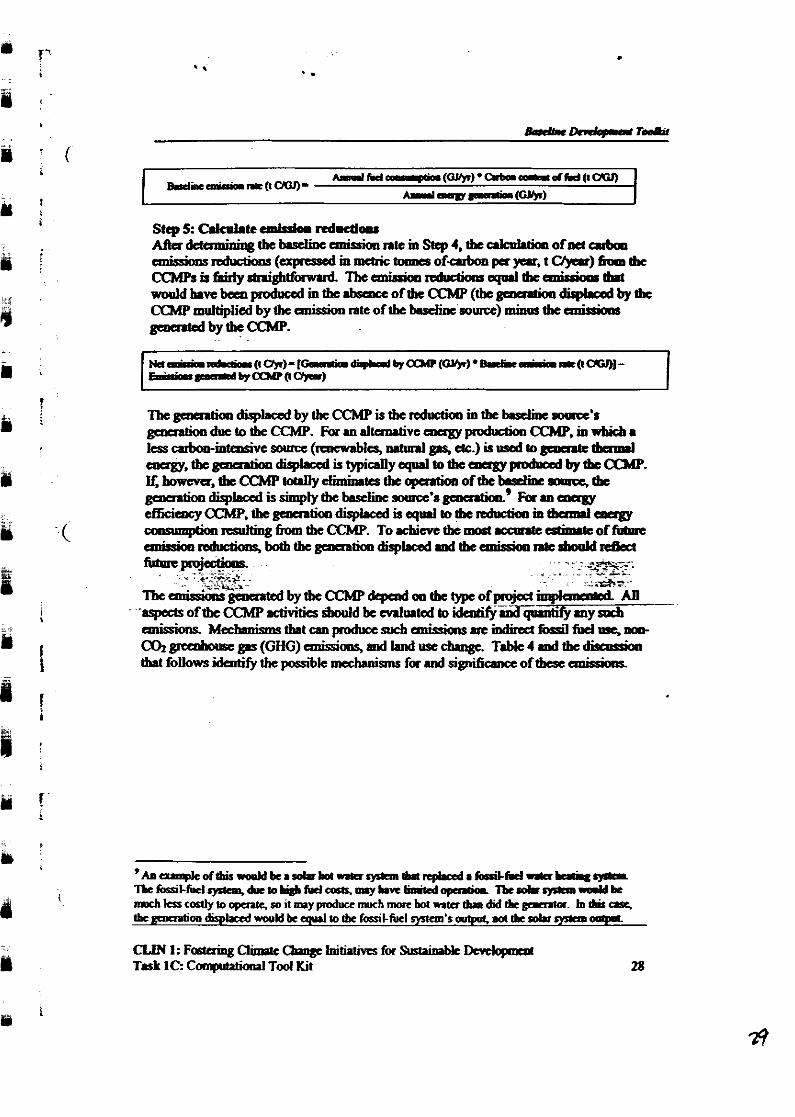
step 5: ~a lc t lk te emissikm miredoctioar After determining the weighted-average marginal emission rate for future years in Step 4, the calculation of net carbon emissions reductions (expressed in metric tonnes of carbon pa year, t Uyear) fmm the CCMPB is fairly straightforward. The emission reductions equal the emissions that would have been produced in the absence of the CCMP (the generation displaced by the CCMP multiplied by the emission rate of the baseline source) minus the anissions generated by the CCMP.
The generation displaced by the CCMP is the reduction in the baseline source's generation due to the CCMP. For an alternative energy production CCMP, in which a less carbon-intensive source (renewables, natural gas, etc.) is used to generate electricity, the grid generation displaced is equal to the electricity produced by the CCMP minus any parasitic elechicity use. For an energy efficiency CCMP, the grid generation displaced is equal to the reduction in electricity consumption resulting fmm the CCMP. To achieve the most accurate estimate of future emission reductions, both the grid generation displaced and the emission nte should reflect future projectipns.
_ , _., T6e emissions genaated by tbc CCMP depend on the type of pmjecl implemented. All aspects of the CCMP activities should be eduated to identify and quantify any such &wcr~ec&sms tbat can produce such emissions are-&t fossil fuel use, now -
C9 greenhouse gas (GYG) emissions, and land use change. Table 2 and tbe discussion that follows identify thi p i l e mechanisms for and significance of these emissions.
TaMc 2: Potential Sollrcea of Emissions from Electricity CCMPs
CLIN 1: Fostering Climate Change Initiatives for Sustainable Development Task 1C: Computational Tool Kit 20
.
CCMP Type Potential Sources of Emissions fium CCMP Electricity generation:
Fossil fitel Fossil fitel combustion Bianass and Release of non-C02 penhouw gases Rrservoir hyko Landuse change other rennvable (wind, solar, nm-of-the-river h y h ) Typ~cally none
Energy efficiency Increased on-site fossil-fuel usage
- . sitecogaKRtioop&jca. ~ b c s c e m i f f i o n r - - d a l e o ~ t c d b ~ ~ t b c c d c a emission ntc of& p l d (t UMWb) by tbe W'S mDorl garortioo m).
CCMPamwtprtrcdsdin-&(~dki~ lbcrcpom;hrrranbc&m .
UNEP/OECDlEMKX 1996 md World Bmt 1998.
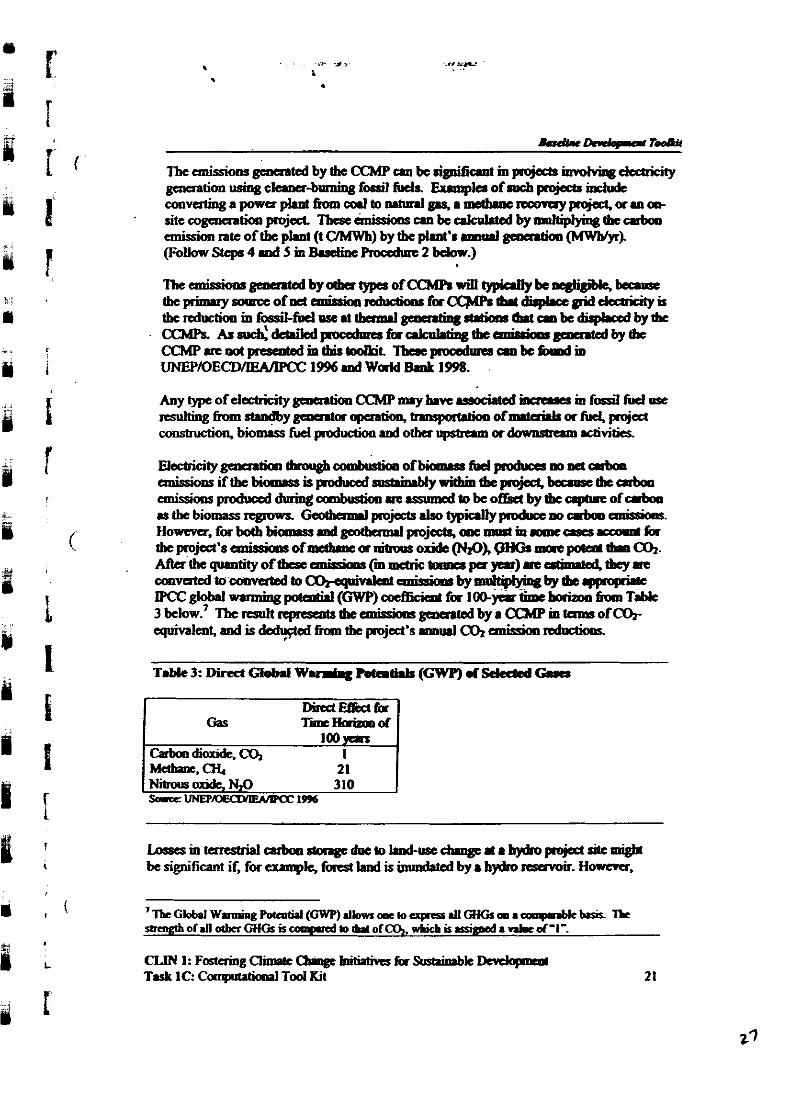
c m i s i o m p r o a u a d c h a i o g ~ r r e ~ t O b c ~ & b y t b c ~ ~ f c r b o c l rs the b i i Gcotbarml projects .Lto typically produce m crbocl cmissiom H o m a , f a b o t h b i a m r s s 9 d g e o t b a r m l ~ o c ~ i n * r m c c g t s v r o r m t f a t b c p r o j c d ' s ~ o f m c l h m c a ~ o x i d e ~ ~ ~ W - p a r a t t b . n ~ . U t a ' t b e a t u u ~ v o f t b c s e ~ f m ~ ~ a r ' ~ . f ~ P e a d i n a t r A t b C Y a m
I DhaU&dfa Gas Ti Horiamof
Losscsin~carbmsomgedoe(ohDd-usccfPngc~ahydropojod&migti l be significant if. for cxmpk, foid kid is ~~ by 8 hydro nssvoir. H-.
CLIN l:Fc6taiugCLimatcC%mgc6r6timvaTor~kDevdopmmr Tulr 1C: Cmpdltiooll T d Kit 21
data. From the generating source(s) affected by the CCMP projecl the following information is required (both current and projected future data).
- Annual thermal gmeration (GJlyr) - Twe of fuel used for each source - so'- net thermal efficiency (%) or source annual fuel consumption (GJIyr)
For the. CCMP, the following information is n& (both current and projected future data)
- Annual thqmd generation (GJ/yr) (generation projects only) - Reduction in annual thermal mergy consumption (GJ/yr) (&idencyprojeds
- Type of fuel used (generationprojecIs only) - Source net thamal efficiency (%) or source annual fuel consumption (GJIyr)
(generation projects only) - Emissions generated by CCMP (t C/year) .
Step 2: Define project bonndrry For a project that displaces thamal mergy generation, the project boundary is typically compact. In thcse cases, the boundary includes the project site and the equipncnt that generates the tbamal energy.
Step 3: Identify thc appropriate b a d h e source Because thcn are anly one or a few maat ion so- in a CCMP dimacing thamal cnagy *ti,&, tbc baseline sour& is easy to identify. It is simply ibc . s- . . wbase 0utputtbc'~wiidisplaCe. . . ., . . :. ~s+:- 'E? . .=.~ ~ . , . l . ~~ ~
! -- A ~:. . ,~ -?SF: .~ - ~
~~ ~. ~. . .,. . -.
-te basdine a r b o n emidon rate next step is to d a d a t e the carbon emission rate of the baseline garemtion source.
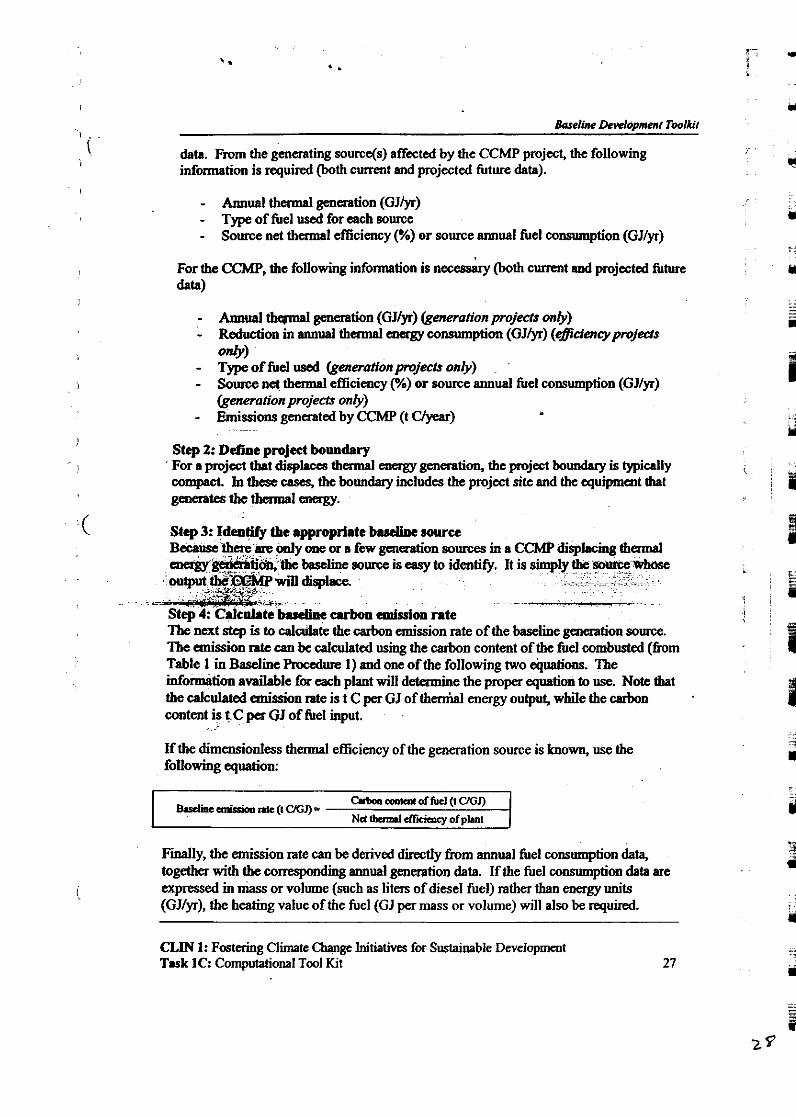
Tbe anission rate can be calculated using the carbon content of the fuel canbusted i h m Table 1 in Baseline Procedure 1) and o&of the following two equations. The information available for each plant will detgmine the proper equation to use. Note that the calculated emission rate is t C per GJ of ther~~ial energy output, while the carbon content is t C pa GJ of he1 input.
Ifthe dimensionless thermal efficiency of the generation source is known, use the following equation:
Finally, the emission rate can be derived directly fium annual fuel wnsumption data, together with the wrmponding annual generation data. If the fuel wnsumption data are expressed in mass or volume (such as liters of diesel fuel) rather than energy nnits (GJIyr), the heating value of the fuel (GI per mass or volume) will also be required.
CLIN 1: Fostering Climate Change Initiativs for Sustainable Deveiopmt Task IC: Computational Tool Kit
- . m i s f d r t y r t n i g b k ~emigicorcbctioascqrnltbcem~doar~ wwks hvc ban produced m the .bscllct of the CCMP (tbc gcastioo dirphccd by tbe CCMP mukiptieciby the cmisJioo rate of the tmdm eo-) minus the Cmirrmm Bcaartsaby*-.
. -. ..,.I .c 2.u.. .rt. t TbeegenaatbdbytheCCMPdegcodaatbelypeofpojed' .' 4 M
of the CCMP .divitics M d be mlurted fo id&-&& m y arb
~ ~ ~ ~ : ~ o s t a i o g ~ l i m ~ c ~ t n i t i a i ~ ~ f a ~ ~ e v c k p n d Talr 1C: ConputuioDll T d Kit
Baseline Dewlopmenl Toolkit
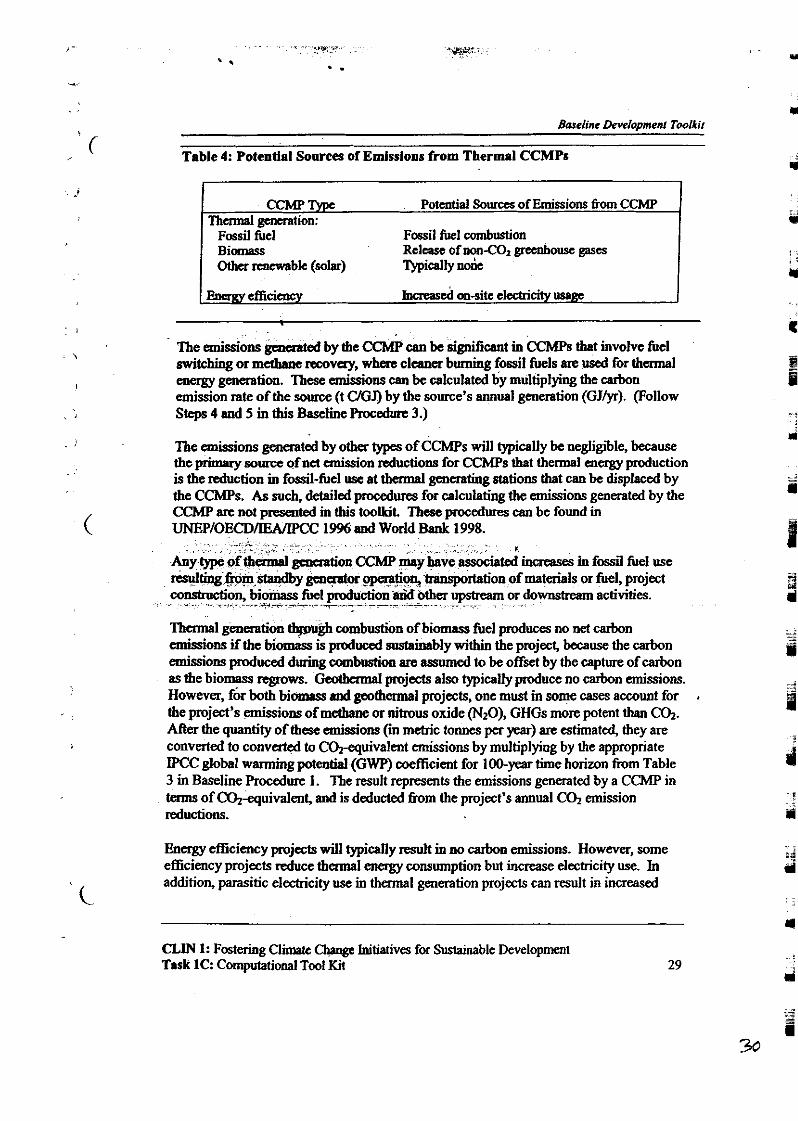
Table 4: Potential Sources of Emlsslons from Thermal CCMPs
CCMPTypc Potdal Sources of Emissions from CCMP T h d generation:
Fossil &I Fossil fi~el combustion Biomass Relcase of nonC02 greenhouse gdscs otaer rcncwsbk (solar) lLpically no&
l k q y efficiency ~ncrcaseh on-site electricity usage I
The emissions m e d by the CCMP can be significaat in CCMPs that involve fuel switching a methane recovery, whem cleaner burning fossil fuels are used for thermal energy generation. These emissions can be calculated by multiplying the carbon emission rate of the source (t UGJ) by the source's annual generation (GJ/yr). (Follow Steps4and5inthisBsselineRocedurc3.)
The emissions generat& by othet types of CCMPs will typically be negligible, because the primary source of net emission reductions for CCMPs that thermal energy production is the reduction in f d - f u e l use at thermal mmating stations that can be di~laced by the CCMPs. As such, detailed procedures f ir calcula& the emissions geaer&d by the CCMP are not prsented in this toolkit. These procedures can be found in wPIOECD/IEA/IPCC 1996 and World Bank 1998.
increases In fossil fuel use [email protected];stdby gen@x g x @ t i w . . ~ ' ~ o n o f materials or fuel, project wnshuctioh, bi- fucl production-add . . other upstream or down& activities.
: -- -.. .. "*.*" .... . .~ . . .
Thermal generation tlpugb combustion of biomass fuel produces no net carbon emissions if the biomass is produced sustainably within the project, because the carbon emissions produced during combustion are assumed to be offset by the capture of carbon as &e biomass regmws. Geothmai projects also typically produce no carbon emissions. However, for both biomass and geothermal projects, one must in some cases account for the project's emissions of methane or nitrous oxide (&O), GHGs more potent than C 9 . After the quantity of tbcse emissions Cm metric tonnes per year) ate estimated, they are converted to converted to COrequivalent emissions by multiplying by the appropriate IPCC global warming potential (GWP) coefficient for 100-year time horizon h m Table 3 in Baseline Procedure 1. Tbe result represents the emissions generated by a CCMP in terms of CQ-equivalent, and is deducted 6om the project's annual C4 emission reductions.
Energy efficiency projects will t y p i d y result in no carbon emissions. However, some efficiency projects reduce thermal energy consumption but increase electricity use. In addition, parasitic electricity use m thermal generation projects can result in i m d
CLJN 1: Fostering Climate Change Initiatives for Sustainable Development Task 1C: Computational Tool Kit
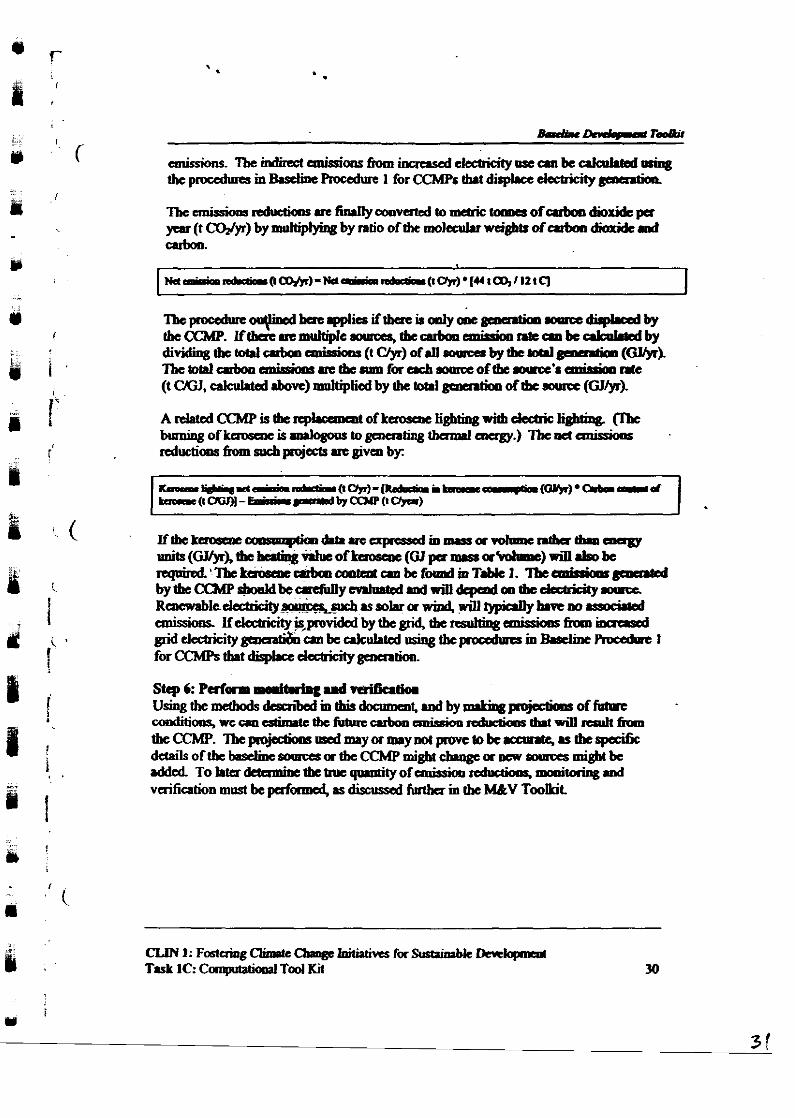
' I IKnniSs iom~aehtul lycoodk~mclr ic toa~gofc lrboodioxidcpa year (t m) by muhiplyhg by ntio ofthc molaukr wd@ of& dimridc md carboa.
%poccdmcu+dbaclppliuiftbacnolllyaacgcaaalh~dipbrrdby tbcKIbP. Iftbacaemultiplc~tbcarbonemigimnteanbcalcDLlPdby d i v i d i a g t b c t o t l l ~ a n i g i O n r ( t C / y r ) ~ f I I i ~ b y t b c w l ( t * (Wh % c o d & ~ . r c t k n r m f o r a c b a w a o f t b e r a n r ' r ~ R l c (t UGJ, cdcuMal above) multiplied by tbc (ot.1 gcocntim of thc aourrt (Gyyr).
- . for cchm td.Idkpk d&hicity-tioa.
Stcp 6: Perform m d b r b g d wrikatk. Usiagtbcmdbodsdaa , imtb i ,doaaocat ,mdby~poj tc larro f~ cooditiom,mcllllcstinntctbcfuturccubonrmissionIcdudicmdntviflrcruhh theCCMP. %poj&t iomPredmryormrywtpovc tok~umtspcc i6~ dctaii of tbc basehe saoras a thc CCMP might ebrngc a DEW sources might be Wed. T o h t a d a c r m i D e t h c m r q ~ 8 a i ~ 0 f c m i a g i o o ~ a ~ , ~ g d vaification mast bc p a f 4 as discussd finiha m tbc M&V Toolkit.
Baseline Procedure 4: Methane recovery CCMPs
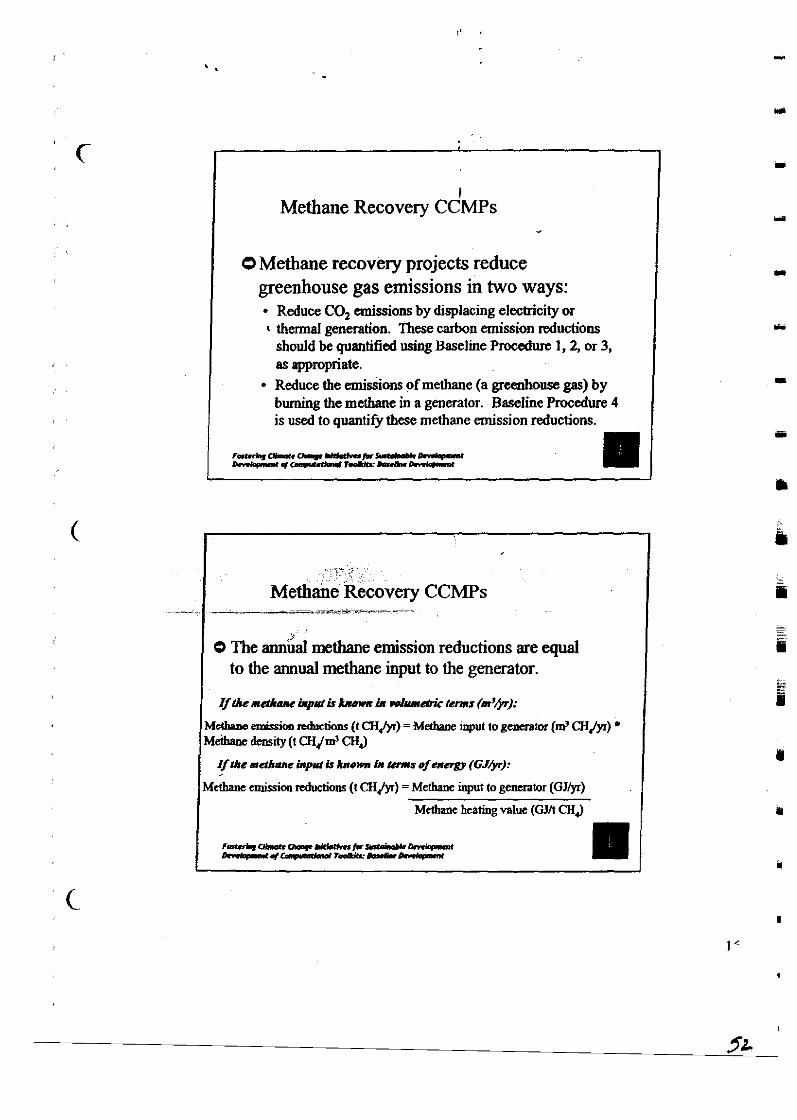
This procedure specifically addresses CCMPs that generate elc&icity or thermal energy by burning mdhane recovered from coal mines, landfills or agniusincss facilities." Two Baseline Rocedures arc required for these methane recovery projects, because they reduce meenhouse nas emissions in two ways. First. they reduce carbon dioxide - - . - missions by displacing electricity or thermal generation h m some baseline source. These carbon emission reductions should be quantified using Baseline Rocedun 1.2, or 3, as appropriate. Secondly, methane recovery projects reduce the emissions of metham (a greenhouse gas) by burning the methane in a generator. This procedure, Baseline Rocedure 4, is usad to quantify these methane emission reductions.
Step 1: Gather required &to Data will be gatbaed for methane recovery CCMPs as required for either Baseline Rocedure 1,2, or 3. Ihe o m additional piece of information necessary for Baseline Rocedure 4 is the amount of methane burned to produce electricity or t h d energy. This can be orpressed in mass, volume, or energy terms (t Wyr, m3 CHJyr, or GJtyr).
Step 2: Define project boundary For a methane recovay m, the project boundary includes the source of methane and the generation equipment in which it is combusted.
Step 3: Identify the appropriate basehe swrc t The baseline source is sim~lv the some from which the methane is recovered. This mav . . .
agiusiness facility, or other so&. .., -. . -: > . . . ~
. .~ . ~ ~
+ e a r b o n emigion rate . . . . ..... This-~.i.i;nottapplicable to calculating methane emission reductions for metbane+..
recovery jkojects. 2 '
Step 5: Clledate emission reductions In methane recovery projeds, methane emissions are reduced by burning the methane to gawate electricity or tha;nal energy. Thus, the annual methane emission reductions are equal to the annual mc(bane input to the generator.
The methane input to the generator must first be converted to t o ~ e s of methane per year (t C M ) using one of the following equahons. If the methane input is known in volumetric terms (m3/yr), it can be converted to tonnes per year using the density of methane. Ideally, the actual density of the on-site methane should be measured. Otherwise, the standard density of 7.167 x lo4 t w m 3 C& can be used.
~ d b n e cmiasio. n d & a w (t a4/yr) = M d h w input m ga~& (m' a4/yr) M d h dmdty (t ~ m ' ah)
I@ b t policy initiatives gowming waste material (hat m y be deposited in landfills in Lndin m y limit rhe nrtractivenea of landfill methane ear rccovcrv vroiccts. Ncvcrtheless. (here an likelv to be simificant -. - - o ~ o r t u n i t i a for biogas production & utilization inagricultural as well h municipal &ings.
CLM 1: Fostering Climate Change. Initiative. fa Sustainable Development Task 1C: Computational Tool Kit 3 1
. . - - mdverifiatimmrdbepafbmcdrc & of emission reddam, &mtonng
d k n s d fmther in the MBV Toolkit.
llepocedurcs#rbovcrpai6allyddrrsmrgy(*lpentioomdarr~' cffieieocy CCMPs. Tbcn arc by m meam tbc aoly type of CCMP Unt r pojcd dmbpamayammlta. Foromatypaofccrm,apPojatdcrdopcraaaarerc ~ a p p m p i a t e b z r d i n c b y r o D o ~ f b c s t r u c t m c o f t b c ~ p c s a r t r d m ~ tooW Thc6mtstcpsaie . todct ioc~projat~PddearrmiDethcbadinc ~sourcc,tbesooralfntwouldopartcmthc.bscoaoftbcOCMP. ' Ibcad stcpic;rOquMtifytbcemisJiaath1would-~tbcbPrdinccacdt6ccminioar that would oecur with the CCMP in place. The diff- behnea tbese two case
Eweline D N c l o ~ m u l Toolkit
scenarios represents the emission reductions attributable to the CCMP. In performing these steps, careful evaluation of the project is necessary to accurately chsraclerize all of the emission sources in the baseline case and the CCMP case.
This general procedure can be used to develop an appropriate baseline for any CCMP that has been carefully evaluated. For example:
A methanc flaring project, in which methane is burned rather than released directly. This raluces methane emissions, though increases carbon dioxide - emissioas A ImnqmMtion project that reduces emissions fkom mobile sources, while pahaps iocn&& &ssiom from elcchicity generation or other sources A r c f o ~ t i o n project that i n m a carbon sequestration rat= A project that d u c e s agricultural methane emi&ons
In this way, the procedures presented in this toolkit can be used as conceptual tools for use in the broader field of CCMPs.
Risk assessment and mitigation , - ,' i
The baseline is subject to the risk of being adjusted or even rejected at some later date if d l it is not well-designed aad documented A baseline that does not hold according to initial
' ( exptations over a specified period of time can undnmine delivery of the projected &
Carbon 0- (Ofhe&). Therefa, an authoxitetive third party should validate the ti baseline. Both tbc buya and the seller of tbc Offsets wuld hs a result suffer ftom my t u m w h d a shiA in the baseline. In the worst scenario, the seller could be m e n t e d hrn-xakhg Bpceted revenues from the sale of Offsas whne the buyer find that fewerlu none of his pnxbusly anticipatdOfkt p u r c b will be fulfilled At a
11 minimum, shifts in the basebe can change the relative price and value of thc Of%&.
I
In this context, tbe perceived risks to the baselint can determine the "quality" of the S Ofiets sold by the projecL The lower the perceived risk to the baseline. the higher the 0Ex-t quality. In orda to msximizc the quality of the Offsds, and thus theh value, it is in the interest of the seller to engage a wellqualified and -enced orpert to quantify Ill the original CCMP baseline. Similarly, it is in the interest of the b u m to engage a well- qualified and e x p e r i d M&V agent to verify the actual amount of Offsets produced by
I the project. Verified or validated Offsets wAI be perce~ved by the market as having high quality. Thus, the higher the quality of the baseline, the Iowa the overall risk to all the
3 parties to the project Risks to the baseline must therefore be identified and mitigated ss
early. Ifit is not possible to ~nitipte all the identified risks to a project baseline, the parha to the project could instead agree to a more conservative figure for any related
S transactions or lworded Ieductions.
CLIN I: Fostering Climate Cbauge Initiatives for Sustainable Development Task IC: Computational Tool Kit
Miilowr.A,1999. T ~ I c f a b u c l h v . t D d i u f a W a l d 8 . m l r A U . ~ M o d n +edq* Shdy for UIC World BmL Clirmrc Qilsc T a m W- D.C.
U N E P K ) E ~ (United NatioPr P . tpW==C% Tor E c o m m i c ~ m m d D m l o p n e q ~ E o c r g ) . ~ . u ~ l W on oil C h q p ) . 1996. R e v i d 1996 I K C G w M h e s * N ~ ~ G a r ~ : R t $ T a s c e M d (Ydumr 3). IPCC: UR. Anikbk at hV
W d d W 1998. ~ e G a r ~ H ~ EnvhmuM Wa&hgioq DC. Avaiibk at
WorMBadL 2OMh. " B a e l i n t M a b o Q ~ f a P C F R o ~ P C F I .' Notc Number 3." Rototypc CPboo F d Wd@toa. D.C
WorMB.nL. 2000b. TahkBasdineShdy." RototypcCPbonFurd W- D.C.
Figuaes. "Ihc Achiwauab of COP 6: Yes, rbe A&haamts!"; Ccda k . SlrsE.irnMt-mthc-D&rmbcr2000.
Inlamtioml Emrgy Aancy (IEA), 1997. Activiks hrpkmmtai lo* for Climate md Dm&pmf, OECD, Park.
It is important for project developers, business representatives, pvamnent policymakers and other interested parties to understand that the international policy context is still uncertain, and that national policies can help define the direction and shape of mtemational ~ l e s . The Kyoto Protocol requires emission reductions generated by the CDM to be measurablq and additional to what would have happeaai in the absence of certified pmjed activities (KP #12.5), but these terms are not defined nor is it clear how these requirements should be implemented. Clarification of these issues is the focus of the on-going negotiations of the Conference of the Parties (COP). Given the lack of definition at mt, pmje-3 developers must rtly on existing tools cmplo+ to date and invent new ones in assessing environmental additionality, whether designing project- specific and multi-project baselines.
The basic requirement for additionality under the CDM is that reductions are "additional to any that would occur in the absence of the certified project activity." Since non-Annex I munhies have not yet taken on any reduction commitments, one can assume that no special efforts to reduce emissions would be made in the absmce of the CDM. However, the prospect of gaining CDM credit for any and all measures that reduce emissions could create an incentive for policies that unnecessarily encourage emissions, so that even obvious or trivial measures might be claimed for CDM credit.
( Thus, fium the policy perspactivc, the absence of project activity is geacrally considered to be "business as usual," i.e. neither specid measmcs to d u c e emissions nor any marsurcs to imrease ~ o p . ~ , ~ d y , -1- to aKSgy pcjliCy, thi* rn-ians developmeat of enagy reso- to m i n w $&s,: without clim&s-related i i -
.=*:be provided at requirements. Althoughit k q & l y . ~ . t b a t . m 2 .,
minimum wst bv includine end-use efficicncv measures with sumlv resoumx in integrated reso- pl&g w), such m& are still not id hl mainstream of energy planning and development." The restructurinp, and privatization of the energy -. sector tbat is &-ay in developing and res&hnin; economies are only awentuating this situation.
Thus, "business as usual" can be summarized as leastcost energy-supply development, witbout special regard for climate protection. 'Ibis policy criterion helps to define the baseline activities "that would occur in the absence of the certified project activity." Based on this policy criterion, a consistent economic crilerion is that the baseline rep-ts leastcost development under "business as usual" financial conditions. d ow ever, the baseline econbnic critetion relates directly to financial decision-making practices in the host country, and the energy technology choices that are favored as a Ault of this '%business as usual" f i n a n c i a f b g and sector investment planning.
CLM 1: Fostering Climate Change Initiatives for Sustainable Development Task IC: Computational Tool Kit 35
G ~ w c G u p o l 3 . t b . R c r L . ~ t c ~ S.ppksmt (CEPC<S)
-QUOr*-h--
I
Baseline Toolkit
ThcLar(r-GrmO.-
- - Q C - m - -*---.a"-
What is a Baseline? . - -. - - - --
0 ~ h e &line represents the emissions that would occur in the absence of a climate change mitigation project.
OThe difference between the baseline and the project case represents the value of the carbon emissions reduction.
r r h m - . l a y . . * - - -7-'Y--
Why is the Baseline Important? I 0 International standards for CCMPs demand a
credible, quantifiable and verifiable baseline of emissions
O Key step in determining additionality for projects for market based funding
0 Project specific baseline necessary to accurately determine the CCMP's emission reductions
0 ~aseflne preparation must typically be performed by mdivictuals with formal training in engineering or the physical sciences
If experienced in energy economics, others should be able to perform quired analysis Proficiency with electronic spreadsheets and processing numerical data are required Completion of training workshop retommended
Static vs. Dynamic Baselines
0 S t . t i c ~ l i I l c s b v c t b c ~ ~ f ~ s i m p k r a d &todcvelop
R m m r , d l c y I m y ~ ~ d m * , k a d b * a I E k 4 &
0 D y p m r i e b s e ~ b v c t b e ~ o f g r a t a ~ . rcrpdicmicrd-d- L I . J p v i & a m m ~ ~ o f O e b c h ~ i a k&agarmtdnbc ~ P ~ m n h r m ~ ~ . .
0 Dynrrmicbascinesarcgwnaymorccrcdiikdrobud fix projects bavmg long p a i d of pcrformaee
-*----
-
-
1
s Baseline Development Checklist
-
D Has a kMP been identified and defined? 0 Does project developer have the training
necessary to develop a credible baseline? 0 Has the project boundary been accurately
dehned? 0 Does project developer have the data
required to perform baseline calculations? D Are the data of sufficient quality? Q l - * - - . -*----
Establishing the Baseline
OBaseline = "without" case: "business as usual" emissions (pre-evaluition)
@Project = "with" case: estimate actual emiskions savings (post-evaluation)
0 Emissions Savings = Baseline Emission - Project Emissions
r-a*raQlp-m-- - . / c r c L . * r ~ ' - -
0 Three bcedures are presented for different project types:
CCMPs that displace grid-generated electricity CCMPs that displace off-grid electricity CCMPs that displace thermal energy generation
OFourth procedure for methane recovery projects
r & a b u . c b . , . - r n - v omarm./c.wumbdra.lb--
Establishing the Baseline
0 Step 1 - Gathcr raquind data 0 Step 2 - Define project bcllmdary 0 Step 3 - Identify the appropiate baseline source
. ' R a A - D c s n i D c i f o m - t k m d r a r o c r r c ~ - hrcB-Damic*dcL(Larmlrorrarcl=ga
OStep4-CalculatcbascliaecarbonQnissimratc 0 Step 5 - Calculate emission rcductims 0 Step 6 - Perform monitoring and verification
-m(. I -ZI-- L . . C . f C . * 6 . l r - - k C I
Step 1 - ~ a t a cdlcctionf Gennal Remmma&tims
- - - --- --- 0 Data quality is crucial to the comhuction of a dtfglsible
and robust emissions bascline. 0 Data shwld be n&rdcd prior to, during, and afta project implementation so that baselines and prow casa can be better established.
0 Fuel consumption data is preferred o v a energy data., because:
more accurate cakulatiolrs can k mdc based oo the c a h o amtmt of UIC fuel
- m q - C - - l . rrCI.r------
Step 1 - Data Collection: General Recommendations
0 More detailed energy data is needed in environmental audits from independent consul(ants. It is useful to include a technical description of on-site generating equipment when relevant.
0 Enefgy-efficiency project investments require specific energy savings results in order to estimate resulting emission reduction benefits.
0 Savings information needs to be accompanied by either resulting energy consumption or pre-project energy consumption so that gross emissions can be calculat
F--m-l"-- Ih.*pa.I-r.aR=--
Step 1 - Gather Required Data
-O Dkta'kkpired from each generating source affected by the CC%@ (both current and projected future data): -wtyo* rsnrmlclatricitygcmation~)(Amnulmarmlgemntion ( G J / y r ) f o r p r o j a b ~ t ~ d i r p h c c ~ g c m a ~ ) ~ o f f u e t m c d f a a e h p l a n t - - PLot h a t mte (GJ/MWb)* or plant net tbamal efiicicncy (%) or plant annual fuel anslnnpbbn (GJ/yr) Disptching order, if available (for pmjccts that displace grid-gemted
electricitu *)
Step 1 - Gather Required Data
~. . . . .:-..*,*. ~ . , - - - . .
~ -, . .
. ... Step 1 i%ather Required Data
~. .. ~
0~dditional useful data if available (fw CCMPs that displace grid-generated electricity): Loadlhldonanve Typialdailybodpfilc
Rqieded-gr0Wtb-w) s5aJukofpknt Pdditions and " *
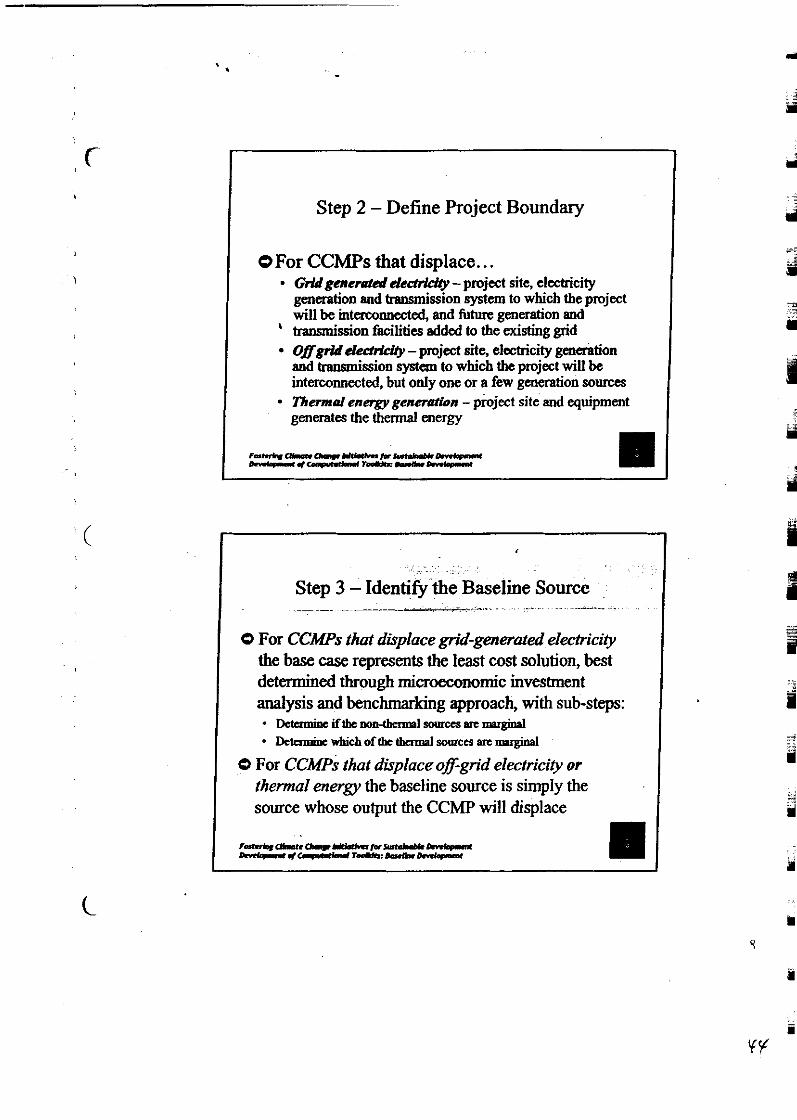
Step 2 - Define Project Boundary
I O For CCMPs that displace.. . Grldgened deddd@ - project site, electricity generation and transmission system to which the project will be interconnected, and future. generation and
' transmission facilities added to the existing grid Offgrjd dechldly - project site, elcct~icity generation and transmission system to which the project will be interconnected, but only one or a few generation sources
I Thermal energygenemtbn -project site and equipment generates the thermal energy
1 Step 3 - Identify the Baseline Source
/ 0 For CCMPs that displace grid-generated electricity
I the base case represents the least cost solution, best determined through microeconomic investment
I analysis and benchmarking approach, with sub-steps: Detamiac if tbc mMbermal ~ourccs nm marghral Debmix wluch of thc thcrrml sources are mugural
0 For CCMPs that displace off-grid electricity or thermal energy the baseline source is simply the source whose output the CCMP will displace
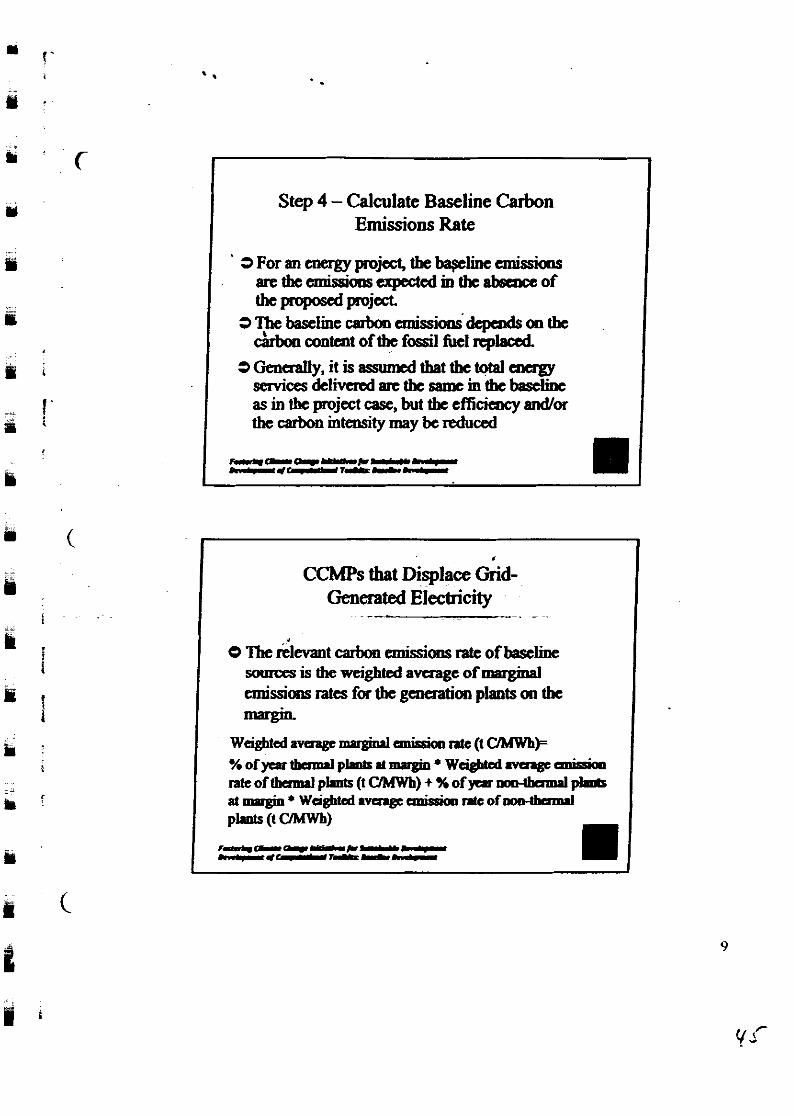
Step 4 - Calculate Baseline Carbon Emissions Rate
- -
~ ~ b e b a s ~ ~ i n e c a r b o o ~ ' d e p m d ~ o n ~ & content of tbt f@ fuel replaced.
3 Genaally, it is assumd that the total a ~ a g y s e r v i c e s d c l i n n d a r e t h e s a m i n t h c ~ as in tbc project case, but tbc efficiency and/m the carbon intensity may be reduced
CCMPs that Displace Ckd- Generated Electricity
~~he~levantcarbonemiss ionsratcof~hc sources is the weighd avaage of imqiml emissions rates for tbe generation plants on tbe margia
%0fyclrtbQID.lpLntsrtmrrgiD*Wcigbtcdavaagc~ rate of thsrml pLnh (i UMWh) + X of F mo-tbamnl p l d s at ma& Waghted mngc anigioll Rlc of mplhaap.l
CCMPs that Displace Grid- Generated Electricity (cont.)
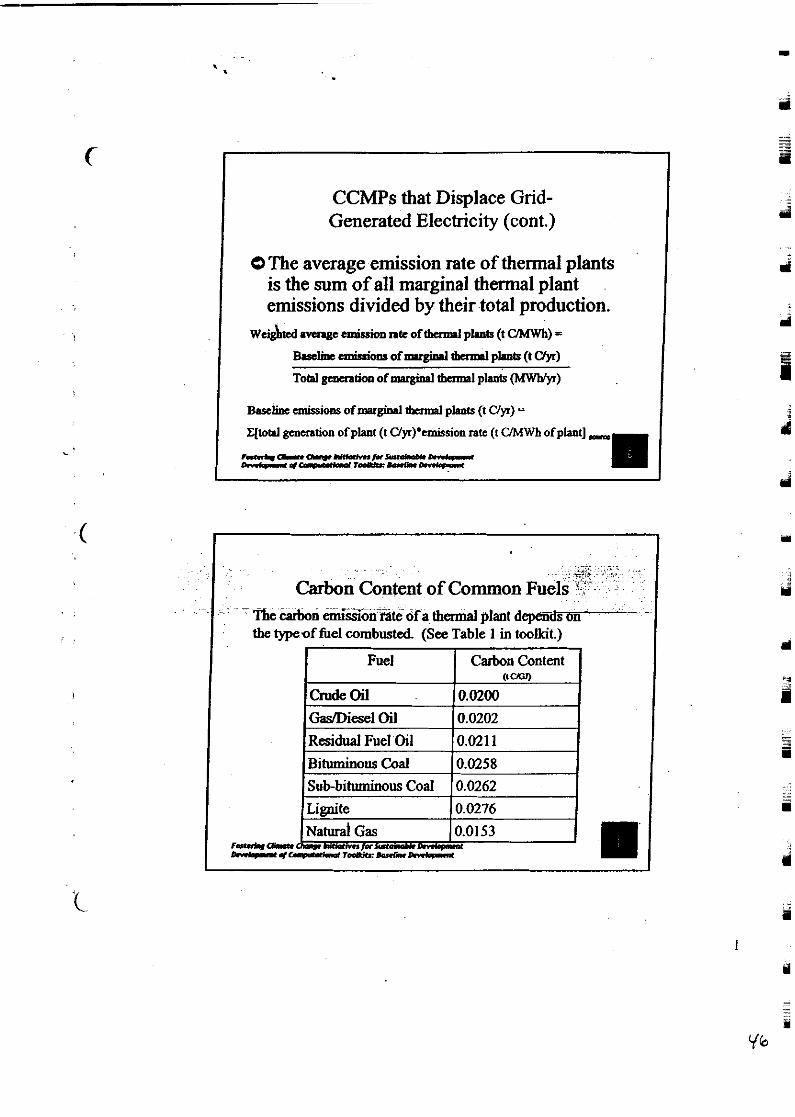
0 The average emission rate of thermal plants is the sum of all marginal thermal plant emissions divided by their total production.
BDIIliac cmkiorn of narginal thmod plants (t UF) =
qtotll generation of plant (1 Uyr)'cmission rate (I C/MWb ofplant],
r r 4 ( . m a - u . - l C - ~ -.I-r---
.. . . , . ,
Carbon content of Common Fue . ~- . ~ . . . *'*d --GGn-f& ofa, thermal dF-
. . .. - - the typeof fuel wmbusted (See Table 1 in tookit.)
I Fuel I Carbon Content I
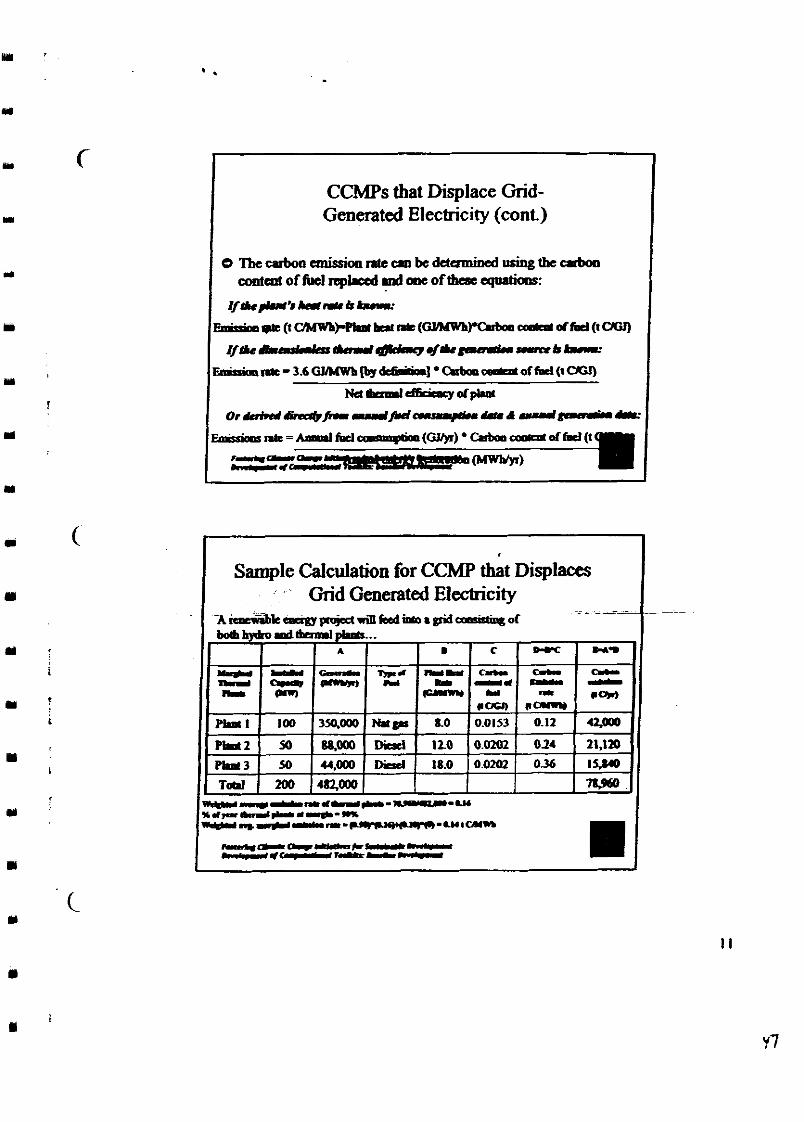
CCMPs that -lace Grid- Genexated Electricity (cont)
0 ibecarboncmissionrrtecmbcde(ermiaeduhingthcCPboll cootall of M qterd md one of these aqrtltioas:
r f & ~ # L a r ~ & b r r .
F m h . P a g L ( t G ? d w h ~ b c l l n t ( ~ ~ ~ d W ( t C I O I )
r / & d b a l h k m & r w r ~ ~ * p c r r & . o r r c r b k r r .
~ R * - 3 . 6 G U M W h ~ ~ ] * C k b a t w o f M ( t C C C I )
Nct&malctiidaryd*
O r b h d ~ I h . r ~ ~ ~ & n & u u r l ~ I I . . . EnrrmPrm=AIPI fd~~(Gyy)*C.rbol l -dm(t
r - ( L P I ,---)
Sample Calculation for CCMP that Displaces Grid Generated Electricity
. - ~ ~ k a u r g y p o p d r i n k + d ~ a g i d ~ o f
'hCY-.L. lhl ly---us X d p - l y l ~ - w % ~ ~ l r L , m - ~ - ~ ~ ~
-mLL.C-L.-- .I.y,r------
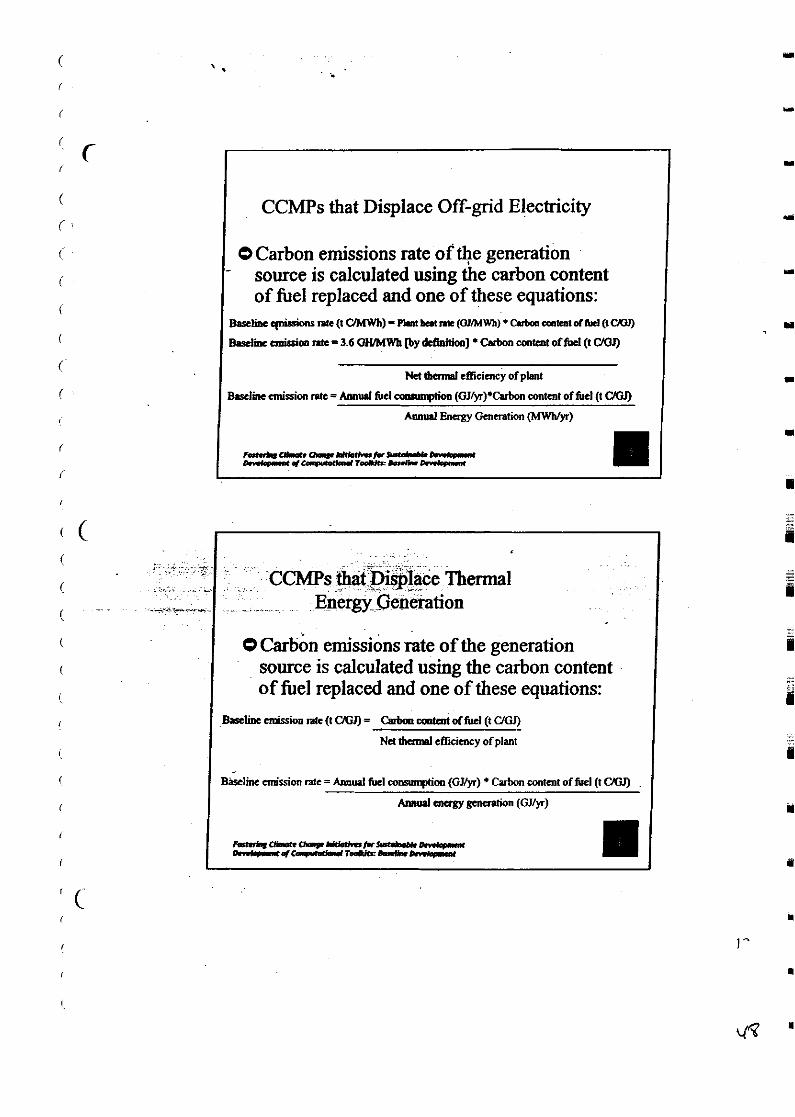
CCMPs that Displace Off-grid Electricity
0 Carbon emissions rate of the generation - source is calculated using the carbon content
of fiiel replaced and one of these equations:
I B.scl~qrdasimsRh(tCIMWh)-nptborn~(OUMWh)*C.rbmm~rtdM(tCXU) W i n c anishim RtC = 3.6 OWMWb [by d&itiOll] Carbon mtmt o f M (t CMI) I
. ~ . , .. . . ~~ . ~ . . .
CCMPs ~ that~is$ace . ..-.~ . Thermal . ~ n e r ~ ~ e n e f i t i o n
0 carbon emissions rate of the generation source is calculated using the carbon content of fuel replaced and one of these equations:
B.sclinecmksiounre(l~= CdmmofrmofM(tUcI)
Nd fhrrmal eE4mcy of plant
Bavline emission me = AM& fuel rmwqlion (GJ/yr) Cnrbon wntmt of fuel (t CMI) I Armtul aragy gmaprion (Glty~)
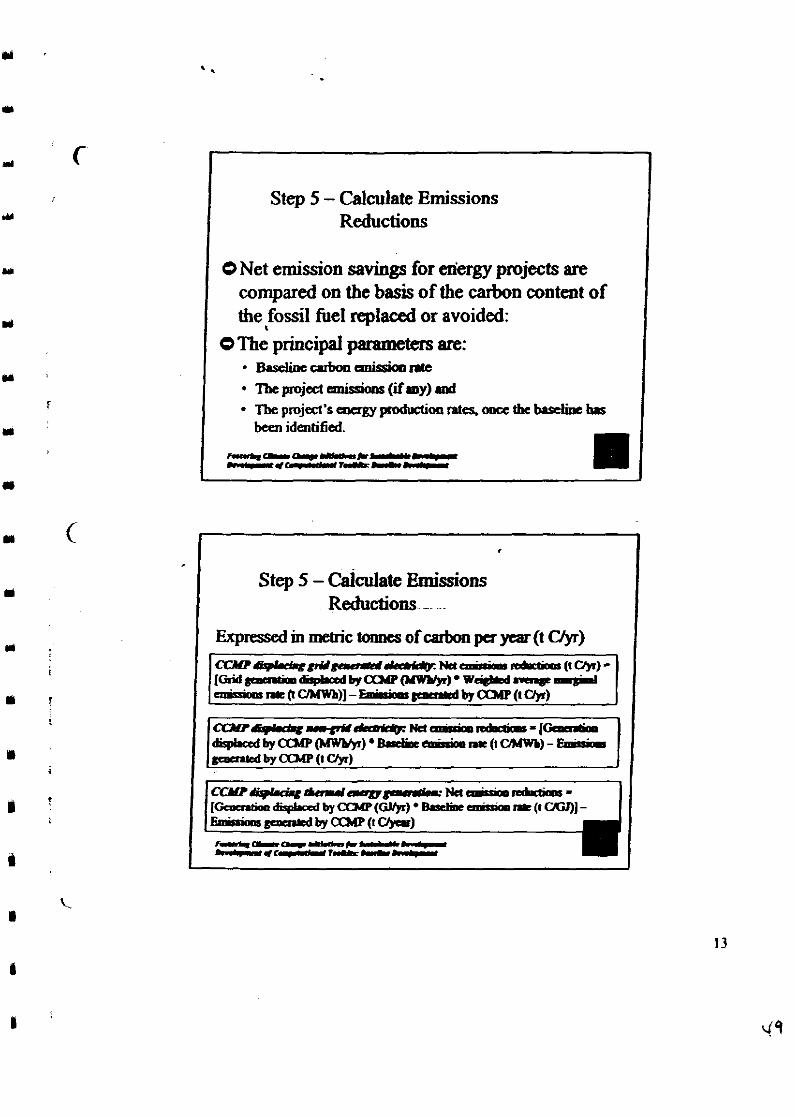
Step 5 - Calculate Emissions Reductions
0 Net emission savings for edergy projects are compared on the basis of the carbon content of the fossil he1 replaced or avoided:
0 The principal parameten are: B.sdine&*ntt Tbe projad Lmissions (Say) rod
Step 5 - Calculate Emissions Reductions -
Expressed in metric tormcs of carbon per yap (t Ctyr)
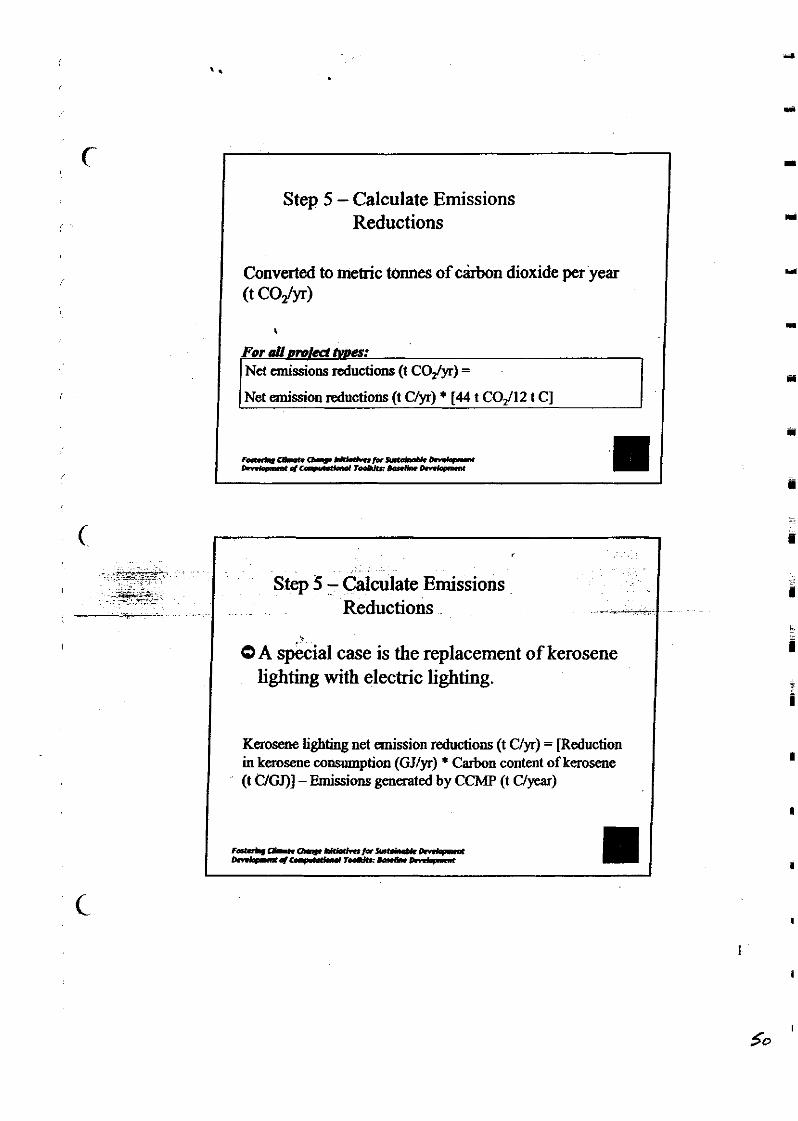
Step 5 - Calculate Emissions Reductions
Converted to metric tonnes of c&n dioxide per year (t COdyr)
For aU amled w: Net emissions reductions (1 Cody) = I Net emission reductions (1 Uyr) * [44 t COJl2 t C] 1
< . .~
~~~ . ,+++-&--, . . .. . . . . ..- x . ~ ~ . . . ~~ . . . > , . .
~ . . . -. - Step 5 - Calculate Emissions .--e;-', ~, ,. ~
. ~ ..-, -,.- . . .- Reductions . , .--.-- ..... .
Q A &cia1 case is the replacement of kerosene lighting with electric lighting.
I Kerosene lighting net emission reductions (t C/y) = meduction in kerosene consumption (GJ/yr) Carbon content of kerosene 1
I (t UGJ)] - ~miss iok ge&atedby CCMP (t Uyear)
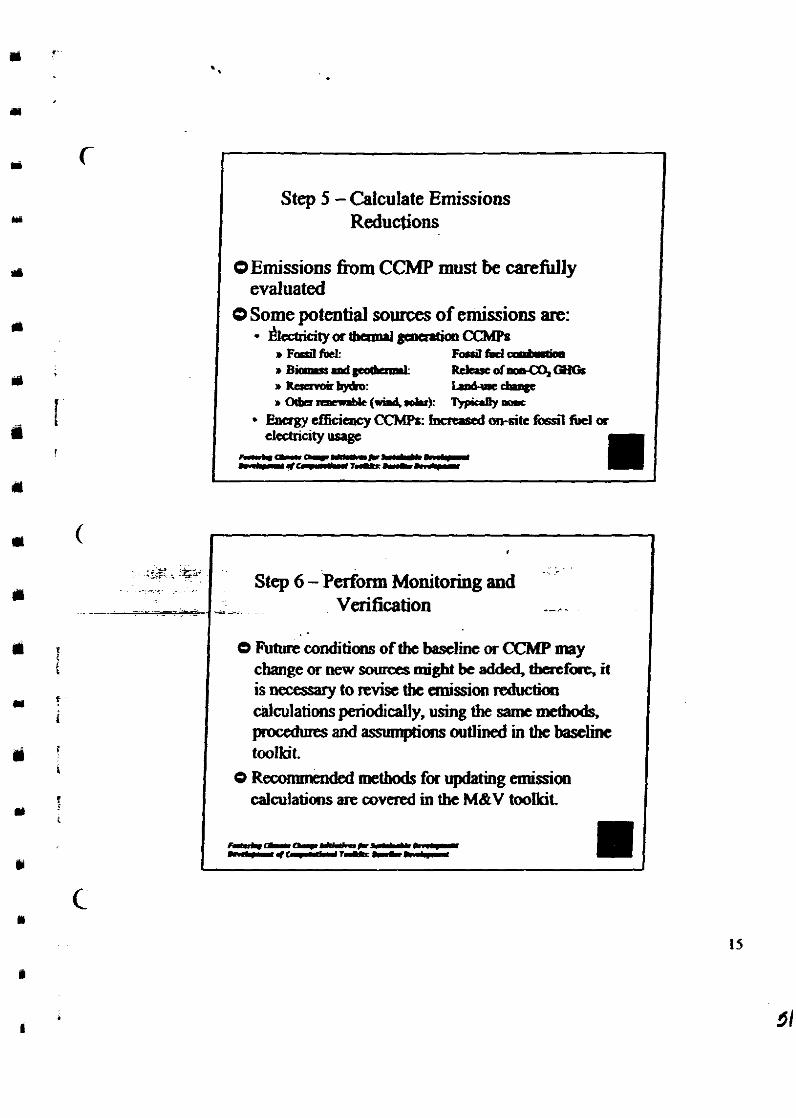
Step 5 - Cdculate Emissions Reductions
I OEmissions h m CCMP must be carefidly evaluated
/ 0 Some potential sources of emissions are: ~ ~ t y a ~ g m e n t i o n ~ ( h ~ r
r F d M: F d b d ' . Bicrmcmd- RJarcd11m€4OROo r ~ o a r o h b y c ~ o : W C b l l P C r ~ ~ ( r i d . r d u k M n a s
Ewgy efkicocy CCMPs: h a m d -site fasil fuel a =-~tyw
--(.I-*-- - * - 7 . L t r - L . . C I
. . Step 6 - Perform Monitoring and
-- - Verification --..
0 ~utkconditians of the baseline or CCMP may change or new sources might be added, *fore, it is necessary to revise the emission reducfion calculations periodically, using the same methods. procedures and asslrmpticms outlined in thc bascline toolkit.
0 Recommended metbods for updating exnisi00 caiculatians are covered in tbe M&V toolkit
I I Methane Recovery CCMPs I
Q Methane recovery projects reduce greenhouse gas emissions in two ways:
Reduce C02 emissions by displacing electricity or thermal generation. These carbon emission reductions should be quantified using Baseline Procedure 1,5 or 3, as appmpnate. Reduce the emissions of methane (a greenhouse gas) by burning the metbane in a generator. Baseline Procedure 4 is used to quantify these methane emission reductions.
, . . ~ - . ; . , . :. < ~. . ~ . ... ~ e t h & e ~ e c o v e r ~ CCMPs
-- _--- ---.---.
I 0 The ann"al methane emission reductions are equal to the annual methane input to the generator.
I Methme emissiar du&us (t CH/r) = Mcthne input to gaxrator (m' CH,/yr) Methane density (I CH/d CH,) 1 Methane emission r;aduetionr ( 8 CH,/yr) = Methane input to genmtor (GJIyr)
Methane heating value (GJh CH,)
F-m-h-9-F-f- Lairym=w""d - e - w a w r e - -
Methane Recovery CCMPs -
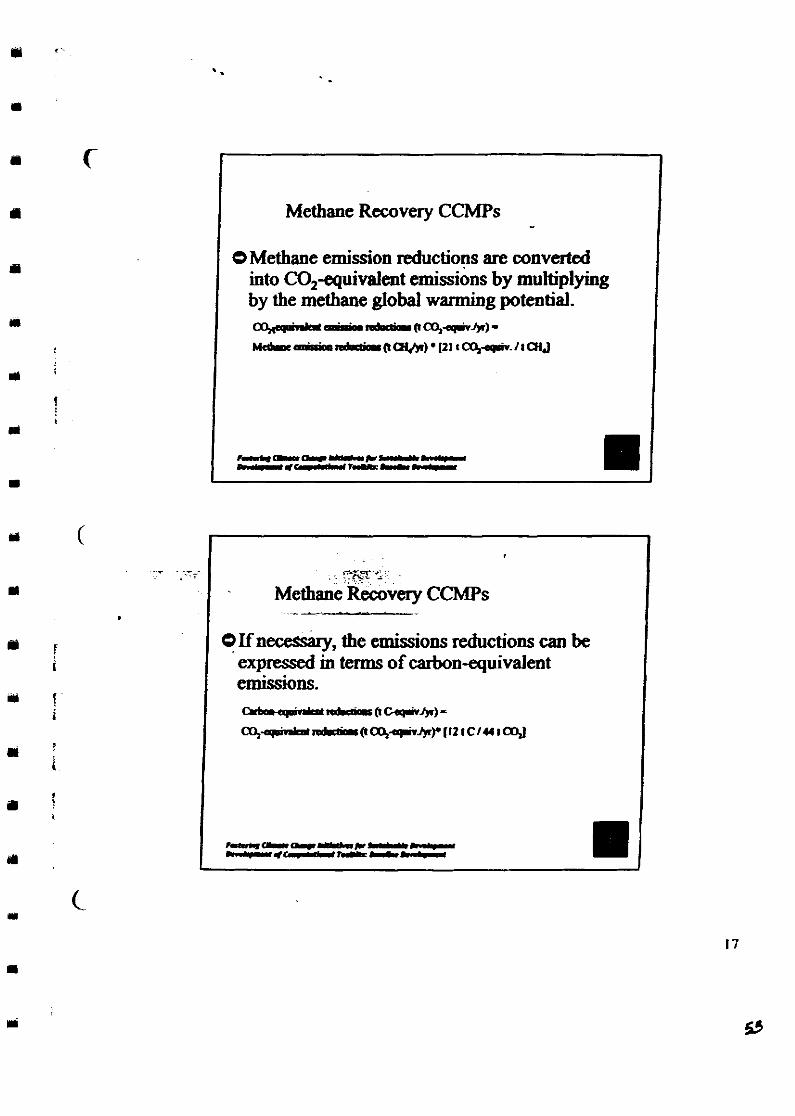
0 Methane emission reductions are converted into C0,equivalent emissions by multiplying by the methane global wanning potential.
1 0 H n v , the emissions reductions can be expressed in terms of carbon-equivalent emissions.
Application of Procedures to Non-energy CCMPs
0 The toolkit addresses energy CCMPs. OProject developers can construct an
appropriate baseline for non-energy CCMPs b'y following the structure of the procedures presented in this toolkit.
Risk Assessment and Mitigation
0 Risk: gdjustments to baseline during M&V phase Risk to buya and seller if projected Offsets not delivered
0 Mitigation: better quality baseline lowers the risk that Offsets will fall short of expectations, increases the value of Offsets
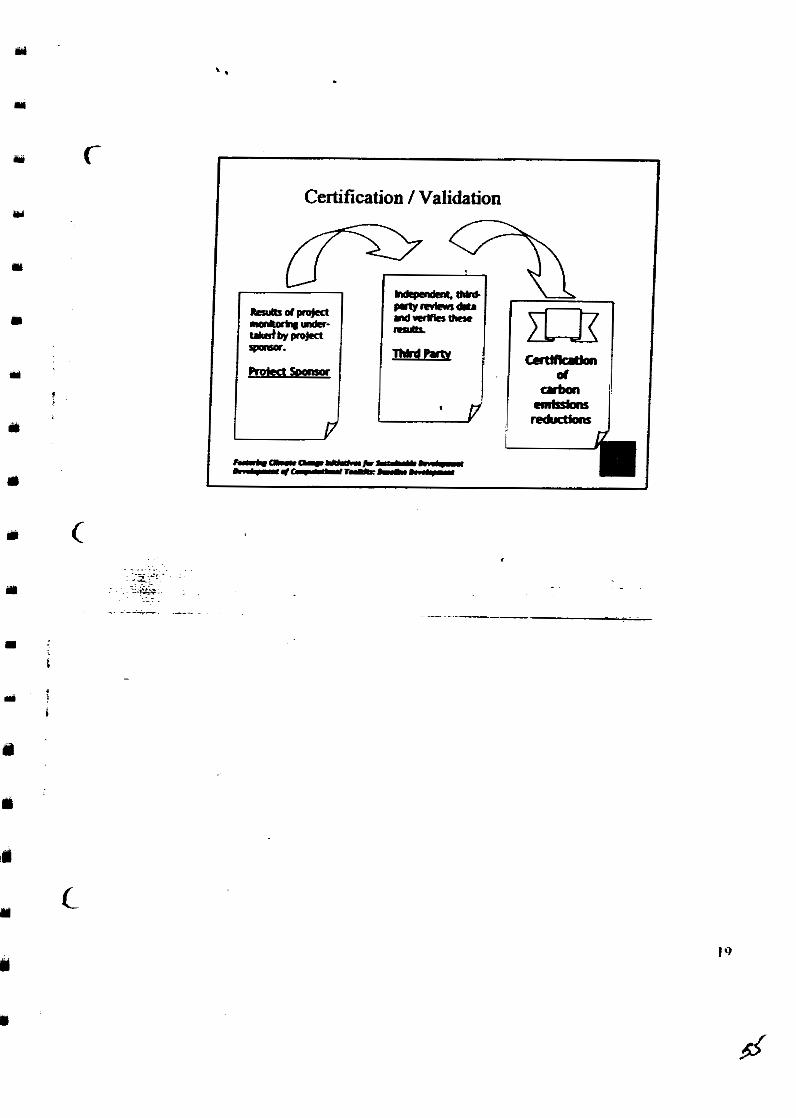
Certification 1 Validation
>
Computational Tool Kit: Carbon Finance Model
Computational Tool Kit: Baseline Development
United States Agency for International Development - Greenhouse Gas Pollution Prevention Project
Climate Change Supplement (CEP-CCS) n
Fostering Climate Change Initiatives for Sustainable Development
Task 1C -
Computational Tool Kit: Carbon Finance Model -
iii
By:
The Louis Berger Group, Inc. C-6/7, Safdarjung Development Area
New Delhi 110 016
May 74, 2007
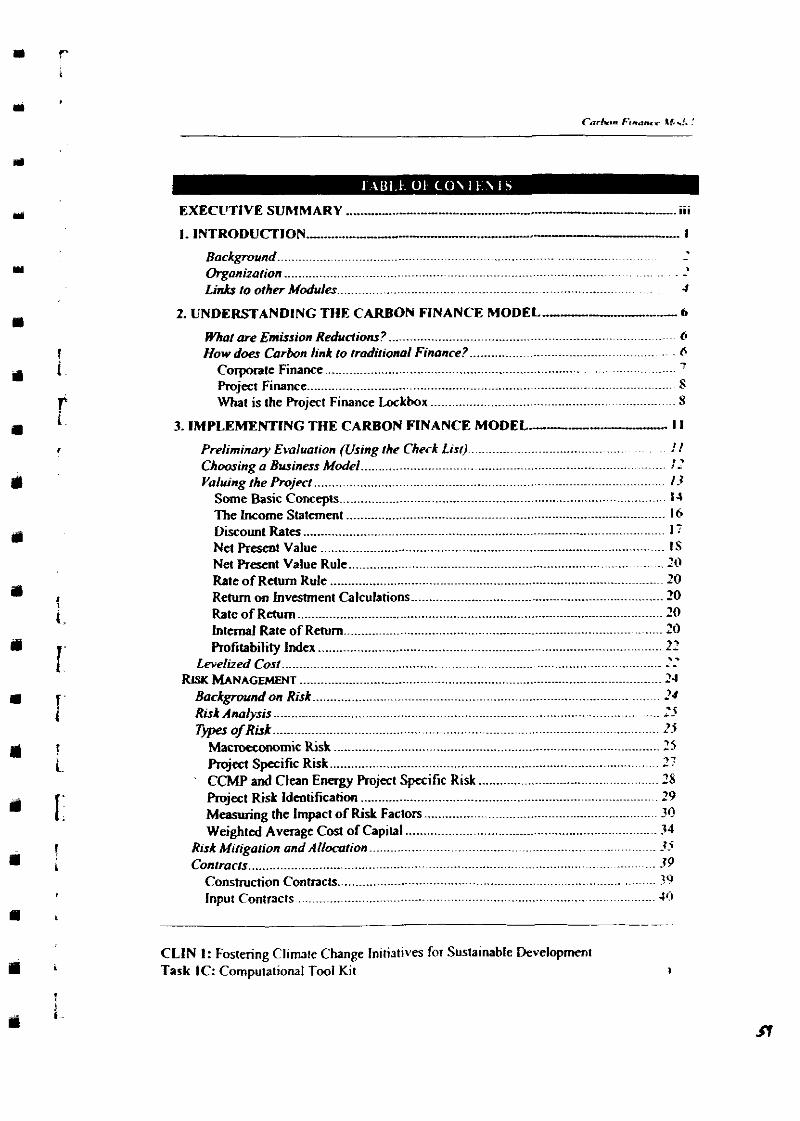
... EXECL'TIVE SUMMARY ........................................................ III
I. INTRODUCTION .- ............................. ,-- --. I
Backgmund .................................................................................................. . - 4
2. UNDERSTANDING THE CARBON FINANCE MODEL ---------- 6 . . . ............................................................................... What are Emus~on Reductions? 6
How doer Carbon link to frodirionol Finance 6
Corporate Finance :
Project Finance ...................... 8 What is the Project Finance Lockbox S
3. IMPLEMENTING THE CARBON FINANCE MODEL----. I I
Preliminary Ewluafi Choaring a Bwiness Valuing the Project ............................................................................................... 13
%me Basic Concepts ........................................................................................... I4 The Income Statement .......................................................................................... 16 Discount Rates ....... ............................... 15 Nei Present Value .. Nei Present Value Rul Rate of Return Rule Rehm on Investment Calculations ....................................................................... 20 Rate of R m m ................................................................................................ 20 Internal Rate of R m ................................ . . Pmfilabtltty Index ................................................................................................. LL . - -
RISK MANAGEMENT ................................... 2-1
.. Risk A ~ i y s i s ........................................................................................................... -> T p of Risk ............................................................................................................. 5 . . 1 - ............................................................................................ Macnxronom~c R~sk ->
Roject Specific Risk -: 7-
................................................... CCMP and Clean Enagy F'roject Specific Risk ?E Projact Risk Identification .................................................................................... 29
.................................................................. Measuring the Impact of Risk Factors 30 Weighted Average Cod of Capilai 31
Risk Cfifigation and Allocation 3.5 39 19 - .
Input Contracts ....................................... 4'3
CLIN I: Fostering Climate Change Initiatives for Sustainable Development Task IC: Computational Tool Kit
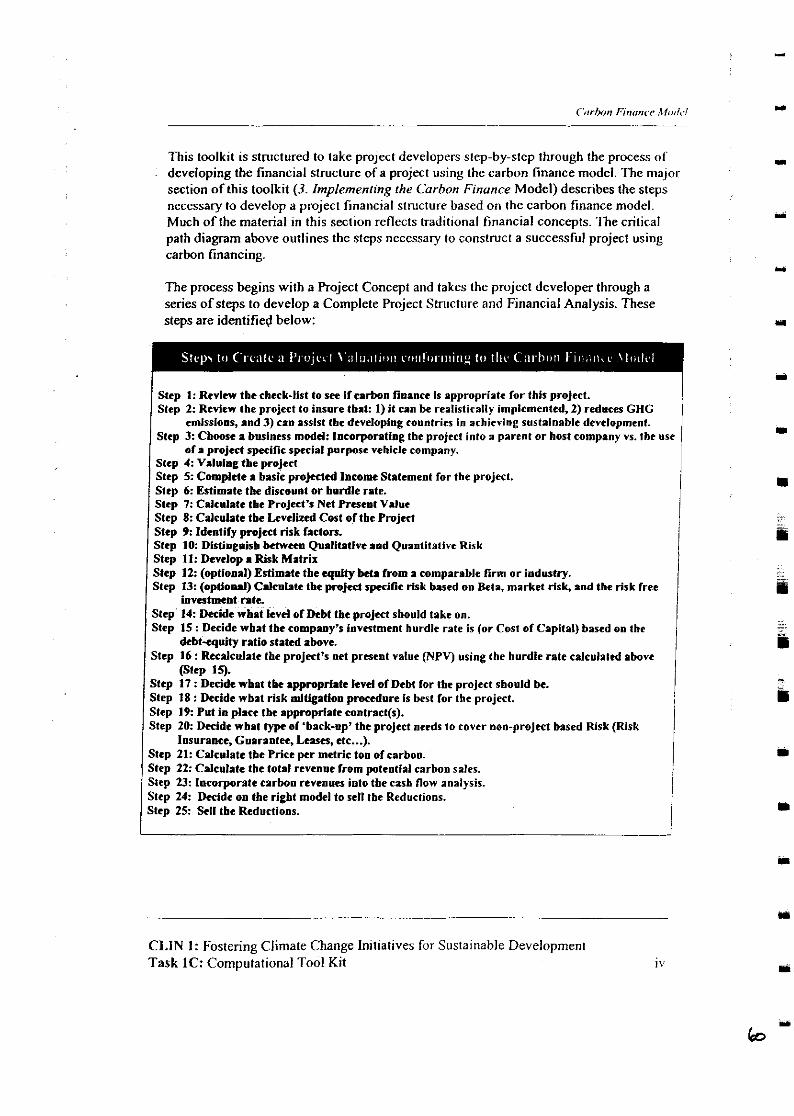
This toolkit is structured to take project developers step-by-step through the process 01. developing the financial structure of a project using the carbon finance model. The major section o f this toolkit (3. Implemenri~ig the Carbon Finance Model) describes the steps necessary to develop a project financial structure based o n the carbon finance model. Much o f the material in this section reflects traditional financial concepts. The critical path diagram above outlines the steps necessary to construct a successful project using carbon financing.
The process begins with a Project Concept and takes the project developer through a series o f steps to develop a Complete Project Shxcture and Financial Analysis. These steps are identified below:
/ Step 1: Revlnr the check-list to see if carbon finance Is appropriate for this project. 1 Step 2: Review the project to insure that: 1) it can be reaiisticalty implementedi2) reduces GHG
emtssions, and 3) can asslst the developine countries in achicvinp: sustainable development.
I - . -
Step 19: Put in place the appropriate kntract(s). Step 20: Decide what type of 'hack-np' the project needs to cover non-project based Risk (Risk
Step 3: Cboore a business model: l n c o r p o ~ t i n ~ the project into a parent or host compan;vs. the use 1 of a project specific special purpose vehicle company.
Stcp 4: Valuing the project Step 5: Complete a basic pro]ected l n m w Statement for the project. Step 6: Estimate the discount or hurdle rate. Step 7: Calculate the Project's Net Present Value Step 8: Calculate the Lcvelized Cost ofthe Project Step 9: Identify project risk factors. Step 10: Distinguish behvecn QnaliIative and Quantitative Risk
lnsuraofe,Guarantec,Lcrsa, etc ...). Step 21: Calculate the Price per metric ton of carbon. Step 22: Calculate the total revenne from potential carbon sales. Step 23: Incorporate carbon revenues into the cash flow analysis. Step 24: Decide on the right model to sell the Reductions. Stcp 25: Sell the Reductions.
Step 11: Develop a Risk Matrix Step 12: (optional) Estimate the quity beta from a comparable firm or industry. Step 13: (optional) Calcnlate the projed specific risk based on &la, market risk, and the risk free
invatment rnte. Step 14: Decide what level of Debt the project should take on. Step IS : Decide what thc company's investment hurdle rate is (or Cost of Capital) based on the
debt-equity ratio stated above. Step 16: Recalculate the projecl's net present value (NPV) using the hurdle rate calculalcd above
(Step 15). Step 17 : Decide what the approprfate k v d of Debt for the project should be. Step 18 : Decide wbat risk mlilgation ~reeedure is best for the proiect.
CLIN 1: Fostering Climate Change Initiatives for Sustainable Development Task 1C: Computational Tool Kit iv
,
This t o n l k i t is designed to help dcvelopem of clean energy a d clinutc chan~v nrtttsat~*s, prt~j~rts l to incorporate addititbnal rcvcnurs lhat can bc gcncratrd thmssh ihc u l c 01' carbon emissions rcdlxtions. I h e toolkit also provides substantial b~oundlns in kc? Jr&.;lr
OF financial analysis and project fimncc. 'l'hc toolkit prr,vidcs the uscr nit11 3 Jcta~lrd critical path beginn~ng with initial conceptual stage through thc stabv u k ~ c in\cunn-nt nuy be sought. By following the steps set forth in this toolk i t , projrrt drvcluprs will h. .~blc to understand the opportunities oNcrecl hy lhe carbon finawc oudcl. as ucll as tk
nlethods for valuing projects and the emissions reductions.
The carbon finance niodel is a methodology used to commalitire and sell the environmental benefits of reducing emissions of greenhouse gas pollutants. This d l incorporates the revenue stream associated with the sale of emission reductions into rhe traditional projectJinn~~ce model. Project finance involves the struciuring oftranvctHHh in a way that links risk and returns to those parties that can most efficicntl?. I IUIU$~
various types of risk inherent in a given project. By taking on risk. investors are cnt~tled to certain specific revenues from a project. By locking-tn this risk-mum relat~onship. a project can reduce the overall risk of project failure. By adding revenues fmni emissions reduction credit sales and using the project finance model, clean enugy pmjeclr u n be made more financially sustainable (higher returns and lower risk) u-h~le n~ll prov~ding environmental benefits.
As regulations evolve and more carbon-based transacttofis ofcur, it is important to recognize the tremendous opportunity to foster commercially viable, envimnmentally beneficial projects through the pmject financing model. The vast majority ofGHG emissions result from private sector activity around h world. Pmject finance hs made possible several sustainable private sector energy projects. By showing the prib-ate sa-tor a methodology offering higher retums and reduced risk, larger numbers ofemisslon reductions should occur.
Lenders of project financing will consider any reliable revenue sueam as a potential security against their investment in pmject development. The lendas' primary concan is that the revenue streams be large enough to cover the debt m i c e obligations of the project and secure enough to mitigate risks of interruption or default. The market talue of carbon credits will determine whether or not revenue streams are large enough to cot= debt obligations. while additional mechanisms such as performance contracts matipre the risks of interruption or default.
By introducing the potential revenue s t m m s from the sale ofcarbon anisston reduction sales into project financing. the threshold for commercial investment in renewable cncrg! and energy efficiency projects could bcg~n to fall around the world. At present. emlsslun reduction sales only represent a small portion o f a project's return, but as the internation31 community comes to apxmen t on a climate change mitigation vehicle this port~on u i l l ow. Projects that are completed and become operational will achieve global environmental benefits iv~thout taxing scarce public resources de\otcJ in n.it~orui and
~~ -..-
CLlN I: Fostering Cl~matc Change lnitiatlres for Susta~nable De\ elopmeni Task IC: Computat1on31 Twl K I ~ I
local ohjcctivcs. and i n ni311y casts c<)nlrihuting to tltt~sc ohjcct~vcs. as well. As nlorc projects hccomc opclati<nlal nlicr project lirlanci~~g, thc s;lnlc i~titial invcstmc~~t rcsotirccs will be liced ibr rci~tvcslmcnt in additio~lal projccts 1Itat acliicvc tlic sanic goals. C I I S ~ I ~ I I I ~ :
a siaslainablc. long-tcmt pall1 lo bc~rclicial projuct devclopnic~tt.
Background
I<cnewable and clean encrgy tcchn<)logics arc generally charactcrizcd hy rclat~vcly liigli capital costs and low operation and maintenance costs. These charactel-istics make t hcn~ attractive in the lohg run, but less so in a competitive setting where thc premium is o11 near-term cost minimization. Renewable generating technologies continue to make advances, thereby illcreasing their efficiency and lowering cost; however, outside of some niche market applications, they still are not economically competitive with conventional sources of power. The Corbor~ Finonce Modc.1 can, in many cases, makc these projects more attractive to possible investors by helping the project return their invesmient faster.
As regulations evolve and more carbon-based transactions occur, it is important to recognize the tremendous opportunity to foster commercially viable, environmentally beneficial projects through the project and carbon finance models. Today the vast majority of greenhouse gas (GHG) emissions result from private sector activity around the world, rather than government mandated activities, as most would assume. At the same time, sustainable private sector development has accelerated with the wider use of the project finance model
By developing financing models that rely on a commercially sustainable base such as carbon offsetting finance, the clean energy projects could be freed from a subsidy regime and stand on their own inherent strength, for the resultant environment benefits from these projects.
Organization
This toolkit is structured to take project developers step-by-step through the process of developing the financial structure o f a project using the carbon finance model. The following section (2. Understanding the Carbon Finonre Model) outlines the basic foundations of carbon finance. The major section of this toolkit (3. Implementing the Corbon Finance Model) describes the steps necessary to develop a project financial structure based on the carbon finance model. Much of the material in this section reflects traditional financial concepts. This was done to insure that carbon finance is understood through traditional finance terms. The critical path diagram outlines the steps necessary to construct a successful project using carbon financing. The diagram below describes the basic steps necessary to integrate the carbon finance model into a project.
CLIN I: Foster~ng Climate Change Initiatives for Sustainable Development Task 1C: Computarional Tool Kit 2
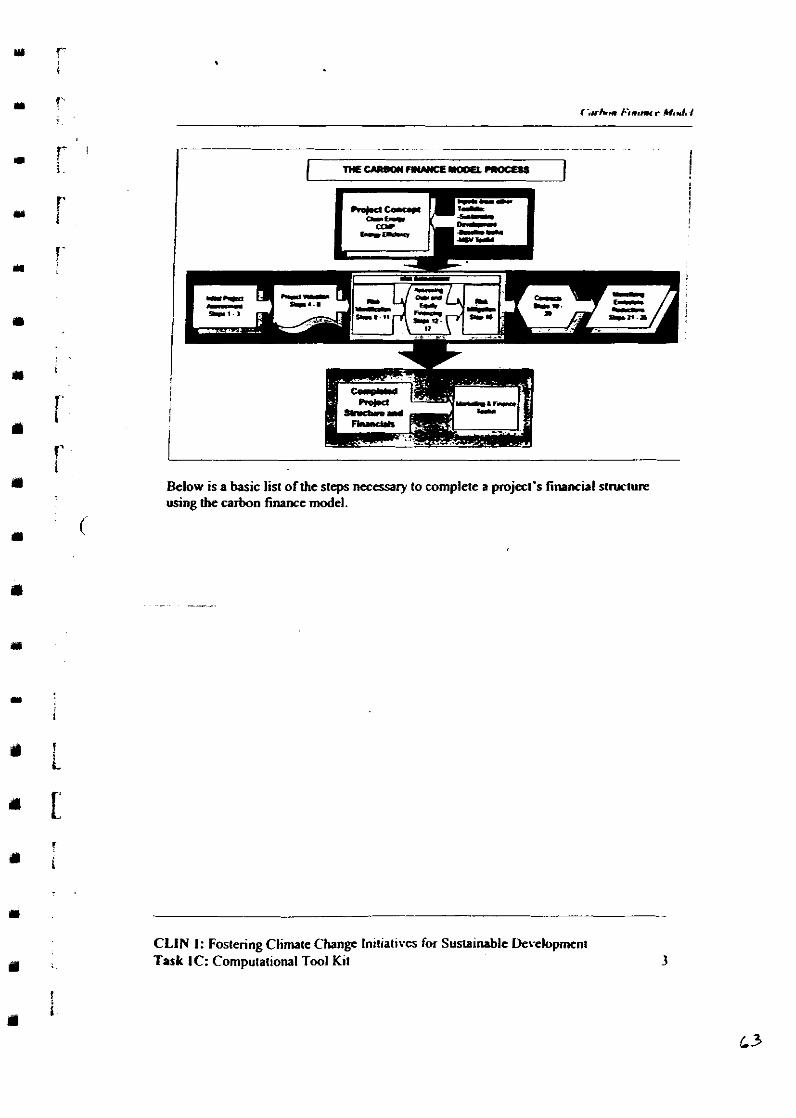
Below is a basic list o f the steps necessary to complac a projat's financial slnrture using the carbon finance model.
CLIN I: Fostering Climate Change In~t~at~vc-s for Sustainable Devclopmcnt Task 1C: Computational Tool Kit 3
The purpose of this section is to help developers better understand the carbon finance model and how it relates to their project. This section further goes into a discussion of the linkages between the carbon credit market and traditional financial concepts. The use of the carbon finance model requires an understanding of the carbon credit market as well as basic project finance concepts. With a solid understanding of these basic concepts and linkages, users will be able to better understand the carbon finance model and the Project Lockbox concept in order to 'lock-in' the revenue stream from a clean energy or climate change mitigationqxoject (CCMP).
What are Emission Reductions?
Trading of allowances, quotas and emissions credits is recognized in many countries as a market-oriented and eficient way to reduce harmful pollution. Credit trading harnesses the forces of supply and demand by enabling firm- or individual-level decision-making that steers scarce resources to the greatest marginal benefit at the lowest cost. Credit trading allows the benefits of renewable energy generation, primarily pollution reduction or other "greeneen'benefits, to be "monetized" (brought into the price system). The creation and trading of credits allows various specific benefits (e.g., emissions avoidance of a particular pollutant that would have been emitted by conventional technologies) to flow to those that value them most. Lastly, and not least, credit tpding operates independently of energy markets. Credit markets are not tied to the time-sensitive energy markets where time of delivery is of paramount importance in determining what values are earned from energy sales. In addition, buyers of credits need not be located near the source of emissi6ini~uihi 'ns.
The sale of emissions reductions represents an opportunity for clean energy and CCMPs to monetize at least m e of its environmental benefits and to generate additional revenue beyond the value of the service delivered by it.
How does Carbon link to traditional Finance?
Carbon finance is a combination of some very basic concepts in Corporate and h j e c t Finance. In carbon financing, basic principles of corporate finance are used to value a project in order to characterize bow financially viable it will be compared to other projects. Basic tools in project finance are then used to commoditize the revenue stream from the sale of carbon emissions reductions and insure it gets to the appropriate party. Under a traditional project finance structure it is usually the debt financier who receives the locked-in revenue streams. in the carbon finance model, i t is usually the equity holders of the project that own the rights to the carbon emissions reductions and the associated revenue stream.
CLlN 1: Fostering Climate Change Initiatives for Sustainable Development Task IC: Computational Tool Kit 6
Cumorate Finance Typically, private sactor amgy projects are financed through corporate financial transactions ("on balance sheet"'), issuing stock to the private or public capiul h a s or borrowing from lendm, where corporate ass& save as the fundamcnul gurnntas to the invdors and the Idm. In the case o f debt financing, ladas (i.e. commucial and investment banks) always enjoy, by law, senior or preferrod access to repa- o v a equity h o h (invcstm and stakeholdas). Thcrr uc a variety o f f ~ h l imbuma*l that fall i n between these two categories (it. ~ i n c l j u n i o r deb5 convatibk debentures, ctc.), which are employod in a great number of- lo fill in the finmcing gaps. Debt f-ing is wnsidacd less risky, baause of the kgal and con& guanntccs employal, and therefore curies a l o w oosf i.e. an i n t a d nte tb.1 h lova than the e x p d nte of mum on equity. The holders o f thcsc f i nu rW hrsmamcs thcn avail th-bes ofthe capital m a r k s to bade chcs insbumnts ("sacutiticsx tuausc the &ying value o f the instrument changes ova time allowing the inharat ridrs ad benefits to be shared among a wide variety o f financial intamcdiuia (brokaldclks). investors and debt holders. The corporate issuer o f the financial instrument is uhimately rsponnile for the performance o f h e instrumen5 and therefore IiaMe for any losses incurred by investors and lenders.
CLlN I: Fostering Climate Change Initiatives for Sustainable Development Task 1C: Computational Too1 Kit 7
Proiect Finance In the 1980s. pmject finance ("offbalance sheet"), as opposed lo corporate fmance, became increasingly popular as i t shielded the corporation rrom liabilities ("limited or non-recourse financing") and provided mostly lower cost long term debt financing, which allowed the private sector lo become increasingly involved in managing and operating long term public infrastructure assets. CCMP type,projects are, generally speaking, considered infrastructure projects and will increasingly turn to project structured tinancing mechanisms in the future.
Under the p~oject~financing scheme, a project is funded against the cash flow that is generated by the project. Risks are balanced against the project's cash flow and assets. The project is isolated from the parent firm as much as possible, sometimes established under a separate operating company to provide minimum exposure. Investments are made directly to the operating company, or by other mechanisms when a number of intermediate firms are involved in the contractual arrangement. Borrowing for the project does not show up as debt on the parent company's balance sheet. This arrangement removes or limits the parent company's assets from recourse action, so most if not all of the project risk is transferred to the lender. Thus, the structure of the project finance arrangement must provide the lender with sufficient security in another form (such as a larger percentage of the cash flows). The additional costs associated with establishing a separate entity and managing the legal arrangements lead to projects being viable only when they are somewhat large. Since 1993 many infrastructure projects especially IPPs have been developed through pmject finance in India.
What i s t h e Proiect Finance Lockbox The phrase 'lockbox' comes from the idea that once the pmject financial structure defining which equity and debt holders have the legal right to a revenue stream, it cannot be altered. In this way, if the project developer comes under financial distress due to other business activities, the pmject shareholders are not impacted. Thus, the pmject is by definition viable or sustainable in the long run because it is isolated from this possible financial distress of the parent company.
CLIN 1: Fostering Climate Change Initiatives for Sustainable Development Task 1C: Computational Tool Kit 8
This checklist is intended to allow the facilitating CCC and project developers to do a son assssment of the potential to benefit from the carbon finance model. It is not intended to be used as a strict requirement for project developers (i.e. if these questions cannot be answered, the developer should not proceed). In order to proceed, each project developer must evaluate the project opportunity based on his or her own criteria. If, the developer has trouble answering these questions, the model may not be appropriate for this particular project. If most of these questions can be easily answered, the carbon finance model is probably appropriate for this particular project.
Step 1: Review the cbecWist to see if carbon finance is appropriate for Ibis project.
Step 2: Review tbe project to insure that: 1) it can be rblistieplly implemented, 2) reduces GHG emissions, and 3) can assist the developing countries in aebieving sudsinable development.
- -
Choosing a Business Model
A project developer must decide on the business model that will result in a project with the lowest possible risk level, while offering a return that is acceptable to the developer and investors. In the process of trying to reduce risk the project developer must take into account the concerns of the project debt and equity holders. Each project participant will have different considerations in this regard. Two project ownership and management structures are offered in this toolkit: 1) the parent company approach, and 2) the special purpose vehicle wmpany. These models are also sometimes called on-balance sheet financing versus off-balance sheet financing.
The parent company model allows project developers (or another sponsor) to keep the project on their own balance sheets making the project (for all intentions and purposes) part of the project developer's parent wmpany. All interested debt and equity holders will then invest in the project developer's company, relying on the project developer to invest the funds in the new project. This model has its advantages and disadvantages
CLIN 1: Fostering Climate Change Initiatives for Sustainable Development Task IC: Computational Tool Kit 12
freecash flows. The value of the business will be the present value of the rrcc cash Hows generated by the business. The discounted cash flow (DCF) procedure includes estimating free cash flows to a time horizon when the cash flows follow a steady gmwth pattern. The steps involved in a DCF valuation of a project arc given below:
I Step 4: Valuing the project 1 1. Estimate free cash flow. (Cash flow may be negative in early years of
project implementation and start-up). 2. C h p o ~ e the horizon date. Free cash flows are estimated to the horizon date
fiom which point the cash flows form a simple gmwth pattern, so that one of the valuation formulas can be applied.
3. Estimate the horizon value (Discount ate)'. This may be very sensitive to the assumptions and will have to be crosschecked with other criteria or benchmarks such as PE ratios, and market to book ratios of other similar companies. For the purpose of valuing the project the weighted average cost of capital will work.
4. Calculate the necessary payback period for the initial investment. This is the number ofyears it takes to accumulate enough capital to payoff the initial debt and equity investment
Step 5: Complete a basic projected Income Statement for the project.
Some Basic Conce~ts The key to valuing the project depends on the pmject developer's ability to accurately forecast the project's future cash flow. The Present Value is the current value of future cash flows discounted at the appropriate discount rate. One dollar of cash received next year is worth less than one dollar received today. The discount rate can simply be the minimum percent return needed or expect in return from the pmject to account for the developer's cost of capital (the opportunity cost). This is in essence, simply discounting future cash flows back to the present time. Thus, the present value of any future cash flow is its current equivalent. The process of computing PV of future cash flows is called discounting and the rate of interest or return used in computing the PV is called the discount rate.
' This is different from the 'Horizon Date' which i s the can be considered the linancial lifetime ofthe projccl.
CLlN 1: Fostering Climate Change Initiatives for Sustainable Development Task 1C: Computational Tool Kit 14
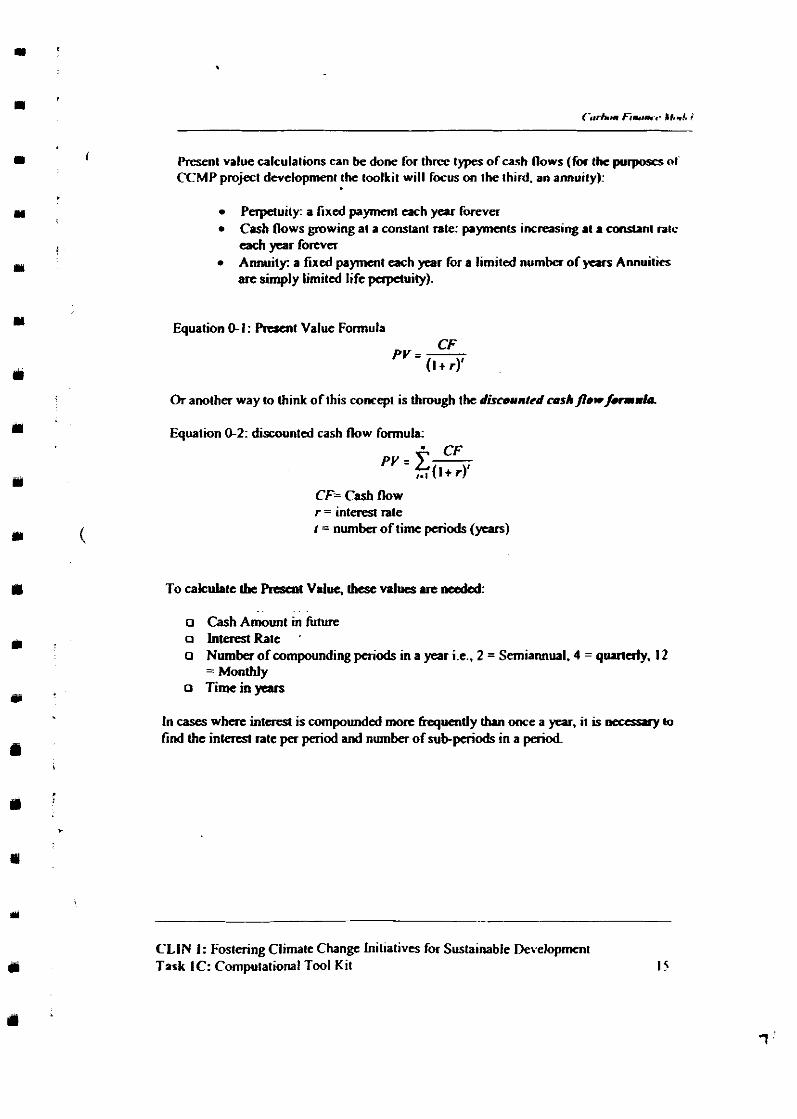
Present value calculations can be done for thnxr types of cash flows (for U u purpobcs 01' CCMP project development the toolkit will focus on the thid. an annuity):
Pexpetuity a fixed payment each year fwcver Cash flows gowing at a constant rale: payments increasing at a conslant ntc each year forever Annuity: a fixed payment each year for a limited number of yeus Annuities arc simply limited life papetuily).
Eauation 0-1: RcKnt Value Formula
Or another way to think o f this wnrept is through the disceuntrd r u s h / l r w j m r l r
Equation 0-2: discounted cash flow formula:
CF= Cash flow r = interesl rale I = number of time periods (years)
o Cash Amount in future o lntercsl Rate . 0 N u m k o f compounding periods in a year i.e., 2 = Semiannual. 4 = g w a f y , I2
= Monthly Timem ycus
In cases where i n t d is compounded more Erequencly chn once a par. it is oacas~y to
find thc intertst n t c per period and number of sub-periods in a period.
CLIN I: Fostering Climate Change Initiatives for Sustainable Development Task IC: Computatioml Tool Kit I!
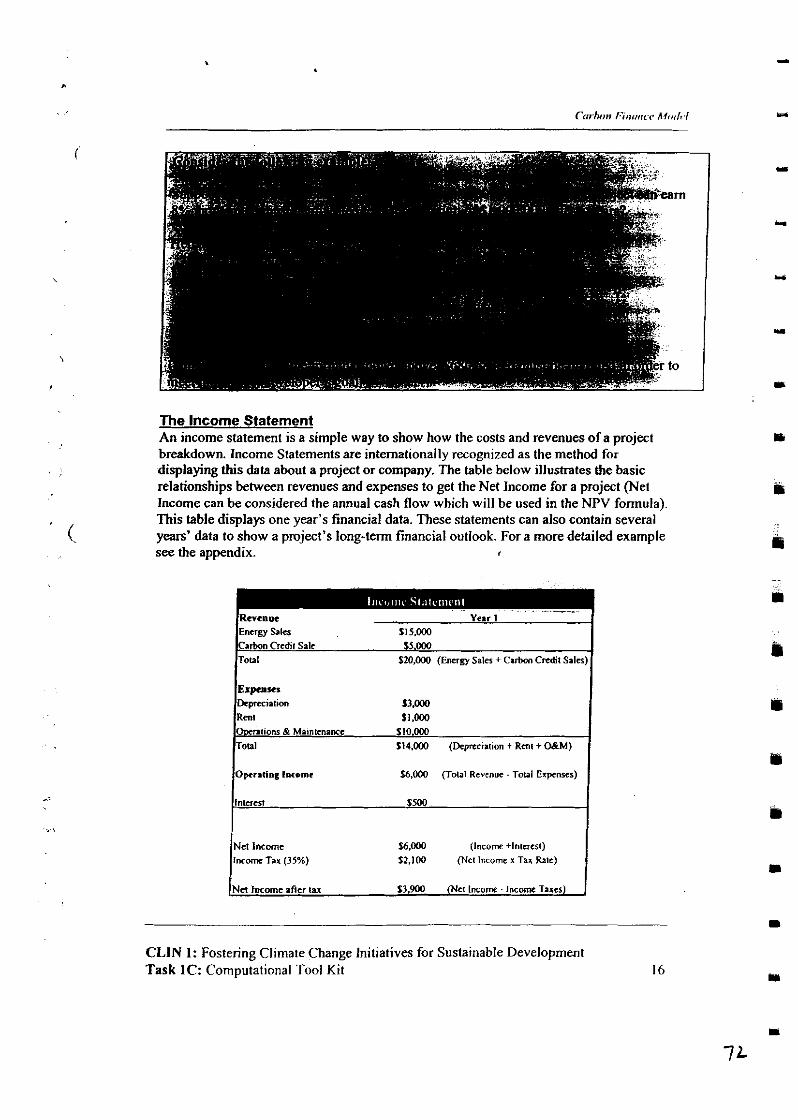
The Income Statement An income statement is a simple way to show how the costs and revenues of a project breakdown. lncome Statements are internationally recognized as the method for displaying this data about a project or company. The table below illustrates the basic relationships between revenues and expenses to get the Net Income for a pmject (Net Income can be considered the annual cash flow which will be used in the NPV formula) This table displays one year's financial data. These statements can also contain several years' data to show a pmject's long-term financial outlook. For a more detailed example see the appendix.
114.000 (Depreciation t Rml + M U )
%,WO (Total Revenue - TwI Expenses)
(Incorn +lnlcrca) l n c m Tax (35%) 12.100 (Net Income x Tax 101)
CLlN 1: Fostering Climate Change Initiatives for Sustainable Development Task 1C: Computational Tool Kit I6
Discount Rates In order to evaluate a project's financial viability. a process ordi-ting future year cadi flows has been developed to lake into Kcwnt the lasc oppottunily of doing wmihing else with the investment capital (thc apilal could h v e bem sitting in a saic back account earning intenst). This n t e is the opportunity cos( ofcapilal and determind as the n te of return that can be cxp&tcd from d t a ~ t e invcstmcnts. olba similar -able emrgy projects or simple govannmt bonQ. The nte s h w M also mflat the investment's risk. In simple tams, it is thc rate of&urn on invcsbnmls of comparable risk. One typically looks to the market to identify an invsimmt o f c a n p n b l e risk. later the toolkit will be dealing more explicitly with eumpks that merum this risk and its impact on rates ofpturns. The tams "'oppmmity cat" and 3 d e ntc- will be used in ref- to this discount rate.
Thc discount rate is a key component to cakuhte the present value of future urh flows (NP'J).
To cakulate a discount rate, the following values are needed:
o Future cash flows o Number of cumpounding paiods during the year (2=smiannual; 12=monthly) o Time in years
In case of int- compounded more fngucntly than once a year, it is mesmry to &ermine the am14 percentage rate (APR). APR can be found by mukiptying the periodic rate with t h e ~ ~ u m b u of paiods in- year.
For mw, while cakuhtiag the vlluc oftbe pject, simply U f y a diPcouM nle, which reflects the project develop& requid rate of return. 'lhc toolkit will return to the imK of discount At& when dikuspingibc Weighted Avaage Coa ofC.pilal (WACC) later. This section will help ibcdrporate a project's debt and equity holds's considentiom into the calculation ofa discount rate.
I Step 6: Estimate the di#out or hardle rstc I
CLIN I: Fostering Climate Change Initiatives for Sustainable Development Task 1C: Compuiatiml Tool Kit 17
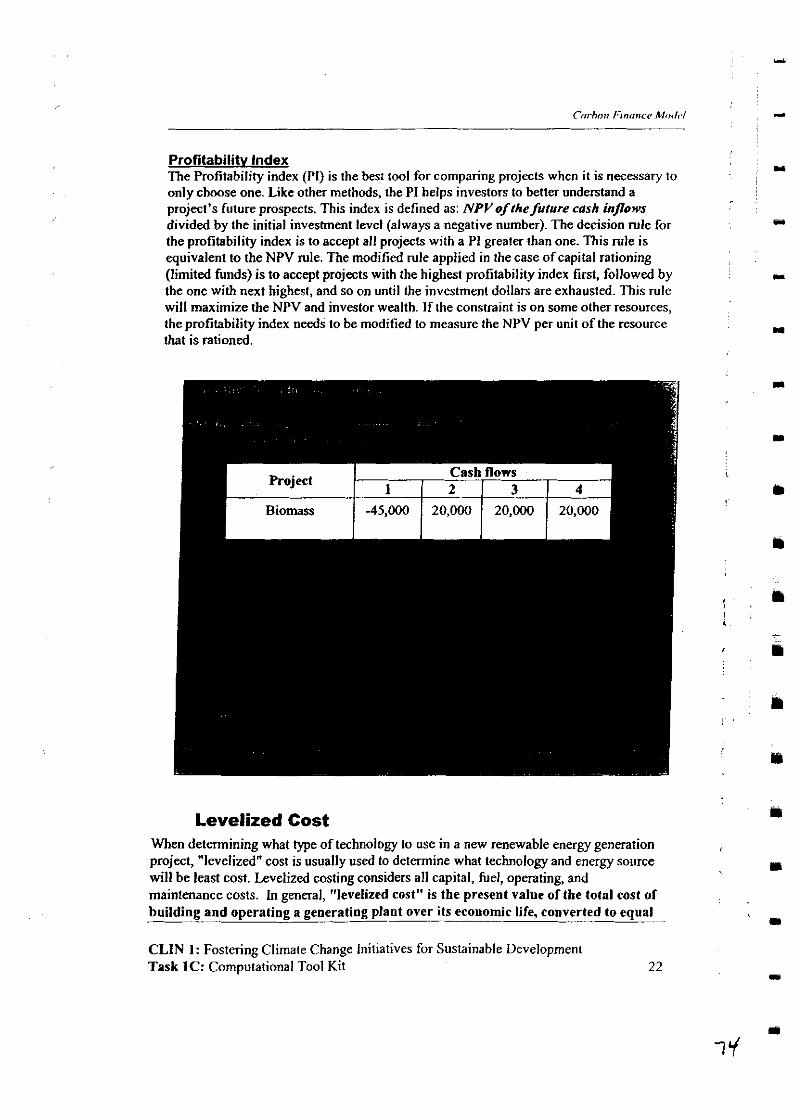
Profitabilitv Index The Profitabilitv index (PI) is the best tool for comnarine nroiects when it is necessarv to , ~ . , -. >
only choose one. Like other methods, the PI helps investors to better understand a project's future prospects. This index is defined as: NPVof thefuture cdsh inflows divided by the initial investment level (always a negative number). The decision rule for the profitability index is to accept all projects with a PI greater than one. This rule is equivalent to the NPV rule. The modified rule applied in the case of capital rationing (limited funds) is to accept projects with the highest profitability index first, followed by the one with next highest, and so on until the investment dollars are exhausted. This rule will maximize the NPV and investor wealth. If the constraint is on some other resources, the profitability index needs to be modified to measure the NPV per unit of the resource that is rationed.
Levelized Cost When determining what type of technology to use in a new renewable energy generation project, "levelized" cost is usually used to determine what technology and energy source I will be least cost. Levelized costing considers all capital, fuel, operating, and maintenance costs. In general, "levelized cost" is the present value of the total cost of building and operating a generating plant over its economic life, converted to equal
I
CLlN 1: Fostering Climate Change Initiatives for Sustainable Development Task 1C: Computational Tool Kit 22 -
annual paymat* In levelized costing, capital costs are amodzcd o v a che apmed power wtput for the life of the plant. This cost metric will nol be useful f a d l proje* typcgOnlyusethis forcaagyg~projeaS.
In tbe contat of most asgy projects, levelizcd cmts uc the alcubtad avenge cuss pa Lcibanu-hour of genenhg electricity o v a the p h t lifetime, includimg ovanigh #ul costs per kilowan, tixed opaationr and maintcnurc (O&M cuss per tiloang nrLbk oaMpcrk~dfudeo~rrperkWh,usingaspeeif i tddiscocotRte) .
Tbe pineiptl phm mtscsl plus equity gives the mnd wpipl cats, whik tbe ope- coetr~etbc.nnuJvlrLblccosts. Depacttionisodtedoutba.au~titisacqi~ expmse. Thc equity n luc urn be d i n g beause nomnlly it is nol noxsmy to q a y ~tyonanprmdbasis.Tmtthis.stheprymcnttheprojactMuld~e~equi~if the project were giving than the mtum tbcy expected annually. So bra t it like 8 ban (chc initial equity amtribution acting as the principal) with an intcrcst mte ~~IuI to the discount rate being usd for lhis project.
N c q 1.tr tbc present n l u e of ucb y a r ' s costs a l d a t c d abovc Uw the Rcsent Value methodology d ~ ~ i in the Net Present Volue Seaion.
AululirctkPV A " ' g the present value of ihc project costs will give an md cost of the projac ~ o n c o a s t a n t ~ y m c a r s a n d a c o a s t a n t i n t a e s t m t e . T o ~ h t e t h i r v l ) r r ~ take tbe smn of present d u e of esch rear cash flows and divide by I& aMlbs of m the project horizon (or lif&). This can be comidacd the mnd payment ~ c c c s ~ r y
to wvw the cost of the p r o j a
C d d a t c a per kilowatt b a r n l u c Take the annualized presatt value and divide by the totll mnnbcr of tilowall bcnnz pmduced pcr year. This will give a d o h per kwh valuc.
Step 8: C.kal.te the Lndkd Cart of tbc Project 1 Part 1: Clldatc tk &for ach y a r
[(opaating cmts - depreciation + i n t d ) + taxes + principal on W+ equity] I
CLIN I: Fostering Climate Change Initiatives for Sustainable Devclopmenl Task IC: Computationa1 Tool Kit 23
Carbon Finance Madel
Risk Management
Risk management involves rssessing and managing a project's exposwe to various sources of risk thmugh a pmcess of identifying, labeling, and mitigating these r i sk Risk, generally speaking, should not be thought of as the *'chances of someihing going wrong, ' but instead sbould be viewed as the volatility in future events that could impact a project @oth positive and negative). lhis may be a very new way to think about risk for many people. By defining risk as the pmbability of an cxpectal event not occurring ur predicted, it is po&iile to begin developing strategies to reduce the unpredictability in a project. By dwhg the unpredictability of a project it is ponsiile to vcry mmately predict project outcomes and the subsequent revenues b m these outcomes. Knowing (with s high l m l of predictability or confidence) what the project's future revenue stream will be, makes financn more willing to fund a project Low risk projects with positive returns are. highly valued to debt and equity investors. This will result in funding offers on better terms to the pmject developer.
'Ibis section begins with a basic backgmund discussion of what exactly risk is, and then it moves on to how to identify, quantify and reduce a pmject's exposure to risk. Specific attention win be paid to risk mitigating contracts.
Background on Risk Risk has lraditionalty been measured against U.S. Treaslny bills (1-bilis), which are &daed risk-less and the bmcbnwk for the safest inveshnent possible. On the 0 t h extra& small-companynew wabms have pmvided the highest historic rdms, but also canyae l @ i L l e v e l of risk. The historic returns for the Trcaswy bill @olio have averaged 3.8 percent in nominal terms compared to the S&P 500 portfolio return of 13 percent and the small-5m portfolio's return of 17.7 percent These historic avmges are offen used to estimate required rates of returns or opportunity cost of capital. These increasing rates of are in tandem with inrreasing rates of risk.
Interest rats change frequently, and the expected return on the market will change with them. The energy market until recently had very stable and predictable rdums, today this is changing. However, the risk premium on the market (the difference between the market return and the return on a risk-& investment, t-bills) is fairly stable. Therefore, to estimate today's expected return on a project, take the current treasury-bill yield and add to it the normal risk premium (the long-term average) that other similar projects have earned above kamy bills.
The idea of risk is a familiar one and implies uncertain outcomes, many of which could be negative. The rdurn fimn an mvestment in a pmject often cannot be predicted with any accuracy but using effective risk evaluation techniques can help reduce the uncertainty surmunding predictions. The use of statistics helps us to analyze this type of risk in a precise way. The returns of previous similar projects give a good indication of
CLIN 1: Fostering Climate Change Initiatives for Sustainable Development Task 1C: Computational Tool Kit 24
c-lVw(p.litialRbt) Pditiulanlcamby*amohmthe-ria-.Thuismdnlyr fimction of WMIU a pow devdopcr comidcrs politial risk 8 d s d of axmmy rbt
C L I l Y I : F o s t a i n g ~ e C b m g c ~ a i t L t i v c s f o r S u s t . i a r M c ~ Tuk 1C: C o m p o t . ~ Tool Kit 25
Carbon Finance Model
Country risk is g e n d l y defined 8s risk caused by actions of the government that may adversely affect the mnomic environment in which a project opemtw and, m turn, may negatively impact the project's ability to m a t its financial o b l i g a h in a timely hhion. This risk incorporates the impact of government policiw that influence the financial and business ~~~~ent faced by the project, including uncertamtiw related to the exchange rate, interest rates, labor market conditions, taxation, regulation, and inbnstructure. Country risk can directly impact a project's ability.to get financing, the cost of debt servicing, the availability and cost of inputs, and the demand for outputs or saviccs. Country risk can incorporate '&mvIgn Rhk'which is associated with the national govanments debts to outside leaders. Sovereign Risk is the wuntry's cndit ratmg in r e f a c e to the pbability of the country paying back this debt.
PoIiticaf Risk Political risk is specifically associated with a major change in political climate or government policy that wuld impact a pmject. Political risk will impact most CCMP or clean energy projects in emerging markets because these governments still have considerable regulatory control over the energy sector in which most projects operate. This risk can be measloed at both the country level and the project level. The most wnnpon example of wuntry level political risk is a change in government, which impacts foreign owmrship and investment m energy projects. If a project has outside investors, such a change in policy could result in the loss of operating capital. At the project level, a new government could drastically increase a project's tax rate, causing it to no longer be wst effective.
One of the most important fktors when evaluating a project (clean cocrgy, m, or othawise) is whether it is likely to pPvide a competitive price for a produd or savice, which will generate sufficient cesh how to meet ail of its obligati&(most importantly its debt). Economic risk is the risk that a project will not generate the forecasted revenue stream to meet these obligations. This risk is impact by multiple variables:
o Demand: A project may be designed and functioning within acceptable parameters, but fail to gcncrate suficient income due to a tack of demand or mteresl in the project's cnd product Pricing: Again, a project may be designed and functioning within acceptable parameters, attracting an adequate number of customers (demand), but be over or under priced causing the project to not be able to meet anticipated revenue projectiom.
o Variable Cmb: When designing a project, basic predictions are used to forecast the cost of important project inputs. In many cases t h e fomasts can be wrong or the macmewnomic environment in which they were d t e d may change, causing the pmject needs to also change. This can have both a positive and negative impact on the project.
Currency Risk While not pertinent to projects financtd entirely within India, any project with foreign owners, investors, or debt sources (including most World Bank loans) can be severely
CLIN 1: Fostering Climate Change Initiatives for Sustainable Development Task 1C: Computational Twl Kit 26
~ ~ = d r i s t P a b o u l d b c r r f l e d e d i n ~ p i c i a e o f t b c c D d ~ ~ m C p n + d viacraannypodm(~,~~laavingr,ac).hmrpmtingrisLin t h c ~ o f a ~ a n k d i f f i c u h , k d a o b c m d c a s i a w h c n a ~ i f a ~ k , a ~ c b a s m o t b c r p o j e c t w i t b a ~ r i s t ~ m d ~ g e h m a ~ y eolamiesdcaDcncrgy~mp~connaazsoiawsrasrmyrcqPbcmacrcwiry on their a a h i g h ntc of rcbnn d m projects m W c a s n Emopc a the lJnikdsht€.s.
CLIN 1 : F ~ C l i m r ( c ~ I n i t i a t i v ~ f o r S ~ D e v d o p a c n ( Tuk 1C: Comput.&xul Tool Kit 27
Carbon Finance Model
Fmm the investor's perspactivc there are several other project specific rink factors that a project developer will need to a d d m in ords to receive debt or equity financing and insure they have an adequate revauc stream to pay their debt obligation:
o Legal RisA: A project that docs not take into account the I@ r~quhnents of its o p t i o n s can fail to begin operations. Project d e v e l o p ~hould review all operating and ccmtract laws in a region bcfqrc they begin construction.
0 Consfructfon Risk: The potcntirl for any large clean enilgy project or CCMP failing to complete wnstrudon on time, in accordance with the planned specifications, and on budge is often very high.
o Transach@ Structure Risk: Welldesigned projects may not have a sound financial shncture, W e the project specifications are hportant, the h c i a l analysis is .Iso n v to insure tbc project is financially viable.
o Opemting and Technology Rlsk F'mjects using new or unproven technologies (an issue with some clean energy technologies) run a higher risk of technical difficulties then traditional technologies.
o F'r'ect Pdonmnce: Lack of historical or meaningful performance data may make it difficult to predict performance.
o 2 X r d - m Perjoonnance dReliabilrly: Reliance on physical asset (property, plant, and equipment) services, short-term credit support pmviders, and other equityldebt parties may d t in increased risk.
o Repcryment Rate: Investors may face uncatainty with regards to the timing of the principal retum of their investments.
Clean enagy pmjects and CCMP may also be iofluenced by marroeconomic &tors speci6c to the type of project. Peabps one of the largest factors impscthtg risk is tbe uooatai4fy mmmmdhg a host nation's effortp in tbe climate change ama If a project developer . -*+ intends to pe r a t e + emission reductions fium a clean energy project and sell them abmad, it will be necessary& insure that the foreign government reeognizcs the credits as valid.
CCMP and Clean Enerav Proiect SDedfic Risk There are many so- of risk associated with the types of projects, technologies and locations likely to be involved in a clean energy or CCMP investment. In particular, small energy efficiency and renewable energy projects in developing wuntries face risks related to size, location, technology, dispersed customer bases, lack of credit-wody customers, etc. In a wmmercial environment these risks drive the reuuired rates of retum for &mmercial finance higher than tho& required for wnventidnal energy project investments. Three other types of risk are worth mentioning in more detail: 1) climate change regulatory policy Ask, 2) baseline risk, and 3) moniioring and verification risk.
o Climate Change Regulatory Policy Risk: At present the regulatory environment will not drive or monitor the market for emission reductions. Project developem moving forward to develop their pmject today may find in the future that their pmject does not meet the specifications of the future regulations.
CLIN 1: Fostering Climate Change Initiatives for Sustainable Development Task 1C: Computational Tool Kit 28
~ w i l l ~ t b c b o a c o m a y t o m i e w d ' r a g ( ' a a r t i f L r p o i e d for~mhding.CeiiingH~wuntty.occpcmcecmldbc8hnDcto selling the credits.
RdsctRhkkknWiation A n ~ ~ s t e p m t k r i s l r i d c l l b i ~ p a r s s b t h e d c v d o p m c n t d a ~ r i s t ~.AriSLrmtrixisa~ttlMc~tbcpmpdridt6ulmmtbckltedmm. dthe~miti~toolsintbclopm.AsW.rcidmtified,tbcpojccldmlopa simply includes tbem in tbir t&k. ODCC tk poj&1 dcvJoper hrr 8 @ '
"q of dl the risk fadorJ i m p h q tbc pojed, they eaa tbcn decide bow to mitigtc h e risk. AoarmpkriskmatrixcmbefoPndintbcAppauiix. ,
CLM 1: Fostering C i b t c Change Initiativa for Sustainlbk tkdqmcnt Tuk 1C: Cornputstid Tool Kit 29
Measurinq t h e Impact of Risk Factors
The relationship between risk and return, Betu , In order to better evaluate a project investment's risk, it is necessary to first measure its market risk (i.e. the impact of the overall market on the project). This is the risk to the project that cannot be mitigated. Ideally, investors desire a project that is impacted only by positive marketevents and resistant to negative market risk (a hard goal to achieve). To measure a project's sensitivity to market risk, financial experts have developed a tool called beta (IP) to measure how a project is influenced by the direction of the market. This can be done in two ways: I ) use the general 'market to evaluate only macro level risk factors, or 2) use the specific market the project is operating within (probably the Indian energy market) to more closely predict market and project specific risk factors. Under mature market conditions it is possible to get beta (/I) information on organizations similar to the project developer's own, allowing the developer to accurately examine the impact of market risk. In less mature, less fluid markets it may not be possible to perform this analysis.
Eguation 0-5: Expected risk premium
r-r, = j3(rm-r,)
r,= risk of a risk free investment r = project specific risk r,,, = market risk J = Beta
The equation above describes the relationship between beta and the project's associated risk factors (or the project's sensitivity to market changes). If beta is found to be above one, the project reacts strongly to changes in the market and the reverse when beta is below 0 (values between 0 and 1 move with the market, but not as much). So a project with a beta of greater then I would do better then the market average under positive market conditions, and worse under negative conditions. The risk premium ( r - r,)
varies in direct proportion to beta.
A beta coefficient will not be available in most projects, but in certain cases it is possible to apply an industry average or U.S.-based firm's beta coefficient, if the proposed project is similar enough to the a U.S. or other OECD industry benchmark. It should be noted that this formula applies to equity capital and not debt capital. A project will likely be financed with both debt and equity and therefore the risk-adjusted cost of capital will
CLIN 1: Fostering Climate Change Initiatives for Sustainable Development Task 1C: Computational Tool Kit 30
rcflecl a weighted average cost ofupi la l (WACC), which will bf weighted xconling to the debl and equity breakdown. The WACC will be described i n morr deiail below
In situations where no bela value is available. and the developer feels it is noc appmpriate to use U.S. or other OECD awnhy data, the following procedure is s u w c d .
Ask bankers or other f i ~ n ~ b l specialists what Baq is right for a region and project. Often, f-ial rrsarch firms publish this information.
An Al~emativr: Finding Beta through scenario a ~ l y s u An altanative m+ for finding bell CB) is to use &o analysis. Sanuio w lys i s involves identifjring sevaal different p r o k t outcams (ud the p h b i l i t y o f chos outcows) basd m the rislrs the project cannot mitigate. For cx.mple, i t m y nol be possible to aczunlely predict the direction a country's economy wil l hke m t yar. The direction ofthe economy will directly impact a project's mmuc for chu yar (and the value o f Beta). By examining three different possible outcomes: Reccskm, Sum qw, and Boom a develouer can take into account the mssibk future fluctusrions in mane. giving lenders grratcr comfort in their investment the project. The cxampk below illustrates the m&odology necessary to conduct this wlys i s and fud Beta.
CLIN I: Fostering Climate Change Imtial~ves for Sustainable Development Task 1C: Computatio~l Tool Kit 31
, B ~ ~ ~ AVAILABLE copY

CLlN 1: Fostering Climate Change Initiatives for Sustainable Development Task IC: Computat~onal Tool Kit 32
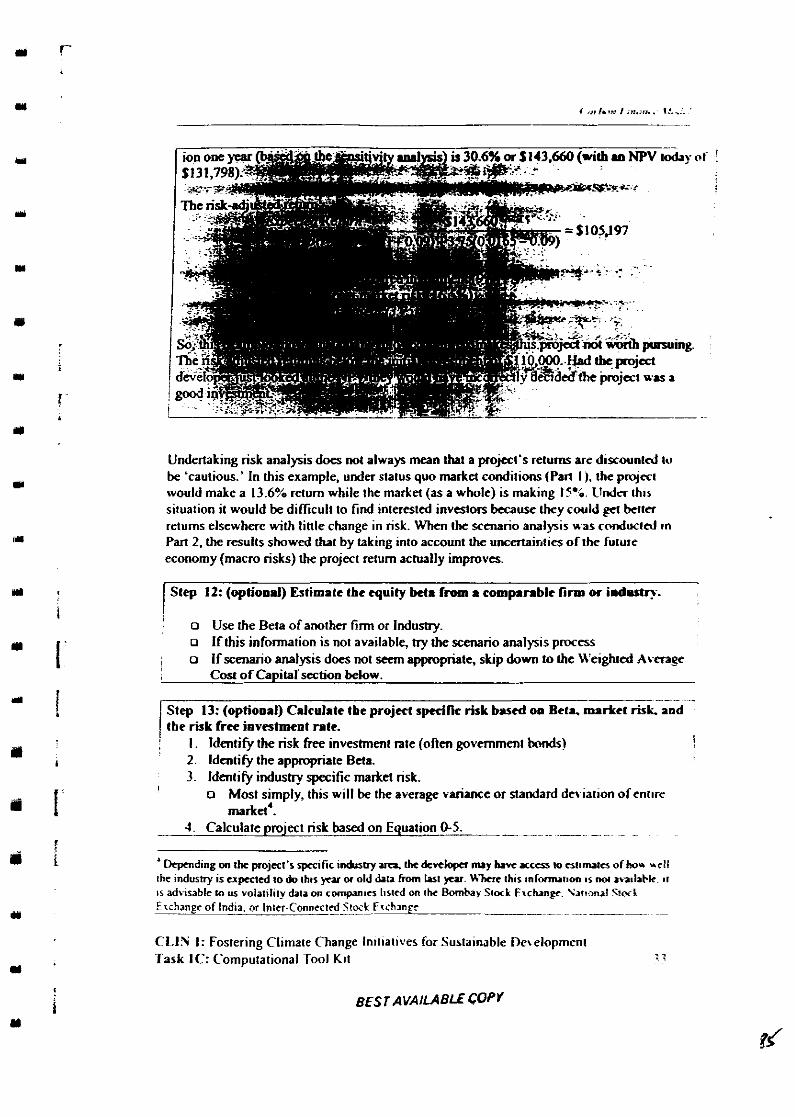
Undertaking risk analrjis does not always mean that a pmjs t ' s retums are discountrd to be 'cautious.' In this example, under status quo markel conditions (Pan I ), the prqccl would make a 13.6% return while the markel (as a whole) is making 15.i. L I d a th15 situation it would be diflicuit to find interested investors because they could g c ~ bccm returns elsewhere with linle change in risk. When the scenario analysis was cnnduc~rd in Part 2. the results showed that by taking into account h e uncertainties oithe iu~ure economy (macro risks) the project return actually improves.
Step 12: (optional) Estimate the quity bela from a comparable firm or id*.
o Use the Beta of another firm or industry. o If this tnformatton is not available, try the -no analys~s p n x e s o If scenano analysis does not seem appropriate, slclp down to the H'etghted A t a g e
Cost of Captlal sectlon below.
Step 13: (optional) Calculate the project specilic risk bPrtd om Beta. market risk and
I the risk free investment rate.
: I. Identify the risk free investment rate (onen government bonds) !
2. Identify the appropriate Bds. 3. Identify industry specific market risk.
I o Most simply, this will be the average variance or standard deviation of entlre markel'.
4. Calculate project risk based on Equation 0 5 . ~. -
Dcpmding on the project's spc~ific idistry area the dcvelopcr nuy bavc xctrr to cst~nulcs of how ur!l the ~ndushy is cxpcctcd lo do thts ycu w old data horn k t m. U k r ~hts ~ n f o m u l ~ w i s nw 1*211al-k. mi
IS advisable to us volat,lity data on cwnpvlncr lnrtcd on the Bombay Sink Fxcbnpc. Y a r m u i Slwl Exchange of India. or Fr ih lnfc ________-_ ___ --
CLlN I: Fostering Cltrnate Change intt~at~\,es lor Susta~nable De\eloprnent Task IC: Computattonal Tool Kit : :
Cmbon F 1 m c e Model
yekhted Awnae Cost of C a In almost all casts micct develo~mn will be looking for outside finaocing for their projects. Outside fi-ing comes with a cost. Providers of equity and dcbt will require a paybeck for giving the fimding ncessmy to finance the project Bach source of fimds will come at different rates. The weighted avnage cost qf capital (WACC) is designed to (measme) account for the cost of debt and equity financing to the project developer. Historic data are often used for valuation or cost of capital estimation. Two types of average measures are calculated from the historic data: the arithmetic avemge and the geometric mean. The arithmetic average will be highcr then the geomehic mean and is the qpqnkte yardstick to use in valuation or cost of capital dmations.
1 s t ~ ~ . . I& Dcdde what levd ofpebt the pmjecf lo111d.t.leoa . , ' ' .~ . ~ . ' . ~ . . . . , .. ...~... . .
This step'&ll be done more then once. For now + this w o n on what the developer thinks is the best debtlequity ratio.
The Weighted Average Cost of Capital (WACC) can be used as a more B C C U T B ~ ~ hurdle rate (discount rate) when calculating the return and net present value of a project. The WACC is used like the discount rate d e s c r i i above when estimating a new project's returns. The benefit of this method verms more simple cost of capital calculations is the fact that WACC takes the impact of project debt 6nancing into account.
'Ibis formula can also be used to identifv the most cost effedtive level of debt to take on. > ,~~~ ~ ~
~ ~~ ~
By cldju$i&e t l e t capitalization lwei (debt over debt plus equity), ?i Wjcd developer ~ ~~
can seZ cLii'Wii~~ aie Wctd If iacrrasinn debt l o r n the w e i p h t e d ~ g e cust of -jm,; w ~ t h a i the levmge docs not lowercash flows ~ ~ d i n g l y ) the
value of the 6nn will increase, and the project developer should pursue more debt finamhg.
Equation WWeighted Average Cost of Capital
E = Equity r, = return to debt holder (interest payments) D = Debt Tc = Corporate tax rate V = D + E r, = return to equity holders (expected)
CLIN 1: Fostering Climate Chaoge Initiatives for Sustainable Development Task 1C: Computational Tool Kit 34
. . .~ . ~
Risk MHIgakn and Alkcatbn - .. . . .-- .--:~
-\.--.
Risk miti-@--- pammw to dcdapbg-a - .
- ] *A socassrul risk dlocat+ ah.tcgy is om thrt dcsipics risk lo tbor plmes tb.1 a~ moQ
~ ~ ~ i l . ~ ~ t h t a r m o t k . I l o a t c d ~ ~ ~ ~ Q pl l jec tdcvdopnmtpaar ,~ tbywi i t~ tbcconof~tbCpojcEt ipmd n m n i o a . S o m v a v b a r i c ~ c s a r h J s ~ r o r c c ~ m v i s i o m . m d
~ ~ g o t h m P g b ~ p b r n s o f r i s t A p o j a r w i l l n c o d I ~ i m p k w D l diffacnt risk d u d i o n sbatcgies d* upon wbrt pb.n of ampkh rbe pjcc! is
o Cwtmtk.:TbtpjcahLcscorlargermolatddcbctob$lmccomrtnrtim . c t i v i t y , q ~ p s c h r r e q d o t b a s c n t q , ~ N o r r v c m c ~ ~ c ~ h I t this Ik.
CLM 1: Foaakg Ctirmtc Clnngc initltives for Saabbk Dcrdopmad Tuk IC: C-W Tool Kit 35
Carton Rnancc Model
o Project Start-up: This period is used to test equipment, hire staff, ,prcparc raw materials, and begin project sales and marketing activities. Costs may increase during this paiod of new business activity, inmasing risk.
D Normal Operation: Revenue begins to grow as the project maturea and the &car and products are sold. During this period, risk begins to drop as lhe debt is repaid.
Table I below offaa somc project specific risks and mitigation strategies associated with developing a project.
!
CLIN 1: Fostering Climate Change Initiatives for Sustainable Development Task 1C: Computational Tool Kit 36
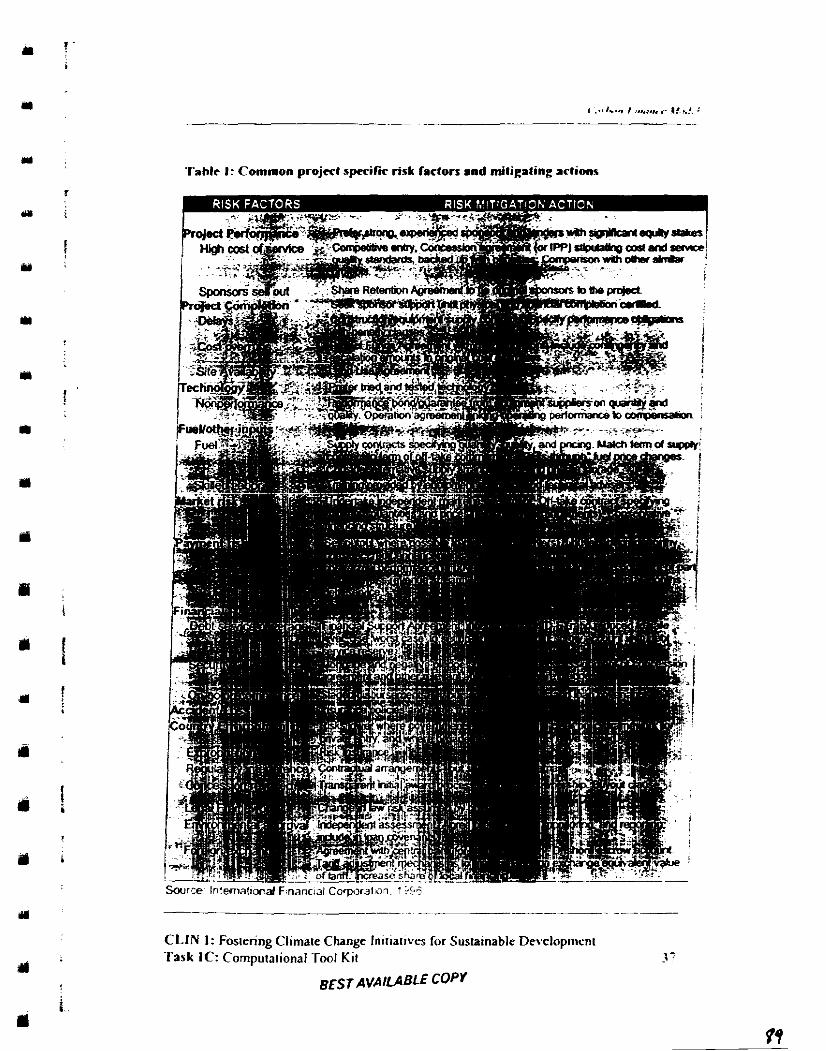
'Tahlc I: Common project specific risk factors and mil i~ating actions
CLIN 1: Fostering Ci~male Change Inlt~a~lves for Sustatnable Developtnent Task IC: Computat~onal Tool KII . -
8 E ~ ~ ~ ~ ~ ~ U B L E COPY
Carbon Finance MoLI
1. Understandlna Prolect Risk
When potential investors are aware ofproject risks they usually bccome less interested in the pmject. It will not be possible to directly control many types of risk, which may lead lendem to lose interest in the pmject. There are scveral vehicles available to project developers to help them manage these risks. This section outlines some of the major types of risk mitigation strategies.
One of the simplest ways to insure investor interest, is to offer a higher yield to offset these &eived risks. Often. hi&= rields can be offered to investors when the pmiect . - - benefits from coiessional financing. This topic will be discussed in more detail in the Marketing and F i c i n g toolkit, at this point simply note the implications that risk can -
have on raising capital.
( Step 18 : Decide wbat risk mitigation procedure is best for the project. -
2. Hedsing
The risks a firm faces during project design, construction, startup, and operations have been identified in the. sections above. Also discussed have been practices that will help mitigate these risks, but sometimes the exposure to risk cannot be resolved by adjusting normal business practices. In these situations, hedging may assist project developers to reduce their exposure to risk beyond what they nomally may think is possible.
One type of risk d e s c r i i above is the uncertainty surrounding future cash flows. The toolkit has praiwsly stated that a key element to the project lockbox is locking-in the future cash flows. If there is uncertainty concerning the size and how reliable,&- @hue revenue streams will be, the project may be at risk. This may be enough to scare possible investors away. In situations like this, it is possible to create f m c i a l instruments that will reduce the uncertainty associated with the future cash flows. These instruments can include simple eontraets like leasing or factoring agreements (discussed in the Bac&ing up the Carbon F h c i n g section below) or more complex tools such as options, future, and swap agreements (discussed in the SeUing the Carbon section below). While many believe that these tools are more appropriate for investment bankas, they can be very simply tailored to the specific project. So long as there is agreement between two interested parties, contracts utilizing these tools can be implemented at any level.
As will be discussed below, hedging practices can also be used to reduce the risk associated with emission reductions. This is accomplished with options, futures, and often with specially designed derivatives6. One of the primary purposes of hedging is to control individual types of risk thereby controlling a firm's total risk. The point of hedging is to minimize the risks that the project owner or manager is not equipped to handle thereby fieeing them up to wony about the things that are worth worrying about
An asset whose value derivs horn that of some other asset.
CLIN 1: Fostering Climate Change Initiatives for Sustainable Development Task 1C: Computational Tool Kit 38
(their core area of ex*) and that t bq am io the best position to hndk. Wich rrspcn to CCMPs. the object of hedging is lo ddamine the numba of miaim mkliom ch .8 PC needed to offstt ch4gcs in the d u e of che o d l firm. This aa hkc tbc form of producing exha rcductioas via increased oBsdbg activities lo insure g r a t a liquidity in the firm. By %&am5ngB risk miti*ticm to partnus who a n M k it bb(cr. project managers PC abk to focur on lbeir core a r u of expertise and not mmy about risks which they arc not able to &y handle.
Contracts
Stable long-tam coolnets PC nceessary W for the security of the projac dcvdopcrs and investors m a p j e c t and insuring hl tbe project openla m an emcicnt and rrli.bk manaa.Thcoontractisthebssisforapojal'sexparrerandtsm~ h insures- should one partnu or contractor within tbe pro* development a d opcntion pocess not meek their commibnents or deliver promised goods or &a oa time. tbac is an agrad upon solution. In this way a pmjed developer fan account for any oontinguuies that may impact the future success of the project. Showing project fmuwm tbe a*rba&. informs lhcm that project risks have ban adequately sddresscd B a d on this infomation, project financiers can assess a project to evaluate its d t worthimss f a possible tiding.
Construdion Contrsch ~oonstnrtioDm~foraclamcacrgyorCCMPsavestoinrunhlthcprojaccir compIc(ed m a 6mdy aod satisfactory muma. lhis includes meeting the p j e c t developer's evaluation criteria and mating the upon pice. Cwmuctioo cmtncCs normally quire dl ammudon oriented wok purchasing, slamrp and kstiug 80 k p m f 4 by the mhacted firm and usally includes the following dcuiled infomution. a scope of work, a tixed price for all work necssuy to complete the project. perfinnuwx guantces performance tests. and asarrnncer of the ammuction firm's credit wcwtbnxs.
Thc propa dlocatioa of combuction risk baarcea tbe project devdopa and the construction h is an hpomut pad of the ovmU project dcv+lopma~t pnrra. One of tb+ most impwtant bckm in chis proccss is the identification of creditwmhy coaJtructioo firms, inruring that they will wt expaience financial dismss and fiil to complete tbc project wnmuction.
C o n s t m t k contrac~s a n take the form of one or a ~ I I I b i ~ t i a i I of the following specific types of canstruetioo contnct:
o Roememat Contra* This conbKt provides for the timely and effitient purchasing and meiving of all supplies, materials, individualg and organizations najessary to begin project construction. This conbact usually
CLlN I: Fostering Climate Change Initiatives for Sustainable Development Task 1C: Computational Tool Kit 39
" .:a;*h , - . , I. ,,:;..:io, r . , '.
Carbon Flnnnce Model
includes p t l d n g all tbc required government pnmita nexmry to complete and begm opantion of the project.
a Englanrlng Contract. Thir contract providea for the prqmmtion of p r c l i m i i and g e n d project designs, specifications, initial cost estimates, preparation of initial bidding documents. These contractors are usually also responsible for inspections and testing of the construction contractor's work
P ConsbPCtion Contrad: Simply put, this contract covers the actual comtmcfion phase of the pject. The contractor agrees in the construction contract to provide all mmtruction related sm.ces, including labor, management, field engineering, and procurement (not covered in any procumnent contract).
!@pt~I ConIra& This contract type covw the cost of Fuel and otber h u t s to the mject wm~any. Changes in t b e k of inputs such as Fuel and basic raw materiais &I have dlargt impact on the cost to produce a good or -ce. Tbe main purpose of this wntract is to lock in prices to reduce the impacts of future price volatility. This can take the form of long- term, supply or pay contracts, where the supplier agrees to provide goods or services at a set price and at a set time. The contract also should include a clause stating that if the supplier amnot provide the goods or services at the required time, it is their respoasiility to find (and pay for) alternative suppliers.
c p In some situations it mav be oreferable to allow an outside ornanization run the dav-to- < .
day operationo aod maintenance aspectr ofa project or man; -projects h- maintenance of the enagy plant may require specialized skills, which are not needed on a fulltime brsis. Oiibnming of wexations and maintenance can be more cost effective and rsult in a more dfcaive hjeci because specialized staff can be used, whicb w o e n o t d y be available to the project developer.
-3
Protect Finance Tumkev Contract Project finance transactiom are made possible because the projects are nlatively predictable (including their cash flows), resulting in reliable payments to debt and equity investors. The project finance hnnkey contract is a specialized construction contract, which covers all wozk and results in a complete project that is ready for o p t i o n (all the owner has to do, is "twn the key"). It is generally acceptable to charge a risk premium for taking on a mi& like this to insure that anv unaccounted for costs are covered. This type i f con&; usualIy requires the contraior to take out substantial loans to cover costs until complete payment is made, in-inn the contractor's risk substantially. Incentives are usual& also &luded for c&pleting the project ahead of time.
Off-take umhacts simply lock-in ttte sale of the project's goods or services. The most common of which (described below) is the Power Purchasing Agreement, which - -
( establishes the te& for selling electricity produced by a project (usually to one buyer) This is often considered the most important contract in a project because it locks-in the
CLIN 1: Fostering Climate Change Initiatives for Sustainable Development Task 1C: Computational Tool Kit 40
P- M = W r A9mncnr PPAI P o w e r ~ ~ n c m l y ~ m t b o K p o j e d l ~ g m c n t c c l ~ t y . ~ t b c ~ o f ~ t b c p l n p o s o f a P P A m t o ~ t b c t a m r d coaditiom mda which tbe stare &micity b u d (SEE) will pmcb.rt, bank, a rbccl p o w a ~ b y m i D d e p s d s r t t p o w a p o d u a r . A m r ~ ~ o f a P P A i t ~ a p r i e e f o r t b c ~ p o v a .
Backing up the C a M Financing
CLIN I: Fosbiq climate Cbmgc hritistiva for Suct.huMc Task 1C: C o m p u t a ~ Tool Kit 4 I
Insurance and Guarantees Insurance and guarantees are frequently used for international trade and investment transactions to reduce the risks related to: expropriation -- the loss of an investment due to expropriation, nationalization, or confiscation by a foreibm government; currency inconvertibility - the inability to convert profits, debt service, and other remittances from local currency into U.S. dollars; and, political violence -- losses of assets due to war, revolution, insurrection, and civil strife. The insurance and guarantees reduces risk for the investor and helps attract additional investors due to lower level of project risk. For large or high risk programs, obtaining insurance coverage is nearly always a prerequisite for the program to go forward.
These insurance and guarantee programs are available from a wide range of sources,
. , which are almost always public entities, such as the U.S. Overseas Private Investment Corporation, the U.S. Exporl-Import Bank, and the World Bank's Multilateral Investment Guarantee Agency. The insurance coverage limitations and requirements vary across countries and industries. Fees are generally based on a small percentage of the total project cost. These fees are not insignificant and far easier accommodated by large programs. In terms of carbon, one can think of providing insurance or a guarantee in exchange for carbon payments, as well as other guarantee payments.
CLlN 1: Fostering Climate Change Initiatives for Sustainable Development Task 1C: Computational Tool Kit 42
Fmctorina Factoring is ihc process wbac a firm, or factor, purchases the accounts rcccivabk of another firm. Tk factor may be a commercial finamx canplny that s p a d k s ia factoring, or simply a commacia1 b a k A small firm cm benefit h n using a &tor, since it kurance against bad debts that rcsult f b n the inability to cdlect Thr h a o r ~ t b e r i s L o f ~ b ~ a b l e t o m l l a t t h e r & c i n b k q b u t t h e f i r m u d o f a specified amount of cash for a given amount of &vables. This reduces the potential earnings of thc firm, but reduces operating costs since it docs not have to staRand nviouin a ercdit .od mllcetion llqmmcnt
Tkfcepridtothcbctorfasavieingthe~tisdlyhPadmtbeha~of all ~cceivables, and will tend to paraJle1 thc rirlr tht customas will not pay and tbe tam of the receivables in question. For OECD cormbics, factoring f m gmu8lty m h. .t 1% to 3 %, of a given amount of receivables. For many developing counfrics. oolkcting receivhles is more risky, so factoring costs am higher.
credit limits and & o o " d t s th i apply to the firm's custaaas. or mukoum faaorhg, the factor may impose strict limits on thc firm's dclivaia to certain cestuaas - A rmuiramnt to obtain &-factor's a m v a l to sen eauin customers mav kd to a loss of saies but since the faetor can bmc; ktimste the risk of no~paymcnt, td firm is pmmtcd h m mpldng a larger loss. Factoring is genarlly not wnsidacd vi.Mc f a
Leasim A tease is esc$ifty 8 medium to hmg-tw ~ w ~ c c of credit for a firm. The firm obtains thc use of an asset, and makes a continuous strcun of payments h k to thc asm owner o v a thc tam of the lease. Leasa can raduce & overall cost of capital, sinc a 1- may be able to obtain an asset and maintain it at a Iowa cost than the kss rmM i f i tpwbasa i iberaddght L u s c . e c o u n t i n g h a r m ~ t c f f a t m f k u c i d statements.
Leasing is a polmtially viabk option for small- and mediumsized bdncscs tfnt annoc afford to tie up largc amounts of cash, either with a witbout bank loong in the purchrt of assets. Initial down payments m usually low, md importantly. cquiplvnt k.sa gnwrally hrve longer repayment tams than b a d loans. Also, kasc paymcDts can be struchuad to match the cash qc le of a pvticular projact Ltrres am usually sa up so that pymcntsmthecarlyycarscqual~ationplusintcrcslcosl inamcdundathebup and-bmw altemrtivc. h may also be easier for a small firm to a m c t the intsrst of a leasing company, as opposed to a bank, in an invesbncnt.
There arc three types of leases, (i) dim4 (ii) sale and leaseback and (iii) leveraged. Direct l u s t s am available through a numbu of Fmancid instimiom. Unda a sale a d leaseback agmment, a firm sells land, buildings, or equipment hat it owns to a kssor
CLlN I: Fostering Climate Change Initiatives for Sustainable Development Task 1C: Computaboml Tool Kit 43
Carbon Flnancc Model
and simultaneously enters into an agreement to lwse it back. The selling 6m receives cash and agrees to make periodic rmtel payments. With a leveraged lease, a firm aquires the usc of an asset from a lursor though a combination of intanel equity and third party assistance (commercial bank or insuranoc company). There 4 however, certain restrictions on the sale and lase back transadom in India. F'urthamm, a @cuk leksc agrcrent can be either a financial or operating leasc. A financial Icasc, the most abundant form, is wnc~celable. An operating leye is cancelable at any time during the lease pexiod. Financial 1- normally extend over a long time fiame with total monthly, quarterly, or m u d payments approximating the purchase price of the assd plus financingcharges.
I
Of all lcascs, only tbosc which can be classilied as capital leases must be inc1udcd in the balance shet (thounh -tim leases am detailed in the footnotes b the finrmcial statements). ~ I I &'am &d~rrd opaating leasea for accounting purposes. A lwse is a capital lease if it meets one of the following criteria:
o The lease transfers ownership of a properly to the lessee by the end of the lease term: ~ ~~-~
o The lease contains a bargain repurchase. option; 0 The lease t am is equal to 75% or more of the estimated economic life of the
o The &t va& of the minimum lease payment equals or exceeds 90?? of the excess of the fair value of thc proper@ over any related investment tax credit retained by the lessor.
For a firm with a large number of mn-capital leases, the balance sheet may not adequately =fkd ihe M s true tiasncial situation. cspeciallv debt amounts. Thus. some_ofthe &ups financial lev-diatom, such & the debt-toequity ratio, will understate the finds true leveraged condition.
Leasing has been em~loved in some hhdm3me oroiects recentlv. mostlv bv vublic - - . seztor Gents which w o k not have access to off-&e sheet p"ject finamx. For example, Mexico's Fede~al Utility (CFE) -th. financed a 700 MW natunl gas power plant northern Mexico h u & a long-term l&ing anangement with ~ibbank, NA., the U.S. Ex-Im Bank, the Inta-American Investment Company PC), and the private sector leading arm of the Inter-American Development Bank (IDB). Depending on the tax structure and the depreciation treatment for the leased assets, leasing can be a cost- effective option forpubiiciprivate venturps.
In terms of carbon broseetions, long-term leases can be a viable solution to hmcing'a project. In this situation, lessors may &ve the rights to the carbon from the lessees in exchange for a lower lease payment or a'longer maturity, for example.
CLIN 1: Fostering Climate Change Initiative for Sustainable Development Task 1C: Computational Tool Kit 44
CLIN 1: Fostering Cthnrtc cb.agc Initiatives for Suhid le Dcvtbpau Tuk 1C: Computatid Tool Kit 45
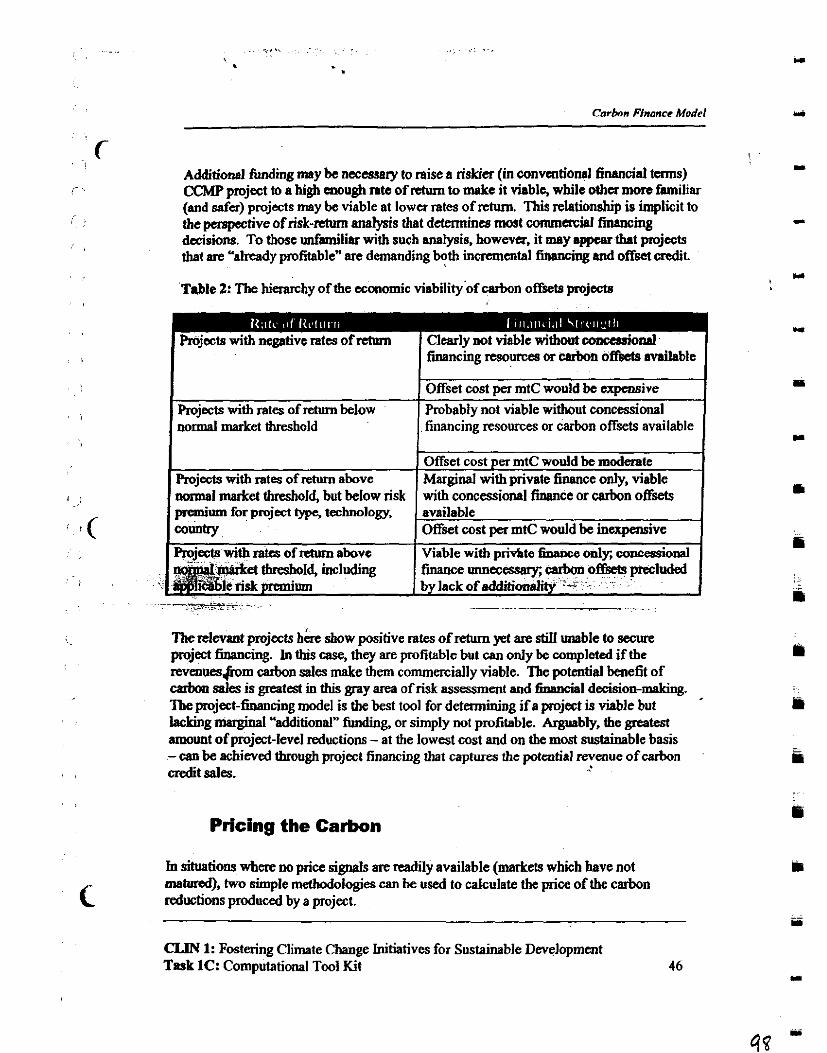
Cnrban F I ~ n c c Model
Additional funding m y be necessary to raise a riskier (in conventional financial terms) CCMP project to a high enough mte of return to make it viable, while otha more fiunilcar (and safer) projects may be viable at lower rates of return. This relationship is implicit to the perspective of risk-return analysis that dctenninw most commmial financing decisions. To those unfamiliar with such analysis, howwa, it may appear that projects that are "already profitable" art demanding both inqmncntal financing and offset credit.
Table 2: The hiemchy of the economic viabilitybf carbon offsetP projccts
I - I financkg TCSO- or ccllbon offsets available I I Offset wst per mtC would be expensive
Roiects with rates of return below I Probably not viable without concessional I 1 financing resources or carbon offsets available I Offset cost per mtC would be moderate
Projects with mtes of return above 1 Marginal with private finance only, viable
n&ql . . &d threshold, including finance unn&-, carbon of&& precluded &i&lc risk premium by lack of additianality .-" .
n-1 market threshold, but below risk premium for project type, technology, corntry Rojccts with rats of nhlm above
Therelevant projects ti& show positive rates of return yet are still unable to secure project financing. In this case, they are profitable but can only be completed if the revenues&om carbon sales make them commercially viable. The potential benefit of carbon sales is greatest in this gray area of risk assessment and finaacial decision-making. Tbeproject--financing model is the best tool for determining if a project is viable but lacking marginal "additional" fbdhg, or simply not profitable. Arguably, the *test amount ofproject-level reductions -at the lowest cost and on the most sustainable basis -can be achieved through project financing that captures the potential revenue of carbon credit sales.
withconcasional finance or carbon offsets available Offset wst per mtC would be inexpensive
Viable with privbte finance only; wncessiod
Pricing the Carbon
In situations where no price sign& are readily available (markets which have not matured), two simple mefhodologies can be used to calculate the price of the carbon reductions produced by a project.
CLIN 1: Fostering Climate Change Initiatives for Sustainable Development Task 1C: Computational Tool Kit 46
- - - ~ - ~~ .---
2. ~ t o t r l r ; a o r m t ~ t o n u t c t h c p o j c c t p m ~ ( a i l o a c ~ b ~ r d k mtc) divided by tbt totll tom of crrbocl- pdncal.
lksc mdbddogia dl give two p o c a i nhKI pa mebic loo of arbm
bcd&fa&bymofopentioa~hisriTginabrric idadlthc.nlocortbecrrboa Use this in formaticto in the projd cash Om analysis (sa &).
CLM 1: Fosbhg Ctirmte Cbmgc Initiatives fix Sustlinrblc Dcvdopncat Tuk 1C: Computrtiolnl T d Kit 47
Corbon Finance Model
I Stm 22: Calculate the total revenue from potential carbon iala.
Ultimately, the additional remue from mission reduction sales could contribute to the project's commercial viability, without the need for subsidies, special tariffs, giants, or other aon-commacial mec:banims. From the perspective of mveators, the additional revenue would lead to mom secure cash flow to cover debt servicing and/or improved credit tams (i.e. longer mahnities, lower interest rates, ctc.) b m lendcrs.
On a more conventional project tinance basis, a commercial bank may in the futun be able to lend to the project directly on the basis of the anticipated cash flows from the carbon sales. These need not n p m t all of the debt required for the project, but rather a portion of the debt that nevuthe1ess makw the overall project commercially viable. Lendas are traditionally &g covaage of debt savice obligations at a ratio of 150°% or more for what are perceived to be high-risk projects.
In some situations carbon revenues mav not be consistent from vear to vear. In this case it - is important to link the appropriate number of emission reductions to the correct year. This will be import if the project is getting cash flows on an annual basis based on the amount of emi&on red&o& produced.
To incorporate the carbon revenues into the cash flow statement simply add a new line in
( the revenues section dedicated to this source. The carbon cash flow does not act any differently than any other some of revenue once the reductions have been monetized.
Evidence from the M a k e t Table 3 is a summary of several international hansactions of carbon emission reduetions nported to date. Becaw the market is in its initial stage, it is highly difficuk to predict future prices. However, tbae is a genaal range of approximately USS0.50 to USS22.00 per ton C@ reductions. An analysis of the intanational commitments suggests a mtentioldemand in ex- of 600 million metric tons of carbon eouivalent (not CG. this k~cludes other gmnhouse gas &emissions) per year. The monetary ;olumes Auld bek high as $10 billion dollars per year; however, this has not been reflected in actual trades.
The further back in time one goes to find bansaction-based evidence for credit pricing, the less useful that information becomes. Knowledge and ~ l e s of the mdd, such as confidence m national pmgrsms, sophistication of risk assessment by buyers, and other factors, are weaker in earlier transactions. An analysis of reported project-based credit costs showed most transactioas to be m the range of USSS to USSlO per t a .
CLIN 1: Fostering Climate Change Initiatives for Sustainable Development Task 1C: Computational Tool Kit 48

CLiN 1: Fosteriag Chute Change Initiatives for S u . k Dcvclopmqat T.rL 1C: ~~ Tool Kit 49
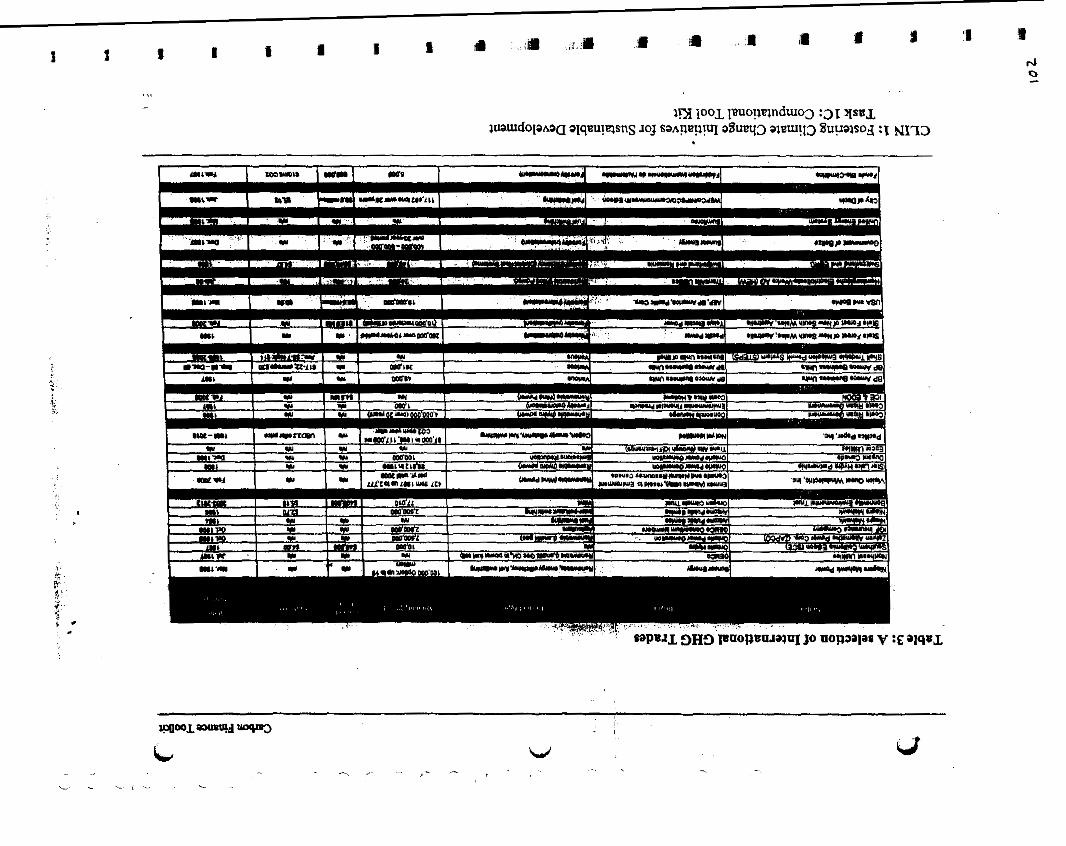
Y Selling the C a h n , Wbntcva metbod of pymcnt is decidod upon, tbe pyma,t coobaa wil l c d tbc
m pojcd rparoor to 8 tong-tam aniarioo d w % h s dclivay o b l i p h to tbe kp. Tbe b u y a a 0 ~ y f W t b a e ~ n d u c t i o D I h l 8 n m n k r 0 f r r y * T b e ~ d i r P a t d intbescetioaire:tbeombonPsforllwlur~,~fidcorclrod.md
i ~ a ~ f i A , ~ , fhemr60nopnopn~andthecmbonnulrp.00aibccotdmd ismpl.ce,tbeiajJuauntrattbecmboll~e~l~~astbcywwldmyothcrrcvmoc Jtram (fs dc5ui-W rbove).
C a r b o n P ~ C o n t r m As with otba oompoarnts of tbe project's puformmcg it is typical f a tbe arboa br)a to expect tht tbe project sponsor shan the risk of ~ i v a y of tbe cPboa offsets. 'Ihis cm be achieved by executing a contract tht includes M u p b t pymd f a tbe buyato~ri~totbepoject'scmiffionrrductioDIdpryfortbcscovcrtimd upon-.
Acobw~~l l tne t is~ toaforamdcoatna . rsmagracmratLmsdc(od .y lor~ o b t i P a a y u e h m g t o f f i m d s m t b e ~ A f a w P d ~ ~ t b e b q u . g r i m r a n y f u t m c p i c c ~ . ' I h c b q u o f t b e t b c c m i r s i m ~ m m w a y x I ) tbcy cm lock-in prices ahead of tim+ if tbcy feel tbe markd price k going to ripc;md 2) if the project pmdwing the duebonr does not deliver. thac is no risk because no
CLLN 1: Fostering Climate Ckingc Initiatives for Su~insbk D c v c ~ Tuk 1C: Computahioasl Tool Kit S I
payment has been made. Tbis conhact type allows buyers who are uncertain about the future regulatory environment to insun a future supply of credits without worrying about the uncatain specific requirements that m y be put forth by govcmments.
mnual Pavments Carbon buyas can make annual payments to aproj&t developer who is selling emission raluctiom. These arc based on how many reductions are produced each ycar.
Rftv-Fntv W o f thc prict &reed upon for the total amount of emission reductions is delivaed u p h t . The nmriniqg half is delivered lfta all of the emissions reductions have hem realized. This is wuallv only ammwiate for projects with a short lifetime. Projects with - - .- - ten-year horizons or more are often not dsi ibl ; because the project develop& has to wait so long for the final payment.
Carbon Ootion (American 0ntions~' Tlx basic wneeat of usinn o~tions to trade securities rnav also be a ~ ~ l i e d when - . wnsidaing emihon reductions. An option is the right, iut not the'&ligation, to buy or seU a fixed quantity of an asset or wmmodity at a given price before or on a specified date. All options may be either puts or calls. Aput opfion gives the owner the right to sell the asset while a cull option gives the owna the right to buy an asset or wmmodity. Tlx price written in the wntmct for which the option may be bought or sold is called the slrilcprierlllpa+thc price paid for the option is called the op@nprenrinm. By pmhasing pn q t i o 4 the seller is egracing to a set price and will sell (or buy) if the buyer C @j& option.
.e --. . , -
- O p t i i u a b l e tool forreducing risk when selling or pahasing emission reductions. Much like and forward wntnrcts, options allow buyers and scllcrs to lock-in the oria of thc'emissioos reductions ahead of time. but thev offer the added benefit of nbt mphg an option o m to actually wmplete the &tion. This way, if markd widitions change over time, and the owner of the option feels that tbey could get a beltez mice. &re is no wm'tment to wmulete the bansaction (as the owner of the . option).-Thus, in the future market for anissi& reductions, if the &v price is less then the shiLe price plus the option premium, the option owner can decide to not exercise their option, a& d g e t a lower price. If the optioa were sold, they would be required to complete lbg tnnsaction if the owner of the option wishes.
By using options, a project developer with eminions reductions can a m financing evem w h a ~ the regulatory drivers are not in place for a fluid carbon market They offer a buya the ability lockin a price, which rebuecs future risk in uncertain regulalory
asset at tbc~&ikcpri&, af l r ~ p o ~ ~ i n tiate, tbe expinti& date. lf the developachomea to &me Emopcm Option style, it win still work lbe me in relation to the carbon transaction.
CLIh' I: Fostering Climate Change Initiatives for Sustainable Development Task 1C: Computational Tool Kit 52
CLLN 1: Foslaing Cliuutc Chsngc Initiatives for Sus~ainable Devdopmeot Task 1C: Chpubtioual Tool Kit 53
. . *, ..., . ., . Energy ~ e f ; i & & ~ : ~ o p ~ a n ~ (ESCO) that perfonhe@7tbe,&iinneerhIg . I i : l ~ . j analysis and design of the EE niiisurek at the brew&es.. ,Under a fiye-year, shared savings, performance-
I . . . , , . . . . . based donQcfi.thg,brewej hal(& :fjuar!eill lek$$apents to the ESCO based on I actual sav~ngs measured by the'hnkry. TIC~SCO, in turn, repay; the U.S. and
CLIR I : Fostering Climate Change initiatives for Sustainable Development Task IC: Computational T001 Kit 5.1
BEST AVAILABLE COPY

CLlN I: I ostenng Clrmate Change In~rl.ii~! cs l o r Susta~nabls Ikvelopmet~l Task 1C: Compu~attonal Tool KII c c
Ashford, Michael S.; "Risk Allocation and Mitigation for Private-Sector Financing of Hydroelectric Projects in Nepalmechnical Assistance for the Elechicily Development Center - HMBNepal," prepared for USAlD and Acres International Corporation, August 1996
I
Econergy International Corp. (EIC) and Pacific Northwest Lab (PNL), 1997. Financing Mechanismfor Renewable Energy and Energy Efticiency in Emerging Markets, Battelle Pacific Northwest National Laboratory, Washington, November.
Ashford, M. and Moscarella, J.P., October 1995, Renewable Energy in the Americas (REIA), Financine Hurdles for Renewable Enerw Proiect Develo~ment in Latin America, revised for REIA 11, July 1997.
Ashford, M.S. Moscarella, J.P., and Swisher, J.N. July 1999. The Emereing Role of Carbon Credits in Ptuiect Finance, Clean Energy Finance. pp. 7-8.
Brealey, R. and Myers, S.. 2000, Princiwls of Cornrate Finance. McGraw-Hill.
Grinblatf M. and Titman. S., 1998, Financial Markets and Corporate Strategy, InviniMcGraw-Hill.
H e & P, 1998. Chanter 12: Sustainable Develo~ment and Greenhouse Gas Reduction, in Issues and Options: The Clean Development Mechanism. United Nations Development Program, pp.147-163.
Hodes, G. and Dolgikb, S. (Editors). 2000. Proiect Identification. h a r a t i o n . and Management, in Greenhouse Gas Abatement: A Project Developers Manual (for Central Asia) pp. 2-20 to 2-51.
Hodes, G. and Dolgikb, S. (Editors). 2000. Valuing Greenhouse Gas Emission Reductions as a Financial Asset. Greenhouse Gas Abatement: A Project Developers Manual f i r Central Asia) pp. 4-95 to 4-1 16.
Hoffman, S.L, 1998, The Law and Business of International Proiect Finance: A Resource for Governments. Suonsors, Lenders. Lawers and Proiect Par t i ch t s , Kluwe~ Law International IIEC. December 1998. Develooinr! and Financing E n w Efficiencv Proiects and Ventures in Emerpjng Markets.
Levich, Richard M, 1998, International Financial Markets, McGraw-Hill.
CLlN 1: Fostering Climate Change Initiatives for Sustainable Development Task 1C: Computational Tool Kit 56
M-ll8, JP.. ZOOO, Cbta 7: CaboD To k published
Rcbrd. Kimkrty O'Nall Pld Rcinb.rds ForcQ Inly-Aulprt MOO. fiaclltivc Needs to Know About Globl W- H d B w f n e s s Rnic*.
Rnbbo, M, Yomgcr, D.. .Id hdO==d4 JJ" rn 199% Rirrtc2wb.Uk GlobJEavirmmmt.dF-Corpantimm.
State Of S o Plulo. prepand by E4 lac. for the G W F * I ~ d i i y ,
wrsbingtos DC.
CLM 1: Fostering Climate Chogt InitLbiva for Sust.hubk Devcbpnat Task 1C: Computationaf Tool Kit 57
CLM 1: Fostering Climate Change Initiatives for Sustainable Development Task 1C: Computational Tool Kit 58
.~ ~ ~- . .. . ~-
ill
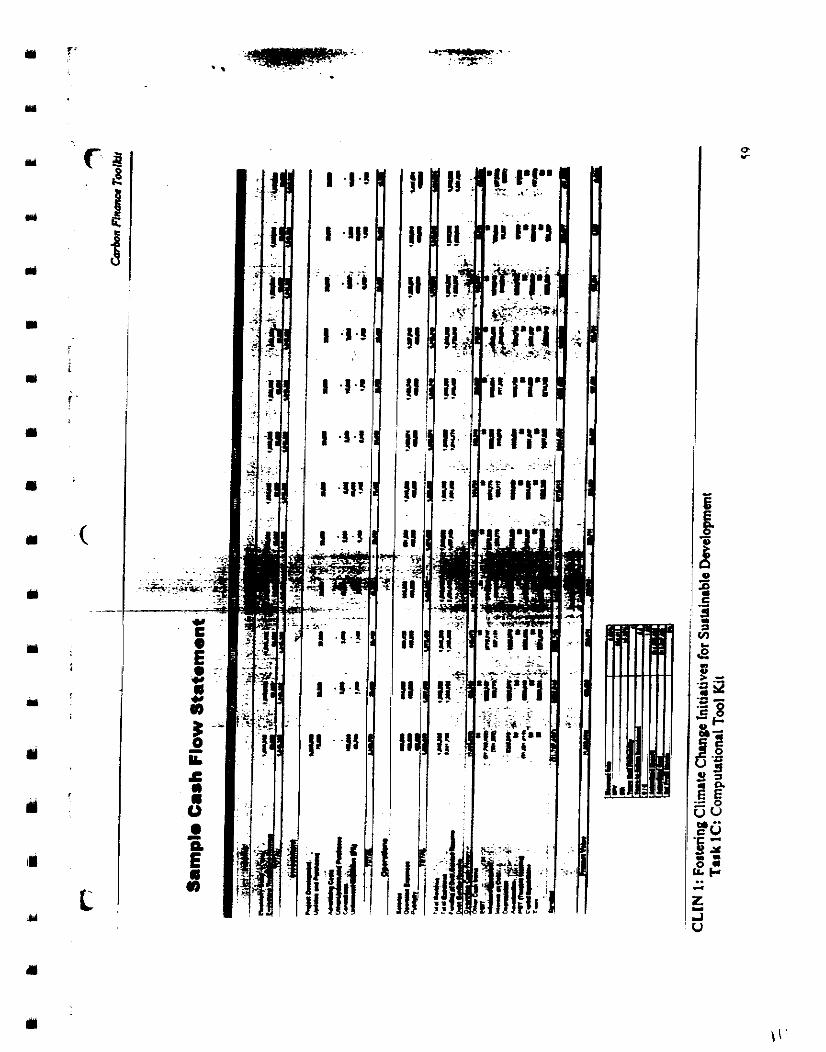
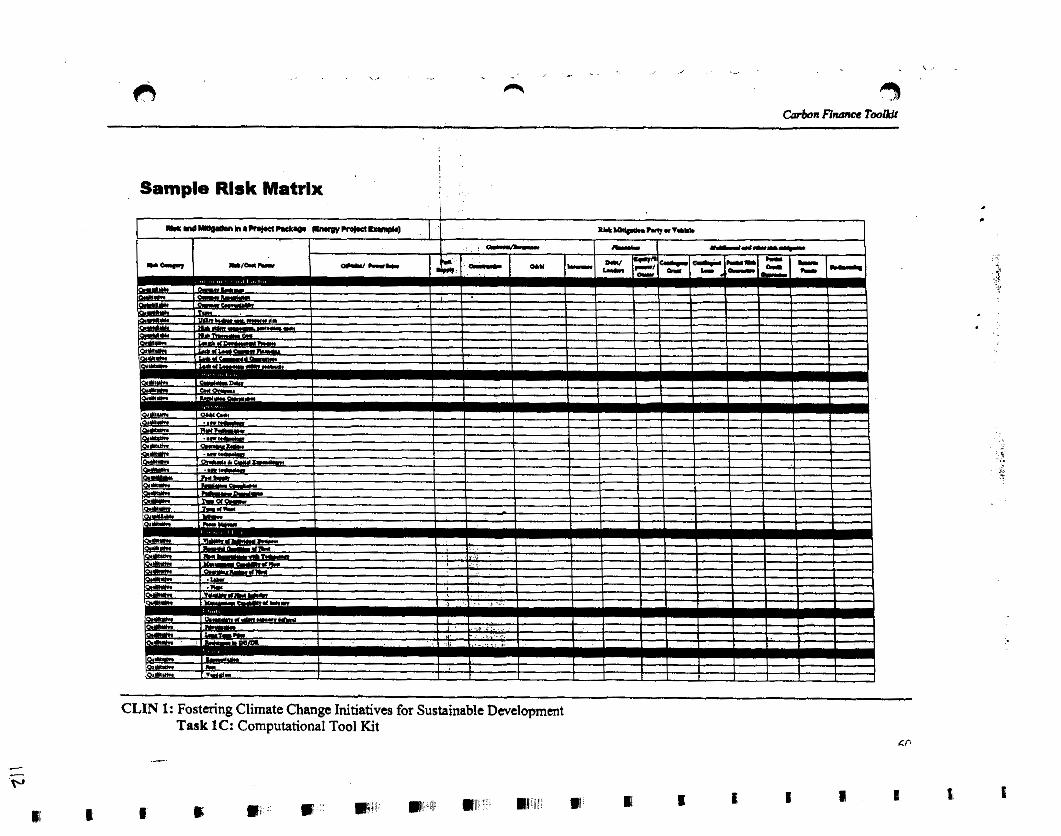
CnrQn R M M ~ Toolkit
1
Sample Rlsk Matrix i
CLIN 1: Fostering Climate Change Initiatives for Sustainable Dwelopmmt Task 1C: Computational Tool Kit
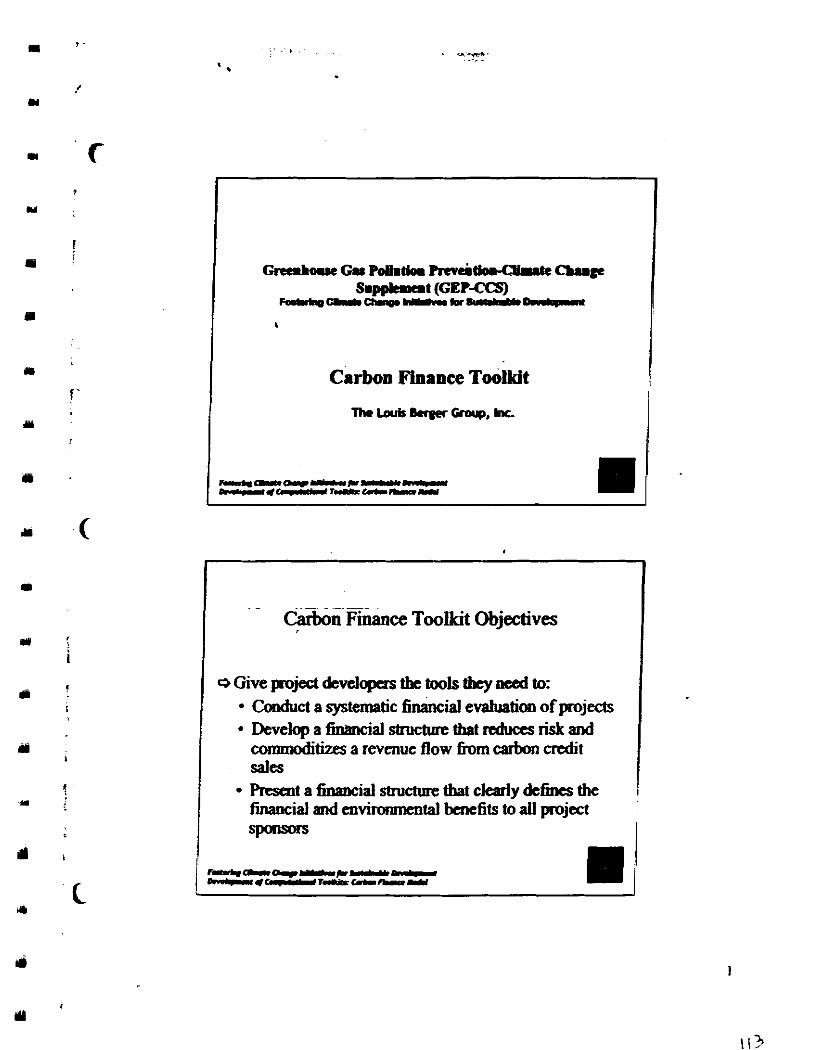
carbon Finance TociUdt
croup.^
Ca&n Fmance ~oolkit Objectives
I Give project devehprm the tools tbey need to: Cooduct a systematic financial e d u a h of projects I Develop a financial sbuctm that nduas risk and I
I sales I Rscnt a financial structlrn that ckarfy d e k s the 1 h i d en... -fits to aii project !
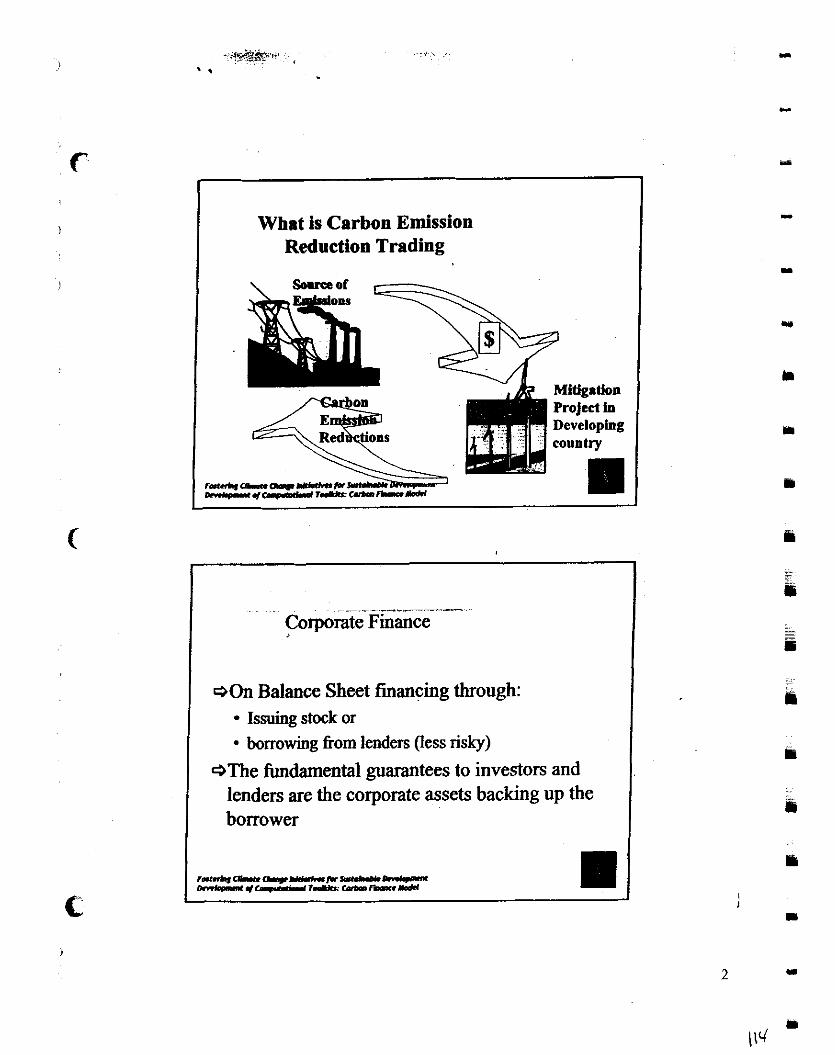
What is Carbon Emission Reduction Trading
F r ( n S m . u . ( 1 4 * L * ( k a * I k . * F I . / C r L d . . l T , , m t C - h ~ m m
- -- --.- - Corporate Finance
+On Balance Sheet financing through: Issuing stock or borrowing fiom lenders (less risky)
+The fundamental guarantees to investors and lenders are the corporate assets backing up the borrower
ras*la*.nlll*-*-- hvkmmt*-r..l*r-hhranl*d.l
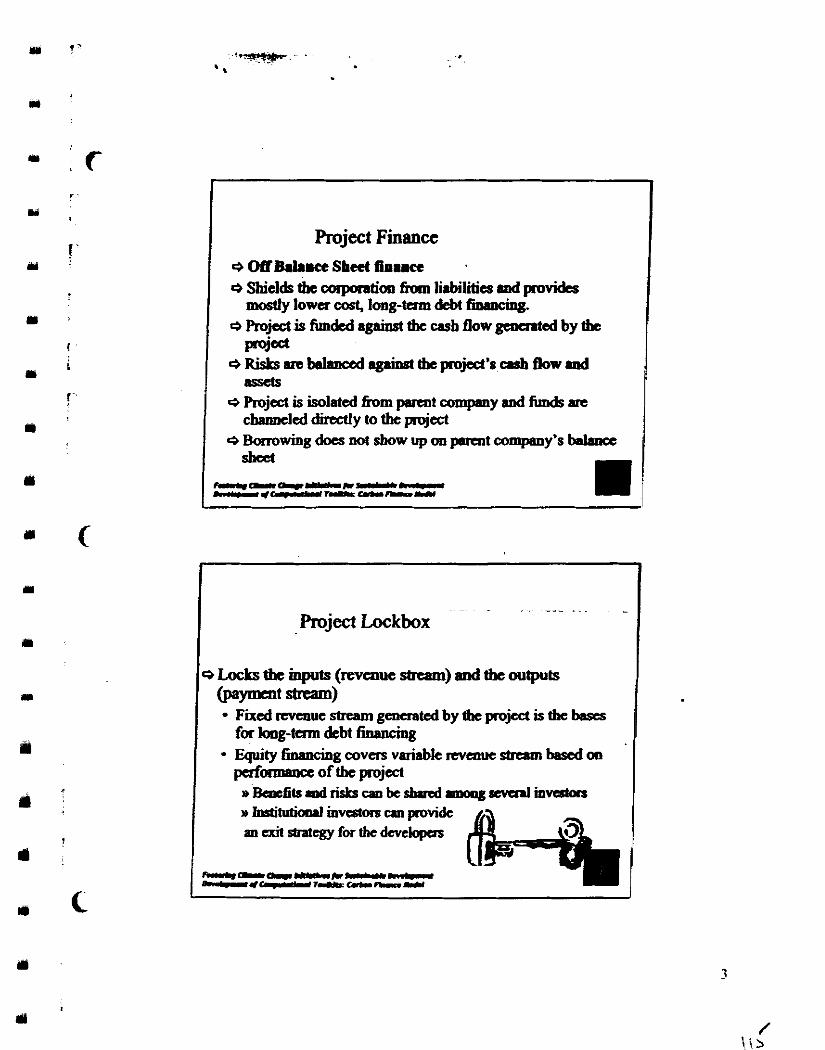
o Shields tbt copration from liabilities rmd provides I d y lowex MSt, 1oSlg-m aa b.ri.
+Risks.rebslrmeed~theprojad'rashflowmd ass&
e Pmjed is isolated h m perent compeny and fuodr arc channeled M y to thc project
I Project Finance
Project Lockbox
Ficd mcnue stream generated by UIC pow is UIC bases I f 0 h g - m debt t-imchg Equity6mancingcovmvmiabkrevmuestrambasedoa paformancc of the project r s B e n c f i k d ~ c s a b e s b r r e d ~ r e v c n l ~ r s W ~ m v c s l 0 r s c ; m p o v i d c an cxii strategy for the developas
h(r.g-(.IC-tr-- - * - 7 r . d E c I . r R l O . m u
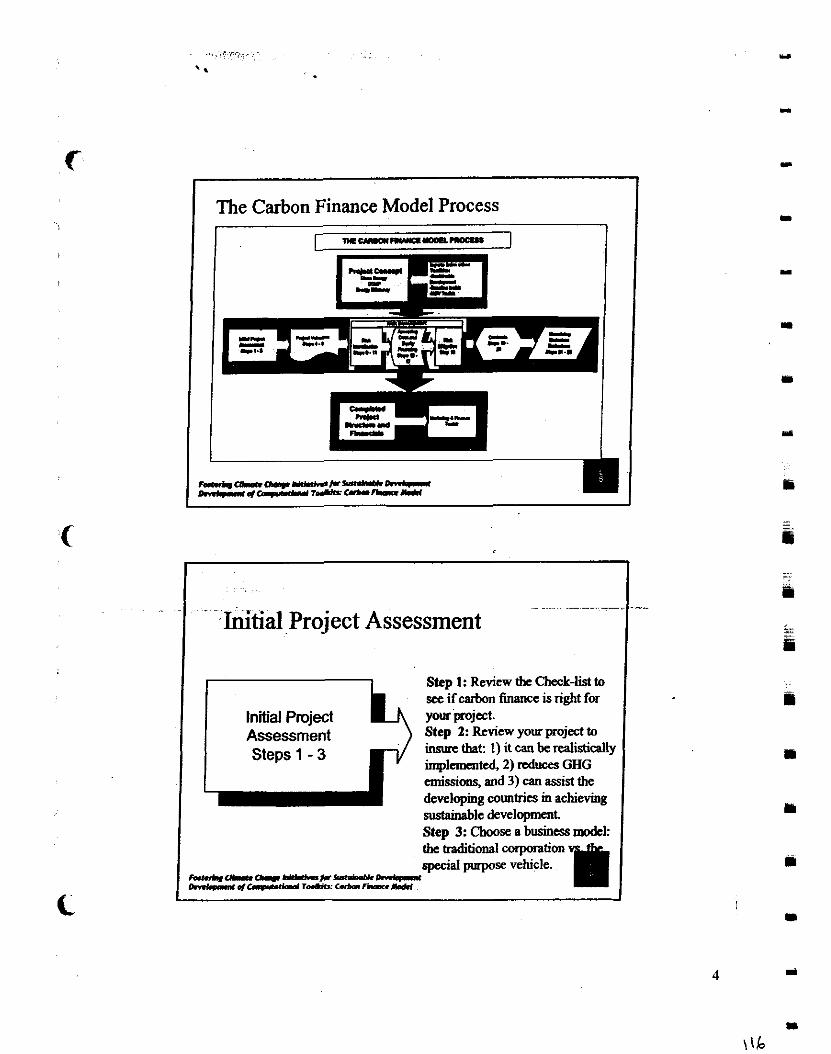
The Carbon Finance Model Process
nROIIO*RUYSlmL-
Mh-Qmw-h-DmCI ~ c f O * a t Y T . L l S c r . r l L l r a W I
Initial Project Assessment
Step 1: Review tfr Check-list to see if carbon fuumce is right for
Initial Project yourproj=t. Assessment Step 2: Review your project to
Steps 1 - 3 insure that: 1) ~t can be realistically irnplcmntcd, 2) reduces GHG emissions, and 3) can assist the developing countries in achieving mrabb1e development S t e ~ 3: Choose a business model: thebaditional corporation spceial purpose vehicle.
-UraLII-c-R-=@-W I * n C a c f - T & C . r . O F ~ * o b (
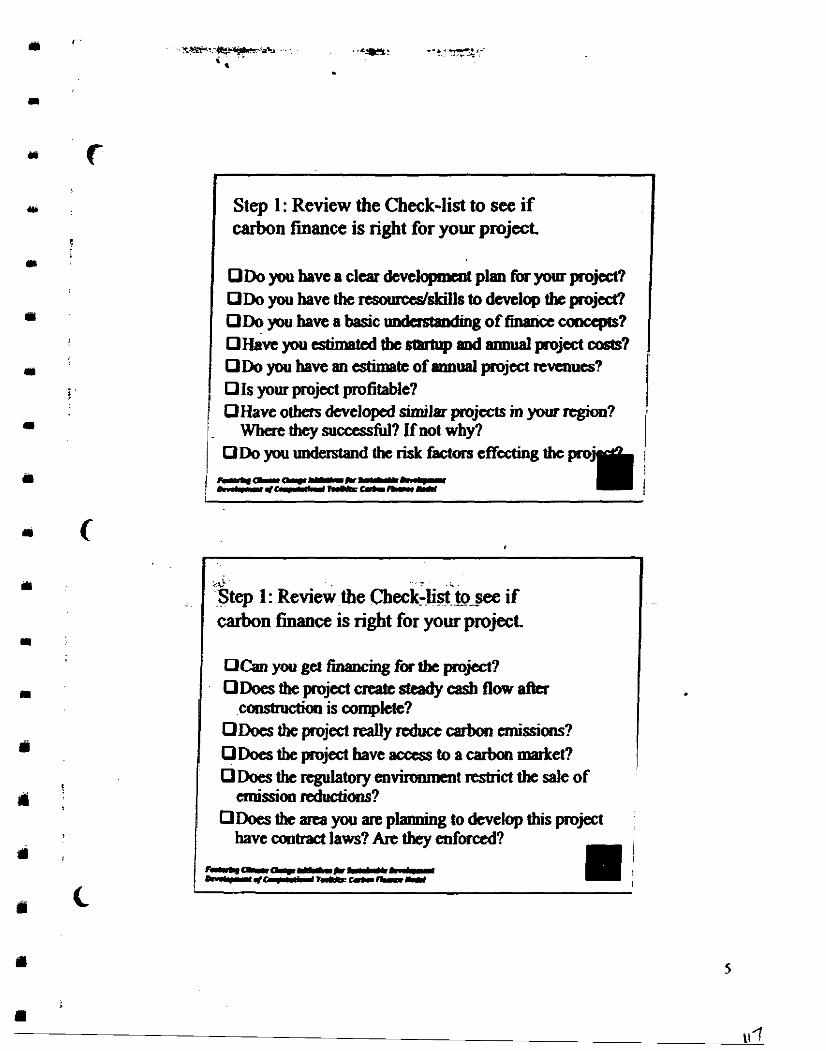
1 Step 1 : Review the Check-list to see if carbon finance is right for your project.
ODo yw have a clear developmait plan fb your project? ODo you have the rcmmcdskills to devclop the projed? ODo yw have a basic lmdastanding of finance ccmocps? OHanpestimatcdtbcsPlrhlpmdtnmualprojectc~ss? ODo yw have an estimate of annual project nvcnucs? q Is your project profitable?
( OHave otbers developad similar pmjccts in your region? 1. Where they successll? Ifnot why? !
<7.=
Step 1 : Review the Check- lists st to to see if carbon finance is right for your project.
OCan you get financing for the project? ODoesthcprojectcreatcstc%dycasbflowaRa
constntction is compkte? ODoesthcp~ojectreallyrcducecarboncmissions? ODoes tbe project have acctss to a carbon market? ODoes the regulatory environment rtstrict the sale of
emission reductians?
. - have cootract jaws? & they E n f d ? -
R...+prQI-lr-- L l r e e r r - M - Y
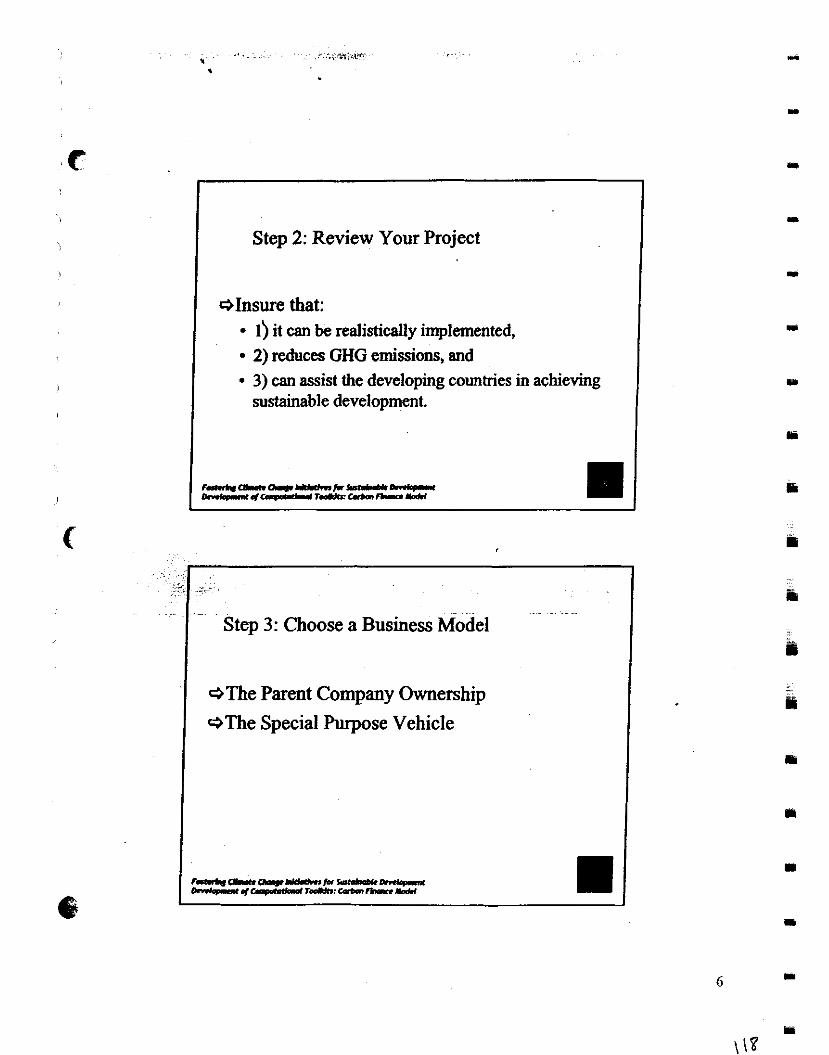
I Step 2: Review Your Project
cjlnsure that: 1) it can be realistically implemented, 2) reduces GHG emissions, and 3) can assist the developing countries in achieving sustainable development.
'- - . . -- -- -
Step 3: Choose a Business ~ o d e ~
+The Parent Company Ownership eThe Special Purpose Vehicle
r~CILraQ=¶.-*-r-kmml ~ * r ~ T ~ ~ ~ m m
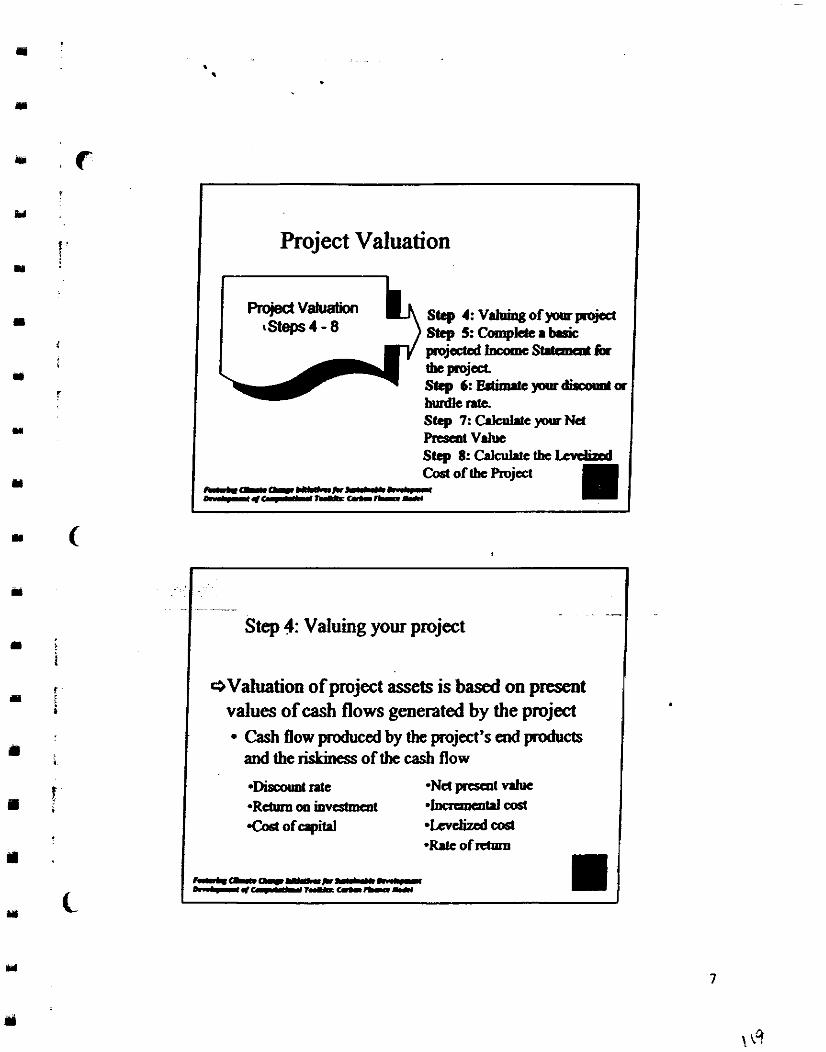
Project Valuation
valuation Step 4:Vduingofpurpojcd
step 5: Complete a b8sk I pFojeded&st.lrmcllt~or
Step 6 : b l i m a t c p u r ~ a I I step 7:c .ko l . t ey~ lr~d
F'Rsd V h step lkCakuktethcLmlircd Cost of thc Prujcct
-m--*-- -*-----
- I step 4: valuing your project -I
I c3Valuation of project assets is based on present values of cash flows generated by the project
Cash flow produced by thc project's end products
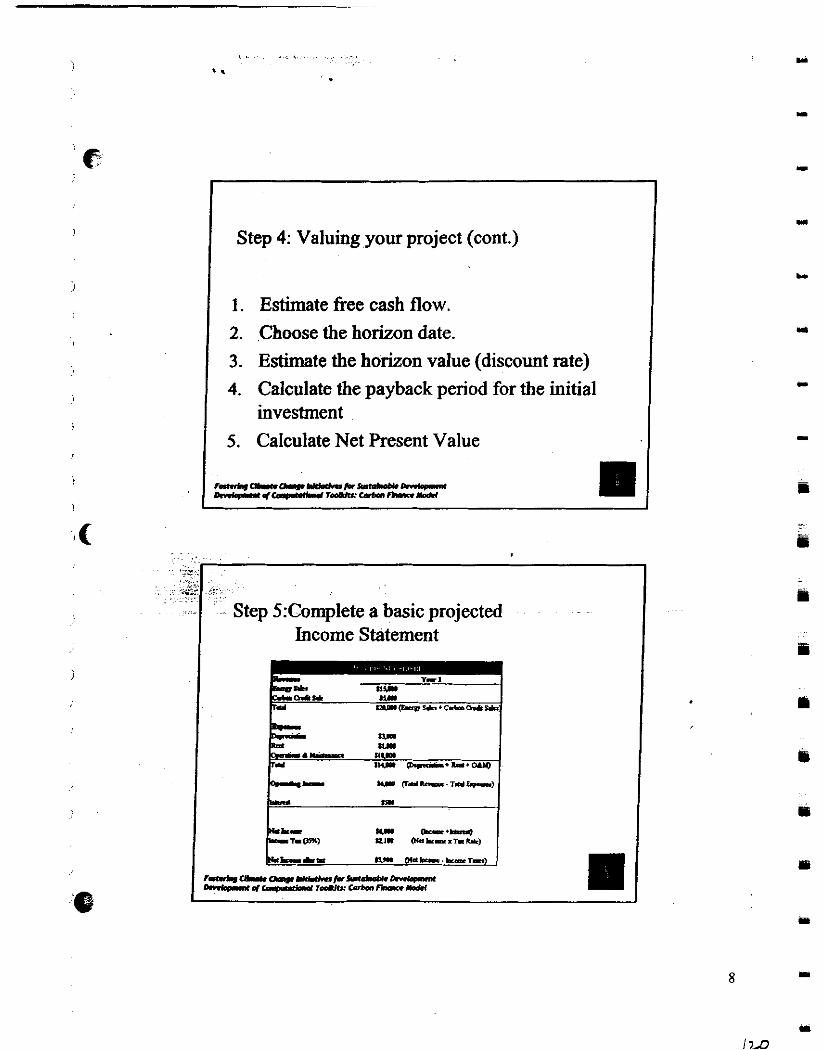
Step 4: Valuing your project (cont.)
1 . Estimate free cash flow. 2. Choose the horizon date. 3. Estimate the horizon value (discount rate) 4. Calculate the payback period for the initial
investment 5. Calculate Net Present Value
'. :~ .-:*%? :*>. . ., . . . . .
. Step 5:Complete a basic projected
I Income Statement
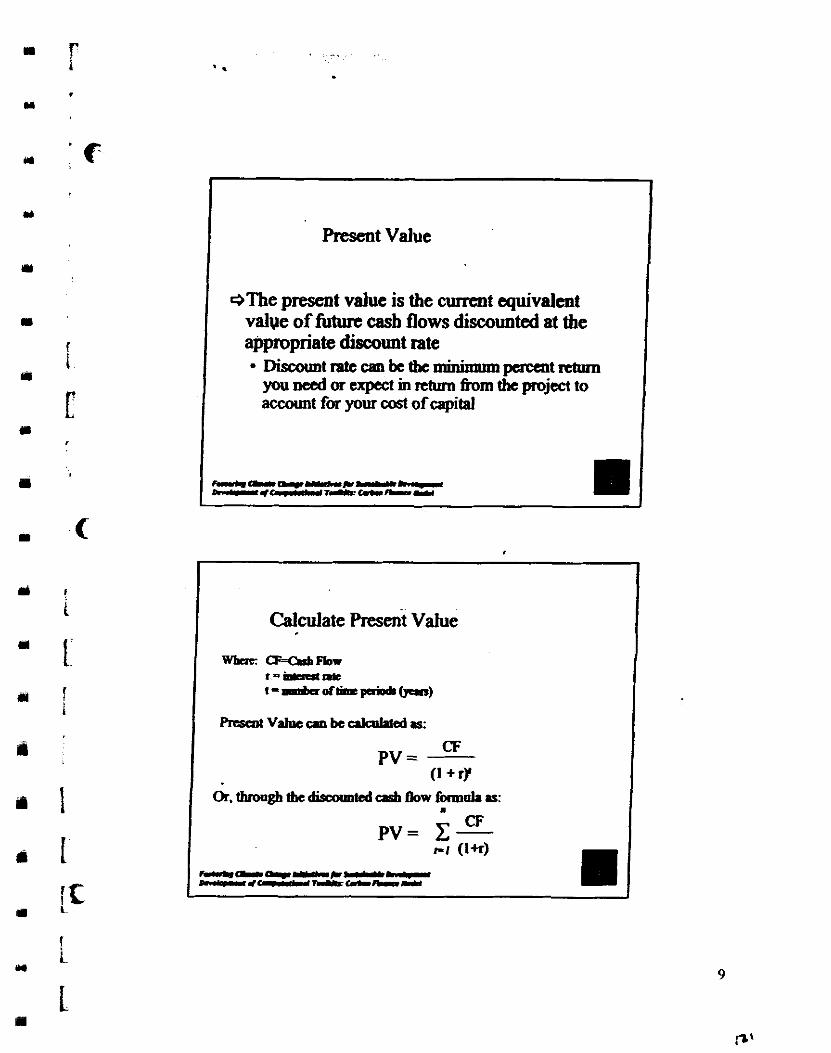
Present Value
QThe present value is the cumnt equivalent valve of h u e casb flows discounted at the appropriate discount rate DiscountratecanbetbcIllininnnapacmtretum you need or ex~ect in return fiom the mi- to - k t for cost ofcapital
Calculate resent Value
or. through tbc dkranmted Oow h n h as: m
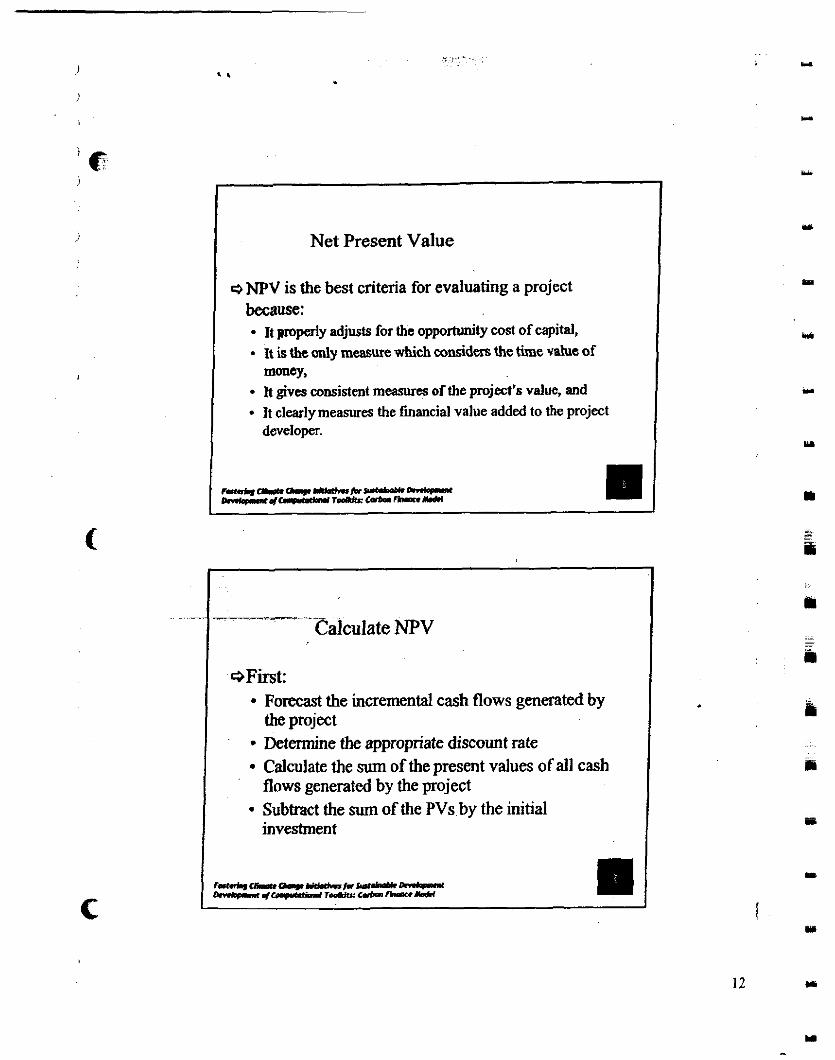
-
Net Present Value
Q NPV is the best criteria for evaluating a project because:
It properly adjusts for the opporhmity cost of capital, It is the only measure which consider8 the time value of money, It gives consistent measures of the project's value, and It clearly measures the financial value added to the project developer.
f-mwCraClq-*-- D r m o p d . l - T e C h - Y I
-. --- --- Calculate NPV
QFirSt: Forecast the incremental cash flows generated by the project Determine the appropriate discount rate Calculate the sum of the present values of all cash flows generated by the project Subtract the sum of the PVs by the initial investment
F a n h c b a o r r n l i ' u W s h - ~ - 7 C r c a w T . . L ( D . - w * o b l
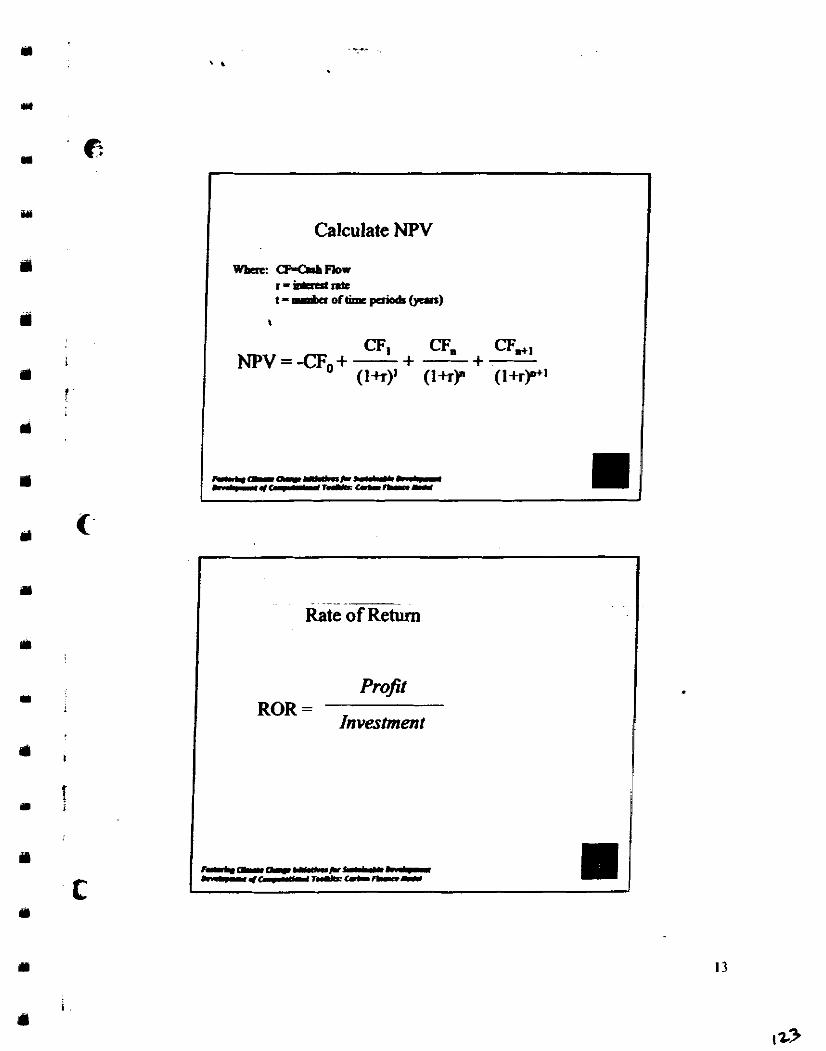
Calculate NPV
m, cF, NPv=-CF,+-+ - +- CF,, ( I ) (I* (I*)'+,
. - - - . --
Rate of Return
Profit ROR =
Inveshnent
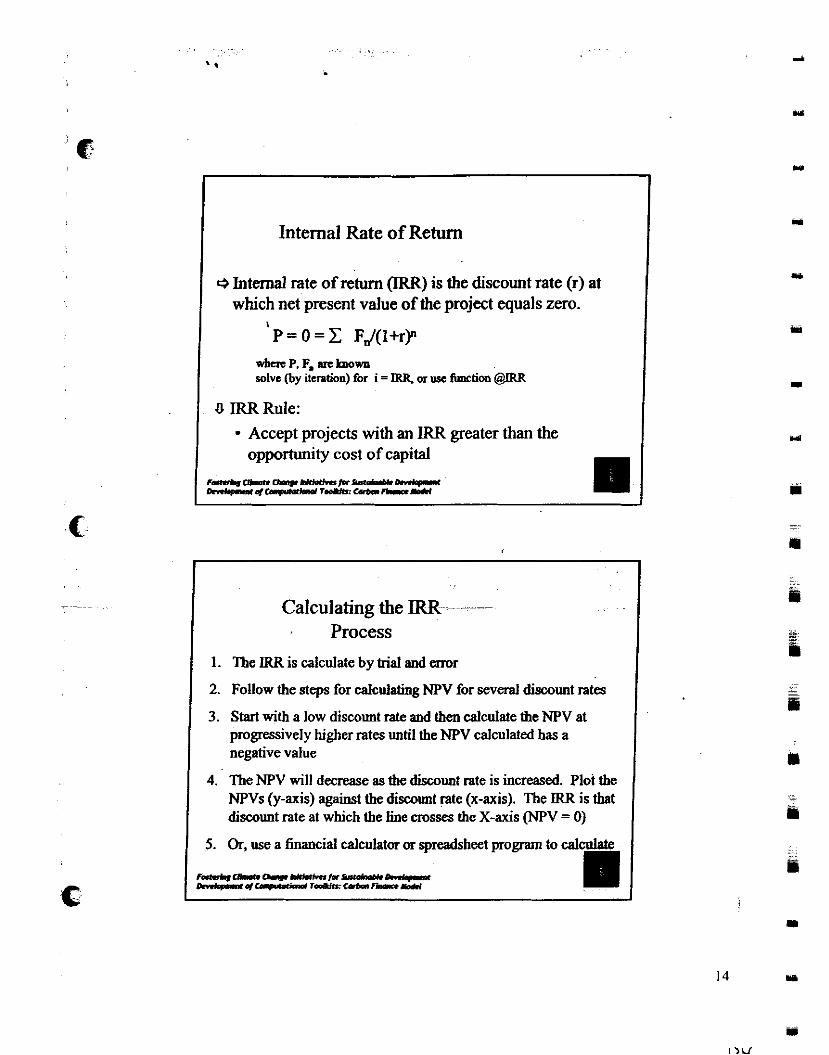
Internal Rate of Return
FS Internal rate of return (IRR) is the discount rate (r) at which net present value of the project equals zero.
I
P = O = C F,,/(l+rp whcrc P. F, uc lmown solve (by ilention) for i = IRR. or lrpc function @US
0 IRR Rule:
Accept projects with an IRR greater than the opportunity cost of capital
DhChnn-w-lr-- m * p r r s f m m a m h d l . a b b C ~ R a Y I
I Calculating the IRR --
Process 1 1. The IRR is calculate by trial and enor
1 2. Follow the steps for calculating NPV for several discount rates
I 3. Start with a low discount rate and then calculate the NPV at progressively higher rates until the NPV calculated has a negative value
4. The NPV will decrease as the h u n t rate is increased. Ploi the NPVs (y-axis) against the h u n t w e (x-axis). The IRR is that discount rate at which the h e crosses the X-axis (NPV = 0)
I 5. Or, use a financial calculator or spreadsheet program to calculate
f~-ar*.Y*tknlr-anCa -sf-r--RllaYI
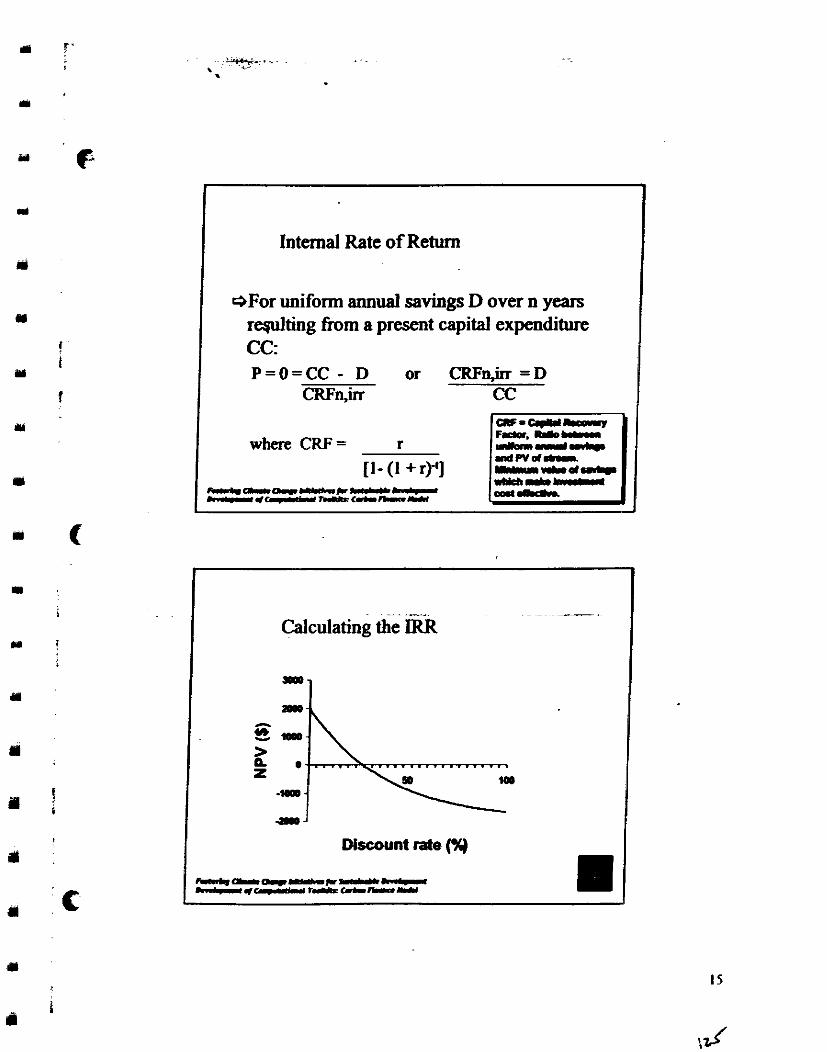
Internal Rate of Retunr
I eFor uniform annual savings D over n years I rqulting from a present capital expenditure Cc: P=O=CC - D or CRFnjir = D
CRFn,irr CC
where CRF = r
11- (1 +rPl k.Omq-*-- IrrC.I--(rC-m
F e r n m- F l - & d m ah-
Calculating the -
3mm
> 0 z
-WOD
E = ~ -am r>iscount rate (%j
-mOl-*-- -.c-rruy....r--rn
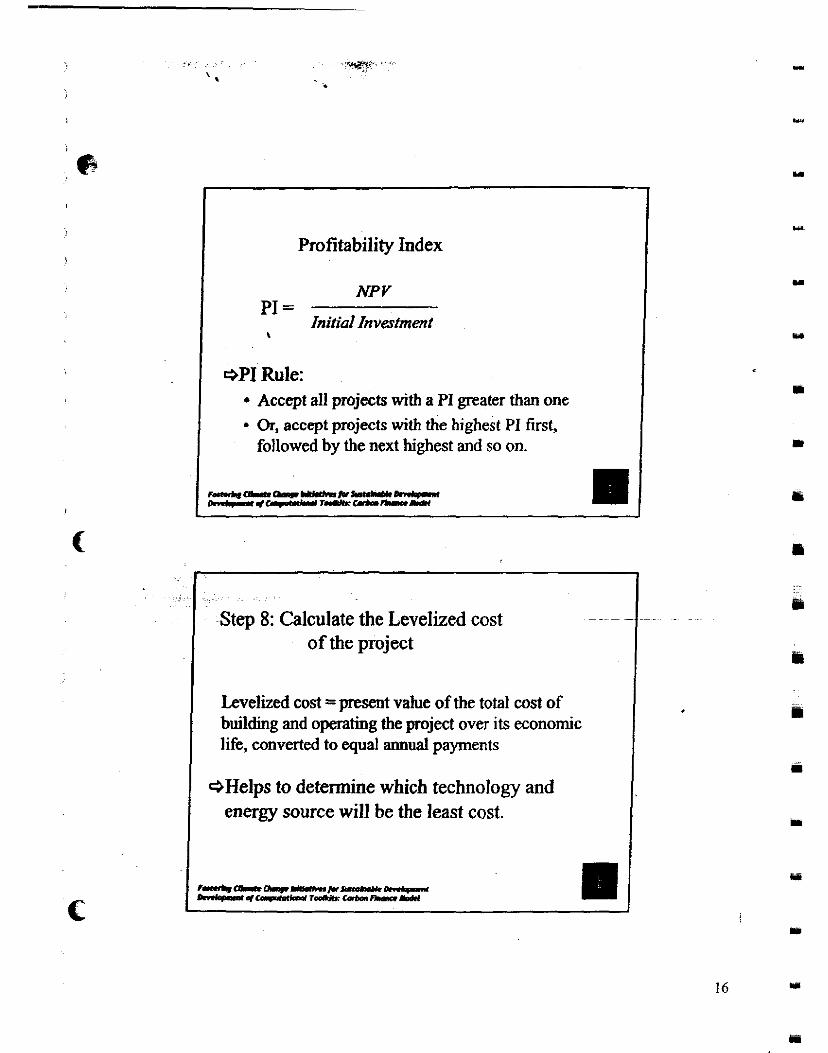
Profitability Index
N P V PI =
Initial lnvatmenl t
+PI Rule: Accept all projects with a PI greater than one Or, accept projects with the highest PI first, followed by the next highest and so on.
I Step 8: Calculate the Levelized cost of the project
Levelized cost =present value of the total cost of building and operating the project over its economic life, converted to equal annual payments
GHelps to determine which technology and energy source will be the least cost.
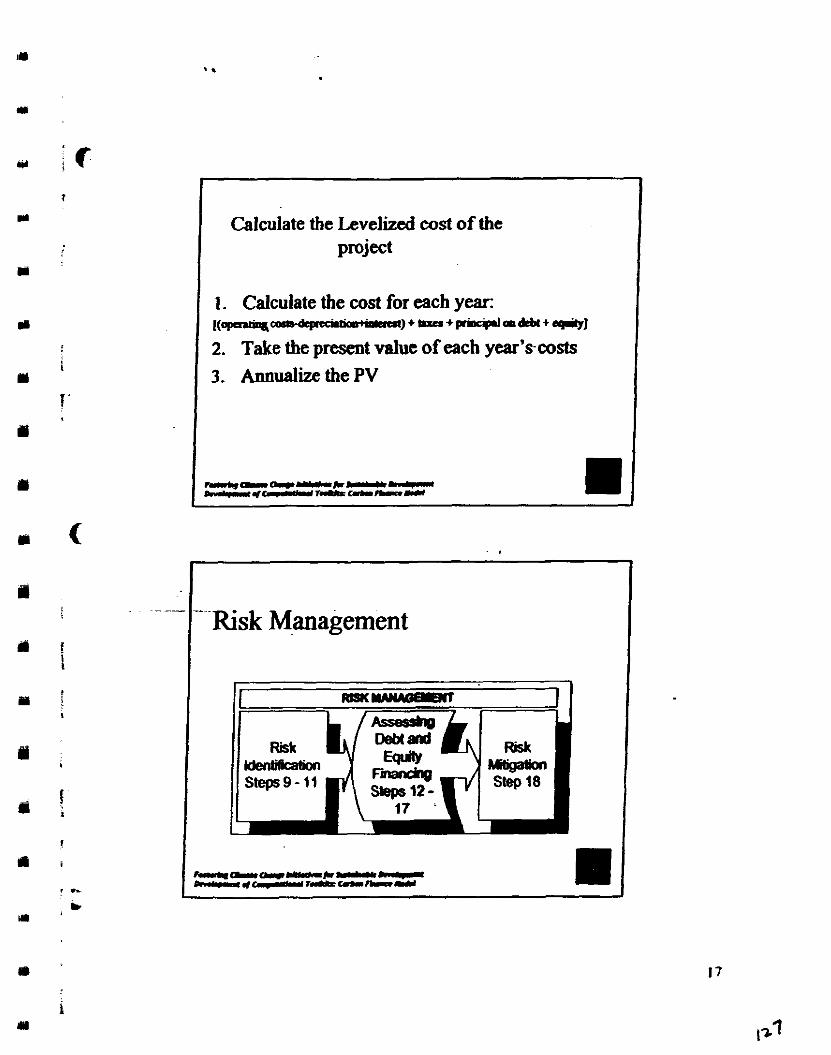
I Calculate the Levelized cost of the project
1. Calculate the cost for each year: . . . [ ( ~ e o a r - a p m r a a r r m h e a ) + ~ + p a c p l l ~ h b c + ~ ~
2. Take the present value of each year's-costs 3. Annualize the PV
RISK-
- -- Risk Management
Clmg-4.C-*-- I * r C L * r ~ l r . . m = c & # . r b - . Y
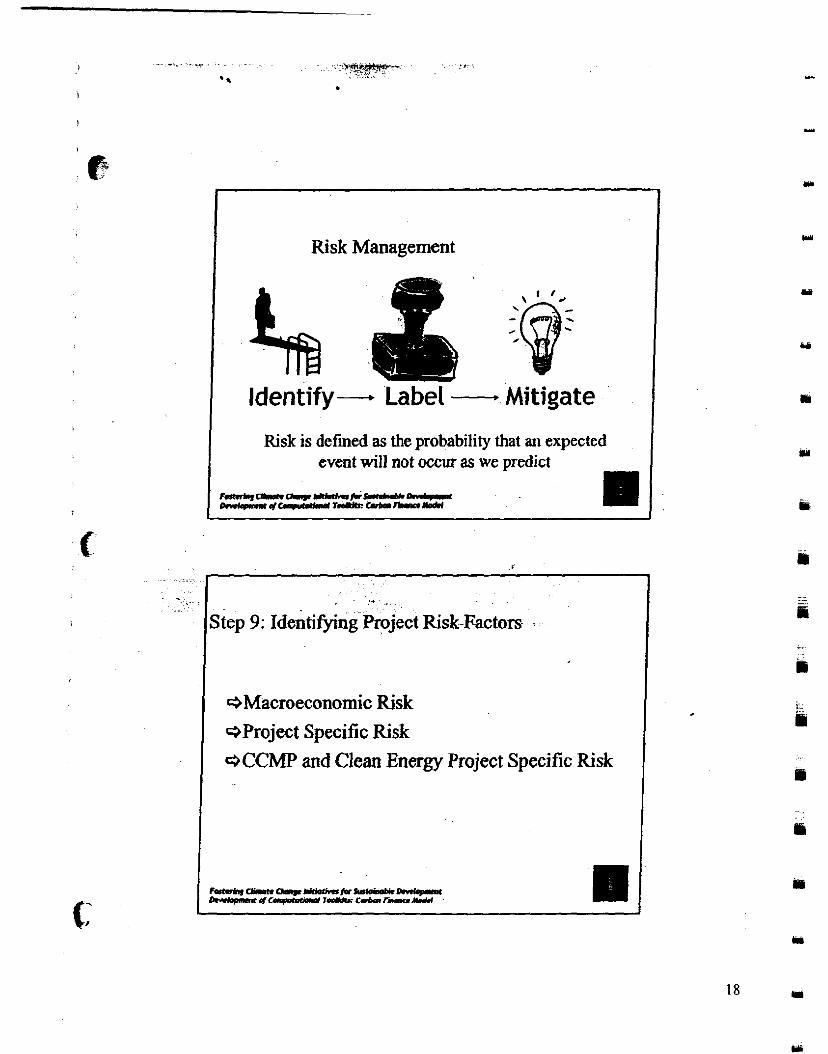
Risk Management
\ - - . .- . ,
Identify- Label - Mitigate
Risk is defined as the probability that an expected event will not occur as we predict
F h r g - - - h - - c , . . w m t . I ~ T & - * m
itep 9: Identifying Project Risk Factors
QMacroeconomic Risk +Project Specific Risk MXMP and Clean Energy Project Specific Risk
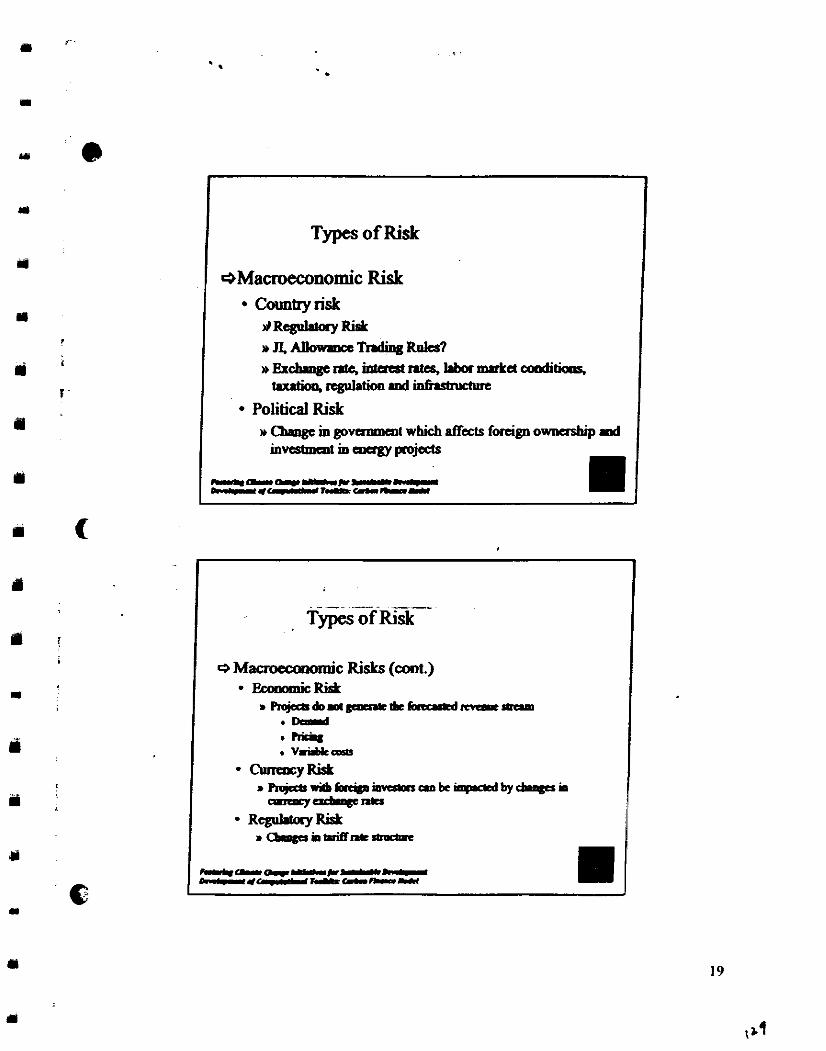
Types of Risk
+Macroeconomic Risk Countryrisk dRegattay Risk nRlubwxmxTRdiqsRutcs? n E x ~ n t e , ~ n l e q h b a m n l r d W n d i t i o m .
t r u t i o q r c g u l . t i o a m d ~
Political Risk n Uumgc in govamnarl which flats forrip owaership m d
Macroeconomic Risks (coot.) . Ecooomic Risk P I r . + & & . o ( ~ & ~ r r r r p c a b u D a
.Deal
.hi+ . v.rirMcrpB
CumncyRid:
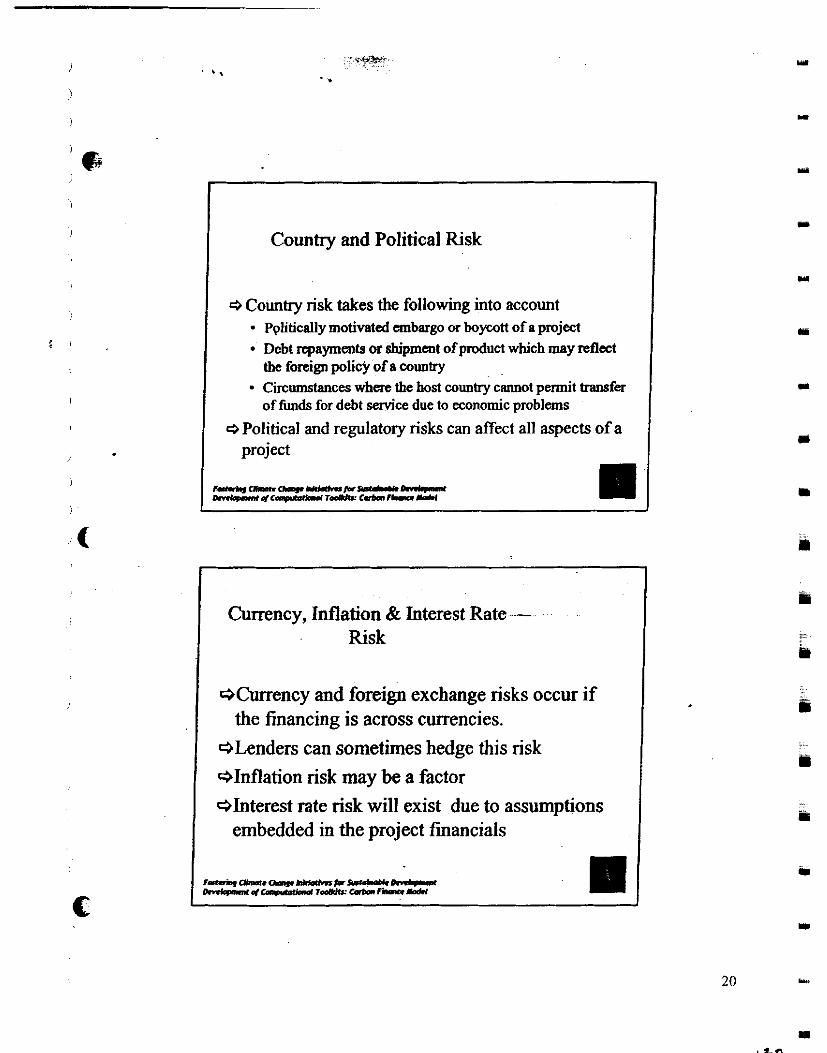
Country and Political Risk
I Country risk takes the following into account I I Pplitically motivated embargo or boycott of n project I
Debt repayments or shipment of product which may reflect the foreign policy of a country Circumstances where the host country cannot permit hansfer of funds for debt service due to economic problems
I Political and regulatory risks can affect all aspects of a project
1 Currency, Inflation &. Interest Rate-- Risk
*Currency and foreign exchange risks occur if the financing is across currencies.
QLenders can sometimes hedge this risk *Inflation risk may be a factor *Interest rate risk will exist due to assumptions
embedded in the project financials
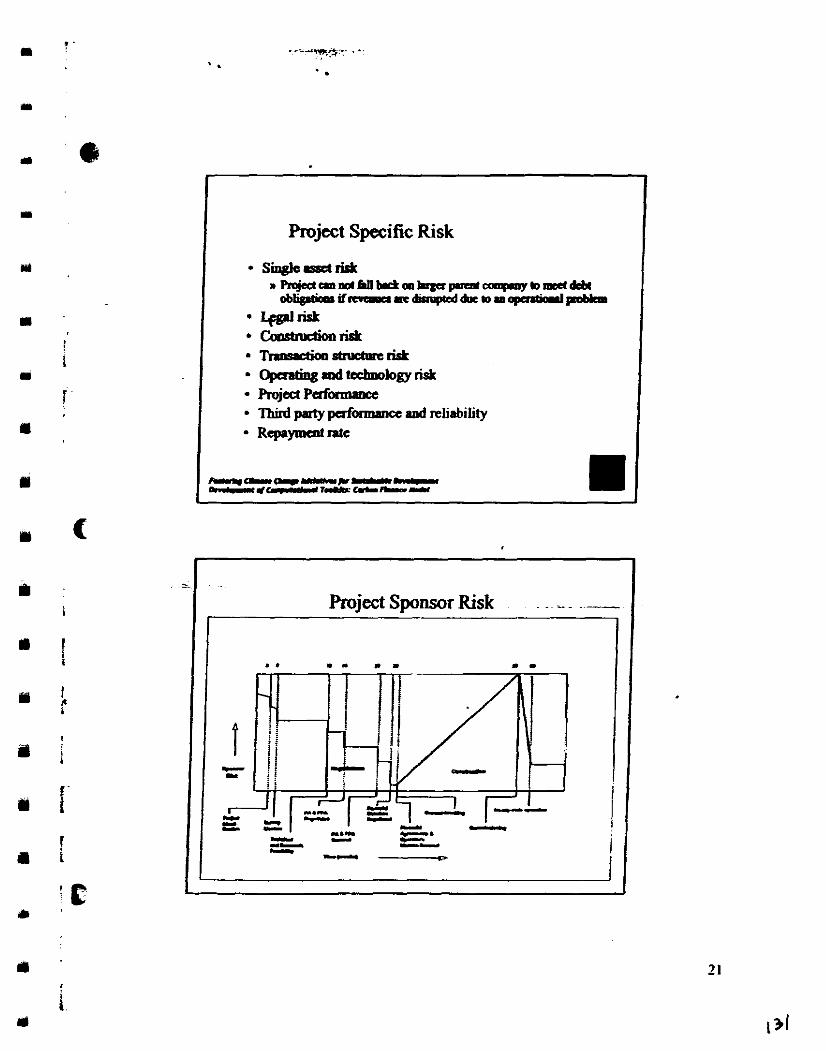
Project Specific Risk
sissctridr
l+gdlisk . Cmshuctionrist . ~ s t N c t m c r i s L
opaahgmdtahmbgyrislr Projed Pd- Third party ~ n m a n c c md reliability Rcprpent Rtc
. - Project Sponsor Risk . -.
P
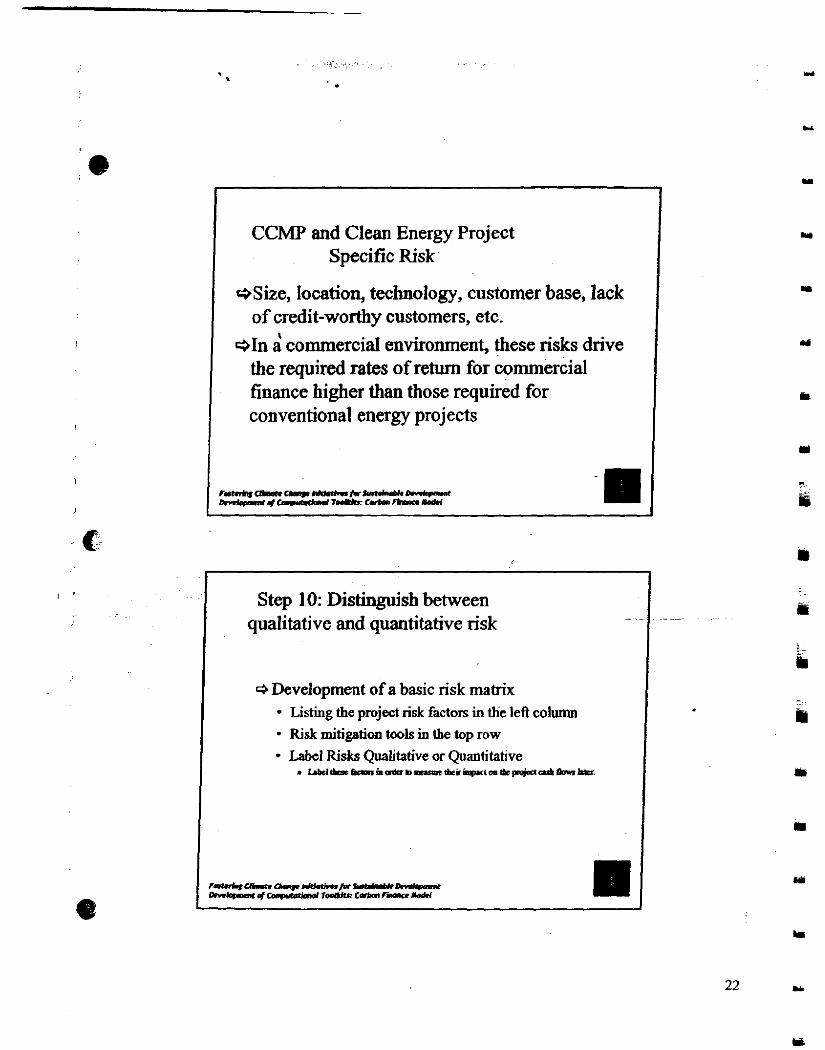
CCMP and Clean Energy Project Specific Risk
eSize, location, technology, customer base, lack of credit-worthy customers, etc.
+In i; commercial environment, these risks drive the required rates of retum for commercial fmance higher than those required for conventional energy projects
Step 10: Distinguish between qualitative and quantitative risk -
1 G Development of a basic risk matrix
I Listing the project risk factors in the left column - Risk mitigation took in the top row
Label Risks Qualitative or Quantitative ~ l k ~ i ~ a p r p n t * r i p r t a ~ ~ r r + t b . r h t r
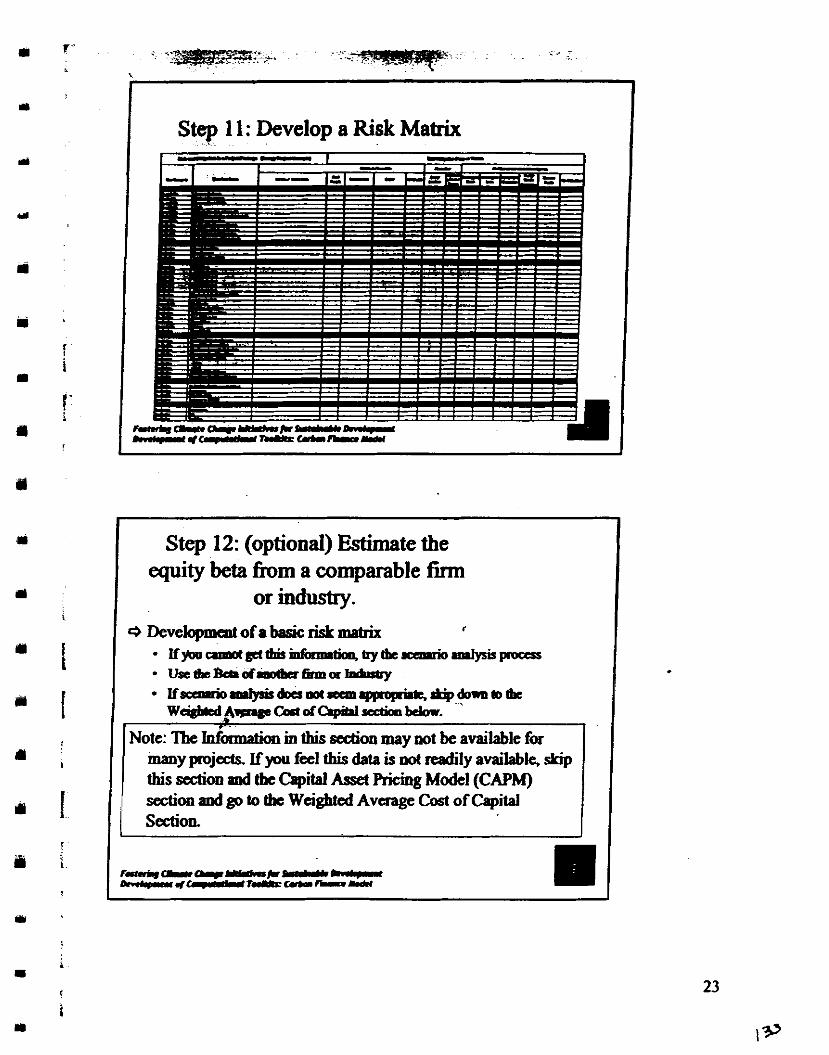
I Step 11: Develop a Risk Matrix
I Step 12: (optional) Estimate the equity beta h m a comparable firm
I or industry. I
Note: Tbe 1~inmatbn in this d o n may not be available for many projects If yw feel this data is not readily available, skip this secikm snd the Capital Asset Pricing Modd (CAPM) d o n aod go to the Weighted Avaage Cost of Capital 1 Section.
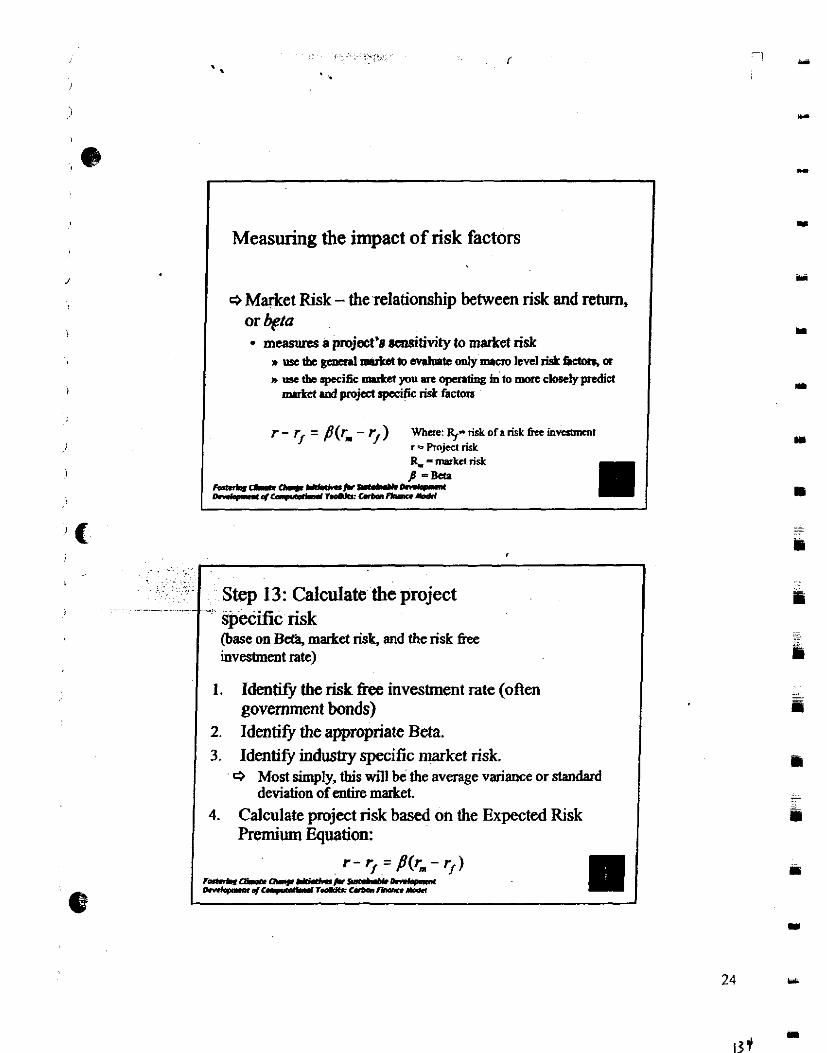
Measuring the impact of risk factors
e Market Risk - the relationship between risk and return, or kta
measures a project's d t i v i t y to market risk P ~ & ~ ~ t o ~ t c ~ m r c r o l c v e l r i s L h c t a * a w use the +c m d e t you m openling in to mom closely predict
mplnt and proj&t apccific risk facton
r - , = ( r - r ) Whcrs: R,= risk of a risk fm invcshmt r - Raiect risk R. - marka risk B
~ P a ( n q . - h . - ~ - q ~ l a U s ~ ~ ~
1. Identify the risk fke investment rate (often 1 govemmenthdsl
.. .. . . ~ , . . . ~ . ~ . . ..
,. . . .. . . . .~ ~
j ~.~
2. Identify the appropriate Beta.
.
Step 13: Calculate the project specific risk (base on Be& market risk, and the risk f?ee inveshnent rate)
3. Identify industry specific market risk. e Most simply, this will be the average variance or standard
deviation of entire market. 4. Calculate project risk based on the Expected Risk
Premium Equation:
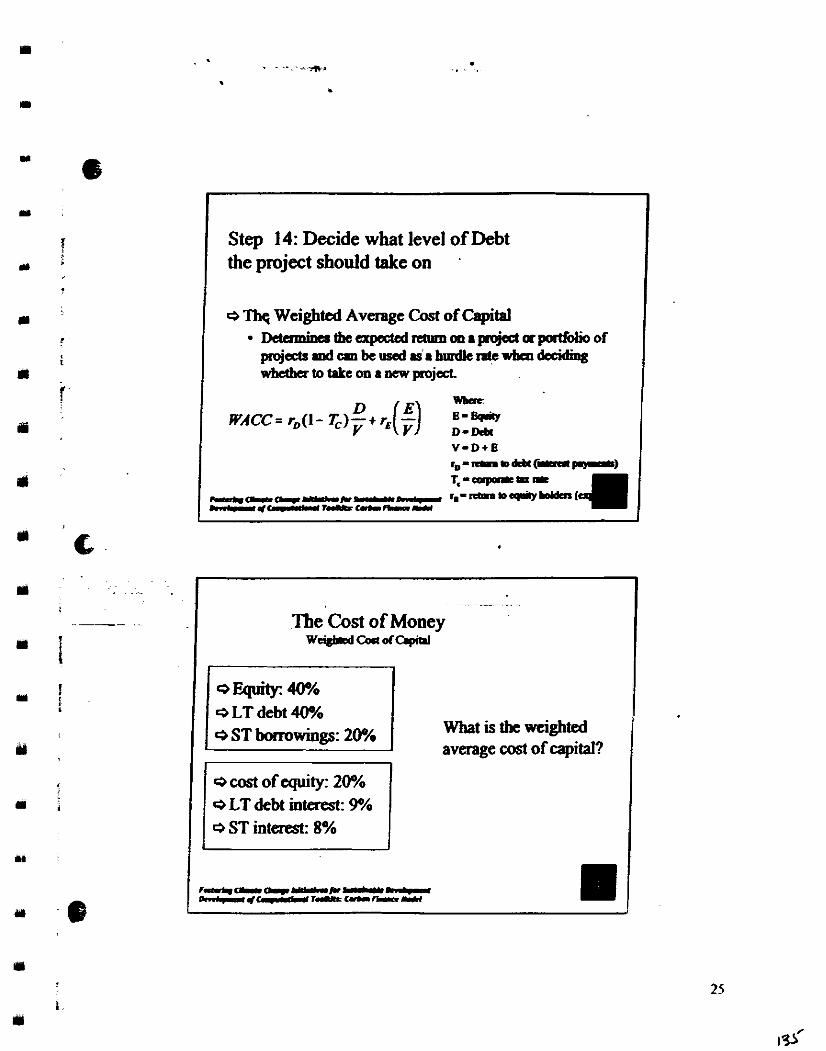
Step 14: Decide what level of Debt the project should take on .
e lhq Weighted Average Cost of Capital . Detamiaestbeupcctcdretllmo~~rpojeda~lioof pmj&tsndcmbeuscdrt~&ndkadcvbcn&ciding wbcthertotakeonraewpmjat
Wbc
WACC = r,(l- v
- -
The'cost of Money W ~ C o a o C ~
e LT debt W/o Q ST bomwings: 20?4 What is the wcighted
average cost of capital?
e cost of equity: 20% LT debt interest: 9% 1
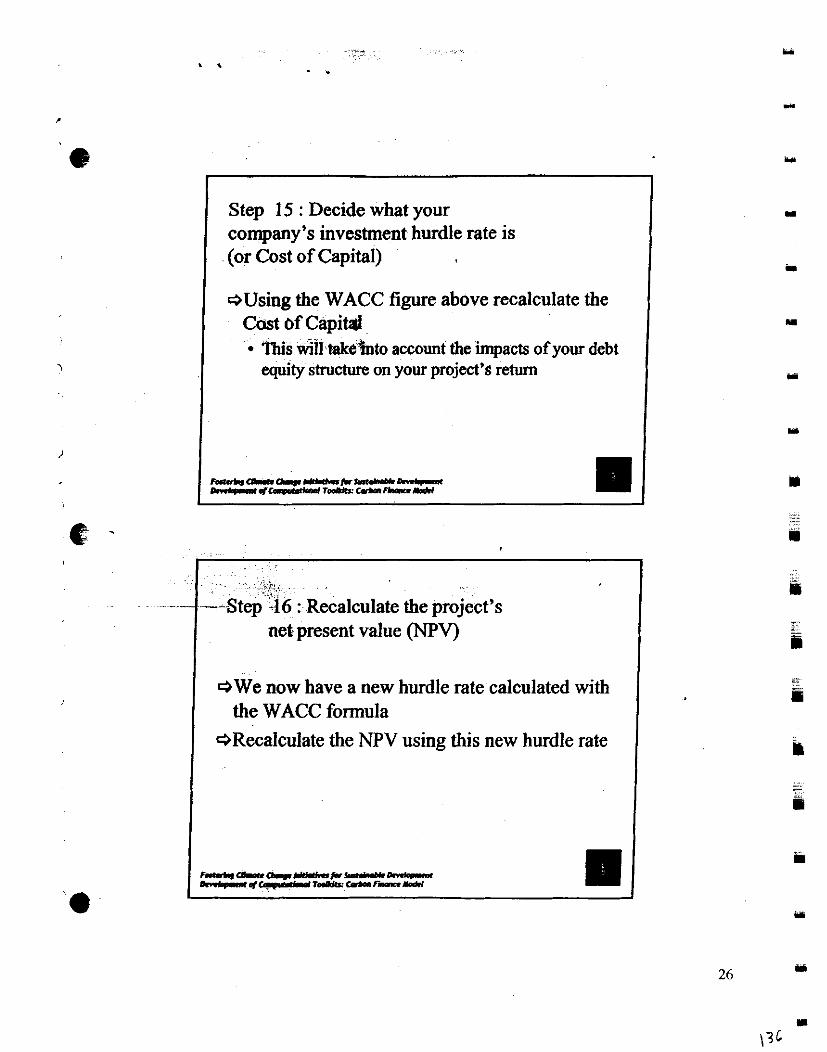
Step 15 : Decide what your company's investment hurdle rate is (or Cost of Capital)
+Using the WACC figure above recalculate the Cost bf Capitid
This will takebto account the impacts of your debt equity structure on your project's return
~ ~
net present value (NPV)
+We now have a new hurdle rate calculated with the WACC formula
eRecalculate the NPV using this new hurdle rate
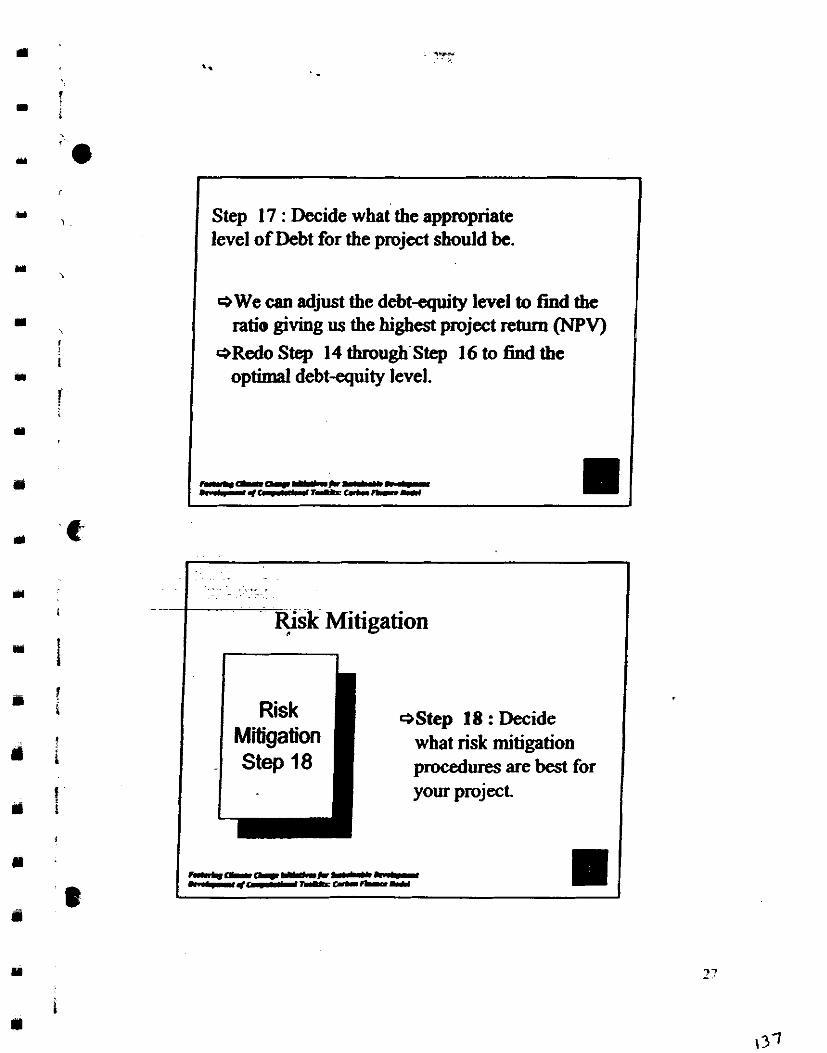
Step 17 : Decide what the appropriate level of Debt for the project should be.
e w e can adjust the debt-equity level to find the ratio giving us the highest project return (NPV)
redo Step 14 through.Step 16 to find the optimal debt-equity level.
~ I i k Mitigation
Risk QStep 18 : Decide Mitigation what risk mitigation Step 18 procedures are best for
your project.
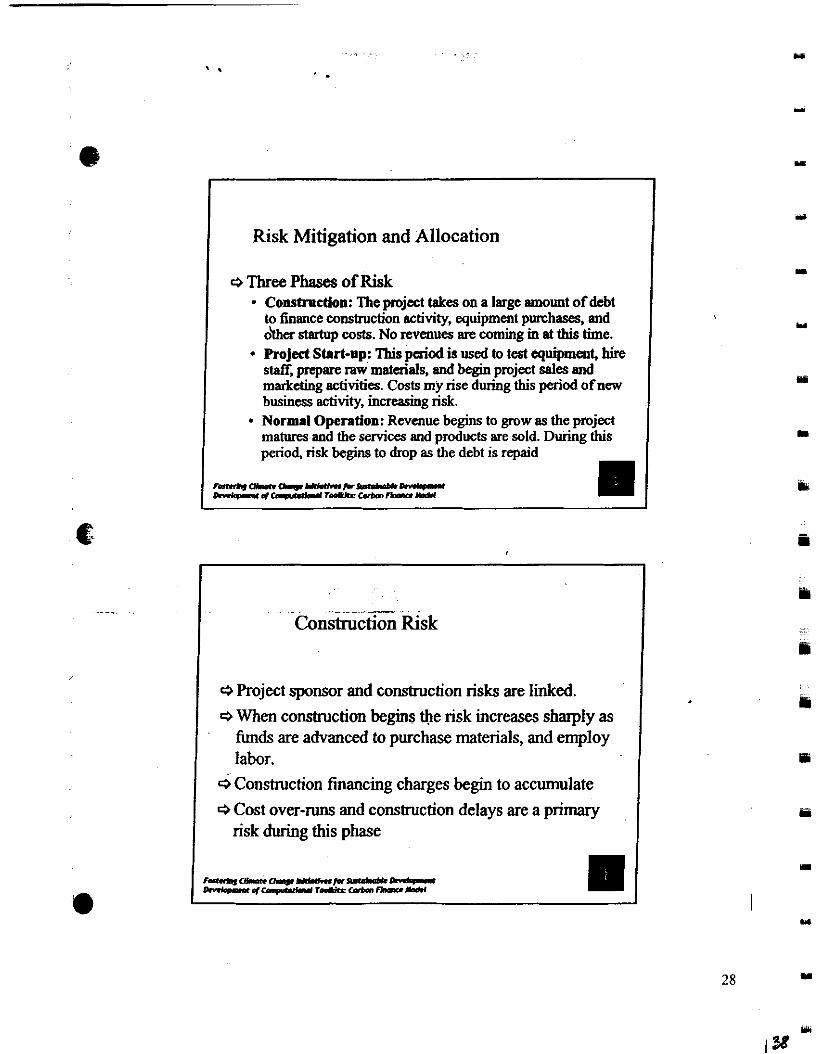
I Risk Mitigation and Allocation
1 o Three Phases of Risk I Construction: The pmjcct takes on a large amount of debt to finance wnshuction activity, equipment phases , and ober starhrp costs. No revenues are coming in at this time. Project Start-up: This paid is used to test equipment, hire staff, mare raw materials, end begin project sales and marketing activities. Costs my rise during this period of new business activity, increasing risk. Normal Operation: Revenue begins to grow as the project matures and the services and ~roducts are sold. Durine this
I -
period, risk begins to drop as b e debt is repaid
f-mhStlhm.Qa-l*--- 0.n*prrrf'.l.rur.a*rc&mFbmmIkm .I
. . --- --
Construction Risk
e Project sponsor and construction risks are linked. When construction begins the risk increases sharply as funds are advanced to purchase materials, and employ labor. Construction financing charges begin to accumulate
e Cost over-runs and construction delays are a primary risk during this phase
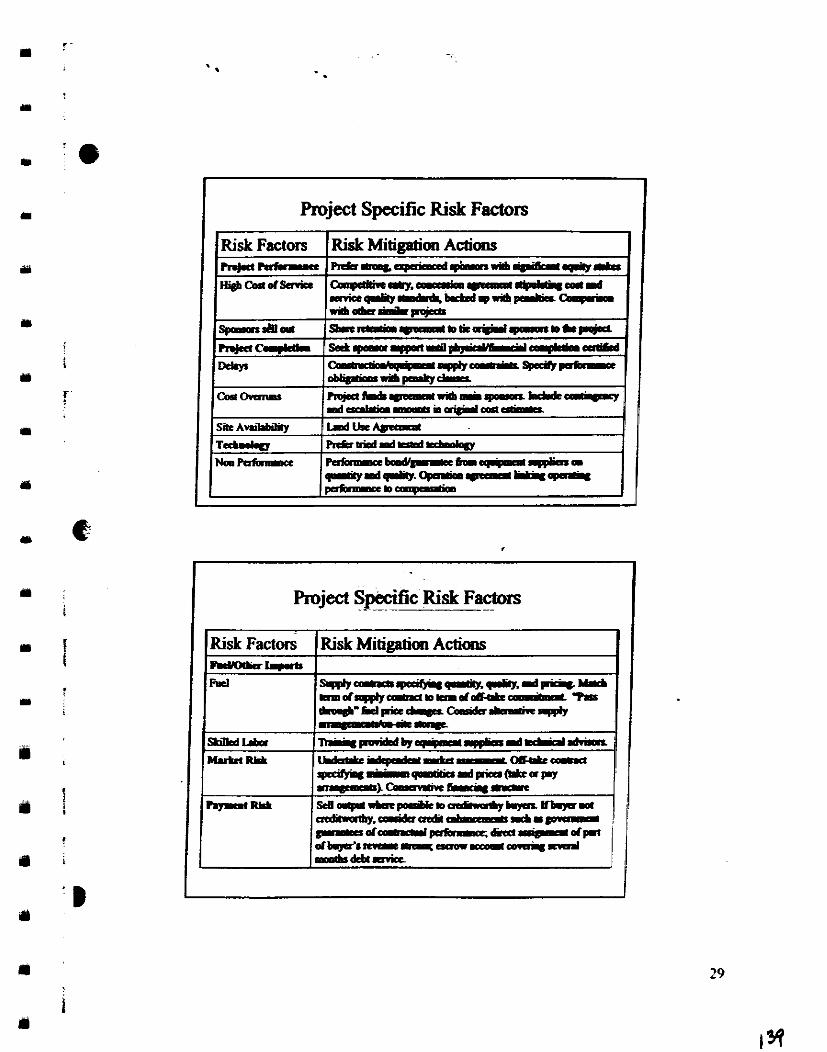
I Project specific ~ i s k Factors I
Project Specific . -~ Risk Facton
Risk ~acto& -- Rd
StiBrdLdor
MubaRirL
w m
Risk Mitigation Actitxis
~ - ~ c F d * . ~ . d ~ Y + L aaorsq#yrmacolsrdau.lAX ' L * t k + - 6 d p P c a a p W - d - . --4=
- p a i M b y r p l i p e w * d r c L i d . d . i m u d l a & c i d r p a d a i t a - ~ o a m 9.rirv4--dpias(Itrap). -=em-)-hrcil- = ~ * ~ * c n d n o l l * L . * r r ~ b p . d l a d k d l y . d d - d = @ - ; oraad-p=f==-x--ofP= db.Jd#ma-cnrorDsd&+
',
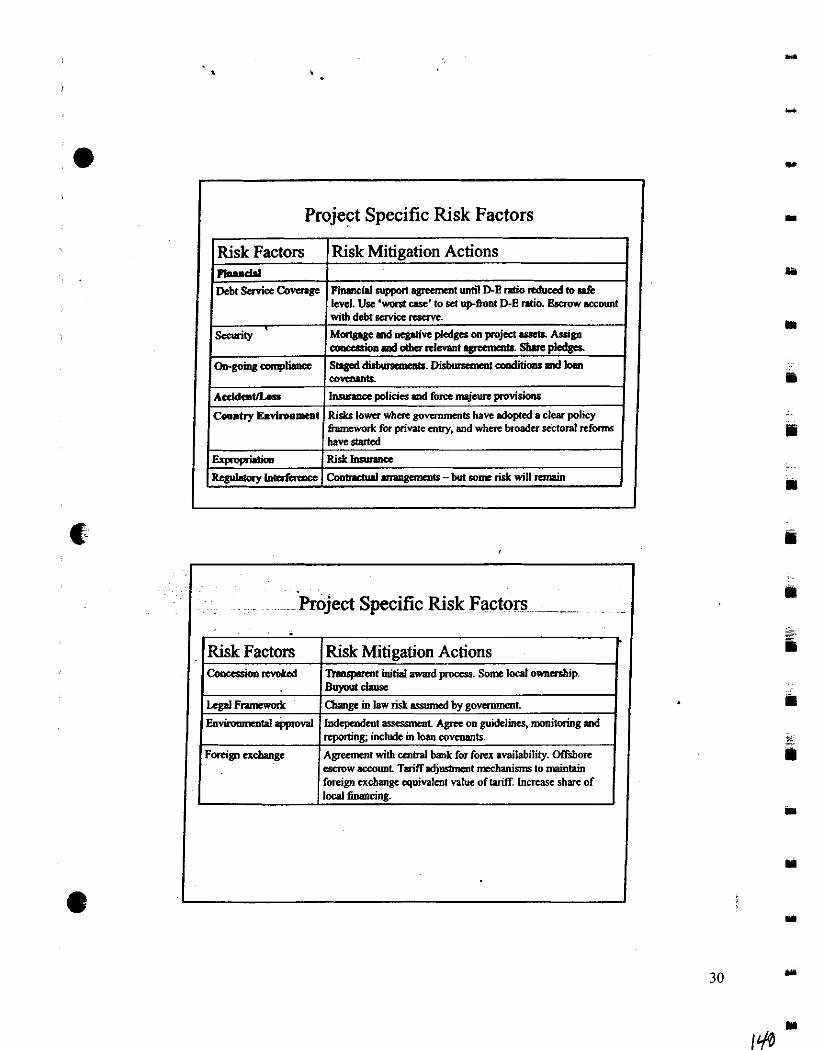
: I . . . . . _.:Prbject Specific RiskFactors~ ~ . .. I
Project Specific Risk Factors
Risk Factors llnucw Debt Savia Camage
W t y
o , , - g o i i m m p ~
Aeddent/L.a
Comatry E.vir~~mcpt
~~- .
Risk Mitigation Actions
Financial wppni agmmmt unbl W E ntio rrduced lo ntc level. Use 'wwst uw' to set ilpfiont D B d o . Bsaow account with debt scnia m.
MmQage d llgu'vt W g c s on pjal lssctr Assjm - ud o(ba rclcnnt igcmrmr. Sbme pledges ~dirbmmraCrDirbllrrrmllcoaditiimSdlosn ODwnmk. I-a policies d force innjcurc poviaiom
Risks lorn where govmunmo haw doptcd a clear policy fmmwork for private mby, and whm broadu &oral doma haw started R i a fnarrws Coomflul~alImL1-butsomcriawillrrrnain
Risk Factors Concession molred
fmgn exchange equrvalmt value of tanff Increase share of local financing.
Risk Mitigation Actions l h b p m n t mbal d poccss. Som I d ownashlp
W p m Envimmmtll w v a l
F d g n exchange
WlyoUl cipua I Qlang+ in law risk ararmcd by govmunmt b u i e p m d m t ~ A g m on guidelines, moniloring a d reporting inchde in loan covnwtr.
Agmmat with untrsl tmk for fom availability. Offsborc e - w scmmt Tmiff diusmat d a n i m to maintain
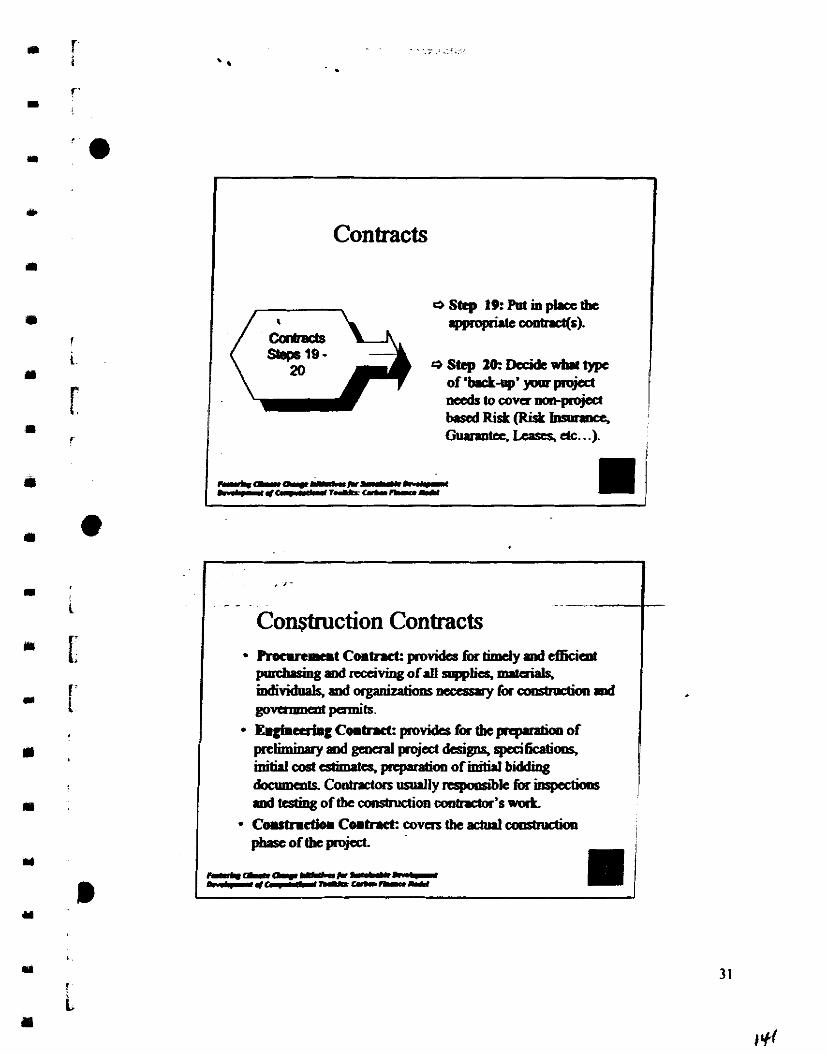
Contracts
I -tee, LtPrcs, dc.. .).
I ~ o ~ c t i o n Contracts -7- E'ghcrrhg Cmtrrw(: p* for or pqmhl of 1 p i 6 i r ~ ~ p o j ~ d s i g m , ~ ~ o m , I
I initi.lcustcstimatcs.pcpantioaofinitiJbiddisg docnmm~s. ~ O C S usually mpcaiik for impcukm d testing of the washdon c o o m ' s wat
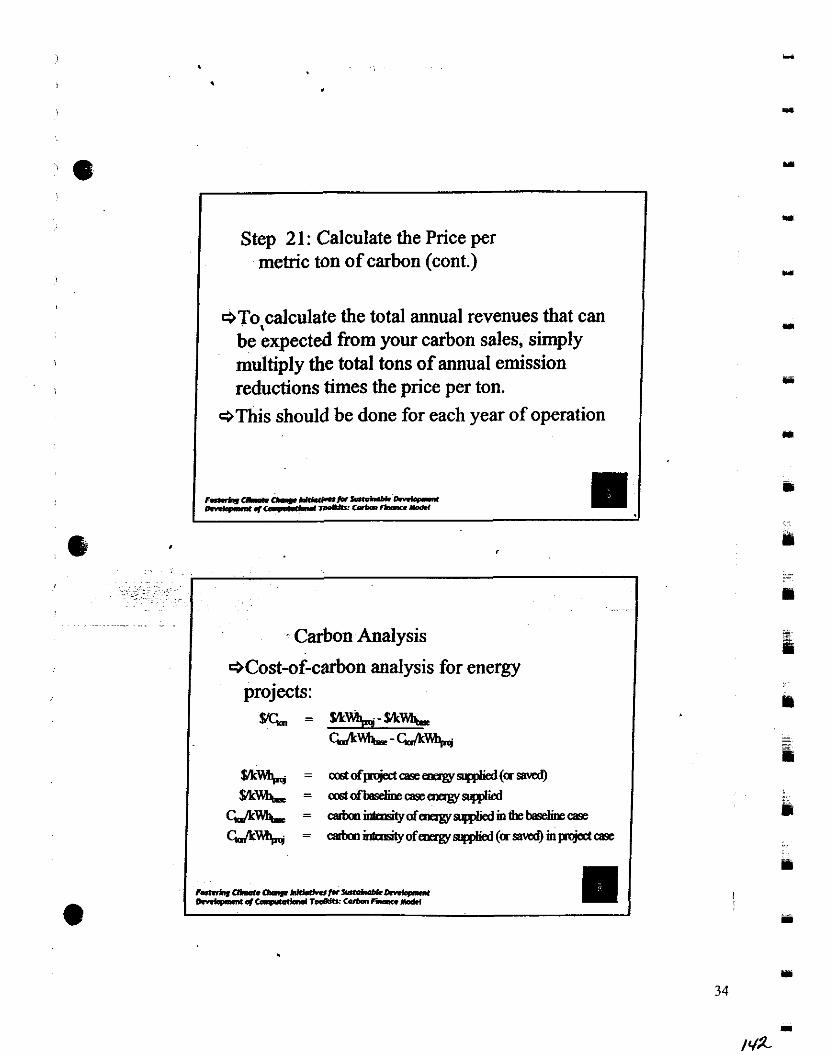
Step 2 1 : Calculate the Price per metric ton of carbon (cont.)
e T o calculate the total annual revenues that can I
be expected from your carbon sales, simply multiply the total tons of annual emission reductions times the price per ton.
eThis should be done for each year of operation
rrnhCI.acbmU*tC.I*-- -.rr-fTm==-t--k.u
. ~- ... . .
Carbon Analysis
e~ost-of-carbon analysis for energy
SK$, = Ww$,--Silr% W%-W%
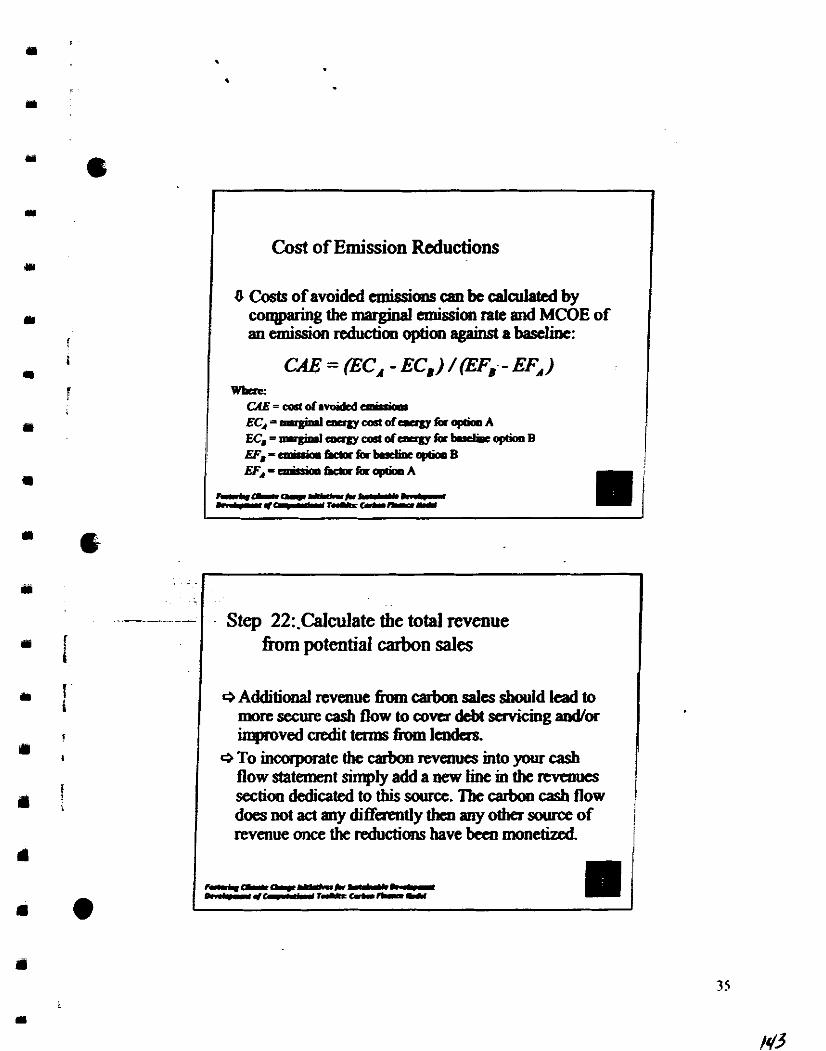
Cost of Emission Reductions
O Costs of avoided emissions can be calculated bv
I oMqparing the marginal emission rate and M C ~ E of an emission reduction option against a baseline
CAE = (EC, - EC,) /@F, - EF,) Wbsr
W = c o r t d a m i d c d ~ ~c,=r-~~~~g~cos(ofacrgTorop(aaA E C , = r ~ m c f g y c o s ( d ~ T o r b . r d i s c o p t a D B ~ = e n i a p . h d o r f a ~ c l p c i o D B EF.-cmkdaDEvbrforc+nA
---am--*-- L..c*-rr.h:u.r-Y
Step 22:.Calculate the total revenue h m potentid carbon sales
Additional revenue h carbon sales should kad to more secure cash flow to cover dcbt servicing andlor improved &t terms from lendas.
*To incorporate the carboo revenues into your cash flow statement simply add a new line in the TCVUIUCS section dedicated to this source. The carbon msh flow does not ad any differently then any other source of revenue once the reductions have bccn monetized
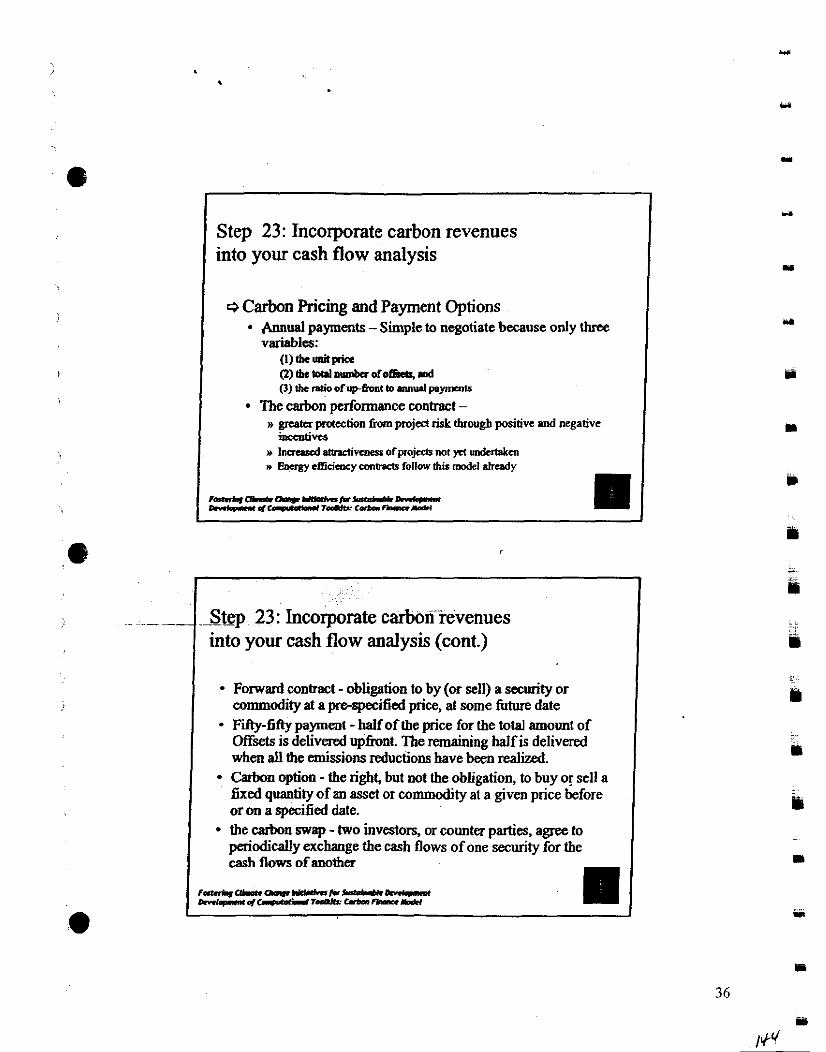
Step 23: Incorporate carbon revenues into your cash flow analysis
Q Carbon Pricing and Payment Options @ual payments - Simple to negotiate because only three variables:
(1)talniritpia ( 2 ) u K t r m n ~ o f o f b d g m d (3) tbe 6 0 f U P h U t b M& p-IS
The carbon performance contract - n gnater protection from projcd risk througb positive aml negative
~ t i v c s w lnaarcd albxtiwnes Ofpmjects not yel undatakcn m effici-y mnats follow this model already
"hOLdLLa-t='T
Step 23: Incorporate carbon revenues into your cash flow analysis (cont.)
Forward contract - obligation to by (or sell) a smurity or commodity at a prsspecified price, at some future date Fifty-fifty payment -half of the price for the total amount of offsets is delivered upfront. The remaining half is delivered when all the emissions reductions have been realized. Carbon option -the right, but not the obligation, to buy or sell a fixed quantity of an asset or commodity at a given price before or on a specified date. the carbon swap -two investors, or counter parties, agree to periodically exchange the cash flows of one security for the cash flows of awther
Ir-- '--a--,,, k"+m-M
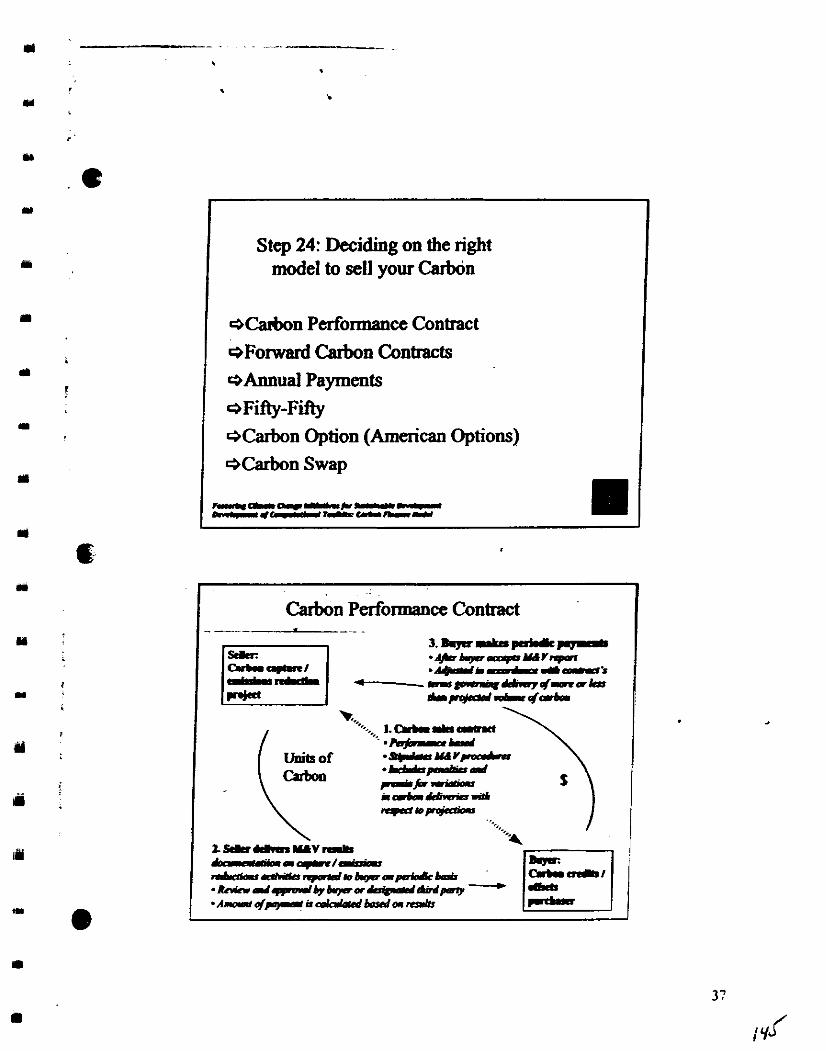
Step 24: Deciding on the right model to sell your W n
I e W n Performance Contract QForward Carbon Conlracts eAnnual Payments e Fifty-Fifty ecarbon Option (American Options)
Carbon Performance Contract
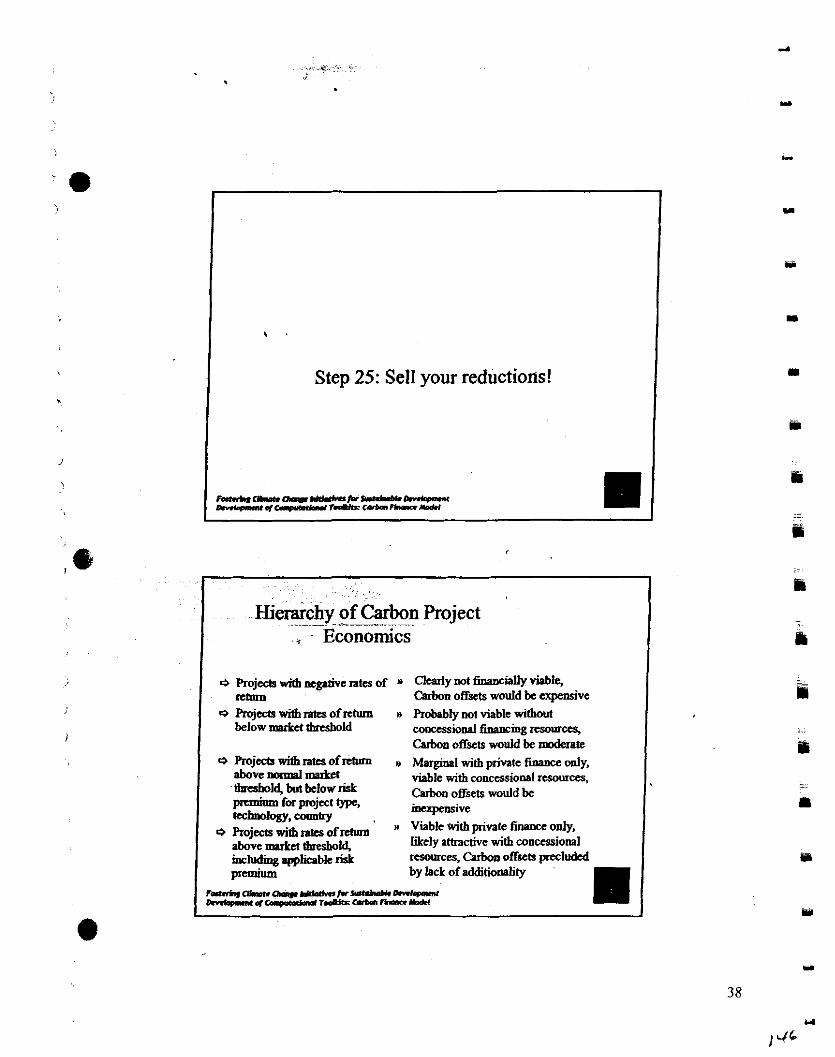
,
Step 25: Sell your reductions!
MnLICslDPQ.rrUYkaf--D".kmm O.n*prrU./Ulpl.oUr.dfezce--md.l
HJeraichy of Carbon Project p i 0 h j e negative mtes of * Clearly not financially d i e ,
Clrbon offsets would be expensive * F'rojabl with Rtcs of return n Robnbly not viable willmut
beiow market threshold coocessid financmg resources, Cubon offsets would be modask
0 hjccb with m t s ofrcbn'n w Marginal with private fllYIIK2 only, above nmmal &t viable with wnccssionnl nsourrcs, - M U but below risk C h n offsets would be Premium for projccl type, ta:blogy, cormtry
incxpemive
hjcctswimnksofrchoa ' w Viable with private finance only, above mukcf (brrshold. likely amactive with conccssional kluding .pplimble risk rr~wrces, Carbon offsets pnctuded premium by lack of additiooaiity
F s a h a b t . Q a y - h - - . . ' b m m I*n(opmtol-rrHaMn-*oM
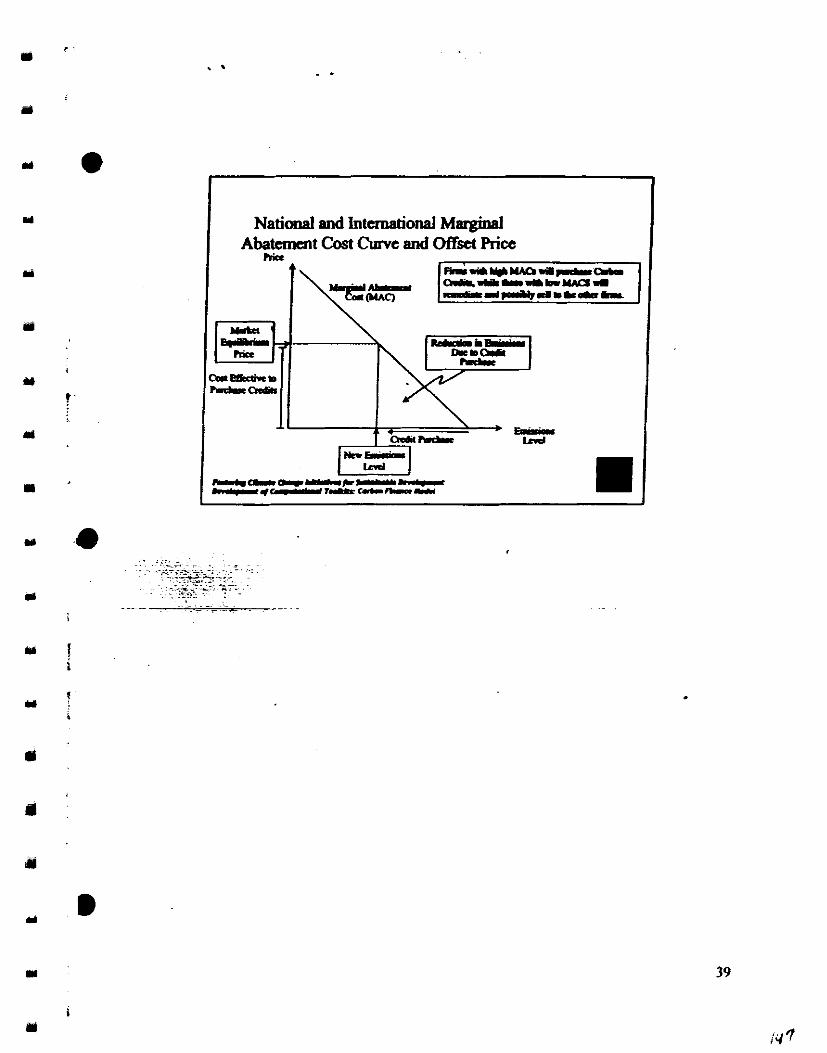
National and International Margiaal Abatement Cost C w e and Offset Rice
hior R V a Y Y A Q d r r l r a b
Computational Tool Kit: Monitoring and Verification
United States Agency for International Development Greenhouse Gas Pollution Prevention Project
Climate Change Supplement (GEP-CCS)
Fostering Climate Change Initiatives for Sustainable Development
-. . .,--:- .~ . . ~-,.
~ - .-v:+y+.p: ~, v Task 1C Computational Tool K i t Monitoring and Verification - -. . ~.
The Louis Berger Group, Inc. C47, Safdarjung Development Area
New Delhi 110 016
May 14,2001
Monlrorfn8 and VetfpaIbn Toolkit
..... TABLE OF CONTENTS ....................... .. ..".......... ,.-.- -1
TABLES AND FtGURES ........ ...... .... -...,.......... ....,...-.......... - ...... ... I1
EXECUTIVE SUMMARY ...,. ...,,....,., ...,. , ........... -...."...--...- I
1. MTRODUCIION" , ................................................. "." ..........-... " .......... 4
.................................................... Intended applications of toolkit ............................. : 4 .................................................................................. Linkages with the other toolkits 5
2. CONCEPTUAL BACKGROUND ..... -.., ,......,,........ ................ .......... 6
Ovaview of the GHG emission reduction sales process ............................................ 6 ........................................................................... Definition and h p o r h c e of M&V 7
International M&V requirements ................................................................................ 8 3. IMPLEMENTING THE MOMTOFUPIG AND VERIFICATION PROTOCOL
Organ& internal plan for implempting M&V ............ ............................. ......... 1 1 . -. . . . . S t a n h d b d M&Vprotoeols ..;,; ..,.......................................... ......... 12 . . . . ...............
, . M&V htoc01 I: CCMPs thatitispiace grid-genexatcd electricity ......................... 13
--M&V F'rotoeol 2: CCMPs that dis~lacc off-grid elcchicity ........................ ; ............ 25 M e V Protocol 3: CCMPs that displace thermallenergy generation ......................... 29 M&V F'rotocol 4: Methane recovery CCMPs ........................................................ 34 Application of procalures to non-energy CCMPs .................................................... 36
. SUPPORTING MATERIALS ..-,,,, ,., ........... -.-......... .-.. ,, 38
CL.M 1: Fostexing Climate Change Initiatives for Sustainable Development Task 1C: Computational Tool Kit
Tabk 1: OPbaa Contcat of Fucb ...................................................... 21 Tabk 2: Potcotid Sotmu of hk&m &om OCMR 23 Table 3: Dind Global Wuming Po- (GWP) of Selected Gases 24 Tabk 4: PolmhIScwccs of Emidma h 'Tbamd CCMPt 33
... Figure 1:ExmpltLod DuratioaCurvc. .--.-, ................................ 17 Figure 2: Eumpk Duly Lod Profile ............................................................ 18 Figure 3: Exlmpk Calculatioos .................................................................... T2
DISCLAIMER
c L I N I : F a s t c r i n g ~ c ~ I n i t h t i v e s T o r ~ k D M ~ l Tsk 1C: C c m p m h a l Tod Kit
'l'lie objectivcof this toolkit is to providc a basic undcrstnnd~ng of t l ie proccxs o f monitoring and verification (M&V) as it rclatcs to climotc c l~angc mitigation projects (CCMPs) and is nicanl ibr the Ciimalc Changc Ccnters (( ' (X-s) a1 Devcloprnciit Alternatives. In general tcrms, M&V refers lo ihc pl-occss oicnstiring that the projcclcil emission reductions developed initially are actually ohtaincd ibllowing projccl i~iiplernentation. MGcV is critical because i t provides the b a s ~ s tor demonstratiiig to thc buyer ofcarbon offscts (Offsets) that miission reductions arc in lsct being dclivercd by the CCMP and, thus, that the annual installrnenl payment o n the Offsets sales conlract shouldbe made.
This toolkit identities the parameters that must be monitored in conjunctio~i with th~. CCMP. Using the procedures froni the Baseline Toolkit, tliese parameters are then usc~ l to quantify the actual emission reductions resulting from the CCMP. For example. the annual electricity generation from a icnewablc projccl is a c r ~ ~ c i a l parameter to monitor and use in calculating actual emission reductions. Because the quantity o f emission reductions determines the carbon credits that can be sold, [he process described here is the basis for the topics covered in the other toolkils.
This toolkit discusses how M&V must be incorporated into the design of the CCMP. and the importance o f M & V in the validation of a project. Guidance is provided in developing a plan for implementing M&V for the projec~. Accepted intcmational standards for M&V are also discussed.
CCMPs involving alternative energyproduction o r energy efficiency are the focus o f this toolkit, but the principles discussed can be applied to any CCMP.
CLlN 1: Fosterit~g Climate Change Initiatives for Sustairiable Developriient Task IC: Computational Tool K i t
dWTAVAILABLE COPY
Oravicrr of the GHG enddon mlwliom da proem
Tbc pfi~css by wbicb the GHG emission reduction poduccd by a climate chmgc mitigation project (CCMP) might be sold mvotves scvaal spccif~ rtcps. Fosl. tbe CCMP developer musl atimatc thc -&on reduerioD expaxed to be poduced by tbe project T b e p o c e d u r r s f o r ~ t h i s s t m u t e u c p r r s c D t e d m t b e ~ T ~ Next, the CCMP developa must develop a pian for monitoring aud vai- ofthe aninionreductioo. ~ C m i s s i o n r c d u c t i o n ~ t e u d c b c M & V ~ . r r t b m prsenrcd to the appropriate rrgulatoty authority for validation of the popd daip ad catifirah of tbe anticipated emission nducrions The regulatory authority tba~ i.%ucs a cdficate for a specific m i m t of anission reduction. At this stage of the pmxs, tbc CCMPbasaCPboaOffsts(Offsts). A n O f f s e s ~ m o n n l u e m t b e ~ c b m dosambcertifiedanisdoorcduction. T k O f f s c t s u n m w b e o f f a u l ~ d c c m t b e carbon market If a sales mlract is executed with a buya, the dcvdops amdrum pmjad md irnplancots tbc monitoring activities outliacd in the U&V pLn An kkgmdent agmt is engaged to periodically verify that the emision rrdustiom .rr in fact being d e l i v d by the projd ova the coamctcd paiod of paiumancc.
'Ibustbeprocasprocadsmthisorder: I. CCMP dcvclopcr cstimstc9 emission reduction 2. CCMP devdopa develops M&V plan 3. Regulatory authority rcvicws the pojcct design, including thc M&V plur; if
appmvcd, tbe pmjd receives rrJi&ion from thc authority 4. Regulatory authority provides crrtr~corion of aninion reduction estimate, tbus
CrGiting Ofhas 5. Offsets arc o f f d for sale by CCMP dcvelopa 6. Rcspectin buya negotiates a sala con- with CCMP devdopa 7. Devdopammamcts the CCMP 8. Devdopa implements the no&* conqmmt of the M&V pho 9. Indcpendeot vcn~mt ion agent uses h e monitoring data to paiatially verify thc
actual amount of mission reduction delivered by the projea
CLlN 1: Fostaing Clinratc Change Irutiallva for SusGainabk DMlopmm: Task IC: ComptatimaI Tool Kit
Monlrorln8 and Vdl j ladon Toolkit
10. Based on the verification resub, the bum pays the developer the appropriate annual installment payment ag specified by the terms of the Offsets mles contract
This toolkit discusses the mle of M&V as a lisk management tool. A good MBV plan is mcesq to acquire validation of the project design aad to obtain ccrtificatim ofGHG offsels. Without certification, the market value of the offsets will be diminished, possibly with gnat severity.
BCFBUSC M&V save such a key role in facilitating CCMP design validation, GHG offset certification. and abwing market value of those offsets, it is very important that the project developa i n c l u d c ~ & ~ costa in CCMP budget and acwunt for M&V in project thetable.
Development of an M&V plan or pmtocol will not in and of itself guarantee project validation or catification of GHG emission reductions. However, an M&V plan is a key wmponmt of CCMP design and is requisite for the project to obtain pruject validation and GHG emission ductions certification. Consequently, it is imperative that close attention be paid to MCV, that adequate resources be budgeted to create the M&V plan, cmd lhat adequate resources be budgeted to fully iraplement the monitoring requirements of the plan. The cost of M&V is a tnrnssction cost that facilitates the sale of carbon emission reductions.
CLIN 1: Fostering Climate Cbaoge Initiatives for Sustainable Devclopmcnt Task 1C: Computational Tool Kit
~aocraditddmdtb~aneapturctbcirfairbhrr0ftbcMB~savicamahC D e v c h p d of this iPcormtry M&V expertise is lLro wry importrat n a mmm br k ~ i n g O f b & s 8 l e s ~ ~ & d . T b c ~ o f b d d i n g a p c i t y o f CCCs lmda GEP-(KS is mc such &OIL
O t h a ~ p o j a t t y p a , a u h a s h m s p o r t . t i m a ~ ~ a d e s a i b c d in a genaal way k Spacifi tmtmmt of such project ~ypcs is no4 p v i M brt tbc
C L I N ~ : F O S ( ~ ~ Q ~ ~ ~ ~ ~ C & I ~ C ~ T ~ ~ S I I ~ ~ ~ ~ P M C D C V C J O P I I C I ) ( Task 1C: Compdltioarl Tool Kit
J
I Monlforhg and VrrlfTmUo~t Toolkit
imoartial observer to the ~miec t and is neither the s u ~ ~ l i c r nor the buver of the carbon -~~ ' -~~ ~ ~
emission nductions gendat& by the pmject ~t the same time, the &tion of the M&V pmtocol (the responsibility of the CCMP developer) is a vital part ofpmjact design - indeed, it is a pnreq&ite for pmject approval as an Offsets proj& by the-hostzounby government as well as the counterpart govemment for qualifying tmda any market based mechanism of funding.
At present, standards for M&V have been developed along two backs. On the one hand, the requimnents of the relevant international agreements and drefl rules for implementing th! international fimding mechanisms include language that guides aspects of the process relevant to them. On the other hand, 4 initiatives as the Robtype Carbon Fund of the World Bank have included specific requirements and standards for the preparation end implementation of M&V protocols.
Definition and importance of M&V
In developing the baseline for a CCMP and sthating emission reductions, projections ere made about future penmeters, such as the baseline carbon emission rate and the pafonnance of the CCMP. M&V is the process of measuring these parametas, then updating the emission reduction calculations by replacing the projected data with the measured d t s . The results ere thus m d verifiable cmigsion reductions
.' c athibutable to the CCMP. The monitored panunken that ere used to document and . . quantify fhe project's .. ~ pgformance pmvide the key LinL betpeen the potential emission
project's validation, which is the final stage of the design process. Once a pmject has been independently validated, one cao assume that it will deliver emission mductions provided that the pmject performs generally as designed. In other words, the project design is d f i e d in the validation stage, and the monitoring and verification stages simply serve to verify the actual performance against the validated design.
In order to ensure that the momtoring effod collects the relevant measurements, and that the verification effort is consistent with the project design, the M&V p n p d during the design stage must specify the pe.rfomance indicators that will be measured and verified. These indicators will make it possible to observe and verify conformance of the project's performance with relevant design criteria In addition to quantitative performance factors, these criteria can include qualitative indicators, for instance the contriiution of the project to achieving sustainable development.
An important pwpose of M&V for a CCMP is its use as a risk management tool. A good M&V plan is necessary to acquire validation of the pmject design and to obtain
CLIN 1: Fostering Climate Change Initiatives for Sustainable Development Task 1C: Computational Tool Kit
c e r t i f i a h of GHG offsds. Witbout cati6ution. the matec d u e of tbc ofberr will k diminisbed, possiMy with lgat rcvaity.
project dmlopa ~UGIII&M&V costs m OCMP ~ l n d & ba M ~ V ia p~crisa tiwt.bk. h a v c i o p i n e c o l c l m i c q t b c ~ d a h u m y m ( k ~ N . i b M e , r h i c h Can*~M&Vcoasf~tbcdcvctcpa.
Dcnlopmnt ofm M&V p h a paao1 will mt m md ofitrdfgPracc popd nlid8tionarmificltioaofGHGani%ica~ rsducaiar...nM&Vhkah*
~ t b c m a ~ d ~ o f & ~ ~ @ " - - - f o r ~ k ' I b c i m p . d o f ~ ~ ~ ~ m t b c n t c o f ~ o f t b c ~ , d t h k - - - r c q ~ ~ ~ f c a r s u m a b d m v i o r d s ( . ~ ~ 'Ihirtoonq however, fbcns an &direct impad of' m a i v i m n l p r o ~ ~ ~ a u g y poductioouemrgyc£Iiciency.
Monitoring and Vrripcatlon Toolkh
The -n that an independent third party, such as that called for by Article 12.5 of the UN FCCC, is ncbdcd to certify emission reductions is that an offkt transaction is not "mo-sum." Both the buycr and the seller could benefit from exaggerating the emission reductions that are credited. Because the financial payments in a power supply project are "mm-mm," this type of project involves a significant degree of two-party vaification. Put of the strategy in this M&V plan is to employ the appmpriate components of the two-party verification of energy performance to streamline the process of third-party vaification of the carbon offsets.
$
A h d y in the pilot phase of application of the Jl mechanism, an adequate M&V plan is c o n s i d 4 an d part of a carbon omet projcct plan. Technically credible M&V plans arc being nquirad as part of wme national project+atification programs, such as the US Initiative on Joint Implementation o. At presmt, M&V methods are mostly being left to an ad hoc process, as it is not yet realistic to standardize the methods used. As international norms are established for pmject-level M&V procedures, compliance with such norms will be required for certification as carbon offsets.
The developmeat of sucb norms is one goal of the World Bank's Rototype Carbon Fund 0, which calk for the validation of project design, including review of the M&V plan to ensure it is appropriate for the proposedpmject and in compliance with relevant standa& or best practice. The PCF also calls for project design to include a baseline study and the development of a project-specific M&V plan or protocol (World Bank 20008 and 2000b). This M&V plan will guide the monitodg of relevant indicators as wen k the audit and verification process. -
,. for potential Prototype .- Csrbon - - Fund pn5jects -_ - - .- ... a review and assessment of all or a part of the assumptions and plans relevant for the successful implanentatiin and operation of the project. The assessment will mainly be done by mfeYlewing documents prepared when developing the project and other relevant documents plus appqniate research by the vslidator.. ." The validator is recummended to be an independent auditor who reviews the project design for appmval against the set miteria One aspect of this validation, or appmval of the project design, should involve a ,
review of the M&V to ensure that it is "appmpriate for the pmject and in compliance with relevant standards or best practice" (World Bank 2000b).
Validation is performed on the bases of the project design documents. A positive validation opinion is required before the project can move into the implementation stage.
For PCF projects, the World Bank recommends that "the M&V will include a list of indicators that must be measured (e.g. fossil fuel consumption) and instructions how meanarments must be made, what records must be kept, how the cotlected information must be processed and documented, and who will be responsible for these activities." m e World Bank expresses pa~ticular concern about potential conflicts of interest in the
CLIN I: Fostering Climate Cbange Initiatives for Sustainable Development Task 1C: Computational Tool Kit 9
M ~ a d v a ( p d r r r . . l b i r
M & V p o c c y u ~ I ~ t c s t b . t r u c b c m f l i d s s b o u M k ldpmmtcdif poglik (World Balk 2000b).
S m i h r f y , t b c U S U I c r i t a i . ~ t c t h t a p o j & ( r u b m i r r i a o ~ d ' . . ~ p o v i s i o n r f a t n d d a g t h c ~ ~ ~ r s d P c s d a ~ ~ ~ t b e p o j a 4 d m . p a M d i c b r * . f a ~ ~ > mdfor- .cturlrcsultswitbthoaai~yprojtcttd" I3ntba,mCUSIJlGpiddiDer . . Tor- RoposJrreqoin&filiqgofmmwrl+ttntiDcfoda' ...- d m d aulytisir m anissiors rcduador supwlmd...significmt ' I lnpdsb&..'.sigBifiaall tammic ad orha "
CLIN 1: Fostering C l i m a ~ ~ Change lnibjtivcs for Susnimbk DCKbpnrat Task 1C: C a q & h d T d Kit 10
Monitoring and Verl(/latrlion Toolkit
5. Identify the technical skills required for the monitoring portion of the M&V. Do the necessary skills exist 'in-house' to perform necessary monitoring on an ongoing basis? If not, are there service providers, which can handle the monitoring?
6. Identify ' d ing sources for M&V. 7. Initiate M&V at appropriate time.
Standardized M&V protocdr
The purpose of M&V is to obtain monitored data with which an independent verification agent can calculate actual emission reductions &om a CCMP. In order to illustrate this process, this section p-ts standardized M&V protocols for selected alternative energy geneation and energy efficiency CCMPs. Each protocol identifies the data that should be monitored and presents the calculation procedures used to quantify emission reductions.
The format of this section is similar to that found in the Baseline Toolkit, because the calcdlation procedures are the same in both toolkits. The purposes of the two toolkits are different, howevcr. The Baseline Toolkit is forward-looking, estimating future emission reductions h m currently available data for the purpose of facilitating an Offsets sales contract. M&V uses measured data to verify, after the fact, the projections made in the Baseline Toolkit. The calculation algorithms included here specify the particular data that must be acquired, fiom on-site monitoring or other appropriate sources. Thus, this M&V Toolkit contains all the information necessary to create a project-specific M&V proloco1 and to identify the specific data points that must be subjected to on-going monitaing. These monitoring data will be used by an independent vm'fication agent to verify that the CCMP delivers sustained emission reductions lhroughout the project life span.
As in the baseline, the M&V procedures will depend on the source from which emission reductions are displaced Thus, the standardized protocols developed are:
M&V Protocol I: CCMPs that displace w.d-generated electricity M&V Protocol 2: CCMPs that displace Off-grid electricity M&V Protocol 3: CCMPs that displace thermal energy generation
A fourth procedure is presented specifically for CCMPs chat generate electricity or thermal energy by burning methane recovered h m , for example, a coal mine, landfill or agribusiness facility. These methane recovery projects reduce greenhouse gas emissions in two ways. First, they reduce carbon dioxide emissions by displacing electricity or thermal generation from some baseline source. These carbon emission reductions are quantified using M&V Protocol 1,2, or 3, as appropriate. Secondly, methane recovery
I Published calculation procedures often include the effect of incomplete carbon oxidation in the ~0mbItstion of fossil fuels. In the procedures pcsented here, this effcct is not included, because it has a minimal impcl on the maIris (typically 1% or less). . -.
CLlN 1: Fostering Climate Change initiatives for Sustainable Dcvclopmcnt Task 1C: Computational Tool Kit 12
For the CCMP, tbc foUowhg i n f o ~ ~ ~ t i o n h m.
- - l = j~ tyo (gcn -po jsason&) - AMurl d&bicity -rim (MWblyr) ( g c n a o d b n m k ~ ~ only) - Rcductim in nmurl dcEhicity CmmnpIh (Mwwy) (qykinuyp91.e on&) - Type of fud d ( f h m d p l m c r r on&) - ~ k n t b a t n t e ( ~ ~ / M W h ) a p h e t n c t ~ c f 6 c h c y ( % ) r p h t ~ l a n l f d
Eoanmtptioll (-*on&) - EmissioluganntalbyCCMP(tC/ym)
t
T b e t d o f ~ t b c p o d D d i o o o f d o c b i c i t y ~ ~ ~ h q r t i t e shaigbtfbmd. ItanbewromplishedlrsingmaaummtdrepDltiqeyltclnctint wi l l , ind i l ikd ibood ,~krplrcofacbprojsd T h e r e p r o j o c p , ~ d l , . ~ a m t t c s o f c o m s + , i a c l o d c ~ t ~ ~ m a r u r e d r s a d a u e R k C S p o r c r oo~paiodicbasiqtypiallynayfcvminutcs. Tbey~mlSr t rmmnaofeol l rpc . ltsoincludercDortinnsvstaosthrtOlLeibcreEordedwr~DlodPctiaadm.nd~e
Moni tMiagreduct iomme~ci tyeo~mme~mcypojars is inbamtfymm d i f k d t . However, effieiclry projects o h id& m M&V p h b &Cjr mugy
MaPnawenl and Ven$c&m Itolood @OE 1997).
stcpi:uld.tt-'- For r project tht displrccs grid-gcacntaf ekctrkity, tbc p j & r bomdq mi ~ t b c p r o j & 1 s i t c d t h e e c k E t r i c i t y ~ d ~ ~ b which the project will k ' - d
CLJN I: Fostering CIiaratc Ch;mgc Initiatives fa Swtahak Dcvcloprrnl Tzsk 1C: C m p M k d Tool Kit
Monlrorhg end VrnpcaUon TwIkit
In India, most state electric systems are composed almost exclusively of thmnal plants, but ~ v a a l states (Kernla. Himachal Mesh , Meghalaya, Jammu & bhmir , Orissa, and KarnataLa) have significnnt hydro capacity. As a result of the different resource bases of the diffaent SEB grids, the marginal source(s) displaced by a particular CCMP, and thus the emission reductions of the C M , wuld be very different depending on its location.
Step 3: Identify tbt approprhte b w h e lourre ' As with the project boundary, M&V should dctamim whetha the baseline generation sources have changed over time. This is especially critical for a grid-connected project, so the I ~ & v pmcp sbould include the same careful determination of the baseline some as was p e r f d prior to the project's o p t i o n
, To quantify emission reductions from CCMPs that displace grid-gmerated electricity, it - i s first m w x m y to identify the baseline -tion source(s), or the source(s) that will be displaced by the CCMP. Unfortunately, there is no standard method for identifying project baselines. Because of the diversity of CCMP and technology typy as well as host country contexts, it n unlikely that a single method could apply to all cases. However, there has been some progress in identifying the of methods that apply best to certain project types, and in beginning to harmonize these procedures (see Michaelowa 1999). There are several types of decison ~ l e s for determining baselins, including:
< 1. Direct comparison with current practice (i.e., "before anl after") 2. National macmemmmic analysis 3. Mici-oemnomic investment analysis (see World Bank 2000a) 4. -Controlgroopadysis(see WorIdBank2000a) 5. Benchmarks, tahnology standards or motrim 6. Barrier analysis (see IEA 1997) - -- - - - - . - -
Of these, microeconomic or invahnent analysis ( d e #3) is appropriate to CCMPs. Applied to power wxor planning, the investment analysis approach indicates that the baseline c a k rejnwents ihe l ~ - c o s t solution. In thecase of CCMPS, the application of m i m n o m i c investmeat analysis is not as simple as comparing the IRR values for two altemative projects. Instead, we need to identify the generation source(s) that wiU be replaced or deferred as a result of the CCMPs. This requires blending the invement analysis (rule #3) appmacb with certain elements ofbenchmarks (rule #5).
The leact-cost solution gov- the operation, or dispatching of the existing gennation plants.2 Least-cost dispatching favors the operation of available generation so- with the lowest variable costs, or short-term marginal costs. Since t h d plants have significant hrcl costs, their variable costs are higher than those of hydro plants. Thermal
CLIN 1: Fostering Climate Change Initiatives for Sustainable DeveIcpmnt Task 1C: Computational Tool Kit IS
T h w . t b c b . s c l i a c r # w c e ( s ) a r o u l d b c t b c ~ ~ a ) t b r t Q o p n t i o o d t b c ~ r c p L c c r . I b e M i a e c p + o f ~ u ~ ~ 8 r l d r a d r i m e m l & ~ t i o n f u e l m i x m c r a b c a p t u r c d m t b c ~ c l r b o l l ~ r p r Tbhkrbcn: Bbmcbmart~anbeuscdtodmpl irytbcrmtydr T b e ~ ~ f o r baseline cmissicms from electricity me:
I )ToueeQ~vcngecmiJs ioD~1~rOCtbC~~( i .~ tOPlcmias ioordiv ided bytDtllnla),a 2) To the weigbkd-svage mPginol aainion ntc
ForCCklP4itkcksr~ttbc&t~-k&hsliacLtbc- avaagcmvgiDalcmiasiaante(mdbodIr2Ibo~t). 'Ibcrasonfmtbisish@ytbc k g i c i h t ~ - d i s p G c b i n e i l l 8 ~ t i o a ~ ~ ~ a i t b k r vPkbkEos l s .~ash~orrcnernb lc s . S i a c c l h e a c ~ s o m x s m e ~ c o s r - k i n IUUIS of miable cost, k y sbould always k dispatched a much u posit Tbamrl - .re dispatched only as aaasary.
CLM I: Foslaing climte ChplgC IniIiatiw for SIISbimbk Devclopmmc Task 1C: Conpltltioaal T d Kit 16
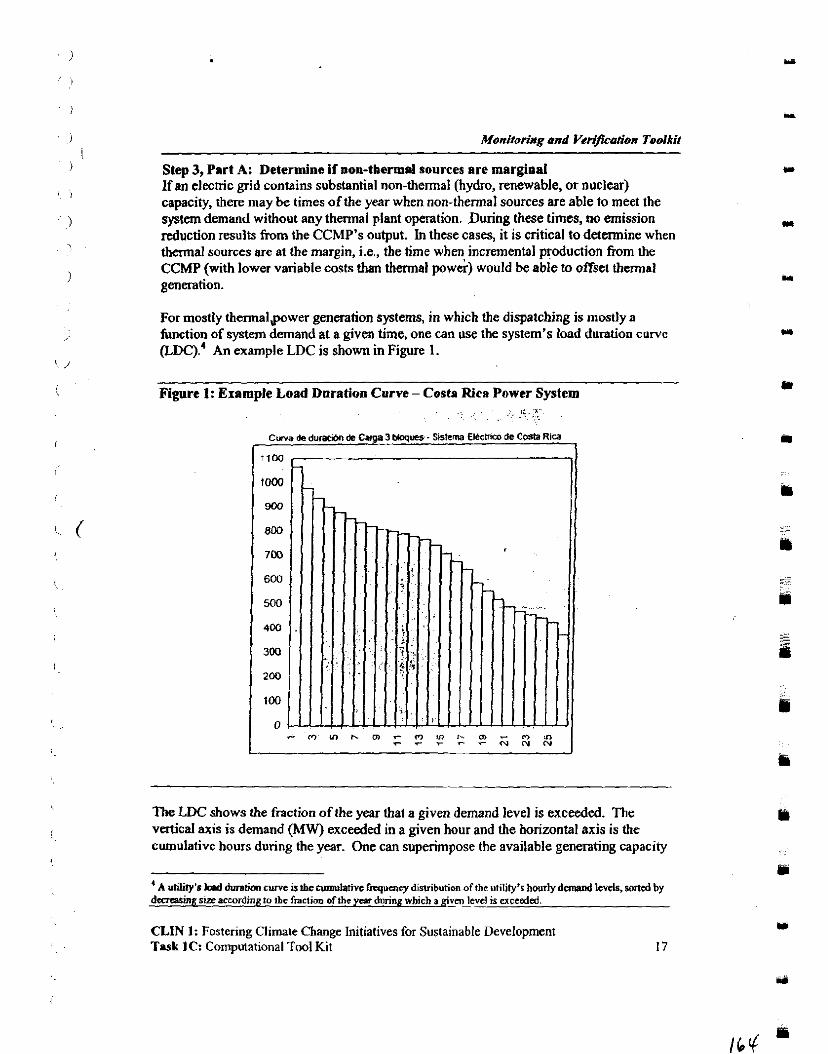
Monitoring and Ver#fication Toolkit
Step 3, Part A: Determine if non-thermal sources are marginal If an electric grid contains substantial non-thermal fiydro, renewable, or nuclear) capacity, there may be times of the year when non-thermal sources are able to meet the system demand without any thermal plant operation. During these times, no emission reduction results from the CCMP's output. In these cases, it is critical to determine when thermal sources are at the margin, i.e., the time when incremental production from the CCMP (with lower variable costs than thermal pw&) would be able to offset thermal generation.
For mostly thermalpower generation systems, in which the dispatching is mostly a function of system demand at a given time, one can use the system's load duration curve (LDC)? An example LDC is shown in Figure 1.
Figure 1: Example Load Duration Curve - Costa Rica Power System
The LDC shows the fraction of the year that a given demand level is exceeded. The v d c a l axis is demand (MW) exceeded in a given hour and the horizontal axis is thc - cumulative hours during the year. One can superimpose the available generating capacity
' A utilify'r bd dunria, curve is t b s ~ m ~ i v s f r r g u m ~ dimibution of the utility's hourlydrmand lcvds, Jond by daracin~slzc according to tbs fraction orthe y e o during which a b v m ~ v c l is acecdd.
CLlN 1: Fostering Climate Change Initiatives for Sustainable Development Task 1C: Computational Tool Kit 17
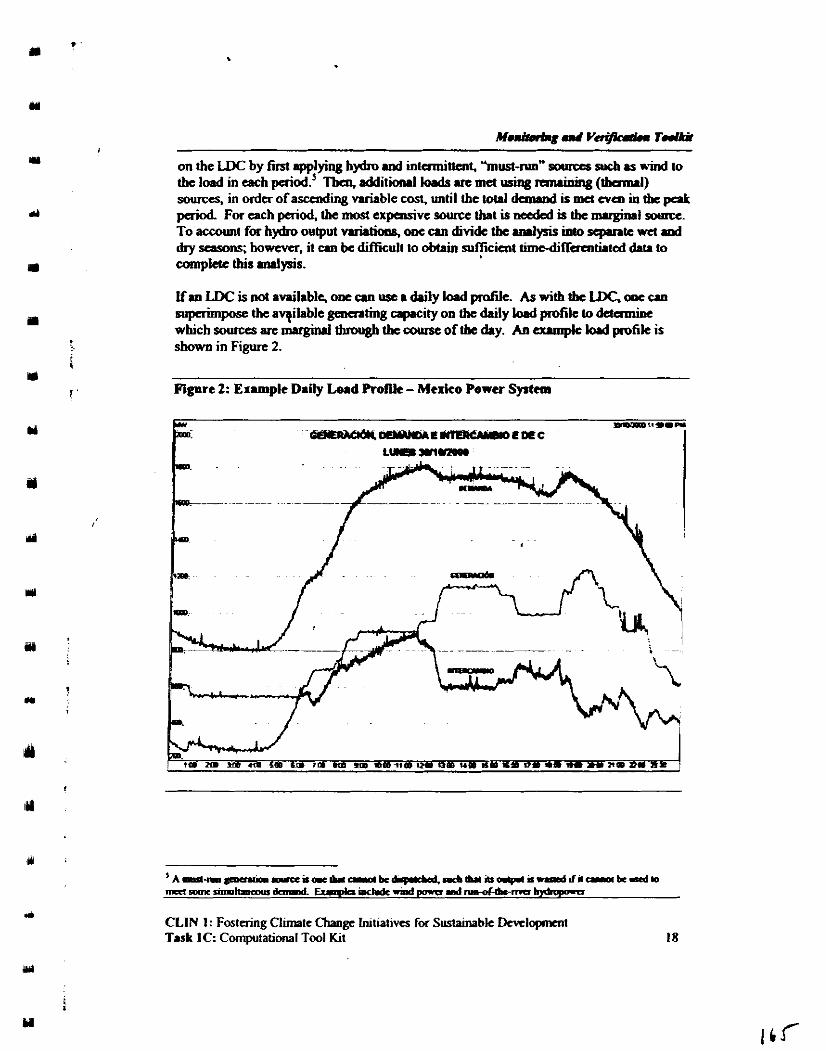
on the LDC by 6rsl applying byim ird intamittent, bust-nm" gurccs arb is rid to the load in each paid.' Tbea, dditibnrl loads are met wing rerminiag (tbarml) sources, in order of a s d i n g variable cost. until thc tolll danand is ma cvcn in cbc peak paiod F a each period. tbe mast expensive source that is needed is tbe mugird n*mr.
Toa~~~untforbyimoutputvu*tioaqoocandiw&thcrarlysis~rcpuw~ad dry seasons; however, it can be difficult to obtain rufficMlt time-diffamtiucd &u to eomplac this analysis.
Urn LDC is not available, ooe can use a duly load pofik. As with tbc LDC. m un thc a ~ i l a b l e geaarting capacity on the daily lod pmfik to duamine
whichsouresucmargi~Ithrougbtheanoseoftheday. Ancumpkbadpmfikis shown in Figure 2.
Figure 2: Example Daily Load Rot&- Mexico Power System
CLlN 1: Fostering Climate Change htiat~vcs for Sustainabk Drrrlopnent Task IC: Compltabonal Tool Kit
Monfrorfng and Vdprrulon Toolkit
As discussed above, m e SEB grids arc domina~ed by thermal plants, and othm by hydm capacity. Thus. the marginal source(s) displaced by CCMPs in lndia depend . - h&ly on the location of the CCMP.
Step 3, Purt B: Detembe nhleb of tbe U~ermd wurm are mrgi~I A& detexmining whether non-thermal sources o p t e at the margin, the n a t step is to determine which thermal sources ue marginal. This is &ally critical if the systan contains base-load thnmal plants. As with hydro sources, the o&ation of base-load thamal plants would be the same whetha or not the CCMP is built. Thus, b l o a d thennal plants shwld not be included in calculating the weighted-avcnge emission rate, beoauss tbe CCMP would never displace generation h m these so-.
The simplest way to detamine which specific thamal @emling plant8 rcpmmt marginal somes during some periods of the year is to compare the capacity factor of existing plants. Typically, thermal plants that are dispatched to serve the base load have a capacity factor above 70%. To identify the marginal plants, look for plants with a lower capacity factor. Thermal plants with 4040% capacity factors are probably dispatched as intermediate 1084 and these plants might be at the margin dmhg some periods. Peak load plants can have a capacity factor as low as 10-20%, which indicates that these plants an at the whenever they are v t i n g .
Note that hydro plants often have capacity factors around 50°/0, due to variations in rainfall and the need to store water for times of high demand or low production. However, it is unusual that hydro plants are t d y at the margin. because as a low
- v a r i a b l a resource they should be dispatched as much as possible, saving m cost) thermal plants for dispatching at tbe margin.
-- ~te$2: ~ d e d a t e b w i i n e carbon emission ~ P C -- AAer determining which g-ting plants represent the baseline so- to be displaced by the CCMP, the next step is to calculate the carbon emission rate of these sources using the data gathered through monitoring. As discussed above, the relevant baseline carbon aukion rate is the wei@ted average of marginal emission mtea for the generation p h t s on the margin. The baseline emissions depend on the installed generation capacity and fuel mix. To the extent that electricity is generated by fossil fuel-fired thermal power plants in the base case, the resulting carbon emissions must be accounted for on the basis of the relevant share of energy generated by each source and its carbon emission rate. Although installed capacity is an hpr tant parameter in describing the generation system and analyzing its ~conomics, the emissions will be proportional to the total energy generated (MWh) by each some, rather than its generation capacity 0.
Ideally, the baseline carbon emission rate should be determined on an hourly basis (8760 houdpr ) , to account for daily variations in loads and seasonal variations in
CLIN 1: Fc6tering Climate Change Initiatives for Sustainable Development Task 1C: Cotnputarional Tool Kit
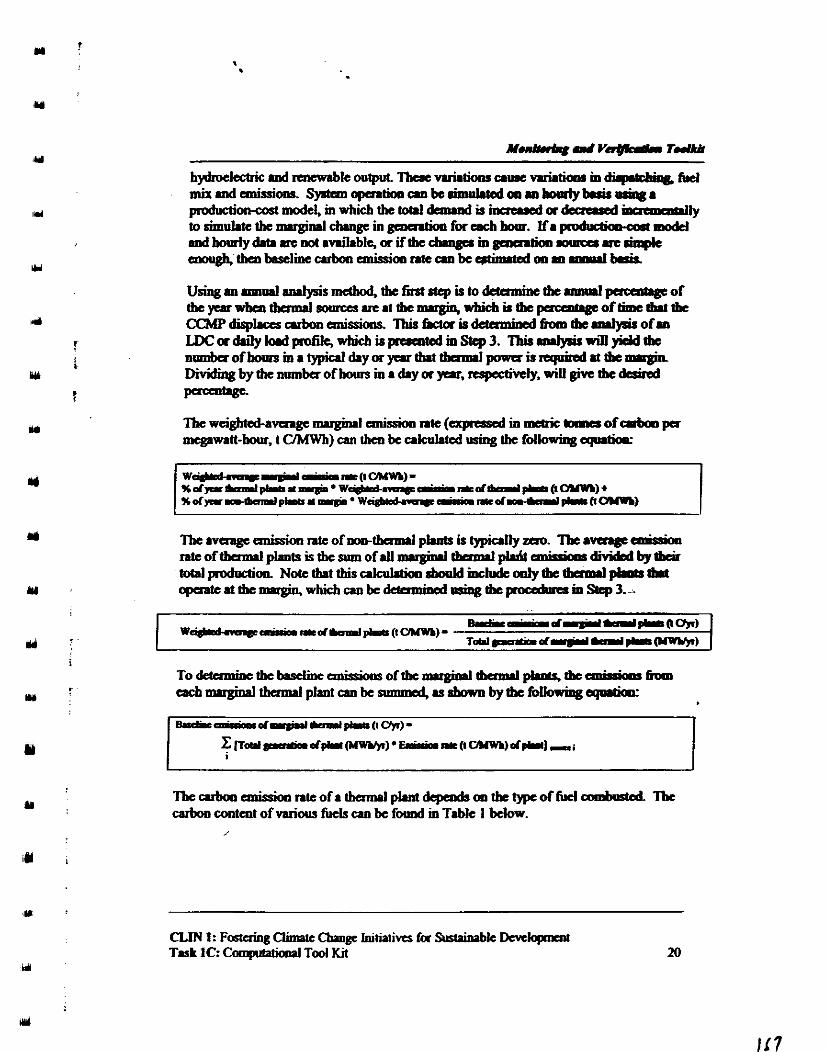
Thc waghtcd-avaagc &I anisdon nte ( a p s c d in mcaic kames of & per mcg.w1II-h, t C/MWh) can tbcl, k akthtcd using the fdlowhrg a)lptim-
The enbar cmisioa nte of a thamol plurp dcpmds cnr thc type of f i a d a s t a i Thc csrboacontcntofmiousfudsanbcfdmTabk 1 below.
CLIN I: Foslabg Chm& Change IniriUiva fa SusUkdk Dcvclopnen( Tuk IC: Carpdatioaal T d Kit r0
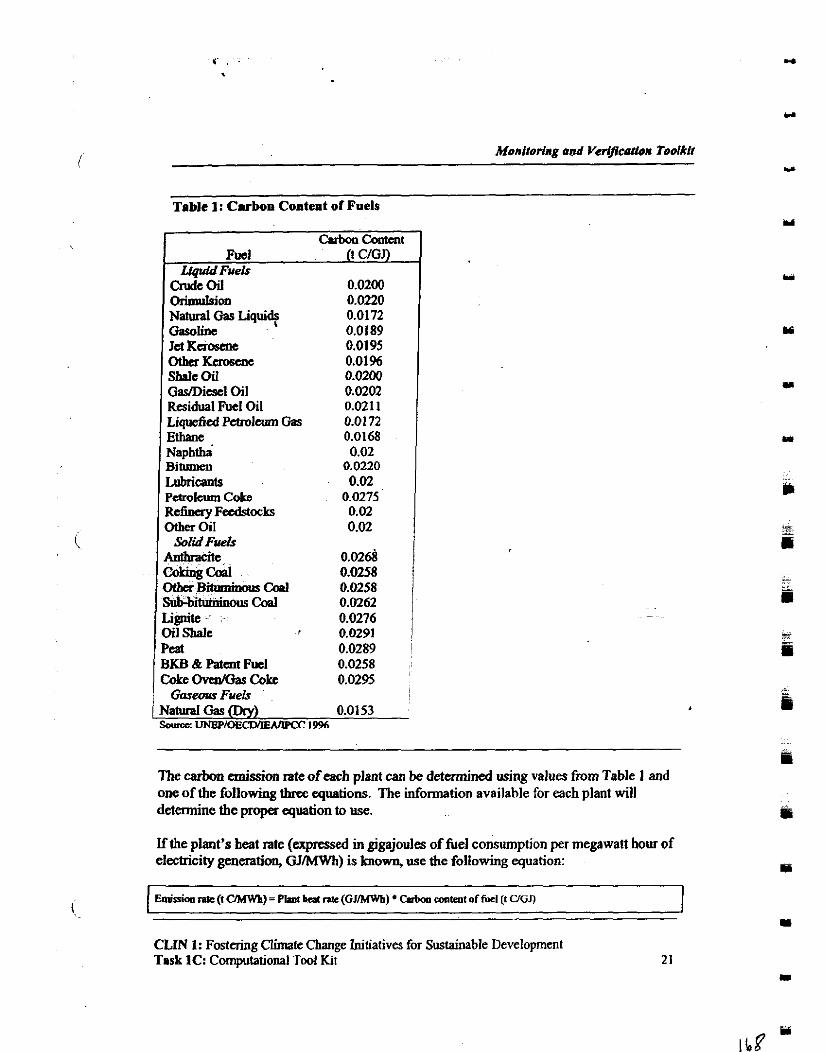
Table 1: Cmrbon Content of Fuels
Cuban Content Fucl (t WGJ)
Uquid FwIs Cndc 011 0.0200 Orimulsjm 0.0220 Natural Gas Liquids 0.0172 Gasoline 0.0189 Jd Kaoscne 0.0195 OthaKaosmc 0.01% Shlc Oil 0.0200 GaSiDicscl Oil 0.0202 Residual Fuel Oil 0.021 1 Liqudied Petroleum Gas 0.01 72 Ethane 0.0168 Naphtha 0.02 Bihmm 0.0220 Lubricants 0.02 Pdmlarm Coke 0.0275 RefinayFetdsoch 0.02 Otha Oil 0.02
Solid FueLr Arlthr&e 0.026il Coking Caal 0.0258 OtbaBihmhvusM 0.0258 S u b - b ~ C o a l 0.0262 Lignite 0.0276 Oil Shale 0.0291 Peat 0.0289 BKB & Wtcm Fucl 0.0258 Coke OvaXas Cokc 0.0295
Garem Fu& / ~alural Gas (Dry) 0.0153
LWEPIOE- 19%
The carbon emission rate of each plant can be determined using values from Table I and one of the following thrce equations. The information available for each plant wiU determine the proper equation to use.
If the plant's heat rate (expressed in gigajoules of k e l consumption per megawatt hour of electricity generation, G J m ) is known, use the following equation:
CLIN 1: Fostering C h t e Change Initiatives for Sustainable Development Task 1C: Computational Tool Kit 21
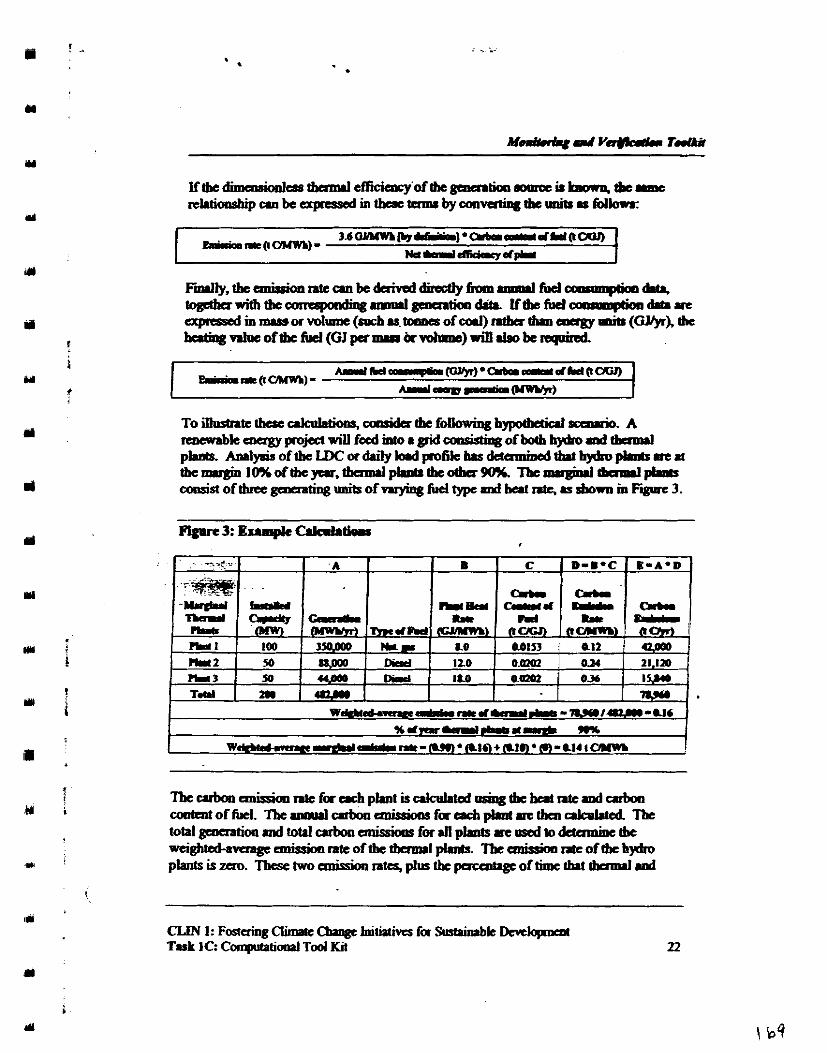
CLIN 1: Fo6(aingClira*canogcJnic iat ivcsfa~k~lopmet Tut 1C: ConplFltioml T d Kit
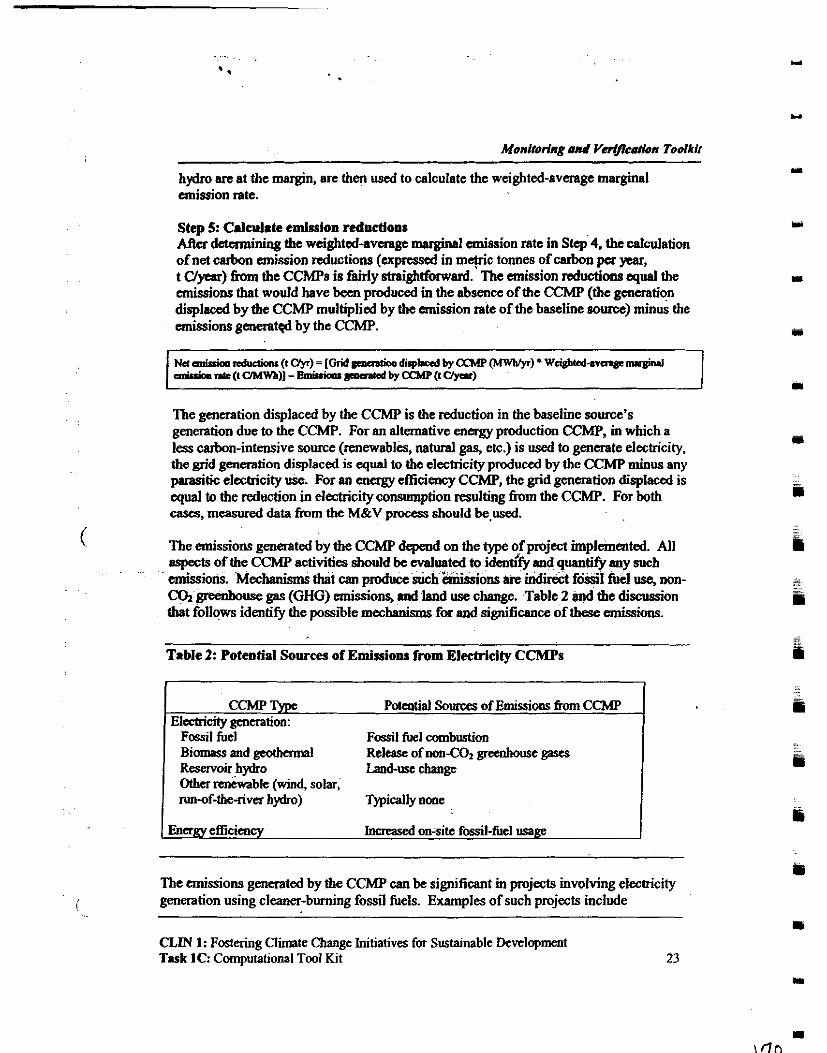
Monl10rlng and VdpCadon Toolkft
hydro arc at the margin, are then used to calculate the wcighted-average marginal mission rate.
Step 5: Cdculrte emlsslon reductions After d-ning the weighted-avaap marginal emission rate in Step 4, the calculation of net carbon emission ductions (expressed in mepic tonnes of carbon pa year, t Uyesr) !%om the CCMPs is fairly strnightfoward. The mission reductions equal the emissions that would have been produced in the absence of the CCMP (the generation displaced by the CChP multiplied by the emission rate of the baseline source) minus the emissions generatpd by the CCMP.
I ~d m&t&ms (I Uy) = [Grid eocntio. dirpbcsd by UMP (MWblyr) W-CRBC Qn&d ~ & ( t u M w b ) l - ~ ~ b y U M P ( ~ ~ ) I The generation displaced by the CChP is the reduction in the baseline source's generation due to the CCMP. For an alternative energy production eChlP, in which a less carbon-intensive source (renewablk, natural gas, etc.) is used to generate electricity. the grid generation displaced is equal to the electricity produced by the CCMP minus any parasitic electricity uk. For an energy efficiency CChP, the grid generation displaced is equal to the reduction in electricity consumption resulting from the CCMP. For both cases, m d data h m the M&V p- should be.used.
The emissions generated by the CCMP depend on the type of pmject implemented. All aspects of the CCMP activities should be evaluated to idendfy and quantify any such emissions. Mechanisms that can produce such imissions are indkct f 1 1 fuel use, non- CQ greenhouse gas (GHG) emissions, md land use change. Table 2 and the discuarion that follows identify the possible mechanism for and significance of these emissions.
Table 2: Potential Sources of Emissiom from EleeMcity CCMPs
CCMP Typ P o t W Sources of Emissions from CCMP Electricity genmtioo:
Fossil fuel Fossil fuel combustion Biomass and g c o t h d Release of mC02 greenhouse gaw Reservoir hylm Land-use change Olher renewable (wind, solar, nm-of-the-river bydro) Twically none
1 ~nergy efficiency J n c m d on-site fossil-fuel wage 1
The emissions generated by the CChP can be significant in projects involving electricity generation using cleaner-burning fossil fuels. Examples of such pmjects include
CLIN 1: Fostering Climate Cbange Initiatives for Sustainable Development Task 1C: Computational Tool Kit
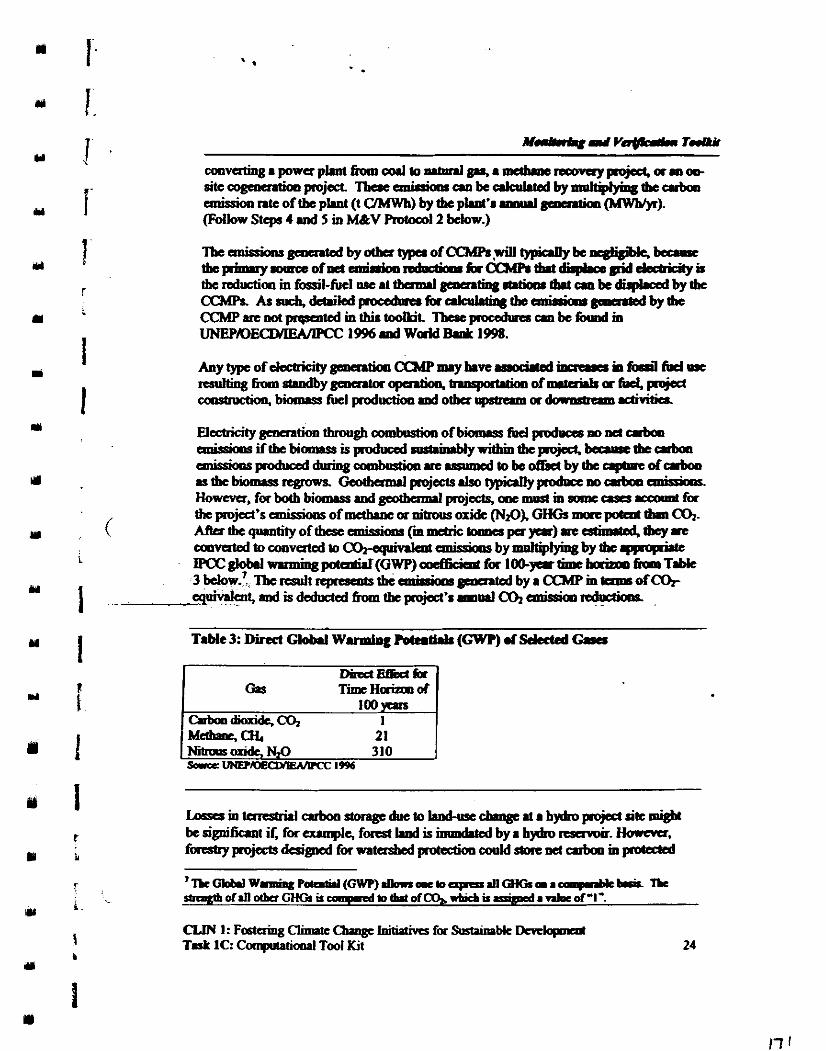
& me oftbe &I (t C / M W ~ ) by tbc pLnt'r ~ l l l l ~ l g m & m l ~ ) . (Follow Stcps 4 and S in M&V PmtomI 2 below.)
~ n ~ ~ o f ~ ~ ~ r m ~ & v c ~ ~ i ~ ~ ~ ~ ~ ~ j l l i ~ I ~ ~ rcsultingfmmgtrodbygcwrtorapcntioq~orrmtcrLkafud,projecc cmseuctioq biomass fucl produetioa md ofba upmum a a c t i v i t k
CLIN 1: Fc6tcring C h a e Cbagc Initiatiws fa Susmkbk Dcvclqmnd T8sk IC: ~ t i o o p l Tool Kit
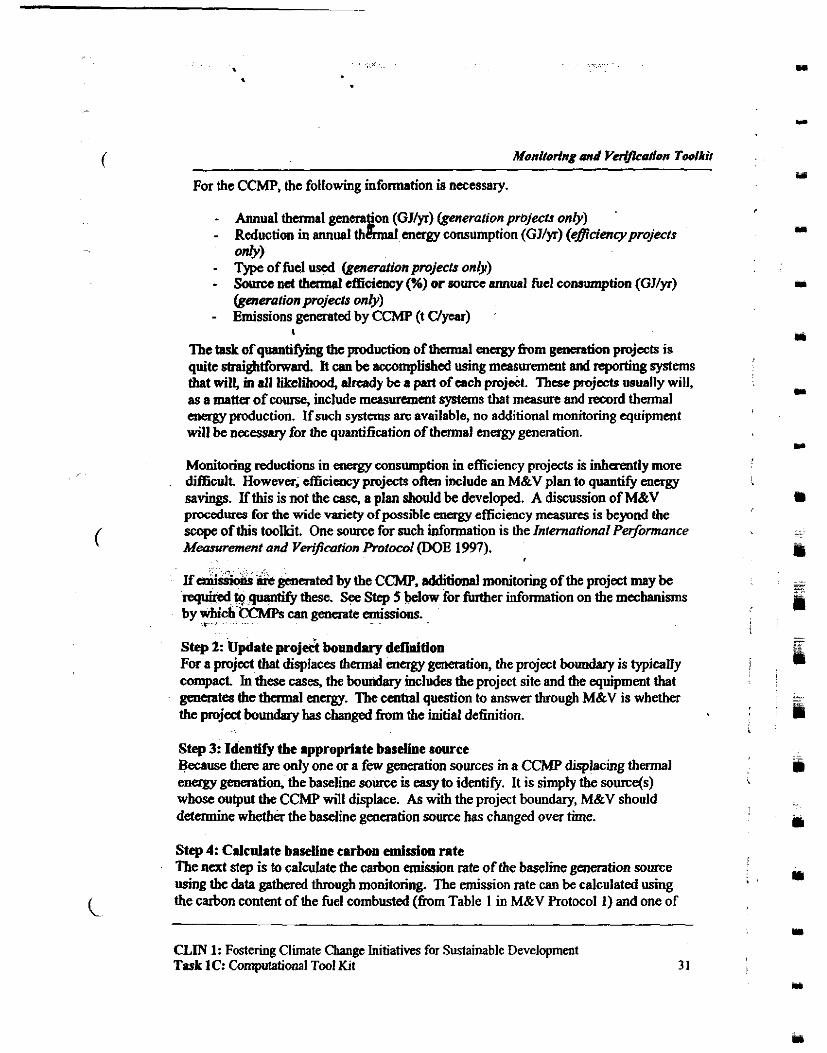
Monitoring md VrrlJkaIIon Toolkit
For the CCMP, the following infonnation is necessary.
- Annual thermal (generation prbjecis only) - Reduction in consumption (GJ/yr) (eflicencyprojecfs
only) - Type of fuel used (gcnerntr'onprojects onh) - Source nd thamal efficiency(??) or source armuel fucl contumption (GJ/yr) (generation projects only)
- Emissions generated by CCMP (t Clycar) I
The task of qmtifying tht production of tfiamal energy h r n gmcration projects is quite shaightfonvard. It can be. ~ccomplishcd using measurement and reporting systems that will, in all likelihood, already be a part of each project. These projects usually will, as a mattex of come, include measmcnt systems that measure. and record thermal energy production. If such systems are available, no additional monitoring equipment will be necessary for the quantification of thermal energy generation.
Monitoring reductiom in energy consumption in efficiency projects is inhecently more difljcult. However, eEciency pmjects often include an M&V plan to quantify energy savings. If this is not the case, a plan should be. developed. A discussion of M&V procedures for the wide m.ety of possible energy efficiency measure-s is beyond the
( scope of this toolkit. One source for such information is the International Performance Measurement and Verijkation FhiocoI (DOE 1997).
. . -. .~.. Jfenhi* -& gemanted by the CCMP, additional monitoring of the project may be. reqw, @ quantify these. Step 5 Mow for further infonnation on the mechanisms by whic&;CCMPs can generate emissions.
f - - . - ~
Step 2: Update poj& boundary definition For a project that displaces thermal energy generation, the project botmdary is typically compact Jn these cases, the boundary includes the project site and the equipment that m t e s the t h l energy. The central question to answer through M&V is whether the project bouudary has changed from the initial definition.
Step J: IdentIfy the appropriate basdine source Because there are only one or a few peration sources in a CCMP drsplaclng thermal energy generation, the baseline source is easy to identify. It is simply the source(s) whose output the CCMP will displace. As with the project boundary, M&V should determine whether fhe baseline genaation source has changed over time.
Step 4: Calculate baseline carbon emission rate The next step is to calculate the carbon emission rate of the bascline gamation source using the data gathered through monitoring. The emission rate can be calculated using
L the carbon content of the fuel combusted ( h m Table 1 in M&V Protocol 1) and one of
CLIN 1: Fostering Climate Cbange Initiatives for Sustainable Development Task 1C: C w t i o n a l Tool Kit
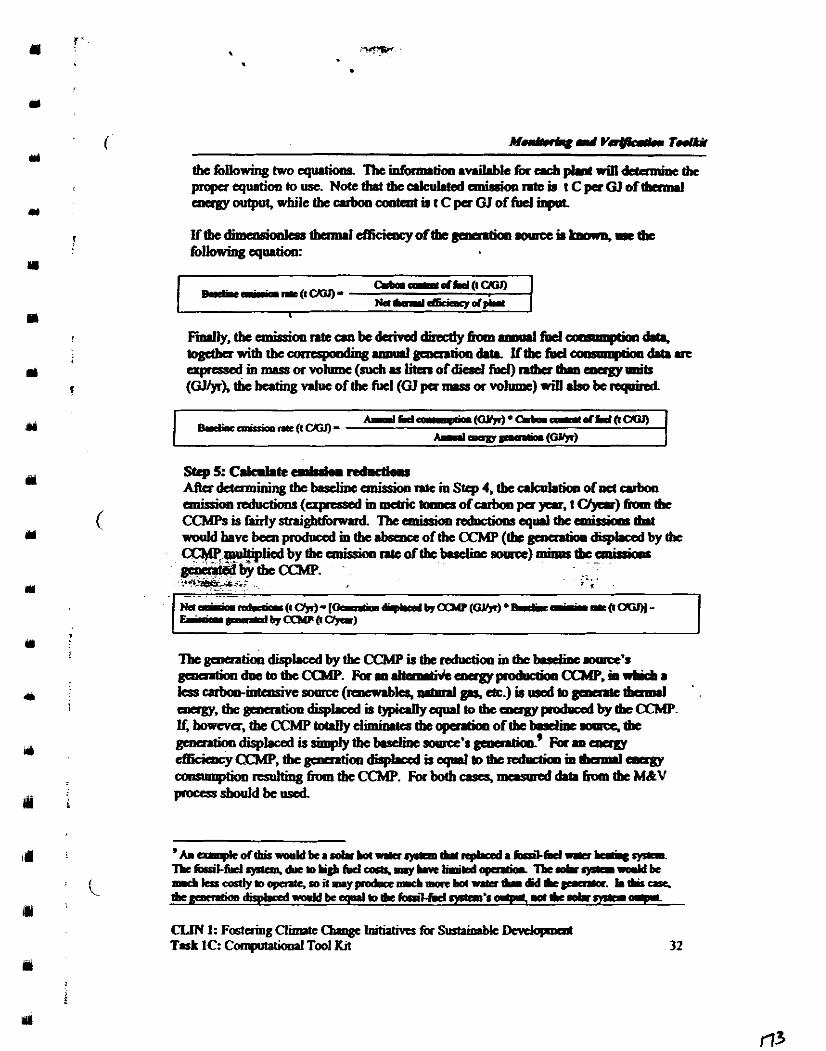
CLIN1:FostaingClhrPtcChqgclai~forSurtaiDlMcDcvdcrpmad Tmk IC: Compdatiooll T d Kit 32
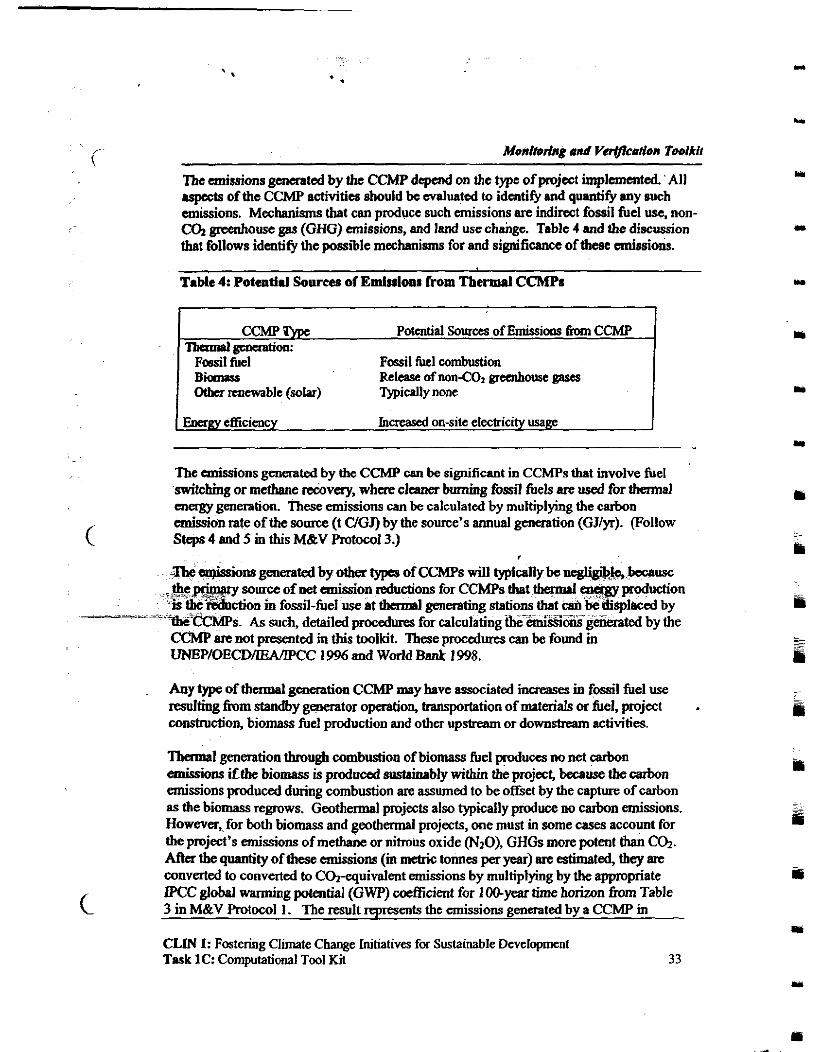
'.
Monlfortng and Vafpeurlon Toolkit
The missions genaatcd by the C W depend on the type of pjmt implanmtcd. All rppccts of the CCMP activitiw should be evaluated to idmtify and quantify any such emissions. Mechanisms tbat can produce such emissions are indirect fossil fuel use, non- a greenhouse gas (GHG) missions, and land use change. Table 4 and the discussion that follows idcntify the possible mechanisms for and significance of theat emissions.
Table 4: Potentid Sour- of Emlsalonr from Thermal CCMPs
I B i i Otba renewable (solar)
Potential Sources of Emissions fimn CCMP
Fossil fucl combustion Release OfnonCO, gnmhouse gas= Typically none
( EWXW efficiency Increased on-site electricity usage I
The anissions gcnaated by thc CCMP can be significant in CCMPs that involve fuel switching or methane recovery, whae cleaner burning fossil fi~els an used for thennal energy generation. These emissions can be calculated by multiplying the carbon emission rate of the source (t UGJ) by the source's annual generation (GJ/yr). (Follow Steps 4 and 5 in this M&V Protocol 3.)
~ ~
: ~ ~ ' e & i o n s generated by o k types of CCMF's will typically be negligiikkbecause .~ . I~ t ! !c~&y source of net emission reductions for CCMPs that thermal q produdion 5s ibe"&hion in fossil-fuel 'k at tbcrmal generating stations that cai'kjeidsplaced by
.. .% " :. ' e CCMF's. As such, detailed procedures for calculating i h e k ~ & o ~ g ~ t e d by the
CCh@ are not pnsented in this toolkit. lbese procedures can be found in UNEP/OECD/ENPCC 1996 and World Bank 1998.
Any t jpe of thermal generation C W m y bave associated inaeases in fossil fuel use d t i n g from standby generator operation, transportation of materials or fuel, project wnstn~~%on, biomass fuel production and othm upstream or downstream activities.
Thermal generation through combustion of biomass fuel produces no net carbon emissions ifthe biomass is produced stmainably within the project, beceuse the carbon emissions produced during wmbustion are assumed to be offset by the capture of carbon as the bio& regmws. 6eothermal projects also typically prod& m, &on emissions. However, for both biomass and geothermal projects, one must in some cases account for the project's emissions of me&e or nitro& oxide OJ20), GHGs more potent than a. After the quantity of these emissions (m metric tonnes per year) me estimated, they are converted to converted to w u i v a l e n t emissions by multiplying by the appmpriate LPCC global warming potential (GWP) d c i e n t for I myear time horizon from Table 3 in M&V Rotocol 1. The result represents the emissions generated by a CCMP in
CLM I: Fostering Climate Change Initiatives for Sustainable Development Task 1C: Computational Tool Kit
E a c r g y e R i c i c a c y p o j e c t s w i l l ~ d t m n o ~ c m h i o a r Ho-,amc ~ p o j e c b r c d u a t b a D P l c o c a y ~ k d ~ ~ ~ h ~ p a r r r i t i c e k a r i c i t y l m m t b c r r m l pjaJscaucaekmilmrad emisdoos %iadb&tcmL.iaaabimZ3E2Earmbe-- thc poocdllrc~ m M&V Rotaol I Tor CCMPs tb.1 d*pIrc dcc6dy gmmtia~
T h i s ~ ~ b a c r p p l i u i f t b s c i s o n l y o o t ~ * r m a ~ b y tbe CCMP. If thac nc multiple somca, thc carboa rmigioa nk caa be akohtal by dividiugtbe t o t a l ~ a n i J J i o a r ( t C l y r ) o f a l l s o u r c e s b y t b e k ~ I a l ~ ( W / y r ) . ~~urbon imis s iomis thcarmfaacbp~of tbcp lmt ' s cmks ioa~ tc (~CK;I . ~ b d o n ) ~ t i c d b y t b c ( D l l l ~ t i o o o f t b e p i r m ( ~ ) .
'IbLpocedmcrp&i6clllyddrrascsCCMPsthatgerwntcdcEhieitya~awrgy by bmniag mdhanc mvad born cbrl mhoeg lmdmls or a&dm=xs bcilitk~.'~ Two
C L M 1 : F o s t a i n g C l i m a 1 e ~ ~ u i v c s f a ~ k D e u ~ Task 1C: Cmptatiooll Tool Kit
M&V Rotoeols are required for these methane m v a y pmjects, bccausc they reduce grcuhu8c gas emissions in two ways. First, they reduce carbon dioxide emissions by displacing electricity or thermal generation from some bascline source. These carbon emission reductions should be quantified using M&V Protocol 1,2, or 3, as appropriate. Secoadly, methane recovery pmjects reduce the emissions of methane (a grocnhousc gas) by burning the methane in a generator. This proced,ye, M&V Rotocol4, is used to quantify these methane emission ductions.
Step 1: Gather required data Data will be gathefed for methane recovery CCMPs as required for eilher M&V Protocol 1,2, or 3. Thc one additional piece of i n f o r m a t i o n ' n ~ for M&V Protocol 4 is the amount of methane burmd to pmduce electricity or thnmsl energy. 'Ibis can be arprtssed in mass, volume, or magy tams (t CHJyr, m3 W y r , or GJIyr). Because this parameter may change ova time, the primary purpose for monitoring activities is to obtain current, m e a s d data. Doing so will allow for accurate quantification of actual . emission reductions resulting h m the CCMP. This data should be directly measured to the extent possible.
Step 2: Update project bomdary dellnition For a methane mmvay CCMP, the project boundary includes the some of metbane and the generation equipment m which it is combusted. The central question to answer through M&V is whether the project boundary has changed from the initial definition.
Step 3: Identiry the appropriate baseline source The baselme scwace is simply tbs somx h m which the methone is mmvaad. This may be a caalmine, W U , a g n i e s s ficility, or othcr source. As with the project boundary, M&V should dctmnine whether the baselbe generation source has changed - - . ov&ibe.
8
Step 4: Calmlate badine arbon emission rate This step is not applicabk to calculating methane emission reductions for methane remvay projects.
Step 5: Calculate emission reductions In methane recovery projects, metbane emissions are d u c e d by b-g the metbane to generate electricity or tbamal energy. Thus, the annual methane emission reductions are equal to theannual methane input to the generator In these calculations, data gathered through monito~ing should k used.
The methane input to UIC gcncrator must first be converted to to- of methane per year (t Cfyyr) using one of the following equations. If the methane input is known in volumetric trims (m31yr), it can be converted to tonnes per year using the density of methaue. Ideally, the actual density of the on-site methane should be measured. Otherwise, the standard density of 7.167 x lo4 t CHJ~' C& can be used.
CLIN I: Fostering Climate Change Initiatives for Sustainable Development Task 1C: Computational Tool Kit 35
T b t ~ c m i s r i o n ~ . r r u K a ~ i d o ~ a t ~ ~ whichistbearnnrwnuui~bywhichGHGanissiom.remrmPed ThiakdoDcby m u h i p ~ L h c ~ c m i n r i m R d u c r i o m b y ~ w c h D e g k ~ b a l a r r m i q g ~ (GWP) kom Table 3, which is 21.
CLM 1: Fostoing Climate Chrngc 1niIiativr-s far Suslaimbk Dcvclopmcat Tut lc: compltatianl Tod Kit

(- Monirorlng a d Vc+cmYon Toolkit
calculations and then use that information to calculate actual emission reductions for Ule CCMP. In this way, the proccdurar presented in this toolfit can be ustd as COncephlsl tools for use in the broader field of CCMPs.
CLM 1: Fostering Climate Change Initiatives for Sustainable Development Task 1C: Computational Tool Kit 37
U.S. Dqmrhmt of Eaagy (DOE). 1997. J ~ ~ ~ a n o l P q i i IIwmmmou and [email protected]. W.sbioBtoa.D.C. 1 A n a d m d v a d m k ~
Vine, E. md 1. Sabyc , 1997. l%e Morriroring E n d w t h , &wthg. md Ve@mfion o f Q ~ ~ M l m ~ : ~ P r o r o e d r d G d d a l h a . LBNL-403 16. Batcley, CA: hwaw &rtdyN.tiaul t.bmtay. AniLbIe at ) 1 ( t D . J I u o d e . l b l . p o v ~ ~ t 6 / ~ ~ 4 0 3 I-. . .
Vine, E. md J. Sa- 1999. Cviddirres for the Monilwhg E&a. R m Y e @ u d i o n , m d ~ o / E ~ ~ ~ / b r C l i r r o t c C k a g c Mtigofrofrm. LBNU 1543. BalrJey. CA: La- Baieky Nathd
V i E.. J. Sathyc. d W. M.hmdi 1999. W i l s a j b r t h e M- E i u f m i k Reporting Y e i j h l h , andCbii@tb~~o/FaabyPmJddljbCdinwrrc Change Mitigongonon. LBNL-4 1877. &rLclcy, CA: h- &rtdcy ?&ianl L.bontay. AAniLbk at h t t o I I e ~ d I b l . ~ I a l i d d c ~ 4 1 Im . uif .
WafdBant 2000b. V . l i d a t i ~ V ~ ~ ~ ~ P ( I R o p c r s . PCF Implaneaerbion Note N m b a 4." Wasb#on. D.C.
World Bent 2000~. ahria Maui10rmg md Vaifiatiolr Rolaol (MVP).' PmWtjpe CabonF%md. W-D.C.
Swishet, J.N, 1994. "Forrshy and Bimms Emrgy Rojcds: Botlom-Up c a o p k a m of CQ SIomge nod Costr" Biompu d B i o a a g y , mi. 6 no. 5, pp. 359-368.
. . ; T h e Achicvcmcnts of COP 6: Yes, the A- m=-- !"; Ceda Tor
SuJEliorble Dcvclapad in tbc Amcrias; Doeaaber 2000.
htaoltiooal Ewgy Ageacy (IEA), 1997. AetivitieS Impkma~Ied lointty. p.rtoaships for Climate md Developlwt, OECD, P A
CLM I: Fastahy Clinnte C k q c initiatives fb htainabk DM- TaL IC: Canpltatianl Tod Kit 38
( Monftoring and Verlpca~en Toolkit
Michaelowa, A., 1999. "Template fw baseline studies for World Bank AU, CDM and JI projects," Study for the World Bank Climate Change Team. Washington, D.C.
UNEP/OECD/IEA/IPCC (United Nations Environment Progrmme, Orpisation for Economic Cooperation and Development, ptemational Energy Agency, Jntergowmm~1tal Panel on Climate Change). 1996. Revfsed 1996 IPCC Guidelinesfor National Greenhouse Gar Inventories: Reference Manual (Volume 3). IPCC: Bracknell, UK. Available at httD~Iwww.~c.ch/oub/rmide.htm.
W d d Bank. 1998. Greenhouse Gus Assessment Handbook. Environment Dcparbnent. Wdirgton, DC. Available at
~ o i l d Bank. 2000a. "Baseline Methodologies for PCF Projects; PCF Implementation Note N u m k 3." Prototype Carbon Fund. Washington, D.C.
CLIN 1: Fostering Climate Change Initiatives for Sustainable Development Task 1C: Computational Tool Kit 39
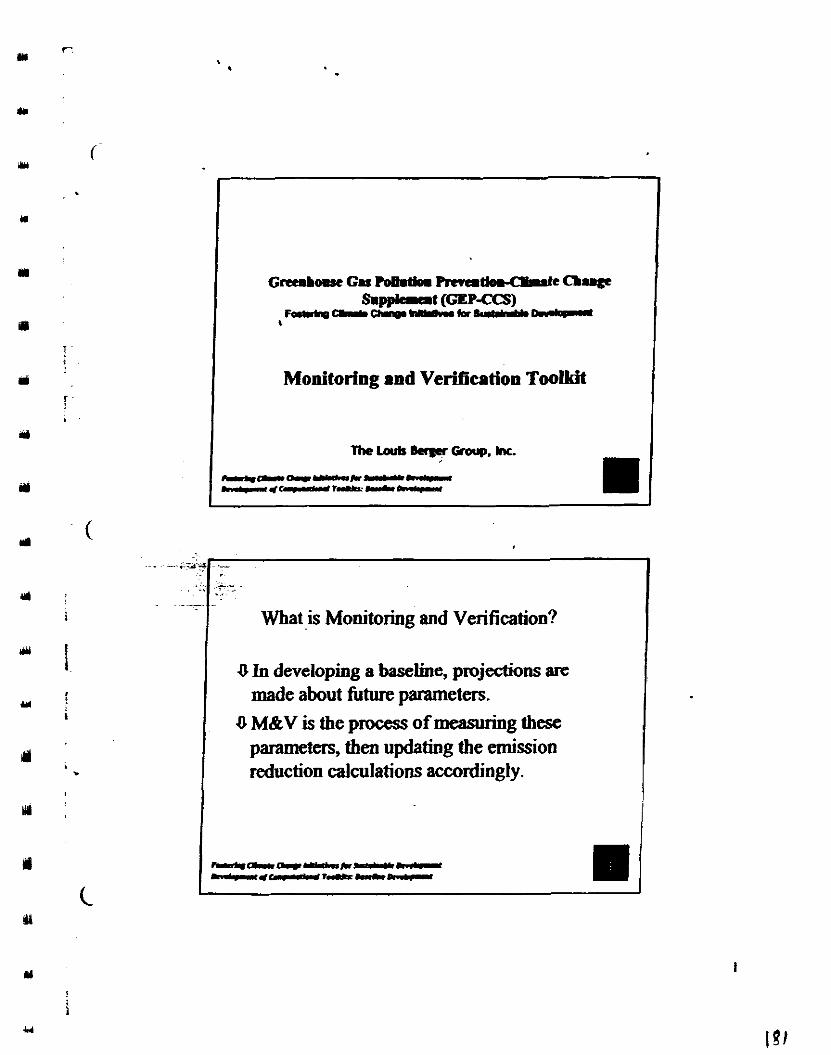
Monitoring and Verification Tookit
--I- What is Monitoring and Verification? I U In developing a baseline, projections are
made about future m e t e r s . U M&V is the process of measuring these
jmameters, then updating the emission reduction calculations accordingly.
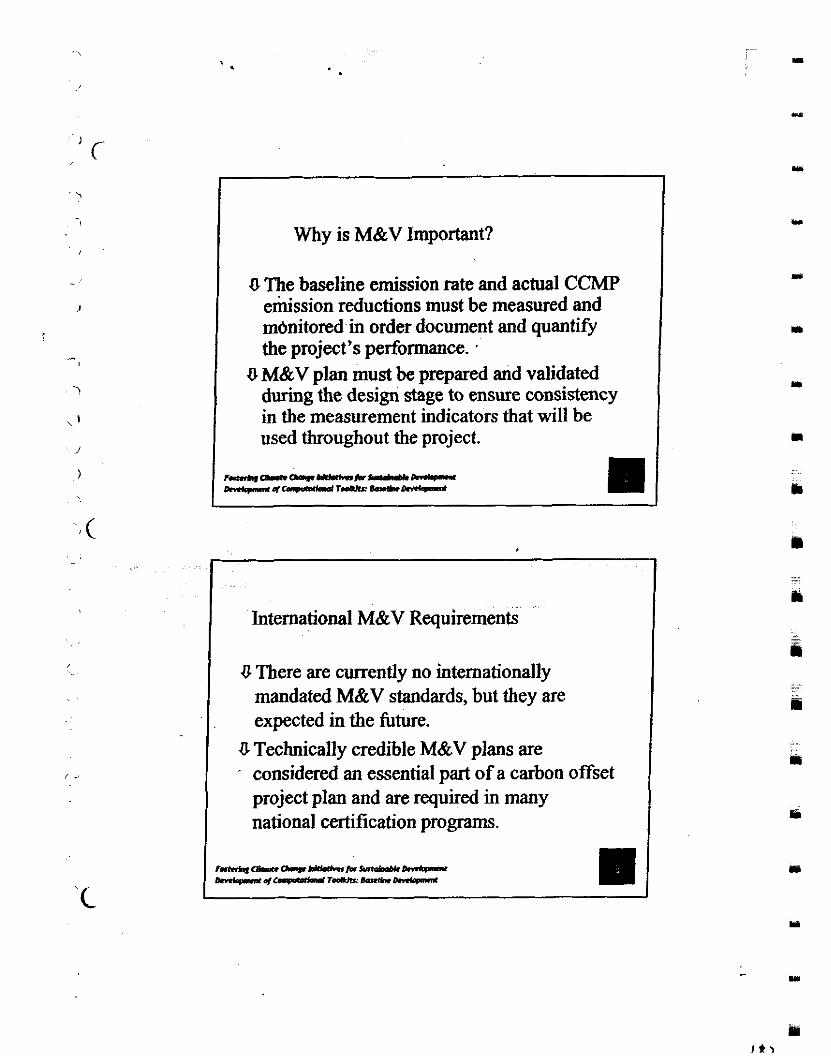
Why is M&V Important?
U The baseline emission rate and actual CCMP emission reductions must be measured and mbnitored in order document and quantify the project's performance. .
8 M&V plan must be prepared and validated during the design stage to ensure consistency in the measurement indicators that will be used throughout the project.
- International M&V Requirements
U There are currently no internationally mandated M&V standards, but they are expected in the future.
U Technically credible M&V plans are - considered an essential part of a carbon offset
project plan and are required in many national certification programs.
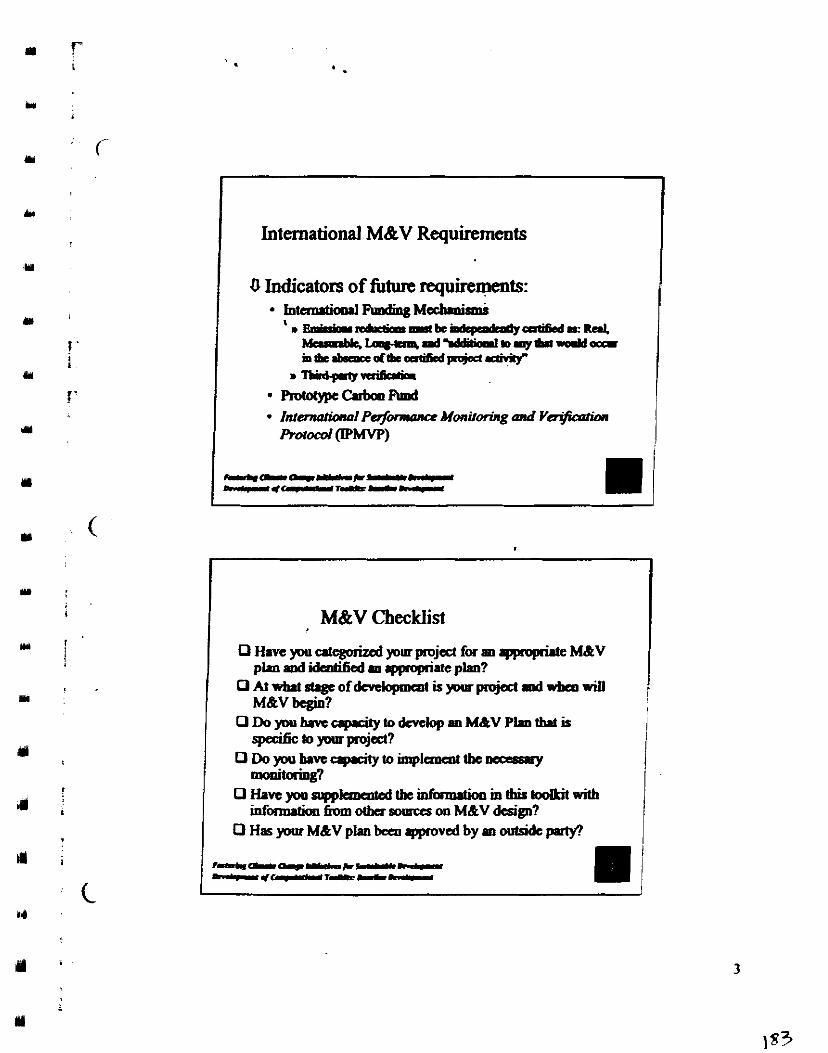
I Internstiood M&V Requirements I 0 Indicators of future requirements:
IntarvtionrlFMdingMahmrrms . .
* R o t o t y p e ~ F t m d * Inf-I Pe+rwue Monilorig and VajFcmion
~ ~ m ' ~ )
M&V Checklist
0 Have )rw atcgorized Fur pmjcct for m -ate MBV p h md W e d MI gpopriate plan?
0 At nhrt d.ge of dcKbpment is pur prow .Id wbeo will M&V bcgin?
I ODopuhrcaplcitytodmlopmMdtVPhthrtir
~ ~ t o ~ p r o j a d ? I
I O D o p u h a n ~ ~ ~ i m p l a n m f t b c o m a s r y
0Havc)rwarpp~thcinfommtioninthistoolLitwith i n f d from otba soums on MCV design? 1
I 0 Has pnu MBV p h bca~ approved by m outside 1 I
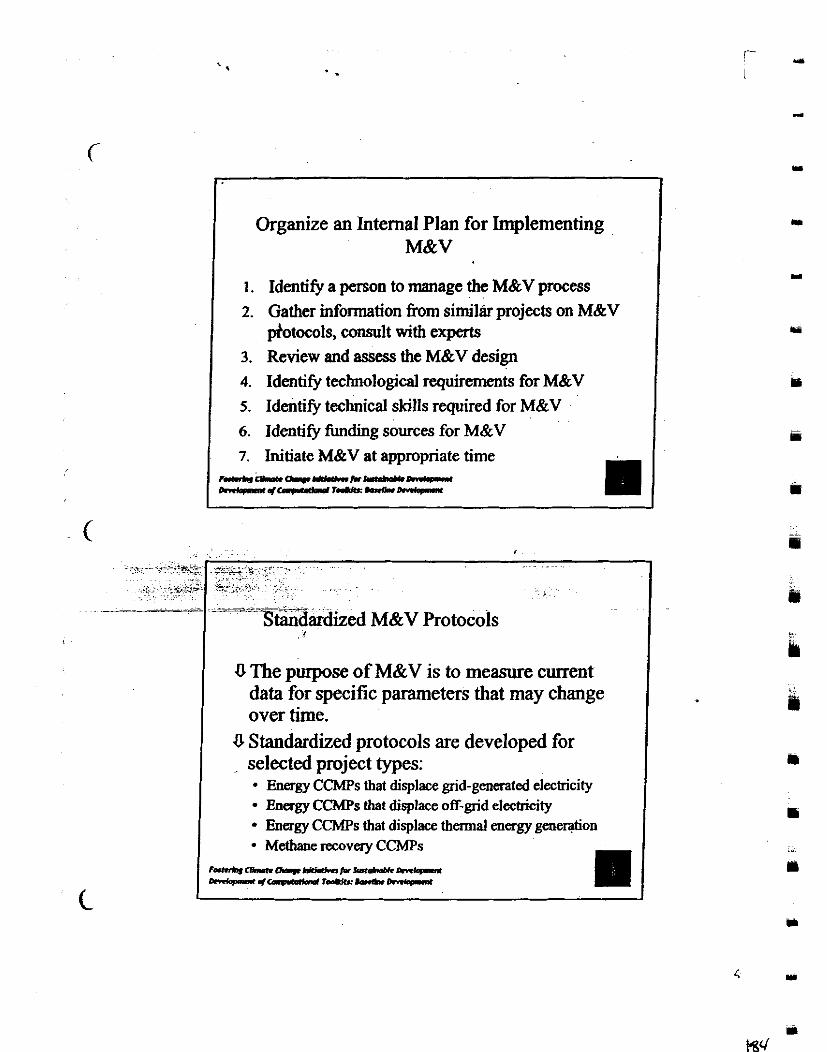
I Organize an Internal Plan for Implementing M&V
1. Identify a person to manage the M&V process 2. Gather information from similar projects on M&V
piotocols, consult with experts 3. Review and assess the M&V design 4. Identify technological requirements for M&V 5. Identify technical skills required for M&V 6. Identify funding sources for M&V 7. Initiate M&V at appropriate time
U The purpose of M&V is to measure current data for specific parameters that may change over time.
U Standardized protocols are developed for selected project types:
I - .
Energy CCMPs that displace grid-gencrated electricity Energy CCMPs tha! displace off-grid electricity Energy C W s that displace thermal energy generqtion Methane rec~very CCMPs
r.t.rblc-CkC-Ir-- ~ ~ ~ r - - ~
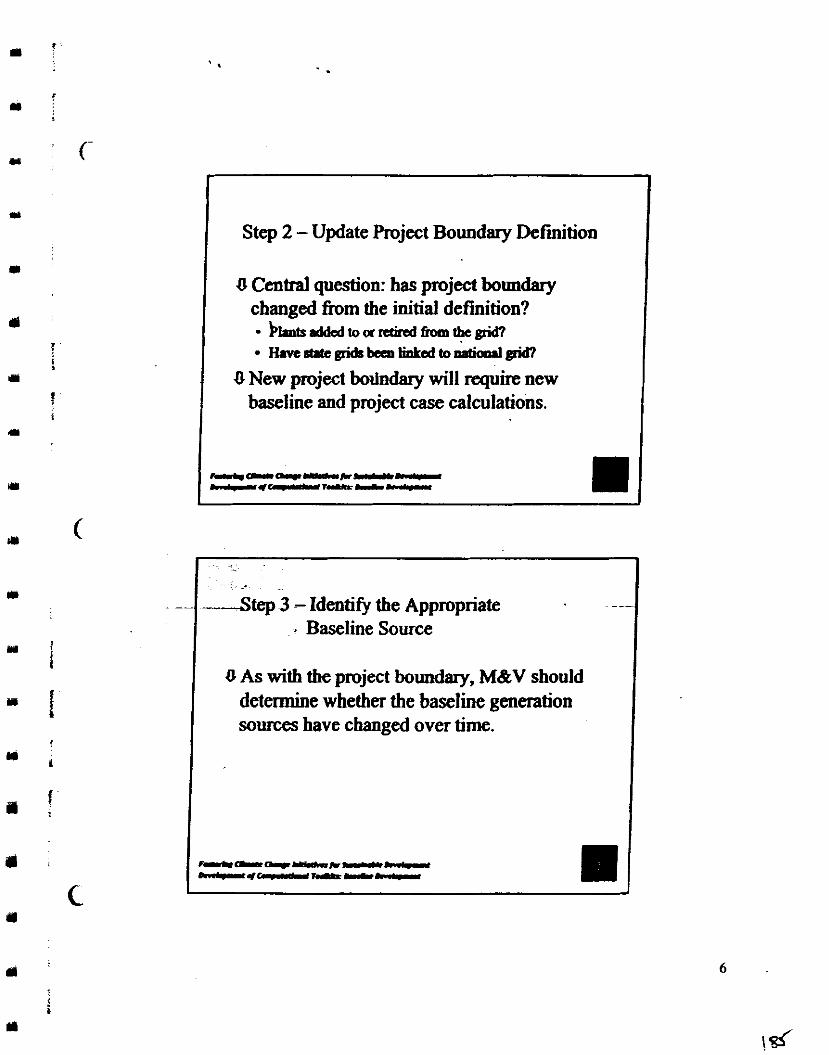
I Step 2 - Update Project Boundary Definition I I U Central question: has project boundary
changed from the initial definition? bkntswtoarctiredhtbegrid? Iim state grids been linked to pid?
U New project bo&dary will require new baseline and project case calculations.
I
--Step 3 - Identify the Appropriate . Baseline Source
U As with the project boundary, M&V should determine whether the baseline generation sources have changed over time.
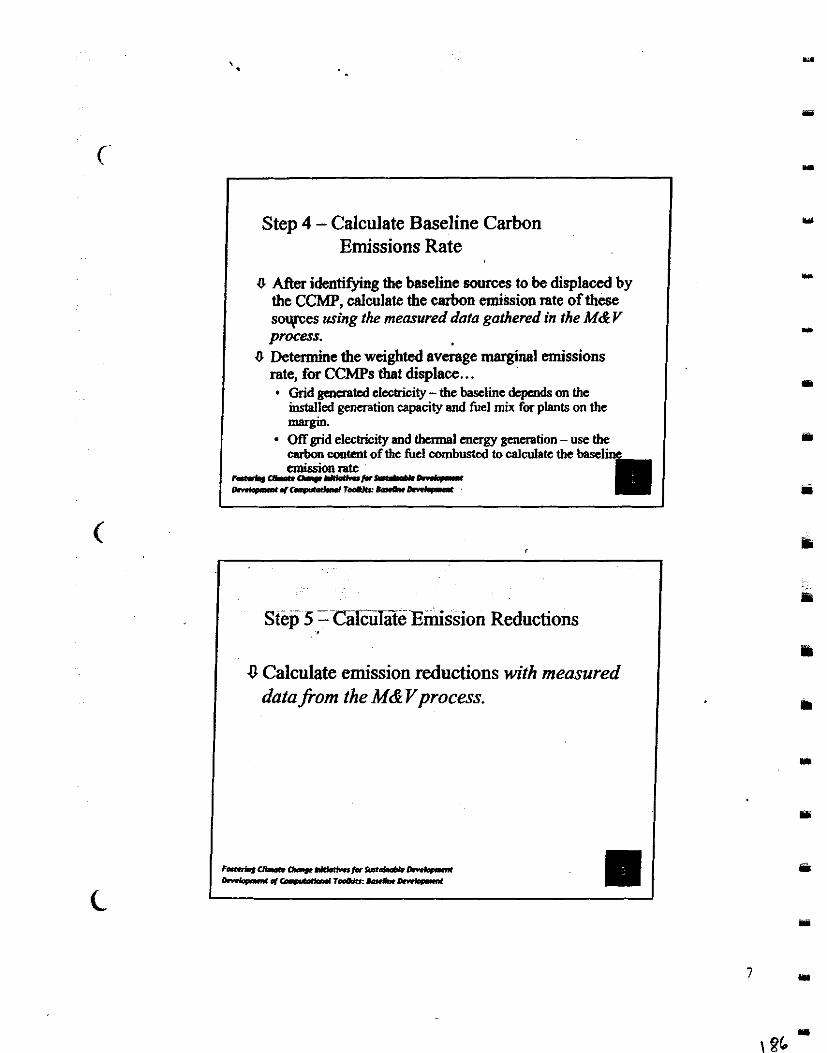
Step 4 - Calculate Baseline Carbon Emissions Rate
U After identifying the baseline sources to be displaced by the CCMP, calculate the csrbon emission rate of these saves using the measured data gathered in rhe M& V process.
O Determine the weighted average marginal emissions rate, for CCMPs that displace.. .
Grid generated electricity - the baseline depends on the installed generation capacity and fuel mix for plants on thc '==w'. Off grid electricity and thmnal energy gmerahon - use the carbon content of the fuel cornbusted to calculate the baseline emission late
r-..im-rg-m-A*r D m * c a . r w r - - - 0 ,
<
Stegi 5 = CalZiiIieErnission Reductions
0 Calculate emission reductions with measured data from the M&Vprocess.
f-CRahar-*-Dm.m-M - w C o a r a c l o . I T o U o - D m * c a
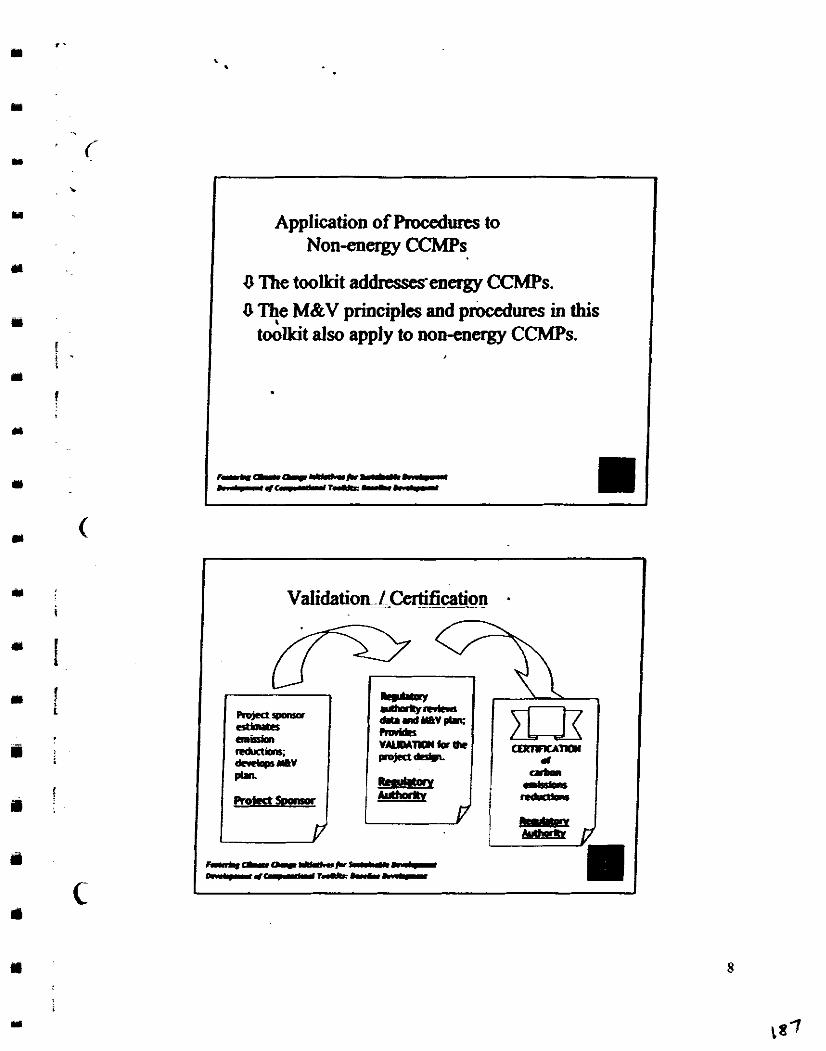
Application of Pmcedum to Non-energy C C M P s
U The toolkit addressesenergy CCMPs. 0 The M&V principles and procedures in this tdlkit also apply to non-energy CCMPS. I
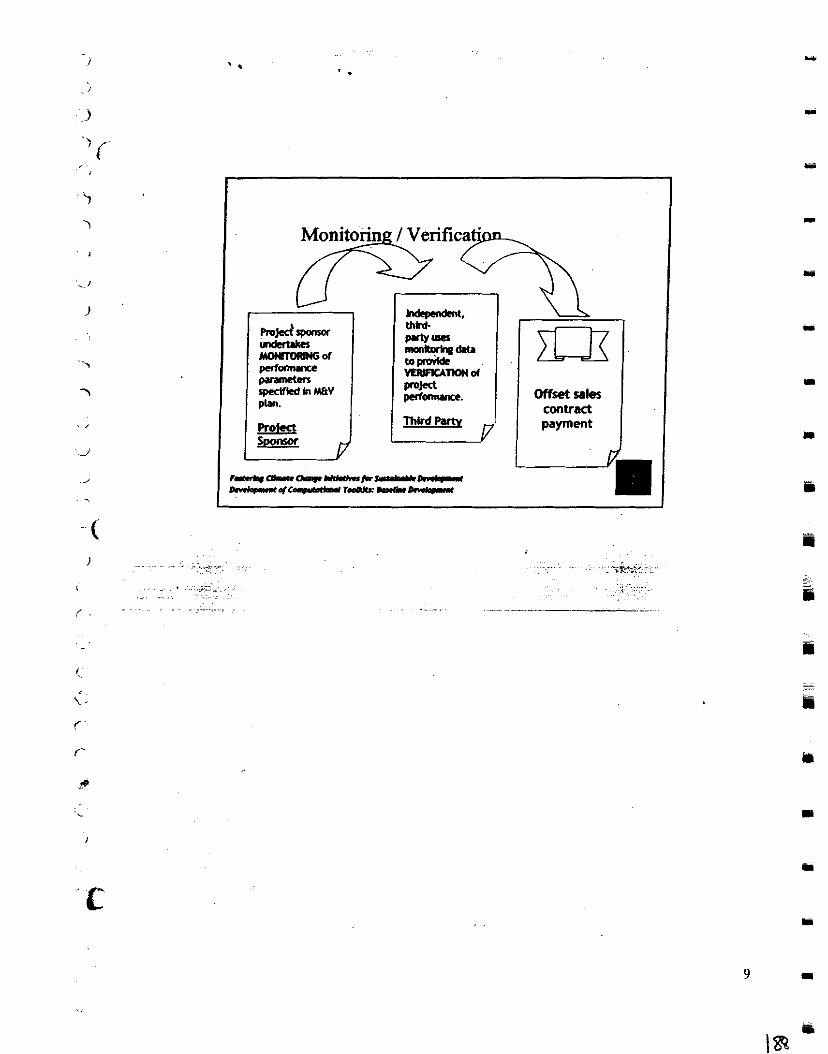
Computational Tool Kit: Marketing & Funding
United States Agency for International Development I
Greenhouse Gas Pollution Prevention Project Climate Change Supplement I
(CEP-CCS)
Fostering Climate Change Initiatives for Sustainable Development
Task 1C Computational Tool Kit: Marketing 8 Funding .
By:
The Louis Berger Group, Inc. C-6/7, Safdarjung Development Area
New Delhi 110 016
May 14, 2001
EXECUTIYE SUMMARY ... h
3 . IMPLEMENTATION 8
PROJECT SPONOORS ............................. - ....................................................... 10 lwEsnmmANDRIsK .................................. ..., 10 SHARJNG THE R~SK ......................................................................................................... 14
AND WMNO ........ .............................................................................. 19 THEB-PUN ........................................................................................... 19 Business Plan Ouiline ............................................................................................... 21
MWKEITNG CARBON CREDITS ...................................................................................... 25 CASE STUDY - CCM BREWERIES ....................... : .......................................................... 28
Overview of Project ..................... ; ............................................................................ 28 Financing ...... : .................................................................................................. 29
4 . FUNDING SOURCES FOR CCMP PROJECIS 32
INTERNATIONAL FUNDING SOIJRCLS ........................................................................... 32 In!emahbnal Finance Corpomtion .......................................................................... 32 World Bank ............................................................... ! ....................................... 34 Owneas Private hnwhtnt Copomtion (OPIC) ............................... .-. ................. 35 US . Tmrk and DNclopmarf Agrrrcy CljDA) ...................................................... .. 36 Renewable Enegy Project S q p r i (REPSOS) ...................................... .. . 36 .- Asian Dewbpment Bank (ABD) 37 Photowltaic M& T ~ o ~ In- (PFWTi) ..................................... 38 i% I n d u s ~ t i o n Fund for M o p i n g Wet and lnwsha t Fwd* Emerging Markets ..................................................................................................... 38 Wrf-part Bank of the lhIed htes (Er-Im M) ....................................... 39 Netherlad Dewlopmar Finance Gnnpany FMO) 40
COMMERCUL FuNLxW SOURCES ....................................................................... 40 Global Environment Fund ........................................................................................ 40 fion .......................................................................................................................... 41 Triodos Bank ............................................................................................................. 41 MeesPiemon .............................................................................................................. 42 Lkia-FondElec Energycienq and EmiuMn RadLdion Fwd ............... .. ..... 42 Draper I n t d n a l Indio Fund .............................................................................. 42
JNDM RNANML W ~ ~ ~ W N S ..................................... .. 43 ........................................... D B I. ..................................................................................................... : 43
m ........................................................................................................................... 43 Power Finance Co~pomtion ..................................................................................... 44
CLIN 1: Fostering Clhnatc Change Initiatives fa Sustlinabk Dcvelopmcnt Tuk 1C: Compltational Tool Kit I
(I
Marketing & Funding
Indian Renewable Energy Development Agency Ltd . (IREDA) ................................ 44 EQUITY b4VEsroRS IN THE CARBON MARKET ............................................................ 46
EBRofund ................................................................................................................ 46 Em-P T. ................................................................................................................ 46 Finnkh F o M Fund ........................................................................................ 47 Climate Trust ............................................................................................................ 47
OTHER ENTITIES PAR~C~PATING IN COMMERCIAL ER TRANSAC~ONS ......................... 48 KEFI&nge ................................................... ..................................................... 48 EmllYlronmentel Resources Trust (ERT) .................................................................... 48 Greedwwe Gas Emission Reduchion Doding (GERg ........................................... 49 Greenhouse Emissions Management Consortium (GEM&) ................................... 50
ENVIRONMENTAL BROKERS AND OTlfER RELATED ORGANIWnONS ............................ 51 Cmrndian Volun!cuy Challenge & Regishy .............................................................. 51
............................................................... Pilot Emission Reduction Tra&&PERlJ 51 w n e y Futures Exchange ..................... : ................................................................... 52 International Emissions Trading Association ........................................................... 52 International Petroleum Ekchange .......................................................................... 52
...... 6 . REFERENCES ON OBSTACLES TO FINANCING CCMPS ..,....,..,.... 54
CLIN 1: Fostering Climate Change Initiatives for Sustainable Development .. Task 1C: Computational Tool Kit II
. . F g r r 1:ChbaI PldbDiapm .......................................................................... 6 Fi@m 2: DcwEqtlity vs Ria Rchtiomhip .................................... .... ................................. 9 Figure 3: Projacc Devekpmxd md h k Rehtiamhip Ba Rm44be-Rkr Hydro ..--,--. I2 Figun4:RiathmcyhtbeRojadCyckwimF~Modrhba
. . . ......................... 15 Rgrm 5: Bl~sincs P h @IdJ ................................................................................................. 20 Figure 6: Energy Efiiciarcy md Ctrboo Sales Tnmaclirn sinidwe .................................... 31
Q
CLIN 1: Fadahg Climate Cbangc Initiatives for SWahbk Devtlopmml ...
Tssk 1C: Cbmputathd Tool Kit 111
Marketing d Funding
This toolkit is the last in the set of guides developed to assist project developers and spolls018 through the process of planning and implmenting Climate Change Mitigation Projects (CCMPs). The Marketing and Funding Toolkit is intended to provide Climate Change centers (CCC~) and developers of C&S and clean energy pkjects, along with the Carbon Finemx Toolkit, with information and assistance that will allow them to compllete the pnnms of procuring project funding and sell the resulting carbon credits.
The toolkit consists of five primary sections: 1. Introduction 2. Assessment Criteria 3. Implementation 4.' Suppo- Materials 5. Funding Sources for CCMP Projects
By the time the develop is ready to begin the process of approaching potential fimders, they should have already completed the initial stages of development. Developers should have a very good understanding of all of the elements of their project and should be umfident that their project will be successful based on an initial analyses.
When prqmhg to approach potential fundm, the key infofmation that must be provided at a minimum includes:
.-'a ,-- - * . s~F:*'% " -. o Expected total project cost (in stages or o Projected revenues fiom the sale of goods or -ces (energy sales, consumer
products, expected hvingdavoided costs resulting h m project); o Assessment of market penetration and growth potential; o Risks to project realization (technical, financial, regulatory); 0 Local economic, social and environmental impacts of the project; and o Preliminary pro-formas, if available.
These assessment aitaia will assist the developer in planning to eventually approach funding sources as they move through the development pmcess. By keeping these questions and criteria in mind, the develomr will be better ure~ared and will know the
m - &proPriate time to consider v-kous elements that are appropriate to the presentation of their project to fimders. -.
In their simplest forms, tbae are thee types of f i e r n g for any given project (1) grant thm3rng, (2) debt hmcing, and (3) equity financing. While knowledge of specifics of these types of fUrancing imdmments is not necessary for the purpose of approaching fimdm, it is helpful to know and understand how each of these types of financing instruments will impact the project.
CLIN 1: Fostering Climate Change Initiatives for Sustainable Development Task 1C: Computational Tool Kit
The import.ncc of risk evaluation in the dcvekqmmt and fkmchg of CCMB cmmt be Mdastatcd. The level of risk in (he project will have a submntd impod on tbe a n i l . b l i t y m d c o s t o f ~ d t b a e f o r e i t i s ~ f a C C M P d m l o p r r b carefully coadda all of the pot&d risks that their project may coco~oter in akjllrrtioo with the level of risk that the targdcd icndas will a k p t and must develop saMa&q mitigation plans d g l y mdas appq&tc
A frrir and bodest wlomtion of the risks inhacot in tbe dnnlopment procea is aitial to attmuing investor inlaesL Project should iocludc of tbt main risks to the pjoc t (tacbnical, *Jmdrcgukbory). Asc*pkiacdmtbe & n ~ t o o f i S t h e r e k r ~ r c l ~ b a w & n p a c c i v s d r i s L d & rchrm that drives tbe cost a d adability of fbding.
~)llringtbcpcriod'fiomsixtotw~~ty-f~montbsin~projectdcvclopoentcyck.a fun-scale technical and firrrncial feasibility sbdy of the project should bc coopk(ed. including initial financial pro formas. An objoctivc Ccsnility adysk wilt bclp thc dcvdopa toddnsspcrcdvcdritbdcsIablisb~cooditiomthrtwiU~itotbcpojcct'~sucass. T b e r c P n M i t y s h d y w i l l T & d i n t o t h c p m j c c t ~ ~ d ~ t o p o s m t L l
k t r y approval f;K my anticipated carbob offie& s so4 as tbc tcclmkal vtbility of the project is clear.
.cw-q$ O n c t t h e p r o j ~ ' s ~ a n d M v i r b i l i t y h . v c h ~ ~ t h e d c v d o p a . . - must begin to m - a p j e c t prcscnhtioa doarmcnt that will be o f f 4 b fimdaa. Esmtially a buPincs plan, this document is r amcisc desaiptioa of tbe proj&c amxpt, g a a ) s r m d o b ~ t b c m a r k e t ; ~ " ' ~Mmalysis;andtcchniatmdicg.l
l k e .rc many potenthl source^ of fbding for CCMP md c b pDductioa pojeEts Sectioa four provides a catalog of potadd bdiug a - bat oKa pow finmeiog r m d i n v c s h n e n t s o n ~ t e r m r a s ~ n ~ t b o s e ~ & r i a g g n a t f m d i s g a n d w i o a s forms of investma& for projects that may iwoh bigba-risk or Iowa rctmn but tha meet mvinnunentally-focused objectives. In addition, the catalog provides infixnuha
CLIN I: Fostaing Change htiativa fbr Scataiaabk Dntlopnan Task 1C: Cooptaticaal T d Kit

I
Marheling & Funding
on several financial intermediaries and brokerage firms that offer support in the I
development of financial stnictures and transactions that incorporate carbon credits.
CLIN 1: Fostering Climate Change Initiatives for Sustainable Development Task 1C: Computational Tool Kit vi
project iimding a d sell tbe resuttiqg cubm d k . Tbe objach'vc of the imkU&lod f h n d i o g t o o l L i t i S t w 0 - ~ l d : t o ~ ~ ~ ~ ( ~ ) d p r j o d devebpasdeveloptbeab1lityto~tbcirprojodstoinvestar,liadarandpoccati.1 buyasof&ncrcdigdtoiddfysounxsofdcbtdoquity~faprojeEts as wtll as potatid carbon buyas.
As with the other topics c o v d m this Scricp of toolkits, tbe Marketing and Fm*tiag + of CCMP dcvekpxat is key to scuning dequate hmds to coolplde UIC
'dcvekpxat of tbe project - without funding the project camtot be ' W d -and to r a l i z i a g t h e d d i t i o n r l r e v ~ ~ p e ~ w m a y b e o b t . i o e d ~ a l i x m P k r Brmax CCMPs have a diffacnt risk pfik eomp.rad with 6, more c a m m h d para projccts,itiscssentialthatdtvclopashaveackar-oftbesp&*l coaddcrrtioasmvdvedmp.ocmiagfundiagfortbcirprojectsrcmilrctherpoEiSe ~ o f f i m d i o e ~ t b a t a r e a v a i l a b k a n d t b c i r r e a ~ 'IbistoaILitis desT@ to w-devdopas ideatify the funding a&e (b CCMR d C h n Enagy -**- h- p q i d s ~ h i g d t h e ~ o f t b c i r p r o j a c t ~ t o ~ o o c . a q ~ . .
t b e i r p j e c t ~ i i o n t o t h e ~ & ~ . n d o b j a t i n s o f f r m d i n s a w c c c . - -
~ a r g e t a l ~ o r s i n ~ s e c t o r p r o j e c t ~ i n c l u d e b o t h c c r a v e n t i a a ~ -ed investors and amma&d, Ily4amYi- hvestment appommities for CCMP H o d s may iakc m m y fonnr Eqoity a debt t i d i ng may be Eargded specifically to m l e (SD) aclidkmdrmy ormaynot raqn i reas t rkemthea l i xmo~tbr t r r t~Mmloc t iogpFa jaLr~ mvestors mtheIbilityto-dp-esentpjects-tosdlproj&tt-inavly l h a t ~ t h e i n v c s t o f i ' ~ ~ m d ~ . Devc~oeedtomdastmdtbrt f r m d i n g ~ f o r C C M P s c m w ~ a ~ ~ t g e o f ~ ~ d b t & I t i M t m d c s i g n i n g a f a a d i a g ~ t h t ~ b o t h t b e ~ o f t b e p o j & 1 m d a r p . a s ~ objecti~s of the itlvcsm.
$i ~ t o ~ ~ . c t i v i t i a o f b ~ i b t t p r o j c e r s m a d a p c c i 6 c ~ f a r 1 , d a n d e c o a o m i c ~ . Hisstrollglyrarmrmcndcdtbrt
project developas rrsarch tbe eligibility aitaia of individual mvcslon d ddrcs YI) tbese specifically in the project prrscntation. The & e q t b md w d n e s s of tbe project
Y CLIN 1: Fostering C h n t c Change InitLtives fa Swtababk D c v e ~ Task 1C: Colllplwlooai Tool Kit
Y
Marketing d Funding
as presented by the pmject developer, should represent risk and return decisions for the investor based on their own particular interests and goals in investing.
M i g sources arc not all alike. Private investors with solely commercial interests will review projects with a focus on the risks to cash flow that may jeopardize retained amhgs and in turn, degrade internal rates of retuni. Specialized funds, such as those which include environmental objectives, may accept some level of higher risk to cash flows in exchange for a stronger likelihood of meeting those wn-commercial goals.
The term "market&' as it is used in this toolkit, refers to a pmxs of analyzing, packaging and presenting projects to potential investom and funding agencies. Successful marketing of a project requires indepth knowledge of its strengths and weaknesses h m a number of perspectives (i.e. technical, linancial, economic), and an ability to communicate those strengths and weaknesses to investors in terms they can understand.
This toolkit combines (1) an explication of the fundamental requirements of project presentation (financials, commercial, regulatory and economic risks and mitigating securities, etc.), (2) examples of pmject presentations, and (3) critical information on sources of public and private financing forprojects. The following mmmarka the information contained within this document by section.
o Section 2: Assessment Oitenb outlines the basic parameters for evaluating a CCMP in tams that are relevant d mniastmdable to potential W e r s d includes a critical path diagram showing the steps relative to generating an appmprhte project
* . presentation for fimders. - - - A - 7 - -
0 Section 3: Implementation outlines the relationships between pmject development phases and project risks and identifies steps that a project developer must take to prepration for approaching funding sources. Specifically within this section:
o Imesimenl and Riskdescrii the importance of risk and identifies different types of risk associated with the pmject development cycle.
o Sharing the risk d e s c n i how to use financial risk analysis to generate a risk- return pmfile for different types of funding sources. The Carbon Finance Toolkit pmvjdes detailed information on the types and sources of project, market and 6nancial risk with quantification and mitigation techniques and should be used as a reference in reporting potential risks and mitigation techniques to investors.
o Feasibility Study Analysis outlines the purpose and importance of generating a sound, objective feasibility analysis to address perceived risks and establish the coditions that will contribute to the pmject's success. The feaslility study will feed into the project presentation document and demonstrate to potential hde r s the commercial viability of the project.
CLIN 1: Fostering Climate Change Initiatives for Sustainable Development Task 1C: Computational Tool Kit
o 77re Btainess Plna section provides a template for presenting projects to potential funders that can be customized to a given project developer's needs a d goals. This section outlines the basic distinctions between project financing and carbon credit sales and explains how CCMP developers can structure project financing that includes the rights to carbon credits, or treats the two as distinct tnnsactions.
o Marketing Carbon Cdifs demonstrates how to identify and approach interned carbon buyas and provides a template "Project Brief" which m y be customized to meet individual carbon buya's requirements.
o ~inancial(Andtiionolity describes this issue and its importance in utilizing carbon credits to support project financing and acquiring approval ofand buyers for carbon credits.
o Section 3: provides a detailed case study of a successful energy effiiency pmjecr, which demonstrates an innovative financial structure that includes carbon offset revenues to support lhe project.
o Section 4: provides a catalogue of available sources o r funding for CCMP project development in India as well as other resources that may be of use.
CLIN 1: Fatering Climate Change Initiatives for Sustainable Development Task IC: Computational Tool Kit
3
Before approaching sources of private and public financial support, project developers must first review and assess their own project in terns that are relevant and understandable to potential financiers. By the time the developer is ready to begin the process of approaching potential funders, they should have already completed the initial stages of development. They will have identified a site and have generally chosen the technologies theyintend to use. They have completed an in-depth feasibility study (described in section 3), including at least preliminary financial projections for their project and will have measured the potential of generating carbon offsets from the project. Developers should have a very good understanding of all of these elements of their project and should be confident that their project will be successful based on these initial analyses.
When preparing to approach potential funders, the key information that must be provided at a minimum includes:
o Expected total project cost (in stages or phases ifrequired); o Projected revenues from the sale of goods or services (energy sales, consumer
( products, expected savings/avoided costs resulting from project);
o Assessment of market penetration and growth potential; o Risks to project realization (technical, financial, regulat6ry); o Local economic, social and environmental impacts of the project; arid o Preliminary pro-fonnas, if available.
These assessment criteria will assist the developer in planning to eventually approach funding sources as they move through the development process. By keeping these questions and criteria in mind, the developer will be better prepared and will know the appropriate time to consider various elements that are appropriate to the presentation of their project to funders. Later stages of the development process such as risk assessment
CLIN 1: Fostering Climate Change Initiatives for Sustainable Development Task 1C: Computational Tool Kit
3
d f ~ b B i t y ~ ~ l b c m o r e ~ t u d t b c p j a d ~ w i U bcmae complete.
C L I N 1 : F o s t c r r i g C t i m W ~ ~ f o r ~ Task 1C: Computational T d Kit
. k v
5
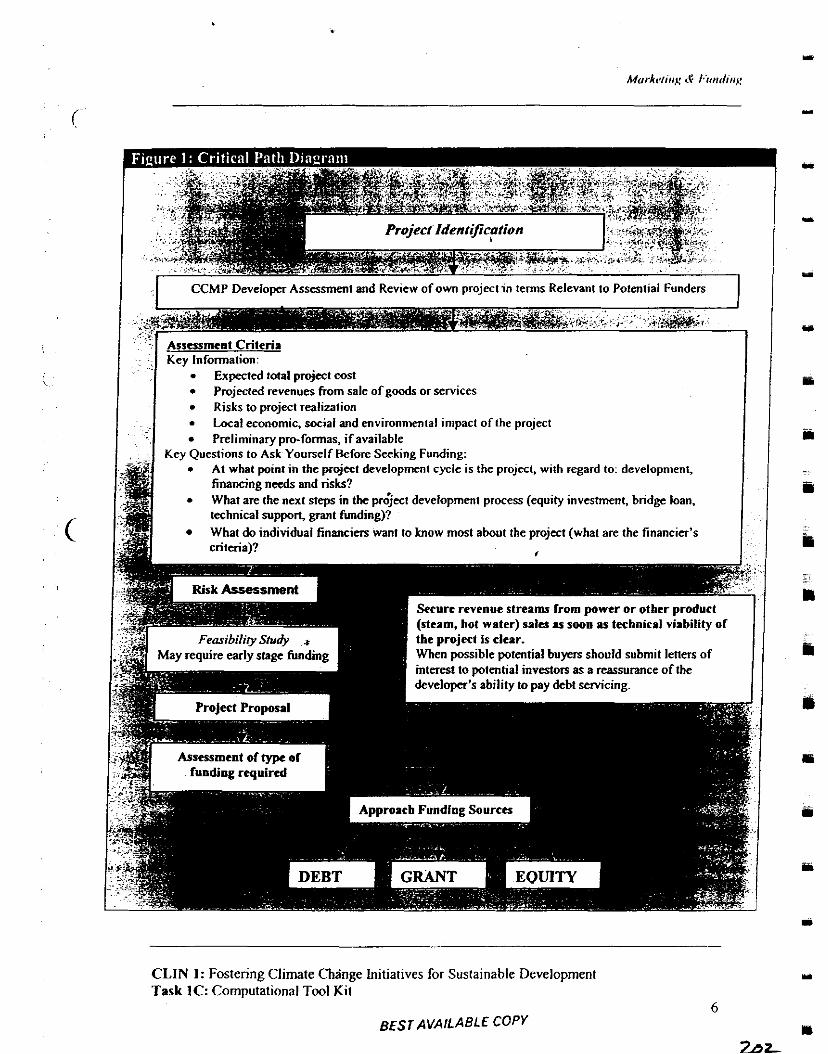
( I CCMP Developer Assessment and Review of om projectin t e n s Relevant to Potential Funders 1 1
Assessment Criteria Key Information:
Expected total project cost Projected revenues from sale of goods or services Risks to project realization Local economic, social and environmental impact of the project Preliminary pm-formas, if available
Key Questions to Ask Yourself Before Seeking Funding: At what point in the project development cycle is the project, with regard to: dcvelopnient, financing needs and risks? What are the next steps in the pro'ject development process (equity investment, blidge loan, technical suppori, grant funding)? What do individual financiers want to lolow most about the project (what are the financier's criteria)?
CLlN I: Fostering Climate Change Initiatives for Sustainable Development Task IC: Computational Tool Kit
BEST AVAILABLE COPY
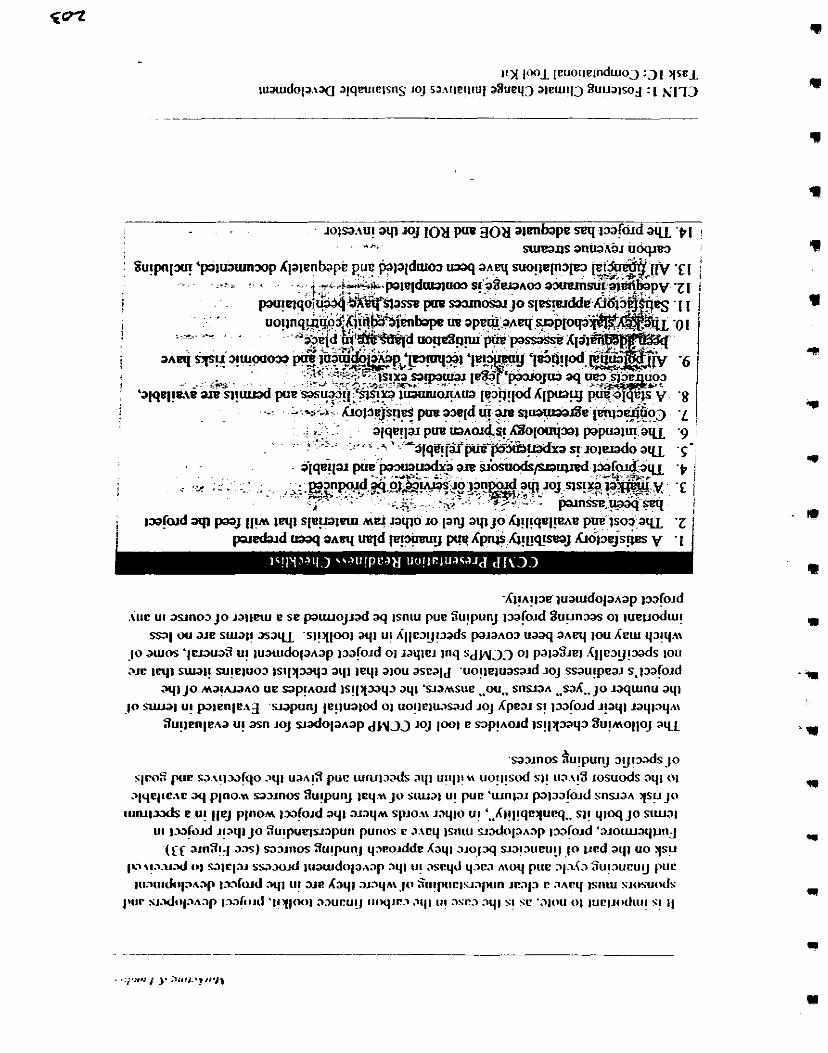
-
! ~ o i s a ~ u ! w lo^ 101 pua aou arenbape req isrdrd a q ~ I .$+.
! surea~~s a n b k a ~ hoqreJ i
I Su!p[ju! 'pe~uaummp X[a~enb?pc ~ ~ pui .~, .. . ~ l a l d r u o j uaaq ancq m ! ~ e [ n q w F f ' 3 d & l ~ .EI ~. ~ ~
*W,~.*.#. : . . . . . .. $ ; - - ~ & & i t . ~ l q d ~ ~ w x ) siaSeu~m a k n ~ s u p a l ~ @ p v -ZI i t: ' , + 7 ~ ' '
. . ~ - I pauyqo;~-5X3&%asse p m
. . ~ , "ollnq&hi3.~-2dwh I
;.-*... -- , I
,:-.-...& ::,. .. ;,.. ! bOpe"3 .a .:. , , a x i d 'dL@t&@l uop&p+ 6 2 ~ ; - .::?i% -. ,! ,,:
I ! 3 ~ q +~~3!~1?093 pus 1 ~ t ~ t ~ $ & v ~ 3 '~J~T*J ~:$xs. :<:: 2 - . **
.. .. !,* . . 1 s l r p a & ~ I I ... ,..{ ,.,~,6.>:,.~,' .. .w. .~ : >lqq+i am sl!uuad pue &yy.hs!ra i ~ a ~ ~ w o a I
. - .-- . -:,yj.~*i:~ . ~ r ( l o p ~ j ' S p ~ pm ?*id, 6.- q-e1*~13@fio3. -L ! .. - ., .I.''. .. iiqe!l& pua ua~or&ii &[a&q5al papuale,aqL -9 , . .. : - : ; .,A a(qa!isw:+iladxa - ,olerado.aqL .*.;
. - I . ~. . . j[grr,[ar *'pa-"adf=an! ..,. ,L. :: : s i d p d . ~ , + ~ ~ g ~ .p : . . . . ., , +. . : : ~ ~ n p s l d . ~ , ~ ~ & ~ ~ $ ~ ~ ~ @ , a ~ .. . .-:: , %+ . , > .. .. % G ~ JO~..S]SIG A-e- 1 a w . v x..: ,,?.?., . .-L 1
.. :. ~ , . . . ~ - - - I , , . , . . , ,? 2.. . . .. msse..paQseq j
-AI!A!I~E luarudo[anap pafold .iuc ut an03 JO la l lau e se p a u o j ~ a d aq lsntu pue Su!punj 13aro~d %uunm 01 lueuodlu!
ml w a ~ e sutal! a s a u -si!qlool aql u! L l l e ~ ~ ~ i ~ a d s pa'ano3 uaaq aneq lou ACUI q3 tq .~ 1 0 acuos ' l uwa8 u! lualudo(anap I X J ~ O J ~ or Jaqlr.1 lnq s d ~ j 3 01 palaSlel .<l [e~y !mds IOU
ale 1 q 1 N l a l t . NI~IUOJ . lS!l13al(3 aql leqi alou aseald 'uo!leluaslld JOJ ssau~pea~ s.]mfold .TI JO ma!mano ue S ~ ! A O J ~ ISII~JJ~J 941 'uamsue ,.ou.. snua* _saK., j o laqutnu aql
jo suual u! palenle.\g -r;lapunj le!rua~od 01 uo!leluau~d JOJ Ape21 st . ~ m l o ~ d . Jlaql laqlaqni zu!lenle~a u! asn l o j sladolanap , j i q ~ > 101 1001 e mp!nold 1~!1qsq3 SU!MOIIOJ a u
~ s a ~ ~ n o s S u ~ ~ u n i j ~ I J ! ~ S JO
s lmB put? h>.\!lcuiqo .>III U ~ A I ~ PUC WIUI~ .~S~I {~ UIIIII\\ UO! I !S~ SI! 11a.\!3 IOSUO~S aql 01
>lqel~c.\r y p1no.n saxnos Sutpunj I eqn jo SIUJ~I u! pue 'urnla> pa lmlo~d snslan qs!~ JO
I I ~ N I ~ e u! l le j pinom i m f o ~ d aql alaqm sp10.n ~ a q l o u! '..Xlil!qequeq.. sl1 qloq JO s~ural UI ~.v io~d i laql JO Su!pucluapun punos c a.\cq lsticu ~ x l o l a n a p 1mrold ' a l o u a q ~ n j
( c c 2ln9l11 9.x) n x n o s %!pun1 q>eo~dde Kaq] J J O ~ ~ ua!nueu!ljo ved aql uo ?(su ~ v \ ! > . u d cr) u l c l a l s w w ~ d ~u~wdolanap a q ~ 111 .wcqJ q>r-? moq puc >I>(> Su!>ueut~ pc~c lu.?ittik~la~>p 1-mrold aql u! X e K3q1 313q.n , # c ~ Su!ptteluap~n IC>(~ t? ancq ISIIIU SI~ISU~K~S
IVIr SJ.ldtl~>~%ap l>?il~~l! ' l l ~ ~ l N > l 33UCU!l lttM+t?.3 .>ql 111 >St!> >ql S l SC '>IOlt 0 1 l ~ C l ~ l > d L l t l Si 11
Marktlng & Funding
l)pes offwrding available and their relalionship 10 project risb andproject deveIopment
This section outlines tbe relationships between project development phases and project risks and identifies steps that a project developer must take to prepare to approach fimding sources.
t In their simplest forms, there are. three types of financing for any given project: (1) grant financing, (2) debt financing, and (3) equity financing. Grant financing is pmvided by organizations and entities that are not expecting financial returns, but may have very strict expectations and requirements regarding the use of the funds. They are likely to require reporting or monitoring on the use of funds and accounting of all costs in assessing the value of the grant.
Debt financing refers to any kind of loan to the project, based on conhadually defined terms regarding maturity and interest rate. Loans do not represent ownership in the pmject; on the contrary, debt 6nancing seeks as little risk exposure as possible, and ownership in the project would constitute shared risk. Lenders will seek collateral for their loans in the form of physical property (assets), which may be appropriated by the lender m the case of default.
, Equity fhmchg provides funds m exchange for direct, proportional ownership Yd the project. Equity owners realize their vaIue throuah distniution of miits kiividmds - - distributed-aft& taxes, debt-service) and throughthegygln?r~ sale-of th& o e stake at higher valuations. Equity owners bear more risk than lenders because if the project fails, they bave no claim on other assets and are likely to lose their investment in the project.
Among tbese three, fratha differentiation reveals different tpcs of grants, debt and equity. Different types of financing instruments, such as subrdinated debt and ~ 0 r k i I I ~ capital loans, are available for pmj& depending on the needs and the best-suited overall finawing package. Knowledge of specific types of financing iasfmments beyond debt, equity and grant finamhg is not necessary for the purpose of appmcbing funders. However it is helpful to know and understand how each of these types of financing iasfmments will impact the project.
Figure 2 below shows the relationship between equity and debt versus general project risk
CLJN 1: Fostering Climate Change Initiatives for Sustainable Development Task 1C: Computational Tool Kit
8
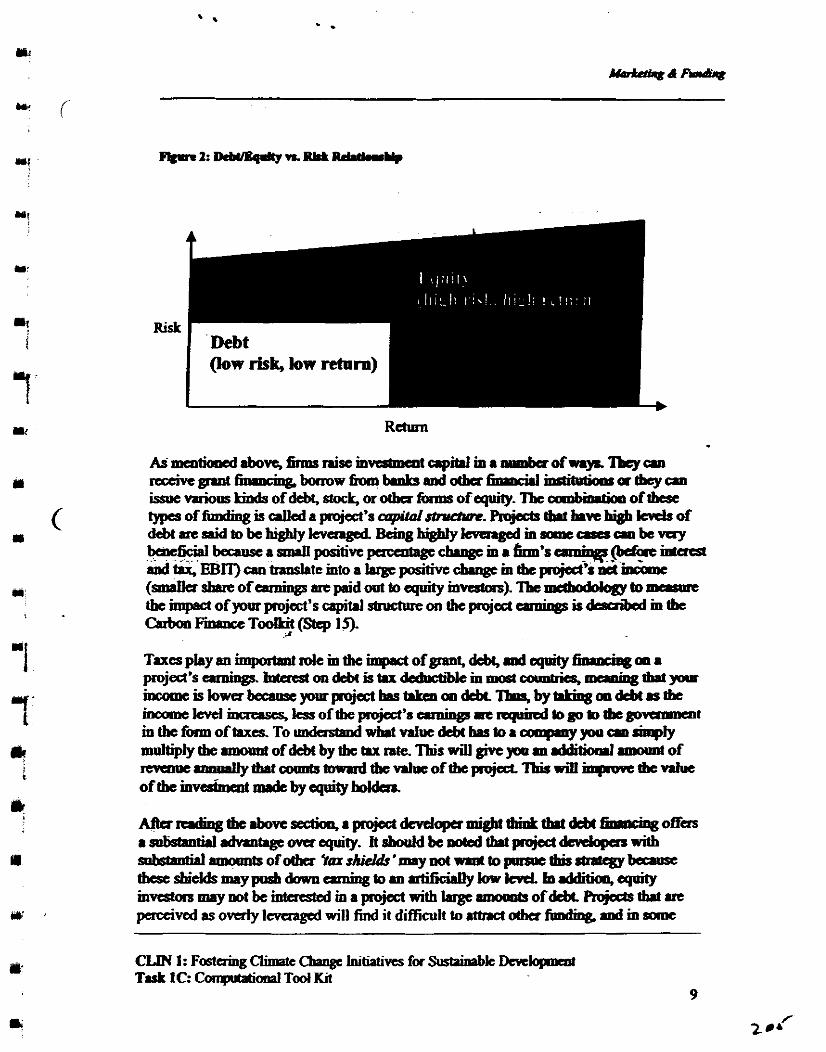
Atta~tbe .bonscct ion ,aprojeCtdenlaprwght(h inLtbrtdcbt~of fas a dkbnthl advantage ova equity. It should be noted tb.1 projed d c d q a s with ~ r m o a n t s o f o t b a k s ~ ' m 8 y n o t ~ t o ~ ~ ~ b s a a s e tbcseshiekis~ppsbdowncPningtom.rtifickllyhicRLIndditioqcqpity i n v c s t o n r m a y n o t & i n t a e s t c d m a ~ n i t h ~ ~ o f ~ R o j & b t t v t a r e pauivad as overly leveraged will find it difficult to atbad dha fimdiqg md m
CLM 1: Fostaing Ckmtc Chogc Initiatives for b t a i d k Dcvclopmcot Task 1C: Compltsbional T d Kit
9
Marketing & Funding
cases may be considered in financial distress (or simply, bad investments). Each project developer should decide on a reasonable debt-equity level that takes profile maximization into account, as well as the interests of the equity holders. Few projects can be completely financed with debt, making the interests of equity holdem of paramount importance.
Project Sponsors
Equity investors and lenders are not likely to give sponsors more than a non-committal "interest" in a pmject that is still in the wnccptual stage, unless it is accompanied by strong, credit-worthy sponsors or some fonn of guarantee. In the absence of strong corporate backing or early guarantee, potential lenders and investors will need to know more specifics about the technical, commercial and regulatory risks inherent in the pmject, issues which can only be a d k e d through pre-feasibility and feasibility studies (discussed later in this document). . It is important to note that either debt or equity arrangements can include elements of carbon financing depending on the funder and the goals of the investment vehicle. It is up to the developer to understand the ways that carbon finance can be shaped and used with a project and to be flexible when presenting his project to potential fimders. It would be wise for the project developers to create presentations tailored to several types of potcntial investors and fimders and be sensitive to the specific requiranents of the investor. -n---. -. .. . . . . .. . . - .. . .~ ~. -. - - .- ~~~ ~
TI& importance of risk evaluation in the development and financing of CCMPs carmot be urnleastated. The levcl6f risk in the miect will have a substantial i m c t on the S - awilability and cost of i inancii a n d k f o r e it is imwrtant for C C ~ develo- to candidly consider all of the potktial rislcs that their prbject may encounter in cdlj~mction
- - -
with the level of risk that the targeted lenders will accept and must develop satisfactory .i mitigation plans accordingly and as appmpriate. This will be discussed in greater detail in the Shuring the Risk section below.
& Aftet assessing where they are in the projed development path, developeas can best urnlastand the nods and concerns of funders by trying to understand their own project risks (see Carbon Ft~nce Toolkit for a detailed list of project risks). Debt and equity L investors are prbady camxmed with any risk that could impact the timely repayment of tbek investment and return. For equity investors, this means concerns about the ability to complete the project and build value through successful operation and positive cash I
flows. Ibe creation of value &om their investment ensures their ability to d i z c gains hm the future sale of their equity stake in the project. For lenders, the project must have "securities" such as enforceable sales contracts, other fixed assets, or corporate I
CLIN 1: Fastering Climate Change Initiatives for Sustainable Development I
Task 1C: Computational Tool Kit 10
qmwdkip,asrasfl~anceUuttheirloanwillbcnp.idmathaefyhshion hdditioq lcndas gcoaally muire that the mject ~ i d e x s b v c mrde a &stand mvcaam . .
t in the Gje~t Ihl& panntees~arc-avaiie 6um vay c d b m d y garrPltaq lendwwinh.ys~a~ti.l~iwahaentinaaoicd.rn.sarrma
~bowmuebriskmitig.t ionmdrcerPityhtrtobcprwidcd~fraafmrdiqg . . ~ou~cetosount. N o t ~ , l d a r r m d c q u i t y m v c s t o r s w i U r e q p i r e m a infonnetio11~~andrisk~tigrtionpLmtheclosatheyrretormLiqsm decision. Ibe amount ofwork put into providing this infwrmtioa b in Lrge par# the p r o j e c t d e v e l o p d s m b ~ v c d e c i s i o n , h s e d o n ~ ~ w i t b p o & n t i d iimdas.
F v 3 on the following page sbows a typical timdrLlr &omhip fk a mediumski (60MW to 100MW) nm-of-tbe-rivcr hydro facility requiring high u p h capital toss and a relativcly loag paiod for oooshuction. l k paiob used arc tbaefae fk refkmce only, and developus should sketch out their own dmlopwnt periods md s&&k rcleetiog the rtl&ve costs md colrphuetion r e q d of their tahdogy (i.c b i o m a s s - f i r a i ~ t i o n typicallyrequirestwoyarrs 6um wncqttooompktim).
CLM 1: Fostering Climate Cbsngc Initiatives for Sushhabk Ikvclopnent Task I C: c v T d Kit
I I
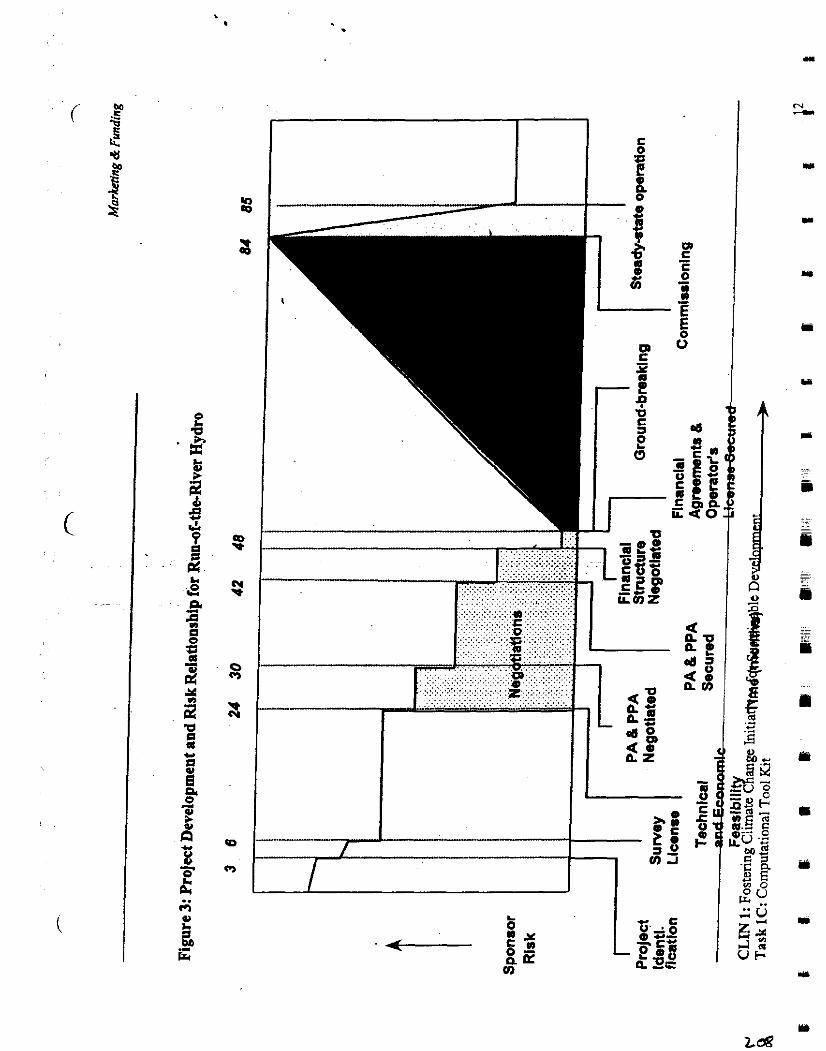
As illushated in Figure 3, the earliest of project represed sane of tbe highest risk to thc puticiprntg Tbe sponsuc, for eumplc, must amsicks tbe oppormnity cost of up;tal reawuccs committal, inchding y for propct identificltioq a n m t r y m d p j e c t r i s k ~ ( i f m ~ p j e c c ~ ) , m d ~ costatimstioas. ~ h c t , ~ c c r r r m i F L o d i t t b i s ~ s t 8 g c ( ~ e q i r i t y ' ,
A s d e v d o p o c n t o f t h e p r o j e d p o c c e d . , ~ m a y ~ d t b c ~ ~ ~ y begintofall. Atthesamttime,morcraomcescuecommitttdmditrislr,while ~ e d c o s s a r c i a a n r e d c m d t h e ~ t e d r l t c o f ~ m t b c p b j e d b c g i a s t o till. ~ r a i s p r o c c a o f p ~ ~ m w h i c h t b c e x p & t c d r r b n n a n t h e ~ pro jCa invcstmcntaodesmthepra -m~~amt i rmcrdtbcest i r rmtcd~te ofrrbnnco11~agcswithtbcraquirrdnteof~f~quityiavcshnartmthemtim project, as identified by the spmm (the real opportunity cost of capital plus risk premium). If the diseouotcd rate of rum falls too hn, the gponsor any withdiaw h the project.
point when an of the legal md f;nanc;.I d s m a & cue d Tbe proposed prom now bas an i n d e nlue tbat mitigates mtlch of the smmsm'r Daceirad risk hsd
~ k e y l e g a l d ~ ~ b r & n ~ s c u n u i , - ~ r i s k a m l y s i s trIresho14bsscdonthernnountoffimdrammitted. h r m c n a s y a a w r g y efficiency pmject with clearly defined cmtnctDIlt ~~5 for example, the dcbt md equity that have been seemed for tbc project ~c am d i s p e d b mat arb Bow ~ ~ ~ t s d u r i u g a x m u d k m Tberiskduring&ispbrs+rhaqr6cllybecawe mtcnstaccumulatesondcbttimdswitboutmyo&rettingrcvamc~ Fortbcraoc r a r s o q r i s k a t t h i s t h a c i s r l s o ~ ~ t i v e t o m y c o s t a ~ o v a n m TbefinraocingofthispbsseisUslpllyrmixofsquity.su~eddcbSrrniordcbSiod @=='- Refaring to Figure 3, only &ex appmximotely three to six moorht of work on ~ t h i n g tbcpmjeetconceptandrcscarching~mdobstacks@amittiqgmd~fbr cxample) would it k ~wsmable to aped more t h r rmbarrrmtiml htud h pota~tid hnks. At this stlge, tbe devdopa shopld hve r did p j e d propod and
CLM1:Fos ta ingcI i iChroge~faSus t s inabkDMloprrnt Task 1C: Computational Tod Kit 13
Marketing & Funding
information clearly presented in an initial project document, developers should then research any available information on the criteria of a given funding source.
Sharing the risk
Steady-state operation of the project means it is generating revenues that are adequate to meet the cash flow requirements (O&M, debt servicing and retum on equity requirements identified when the fmwial ad legal documents were secured). Refinancing of the project is now possible. With the project risks greatly reduced, the required (forward- looking) rate of =turn is significantly lower, making it possiile to reduce the cost of financing the opational phase of the project, thus improving the position of equity investors.
Figure 4 below m h p o s e s the fimding mechanisms of the Global Environment Facility (GEF) on the project risk and development diagram. This is useful for thinking about where you are in the project phases and what kind of funding instnnnents may be appropriate and available. GEFgrant and non-grant funding sources comespond with the project development cycle and its three phases: (1) pre-construction, (2) the construction phase and (3) the operational phase. There are two areas of the project development cycle where GEFnon-grant measures, such as concessional lending and loan guarantees are
( relevant (I ) preanstmdon and (3) operation. The construction phase (2) is not appTopriate for GEF sup@ because risk is mitigated primarily through contractual obligations between the sponsor and the contractor.
CtIN 1: Fostering Climate Qange Initiativts for Sustainable Development Task 1C: Computational Tool Kit
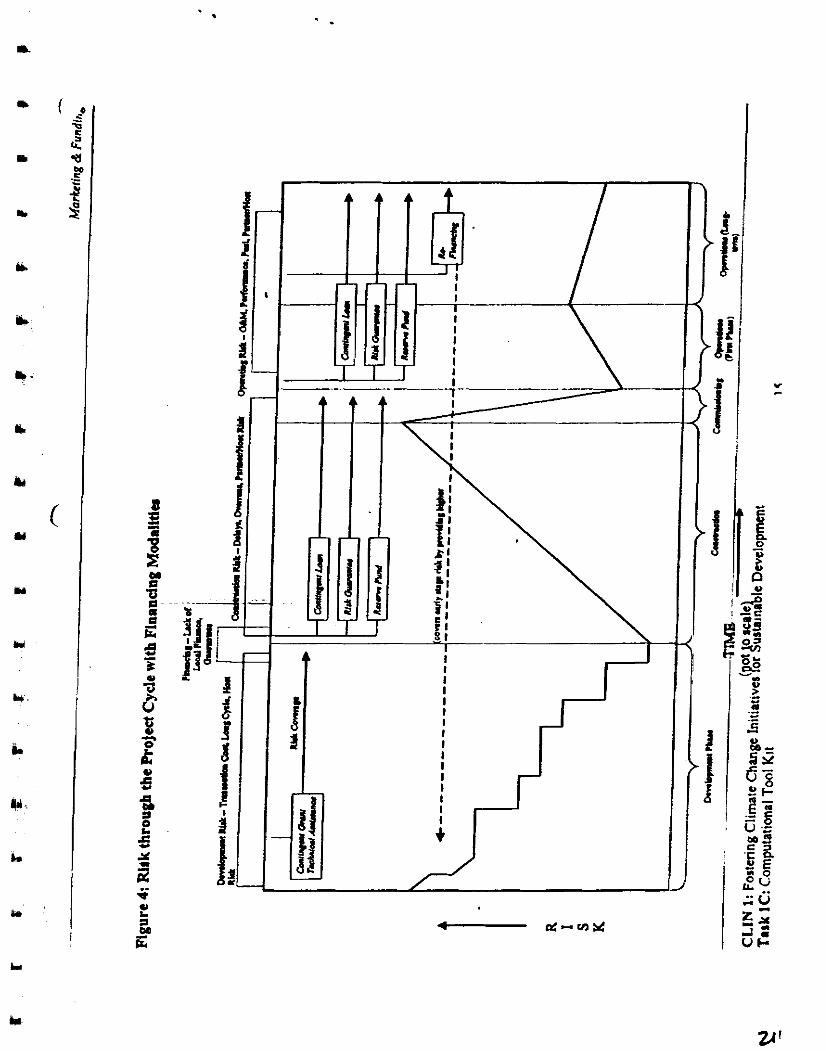
Markeling & Funding
A fair and honest exploration of the risks inherent in the development process (sot Carbon Finance toolkit for a comprehensive list) is critical to attracting investor interest. Project presentations should include identification of the main risks to the project (technical, commercial, and regulatory). As explained in the carbon financing toolkit, there is a fi~ndamental relationship between perceived risk.and expected return that drives the cost and availability of funding.
Refcning to ~ i g u d 4, during the (1) pre-wmtrudon phase, project developers take on greater risk that the project will not come to fiuition and they will not be able to . mxperate paid-in or "sweat" equity from successful closure of the project. This risk- sharing dement of the development stage is important to baintain, because it helps to assure potential lenders that the developer has enough at stake to see the project through to completion.
However, the preanstruction phase of a CCMP, such as a renewable energy or energy efficiency project is likely to last longer and require more costly transactions relative to thc total investment value than conventional project development The lengthy period and high tramaction costs associated with CCMP development therefore constitute barriers that can be ddressed by exisling concesional or dedicated funding sources. Because these costs occur at the pre-investment stage and put the entire project at risk, their relative @ortame is magnified in small projects, even tho
involves intemifiol mjject-SEakSolders and equipment imports. In&a& ~ p m s designed to protect renewable energy firms against commercial and political risk can subtantially &engthen the project presentation, enhancing the chances that lenders will make loans and investors will make investments. The Ovaseas Private Investment Chporation for example, offers a wide range of insurance progmm to cover losses from political violence, currency converb'bility and expropriation.
GEF contingent grants convert into loans if a project proves successhl, addresing certain prc-mv-t costs, costs,partieularly early-stage development psts that require smaller, incremental funds. In other words, a contingent grant is capitalized as an overall - - project cost as the project moves to financial closure. For projects that enter commercial opaation, a grant of this kind would be recovered when it is converted to part of the loan financing. If the project docs not reach commercial operation, the grant is not recovered.
Concessional lending, granks and dedicated equity funding is often predicated upon admessing the high-fmqadon costs of the pre-wnstruction phase of CCMP development ~ i g h tramadon costs duringthe p ~ n s t r u c t i o n phase can contniute to the higher total capital requirements of CCMPs. As a result, concessional lenders andlor risk-fiiendly envimmental investors often want to know in some detail how they may
CLIN I:, Fostering Climate Change Initiatives for Sustainable Development Task 1C: G~mputational Tool Kit 16
s d d r r s s h i g h a ~ c o s t s d u r i n g t h e ~ o o p h s t o ~ ~ debt aod equity pdcipatiw kta m tbe dcvelopmcnt cycle.
FkuusctherisksofCCMPpjectdevdopmntladtubigbarrtum~q ' %sod s t n ' e t a i ~ t e s a s , o t h a f a n r s o f ~ c m b e c o o r m i ~ c u ? y s o d ~ kta I&I finmciai closure. Euly, M U I - C O D ~ &offbumhg ~ t s s r r c b a s p a r l i a l a e d i t . n d r i s k g u v a n t e e s o r a t h a ~ l d e b t o r q u i t y c a n b e v a y ~ c i n m o v i n g t b e p r o j e d f ~ . :
of tbc ri& This may be simpie u r &-equity req '~ tbytbckada,amae compticatedintbe~ofddition;l lseanity~~byt&spomor. CCMP dev&opaswitbontshwg~kkiug-&oddllotdt&bytkaasdinarme c a s e s t o p v i d e ~ ~ ~ t o ~ ~ a r h r c k a n i L b l c h the poject 6.c. physical assds). - .. --
F i i l y , t b c r i s k s o f t b e o p a c l t i o l l l l p b s e , v f i i k s i ~ n e ~ b w . This is a question of degree m that tbe failllrc of -tion MY Only aatc short-term
-1.i t e c ~ ~ a l aod u fca~lbity & projcet shollld be -k(e4 i n c i u d i n g i r d t i a l ~ R o f o r m r i f t b c ~ d m f o p a ~ n o t h n h i s l h c r ~ w n r r n w a c t s t o c a n p l e t e t b e f e a n ~ , a p ~ y p p C t r e p o r t a ~ f a s ~ ~ ~ ~anp1~tosupport4@=-=
. . forxlditia~Iartyztrge- A p f - i t y sbdypro*a~oftbeprojeddis.Isotbcbrdrfor&- . .
gwbc(bcrtbe projedkworthyof~~md~mrM&fcaSlklitystpdy. obicctives of a raafdilitv shdv are to 11 establish the lltnmcras aad cbmdenstlcs
. .
o h project, i) riscss tbe ;cgionj A to cst.b1ibhlibhfutl supply and ( c c h n ~ l o g ~ ~ 3 ) d d e r m i n e c m d i b t c p j a % s i t c s , d 4 ) i d c a t i f y p o t m t i . l p m j e d ~ o r
CLIN1:Fosta ing~~ia i tht ivrsforSl ld l iorMcDcnlopmcd Task 1C: Compdatiooal Tool Kit
Markflng & Funding
partners. A formal prefeasibility study may not be necessary depending on the type of project, if much of this information is already known or if the project developa has conducted these assessments in a less formal manner. However, for project developers that are seeking early stage funding for a more detailed full-scale feasibility study, a preliminary feasibility study or more formal project concept document that outlinea these key criteria will help in making a case to lenders.
'
Sevcral sourca of &ly stage funding, i.e. pre-feasibility or feasibility study funding exist in sssociatiop with funds that are oriented towards environmentally-fiiendly or sustainable development. For example, the Small- and Medium-Sized Entaprise Fund of
5 the International F i e Corporation, which invests in mall, environmentally fiicndly - projects of various kinds, can sometimes provide grants for feasibility studies during the loan review pmcas. A full-scale feasibility study, which establishes the technical and financial credibility of the CCMP and projects cost and revenue streams for several ongoing years, is a necessary element of the financing pmposal and will be required by lenders. A strong feasiiility study conducted by credible analysts will improve the developer's pres&tation of his and will-reassure lend& that the project has a credible developer leading the effort.
A full-scale fessiih'ty study looks at the project in greater detail and should predict the project's ability to achieve eommacial success, based on an objective assessment of market penetration and gmwth potential. It should provide a clear picture of the pmject from a technical as wen as financial standpoint, its market, the costs of operation and a projection of the potential sales and profits based on the size of the market, the nisting c~mpetitom and the room for gmwth in the market The feasiiility study is the project sponsor's primary argument for selling the project to potential fhanciers and the primary d c t h t of future success.. Therefort, it is verj impo&f thei-feasii i l i ty study be canied out objectively and a c c ~ t e l y . If the sales volume pdicted by the feasibility study is not adequate to suppor& the project, then the developer should not pursue the pmject. Developas gain nothing by altering the pmjections so that they seem more athactive to potential fundm - if the sales are not really tbae, the project will f%l.
Tbe feasibility study includes both an analysis of projected sales volume and the costs and expenses that the project d l incur- this can be estimated based on similar projects in the same industry and adjusted for my diffcreoces in your project By comparing these projected costs with the projected sales volume you can calculate whether the project will be able to generate adequate profits.
Project developers must begin the process of securing revenue streams 6om powu or other product (steam, hot water) sales as soon as tbe technical viability of the project is clear. Power purchase or 0 t h sales contracts for the project's output are ultimately going to be a major part of the security package that reassures lenders of the developer's abilityto pay debt sewicing. If possible, pmject developers should pmvide potential investors with expressions of interest in the pmject output from buyers, along with information on the credit worthiness of those buyers and an outline of the intended
CLIN 1: Fostering Climate Change Initiatives for Sustainable Development Task 1C: Computational Tool Kit
commacial ammgmats and likely contract saucmc. Early indiutions of scam sounxs of revenue to tbe project can p a long wry to rnrsllring hvcsims Umt the project is a good cmdid.tc for financing.
h addition, project developas should also begin seekkg IUXI-UJUII~~ .ppronl for UIC ~ g e d i t s t W t h y c x p c c t t o g e a a ; r t e f r o m t b t p r o j e e t . r ~ o f m c p o n - ~ denlopmcntpocess. O b t l t n i n g h o s t ~ ~ n l i r ~ t D b r v i q B U I C c r r b o o c r c d i t s ~ ~ k g i t i m a t c w i t h i n t h c ~ ) 2 o l i c y ~ . n d u ~ n h r mtbeintauatiodcuboamplrct W ~ h O B t ~ . p p I o y . I , ~ ~ h y u ~ willnotcven&tbecuboa~ts.svi.bk. ~ h o s l ~ p p o o l l i s d i f f ~ m m r y ~ , b o v m r m & t u n w a ~ a S c c f e t . r y o f
- Environment will howc m of6a h i is cqmble of reviewing md signing offon adnm crcdik G m c n l l y a ~ k m p p ~ ~ n l k ( t a b d i k k & N i d e n a o f ~ ~ approval. I t s b w l d b e l l o t e d h c n h t m ~ w b i l e t h c g o ~ h s ~ t o ~ v c any projeci for its carbon anissiom ductions, the gcnad trad m thc cocmby h pointing to grclta invohvamt m and q p n t of mtanrtiorvl activities to aumil Breenhousekw=
A s a f i r s t s t e p m l o a t i a g k n d a s o r m v ~ ~ d c v d o p a s b o d d c o r r p a C a ~ o f ~ t i d l y m ~ f i d i n g a o u r c e s a n d c o a d u c t F s m c b o n t h e r p e e i f i c ~ ~ m a o f o c h l & i n o r d c r t o n u r o w t b e l i s t t o t h o a e ~ s b . t c g i c . n l ~ goalsthatanmostcondfdntDthc~ficCI=MP. l h i r m a y i n v d v c ~ -- fundcrsdirccUytodiscusstbefwusoftbeprojcctmd(G~ wbctbatbetim~kr hasrmintncrdm~theprojcct . D i f f a e o t f h D d a s w i n ~ ~ k R b o f infixmation and dB& critaL m tcrms of rchrm, ~ e ~ ~ l a l -a ~ r i g h t s i n d c s t D m o v c t o t b e l l e x t stepadthippoce~~may invdvcscvad telephone caUs in orda to obtain approval to provide a forrml project
A t t h i s ~ t b c d c v d o p c r d h v c . t r r r d y ~ p k t e d a ~ o f d i s a c l e ~ m ( b c psiect dev-t proctsg many of whicb f d M y into tbe pojad prcsuWh docmamttWwillkoffaedtofimdaa T h i s d o c l m r e o t i s ~ a h n d . v x r p b g a somecimesalkdafinmdDgpaposalafmanhgpLn ltisacooeiccdescripioaoftbc pojectcooapt,golkaudobj&tives;themarkq~*yfinmcLl~d t c c ~ ~ ~ ~ f o r p u m u h g t b e p r o j e d p t h . T b e a d i i 1 i t y d
m i n d t h t m ~ h m d a s r c v i c w ~ b & k . % ~ t i c s p & & , . n d r r h m g prof~doamKntwiI lg ivcdmlopas .a~oramnebof tbecompeWan
. . The business plan sboutd be clear and tmdastaaLble to a pasoa wbo bas m apuhcc with your project or UIC khmlogy. 11 should be free of jargon and sbwld lay a pmpa fomdationmthrtabyrmownrmdcntMdcbeconceptsit~ Thetdmkd
Q M 1 : F c s t c r i o g C l i r m t c ~ l c d I i a i i v c s f o r ~ D c v d o p n m T& 1C: CaapltrtiooPl T d Kit
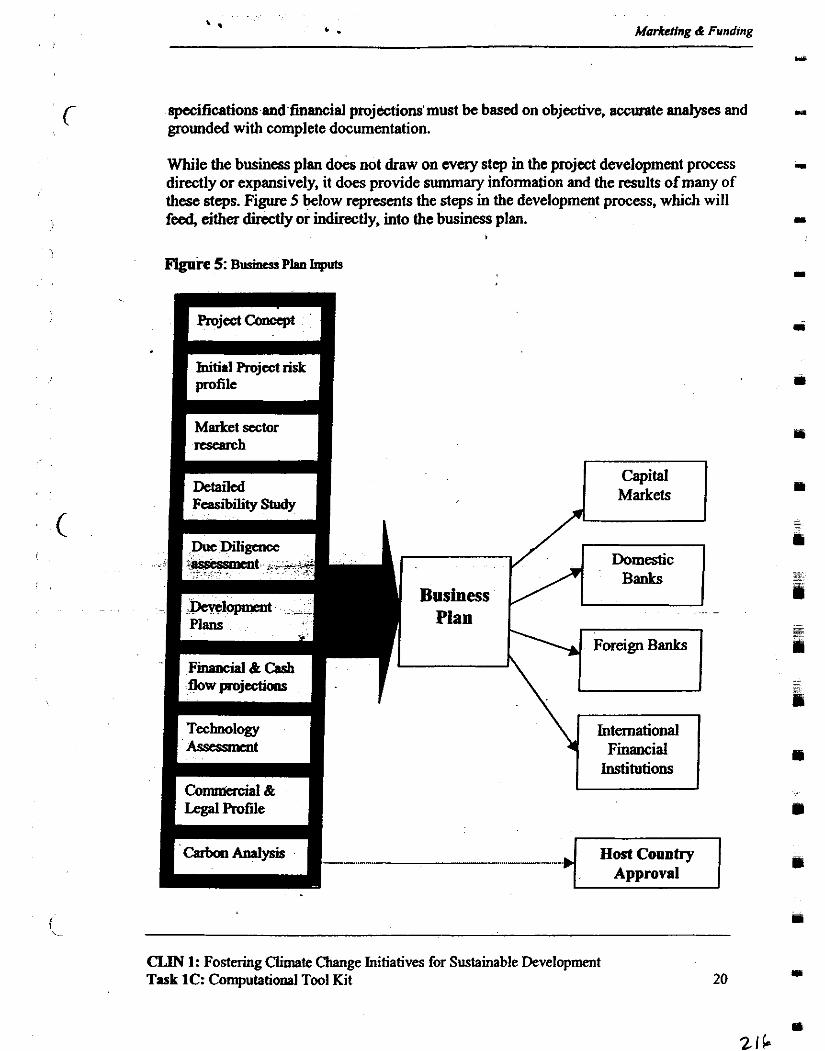
' . . M&Ing & Funding
specifications and financial projections'must be based on objective, accurate analyses and - grounded with complete documentation.
While the business plan does not draw on every step in the project development process 5
directly or expansively, it does provide summary information and the results of many of these steps. Figure 5 below represents the steps in the development process, which will feed, either b t l y or indirectly, into the business plan. I
Figure 5: Burinesr Pkn Inputs I
CLIN 1: Fostering Clitnate Change Initiatives for Sustainable Development Task 1C: Computational Tool Kit 20 D
Concept i
Initial Project risk profile I
Market sector m m h
Detailed Capital Markets Feasibility Study
Due Diligence -
- . Domestic
Banks Business
Pian Foreign Banks
FinancialBtcaSb flow pj&
m
= - - -
m -
a -
- = -
h
01 Technology International Assessncnt Financial
Institutions m
u
Host Country Approval
s
I
Wbar devcbpas bavc mcived an invitation to provide a hmal pmeamh of their project to a Ma, they should s a d a oompleced business plm with an iatrodPday COVQ I*. An investor who is &om about the pmjed will wplt to review tbt business plan in detail bcfon setting up a formal meeting with tbe dcdapcz. Do mi plan to drop off the business plan m paeoa and expea the imrrstor to arrmia it whik ywwait. Also,donotwait~mtilyougdarcsponse~oocfuodat0readthebrrdasc phpahgctoothgs,asmmywill&clinetheprojcd. D e n ~ s b o l r l d p l m i t o d the pahgc to scvad invadosr s i m w , being c&ab to keep deClikd notes of all telephone mils. to whom the package was sent d the dates fbr fob ip. If n mvcstor is btensicd in a project, the developex mud be abk to speak intdligently .bout aay previwsconlacttbeymayh.vchd.
t
Inprcparingam-topo(entidinmdfhndas,itir-topesenta . completcpicturcoftheprojcd,theprojedaparsorsmd~dtbtmrrle(mwhich
thepmjectwillqnxatc Whdhasukingdebtorcquityconhii~armmacial ordcvel~t~mothafiormcialinstitutions.dwbdhathefbrrrjlw~ includes carbon of%& sales or not, Was want to see bad facts as well as pasoorl attributes such as tRCk mxd. qualifidom d dababon
. . to tbe project m term of
swtatorothcrcquityinvested. I t i s~ topixkagethepmjactbr ie fmtbtmos l pmfessional way possible; getting hmding is essentially a saks job d hviog a p r o f ~ ) o d c g o e s a l o n g w a y t o ~ ~ t i d i n v e s t o r ' s ~ d ~ g t h e m t h a t t h e d e v ~ l o p a Q a s a i o u s b u s i o r s o ~ w i t h a m U ~ o r l . commacinlly sh.ong project Tbe folkwing outline cuntnins the main e- of a businesr plan.
, B e Plmr CWine
M i s s i a n w H i r t o r y m d c l m u l t ~ MarkddRodocts Objcdives Company Financials
CLIN 1: Fostaing Climate C h g c Initiatives for Sushinrbk Dc~ laptm~t Tuk 1C: Conpltatianl Tool Kit 2 1
Morbting & Funding
Product or Sewice Descripdon (-2 page) Description of sewice offering Detailed financial projections
rndusny a d Markaplaee An*& (-3 pagesj industry Analpis Markctplacx Analysis Customer Analysis Competitor Analysis
M * g w (-4 pages) Target Market Strategy ProducVSenice Shategy Pricing Seategy Distributionstrategy Advertising and Romotion Strategy Sala Strategy Marketing and Sales Forecasts
MawF=cnt (-2 pages) CompanyOrgmbtion Management Team
The Business Plan outlined above win have to be customized for the given project, but this format can serve as a template that ineludes key information.
If the business plan is wdl--ved and the pmject shows strong financials, then several potential fimders will likely call to scbedule an interview to discuss the project in detail. They will want to see wbo is requesting the money and developers will also want to get a feel for the invartots. Prepare a brief presemtation with visual aids ahead of time. Anticipate questions and plan concise, informative answers. Above all, be relaxed; try to gauge the funders' business objectives and determine how to conduct yourself to best make it easy for them to say "yes."
If investors and funders all had the same capabilities and funding criteria, the p m s of securing funding would be a simple matter. This is not the case, however. Every funder
CLIN I: Fostering Climate Change Initiatives for Sustainable Development Task 1C: Computational Tool Kit 22
will have different criteria, emphases and political agtndas. Evay bank and international lending institution stresses a difierent portfolio m u of working capital lours and investments Thus, it is very important that the project developer conduct enough preliminary research to I) identify appropriate l edr r s and avoid wvting time with those that would not be likely to invest in the project and 2) target the business plan to the specific eligibility crituia and funding -1s of those that are the most likely to invest in the project. The developer's analysis of risk is imporiant here, as the level of risk that is inherent in the CCMP will play an important role in the type of fundcr or investor that the project developer should approach and the type of financial i-ts that will be available.
- There are additional measures that the project developer can take to give him an adgc with potential lenders. These m*lsurs arr by no m a n s a guarantee of suaxss, however, many business professionals have fouml that the following ten rules have helped them to be better prepared to present their projects and deal with the potential pitfalls of securing -s
It is important to note that it may be pobsiik for c k v t ~ to market (beir business plan to fundcrs whose investment cn'texia include the rights to the carbon credits chst result 6om the project and, in this case, your business plan should include a p m p o d financial s t ~ c h t r e to accommodate the purchase of carbon credits as well as the a summary of the
CLlN I: Fostering Cliqtc Change Initiatives for S-k D c v c w Task 1C: Computationai Tool Kit
BEST AVAILABU COPY
I.
Marhetlng & Funding
results from your other toolkit analyses. However, this may not be the case. In many cases, it will not be poss%le for developers to obtain project financing tied to carbon - credits and the proms of presenting the project may have to be q t e d with potential cerbon buyers. While this pmcss is less onerous than obtaining initial seed funding for project development, it still requires a rigorous research and preparation process, which I
will be discussed in the Marketing Carbon Credits section below.
CLIN 1: Fostering Climate Change Initiatives for Sustainable Development Task 1C: Computational Tool Kit
Marketing Carbon Credits
As noted previously, funders and investors will have different objectives and criteria for selecting project investments. It may be in chc best intarst of the project. depending on the individual investor, to bundle the pmject fmancing with tbe rigbts to the rsulting carbon credits, or it may be more advantageous to conduct a sepamte transaction for the sale of carbon credits. Flexibility is paramount - be prrparrd to structure a bansaction with or without bundling the carbon credits d q e d q on the fimder's offer.
I
As international markets for carbon credits mshne, h a m d o n s involviog carbon as a commodity arc becoming more common. Entities tanging from development banks and multinational corporations to i n d w groups and individual investon are entaing this market, helping to solidify carbon as~a legitimate commodity nd stabilize pricing indicators. Interested buyers have taken various approaches to identifying pmjats eligible for investment, and the CCMP developer can enter this d e t with a little market msexch and foresight. Several large corporations and climate change spec if^ development funds have issued requests for proposals for carbon offset pmhaxs. These may be published on the Intemd or coordinated through a financial intcnncdiary such as a brokerage house. CCMP developers may wish to antact a finn with specialized -ces focused on brokering environmental commodities or cooducl their own -h. Genemlly, brokemge h n s will q u i r e a small commission based on the q u d t y and price of offsets soid, plus may charge some analysis fees, dcpcoding on the level and quality of carbon baseline and project case analysis that has been completed prior to this phase of the project pmccs.
In responding to a cabon request for proposal, the developa will geoetally need to prepare a separate presentation document for his poject similar to the "Rojat Brief' shown below. This sample is based on the f-t used by the World Bank's Rototype Carbon Fund, a well-respected and substantial fund, foeused on supporting climate change mitigation projects through the purchase of carbcm offset credits. T ~ K information contained m the World Bank's project brief wii probbly k similar in nature to that which any interested carbon credit buyer would quire . All of the information contained from the Project Brief can be taken fiom the Business Plan and from the carbon rmalyss that have ban completed through each of the olha toolkits.
CLlN 1: Fostering Climate Change ht~ativcs for Sustainable Dcvclopmn~ Task 1C: Computational Tool Kit
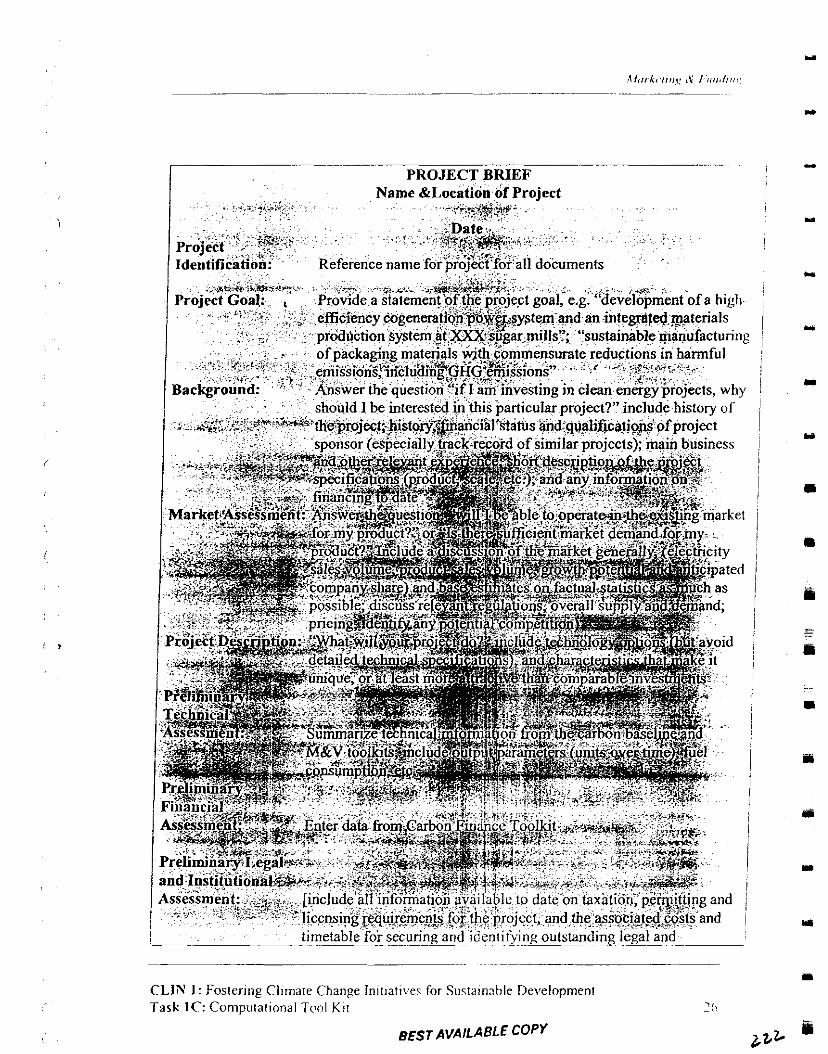
" . . . . - -. . - I . .
. . . . . > . . ' sh&ld 1 be &terest.&d i"this barticular project?'? include histo; of
I ~. timetable for securing and -~~ identiS3ing outstanding legal and -p-- ~ ~~ - -
-~. ~~ p~
CLlN I : Fostering Cl~rnale Change lnitratives for Susta~nnble Development Task IC: Computational Tvol Krr 21.
. ~
BEST AVAILABLE COPY 2th
I
Tbe~providcs8rea~warldcumpkofa CCMPpojedtlmtlmsmaxddIy seaming funding &st utilizes revenues fiom he dc of ~TIJOII anhion rrdPctims as a
h~1998,.ftaprscntinghjsbmioessphato~pohnt*l~tbe prwprieta of Empr*su ESM SA. de C.V. (EESM), 8 start-up Mericro ScniaJ Company, was invited to presart a potential inwslment opportunity to the Emrhoemcn . -. Ell EotapiseS Assirdmce Fund (EEAF). EEAF is 8 mn-pmfit ,, -Openram a vmture capital hml, providing long-term risk cupitll to rcncanMe coagy, &aq m d envhmma~hlly bcncficial pjtcts md busines&5 in d c d q i q count&& T h e ~ j a d i n v o h r e d c n e r g y ~ m e a r m e r i t t w o ~ h c i l i O i a (located m Sonom md Baja California) opaatd by cr;lted of M o f s bm compaaies,CavcarL~uhtamlcModmmu(~p.rcoftbe~hrdad FEMSAOrollp(NYSE:I;EMSA). Thecnagyrdrofitpjedaroaldbe' .' 1 ~ ~ s i n g ~ p a f o m r s n e e c a n ~ a ~ ~ ~ ~ n h i e k t h . t w r r c o m p k t d y n c a O D t b c Matic;mifficicaey& .,A - -
EEAF,intaestcdmtbeprojcctbui " i . r w i t h t b e E S C O m d M ~ ~ _ m r i r k c f c o n t s c t e d E a n a g y I n ~ ~ ~ t i o n ( E I c ) t o ~ a d a d i t i ~ mPlysisof~projcctmddcvdopcrandtode 4 b l o m o o h e ~ o f the investmat
T b c o b ~ o f t b e ~ p F o j e c t w M m n d u c e t b e t m p h b ' r n a g y a e a d r ( b o t b co~lPrrmption ('kwh) md dcmand 0) with two complcmamy .ppoclEber M d s state d i t y , the Fedal El&tricity Conmnssaon . .
(m)emwrnagy needs. FnsteocrgyefficimcrmarsunswaeianaIkdtobcttammrged&hicay&d d m h l g p a t b o m s m d s c u m d , ~ l ~ v a e ~ t o ~ r d i m p w c tbc e- of tbt brewing pmcessts.
T b c p r o j e c t ~ i n v d v a r b d t a R g u L t i a o o f ~ d s c t r i c b d ~ ~ p a L mmmptkmpaiodz Usingdeetr ica laquipmatfot~codingonasapda s t . g g a c d ~ n t h a t h a o s i m u l ~ m d ~ , r a d u o a h e t o ( r l ~ danaad-R&igaathn&dPduriqgsummamonths~~machrrsixixtimesof w i n t a ~ s o t b i p ~ c a n y i c l d s i ~ n ~ hdditioo.EESM instalkd efliciency measllrs in the brewing pnwmcr. iocluding amtmls on moton, fans, pumps and otha c l h c devices, and i m p ~ v e d the efficicocy of back-up cooling
Markcrng & Funding
systems. As part of the load management project, many of these motors can be turned off temporarily without dimpting production.
The project is structured on the basis of a performance contract, under which EEiSM's compensation, m the form of quattcrly lease payments, is dependent on the naiization of energy savings by the breweries. EESM provided tHe necessary enagy audits, engineering, analysis, and design for the project and oversaw the installation of new equipment. .& a result of the project, the brewcries expected to reduce energy consumption by 7% (3.7 million kwh) annually.
I
By tracing the energy savings upstmm to the power plants operated by CFE, it is possiile to determine the amount of fossil fuel consumption that is offset by this project and to determine the magnitude of the carbon savings. These calculations indicate that the project will reduce carbon emissions by 986 metric tons annually over the five-year lifetime of the project for a total of 4,930 metric tons of recorded emissions reductions.
EIC evaluated the opportunities m the Mexican market and the viability of the projects and determined that their small size and low rates of return due to risks associated with investing in Mexico made the projects unacceptable. Risks included Mexico's unstendy financial envhmment and the fluctuating regulatory strucm m the energy sector. However, the oppommity to acquire carbon offsets and to dpmonstrate the viability of incaporating such offsets into a project finance package, impmved the alfmdiveaess of the Mject for EIC. Likewise, the other financing institutions would have been unlikely to help tmderwrite the project without EIC's efforts to package the transaction in a - -- marmiiiq-&tifies and monetizes the carbon reductions associated +ith the project. . Given the existence of USIJI and the value associated with their certification of carbon mitigation projects, EIC wncluded that it was willing to accept the commerciat and potitid risk essociated with the project m order to acquire thc carbon offsets and the &se in designing tmsactiok that result in an in tk t iona l of such offsets. Under these circum&ameq for example, EIC was willing to issue a loan to EESM at a rate of 12 perceot per m u m for the CCM Brewery Project, approximately ten points lower than the prevailing c o m m d rate for similar tmmctions m Mexico. In exchange for offeringlhis concession&y financing for subordinated debt, EIC included a stipulation that assigns it itself the rights to all carbon offsets generated by the project. EIC has also continued to offer its senrices to develop and secure financing for other projects to be included m the Mexico Carbon Portfolio in exchange for the rights to the carbon o& generated by the projects.
CLLN 1: Fostering Climate Change Initiatives for Sustainable Development Task IC: Computational Tool Kit
Thc potential TCV- from carboo ofbets erublcd EESM to ohah ktter hmciug hmrrfortbcsubordhteddebt ~ m d E E S M a n l ~ r r i t b ~ ~ . . a ~ p u r p o s c o r p o n t i o o f o e d o o k o l r w i n g a r b o a d t a , t o ~ t b c c u b o n ~ b ~ t c d w i h t b e p o j c d , ~ w i l h t w o a 4 h c ? a t b t E B S M ~ dcvdaping. This pool of arbon d b is tbm available to my udaam .&Liqe to r c g i s t a o ~ t h r o u g h ~ e x i i i l i t y ~ ~ d e v ~ u n d a t b e ~ CoawntiononQimatcChange. IDA- 1 9 9 9 , E M : m d E E S M ~ t b e ESCOIBmvayprojcctinforrmtioototbeM~mdUS.~~taroapbae simulraoeoushr. Ibe reknnt Mnicll, Govcnnamt authitjcs at INE bave h.vodb
- pjeet are 4,930 mt.
E I C , t h e p r i m u y U S ~ t , e n t a r d i u t o m C d c v ~ m d ~ o f t b e EESM projects with thc asmpth tht of the arbon d i s will brve a fubnevrlue. E I c p o v i d a i ~ r p b o s d i n r t e d d t b t ~ f a t b e C < M BmvayRojcctmdp&tdcvelopnentmdfinme*lcdvisorysaviccsfa~ projactsas"inWsavi0Cslmdcrthe %XI t h t these mv- and a r n a s s i o m w i n b a v e a f i o m L l ~ m t b t ~ c a r b o n m p t e c .
U n d a t h e t a n r r o f t h e c o a t n d ~ E E S M m d E I C , E I C i s a ~ ~ o f tbearbonaadits,arhiebmaybcbadcdordoldmtbcfuhtn.'IbcclrboapucbsaniU . I s o b c n ~ m d a a p r f o r m m e e W ~ ~ l l t n c t t o b d p ~ t b t r b t t h . l t b e o f E p e g n e m t ~ o a ~ a m t h e ~ . m a m t r ~ i n v a r c d h t b e p o p d basal oo m estimrted future d o c of ca&m acdits gmuated by tbc proj&l DetiPay d paymeat of tbe carbon credits wiO oew u p d y to reduce r " COCLI. F'anncnt ~-aiili-*-tbc mvinep &&tiom d the comswoltinn cmisioap
A diagram on the following page sbows tbc structure of the !hamid a-1 qplicd totbcBrewaiespmjed.
"I CLINI:Fost~ClirmicUtaagcY~faSurtninrMcDcvclopDcnt L Task 1C: Cbqnmhd Tool Kit 30
I
Marketing & Funding
o Channels selective GEF concessional support only to projects that require assistance
o Status - Equity fund fist closing achieved at USS65 million in March 2000; debt facility and GEF co-financing in place; looking for projects!
Small and Medium Scale Enterprise w) Progrmn , o USS2l million program to provide contingent, concessional loans to financial
intermediaries (Fls), which then on-lend to or invest in SMEs o FIs include both NGOs and commacial enterprises o Incentiveqfor FIs to seek npayment h SMEs a 10 FIs selected to date - USS6.3 M approved
Sdar Development Group o Exclusive focus on Rural I?V Solar Homes Systems (SHS) in Emerging Markets o $50 million Target Initial Capitalization o Private, Stand-alone Entity with Finance Window ($32 million) and Business
Development Services ($18 million) to local PV companies. o Initiative launched by World Bank, IFC, GEF and U.S. Charitable Foundations as
Potential Founding Investors o Status: Active fimdraising continues; business advisory work underway
Efin'ent Lighting Initiatiw 0 o aims to overcome the barriers to efficient lighting technologies in seven
count+s ~~ ~ o . ;ELI'sp-wes: .'.. :.? . ., , USS15 in GEF funds ~ ., .
' 0 E W s ' h d e t interventions: Product quality standads & labeling . - - ~ - ~, ~ ~ ~ . ~. . . . .- - - - Picinl? ~nbl ic education Tramactionsupport Market aggregation
EastAsiaandPdc-t Internatid F i Corporation 2 12 1 Pennsyivania Avenue, N. W. Washington, DC 20433 USA
Telephone: (202) 473-0400 Fax: (202) 974-4340
The Director of the East Asia & Pacific Department
I
CLIN 1: Fostering Climate Change Initiatives for Sustainable Development Task 1C: Computational Tool Kit 33
is Mr. Javed H d
SOuthAsLDeputmeat Intanrtioud Finance Corpontim No. 1 Panchsb&I M;ug
NewDeIhi 110021 India
Thc M a of ibc Soutb & Southst Asia Dqnrtmcnt is Mr. Banard Pksquicr.
World Bank
T b e P C F i s ~ ~ t o . c b i m a b P l m a d p a t f o l i o ~ ~ m d technok~&AI~- Approxbatdy half of tbc inv-ts wiU be mdc m -in- Trmrieiard "gJ/mdbnlfwiUkmrdcindmlopiqg&hcititrtiqgtbe C D M . . T b c m a j o r a o p h s i s w i U b e p L c c d c m ~ c m a g y m d r m a g y ~ pjects, which have a great po&atid f a qkaion md for roduciog climate change u a xasombk costcost
m o To damr&&e how JVCDM jmoje~s can promote SD o T o p o v i & ~ A r t i & t o t b c U N F C C C a n o p p a t u n i t y t o ~ y ~ " o T o p . r t n c r w i t h p l l b ~ m d p i n t e ~ t o m o b i l i z e ~ ~ ~ ~ ~ c i i i
changemi~mdbddconfidawxmh.de . . dominat#lbypivateclpit.1.nd mtamahes
CLIN1:FostaingClhnrceChrrgchntPhva . . . f b s u s t a i m b k ~
Tmk 1C: C - d T d Kit
Morkrfing & Funding
Oversear Private Investment Copration (OPIC)
The Overseas Private Investment Corporation is an independent U.S. Government agency that encowages mutually beneficial direct U.S. investment in developing countries.
OPIC assists U.S. investors in renewable energy projects through three programs: financing investments through direct loans and loan guarantees; insuring investments against a broad range of political risks, providing a variety of investor services, including advisory services, investment missions and ou&eack
I
OPIC's loans and loan guarantees are extended in the form of project hancing up to a maximum amount of $200 Million USD. Project evaluations are based on the viability of the project. The project must have adequate cash flow to pay all optional costs, to service all debt and to provide the investment owners an adequate return.
OPIC can provide a major portion of medium- and long-term h d s for financing in countries where conventional fmancial institutions are often hesitant or unable to lend. OPIC programs support private sector investments in financially viable projects. They do not offcr concesiod tams o h associated with in--government lending, nor do they finance export sals unrelated to direct investment.
c Under certain circumstances, OPIC may pwhase equity in a project, including conve~tible ~. notes and other debt instruments with equity w-cipating features. The terms
. .~ ~- - - . . . . . .
-thcwject to the development of the host country, the financial requirements, and the distribution of the financial risks and benefits among the investors and lenders.
v
Potential project develops tbat wish to obtain financing should provide a copy of the business plan of the mcmsed moiect to OPIC. This business ~ l a n should serve as the - - basis for &eA eliebihy. It should also provide the tams Ad amount of the requested financing. The following information should be given to OPIC, including:
0 A gened description of the project 0 Identity, backgmd and audited financial statements of the project's proposed
principal owncrsandrmlagement o Planned sources of supply, anticipated output and markeb, distniution channels,
competition and I& basis for projecting market shaw 0 Summary,of project costs and sources of procurement of capital goods and
senices Proposed hancing plan, including the proposed amount of OPIC participation
0 Brief statanent on bow the proposed business will contribute to local economic and social development.
CLIN 1: Fost'ering Climate Change Initiatives for Sustainabk Developnent Task 1C: Computational Tool Kit
Conlad: Owrseas Priwre 1 ~ h n e n 1 Corpomtion I 1 0 New York Awnue, NW Wmhington. D.C. 20527 Tel202-336-8663 Far. 202-108-5145 Ar fami ie East Td: 202-334-8589
US. TropC a n d ~ o p e w Agency OVA)
1 t r b o a l d k . d e d t h a t T D A o l l l y p m r M a M n g U t L a t b a ~ t p o t a t i . l for US. Exports to the project.
Tbe IDA supports fessliility shdies for tbc dev- of proj&tsm dcvdoping countries, which present significant oppxtmitk% U S s u p p ~ ~ ' ~ b t ~ o f t b ~ ~ ~ ~ ~ k ~ t b e h O S t g o ~ t t ~ ~ t b c ecommic and technical viability of a pojcct with tbe .ppkAon of US. teEbDdogy. F c a s i i shdy contracts are awar&d to Uoited Sertes a q m i e s which sllbmic bids in rr~ponsctotbcseso~icitatio~; t h e b o s t g o v a m m t i s ~ i k hrd&tiqgtbc whming firm. F c s i i i t y studies for public-scum pmjcdJ rppod by the houi pwmma~twiibefimded 100pacentbytheIDA. Typialgnotr~inrisefram S30,oOO to $2 million.
'IbeTDA.IsohswhatisImom.stbe~~Fuod"mplrce.tdMoltilrtarl DevdopnmtBanks. ' Ibcscfunds,ma~attbelotaAmcrianDcvdoe;ocnt Bank, t b e W o r M B a n k ( l B R D ) , T b e ~ F i n m e e Bank for R- Compmiestbatbavewon f e s s l b i ~ s t u d y ~ f o r p o j e d s t h t a r b b c f i m d e d b y the MDB are digiile for this assistance.
Gm&d: US. Trade mul Dorelopnen~ Agocy 1621 North Kent Smcl Sldtc31)9 R O S S ~ VA 22209 Td 703-875-4357 Fax: 703-8754009
~ ~ E n e r g y ~ i ~ S v p p o r l W = ~ 1 ThtRmewableEmrKyProjectS~Of6ccsarca~netWatofoau- goy-
. . tbrtprovidci&bnial.ndhnmchlnpport~rn.Sdst firms m idarEifyiog appalmities for tmcwable anagy prvjds REPSOs briqg rbout the use of renewable energy techoologia for nnal cnagy + p l y m dm- colmhies. REPS05 are W e d by USAID and local ofices mmaged by Wmock tntanrtioorl.
C L P T I : F o s t a i a g C i i m a t c C b m g e ~ f o r Task 1C: ChqmWional Tool Kit
-Dcvtlapmcd 36
Morketlng & finding
REPSOs can provide resource and market assessments and identify potential sources of project financing. REPSOs also offer private pmject developers cost-share funding of up to 50 percent of the cost of a pre-investment study.
C o n w : REPS0 - India P. 0. Bar 8808 7, Poom' Mag, Vastant Vihr NewDehli- 110057, India Tel: 91-11-687-39?7 Far: 91-11-687-6004
Asian h l o p m e n t Bank (ABD)
The Asian Development Bank (ADB) is a major lender for infrastructure projects and environmental development in Asian countries.
The ADB follows strict International Competitive Bid (ICB) guidelines for public sector projects. ADB has also had experiemce in private sector projects such as those involving small regional entrepreneurs, w h m ADB's participation has not been greater than $5 Million. To fit the ADB's criteria, projects must be targeted to member countries end must be approved by the planning and finrmcial authorities of the host government. This approval will be confirmed through consistent discussions between the ADB and the host govexment.
&<
-??'**;I z'. - The bormwa is d l y only permitted to draw on the loan m orda to meet expeum'tuns associated with the pmject as they are incumd. In tbe intearst of economy the ADB rereqq&-at borrowers seek competitive bids from potential suppliers in member countries, eDgineaing plans be drawn up hdepemdently of the suppliers and, if appropriate, independent consulting engineers be retained by the borrowers.
Except in specid chmstances, the ADB requires that the procaeds from loans or other ADB financing be used for only the procurement of goods and services produced in member countries. ADB adjusts its variable lending rate each year in January and July.
ADB lends to both public and private entities. ADB will take equity interests to m u r a g e the jinancing of private sector sources in developing countries. The ADB will also participate in sector and cross-country loans and equity financing.
The ADB has a $150 million loan in the final stages of negotiation with the Indian Renewable Energy Development Agency Ltd. (IREDA). The lREDA loan will target wind, -gemation, biofuels, and solar projects, although all renewable energy projects will most likely qualify.
In order to apply for project fjnancing the following should be submitted:
CLIN 1: Fostering Climate Change Initiatives for Sustainable Development Task 1C: Computational Tool Kit 37
0 The proposed h w a s business bistary o Rojd -on md opeamtion plas o Feasiiility studies, prc-invcstmcat surveys md ply otbcr tcehnial and 6nmd
b b i i i t y information o Amountofhrcquestcdandtbeprojectcost~tca o ~ d p c r f i ~ t e s m d w h d o w ~ j a a i o l u o Value and volume of u m d srla
Gnuad: Asion Dedbpmeni Bank 37 COyLink P.O. Box 3019. Lodi Road HPQ N o u m 1 1 0 0 0 3 , hdio Tek 91-1146%2578 F a : 91-11-463-61 75
Photovoltaic MarkcC Tnnsfcmuhn Initiative 0 is a S25 miltian GEF-apMid fmd&dqdbytbeintarat;nrulFinmr
nstiolnlde&catility:ONE,k.~povcditsownpdcipatim'IbePVh47lfrmd omuaga is Impax Capital, .long with IT Powa.
G n l t ' u i : I m c ~ l b l p o r ~ * r r l C a p o m r i o n L f d , Bnnighton Horg 6-8 Suchville %,
Lmdon WIXIDD. VK; Td: +I4 (207) 434 1122; Fax.*+# (207) 434 1123;
e0.d n&sit2: h l t D : / h . ~ c o . u k
n e f . . - n Fvnd/r M o p i n g CoMDia (7FlJ cad F d f b EnugingM;ontctr
nK- . . . ~ f o r D e v ~ C o u a t r i c s ~ h l ~ t F d ~ C c o E r r l and Eastan Europe (I@), and Invcstmeot Fund for Emcrgiog Markets 0 me thc Danish govanmcnt's international investment The thru fimdc s h e thc same
C L M l : F o s t a i n g ~ ~ ~ t t t i v a f a ~ D t \ r d a p m c n t Tak 1C: Computdooal Tool Rit UI
MarWng & Funding
boards of directors and management. I N , the oldest and largest of thc three, provides equity, debt, and guarantees, and assists in mobilizing supplementary financing from other sources for projects in all but the poorest developing countries. It generally participates as an equity pertncr, providing up to 30% of the equity. It can also provide loans up to 25% of total project cost including working capital. It invests in both large and s i l l projects, including pilot prqjects, i d offers advisory services in the prepamtory.and initial phases of investment projeck..
IPI w& along the same lines as IFU but only in Cedtral and Eastern Europe. l t is among the biggest fonigq investors in Poland and has an office in Warsaw. I0 admhisters a special Environmental Investment Facility (MID) in cooperation with the Danish Miistry of Environment and Energy. W operates in the poorest developing countries, which are not eligible for IRI or I0 financing. It co-finances start-ups as well as expansions and privatizations, pmwded that Danish companies participate with financing and management. IFU has regional offices in India, China, Zimbabwe, and Mexico.
Contact: LFUa! Bremerholm 4, DK 1069 Cbpenhagen K. Denmark; Tel: +45 (33) 63 7500; Far: +45 (33) 32 2524; emaiLr: @[email protected].&
[email protected] &[email protected].&
.-httvr//www.ifL.dk I
. . ~~ ~~
. .
.... ~ . ~
Export-Import Bank of the United States (Ex-Im Bank) is tbe U.S. Govamnent export credit agency. The Bank facilitates shoxt-, medium- and long-term financing to creditworthy international customers to purchase U.S. goods and -ces, and short- and medium-term export credit insurance to enable U.S. firms to extend credit directly to international customers. There is no minimum project size.
The Bank is interested in, and has actively supported, clean energy projectr. including the establishment of a $100 million sustainable energy window for China. In addition, it has a policy that allows it to provide concessional f&ming on a case-by-case basis to renewable energy exporters, among others, in order to match the concessional terms provided by other aport aedit agencies. Another U.S. agency, Overseas Private Investment Corporation (OPIC), provides political risk insurance, loan guamties, and
i direct loans for small businesses. Under its U.S.-A6ica Sustainable Energy Program. -,
1 1 capomred with the U.S. -ent ofEnergy to advance clean energy, OPIC has given the region priority in its programs, including a small grant fund for small
' C businses and mu-governmental oqpht ions .
i CLIN 1: Fostering Climate Change Initiatives for Sustainable Development
, \, TJS~ IC: Cwnputatiml Tool Kit 39
Contod: Craig 0 'Carnor. Enrironm'?ntaILia&on OJicer, Er-lm Bank, 811 Vermont Avr M, Washington DC20571 USA Tel: ++I (202) 565-3946; Fp~r +I (202) 565-3380.
Cornmemid Fanding Sources
Global l h i n m m m F d
c Global En- Fund, not to be confused with cbe multiLtcnl Glow Envimma~t Facility (GEF), is a venturr c q i d fimd m g e r with ova $2.50 millioo unda
CLIN 1 : F o s t ~ ~ C J m t g c I n i ~ ~ ~ k D m l q m r m Task 1C: Conq!ut&ad Tml Kit
Marketing & Funding
management in four funds and ~rivate asset accounts focused on public and private equi&invcstments in emergingmarkets. Two of its funds, ~mer;n~ ark& Funds I and II, invest in renewable energy, among other environmentally oriented projects.
Contact: WendeIl Robinson,
1225 Eye Street Suite 900, Washington DC 20005; Tel: +I (202) 789-4500; Far: +I (202) 789-4508; emaiI: recegtion~IobalennronmenHlnd.com
Nuon is the largest energy and water utility in the Netherlands and one of the largest clean energy providers in Europe. It has set an ambitious goal of generating 10 percent of domestic power salts from renewable energy sources by the year 2010. Nuon bas expanded its domestic investment philosophy to overseas markets, where it is pursuing clean energy equity investmeats in both industrialized and developing countries, including a wind fann in China, a nnal electrification and photovoltaic solar home system business in South Africa, and its recently-announced $53.5 million equity investment in the Green Mountain Energy Company in the United States.
Contact: &' b .&edm&m, Director, NUON Renewable E-7- U . Posthu 9039,6600 a Arnhern, Netherlaan&, .. . . ~~ . TeI:,+31 . (26) 377 2143; Far: +31 (26)377-2186 -- - . . - . . . .- -
Triodos Bank
Triodos Bank is a Dutch bank that offers financing to businesses with social and enwomnental objectives. In 1996, it organized and capitalized (and now manages) the Solar Investment Fund (SIF) to pmvide loans and guarantees to intermediary institutions (e.g. credit unions, utilities, wn-govenunental organizations, and equipment distributors) which m bnn sell or lcnd to buyers of photwoltaic solar home systems. Triodos is also a m-investor/manager in the Solar Devclopment Group. In addition, it manages The Wind Fund, which invests in wind project in the U.K., and the Triodos Greenfunds, which lbance wind projects in I l e Netherlands. The bank is preparing to launch Triodos Venture Capital to provide equity to renewable energy companies in Europe.
Conraci: Ham Mut, Project Manager, Triodes Bank, Uirechiseweg 60, P.O. Box 55,
3700 At3 Zeist l3e Netherlands;
CLIN 1: Fostering Climate Cbange Initiatives for Sustainable Developmt Task IC: Computational Tool Kit 4 1
M ~ b a D u t c h ~ b . n L p r 0 ~ ~ ~ ~ ~ d . r ~ d a r m g i a e c o m p I c x f i a m c k l t r m s r c t i o n s . I t a n m a l ~ ~ m ssd-backed md project lbmcc. M-s Global Energy Finmce Gropp provides a q l U c pschgt of commcrckl md mveshnent banking saviccs, inclpdiog
--Tz ~ m d a a r r i t i q g , m d ~ t i n g m ~ ~ d prOjtdfiMoc& ~ i n t a l d s t o b e p m t i c o l a l y J c t i v c m t b e ~ d shudwhg of projact 6nmSq f a wind power projects.
Conrcrcl: McaPirnon at P.O. Bar 243.1000 AE, Amst&; Tel: +31205279111; w r b s i i c : ~ : / ! . ~ - e r s o n . c o n J
Ma-Fo~dElec Eoagy JXkicncy a d Emissim Reduction Fbnd is a 70 mgioo am, a g P i t y f u n d ~ ~ b y t b e ~ ~ f a ~ d D R d o p m c d ( E B R D ) t o ~ v ~ c n a g y c f E i c i e n c y d r c d u c t ~ ~ r m ; r c i r u l c b p ~ d ~ ~ T b e f u n d i s c a p i t . l i z a d b y t h c E B R D , D c x i . ~ d d Japauesc and is managed by FoodElec, a private equity fund ~-16rm . .
- ; ; ~ f i m d i s f o a r d q g o n m a g y s a v i c e c o m p . n i c s ( E S C O s ) , ~ . . - sysrFmr,d "%mbinaf -., b a t mdpwa(C)FP)pr0~
- - --- - - . a-,L--7 -- -- - - -
LrrmmrccM~arFmnciPaoHoywotF~ccC~,l~~, 333 Lakuow s-ed, stm$ord. CTlm902 USA; Td +I (203) 326-4570; Fax: +I (203) 326-4578; d : ~ a m l
'1hiss4omi1liondund-aeatedto~vi&hdimr~-~apit.ladwces t o U . S . ~ l o g V m d ~ ~ I t i S t b e ~ v a l t u r r c a p ~ C l l D d ~ ~ ~ prcsencc in tbe United Shta md Ikir The fund makes equity md aqaity-rchtcd invstmcnts m arfy stage opxbitics, inchding a small number of start-up aqmtics. lky.Isomvdmlrtastagecompania f h a t . r e t w o t o ~ ~ a w a y frombcing Wkh quotrd
CLIN 1: Fastaiug Climate Chmgc h i t k t k s for Sustairnbk Dcvclqnm!td Tnk 1C Carpllatid Tool Kit
Marketing & Funding
San Francisco, CA 94105 Tel: 415-284-8696 Fax: 415-284-8132
IDBI
Tbe IDBI is one of the leading lending and financial institutions in India. It was cstablisbal in 1975 as a wholly-owned subsidiary of the Resave Bank of India and ownmhip was transferred to the government in 1976 after guidelines on the entrance of new private sector banks were issued. In 1982, IDBI m f e r r e d its International Finance Division to Export-hpott Bank of India.
IDBI's objectives for growth include building on its project financing successes and entering othcr wmpatiile business operations as well as positioning itself among top d d o p m e n t financial institutions of the world.
Contack WBI Ltd
c IDBI T o m , M e Parade Mumbai - 400 005
JCICI's main function in the Indian capital markets is to provide financbg fix forindustrial companies. 'Ibis is typically in the form of wrporate term loans and project finance. Project loans are typically 5 to 7 years in duration, and therefore may be somewhat diflicult for CCMP developers to accsr as sourcea of debt. The banlt usually only knds up to 60 percent debt on total project costs, requiring the rest as sponsor's equity. ICICI has been lend~ng to energy sector projects for the past over 20 years. ICICI can provide financing in both rupee and foreign currency.
C b m ICICI Ud. <
ICICI Towers, Bandra-Kuria Complex B a h (East) Mumbai 400 05 1 Website: http:/lwww.icici.comI
' c FCI, which was created by the Indian government in 1946 as a development bank, has since evolved into a commercial bank, which provides term loans as well as project
CLM 1: Fostering Climate Change Initiatives for Sustainable Development TnklC: Computational Tool Kit
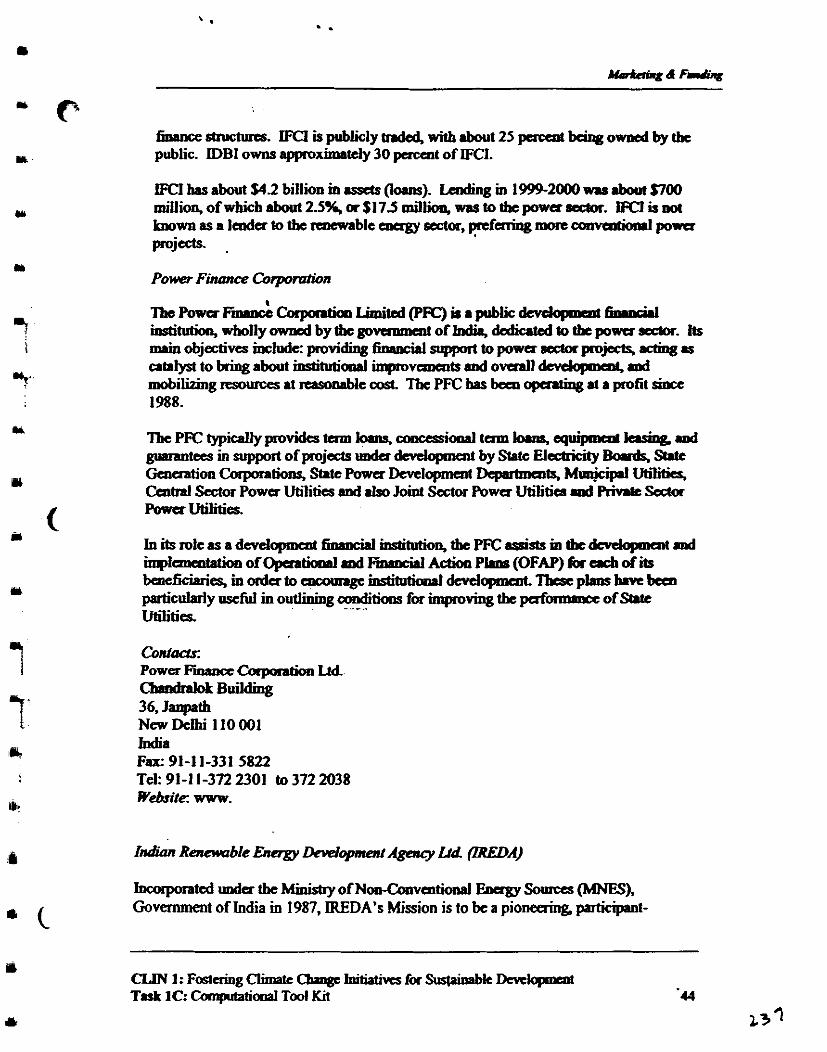
6 a a n c e s h u c ~ I F C l i s p u b I i c l y t n d a d , w i l h . b w t 2 5 ~ ~ o w n c d b y t h e public. IDBl owns approximately 30 pacent of IFCI.
IFCI has about $4.2 billion m es&s (loam). Leading in 1999-2000 wu about $700 milion, of which about 2.5% a $17.5 m i l h was to the p o w seem. EU is wt known as a Ida to the noeaable awrgy sector, prefa~& more collvmtioml power ptoj-. .
main objectives include: &vid& fimmd supper( to powa ECUCW prim wtiog rs catalyst to bring about instiMid inprovcments and o d dcvdopmcnS md mobilizing rcsource~ at masamble cost. l'k PFC bas been opuahg at a p f i t siact 1988.
pmauteei in sup&t of projects lmda dmlopaent by stltc EICC&& SElPe Geoaation CQIPX~~~S. State Power Dmlo~meat Dcmma~g MIlniciprl U t i i Cenbal sector power Utilities and also Joint &tor Po- Utilitica m d - h Soda Powalwties.
In its rote as a dmdopmcnt h a n c i d inrlitution, tbc PFC in the dcvdqment Pd blcment.tiOn of <)Dentiooal md h a o c i d Actioo PLns (OFAF') Tor acb of its
Corn: Power Finamr Cupomtion Ltd c h i d d o t Building 36. J q I New Dclhi 1 10 001 Mia F= 91-1 1-331 5822 Td: 91-1 1-372 2301 to 372 2038 website: www.
Jncapomtcd unda thc Minishy of Noo-Chv~~tional Eocrgy Somees (MWS), Govermnent of India m 1987, IREDA's Mission is to be a pioneaing. pmkipnt-
C L I N 1 : F o s t a i n g C l i m a t e C b m g c ~ f o r ~ k D m l o p m c n t Task 1C: Cmptat iod Tool Kit -4.4
~ 3 '
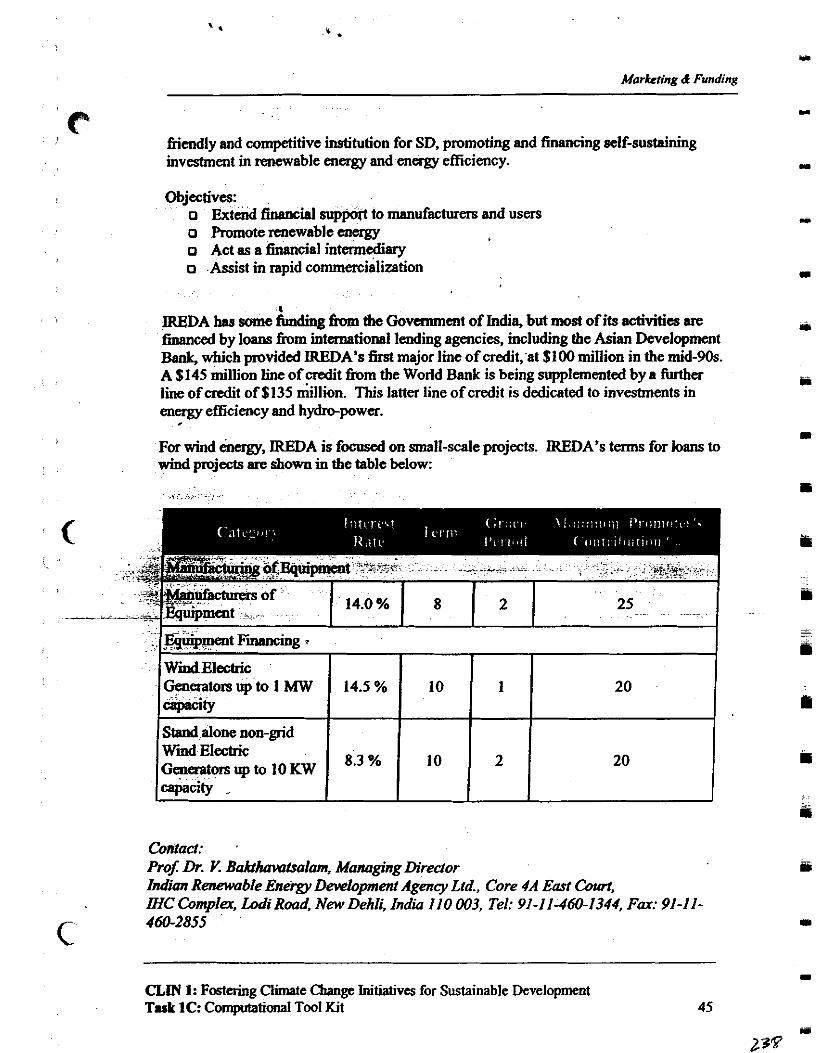
Marbring & Funding
fiiendly and competitive institution for SD, promoting and financing self-sustaining investment in mewable energy and energy efficiency.
Objectives: o Extend financial support to manufacturers and users o Promote renewable energy o Act as a hancial intermediary o Assist in rapid commercialization
8
IREDA ha8 some funding from the Govamnent of India, but most of its activities are financed by loans from international lending agencies, including the Asian h l o p m e n t Bank, which provided IREDA's first major line of credit, at $100 million in the mid-90s. A $145 million line of credit h m the World Bank is being supplemented by a M e r line of credit of $135 million. This latter line of credit is dedicated to investments in energy efficiency and hydmpower. . For wind energy, IREDA is focused on small-scale projects. IREDA's terms for loans to wind projects are shown in the table below:
Contact: Pro$ Dr. Y. BakhwztsaIorn, Managing Diredor Indm Renewable Energy Development Agency Ltd., Core 4A East Gnut, IHC Complex, Mi Road, New Dehli, India 110 003, Tel: 91-11-46c1344, Fax: 91-11- 460-2855
WindElechic Gemaa to~~up to lMW W t y
Stand alone non-grid W d Electric GeneratmuptolOKW capacity -
I
CLiN 1: Fostering Climate Change Initiatives for Sustainable Development Task 1C: Comptational Tool Kit 45
I
14.5%
8.3 %
10
10
1
2
20
20
I
C
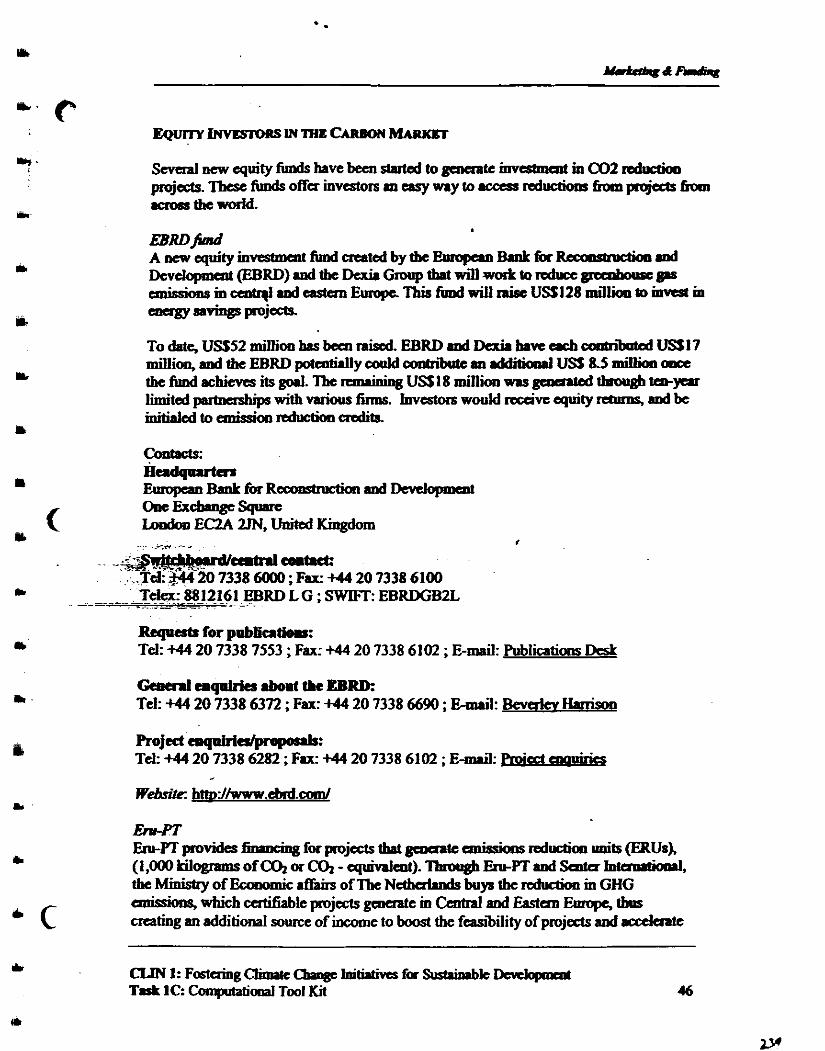
S c v a a l n e w q u i t y f i m d s h a v e b a c n ~ t o g a # l u i m r ~ m C O Z ~ projects. These fimds offa investors m easy way to .eeess duetiom 6um projects 6w1 .arwcitheworM.
Tod.te.USS52millimhs~Rise&EBRDmdDexkhmacb~baadUSfl7 million, and the EBRD p o t e d d y amid amtn%utc rm dditionrl U S 8.5 m i ance t h e f u n d ~ h i m s i k g o r l . T h e r C r m i n i n g U S 1 8 m i l l i o a ~ ~ ~ ~ y c r r limited pirrtmships with rariouJ fimrs. Investors would r&dn equity rchlms. md be iu i t i a l cd tocmis s ioa~end i tk
Contacts: ir-e-r- Ehqcm Bank fbr R-on and Lkv+mmt -EXcbmgt- Looaon EC2A 2JN. United Kingdom
Rq€lestr for pab8k.tk.r: Td: +44 20 7338 7553 ; Fax: +44 20 7338 6102 ; E-mail: Publications Desk
Geacnl cquhka .boat tk EBRD: Tel: +44 20 7338 6372 ; Fax: +44 20 7338 6690 ; E-mail: Bevrrkv H m k m
bi=tW=@W-'= Tef: +44 20 7338 6282 ; Fu- +44 20 7338 6102 ; E-mail: poiad . .
En-PT EntPT povides fhmciq for pojeck tht ppaak clnissiom reduction unik (ERUs). ( 1 , m l c i l ~ o f a o r a - ~ ) . ~ E N - P T m d S c n t c r ~ , tbeMinistryofEconomiclffairsofTkN~buvrthcrcductionmGHG aukbm, ;rvhieh catifiabte pjccts g e e in Gmtd-and Eastan Emope, thm creating an additional source of im*nne to boost the feasibility of projeck and rccdartc
CLIN 1: Fostering Cthnrtc C h g c IaiPidves f a htakbk D c K w Task 1C: Compdabooal Tool Kit 46
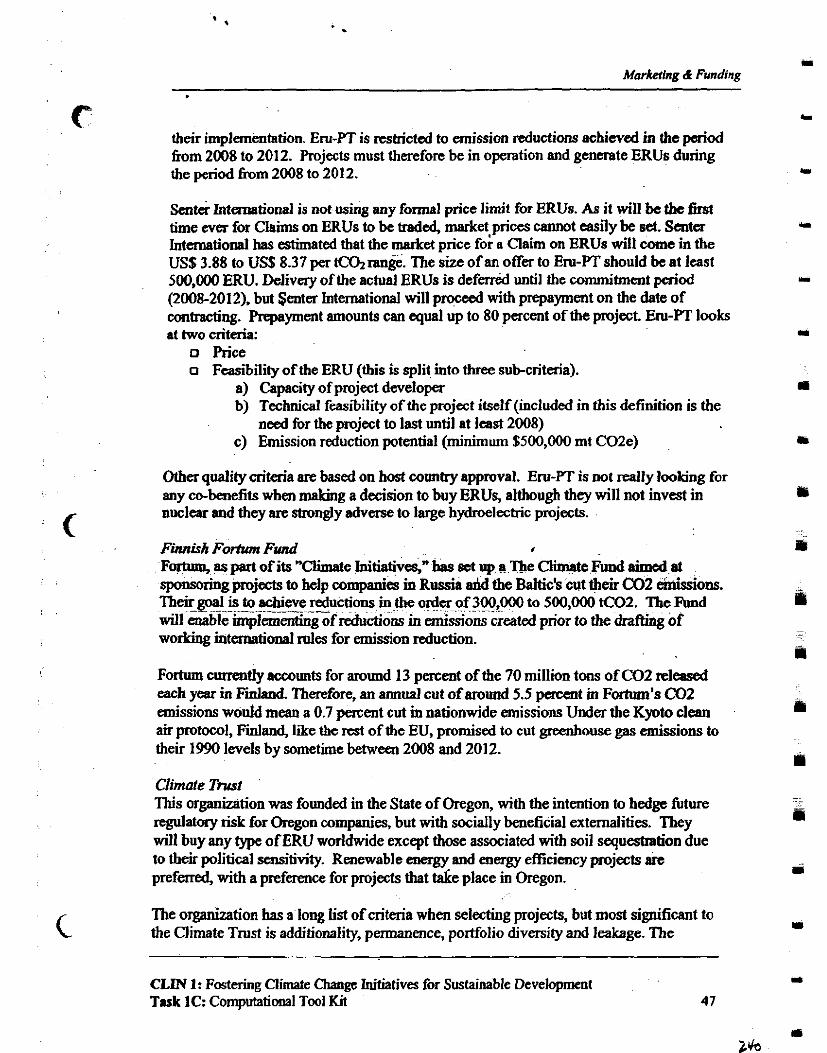
C Marking & Funding
their implementation. Em-FT is restricted to emission reductions achieved in the paiod h m 2008 to 2012. Projects must therefore be in operation and generate ERUs during the period h m 2008 to2012.
- .I
Senter Intanstional is not using any formal price limit for ERUs. As it will be the first time ever for Claims on ERUs to be traded, market prices cannot easily be set. Sentcr II
International has estimated that the market price fo; a Claim on ERUs will come in the USS3.88 to USS8.37 per mran&.. The size of an offer to EN-PT should be at least 500.000 ERU. Dcliveay of the actual ERUs is deferred until the commitment period II
(2008-2012). but sent; International will proceed with prepayment on the date of contracting. Prepayment amounts can equal up to 80 percent of the project. EN-PT looks at two criteria:
o Price o Feasiiility of the ERU (this is split into three sub-criteria).
a) Capacity of project developer b) Technical feasibility of the project itself (included in this definition is the
need for the project to last until at least 2008) c) Emission reduction potential (minimum $500,000 mt COZe)
Other quality criteria are based on host country approval. Em-PT is not really looking for any *benefits when making a decision to buy ERUs, although they will not invest in nuclear and they are strongly adverse to large hydroelecttic projects.
Fortum, as part of its "Climatc Initiatives," has set up a The Climate Fund aimed at sponsoring projccts to help companies m Russia lnid the Me's cut their C02 emissions. Their goal is to achieve reductions in the orda of 300,000 to 500,000 0 2 . The Fund will enableimplem&gof reductions in emissions created prior to the W g of working international roles for emission reduction.
Fortum currently accounts for around 13 percent of the 70 million tons of COZ released each year in Finland. Therefore, an annual cut of around 5.5 percent in Fortum's COZ emissions would mean a 0.7 percent cut m nationwide emissions Under the Kpto clean air protocol, Finland, like the rest of the EU, promised to cut greenhouse gas emissions to their 1990 levels by sometime between 2008 and 2012.
Climate T m This organhtion was founded in the State of Oregon, with the intention to hedge f h e regulatory risk for Oregon companies, but with socially beneficial externalities. They will buy any type of ERU worldwide except those associated with soil sequestration due to their political -tivity. Renewable energy and energy efficiency projects are preferred, with a preference for projects that take place in Oregon.
The organization has a long list of criteria when selecting projects, but most significant to the Climate Tmst is additionality, permanence, portfolio diversity and leakage. The
CLIN 1: Fostering Climate Change Initiatives for Sustainable Developmen1 Task 1C: Computatiorral Tool Kit
~eTNstiSwilli~topya~~rmfiw-&trthl.dbaetotkncritah. Any ddiriwal quality aita* would be noted, but would inaase tbc prica pid fb ERUs. 'Ihcsc-00-bcnefits arc Considcrad tidxcaka aitaia. l k y u c praently looking to buy ERUsmtheprioe~agcofS1.00-SS.00pcr~.
coiltag: MikcFbtmq ExdvcDirector Telepboae: 503-238- 191 5 Climute Trust W: -tdnetorg 516 SE Morrison @md, Suite 1200B Podand. OR 9721423% wcb: www.clilMtctnstorg
'Ibc KER-exchange is a pilot private cxhngc qnnanhg I d e s of ERUs 6mnr a d l setoftestpi&tg ~ ~ i S m g i v c . l I U C c k . r p i a ~ f i J r E R U a 'Ibccx* g c o a t c s c a t i f i c a t c s f o r ~ ~ o u t t o 2 0 1 2 . Tbeauprityofhdeshvebam ~~betwanmmpaniainWcstanCmd.(KEFIfacilitaicdtbcraaot~ b e ( w ~ T r a u 3 A h I d ~ ~ ) . K E R s I a f f s t 8 t e d t h . 1 ~ f b t r d a h v e f h n ~ 1 ~ U S S 1 . 0 0 - 1.50patCOZ. Ibykiieve~myereditfaarty.ctioll
ConUrei: Slrite 200,105520. ~ v e . N.W. agpry, Alberta. - TW 1m Phone (403) 21CL2144 Fax: (403) 282-3323 Websitc b t t D J / w w w . k ~ u c ~ . o o m l
;odoee&iution and stimulate markets ~b pkjcd~ tbat involve tbc acquisition of& pollution emission allowaoccs ERT .Is0 bas hditaial emissions allowance
C L M 1 : F ~ ~ ~ ~ f a Task 1C: CooquWimal Tool Kit
-DcvelqmDt a
Marketing & Funding
transactions, such as the carbon dioxide (COZ) s u l k dioxide (S02) swap between Niagara Mohawk Power Company and Arizona Public Service.
Canada has been identified by ERT as a higher priced market. These prices tend to be higher than those in America because of overt government backing (although here aren't any fked laws). This can also be associated with hieer willingness to pay in buyer behavior and is most likely to be associated with their perception of what the future political climate.
Greenhome Gas l$mission Reduction lkading (GERV The Canadian Greenhouse Gas Emission Reduction Trading (GERT) Pilot, to be completed Dec. 31,2001, focuses on providing industry, government, and other participants with experience and training in the implementation of gemhouse gas emission (GHG) reduction trading schemes. This includcs reviewing a wide variety of projects, trades, and developing the key elements of a trading system.
GHG emission hading projects currently being reviewed through GERT include small hydro, fuel switching. landfill gas utilization, forestry, and wind power projects across Canada, h m B.C to Newfoundland. The GERT Pilot rwirws both traded projects. where a buyer and a seller of emission reductions have been identified, and offers to sell, where a buyer has not yet been identified.
GERT has a set of mandatory review criteria that can be roughly summarized as the following: - o -Additionality, although they are still developing the definition for a d d i t i d t y :&2iz?-%ge -
. ---- o Measurable, pilot proponents are required to measure -- and report on the emission red&~= h m their projects on an annual basis
o Verifiable, calculation methodology must be acceptable, transparent and replicable and the raw data required to verify and audit the calculations must be made available upon q u e s t Surplus
b n d a r y GERT criteria: o Sole ownership, to ensure against double counting of emission reductions o Other environmental and socio-economic benefits
Contact Howard Loseth, Pilot Manager -use Gas Emission Reduction Trading Pilot Saskatchewan Department of Energy & Mines Energy Development Branch 2101 Scarth Street - 8th floor Regina, Saskatchewan Canada s4P3V7
CLIN 1: Fostering Climate Change Initiatives for Sustainable Development Task 1C: Computational Tool Kit 49
Gmahmse ,%issiom Mmgemenl Carwrlivln (GEIICO) GEMCoisacoaJortiumofqpmximrtely 10C.ndirnaurgy-uoa market-basal ways of duciug GHG emissions GEMCo does not disaimbtc b c t w a ~ ~ ~edtypes(seqocp(ercdor0ffsd)rslongrrtbcrcis~.grcmreotoopotocd. GEMCowi inot~CERcat i f iu t iOn~undaCDMimhl gumnteerndatbe supped Kyoto Rotocol rules.
GEMCo idcntifid tbc cause of price d i E ~ ~ m this mrrtd as tbe cost asoch&d with project initiation, rtdueingihe #ram of GHG credits (vint.gc of ERU ad the y of mied m-tl. The followipn is a list of how this an &ed tbc mice of thac . - - onits (,midy due to &latory ,nmiainty) h m least cxpcasivc te mastapcndrc:
0 Reductim.ctioa~phccbcforeinptanmtrtioopaiod~2012)md ' d u a i o c r s hkc placc btforc tbrt period, loo.
o RednctianlctioaEaltesplaccmw.RtduetMasbegiomwmd~ocFlmiqg though thc implcmenmtion p a i d
o Reduction action taka place a h tbe kginniqg of the period withIcduEtioastramocarrriqgrigbt.Aa.
thc n A his Ly ~ s p l t m GEMQ p&tk& ERGS - tb.1-$t . - md due to thc divasi-00.
Risk SLYbn S m c i u c (could nsult in various price scbadula within a dal) I. Thost~ffscgwitbbac~canytbe~pricc(sc lkrcanmiaed~ot l l iqg. -
buyaanmniatdtobuying). - -
2. Thosttonstbrtfill&arigbtoffirrtrdiisllanytbcP&aadhigbcstpicc. T b i s i s a r i g b t t o d d i v c r a r t b e p s r t ~ f t h e s d k r ~ m d t b e ~ m ~ p r y f a the tum of COZ if delivered at tbc agreed price.
CLIN1:FostmiugClimateChaogcIni~TorSustohnbkDmlapncld TI& IC: c l m p m h d Tool Kit
Marketing di Funding
I
3. "Put" (i.e., sell) provision tons cany the lowest price. The seller has no obligation to offer these ERUs to the buyer, but under the Kyoto Protocol , the I
buyer has an obligation to pay for them.
Also in this deal structure is an M&V protocol bailout provision. If a govermnent M&V I
protocol is suddenly introduced after the contract b,egins, there is a clause that will allow the buyer to bail if cost nms over say 10?4 of total cost of the deal. If the costs are under that margin, the buyer must pay the extra cost. If this clause is included, the buyer is then I willing to pay more for ERU. Most contracts GEMCo currently has have full bailout c l a w if Kyoto Pptocol blows up. Otherwise it is not a "true deal."
Canadh Voluntary Challenge &Regisfry VCR lac. is a stand-alone, not-for-pm6t corporation dedicated to encouraging private and public sector organizations to voluntarily limit their net greenhouse gas emissions. It will aummmdate emerging Canadian registration needs such as baseline protection, credit for early action, volunkq emissions tnding, and offset systems that are currently being studied or proposed.
Pilot Emfssion Reduction lkading (PER7 Pilot Emissions Reduction Trading Project, PERT, is similar to GERT, but the former only opemtes in the Canadian province of Ontario. PERT is an industry-led, multi- stakebolder environmental initiative. PERT is evaluating enlission reduction trading as a tool to in the reduction of smog and 0 t h air poll;tants in the wmdsor-Quebec &rid&, and the effects of climate change. They are facilitating emission reduction trading between companies is to help shape future legislation and commitments on -. &ons.
r
PERT has reviewed 20 million tons of C Q reduction projects, 4 million is in process and IS million tC02 worth of projects are in the pipelme. The top buyer to go through PERT is Ontario Power Group. The current price for vintage 2000 is $0.67 per tCQ. The five main criteria used to evaludte these ERUs are:
o real, . 0 surplus. o quantifiable o verifiable, and o unique.
The five main submiteria would be ownership, leakage, additionality, and project risk m .C g d . Through the use of these criteria, PERT is able to ensure more reliable and qmtifiable credits.
5
CLIN 1: Fostering Climate Change Initiatives for Sustainable Development Task 1C: Computatjonal Tool Kit
JLdncvF-fi*~ T h c S y k y Futumcxchnge isdevelopiingancxchaagc-ttadainmrka faarboa scqu~ticmdts.ThecarbontndtogddisbcingdcvdopcdhdthnybySFEm association with State Forests of New South Wales. This arbon hdbg rmrtd will be opentodmtcrestedpuhcrpmta
. .
me integrity of thc d d will be mdapiuocd by'hampmt arboa wwurhg, m opca c d m s tdad , as well as ongoing verification md in+ ' t catifiatioo processes Tokp El& Powa Compru?y (TEPCO), a J . p m c a d c a i c utility, hs signed a &al wisvitq NSW SIUe Forests to pknt 1,000 bcctam of forest m ym 2000.
InfemationalEanisrionr T r o d i g A s s ~ o n The Iohnalhd Emkhm Tnding Assahtion (IETA) is m iodepadcnS -fit ~ t i o n ~ ~ t o ~ t i s h a s y s t a n f o r ~ g m g r r e o b o u s c ~ a n i s s i o P c I E T A is d a d to smning lbe development of rrmrld-based trding syslam tht are ~ l y f i ~ i r , o p e s ~ e ~ v x o u n b b l c d c o n s i s C e n t ~ n r t i a v l ~ One of tbeir mam activities is to coolpile a tmsadoo database
IbcIPEisE~'b lerrdingeoagyh, t trrcs .ndc .rpt ionSa~TheIPEprovida~ highly quhtcd ~ b o c whae indusby participants use tihues md options b m i n i m i S e t b c i r p d c e ~ m t b e p h y s i c a l e o a ~ y m a l r d O v c r S l b i I I i o o ~ m &-*i;atui is traded on tbe IPE.
h~don-W-tPE--@ for creating a cartioh market are at a more cmkyollic strgc. Ibc exchange hopa to establish a nurkd for C02, N20, md CH4 (mcbnc) cmirJiars
Conact IPE I o ~ t i o l d House I st Kdurk? i way London ElW 1W. UX. Switchboard: +44 (0) 20 7481 0643. F a nmnba: +44 (0) 20 7481 8485 In tkmtb: +44 (0) 20 7265 3636 Wcbsitc h t t D ~ h . i D h & ~ M
CLIN 1: Fadaiog Cbm& Qvrsge MtiPiva fa Sus&habk Dedqmnu Task 1C: Comptlstid T d Kit
Markefing & Funding
Fels. M. "Special Issue Devoted to Measuring Enagy Savings. The Rinceton Scorekeeping Method (PRISM)". Energy and Z(uildings, (ed.) 1986. Vol. 9, Nos. 1 and 2.
Jochem, E. and E. Gruber, "Obstacles to Rational Electricity Use and Measures to Alleviate llq," Energy Policy, pp. 340-350, June 1990.
Johansson, T.B.; Kelly, H.; Reddy, A.K.N. and Williams, R.H. Renewable Energy Sources for Fuels and EIecfrici@, Island Ress, Washington, DC, (eds.), 1993.
Tmceediigs of the United States Initiative on Joint Implementation &gram Conference", Arlington, Vk, May 3 l-June 1, 1995.
Swisher, J.N. and Masters, G.M., "A Mechanism to Reconcile Equity and Efficiency in Global Climate Proteztiou," Ambio. vol. 21, pp. 154-159, 1992.
Swisha, J.N., "Joint Implementation under the U.N. Framework Convention on Climate Chaoge: Technical and Institutional Challenges", Mitigation and Adaptation Strategies for Global Change, vol. 2, pp. 57-80, 1997.
Swisher, J.N. and Remer, F.P., "Carbon 01%- from Biomass Energy Projectsn, -Proc&gs of the Seventh National Bioenergy Confsknce,
, , ( ; + a t y , ' ~ ' & l ~ Shoals AL, 19%. . .
.>%.-sq*>,2<..~:> : ' , .,.,., . .. ~
.~~ . ~ , . ~
~uller, LaWrenCe W., ~ i & n ~ the small ~usiness. PrenticeHall, New Y h N Y , 1991.
Delphos, William A., ~*ower A4onty. The internatio~l business Ereenfive's Guide to Government Resources, Sponsored by the U.S. Export Council for Renewable Energy, Venture Publishing NA., Washington DC, 1994.
Nevitt, Peter K, and Frank Fabozzi, Project Financing - S&h Edition, Emmoney Publications, 1995
CLIN 1: Fostering Climate Change Initiatives for Sustainable Development Task 1C: Computational Tool Kit
Hbs&EmdM.Brown, "ClosingtkEftidmcyCirp:BPrieniotbe~U+of Emrg)r, R-, C a n r m . o n and Rayding, 1990,3(4), pp. 267-28 1.
1) CLIN1:FostcringClhrntcCbilqgcInitirtivafor~Dnclapmed Task 1C: Compltatiooal Tool Kit 54
a ~ q -
Greenhouse Gas Pollution Prevention-Climate Change Supplement (GEP-CCS)
l&rlng Cltm.(. Chutg. lnhtivn for Sustdnabk t k d o p m d
Marketing and Funding Toolkit
The Lwis Berger Group, Inc.
rrnm-olaNbtk.h---4=- ~ ~ C a C a c l l d T t ) s h r l k m ( q r m C
-- -.
t
- Toolkit7Tbjectives
U Give project developers an ability to market their CCMPs to investors.
U 1denti~ sources of debt and equity financing for CCMPs.
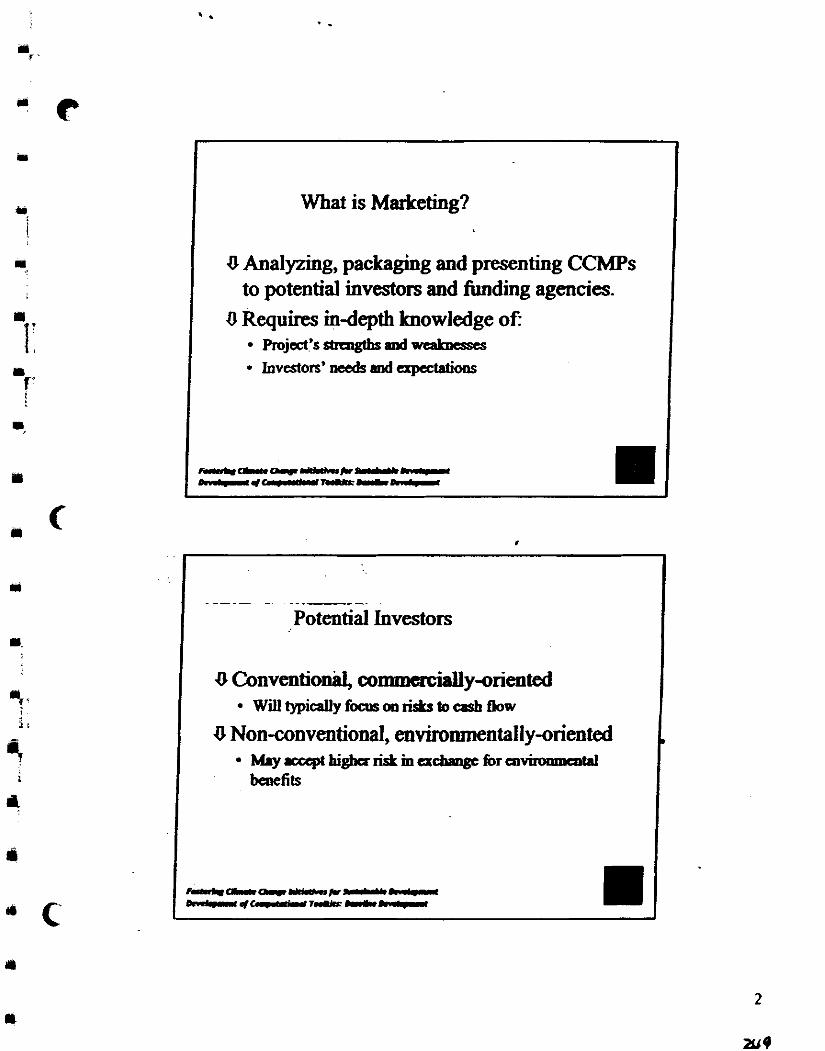
What is Marketing?
8 Analyzing, packaging and presenting CCMPs to potential investo~s and h d i n g agencies.
U Requires indepth knowledge of Pmja3'sstrcngthsmd wealrnsscs
1nvest0fs' needs md npeaatioos
- - - - - . . . - - Potential Investors
U Conventional, commadly-oriented willtypicallyfocosmriststocashflow
U Nonconventional, environmentally-oriented M.y.ceepthigburistinu-form ' 4 bewfits
--cllr-w-LICI omCI.I--mw=--
.
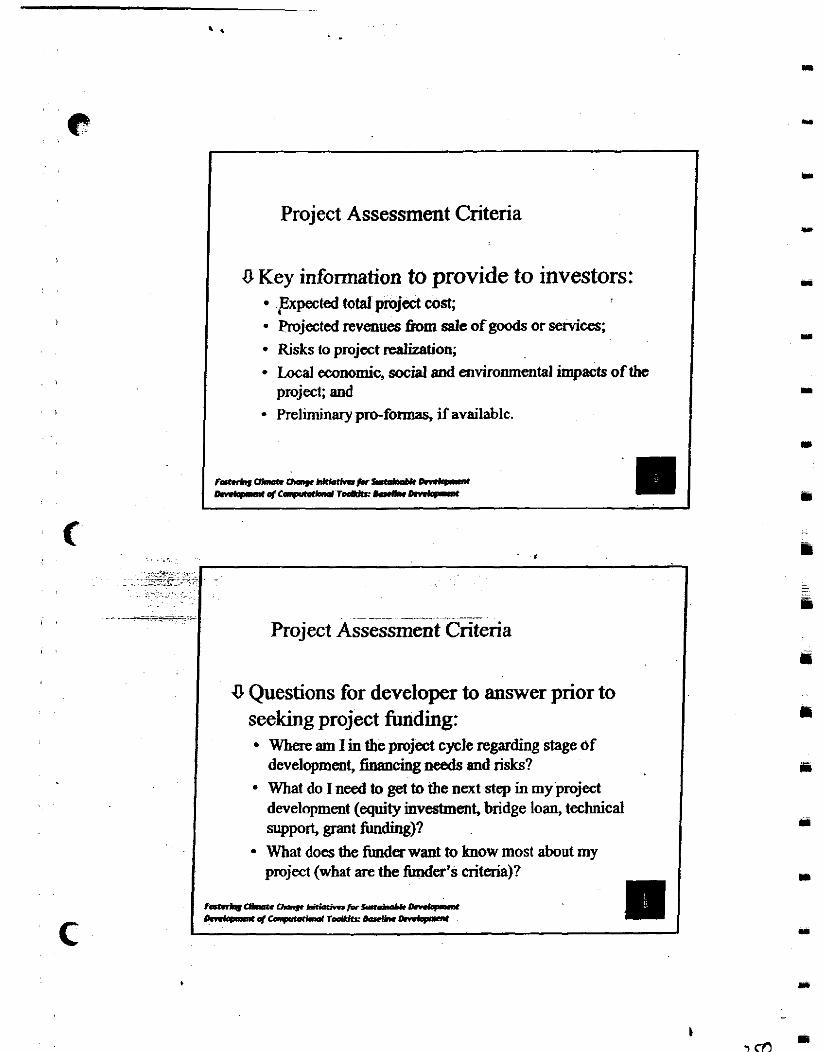
I Project Assessment Criteria
I 0 Key information to provide to investors:
Fxpected total project wst; hojected revenues b m sale of goods or services; Risks to project dization; Local economic, social aod environmental impacts of the project; and Preliminary pro-fonnas, if available.
, , . ~~
Project Assessment Criteria
U Questions for developer to answer prior to -
seeking project funding: Where am I in the project cycle regarding stage 6f development, ihucing needs and risks? What do I need to get to the next step in my project development (equity investment, bridge loan, technical support, P t funding)? What does the funder want to know most about my pmjmt (what are the fimder's criteria)?
~-hon-*-Dm(opa ~ # c a p l o . t i r m ( r ~ - D m ( l p n *
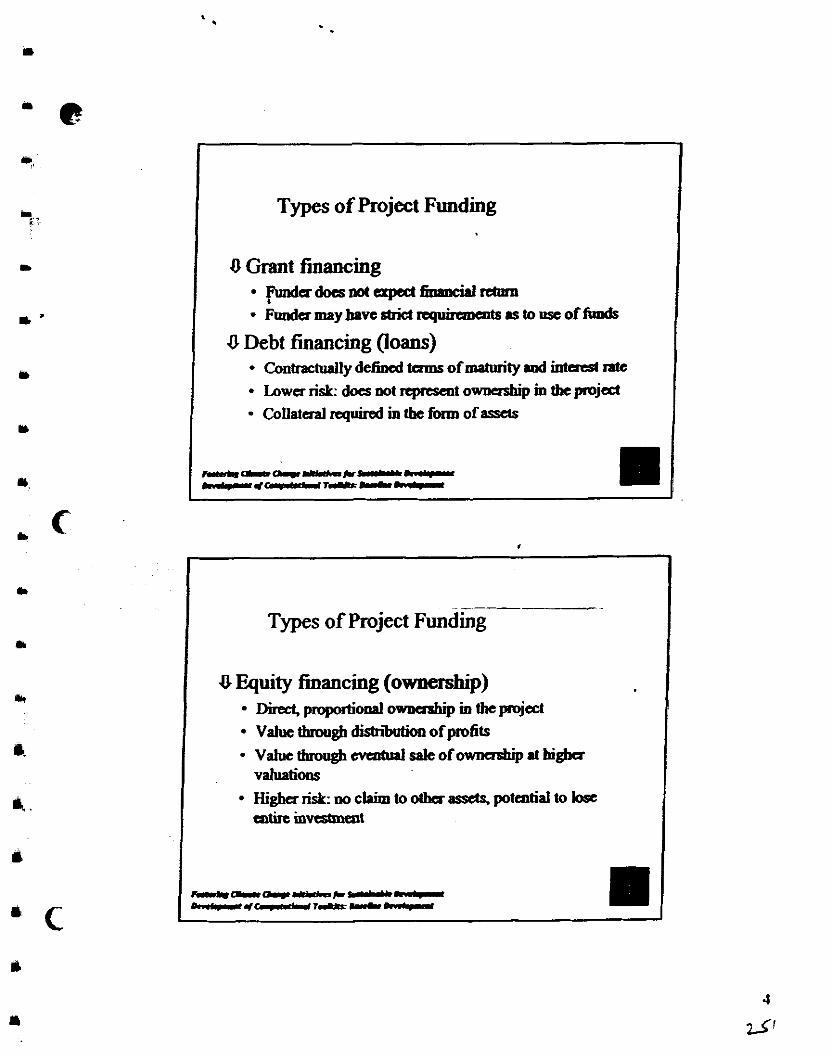
Types of Project Funding
U Grant financing p m d ~ d o e s m t a t p a d ~ n t m n FPndamayhavcsbidreguinmentsrstomcoffundr
U Debt financing (loans) Contrachdly defined tams of maturity md i n t d ntc
Lower risk: docs not repsent owmrship m tbe poj& Collataal rapid in tbe fwm of asds
Types of Project Funding
U Equity financing (ownership) Diieet,proportioaalo~mtbeprojcct Value tblwgll d i s b i i of profits Value thugll c v d sak of owaaship at hi* v-w Highariskm,clPimtootbaasscts.potmtialtobsc mtk mv-t
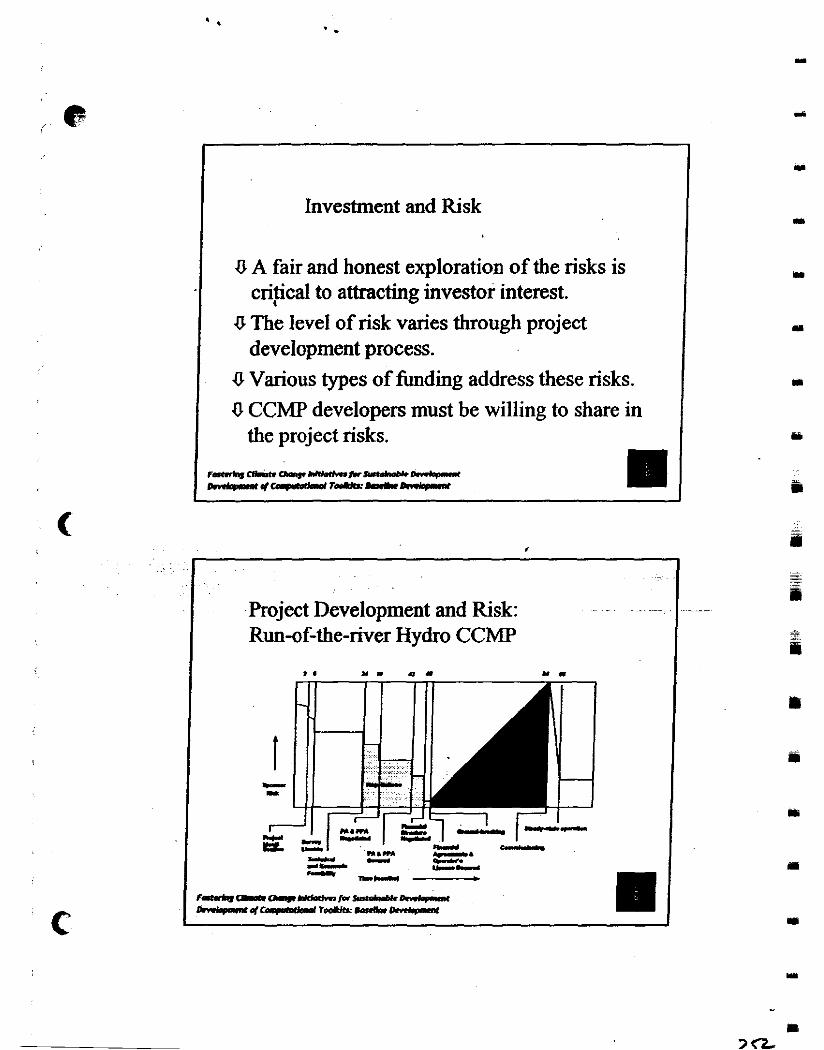
I Investment and Risk
U A fair and honest exploration of the risks is critical to attracting investor interest.
0 The level of risk varies through project development process.
U Various types of funding address these risks. U CCMP developers must be willing to share in I the project risks.
Project Development and Risk: Run-of-the-river Hydro CCMP
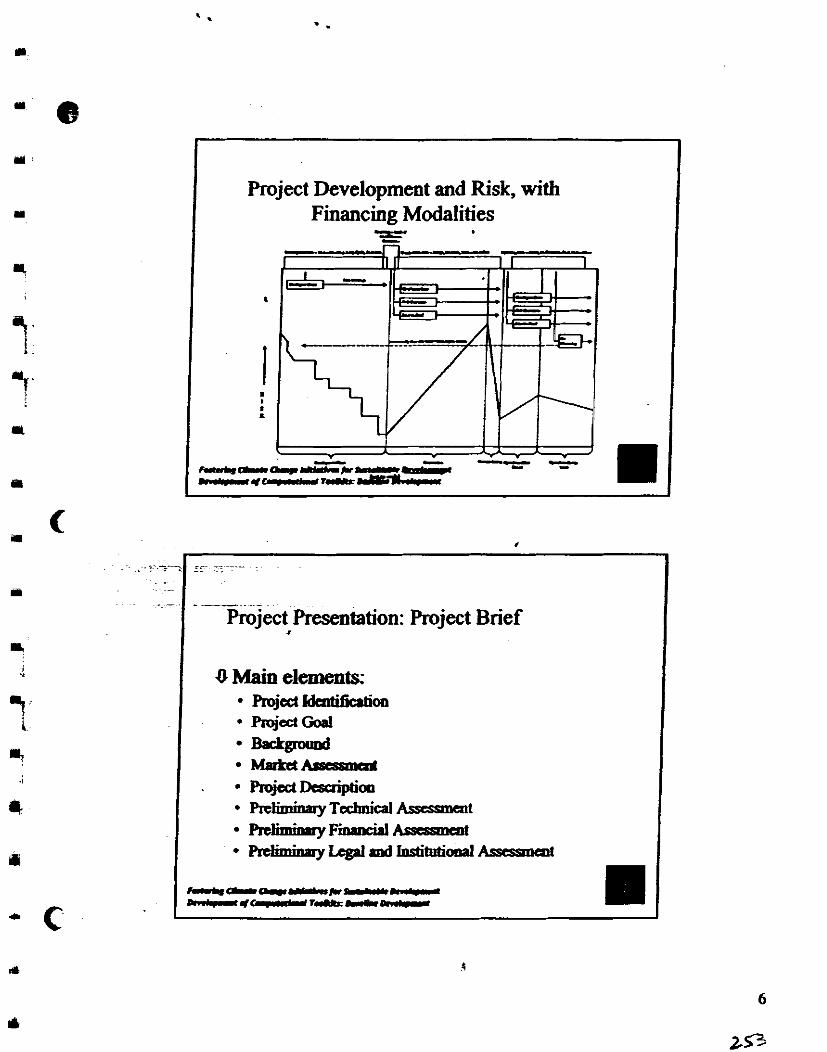
. -
I project Presentation: Project Brief ,
-
I U Main elements:
Project Development and Risk, with Financing Modalities
3F
I
! .
. . - 1) ' - - -- k r r l l - 0 - m - w - m - rrcrec-m-b-f-rtlc-
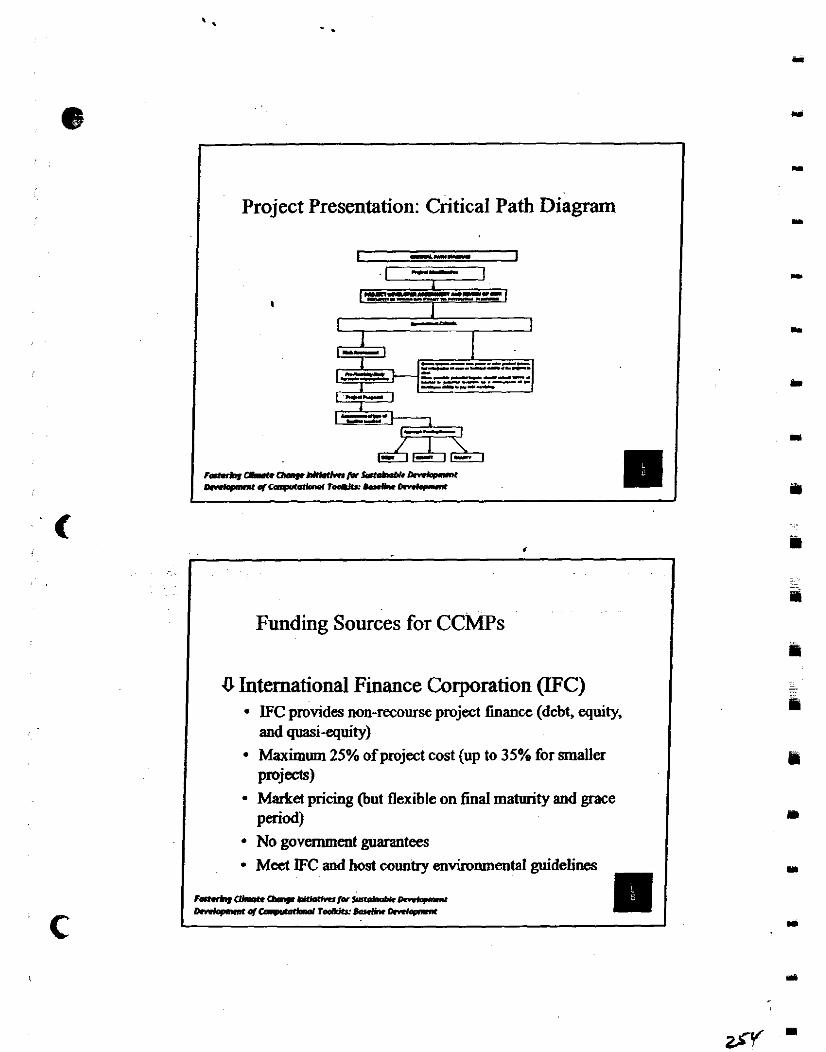
( Project Presentation: Critical Path Diagram I
Funding Sources for CCMPs
U International Finance Corporation (IFC) IFC provides non-recourse project finance (debt, equity, and quasi-equity) Maximum 25% of project cost (up to 35% for smaller proj=c=W Market pricing (but flexible on final maturity and grace period) No government guarantees Mect IFC and host country environmental guidelines
F ~ - ~ n * i m r m - D m ( q n n * ~ * ~ r ~ - D m C p m *
I Funding Sources for CCMPs
U Renewable Energy and Energy Efficiency Fund (REEF)
~ 6 S l O O m i l l i m g b b d ~ n p i t V ~ f m d FintfmdhcR?iagolpR61EIipojbdrm~mrrtm
. . wd-sQdpoj&b<50hiw ~ l d c b c ~ o f S l O O ~ A d d i t i o r n l U S S 2 5 - 3 0 ~ h G E F h m d r f a p o p d c o - ~ Spba- fap pro par!
- . I ~unding ~ o u r c s for CCMPS
I U World Bank Prototype Carbon Fund 0
Objectives: T o ~ b r C C M P s ~ s p a D a - 'k
d n ~ t ( w h d O C T t b i S ~ ~ a m i l k ~ m T o p m i d e i k P . r & r m i b c ~ n ~ b ~ wid"'
Funding Sources for CCMPs
0 Small and Medium Scale Enterprise Program ' VS$21 million program to provide contingent,
concessional loam to financial intermediaries (FIs) which then on-lend or invest in SMEs Fls include both NGOs and commercial enterprises Incentives for FIs to seek repayment fiom SMEs 10 FIs selected to date - USS6.3 M approved
~~ ... ~~ . . . . .- . Funding Sources for CCMPs
0 Solar Development Group Exclusive focus on Rural PV SHSs in Emerging Markets $50 million Target Initial Capitalization Private, Stand-alone Entity with Finance Window ($32
and Business Development Services ($1 8 million) to local PV comp&es. Initiative launched by World Bank, IFC, GEF and U.S. Charitable Foundations as Potential Founding Investors
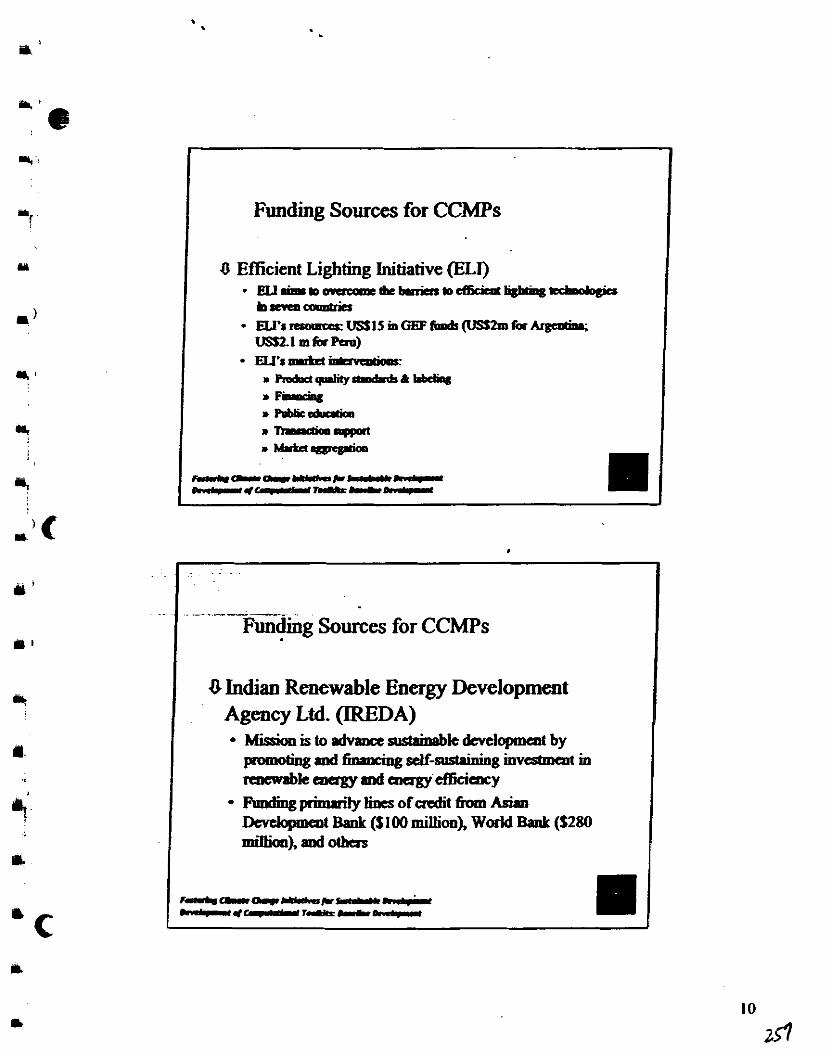
Funding Sources for CCMPs
U Efficient Lighting Initiative (ELI)
-.--- Fundhg Sources for CCMPs
U Indian Renewable Energy Development Agency Ltd. (IREDA)
MissionistoPdvnmx~kdcvetopmaltby pnwotingdfinmcingsdf-- . .
g imedmaa in m ~ ~ ~ & k c o a g y d ~ e f f i c i e a e y I?mdingprimdyliacsofaedit~Asi;m Dcvdopmmt Bank (S 100 millioo), World Bauk ($280 na ion) ,ddbas
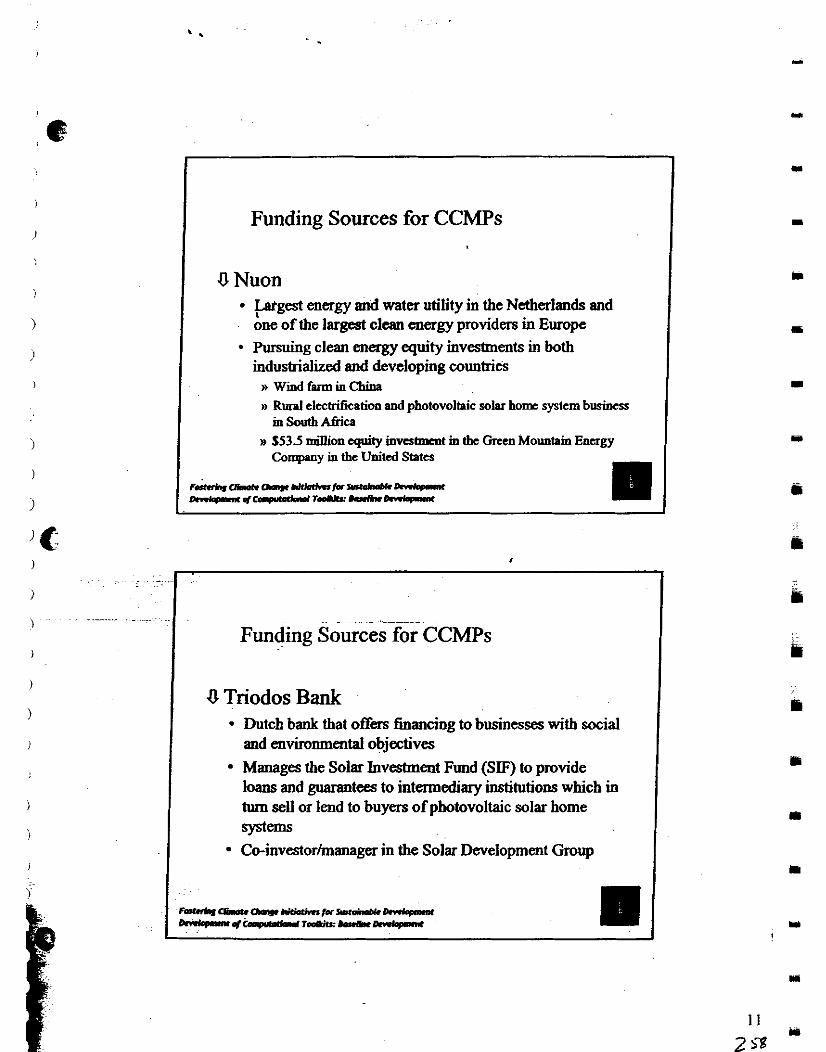
Funding Sources for CCMPs
pug& energy and water utility in the Netherlands and one of the largest clean energy providers in Europe Pursuing clean energy equity investments in both industrialized and developing countries n Wind farm in China B Rural elechificatim and photovoltaic solar horn system business in South AWca
H $53.5 million equity investment in the Green Mountain Energy Compnny in the United States
F ~ C d L P n ~ - ~ - ~ h4-w-r----
( U Triodos Bank I Dutch bank that offers financing to businesses with social and enviromnental objectives Manages the Solar Investment Fund (SF) to provide loans and gmmtees to intermediary institutions which in turn sell or lend to buyers of photovoltaic solar home syst- Co-investorhanager in the Solar Development Group
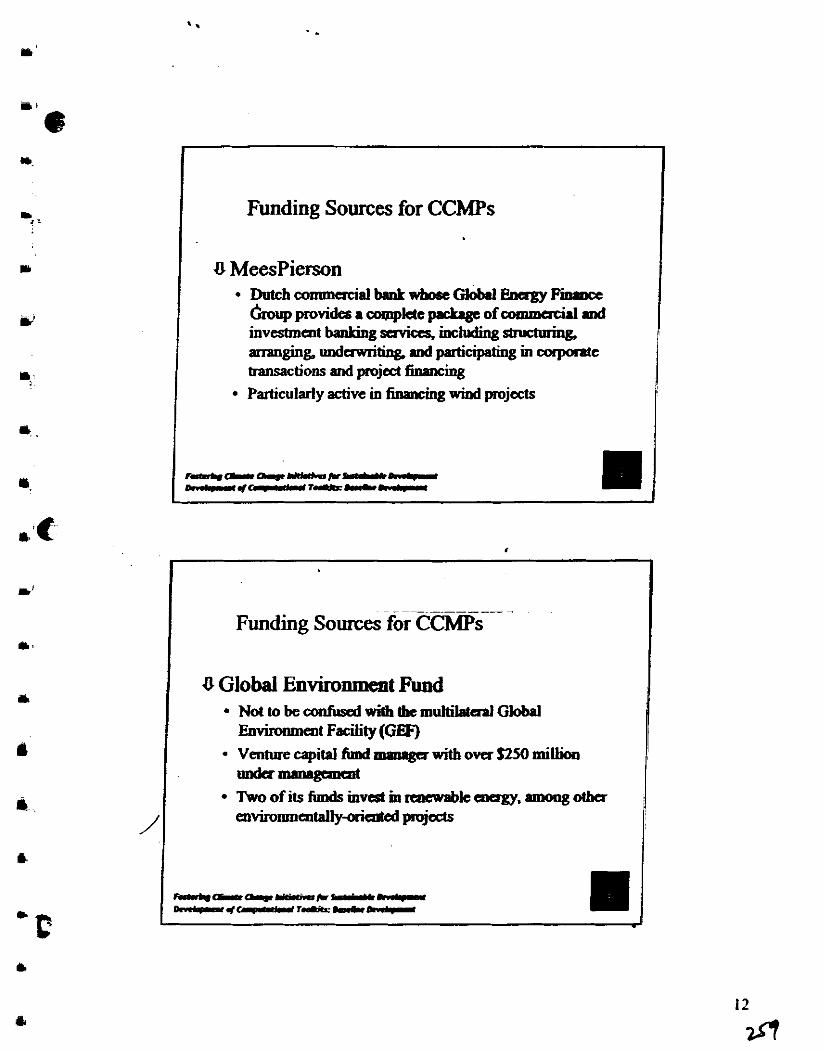
Funding Sources for CCMPs
Dutch c~mmacial bauk whore Giobrl Ewgy Fiomce
arranging madexwriting md participating m corpomte transactions and project finsncing Particularly active m financiag wind projects
Funding Sources forrcW-s- -
U Global Environment Fund NottobeconfLsdwitbthemultihdGlobPl En-t F d t y (GEF) Venture capital fiml m~nrga witb ova $250 miltiw -- Twoofitshmdsinvcs(iureaewsbk~,rmongotba e n v i r o m n m ~ p r o p d s
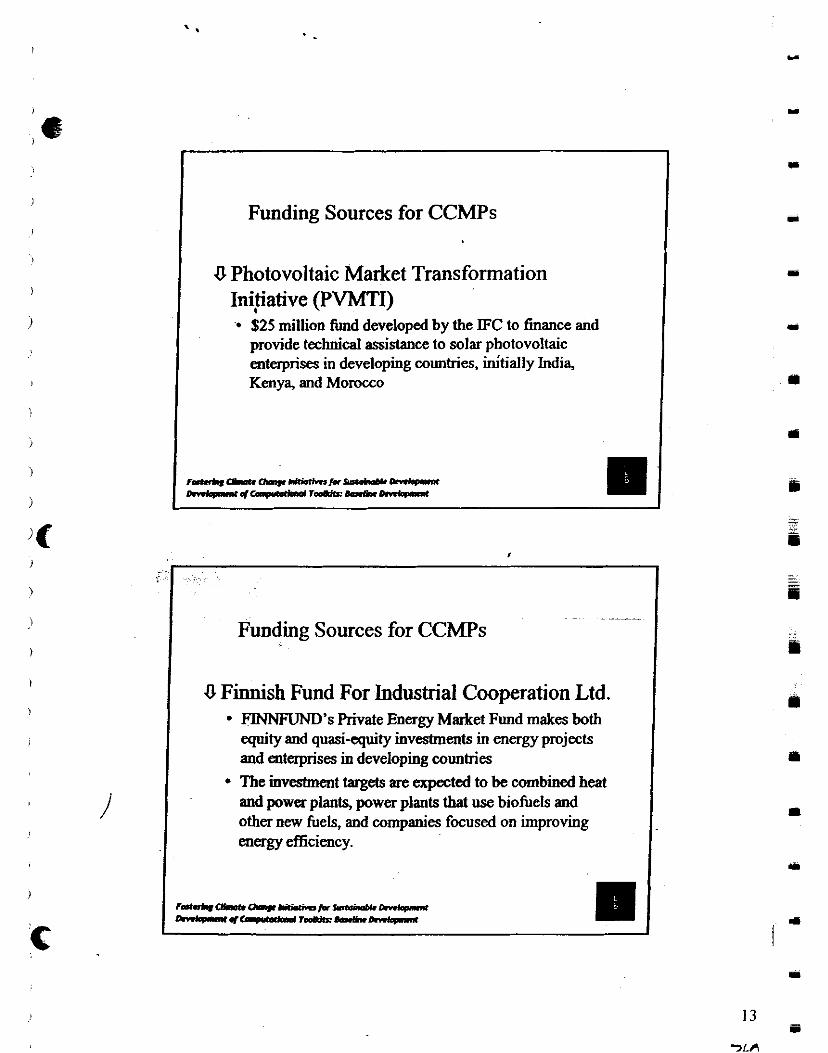
Funding Sources for CCMPs
U Photovoltaic Market Transformation Initiative I (PVMTI)
$25 million h d developed by the IFC to finance and provide technical assistance to solar photovoltaic enterprises in developing countries, initially India, Kenya, and Morocco
U Finnish Fund For Industrial Cooperation Ltd. FINNFUND'S Private Energy Market Fund makes both
.
equity and quasi-equity invesbnents in energy projects and enterprises in developing countries
- Funding Sources for CCMPs
The investment targets are expected to be combined heat and power plants, power plants that use biofuels and other new fuels, and companies focused on improving energy efficiency.
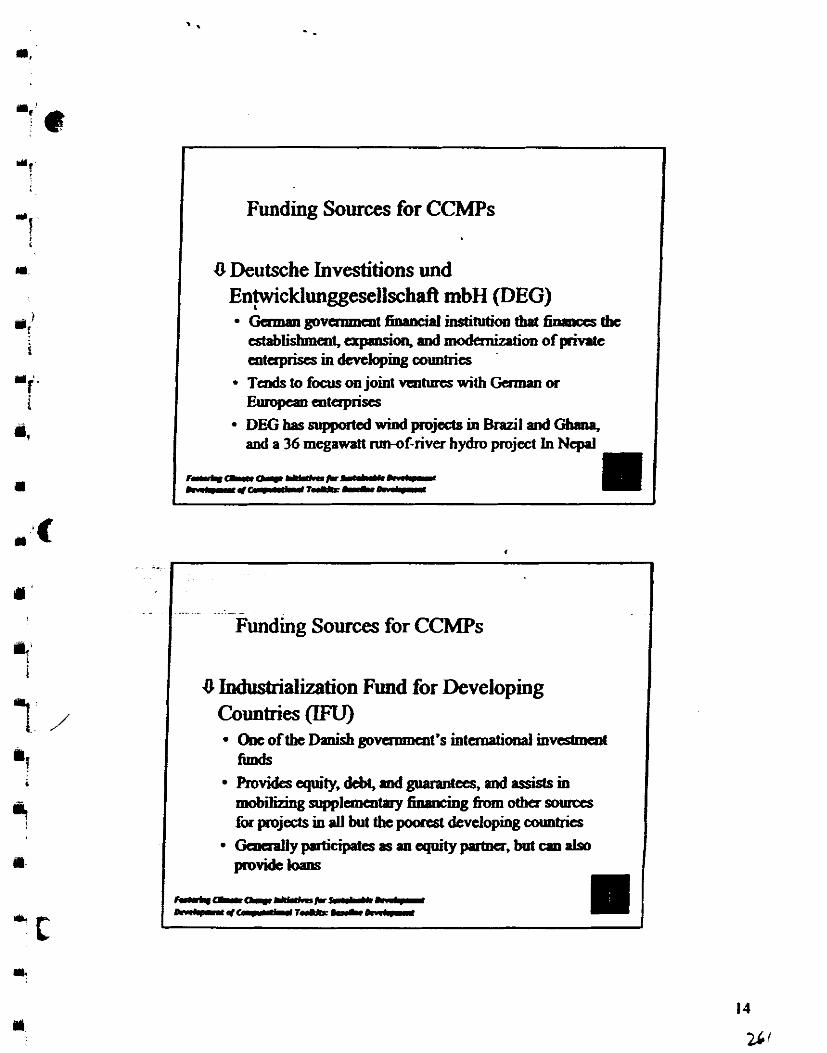
Funding Sources for CCMPs
U Deutsche Investitions und Entwicklunggeseiischafl mbH PEG) Gamangovamncnt~dinstiMhthrtfinrnccstbc
establishmeat, aplmsion, and modernization of private mtaprises in developing countries TendstofoarsonjointvmturcswithGamPlor Ebmpcal altapriscs DEG has suDoorted wiml mid in Brazil and Ghanr aud a 36 megawatt nm-of:riv& hydro project In ~ c p r l -
rrrh-Q.c-*-..r(c -*-r--.mcI
I - -.
Funding Sources for CCMPs
8 Industrialization Fund for Deveioping Countries 0
One of the DPnisb govcmmalt's international investmcot fimds Rovidesequity,debt.md~tas.andaPsistsin mobiisupplarrcnt .ry fuuucing tiom othasourccs for projects in all but tbt poonsl developing anmtries
*MY- . -
r s p n a q o i t y ~ , W b n t h
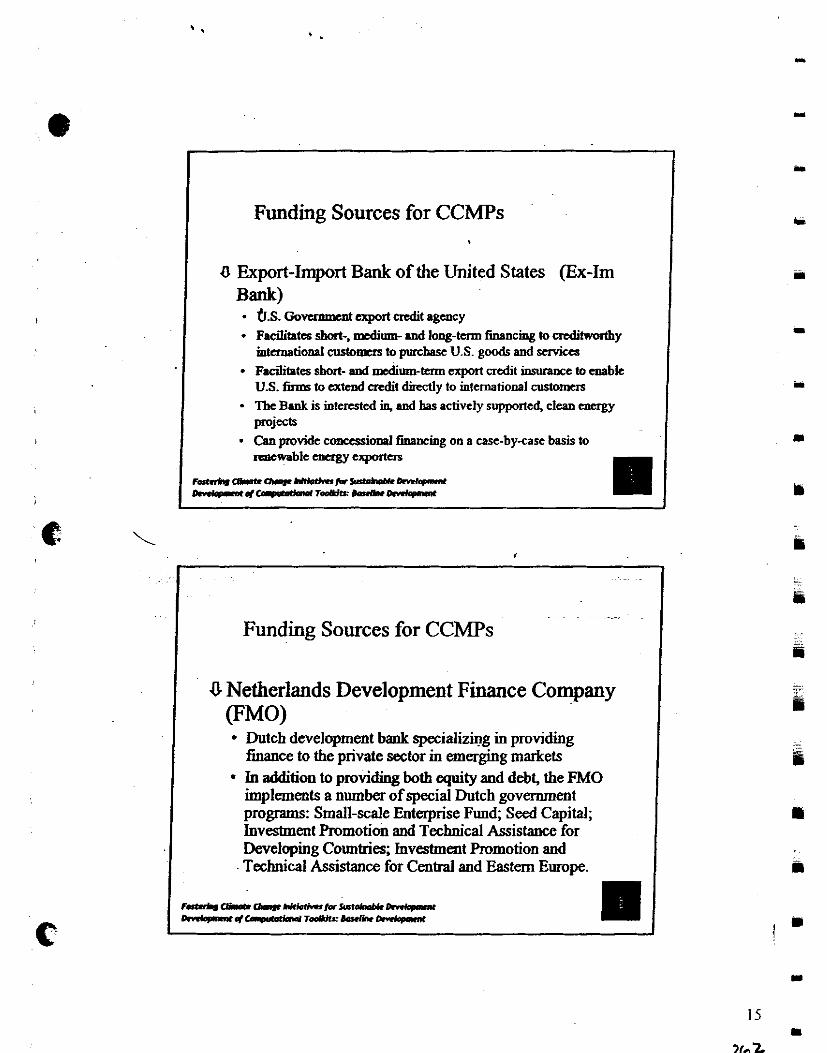
Funding Sources for CCMPs
U Export-Import Bank of the United States (Ex-Im Bank)
Facilihts short-, d u r n - and long-tam financing to -Y mtemational cmtomm to purchase U.S. goods and service Facilitates short- and mediumterm expon credit insurance to enable U.S. h u s to cxtcnd credit directly to international customers T k Bank is interested in, md has actively supported. clcan energy projects . Can provide conccssional financing on a case-by-ease basis to irocwable energy exporters
- .
Funding Sources for CCMPs
U Netherlands Development Finance Company (FMO)
Dutch development bank specializing in providing finance to the private sector in emerging markets In addition to providing both equity and debt, the FMO implements a number of special Dutch govenunent programs: Small-scale Enterprise Fund; Seed Capital; Inveslment Promotion and Technical Assistance for Developing Countries; Investment Promotion and Technical Assistance for Central and Eastern Europe.
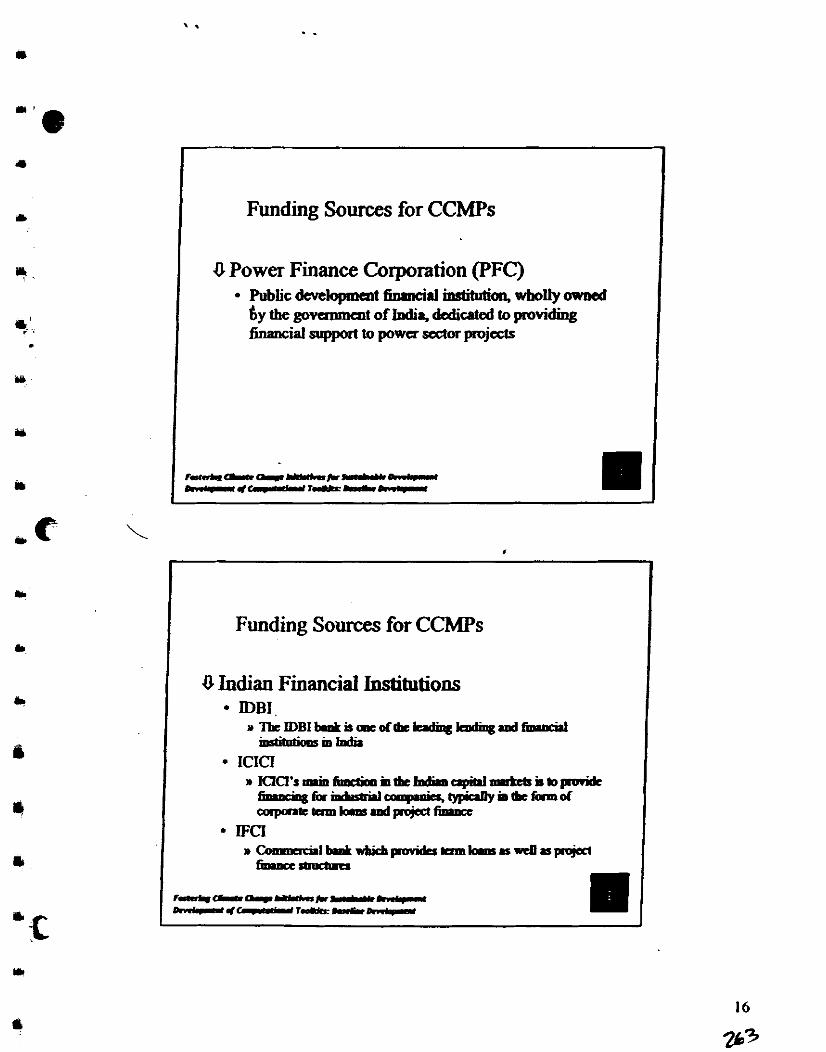
Funding Sources for CCMPs
U Power Finance Corporation (PFC) Pubt icdeve~t f inmcidinst i tut ion ,wbol lyd By the govunma~t of Irdia, dedicated to providing financial support to power scdor projects
rrarh-q-*-- A I C # - r - - M C I
'-..
Funding Sources for CCMPs
U Indian Financial Institutions IDBI n T b c I D B I M k c a o l ( b c k . d h g l c D d i q B d ~ . . .
m s h t l m o m i n ~
ICICI r ml'srmiadonerioom(bc~crpihl-iIbporidc
6 l m K i e g f o r ~ c c m p . n i q ~ b & f i l r m ~ c.aqNnebmbmsdpojactfiemEc
IFCI W C 4 1 b d ~ p w i d c r n m ~ a s R n a p o j a c t
fiemEcsbtw%ms
m-ol.lr-*-- I * n * r a # C . . . * . b r r T r l d a h L h . 4 - -
I
Computational Tool Kit: Sustainable Development ,
United States Agency for International Development Greenhouse Gas Pollution Prevention Project
Climate Change Supplement a (GEP-CCS)
Fostering Climate Change Initiatives for Sustainable Development
Task 1C Computational Tool Kit: Sustainable Development .
By:
The Louis B q e r Group, Inc. G&7, Safdarjung Develaynnent Area
New Delhi 110 016
May 14,2001
Sustoinoble Development Toolkir
TABLE OF CONTENTS ................................................................................... I
.... .... .......... ....... TABLES AND FIGURES -...,,, , ,,,. -.. ........ ........................ ..Ill
....... .......... EXECUTIVE SUMMARY ..., ............ , .-,............. .. .... ;... ..... ..,...... ". .. ES-1
.......................................................................................................... INTRODUC~ON ES- I ....................................................... BACKGROUND ON SUSTAINABLE DEVELOPMENT ES-2
CONCEPTUAL FRAMEWORK FOR UNDERSTANDING SD ............................................ ES-2 ENVIRONMENTAL SUSTAINABILITY ........................................................................... ES-3
...................................................................................... ECONOMIC SUSTARJABIUTY ES-6 ............................................ SOCIAL SUSTAMABIWTY ; .............................................. ES-6
........................................................................ IMPLEMENTING AND MEASURING SD ES-7 LINKAGES BETWEEN THE TOOLKITS ......................................................................... ES-I 0
! ( ' .......... 1. INTRODUCTION ......,.... , ................................. ......................... 1
2. BACKGROUND ON SUSTAINABLE DEVELOP~&NT ..,. -.,. .." -....... ...-- 5 ~- .~ ~
3. CONCEPTUAL FRAMEWORK FOR UNDERSTANDING AND
\ . . ~ ~
IMPLEMENTING SUSTAINABLE DEVELOPMENT ...,... , .......-...... "-.. ..... ,... 7 - .-
ENVIRONMENTAL SUSTAINABILITY .................................................................................. 9 Corporate actiom to move toward environmental sustainabili@ ............................. 13
.......... ................................. Linking SD with climate change benefits and C W s .; 18 ECONOMC SUSTAINABILITY .......................................................................................... 20
......................................... SOCIAL SUSTAINABILITY ERROR! BOOKMARK NOT DEFINED. INTEGRATION OF THE THREE FACETS OF SUSTA~NABILITY ............................................ 24
4. OPERATIONALIZING AND MEASURING IMPLEMENTATION OF SD PRTNCIPLES IN CCMPS ...,... , .....,. .. - ............................................. 27
mSURING AND ASSESSING ENWRONMENTAL SUSTAlNABlLlTY ................................. 27 MEASURING AND ASSESSING ECONOMIC SUSTAINABILITY ........................................... 28 mSURING AND ASSESSING SOCJAL SUSTAINABIUTY ................................................. 3 1 hfPLEMWlUiG SD CkTERU IN PROJECTS AND ~ R P O R A T E INITIATNES .................... 33
Checklist for Implementing SD Principles and SD Indicafom ................................. 33 ............................................................................................................... Checklist 33 . . .
Environmental sustalnabll~ty ................................................................................ 34 .. Economic sustamab~l~ty ................................. ...................................................... 36 . . . Social susta~nab~llty .............................................................................................. 37
CLIN 1: Fostering Climate Change Initiatives for Sustainable Development Task 1C: Computational Tool Kit 1
Critical PathJim Integrating SD himripla in Projects and Carpome h i m . 39 LINKAGES m CARBON ANALYSIS TOOW ........................................................ 41
5. CONCLUDING REMARKS 44
BIBLIOGRAPHICAL REFERENCES 45
ANNEX: PROJECT CASE MATERIALS 44
UL CLM I: Fastaing Climate Change Initiatives for Sustainable Dcvelqmnnt Task 1C: Computational Tool Kit ii
J
............................................................. Figure 1: Relationships bctwcen the Five Toolkits 3 ...................................................................... Figure 2: The Three Facets of Sustainability 8
............ Figure 3: Boundaries and Environinental Impacts of CCMPs and SD Activities 18 ......................................................................... Figure 4: Three Facets of Sustainability . ' '. ?4 .............................................. Figure 5: Integration of the Three Facets of Susfatnabality 24
........................................... Figure 6: Overlap of Project Boundaries in the Facets of SD 26 Figure 7: Critical Path for Implementation of SD ~ r & i ~ l e s ........................................... 40
................. Figure 8: Linkage between the SD Toolkit and the Carbon Project Toolkits 42 Figure 9: Project Development Process and Linkages to the Toolkits ............................. 43
Table 1: CCMP Types, Climate-Related Environmental rind SD Benefits ...................... 14 ................... Table 2: Non-Climate Environmental Benefits Derived from Project Types 16
Table 3: Projects identified as of April, 2001 ........... .; ...................................................... 46
CLIN 1: Fostering Climate Change Initiatives for Sustainable Development Task 1C: Computational Tool Kit iii
The obj&tinof the sustainable dcniopmmt (SD) toolkit is to peseat a ck.ramcqhd modc~ofwimt s~ '~~ lammgeoanl t~ .~wenr~mthecontartofc l imrtechqge mitigation projects (EM'S) Tbe toolkit is duigaed to provide dmlopas of ~K&S to reduce emissions of grrtnbous gases (GHGs) with the analytical mdbodr and tools they need to .sstss the degree to whiCh theirprojects incorporate SD priocipkq rr wdl n to assist thcm m the process of incorporati& SD More spai&Ily, the tookt is desi& to be used by Development Altanrtives ad org.niutionc like it in thdr efforu to support project developers lodir Accordi&, the infended attdhce for this document includes businesspeople and prclctitiqmrs of coagy effickncy and mmvable cncr~ydmlapmcnt-"pmjectdevckqus"inlhcscrras-insladof~Pd acdemic specialists m the field. It is hoped, bowewr, that both groops a n k a f i t hm, asweUas.pply,tbeidcasdmataialscontahalbcrc.
Tbis doc~lcnt comprises tbe first of five toolkits, md coven SD m gawrrl lams. Tbc four . t a o l l 6 t s c o m p r i s i n g ~ o n ( I ) ~ b r s + l i n c ~ ( 2 ) s&n emissions mondtoiiug ad v d a t i o n pocmok (3) the arbon hancc model md (4) the marketing a d hmdiog of ctiumtc change miti@cm p j m s , an more namwly focused. The purpose of this "SD Toolkit," timefore, is to asist projecacVeIopas in the assessment of the SD attributes of tbcir projects, ad to seek ways to design more SD attnites into new Projece. In addition, tbis daxlmcol aiarts its rcadas on the linlages between SD principks m gewral and the nurow ~JCUS of eua00 analysis and project devdqment implicit m the olhcr fom toolkits, and it p r o v i d e s a l i a m c w o r l r f o r ~ g t b e ~ b c t w & ~ ~ t h e o c h a h a w d l aslbeirindividluluses
This toolkit amhim three major compma~ts The first component (Sectiaa 2) pvides a very brief summary of the intellectual uodcrp igs md origins of tbe coocept of SD. while the following onc (Seaion 3) &data the ainccpt of SD m mtu dblil. Altho~gh this presentation cannot be consbud as bemg a definitive trrrtmcnt, it is rqmsmtatitab'vc of c w m t thinking on the subject. The I& major aqxmnt (S&tiorr 4) m ~ a s e t o f S D i n d i a c o n f o r l r s e m ~ l ~ m i n i t i P l ( b r s d i n c ) ~ o f
charactaistics of each project ad company, and to be incoqmatcd into regular rrportisg p ~ m t h e s a m e w a y a s ~ i a l r r p o r t i n g i s p a f o r m e d .
CLIN 1: Fastering Climate Change Initiatives for Sustainable Dcvdopment Task I C : Computational Tool Kit E S I
Sustainable Devrlopment Toolkir
Background on Sustainable Development
With the emergence of the modern environmentalist movement beginning in the 1960s, debate raged between the ''technocentric wmucopians" (such as Julian Simon) and the "limits to growth" school of thought (such as the "steady state economics" articulated by Hennan Daly), as well as even more unwmpromising versions, such as the "deep ecology" espoused by various writers.' By the late 1980s, with the publication of the f i n d i i of the World Commission on Environmevt and Development (the "Bnmdtland Commission")in Our Common ~uture? the bases for several different threads of argument over the definition had emerged. Since the publication of the Bnmdtland report, with its well-known formulation of SD as "development that meets the needs of the present withopt compromising the ability of hture generations to meet their own needsn a great deal of further theoretical, and increasingly, empirical work has been done. Recent scholamhip as well as practical experience indicate that SD encompasses three broad areas: environmental, economic and social sustainability. Sustainability in any single one of these areas depends on the degree to which it is achieved in the othm.
The presentation of SD in this tookit stresses that the implementation of SD principles is an evolutionary process that will take time, and that there are different "levels of sushinabfity" as well as different aspects of sustainability. At the same time, the view that SD requires limits to economic growth is q-jected here. This assertion is based on two assessments: first, that there is increasing evidence that the search for greater env-iromnental sustainability fosters a significant degree of technological i~ova t ion that permits wmpnnies to "do more with less" (a process that offers limitless potential for development and growth); and second, that in the emerging economies of the world, it is impasi'b1e for thae to be any political support for development policies that limit growth, at least in the near tenn. In the end, the move toward SD must include the development of sustainable economic activity- sustainable businesses - for without them, economic activity would revert to unsustainable activities. - - - .
In its current mode, industrial development is essentially linear, based on the extraction of raw materials, processing these raw materials in an often large number of intermediate steps, and delivering a finished product to the end-user that embodies a small hction of the total mass of the materials and energy extracted to produce it. The balance of materials and energy is accounted for as waste, some of which might be recycled, but the vast majority of which is not. Further, the level of extraction of certain 'hnewable" resources (forests, fisheries) exceeds the level at which those resources can regenerate themselva, while the volume of wastes produced exceeds the carrying capacity of the natural ecosystems where they are discharged.
Conceptual Framework for Understanding SD
' Sot Peary David snd Turner, Kcrry, Economicr ofNatural Resowces and the Environment, (Johns HopljnsUnivzrsityRcss. 1990): 12-15.
C Oxford University Rcss, 1987.
CLIN 1: Fostering Climate Change Initiatives for Sustainable Development Task 1C: Computational Tool Kit ES-2
A lrrge body of tiicmtum hs luem produced ova tbe last 20 yam derailing bow cbt transfonnrtioa of i n d h a l activity armot be achieved unksa bmhwses od collamas have the correct iocentivcs to move in that direction In this rrsped, the .mlysis of sustainable development artas two broad -: economic, or f .nd &maciil. . . wstmmbility, which d e s c n i how mvkonmentd swhhability Bows 6un cb.sats in the paradig& of business ~nrgcmart; md d matakbili& whicb bi bok the baosf~i l~t ion of business and industry towad SD. b c b rhslnthar bkamx witb surrotmding communities, on tbc one &04 and bok &onxitiom oft& -mities themselves to& more sustainable m o b of agrmPbon . . yieldbothloatandbrmdcr M t s . T k c d y n u u i c s , m h p n . ~ ~ _" ' gpoliticrlappor(fatk continued cvolufhn of business and c a n m m toward SD.
facets of sustsinability: economic and sot%. It is imporht to no&+ boma, tht there two &soccts of sustainability do not merely &scri'bc and rmcroamaaic issues,--gh economic aMlysis .t both -1s is m~cvan~ L both i-q especially the social aspect, the implbtioos of SD m tams of public, pditial and c u l n P P l d c v c l ~ t s a r c a l s o ~ L Ckuly.advanusintccbdogyphyaccotnl mlain this process, with advances pamitting thc fhmchlly viabk implcmcddioo of ~e indf i c i cacyandraseofo tbaar i sewrdermta i .h Alsqtklinhlp (en-c. or "m-, s o c i c t e n ~ , md S o C b
axmomic) between tbese facets of sustahbility arc imporbnt.' Figure 1 smmdms d~ salient issues aocompsssed by thew three beets of smtahbility.
thought of as software, computa programs, dc. but also ~ t i o o l l rm-d techniques, a d y & d &Is, dc. For tbe plnpoce of this coocephral pmmt&a - - "teebmlogy" is lmdastood in its most sweeping dcjiaition.
-
E n v i r 0 ~ ~ 0 t . I Smtahabilily
Thcrc arc difkmt l ads of mvinrmaentrl m i . World Bmt cwma&¶ Robar Goodlmd dsai tbcsc s "weak". %nnm," and 'kcstamhe" i~oodtand lrpa
~ ~ y s t r o o g ) c n v i r o n m e n t a ~ ~ i t y . ' *diaimionintWeentbc- degrees is based on a classificatioo of the typcs of capital mcesq f a d l n a t d and
CLLN 1: Fostering Climate Changc Initiatives for Sushiaable Developmot Task 1C: Computational Tool Kit ES-3
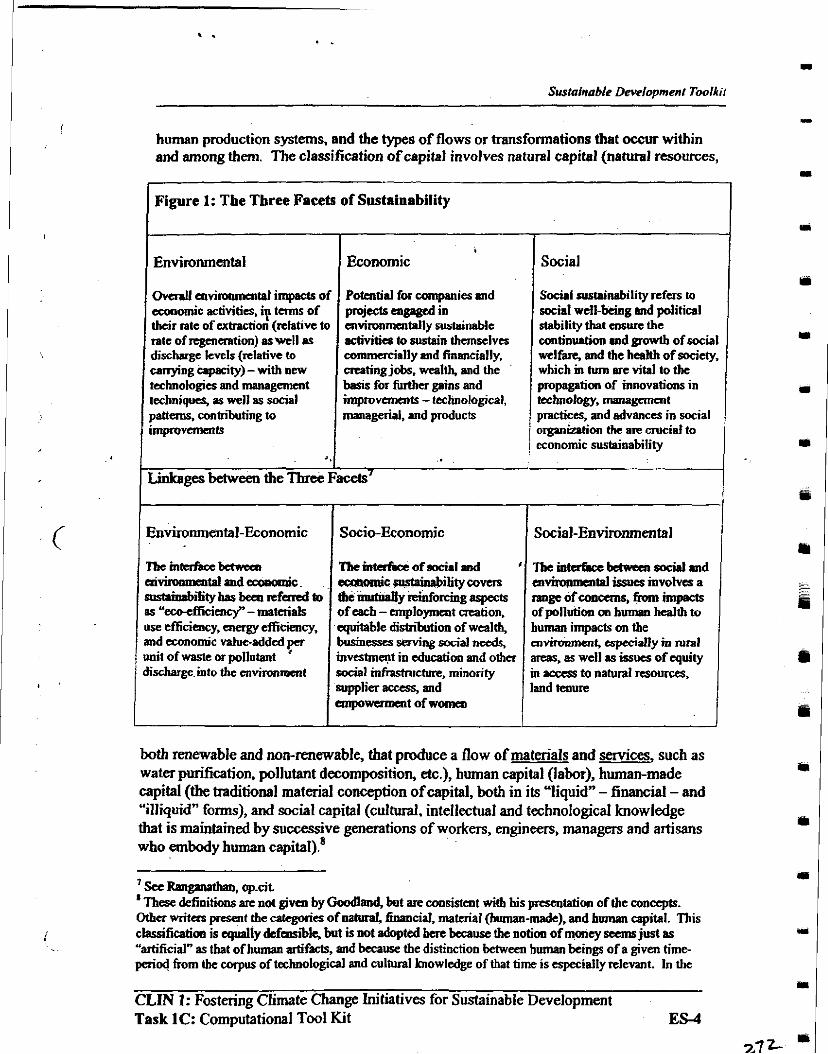
human production systems, and the types of flows or transformations that occur within and among them. The classification of capital involves natural capital (natural resources,
( Figure 1: The Three Fmts of Sustainability I
I I Environmental Economic I Social
Ovmll cnvimomotal impads of amomic activities, iy terms of thcir rate of utnction (relative to rate of regmantion) aswell as dischame kvels (relative to
I Social sustainability refers lo social well-being and political
'
- carrying apacity) - with new technologies and managcmmt tshnigue~ as well as social paltans, contriiting to improvements
stability that enswc the continuation ad growth of social welfare, and the health of son'cty, which m turn sn vital to thc propagation of innovations in tefhnology, managmrmt practices, and advancs in social organizltion Ute are crucial to economic sustainability
Potential for comp~nies and projects mgsged in mvimmencplly sustsinable .ctivitics to sustain themselves c o ~ ' s l l y and financially. creating jobs, wealth, and the basis for furtha gains and improvanents -tachnological, managerial, and products
1.
Linkages between the Three Facets7
Environmental-Economic Soeio-Jikonomic I I Social-Environmental
1 The intahae bmvbca I ~ b e i n t a h a a f s o d a l n d ' I ~ b c i a t a ~ . a b d w m r o c i l ~ 8 n d 1
I aivimnmaltalandecowmic. I d c smdahbihty covers mvimmrrntd al mvolva a sust.inabitity har bcca r e f d to tbe rmtDany reinforcing aspects range of coooems, fiaa impacrs as %so-&cicncv" - materials of taeb - anutomnt creation. I of mllution on b- health to i
I use efficiency, a& dficiency, and economic value-added per unit of waste or pollutant ' discharge.into the environmmt
'-equitable d i s b i i o n of wealth, busincsss saving social needs. mves-t in education and other d l mfrastructun, minorily s u p p k i e r a n d anpowcmmt of women
h&an impacts on tbc envbanmcnf especially m mral areas, as well as issues of equity in to natural rsources, land tenure
both renewable and non-renewable, that produce a flow of materials and &ces, such as water purification, pollutant decomposition, etc.), human capital (labor), human-made C
capital (the traditional material conception of capital, both in its "liquid" - financial - and "illiquid" forms), and social capital (cultural, intellectual and technoIogica1 knowledge that is maintained by successive generations of workers, engineers, managers and artisans I
who embody human capital)*
' see RWganaum, 0p.CiL t These defmitions are not given by Goodland, h t are consistent witb his presentation of the con-. Other witas present the co(egoti& of n a W b c i d , material (buman;made), and hnman api&l. This classification is &ly defatsibk, but is not adopted here because the noticm of money seems just rr I
"artXcia1" as thabf human artifacts, and h u & the distinction behueen human bein& of a given time- perid from tbc unpus of technological and cultural knowledge of that time is especially relevant. In the
m CLIN 1: Fostering Climate Change Initiatives for Sustainable Development Task 1C: Computational Tool Kit E M
7>7 ,=fL m
Hence, the achievement of SD mvolves reducing tbe anmoat of mataid a d required to create a unit ofthe ti^^ prcduct, through ecienq -9 u h l as finding warn to use what would otharvise be waste itetaid u M itwad for otha - - pmductivepmcscs ~hiscoaap~whicbiscompkment.ryto&mduuybe r e f d to as tbe identifiation ofprauc M i o s i r , is based cnr tbe .9cmoo that ady compkCdy slf-arntakd pmxscs arc huly swtahble. lo a closed kitthd poductionsyJtan,Mste6nmooeproecssisuxdasinputsfaotbas. l o ~ t b c c c two concepts form the basis f a rtbiitcs of envimnmentd ststainability m idasbid proecsscs d o r projects
a
Initially, a~taprks or proja%s may begin with the implcm~ntrtion of- lbrt ~thecfficiencyofresolnccorenagyusemtbeovcnilpoductioapoces without & o @ k eliminating the formation of wastes md effluents. The types of mcasurs adopted mge fkm actions bat urry viwlly DO coa( - imp-& of good housekeeping procallns - to those hi carry successivdy mae signifiant eosa and cspihl invcstmmt wquknmb - inpul subslitutioo, pmCcS ~01)trOk, equipmavl modi&tion, and ~ O g y ciunge. 'Ibe end produ~t might als~ be modifiedto rcduc~ hqHd raquirements in oranufactmhg andlor fuels and matuial requiraaeas wbm d as . desigoed.
SubsequmUy, entapka or projects can build on efficiency gains to identify and impkmmt actions that acluaUy rnw p~ocesces, a link thcm to otbu, ~.ntlatcd p r a s s t ~ , ~ f h d p o d u c t i ~ ~ u s e ~ f ~ r w ~ ~ a n d e f f l ~ m & i n ~ & ~ ~ ~ q u & n p o l l d a a t ~ t o z a o . Tbe&ofzaormigionscolbg~m~~jllstbyralucing t h c ~ o f p o l ) l l t m t S b u t m o n ~ l l y l I ~ ~ ~ g h t h e ~ o f ~ asiapotsfa.notbspoccss. Thisisrcfdtoassymbiosisbaqtmthrsvsriody b e m I M e d "biomimesy" ISndustrial aa~logy." "clean pdudcq" a '?a
. . prodoctioll" The key notion is bat of imitating emlogid - m the rntunl worM,wrmtaiaiis~amgyisconsaved,aadbalanceispddto concentratio3 imbalaace and inactivity. As Pad Hawkm puts if in nrtinq %ask equals food
Thepemammeofthem ' - 1bcnefitsobtaincdrbro~ghthe' .. - of SD priociptes - or their " . I i n ~ t y " - i s ~ rstbecypesofrctioar procduptbeLddahef f i c i cney~t s tow.TQrt iomtb . t cbse thebop drcdtinbulysymbmtkprarsscs. Thciqmmnmoftecbodogy-botbbrdrslrt andsoftware-tothisproo*rsisckar. Succasiveadvmccsinprodudionpoccscc~ management methods and equip men^ d k the same level of outpur to be obt.ioed with r t d u e a d i n p u I s d ~ a n s t t g c n m t i o n . Mcanwhile,producrimpwcments enable coosumers to obtain the same level of savice or pafonnuwv with lowa cnagy ca~ioqmstairrlsa~t,Pdwrstegaurrtion.
CLIN 1: Foskrhg Ctimate Change initiatives for Sustainable Development Task 1C: Computational Tool Kit ES5
In the last decade and half, many businesses throughout the world have begun to adopt environmental principles'0 and take the first steps toward SD. These actions may take the form of changes in management practices intended to result in alterations in productive processes, changes in the types of inputs used, development of new product lines, and changes in the business models employed. Complementing these actions, entrepreneurs and proiect developem have sought ways to provide services and quipment to enhance the &iiency of iddustrial proc&ses, alter the envipmmental impa&of basic inputs, such as electricity and steam, reduce the pollution in different types of effluents and emissions, or even begin to close the loop and reuse or find productive uses for wastes."
Economic Sustainability
For enterprises as well as poliqmakers, sustainability is an attribute consistent with commercial and economic realities, namely that a SD project must be economically sustainable - a viable venture grounded on a solid business concept -and must genemte economic benefits to the community and broader social and economic context in which it is implemented. Over the longer-tem the move toward reduced emissions and waste yields.what someanalysts have dubbed the "sustaimble-developmmt.premim).. the financial payoff to businesses, especially existing businesses, h m the implementation of SD principles.'2
In the lonn run, economic sustainability is essential to the proliferation of SD principles. This mustbe so, for in the absence of &onomic sustainability, activities that provide benefits in terms of enviromnental d n a b i l i t v would deotnd always on m v t funding or donations - this would limit the ex& to which they were impraneoted, on the one hand, and would subject them to the vagueries of political and public preferences.
- In contrast, economic swtaimbility implies that there is a financial or commercial incentive to undertake environmentally sustainable activities, thereby creating the potential for a virtually'automatic process of expansion and economic transformation.
As companies undertake the longer-term move toward achieving the goal of zero- emissions and waste, other transformations occur that begin to extend the commercial benefits deriving & imp]-ting SD principles to &er indicators of & sustainability at a macrwconomic level. A venture based on SD principles benefits the community and counhy where it is located through job creation, local environmental benefits and resource recovery, enhanced standard of living, and creation of new educational opportunities. All of these benefits contribute to long-term social welfare, -
'O Such as the CERES Rincipks, tbe Business Charter for Sustainable Dev+lopmmt, as well as othm. I1 Alan Hecht provides some exampla of this process in T h e triad of sustainable developma~t pmmoting sustainable development in developing countrio," ne Journal oflnvironment andDewlopmen~ 8 number 2 (June, 1999): 123-126. I 2 See Hedstrom, Filbert; Shopley, Jonathan, and LeDuc, Colin, 'Realizing the SustainablaDevelopmcnt Rcmium," Prirrn QlROOO (Artbur D. Little): 12-1 7.
CLIN 1: Fostering Climate Change Initiatives for Sustainable Development Task 1C: Computational Tool Kit ES6
improved health for the human (as well as fkwa and hma) m the armmunity, political stability, and d o r c a n a ~ t of the t r d towud SD.
The broader, community-M ccovlomic and e n h t . l kocfits ad longn-tam ~ n o w i q g 6 r o m a p r o j c c t n u y b c c b r n a a i z s d u m ~ o f o o c i . l SUJtainability. This is did, for ia einaghrg ammmk, mu& u hub, psopk anoot and Will m t allow cnvironmcntrl p m c c t h s and qtha nzguhtioab to sPod m tbe way of improving standards of living and opening up &oaomic for tbcir children. 'Iherrforc.mytnrlyusdLlnotioaofSDinstobegnnmdedmibedfa~ b e t w m g - h ~ ~ ~ e l l . ~ ~ ~ ~ h t b c c U m n t ~ ( W i t h i n ~ n m ~ as well as among countries). W notion of equity is oot simply m enVir0maart.l d d u a t i o n - it is a social, economic and above all, r political ate - and is vital to dw socioummnic sustliorbility of a project or businas.
Thc idcators suggested m this sa&n arc of a sufficia~t h l of gcoclllity to aammmdate their application as appmpkte to my indusbid poasr. Otbas WC
- hcre may obviously be included by individual comp.nies. llc nuin obpctive is to develop a set of indicators to begin laking mamum&md to rumd pogrrs ia inrrcasinp: rsourcc utilization efficiency. F.xperiawx m mmy indushial hcilities suggests thst ova thm. this pmcss w i i leadto the dimimtioa o f w e amas o f m e that were otherwise wnsidaul uuavoidaMe.
Tbe~of io lpkmcnt iqsmasma~eebrna mvhmmaM -btBinr w i t h t b e e n h s n c e m c n t o f ~ ~ ( e n a g y ~ , a r s t e ~ n a , watu use duction), ~ I f o w a l by tbe impkcntltion of mcrrcmrr h&u&d to slowly sq- the volume of wade material ~ e d . b ~ b y h & d M i t i a AWollgb opportunities to exploit s y m b h bdwm idusbid may somcthner be available at tbe same thne as opporhmik to i n v a m ef6eiency. it is mdy &at opportunities to exploit inputAput s y m b i i will aoagc && tbc cu&xt of dose coordination and commuolabon . .
b d w ~ ~ f i m m d i f f ~ s c c t o n H d a c a s s t o information that might otbawist bc -dacd amfkhtial.
CLM 1: FostBing Climate U m g e Initiatives for Sudabmble Dcvelopmnt Task IC: Computational Tool Kit ES7
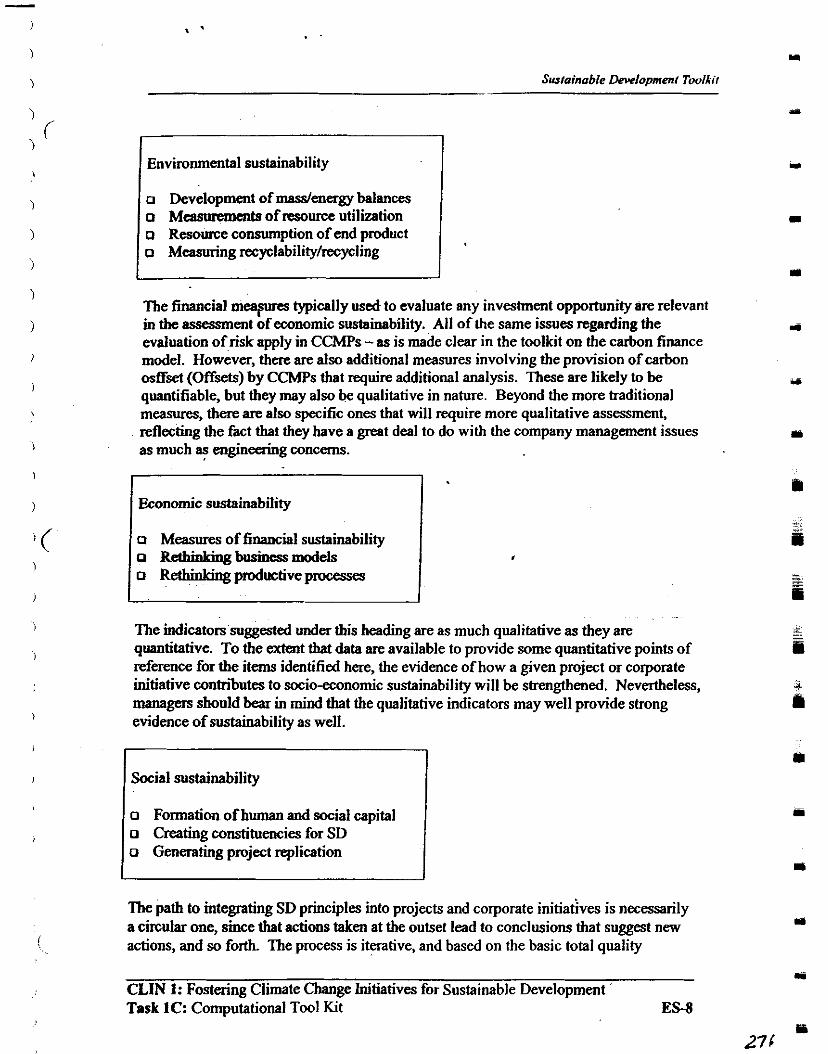
I Environmental sustainability
Sustainable Development Toolkit
o Development of masslenergy balances o Measwemtnts of resource utilization o Resource consumption of end pmduct o Measuring recyclabilityfrecycling
The financial myures typically used to evaluate any investment opportunity are relevant in the assessment of economic sustainability. All of the same issues regarding the evaluation of risk apply in CCMPs - as is made clear in the toolkit on the carbon finance model. However, there are also additional measures involving the provision of carbon osffset (Offsets) by CCMPs that require additional analysis. These are likely to be quantifiable, but they may also be qualitative in nature. Beyond the more traditional measures, there are also specific ones that will require more qualitative assessment, reflecting the fact that they have a great deal to do with the company management issues as much as engineering concerns.
Economic sustainability
o Measures of financial sustainability o R ~ g b u s i n c s s m o d e l s o Rethinldngproductiveprocesses
The indicators suggested under this heading are as much qualitative as they are quantitative. To the extent that data are available to provide some quantitative points of reference for the items identified here, the evidence of how a given project or corporate initiative contn'butes to socioeconomic sustainability will be strengthened. Nevertheless, managers should bear in mind that the qualitative indicators may well provide strong evidence of sustainability as well.
Social sustainability
o Formation of human and social capital o Creating constituencies for SD o Generating project replication
The path to integrating SD principles into projects and corporate initiatives is necessarily a circular one, since that actions taken at the outset lead to conclusions that suggest new actions, and so forth. The process is iterative, and based on the basic total quality
CLIN 1: Fostering Climate Change Initiatives for Sustainable Development Task 1C: Computational Tool Kit E M
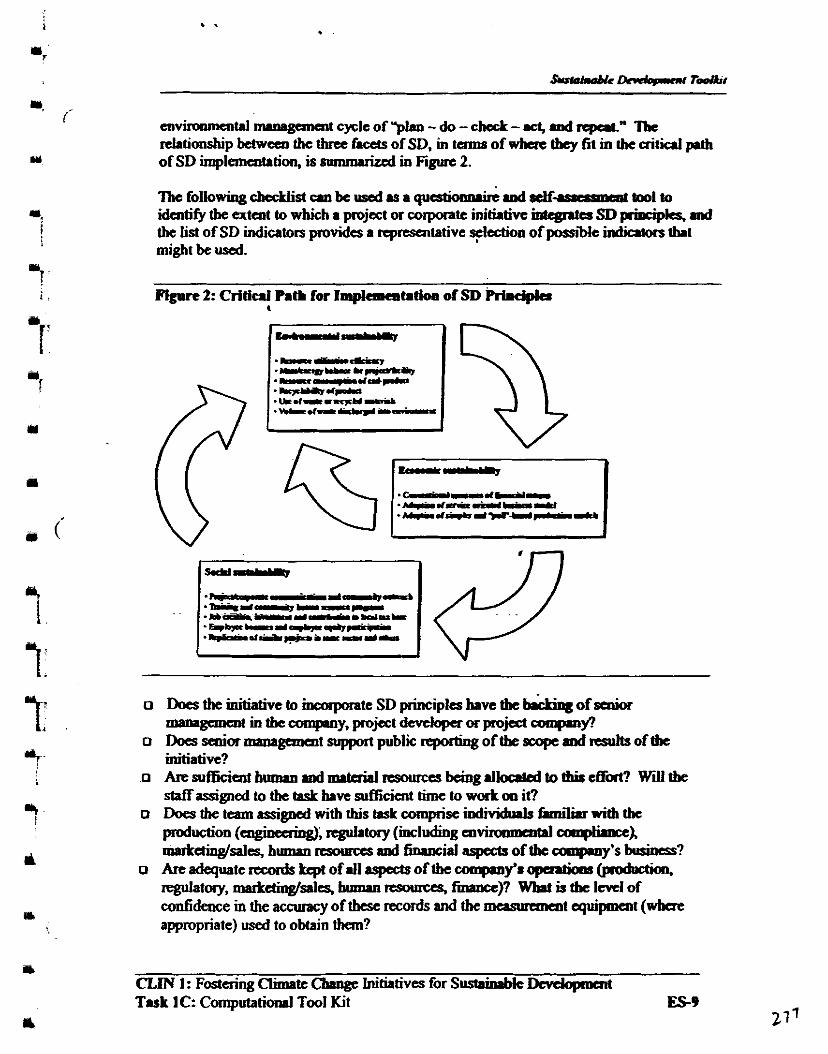
environmental muvgamnt cycle of -Ian - do - ch&L - act, ad rcpat" Thc relationship between the three facets of SD. in tams of where tby fit m tbc aitial path of SD implanentrtion, is summarized in Fim 2.
~ f o l l o ~ c b c c ~ ~ i d c m k u s e d r s a ~ a d c d f - m c r s m e n c t o o l t o identify the extent to which a project or corporate initiative idqp.trr SD priDcipkg ad the list of SD indimtors provides r rrprcscntativc S+CI~OII of possble indiacon t h t might be used.
o Does the initiative to inaxpate SD pakipla have tbe b&ng of & ~ ~ ~ ~ a o m p n ~ , p r o j ~ ~ ~ ~ p r o j e d ~ f l
o Does senior managanent support public reporting of tbe scope id rsules of tbe initiative?
o Aresuf f jc imtbumandmatcr ia l~~~bciogdloata l to~e&nt? Willtbc staffassi~edtothetaskhvtsUafienttimctowortooit?
o Does the team rtssienal with this task cormKisc i nd idub fmuiiar with tbc " production (cngiacaing), reguiamy(incl;diog al . - leompl*X markctin&aies, buman remums and thancia1 aspects of tbc comp.ny's brsims?
m . .
o re b t e rs;ords ~ c p t of dl rspeets of tbe &r apentioar (prodsction. regulatory, markethglsalcs, b- resources, hame)? Wbrt is the l m l of
w confidence in the accuracy of these records and the qlljpment (wbac appropriate) used to obtain than?
m CLIN 1: Fost&g Climate Cbange Inihtiva for Su&nde Dmlopacat Task 1C. Cornputatid Tool Kit ES9
Y

Sustainable Development Twlkit
Linkages between the Toolkits
This toolkit and the four others are interrelated. While this toolkit provides an overall framework for considering CCMPs in the broader context of SD, the other four provide the specific wnceptual, and where appropriate, quantitative tools for developing and implementing CCMPs.
CLIN 1: Fostering Climate Change Initiatives for Sustainable Development Task 1C: Computational Tool Kit ES-10
The objedive of the sustainable development (SD) tclolkit is to pnsni a clear m o q l u a l modelofwfratSD,mcansin~ltarasu~rsmthecontextofdimrcecb.sge mitigation projects (CCMPs). The toolkit is designed to provide dcvdopas dpojacts to r e d u e e c m i J s i o n s o f ~ ~ ( G H G s ) w i t h t h e ~ m c t b o d s m d t o d s m C y n e e d t o a s s c s s t h e d t g r a t o w h i c h t h c i r p r o ~ ~ t e S D p i a c i p l e s . . ~ w d l r c t o assist them in tbe process of k m p o d q SD principles. More spccifially. the ioolkit is deigned to be used by Development Altanrtives d organbtkms Wrt it m their &arts to support project developers in India. Accordingly, the mleoded audicncc for this document includes businespeopk and pm&has of- eflscicncy d rrarnbk enagy developwnt - "pioject developas" m thest areas - i r r s td of theorists md acadanicspceialistsmtfieW. I t i s h o p o d , h o w m r , t h t b o t h ~ e m b a n 6 1 ~ as well as apply, the idas and mataials conabd here.
Bcuuse SD both micro- as well u A kvds of .nrtysk. 6rom theenterprise tosoc ie tyandcventheglobalc~mm~, i t i s~csp&ial ly t (o r m d e r s t a n d t b a t t h e p h s a y f o e u s o f t h i s t o o l k i t i s m o r t m p d c s S ~ t b c ~ and enterprise levels of adysk. Euly work on SD. as well as more racrnt papas by DevdopmentAlt~vcs,strcsstbebroada~dpdicy-rrktad~ofSD. Some morc -t studies of corporate rcpating and SD indicators have ddrased ways for managm to incwpOnte SD corsidaatioos into coaproy mamgamnt, plmn$tg and business dmlopmcat -Similarly, the cmphsls on this toolkit is on .sJisting lndia . projed developers ad managers to tmdasEaod SD ad how it is related to climate cbrngc pmjats .aadbowtoenhmctbeSDbwi i tr~byagivatprojsd Whikmis documentdoesat tempttoor icntpmjcddmlopasni th intbcbrorda~ and global context of SD, its main pwp0s-e is to assist in the projat development poass onlv. As~hitsrminfowisonthcmiedandeataaistimlofrctivitv.od . - anaiysis, with the objective of assisting pojed &ve& to the SD & i of their projects and to design mort SD atbiiutes into new pojcus.
This document is tbc first of fin toollda and covas SD m tams The four
& d l and (4) tbc marlrcting and fimdiog of climatc cbmge mitigation pmjss. are more narrowlv f d 10 d d i t i ~ this doarmcnt aients its readas on tbe linhnes - b e a r &les in geocnl and tbe nurow focus of carboa mtlysis md proj&1 development implicit m the 0 t h four toolkitq and it provides a fiammwk for
CLIN 1: Fostaing Climate Chngc Initiatives for Sustainhie DcvcbpmaM Task 1C: Computational Tool Kit 1
. . 1
m Surfainable Developmmr Toolkit
understanding the relationships between the other four as well as their individual uses. The relationship between the five documents is illustrated in Figure 3.
CLIN 1: Fostering Climate Change Initiatives for Sustainable Development Task 1C: Computational Tool Kit 2
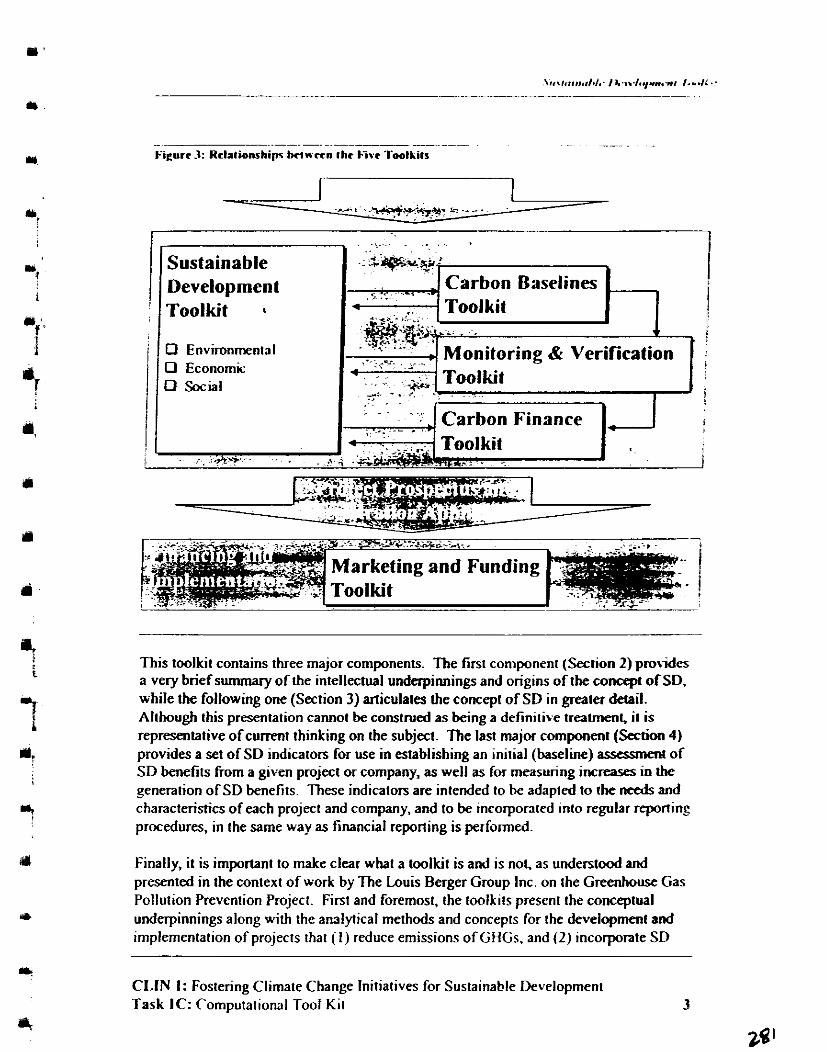
Sustainable Development
1 0 Environmental 0 Economic 0 Social
> . .
Carbon Baselines Toolkit
Monitoring & Verification
. . . I i
..:, Carbon Finance i I . 3
1 I
This toolkit contains three major components. The first component (Section 2) probides a very brief summary of the intellectual underpinnings and origins of the concept of SD, while the following one (Section 3) articulates the concept of SD in greater detail. Although this presentation cannot be ~ 0 n S l ~ e d as being a definitive treafmenl, it is representative of current thinking on the subject. The last major component (Section 4) provides a set of SD indicaton for use in establishing an initial (baseline) assessnent of SD benefits from a given project or company, as well as for measuring increases in the eeneration of SD benefits. These indicaton are intended to be adapted to the needs and - characteristics of each project and company, and to be incorporated into regular reporting procedures, in the same way as financial reporting is performed.
Finally, it is important to make clear what a toolkit is and is not, as understood and presented in the context of work by The Louis Berger Group Inc. on the Greenhouse Gas Pollution Prevention Proiect. First and foremost. the toolkits present the conceptual underpinnings along with the analytical methods and concepts for the development and implementation of projects that ( I ) reduce emissions of GHGs, and (2) incorporate SD
CLIN 1: Fostering Climate Change Initiatives for Sustainable Development Task IC: Computational Tool Kit 3
SvrtofnaMe Development Twlkir
i principles. As the metaphor "toolkit" suggests, neither this document nor the other four can be understood to provide ready-to-use solutions to complex problem involving a mix of quantitative and qualitative issues. Rather, these documents provide the "tools" that practitioners, who have some training and understanding of the issues involved, can use to solve the pmblems inherent in carbon accounting, preparetion of monitoring and vaifiwtion protocols, carbon finance and mariccting. Because there is a mgnificent amount ofjudgment involved in carbon analysis, ~d because the rules of the merging carbon market are as yet undefined, it is impossible for the toolkits to savc as onesize- fits-all pmccssomof csrbon analysis problems for use by individuals who have not been exposed to the field. To the extent that these toolkits art used by those unfamiliar with the fields of SD apd carbon accounting, they may sene as a usefbl primer and orientation course. It is expected that the toolkits will be pmented in the context of formal training, h u g h Development Alternatives as well as similar organizations throughout India, as well as in other emerging economies.
This toolkit, as well as the companion toolkits on carbon analysis and project linancing issues, is expected to be updated continuously to reflect new developments. In particular, the efforts of Development Altcmatives to wppott project development activities in India
1. provide a useful forum for testing the methodologies and guidelines pnxiented here, as . well as a source of case studies. Development Alternatives has pmposed that this toolkit and its companion documents be "tested" first on tbe 4.25-MW biomass gadication plant propod by Ravi Entech Ltd. It is expected that these case studies will be
(I incorporated into the toolkit binder in the section labelled "Annex: Project Case Materials."
- ,
CLIN 1: Fostering Climate Change Initiatives for Sustainable Dwelopmcnt Task 1C: Computational Tool Kit 4
are some wbo contcad tht SD is incompotie witb eamomic &w&, nhilc ocba rgve t b c o ~ ~ ~ ~ & . Wbilethemore~teainintofthetammdtbcddmtcovuw&
base,asMa&usrrgued,orwould h - ~ ~ m d ~ ~ p r o g m s s ~ ~ o ~ populations to enjoy improving sEandmds of living based an the tboae srme finite
W i t h t h e ~ o f t h t m o d e m c n v i r w m c n t r l i s t m o ~ ~ m t h e 1 9 6 Q r . ddm& raged bctwca~ the l ~ ~ h n o c a ~ & CUIII&~(SM% fulLn simm) d tbe rimits t ~ - ~ w r h - achooi of tbw&t (sucb 8s the-%tady st.tc carnomics- af ihwcd . . by HcnaanDdy).asWenueva!more vasioas,archrcthe~aaCp
appared in the woxk of tht Intanational Union far Corrscnuioo of N.ime md N8tmd ~ c s o r m x s ~ m 1 9 8 0 . ~ B y t h e h t e 1 9 % 0 s , w i U ~ t b s ~ o f ~ ~ o F thcwaM- . .
an& kd-(h.IBrPnQlmd ~ " ) m ~ l a C o m r n o n ~ ~ ' ~ t b e b a e s h ~ r d i ~ ~ o f argmnentovcrtbe~onhademagad. Sinathepabliatioaoftbe- repolt, with its wellhorn formulation of SD as mdmlopmcat that me& tbe aaods of t h e p r e s e o t ~ i t h o p t c O m p F D r n i ~ i n ~ t h e 8 b i t i t y 0 f ~ ~ I o m a d t b c i r c n n ncah"agratdaloffirrtha(bcorctial,d' - @y,empPialwortb.rbQlr R a x n t s c b o l a r s b i p a s w d l a s p m c t i c d e ~ z ~ t b r t S D ~ ~ ~ ~ ~ t t n e c b r o g d a r t a s : c n ~ t a l , ~ c n d ~ o c k l ~ . s ~ h r p y single one of rras depends on the degree to whieb it is achieved m cbt otbas.
The pnscotrtion of SD m this toolkit strepses that the +lement.tion of SD phcipks is anNdUtiolpry~UmtwiUhkctimt,md~tberrirtdiffaaPt4mlsof swhabilitv" as wdl as different axecis of asshidim. At the same time. the view
CLIN 1: Fostaing Climate Change Initiatives for SusEainrblc Devckpmt Task 1C: Compuhtbd Tool Kit 5
Sustainable ~ o p m e n t Toolkit
two assessments: first, that there is inamsing evidence that the search for greater emironmental sustainability fostas a significant degree of technological innovation that pumits companies to "do more with less" (a process that offers limitless potential for development and growth); and second, that in the emaging economies of the world, it is impossible for thcre to be any political support fm development policies that limit growth, at l a s t in the near term. In the md, the move toward SD muit include the development of sustainable economic activity- sustainable businesses - for without them, economic activity would revert to unsustainable activities.
It is also important to oote that SD encompagses a bIoedcr range of mvironmmtal impacts than those ad- by climate change mitigation projects. Indeed, it is necessary to ckrify that certain projects that reduce GHGs may not qualify as SD projects at all, whik at the same time, not all SD projects involve GHG mitigation. Hence, while the presentation of SD criteria (Section 3) is more general in nature, the discussion contained m Section 4 - "Operatiodizing and measuring implementation of SD principles in CCMPs" - is more narrowly focused on projects and corporate initiatives that deliver reductions in GHGs. It is hoped that specific case studies of projects will . eventually be included in the document m the Annex.
am CLM 1: Foste.ring Climate Cbange Initiatives for Sustainable Development
, Task 1C: Computational Tool Kit 6 I
.,cG
issua,.ItbwebeEommicmrlyrir.tbothlmtrkrrtrrmL Inbotbi-d ~ t h e ~ r p p t a . t h e @ l i a t i o o r o f S D m t a m r o f p u b l i c , p d i t i a l m ~ ~ I cultunldmlopmeotsuerlso- C k r r t y , d v m c t r h l a & d o g y p l . y a ~ rok in tlds praeaq with dvanca pamitting the f h n c i d y vtble imp- of ~indlkkncy.ndrcuscofatbawirswutenmtai& Ulo,th- ( . orU - l.Pd& v - h x i l i ' t y a q in4mmm~'' F v 4 auafmks thelrlicntissu*rammppd b y t h e s e t h r a ~ o f ~ i l i t y .
-. - - a d of it- sinct it Gy be understood to mcompaps h&wve --% ', tbds.- ~ d c . - r r w d l r r ~ ~ ~ - r m d a s t o o d t o i n c h d e m t j u ~ l n b r t i r a ~ l y thought of .s software, computw programs, dc. but rEFo . .
o=W=- * ~ m a l y t i c a l t o o l s , d c . ~tbc~ofthisconccphPlprcsatrt ioq rsChno~istmdastoodmitsmostswcqmgdchitioa.
TO begin with, kcboology is a critical part of impmvancnts in I pafi~bybusinesJmdiodusey,sinccnewhrdame.processt&bniquesd
Sucb iuqmved technologies Q Q ~ new business a ahncc the - o f u i s l i m g ~ b y ~ o p a r t i m ~ - - cocq
~ ~ ~ a d d i q ~ a d y ~ B . d r a r r m - * m j w ~ ~ f ~ ~ ~ ~ t i U g n c w ~ . a d r o ~ f o r ~ ~ ~pa-tc-- - ~ ~ ~ e n ~ f ~ s a l ~ t o ~ ~ ~ . pw-Ts0 f d 7
CLIN 1: Fosbing Ctinntc CInne Initiatives for Smbhabk Dmlopment Task 1C: Computdoml Tool Kit 8
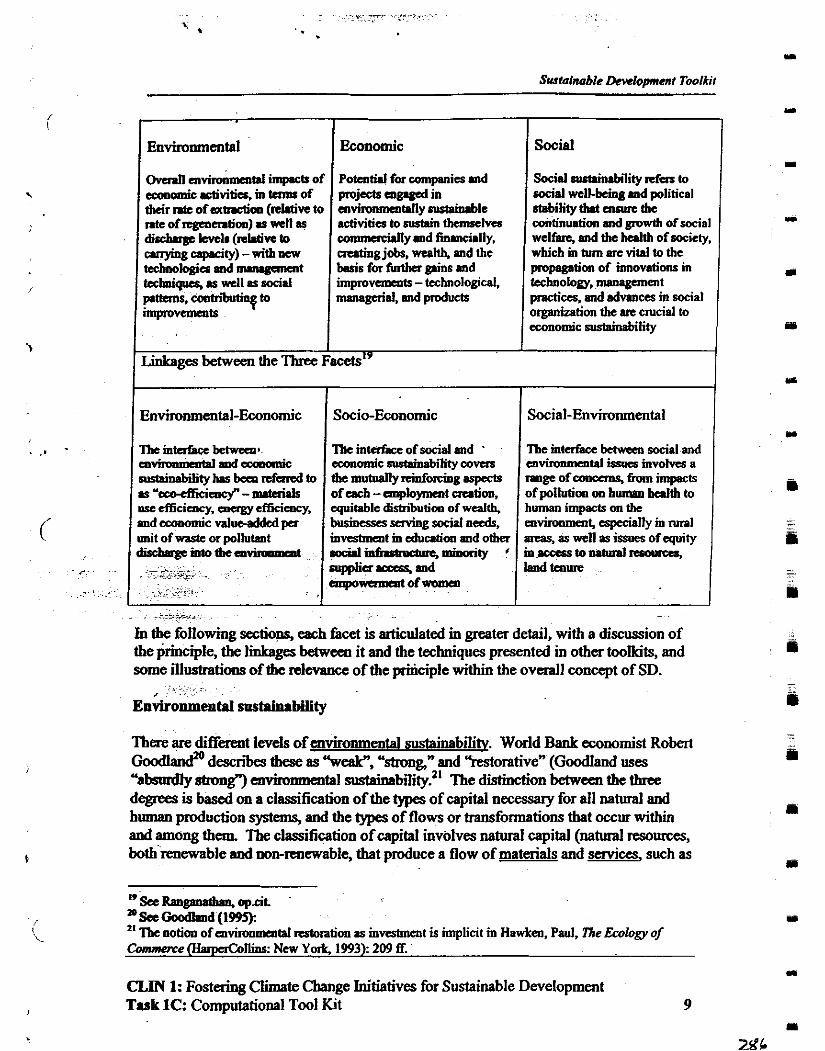
Y
Social
\
Social aUt.iolbilily refas to social well-being and political st.bilitythatcnntrrtbc amtinuation and p w i h of social welfPg md the halth of society, which in turn arc vital to the propgation of innovations in
Ovenn mvironmcntll impacts of d c ictivitia, in Ism of theirnte of a m c h (dative to ntc of n g e n ~ h m ) m .st1 as disehrge h l r (reldve to arrying cllpcity) - with new t d m o l o g i ~ m d ~ tcdulim as well as P0ci.l pttaas, c o a t r i i to ilnpmvemmts
I Linkages between the Tinee ~ a c d s ' ~
I technology, management pradcs, and advances m social omanization the PC crucial to I
Potential for canpanicsand projects cappl in mvhmmcntally mtaimble activities to sustain thanselves c o d l y and finmcially, ercating job, wealth, and the hsisforfurthapinsand impruvenxnts - tcchnologieol. managerial, md products
1 &nomic sustainability I
use cfiicimcy, energy efficicacy, and &ollondc valucaddcd u u
I
I Environmental-Economic Socio-Economic
'Ibe mtufacc of social and '
the mutUany minforciug srpocts of each - anpbloymmt caution. equitable disiriiuticm of wealth, buhiDesses ~ g S 0 c i . l nads, mvrstmcnt in educalion and 0 t h dinfnrtncans-ty ' supplia .caa, and ~ w a m a I l 0 f w o m e a
Social-Environmental
'Be mterface between social and cnvironmcntd issues invokes a rmge of collcans, fran impacts of pollution on b u m b d t h to human impacts on the mvironmmt, esptciany m ~ n l was, as well as issues of equity intoafftoluhinlrrooura* lsnd ten=
- -a> .
In the foilowing sections, each facet is articulated in greater detail, with a discussion of the principle, the linkages between it and the tahniques presented in other toolkits, and some illustrations of the relevance of the Wcipie within the overall concept of SD. ,
Environmental sastainabitity
There are different levels of mvironmental sustainability. World Bank economist Robert ~oodIandaO descr i i these as "weak", "stron~" and "restorative" (Goodland uses uabsmdly strong'') envinmmental sustainabil&?' The distinction between the thne degrees is based on a classification of the types of capital necessary for d l natural and human production systems, and the types of flows or transformations that occur within and among them. The classification of capital involves natural capital (natural resources, both renewable and nobrenewabie, that produce a flow of materials and services, such as
- --
"see Rau- opbt "S&Goodlm1dll995k - .~~ ~ ~,~ " 'Ibc notion of cnvironmmtal rrrtoration as investment is implicit in Hawkea. Paul, ne Efology of - (HarpcrConins: NW yak 1993): 209 fi.
m CLIN 1: Fostering Climate Change Initiatives for Sustainable Development Task 1C: Computational Tool Kit 9
1
>b?L
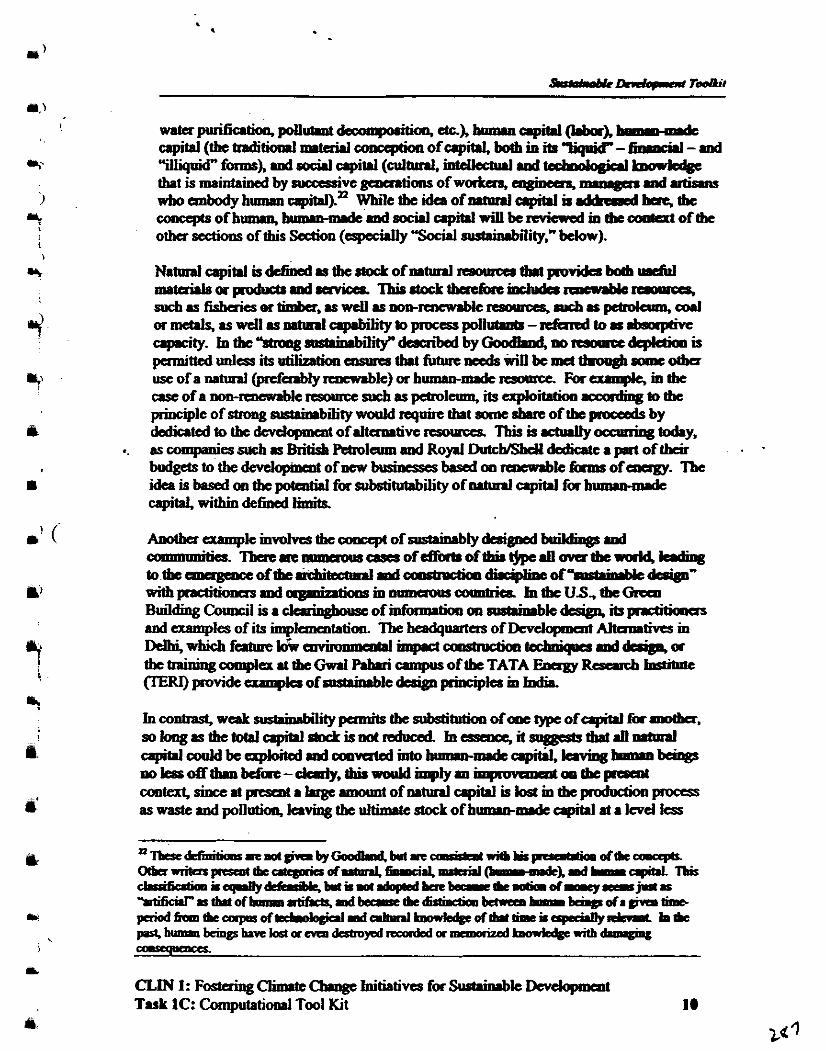
wbocnvbodybu&upibl)-" whlitbeidaofnrtun)&bddre;;sdbae.tbc coaccpts of bumm, brmubmde'd coci.l apitrl win be reviewed ia tbc eolltca of tbc other e o n s of this Scetion ( q d d l y "Social mstahbiiity," below).
Natmrlerpitdis~mtbtdocLofnrturrlra~nacat?mtprovidsbocbd r m t a i r l e a ~ d r a v i c a . l l i s r t o c i t t b o r e e n e i n e M a ~ - s u c b . ~ f i s b a i a o t t i m b a . a s 4 a s ~ d k ~ a r b & p e h d a m S o D I J or~aswdlml l rhnr lap lb i I i ty toprocesspol l~ -~(omrbsapt ivc a p d t y . Intbe'bhmgm#ak&MfdarnibyGoodfmd,norrsoaot~is p c r m i t t c d i m l e s s i t s ~ a w n w U m t f u h n e ~ n i U b e m c t t t r o q s b ~ o m e o t b r r use of a n r d (jmfaabiy renewable) or buman-mdt m For ampk. ia tbc ~ o f ~ n m - ~ r e s o u n x s u & u ~ I n n a , i t s ~ * . e e o r d i n g t o t b c priociplc of strong ataahbility would require tbat some shue of the pmcads by dedicated to the dcvdopmcnt of &amative nscwas This is a c h d y OOcrmigB lodry,
.. as compauies swb as British Pebolaan aud Royal DutcblSbdl dcdiate a pa of their budgets to tbe developineat of new bmhcscs b a d oo &k Eomg of Tbc idcaisbasedontbep0tmtidfasubstitut.bityofnrturrlclpit.l forbumm-mdc
within &find l i m k
- ~uilding Colmcil is a c k k g b w c of infornvtion on mshbbk its pncliPiooas and oram~les of its hlaneatation. The beadstlntas of Dcvdootmat Altmmtives in
hcontnst,wcllksushirvbility~tbcsubstitutiaoofautypcof~formotbcr, s r , l o n g a s ~ d o t a t ~ ~ i s m t r e d m e d Inesscnct,itsrrggeshthrtdmtmal ~ c o o l d b e ~ m d w n ~ i o s o ~ m d e ~ ~ ~ b e i q g J r n l e a ~ ~ t b m k f a c - ~ , ~ t b i r ~ i m p h l ~ t ~ t b c p m s a u ~ t a t , s i n c e r t p r c s m t a ~ a m o u n t o f n a t u r a l ~ i s b s t ~ t h e ~ ~ as waste and pollution, leaving the uttimrtc stock of bunmi-mdc apital at a kvd kss
CLM1: FostaingCliuutc(kmge~tiativesforSudnabkDml0pment Task 1C: Coxputatbud Tool Kit 19
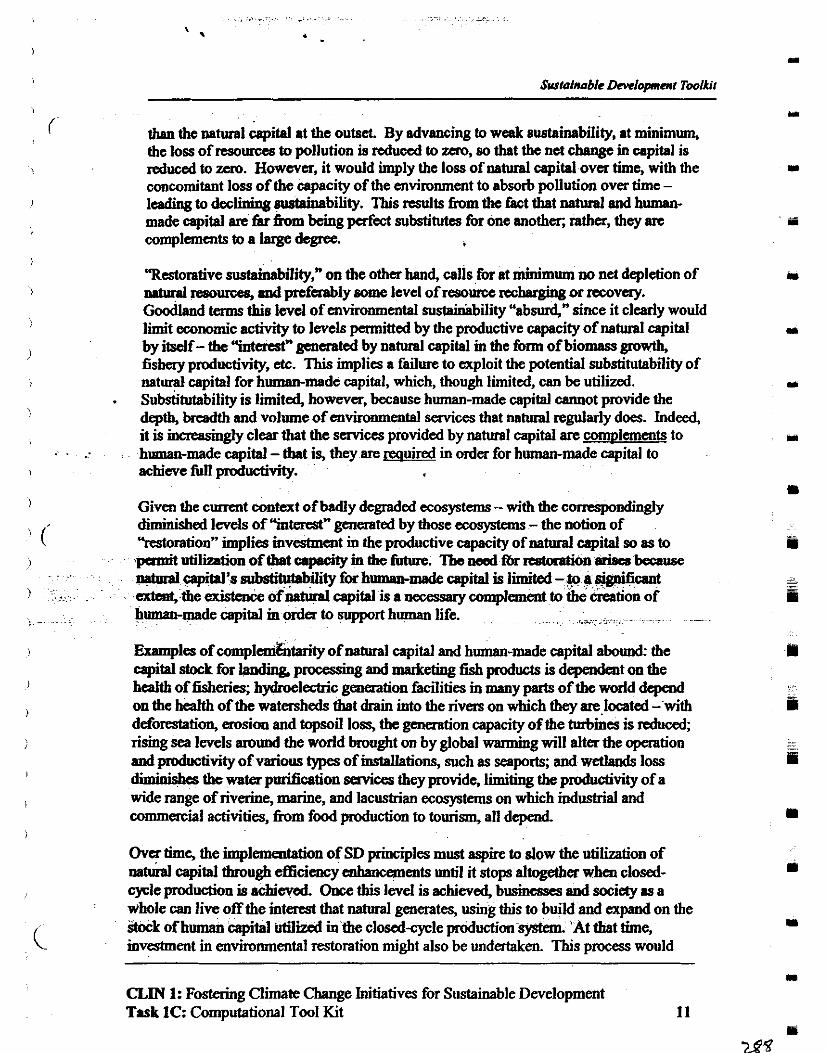
Swtalnable Developmar Toolkit
than the natural & i d at the outset. By advancing to weak sustainability, at minimum, the loss of resources to pollution is reduced to zero, so that the net change in capital is reduced to zao. However, it would imply the loss of natural capital over time, with the concomitant loss of the capacity of the environment to absorb pollution over time - leuling to declining sustaihabicty. This results from the fkct hat natural and human- made capital are far firom being pafect substitutes for one anothw, rather, they are complements to a lage degree.
"Restorative suddi l i ty , " on the other hand, calls for at minimum no net depletion of nalud resources, and prefaably some level of resource ncharging or -very. Goodland terms this level of environmental susEainability "abmd," since it clearly would limit economic activity to levels permitted by the productive capacity of natural capital by itself - the "interestn generated by natural capital m the fbnn of biomass growth, fishery productivity, ctc. This implies a failure to exploit the potential substitutability of natural capital for humnu-made capital, which, though limited, can be utilized. Substitutability is limited, however, because human-made capital cannot pmvide the deptb, breadth and volume of environmental services that natural regularly does. Indeed, it is inereasingty clear that the services provided by nattual capital are unnnlements to human-made capital - that is, they are muired in order for human-made capital to achieve fun pxuductivity.
) Given the current context of badly degraded ecosystems - with the mmqmdhgly
' ( ' diminished levels of "interestn genuated by those ecosystems - the notion of "restorationn implies investment in the productive capacity of natural capital so as to
I uamitutilizationofthataD.oitvmthcfutun. ' I b e n e e d f b r ~ . r i s C S b c a u s c . . .. .. . Ltml cspital's mbshtab'ility ;or human-made &tal is limited - F.9 bjpificant
) $ . . ~ ~ ~ . .,. . . . : . ,-:the o f d u d capital is a mcessary complement to the &ti& of h-made capital in order to &port h u p n life: . - . . . . . . . . . . ..... , , . . .. . . ~ .-
Examples of compl&tarity of natural capital and human-made capital abound: the capital stock for tanding, procasing and marketing fish products is dependent on the health of fisheries; hydmelectxic generation Mi t ies m many parts of tbe world depend on the health of tbe watersheds that main into the rivers on which they are located - with deforestation, erosion and topsoil loss, the genefation capacity oftbe turbines is reduced; rising sea levels around the world brought on by global wanning will alter the opefation and productivity of various types of installations, such as seaports; and wetlands loss . . . dummhes the water purification senices they provide, limiting the productivity of a wide range of riverine, marine, and lacustrian ecosystems on which industrial and commercial activities, from food production to tourism, all depend.
Over time, the implementation of SD principles must aspire to slow the utilization of d capital through efficiency cnbsncements until it stops altogether when closed- cycle uroduction is achieved. Once this level is achieved. businma and societv ur a &'can live off the interest that natural generates, using this to build and ex& on the
i stock of human capital utilized in the cclosedcycle production system. 'At that time, \ investment in &nmental restoration mightalso-be undertaken. This process would
CLM 1: Fostering Climate Change Initiatives for Sustainable Development Task 1C: Computational Tool Kit 11
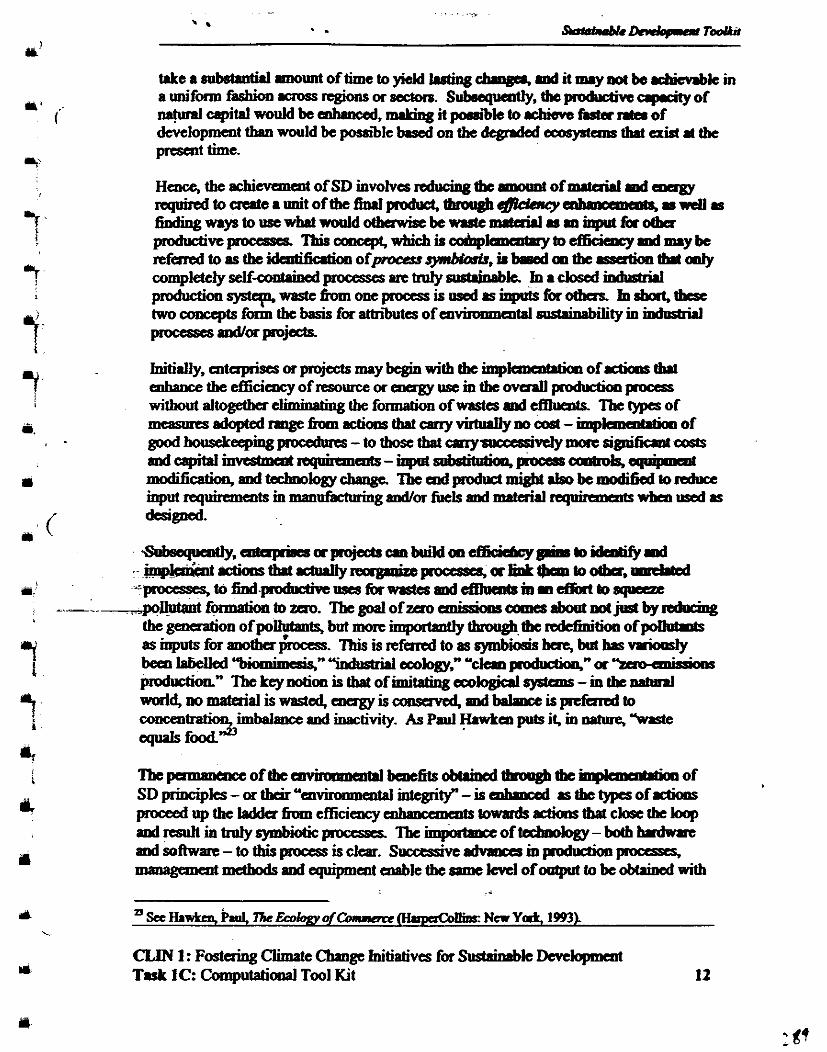
t r k e a ~ r m o u n t ~ f t i m e t o y i a l d ~ d u a l p a , d i t m r y n o t b s r c b i m b k i n almifonnf8shion~regionsor#dors. S ~ , t h e ~ p o d u c t i v s o f ~ ~ t a l ~ ~ u l d b e ~ , ~ i t ~ b k t o r c h i s v s h d a ~ o f d&lopmcnt thn would be possible based on the dcgdal w a n s tlmf exist 1 tbe prcscnt time.
Hence, the achicmment of SD invohres miwing the 8moW of mr0ai.l d magy r s q n i r e d t o ~ a l r n i t o f t h e f u l . I p r o d u d , ~ ~ ~ ~ 8 . . r r d l a f i i od ingwytousewht&othawisebew; r r t t~ . rm~f i *o tba pmdudjve proccsscg Tbis concept, which is d p L m x y to dficicncy md nuy be ~~fandtoutheidclltificrtiooofprwm~~k~ontherrsation~~ completely self- processes arc tmly smhbbk. h a closed bduhd
production systcfn. wastc~oaeprocesrisdsiapdsfixotbas. Indlart,tbcs two concepts fimn the basis for atbiites of at-tal tmhhbility m industrid 7 & o r p r o *
Initially, mtaprk or projects may bcgin with the kpB " of.ctiaostht enhance the effiacncy of resource or emav use m the ovadl produdion pocesr witbout altogetba tbe fo& ofwastes efflucds. =-types of m e a s u r r s s d o p t a d n n g e h a c t i ~ t h a t ~ v i r t u i I t y m c o s t - i m p ~ o f g o o d b o u s e k e e p i u g ~ - t o t b o s t t h e t a n y ~ . . - monsjgni6cauulsts andcapital- . - - - ~ a t b r h t u h o n . p w x a s ~ ~ ~ c a t b n , a n d t c d m o l o g y ~ Thcdprodudmigbt.laobemodikdtoreducc i n p u t ~ h m m a n ~ d m ~ I s d ~ d ~ - w h c n u s e d . s designed.
-Sobecqucdty,-mapojcctsm-mbidaqd ~ a c t i o n s t l m t . c t P a l l y ~ ~ a ~ t j m u t o o t b r r , ~
~ p o c x s s e s , t o ~ p o d o c t i P e m e s i b r w r r t e s m d ~ i o a c f i i m t t o ~ --gollutantf;ormationtozcro. 'Ihegodof~cmissioascatlesaboutmtjuabyredPcing
the g e d o n of pohhu?~, but morc impatantly th@ the mdctk&m of pdlaEoh asinputsfmanolfra&mss. Thisisrefdtoassymbiosisbae,butbsvriwsly been la6elkd "bnxnbzsi~.~ "hduhd &ologyPn uclem produbioqn a
. - pductkm" Thc key notion is tlmf of imitating C E O ~ systems - in tbe natmrl worl~mmataialiswsstcd,cnagyiscoascnad.dbrlsnceisptfimdto amcenlmth, imbalance and inactivity. As Pad Hawkat puts if m nature, ?mste equals foodd
CLM 1 : Fostaing Climate Chaoge initiatives fbr !kkbbk Devebpcnt Task 1C: Cornputatid Tool Kit I2
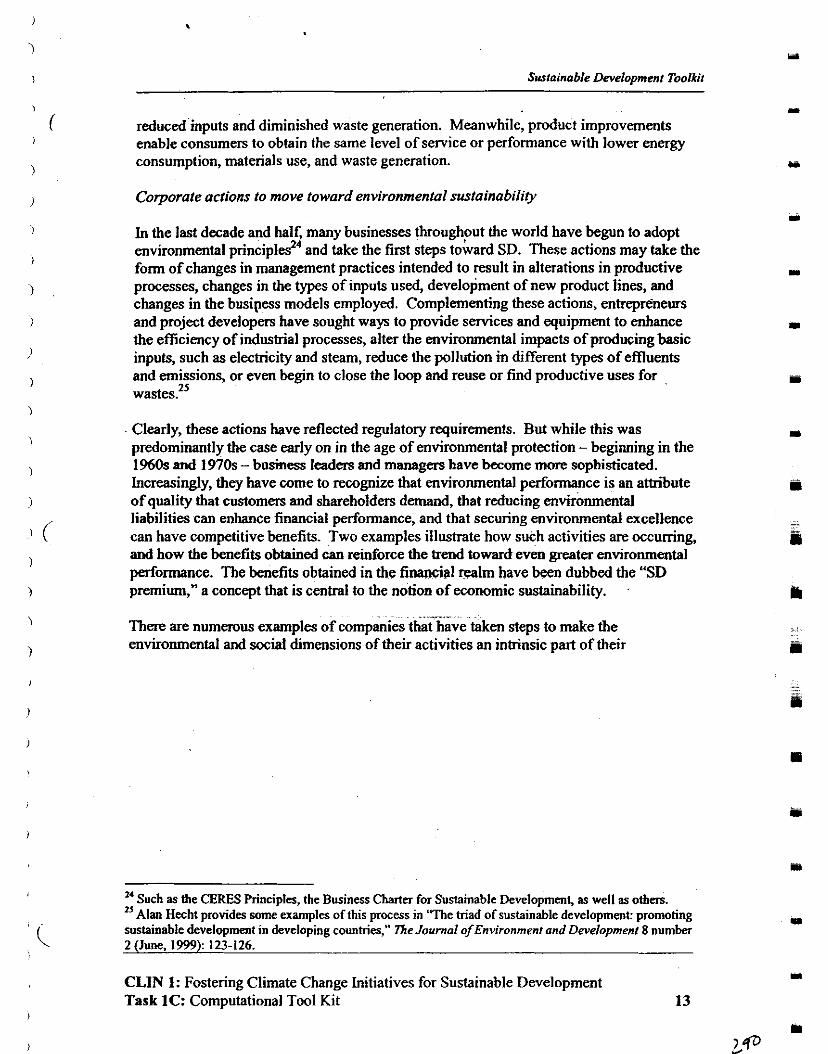
Sustainable Development Toolkit
reduced inputs and diminished waste generation. Meanwhile, product improvements enable consumers to obtain the same level of service or performance with lower energy consumption, materials use, and waste generation.
Corporate adions to move toward environmental sustainabili~
In the last decade and half, many businesses throughout the world have begun to adopt environmental principles24 and take the first steps tokard SD. These actions may take the form of changes in management practices intended to result in alterations in productive processes, changes in the types of inputs used, develoliment of new product lines, and changes in the busipess models employed. Complementing these actions, entrepmeurs and project developers have soughi ways to provide services and equipment to enhance the emciency of industrial processes, alter the environmental impacts of producing basic inputs, such as electricity and steam, reduce the pollution in different types of effluents and emissions, or even begin to close the loop and reuse or find productive uses for wastes. 25
Clearly, these actions have reflected regulato~y requirements. But while this was predominantly the case early on in the age of environmental protection - beginning in the 1960s and 1970s -business leaders and managers have become more sophisticated. Increasingly, they have come to recognize that environmental performance is an attribute of quality that customers and shareholders demand, that reducing environmental liabilities can enhance financial performance, and that securing environmental excellence can have competitive benefits. Two examples illustrate how such activities are occurring, and how the benefits obtained can reinforce the trend toward even greater environmental performance. The benefits obtained in the financial realm have been dubbed the "SD premium," a concept that is central to the notion of economic sustainability.
There are numerous examples of companies thaihive taken steps to make the environmental and social dimensions of their activities an intrinsic part of their
--
"Such as the CERES Principles, the Business Charter for Sustainable Development, as well as others. U Alan Hecht provides some examples of this process in 'The triad of sustainable development: promoting sustainable development in developing countries," 7he Journal of Environmenf and Development 8 number 2 (June, 1999): 123-126.
CLIN 1: Fostering Climate Change Initiatives for Sustainable Development Task 1C: Computational Tool Kit 13
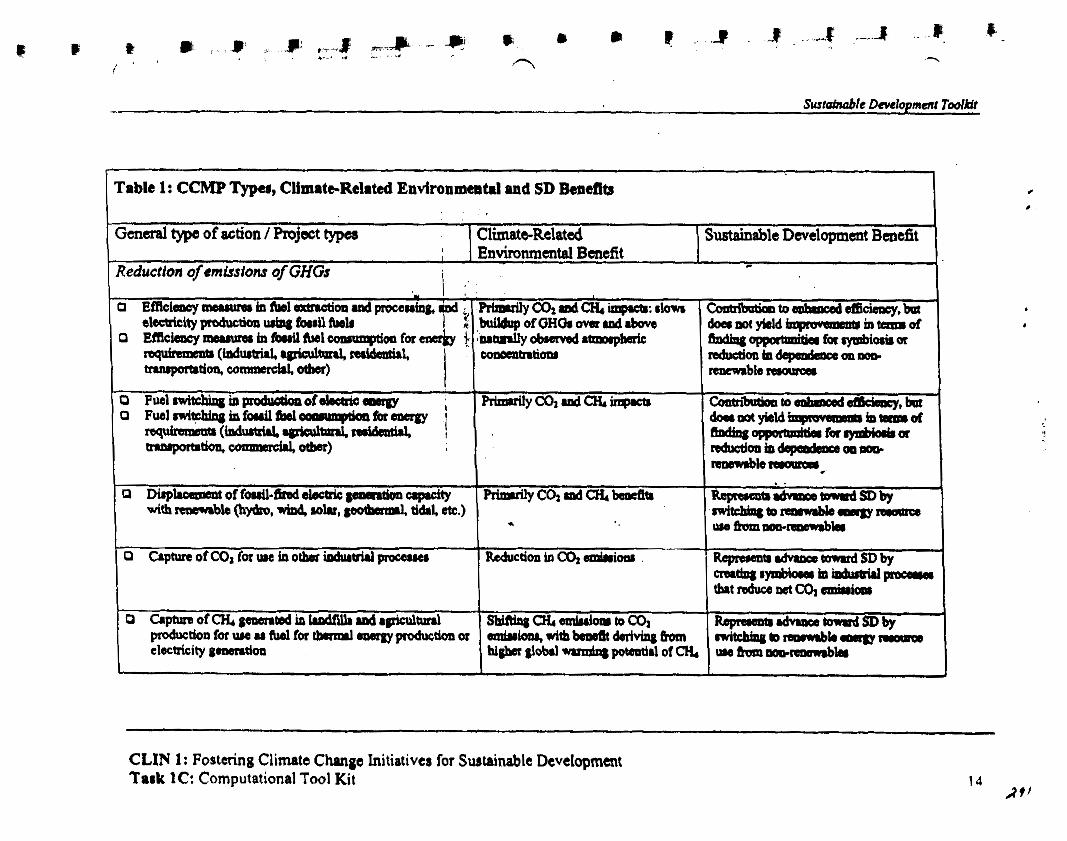
Table 1: CCMP Types, Climate-Related Envlronmentd and SD Bendlb
CLIN 1: Fostering Climata Change Initiatives for Swtainable Developmmt Task 1C: Computational Tool Kit
General type of action 1 Project typm Climat~Relatad Sustainable Development Benefit '
I Environmental Benefit Reduction of emissfons of GHGs -
I
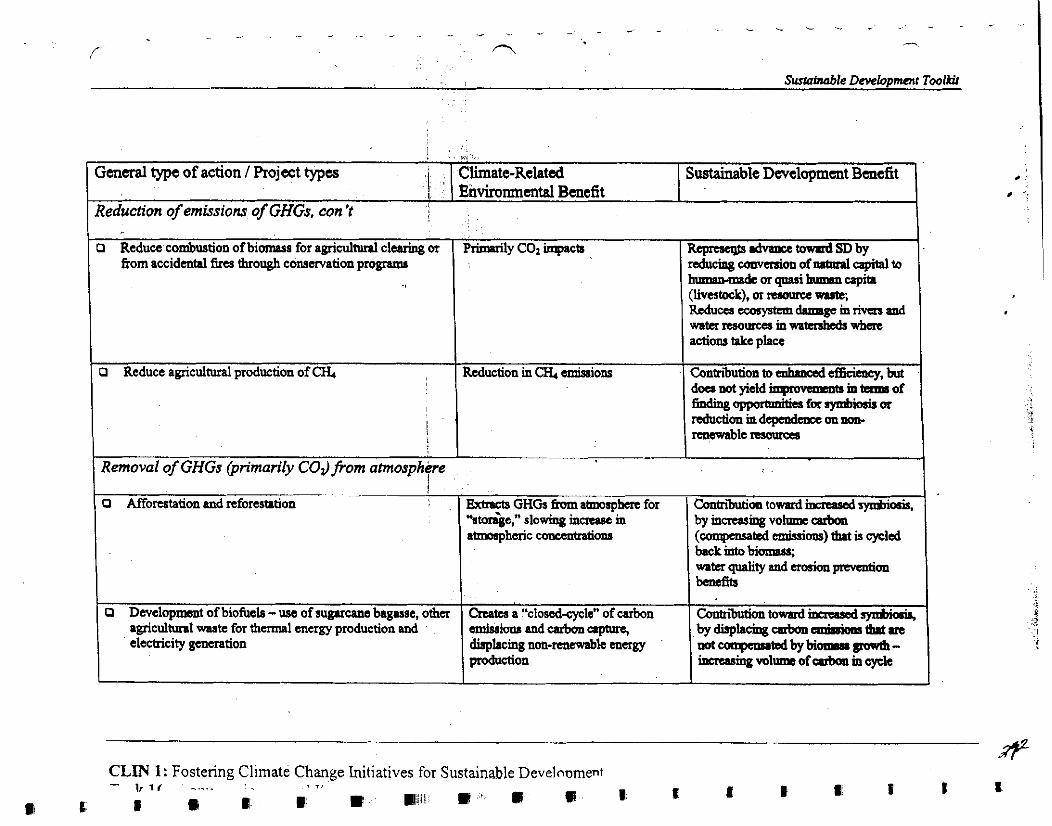
! * /
General type of action / Project types Climate-Related I I Environmental Benefit
0 Reduce combustion of b i m s for agricultural clearing or from accidental fires through conservation program
lnummmadc or qnaai bunrn capiia (livestock), or mource wute, Rzducu ccosystcm dmmge in rivers and ~11teIresolaecsinwabnhedswll~ actions tnke place
Sustainable Development Benefit
I Contribution to enhrnad e86cicecy. but d o a aot yield ' iutannsof
. 'edforaymbiosisor -1 renewable P ~ S O ~ O C I ~
Reduction of emissions of GHGs, con 't
Prirmrily C0, impacts
0 Reduce agricultural production of CI&
I -- I Removal of GHGs @rimariIy Cot) from atmosphye I
RW=W.dvaocetwJ=dsDby reducingeanvcrsionofnrharlcapitalto
Reduction in CH, rmigions
1
CLIN 1: Fostering Climate Change Initiatives for Sustainable Develnoment
~ b a ( m c s p h e r e t i ~ o n t n b u t i o ~ ~sdgc; slowing innase in atmoqhuic concen+mtiom
0 Development of biofucb - use of sugarcam bagasse, other agricultunt mate for thermal energy production and electricity generation
t o d inxascd SyDlLn*
by increasing v o h aubon (-tcd emiaio~s) h t M cycled back into biomsss; water quality and erosion prcvmton benefits
Cnatts a "oloscd-cycle" of carbon smissions and carbon apam, diaphcing non-renewable energy prodtlaion
Gmlributiontowardinensredaymbi& b y d i s p ~ c a b o n ~ d u t a n o t ~ b y b i o r m a g m r ( h - ~ v o 1 u m e a t m a o n ~ c y c l e
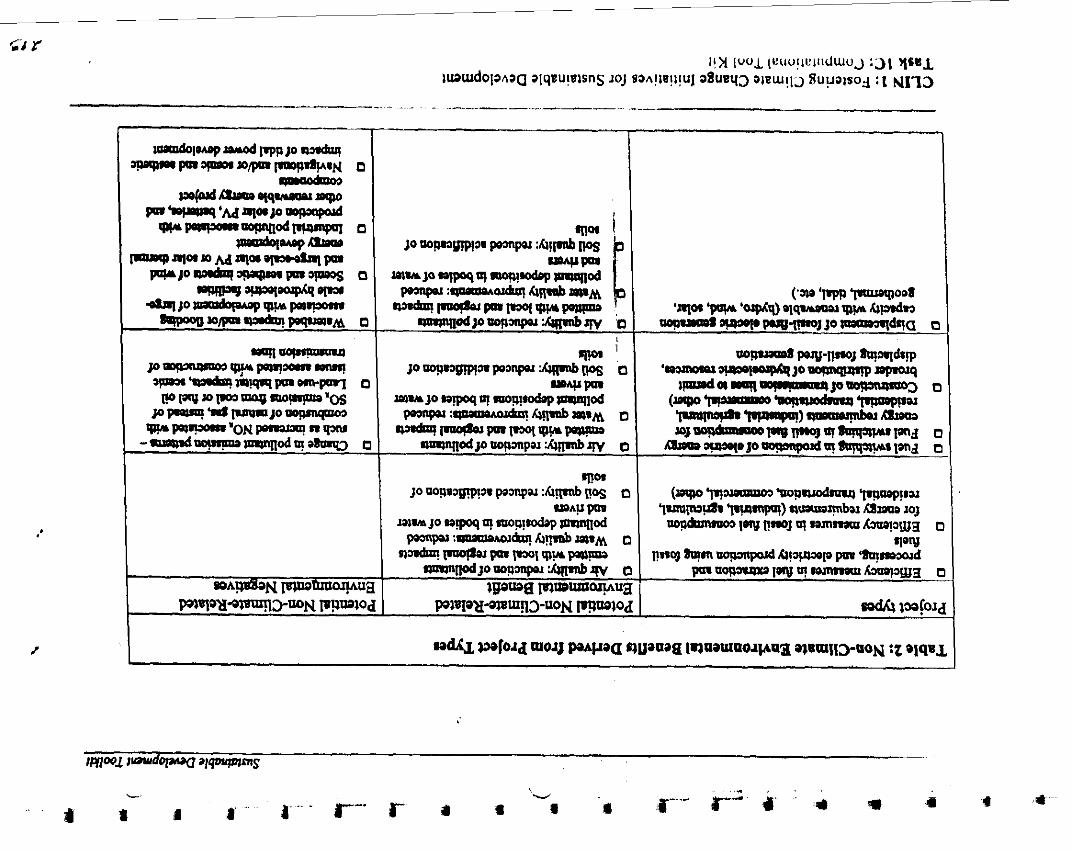
G4 r I l > l (uol (uuu! i~ : r~~duo j :;)I 1 6 8 ~
lu?rudol3Aaa aIqeu!vlsns JOJ s~A!~E! I !u~ aaueq3 oleu!l3 sup also^ : ( NI73 - -
,~=WD~IP~ IVP P wm m- pa m n/pm FODY*@N 0 -
~ - ~ 9 - ~ pm '-mm'M q m 1 0 ODP3(1POJd
W P a q # a ~ o d m p m p c r l O ~ o n o p -
m - P n l ~ m M n ( a ~ p m P W / O - m P r n @ P W 0
'WIW'wVW4W ~ 3 o ~ w p o o r p o m
~ ~ / p a q 3 l d m ! p o g r m s ~ ~ o
-"?I- P ~ ' P p p a ) r l - r o n n l v=+'rr j .dmlWmpm~-rn 0 I)oI@'u~Fo?Plorl~~'os
P F - - ! ~ I M ) P ~ o ~ w 'ON n q m
- ~ ~ + a s m r V o
-A!@~N w w u a PnItlQ?343'Wl3-QON PPmOd
- - ~- .. ..-.-..--.,-..7..-.--- -. ..
i
30 ~ R ~ y I p ! 3 1 P m v :r(ljFb nos
W ~ 3 O S S f p q o ( n O y r ! ~ S l q q o d Pempor :-- 4fw o * s ~ - l-F@J pol 1-1 gyn pqlpno
maplnoa~oao~=w~~w .D I m .
J O ~ ~ l n P ~ p o r ~ n o s 0 -wpm
m w 3 0 mmoq II! ='!wwPa)anod pQJnpY:-XUlmbm~~ 0 ~ ~ p m l n o l r p l r r ~ w -
~ m n o d ~ ~ p ~ n p o l ~ w o
'I!"' 30 uo!wamn planpa :xl@ FOS o
"@A!' pm m~ JO ~ 0 9 w m09!- UWII~~ ~: -~44nmbrPo@M 0 nndm!wWjpmlao1rplrrp1,~
m n o d ~ o w w : 4 m b JW 0 vgo-0 ~rr,-=wua
WWW*W3UON IWWOd
.-
(%a 'ppp ' p1qw8 'alW pqn 'WQ 01- rpP Qllrd.?
~ l q r ~ v w w p u ( l - n w ~ o ~ @ a o
w m poql-n-3 hqnlhn, ' - ~ l o l l o p n a q r l p r ~ p r a t q
~ W W I * J O W ~ W W * I ~ ~ a
(w 7-1- .POP- ‘I'I)w!~w ~UrnIKu* m) fl-b a m 103
' J O w lond EmJ r r l ~ ~ r(ntP1a~~a 0 'low
F=OJ hnm wwd k ! a p l o pm ' ~ s r a u d p r n ~ ~ w a ! ~ - ~ a u ~ a 0 .
Wdh 19?@ld
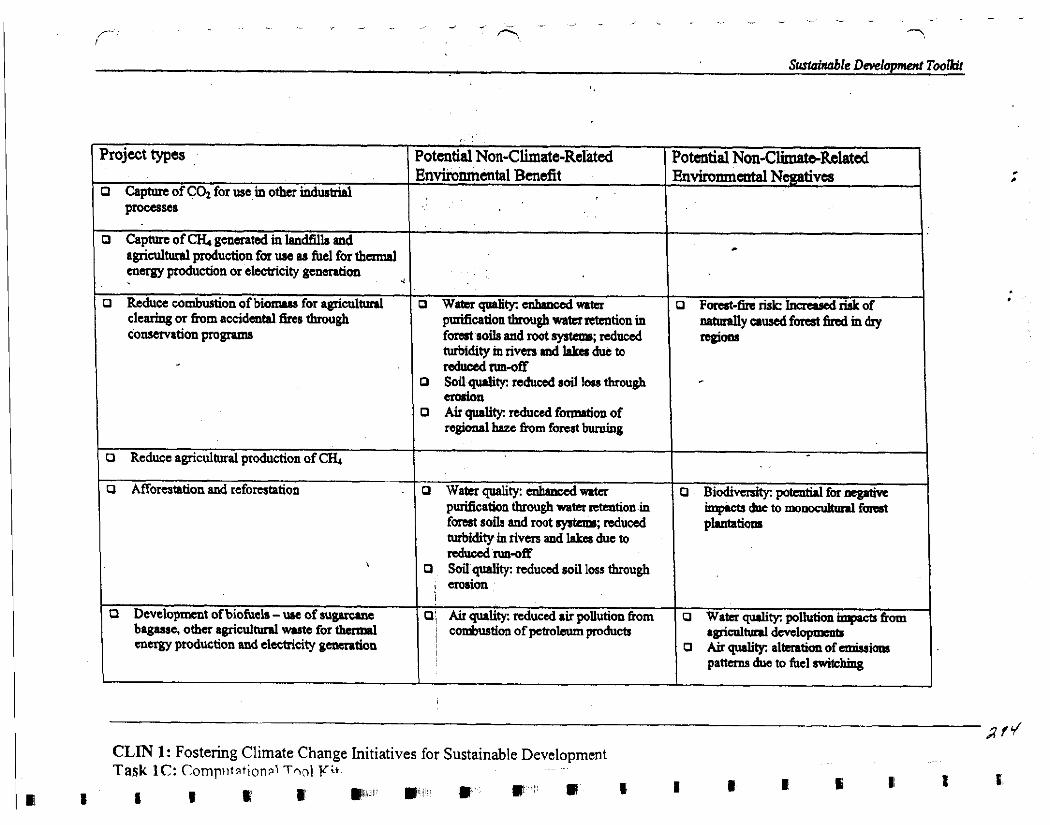
( Project types I Potential Non-Climate-Related I Potential Nan-Chat+Related
0 C a p e of C02 for use in other indusbhl procuses
0 Capnac of gco.cratd in landfills and l~dhld produdon f0r W M fuel for t b d energy production or electricity generation
fomt soils and root syaemr; reduced turbidity m riven md lrlm due to reduced nm-off
0 Soil @ty: reduced soil loss through erolian
0 Air quality: reduced f d o n of regional hazc from forcst burning
Environmaatal Benefit
- I I
I I 0 Reduce agricultural production of CH,
Environmental Negativa
0 Reduce combustion of biomus for agricultunl clearing or &om accidental fires through
0 Afforesmtion and reforestation 4
0 Water quality: cnhmced wter puritication through water retention in
0 F a a t - f i n r i k Inaascd ridr of nrturallyausedfonstfUedindry
0 Water quality: cdmccd wan puliiic~ticn through water ntention m fomt soils and root systans; nduccd lurbiditymrivasandl.lrtadueto reduced m-off
0 Soil quality: reduced soil loss through , emsion
0 Biodiv& potatid for negative i m p r c t , Q l c t o ~ f n s s t phtatiom
I ' I
CLIN 1: Fostering Climate Change Initiatives for Sustainable Development .~ . Task 1C: Compiitationrl Tqol Y;+
b , A', rn C L E I E' II L B I 1 I 8, I:
0 Developmat of biofueb - w of aug- bagasse, other agriculhml vwtc for thcmd energy producm and eledricity generation
0; Air quality: reduced air pollution !?urn I combuslion of petrolnun moductr I
0 Water quality: p o W m impam fiom a m i d t u n l dmlo~menb
0 & quality: altsntik of emiuiana panems due to fuel mitccbing
If: i
businesses and accordingly, their reporting procedures. In addition. a large numbes of business initiatives intended to establish guidelines or principles for busimss behavior - with environmental as well as social criteria in mine - have emerged of the last two decades. Many of these are summarized by Ranganaihan in the annex to ha article "Sustainability ru~ers . "~~
Linking SD with climare change benejiLt and CCMPs
From the climate change perspective, the relevant environmental impacts enwmpass emissions of GHGs - primarily carbon dioxide ( C a ) and methane (CK), but also othe~ gases emitted in smaller volumes - from various types of industrial, agricultural, or hamoortation activities in orda to m r c s n t an im~ovement in terms of the i n d u c t i o n of SD principles, eBorts at the enterprise level or projects will typically take one of the forms outlined in Table 1. What is clear from the presentation given there is that the scope of CCMPs, in t a m s of thc environmental benefits that they6&nxak may be more limited than the SD projects with the broadest scope of environmental benefits. Put another way, SD incorporates actions that address climate change, but not all projects
Detailed dewriptiom of tbc initiatives may be accessed at h t t p J / ~ . v n i . ~ r i t m b .
CLIN 1: Fostering Climate Change Initiatives for Sustainable Development Task IC: Computational Tool Kit 18
Sustainable Development Toolkit
addressing climate change contain components that make them SD projects. This is . illustrated in Figure s.~'
The 'harrow project boundary" for CCMPs refers to cases where the environmental benefits do not extend past the reduction in GHG emissions or the caoture of GHGs . - -. . - -
resulting b m theproj&t. Thismight be the case in the context of c h i n energy efficiency projects, either on the supply side or the demand side, where w actions are taken that address water consumption, materials use, or other impacts. In contrast, a project involving process reengineering intended to reduce water consumption and/or material inputs - with reductions in energy requirements and hence GHG emissions - provides an example of a "broader project boundary" case. It is arguably most difficult for EE and RE CCMPs to mconwass actions that would benefit flora and fauna or conversely, for forestry projects that provide significant benefits in terms of flo& and fauna, to generate emissions reductions (as opposed to the carbon capture benefits they generatc)-dess paired with a biomass generation project - and e m thm, the monoculture required for such projects may be of limited benefit h m a biodiversity sbklpoint. While all of the project types described in Table 2 offer environmental benefits in terms of reducing emissions or atmospheric concentrations of GHGs, certain project types offer more in terms of SD benefits than others. The non-climaterelated environmental benefits (%+benefits"), as well as possible environmental impacts, that each project type yields mast be considered.
There inay be negatives assixiated with the implementation of specific types of projects as well, as identified in Table 2. While many of the trade-offs associated with the project types described in Table 2 may be avoided or mitigated through proper project design; some could be more difficult to address. An example of fhis is the change in pollutant missions associated with the combustion of biofiels, especially for tramportation + w G . * h e Brazilian experience with alcohol fuels offes an example of how emissions of CO, NO, hydmmbons and other pollutants associated with gasoline - -- -.-. pow& engmes may be displaced with emissions of formaldehyde and other related compounds, contributing to more favorable air quality conditions in urban areas overall, but not without introducing new pollutants to the air quality situation.
Conversely, projects lmdertaken to addnss other =-climate related environmental concam, such as solid waste or water quality, may be implemented in such a way as to create opportunities to obtain climate benefits as well. An example of this might be the use of anaerobic digeston., which produce methane, in water treatment plants. The methane could be used to generate electricity or as a fuel for thermal energy production.
The toolkits that complement this document focus exclusively on the quantification, monitoring and verification of carbon emissions reductions, the monetization of the carbon 0s- (OfWs) t b t result 6rom these physical reductions, and the placement of
CLIN 1: Fostering Climate Change Initiatives for Sustainable Development Task 1C: Computational Tool Kit 19
~OfiktsontbeintanrtioarJurboamrrLet hnrcb,thtfbcurofcbscoap.llioa toolkits to this one arc narrowly focused on one upect of SD prkipks.
For enterprises as well as policymakes, arstrinrbilitynm.ttni amrbcmtritb c o m m a c i d a n d e c o n o m i c r t o l i t i e s , ~ t h a t a S D ~ c c t m u s t b c ~ d k - a v i s b k v e n h r r e g r o & o n a ~ l i d ~ e o a e e p t - a d m a c t m e econOmicbeaefitstothecommunitymdbroda~ad&moraicEmtcrtinwhiebit is implmwtd Ova the knga-tam tbe move tbwmd reduced m i x i a m ad waste yields what some aulys!s have dubbed the "sllstrinrbladmlopnent p s b " tbc financial payoff to businesses, especially nisting businesses. 6wn the imp- of ~~pr inc ip les .~ , h t h e l o n g n m , ~ c ~ i l i t y k ~ t o t b e p r o ~ o f S D ~ 'Ihis must be so, for in tbc &scam of economic swtahbility. activities that povide knefits in terms of Cmrir0maent.l mstahbility wwld depend atways oo g o k frmding or donetions - this would limit the ate& to whicb they wae imp- on the one hand, and woukl subject than to the vagark ofpotihicll and pubtic p r c f m
ilityimpliesthatthaeisahtaaialorarmwrcirl J n c o n ~ e c o m m i c ~ h t i v e to underhkt environmentally sustainable activities, tbacby cnrting tbe p o t m t i a l f o r a v h t u a n y a & m a t i c p o c * r r o f n p g n s i o n m d ~ ~
The supposed ternion between the pllrmit of cn ' ~~k~ ilityhasbecaasubjcctofdebrle. Coavadoml sbatcgiaandeumomicaaawb
~bastypicPllyhtldtbateconomkactivit iesdm ' hcomptibk. ~ p a e e p t i o n h r s ~ b e e n t h o o g b l ( o h b d d b v l r t b e r p a d o f
e t n @ a h n m c m r g i n e a x m m i q ~ l m s b e c n t h c ~ O f ~ ~ i n t h e ~ w o d d . H o w m r , r e c a r t c x p a i c o c c m d b m many countries and the work of co- tbeairb ddbgcs this view. Ibt nerw thinkiug argues that the incorporation of cn6mmaWIy susllinsbk prsctices ad insights, tog&cr with the hausformath of maaapnd pndkcs ad bPrirrcPs Mcgies , can lead to enhanced prolitability atid, to the dmt Um tby n 6 1 broodlyarough,couldevaldPmpentbe~cycksthathmb&lrtbebatof d c policymakas and politiciw eva situx the i dus id rcvoIutioan
~ i t i t y t o y i c M t b e c a m m i G t For cn- * ~ n & c s s a y @
achim long-range cmbmmcntal and social objectives, the SD pemirrm is bd@as&k -n i tbout i f tbaecmbcm~~t ive todopt"omrrhrrbkth intm9." TbaE
s e v d !ktors thrt d l the premium:
L CLM 1 : Fostaing Climate Change Initiatives for Sustainabk Dcvdoplncllt Task 1C: Computational Tool Kit 20
~. . . - . . . . ...... . . . . . . . . ~-:x-> ..~: , .:. . . .. ~, . . . . . Sustainable Drvclopmmt Toolkit
o Implementation of SD principles nsults in option creufion for the firm, meaning that new product lines, new processes, and new markets emerge, all of which enhance commercial opportunities for the
a Reduction in pollution and material inputs yields cost Ieverage opportunities, because ew-efficiency enhancements generate savings that go straight to the bottom- line perfinmancc of the company, - -
o ~ollution miuctions also permit substantial nkk &tion benefits for firms. enabling busintsrres to shed '-le" assets and prepare for tighter en-atal repiatio11~; and
o Implementation of SD principles positions bubin- better to offer products and services in line with customerprefeences, thereby enhancing market position and often, attracting new sources of capital.
I
As a result of each of these fztors, the premium can take the form of reduced operating costs, reduced liabilities pnd insurance requirements, new market opportunities and new customer bases. Clearly, in the case of CCMPs, the degree to which these benefits are obtained will depend on the type of projects undertaken. For example, a simple energy efficiency project is most likely to generate wst-leveraging opportunities, but may not create new business options for the h. In contrast, a cogeneration project implemented at a sugar mill, using state-of-the-art emissions control equipment, in conjunction with end-use efficiency rneesures could open up new revenuegenerating opportunities for the mill - sales of excess power and electricity, distribution or sale of organic fertilizer produced fbm fly-ash mvered in the anokatacks -thereby expanding the mill's revenuegenaating potential and not just the efficiency of its use of energy.
( The SD pmmium results in increased profitability for the fum or project, but it is also likely to drive capital formation at the firm l ed , althouph the patterns of capital -on may be diffamt in the case of a firm employing SD principles compared to one-that is not. Whae a campany is successful in the implementation of a SD project, . -auditgenerates higher returns on investment and increased capital formation, it is possible to assert that @e bigher efficiency of resource by the firm enables a more rapid pace of human-made capital formation, and hence more efficient transformation of natural capital into humau-made capital.
It is important to bear in mind that there are numerous ways in which the economic environments in which individual wmanies are forced to comnete are conditioned to . promote unsustainable activities. Such national and statelevel policies as subsidies (on water, hels, electricity, roads, mineral rights, etc.), fiscal spending, tax incentives, research programs and so forth are often designed to promote e ~ 0 m . c growth, job formation &d regional development, but in ways that fail to consider the environmental costs of the activities being promoted.
The distortions created by such policies may often appear to undacut the economic benefits of implementing SD practices - as in the case of energy subsidies that undercut the ewnomic viability of energy efficiency projects. However, the introduction of SD principles in a project or enterprise involves more integrated approaches that result in < CLIN 1: Fostering Climate Cbange Initiatives for Sustainable Development Task 1C: Computational Tool Kit 21
multiple benefits, some of which may oot inrmeciirtely nan -b - arh as a more mjoyable work mviroament - but & yield t.ngile bamfits m che medimn .ad longer tam. A book on SD, Nolvnrl GipWimr," coatrhv cma of building developmnts thal anploy SD principles, which yield h i e mta of productivitymtheworkforastheyhotrre,thatby.ccel~tber~~~vayoftbeinitirl i n v e s t m ~ n t m c h e ~ , w l t a , w l t a , a d a m m v a t i ~ ~ l m d a t r L m . ~ t h c outset
g o v m md in tan&d policies mart.rinn, -pror&tiaaautcaoctof ~ t i v e s t o i m D l o v e c n ~ t a l D a f ~ AWopphe;lrtv~o~mtbis~cr - . . favored u 4 - ~ ~ t r o ~ n style' regul.tion, f i c h its own sc of pavase M v c s , more rsmt initiatives have iacarpOrated iacentiva- d d d - based systems. wlth favorrble results.
As ampanics mckhke the longer-tam move toward .cbieving tbc goal of nso- emissionsandwastc,otbabaasf~onsocarrthtbcgintodcndtbc I benefits daiviag 6mn imp-ting SD prbc@Ics to bmak indiratom of- sustakbiiity at a mxmammmic level. A vmhrrr batd on SD piocipks b a d t s tbc m m m u n i t y d ~ n b a t i t i s ~ e d ~ j o b a u t i o n , b a l '.I benefits pdrcsomcerecovay ,~mbsoced~f l i v iO&.nd~of l l car educational m e g AII of these kaefits u m l r i i to lorn-tam social wdhrc. ~ v e ~ ~ ~ o r t b c ~ m n m ( a s w c ~ . s f l ~ ~ m d ~ ) ~ ~ ~ ~ ~ ~ ~ stability, and rcinfomxnmt of the trmd toward SD.
*, ,. .-*\ . I
Sincttbcproccssof-~mdev~c**wrctcdpdhltimAmmrk t h e c d t i d O n 0 f e o g i n e a i q g d ~ ~ i t L ~ ' - - qrapiliring C o n t i m p a l s o c i a l ~ Ham,thisproctssrcsultrmtbcfimnrtiaaof~ c a p i l a l , & ~ g t b t e m p ~ o n m p t d c l p i t P t ~ a ~ a ~ capifal)foreamomicaevdopmcnt. Soeiol~fomafionmbnnpomotatbe
ez&wama~t-ofwomq gcDdcr equality, aud mad of d k u b i d o n and baias to minority- Fimny,soeidcrpitalformation~tbc
innovation and dvmmnaa
H i s ~ t t o n o t t t M t b t p o c e s s o f s o c i a l ~ f o r r m t i o n r m y b c a s r m r b t b c dcsind but indired r d of c o m p ~ l y adom to i m p h d SD principks, as tbt dim3 rsuh of corporate sctions in support of local eduatioorl institutions, scbolarsbip d
CLIN 1: Foskrhg Climate Cbmgc Initiatives for SushkbIc Dmiopment Task 1C: Computationel Tool Kit 22
internship programs, or simply community relations and oulrcach. The latter is especially important in the case of indltstrinl facilitics whcrc ha'ardol~s niatcrials, processes or equipment are present.
The broader, community-based economic and environmental benefits and longer-term prospects flowing from a project may be characterized as attributes of social sustainability. This is critical, for in emerging economies, such as India, people cannot and will not allow environmental protections and other regulations to stand in the way of improving standards of living and opening up economic opportunities for their children. Therefore, any tmly useful notion of SD has to be'grounded in the need for equity between generations as well as among groups in the current generation (within countries as well as among countries). This notion of equity is not simply an environmental consideration - it,is a social, economic and above all, a political one - and is vital to the socio-economic sustainability of a project or business.
Social capital and human capital are necessary elements in the efficient utilization of natural capital and its transformation into human-made capital. Human capital refers to the actual labor force involved, while social capital refers to the cumulative body of knowledge and experience - management, engineering, scientific, artistic and so forth - that successive generations of workers, scientists, engineers and managers must absorb so that the process of adopting SD practices moves forward as opposed to backwards.
As companies implement SD principles, they must inculcate these principles in the workforce, and in their search for solutions to the challenges of conserving resources in production processes; they stimulate the development of SD know-how in their workforces. The body of experience and knowledge that is developed in this way is vital to the continuity of SD at the societal level as much as it 7s essential at the enterprise level.
More important, theorists of SD argue that companies that manage to reduce their utilization of natural capital - an industrial input that has traditionally been undervalued but is becoming increasingly scarce - will re-orient their production processes to utilize more human capital andlor human-made capital. In countries where well-trained as well as unskilled labor (human capital) enjoys a comparative advantage, as is the case in India, the societal and macro-economic advantages of an approach predicated on SD principles are obvious.
CLIN I: Fostering Climate Change Initiatives for Sustainable Development I
Task 1C: Computational Tool Kit 23
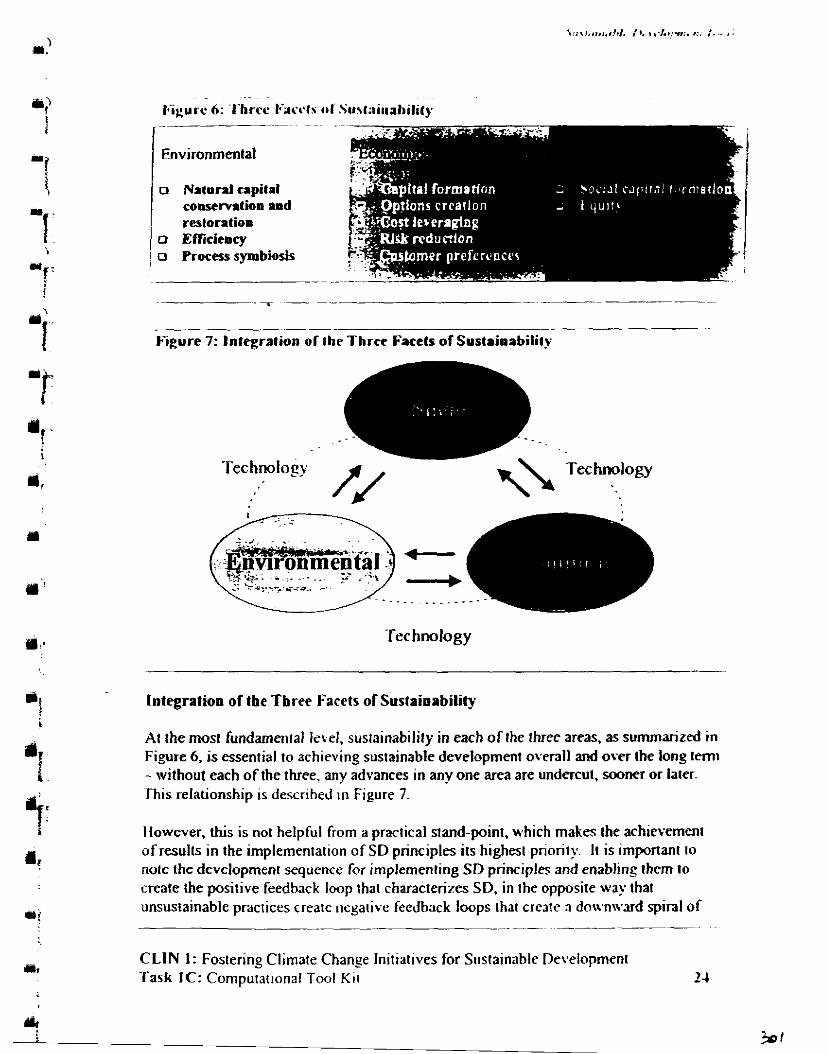
I*'igure 7: Integralion of Ihr Three Facets of Suslahabilily
Technology
Integration of the Three Facets of Sustainability
At the most fundamental lskel, sustainability in each of the three areas, as summarized in Figure 6, is essential to achieving sustainable development overall and over the Ions tern1 - without each of the three, any advances in any one area are undercut. sooner or larer. This relationship is described in Figure 7.
Ilowever, this is not helpful from a practical siand-mint. ~ h i c h makes the ach~evernent of results in the implementation of SD principles its highest priority. I t is important to note the development sequence for implementing SD principles and enabling them to create the positjve feedback loop that characterizes SD. in the opposite way that unsustainable practices create negative feedback loops that creare a doc\nn.mi spiral of
-. ~.
CLlN 1: Fostering Climate Chanse Initiatives for Sustainable De\.elopment Task IC: Computat~onal Tool Kil 2-1
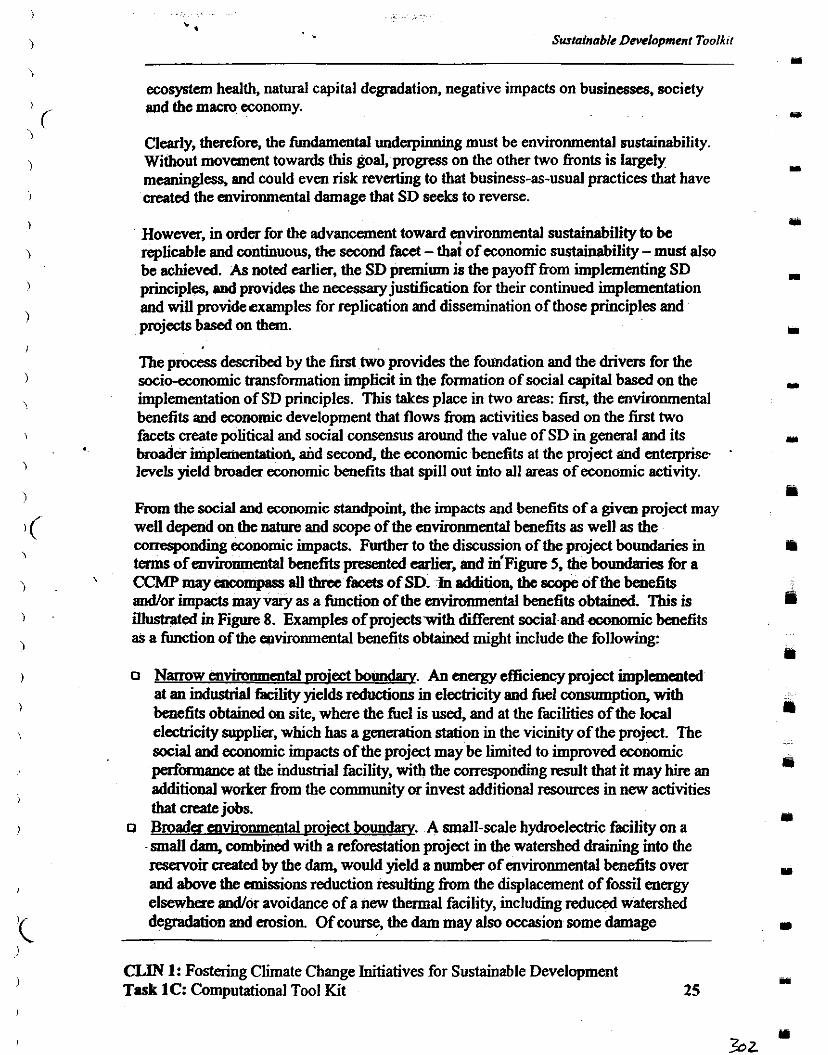
ecosystem health, natural capital degradation, negative impacts on businesses, society and the macm economy.
Clearly, therefore. the fundamental underpinning must be environmental sustainability. Without movement towards this goal, progress on the other two fronts is largely . .
meaningless, and could even risk reverting to that business-as-usual that have created the environmental damage that SD seeks to reverse.
However, in order for the advancement toward environmental sustainability to be replicable and continuous, the second facet - thai of economic sustainability - must also be achieved. As noted earlier, the SD premium is the payoff b m implementing SD principles, and provides the necessary justification for their continued implementation and will provideexamples for replication and dissemination of those principles and projects based on them.
The process d e s c n i by the first two provides the foundation and the drivers for the socioeconomic transformation implieit in the formation of social capital based on the implementation of SD principles. This takes place in two areas: first, the environmental benefits and economic development that flows from activities based on the first two facets create political and social consensus mund the value of SD in general and its broader implementatio6, ai~d second, the economic benefits at the project and enterprise levels yield broader economic benefits that spill out into all areas of economic activity.
From the social and economic standpoint, the impacts and benefits of a given project may well depend on the nature and scope of the environmental benefits as well as the ccmsponding economic impacts. Fuiher to the discussion of the project boundaries in terms of environmental benefits presented earlier, and in'Figure 5, the boundaries fbr a m m a ~ e n o o m p a s s all three facets of SD. h addition, the scope of the benefits and/or impacts may vary as a function of the environmental benefits obtained This is ihhated in Figure 8. Examples of projectswith different social a n d ~ ~ ~ n o m i c benefits as a function of the environmental benefits obtained might include the following:
o Narrow envimnmental ~roiect boundaru. An energy efficiency project implemented at an industrial facility yields reductions in electricity and fuel consumption, with benefits obtained on site, where the fuel is used, and at the facilities of the local electricity supplier, which has a generation station in the vicinity of the project. The social and economic impacts of the project may be limited to improved economic pafkmmme at the industrial facility, with the corresponding result that it may hire an additional worker from the community or invest additional resowes in new activities that create jobs.
o ~ r o a d a ~vironmental proiect boundary. A small-scale hydroelectric facility on a small dam, combined with a reforestation project in the watershed draining into the
* - reservoir created by the dam, would yield a number of environmental benefits over and above the eani&ions reduction resu]ting from the displacement of fossil energy elsewhere andlor avoidance of a new thermal facility, including reduced watershed degradation and erosion. Of course, the dam may also occasion some damage
CLIN 1: Fostering Climate Change Initiatives for Sustainable Development Task 1C: Computational Tool Kit 25
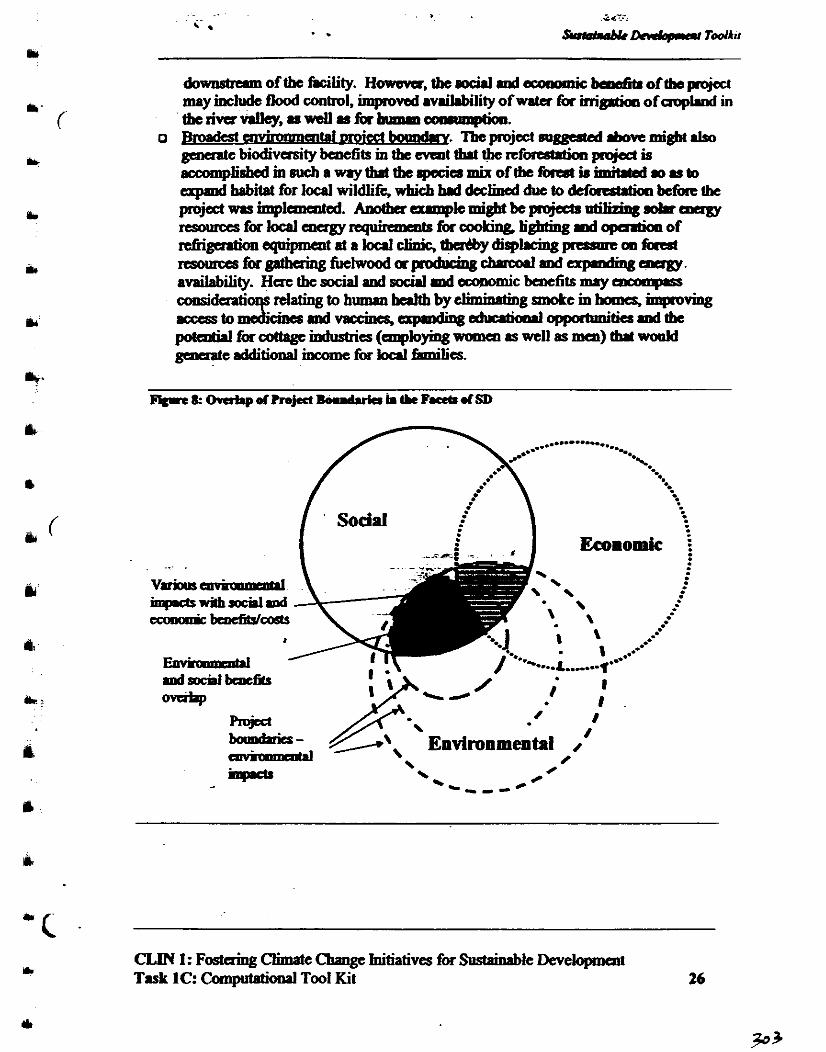
downstnrm of the hcility. Howsvor, t h e d d e c o o m t i e ~ o f t b e p o j & 1 may inchrde flood control, bqmved anilrbility of wrta fk inigrtioa of cropland in t b e r i v a n l l s y , r a w d l n f k ~ ~ .
o ~ ~ t a i ~ c c t b o m d o r y . . ' l l ;epmjcct~ .bovemig~l lso d c biodivusitv benefits m the evmt tJmt the reforrsbtion aoiscc is & ~ ~ h & a ~ t h d t h c ~ ~ m i x o f t h e ~ i r * k * , . s ~ ~ h o b i t r t f b r M w i ~ w h i c h h d ~ ~ d u e t o d e f ~ ~ L b c pmjectwasimplanmtcd. A n o t h a e x r m p l o m i g M b e p o j s c b ~ a o h e a r g y r t ~ ~ u r c c s f o r ~ a r a g y r e q ' ~ f b r c ~ o k @ . l i g h t i n g m d ~ o f
sqnipaent a! a local clinic, tberCby displrciag prcgme m f h x l ~ ~ g r t b a i n g f u e h v o o d a p P d P c i n e ~ a u d e x p m d i n g a m g y . availability. Here the social aud sod.l d d c barefits nuy mmqmss
wxxssto poMi.I for cottnge industria (anpbying woma as well as men) tbrl wonld gamate additional hame fbr ioal fhilies
. ... .
imp Ic t r~ roch ld c c o n a n i c w w
md sairl bmt61s 0-
I Environmental 8 /
inp.ctr /
- .. - - - w e /
CLIN 1: Fostaing C?imate Change Initiatives fbr Sustainable Developcat Task 1C: hnpumional Tool Kit 26
. Sustainable Dhrclopment Toolkit
This section builds on the conceptual discussion presented in Section 3 to provide a tool for assessing the extent to which a project or enterprise is implementing SD criteria. Quantitative as well as qualitative yardsticks for assessing the d e w to which projects and companies adhere to SD criteria are presented for each of the three of SD. This section also provides a critical path to guide .developers of climate change mitigation projects (CCMPs) through the project design process and implement these sustainability criteria. Jn addition, this section describes the linkages between this toolkit and the four other toolkits developed as part of the Greenhouse Gas Pollution Prevention Project.
I
Measuring and Assessing Environmental Sustainability
The p m x s of implementing measures to enhance environmental sustainability begins with the eohancement of resource-use efficiency (energy efficiency, waste minimization, water use reduction), followed by the implem&tation if rneasur& intended to slowly' squeeze the volume of waste material generated by industrial facilities. Although opportunities to exploit symbioses between industrial processes may sometimes be available at the same time as opportunities to invest in efficiency, it is likely that opportunities to exploit input-output symbiosis will emerge only in the context of close coodimtion and communication between companies from different sectors and access to information that might otherwise be considered confidential.
From the perspective of CCMP developas, many of the l p i c engineering andyses that form part of any feesliility study provide al l the information necessary to evaluate the extent to which apmject or corporate initiative moves toward the goal of envhnmental sustainability. Specifically, two (closely related) engineaing measures may be usad as sustainable d&efsent indicators:
* 0 Dewloping dm balancesforpr@ects. Before developing narrow measures
of process efficiency and resource consumption, it is necessary to develop integrated assessments of resource use and lnocess efficienc~~throueh the maration of a detailed mass-energy balance for-a given project or &s. ~ i e bdance is intended to identify and quantify all material and energy inputs and outputs h m a process or saies of processes, and is helpful in tracking down areas of opportunity to reduce waste and inefficiency. Mass/energy balances for a project or process may be expanded upon to identifl where specific waste streams may be directed to reduce resource waste further.
0 Measurements ofproductivi~ in resource utilization, usually in terms ofunit ou@ml. Such m e - might include measures of energy consumption per unit of production (electricity consumed per unit of production, water consumed per unit ofproduction, or he1 consumed oer unit outout). In sugar mills. for exam~le. one measurement that is o h used as a &ugh yardsiick of is ihe'consumPtion of "steam on me," or the steam (measured in tons) required to mill each ton of
CLIN 1 : Fostering Climate Change Initiatives for Sustainable Development Task 1C. Computational Tool Kit 27
mugmame A s i m i l P m e w r c i s t h e r c q u i r a n a t t ~ f f k r i l M ( ~ M o i l ) ~ tonofcmtcrushcd
o Resourn awrnunprion ojmdprodud. Ooe of the most impatd . .I impacts of a given product is o h its lifetime ofrrrolnmwba~ a n p l o y c d a s d i n d t d b y t b e m s n ~ . Tbaemayben~ ' a I-to bee~rploitedby&goingthepmdudtobemoreeffi&alodirpaPewithawr~y orwrtainputsaltogethcr. I n t h e i . t t a c s s e , q K c i r l i z s d ~ a u d c o o ~ n w W m r y b r c g u i n d .
T h e ~ t s o f r e s o l n c e ~ b y t h e m b p a f u d w b r n o p a d d a s dh-edtd m simikr to the production pmcss itself- the masureo mi@ involve wrrtacoosao3ptioqnwrmtai.laseqopaatbdinputssucbasd5gamUsa0il. and, of course energy. Comumption w d t d to be meaarrsd m tums of ~mit olltpat,distmcetnvekdorduntiooof#nricc.
o M e ~ n a * l g r $ c y c l a b i l i r y a n d u s c o f w r a r t e w ~ n r o r a i o k i u ~ p * a c c u . InthecontcJrtof~onofawidcwgcofconsmna~.swdla~k goods, capital goods and the anuhuctioo of vanJ- types of Rcycled m r t a i a l s c a n b e ~ r s t e d m t o t b e ~ u t ~ t h c r t b y f e d u c i o g t b e p s + o f ~ materials. The recycled ~ o t a t of many podud types, such as prpa d podogink plastics and gbs, shipping pallets aud a wide rsngc of other prodPcls rre .Irady regularly reported. In addition, the degree of rqdability tht is desipd i&o ~leaudcapitdgoodsis~impoltrntiodicrtortbrtisbcginniqgtobe .doptadmsevadsedors,such.sartomabiks.whitcgoodr.;rdocba~itans C1~thisismimportsntintanalmanqb~itonfybsmrningarocumpk of the inrpkmcntatkm of SD prhcipks once a p k g m hr lbe~vaing md mqchg thatcontentismpiace. ' I b a e i s o o v l l u e , ~ t h e ~ v c o f m ' -1 sustabbi l i ty, tosaythasornctbingisncyrlaMeandnothLethe~~eps a c b a n y ~ t b r t m a t a i a l Utilization0fotbawir~mrtai.lsiS.hpD -we=Wwl== 5
'Ibis type of analysis forms the brsis for the tachnicrl mahaation of w.k&ts in tamsofreductionsmGHGemissions,as~bcctm~detailintbeToolLitoa Baseline P q m t h imd the Toolkit on Rqarbg M o i h i q and Vai6ation Ro(ocoEs.
T h e ~ m e ~ s u r e s t y p i c a n y a s e d t o ~ r o y ' toppomdyrerelcvat intbe8+ressmnlofcconomic~fty. AUofthesamcissmngPldisgtbc ~ m o f r i s i r q p t y m C C M R - . s i s r m d e c k P m t b e t o d t i t m t b e c r b o a ~ modd Hawcvn. thert n .Iso .dditknui mcgufa involvina tbe mvisim of crboo
CLM 1: Fostaing Climate Ch;mgc Initiatives for Sus&iaabk Dcvelqrmcnt Task 1C: &"putational Tool Kit 28
o Conventional mearuremenfs offlnancial wtainability. Corporate actiom that enhance efficiency or even yieid procars symbioses must be kbjected to the same sorts of W i a l evaluation and scrutiny that any other investment receives. Even in - cases where compliance with regulatory requirements is at issue it is possible to argue that decision making is consistent with the pursuit of economic returns - in the context of regulatory c&pliance, the avoidance of fines, legal feee m litigation, and the cost of bad publicity in terms of negative press.
Among the conventional measures, projects may be evaluated on the basis of cost-benefit analyses, the calculation of net present value (NPV) and i n t d rate of return lIRR). So~hiSticated financial valuatibn techniques, such as the cauital asset . . pric&m&el (C'APM) and the weighted average cost of capital (WACC~ for the firm, or advanced financial instruments such as options and other derivatives, may also be emplpyed in the evaluation of such projects. The d t s of thew analyses and financial innovation may be p m t e d in the broader context of business and investment plans and strategies where risks and retums on investment arc evaluated, corporate budgets or risk capital and debt are solicited, and are often communicated tu company shareholders, customers and regulators in annual reports and other oresentations.
In short, all the same analytical techniques and procedures for presenting and implementing projects - either as internal investments by companies, new ventures - - - an;f project finance opportunities - apply tothe evaluatihn, p&entation and imolementation of CCMPs and SD -tcts. These messures ~roVide the best &eat of managers or project dev&pers of the financial -kurns of a given investment. If the results indicate that the prvject meets the necessary criteria for investment, then it can be said that the is likely to be financially sustainable according to the information available to developers and managers at the time.
u Rethinking business modeb - service ~ p k z i u c t ! Much of the thinking about bow to align bushes inten& with enviromnental mskhability wnceans cater on methods for making the prcducer mponsiile for the product throughout its entire
- --l%cyc1e, h production through use and finalh/ to final disposition. In this way, the environmental impact of its creation, use and disposal are translated into costs to the producer (andtthrough pricing, to its user). The purpose of policies such as those in Germany requiring a certain degree of recyclability in products such as automobiles, produd packaging, or white goods is to inkmake environmental costs. Clearly, this approach can p d u c e the desired d t s . But just as reengineering production pmessa can yield significant environmental benefits, so too can reengineering business models achieve the desired outcomes -bypassing the regulatory driver.
These results can be achieved when the customer's mtenxt and the enterprise's intewd are aligned, as opposed to being counter posed. This is done by mgaizing that when a firm produces a tangtile product - whether for the comumer, the industrial customer, or government -it is really delivering the service of the p d u c t as opposed to the product itself. That is, an automobile manufacturer sells cars that provide their owners with tmqortation and the ability to move cargo, more than the car itself (of m e , this is generally, but not always, the case). If the automobile m a n e offers cars on a lease ("service")basis, with the commitment to take it
CLIN 1 : Fostering Climate Change Initiatives for Sustainable Development Task 1C: Computational Tool Kit 29
brkrttheendofitsutefultife.hthem~ofpirrcbr#.Ild:~~ye alignad -they benefit (make money) m the same way, by atmc6ng maimma ~ n ' t y 6 o m ~ ~ - m d . I ~ l i t y h ~ a t t h a s 8 m c time that m i l i t y is cmr~ed"
T k intaests of both sides arc alignad because tbe reelP to ddiva thevcbickbtheuscr~tbemoslcBeientwry~'blc,~oaadedp thrt enables it to m o v a as much or (ubutdy) dl of the vcbick it cm, nbik tbe ips
~thebest~blcvthickl~pcovidemob~md~gbtcgrbititytbrtit raquires. T h c r m m ~ ~ t s f i w t h i d ~ m o d d b e a u # i t c s & b ~ a long-tam client relationship. as apposed to a'omoff- d pwides tbe man~'lvithmorewa~to~lCOQ14buildupitsarse(bos+..Ildobt.intu benefitstbrwghdcpreciation. Tht~#r ,minbt rg ,cao~bgahrnto tb t u s c o f ~ g o o d s ~ c r p i ~ ~ 1 , i s a r s u r e d o f i m p o v d s a v i e e ~ t b e m ; m ~ , ~ r c d u c a d c x p u s w c t o ~ . p e ( ~
M~thedcgrcctowhichacomprr)rorpojadis .doptisgaravia orientation as opposed to a con- srlcs model is mcesslrily a q t m h i k ~ ~ c t h e ~ o n o f r r t u m o n m ~ t F u r i k . a s a v h u h t a J ~ p p r o a ~ h i ; n o t ~ ~ k t o a l 1 p i o d u d ~ . ~ n P s r c s s n c n t o f & b e t o ~ this is achicvd might begin with a simple question as to wbc&rs a not poduas arc p l a c e d a s p a r t o f a ~ a ~ r s o p p o b a d t o d e l i v a y o f t b c d . k a c A ~ h t r e l a h d q u & i o n i s t b c ~ o f ~ ~ t h a t t b c ~
swabable way cvcn if tbe savicc orienEstioa is not a part of the aaojm~y's bushes model. AWoogb the measure of tbc dcgmc of rtcyclabiity is rm indic*or of en lslstrinrbility,itm~beconddaatmthe~~~ltatoftbtmrp~cmeat of an ~I@IK&C baausc the m w t n l k f i t .caucs only when tk ~~
c h P r a d e r i z e d b ; ~ ~ e ~ i s i s r w a o f w r s t e ~ ~ c o s t . Roduc t ionneng inar ing~WOn - " - l g p r o d u c t i a n ~ m c manu!idmkg pmces - mcasuns such as dq~io1) of just-iptimc prPdias, nsirhg ~ p a c s ~ f d r e d u e h r g t b e m a n k r o f s t q g m ~ p r o d u d componeots,fkcxmnpk-eanraducestongetiws,eliminrttllmraces~lry process inns tc~nduecewt .nd&~ AaatrPlabsantioainvolrcdm
CLlN 1 : Fostaiag climate Change Initiatives for Sustahabk Dmlopoeot Task 1C: Computational Tool Kit 30
Sustafnable Development Toolkif
unproductive assets that go with thcse phenomena. The latter bas been dubbed "flow.")'
How flow might be measured depends on the nature of the enterprise or project unda study. In genernl terms, the degree to which flow is observed will depmd on the number of points in a productive process - as well as in its relationship with other processes outside the boundaries of the process under study - where the speed of transformation changes. An m m ~ l e of this might be in an automobile rssrmblv plant, whcre hun& of componr&ts arc receivad, organized and p d (assembled) into finished vehicles. Multiple production lines for components must all coalesce into one 6nal assembly line, with the'flow of components calibrated to the speed of every other. If a specific component, such as a mirror, requires dozens or even a hundred steps to produce, any effort to simplify its production will improve the o v d flor of production. In cases where multiple models are produced, the potential for mismatches of demand end supply increase, thereby increasing the benefits of creating flexible man-g processes (using easily shaped - and recycled! -plastics, for example) that enable a small number of production lines to turn out multiple model types.
The measurements used might therefore include indicators of velocity of output at all the various points in the production process, as well as measures of the accumulation of raw materials, pda l ly processed product, and final product at the various transition points in the procas. These accumulations might be measured in terms of daily or monthly output. In those points, as well as all others, ways to shift h m "pushn to "pull" processing should be identified.
There may be cases, however, where accumulation might be justified precisely on the grouhds of environmental benefit and sustainability. In sugar mills that implement bagase-fid c o g e n d o n in conjunction with efficiency measures to reducesndevcae~theneed~llstoffutloilbrnsturelgas,energy reqhments snd gemation capacitymay be exceeded by the volume of bagasse produced during the crushing season. In such cases, one possible strategy involves storing tbe bagasse for combustionfo~-at4east part of off-season. To the extent that the storage M t i q prevent degradation and rotting, this accumulation of fuel may be justified.
Measuring and Assepi.g Seeid Sust.inability
Social sustahbility is the mod difficult facet of SD to assess and progress in this area is arguably l e i amenable to quantitative measurement. As in other areas of social science, however, certain statistical and data collection techniques are applicable here. To begin with, broad, -c and demographic indicatm will provide information relevant to the assessment of ~ropless in this area as well. In addition. good record- . - , - keeping on the part of companies involved in projects with social components, as well as those concerned with communitv develoument activities. will also vield adeauate infomation for gauging in this &a
-
CLIN 1: Fostering Climate Change Initiatives for Sustainable Development Task 1C: Computational Tool Kit 31
w&as md in the cont&t of r project a mpomtc initiative Tht &%uyxSsful b W o n of such tlmjacta rs well .s tbcir r e ~ l i a t h elrtwbse. - - d e p e n d s o l l & ~ t t m t t o w h i c h t b c ~ p n c t i c e s , b a c i m i a l ~ m d results of the project IIC well rmdastood, d; t 4
. - . upanbymmvgcrsandcmployag Thepammmceoftberesaltrof~pojcctmry .IBQ dqmd OII the amount of bllowon baining md review included in the
firrmrtion*idesrs.ifthermouatof-thrlenpkG nx&c as part of the hnplemcntrtion of the projcd. Spadficrlly, scwd bdkabm migMbt~(I)mrolmtof~(mmy)rpentoo~.rprtoftbt project; (2) mmbu 0f-y~ of- (3) ~=-1.ge o f c n p b ~ &viog training at the specific plat invohrad, a ampmy-+, (4) lurmba of pasomdays of foIl0won trsining provided to anpby~ ad mmagas in tbe yeas Wowing project implcmentrtion; (5) number of women cmployal and tnioad; (6) mtdxx of am,lo~eesmd~fbmcthnicracial.nliniousandotberminoritia. Mote
sJj&lCS. % goes be,& the 1t-6tsgaradadby8pp0jed~ eorpor;ltciniliativc W h i k t b e s c n c ~ t h c y d o n o t a r s m e ~ t y . R a t h c r , i t i s c m c k l ~ o w n c r s , ~ b ~ d t b c i r ' bmaamomic i n t a e s t m t h c a n x s s f n l i m p ~ o f S D , t h a e b y ~ ~ ~ o f i x m i h e d w p p o r t f i K t b c a ~ Witbold*wpporSdtbtertrmpletbli( p r o ~ t o o t b a a , t h c i m p ~ o f S D ~ I c s w i u n t t i m r O d y h i l --
H o w d ~ e s f o r S D m e r a t e d i s r s m n c b a ~ o f ~ go~andorganiZationasitisoncofpojeddcsiga Facxmnple.prjad d e s i g n l n a y i n c h d e a r a m n m i t y ~ m d c m p b ~ ~ ( D ~
" g d ~ o f t h e b e n e f i t s d ~ o f r p r q i e d a c a p a i c hitidve. Tbcmmwxsofthem ' mIbmeiitshtbeprojcdacaporrte i n i t i n t i v q r s w d l r s g e m P l i z a d ~ ~ t s t 0 t b t ~ c o m m m i t y flowiughitsimpkmcn~inthef'ofjobs,higtiangcr,d~ snpportfar localscbools ,c labJ,~d tY r . .. \rem ~ ~ i n a d n g r ~ f b r S D . Butmroppatthcpjcua initiativcariUbederpad~t0tbeakntth.1anpb)aarhnmtbt finmcirl rctmPs 6rom the project a initiative throPgb bonuses a slock option
t h e ' a x l n o m i e ~ r ~ e ~ a ~ - p b y ~ i n t h c ~ , ~ d as the employees and inwsim who make IIP tbe brorda anmate c a m u d y . These might-include: number of jobs d e ; f ad snpported; &nponk m- fbr
CLIN 1 : Fostering Climate Change Initiatives fix Sustainsbk DmlopmeDt Task 1C: Computational Tool Kit 32
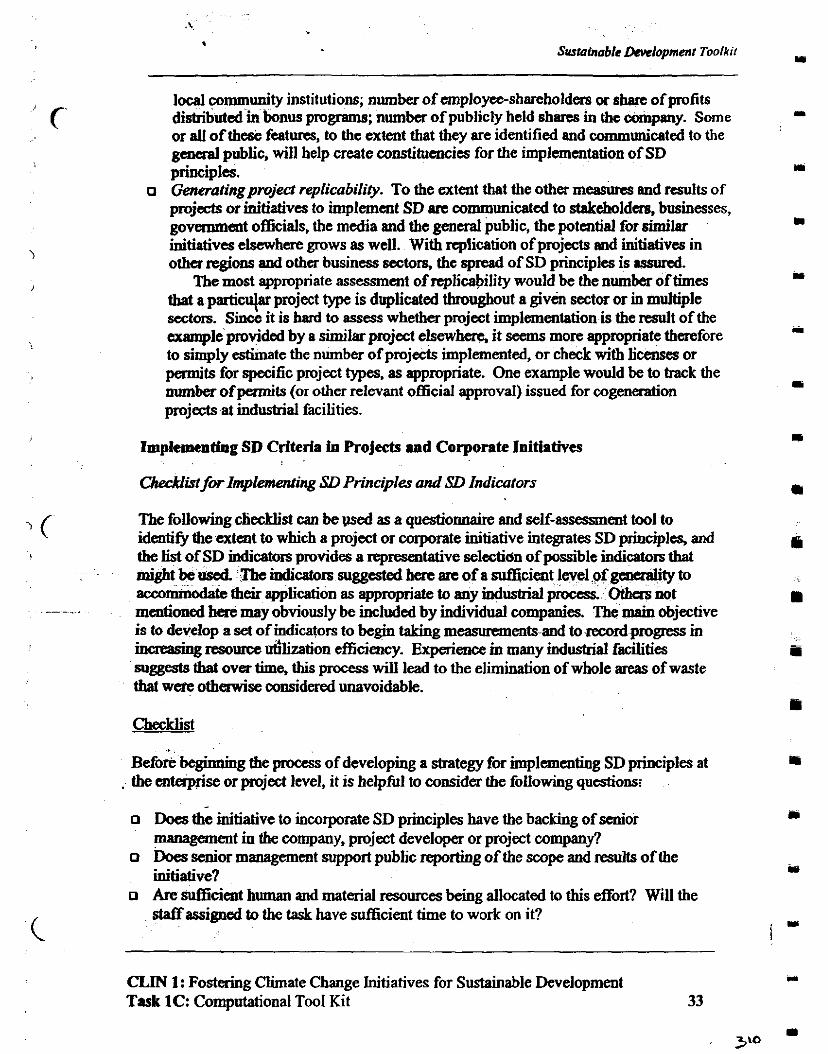
Sustainable DNclopmmt Toolkit I
local community institutions; number of employee-shareholders or share of profits distributed in bonus progmm; number of publicly held shares in the company. Some I
or al l of thtsc features, to the extent that they are ident~fied and communicated to the general public, will help create constituencies for the implementation of SD principles. I
o Generatingproject replicability. To the. extent that the other m e a m and results of projects or initiatives to implement SD are communicated to staktholdae, businesses, government officials, the media and the general public, the potential for similar m
initiatives elsewhere mows as well. With replication of projects and initiatives in otha regions and othcr business sectors, the-qmad of SD pkciples is assued.
The most appropriate assessment of rcplic&ility would be the number of times .. that a parti* project typc is duplicated h g h o u t a given sector or in multiple sectors. Since it is hard to assess whetha project implementation is the d t of the example provided by a similar project els&h&e, it seems more appropriate therefore 1
to simDlv estimate the number of ~miects im~lemented. or check with Hcenses or . - permi& for specific project types, as approPXate. One example would be to track the number of permits (or other relevant official approval) issued for cogenemtion .c
projects at industrial facilities.
Implementing SD Criteria in Projects and Corporate Initiatives
Checklist for Implementing SD Principles and SD Indimtors
The following cliecklist can be wed as a questionmire and self-assessment tool to identify the exteot to which a project or corporate initiative integrates SD principles, and the list of SD indicators orovides a mmentative sehti6n of wssible indicators that might be used The indi&toni s u d here are of a suf6ciGt level of geacdty to accommodate their application as appropriate to any industrial procss Othas not mentioned here may obviously be included by indi&dual compmpames. The main objective is to develop a set of indicators to begin taking measurements and to record progress in bmashg resource dlization efficiency. ExDerience in many industrial M t i e s suggests that over time, this process will leadto the eliminati6n of whole areas of waste thaI were othawise considered unavoidable.
Checklist
~ e f & beginning the process of developing a strategy for implementing SD principles at . the enterprise or project level, it is helpfid to consider the following qucstionsi
o Does the initiative to incorporate SD principles have the backing of senior management in the company, project developer or project company?
o Does senior management support public reporting of the scope and results of the initiative?
o Are Mcien t human md material resources being allocated to this effort? Will the staff assigned to the task have sufiicient time to work on it?
CLIN 1 : Fostering Climate Change Initiatives for Sustainable Development Task 1C: Computational Tool Kit 33
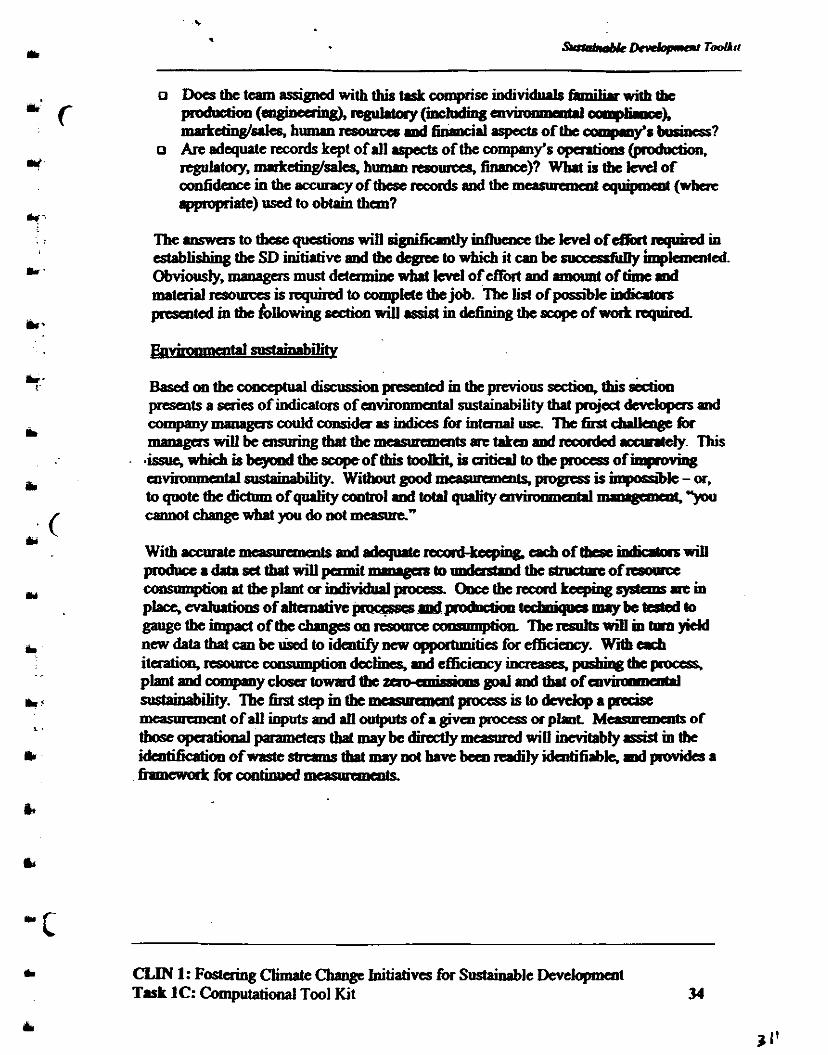
o Are d&e records kept of dl .spsc~r ofthe co&y's opartik (;rroduction. regulatory, mrrkefh@salcs, humm resotmxs, finance)? What is tbe iml of d d a w x m t h e ~ ~ : u r a c y o f t b t s e ~ d t h e m a s l ~ a a c n t ~ ( w k F c rpproPriate) used to obtain them?
T h e . ~ l s w a s t o t b e s e ~ ~ l l s w i U d g n i f i c m ~ i n f l u e n e e t b e l e v d o f ~ ~ i n ~~theSDini t i l t iveandtbedcgreetowhichi tcraberucccgfunr~kwnted . Obviwiy, managus must ddamine what i m l of effort and amount of time rad mataial resources is r e q u i d to complete the job. The lid of possibk W presented in the foliowing section will sskt in defining the smpe of work nquircd
presents a series of indicators of enviromocntal sustainability that project dtvdopcrs aud co~~mp0lllccrseouMconsidarrindicesforintanalusc Tbef%lch.lknffh - - m a u a g u s w i l l b e c n s u r i n g t h a t t h e ~ t s a e t a k e n d ~ ~ e i y . This
. 'issue, which is byond the scopeof this toolkit, is criticlJ to tbe pc tss of al tal sustakbility. without good mcosmments, pr&cs is impossi~t - or toqoottthedictnmofqualitycontroldtotaltp&y ' - -w-=C'L&J
W i t b s c c m P t c ~ d ~ ~ ~ t s c b ~ f t b e s t i n d i a r a s w i l l ~ 8 d r h s d ~ w i l l ~ ~ ~ t O P n d c r s t ; m d t b c s h u c t P r e 0 f ~ c o l l s l m r p t i o l l s t t b e p h t o r i n d i ~ ~ O o c c t h e ~ ~ s y s t e m r a r c i n p b c e , ~ o f ~ ~ ~ ~ t e e t m i q P g n u y b e t c s l o d b gangetheimpactofthe~onrtsomct -awm@n TheWnillmblroyidd new data that can be Ged to identify new opporhmitia for efiiciency. With c u b ituation.rsolace a Son dac- md efficiaxy increases, pprhiqB the poces v h t a n d ~ y c l o s a t o w a r d t b e ~ a o l l l . n d t h p t ~ f I A ~ l i ~ . - l b ; : ~ ~ i n t b e ~ ~ ~ i s t o ~ a ~ r ~ mcrnrranent of all inputs md dl oulputs of 8 given procts or p h t Mesmaaents of thoseopaat ional~erstha(ma~bedircct lymesnrndwi~inevi~~yss is l intbe idcntifidkm of waste strwms that nuy not have been readily idmtifiabk, ad pmrides
CLM 1: FoslQing Climate Change Initiatives for Sustainable Development Task 1C: Computational Tool Kit 34
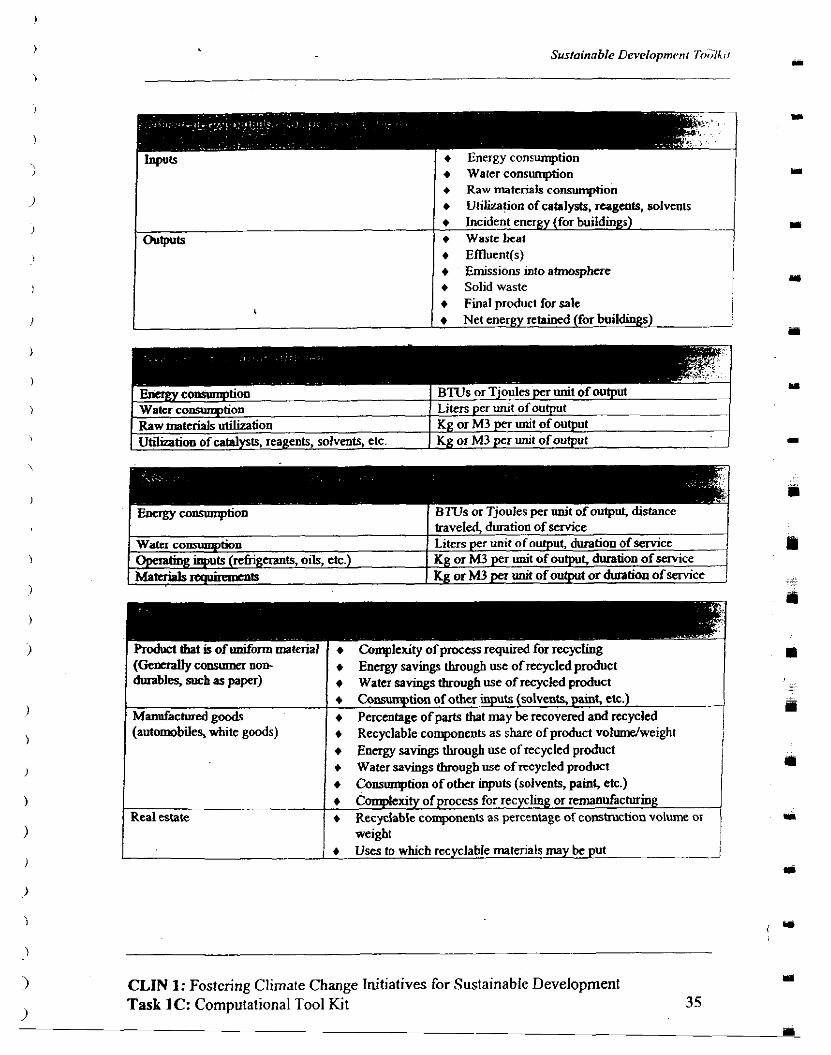
t Watcr consumption t Raw materiais consumption t Utilization of catalvsts. rugents. solvents I - . - .
I t Incident energy (for buildings)
0utpVts 1 t Wastc heat 4 t Emuent(s) t Emissions into atmosphere t Solid waste t Final product for sale t Net energy retained (for b u i l d i n g s ) L
pp
I i?Gmrgy wnnrrqption ( BTUs or Tjoules per unit of output, distance 1
. . (Generally cowumer non- t Energy savings through use of recycled product durables, sueh a. paper) t Water savings through use of recycled product
I 4 C m w q t i o n of other inputs (solvents, paint, etc.) Manufactured noods 1 t Percentaec of oarts that mav be recovered and ncvcled (automobiles, &te goods)
- . .! t Recyclable components as share of product vol&might t Energy savings through use of recycled product t Water savings through use of recycled product t Consumption of other inputs (solvents, paint, etc.)
)
> CLIN I: Fostering Climate Change Initiatives for Sustainable Development
j Task 1C: Computational Tool Kit 35
I t Complexity of process for recycling or remanufacturing Real estate 1 t Recyclable components as percentage of c o ~ s h c b o n volume or
1 weight 4 Uses to which recyclable materials may be put
I 1
1
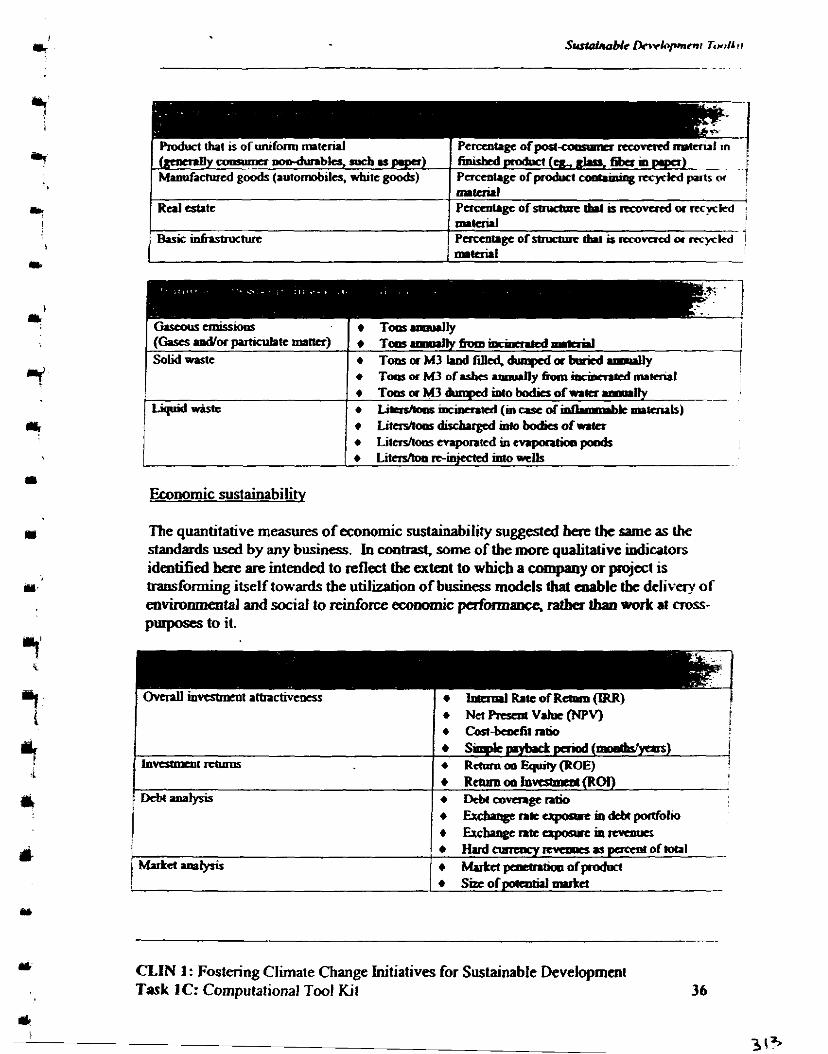
(sawnny ~aranm ooPhtnbla, mcb rr p.pa) 1 f i ~ i ~ k d pmd~cl (ell.. fiberm i Manufacrud goods (automobilq white goods) I Pmmt.pc o f r n ~ ) p u t 5 i ?
mccrul Basic i d n s m ~ M
Economic sustainability
The quantitative measures of economic sustainabilily suggested here thc same as the standards used by any business. In colltml. some of the more qualitative iodicaion identified here. are intended to reflect the uteot to which a company or project is transforming itself towards the utilization of business models that enable the delivery of enviromtal and social to reinforce ewnomic pcrfmmance, ratba thao work at cross- puqmcses to it.
CLIN 1 : Fostering Climate Change Initiatives for Sustainable Development Task IC: Computational Tool Kit 36
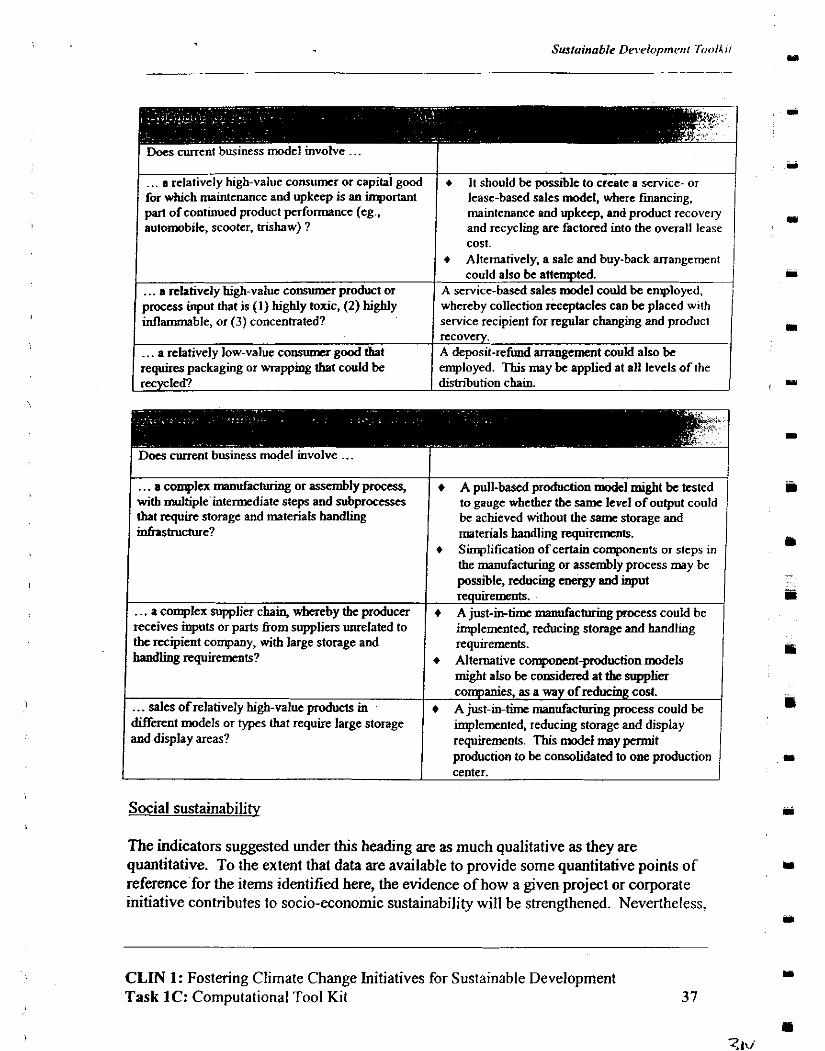
Sustainable Duerlopmc~t~f Toollrr I
F & e n t business model involve . . . I I ... a relatively high-value consumer or capital good + It should be possible to create a service- or for which maintenance and upkeep is an important lease-based sales model, where fmncing, part of continued product performance (eg., maintenance and upkeep. and product recovery automobile, scooter, trishaw) ? and recycling are factored into the overall lease
I cost. t Alternatively, a sale and buy-back arrangement
could also be attempted. . . . a relatively high-value consumer product or A service-based sales model could be employed, process input that 1s (I) highly toxic. (2) highly whereby collection rcccptacles can be placed w~th inIlammable, or (3) concentrated? service recipient for regular changing and producl
recovery. . . . a rektively low-value comurm good that A deposit-refund arrangement could also be requires packaging or wrapping tbat could be employed. This may be applied at all levels of the recycled? distrhtion chain.
- companies, as a way of reducing cost. . . . sales of relatively high-value products in I t A iust-ic-time maoufacturina process could be
. . . a complex rnanufachning or assembly process, with multiple~intennediate steps and subprocesses that require storage and materials handling i n 6 l S ~ h u e ?
. . . a complex supplier chain, whereby the producer receives inputs or parts ffom supplim unrelated to the recipient company, with large storage and handling requirrmnts?
+ A pull-based production model might be tested to gauge whether the same level of output could be achieved without the same storage and materials handling requirements.
+ Simplification of certain compnents or steps in the manufacturing or assembly process may be possible, reducing energy and input requirements.
+ A just-in-time manufacturing process could be implemented, reducing storage and handling requirements.
t Alternative component-production models might also be convidered at the supplier
The indicators suggested under this heading are as much qualitative as they are quantitative. To the extent that data are available to provide some auantitative points of
different models or types that require large storage and display areas?
reference for the items identified here, the evidence of how a given project or corporate initiative conhibutes to socio-economic sustainability will be strengthened. Nevertheless,
i&plemented, reducing ston% and display requirements. This mode1 may m ' t production to be consolidated to one production center.
CLIN 1: Fostering Climate Change Initiatives for Sustainable Development I
Task 1C: Computational Tool Kit 37
Social sustainability
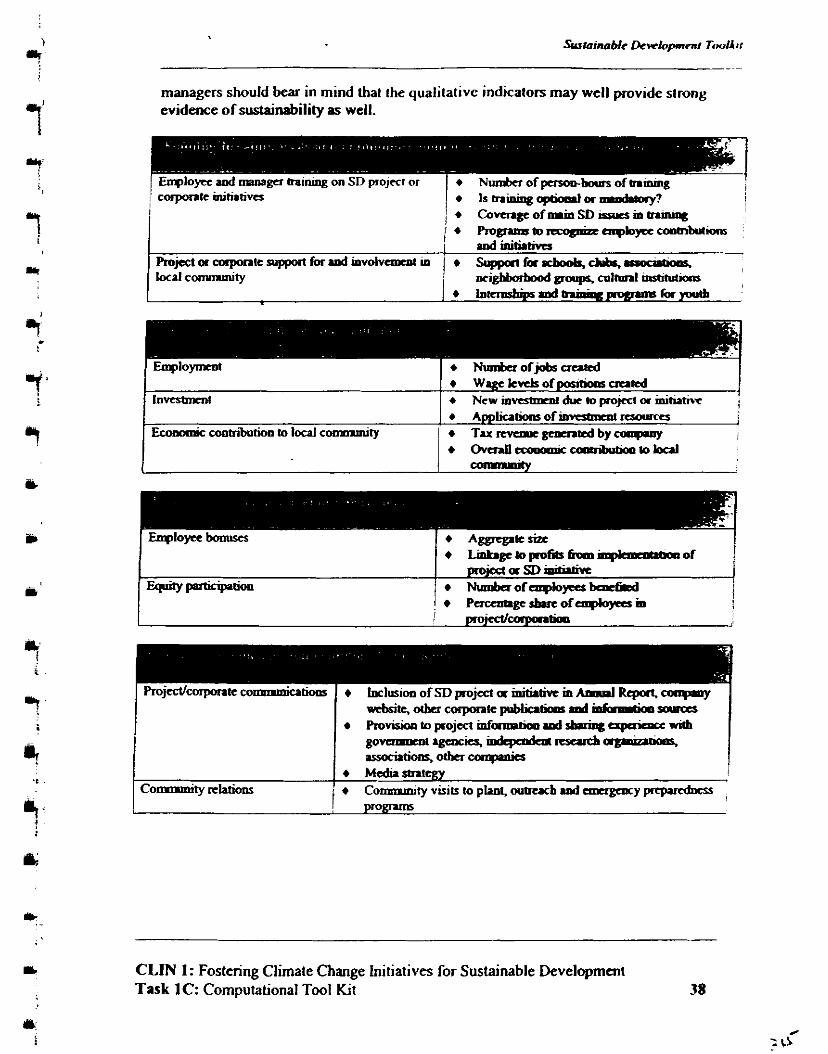
managers should bear in mind that the qualitative indicators may well provide strong evidence of sustainability as well.
I I and miblbva -
Ro~ea a corpontc summ for and mvolvcment lo j S- Tor O E ~ O O ~ . chbo.
-- I Rojcctlcorporate wumm&& I lnchaionof SD pojd or initiative ia & Rqmrk colqrmy I
CLIN I: Fostering Climate Change Initiatives for Sustainable Developmenl Task 1C: Computational Tool Kit 38
I ~ ~
S R ~ S ~ I Z ~ ~ ( C ~ ~ ~ ~ - OOum
R o v i s i o o t o p o j c c t i n f ~ d ~ P r p c r i m c c v i m g O ~ . g c ~ y j C S ~ r r S f U t b ~ ~ , associatiom, orbcr cmqmliM
6 Medumattgy Colnnmity rchbbar Conmrmjty visits to p l u y a m u c b .Id a r c r g a ~ y p q a m k s ,
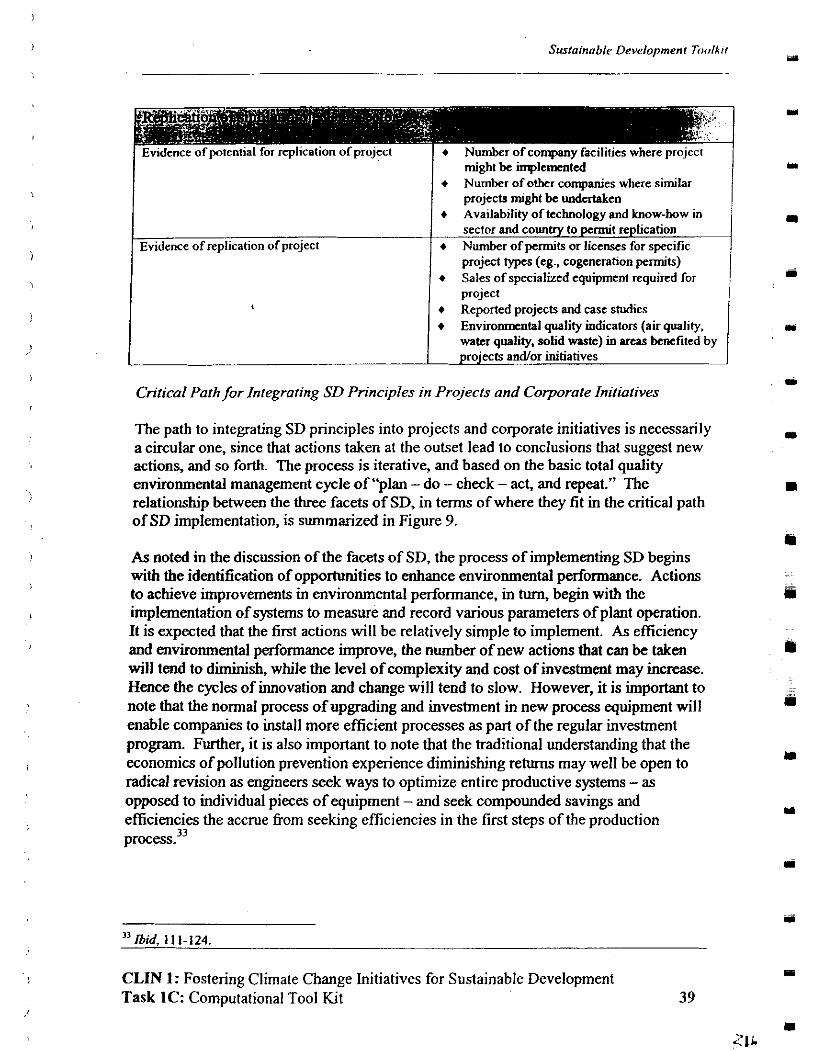
Evidence of replication of project
might be inplcmnted + Number of other companies where similar
projects might be undertaken 4 Availability oftechnology and know-how in
sector and country to pe-t replication I + Number of permits or licenses for s~ccific
, - Crificai Parh for Inregraring SD Principles in Projects and Corporate Inifiarives
- . .
The path to integrating SD principles into projects and corporate initiatives is necessarily - a circular one, since that actions taken at the outset lead to conclusions that suggest new
project types (eg., cogeneration permits) + Sales of specialized equipment required for
project + Reported projects and case studies + Environmental quality indicators (air quality.
water quality, solid waste) in areas benefited by projects andlor initiatives
actions, and so forth. The process is iterative, and based on the basic total environmental management cycle of "plan - do -check - act, and repeat." The relationship between the three facets of SD, in terms of where they fit in the critical path of SD implementation, is summarized in Figure 9.
As noted in the discussion of the facets of SD, the process of implementing SD begins with the identification of opportunities to enhance environmental performance. Actions to achieve improvements in environmental performance, in turn, begin with the implementation of systems to measure and record various parameters of plant operation. It is expected that the first actions will be relatively simple to implement. As efficiency and environmental performance improve, the number of new actions that can be taken will tend to diminish, while the level of complexity and cost of investment may increase. Hence the cycles of innovation and change will tend to slow. However, it is important to note that the normal process of upgrading and investment in new process equipment will enable companies to install more efficient processes as part of the regular investment program. Further, it is also important to note that the traditional understanding that the economics of pollution prevention experience diminishing returns may well be open to radical revision as engineers seek ways to optimize entire productive systems - as opposed to individual pieces of equipment - and seek compounded savings and efficiencies the accrue &om seeking efficiencies in the first steps of the production process.33
CLIN 1: Fostering Climate Change Initiatives for Sustainable Development Task 1C: Computational Tool Kit 39
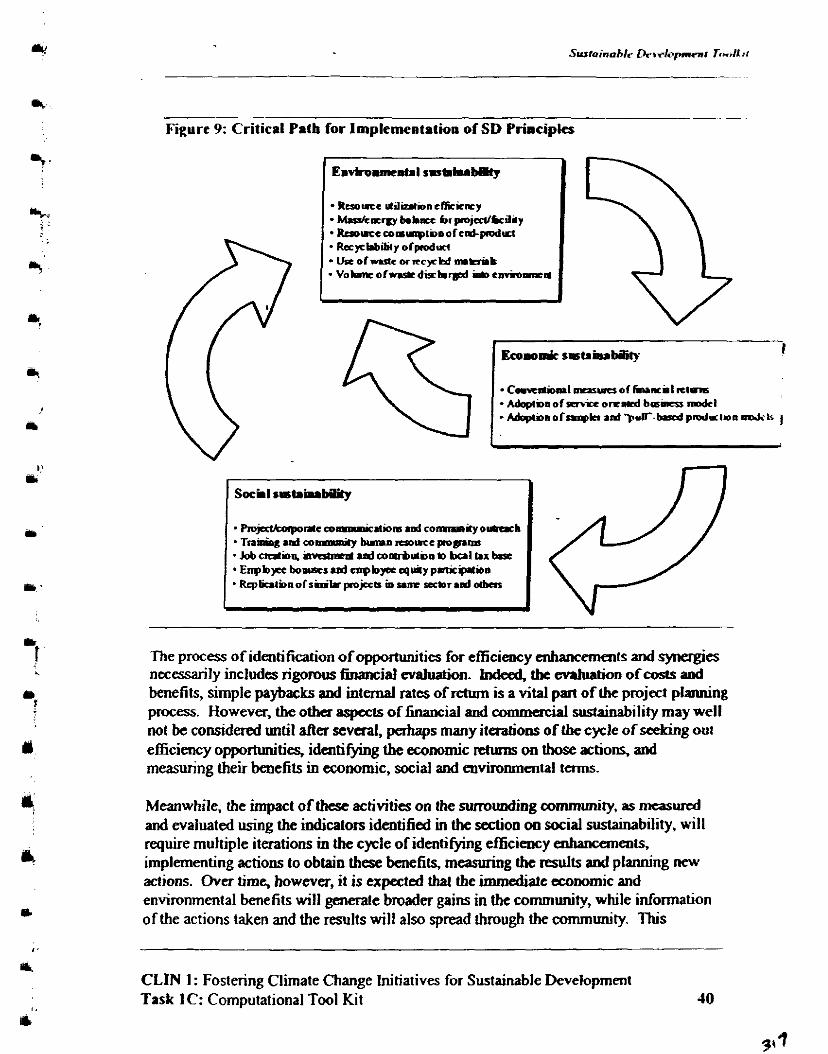
Figure 9: Critical Patb for Impkmentatioo of SD Principles
The process of identification of opportunities for efficiemcy enhancements and synergies necessarily includes rigomus fioancial evaluation. Indeed, the cvduation of coats and benefits, simple paybacks and internal rates of return is a vital pan of the project planning process. However, the other aspects of financial and commercial sustainability may well not be considered until after several, perhaps many itaations of the cycle of seeking out efficiency opportunities, identifying the economic returns on those actions, and m-hg their benefits in economic, social and enviromnental terms.
Meanwhile, the impact of these activities on the surrotmdiag community, as measured and evaluated usine the indicators identified in the seaion on social sustainabilihi. will - - require multiple iterations in the cycle of identifying efficiency enhancanarts. implementing actions to obtain these benefits, measrning the results and planning new actions. OV& time, bowever, it is expected that the immediate ~conomi~and
-
environmental benefits will generate broader gains in the wmmunity, while information of the actions taken and the results will also spread through the commtmity. This
CLIN 1 : Fostering Climate Change Initiatives for Sustainable Development Task 1C: Computational Tool Kit 40
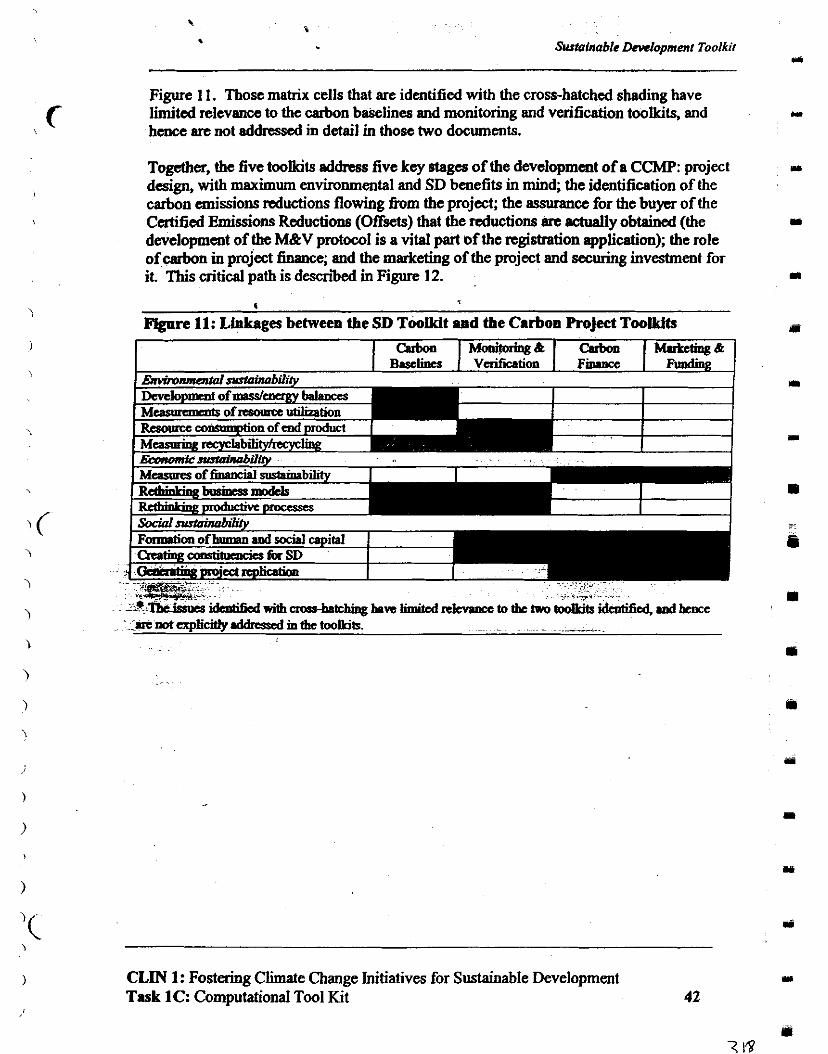
Surtalnable h l o p m e n f Toolkit U
Figure 1 1. Those matrix cells that are identified with the cross-hatched shading have limited relevance to the carbon baselines and monitoring and verification toolkits, and I
hence arc not ad- in detail in those two documents.
Togdhcr, the five toolkits ad& five key stage8 of the development of a CCMP: project I
design, with maximum environmental and SD benefits in mind; the identification of the carbon emissions reductions flowing fiom the project; the assurance for the buyer of the Certified Emissions Reductions (Offsets) tbal the reductions arc actually obtained (the .L
development of the M&V protocol is a vital part of the registration application); the role of carbon in project finance; and the marketing of the project and securing investment for it. This critical path is descn'bed in Figure 12. m
G
-re 11: Linkages between the SD TooUdt and the Carbon Project Toolkits I
CLIN 1 : Fostering Climate Change Initiatives for Sustainable Development I
Task lC Computational Tool Kit 42
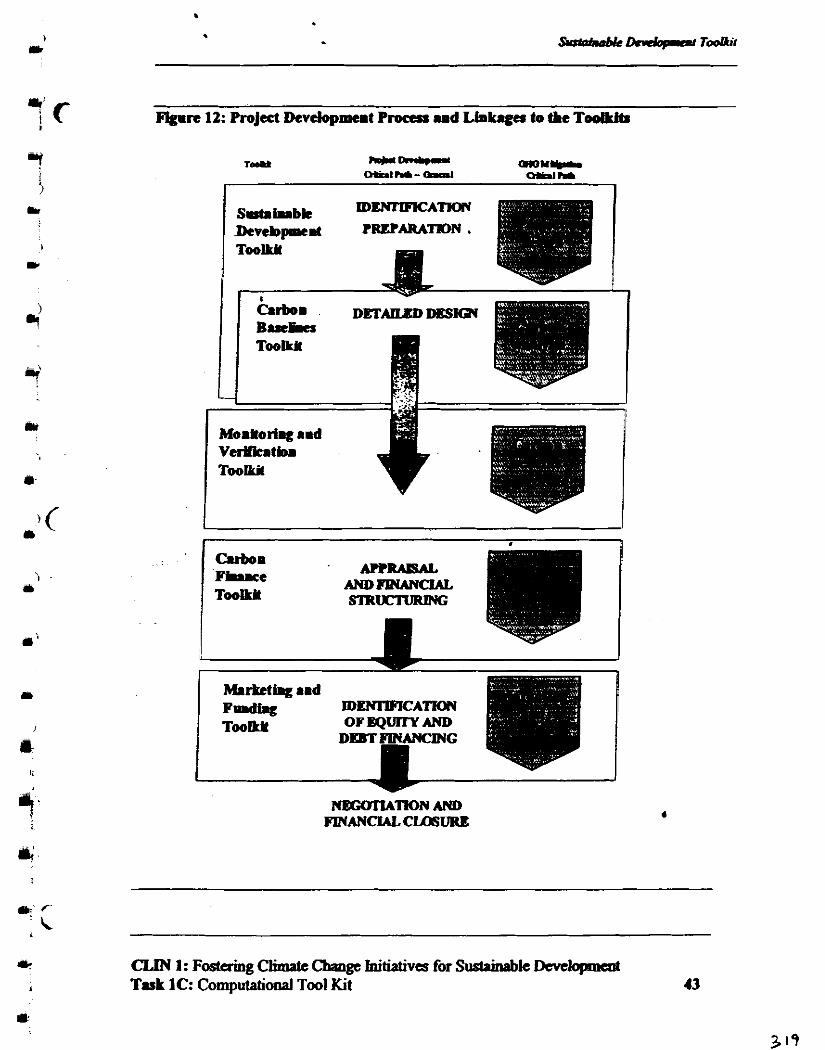
*re 12: Project Jkvdopmut Proaa u d Lhkagu b tbc ToolLitr
Sst.i..bk ID--
Dcocbp.w.1 PWARATKm . Toolkit
C u b o m P h w e ArPmmAL
Toolkit ANDFINMCUL SIR-
CLM I: Foaming Climate Change Initiatives for Sushhble DmJopatl Task 1C: Computational Tool Kit
This toolkit and the four companion documents covaing the evaluation and preparation of climate change mitigPtion pmjects is intended to oricnt the user in the utilization of a broad set of sustainable development indicators that monitor the environmental, m m i c and social aspects of SD.
While there is still debate over the definition of SD. as well as the most m~rouriate - .. . conceptual framework for understanding it and appiying SD principles at the entaprise level, s general &nscnsus among busmess organizations, businesses, government and
has emerged on the m k c e and value of SD indicators (SDIS) as a tool for evaluating company and project performance with rspact to SD principles. This toolkit has presented a series of indicators for consideration and use by firms engaged in the . development of CCMPs.
Progress toward SD will necessarily be slow and hught with difficulties. However, a large number of orgauizations and companies fiom many countries, both in the indus(rialized netions as well as the emerging economies, have made progress toward developing principles for SD as well as mettics and measurement systems for evaluating pmgress toward the goal of SD. The information presented here is intended to serve as
)(
an introduction and a prel imby guide to the project developer and or corporate mauager, and not an exhaustive treatment of the subject.
, At the same time, this document is intended to provide the beginning of a reference
i document that will be updated m the future with case studies, new references and Internet \ resoma, and possiily otha material.
CLIN 1: Fostering Climate Change Initiatives for Sustainable Development I
Task 1C: Computational Tool Kit 44
This su3ion prcscnts titles and web links of rollrcar of xiditioarl iafbrmrtian:
o Austin, Duncan et d., "How Mucb SuJt.inrble D c v t w Cm We Expod ha t h e C k r n D e v d o p n c n t M s c b m i s m ? " W o r l d ~ ~ ~ ~ , No-, 1999.
o Badou3le ,PqwrhyePrdKaubsky ,J~"Incapcc . t iag~ . . dmlopment considartioos into am@ sector -: hid106 F?* ' ' Disbiu HcPting Facility case study, Encrgv Pdicy 28 (2000): 689-71 1.
o C h h , Daniel, Voices fw the m h : T I IdePrjiwm Amcriarr f Bar Em+mumal Beak &otmsm h o k x BOUldCI, CO, 1995).
o , ~ ~ N o a c r r : L a m r r i n g t o L i r r ~ m 1 A L ~ ~ Ress: Wsrbington. DC, 1992).
o Goodl.md,Robert.7hceooecptof - 1 ms&b&ility," A d Reuicw o/ Ecdogiml $stems 26 (1995): 1-24.
o H ~ S t C i n . T o ~ a ~ l c ~ y c g l w e a P v i v t g r a c a ~ ? " Dqmima~t Papers no. 36 (June. 1996), Tk WorM Bmt
o Hawkcn, Pad, me Ecology of Comnrcm (H;rrpaCollim: New York, 1993) o Hadtrom. Gilbai et d. "Redking the sustainrbk development b d , " Rism
( M U D . Lit&), 1Q 5-19. o H a c h f A l m , ~ l r i d o f s u s t a h b k d e v e l o p n e a t : p m m o t i o g ~
developmeat in developing cocmtrig" lXc J d W d M o p w n a r 8nlrmba2 (Juoc. 1999): 111-132
0 ~ J a i l d , ~ i l i t y m k r s : m c r s h r i q s c o r p a r t e ' I d socidpldmmcqn ~Entcrpi#Nofa(w.shiqgtoqI)(=:Wald re sour as.^^ May 1998).
o S m a r t , B T U O C , B & ~ A N e w ~ Y i C W o f & ~ ( W d Resomxs Instilute: Washington, DC. 1992).
2
o Applied htaimbilitu: h t @ J / w w w ~ l l c . ~ o Carts for Ckrn Air Policy: httpJ/www.ccap.org o Ccotcr for Sustababk Devclojnna~t in tbthnaias http-JEwww.dorg o CoaMionfbrEnv' tlly Rcqmsibk Earnanics: h ~ J l w w n . ~ a g o W s i n e s s C o P n c i l f i x ~ k D e v c l q r m e o C G u l f o f M ~ :
httpJ~.wbcsdgm.org o Global En ' .tP1 Managamnt h~ihtiw httpJ/wnw.gcmi.org o Wcmational W e for Snstpinsble Dmdupa& httpJhvww.iid.org o United N&mx h t t p J l w w w . r m o r p / ~ ~ h o WorldBusintssColmdlfaSustainabkDcve~
h t t p J r w w w . w - o World Resources Institute: httpJlwww.aniorg md www.w&onxxg
CLIN 1: Fastahrg Climate Cluuge Initiatives for Sushidk D e v e w Task 1C: Computrtiwal Tool Kit 45
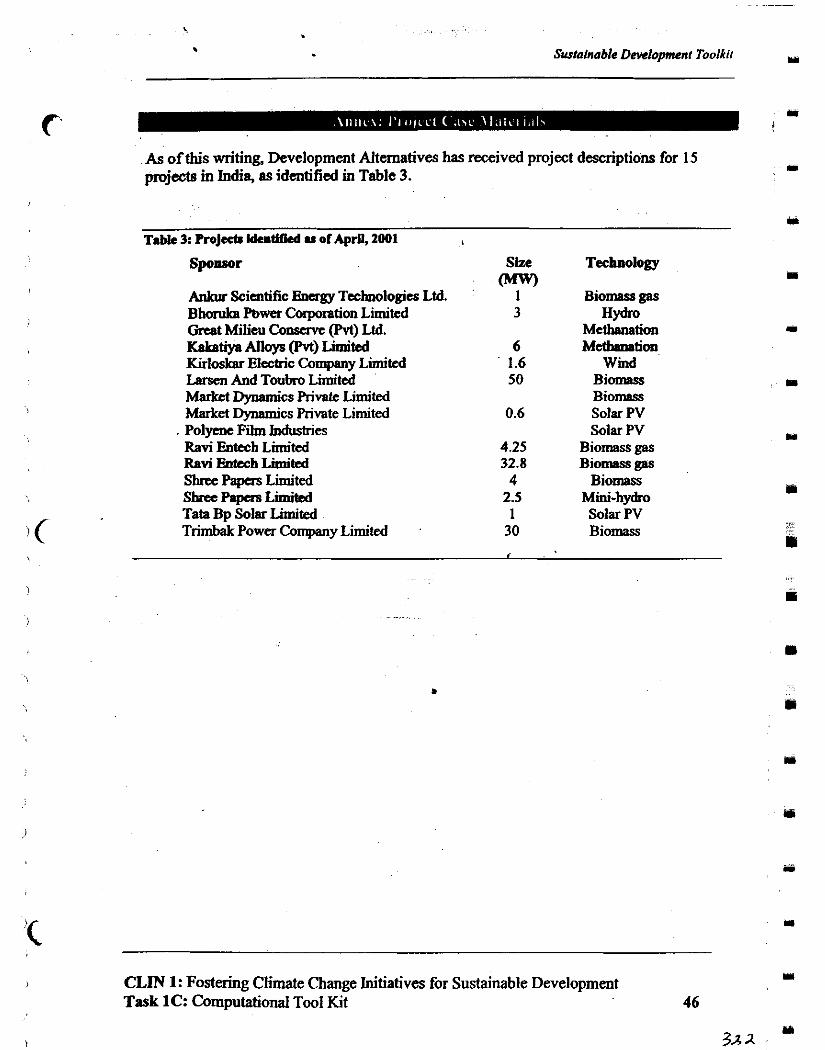
. Surtalnoble DDNcpmen t Toolkit
As of this writing, Development Alternatives has received project descriptions for 15 projects in India, as identified in Table 3.
Sponsor
Ankur Scientific Bncrgy Technologies Ltd. Bhonrka Pbwer Gqaation Limited Great Milieu Consavc (Pvt) Ltd. K h t i y a Alloys (Pvt) Limiisd Kirloskar Elcclric Company Limited Larsm And Twbro Limited Market Dynamics Private Limited Market Dynamics Private Limited
. Polycne Film hxrustria Ravi Entech Limited Ravi Endech Limited Shrce Papas Limited SllePnpersLimiad Tata Bp Solar Limited Trhnbak Power Company Limited
Bior~lass gas HYQO
Methanation M m t i o l l
Wind Biomass Biomass Solar PV Solar PV
Biomass gas Biomass gas
Biomass Mini-hydro Solar PV Biomass
CLIN 1: Fostering Climate Change Initiatives for Sustainable Development 1
Task 1C: Computational Toot Kit 46
m 3% 2
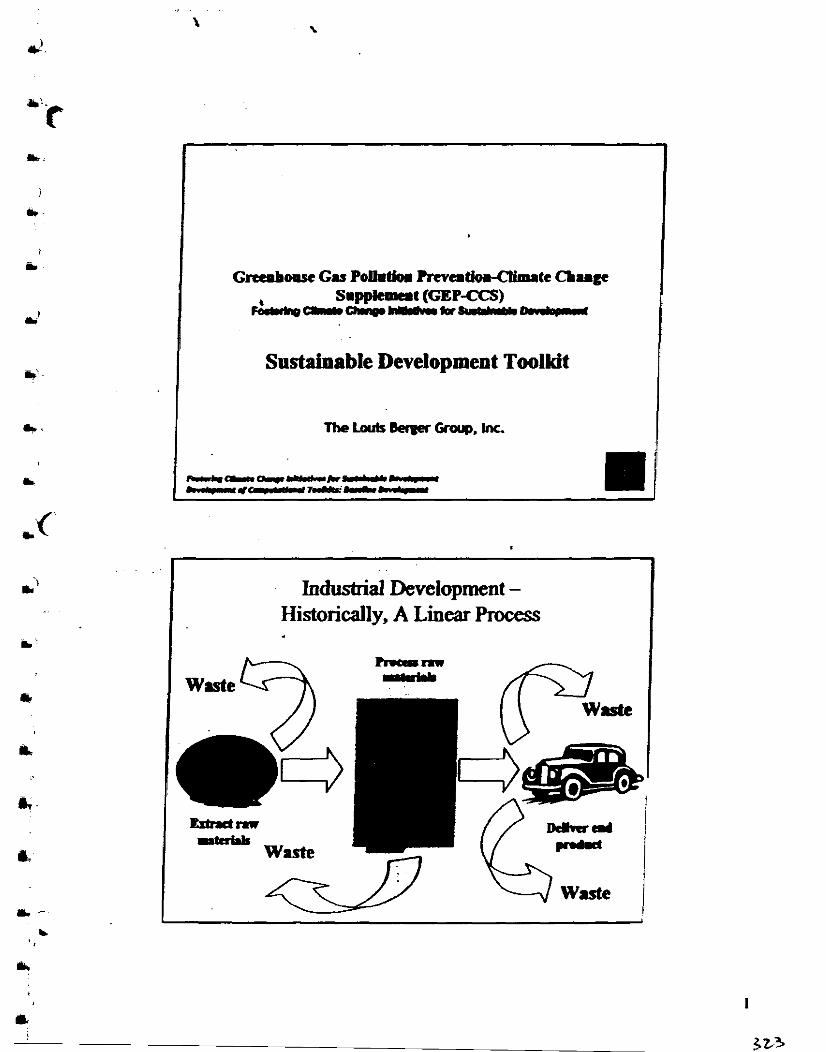
Sustainable Development Toolkit
Industrial Development - Historically, A Linear Process
-m rCrY
lhhdm Dchrd
Waste
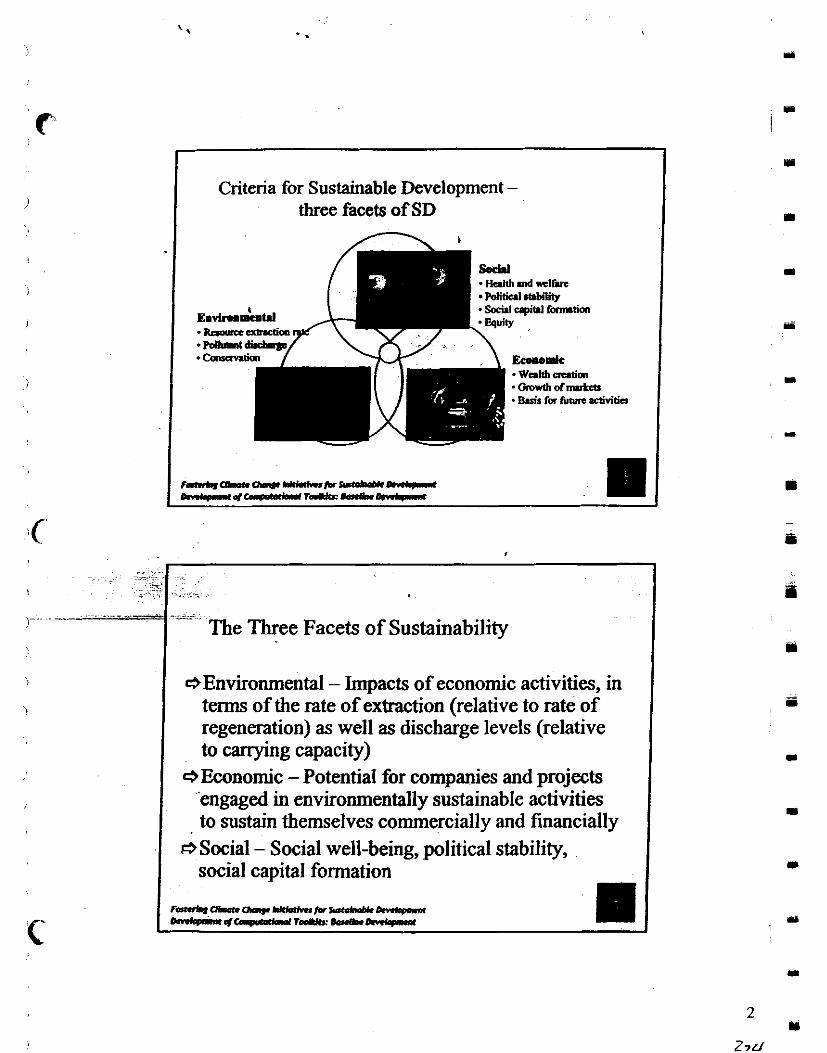
Criteria for Sustainable Development - three facets of SD
- Halth d vsihrc . PdihQl rabitity . Sonrl aplUI famwn
. W u M cnxtim QluMhofrmrlaa Buir for futm r r v i b a
r m - c r n r - w - w -*-r--r**lr911
!
The Three Facets of Sustainability
sEnvironmenta1- Impacts of economic activities, in terms of the rate of extraction (relative to rate of regeneration) as well as discharge levels (relative to carrying capacity)
cSEconomic - Potential for companies and projects .engaged in environmentally sustainable activities to sustain themselves commercially and financially
FS Social - Social well-being, political stability, social ca~ital formation
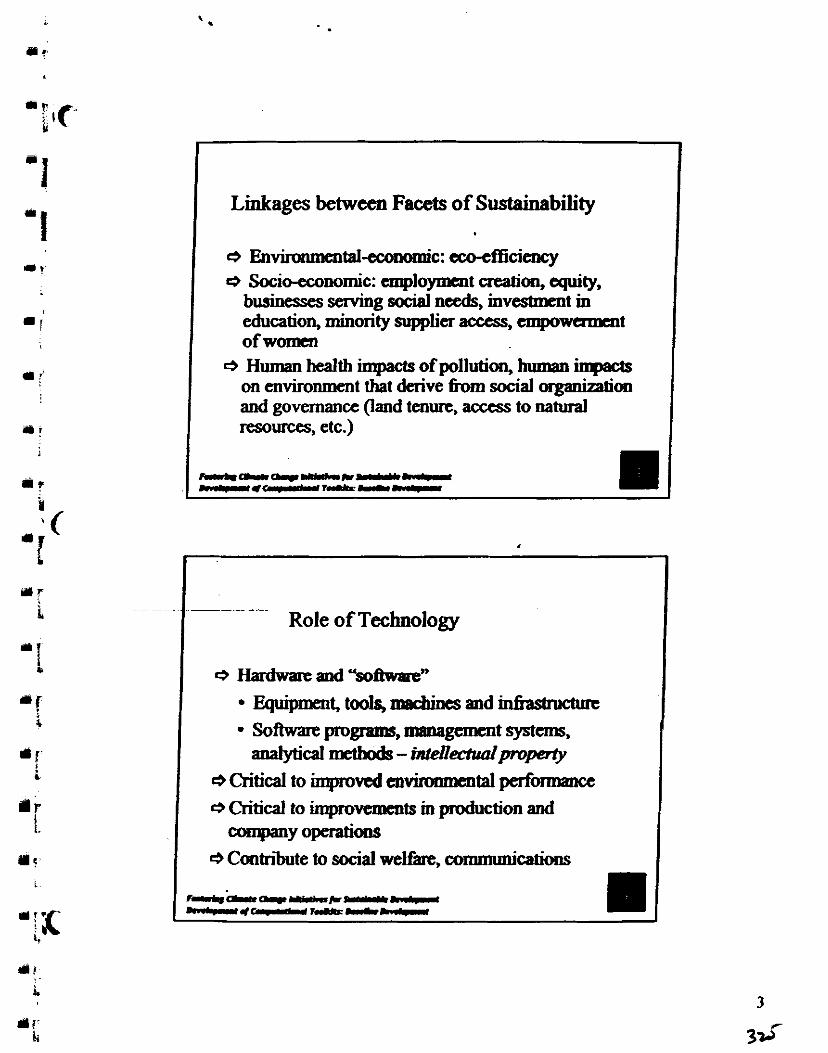
Linkages between Facets of Sustainability
a Envhnmentalccowmic: ux-cfficicncy + Socioeconomic: employment d o n , equity, buJinesses serving social d, investment m education, minority supplier access, cmpowamnt of womm
a Human health impacts of pollution, human inpacts on environment that derive b r n social organization and governance (land teoure, access to n a d resoums, etc.)
- - -. - Role of Technology
* Hardware and "softwaren
Equipnmt, tools,anacbinesandinfrastnrcturc
Software p r o m , mgement systm, z m a I y t i c a l ~ - M d p r o ~
a Critical to improved en-tal pcrfimmcc a Critical to improvements in production and
-yoperations *Contribute to social welfsre. cations
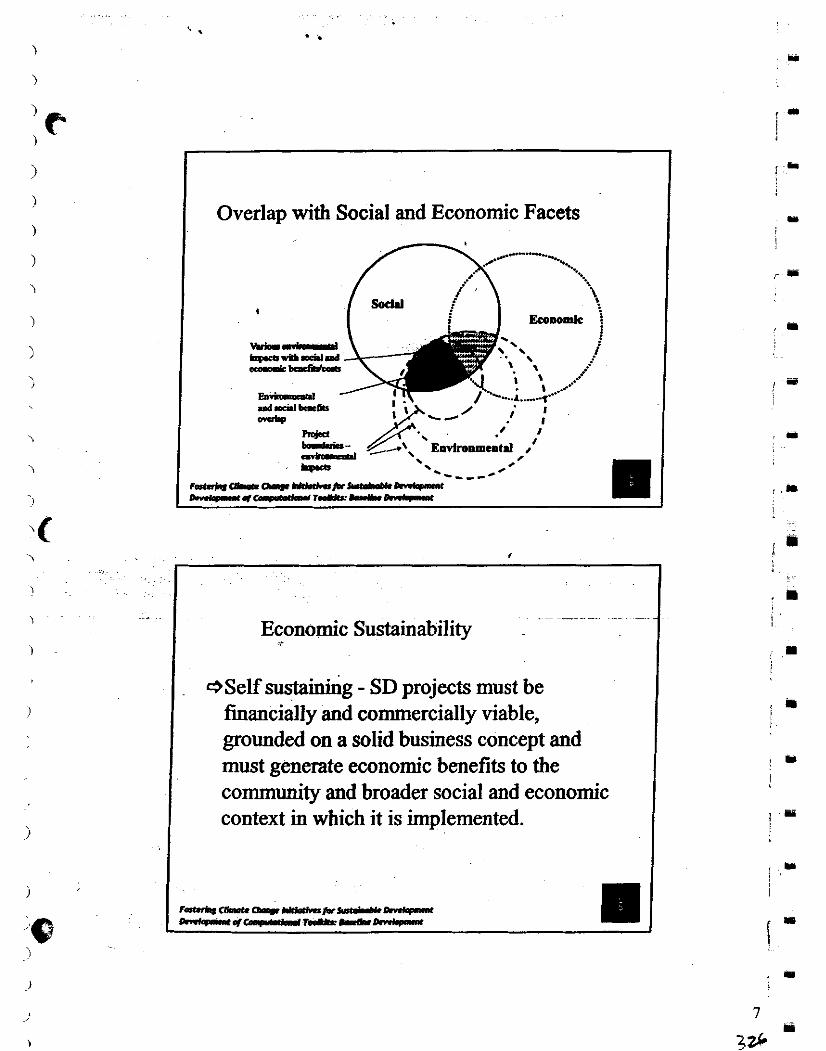
Overlap with Social and Economic Facets
* . -- .
ipcavPlad.ld --oa
E.- d d b e . t f i o 0m-b
R4Ca . I I . . , - .-----*#
FDItnLa-Cka-*-- W s l r * c o 4 o . l l a * r ~ - ~
~
Economic Sustainability I
I
+Self sustaining - SD projects must be financially and commercially viable, grounded on a solid business concept and must generate economic benefits to the community and broader social and economic context in which it is implemented.
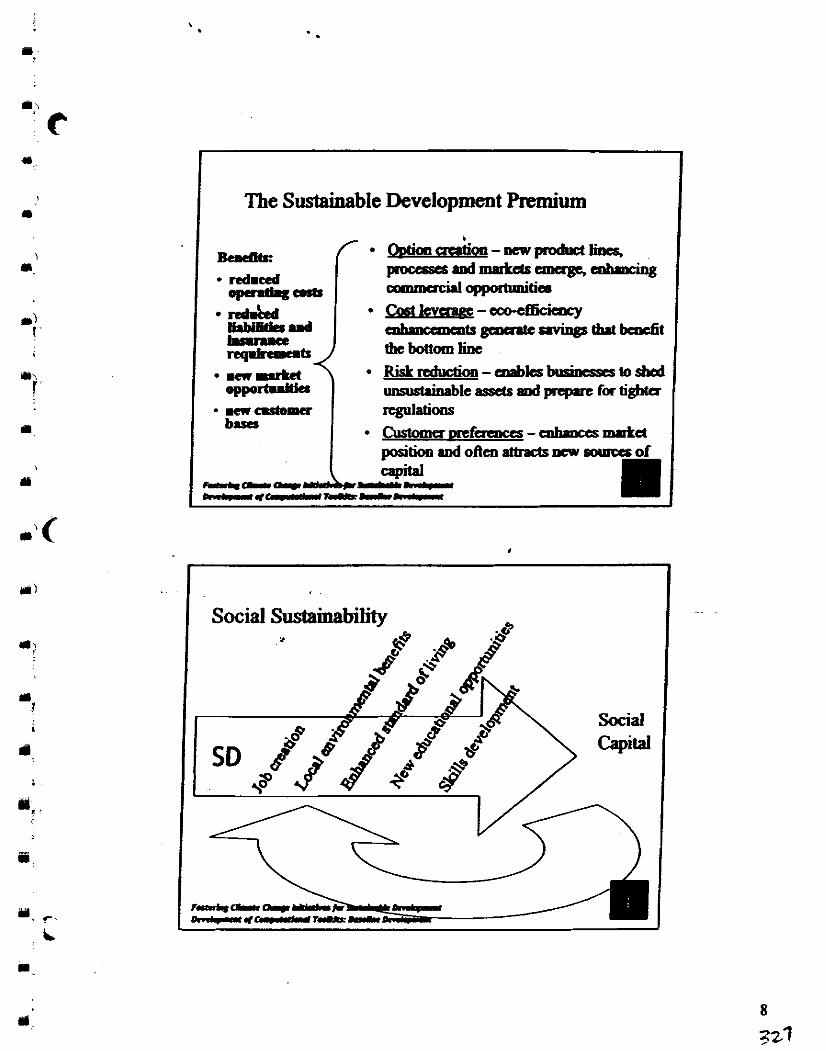
( The Sustainable Developmmt Premium I
*--ccocf6icimcy ~ g a # l t c a v i n g s t h r t b c n c f i t the bottom line
position and often atbacts ncar colnca of
R ( L I I - - . r L L I L L
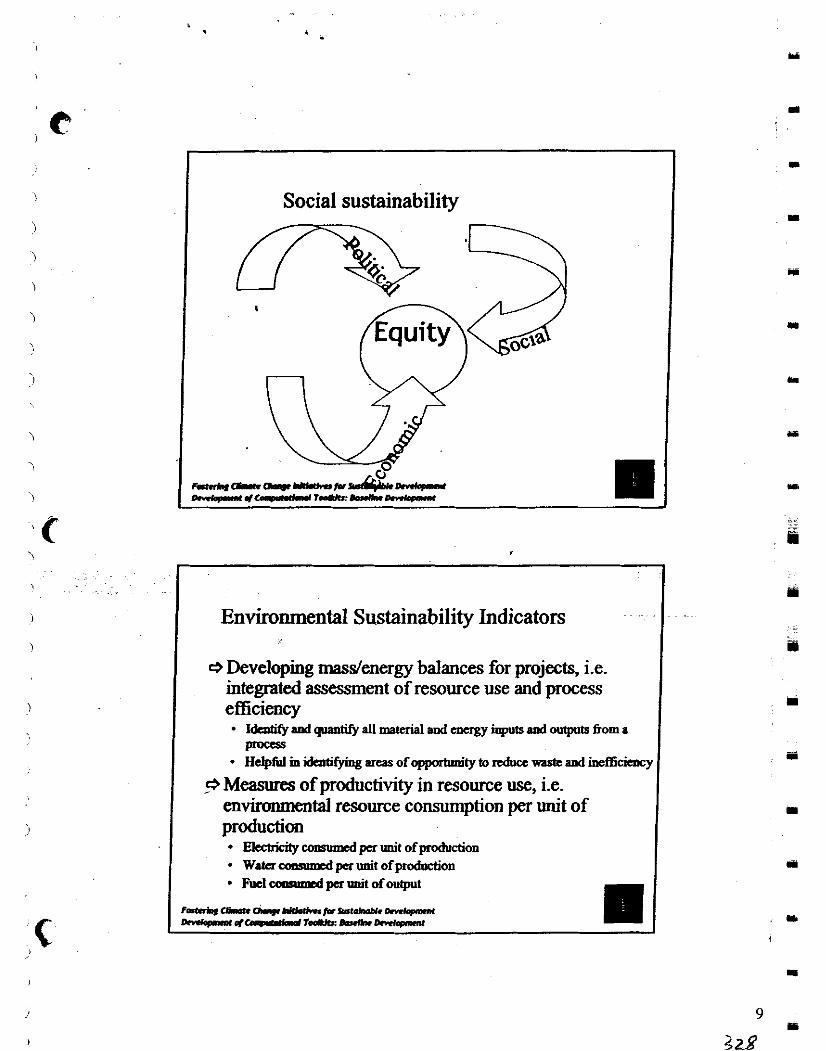
Social sustainability
I Environmental Sustainability Indicators
I CS Developing masdenergy balances for projects, i.e. integrated assessment of resource use and process efficiency
ibptify and qunntify all material and cnergy ioputs and outputs from a procas Helpfnl in idartifyiog arus of -.ly to rcduec waste and ine&iency
9 Measures of productivity in resource use, i.e. environmental resource consumption per unit of production
Ekchicity colrsumd per unit of pduction
w* - per unit of production
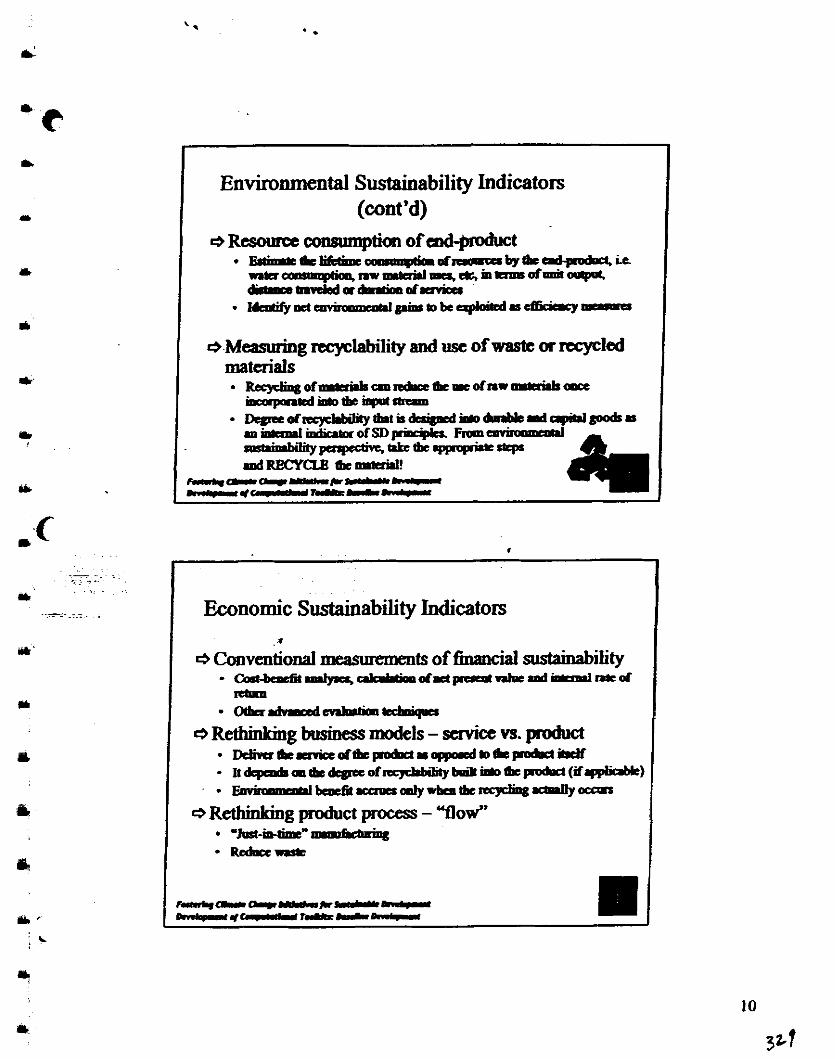
Environmental Sustainability Indicators (cont'd)
a Resouroe amsumpti011 of md-product ~ ( b c l i f d i m c ~ d r r r a c e r b y B c ~ i r r r c a ~ n w r m * r h l ~ c % i n k m s d l m i r ~ ~ k 8 v c k d a & a t i m d a u v k . I&dfymcc . ~ 1 p k S m k a r p k h d r r ~ -
a Measrrring recyclability and use of waste or recycled materials
~ O f r m L d r k a a ~ t b r c o f n w ~ m c i o c a q k n * d * l b c ~ - D c g c c o r r s c y c l b i l i ( y d n t i r ~ a ~ r d ~ g i n n k a m ~ m f i . l m r o f S D p i D c i p k horn
.
FnpatiY~cbcWmgrhrapr BdRECYQB tbrmtahl!
k.rL.(YQIIC-*-L..cI) -.I---L..cI)
Economic Sustainability Indicators 1
e Conventional -ts of f inand sustainability . C o r c - h m d B ~ ' '- ' o f ~ p a c l l l ~ d m C r m l n * c d * O l h r r . d v a c c d ~ ~
e Rethinking business models - swvicc vs. product DCf isCTalmiCedtk~noppDcdm(Lcpodr ( ibdf t r d q t d s ~ Q ~ d ~ ~ ~ ~ p o d P E t ( i C . l r p l i a M c ) . I ~ - m l y d u t b c ~ . c c p l o y -
a Rethinking product process - Yow" - - . . - . R d l a r P c
--Oly-*-- A . ( p r * v r - n -
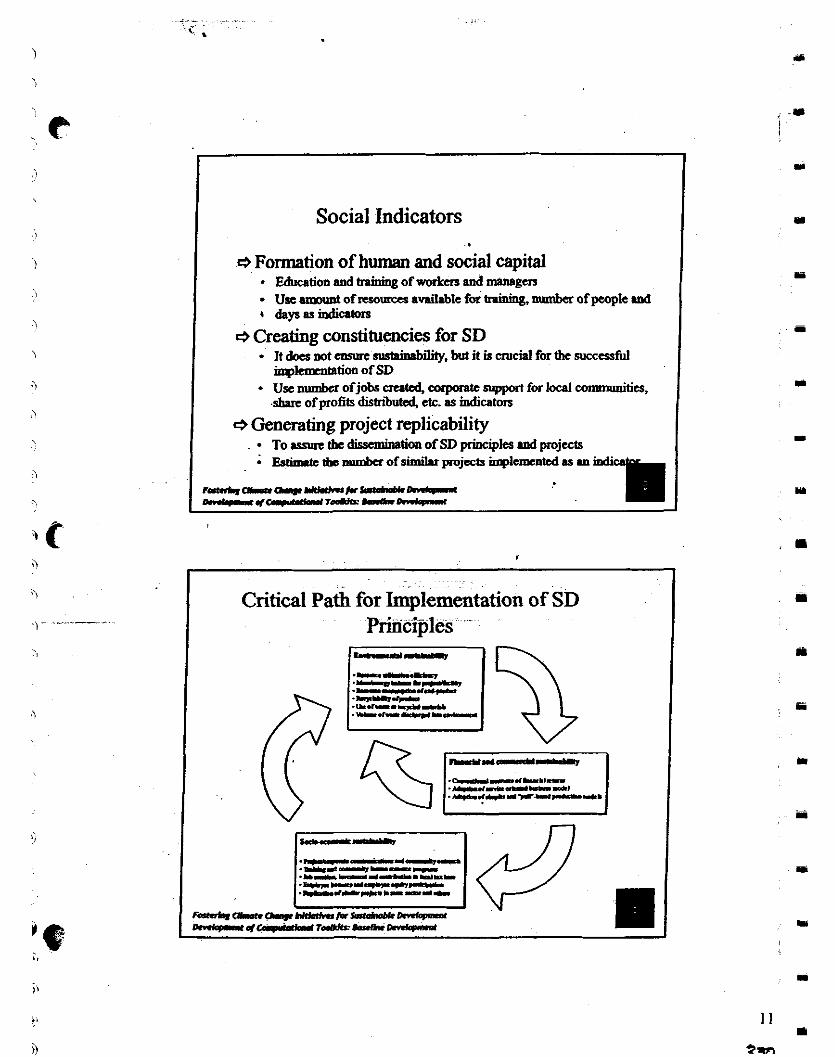
Social Indicators
Ej Formation of human and social capital Education and h b h g of workers and m m g m Use uDMmn of rwo- a n i l e for haining, rmmber of people rod days- indiatoIs
~j Creating constituencies for SD ItdacJaotcapurr~~,butitiscrucialforthesuccessful inpknxmtntion of SD Usc numbu ofjobs created, anporatc support for local commuoitics, s h ofprofib distributed, etc. as indicators
a Generating project replicability To - tbc clhmhation of SD principks rod projects
; Eamntc tbc mmbu of simiLr projects inplemted as UI indi
F ~ c L . Q . I p - C - D m * C I -7crraaa*r---
Critical Path for Implementation of SD 1 Principles -
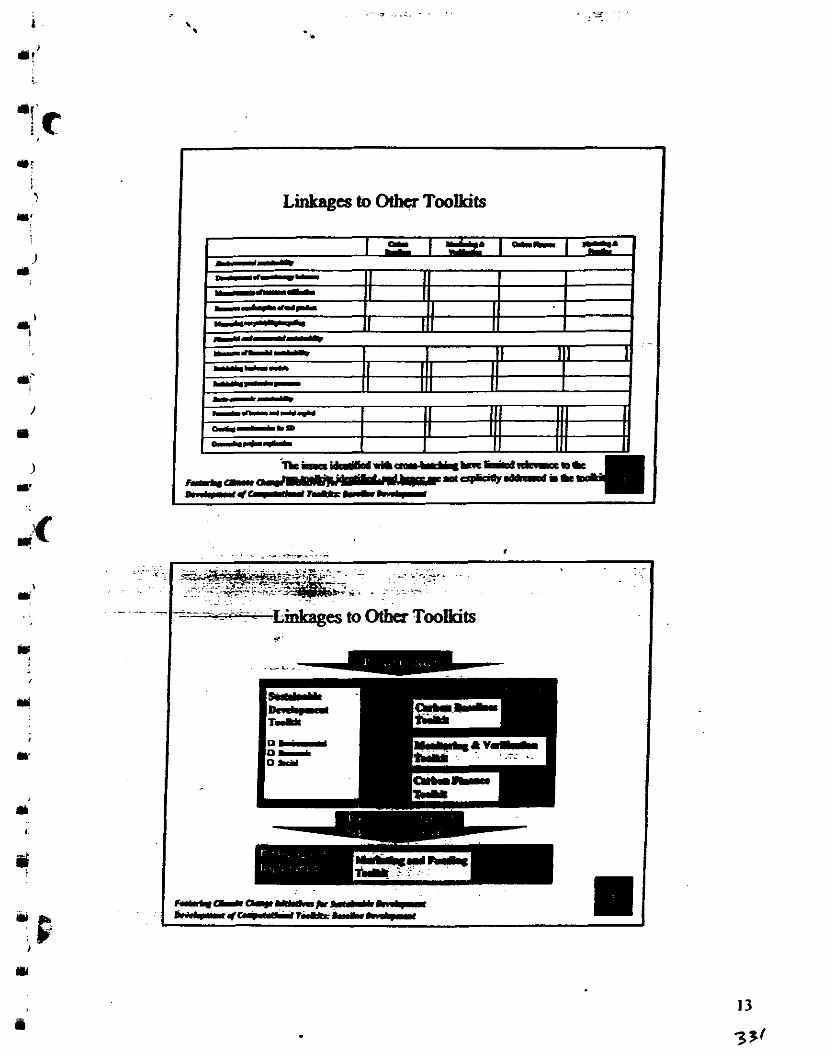
Linkages to 0 t h TooIkits
. . . k(.h e n . d - - * ..Icc#w---


