Embed Size (px)
Citation preview

EPJ manuscript No.(will be inserted by the editor)
Plotting the Differences Between Data and Expectation
Georgios Choudalakis1 and Diego Casadei2
1 University of Chicago, Enrico Fermi Institute, 5640 South Ellis Avenue, Chicago, IL-60637, USAe-mail: [email protected]
2 Department of Physics, New York University, 4 Washington Place, New York, NY-10003, USAe-mail: [email protected]
the date of receipt and acceptance should be inserted later
Abstract. This article proposes a way to improve the presentation of histograms where data are comparedto expectation. Sometimes, it is difficult to judge by eye whether the difference between the bin contentand the theoretical expectation (provided by either a fitting function or another histogram) is just dueto statistical fluctuations. More importantly, there could be statistically significant deviations which arecompletely invisible in the plot. We propose to add a small inset at the bottom of the plot, in which thestatistical significance of the deviation observed in each bin is shown. Even though the numerical routineswhich we developed have only illustration purposes, it comes out that they are based on formulae whichcould be used to perform statistical inference in a proper way. An implementation of our computation isavailable at: http://svn.cern.ch/guest/psde/.
PACS. 02.70.Rr General statistical methods
1 Introduction
Most analyses compare the observed data to the expectation resulting from a theoretical model, like the StandardModel (SM), or some other hypothesis, like a best fitting function, or a Monte Carlo simulated distribution. It iscommon to make histograms in logarithmic scale, because their contents span orders of magnitude. Since differencesare difficult to see in a logarithmic scale, an inset plot is often made at the bottom of the histogram. In this article,we focus on this inset and propose a way to make it intuitive and accurate. By “intuitive” we mean that it shouldmake it obvious which bins contain an excess of data and which contain a deficit, while significant deviations shouldlook more striking than insignificant ones. By “accurate” we mean that it should represent the actual significance ofthe deviation in each bin, rather than some approximation.
Below we define statistical significance in two probability models, Poisson and binomial. In Section 2 we show asequence of presentation options that could be used (and most of them have been used), explaining their strengthsand limitations. This will motivate, through a series of incremental improvements, our final proposal, which is givenin Section 2.4. Finally, if the expectation is only known within some uncertainty, this uncertainty can be taken intoaccount in the comparison to the data, as explained in Section 3. In this paper, we use the ROOT framework [1] toproduce the plots and provide suggestions for implementing our formulae with this widely used software for dataanalysis and visualization, although our recommendations can be easily implemented within other frameworks too.
1.1 Definition of statistical significance
The key notion, which is needed to define the statistical significance, is the probability of finding a deviation at leastas big as the one observed in the data, under the assumption that the chosen theoretical model describes our system.This probability is commonly called the “p-value” and it usually spans several orders of magnitude. For this reason, itis convenient to translate the p-value into a “z-value”, which is the deviation at the right of the mean of a Gaussiandistribution, expressed in units of standard deviations, which would correspond to the same p-value. The equationwhich maps each p-value to a z-value, and vice versa, is:
p-value =
∫ ∞z-value
1√2πe−
x2
2 dx, (1)
arX
iv:1
111.
2062
v4 [
phys
ics.
data
-an]
12
Apr
201
2

2 Georgios Choudalakis, Diego Casadei: Plotting the Differences Between Data and Expectation
10-5 10-4 0.001 0.01 0.1 1p-value
-4
-2
2
4
z-value
Fig. 1. Relationship between p-value and z-value.
which is shown in Fig. 1. In ROOT, the z-value can be computed in one line of code, using the inverse error function:
sqrt(2.) ∗ TMath :: ErfInverse(1.− 2. ∗ pvalue)
A z-value ≥ 0 corresponds to a p-value ≤ 0.5, and negative z-values correspond to p-value > 0.5. Significantdeviations are characterized by quite small p-values, corresponding to z-values ≥ 3. For example, it is common to referto a p-value = 2.87× 10⁻⁷ as a “5σ effect”, meaning that the corresponding z-value is 5. Such deviations are usuallyconsidered very significant and a z-value of 5 or more is conventionally required in High Energy Physics to claim adiscovery [2]. On the other hand, a z-value which is less than 1–2 units represents a common statistical fluctuation,which is uninteresting. The fluctuations are even more probable (i.e. less interesting) when the z-value is negative.
The p-value depends on the statistical distribution that the data are supposed to follow, the so-called “probabilitymodel”. The cases of Poisson and binomial distributed data are most common in experimental physics, and areaddressed in this note.
1.2 Poisson model
This is the most common case, where event counts are plotted in each bin and the number of entries in each bin followsa Poisson distribution (e.g. Ref. [3]). If B ∈ R events are expected in a bin, the probability of observing D ∈ N eventsis
P (D|B) = Poi(D|B) =BD
D!e−B
(B is also the variance of D). The Poisson p-value is
p-value =
∞∑n=D
Bn
n!e−B = 1−
D−1∑n=0
Bn
n!e−B , D > B
D∑n=0
Bn
n!e−B , D ≤ B
(2)
The above sums are simplified thanks to the identity:
D−1∑n=0
Bn
n!e−B =
Γ (D,B)
Γ (D), (3)
where
Γ (D,B) =
∫ ∞B
tD−1e−t dt, (4)
Γ (D) =
∫ ∞0
tD−1e−t dt. (5)

Georgios Choudalakis, Diego Casadei: Plotting the Differences Between Data and Expectation 3
The ratio between the upper incomplete Gamma function Γ (s, x) and the Gamma function Γ (s) in the previousequation is known as the upper regularized Gamma function
Q(s, x) =Γ (s, x)
Γ (s)= 1− P (s, x) (6)
where P (s, x) is the cumulative distribution function for Gamma random variables with shape parameter s and scaleparameter 1 [4]. In ROOT this function is available as
Q(s, x) = ROOT::Math::inc gamma c(s,x),
such that
p-value =
{1−Q(D,B) = ROOT::Math::inc gamma c(D,B) , D > B
Q(D + 1, B) = ROOT::Math::inc gamma c(D+1,B) , D ≤ B(7)
One should notice that it is not always true that the bin population follows the Poisson distribution. This doesnot happen when the total number of entries in a histogram is not a random variable, in which case the events ineach bin are distributed accordingly to the multinomial distribution, which means that the bins cannot be consideredstatistically independent as we assumed in this section. In the extreme case of a fixed total number of entries andonly two bins, the content of each bin follows the binomial distribution: if there is an excess of counts in one bin, withrespect to the expectation, then the other bin must have a deficit in order to preserve the total number of events.
1.3 Binomial model
If the plotted quantity is a Bernoulli success rate, then it follows a binomial distribution. A common example wouldbe a trigger efficiency “turn-on curve” like Fig. 1 in Ref. [6], where it would be informative to show how significantlythe observed trigger rate differs from the simulation. Another example is Fχ(mjj) in Ref. [5]: if this event rate weresignificantly different than the SM prediction, this could be a sign of certain new physics.
Let us define the following notation:
n ∈ N: the number of events initially observed in a bin, a subset of which will survive the selection;kobs ∈ {0, 1, . . . , n}: the observed number of selected events;ε ∈ R: the expected success rate, i.e. the selection efficiency, to which we compare the observed success rate kobs/n.
The binomial distribution gives the probability of observing k events passing the selection out of the initial n events:
P (k|n, ε) = Bi(k|n, ε) =
(n
k
)εk(1− ε)n−k (8)
The expected number of surviving events is E[k|n, ε] = nε, with variance V [k|n, ε] = nε(1− ε). Finally, the Binomialp-value is defined as
p-value =
n∑n=kobs
(n
k
)εk(1− ε)n−k , kobs ≥ nε
kobs∑n=0
(n
k
)εk(1− ε)n−k , kobs < nε
(9)
The cumulative distribution function of the binomial model can be represented in terms of the regularized incom-plete Beta function [4] Ix(a, b) =
∫ x0ta−1(1 − t)b−1 dt/B(a, b) where the Euler’s Beta function can be represented in
terms of the Gamma function as B(a, b) = Γ (a)Γ (b)/Γ (a + b). The regularized incomplete beta function is availablein ROOT as
Ix(a, b) = ROOT::Math::inc beta(x,a,b),
which makes it possible to implement what follows.Let us start with the deficit case kobs < nε, for which the p-value coincides with the cumulative distribution
function:p-value = P (k ≤ kobs) = I1−ε(n− kobs, kobs + 1) , kobs < nε . (10)
For the case of an excess, we use two identities. The first is Ix(a, b) = 1−I1−x(b, a) and the second comes directly fromthe binomial distribution and is the starting point of the following chain of equations, whereas the previous identityis used in the last step:
P (k ≥ kobs + 1) = 1− P (k ≤ kobs) = 1− I1−ε(n− kobs, kobs + 1) = Iε(kobs + 1, n− kobs)

4 Georgios Choudalakis, Diego Casadei: Plotting the Differences Between Data and Expectation
Bin number Observed Expected Bin number Observed Expected
1 121687 121688 21 233 226.5092 222014 221422 22 129 144.0863 223741 223832 23 90 91.45764 189486 190065 24 51 57.93725 148673 148218 25 53 36.63616 109932 109876 26 20 23.12797 79553 78760.1 27 15 14.57798 56420 55119.7 28 13 9.175589 38771 37889.4 29 3 5.7676410 25628 25684.7 30 4 3.62111 17309 17218.4 31 4 2.270712 11553 11438.1 32 0 1.422413 7573 7540.84 33 1 0.89011914 5024 4939.65 34 0 0.55649615 3221 3217.98 35 2 0.34760816 1828 2086.41 36 0 0.21694617 1213 1347.11 37 0 0.13529118 788 866.585 38 0 0.084306219 572 555.646 39 0 0.052497920 362 355.233 40 0 0.0326686
Table 1. Observed events (D) and expected events (B), used for demonstration.
from which we immediately find the p-value for the excess:
p-value = P (k ≥ kobs) = Iε(kobs, n− kobs − 1) , kobs > nε (11)
which is defined for kobs < n (in case kobs = n one has P (k ≥ n) = P (k = n) = Bi(n|n, ε) = εn).
1.4 Unfolded data
If the histogram is the product of some unfolding procedure, things are much less clear, because the bin populations donot follow a well-known and generally applicable probability distribution. In addition, the correlations across adjacentbins are unavoidable. It is unclear even if one should try to compute, bin by bin, the significance of the differencebetween unfolded data and theoretical expectation. This could mislead people to think that the bins are independent,which is not true. For this reason, this document does not deal further with unfolded spectra.
2 Some ways to present deviations in Poisson distributed data
The goal of this section is to present a logical progression of plotting options, which will lead to the final proposal. Weexamine the different options in detail because they continue to be used despite many people know their drawbacks.All the examples will use the observed (from Monte Carlo simulation) and expected event counts of Table 1 andassume Poisson-distributed bin populations, which is the most common case in high-energy physics (Sec. 1.3 explainsthe treatment of binomial data). Two additional features have been introduced in the observed data, an excess and adeficit, to make the illustration more interesting. In case the data follow neither a Poisson nor a binomial distribution,one needs to compute the p-value according to the probability distribution which the data are assumed to follow.Besides the different p-value definition, the rest of this discussion still applies.
2.1 The D/B ratio
A simple, and very common practice (e.g., Fig. 13 in Ref. [6] and Fig. 1 in Ref. [7]), is to plot the ratio of data overexpectation (D/B), or subtract 1 to plot their relative difference, i.e. (D − B)/B. As shown in Fig. 2, clearly this isthe worst way to compare two histograms, especially when the bin contents span several orders of magnitude. It ispossible to hide significant discrepancies, as it will become obvious.
The biggest disadvantage of this method is that it does not show the statistical significance. It gives the impressionthat low-population bins are fluctuating more significantly than high-population bins, which is not true in this case.

Georgios Choudalakis, Diego Casadei: Plotting the Differences Between Data and Expectation 5
observable
0 200 400 600 800 1000
Eve
nts
-110
1
10
210
310
410
510
observable0 200 400 600 800 1000
Rel
. diff
.
-1.0-0.50.00.51.0
Fig. 2. The relative difference between data (D) and expecta-tion (B): (D − B)/B is not a good indicator of the statisticalsignificance of the observed deviations.
observable
0 200 400 600 800 1000
Eve
nts
-110
1
10
210
310
410
510
observable0 200 400 600 800 1000
B(D
- B
) /
-5
0
5
Fig. 3. The quantity (D − B)/√B approximates the statis-
tical significance in bins with large population. However, thisapproximation fails when there are only a few entries.
The last non-empty bin is off scale, and if we un-zoom the vertical axis to include it, then the other features willbecome even harder to see. Although the relative difference cannot be smaller than -1 (for D = 0), it has no upperlimit, therefore, the absolute values of negative and positive deviations are not comparable. Bins with D = 0 wouldall be at relative difference −1, regardless of B, and are typically not shown.
The only advantage of this method is that excesses of data appear above 0, and deficits below, which is intuitive.Although this method is inappropriate to convey the statistical significance of deviations, it might still be used
when a statistical comparison is not desired. For example, one may wish to show simply that the data lie within5% from the expectation, even if a 5% deviation would be statistically significant in regions with many events andinsignificant in regions with just a few.
2.2 The (D −B)/√B approximation
It is well-known that, for large B, the Poisson distribution with parameter B is approximated well by a Gaussianof mean B and standard deviation
√B. This leads to the approximation of the Poisson z-value with D−B√
B, which is
plotted in Fig. 3. For example, Ref. [8] contains such a plot.An advantage of this approach is that we see clearly two significant features: an excess around 200 and a deficit
around 400. Intuitively, excesses point “up” and deficits “down”. Indeed, the quantity shown, in bins with largeexpectation, is a good approximation of the actual Poisson z-value.
The main disadvantage is that, in low-population bins, D−B√B
is not a good approximation of the true z-value. We
will see soon that the last bin with D = 2 is not as significant as it appears in Fig. 3. Similarly, the empty bins inthe end of the spectrum do not actually have deficits of z-value between 0 and 1, as is indicated by the small negativebars. Such z-values would correspond to p-values < 0.5, but, as we are about to show, these bins contain deficits ofp-value > 0.5, which the approximation in Fig. 3 fails to describe.
2.3 Plotting signed z-values
Instead of approximating the z-value with D−B√B
, it would be better to plot the exact z-value in each bin. If a bin
contains a significant excess of data (with p-value < 0.5), it will have a z-value > 0 which, when plotted, will givecorrectly the impression of an excess. If a bin contains a significant deficit of data (with p-value < 0.5), it will havea z-value > 0 as well, so, to avoid giving the impression of an excess in bins with deficits, instead of z-value we plot−z-value in these bins. The result is in Fig. 4.

6 Georgios Choudalakis, Diego Casadei: Plotting the Differences Between Data and Expectation
observable
0 200 400 600 800 1000
Eve
nts
-110
1
10
210
310
410
510
observable0 200 400 600 800 1000
sign
ed z
-val
.
-5
0
5
Fig. 4. Showing the z-value corresponding to the p-value ineach bin. In bins with D < B, the −z-value is plotted, todistinguish excesses from deficits.
observable
0 200 400 600 800 1000
Eve
nts
-110
1
10
210
310
410
510
observable0 200 400 600 800 1000
sign
ifica
nce
-5
0
5
Fig. 5. The final proposal. Plotting the z-value only for binswith p-value < 0.5, with positive sign for excesses and negativefor deficits.
This is a more accurate representation of significance than D−B√B
, but there is still something confusing in bins with
low statistics. We know that the last few bins contain deficits (D = 0), however, they appear in Fig. 4 as if they wereexcesses. This happens because they originally had negative z-values, indicating very insignificant deficits, so, with thesign-flipping they appear like excesses. The less significant the deficit, the larger the p-value, and the more negativethe z-value, which gives the impression of an even larger excess when plotting −z-value. The same problem, but in theopposite direction, is observed in bin 33, around 800. It contains a very insignificant excess with z-value < 0, and sinceit is an excess this z-value is plotted without changing sign. The result points “down”, giving wrongly the impressionof a deficit.
2.4 The final proposal: plot signed z-values only if p-value < 0.5
In conclusion, our proposal is to plot z-values as in section 2.3, which are negative in bins with data deficits, with theexception of bins with p-value > 0.5, whose significance should be simply not shown. The result is shown in Fig. 5.
The justification for not showing the significance of bins where p-value > 0.5 is that such bins agree perfectly withexpectation: such deviations are totally uninteresting. In addition, trying to present their z-values could be misleading,as explained in section 2.3.
The advantages of this proposal are the following:
– The z-value is accurate, unlike the (D −B)/√B approximation.
– Positive values represent excesses of data over the expectation, and negative values correspond to deficits.– No feature is hidden if it is worth showing, namely if it has a p-value < 0.5.– Bins with high and low statistics (like bin 35 with D = 2 and bin 32 with D = 0) are treated in the same way.– If the significance is not shown for a bin, it means that there is no relevant deviation from the expectation.– What we propose is easy to implement, using existing ROOT functions as we show in sections 1.1, 1.2 and 1.3.
3 Including the theoretical uncertainty
Any theoretical uncertainty in the reference value will affect the significance of the observation. For example, in case ofa Poisson process with parameter B, a non-zero uncertainty on B will decrease the significance of the difference betweenD and B. Because realistic use cases always involve some (perhaps small) theoretical uncertainty, it is important tostudy its effects on our estimate of the significance of the result. A full treatment would require to solve an inference

Georgios Choudalakis, Diego Casadei: Plotting the Differences Between Data and Expectation 7
observable
0 200 400 600 800 1000
Eve
nts
-110
1
10
210
310
410
510
observable0 200 400 600 800 1000
sign
ifica
nce
-5
0
5
Fig. 6. The error bars in the inset indicate the range by whichthe significance varies when recomputed after shifting the ex-pectation by ±1 standard deviation, corresponding to the errorboxes shown in the main plot. This is not the correct way ofaccounting for theoretical uncertainties.
observable
0 200 400 600 800 1000
Eve
nts
-110
1
10
210
310
410
510
Data
Expectation
Significance (no unc.)
Significance with uncertainty
observable0 200 400 600 800 1000
sign
ifica
nce
-5
0
5
Fig. 7. The inset shows the significance computed by neglect-ing the theoretical uncertainty on the expectation (red his-togram) and by including it (blue histogram). Including addi-tional sources of uncertainty decreases the significance.
problem. However, here we limit ourselves to the aspects which are relevant when making plots, and consider only thetotal theoretical uncertainty, without addressing all possible components which may contribute to it.
Of course, in some cases it makes sense not to show the effect of theoretical uncertainties. For example, this canbe done if the theoretical uncertainty is negligible compared to the statistical uncertainty, or if the deviations withouttheoretical uncertainty are already not significant enough to deserve further investigation. On the other hand, beforeclaiming than an excess is really statistical significant one should always check what happens when including the totaluncertainty on the expectation.
At first sight, a simple procedure to warn the reader about the effects of the theoretical uncertainty on B wouldseem to plot the significance shown in Fig. 5 with “error bars”. The upper and lower deviations with respect to thesignificance computed above could correspond to the result of recomputing the significance with the parameter Bshifted by ±1 standard deviation (assuming symmetric uncertainty). An example of this is in Fig. 6, where the relativeuncertainty in bin i has been set to 10−5 · i3. The problem with this approach is that it misses the fundamental point:any additional uncertainty will decrease the significance of the observed deviation.
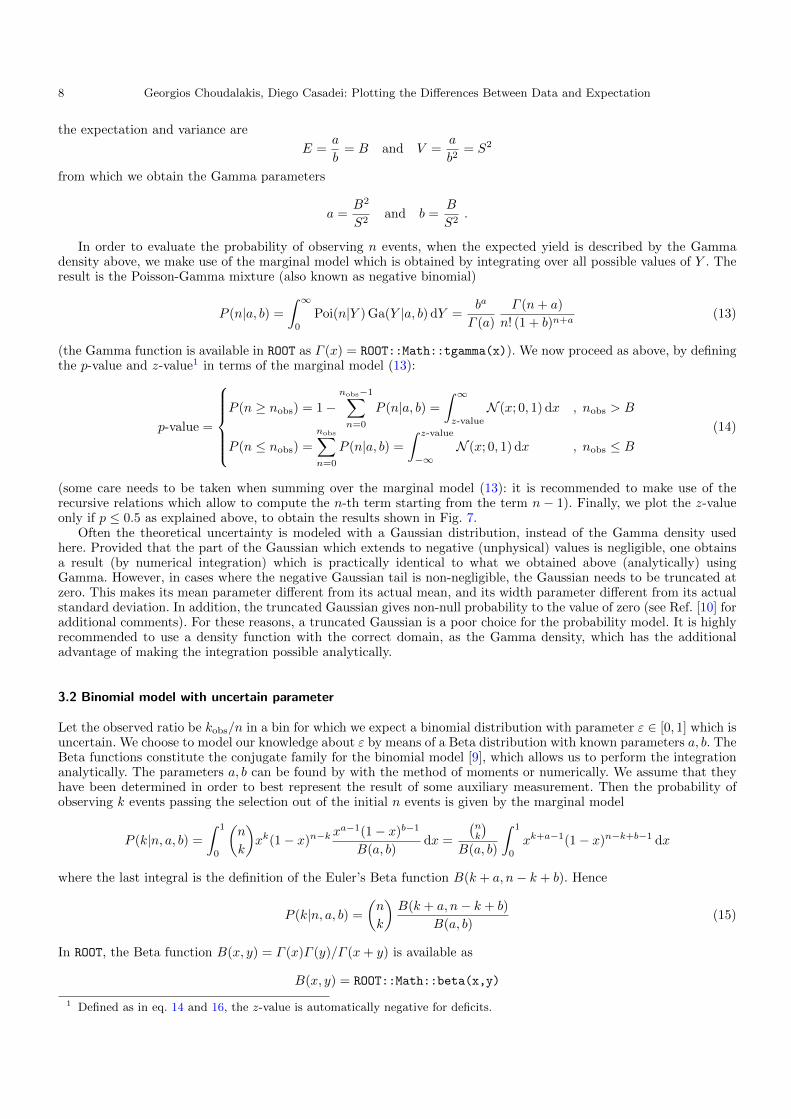
This can be shown with a formal approach, which would correspond to a Bayesian treatment of the uncertainties.It consists of computing the p-value with the marginal model obtained after integration over the parameter, whoseprior describes the experimenter’s degree of belief on the allowed range of values. This is explained in detail in thenext two sections for the Poisson and binomial models, and it is illustrated by Fig. 7, which should be compared toFig. 6.
3.1 Poisson model with uncertain parameter
In any bin the probability of observing n events is given by the Poisson distribution with parameter Y > 0 (theexpected number of events), which is not certain. One assumes to know its best estimate (which we take to be theexpectation B of Y ) and “uncertainty” (which we take to be the square root S of the variance of Y ). In most casesB and S are the result of some auxiliary measurement. We choose to model the uncertainty on the Poisson paramterwith a function belonging to the Gamma family, which is the conjugate family for the Poisson model. This allows toperform the integration analytically. A unique Gamma density corresponds to the pair (B,S). If we write the Gammadensity as
Ga(x|a, b) =ba
Γ (a)xa−1 e−bx (12)
8 Georgios Choudalakis, Diego Casadei: Plotting the Differences Between Data and Expectation
the expectation and variance are
E =a
b= B and V =
a
b2= S2
from which we obtain the Gamma parameters
a =B2
S2and b =
B
S2.
In order to evaluate the probability of observing n events, when the expected yield is described by the Gammadensity above, we make use of the marginal model which is obtained by integrating over all possible values of Y . Theresult is the Poisson-Gamma mixture (also known as negative binomial)
P (n|a, b) =
∫ ∞0
Poi(n|Y ) Ga(Y |a, b) dY =ba
Γ (a)
Γ (n+ a)
n! (1 + b)n+a(13)
(the Gamma function is available in ROOT as Γ (x) = ROOT::Math::tgamma(x)). We now proceed as above, by definingthe p-value and z-value1 in terms of the marginal model (13):
p-value =
P (n ≥ nobs) = 1−
nobs−1∑n=0
P (n|a, b) =
∫ ∞z-value
N (x; 0, 1) dx , nobs > B
P (n ≤ nobs) =
nobs∑n=0
P (n|a, b) =
∫ z-value
−∞N (x; 0, 1) dx , nobs ≤ B
(14)
(some care needs to be taken when summing over the marginal model (13): it is recommended to make use of therecursive relations which allow to compute the n-th term starting from the term n − 1). Finally, we plot the z-valueonly if p ≤ 0.5 as explained above, to obtain the results shown in Fig. 7.
Often the theoretical uncertainty is modeled with a Gaussian distribution, instead of the Gamma density usedhere. Provided that the part of the Gaussian which extends to negative (unphysical) values is negligible, one obtainsa result (by numerical integration) which is practically identical to what we obtained above (analytically) usingGamma. However, in cases where the negative Gaussian tail is non-negligible, the Gaussian needs to be truncated atzero. This makes its mean parameter different from its actual mean, and its width parameter different from its actualstandard deviation. In addition, the truncated Gaussian gives non-null probability to the value of zero (see Ref. [10] foradditional comments). For these reasons, a truncated Gaussian is a poor choice for the probability model. It is highlyrecommended to use a density function with the correct domain, as the Gamma density, which has the additionaladvantage of making the integration possible analytically.
3.2 Binomial model with uncertain parameter
Let the observed ratio be kobs/n in a bin for which we expect a binomial distribution with parameter ε ∈ [0, 1] which isuncertain. We choose to model our knowledge about ε by means of a Beta distribution with known parameters a, b. TheBeta functions constitute the conjugate family for the binomial model [9], which allows us to perform the integrationanalytically. The parameters a, b can be found by with the method of moments or numerically. We assume that theyhave been determined in order to best represent the result of some auxiliary measurement. Then the probability ofobserving k events passing the selection out of the initial n events is given by the marginal model
P (k|n, a, b) =
∫ 1
0
(n
k
)xk(1− x)n−k
xa−1(1− x)b−1
B(a, b)dx =
(nk
)B(a, b)
∫ 1
0
xk+a−1(1− x)n−k+b−1 dx
where the last integral is the definition of the Euler’s Beta function B(k + a, n− k + b). Hence
P (k|n, a, b) =
(n
k
)B(k + a, n− k + b)
B(a, b)(15)
In ROOT, the Beta function B(x, y) = Γ (x)Γ (y)/Γ (x+ y) is available as
B(x, y) = ROOT::Math::beta(x,y)
1 Defined as in eq. 14 and 16, the z-value is automatically negative for deficits.

Georgios Choudalakis, Diego Casadei: Plotting the Differences Between Data and Expectation 9
which makes the marginal model (15) easy to compute, although summing over it is better achieved if the recurrencerelations which connect P (k|n, a, b) to P (k − 1|n, a, b) are exploited.
The p-value and z-value are then defined in terms of the marginal model (15) as
p-value =
P (k ≥ kobs) =
n∑k=kobs
P (k|n, a, b) =
∫ ∞z-value
N (x; 0, 1) dx , kobs ≥ nε
P (k ≤ kobs) =
kobs∑k=0
P (k|n, a, b) =
∫ z-value
−∞N (x; 0, 1) dx , kobs < nε
(16)
Finally, one plots only the z-values which correspond to p ≥ 0.5 as explained in the previous sections.Similarly to the Poisson case, the choice of a Gaussian distribution to model the theoretical uncertainty is problem-
atic, because in the binomial case the domain is limited to the interval [0, 1], so the Gaussian may have to be truncatedon both sides. The Beta density is strongly recommended because it has the correct domain and it allows for ana-lytic integration. In cases where the Gaussian distribution does not span much below 0 or above 1, it is practicallyindistinguishable from the Beta distribution with the same mean and standard deviation.
4 Summary
In this article, we propose an improved way of plotting the difference between data and expectation, based on thesignificance of the difference in each bin. We have shown than one can obtain an accurate plot of the statisticalsignificance of the deviation of the bin contents from the expectation, obtaining at the same time an intuitive pictureof the relevant deficits and excesses. This is achieved by computing the exact p-value and, when its value is smaller that50% probability, by mapping it into the z-value which gives the deviation in units of Gaussian standard deviations.The sign of z-values is always positive for excesses and negative for deficits, making it trivial to decode the result atfirst sight.
When there are important deviations, whose z-values are above 3 or 4, it is fundamental to check what happens byincluding the total uncertainty on the expectation. This always2 lowers the actual significance and provides a resultwhich is closer to what one would have obtained by performing a proper statistical inference. Here the focus is onlyon methods which can improve illustrations. However, it is important to notice that our formulae for the p-values inthe presence of uncertainty on the expectation coincide with the solutions pΓ for the Poisson case and pBi for thebinomial case, computed by Cousins, Linnemann, and Tucker [10] using a completely different approach. These authorshave performed frequentist evaluations of the performance of such estimators and concluded that they are optimalfor statistical inference. We repeat that we do not focus on statistical inference here, but this agreement betweencompletely independent derivations makes us more confident about the validity of our proposal.
Acknowledgements
We thank Alex Read, Glen Cowan, and Kyle Cranmer for their feedback.
References
1. I. Antcheva et al., “ROOT: A C++ framework for petabyte data storage, statistical analysis and visualization”, Com-put. Phys. Commun. 180 (2009) 2499–2512, doi: 10.1016/j.cpc.2009.08.005.
2. D. Casadei, “Statistical methods used in ATLAS for exclusion and discovery”, proceed. of PHYSTAT2011, CERN, 17-20Jan 2011, arXiv: 1108.2288.
3. The ATLAS Collaboration, “Search for New Physics in the Dijet Mass Distribution using 1 fb−1 of pp Collision Data at√s = 7 TeV collected by the ATLAS Detector”, subm. to Phys. Lett. B, arXiv: 1108.6311.
4. M. Abramowitz and I.A. Stegun (eds.), Handbook of Mathematical Functions with Formulas, Graphs, and MathematicalTables, Dover, New York, 1965, ISBN 978-0486612720.
2 After publication we realized that this statement is not always true. When the significance without extra uncertaintiesis large, then indeed adding extra uncertainty lowers the significance. But if the significance is small without consideringadditional uncertainties, it is actually possible that it increases when additional uncertainties are convoluted. This is a well-known effect which can be explained, qualitatively, in this way: If without extra uncertainties the data agree (almost) perfectlywith expectation, then convoluting alternative possibilities could make the agreement worse, since these alternatives cannotpossibly entail better than perfect agreement.

10 Georgios Choudalakis, Diego Casadei: Plotting the Differences Between Data and Expectation
5. The ATLAS Collaboration, “Search for New Physics in Dijet Mass and Angular Distributions in pp Collisions at√s = 7 TeV Measured with the ATLAS Detector”, New J. Phys. 13 (2011) 053044, doi: 10.1088/1367-2630/13/5/053044,
arXiv: 1103.3864.6. The ATLAS Collaboration, “Measurement of inclusive jet and dijet cross sections in proton-proton collisions at 7 TeV
centre-of-mass energy with the ATLAS detector”, Eur. Phys. J. C 71 (2011) 1512, arXiv: 1009.5908.7. The CDF Collaboration, “Search for new particles decaying into dijets in proton-antiproton collisions at
√s = 1.96 TeV”,
Phys.Rev.D79:112002,2009, arXiv: 0812.4036.8. The ATLAS Collaboration, “Search for New Physics in Dijet Mass and Angular Distributions in pp Collisions at
√s = 7
TeV Measured with the ATLAS Detector”, New J.Phys.13:053044,2011, arXiv: 1103.3864.9. D. Casadei, “Estimating the selection efficiency”, arXiv: 0908.0130.
10. R.D. Cousins, J.T. Linnemann, & J. Tucker, “Evaluation of three methods for calculating statistical significance whenincorporating a systematic uncertainty into a test of the background-only hypothesis for a Poisson process”, NIM A 595(2008) 480–501, doi: 10.1016/j.nima.2008.07.086, arXiv: physics/0702156.


