Embed Size (px)
Citation preview

Astronomy & Astrophysics manuscript no. m31 c© ESO 2014July 22, 2014
Planck intermediate results. XXV.The Andromeda Galaxy as seen by Planck
Planck Collaboration: P. A. R. Ade78, N. Aghanim54, M. Arnaud66, M. Ashdown63,6, J. Aumont54, C. Baccigalupi77, A. J. Banday84,10,R. B. Barreiro60, N. Bartolo27, E. Battaner85,86, R. Battye62, K. Benabed55,83, G. Bendo62, A. Benoit-Levy21,55,83, J.-P. Bernard84,10,
M. Bersanelli30,47, P. Bielewicz84,10,77, A. Bonaldi62, L. Bonavera60, J. R. Bond9, J. Borrill13,79, F. R. Bouchet55,83, C. Burigana46,28, R. C. Butler46,E. Calabrese82, J.-F. Cardoso67,1,55, A. Catalano68,65, A. Chamballu66,14,54, R.-R. Chary52, X. Chen52, H. C. Chiang24,7, P. R. Christensen74,33,
D. L. Clements51, L. P. L. Colombo20,61, C. Combet68, F. Couchot64, A. Coulais65, B. P. Crill61,75, A. Curto6,60, F. Cuttaia46, L. Danese77,R. D. Davies62, R. J. Davis62, P. de Bernardis29, A. de Rosa46, G. de Zotti43,77, J. Delabrouille1, C. Dickinson62, J. M. Diego60, H. Dole54,53,
S. Donzelli47, O. Dore61,11, M. Douspis54, A. Ducout55,51, X. Dupac36, G. Efstathiou57, F. Elsner55,83, T. A. Enßlin71, H. K. Eriksen58,F. Finelli46,48, O. Forni84,10, M. Frailis45, E. Franceschi46, A. Frejsel74, S. Galeotta45, K. Ganga1, M. Giard84,10, Y. Giraud-Heraud1, E. Gjerløw58,
J. Gonzalez-Nuevo60,77, K. M. Gorski61,87, A. Gregorio31,45,50, A. Gruppuso46, F. K. Hansen58, D. Hanson72,61,9, D. L. Harrison57,63,S. Henrot-Versille64, C. Hernandez-Monteagudo12,71, D. Herranz60, S. R. Hildebrandt11, E. Hivon55,83, W. A. Holmes61, A. Hornstrup15,W. Hovest71, K. M. Huffenberger22, G. Hurier54, F. P. Israel81, A. H. Jaffe51, T. R. Jaffe84,10, W. C. Jones24, M. Juvela23, E. Keihanen23,
R. Keskitalo13, T. S. Kisner70, R. Kneissl35,8, J. Knoche71, M. Kunz16,54,3, H. Kurki-Suonio23,41, G. Lagache54, A. Lahteenmaki2,41,J.-M. Lamarre65, A. Lasenby6,63, M. Lattanzi28, C. R. Lawrence61, R. Leonardi36, F. Levrier65, M. Liguori27, P. B. Lilje58, M. Linden-Vørnle15,
M. Lopez-Caniego60, P. M. Lubin25, J. F. Macıas-Perez68, S. Madden66, B. Maffei62, D. Maino30,47, N. Mandolesi46,5,28, M. Maris45, P. G. Martin9,E. Martınez-Gonzalez60, S. Masi29, S. Matarrese27, P. Mazzotta32, L. Mendes36, A. Mennella30,47, M. Migliaccio57,63,
M.-A. Miville-Deschenes54,9, A. Moneti55, L. Montier84,10, G. Morgante46, D. Mortlock51, D. Munshi78, J. A. Murphy73, P. Naselsky74,33,F. Nati29, P. Natoli28,4,46, H. U. Nørgaard-Nielsen15, F. Noviello62, D. Novikov51, I. Novikov74, C. A. Oxborrow15, L. Pagano29,49, F. Pajot54,
R. Paladini52, D. Paoletti46,48, B. Partridge40, F. Pasian45, T. J. Pearson11,52, M. Peel62∗, O. Perdereau64, F. Perrotta77, V. Pettorino39,F. Piacentini29, M. Piat1, E. Pierpaoli20, D. Pietrobon61, S. Plaszczynski64, E. Pointecouteau84,10, G. Polenta4,44, L. Popa56, G. W. Pratt66,
S. Prunet55,83, J.-L. Puget54, J. P. Rachen18,71, M. Reinecke71, M. Remazeilles62,54,1, C. Renault68, S. Ricciardi46, I. Ristorcelli84,10, G. Rocha61,11,C. Rosset1, M. Rossetti30,47, G. Roudier1,65,61, J. A. Rubino-Martın59,34, B. Rusholme52, M. Sandri46, G. Savini76, D. Scott19, L. D. Spencer78,
V. Stolyarov6,63,80, R. Sudiwala78, D. Sutton57,63, A.-S. Suur-Uski23,41, J.-F. Sygnet55, J. A. Tauber37, L. Terenzi38,46, L. Toffolatti17,60,46,M. Tomasi30,47, M. Tristram64, M. Tucci16,64, G. Umana42, L. Valenziano46, J. Valiviita23,41, B. Van Tent69, P. Vielva60, F. Villa46, L. A. Wade61,
B. D. Wandelt55,83,26, R. Watson62, I. K. Wehus61, D. Yvon14, A. Zacchei45, and A. Zonca25
(Affiliations can be found after the references)
Preprint online version: July 22, 2014
ABSTRACT
The Andromeda Galaxy (M31) is one of a few galaxies that has sufficient angular size on the sky to be resolved by the Planck satellite. Planckhas detected M31 in all of its frequency bands, and has mapped out the dust emission with the High Frequency Instrument, clearly resolvingmultiple spiral arms and sub-features. We examine the morphology of this long-wavelength dust emission as seen by Planck, including a study ofits outermost spiral arms, and investigate the dust heating mechanism across M31. We find that dust dominating the longer wavelength emission(& 0.3 mm) is heated by the diffuse stellar population (as traced by 3.6µm emission), with the dust dominating the shorter wavelength emissionheated by a mix of the old stellar population and star-forming regions (as traced by 24µm emission). We also fit spectral energy distributions(SEDs) for individual 5′ pixels and quantify the dust properties across the galaxy, taking into account these different heating mechanisms, findingthat there is a linear decrease in temperature with galactocentric distance for dust heated by the old stellar population, as would be expected, withtemperatures ranging from around 22 K in the nucleus to 14 K outside of the 10 kpc ring. Finally, we measure the integrated spectrum of the wholegalaxy, which we find to be well-fitted with a global dust temperature of (18.9 ± 0.9) K with a spectral index of 1.61 ± 0.11 (assuming a singlemodified blackbody), and a significant amount of free-free emission at intermediate frequencies, which when converted into a star formation rateagrees well with the star formation estimate from Hα emission of 0.4 M yr−1. We see no evidence for spinning dust emission, with a 3σ upperlimit of 1.26 Jy in the 20-60 GHz band.
Key words. Galaxies: individual: Messier 31 – Galaxies: structure – Galaxies: ISM – Submillimeter: galaxies – Radio continuum: galaxies
1. Introduction
The infrared (IR) and submillimetre (submm) wavelength do-main is particularly useful for understanding the processes driv-ing star formation in various galactic environments, since dustgrains re-emit in this frequency window the energy that has beenabsorbed from the UV-optical starlight. Our view of the global
∗ Corresponding author: M. Peel, [email protected]
inner and outer disk star formation and ISM properties of the spi-ral galaxy in which we live is limited by our position inside theGalaxy, but our nearest spiral neighbour, the Andromeda Galaxy(also known as Messier 31 and NGC 224), offers the best viewof the environmental effects within an entire galaxy, particularlybecause of its large angular extent on the sky.
M31 has been extensively studied at IR/submm wave-lengths with data from the Infrared Astronomical Satellite (IRAS,Habing et al. 1984; Walterbos & Schwering 1987), the Infrared
arX
iv:1
407.
5452
v1 [
astr
o-ph
.GA
] 2
1 Ju
l 201
4

2 Planck Collaboration: Andromeda as seen by Planck
Space Observatory (ISO, Haas et al. 1998), the Spitzer SpaceTelescope (Barmby et al. 2006; Gordon et al. 2006), and, mostrecently, the Herschel Space Observatory (Fritz et al. 2012;Groves et al. 2012; Smith et al. 2012; Ford et al. 2013; Kirket al. 2013; Draine et al. 2014; Viaene et al. 2014). Except forthe Herschel data, these IR observations have been restricted toobserving the peak of the dust emission in the far infrared (FIR)as well as mid-infrared (MIR) emission from >
∼100 K dust and
polycyclic aromatic hydrocarbons. In contrast, it has been partic-ularly difficult to map M31 at wavelengths longer than 500µm,which is needed to constrain the Rayleigh-Jeans side of the dustemission and the contribution of non-thermal emission sourcesto the spectral energy distribution (SED). In fact, the submm datafor nearby spiral galaxies that have been published (e.g., Dunneet al. 2000; Stevens et al. 2005; Dale et al. 2007) have had lowsignal-to-noise levels, have been biased towards infrared-brightsources, or have only covered the centres of galaxies.
Data from Planck (Tauber et al. 2010)1, which range from28.4 to 857 GHz, allow us to examine the Rayleigh-Jeans tail ofthe dust SED and the transition into free-free and synchrotronemission at longer wavelengths. Moreover, since Planck ob-served the entire sky at high sensitivity, its High FrequencyInstrument (HFI, Lamarre et al. 2010) provides high signal-to-noise maps of M31 that extend to the outermost edges of thegalaxy.
Planck’s large-scale map of the region provides the oppor-tunity to study dust heating in M31 out to the optical radiusof the galaxy. Prior investigations with IRAS of dust heatingin our Galaxy and others had produced seemingly contradic-tory results, with some studies indicating that dust seen at 60–100µm was heated primarily by star-forming regions (Devereux& Young 1990; Buat & Xu 1996) and others demonstrat-ing that evolved stellar populations could partially contributeto heating the dust seen by IRAS (e.g., Lonsdale Persson &Helou 1987; Walterbos & Schwering 1987; Sauvage & Thuan1992; Walterbos & Greenawalt 1996). More recent observa-tions with Herschel of a number of galaxies, including M81,M83, NGC2403 (Bendo et al. 2010, 2012a) and M33 (Boquienet al. 2011), demonstrated that dust-dominating emission atwavelengths shorter than 160µm was primarily heated by star-forming regions (henceforth abbreviated as “SFR dust”), whiledust-dominating emission at wavelengths over 250µm maybe primarily heated by the total stellar populations, includingevolved stars in the discs and bulges of the galaxies (henceforthabbreviated as interstellar radiation field dust, or “ISRF dust.”Planck observations of the SED of M31 allow us to examinedust heating within the galaxy at frequencies much lower thanwas possible with Herschel. Once the dust heating sources areidentified empirically and the SED is separated into differentthermal components based on the heating sources, it will be pos-sible to more accurately measure the temperature of the coldestdust within M31, which is also critically important to properlyestimate the dust mass.
Non-thermal emission from M31 can also be measured atthe lowest frequencies covered by Planck. Synchrotron emissionfrom M31 was discovered in the early days of radio astronomy(Brown & Hazard 1950, 1951). It has subsequently been mapped
1 Planck (http://www.esa.int/Planck) is a project of theEuropean Space Agency – ESA – with instruments provided by twoscientific Consortia funded by ESA member states (in particular thelead countries: France and Italy) with contributions from NASA (USA),and telescope reflectors provided in a collaboration between ESA and ascientific Consortium led and funded by Denmark.
at low frequencies (Beck et al. 1998; Berkhuijsen et al. 2003),and associated emission has even been detected at gamma-rayfrequencies (Abdo et al. 2010). However, the synchrotron emis-sion has not been studied at higher frequency. Free-free emissionis also expected from M31. This emission may be used to mea-sure star formation rates in a way that is not affected by dustextinction or reliant upon assumptions about the dust heatingsources (e.g., see Murphy et al. 2011). However, free-free emis-sion from M31 has not yet been identified. Planck data providethe opportunity to do this for the first time.
Section 2 of this paper describes the Planck data, and Sect. 3the ancillary data that we use here. We discuss the morphologyof the dust as seen by Planck in Sect. 4, the colour ratios and theimplications they have on the dust heating mechanism in Sect. 5,and the spectral energy distributions on 5′ scales in Sect. 6 andfor the whole of M31 in Sect. 7. We conclude in Sect. 8.
2. Planck data
Planck (Tauber et al. 2010; Planck Collaboration I 2011) is thethird generation space mission to measure the anisotropy of thecosmic microwave background (CMB). It observes the sky innine frequency bands covering 30–857 GHz with high sensitiv-ity and angular resolution from 31′ to 5′. The Low FrequencyInstrument (LFI; Mandolesi et al. 2010; Bersanelli et al. 2010;Mennella et al. 2011) covers the 30, 44, and 70 GHz bands withamplifiers cooled to 20 K. The High Frequency Instrument (HFI;Lamarre et al. 2010; Planck HFI Core Team 2011a) covers the100, 143, 217, 353, 545, and 857 GHz bands with bolometerscooled to 0.1 K. Polarization is measured in all but the highesttwo bands (Leahy et al. 2010; Rosset et al. 2010). A combina-tion of radiative cooling and three mechanical coolers producesthe temperatures needed for the detectors and optics (PlanckCollaboration II 2011). Two data processing centres (DPCs)check and calibrate the data and make maps of the sky (PlanckHFI Core Team 2011b; Zacchei et al. 2011). Planck’s sensitiv-ity, angular resolution, and frequency coverage make it a pow-erful instrument for Galactic and extragalactic astrophysics aswell as cosmology. Early astrophysics results are given in PlanckCollaboration VIII–XXVI 2011, based on data taken between13 August 2009 and 7 June 2010. Intermediate astrophysics re-sults are presented in a series of papers between the major datareleases.
In this paper we use Planck data from the 2013 distributionof released products (Planck Collaboration I 2014), which canbe accessed via the Planck Legacy Archive interface2, based onthe data acquired by Planck during its “nominal” operations pe-riod from 13 August 2009 to 27 November 2010. In order tostudy M31 in the Planck maps, the CMB needs to be subtracted.CMB maps in the M31 region are shown in Fig. 1. The CMB-subtracted Planck maps are presented in Fig. 2 at their nativeresolution and their properties are summarized in Table 1. Weuse various combinations of the Planck maps throughout thispaper, and all maps are used to qualitatively study the emissionat all Planck frequencies in Sect. 4. Maps at 217 GHz and higherfrequencies are used to quantitatively investigate the emission inSects. 5 and 6, and all frequencies are used to measure the totalemission in Sect. 7.
CMB subtraction is particularly important for M31, given thesimilarities in angular size between M31 and the anisotropiesin the CMB. Additionally, there is an unfortunately large
2 http://www.sciops.esa.int/index.php?project=planck&page=Planck_Legacy_Archive

Planck Collaboration: Andromeda as seen by Planck 3
Right Ascension (J2000)
De
clin
atio
n (
J2
00
0)
+40:00
+41:00
+42:00
+43:00
217 GHz(no CMB subtraction)
-4.0 -3.5
log(TRJ (K))
217 GHz(CMB-subtracted)
-4.0 -3.5
log(TRJ (K))
+40:00
+41:00
+42:00
+43:00
SMICA CMB map
-400 0 400
TCMB (µK)
Commander CMB map
-400 0 400
TCMB (µK)
00:50 00:40
+40:00
+41:00
+42:00
+43:00
SEVEM CMB map
-400 0 400
TCMB (µK)
00:50 00:40
NILC CMB map
-400 0 400
TCMB (µK)
Fig. 1. Top left: M31 at 217 GHz, with no CMB subtraction. Topright: the SMICA CMB-subtracted 217 GHz map. Middle left:the SMICA map of the CMB in the same region. Middle right:Commander CMB map. Bottom left: SEVEM CMB map. Bottomright: NILC CMB map.
(approximately 290µK) positive CMB fluctuation at the south-ern end of M31, which can be clearly seen in the CMB mappanels of Fig. 1. As part of the Planck 2013 delivery, CMBmaps from four component separation techniques were re-leased, namely maps from the Commander, NILC, SEVEM andSMICA component separation methods (Planck CollaborationXII 2014). We specifically use the SMICA CMB map to subtractthe CMB from the Planck data, as from a visual inspection thisappears to be the cleanest map of the CMB in this region fromthe four methods (see Fig. 1). The NILC and SEVEM maps areparticularly contaminated by emission from M31; we also usethe NILC map to test the impact of residual foreground emissionbeing subtracted out of the maps along with the CMB. Figure 1shows the 217 GHz map pre- and post-CMB subtraction, alongwith the four CMB maps of the M31 region.
The maps are converted from TCMB to TRJ using the standardcoefficients as described in Planck Collaboration ES (2013); wealso use the nominal frequencies for the bands, and (when fittinga spectral model to the data) colour corrections, depending onthe spectra of the emission. The 100 and 217 GHz Planck bandsinclude CO emission. The CO emission from M31 has beenmapped with ground-based telescopes (e.g., Koper et al. 1991;Dame et al. 1993; Nieten et al. 2006, but these do not include the
full extent of M31 that is considered here. The CO emission istoo weak to be reliably detected in the full-sky Planck CO maps(Planck Collaboration XIII 2014).3 We do not correct for the COemission in the maps; instead we omit the 217 GHz channel fromthe SED fitting in Sect. 6, and we compare the level of CO emis-sion expected from the ground-based CO map of Nieten et al.(2006) (described in Sect. 3.1) with the emission attributable toCO in the integrated Planck measurements of M31 in Sect. 7.
To assess the uncertainty in the Planck maps, we estimate theinstrumental noise and cirrus contamination by measuring thescatter of flux densities in an adjacent background region of thePlanck maps (see Sect. 6 for details). We conservatively assumecalibration uncertainties of 10 % for 857 and 545 GHz and 3 %for all other Planck frequencies (see Planck Collaboration ES2013).
For some parts of this analysis (particularly the integratedspectrum in Sect. 7), the Planck full-sky maps are used directlyin HEALPix4 format (Gorski et al. 2005). For the higher res-olution analyses, however, we use “postage stamp” 2-D pro-jected maps centred on M31. To conserve the photometry ofthe data whilst repixelizing, we use the Gnomdrizz package(Paradis et al. 2012a) to create the postage stamp maps fromthe HEALPix data; since the HEALPix Gnomview function usesnearest-neighbour interpolation, it does not necessarily conservethe photometry, although we tested that there is no significantdifference in this case. The resulting postage stamp maps inequatorial coordinates are of size 250′ × 250′ with 0.5′ × 0.5′pixels, centred on RA 10.68, dec 41.27 (l = 121.2, b = −21.6).
When quantitatively analysing the data, we first smooth to acommon resolution of either 5′ (at 217 GHz and above, wherethe data have a native resolution of 4.′39–4.′87) or 1 (at allfrequencies) by convolving the map with a circular Gaussianbeam with a full-width at half-maximum (FWHM) of θconv =(θ2
new − θ2old
)1/2, where θnew is the desired FWHM and θold is the
current FWHM of the maps. For some of the later analysis, wealso repixelize the 5′ resolution data into 5′ pixels (see Sect.5), while the 1 data are analysed at their native HEALPix Nsideresolution. The Planck beams are not symmetric at the roughly20 % level (e.g., see Zacchei et al. 2011; Planck HFI Core Team2011b); smoothing the data to a common resolution reduces theeffect of the asymmetry. However, a residual low-level effect willstill be present in this analysis, for example in terms of introduc-ing some correlation between adjacent 5′ pixels.
3. Ancillary data
The ancillary data that we use in this paper fall under two cate-gories. For the higher resolution spatial analysis, we need obser-vations with resolution equal to or greater than the Planck highfrequency resolution of 5′; these are described in Sect. 3.1. Forthe integrated SED, we can make use of large-scale survey datawith a resolution of 1 or higher; we describe these data sets inSect. 3.2. All of the data sets are summarized in Table 1.
We also make use of ancillary information about the distanceand inclination of M31. M31 is at a distance of (785 ± 25) kpc
3 There is no detection in the Planck Type 1 CO map (PlanckCollaboration XIII 2014); the morphology is not consistent with theknown structure in the Type 2 map, and although there is a detection inthe Type 3 map and the ring morphology is visible, the detection doesnot have a high signal-to-noise ratio and may be contaminated by dustemission.
4 http://healpix.jpl.nasa.gov
4 Planck Collaboration: Andromeda as seen by Planck
Right Ascension (J2000)
De
clin
atio
n (
J2
00
0)
+40:00
+41:00
+42:00
+43:00
28.4 GHz
-3.75 -3.25
log(TRJ)
44.1 GHz
-4.0 -3.5
log(TRJ)
70.4 GHz
-4.0 -3.5log(TRJ)
100 GHz
-4.25 -3.75
log(TRJ)
+40:00
+41:00
+42:00
+43:00
143 GHz
-4.25 -3.75
log(TRJ)
217 GHz
-4.0 -3.5log(TRJ)
353 GHz
-4.0 -3.5
log(TRJ)
545 GHz
-4.0 -3.5 -3.0
log(TRJ)
00:50 00:40
+40:00
+41:00
+42:00
+43:00
857 GHz
-4.0 -3.5 -3.0
log(TRJ)
00:50 00:40
3000 GHz
0.5 1.0 1.5log(MJy sr-1)
00:50 00:40
5000 GHz
0.0 0.5log(MJy sr-1)
00:50 00:40
12 000 GHz
0.2 0.4log(MJy sr-1)
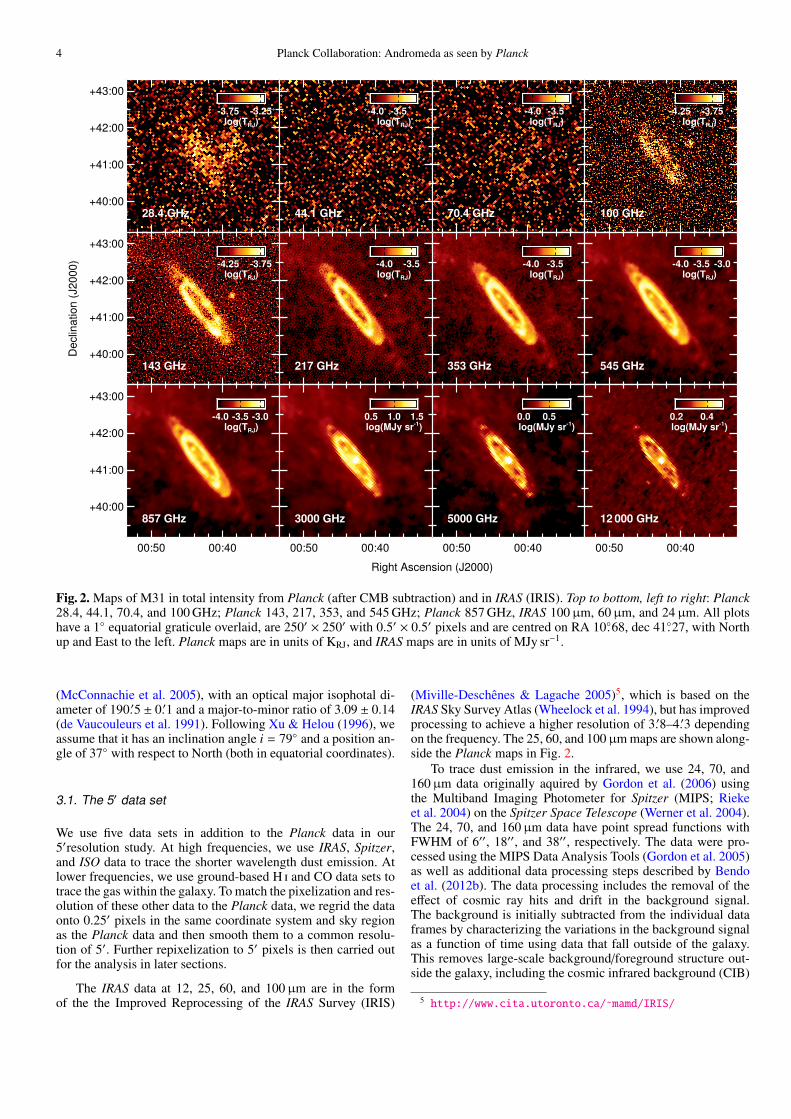
Fig. 2. Maps of M31 in total intensity from Planck (after CMB subtraction) and in IRAS (IRIS). Top to bottom, left to right: Planck28.4, 44.1, 70.4, and 100 GHz; Planck 143, 217, 353, and 545 GHz; Planck 857 GHz, IRAS 100µm, 60µm, and 24µm. All plotshave a 1 equatorial graticule overlaid, are 250′ × 250′ with 0.5′ × 0.5′ pixels and are centred on RA 10.68, dec 41.27, with Northup and East to the left. Planck maps are in units of KRJ, and IRAS maps are in units of MJy sr−1.
(McConnachie et al. 2005), with an optical major isophotal di-ameter of 190.′5 ± 0.′1 and a major-to-minor ratio of 3.09 ± 0.14(de Vaucouleurs et al. 1991). Following Xu & Helou (1996), weassume that it has an inclination angle i = 79 and a position an-gle of 37 with respect to North (both in equatorial coordinates).
3.1. The 5′ data set
We use five data sets in addition to the Planck data in our5′resolution study. At high frequencies, we use IRAS, Spitzer,and ISO data to trace the shorter wavelength dust emission. Atlower frequencies, we use ground-based H i and CO data sets totrace the gas within the galaxy. To match the pixelization and res-olution of these other data to the Planck data, we regrid the dataonto 0.25′ pixels in the same coordinate system and sky regionas the Planck data and then smooth them to a common resolu-tion of 5′. Further repixelization to 5′ pixels is then carried outfor the analysis in later sections.
The IRAS data at 12, 25, 60, and 100µm are in the formof the the Improved Reprocessing of the IRAS Survey (IRIS)
(Miville-Deschenes & Lagache 2005)5, which is based on theIRAS Sky Survey Atlas (Wheelock et al. 1994), but has improvedprocessing to achieve a higher resolution of 3.′8–4.′3 dependingon the frequency. The 25, 60, and 100µm maps are shown along-side the Planck maps in Fig. 2.
To trace dust emission in the infrared, we use 24, 70, and160µm data originally aquired by Gordon et al. (2006) usingthe Multiband Imaging Photometer for Spitzer (MIPS; Riekeet al. 2004) on the Spitzer Space Telescope (Werner et al. 2004).The 24, 70, and 160µm data have point spread functions withFWHM of 6′′, 18′′, and 38′′, respectively. The data were pro-cessed using the MIPS Data Analysis Tools (Gordon et al. 2005)as well as additional data processing steps described by Bendoet al. (2012b). The data processing includes the removal of theeffect of cosmic ray hits and drift in the background signal.The background is initially subtracted from the individual dataframes by characterizing the variations in the background signalas a function of time using data that fall outside of the galaxy.This removes large-scale background/foreground structure out-side the galaxy, including the cosmic infrared background (CIB)
5 http://www.cita.utoronto.ca/˜mamd/IRIS/
Planck Collaboration: Andromeda as seen by Planck 5
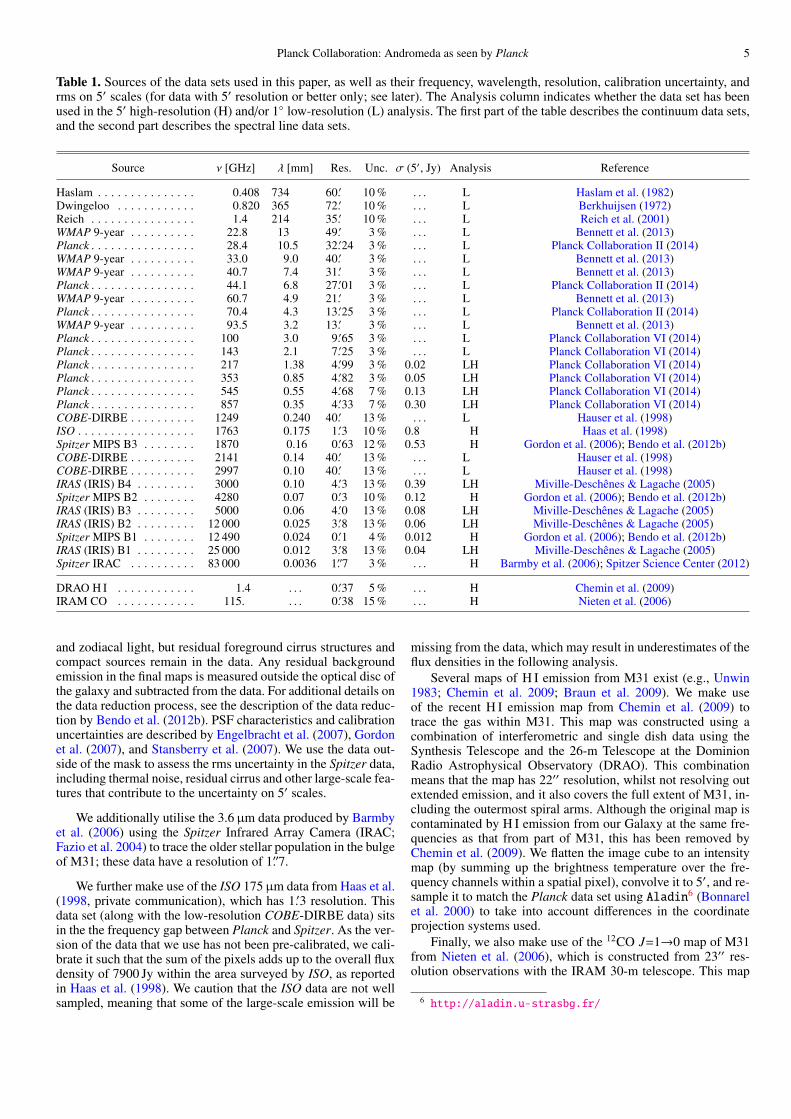
Table 1. Sources of the data sets used in this paper, as well as their frequency, wavelength, resolution, calibration uncertainty, andrms on 5′ scales (for data with 5′ resolution or better only; see later). The Analysis column indicates whether the data set has beenused in the 5′ high-resolution (H) and/or 1 low-resolution (L) analysis. The first part of the table describes the continuum data sets,and the second part describes the spectral line data sets.
Source ν [GHz] λ [mm] Res. Unc. σ (5′, Jy) Analysis Reference
Haslam . . . . . . . . . . . . . . . 0.408 734 60.′ 10 % . . . L Haslam et al. (1982)Dwingeloo . . . . . . . . . . . . 0.820 365 72.′ 10 % . . . L Berkhuijsen (1972)Reich . . . . . . . . . . . . . . . . 1.4 214 35.′ 10 % . . . L Reich et al. (2001)WMAP 9-year . . . . . . . . . . 22.8 13 49.′ 3 % . . . L Bennett et al. (2013)Planck . . . . . . . . . . . . . . . . 28.4 10.5 32.′24 3 % . . . L Planck Collaboration II (2014)WMAP 9-year . . . . . . . . . . 33.0 9.0 40.′ 3 % . . . L Bennett et al. (2013)WMAP 9-year . . . . . . . . . . 40.7 7.4 31.′ 3 % . . . L Bennett et al. (2013)Planck . . . . . . . . . . . . . . . . 44.1 6.8 27.′01 3 % . . . L Planck Collaboration II (2014)WMAP 9-year . . . . . . . . . . 60.7 4.9 21.′ 3 % . . . L Bennett et al. (2013)Planck . . . . . . . . . . . . . . . . 70.4 4.3 13.′25 3 % . . . L Planck Collaboration II (2014)WMAP 9-year . . . . . . . . . . 93.5 3.2 13.′ 3 % . . . L Bennett et al. (2013)Planck . . . . . . . . . . . . . . . . 100 3.0 9.′65 3 % . . . L Planck Collaboration VI (2014)Planck . . . . . . . . . . . . . . . . 143 2.1 7.′25 3 % . . . L Planck Collaboration VI (2014)Planck . . . . . . . . . . . . . . . . 217 1.38 4.′99 3 % 0.02 LH Planck Collaboration VI (2014)Planck . . . . . . . . . . . . . . . . 353 0.85 4.′82 3 % 0.05 LH Planck Collaboration VI (2014)Planck . . . . . . . . . . . . . . . . 545 0.55 4.′68 7 % 0.13 LH Planck Collaboration VI (2014)Planck . . . . . . . . . . . . . . . . 857 0.35 4.′33 7 % 0.30 LH Planck Collaboration VI (2014)COBE-DIRBE . . . . . . . . . . 1249 0.240 40.′ 13 % . . . L Hauser et al. (1998)ISO . . . . . . . . . . . . . . . . . . 1763 0.175 1.′3 10 % 0.8 H Haas et al. (1998)Spitzer MIPS B3 . . . . . . . . 1870 0.16 0.′63 12 % 0.53 H Gordon et al. (2006); Bendo et al. (2012b)COBE-DIRBE . . . . . . . . . . 2141 0.14 40.′ 13 % . . . L Hauser et al. (1998)COBE-DIRBE . . . . . . . . . . 2997 0.10 40.′ 13 % . . . L Hauser et al. (1998)IRAS (IRIS) B4 . . . . . . . . . 3000 0.10 4.′3 13 % 0.39 LH Miville-Deschenes & Lagache (2005)Spitzer MIPS B2 . . . . . . . . 4280 0.07 0.′3 10 % 0.12 H Gordon et al. (2006); Bendo et al. (2012b)IRAS (IRIS) B3 . . . . . . . . . 5000 0.06 4.′0 13 % 0.08 LH Miville-Deschenes & Lagache (2005)IRAS (IRIS) B2 . . . . . . . . . 12 000 0.025 3.′8 13 % 0.06 LH Miville-Deschenes & Lagache (2005)Spitzer MIPS B1 . . . . . . . . 12 490 0.024 0.′1 4 % 0.012 H Gordon et al. (2006); Bendo et al. (2012b)IRAS (IRIS) B1 . . . . . . . . . 25 000 0.012 3.′8 13 % 0.04 LH Miville-Deschenes & Lagache (2005)Spitzer IRAC . . . . . . . . . . 83 000 0.0036 1.′′7 3 % . . . H Barmby et al. (2006); Spitzer Science Center (2012)
DRAO H I . . . . . . . . . . . . 1.4 . . . 0.′37 5 % . . . H Chemin et al. (2009)IRAM CO . . . . . . . . . . . . 115. . . . 0.′38 15 % . . . H Nieten et al. (2006)
and zodiacal light, but residual foreground cirrus structures andcompact sources remain in the data. Any residual backgroundemission in the final maps is measured outside the optical disc ofthe galaxy and subtracted from the data. For additional details onthe data reduction process, see the description of the data reduc-tion by Bendo et al. (2012b). PSF characteristics and calibrationuncertainties are described by Engelbracht et al. (2007), Gordonet al. (2007), and Stansberry et al. (2007). We use the data out-side of the mask to assess the rms uncertainty in the Spitzer data,including thermal noise, residual cirrus and other large-scale fea-tures that contribute to the uncertainty on 5′ scales.
We additionally utilise the 3.6µm data produced by Barmbyet al. (2006) using the Spitzer Infrared Array Camera (IRAC;Fazio et al. 2004) to trace the older stellar population in the bulgeof M31; these data have a resolution of 1.′′7.
We further make use of the ISO 175µm data from Haas et al.(1998, private communication), which has 1.′3 resolution. Thisdata set (along with the low-resolution COBE-DIRBE data) sitsin the the frequency gap between Planck and Spitzer. As the ver-sion of the data that we use has not been pre-calibrated, we cali-brate it such that the sum of the pixels adds up to the overall fluxdensity of 7900 Jy within the area surveyed by ISO, as reportedin Haas et al. (1998). We caution that the ISO data are not wellsampled, meaning that some of the large-scale emission will be
missing from the data, which may result in underestimates of theflux densities in the following analysis.
Several maps of H I emission from M31 exist (e.g., Unwin1983; Chemin et al. 2009; Braun et al. 2009). We make useof the recent H I emission map from Chemin et al. (2009) totrace the gas within M31. This map was constructed using acombination of interferometric and single dish data using theSynthesis Telescope and the 26-m Telescope at the DominionRadio Astrophysical Observatory (DRAO). This combinationmeans that the map has 22′′ resolution, whilst not resolving outextended emission, and it also covers the full extent of M31, in-cluding the outermost spiral arms. Although the original map iscontaminated by H I emission from our Galaxy at the same fre-quencies as that from part of M31, this has been removed byChemin et al. (2009). We flatten the image cube to an intensitymap (by summing up the brightness temperature over the fre-quency channels within a spatial pixel), convolve it to 5′, and re-sample it to match the Planck data set using Aladin6 (Bonnarelet al. 2000) to take into account differences in the coordinateprojection systems used.
Finally, we also make use of the 12CO J=1→0 map of M31from Nieten et al. (2006), which is constructed from 23′′ res-olution observations with the IRAM 30-m telescope. This map
6 http://aladin.u-strasbg.fr/
6 Planck Collaboration: Andromeda as seen by Planck
covers the 10 kpc ring structure, but does not include the outer-most spiral arm structures. We use this map to compare with thePlanck data in the bands that have been contaminated with COemission, particularly for the integrated spectrum in Sect. 7. Thedata (downloaded from NED) were reprojected using AIPS priorto being smoothed and repixelised.
3.2. The 1 data set
When looking at the integrated spectrum of M31, we make useof a number of large-area, low-resolution surveys. These arepublicly available in HEALPix format. We convolve the data setsto a resolution of 1 to match the resolution of the low-frequencydata sets and perform the analysis directly on the HEALPixmaps.
At low frequencies, we use the low-resolution radio maps ofthe sky at 408 MHz (Haslam et al. 1981; Haslam et al. 1982),820 MHz, (Berkhuijsen 1972) and 1.4 GHz (Reich 1982; Reich& Reich 1986; Reich et al. 2001). We assume that there is a 10 %uncertainty in these maps, which includes both the uncertainty inthe flux density calibration (between 5 and 10 % depending onthe survey) and also uncertainties arising from the morphologyof the surrounding structure interacting with the aperture pho-tometry technique we use. This choice of uncertainty has beenshown to be reasonable for Galactic anomalous microwave emis-sion (AME) clouds (Planck Collaboration Int. XV 2014). Forthe 408 MHz map, we also add 3.8 Jy to the uncertainty to takeinto account the baseline striations in the map, which are at thelevel of ±3 K (Haslam et al. 1982; Planck Collaboration Int. XV2014). All of the maps have been calibrated on angular scalesof around 5, and consequently the difference between the mainand full beams (the latter including sidelobes) needs to be takeninto account when measuring the flux densities of more com-pact sources. This is significant for the 1.4 GHz map, where thefactor for objects on 1 scales is approximately 1.55. As M31is on an intermediate scale, we adopt an intermediate correctionfactor of 1.3 ± 0.1, and also include the uncertainty in this cor-rection factor in the flux density uncertainty. We assume that thevalue and uncertainty on the ratio for the 408 MHz and 2.3 GHzmaps is small, and hence will be well within the existing cali-bration uncertainties, as per e.g., Planck Collaboration Int. XV(2014). We also make use of the integrated flux densities fromhigher-resolution surveys collated by Berkhuijsen et al. (2003)for comparison to those extracted from the maps.
At intermediate frequencies, in addition to Planck-LFI data,we use the deconvolved and symmetrized 1-smoothed WMAP9-year data at 22.8, 33.0, 40.7, 60.7, and 93.5 GHz (Bennett et al.2013)7. When fitting a model to these data, we apply colour cor-rections following the recipe in Bennett et al. (2013), and weconservatively assume a calibration uncertainty of 3 %.
At higher frequencies, we include the low-resolution COBE-DIRBE data at 240, 140, and 100µm (Hauser et al. 1998), inaddition to the IRAS data described above. We assume that thesedata have an uncertainty of 13 %. We also use the integrated fluxdensities from Herschel observations as published in Fritz et al.(2012).
4. Infrared morphology
The Planck maps of M31 are shown in Fig. 2. At 100 GHz andall higher Planck frequencies, the prominent 10 kpc dust ring ofAndromeda can clearly be seen – as expected based on previous
7 http://lambda.gsfc.nasa.gov/product/map/dr4/maps_band_smth_r9_i_9yr_get.cfm
infrared observations of M31 – as well as a number of otherextended features.
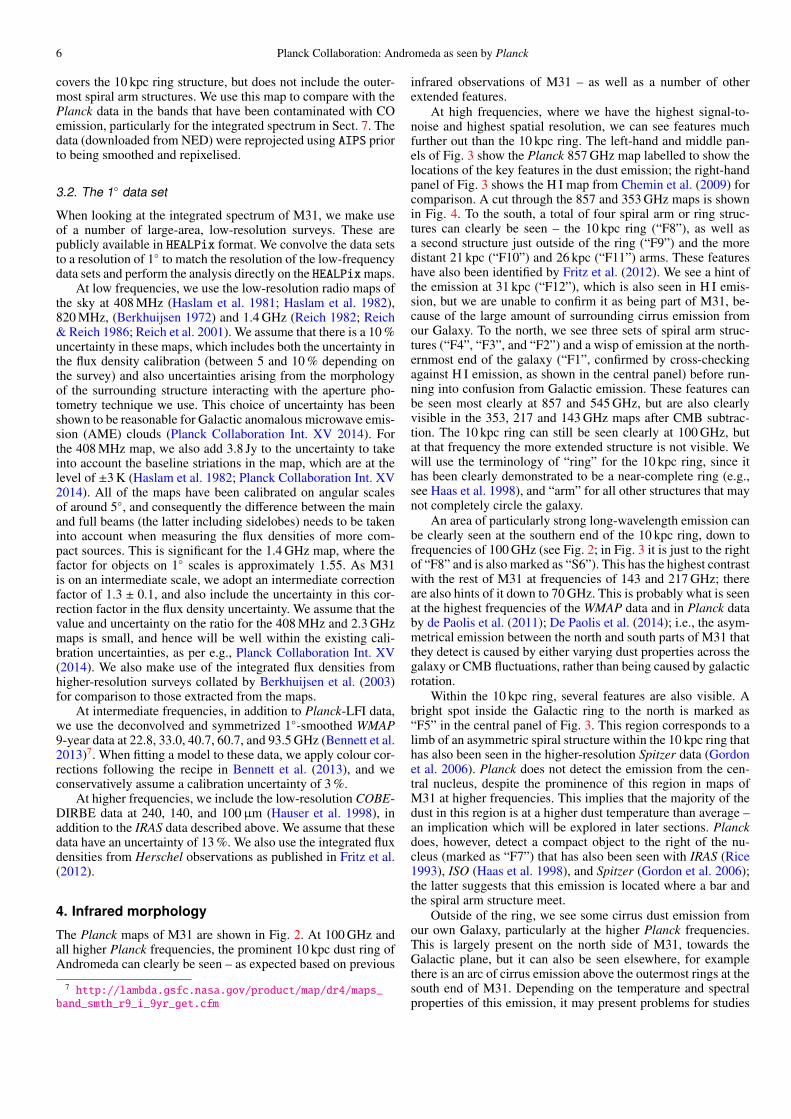
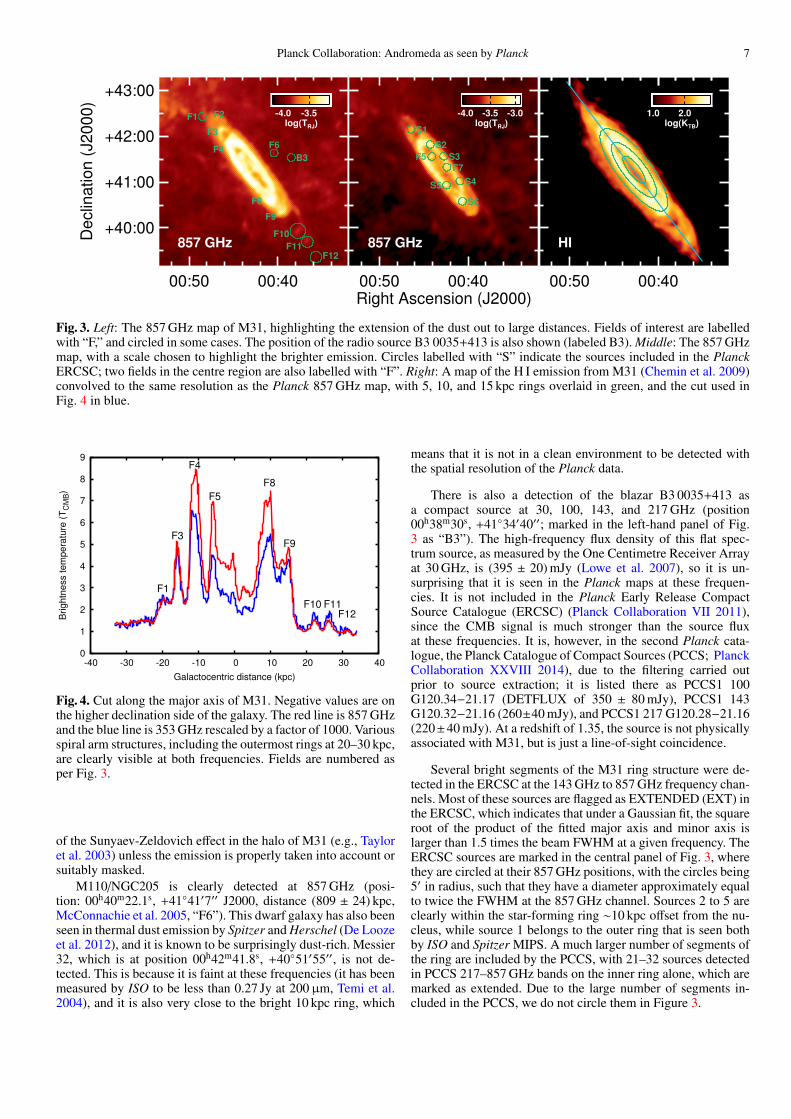
At high frequencies, where we have the highest signal-to-noise and highest spatial resolution, we can see features muchfurther out than the 10 kpc ring. The left-hand and middle pan-els of Fig. 3 show the Planck 857 GHz map labelled to show thelocations of the key features in the dust emission; the right-handpanel of Fig. 3 shows the H I map from Chemin et al. (2009) forcomparison. A cut through the 857 and 353 GHz maps is shownin Fig. 4. To the south, a total of four spiral arm or ring struc-tures can clearly be seen – the 10 kpc ring (“F8”), as well asa second structure just outside of the ring (“F9”) and the moredistant 21 kpc (“F10”) and 26 kpc (“F11”) arms. These featureshave also been identified by Fritz et al. (2012). We see a hint ofthe emission at 31 kpc (“F12”), which is also seen in H I emis-sion, but we are unable to confirm it as being part of M31, be-cause of the large amount of surrounding cirrus emission fromour Galaxy. To the north, we see three sets of spiral arm struc-tures (“F4”, “F3”, and “F2”) and a wisp of emission at the north-ernmost end of the galaxy (“F1”, confirmed by cross-checkingagainst H I emission, as shown in the central panel) before run-ning into confusion from Galactic emission. These features canbe seen most clearly at 857 and 545 GHz, but are also clearlyvisible in the 353, 217 and 143 GHz maps after CMB subtrac-tion. The 10 kpc ring can still be seen clearly at 100 GHz, butat that frequency the more extended structure is not visible. Wewill use the terminology of “ring” for the 10 kpc ring, since ithas been clearly demonstrated to be a near-complete ring (e.g.,see Haas et al. 1998), and “arm” for all other structures that maynot completely circle the galaxy.
An area of particularly strong long-wavelength emission canbe clearly seen at the southern end of the 10 kpc ring, down tofrequencies of 100 GHz (see Fig. 2; in Fig. 3 it is just to the rightof “F8” and is also marked as “S6”). This has the highest contrastwith the rest of M31 at frequencies of 143 and 217 GHz; thereare also hints of it down to 70 GHz. This is probably what is seenat the highest frequencies of the WMAP data and in Planck databy de Paolis et al. (2011); De Paolis et al. (2014); i.e., the asym-metrical emission between the north and south parts of M31 thatthey detect is caused by either varying dust properties across thegalaxy or CMB fluctuations, rather than being caused by galacticrotation.
Within the 10 kpc ring, several features are also visible. Abright spot inside the Galactic ring to the north is marked as“F5” in the central panel of Fig. 3. This region corresponds to alimb of an asymmetric spiral structure within the 10 kpc ring thathas also been seen in the higher-resolution Spitzer data (Gordonet al. 2006). Planck does not detect the emission from the cen-tral nucleus, despite the prominence of this region in maps ofM31 at higher frequencies. This implies that the majority of thedust in this region is at a higher dust temperature than average –an implication which will be explored in later sections. Planckdoes, however, detect a compact object to the right of the nu-cleus (marked as “F7”) that has also been seen with IRAS (Rice1993), ISO (Haas et al. 1998), and Spitzer (Gordon et al. 2006);the latter suggests that this emission is located where a bar andthe spiral arm structure meet.
Outside of the ring, we see some cirrus dust emission fromour own Galaxy, particularly at the higher Planck frequencies.This is largely present on the north side of M31, towards theGalactic plane, but it can also be seen elsewhere, for examplethere is an arc of cirrus emission above the outermost rings at thesouth end of M31. Depending on the temperature and spectralproperties of this emission, it may present problems for studies
Planck Collaboration: Andromeda as seen by Planck 7
00:50 00:40
+40:00
+41:00
+42:00
+43:00D
eclin
ation (
J2000)
857 GHz
F2
F3
F6
F1
F4
F8
F9
F10
F11F12
B3
-4.0 -3.5
log(TRJ)
00:50 00:40Right Ascension (J2000)
857 GHz
S1
S2
S3
S4S5
S6
F5
F7
-4.0 -3.5 -3.0
log(TRJ)
00:50 00:40
HI
1.0 2.0
log(KTB)
Fig. 3. Left: The 857 GHz map of M31, highlighting the extension of the dust out to large distances. Fields of interest are labelledwith “F,” and circled in some cases. The position of the radio source B3 0035+413 is also shown (labeled B3). Middle: The 857 GHzmap, with a scale chosen to highlight the brighter emission. Circles labelled with “S” indicate the sources included in the PlanckERCSC; two fields in the centre region are also labelled with “F”. Right: A map of the H I emission from M31 (Chemin et al. 2009)convolved to the same resolution as the Planck 857 GHz map, with 5, 10, and 15 kpc rings overlaid in green, and the cut used inFig. 4 in blue.
0
1
2
3
4
5
6
7
8
9
-40 -30 -20 -10 0 10 20 30 40
Brig
htn
ess t
em
pe
ratu
re (
TC
MB)
Galactocentric distance (kpc)
F1
F3
F4
F5
F8
F9
F10 F11F12
Fig. 4. Cut along the major axis of M31. Negative values are onthe higher declination side of the galaxy. The red line is 857 GHzand the blue line is 353 GHz rescaled by a factor of 1000. Variousspiral arm structures, including the outermost rings at 20–30 kpc,are clearly visible at both frequencies. Fields are numbered asper Fig. 3.
of the Sunyaev-Zeldovich effect in the halo of M31 (e.g., Tayloret al. 2003) unless the emission is properly taken into account orsuitably masked.
M110/NGC205 is clearly detected at 857 GHz (posi-tion: 00h40m22.1s, +4141′7′′ J2000, distance (809 ± 24) kpc,McConnachie et al. 2005, “F6”). This dwarf galaxy has also beenseen in thermal dust emission by Spitzer and Herschel (De Loozeet al. 2012), and it is known to be surprisingly dust-rich. Messier32, which is at position 00h42m41.8s, +4051′55′′, is not de-tected. This is because it is faint at these frequencies (it has beenmeasured by ISO to be less than 0.27 Jy at 200µm, Temi et al.2004), and it is also very close to the bright 10 kpc ring, which
means that it is not in a clean environment to be detected withthe spatial resolution of the Planck data.
There is also a detection of the blazar B3 0035+413 asa compact source at 30, 100, 143, and 217 GHz (position00h38m30s, +4134′40′′; marked in the left-hand panel of Fig.3 as “B3”). The high-frequency flux density of this flat spec-trum source, as measured by the One Centimetre Receiver Arrayat 30 GHz, is (395 ± 20) mJy (Lowe et al. 2007), so it is un-surprising that it is seen in the Planck maps at these frequen-cies. It is not included in the Planck Early Release CompactSource Catalogue (ERCSC) (Planck Collaboration VII 2011),since the CMB signal is much stronger than the source fluxat these frequencies. It is, however, in the second Planck cata-logue, the Planck Catalogue of Compact Sources (PCCS; PlanckCollaboration XXVIII 2014), due to the filtering carried outprior to source extraction; it is listed there as PCCS1 100G120.34−21.17 (DETFLUX of 350 ± 80 mJy), PCCS1 143G120.32−21.16 (260±40 mJy), and PCCS1 217 G120.28−21.16(220±40 mJy). At a redshift of 1.35, the source is not physicallyassociated with M31, but is just a line-of-sight coincidence.
Several bright segments of the M31 ring structure were de-tected in the ERCSC at the 143 GHz to 857 GHz frequency chan-nels. Most of these sources are flagged as EXTENDED (EXT) inthe ERCSC, which indicates that under a Gaussian fit, the squareroot of the product of the fitted major axis and minor axis islarger than 1.5 times the beam FWHM at a given frequency. TheERCSC sources are marked in the central panel of Fig. 3, wherethey are circled at their 857 GHz positions, with the circles being5′ in radius, such that they have a diameter approximately equalto twice the FWHM at the 857 GHz channel. Sources 2 to 5 areclearly within the star-forming ring ∼10 kpc offset from the nu-cleus, while source 1 belongs to the outer ring that is seen bothby ISO and Spitzer MIPS. A much larger number of segments ofthe ring are included by the PCCS, with 21–32 sources detectedin PCCS 217–857 GHz bands on the inner ring alone, which aremarked as extended. Due to the large number of segments in-cluded in the PCCS, we do not circle them in Figure 3.
8 Planck Collaboration: Andromeda as seen by PlanckD
eclin
atio
n (
J2
00
0)
+40:00
+40:30
+41:00
+41:30
+42:00
+42:30
217 GHz
-5.5 -5.0
log(Jy arcsec-2)
353 GHz
-5.0 -4.5log(Jy arcsec-2)
545 GHz
-4.5 -4.0log(Jy arcsec-2)
857 GHz
-4.0 -3.5log(Jy arcsec-2)
1763 GHz
-3.5 -3.0
log(Jy arcsec-2)
00:50 00:40
+40:00
+40:30
+41:00
+41:30
+42:00
+42:30
1870 GHz
-3.5 -3.0
log(Jy arcsec-2)
00:50 00:40
3000 GHz
-4.0 -3.5 -3.0
log(Jy arcsec-2)
00:50 00:40Right Ascension (J2000)
4280 GHz
-5.0 -4.0log(Jy arcsec-2)
00:50 00:40
5000 GHz
-5.0 -4.5 -4.0log(Jy arcsec-2)
00:50 00:40
12 490 GHz
-5.5 -5.0 -4.5
log(Jy arcsec-2)
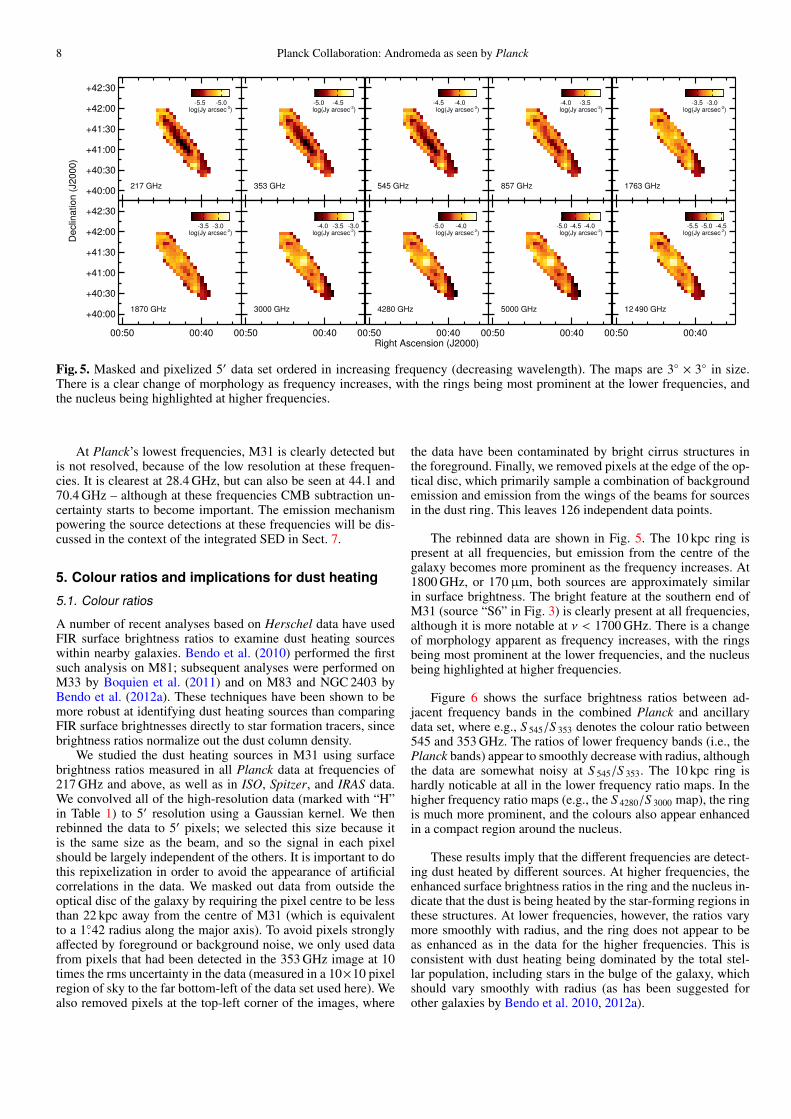
Fig. 5. Masked and pixelized 5′ data set ordered in increasing frequency (decreasing wavelength). The maps are 3 × 3 in size.There is a clear change of morphology as frequency increases, with the rings being most prominent at the lower frequencies, andthe nucleus being highlighted at higher frequencies.
At Planck’s lowest frequencies, M31 is clearly detected butis not resolved, because of the low resolution at these frequen-cies. It is clearest at 28.4 GHz, but can also be seen at 44.1 and70.4 GHz – although at these frequencies CMB subtraction un-certainty starts to become important. The emission mechanismpowering the source detections at these frequencies will be dis-cussed in the context of the integrated SED in Sect. 7.
5. Colour ratios and implications for dust heating
5.1. Colour ratios
A number of recent analyses based on Herschel data have usedFIR surface brightness ratios to examine dust heating sourceswithin nearby galaxies. Bendo et al. (2010) performed the firstsuch analysis on M81; subsequent analyses were performed onM33 by Boquien et al. (2011) and on M83 and NGC 2403 byBendo et al. (2012a). These techniques have been shown to bemore robust at identifying dust heating sources than comparingFIR surface brightnesses directly to star formation tracers, sincebrightness ratios normalize out the dust column density.
We studied the dust heating sources in M31 using surfacebrightness ratios measured in all Planck data at frequencies of217 GHz and above, as well as in ISO, Spitzer, and IRAS data.We convolved all of the high-resolution data (marked with “H”in Table 1) to 5′ resolution using a Gaussian kernel. We thenrebinned the data to 5′ pixels; we selected this size because itis the same size as the beam, and so the signal in each pixelshould be largely independent of the others. It is important to dothis repixelization in order to avoid the appearance of artificialcorrelations in the data. We masked out data from outside theoptical disc of the galaxy by requiring the pixel centre to be lessthan 22 kpc away from the centre of M31 (which is equivalentto a 1.42 radius along the major axis). To avoid pixels stronglyaffected by foreground or background noise, we only used datafrom pixels that had been detected in the 353 GHz image at 10times the rms uncertainty in the data (measured in a 10×10 pixelregion of sky to the far bottom-left of the data set used here). Wealso removed pixels at the top-left corner of the images, where
the data have been contaminated by bright cirrus structures inthe foreground. Finally, we removed pixels at the edge of the op-tical disc, which primarily sample a combination of backgroundemission and emission from the wings of the beams for sourcesin the dust ring. This leaves 126 independent data points.
The rebinned data are shown in Fig. 5. The 10 kpc ring ispresent at all frequencies, but emission from the centre of thegalaxy becomes more prominent as the frequency increases. At1800 GHz, or 170µm, both sources are approximately similarin surface brightness. The bright feature at the southern end ofM31 (source “S6” in Fig. 3) is clearly present at all frequencies,although it is more notable at ν < 1700 GHz. There is a changeof morphology apparent as frequency increases, with the ringsbeing most prominent at the lower frequencies, and the nucleusbeing highlighted at higher frequencies.
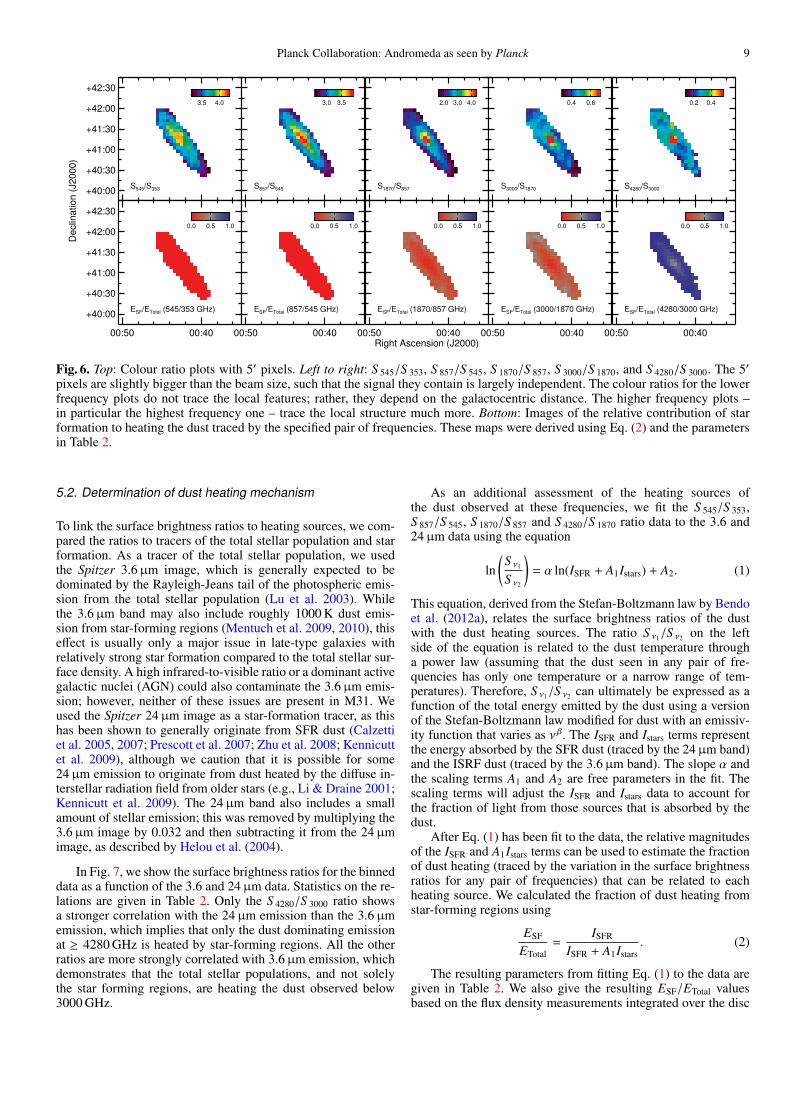
Figure 6 shows the surface brightness ratios between ad-jacent frequency bands in the combined Planck and ancillarydata set, where e.g., S 545/S 353 denotes the colour ratio between545 and 353 GHz. The ratios of lower frequency bands (i.e., thePlanck bands) appear to smoothly decrease with radius, althoughthe data are somewhat noisy at S 545/S 353. The 10 kpc ring ishardly noticable at all in the lower frequency ratio maps. In thehigher frequency ratio maps (e.g., the S 4280/S 3000 map), the ringis much more prominent, and the colours also appear enhancedin a compact region around the nucleus.
These results imply that the different frequencies are detect-ing dust heated by different sources. At higher frequencies, theenhanced surface brightness ratios in the ring and the nucleus in-dicate that the dust is being heated by the star-forming regions inthese structures. At lower frequencies, however, the ratios varymore smoothly with radius, and the ring does not appear to beas enhanced as in the data for the higher frequencies. This isconsistent with dust heating being dominated by the total stel-lar population, including stars in the bulge of the galaxy, whichshould vary smoothly with radius (as has been suggested forother galaxies by Bendo et al. 2010, 2012a).
Planck Collaboration: Andromeda as seen by Planck 9D
eclin
atio
n (
J2
00
0)
+40:00
+40:30
+41:00
+41:30
+42:00
+42:30
S545/S353
3.5 4.0
S857/S545
3.0 3.5
S1870/S857
2.0 3.0 4.0
S3000/S1870
0.4 0.6
S4280/S3000
0.2 0.4
00:50 00:40
+40:00
+40:30
+41:00
+41:30
+42:00
+42:30
ESF/ETotal (545/353 GHz)
0.0 0.5 1.0
00:50 00:40
ESF/ETotal (857/545 GHz)
0.0 0.5 1.0
00:50 00:40Right Ascension (J2000)
ESF/ETotal (1870/857 GHz)
0.0 0.5 1.0
00:50 00:40
ESF/ETotal (3000/1870 GHz)
0.0 0.5 1.0
00:50 00:40
ESF/ETotal (4280/3000 GHz)
0.0 0.5 1.0
Fig. 6. Top: Colour ratio plots with 5′ pixels. Left to right: S 545/S 353, S 857/S 545, S 1870/S 857, S 3000/S 1870, and S 4280/S 3000. The 5′pixels are slightly bigger than the beam size, such that the signal they contain is largely independent. The colour ratios for the lowerfrequency plots do not trace the local features; rather, they depend on the galactocentric distance. The higher frequency plots –in particular the highest frequency one – trace the local structure much more. Bottom: Images of the relative contribution of starformation to heating the dust traced by the specified pair of frequencies. These maps were derived using Eq. (2) and the parametersin Table 2.
5.2. Determination of dust heating mechanism
To link the surface brightness ratios to heating sources, we com-pared the ratios to tracers of the total stellar population and starformation. As a tracer of the total stellar population, we usedthe Spitzer 3.6µm image, which is generally expected to bedominated by the Rayleigh-Jeans tail of the photospheric emis-sion from the total stellar population (Lu et al. 2003). Whilethe 3.6µm band may also include roughly 1000 K dust emis-sion from star-forming regions (Mentuch et al. 2009, 2010), thiseffect is usually only a major issue in late-type galaxies withrelatively strong star formation compared to the total stellar sur-face density. A high infrared-to-visible ratio or a dominant activegalactic nuclei (AGN) could also contaminate the 3.6µm emis-sion; however, neither of these issues are present in M31. Weused the Spitzer 24µm image as a star-formation tracer, as thishas been shown to generally originate from SFR dust (Calzettiet al. 2005, 2007; Prescott et al. 2007; Zhu et al. 2008; Kennicuttet al. 2009), although we caution that it is possible for some24µm emission to originate from dust heated by the diffuse in-terstellar radiation field from older stars (e.g., Li & Draine 2001;Kennicutt et al. 2009). The 24µm band also includes a smallamount of stellar emission; this was removed by multiplying the3.6µm image by 0.032 and then subtracting it from the 24µmimage, as described by Helou et al. (2004).
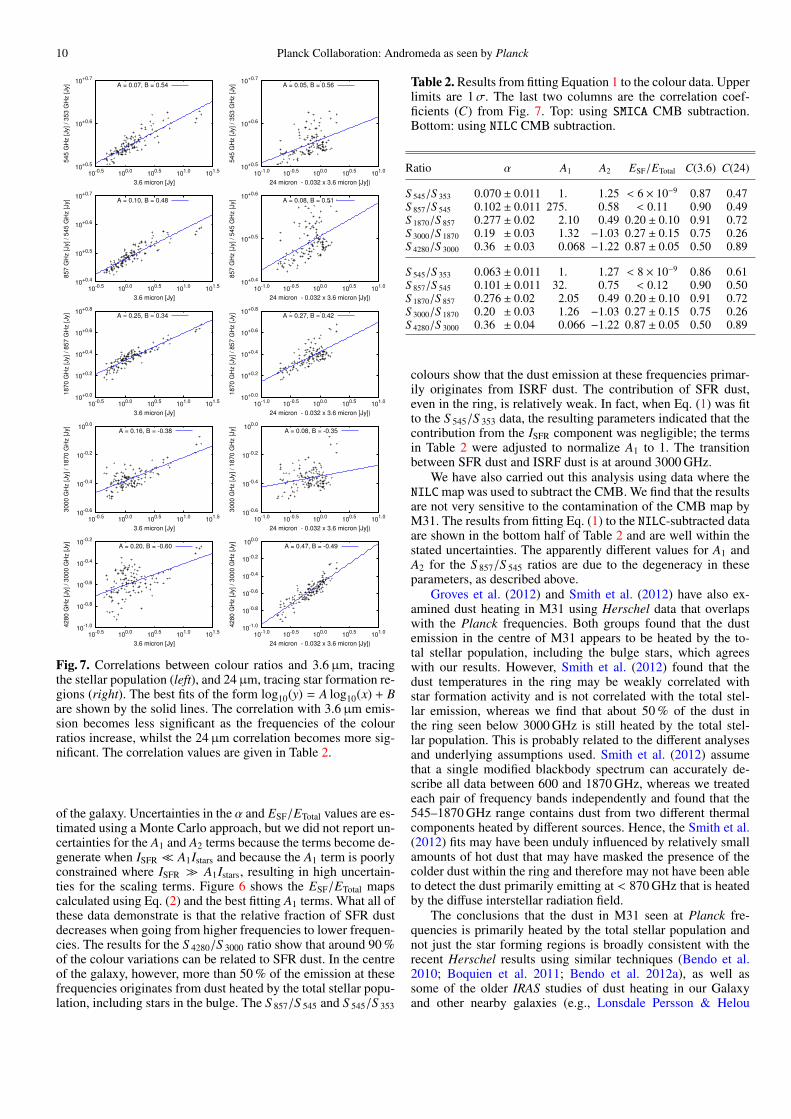
In Fig. 7, we show the surface brightness ratios for the binneddata as a function of the 3.6 and 24µm data. Statistics on the re-lations are given in Table 2. Only the S 4280/S 3000 ratio showsa stronger correlation with the 24µm emission than the 3.6µmemission, which implies that only the dust dominating emissionat ≥ 4280 GHz is heated by star-forming regions. All the otherratios are more strongly correlated with 3.6µm emission, whichdemonstrates that the total stellar populations, and not solelythe star forming regions, are heating the dust observed below3000 GHz.
As an additional assessment of the heating sources ofthe dust observed at these frequencies, we fit the S 545/S 353,S 857/S 545, S 1870/S 857 and S 4280/S 1870 ratio data to the 3.6 and24µm data using the equation
ln(
S ν1
S ν2
)= α ln(ISFR + A1Istars) + A2. (1)
This equation, derived from the Stefan-Boltzmann law by Bendoet al. (2012a), relates the surface brightness ratios of the dustwith the dust heating sources. The ratio S ν1/S ν2 on the leftside of the equation is related to the dust temperature througha power law (assuming that the dust seen in any pair of fre-quencies has only one temperature or a narrow range of tem-peratures). Therefore, S ν1/S ν2 can ultimately be expressed as afunction of the total energy emitted by the dust using a versionof the Stefan-Boltzmann law modified for dust with an emissiv-ity function that varies as ν β. The ISFR and Istars terms representthe energy absorbed by the SFR dust (traced by the 24µm band)and the ISRF dust (traced by the 3.6µm band). The slope α andthe scaling terms A1 and A2 are free parameters in the fit. Thescaling terms will adjust the ISFR and Istars data to account forthe fraction of light from those sources that is absorbed by thedust.
After Eq. (1) has been fit to the data, the relative magnitudesof the ISFR and A1Istars terms can be used to estimate the fractionof dust heating (traced by the variation in the surface brightnessratios for any pair of frequencies) that can be related to eachheating source. We calculated the fraction of dust heating fromstar-forming regions using
ESF
ETotal=
ISFR
ISFR + A1Istars. (2)
The resulting parameters from fitting Eq. (1) to the data aregiven in Table 2. We also give the resulting ESF/ETotal valuesbased on the flux density measurements integrated over the disc
10 Planck Collaboration: Andromeda as seen by Planck
10+0.5
10+0.6
10+0.7
10-0.5
100.0
100.5
101.0
101.5
545 G
Hz [Jy] / 353 G
Hz [Jy]
3.6 micron [Jy]
A = 0.07, B = 0.54
10+0.5
10+0.6
10+0.7
10-1.0
10-0.5
100.0
100.5
101.0
545 G
Hz [Jy] / 353 G
Hz [Jy]
24 micron - 0.032 x 3.6 micron [Jy])
A = 0.05, B = 0.56
10+0.4
10+0.5
10+0.6
10+0.7
10-0.5
100.0
100.5
101.0
101.5
857 G
Hz [Jy] / 545 G
Hz [Jy]
3.6 micron [Jy]
A = 0.10, B = 0.48
10+0.4
10+0.5
10+0.6
10-1.0
10-0.5
100.0
100.5
101.0
857 G
Hz [Jy] / 545 G
Hz [Jy]
24 micron - 0.032 x 3.6 micron [Jy])
A = 0.08, B = 0.51
10+0.0
10+0.2
10+0.4
10+0.6
10+0.8
10-0.5
100.0
100.5
101.0
101.5
1870 G
Hz [Jy] / 857 G
Hz [Jy]
3.6 micron [Jy]
A = 0.25, B = 0.34
10+0.0
10+0.2
10+0.4
10+0.6
10+0.8
10-1.0
10-0.5
100.0
100.5
101.0
1870 G
Hz [Jy] / 857 G
Hz [Jy]
24 micron - 0.032 x 3.6 micron [Jy])
A = 0.27, B = 0.42
10-0.6
10-0.4
10-0.2
100.0
10-0.5
100.0
100.5
101.0
101.5
3000 G
Hz [Jy] / 1870 G
Hz [Jy]
3.6 micron [Jy]
A = 0.16, B = -0.38
10-0.6
10-0.4
10-0.2
100.0
10-1.0
10-0.5
100.0
100.5
101.0
3000 G
Hz [Jy] / 1870 G
Hz [Jy]
24 micron - 0.032 x 3.6 micron [Jy])
A = 0.08, B = -0.35
10-1.0
10-0.8
10-0.6
10-0.4
10-0.2
10-0.5
100.0
100.5
101.0
101.5
4280 G
Hz [Jy] / 3000 G
Hz [Jy]
3.6 micron [Jy]
A = 0.20, B = -0.60
10-1.0
10-0.8
10-0.6
10-0.4
10-0.2
100.0
10-1.0
10-0.5
100.0
100.5
101.0
4280 G
Hz [Jy] / 3000 G
Hz [Jy]
24 micron - 0.032 x 3.6 micron [Jy])
A = 0.47, B = -0.49
Fig. 7. Correlations between colour ratios and 3.6µm, tracingthe stellar population (left), and 24µm, tracing star formation re-gions (right). The best fits of the form log10(y) = A log10(x) + Bare shown by the solid lines. The correlation with 3.6µm emis-sion becomes less significant as the frequencies of the colourratios increase, whilst the 24µm correlation becomes more sig-nificant. The correlation values are given in Table 2.
of the galaxy. Uncertainties in the α and ESF/ETotal values are es-timated using a Monte Carlo approach, but we did not report un-certainties for the A1 and A2 terms because the terms become de-generate when ISFR A1Istars and because the A1 term is poorlyconstrained where ISFR A1Istars, resulting in high uncertain-ties for the scaling terms. Figure 6 shows the ESF/ETotal mapscalculated using Eq. (2) and the best fitting A1 terms. What all ofthese data demonstrate is that the relative fraction of SFR dustdecreases when going from higher frequencies to lower frequen-cies. The results for the S 4280/S 3000 ratio show that around 90 %of the colour variations can be related to SFR dust. In the centreof the galaxy, however, more than 50 % of the emission at thesefrequencies originates from dust heated by the total stellar popu-lation, including stars in the bulge. The S 857/S 545 and S 545/S 353
Table 2. Results from fitting Equation 1 to the colour data. Upperlimits are 1σ. The last two columns are the correlation coef-ficients (C) from Fig. 7. Top: using SMICA CMB subtraction.Bottom: using NILC CMB subtraction.
Ratio α A1 A2 ESF/ETotal C(3.6) C(24)
S 545/S 353 0.070 ± 0.011 1. 1.25 < 6 × 10⁻⁹ 0.87 0.47S 857/S 545 0.102 ± 0.011 275. 0.58 < 0.11 0.90 0.49S 1870/S 857 0.277 ± 0.02 2.10 0.49 0.20 ± 0.10 0.91 0.72S 3000/S 1870 0.19 ± 0.03 1.32 −1.03 0.27 ± 0.15 0.75 0.26S 4280/S 3000 0.36 ± 0.03 0.068 −1.22 0.87 ± 0.05 0.50 0.89
S 545/S 353 0.063 ± 0.011 1. 1.27 < 8 × 10⁻⁹ 0.86 0.61S 857/S 545 0.101 ± 0.011 32. 0.75 < 0.12 0.90 0.50S 1870/S 857 0.276 ± 0.02 2.05 0.49 0.20 ± 0.10 0.91 0.72S 3000/S 1870 0.20 ± 0.03 1.26 −1.03 0.27 ± 0.15 0.75 0.26S 4280/S 3000 0.36 ± 0.04 0.066 −1.22 0.87 ± 0.05 0.50 0.89
colours show that the dust emission at these frequencies primar-ily originates from ISRF dust. The contribution of SFR dust,even in the ring, is relatively weak. In fact, when Eq. (1) was fitto the S 545/S 353 data, the resulting parameters indicated that thecontribution from the ISFR component was negligible; the termsin Table 2 were adjusted to normalize A1 to 1. The transitionbetween SFR dust and ISRF dust is at around 3000 GHz.
We have also carried out this analysis using data where theNILCmap was used to subtract the CMB. We find that the resultsare not very sensitive to the contamination of the CMB map byM31. The results from fitting Eq. (1) to the NILC-subtracted dataare shown in the bottom half of Table 2 and are well within thestated uncertainties. The apparently different values for A1 andA2 for the S 857/S 545 ratios are due to the degeneracy in theseparameters, as described above.
Groves et al. (2012) and Smith et al. (2012) have also ex-amined dust heating in M31 using Herschel data that overlapswith the Planck frequencies. Both groups found that the dustemission in the centre of M31 appears to be heated by the to-tal stellar population, including the bulge stars, which agreeswith our results. However, Smith et al. (2012) found that thedust temperatures in the ring may be weakly correlated withstar formation activity and is not correlated with the total stel-lar emission, whereas we find that about 50 % of the dust inthe ring seen below 3000 GHz is still heated by the total stel-lar population. This is probably related to the different analysesand underlying assumptions used. Smith et al. (2012) assumethat a single modified blackbody spectrum can accurately de-scribe all data between 600 and 1870 GHz, whereas we treatedeach pair of frequency bands independently and found that the545–1870 GHz range contains dust from two different thermalcomponents heated by different sources. Hence, the Smith et al.(2012) fits may have been unduly influenced by relatively smallamounts of hot dust that may have masked the presence of thecolder dust within the ring and therefore may not have been ableto detect the dust primarily emitting at < 870 GHz that is heatedby the diffuse interstellar radiation field.
The conclusions that the dust in M31 seen at Planck fre-quencies is primarily heated by the total stellar population andnot just the star forming regions is broadly consistent with therecent Herschel results using similar techniques (Bendo et al.2010; Boquien et al. 2011; Bendo et al. 2012a), as well assome of the older IRAS studies of dust heating in our Galaxyand other nearby galaxies (e.g., Lonsdale Persson & Helou
Planck Collaboration: Andromeda as seen by Planck 11
1987; Walterbos & Schwering 1987; Sauvage & Thuan 1992;Walterbos & Greenawalt 1996). Some dust emission and ra-diative transfer models for galaxies (e.g., Draine et al. 2007;Popescu et al. 2011) include two dust components: diffuse dustheated by a general interstellar radiation field; and dust heatedlocally by star forming regions. The results here are broadly con-sistent with the characterisation of the dust emission by thesemodels. However, we observe the transition between SFR dustand ISRF dust at 70–100µm, whereas in the model fits shownby Draine et al. (2007), the transition generally takes place atshorter wavelengths (below 70µm).
6. SEDs at 5′ resolution
We now move on to investigate and quantify the distributionof dust temperatures and spectral indices within M31 by fittingthermal dust spectra to the 5′ data set (as described in the previ-ous section) comprised of Planck, Spitzer, IRAS, and ISO data.We use the dust heating fraction that was quantified in the pre-vious section in order to focus only on the colder dust that isheated by the total stellar population.
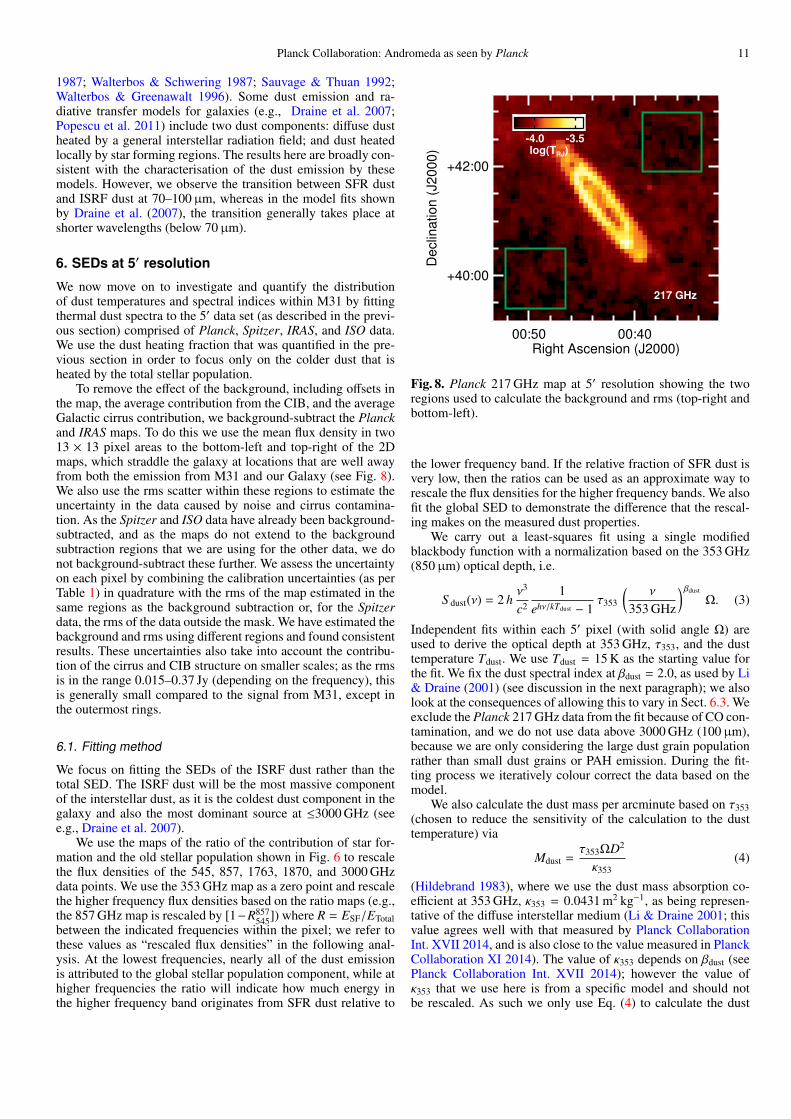
To remove the effect of the background, including offsets inthe map, the average contribution from the CIB, and the averageGalactic cirrus contribution, we background-subtract the Planckand IRAS maps. To do this we use the mean flux density in two13 × 13 pixel areas to the bottom-left and top-right of the 2Dmaps, which straddle the galaxy at locations that are well awayfrom both the emission from M31 and our Galaxy (see Fig. 8).We also use the rms scatter within these regions to estimate theuncertainty in the data caused by noise and cirrus contamina-tion. As the Spitzer and ISO data have already been background-subtracted, and as the maps do not extend to the backgroundsubtraction regions that we are using for the other data, we donot background-subtract these further. We assess the uncertaintyon each pixel by combining the calibration uncertainties (as perTable 1) in quadrature with the rms of the map estimated in thesame regions as the background subtraction or, for the Spitzerdata, the rms of the data outside the mask. We have estimated thebackground and rms using different regions and found consistentresults. These uncertainties also take into account the contribu-tion of the cirrus and CIB structure on smaller scales; as the rmsis in the range 0.015–0.37 Jy (depending on the frequency), thisis generally small compared to the signal from M31, except inthe outermost rings.
6.1. Fitting method
We focus on fitting the SEDs of the ISRF dust rather than thetotal SED. The ISRF dust will be the most massive componentof the interstellar dust, as it is the coldest dust component in thegalaxy and also the most dominant source at ≤3000 GHz (seee.g., Draine et al. 2007).
We use the maps of the ratio of the contribution of star for-mation and the old stellar population shown in Fig. 6 to rescalethe flux densities of the 545, 857, 1763, 1870, and 3000 GHzdata points. We use the 353 GHz map as a zero point and rescalethe higher frequency flux densities based on the ratio maps (e.g.,the 857 GHz map is rescaled by [1−R857
545]) where R = ESF/ETotalbetween the indicated frequencies within the pixel; we refer tothese values as “rescaled flux densities” in the following anal-ysis. At the lowest frequencies, nearly all of the dust emissionis attributed to the global stellar population component, while athigher frequencies the ratio will indicate how much energy inthe higher frequency band originates from SFR dust relative to
00:50 00:40Right Ascension (J2000)
+40:00
+42:00
De
clin
atio
n (
J2
00
0)
217 GHz
-4.0 -3.5log(TRJ)
Fig. 8. Planck 217 GHz map at 5′ resolution showing the tworegions used to calculate the background and rms (top-right andbottom-left).
the lower frequency band. If the relative fraction of SFR dust isvery low, then the ratios can be used as an approximate way torescale the flux densities for the higher frequency bands. We alsofit the global SED to demonstrate the difference that the rescal-ing makes on the measured dust properties.
We carry out a least-squares fit using a single modifiedblackbody function with a normalization based on the 353 GHz(850µm) optical depth, i.e.
S dust(ν) = 2 hν3
c2
1ehν/kTdust − 1
τ353
(ν
353 GHz
) βdust
Ω. (3)
Independent fits within each 5′ pixel (with solid angle Ω) areused to derive the optical depth at 353 GHz, τ353, and the dusttemperature Tdust. We use Tdust = 15 K as the starting value forthe fit. We fix the dust spectral index at βdust = 2.0, as used by Li& Draine (2001) (see discussion in the next paragraph); we alsolook at the consequences of allowing this to vary in Sect. 6.3. Weexclude the Planck 217 GHz data from the fit because of CO con-tamination, and we do not use data above 3000 GHz (100µm),because we are only considering the large dust grain populationrather than small dust grains or PAH emission. During the fit-ting process we iteratively colour correct the data based on themodel.
We also calculate the dust mass per arcminute based on τ353(chosen to reduce the sensitivity of the calculation to the dusttemperature) via
Mdust =τ353ΩD2
κ353(4)
(Hildebrand 1983), where we use the dust mass absorption co-efficient at 353 GHz, κ353 = 0.0431 m2 kg−1, as being represen-tative of the diffuse interstellar medium (Li & Draine 2001; thisvalue agrees well with that measured by Planck CollaborationInt. XVII 2014, and is also close to the value measured in PlanckCollaboration XI 2014). The value of κ353 depends on βdust (seePlanck Collaboration Int. XVII 2014); however the value ofκ353 that we use here is from a specific model and should notbe rescaled. As such we only use Eq. (4) to calculate the dust
12 Planck Collaboration: Andromeda as seen by Planck
10-1
100
101
102
100 1000 10000
Flu
x d
en
sity (
Jy)
Frequency (GHz)
(a)
10-1
100
101
102
100 1000 10000
Flu
x d
en
sity (
Jy)
Frequency (GHz)
(b)
10-1
100
101
102
103
100 1000 10000
Flu
x d
en
sity (
Jy)
Frequency (GHz)
(c)
10-1
100
101
102
100 1000 10000
Flu
x d
en
sity (
Jy)
Frequency (GHz)
(d)
10-2
10-1
100
101
100 1000 10000
Flu
x d
en
sity (
Jy)
Frequency (GHz)
(e)
10-2
10-1
100
101
100 1000 10000
Flu
x d
en
sity (
Jy)
Frequency (GHz)
(f)
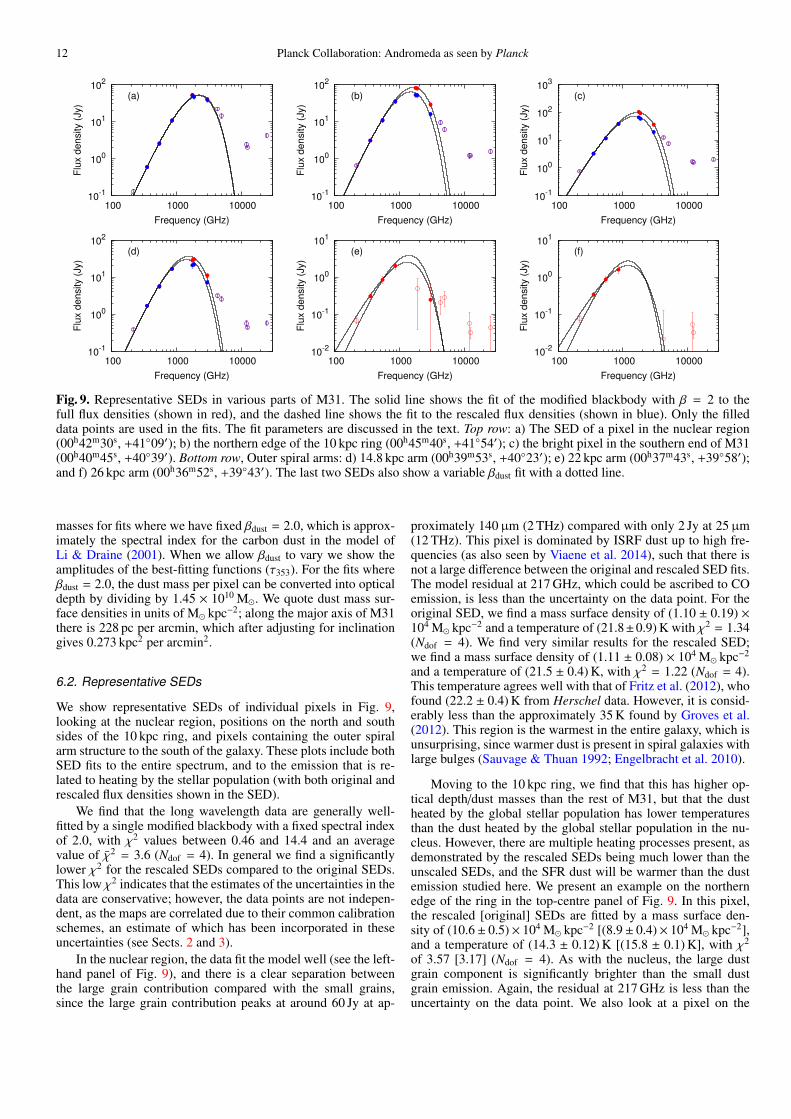
Fig. 9. Representative SEDs in various parts of M31. The solid line shows the fit of the modified blackbody with β = 2 to thefull flux densities (shown in red), and the dashed line shows the fit to the rescaled flux densities (shown in blue). Only the filleddata points are used in the fits. The fit parameters are discussed in the text. Top row: a) The SED of a pixel in the nuclear region(00h42m30s, +4109′); b) the northern edge of the 10 kpc ring (00h45m40s, +4154′); c) the bright pixel in the southern end of M31(00h40m45s, +4039′). Bottom row, Outer spiral arms: d) 14.8 kpc arm (00h39m53s, +4023′); e) 22 kpc arm (00h37m43s, +3958′);and f) 26 kpc arm (00h36m52s, +3943′). The last two SEDs also show a variable βdust fit with a dotted line.
masses for fits where we have fixed βdust = 2.0, which is approx-imately the spectral index for the carbon dust in the model ofLi & Draine (2001). When we allow βdust to vary we show theamplitudes of the best-fitting functions (τ353). For the fits whereβdust = 2.0, the dust mass per pixel can be converted into opticaldepth by dividing by 1.45 × 10¹⁰ M. We quote dust mass sur-face densities in units of M kpc−2; along the major axis of M31there is 228 pc per arcmin, which after adjusting for inclinationgives 0.273 kpc2 per arcmin2.
6.2. Representative SEDs
We show representative SEDs of individual pixels in Fig. 9,looking at the nuclear region, positions on the north and southsides of the 10 kpc ring, and pixels containing the outer spiralarm structure to the south of the galaxy. These plots include bothSED fits to the entire spectrum, and to the emission that is re-lated to heating by the stellar population (with both original andrescaled flux densities shown in the SED).
We find that the long wavelength data are generally well-fitted by a single modified blackbody with a fixed spectral indexof 2.0, with χ2 values between 0.46 and 14.4 and an averagevalue of χ2 = 3.6 (Ndof = 4). In general we find a significantlylower χ2 for the rescaled SEDs compared to the original SEDs.This low χ2 indicates that the estimates of the uncertainties in thedata are conservative; however, the data points are not indepen-dent, as the maps are correlated due to their common calibrationschemes, an estimate of which has been incorporated in theseuncertainties (see Sects. 2 and 3).
In the nuclear region, the data fit the model well (see the left-hand panel of Fig. 9), and there is a clear separation betweenthe large grain contribution compared with the small grains,since the large grain contribution peaks at around 60 Jy at ap-
proximately 140µm (2 THz) compared with only 2 Jy at 25µm(12 THz). This pixel is dominated by ISRF dust up to high fre-quencies (as also seen by Viaene et al. 2014), such that there isnot a large difference between the original and rescaled SED fits.The model residual at 217 GHz, which could be ascribed to COemission, is less than the uncertainty on the data point. For theoriginal SED, we find a mass surface density of (1.10 ± 0.19) ×104 M kpc−2 and a temperature of (21.8±0.9) K with χ2 = 1.34(Ndof = 4). We find very similar results for the rescaled SED;we find a mass surface density of (1.11 ± 0.08) × 104 M kpc−2
and a temperature of (21.5 ± 0.4) K, with χ2 = 1.22 (Ndof = 4).This temperature agrees well with that of Fritz et al. (2012), whofound (22.2 ± 0.4) K from Herschel data. However, it is consid-erably less than the approximately 35 K found by Groves et al.(2012). This region is the warmest in the entire galaxy, which isunsurprising, since warmer dust is present in spiral galaxies withlarge bulges (Sauvage & Thuan 1992; Engelbracht et al. 2010).
Moving to the 10 kpc ring, we find that this has higher op-tical depth/dust masses than the rest of M31, but that the dustheated by the global stellar population has lower temperaturesthan the dust heated by the global stellar population in the nu-cleus. However, there are multiple heating processes present, asdemonstrated by the rescaled SEDs being much lower than theunscaled SEDs, and the SFR dust will be warmer than the dustemission studied here. We present an example on the northernedge of the ring in the top-centre panel of Fig. 9. In this pixel,the rescaled [original] SEDs are fitted by a mass surface den-sity of (10.6± 0.5)× 104 M kpc−2 [(8.9± 0.4)× 104 M kpc−2],and a temperature of (14.3 ± 0.12) K [(15.8 ± 0.1) K], with χ2
of 3.57 [3.17] (Ndof = 4). As with the nucleus, the large dustgrain component is significantly brighter than the small dustgrain emission. Again, the residual at 217 GHz is less than theuncertainty on the data point. We also look at a pixel on the
Planck Collaboration: Andromeda as seen by Planck 13
00:50 00:40Right Ascension (J2000)
+40:00
+40:30
+41:00
+41:30
+42:00
+42:30
Declin
atio
n (
J2
00
0)
Surface Density
4.0 4.5 5.0log(M
O •
kpc-2)
00:50 00:40Right Ascension (J2000)
Temperature
15 20K
00:50 00:40Right Ascension (J2000)
χ2
0.0 2.0 4.0
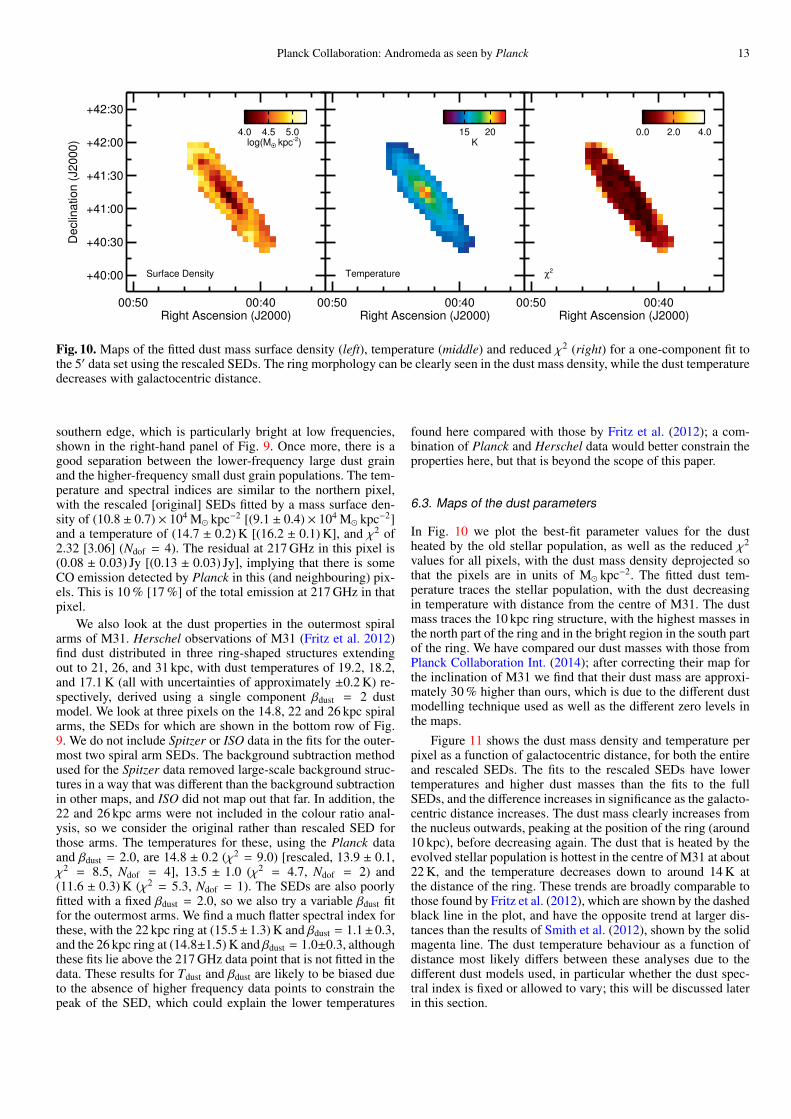
Fig. 10. Maps of the fitted dust mass surface density (left), temperature (middle) and reduced χ2 (right) for a one-component fit tothe 5′ data set using the rescaled SEDs. The ring morphology can be clearly seen in the dust mass density, while the dust temperaturedecreases with galactocentric distance.
southern edge, which is particularly bright at low frequencies,shown in the right-hand panel of Fig. 9. Once more, there is agood separation between the lower-frequency large dust grainand the higher-frequency small dust grain populations. The tem-perature and spectral indices are similar to the northern pixel,with the rescaled [original] SEDs fitted by a mass surface den-sity of (10.8 ± 0.7) × 104 M kpc−2 [(9.1 ± 0.4) × 104 M kpc−2]and a temperature of (14.7 ± 0.2) K [(16.2 ± 0.1) K], and χ2 of2.32 [3.06] (Ndof = 4). The residual at 217 GHz in this pixel is(0.08 ± 0.03) Jy [(0.13 ± 0.03) Jy], implying that there is someCO emission detected by Planck in this (and neighbouring) pix-els. This is 10 % [17 %] of the total emission at 217 GHz in thatpixel.
We also look at the dust properties in the outermost spiralarms of M31. Herschel observations of M31 (Fritz et al. 2012)find dust distributed in three ring-shaped structures extendingout to 21, 26, and 31 kpc, with dust temperatures of 19.2, 18.2,and 17.1 K (all with uncertainties of approximately ±0.2 K) re-spectively, derived using a single component βdust = 2 dustmodel. We look at three pixels on the 14.8, 22 and 26 kpc spiralarms, the SEDs for which are shown in the bottom row of Fig.9. We do not include Spitzer or ISO data in the fits for the outer-most two spiral arm SEDs. The background subtraction methodused for the Spitzer data removed large-scale background struc-tures in a way that was different than the background subtractionin other maps, and ISO did not map out that far. In addition, the22 and 26 kpc arms were not included in the colour ratio anal-ysis, so we consider the original rather than rescaled SED forthose arms. The temperatures for these, using the Planck dataand βdust = 2.0, are 14.8 ± 0.2 (χ2 = 9.0) [rescaled, 13.9 ± 0.1,χ2 = 8.5, Ndof = 4], 13.5 ± 1.0 (χ2 = 4.7, Ndof = 2) and(11.6 ± 0.3) K (χ2 = 5.3, Ndof = 1). The SEDs are also poorlyfitted with a fixed βdust = 2.0, so we also try a variable βdust fitfor the outermost arms. We find a much flatter spectral index forthese, with the 22 kpc ring at (15.5±1.3) K and βdust = 1.1±0.3,and the 26 kpc ring at (14.8±1.5) K and βdust = 1.0±0.3, althoughthese fits lie above the 217 GHz data point that is not fitted in thedata. These results for Tdust and βdust are likely to be biased dueto the absence of higher frequency data points to constrain thepeak of the SED, which could explain the lower temperatures
found here compared with those by Fritz et al. (2012); a com-bination of Planck and Herschel data would better constrain theproperties here, but that is beyond the scope of this paper.
6.3. Maps of the dust parameters
In Fig. 10 we plot the best-fit parameter values for the dustheated by the old stellar population, as well as the reduced χ2
values for all pixels, with the dust mass density deprojected sothat the pixels are in units of M kpc−2. The fitted dust tem-perature traces the stellar population, with the dust decreasingin temperature with distance from the centre of M31. The dustmass traces the 10 kpc ring structure, with the highest masses inthe north part of the ring and in the bright region in the south partof the ring. We have compared our dust masses with those fromPlanck Collaboration Int. (2014); after correcting their map forthe inclination of M31 we find that their dust mass are approxi-mately 30 % higher than ours, which is due to the different dustmodelling technique used as well as the different zero levels inthe maps.
Figure 11 shows the dust mass density and temperature perpixel as a function of galactocentric distance, for both the entireand rescaled SEDs. The fits to the rescaled SEDs have lowertemperatures and higher dust masses than the fits to the fullSEDs, and the difference increases in significance as the galacto-centric distance increases. The dust mass clearly increases fromthe nucleus outwards, peaking at the position of the ring (around10 kpc), before decreasing again. The dust that is heated by theevolved stellar population is hottest in the centre of M31 at about22 K, and the temperature decreases down to around 14 K atthe distance of the ring. These trends are broadly comparable tothose found by Fritz et al. (2012), which are shown by the dashedblack line in the plot, and have the opposite trend at larger dis-tances than the results of Smith et al. (2012), shown by the solidmagenta line. The dust temperature behaviour as a function ofdistance most likely differs between these analyses due to thedifferent dust models used, in particular whether the dust spec-tral index is fixed or allowed to vary; this will be discussed laterin this section.

14 Planck Collaboration: Andromeda as seen by Planck
1
10
0 2 4 6 8 10 12 14
Du
st
ma
ss d
en
sity (
10
4 M
O• k
pc
-2)
Distance (kpc)
12
14
16
18
20
22
24
26
28
0 2 4 6 8 10 12 14
Du
st
tem
pe
ratu
re (
K)
Distance (kpc)
Fig. 11. The fitted dust mass surface density (left) and dust temperature (right) as a function of galactocentric distance. Red pointsare from fitting the entire SED, while blue points are fitting to the fraction of the flux density that can be attributed to the dust heatedby the global stellar population. Temperatures from Fritz et al. (2012) and Smith et al. (2012) are shown by the dashed black lineand the solid magenta line, respectively; these differ from the analysis here due to the different dust models used and whether thedust spectral index has been allowed to vary or not. There is a systematic shift towards lower dust temperatures and higher dustmasses with the rescaled SEDs.
The temperatures from the rescaled and unscaled SEDs agreewell with each other in the centre of the galaxy, but diverge fromeach other beyond about 5 kpc. We expect the SFR to contributemore to dust heating at larger distances from the centre as thebulge stars peak in the centre of the galaxy and the SFR peaks inthe ring. At the centre of the galaxy, the old stellar population inthe bulge dominates the ISRF, and the dust seen at wavelengthsas short as 70 µm is heated by the ISRF, which means that therescaled vs. unscaled SEDs should be essentially the same. Therescaled and unscaled SEDs may converge outside of the 10 kpcring, but we lack the sensitivity to accurately measure the SEDat larger radii and therefore cannot see this reconvergence.
We also combine the values from all pixels and fit a fixedβdust model to the overall SED from M31. We find that thishas an average temperature for the rescaled [original] SEDof (15.7±0.3) K [(16.3±0.3) K] and a combined dust mass of(8.2 ± 0.7) × 107 M [(7.8 ± 0.6) × 107 M]. The combined dustmass from the fits to the individual pixels is (4.3± 0.3)× 107 M[(3.8±0.3)×107 M], just under a factor of two lower. This is theopposite of the results of Galliano et al. (2011), who found 50 %higher dust masses when fitting data for the LMC at higher reso-lution compared to the integrated SED, and Aniano et al. (2012)who find up to 20 % higher dust masses from fitting the resolveddata for NGC 628 and NGC 6946. However it is in agreementwith Smith et al. (2012) who, like us, find a significantly higherdust mass from the integrated SED than the individual pixelSEDs in M31, and also Viaene et al. (2014) who find a dust mass7 % higher using an integrated SED. The difference between themasses is caused by different weightings resulting from the mor-phology and temperature distribution within M31. In the caseof the LMC and other dwarf galaxies, warm dust in star form-ing regions are embedded within a dust component of cool largegrains heated by a relatively weak diffuse interstellar radiationfield. When integrating over large areas, the resulting tempera-tures are warmer and dust surface densities are lower than whatwould be found within individual subregions. In M31 and othergalaxies with large bulges (e.g., M81; Bendo et al. 2010, 2012a),the temperature of large dust grains heated by the diffuse inter-stellar radiation field in the centres of the galaxies may be higher
than the temperature of the large dust grains heated locally bystar-forming regions in the outer disc. When integrating over anarea that includes both the centre of the galaxy and the star form-ing ring, the inferred dust temperatures may appear lower andthe dust surface densities may appear higher than what wouldbe found in individual subregions within the galaxies. The com-bined dust mass from the individual pixels will be more physi-cally accurate, and is in agreement with the overall dust mass forM31 found by Draine et al. (2014).
However, Smith et al. (2012) find about 2.8 × 10⁷ M withtheir higher resolution analysis, but this is likely to be relatedto the different approaches with SED fitting. Smith et al. effec-tively assumed that all emission above 100 µm originates fromdust heated by a single source, whereas we show that some ofthe emission above 1000 GHz originates from dust heated bystar formation. The Smith et al. (2012) dust temperatures willtherefore be higher, which will bias the resulting dust masseslower.
We have also fitted the data using a variable spectral index.The results of these fits for both the full and rescaled SEDs areshown in Fig. 12. The behaviour of the temperature and spectralindex are somewhat different in these two situations. When fit-ting the entire SED, the resulting temperatures are much flatterthan for the fixed βdust case, whilst the spectral index decreaseswith galactocentric distance. The same behaviour is still evidentwhen the rescaled SEDs are fitted; however, it is less significant.This helps explain some of the differences between our analy-sis and that using the Herschel data described in Smith et al.(2012), where the entire SED has been fitted without taking intoaccount the heating mechanism. The behaviour of flatter spectralindices further out from the galactic centre was noted by Smithet al. (2012), and has also been seen in our Galaxy (Paradis et al.2012b; Planck Collaboration XI 2014). The fitted spectral in-dices are steep, with a range of 1.8–2.5 for M31 both here and inSmith et al. (2012); in comparison, our Galaxy has much flatterspectral indices of 1.4–1.8 (Planck Collaboration XI 2014).
We plot the temperatures vs. βdust for both the entire SEDand the rescaled SED in Fig. 13. There is a systematic shift to-wards colder temperatures of about 9 % when fitting the rescaled
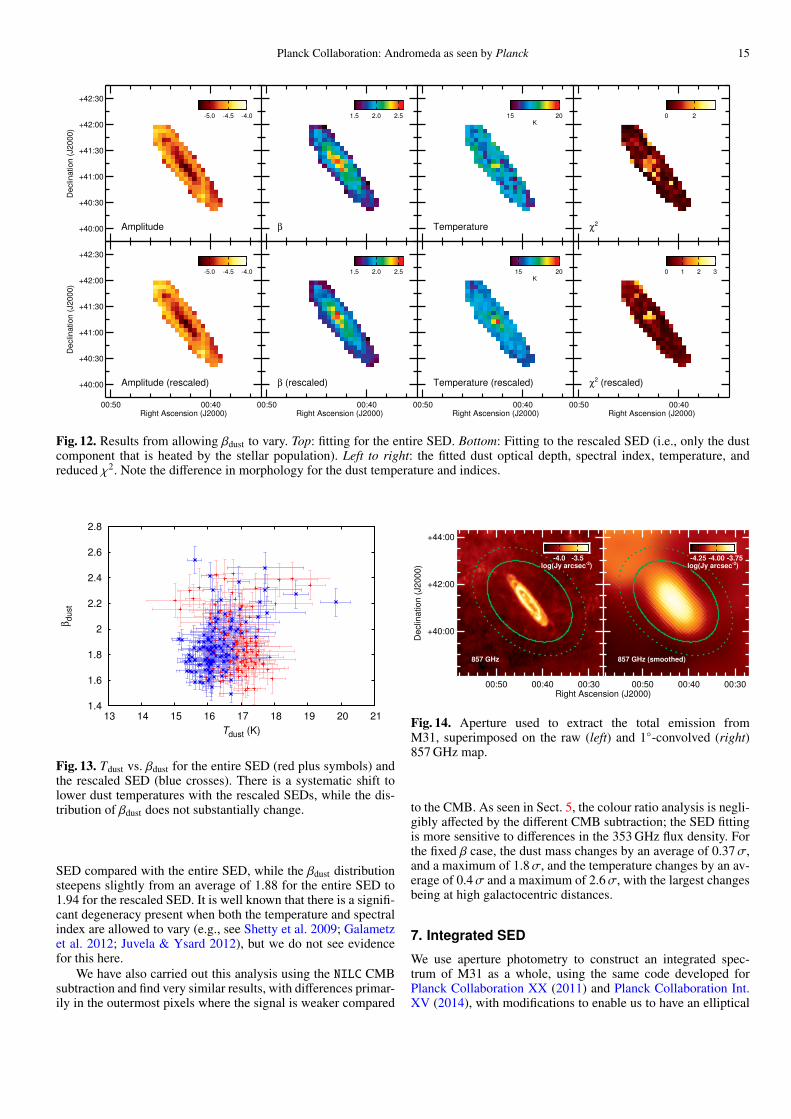
Planck Collaboration: Andromeda as seen by Planck 15
+40:00
+40:30
+41:00
+41:30
+42:00
+42:30
Declin
ation
(J2000)
Amplitude
-5.0 -4.5 -4.0
β
1.5 2.0 2.5
Temperature
15 20K
χ2
0 2
00:50 00:40Right Ascension (J2000)
+40:00
+40:30
+41:00
+41:30
+42:00
+42:30
De
clin
atio
n (
J2000)
Amplitude (rescaled)
-5.0 -4.5 -4.0
00:50 00:40Right Ascension (J2000)
β (rescaled)
1.5 2.0 2.5
00:50 00:40Right Ascension (J2000)
Temperature (rescaled)
15 20K
00:50 00:40Right Ascension (J2000)
χ2 (rescaled)
0 1 2 3
Fig. 12. Results from allowing βdust to vary. Top: fitting for the entire SED. Bottom: Fitting to the rescaled SED (i.e., only the dustcomponent that is heated by the stellar population). Left to right: the fitted dust optical depth, spectral index, temperature, andreduced χ2. Note the difference in morphology for the dust temperature and indices.
1.4
1.6
1.8
2
2.2
2.4
2.6
2.8
13 14 15 16 17 18 19 20 21
βdust
Tdust (K)
Fig. 13. Tdust vs. βdust for the entire SED (red plus symbols) andthe rescaled SED (blue crosses). There is a systematic shift tolower dust temperatures with the rescaled SEDs, while the dis-tribution of βdust does not substantially change.
SED compared with the entire SED, while the βdust distributionsteepens slightly from an average of 1.88 for the entire SED to1.94 for the rescaled SED. It is well known that there is a signifi-cant degeneracy present when both the temperature and spectralindex are allowed to vary (e.g., see Shetty et al. 2009; Galametzet al. 2012; Juvela & Ysard 2012), but we do not see evidencefor this here.
We have also carried out this analysis using the NILC CMBsubtraction and find very similar results, with differences primar-ily in the outermost pixels where the signal is weaker compared
Right Ascension (J2000)00:50 00:40 00:30
+40:00
+42:00
+44:00
Declin
ation (
J2000)
857 GHz
-4.0 -3.5log(Jy arcsec-2)
00:50 00:40 00:30
857 GHz (smoothed)
-4.25 -4.00 -3.75log(Jy arcsec-2)
Fig. 14. Aperture used to extract the total emission fromM31, superimposed on the raw (left) and 1-convolved (right)857 GHz map.
to the CMB. As seen in Sect. 5, the colour ratio analysis is negli-gibly affected by the different CMB subtraction; the SED fittingis more sensitive to differences in the 353 GHz flux density. Forthe fixed β case, the dust mass changes by an average of 0.37σ,and a maximum of 1.8σ, and the temperature changes by an av-erage of 0.4σ and a maximum of 2.6σ, with the largest changesbeing at high galactocentric distances.
7. Integrated SED
We use aperture photometry to construct an integrated spec-trum of M31 as a whole, using the same code developed forPlanck Collaboration XX (2011) and Planck Collaboration Int.XV (2014), with modifications to enable us to have an elliptical
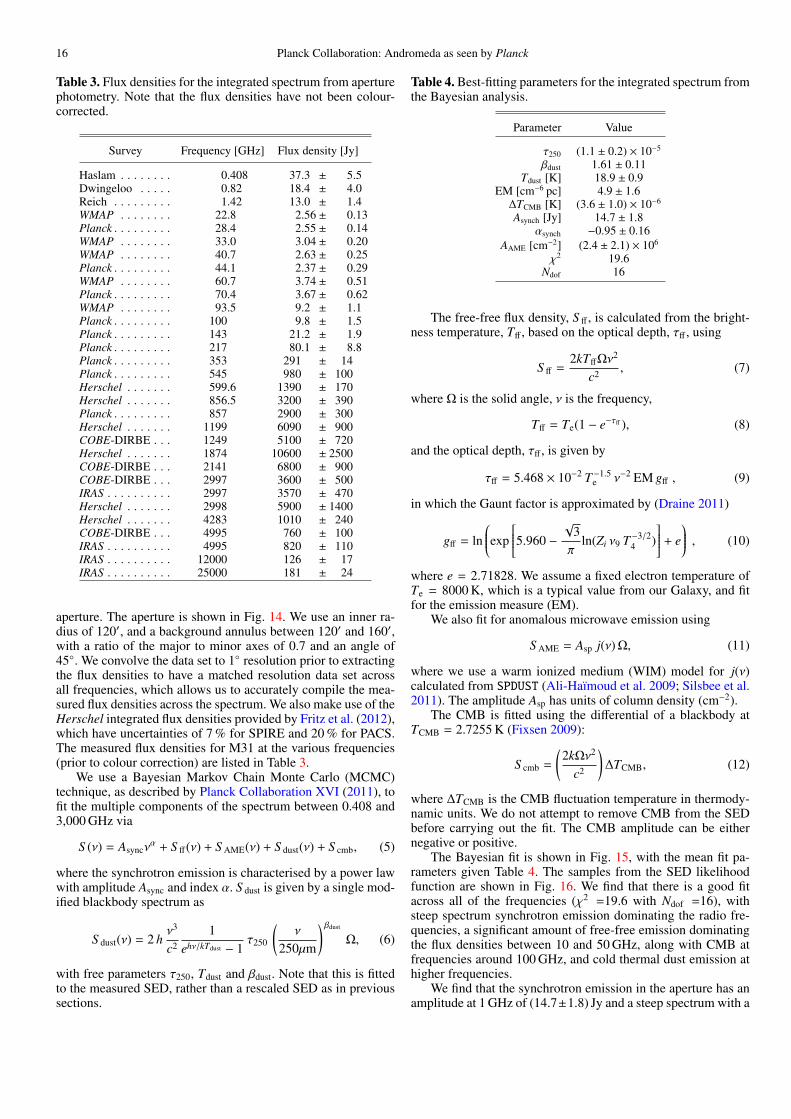
16 Planck Collaboration: Andromeda as seen by Planck
Table 3. Flux densities for the integrated spectrum from aperturephotometry. Note that the flux densities have not been colour-corrected.
Survey Frequency [GHz] Flux density [Jy]
Haslam . . . . . . . . 0.408 37.3 ± 5.5Dwingeloo . . . . . 0.82 18.4 ± 4.0Reich . . . . . . . . . 1.42 13.0 ± 1.4WMAP . . . . . . . . 22.8 2.56 ± 0.13Planck . . . . . . . . . 28.4 2.55 ± 0.14WMAP . . . . . . . . 33.0 3.04 ± 0.20WMAP . . . . . . . . 40.7 2.63 ± 0.25Planck . . . . . . . . . 44.1 2.37 ± 0.29WMAP . . . . . . . . 60.7 3.74 ± 0.51Planck . . . . . . . . . 70.4 3.67 ± 0.62WMAP . . . . . . . . 93.5 9.2 ± 1.1Planck . . . . . . . . . 100 9.8 ± 1.5Planck . . . . . . . . . 143 21.2 ± 1.9Planck . . . . . . . . . 217 80.1 ± 8.8Planck . . . . . . . . . 353 291 ± 14Planck . . . . . . . . . 545 980 ± 100Herschel . . . . . . . 599.6 1390 ± 170Herschel . . . . . . . 856.5 3200 ± 390Planck . . . . . . . . . 857 2900 ± 300Herschel . . . . . . . 1199 6090 ± 900COBE-DIRBE . . . 1249 5100 ± 720Herschel . . . . . . . 1874 10600 ± 2500COBE-DIRBE . . . 2141 6800 ± 900COBE-DIRBE . . . 2997 3600 ± 500IRAS . . . . . . . . . . 2997 3570 ± 470Herschel . . . . . . . 2998 5900 ± 1400Herschel . . . . . . . 4283 1010 ± 240COBE-DIRBE . . . 4995 760 ± 100IRAS . . . . . . . . . . 4995 820 ± 110IRAS . . . . . . . . . . 12000 126 ± 17IRAS . . . . . . . . . . 25000 181 ± 24
aperture. The aperture is shown in Fig. 14. We use an inner ra-dius of 120′, and a background annulus between 120′ and 160′,with a ratio of the major to minor axes of 0.7 and an angle of45. We convolve the data set to 1 resolution prior to extractingthe flux densities to have a matched resolution data set acrossall frequencies, which allows us to accurately compile the mea-sured flux densities across the spectrum. We also make use of theHerschel integrated flux densities provided by Fritz et al. (2012),which have uncertainties of 7 % for SPIRE and 20 % for PACS.The measured flux densities for M31 at the various frequencies(prior to colour correction) are listed in Table 3.
We use a Bayesian Markov Chain Monte Carlo (MCMC)technique, as described by Planck Collaboration XVI (2011), tofit the multiple components of the spectrum between 0.408 and3,000 GHz via
S (ν) = Asyncνα + S ff(ν) + S AME(ν) + S dust(ν) + S cmb, (5)
where the synchrotron emission is characterised by a power lawwith amplitude Async and index α. S dust is given by a single mod-ified blackbody spectrum as
S dust(ν) = 2 hν3
c2
1ehν/kTdust − 1
τ250
(ν
250µm
) βdust
Ω, (6)
with free parameters τ250, Tdust and βdust. Note that this is fittedto the measured SED, rather than a rescaled SED as in previoussections.
Table 4. Best-fitting parameters for the integrated spectrum fromthe Bayesian analysis.
Parameter Value
τ250 (1.1 ± 0.2) × 10−5
βdust 1.61 ± 0.11Tdust [K] 18.9 ± 0.9
EM [cm−6 pc] 4.9 ± 1.6∆TCMB [K] (3.6 ± 1.0) × 10−6
Asynch [Jy] 14.7 ± 1.8αsynch −0.95 ± 0.16
AAME [cm−2] (2.4 ± 2.1) × 106
χ2 19.6Ndof 16
The free-free flux density, S ff , is calculated from the bright-ness temperature, Tff , based on the optical depth, τff , using
S ff =2kTffΩν2
c2 , (7)
where Ω is the solid angle, ν is the frequency,
Tff = Te(1 − e−τff ), (8)
and the optical depth, τff , is given by
τff = 5.468 × 10⁻² T−1.5e ν−2 EM gff , (9)
in which the Gaunt factor is approximated by (Draine 2011)
gff = lnexp
5.960 −
√3π
ln(Zi ν9 T−3/24 )
+ e , (10)
where e = 2.71828. We assume a fixed electron temperature ofTe = 8000 K, which is a typical value from our Galaxy, and fitfor the emission measure (EM).
We also fit for anomalous microwave emission using
S AME = Asp j(ν) Ω, (11)
where we use a warm ionized medium (WIM) model for j(ν)calculated from SPDUST (Ali-Haımoud et al. 2009; Silsbee et al.2011). The amplitude Asp has units of column density (cm−2).
The CMB is fitted using the differential of a blackbody atTCMB = 2.7255 K (Fixsen 2009):
S cmb =
(2kΩν2
c2
)∆TCMB, (12)
where ∆TCMB is the CMB fluctuation temperature in thermody-namic units. We do not attempt to remove CMB from the SEDbefore carrying out the fit. The CMB amplitude can be eithernegative or positive.
The Bayesian fit is shown in Fig. 15, with the mean fit pa-rameters given Table 4. The samples from the SED likelihoodfunction are shown in Fig. 16. We find that there is a good fitacross all of the frequencies (χ2 =19.6 with Ndof =16), withsteep spectrum synchrotron emission dominating the radio fre-quencies, a significant amount of free-free emission dominatingthe flux densities between 10 and 50 GHz, along with CMB atfrequencies around 100 GHz, and cold thermal dust emission athigher frequencies.
We find that the synchrotron emission in the aperture has anamplitude at 1 GHz of (14.7±1.8) Jy and a steep spectrum with a
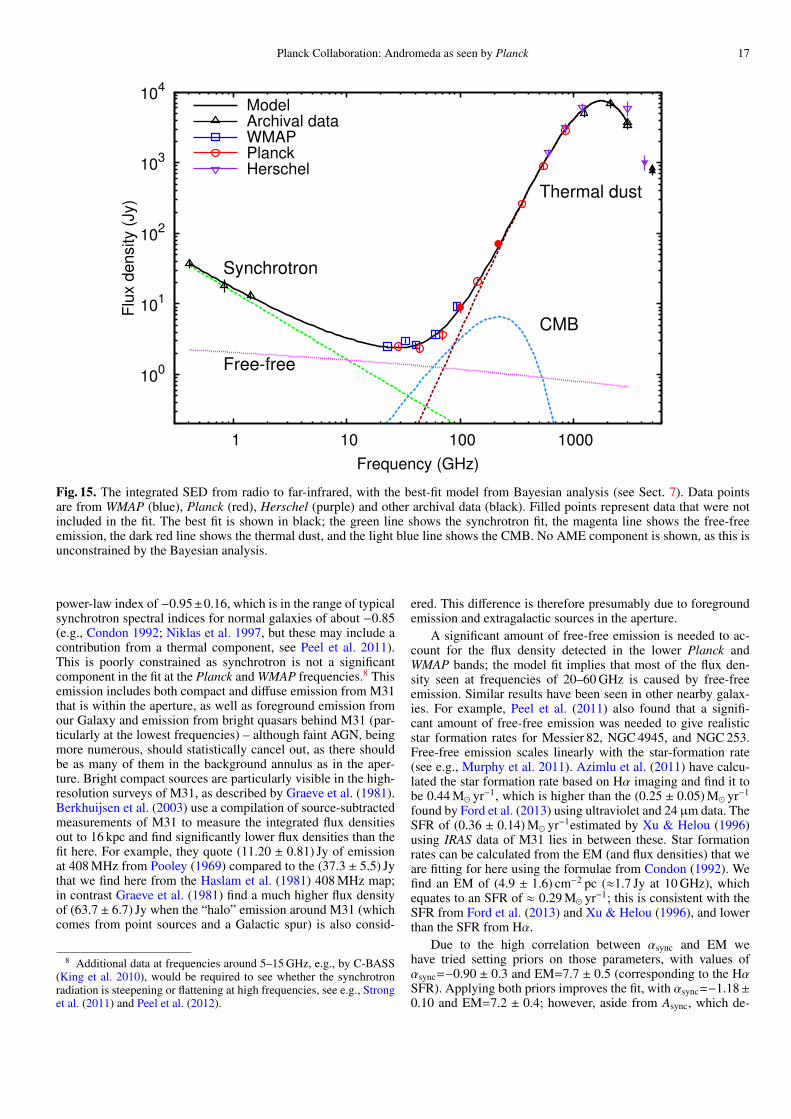
Planck Collaboration: Andromeda as seen by Planck 17
100
101
102
103
104
1 10 100 1000
Flu
x d
ensity (
Jy)
Frequency (GHz)
Synchrotron
Free-free
CMB
Thermal dust
ModelArchival dataWMAPPlanckHerschel
Fig. 15. The integrated SED from radio to far-infrared, with the best-fit model from Bayesian analysis (see Sect. 7). Data pointsare from WMAP (blue), Planck (red), Herschel (purple) and other archival data (black). Filled points represent data that were notincluded in the fit. The best fit is shown in black; the green line shows the synchrotron fit, the magenta line shows the free-freeemission, the dark red line shows the thermal dust, and the light blue line shows the CMB. No AME component is shown, as this isunconstrained by the Bayesian analysis.
power-law index of −0.95±0.16, which is in the range of typicalsynchrotron spectral indices for normal galaxies of about −0.85(e.g., Condon 1992; Niklas et al. 1997, but these may include acontribution from a thermal component, see Peel et al. 2011).This is poorly constrained as synchrotron is not a significantcomponent in the fit at the Planck and WMAP frequencies.8 Thisemission includes both compact and diffuse emission from M31that is within the aperture, as well as foreground emission fromour Galaxy and emission from bright quasars behind M31 (par-ticularly at the lowest frequencies) – although faint AGN, beingmore numerous, should statistically cancel out, as there shouldbe as many of them in the background annulus as in the aper-ture. Bright compact sources are particularly visible in the high-resolution surveys of M31, as described by Graeve et al. (1981).Berkhuijsen et al. (2003) use a compilation of source-subtractedmeasurements of M31 to measure the integrated flux densitiesout to 16 kpc and find significantly lower flux densities than thefit here. For example, they quote (11.20 ± 0.81) Jy of emissionat 408 MHz from Pooley (1969) compared to the (37.3 ± 5.5) Jythat we find here from the Haslam et al. (1981) 408 MHz map;in contrast Graeve et al. (1981) find a much higher flux densityof (63.7 ± 6.7) Jy when the “halo” emission around M31 (whichcomes from point sources and a Galactic spur) is also consid-
8 Additional data at frequencies around 5–15 GHz, e.g., by C-BASS(King et al. 2010), would be required to see whether the synchrotronradiation is steepening or flattening at high frequencies, see e.g., Stronget al. (2011) and Peel et al. (2012).
ered. This difference is therefore presumably due to foregroundemission and extragalactic sources in the aperture.
A significant amount of free-free emission is needed to ac-count for the flux density detected in the lower Planck andWMAP bands; the model fit implies that most of the flux den-sity seen at frequencies of 20–60 GHz is caused by free-freeemission. Similar results have been seen in other nearby galax-ies. For example, Peel et al. (2011) also found that a signifi-cant amount of free-free emission was needed to give realisticstar formation rates for Messier 82, NGC 4945, and NGC 253.Free-free emission scales linearly with the star-formation rate(see e.g., Murphy et al. 2011). Azimlu et al. (2011) have calcu-lated the star formation rate based on Hα imaging and find it tobe 0.44 M yr−1, which is higher than the (0.25 ± 0.05) M yr−1
found by Ford et al. (2013) using ultraviolet and 24µm data. TheSFR of (0.36 ± 0.14) M yr−1estimated by Xu & Helou (1996)using IRAS data of M31 lies in between these. Star formationrates can be calculated from the EM (and flux densities) that weare fitting for here using the formulae from Condon (1992). Wefind an EM of (4.9 ± 1.6) cm−2 pc (≈1.7 Jy at 10 GHz), whichequates to an SFR of ≈ 0.29 M yr−1; this is consistent with theSFR from Ford et al. (2013) and Xu & Helou (1996), and lowerthan the SFR from Hα.
Due to the high correlation between αsync and EM wehave tried setting priors on those parameters, with values ofαsync=−0.90 ± 0.3 and EM=7.7 ± 0.5 (corresponding to the HαSFR). Applying both priors improves the fit, with αsync=−1.18±0.10 and EM=7.2 ± 0.4; however, aside from Async, which de-
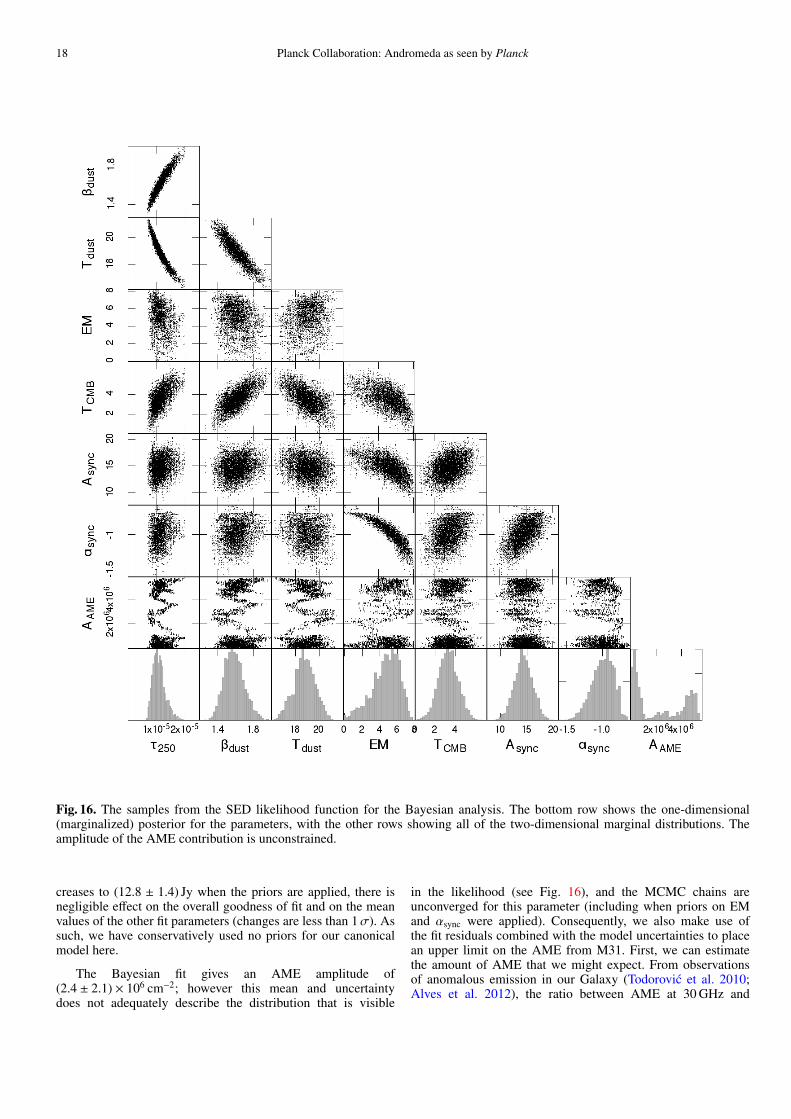
18 Planck Collaboration: Andromeda as seen by Planck
Fig. 16. The samples from the SED likelihood function for the Bayesian analysis. The bottom row shows the one-dimensional(marginalized) posterior for the parameters, with the other rows showing all of the two-dimensional marginal distributions. Theamplitude of the AME contribution is unconstrained.
creases to (12.8 ± 1.4) Jy when the priors are applied, there isnegligible effect on the overall goodness of fit and on the meanvalues of the other fit parameters (changes are less than 1σ). Assuch, we have conservatively used no priors for our canonicalmodel here.
The Bayesian fit gives an AME amplitude of(2.4 ± 2.1) × 106 cm−2; however this mean and uncertaintydoes not adequately describe the distribution that is visible
in the likelihood (see Fig. 16), and the MCMC chains areunconverged for this parameter (including when priors on EMand αsync were applied). Consequently, we also make use ofthe fit residuals combined with the model uncertainties to placean upper limit on the AME from M31. First, we can estimatethe amount of AME that we might expect. From observationsof anomalous emission in our Galaxy (Todorovic et al. 2010;Alves et al. 2012), the ratio between AME at 30 GHz and
Planck Collaboration: Andromeda as seen by Planck 19
thermal dust emission as seen by IRAS at 100µm is expectedto be about 1:3000, although there is a considerable amount ofscatter in this number (see Planck Collaboration Int. XV 2014;additionally Planck Collaboration XVII 2011 found a ratio of1:2000 for the Small Magellanic Cloud) and it is sensitive todust temperature (Tibbs et al. 2012). As we find (3570 ± 470) Jyat 100µm, this implies that the 30 GHz AME emission shouldbe 1.19 ± 0.15 Jy (with the uncertainty only from the 100µmflux density, not from the ratio). The residual that we find at30 GHz is (0.1 ± 0.7) Jy, which is <2.2 Jy at 3σ. Combining themeasurement residuals at 20–60 GHz gives an average residualof (0.15 ± 0.37) Jy, or <1.26 Jy at 3σ. This means that while wedo not detect AME from M31, we find an upper limit that meansthat AME in M31 must be less than, or comparable to, the AMElevel seen in our Galaxy. The results are compatible with thosefor AME in other nearby galaxies presented by Peel et al. (2011)and the detection of AME within only one of ten star-formingclouds observed by Murphy et al. (2010) and AMI Consortiumet al. (2010) within NGC 6946. The main source of uncertaintyhere is the level of the free-free emission. Observations atfrequencies of 5–10 GHz (e.g., a 5 GHz measurement fromC-BASS, King et al. 2010) would improve these constraints.
We find that the thermal dust emission can be well char-acterised with a single modified blackbody spectrum, withan effective temperature of (18.9 ± 0.9) K, a spectral indexβdust =1.61 ± 0.11 and an optical depth of (1.1±0.2)×10−5. Theoverall cold temperature of the dust agrees with the Herschel ob-servations, which found an average temperature of (18.1±0.2) K(Fritz et al. 2012). This is higher than the temperature of (16.5±0.3) K found in Sect. 6.3. The higher temperature obtained whenallowing βdust to vary is an expected consequence of the degen-eracy between temperature and βdust (Shetty et al. 2009). Thespectral index is lower than would have been expected from thestatistical βdust-Tdust relation seen in nearby galaxies in PlanckCollaboration XVI (2011), where at this temperature βdust > 2would have been expected. It is, however, higher than the valuesseen in the LMC and SMC of around 1.5 and 1.2, respectively(Planck Collaboration XVII 2011), and is comparable to the typ-ical values of βdust seen in our Galaxy Planck Collaboration Int.XVII (2014). We note that it is surprising how well the singletemperature modified blackbody fits the data. Even though thisfunction does not replicate the emission at < 100 µm from smalldust grains that are stochastically heated by the diffuse ISRF, itstill appears to be a good model for the overall emission from agalaxy and can provide a characteristic temperature for the largedust grains.
A positive differential CMB contribution is found, with anamplitude of (3.6 ± 1.0) × 10−6 K. That this signal is positive isnot too surprising, given the presence of the large positive CMBanisotropy seen in Fig. 1. Planck Collaboration XVII (2011)also found positive residual CMB contributions for the LMCand SMC, and Planck Collaboration Int. XV (2014) found thatAME sources preferentially had larger CMB contributions totheir spectra. The CMB amplitude is degenerate with the dustspectral index, so a flattening of this spectral index (e.g., as seenin our Galaxy by Planck Collaboration Int. XIV 2014) wouldreduce the contribution from the CMB in this spectrum; the pos-itive CMB fluctuation may be accounting for a small excess ofemission in the range 100–300 GHz. Further investigation of theCMB contribution would be needed to identify whether that isthe case here or not.
The 100 and 217 GHz bands of Planck are particularlycontaminated with 12CO,9 and consequently these bands werenot included in the fit. Using the unit conversion coefficientestimates of the 12CO contamination of the Planck mapsfrom Planck Collaboration ES (2013) of (14.78 ± 0.21) and(45.85 ± 0.11)µKCMB [K km s−1]−1 at 100 and 217 GHz, respec-tively, and the sum of the emission in the Nieten et al. (2006)CO map of 109 481 K km s−1, we estimate that within the el-liptical aperture centred on M31, the Planck maps should con-tain a total of 0.58 Jy of CO emission at 100 GHz and 3.6 Jy at217 GHz. These estimates agree within a factor of two with mea-surements of the CO contamination given by the residuals aftersubtracting the thermal dust model. At 100 GHz, there is 0.30 Jyof flux density above the model fit, corresponding to 3.3 % ofthe flux density measured at that frequency, which is lower thanexpected. This could be due to some of the CO emission be-ing included in the thermal or CMB component fits within thismodel. At 217 GHz it is 6.8 Jy, or 9.5 %, which is just under afactor of two higher than expected. One possible explanation forthis discrepancy is that the 217 GHz map contains CO emissionfrom M31 that was not measured by the ground-based survey, orthere could be CO contamination by emission from our Galaxy.Another possibility is that the modified blackbody is not suffi-cient to describe the data at these frequencies, or that the de-generacy with the CMB amplitude is affecting the fit at thesefrequencies.
8. Conclusions
Planck has clearly detected emission from the Andromedagalaxy across all of its frequency bands, and the High FrequencyInstrument has mapped out the emission at 5′ scales. Multiplespiral arm features are seen to both the north and south of thegalaxy, with the 10 kpc ring clearly detected down to 100 GHz,and additional spiral arm structures extending out to 26 kpc fromthe nucleus. Knots of emission at various points within M31 canalso seen in the Planck data.
Smoothing the Planck data to a common resolution and com-bining it with ancillary data, has provided a powerful probeof the dust properties. By looking at colour ratio plots, it canbe seen that the dust observed at the longest wavelengths (&0.3 mm) is heated by the diffuse stellar population (as tracedby the stellar emission at 3.6µm), whilst the dust observed athigher frequencies is heated by more local features (as traced bythe star formation emission at 24µm). Throughout the Planckfrequency range the dust emission is primarily from dust heatedby the diffuse stellar population rather than star formation.
By fitting a single modified thermal dust spectrum to indi-vidual pixels, the variations in dust mass and temperature acrossM31 can be seen. When a fixed βdust = 2 is used and the SEDis rescaled to include only the component that is attributable tothe dust heated by the old stellar population, then the dust tem-perature is inversely proportional to the galactocentric distance.When the spectral index is allowed to vary, then we recover val-ues of βdust ≈ 2 when only fitting the rescaled pixel SEDs. Whenwe fit the unscaled pixel SEDs using a variable βdust (see Sect.6.3), we find that βdust traces the heating from the old stellar pop-ulation rather than measuring the dust grain properties.
9 13CO also emits in these frequency bands with a similar unit con-version coefficient, but the 13CO line amplitudes are a factor of around10 fainter than the 12CO amplitudes (e.g., Allen et al. 1995); 12CO/13COratios are expected to be similar in M31 to Galactic values, since 13CO isproduced through hot-bottom burning in asymptotic giant branch stars(Herwig 2005).

20 Planck Collaboration: Andromeda as seen by Planck
Using aperture photometry, the integrated spectrum of all ofthe emission from M31 has been measured. This spectrum iswell fitted with a combination of free-free, CMB and cold ther-mal dust emission. Overall, the fitted dust temperature is reason-ably cold, at (18.9 ± 0.9) K, with a spectral index of 1.61 ± 0.11.The significant amount of free-free emission brings the star for-mation rate into agreement with Hα observations. We find a limiton the amount of AME in M31 of <1.26 Jy at 3σ, which is com-parable to the expected level of around 1 Jy from measurementsof the ratio of AME to thermal dust emission in our Galaxy.
Acknowledgements. We thank M. Haas for providing a copy of the reduced170µm data from ISO, P. Barmby for providing the Spitzer IRAC 3.6µm data,L. Chemin for providing the H I map from DRAO, and A. Richards for assis-tance with the CO data. We acknowledge the use of the Legacy Archive forMicrowave Background Data Analysis (LAMBDA); support for LAMBDA isprovided by the NASA Office of Space Science. This research has made useof the NASA/IPAC Extragalactic Database (NED) which is operated by the JetPropulsion Laboratory, California Institute of Technology, under contract withthe National Aeronautics and Space Administration. Some of the results in thispaper have been derived using the HEALPix package
The development of Planck has been supported by: ESA; CNES andCNRS/INSU-IN2P3-INP (France); ASI, CNR, and INAF (Italy); NASA andDoE (USA); STFC and UKSA (UK); CSIC, MICINN, JA, and RES (Spain);Tekes, AoF, and CSC (Finland); DLR and MPG (Germany); CSA (Canada);DTU Space (Denmark); SER/SSO (Switzerland); RCN (Norway); SFI (Ireland);FCT/MCTES (Portugal); and PRACE (EU). A description of the PlanckCollaboration and a list of its members, including the technical or scientific activ-ities in which they have been involved, can be found at http://www.sciops.esa.int/index.php?project=planck&page=Planck_Collaboration.
ReferencesAbdo, A. A., Ackermann, M., Ajello, M., et al. 2010, A&A, 523, L2Ali-Haımoud, Y., Hirata, C. M., & Dickinson, C. 2009, MNRAS, 395, 1055Allen, R. J., Le Bourlot, J., Lequeux, J., Pineau des Forets, G., & Roueff, E.
1995, ApJ, 444, 157Alves, M. I. R., Davies, R. D., Dickinson, C., et al. 2012, MNRAS, 422, 2429AMI Consortium, Scaife, A. M. M., Nikolic, B., et al. 2010, MNRAS: Letters,
406Aniano, G., Draine, B. T., Calzetti, D., et al. 2012, ApJ, 756, 138Azimlu, M., Marciniak, R., & Barmby, P. 2011, The Astronomical Journal, 142,
139Barmby, P., Ashby, M. L. N., Bianchi, L., et al. 2006, ApJ, 650, L45Beck, R., Berkhuijsen, E. M., & Hoernes, P. 1998, Astronomy and Astrophysics
Supplement Series, 129, 329Bendo, G. J., Boselli, A., Dariush, A., et al. 2012a, MNRAS, 419, 1833Bendo, G. J., Galliano, F., & Madden, S. C. 2012b, MNRAS, 423, 197Bendo, G. J., Wilson, C. D., Pohlen, M., et al. 2010, A&A, 518, L65+Bennett, C. L., Larson, D., Weiland, J. L., et al. 2013, ApJS, 208, 20Berkhuijsen, E. M. 1972, Astronomy and Astrophysics Supplement Series, 5,
263Berkhuijsen, E. M., Beck, R., & Hoernes, P. 2003, A&A, 398, 937Bersanelli, M., Mandolesi, N., Butler, R. C., et al. 2010, A&A, 520, A4Bonnarel, F., Fernique, P., Bienayme, O., et al. 2000, A&AS, 143, 33Boquien, M., Calzetti, D., Combes, F., et al. 2011, AJ, 142, 111Braun, R., Thilker, D. A., Walterbos, R. A. M., & Corbelli, E. 2009, ApJ, 695,
937Brown, R. H. & Hazard, C. 1950, Nature, 166, 901Brown, R. H. & Hazard, C. 1951, MNRAS, 111, 357Buat, V. & Xu, C. 1996, A&A, 306, 61Calzetti, D., Kennicutt, R. C., Engelbracht, C. W., et al. 2007, ApJ, 666, 870Calzetti, D., Kennicutt, Jr., R. C., Bianchi, L., et al. 2005, ApJ, 633, 871Chemin, L., Carignan, C., & Foster, T. 2009, ApJ, 705, 1395Condon, J. J. 1992, ARA&A, 30, 575Dale, D. A., Aniano, G., Engelbracht, C. W., et al. 2012, ApJ, 745, 95Dale, D. A., Gil de Paz, A., Gordon, K. D., et al. 2007, ApJ, 655, 863Dame, T. M., Koper, E., Israel, F. P., & Thaddeus, P. 1993, ApJ, 418, 730De Looze, I., Baes, M., Parkin, T. J., et al. 2012, MNRAS, -1de Paolis, F., Gurzadyan, V. G., Ingrosso, G., et al. 2011, A&A, 534, L8De Paolis, F., Gurzadyan, V. G., Nucita, A. A., et al. 2014, A&A, 565, L3de Vaucouleurs, G., de Vaucouleurs, A., Corwin, H. G. J., et al. 1991, Volume
1-3, XII, 2069 pp. 7 figs.. Springer-Verlag Berlin Heidelberg New York, -1Devereux, N. A. & Young, J. S. 1990, ApJ, 350, L25
Draine, B. T. 2011, Physics of the Interstellar and Intergalactic Medium(Princeton University Press)
Draine, B. T., Aniano, G., Krause, O., et al. 2014, ApJ, 780, 172Draine, B. T., Dale, D. A., Bendo, G., et al. 2007, ApJ, 663, 866Dunne, L., Eales, S., Edmunds, M., et al. 2000, MNRAS, 315, 115Engelbracht, C. W., Blaylock, M., Su, K. Y. L., et al. 2007, PASP, 119, 994Engelbracht, C. W., Hunt, L. K., Skibba, R. A., et al. 2010, A&A, 518, L56Fazio, G. G., Hora, J. L., Allen, L. E., et al. 2004, ApJS, 154, 10Fixsen, D. J. 2009, ApJ, 707, 916Ford, G. P., Gear, W. K., Smith, M. W. L., et al. 2013, ApJ, 769, 55Fritz, J., Gentile, G., Smith, M. W. L., et al. 2012, A&A, 546, A34Galametz, M., Kennicutt, R. C., Albrecht, M., et al. 2012, ApJ, 425, 763Galliano, F., Hony, S., Bernard, J.-P., et al. 2011, A&A, 536, A88Gordon, K. D., Bailin, J., Engelbracht, C. W., et al. 2006, ApJ, 638, L87Gordon, K. D., Engelbracht, C. W., Fadda, D., et al. 2007, PASP, 119, 1019Gordon, K. D., Rieke, G. H., Engelbracht, C. W., et al. 2005, PASP, 117, 503Gorski, K. M., Hivon, E., Banday, A. J., et al. 2005, ApJ, 622, 759Graeve, R., Emerson, D. T., & Wielebinski, R. 1981, Astronomy and
Astrophysics, 98, 260Groves, B., Krause, O., Sandstrom, K., et al. 2012, MNRAS, 426, 892Haas, M., Lemke, D., Stickel, M., et al. 1998, Astronomy and Astrophysics, 338,
L33Habing, H. J., Miley, G., Young, E., et al. 1984, ApJ, 278, L59Haslam, C., Stoffel, H., Salter, C. J., & Wilson, W. E. 1982, Astronomy and
Astrophysics Supplement Series, 47, 1Haslam, C. G. T., Klein, U., Salter, C. J., et al. 1981, A&A, 100, 209Hauser, M. G., Arendt, R. G., Kelsall, T., et al. 1998, ApJ, 508, 25Helou, G., Roussel, H., Appleton, P., et al. 2004, ApJS, 154, 253Herwig, F. 2005, ARA&A, 43, 435Hildebrand, R. H. 1983, Quarterly Journal of the Royal Astronomical Society,
24, 267Juvela, M. & Ysard, N. 2012, A&A, 541, A33Kennicutt, Jr., R. C., Hao, C.-N., Calzetti, D., et al. 2009, ApJ, 703, 1672King, O. G., Copley, C., Davies, R., et al. 2010, in Millimeter, Submillimeter, and
Far-Infrared Detectors and Instrumentation for Astronomy V (SPIE), 77411I–77411I–10
Kirk, J. M., Gear, W. K., Fritz, J., et al. 2013, ArXiv:1306.2913Klaas, U., Haas, M., Muller, S. A. H., et al. 2001, A&A, 379, 823Koper, E., Israel, F. P., Dame, T. M., & Thaddeus, P. 1991, ApJ, 383, L11Lamarre, J., Puget, J., Ade, P. A. R., et al. 2010, A&A, 520, A9Leahy, J. P., Bersanelli, M., D’Arcangelo, O., et al. 2010, A&A, 520, A8Li, A. & Draine, B. T. 2001, ApJ, 554, 778Lonsdale Persson, C. J. & Helou, G. 1987, ApJ, 314, 513Lowe, S. R., Gawronski, M. P., Wilkinson, P. N., et al. 2007, Astronomy and
Astrophysics, 474, 1093Lu, N., Helou, G., Werner, M. W., et al. 2003, ApJ, 588, 199Mandolesi, N., Bersanelli, M., Butler, R. C., et al. 2010, A&A, 520, A3McConnachie, A. W., Irwin, M. J., Ferguson, A. M. N., et al. 2005, MNRAS,
356, 979Mennella, A., Butler, R. C., Curto, A., et al. 2011, A&A, 536, A3Mentuch, E., Abraham, R. G., Glazebrook, K., et al. 2009, ApJ, 706, 1020Mentuch, E., Abraham, R. G., & Zibetti, S. 2010, ApJ, 725, 1971Miville-Deschenes, M.-A. & Lagache, G. 2005, The Astrophysical Journal
Supplement Series, 157, 302Murphy, E. J., Condon, J. J., Schinnerer, E., et al. 2011, ApJ, 737, 67Murphy, E. J., Helou, G., Condon, J. J., et al. 2010, ApJ, 709, L108Nieten, C., Neininger, N., Guelin, M., et al. 2006, A&A, 453, 459Niklas, S., Klein, U., & Wielebinski, R. 1997, A&A, 322, 19Paradis, D., Dobashi, K., Shimoikura, T., et al. 2012a, A&A, 543, A103Paradis, D., Paladini, R., Noriega-Crespo, A., et al. 2012b, A&A, 537, A113Peel, M. W., Dickinson, C., Davies, R. D., et al. 2012, MNRAS, 424, 2676Peel, M. W., Dickinson, C., Davies, R. D., Clements, D. L., & Beswick, R. J.
2011, MNRAS, 416, L99Planck Collaboration. 2011, The Explanatory Supplement to the Planck Early
Release Compact Source Catalogue (ESA)Planck HFI Core Team. 2011a, A&A, 536, A4Planck HFI Core Team. 2011b, A&A, 536, A6Planck Collaboration I. 2011, A&A, 536, A1Planck Collaboration II. 2011, A&A, 536, A2Planck Collaboration VII. 2011, A&A, 536, A7Planck Collaboration VIII. 2011, A&A, 536, A8Planck Collaboration IX. 2011, A&A, 536, A9Planck Collaboration X. 2011, A&A, 536, A10Planck Collaboration XI. 2011, A&A, 536, A11Planck Collaboration XII. 2011, A&A, 536, A12Planck Collaboration XIII. 2011, A&A, 536, A13Planck Collaboration XIV. 2011, A&A, 536, A14Planck Collaboration XV. 2011, A&A, 536, A15

Planck Collaboration: Andromeda as seen by Planck 21
Planck Collaboration XVI. 2011, A&A, 536, A16Planck Collaboration XVII. 2011, A&A, 536, A17Planck Collaboration XVIII. 2011, A&A, 536, A18Planck Collaboration XIX. 2011, A&A, 536, A19Planck Collaboration XX. 2011, A&A, 536, A20Planck Collaboration XXI. 2011, A&A, 536, A21Planck Collaboration XXII. 2011, A&A, 536, A22Planck Collaboration XXIII. 2011, A&A, 536, A23Planck Collaboration XXIV. 2011, A&A, 536, A24Planck Collaboration XXV. 2011, A&A, 536, A25Planck Collaboration I. 2014, A&A, in pressPlanck Collaboration II. 2014, A&A, in pressPlanck Collaboration VI. 2014, A&A, in pressPlanck Collaboration XI. 2014, A&A, in pressPlanck Collaboration XII. 2014, A&A, in pressPlanck Collaboration XIII. 2014, A&A, in pressPlanck Collaboration XXVIII. 2014, A&A, in pressPlanck Collaboration ES. 2013, The Explanatory
Supplement to the Planck 2013 results,http://www.sciops.esa.int/wikiSI/planckpla/index.php?title=Main Page(ESA)
Planck Collaboration Int. XIV. 2014, A&A, 564, A45Planck Collaboration Int. XV. 2014, A&A, 565, A103Planck Collaboration Int. XVII. 2014, A&A, 566, A55Planck Collaboration Int. 2014, A&A, to be submittedPooley, G. G. 1969, MNRAS, 144, 101Popescu, C. C., Tuffs, R. J., Dopita, M. A., et al. 2011, A&A, 527, A109Prescott, M. K. M., Kennicutt, Jr., R. C., Bendo, G. J., et al. 2007, ApJ, 668, 182Reich, P. & Reich, W. 1986, A&AS, 63, 205Reich, P., Testori, J. C., & Reich, W. 2001, A&A, 376, 861Reich, W. 1982, A&AS, 48, 219Rice, W. 1993, The Astronomical Journal, 105, 67Rieke, G. H., Young, E. T., Engelbracht, C. W., et al. 2004, ApJS, 154, 25Rosset, C., Tristram, M., Ponthieu, N., et al. 2010, A&A, 520, A13Sauvage, M. & Thuan, T. X. 1992, ApJ, 396, L69Shetty, R., Kauffmann, J., Schnee, S., Goodman, A. A., & Ercolano, B. 2009,
ApJ, 696, 2234Silsbee, K., Ali-Haımoud, Y., & Hirata, C. M. 2011, MNRAS, 411, 2750Smith, M. W. L., Eales, S. A., Gomez, H. L., et al. 2012, ApJ, 756, 40Spitzer Science Center. 2012, IRAC Instrument Handbook (v2.0.2), Tech. rep.,
California Institute of TechnologyStansberry, J. A., Gordon, K. D., Bhattacharya, B., et al. 2007, PASP, 119, 1038Stevens, J. A., Amure, M., & Gear, W. K. 2005, MNRAS, 357, 361Strong, A. W., Orlando, E., & Jaffe, T. R. 2011, A&A, 534, A54Tauber, J. A., Mandolesi, N., Puget, J., et al. 2010, A&A, 520, A1Taylor, J. E., Moodley, K., & Diego, J. M. 2003, MNRAS, 345, 1127Temi, P., Brighenti, F., Mathews, W. G., & Bregman, J. D. 2004, ApJS, 151, 237Tibbs, C. T., Paladini, R., & Dickinson, C. 2012, Advances in Astronomy, 2012Todorovic, M., Davies, R. D., Dickinson, C., et al. 2010, MNRAS, 406, 1629Unwin, S. C. 1983, MNRAS, 205, 787Viaene, S., Fritz, J., Baes, M., et al. 2014, ArXiv:1403.4272Walterbos, R. A. M. & Greenawalt, B. 1996, ApJ, 460, 696Walterbos, R. A. M. & Schwering, P. B. W. 1987, Astronomy and Astrophysics,
180, 27Werner, M. W., Roellig, T. L., Low, F. J., et al. 2004, ApJS, 154, 1Wheelock, S., III, T. N. G., Chillemi, J., et al. 1994, IRAS Sky Survey Atlas
Explanatory Supplement (http://irsa.ipac.caltech.edu/IRASdocs/issa.exp.sup/: JPL Publication 94-11)
Xu, C. & Helou, G. 1996, ApJ, 456, 152Zacchei, A., Maino, D., Baccigalupi, C., et al. 2011, A&A, 536, A5Zhu, Y.-N., Wu, H., Cao, C., & Li, H.-N. 2008, ApJ, 686, 155
1 APC, AstroParticule et Cosmologie, Universite Paris Diderot,CNRS/IN2P3, CEA/lrfu, Observatoire de Paris, Sorbonne ParisCite, 10, rue Alice Domon et Leonie Duquet, 75205 Paris Cedex 13,France
2 Aalto University Metsahovi Radio Observatory and Dept ofRadio Science and Engineering, P.O. Box 13000, FI-00076 AALTO,Finland
3 African Institute for Mathematical Sciences, 6-8 Melrose Road,Muizenberg, Cape Town, South Africa
4 Agenzia Spaziale Italiana Science Data Center, Via delPolitecnico snc, 00133, Roma, Italy
5 Agenzia Spaziale Italiana, Viale Liegi 26, Roma, Italy
6 Astrophysics Group, Cavendish Laboratory, University ofCambridge, J J Thomson Avenue, Cambridge CB3 0HE, U.K.
7 Astrophysics & Cosmology Research Unit, School ofMathematics, Statistics & Computer Science, University ofKwaZulu-Natal, Westville Campus, Private Bag X54001, Durban4000, South Africa
8 Atacama Large Millimeter/submillimeter Array, ALMA SantiagoCentral Offices, Alonso de Cordova 3107, Vitacura, Casilla 7630355, Santiago, Chile
9 CITA, University of Toronto, 60 St. George St., Toronto, ONM5S 3H8, Canada
10 CNRS, IRAP, 9 Av. colonel Roche, BP 44346, F-31028 Toulousecedex 4, France
11 California Institute of Technology, Pasadena, California, U.S.A.
12 Centro de Estudios de Fısica del Cosmos de Aragon (CEFCA),Plaza San Juan, 1, planta 2, E-44001, Teruel, Spain
13 Computational Cosmology Center, Lawrence Berkeley NationalLaboratory, Berkeley, California, U.S.A.
14 DSM/Irfu/SPP, CEA-Saclay, F-91191 Gif-sur-Yvette Cedex,France
15 DTU Space, National Space Institute, Technical University ofDenmark, Elektrovej 327, DK-2800 Kgs. Lyngby, Denmark
16 Departement de Physique Theorique, Universite de Geneve, 24,Quai E. Ansermet,1211 Geneve 4, Switzerland
17 Departamento de Fısica, Universidad de Oviedo, Avda. CalvoSotelo s/n, Oviedo, Spain
18 Department of Astrophysics/IMAPP, Radboud UniversityNijmegen, P.O. Box 9010, 6500 GL Nijmegen, The Netherlands
19 Department of Physics & Astronomy, University of BritishColumbia, 6224 Agricultural Road, Vancouver, British Columbia,Canada
20 Department of Physics and Astronomy, Dana and David DornsifeCollege of Letter, Arts and Sciences, University of SouthernCalifornia, Los Angeles, CA 90089, U.S.A.
21 Department of Physics and Astronomy, University CollegeLondon, London WC1E 6BT, U.K.
22 Department of Physics, Florida State University, Keen PhysicsBuilding, 77 Chieftan Way, Tallahassee, Florida, U.S.A.
23 Department of Physics, Gustaf Hallstromin katu 2a, University ofHelsinki, Helsinki, Finland
24 Department of Physics, Princeton University, Princeton, NewJersey, U.S.A.
25 Department of Physics, University of California, Santa Barbara,California, U.S.A.
26 Department of Physics, University of Illinois at Urbana-Champaign, 1110 West Green Street, Urbana, Illinois, U.S.A.
22 Planck Collaboration: Andromeda as seen by Planck
27 Dipartimento di Fisica e Astronomia G. Galilei, Universita degliStudi di Padova, via Marzolo 8, 35131 Padova, Italy
28 Dipartimento di Fisica e Scienze della Terra, Universita diFerrara, Via Saragat 1, 44122 Ferrara, Italy
29 Dipartimento di Fisica, Universita La Sapienza, P. le A. Moro 2,Roma, Italy
30 Dipartimento di Fisica, Universita degli Studi di Milano, ViaCeloria, 16, Milano, Italy
31 Dipartimento di Fisica, Universita degli Studi di Trieste, via A.Valerio 2, Trieste, Italy
32 Dipartimento di Fisica, Universita di Roma Tor Vergata, Via dellaRicerca Scientifica, 1, Roma, Italy
33 Discovery Center, Niels Bohr Institute, Blegdamsvej 17,Copenhagen, Denmark
34 Dpto. Astrofısica, Universidad de La Laguna (ULL), E-38206 LaLaguna, Tenerife, Spain
35 European Southern Observatory, ESO Vitacura, Alonso deCordova 3107, Vitacura, Casilla 19001, Santiago, Chile
36 European Space Agency, ESAC, Planck Science Office, Caminobajo del Castillo, s/n, Urbanizacion Villafranca del Castillo,Villanueva de la Canada, Madrid, Spain
37 European Space Agency, ESTEC, Keplerlaan 1, 2201 AZNoordwijk, The Netherlands
38 Facolta di Ingegneria, Universita degli Studi e-Campus, ViaIsimbardi 10, Novedrate (CO), 22060, Italy
39 HGSFP and University of Heidelberg, Theoretical PhysicsDepartment, Philosophenweg 16, 69120, Heidelberg, Germany
40 Haverford College Astronomy Department, 370 LancasterAvenue, Haverford, Pennsylvania, U.S.A.
41 Helsinki Institute of Physics, Gustaf Hallstromin katu 2,University of Helsinki, Helsinki, Finland
42 INAF - Osservatorio Astrofisico di Catania, Via S. Sofia 78,Catania, Italy
43 INAF - Osservatorio Astronomico di Padova, Vicolodell’Osservatorio 5, Padova, Italy
44 INAF - Osservatorio Astronomico di Roma, via di Frascati 33,Monte Porzio Catone, Italy
45 INAF - Osservatorio Astronomico di Trieste, Via G.B. Tiepolo11, Trieste, Italy
46 INAF/IASF Bologna, Via Gobetti 101, Bologna, Italy
47 INAF/IASF Milano, Via E. Bassini 15, Milano, Italy
48 INFN, Sezione di Bologna, Via Irnerio 46, I-40126, Bologna, Italy
49 INFN, Sezione di Roma 1, Universita di Roma Sapienza, PiazzaleAldo Moro 2, 00185, Roma, Italy
50 INFN/National Institute for Nuclear Physics, Via Valerio 2,I-34127 Trieste, Italy
51 Imperial College London, Astrophysics group, BlackettLaboratory, Prince Consort Road, London, SW7 2AZ, U.K.
52 Infrared Processing and Analysis Center, California Institute ofTechnology, Pasadena, CA 91125, U.S.A.
53 Institut Universitaire de France, 103, bd Saint-Michel, 75005,Paris, France
54 Institut d’Astrophysique Spatiale, CNRS (UMR8617) UniversiteParis-Sud 11, Batiment 121, Orsay, France
55 Institut d’Astrophysique de Paris, CNRS (UMR7095), 98 bisBoulevard Arago, F-75014, Paris, France
56 Institute for Space Sciences, Bucharest-Magurale, Romania
57 Institute of Astronomy, University of Cambridge, MadingleyRoad, Cambridge CB3 0HA, U.K.
58 Institute of Theoretical Astrophysics, University of Oslo,Blindern, Oslo, Norway
59 Instituto de Astrofısica de Canarias, C/Vıa Lactea s/n, La Laguna,Tenerife, Spain
60 Instituto de Fısica de Cantabria (CSIC-Universidad de Cantabria),Avda. de los Castros s/n, Santander, Spain
61 Jet Propulsion Laboratory, California Institute of Technology,4800 Oak Grove Drive, Pasadena, California, U.S.A.
62 Jodrell Bank Centre for Astrophysics, Alan Turing Building,School of Physics and Astronomy, The University of Manchester,Oxford Road, Manchester, M13 9PL, U.K.
63 Kavli Institute for Cosmology Cambridge, Madingley Road,Cambridge, CB3 0HA, U.K.
64 LAL, Universite Paris-Sud, CNRS/IN2P3, Orsay, France
65 LERMA, CNRS, Observatoire de Paris, 61 Avenue del’Observatoire, Paris, France
66 Laboratoire AIM, IRFU/Service d’Astrophysique - CEA/DSM -CNRS - Universite Paris Diderot, Bat. 709, CEA-Saclay, F-91191Gif-sur-Yvette Cedex, France
67 Laboratoire Traitement et Communication de l’Information,CNRS (UMR 5141) and Telecom ParisTech, 46 rue Barrault F-75634 Paris Cedex 13, France
68 Laboratoire de Physique Subatomique et de Cosmologie,Universite Joseph Fourier Grenoble I, CNRS/IN2P3, InstitutNational Polytechnique de Grenoble, 53 rue des Martyrs, 38026Grenoble cedex, France
69 Laboratoire de Physique Theorique, Universite Paris-Sud 11 &CNRS, Batiment 210, 91405 Orsay, France
70 Lawrence Berkeley National Laboratory, Berkeley, California,U.S.A.
71 Max-Planck-Institut fur Astrophysik, Karl-Schwarzschild-Str. 1,85741 Garching, Germany
72 McGill Physics, Ernest Rutherford Physics Building, McGillUniversity, 3600 rue University, Montreal, QC, H3A 2T8, Canada
Planck Collaboration: Andromeda as seen by Planck 23
73 National University of Ireland, Department of ExperimentalPhysics, Maynooth, Co. Kildare, Ireland
74 Niels Bohr Institute, Blegdamsvej 17, Copenhagen, Denmark
75 Observational Cosmology, Mail Stop 367-17, California Instituteof Technology, Pasadena, CA, 91125, U.S.A.
76 Optical Science Laboratory, University College London, GowerStreet, London, U.K.
77 SISSA, Astrophysics Sector, via Bonomea 265, 34136, Trieste,Italy
78 School of Physics and Astronomy, Cardiff University, QueensBuildings, The Parade, Cardiff, CF24 3AA, U.K.
79 Space Sciences Laboratory, University of California, Berkeley,California, U.S.A.
80 Special Astrophysical Observatory, Russian Academy ofSciences, Nizhnij Arkhyz, Zelenchukskiy region, Karachai-Cherkessian Republic, 369167, Russia
81 Sterrewacht Leiden, Leiden University, PO Box 9513, 2300 RALeiden, The Netherlands
82 Sub-Department of Astrophysics, University of Oxford, KebleRoad, Oxford OX1 3RH, U.K.
83 UPMC Univ Paris 06, UMR7095, 98 bis Boulevard Arago,F-75014, Paris, France
84 Universite de Toulouse, UPS-OMP, IRAP, F-31028 Toulousecedex 4, France
85 University of Granada, Departamento de Fısica Teorica y delCosmos, Facultad de Ciencias, Granada, Spain
86 University of Granada, Instituto Carlos I de Fısica Teorica yComputacional, Granada, Spain
87 Warsaw University Observatory, Aleje Ujazdowskie 4, 00-478Warszawa, Poland


