Embed Size (px)
Citation preview
Effect of Rearing Environment on Hypothalamic-
Pituitary-Interrenal (HPI) Axis of Mahseer
(Tor putitora)
By
IMDAD ULLAH
Department of Animal Sciences
Faculty of Biological Sciences
Quaid-i-Azam University
Islamabad
2017

Effect of Rearing Environment on Hypothalamic-
Pituitary-Interrenal (HPI) Axis of Mahseer
(Tor putitora)
A thesis submitted in partial fulfilment of the requirements
for the degree of
DOCTOR OF PHILOSOPHY
By
IMDAD ULLAH
Department of Animal Sciences
Faculty of Biological Sciences
Quaid-i-Azam University
Islamabad
2017


IN THE NAME OF ALLAH
THE MOST MERCIFUL
THE MOST BENEFICENT
AND
THE MOST COMPASSIONATE

Dedicated to:
‘‘My loving and caring
Humaira Rehman (Mary)’’
LIST OF CONTENTS
Title Page No.
Abbreviations i
List of Figures ii
List of Tables vi
Acknowledgements xi
General Abstract xiii
General Introduction 1
Chapter No. 1 16
Chapter No. 2 72
Chapter No. 3 92
Chapter No. 4 139
General Discussion 161
References 169
i
LIST OF ABBREVIATIONS
Abbreviations Full Names
® Registered
°C Centigrade
µg Microgram
µl Microliter
µm Micrometer
5-HIAA 5-hydroxyindoleacetic acid
5-HT Serotonin (5-hydroxytryptamine)
cm Centimeter
DA Dopamine
dd Double distilled water
DHBA 2,3-Dihydroxybenzoic acid
DO Dissolved oxygen
DOPAC 3,4-dihydroxyphenylacetic acid
EIA Enzyme-linked immunosorbent assay
Ft Feet
g Gram
hr Hour
HVA Homovanilic acid
mg/dL Milligram per decilitre
mgL-1
Milligram per litre
min Minute
ml Millilitre
mm Millimetre
mmole Millimole
mmole/L Millimole per litre
Ms222 Ethyl 3-aminobenzoate methanesulfonic acid
ng/L Nanogram per litre
ngg-1
Nanogram per gram
ppm Part per million
rpm Rounds per minute
sec Second
TMB 3, 3, 5, 5-Tetramethylbenzidine
ii
LIST OF FIGURES
Figure
No.
Title Page
No.
Chapter # 1
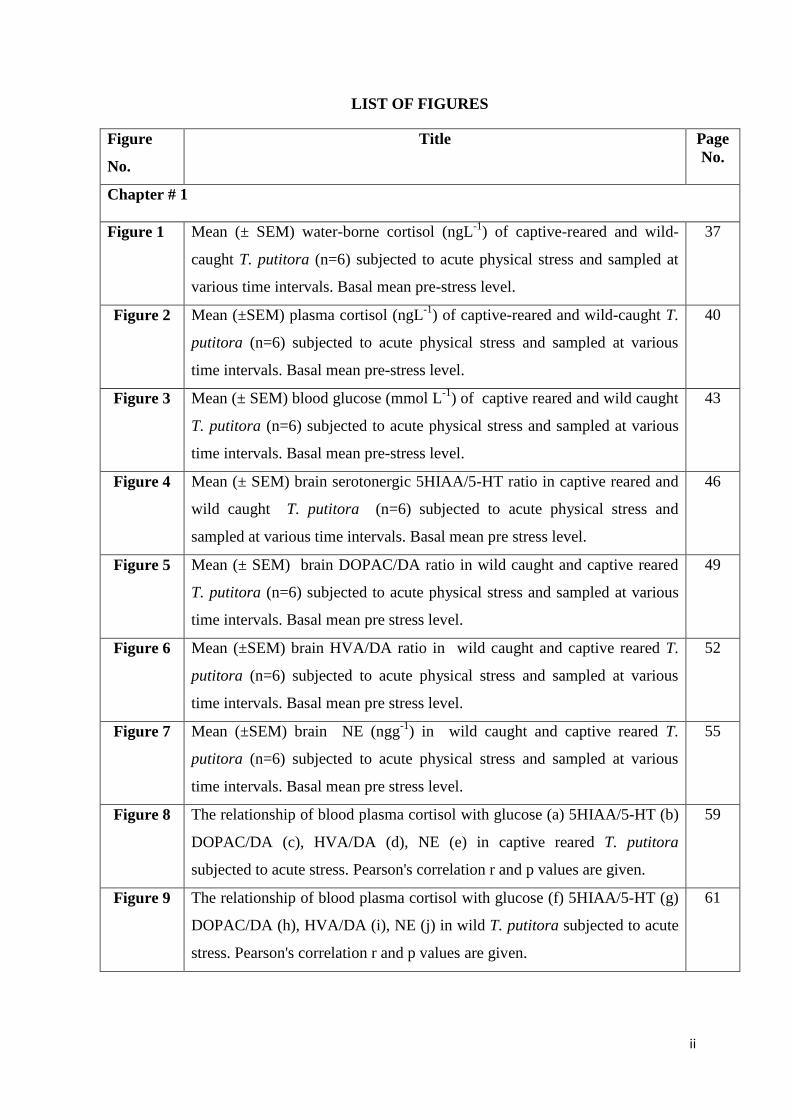
Figure 1 Mean (± SEM) water-borne cortisol (ngL-1
) of captive-reared and wild-
caught T. putitora (n=6) subjected to acute physical stress and sampled at
various time intervals. Basal mean pre-stress level.
37
Figure 2 Mean (±SEM) plasma cortisol (ngL-1
) of captive-reared and wild-caught T.
putitora (n=6) subjected to acute physical stress and sampled at various
time intervals. Basal mean pre-stress level.
40
Figure 3 Mean (± SEM) blood glucose (mmol L-1
) of captive reared and wild caught
T. putitora (n=6) subjected to acute physical stress and sampled at various
time intervals. Basal mean pre-stress level.
43
Figure 4 Mean (± SEM) brain serotonergic 5HIAA/5-HT ratio in captive reared and
wild caught T. putitora (n=6) subjected to acute physical stress and
sampled at various time intervals. Basal mean pre stress level.
46
Figure 5 Mean (± SEM) brain DOPAC/DA ratio in wild caught and captive reared
T. putitora (n=6) subjected to acute physical stress and sampled at various
time intervals. Basal mean pre stress level.
49
Figure 6 Mean (±SEM) brain HVA/DA ratio in wild caught and captive reared T.
putitora (n=6) subjected to acute physical stress and sampled at various
time intervals. Basal mean pre stress level.
52
Figure 7 Mean (±SEM) brain NE (ngg-1
) in wild caught and captive reared T.
putitora (n=6) subjected to acute physical stress and sampled at various
time intervals. Basal mean pre stress level.
55
Figure 8 The relationship of blood plasma cortisol with glucose (a) 5HIAA/5-HT (b)
DOPAC/DA (c), HVA/DA (d), NE (e) in captive reared T. putitora
subjected to acute stress. Pearson's correlation r and p values are given.
59
Figure 9 The relationship of blood plasma cortisol with glucose (f) 5HIAA/5-HT (g)
DOPAC/DA (h), HVA/DA (i), NE (j) in wild T. putitora subjected to acute
stress. Pearson's correlation r and p values are given.
61
iii
LIST OF FIGURES
Figure
No.
Title Page
No.
Chapter # 2
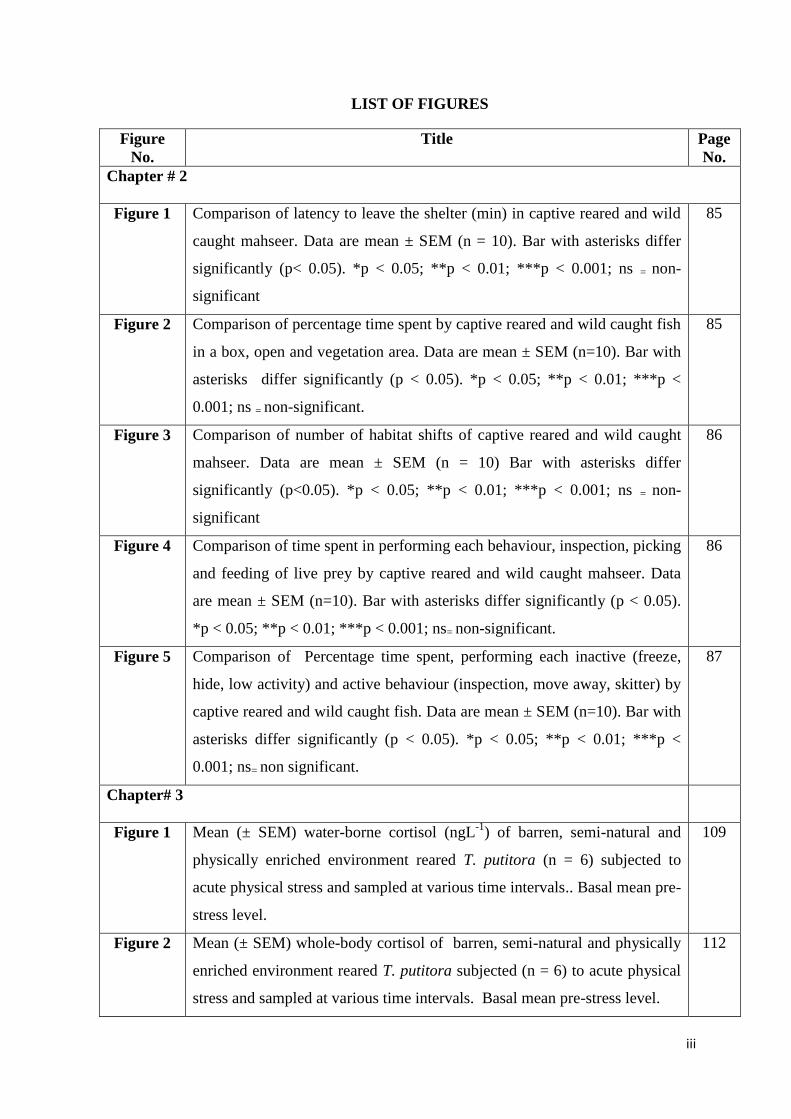
Figure 1 Comparison of latency to leave the shelter (min) in captive reared and wild
caught mahseer. Data are mean ± SEM (n = 10). Bar with asterisks differ
significantly (p< 0.05). *p < 0.05; **p < 0.01; ***p < 0.001; ns = non-
significant
85
Figure 2 Comparison of percentage time spent by captive reared and wild caught fish
in a box, open and vegetation area. Data are mean ± SEM (n=10). Bar with
asterisks differ significantly (p < 0.05). *p < 0.05; **p < 0.01; ***p <
0.001; ns = non-significant.
85
Figure 3 Comparison of number of habitat shifts of captive reared and wild caught
mahseer. Data are mean ± SEM (n = 10) Bar with asterisks differ
significantly (p<0.05). *p < 0.05; **p < 0.01; ***p < 0.001; ns = non-
significant
86
Figure 4 Comparison of time spent in performing each behaviour, inspection, picking
and feeding of live prey by captive reared and wild caught mahseer. Data
are mean ± SEM (n=10). Bar with asterisks differ significantly (p < 0.05).
*p < 0.05; **p < 0.01; ***p < 0.001; ns= non-significant.
86
Figure 5 Comparison of Percentage time spent, performing each inactive (freeze,
hide, low activity) and active behaviour (inspection, move away, skitter) by
captive reared and wild caught fish. Data are mean ± SEM (n=10). Bar with
asterisks differ significantly (p < 0.05). *p < 0.05; **p < 0.01; ***p <
0.001; ns= non significant.
87
Chapter# 3
Figure 1 Mean (± SEM) water-borne cortisol (ngL-1
) of barren, semi-natural and
physically enriched environment reared T. putitora (n = 6) subjected to
acute physical stress and sampled at various time intervals.. Basal mean pre-
stress level.
109
Figure 2 Mean (± SEM) whole-body cortisol of barren, semi-natural and physically
enriched environment reared T. putitora subjected (n = 6) to acute physical
stress and sampled at various time intervals. Basal mean pre-stress level.
112
iv
LIST OF FIGURES
Figure
No.
Title Page
No.
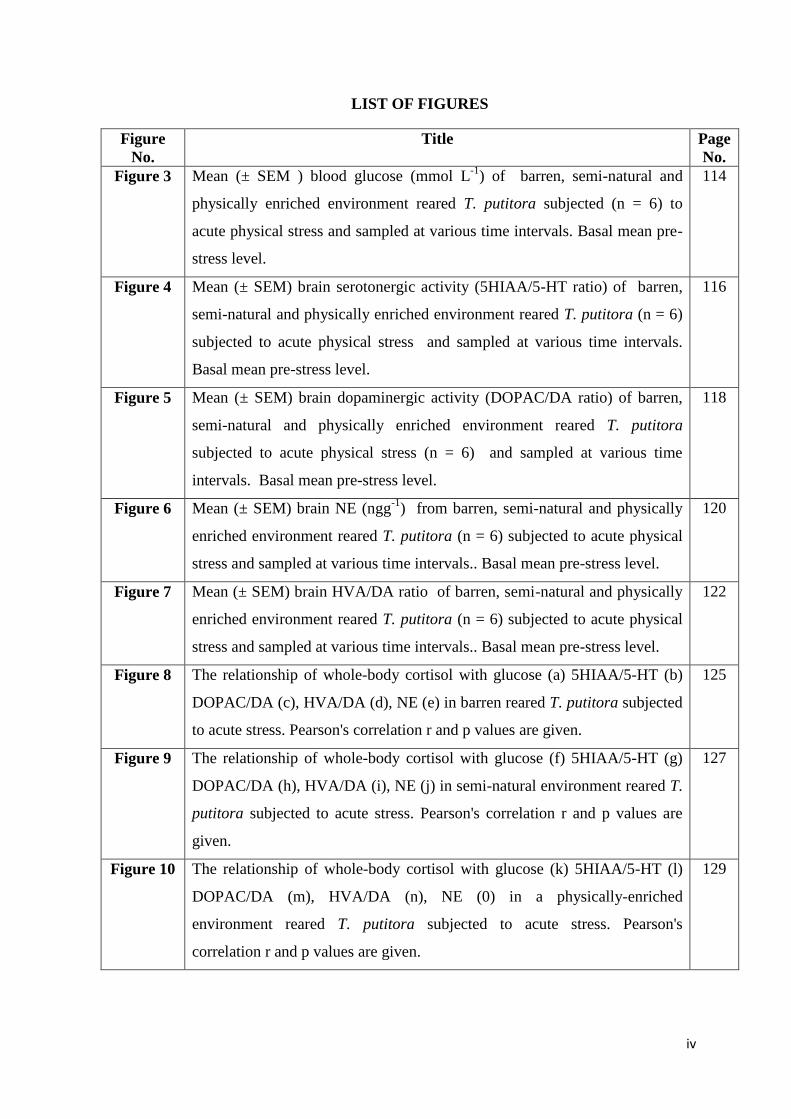
Figure 3 Mean (± SEM ) blood glucose (mmol L-1
) of barren, semi-natural and
physically enriched environment reared T. putitora subjected (n = 6) to
acute physical stress and sampled at various time intervals. Basal mean pre-
stress level.
114
Figure 4 Mean (± SEM) brain serotonergic activity (5HIAA/5-HT ratio) of barren,
semi-natural and physically enriched environment reared T. putitora (n = 6)
subjected to acute physical stress and sampled at various time intervals.
Basal mean pre-stress level.
116
Figure 5 Mean (± SEM) brain dopaminergic activity (DOPAC/DA ratio) of barren,
semi-natural and physically enriched environment reared T. putitora
subjected to acute physical stress (n = 6) and sampled at various time
intervals. Basal mean pre-stress level.
118
Figure 6 Mean (± SEM) brain NE (ngg-1
) from barren, semi-natural and physically
enriched environment reared T. putitora (n = 6) subjected to acute physical
stress and sampled at various time intervals.. Basal mean pre-stress level.
120
Figure 7 Mean (± SEM) brain HVA/DA ratio of barren, semi-natural and physically
enriched environment reared T. putitora (n = 6) subjected to acute physical
stress and sampled at various time intervals.. Basal mean pre-stress level.
122
Figure 8 The relationship of whole-body cortisol with glucose (a) 5HIAA/5-HT (b)
DOPAC/DA (c), HVA/DA (d), NE (e) in barren reared T. putitora subjected
to acute stress. Pearson's correlation r and p values are given.
125
Figure 9 The relationship of whole-body cortisol with glucose (f) 5HIAA/5-HT (g)
DOPAC/DA (h), HVA/DA (i), NE (j) in semi-natural environment reared T.
putitora subjected to acute stress. Pearson's correlation r and p values are
given.
127
Figure 10 The relationship of whole-body cortisol with glucose (k) 5HIAA/5-HT (l)
DOPAC/DA (m), HVA/DA (n), NE (0) in a physically-enriched
environment reared T. putitora subjected to acute stress. Pearson's
correlation r and p values are given.
129
v
LIST OF FIGURES
Figure
No.
Title Page
No.
Chapter# 4
Figure 1 Latency to leave the shelter (min) by three different rearing groups, barren,
enriched and semi-natural environments. Data are mean ± SEM (n = 20).
Bar with asterisks differ significantly. * p< 0.05; ** p< 0.01; *** p < 0.001
ns = non significant.
153
Figure 2 Latency to leave the shelter (min) by three different rearing groups, barren,
enriched and semi-natural environments. Data are mean ± SEM (n = 20).
Bar with asterisks differ significantly. * p< 0.05; ** p< 0.01; *** p < 0.001
ns = non significant.
153
Figure 3 Number of habitat shifts for three different rearing groups, barren, enriched
and semi-natural environments. Data are mean ± SEM (n = 20). Bar with
asterisks differ significantly. * p< 0.05; ** p< 0.01; *** p < 0.001 ns = non
significant.
154
Figure 4 Time (min) spent performing each behaviour inspection, latency to pick and
feeding by fish rearing in three different rearing groups, barren, enriched
and semi-natural environments. Values are presented as mean ± SEM (n =
10). Bar with asterisks differ significantly. * p< 0.05; ** p< 0.01; *** p <
0.001 ns = non significant.
154
Figure 5 Percentage of time spent (min) performing each inactive and active
behaviour of fish rearing in three different rearing groups, barren, enriched
and semi-natural environments. Values are presented as mean ± SEM (n =
20). Bar with asterisks differs significantly. * p< 0.05; ** p< 0.01; *** p <
0.001 ns = non significant.
155
vi
LIST OF TABLES
Table No. Title Page
No.
Chapter # 1
Table No. 1 Summary of the ANOVA examining water-borne cortisol in captive-
reared and wild-caught T. putitora during control and acute physical
stress treatments.
38
Table No. 2 Water-borne cortisol (mean ngL-1
± SEM) in captive-reared and wild-
caught T. putitora subjected to acute physical stress and sampled at
various time intervals. Basal mean pre-stress level.
39
Table No. 3 Summary of the ANOVA comparing plasma cortisol in captive-reared
and wild-caught T. putitora during control and acute physical stress
treatments.
41
Table No. 4 Mean (± SEM) plasma cortisol (ngL-1
) in wild and captive reared T.
putitora subjected to acute physical stress and sampled at various time
intervals. Basal mean pre-stress level.
42
Table No. 5 Summary of the ANOVA examining blood glucose in captive-reared
and wild-caught T. putitora during control and acute physical stress
treatments.
44
Table No. 6 Mean (± SEM) of the total blood glucose (mmol L-1
) in wild and captive
reared T. putitora subjected to acute physical stress and sampled at
various time intervals. Basal mean pre-stress level.
45
Table No. 7 Summary of the ANOVA representing brain serotonergic activity
(5HIAA/5-HT ratio) in captive-reared and wild-caught T. putitora
during control and acute physical stress treatments.
47
Table No. 8 Mean (± SEM) brain 5HIAA/5-HT in wild and captive reared T. putitora
subjected to acute physical stress and sampled at various time intervals.
Basal mean pre-stress level.
48
Table No. 9 Summary of the ANOVA examining brain dopaminergic activity
(DOPAC/DA ratio) in captive-reared and wild-caught T. putitora during
control and acute physical stress treatments.
50
Table No. 10 Mean value (± SEM) brain DOPAC/DA ratio in wild and captive reared
T. putitora subjected to acute physical stress
51
vii
LIST OF TABLES
Table No. Title Page
No.
and sampled at various time intervals. Basal mean pre-stress level.
Table No. 11 Summary of the ANOVA examining brain HVA/DA in captive-reared
and wild-caught T. putitora during control and acute physical stress
treatments.
53
Table No. 12 Mean (± SEM) brain HVA/DA ratio in wild and captive reared T.
putitora subjected to acute physical stress and sampled at various time
intervals. Basal mean pre-stress level.
54
Table No. 13 Summary of the ANOVA examining brain NE in captive-reared and
wild-caught T. putitora during control and acute physical stress
treatments.
56
Table No. 14 Mean (± SEM) brain NE (ngg-1
) in wild and captive reared T. putitora
subjected to acute physical stress and sampled at various time intervals.
Basal mean pre-stress level.
57
Table No. 15 Summary of relationship of plasma cortisol with brain monoamenergic a
ctivity (monoamine/metabolite ratio) and blood glucose in acute stress tre
ated T. putitora from captive-reared and wild-caught population.
62
Table No. 16 Summary of relationship of plasma cortisol with brain monoamenergic
activity (monoamine/metabolite ratio) and blood glucose at different time
interval in acute stress treated T. putitora from captive-reared and wild-
caught population.
63
Chapter # 2
Table No. 1 Behaviour o f m ahseer observed during feeding on live prey
(earthworm) trial (Ullah et al., 2017).
80
Table No. 2 Behaviour observed during anti-predator response trials (Ahlbeck and
Holliland 2012; Ullah et al., 2017).
81
Table No. 3 Summary of the ANOVA examining the exploratory, feeding and anti-
predatory behaviours of wild caught and captive reared T. putitota.
84
viii
LIST OF TABLES
Table No. Title Page
No.
Chapter # 3
Table No. 1 Summary of the ANOVA examining water-borne cortisol in barren,
semi-natural and physically-enriched environment reared T. putitora
during control and acute physical stress treatments.
110
Table No. 2 Mean (± SEM) water-borne cortisol (ngL-1) from barren, semi-natural
and physically-enriched environment reared T. putitora (n=6) subjected
to acute physical stress and sampled at various time intervals. Basal mean
pre-stress level.
111
Table No. 3 Summary of the ANOVA comparing whole-body cortisol of barren,
semi-natural and physically-enriched environment reared T. putitora
during control and acute physical stress treatments.
112
Table No. 4 Mean (± SEM ) whole-body cortisol (ng/g fish) of barren, semi-natural
and physically-enriched environment reared T. putitora (n=6) subjected
to acute physical stress and sampled at various time intervals. Basal mean
pre-stress level.
113
Table No. 5 Summary of the ANOVA examining the blood glucose level in barren,
semi-natural and physically-enriched environment reared T. putitora
during control and acute physical stress treatments.
114
Table No. 6 Mean (± SEM) blood glucose (mmolL-1
) in barren, semi-natural and
physically-enriched environment reared T. putitora (n=6) subjected to
acute physical stress and sampled at various time intervals. Basal mean
pre-stress level
115
Table No. 7 Summary of the ANOVA examining serotonergic activity (5HIAA/5-HT
ratio) in the brain in barren, semi-natural and physically-enriched
environment reared T. putitora during control and acute physical stress
treatments.
116
Table No. 8 Mean (± SEM) 5HIAA/5-HT ratio in barren, semi-natural and physically-
enriched environment reared T. putitora (n=6) subjected to acute physical
stress and sampled at various time intervals. Basal mean pre-stress level.
117
ix
LIST OF TABLES
Table No. Title Page
No.
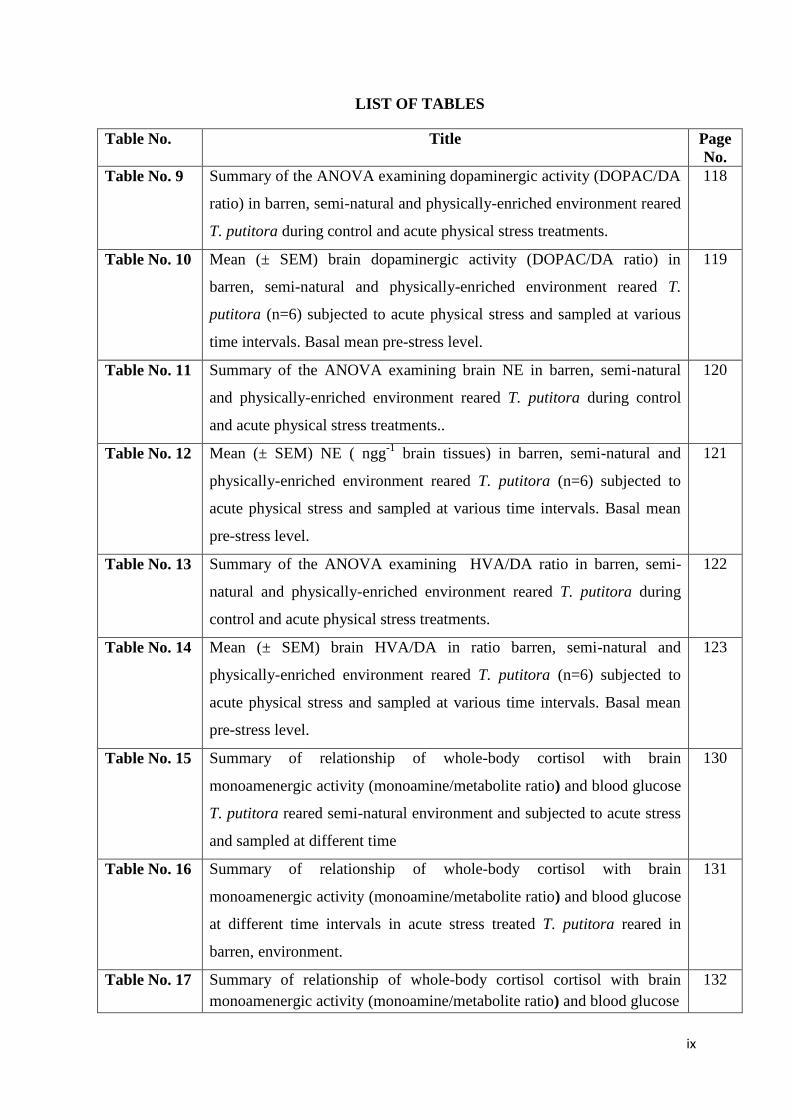
Table No. 9 Summary of the ANOVA examining dopaminergic activity (DOPAC/DA
ratio) in barren, semi-natural and physically-enriched environment reared
T. putitora during control and acute physical stress treatments.
118
Table No. 10 Mean (± SEM) brain dopaminergic activity (DOPAC/DA ratio) in
barren, semi-natural and physically-enriched environment reared T.
putitora (n=6) subjected to acute physical stress and sampled at various
time intervals. Basal mean pre-stress level.
119
Table No. 11 Summary of the ANOVA examining brain NE in barren, semi-natural
and physically-enriched environment reared T. putitora during control
and acute physical stress treatments..
120
Table No. 12 Mean (± SEM) NE ( ngg-1
brain tissues) in barren, semi-natural and
physically-enriched environment reared T. putitora (n=6) subjected to
acute physical stress and sampled at various time intervals. Basal mean
pre-stress level.
121
Table No. 13 Summary of the ANOVA examining HVA/DA ratio in barren, semi-
natural and physically-enriched environment reared T. putitora during
control and acute physical stress treatments.
122
Table No. 14 Mean (± SEM) brain HVA/DA in ratio barren, semi-natural and
physically-enriched environment reared T. putitora (n=6) subjected to
acute physical stress and sampled at various time intervals. Basal mean
pre-stress level.
123
Table No. 15 Summary of relationship of whole-body cortisol with brain
monoamenergic activity (monoamine/metabolite ratio) and blood glucose
T. putitora reared semi-natural environment and subjected to acute stress
and sampled at different time
130
Table No. 16 Summary of relationship of whole-body cortisol with brain
monoamenergic activity (monoamine/metabolite ratio) and blood glucose
at different time intervals in acute stress treated T. putitora reared in
barren, environment.
131
Table No. 17 Summary of relationship of whole-body cortisol cortisol with brain
monoamenergic activity (monoamine/metabolite ratio) and blood glucose
132
x
LIST OF TABLES
Table No. Title Page
No.
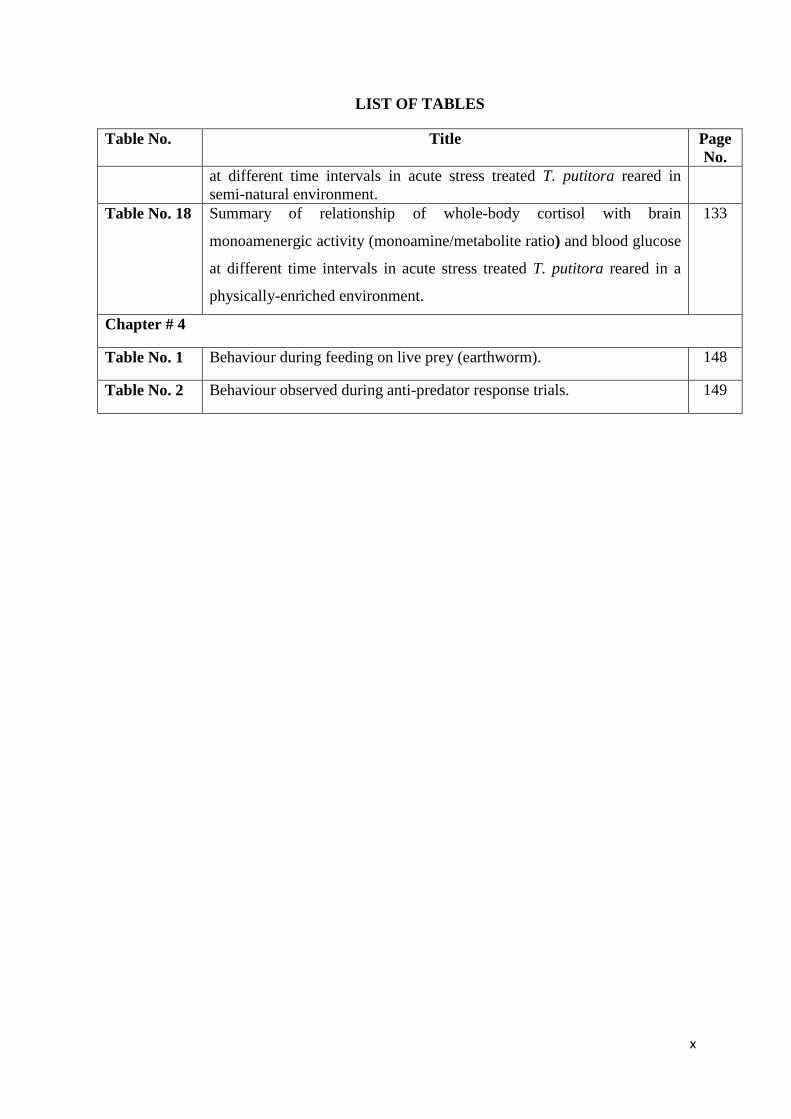
at different time intervals in acute stress treated T. putitora reared in
semi-natural environment.
Table No. 18 Summary of relationship of whole-body cortisol with brain
monoamenergic activity (monoamine/metabolite ratio) and blood glucose
at different time intervals in acute stress treated T. putitora reared in a
physically-enriched environment.
133
Chapter # 4
Table No. 1 Behaviour during feeding on live prey (earthworm). 148
Table No. 2 Behaviour observed during anti-predator response trials. 149
xi
ACKNOWLEDGEMENTS
Praise is to Allah, Lord of the Worlds. The Most Beneficent, the Most Merciful, Who
is the entire source of knowledge and wisdom, endowed to mankind; Who gave me
courage and potential to pursue this goal Whom I believe that He never spoils any
effort of good deeds. Blessings of Allah be upon His Prophet Muhammad (PBUH)",
the city of knowledge and blessing for entire creature, who has guided his Ummah
to seek knowledge from Cradle to Grave, and enabled me to win the honour of life.
It is a matter of great pleasure to express my sincere regards to my honourable
supervisor Associate Prof. Dr. Amina Zuberi, Department of Animal Sciences for
affectionate supervision, inspiring attitude, masterly advice and encouragement.
Without her useful intellectual suggestions, it would have been impossible for me to
complete this tedious work. I would like to extend my thanks to Chairperson, Prof.
Dr. Sarwat Jahan, Department of Animal Sciences, for providing me all the privileges
during my research work.
I am indeed humbly grateful for, Dr. Muhammad Shahab, Dr. Muhammad Sajid
Nadeem, Dr. Ali Nawaz, Dr. Naeem Ali (Microbiology), Dr Muhammad Ismail
(IBGE), Dr. Tariq Mehmood (NCP), Dr Ejaz Hussain (State Dept), Ms. Humaira
Rehman (Reproductive physiology lab), Mr. Zulfiqar Ali (State Dept), Mr. Asif Ali
Shah (Mahseer Nursery Unit Hattian Attock) Mr. Muhammad Yasir (MNUHA), Dr.
Hizb Ullah (Reproductive physiology lab), Ms. Huma Fatima (parasitology lab) and
Yasir Sultan (Lab Assistant) for their ending cooperation, valuable suggestions,
most affectionate behaviour, inspiring and impetuous guidance and moral help for
the completion of this task. They profited me as per their experience and made a lot
possible for me.
I have special thanks to Prof Dr. Svante Wienberg and Dr. Per-Ove Thornqvist. I
am very proud of the work we did together! Special thanks to my coordinator Dr.
Amina and Dr. Svante, you cannot imagine how much your very good and nice
comments encouraged and motivated me in the final print of my thesis, thank you! I
also want to thank the staff at the Uppsala university, Laura Vossen, Cocco
Arianna, Axling Johanna and Mustafa Arshi for their kind, moral and peaceful
support during my research work period at Uppsala University, Sweden. I wish to
extend my greatest gratitude and thanks to Director Mr. Chaudhary Iftikhar,
xii
Deputy Director Mr. Zulfiqar Abdi and Maratib Ali Awan Rawal Fish Hatchery,
Islamabad.
I feel highly privileged to express my profound gratitude to my respected teachers Dr.
Afzal Bhatti, and Dr. Rehana Kausar for their devotion, creativity, affectionate
criticism and keen interest in my work. I wish to extend my greatest appreciation
gratitude and thanks to Imrana Amir, Naima Younus, Muhammad Ahmad and
Kareem Johr khan for his affectionate efforts, guidance, support, encouragement and
patience. They have been my continued support and source of inspiration throughout
my research work.
I must acknowledge my debt to my lab fellows Fawad Aziz, Fahim Ullah Khan,
Khurrum, Shakeel Ahmad, Sami Ullah Wazir, Zohaib Noor, Noor Ullah
Muhammad Nauman, Awal Sayed, Hussain, Mashooq Ali, Fareed Ahmad Jan,
Layaq Jan, Muhib Zaman and other lab fellows for their kind help and cooperation
during my research work. I am also thankful to them for their nice company and time
they provided me with beautiful memories that I will treasure throughout my life.
I am obliged to Naeem Masih, Iftikhar Kiyani and Sami Ullah for their help and
support and motivation during my research. I express my special thanks to my friends,
Ehsan Ullah Sadozai and Azmat Bangash who help with the start of my whole
journey. I cannot forget the fabulous company and robust attitude of my friends,
especially Mr. Munawer Hussain. No words can express my thanks to my loving
parents, my brothers and Sisters whom love, affection, prayers, care and support
helped me not only during my studies but throughout my life.
My Parents and Humaira Rehman (Mary) deserve special mention for their
incredible support and prayers. My special gratitude is due to them for providing me
a chance to prove and improve myself through all walks of life. I am honoured to
have them as my parents. A non-payable debt to my loving parents, Mary and their
wish motivated me in striving for higher education, they prayed for me, shared the
burden and made sure that I sailed through smoothly.
In the end, I am thankful to all those who helped me.
IMDAD ULLAH
xiii
GENERAL ABSTRACT
Release of hatchery reared fish in the natural environment is one of the most important
strategies to replenish the natural stock of endangered fish species mahseer (Tor
putitora). Most of the reintroduction projects are not providing the desired results, since
captive-reared fish may not possess the well-adapted behavioural skills and
physiological responses required for survival in the natural environment. Early rearing
environment affect the stress sensitivity and shaping the behaviour of fish, while
enrichment in the rearing environment, improve the behaviour and physiological
responses of fish by modulating HPI axis and dopaminergic and serotonergic systems.
Here an attempt has been made to investigate the impact of rearing environment on the
physiological stress response and behaviour of endangered fish Tor putitora. First, the
physiological status of wild caught and captive reared fish was compared by adopting
invasive and non-invasive methodology and measured the pre-stress and post stress
levels of plasma and water-borne cortisol, blood glucose, whole brain serotonergic
activity (5HIAA/5HT ratio), dopaminergic activity (DOPAC/DA and HVA /DA ratios)
and Norepinephrine (NE) levels. Life skill activities like exploratory, predatory and
anti-predatory behaviour of both populations under laboratory condition were also
studied. The captive reared mahseer displayed a typical stress response i.e., low
activation of HPI axis and brain monoamenergic (serotonergic and dopaminergic)
system and delay recovery period as compared to wild counterpart. Moreover, the wild
fish display significantly (p ˂ 0. 05) more exploratory, predatory and anti-predatory
behaviour in comparison to the captive reared fish. However, captive mahseer appeared
bolder. In the second part of the study, to test the impact of the enriched rearing
environment on hypothalamic–pituitary–interrenal (HPI) axis, brain monoamines
system and life skills of fish were devised three different rearing environments
(barren, semi-natural and physically enriched) that differed in their levels of complexity
and heterogeneity and reared mahseer 15 days old hatchlings up to advanced fry stage
in these environments. Similar non-invasive and invasive techniques as used for
comparison of wild caught and captive reared fish were followed for evaluation of pre
and post stress levels of whole-body and water borne cortisol, blood glucose and brain
monoamines as well as the behaviour of fry from three different rearing environments.
The pre-stress basal cortisol, blood glucose and brain monoamines serotonergic,
dopaminergic and central norepinephrine (NE) levels were higher in fry reared in barren
xiv
and semi-natural environment indicating the impact on rearing environment on the
stress sensitivity fish. Furthermore, exposure of acute physical stress induced increase
in whole-body cortisol, blood glucose, whole-brain serotonergic and dopaminergic
activity and Norepinephrine (NE) levels in all three different rearing groups up to 0.75
hr. Although, the peak levels of all stress parameters were observed at 0.75 hrs post
stress, but there was a significant difference in the increasing trend and magnitude of
cortisol, blood glucose and brain monoamines at peak levels among three rearing
groups of mahseer previously reared in different rearing environments. At 0.25 hrs,
rapid stress response was observed in semi-natural reared mahseer, compared with
barren and physically-enriched reared fish. After 0.75 hrs post stress, the levels of
cortisol, blood glucose, brain-monoamines (ratios of 5HIAA/5HT, DOPAC/DA and
HVA /DA) and NE in all rearing groups showed a steady decreasing trend and
recovered to its basal level after several hours of stress. The recovery time of whole-
body cortisol, blood glucose and whole-brain monoamines were significantly higher in
barren reared mahseer compared with the other two groups. Moreover, it was also
observed that the increased structural complexity during early life significantly affect
various behavioural characteristics of the fish. Exploratory, predatory and anti-
predatory behaviours were significantly (p ˂ 0.05) more pronounced in fry reared in
physically enriched and semi-natural environment than barren environment. The results
of the present study specify the role of rearing environment in shaping the stress
response and life skill activities of fish and suggest an improvement in the hatchery
rearing environment to reduce the physiological and behavioural variations among wild
and captive reared counterpart. We further illustrate that the increased structural
complexity, i.e., physical enrichment in the early rearing environment significantly
modulates various physiological stress coping mechanisms and life skill behaviour of
mahseer. These outcomes have important implications for a possible way of improving
the outcomes of restocking programs of endangered fish species by modifying
conventional hatchery-rearing environments.
Genral Introduction
Page 1
GENRAL INTRODUCTION
Mahseer (Tor putitora) national fish of Pakistan, is among the most important
freshwater fish species of the Indian sub-continent (Everard and Kataria, 2011; Gupta
et al., 2014; Bhatt and Pandit, 2016). It is a large cyprinid fish that is considered as
cultural icons of economic, recreational and conservation interest in many Asian
countries, including Pakistan and more importantly serve as a ‘freshwater flagship’.
The Himalayan or Golden mahseer (Tor putitora) is acclaimed as world famous,
outstanding game (hardest fighting fish) and food fish (Everard and Kataria, 2011;
Gupta et al., 2014) that provide unparalleled recreation to anglers from all over the
world (Gupta et al., 2014; Bhatt and Pandit, 2016). It is among the mega fishes’ of
the world (Bhatt et al., 2000; Stone, 2007), attains nearly 3 m length and over 54 kg
weight (Everard and Kataria., 2011; Nautiyal et al., 2008). As a food fish, it is highly
esteemed and fetches the highest market price in the Asian countries. In commercial
fisheries it occupies an important position for its good quality and high market value,
while for fishermen; mahseer is of considerable importance because of its large size.
Mahseer is endemic to Asia with a wide distribution spanning from
Afghanistan, Pakistan, India, Sri Lanka, Nepal, Bhutan, Myanmar, Thailand, China,
Laos, Cambodia, Vietnam, Indonesia and Malaysia (Menon, 1992; De Silva et al.,
2004; Mohindra et al., 2007; Nautiyal et al., 2008; IUCN, 2016). It is distributed in
foothills of Himalayan region and has a wide distribution in sub-continent (Talwar
and Jhingran, 1992; Bakawale and Kanhere, 2013). Earlier studies indicated the
presence of mahseer in most of the rivers of Pakistan (Mirza and Khan, 1994; Mirza
et al., 1994; Zafar et al., 2001), but recent studies reported that this population
reduced from most parts of the country (Shafi et al., 2016) and the only size able and
stable population that remains is in the Mahseer National Park (Poonch river), Azad
Jammu and Kashmir, Pakistan (Rafiq and Khan, 2012).
T. putitora is mostly rheophilic in nature, inhabiting hill streams having rocks /
stones substrate (Nautiyal, 2014). The foothill stretches of the Himalayan Rivers are
reported to be the stationary or feeding grounds of the golden mahseer. These habitats
have large volumes of water and the river bed is mostly covered with sand, silt and
small boulders (Bhatt et al., 2004). The physico-chemical nature of the feeding
Genral Introduction
Page 2
grounds is characterized by water temperature in the range of 14–22ºC and an alkaline
(pH>7). Dissolved oxygen in these habitats varies from 5.2 to 12.9 mgL-1
(Bhatt et al.,
2004). It mostly inhabits semi-cold natural running waters (Shrestha et al., 1990;
Talwar and Jhingran, 1992; Bhattand Pandit, 2016), while reservoirs with clear water,
rocky beds, submerged aquatic plants, filamentous algae, molluscs and insects
provide a suitable environment for its existence (Desai, 2003). Similarly, they are
also found in streams hardly above sea level and at an altitude of 2000 m above sea
level. The occurrence and distribution of mahseer are controlled by the prevailing
water temperature of the streams and not by the altitude (Jhingran and Sehgal,1978)
The food of T. putitora comprises insects, algae, macrophytes, rotifers, small
fish, crustaceans etc.(Desi, 2003; Bhatt and Pandit, 2016). Numerous studies have
indicated that the species feeding habits change with increasing size. At early stages
of its development, it is carnivorous (Froese and Pauly, 1999) and later on diverts to
omnivore when approaches to juvenile stage. Sometimes it becomes an opportunistic
feeder and also feeds on larvae, small mollusks and algal coating on rocks (Shrestha,
1997). Examination of guts of fry of T. putitora, for example, revealed diatoms as the
chief food item (Bhatt and Pandit, 2016), while in fingerlings and juveniles,
researchers have found 81.4 % insect material and 15.9 % plant material in their guts
and categorized this stage of fish as insectivorous (Nautiyal and Lal, 1984).The
anatomical adaptations of the alimentary canal system also confirm that mahseer are
omnivorous that feed on plants, insects, shrimp and mollusks (Talwar and Jhingran,
1992; Froese and Pauly, 1999; Desi, 2003; Bhatt and Pandit, 2016).
Mahseer is potamodromous (migrating within freshwaters), perform seasonal
migrations within a short distance mainly for feeding and breeding. The limit of such
migrations is determined by water temperature and floods. Mahseer prefer rocky
pools and cooler temperature, moving up and downstream, depending upon the flood
conditions (Nautiyal, 1994). Johnsingh et al. (2006) suggested that the mahseer moves
upstream in search of suitable spawning grounds, while turbid waters and higher
water temperature are considered to be the stimuli for migration for breeding in the
rain-fed hill streams (Nautiyal, 1994; Bhatt et al., 2004). Hence, migratory habit of
mahseer is attributed to the changes in water temperature and to seek more congenial

Genral Introduction
Page 3
surroundings during the monsoon (Shrestha, 2002; Bhatt et al. 2004; Johnsingh et al.,
2006; Nautiyal, 1994)
Generally, the spawning grounds of the fish are characterized by river beds
with large boulders, pebbles and gravel with water temperature varying from 11 to
30.5˚ C, alkaline pH and dissolved oxygen concentration in the range of 6.4–11 mg L-
1 (Bhatt et al., 2004; Joshi, 1994). In Pakistan the natural spawning areas of this
species are River Korang near Islamabad, Pakistan (Zafar et al., 2001), mahseer
National park (River Poonch) Azad Jammu and Kashmir and allied rainy streams,
River Swat and Kalpani River, Mardan (Khyber Pakhtunkhwa), Harro River Attock
and River Indus. Previous reports suggested that the species spawns twice in a year,
during April–May and July–October (Malik, 2011). In Pakistan, the spawning season
of mahseer ranges from early March to mid May and August - October in captivity
(personal observations). However, Hussain and Mazid (2001) reported that in
Bangladesh, the species spawn during early November to late January. Absolute
fecundity of T. Putitora is very low i.e., between 8000 and 12,000 eggs/kg body
weight of female (Mahata et al., 1995; Hussain and Hossain, 1999), compare to other
carp species.
Globally, one third of all freshwater fishes, including mahseer are threatened
with extinction (Dudgeon, 2012 ; Gray, 2013). Various factors, including habitat loss,
overexploitation and biological invasions are contributing significantly in destruction
of various species (Dudgeon, 2012; Gozlan et al., 2005). Like other threaten species,
many mahseer (Tor putitora) populations have experienced severe declines across
their natural range because of anthropogenic disturbances, including damming on
rivers, deforestation, pollution, and overexploitation (Lakra et al., 2010; Nautiyal,
2011, 2014; Pandit and Grumbine, 2012; Khajuria et al., 2013; Gupta et al., 2014,
2015; Sharma et al., 2015). Many current literatures have reported that this fish is
extremely vulnerable and threatened in the most part of the Asia and Trans-
Himalayan region of sub-continents.
Over the last two decades, initiation of hydropower projects to meet the
energy requirement of growing population in Himalayan region resulting change in
landscape and habitat destruction (Grumbine and Pandit, 2013; Pandit et al., 2014).
Genral Introduction
Page 4
Construction of multiple dams on the Himalayan rivers cause changes in the quantity,
quality and regime of water flow in the downstream sections of rivers that results in
habitat fragmentation of migratory species, habitat degradation, submergence of large
terrestrial and river bed areas (Everard and Kataria, 2011; Gupta et al., 2015;
Quinones et al., 2015). The major anticipated impacts of dams on the Himalayan
rivers are decreased water flow, rise in channel water temperature, diurnal flow
variation, low turbidity of downstream waters as well as the interruption in the
longitudinal connectivity (Bunn and Arthington, 2002). All these factors are
responsible to hinder fish migration that is required for reproduction and increase
mortality by higher predator attacks (Abrahams and Kattenfeld, 1997; Bunn and
Arthington, 2002; Bhatt et al., 2000). Beside these, many other factors like destruction
of breeding grounds, indiscriminate fishing of broodstock and juveniles, wanton
(illegal) killing of juveniles and brood fishes through poisoning or dynamiting (khan
and Sinha, 2000), use of small mesh nets, explosive, plant-derived toxins, poisons and
electro fishing by poachers, industrial and human pollution etc are also contributing
in declining the population of the T. putitora in Himalayan region. Moreover, life
history traits migratory behavior, low fecundity (William et al., 2005) and delayed
sexual maturity (Nautiyal and Singh, 1989) also combined with numerous external
threats for declining its population (William et al., 2005). Obstruction in migratory
route due to construction of dams cause gathering of migratory fish in particular area
and make them vulnerable to predators and exploitation by humans (Ogale, 2002).
Depletion of mahseer populations has been reported from various parts of
India (Desai, 1994; Laskar et al., 2013; Gupta et al., 2014; Bhatt and Pandit, 2015),
Pakistan (Mirza, 1994; Mirza et al., 1994; Yaqoob, 2002), Nepal (Shrestha, 2002),
Turkey (Balik, 1995), Papua New Guinea (Coates, 1991) and Bangladesh (Hussain
and Mazid, 2001). According to the red list of IUCN, mahseer is identified as a
critically endangered species (IUCN, 2015, 2016), had been declined about 50 % in
the past and may decline more by about 80 % in future, specially because of the
regulation of the rivers it inhabits (Sharma et al., 2015; IUCN, 2016). Conservation of
economically important and endangered T. puitora is therefore, a serious challenge
and its alarming natural population reflecting the need of serious efforts for its
rehabilitation and conservation. Many scientists have suggested special attention for
the protection of mahseer from extinction (Yaqoob, 2002; Nautiyal et al., 2008;
Genral Introduction
Page 5
Everard and Kataria, 2011; Naeem et al., 2011; Arora and Julka, 2013; Sati et al.,
2013; Khajuria et al., 2013; Laskar et al., 2013; Gupta et al., 2014; Ali et al., 2014;
Bhatt and Pandit, 2015).
Realizing ecological and economic importance of mahseer, particularly in the
Himalayan regions, several attempts have been made to propagate and rehabilitate
the species in rivers and lakes by initiating artificial breeding and restocking programs
(Pandey et al., 1998). However, the outputs of restocking programs are not
encouraging and the natural populations of mahseer are still showing continuous
decline. Like other countries, Pakistan has also taken step for the conservation of this
species and established hatcheries in different provinces (Punjab and Khyber
Pakhtunkhwa) and initiated the artificial propagation program. Moreover, for
replenishment of natural stock, restocking program was also initiated that involve the
release of artificially propagated hatchery reared fish in natural bodies (rivers,
streams, lakes ). However, in spite of all efforts, the results are also not encouraging
and captures of this species from natural reservoirs are continuously declining
(Personal observation and communication with Punjab Fisheries). It seems that
hatchery reared fish in the natural environment underwent mortality may be due to
behavior deficiencies or atypical physiological responses. It appears that for the
conservation and rehabilitation of this species, development of a suitable technology
in contrast to conventional methodology for breeding, rearing and nursing of fry and
fingerlings is required (Islam, 2002; Rahman, 2003).
Restocking programs has been commonly used in attempts to counter the
effects of over-fishing, environmental degradation and recruitment failures. However,
restocking and conservation programs are controversial with respect to hatchery
reared populations as well as to the ability of fish to maintain successfully in their
natural population (Olla et al., 1998; Salvanes, 2001; Myers et al., 2004). Generally
releasing programs rely upon the assumption that captive-bred or translocated animals
can rapidly adjust to a wide diversity of novel challenges upon release. However,
many captive breeding programs fail to raise individuals with natural behaviour, thus
showing high mortalities upon release (Araki et al., 2008). Recent experiments on fish
show that the lack of stimulus variation in captive rearing conditions influence the
Genral Introduction
Page 6
phenotype at many different levels, ranging from physiology, neurology to behaviour
(Olla et al., 1998; Huntingford, 2004; Brännäs and Johnsson, 2008).
The current failure of stock enhancement projects might be related to
inadequate rearing environment at hatcheries (Leber, 2013; Lee and Berejikian,
2008), which often generated fish unable to survive in the wild (Lorenzen et al., 2010;
Salvanes and Braithwaite, 2006). Standard hatchery conditions typically consist of
plain impoverished environments, often designed to sustain good physical health.
Nevertheless, such structure-less/featureless environments can severely restrict the
natural behavioural and physiology of animals, and may further compromise with
welfare of fish (Brännäs and Johnsson, 2008; Huntingford, 2004).It has been
previously observed that upon release hatchery-reared fish have lower survival rates
and provide lower returns to anglers than wild fish (Ebner and Thiem, 2007; Daniels
and Watanabe, 2010; El Balaa and Blouin-Demers, 2011). Poor survival greatly
reduces the efficiency of hatchery stocks to supplement wild population (Maynard et
al., 1995; Olla et al., 1998). It is reported that in most instances mortality is highest
during and immediately after release into the wild (Heggberget et al., 1992; Olla et al.,
1998). Hatchery selection favors fish that are well adapted to captivity, but
maladapted to the wild (Christie et al., 2012), leading to differences in behavior,
physiology and survival between wild and hatchery stocks.
Captive animals exist in a very different dynamic environment as compare to
natural one in term of resource availability, rearing densities and dangers involved
(Boersma et al., 2008; Epp and Gabor, 2008; Brockmark et al., 2010), and encounter
experiences different from their free-living counterparts (Price, 1999; Huntingford,
2004). In captivity, animals are protected from predation, competition and disease
causing organisms. Animals are habituated to captive environments due to human
intervenes, limited spaces, constant availability of food and water and protection
from predators (Price, 1999). Extending such a life style to several generations as
well as intentional or intentional selection, allow individuals genetically predisposed
to suit these conditions (Price, 1999), like aggression to compete for food, or poor
predation-avoidance abilities (Stunz and Minello, 2001; Huntingford, 2004). Captive
conditions, as well as the lack of life training experiences present in the wild, often
produce individuals unfit for wild environments (McPhee, 2003; Mathews et al.,
Genral Introduction
Page 7
2005; Jule et al., 2008). Hatchery reared fish upon release into wild feel difficulty to
capture live prey (McNeil, 1991; Olla et al., 1998) in high predation pressure and high
mortality may be due to maladaptive behavior and physiology (Huntingford, 2004;
Fuiman et al., 2010; Brown et al., 2016).
Hatchery reared fish in semi intensive and intensive aquaculture facilities face
several potential environmental, social, and husbandry stressors, including limited
space, high density, and aggressive interaction with conspecifics, handling and
confinement stress. To cope such situations, fish harmonize physiological and
behavioural responses and release major stress hormones like corticosteroids and
catecholamines (Schreck, 2000; Barton, 2002; Pankhurst, 2011; Wendelaar Bonga,
1997). Cortisol, is the frequently use indicator of acute and long-term stress in fish
that is released by the hypothalamic–pituitary–interrenal axis (HPI-axis) (Barton,
2002; Martinez-Porchas et al., 2009). The elevated level of cortisol can lead to
energetic costs (Leal et al., 2011), modulate metabolic process by effecting energy-
demanding processes, like growth (Bernier et al., 2003), reproductive process
(Fitzpatrick et al., 2012; Schreck, 2010), immune function (Tort, 2011) and
neurogenesis (Sorensen et al., 2011). The stress responses of captive bred fish could
be effected by adaptation of animals to domestic environment or though intentional
and unintentional artificial selection at the time of breeding.
Wild fish may respond differently to stressors because of genetic or
environmental differences (Clements and Hicks, 2002), e.g. domesticated fish
generally show increase body weight , higher growth and reproduction rates compare
with their wild counterparts (Wright et al., 2006). In birds and mammals,
domestication lead to lower reactivity of the stress axes (Künzl et al., 2003; Ericsson
et 2014; Fallahsharoudi et al., 2015). Similar variation can be seen in wild and
domestic strains of brown trout (Salmo trutta) (Lepage et al., 2000), rainbow trout
(Oncorhynchus mykiss) (Jentoft et al., 2005), fighting fish (Betta splendens) (Verbeek
et al., 2008), and rainbowfish (Melanoteania duboulayi) (Zuberi et al., 2011).
Fish either in captivity or in natural environment, faces wide range of stressors
around the clock (Galhardo and Oliveira, 2009) and show physiological and
behavioural responses. The physiological stress response are very well studied in
Genral Introduction
Page 8
many teleosts (Barton and Iwama, 1991; Wendelaar Bonga, 1997; Barton, 2002; Ellis
et al., 2004; Zuberi et al., 2011) and appears as biphasic with an initial short latency
elevation of plasma catecholamines from chromaffin tissue of kidney, followed by
prolonged elevation in plasma cortisol levels from interrenal tissue (Wendelaar
Bonga, 1997; Pankhurst, 2011). Like other vertebrates, corticosteroid hormones
concentration in blood is a major index of stress in fish, and activation of the
hypothalamus-pituitary-interrenal (HPI) axis is responsible for increase their
concentration (Tsalafouta et al., 2014; Pijanowski., 2014).
Under stress, the preoptic area of the brains of many fish species like carp
Cyprinus carpio (Flik et al., 2006), masou salmon O. masou (Westring et al., 2008),
rainbow trout Oncorhynchus mykiss (Craig et al., 2005; Bernier and Craig, 2005;
Doyon et al., 2006) showed improve expression and synthesis of corticotropin
releasing factor (CRF), which in turn regulated by cortisol via negative feedback
mechanism (Bernier et al., 1999; Doyon et al., 2006). It is suggested that
corticosteroids in fish usually exert their actions through classical genomic and non-
genomic action (Borski et al., 2001). CRF stimulate the release of ACTH, α-
melanocyte stimulating hormone (α-MSH) and β-endorphin by of stimulating the
synthesis and cleavage of pro-opiomelanocortin, precursor of these hormones
(Sumpter, 1997). CRF besides stimulating the release of ACTH also has
neuromodulatory and behavioural effects. Generally, it stimulates the locomotory
activity (Clements et al., 2002; Lowry and Moore, 2006), and suppress the appetite
and feeding behaviour in a range of species (Bernier and Peter, 2001; Bernier and
Craig, 2005; Bernier, 2006).
The time course production of cortisol in response to stress is variable among
species but variation in response latency (time to identify significant increase) is, in
minutes rather than hours, e.g. response times of striped bass (Morone saxatilis) was
as short as 2.5 min (Tamasso et al., 1996) while in the sea raven (Hemitripterus
americanus) as long as 120 mins (Vijayan and Moon, 1994). It is reported that
response latencies are independent of temperature but related to the lifestyle of
species. Most active species showed quick post-stress increases in cortisol as
compared to sedentary species (Vijayan and Moon, 1994; Wright et al., 2007).
Genral Introduction
Page 9
Magnitude of the corticosteroid response also shows considerable variability
among species and appear as individual characteristic which is stable over time, with
a moderate to high degree of heritability (Pottinger et al., 1994; Fevolden et al., 1999).
Generally, the peak values lie between 30-300 ng mL-1
but within species variation
obseve according to severity of stressor and the duration of exposure (Barton, 2002).
In contrast to attain peak cortisol level , the return of plasma cortisol to basal value
(recovery from stress) taker lomger time and occur in hours rather than minutes.
Although quick falls in plasma cortisol may reveal recovery but reflect the
desensitisation of the HPI axis because of continued exposure to stressors (Cyr and
Romero, 2009). The recovery from acute stress may be as short as 2-6 hr (Robertson
et al., 1988; Young and Cech, 1993) or as long as 24-48 hr (Vijayan and Moon, 1994;
Barnett and Pankhurst, 1998).
In addition to cortisol, glucose and lactate levels also increase under stress.
Generally, in initial stage catecholamine-mediated glycogenolysis is responsible for
the increase in plasma glucose but at later stages, elevation is due to cortisol-mediated
gluconeogenesis (reviewed in Begg and Pankhurst, 2004; Mommen et al., 1999).
Rises in plasma glucose vary in different fish species and depend on the capacity to
store glycogen in lever (Pottinger et al., 2002; Wright et al., 2007). Moreover, after
acute stress, plasma glucose profile (to attain peak level and return back to basal
level) show variability with cortisol profile (Pottinger, 1998; Flodmark et al., 2002).
In addition to HPI axis, brain monoaminergic systems (dopaminergic and
serotonergic systems) also regulating the stress rsponses, independently or by
regulating the HPI axis (Chaouloff, 1993; Winberg and Nilsson, 1993). In vertebrates
including fish, common control mechanisms in the brain regulate the behavioral and
physiological stress responses while monoamine neurotransmitters serotonin (5-
hydroxytryptamine, 5-HT), dopamine (DA), and norepinephrine (NE) are
synchronizing the action (Winberg and Nilsson, 1993; Winberg et al., 2001; Øverli et
al., 1999; Höglund et al., 2002; Lepage et al., 2003; Clements et al., 2003; Larson et
al., 2003; Perreault et al., 2003). In fish like other vertebrates brain serotonergic
activity indicated by 5-hydroxyindoleacetic acid (5-HIAA, the major serotonin
metabolite) 5-HIAA to serotonin (5-hydroxytryptamine, 5-HT) ratio increase quickly
under stress (Winberg and Nilsson, 1993). Similarly, acute stress also show a rapid
Genral Introduction
Page 10
activation of brain dopaminergic (DA) and norepinephric systems in rainbow trout
(Øverli et al., 1999).
Several studies observed plasma cortisol concentrations correlation with the
brain 5-HIAA/5-HT ratios and, suggesting the involvement of brain 5-HT, in the
regulation HPI axis (Winberg and Lepage, 1998; Øverli et al., 1999; Höglund et al.,
2000). It is believed that 5-HT stimulate the hypothalamic–pituitary–adrenal (HPA)
axis in mammals (Heisler et al., 2007), as well as the hypothalamic–pituitary–
interrenal axis (HPI axis) in fish (Winberg et al., 1997; Øverli et al., 2000; Höglund et
al., 2000). However, the involvement of central DA in the regulation of the HPA axis
are still controversial and in mammals, central DA has been suggested to act
stimulatory, inhibitory or no role in the regulation of the HPA axis ( Brambilla et al.,
2000; Sullivan and Dufresne, 2006 ).Winberg et al. (1997) observed dose dependent
elevated plasma cortisol after treatment of rainbow trout (Oncorhynchus mykiss) with
a potent 5-HT1A receptor agonist, 8-hydroxy-2-(di-n-propylamino)-tetralin (8-OH-
DPAT). It is documented that 5-HT precursors or 5-HT receptor agonists elevates
plasma glucocorticoid levels in mammals, while inhabitors show opposite effects
(reduce the levels) (Winberg et al., 1997; Dinan, 1996).
Noradrenaline also play role in triggering the release of CRF, leading to the
activation of the HPA axis in mammals (Dunn et al., 2004). Fish brain monoamine
activation related to social interactions, especially social status and aggressive
behaviour (Summers et al., 2005; Blanchard et al., 2001; Johnsson et al., 2006). For
instance increase serotonergic activity in rainbow trout Oncorhynchus mykiss was
observed at higher stocking density (Laursen et al., 2013), while increase
dopaminergic activity in white seabream (Diplodus sargus) (Papoutsoglou et al.,
2006) was associated with high social stress.
Early rearing environments and experiences play significant role to shape an
animal behaviour (Huntingford, 2004; Liedtke et al., 2015). Like many other
vertebrates including old field mice (McPhee, 2003) and mussels (Hoftyzer et al.,
2008), captive environments promote domesticated behavior in wild fish (Kohane et
al., 1988; Kelley et al., 2006; Lee and Berejikian, 2008) such as incorporate change
in predator recognition (Kelley and Magurran, 2003; Brown, 2003; de Azevedo and
Young, 2006), foraging, and reproductive behaviour (Kelley et al, 2006). In fish,
captive bred individuals seek less refuge (Kelley et al., 2006) show higher mortality
Genral Introduction
Page 11
due to predation (Jepsen et al., 2000; Kekäläinen et al., 2008) and low resistance to
disease than wild counterpart after release to the wild (Johnsen and Jensen, 1991).
Hatchery-reared animals may lack the necessary behavioral skills to forage
natural prey, exhibit deleterious morphologic characteristics (Purcell, 2002) or
display behaviors that increase their vulnerability to predators (Kellison et al., 2000;
Castro and Cobb, 2005). At hatchery, fish have intentionally and unintentionally been
selected for high growth rate, which lately has been connected to a shorter memory
duration, thus may simply forget fast what they have learned (Brown et al., 2011). In
semi-intensive and intensive culture systems, fish are typically grown in static,
featureless environments with unnaturally high densities. They are provided an excess
of pellet food, thus preventing them to learn how to capture natural live prey.
However, wild fish live in complex environments and learn by experience how to
capture and handle various live prey types (Sundström and Johnsson, 2001). Fish
reared for conservation purpose, behaviour adapted to natural environments are
critical for obtaining stocking effectiveness (Brown and Day, 2002; Salvanes and
Braithwaite, 2006). Hence, concern regarding the poor performance of hatchery
reared fish following release (Salvanes and Braithwaite, 2006; Le Vay et al., 2007),
greatly reducing the effectiveness of restocking program
Hatchery-reared animals may simply be ill-equipped for the transition from
hatchery conditions to the natural environment and suffer high rates of mortality
(Brown and Day, 2002; Huntingford, 2004; Bell et al., 2005; Le Vay et al., 2007).
Behavior can be among the first traits affected by domestication and differences in
behavior between hatchery reared and wild fish are well documented (Olla et al.,
1998; Alvarez and Nicieza, 2003; Lee and Berejikian, 2008). Domestication can
promote phenotypic traits that are different from their wild counterparts (Price, 1984;
Larson and Fuller, 2014).
Hatchery reared fish are physiologically and behaviorally deficient to cope the
challenges of natural environment, thus has led many questions about the validity of
stock enhancement from hatchery reared fish sources (Brown and Day, 2002;
Huntingford, 2004). Previous studies have demonstrated that behavioural deficiencies
or maladaptive behaviour of fish can be reduced by proper pre-release conditioning of
Genral Introduction
Page 12
hatchery-reared fish to a variety of stimuli (Griffin et al., 2000; Alvarez and Nicieza,
2003; Kelley and Magurran, 2003). Life-skills training, social learning protocols and
environmental enrichment (Brown and Day, 2002) can be adopted to enhance the
post-release survivorship of fish (Brown and Laland , 2001). It has been suggested by
studying several fish that enriched captive environments can promote behavioural
flexibility (Braithwaite and Salvanes, 2005), foraging abilities (Brown et al., 2003;
Strand et al., 2010; Rodewald et al., 2011) influence social interactions (Berejikian et
al., 2000; Salvanes and Braithwaite, 2005) and reduce anxiety (Maximino et al.,
2010). Standard laboratory housing conditions typically consist of plain impoverished
environments, often designed to standardize behaviour between different
experimental groups and maintain good physical health (Olssonand Dahlborn, 2002).
However, such environments can severely restrict the natural behavioural repertoire
of animals, and hence may compromise their welfare if the animal is highly motivated
to carry out particular behaviours (Dawkins, 1998).
Recently, environmental enrichment appears as a mitigating strategy,
increasingly used by hatchery managers to reduce stress and maximize psychological
and physiological well-being of captive animals by identifying and providing the
appropriate environmental stimuli (Shepherdson, 2002; Gerber et al., 2015). It is
generally accepted that structural enrichment and complexity in the rearing
environment, improve animal welfare and living performance in captivity
(Shepherdson, 2012; Young, 2013). Increased structural complexity in the rearing
environment resulted in improved growth (Batzina, 2014), survival (Coulibaly et al.,
2007) and foraging behaviour (Strand et al., 2010) in several hatchery reared fish
species. The conservation of endangered species programs, especially those which
produce individuals for the reintroduction into wild, can be benefited by
environmental enrichment by promoting the development of healthy, reproductively
successful, and behaviorally competent animals (Swaisgood et al., 2002).
Extensive literature is available on fish indicating that more complex rearing
environments promote the development of fish brains (Kishlinger and Nevitt, 2006;
Näslund et al., 2012), cognitive abilities (Brown et al., 2003; Kotrschal and Taborsky,
2010; Strand et al., 2010), behaviour (Braithwaite and Salvanes, 2005; Salvanes and
Braithwaite, 2005; Salvanes et al., 2007; Moberg et al., 2011; Roberts et al., 2011)
Genral Introduction
Page 13
and survival in the wild (Maynard et al., 1996). Social and physical enrichment
change the behaviour and physiology of fish and often consider beneficial for the
captive animals (Balcombe, 2005). It can be use to decrease fear and aggression
(Reinhardt, 2004) and improve physiological stress responses (Fox et al., 2006). For
example, female, group housed rats were less stressed than those housed in isolation
(Sharp et al., 2003). Previous behavioural observations (Baker, 1997; Swaisgood et
al., 2002) and measurement of glucocorticoid hormonal values (Belz et al., 2003)
have suggested that enriched environments can reduce adrenocortical activity in
captive animals.
Structural enrichment reduced the basal level of stress hormone cortisol
concentrations and improve the antipredator behaviour in hatchery-reared Atlantic
salmon (Näslund et al., 2013). There are several observations demonstrating the
positive effects of environmental enrichment on welfare and survival of many fish
species (see review Näslund and Johnsson, 2014). Compared with captive-held fish in
hatchery barren-reared environments with those provided some form of enrichment
have been found to have increased brain development and neurogenesis (von Krogh et
al., 2010; Näslund et al., 2012; Salvanes et al., 2013), reduced impact from stressors
(Braithwaite and Salvanes, 2005; Näslund et al., 2013; Batzina et al., 2014) and
improved post-release survival (Rodewald et al., 2011; D’Anna et al., 2012). It has
been reported that rainbow trout reared in pond with added structures during the last
month preceding smoltification enhanced physiology of smolt comparatively to fish
kept in barren raceways (Zydlewski et al., 2003). In an intensive captive rearing
environment fish from barren tanks had two fold higher basal levels of plasma
cortisol than fish from the enriched rearing environment (Näslund, 2013). Similarly,
an enrichment also effect the recovery time in rainbow trout exposed to the stressor
e.g. anaesthesia, handling, and other standard stressors. However, cortisol values
show less variation between individuals within the enriched groups (Pounder et al.,
2016). Besides cortisol, brain monoamines (5-HT, DA and NE) also modified in mice
and rates (Naka et al., 2002; Bernes et al., 2008) and in fish (Winberg and Nelson,
1993; Höglunds et al., 2005) by rearing them in enriched environment.
Brain serotonin and catecholamine systems becomes activated when fish
confront a stressful condition (Winberg and Nilsson, 1992; Papoutsoglou et al., 2006;
Genral Introduction
Page 14
Karakatsouli et al., 2007). Previously, several studies mainly on rats and mice, have
reported that housing in enriched environment is associated with increased brain
weight, neuronal density and cortical thickness, changes in hippocampal levels of
neurotrophins, neurogenesis, serotonin receptors expression and brain monoamine
neurotransmitter content (Mohammed et al., 2002; van Praag et al., 2000). Recently
reduced brain serotonergic (5HIAA/5HT) system activation as well as reduced DA
levels in specific brain areas has been reported (Brenes et al., 2008; McQuaid et al.,
2012) in rat and mice kept in enriched environment. It has also been reported that
environmental enrichment and structural complexity to the rearing environment
induced changes in the brain monoamines levels in gilthead seabream (Sparus aurata)
(Batzina, 2014). Although, brain monoamines have been shown to be modified in
mice and rats reared in enriched environments (Naka et al., 2002; Brenes et al., 2008),
but limited literature is available for fish (Höglund et al., 2005).
Realizing the impact of rearing environment on the physiology and life skill
activities of different fish species, we assumed that poor post release survivorship of
mahseer Tor putitora in restocking programs may also be related to the distinct
rearing environments at hatcheries that will generate differences in HPI-Axis and
many aspects of behavioural skills of mahseer (e.g. anti-predatory, exploratory and
foraging behaviour etc.). We hypothesized that by providing hatchery reared mahseer
with an enriched environment during early life stages should lower stress response,
improve recovery time period from acute stressor and life skill activities (foraging,
exploratory, predatory and anti-predatory behaviors). Therefore, we designed study
with the aim 1) to evaluate the physiological stress response and behavior of wild
caught and hatchery reared mahseer and 2) to modulate the stress response and
behavior of fish by manipulation of rearing environment. The physiological stress
response of both populations (wild caught and hatchery reared) was evaluated through
invasive and non invasive methodology by, examining plasma and water borne
cotisol, plasma glucose, monoaminergic activity i.e., 5-HIAA/5-HT, DOPAC/DA,
HVA/DA ratios and NE level at different time intervals after exposure to acute stress
(5 min chasing and 2 min confinement with hand net). The basal levels and recovery
period i.e. return back to basal levels were also studied for defining difference
between populations. Furthermore, experiments under laboratory conditions were
designed to evaluate the anti-predatory, exploratory and foraging behaviour of both
Genral Introduction
Page 15
wild caught and hatchery reared populations. To test the impact of enrichment on
physiology and behavior of fish, we devised three different rearing environments
(barren, semi-natural and physically enriched) that differ in their levels of complexity
and heterogeneity and reared mahseer hatchlings up to advanced fry stage in these
three different rearing environments. The physiological stress response and behavior
of these three rearing groups were also evaluated by adopting the methodology as
used for evaluating the difference between wild caught and captive reared mahseer.
Chapter No. 1
Page 16
Chapter# 1
Physiological Stress Response of Captive-reared and Wild-caught Mahseer (Tor
putitora)
Chapter No. 1
Page 17
ABSTRACT
The altered developmental patterns of hatchery-reared fish suggests that there may be
important physiological changes occur that differentiate it from their wild
counterpart to cope the life challenges after release into the wild. Differences in the
physiological stress response of captive and wild caught individuals have been
observed recurrently. Here an attempt has been made to evaluate the physiological
stress response of captive-reared and wild-caught endangered fish mahseer (Tor
putitora) by adopting invasive and non-invasive methods. Before examining the
stress response, basal/pre-stress levels of plasma and water-borne cortisol, blood
glucose and brain monoamines were noted. Both populations were exposed to short
term acute physical stress, i.e. 5 min chasing and 2 min confinement with a hand net
and blood, water and brain sample were collected at 0, 0.25, 0.5, 0.75, 2, 4, 6, 8, 24,
48 hrs. The physiological stress response of mahseer showed the activation of
hypothalamic–pituitary–interrenal (HPI) axis, serotonergic and dopaminergic systems
indicated by several fold elevation of plasma and water-borne cortisol, plasma
glucose 5HIAA/5-HT, DOPAC/DA and HVA/DA ratios and NE in both
populations after being acute stress (chasing and confinement). Although both
populations attained peak levels of all stress parameters except water borne cortisol
at the same time period, i.e. at 0.75 hr after stress but showed significant difference
(P<0.05) in magnitude (concentration) of cortisol, brain 5HIAA/5-HT, DOPAC/DA,
HVA/DA ratio and NE. However, water borne cortisol in both populations after
being acute stress peak at different time periods, as in wild-caught fish rise to
56.23±3.84ngL-1
, 2 hrs post stress in contrast to captive reared mahseer with peak,
46.48±3.32 ngL-1
at 4 hr after stress. By close examining the results, it appears that
wild fish showed typical stress response, i.e. rapid and strong activation of of
hypothalamic–pituitary–interrenal (HPI) axis, serotonergic and dopaminergic system
and rapid recovery (return back to basal levels) as compared to captive reared
counterpart which showed low level of stress hormones and had taken comparatively
longer time to attain their basal levels back. These results specify the role of natural
rearing environment in shaping the stress response of fish and suggest an
improvement in the hatchery rearing environment to reduce the physiological
variations and increase the post survivorship of captive reared mahseer.
Chapter No. 1
Page 18
1. Introduction
Captive animals are the wild animals being kept and bred in captivity. Fish are
artificially bred and reared for human consumption, restocking in natural water bodies
and for conservation of critically endangered species (Simpson and Jackson, 1996;
Lintermans and Ebner, 2006). However, fish from open waters are considered as a
“wild animals” (Clarkson, 2003). Wild animals undergo interactive and physiological
changes with respect to the environment (Price, 1999; 2002) while life in captivity
leads to adaptations according to the artificial environment. Captivity may result in
genetically and phenotypically different fish than wild populations because of genetic
selection for particular traits or due to the effect of the environment on the phenotype
(Berejikian et al., 1999). Therefore, the process of rearing in captivity leads to change
the behaviour, physiology and phenotype in comparison with their wild progenitors
(Brown and Laland, 2001; Brown and Day, 2002; Zuberi et al., 2011). The reduced
genetic vigour, altered immune response and behaviour deficiency appeared as major
obstacles in the survival of hatchery reared population in wild (Doyle et al., 2001;
Huntingford, 2004; Mathews et al., 2005; Jule et al., 2008).
Domestication and captive rearing of fish for replenishment of natural stock,
for conservation of endangered species as well as for aquaculture have increased
rapidly worldwide (Boyes, 2016; Jiang, 2010). Domestic animals, including fish are
well adapted to artificial environments, arbitrated by planned or inadvertent selective
breeding over several generations (Price,1984). In the course of domestication,
animals can acquire phenotypic traits differ from their wild ancestors (Price, 1984).
Domesticated animals generally show increase body weight, higher growth and
reproduction rates compared with their wild counterparts (e.g. birds: Jensen and
Andersson, 2005; fishes: Johnsson et al., 1996; Fleming and Einum, 1997; Wright et
al., 2006). In birds and mammals, domestication has led to decrease reactivity of the
stress axes (Künzl et al., 2003; Ericsson et al., 2014; Fallahsharoudi et al., 2015).
Similar changes have also been reported in domestic and wild strains of brown trout,
Salmo trutta (Lepage et al., 2001), rainbow trout O. mykiss (Jentoft et al., 2005),
fighting fish Betta splendens (Verbeek et al., 2008) and rainbowfish Melanoteania
duboulayi (Zuberi et al., 2011).

Chapter No. 1
Page 19
Fish reared under hatchery conditions are subjected to several environmental,
social, and husbandry related stimuli that may have potentially noxious or stressful
effects. The stress response has been described for numerous fish species (Schreck,
2000; Barton, 2002; Zuberi et al., 2011). Under hatchery condition fish are exposed to
acute stress occurs during counting, grading or harvesting while chronic stress,
occurs when fish are reared at too high densities, in poor quality water ( level DO,
high ammonia, high suspended solids, etc.), or when fish are confined, transported,
sick or exposed to social interactions between individuals (Berejikian et al., 2000;
Salvanes and Braithwaite, 2005; Strand et al., 2010). Chronic stressors are more
potent to jeopardize animal health and welfare. Fish under intensive culture conditions
are exposed to a regime of acute and chronic stressors, which have adverse effects on
growth, reproduction, immune system, flesh quality, feeding behaviour, etc. (Barton
and Iwama, 1991; Lowe et al., 1993; Pickering, 1993; Balm, 1997; Pankhurst and Van
der Kraak, 1997; Sigholt et al., 1997; Schreck et al., 2001). Fish populations bred in
captivity and adapted to the domestic environment by plane or accidental selection
could affect the stress responses. Wild fish may respond differently to stressors
because of genetic or environmental differences. (Clements and Hicks, 2002).
A wide range of stimuli challenges a fish around the clock, whether in
captivity or in the wild (Galhardo and Oliveira, 2009). The physiological and
behavioural responses to stress are very well studied in many teleost species, having
striking similarities to those of other vertebrates (Barton, 1997; Sumpter, 1997;
Barton, 2002; Lee and Berejikian, 2008). It is well known that physiological stress
response in fish is biphasic with an initial short time increase in plasma
catecholamines from the stores of chromaffin tissue of the kidney, followed by a
longer latency i.e., prolonged activation of HPI-Axis and de novo synthesis as well
as the release of cortisol (Sumpter, 1997; Wendelaar Bonga, 1997; Pickering, 1998).
Although rapid physiological response is mostly arbitrated by cholinergic nerve fibres
innervating the chromaffin tissue; but involvement of, adrenocorticotrophic hormone
(ACTH), serotonin and non-cholinergic innervation of chromaffin tissue in
modulation of catecholamine release is also reported (see review Perry and Bernier,
1999)
Chapter No. 1
Page 20
The increase in plasma catecholamines levels in initial stress response causes
elevation of plasma glucose level because of catecholamine-mediated glycogenolysis
(Wendelaar Bonga, 1997) but later on cortisol-mediated gluconeogenesis is
responsible for maintaining increase level of glucose. Measurements of plasma
cortisol, lactate, and glucose are now in practice to determine the primary and
secondary stress response of fish (Clements and Hicks, 2002). Like in other
vertebrates, the blood concentration of corticosteroid hormones is a major index of
stress in fish, while elevated levels of corticosteroids indicate the activation of the
hypothalamus-pituitary-interrenal (HPI) axis (Wendelaar-Bonga, 1997; Höglund et
al., 2000; Winberg et al., 1997; Øverli et al., 2000). The main corticosteroid in
teleost fish is cortisol (Barton, 2002; Martinez-Porchas et al., 2009; Pankhurst, 2011),
and this steroid is used as a causal factor for the determination of the impact of
stress ( Barton and Iwama, 1991; Harris and Bird, 2000; Pankhurst and Van der
Kraak, 2000; Schreck et al., 2001; Consten et al., 2002; Bernier et al., 2004).
Physiological stress and behavioral responses in vertebrate, including fish, are
also linked to a large degree by common control mechanisms in the brain while
monoamine neurotransmitters: norepinephrine (NE), serotonin (5-hydroxytryptamine,
5-HT), dopamine (DA), play an important role in the co-ordination (Chaouloff, 1993;
Winberg and Nilsson, 1993; Gesto et al., 2013; Winberg et al., 2001; Larson et al.,
2003; Perreault et al., 2003; Lepage et al., 2005). Brain serotonergic and
dopaminergic system play a key role in the regulation of stress reactions (Winberg
and Nilsson, 1993; Bowman et al., 2002; Gesto et al., 2013; Winberg et al., 2001;
Larson et al., 2003; Perreault et al., 2003; Lepage et al., 2005), mediated by stressor
like predator exposure, isolation, handling, pollutant exposure or crowding
(Schjolden et al., 2006; Gesto et al., 2008; Gesto et al., 2009; Weber et al., 2012).
Number of teleost species as well as mammals showed increase level of brain 5-
hydroxyindoleacetic acid (5-HIAA; major 5-HT metabolite) and 5-HIAA/5-HT ratios
(Winberg et al.,1997; Øverli et al., 2001; Alanärä et al., 1998; Gesto et al., 2013;
Höglund et al., 2002; Lepage et al., 2005; Bowman et al., 2002) in response to
stressor like handling and predator exposure. It is previously reported that stressful
events affect synthesis of brain serotonin (5-hydroxytryptamine, 5- HT) and turnover
Chapter No. 1
Page 21
(Barton et al., 2008) as well as rapid activation of brain dopaminergic (DA) and
norepinephric systems (Øverli et al., 1999).
Brain sertonergic activity (5-HIAA/ 5-HT ratio) have been found to correlate
with plasma cortisol concentration, indicating the involvement of brain 5-HT in the
regulation of HPI axis (Winberg et al., 1997; Winberg and Lepage, 1998; Øverli et al.,
1999; Höglund et al., 2000; Guesto et al., 2013). It is believed that 5-HT stimulate the
hypothalamic–pituitary–adrenal (HPA) axis in mammals (Dinan,1996; Heisler et al.,
2007; Herman and Cullinan., 1997 ) as well as the hypothalamic–pituitary– interrenal
axis (HPI axis) in fish (Höglund et al., 2000; Winberg et al., 1997; Øverli et al.,
2000). However, the involvement of central DA in the regulation of the HPA axis is
still controversial and in mammals central DA has been suggested to act stimulatory,
inhibitory or no role in the regulation of the HPA axis (Brambilla et al., 2000;
Sullivan and Dufresne, 2006).
Mahseer is one of the most important semi-cold fresh water fish of Pakistan
and South Asian countries. It has great importance as a food, research model and in
sport fishing (Singh et al., 2009; Barat et al., 2016). However, its natural population
has experienced severe declines across their natural range because of the destruction
of feeding and spawning grounds, may be due to natural disasters (Rahman et al.,
2005) or anthropogenic disturbances, including damming of rivers, deforestation,
pollution, and overexploitation (Lakra et al., 2010; Nautiyal, 2014; Pandit and
Grumbine, 2012; Khajuria et al., 2013; Gupta et al., 2015; Sharma et al., 2015).
Current conservation status of the mahseer is vulnerable and endangered (Ameen et
al., 2000; IUCN, 2016). Conservation of endangered and economically important fish
is, therefore, a serious challenge. It is important to make serious efforts for the
conservation of this remarkable fish species. Many scientists have suggested that
special attention is necessary to protect mahseer from extinction (Everard and Kataria,
2011; Naeem et al., 2011; Arora and Julka, 2013; Khajuria et al., 2013, Gupta et al.,
2014; Ali et al., 2014; Hussain and Mazid, 2001; Islam, 2002; Yaqoob, 2002; Bhatt
and Pandit, 2016).Thus to maintain the natural population of mahseer as well as its
conservation and rehabilitation many restocking programs have been initiated but
results are still not encouraging and natural population is continually showing
declining trend. It may be due to poor post release survival of hatchery reared fish.
Chapter No. 1
Page 22
We hypothesized that distinct captive rearing environment may generate
physiological changes that differentiate hatchery reared mahseer from their wild
counterpart to cope the life challenges after release into the wild. The objective of the
present study was to evaluate the stress response in term of activation of HPI-axis and
brain serotonergic and dopaminergic system of both populations. We examined the
physiological stress response of wild caught and captive-reared mahseer population
that had been held in captivity for around 4 generations by adopting both invasive and
non invasive techniques. We assumed that the captive reared mahseer would show an
atypical stress response as compared to the wild population, which should exhibit
relatively rapid physiological stress responses followed by a quick recovery.
Chapter No. 1
Page 23
2. Materials and Methods
2.1. Fish collection from wild environment
Wild mahseer (mean ± SEM body mass and length 15.9 ± 1.37g; 11.2 ± 0.89
cm) was captured through drift gill net (size, 25m L× 4m W; mesh size, 2 cm) from
River Haro, Attock 33°46'8" N, 72°14'43" E in DMS (Degrees, Minutes, Seconds)
and transported alive (3 g/L) in oxygen filled plastic bags (36 cm L × 24 cm W; 25 L
water) to the Fisheries and Aquaculture Research Center, Department of Animal
Sciences, Faculty of Biological Sciences, Quaid-I-Azam University Islamabad,
Pakistan. Fish were initially housed in replicates of three (with a stocking density of
1.5 g/L: 35 fish/tank) in well aerated circular fibreglass tanks (volume, 500 L water)
containing 1cm deep gravel (black and white colour) substrate, river stones (5-6 cm
diameter) and artificial plastic plants (25 cm height: n = 10) for at least one week
before any further experimentation. Overhead fluorescent tubing was used to provide
light (12:12 light, dark) and water temperature was maintained at 22.5 °C. Water
quality in terms of total ammonia (< 0.20mg L-1
), pH (from 6.8 to 7.48) and dissolved
oxygen (>6.4mgL-1
) were found to be in the acceptable range for mahseer (Islam,
2002; Bhatt et al., 2004). During acclimation period, wild fish were weaned from live
food onto prepared pelleted feed (sinking pellets; Oryza Organics fish feed, size 2
mm; 45 % crude protein, 14 % fats, crude fiber 2 % and 10 % moisture. Fish were fed
4 % body weight twice daily (9:00 am and 5:00 pm).
2.2. Fish collection from captive environment
2.2.1 Conventional breeding and rearing of Mahseer
In Pakistan, artificial propagation of mahseer in captivity was started in 2001
at Mahseer Fish Hatchery Hattian, Attock, Punjab, Pakistan. Generally, at hatcheries,
fish brooders are prepared in the structureless concrete rectangular tank (50×50 feet)
on live plus prepared pelleted feed. Hand stripping is the method in practice for
obtaining eggs and sperms. Incubation of the fertilized egg are carried out in
fibreglass hatching tray (size, 1.5 ft W × 15 ft L) in a hatchery room under direct
water sprinkling. After hatching (70 to 100 hrs depending upon water temperature),
Chapter No. 1
Page 24
the hatchlings are shifted to barren circular concrete tank (7 ft diameter × 4 ft H)
under slow moving water. After semi-quiescent stage (egg yolk absorption), when fry
starts feeding exogenously, they are relocated to semi-earthen ponds (50 W × 100 L
ft), earthen bed with concrete walls, having natural food organisms (phytoplankton,
zooplankton, diatoms, some protozoa etc.) but without common aquatic weeds or
other substrate. They are raised up to fingerling stage on live feed, plus prepared feed
by adopting monoculture technique or in combination with other species like
common carp (Cypriuns carpio), rohu (Labeo rohia ) etc.
Breed of the fourth generation, captive mahseer (mean ± SEM body mass and
length 15.2 ±0.43g and 9.5 ± 0.63cm) were collected from the hatchery and
transported to the Fisheries and Aquaculture Research Center, Department of Animal
Sciences, Faculty of Biological Sciences, Quaid-I-Azam University Islamabad,
Pakistan. The fish were acclimated for at least 2 weeks in well-aerated circular
fibreglass tank (volume, 500 L water) with same stocking as used for wild fish, before
starting the experiments. The fish were maintained under a controlled photoperiod
(12:12 h day: night) and temperature (22.5 °C). Water quality parameters were
maintained at optimum level.
2.3. Experimental protocol for water-borne cortisol collection
2.3.1 Distribution of fish and stress assay procedure
The experiment was designed by adopting the procedure reported by Zuberi et
al.(2011) for monitoring the stress response of captive reared and wild rainbow fish
(Melanoteania duboulayi). Briefly, one week prior to stress assay, both wild (No.40;
Average body mass 15.9 ± 1.37g and body length 11.2 ± 0.89 cm) and captive reared
mahseer (No.49; Average body mass15.2±0.43g and length 9.5 ± 0.63cm) was re-
distributed in 12 similar size glass aquaria (60 cm L ×30 cm W× 30 cm H; 54 L
water) at a stocking density of 10.6± 0.03 gL-1
. Six glass aquaria were for wild and
the other six for captive reared mahseer. The size difference between wild and captive
reared fish was controlled by maintaining the stocking density of both populations
instead of the number of fish in aquaria. T. putitora is an endangered species, difficult
to collect and transport live from wild. Therefore, we compromised on size difference.
Chapter No. 1
Page 25
According to Bender et al. (2008) small variation in body size does not result in
considerable changes in metabolism and production of cortisol. The experiment was
conducted in replicate, with slight variation in number of fish in aquaria (7, 7, 7, 7, 6
and 6 for wild and 7, 7, 7, 7, 7 and 7 for captive reared mahseer). The six aquaria of
each group were split into half for control and other for test stress assay. All aquaria
were well equipped with aerator and water heater, to maintain a constant temperature
of 22.5˚C and had permanent volume marks for maintaining water volume .
Dechlorinated water to each aquarium was supplied through the main pipeline
from water tank set at the same temperature (22.5˚C) used in experimental aquaria.
The pipeline at the top of each aquarium had tap with regulator to control the rate of
flow of water. Outflow of water were maintained by connecting experimental
aquarium via Tygon® tubing and a regulator. During experiment, constant rate of
flow, i.e. 25.01± 1.29 ml min-1
was maintained. Fish were fed once daily at 09:00 am
with floating food (Oryza organics fish feed, pelleted; 55% crude protein, 12% lipid
fats, crude fiber 2% and 10% moisture). Every day uneaten food and faces were
removed by siphoning and about 20% water in each aquarium was also replaced by
the addition of fresh water from the water reserviour. During the experiment, the pH
was >7, DO was near saturation (>6.4 mg L-1
) ammonia was less than 0.20 ppm. The
experiment consists of two treatments; control, i.e. unstressed fish and treated i.e.,
exposed to acute stress. Treated groups were stressed by following standardized
handling stress protocol previously described by Guesto et al. (2013) for rainbow
trout with some modification, i.e., 5 min chasing and confining the fish to one corner
of the tank with hand net for 2 min.
2.3.2 Water sampling
Twenty four hr prior to the experiment, fish were not fed and on the day of
experiment, without disturbing fish, water from each aquarium was exchanged with
fresh water from main tank by controlling rate of flow. For obtaining basal level of
cortisol, before exposing stress, 500 ml water from each aquarium was collected in
glass bottle through long outflow Tygon® tube, without approaching too closely to
experimental aquaria. The rate of flow was recalibrated and further water samples
were collected by adopting same procedure at 0.5, 0.75, 1, 2, 4, 6, 8, 24 and 48hr
Chapter No. 1
Page 26
after acute stress (5 min chasing and 2 min confinement). To minimize the
possibility of any interference from background, water from the main water reservoir
was also collected for cortisol analysis. Throughout the experiment, the flow rate was
periodically checked by recording the time to fill the graduated beaker and adjusted
the inflow or outflow of water accordingly. Moreover, the volume marks on aquaria
also helped in maintaining the constant rate of flow. Immediately after sample
collection, water was filtered.
2.3.3 Extraction procedure of Water-borne Cortisol
Zuberi et al. (2011) procedure was used for extraction of water-borne cortisol.
Briefly water samples were immediately filtered by using Whatman filter paper No.
1(pore size ,11µm)and passed through a millipore filter (pore size , 0.45 µm) using
millipore filter assembly. LiChrolut® RP-18 solid phase extraction cartridges (3 ml,
500 mg, 40 - 63 µm, standard PP Merck) were used for extraction of free cortisol
from water samples. Cartridges were primed with 2 × 2 ml HPLC grade methanol
(CH3OH) followed by two consecutive washes with 2 ml double distilled H2O and
fitted to a 20-port vacuum manifold and filtered water samples (500 ml) were
pushed through Tygon® tubing into the columns. Once the entire water sample was
passed, the cartridges were washed twicewith 4 ml dd water and free cortisol was
eluted from the columns with ethyl acetate. The eluted solvent was evaporated at
45°C using a nitrogen gas stream and the residue was re-dissolved in 100ul of ELISA
buffer and stored frozen until assayed. The % age efficiency of extraction from water
sample was assessed by adding predicted concentrations of 10 and 20 and 50 ng mL-
1. standard cortisol to 500 ml water samples collected from main reservoir which
supplies water to experimental aquaria. Water samples were then passed through
extraction cartridges and cortisol was recovered by using ethyl acetate and the amount
was quantified by ELISA. The % recovery was found 90.1%, 95.96% and 96.45%
respectively. All values of water-borne cortisol were corrected accordingly.
2.4 Experimental protocols for blood glucose, plasma cortisol and monoamines
2. 4.1 Distribution of fish and stress assay procedure
Chapter No. 1
Page 27
In order to avoid unnecessary catching of endangered species from wild, the
same stock used for water-borne cortisol assay was used for further research work.
One week prior to experiment, 60 each wild (mean ± SEM body mass and length 15.9
± 1.37g; 11.2 ± 0.89 cm respectively) and captive reared ( mean ± SEM body mass
and length 14.2 ± 0.98g and 9.5 ± 0.63cm respectively) T. putitora were re-housed
(6 fish per aquarium; stocking density, 10 ± 0.05gL-1
) in 20 same size (Length: 120
cm L × 60 cm W× 60 cm H; 96 L water) 430 L volume experimental aquaria (10
aquaria per population, wild : captive reared) well equipped with aerators and heater
for constant temperature and almost similar DO level. The fish were kept under flow
through system in order to avoid any re-uptake of cortisol and constant rate of flow
100 ml min-1
was maintained by connecting each aquaria with Tygon® tube for
outflow of water while inflow was controlled through the regulator on tap at the top
of each aquarium. After distribution the fish were remained without any disturbance
under same laboratory condition (12:12 h, light: dark; temperature, 22.5 °C; DO, >
6.5 mgL-1
, total ammonia < 0.25 mgL-1
). After acclimatization, in order to obtain the
basal level of blood glucose, plasma level of cortisol and brain monoamines, fish in
one aquarium of each population were anaesthetized by adding MS-222 (50 mgL-1
)
by stopping the flow of water . Immediately, blood was drawn from the caudal vein
below the lateral line and behind the anal fin by using 1 ml heparinized syringe from
every fish of both population and dissected out the brain (within 3 min). The brain
was immediately deep frozen in liquid nitrogen and stored at -80°C for further
analysis of monoamines, while approximately 20 µl of the blood of every fish was
used for blood glucose level and reaming were centrifuged at 3000 rpm for 15 min
for the separation of plasma. The plasma samples were collected in a separate tube
and cortisol was extracted with ethyl acetate by adopting Backström et al. (2011)
protocol. Briefly, 3mL ethyl acetate was added in 300 µL plasma , vortex mixed for
5 min and centrifuged at 1000 rpm for 2 min. The organic layer decanted in a
appendourf tube and evaporated under a gentle stream of nitrogen gas at 45°C. The
residue was dissolved in buffer provided in the ELISA kit and stored at -20 ºC for
analysis of cortisol.
In order to find out the comparison of the stress response of wild and captive
reared T. putitora, fish in remaining aquaria were exposed to acute handling stress by
following the procedure previously adopted by Gesto et al. (2013) for rainbow trout
Chapter No. 1
Page 28
with some modification. Briefly, fish were chased 5 min with hand net (10cm×10 cm)
and confined to one corner of aquaria for 2 min. Fish samples for blood glucose,
plasma cortisol and brain monoamines of both populations were collected at 0.5, 0.75,
1, 2, 4, 6, 8, 24 and 48hr after acute stress by adopting the same technique some
modification in order to avoid excess use of Ms222. For sampling water level of
particular aquarium was lower to 5 L by quick adjustment of inflow and outflow of
water and th addition of MS222. Samples (n=6 per population per time period ) were
collected, by using aquarium assigned for a particular time period (1 aquaria/time
period/population).
2.5. Blood Glucose Level
The blood glucose level was analysed with the help of digital glucometer
(ACCU-CHEK®Softclix; blood glucose meter). A drop approximately 20 µl of fresh
blood was placed on the glucometer strip. The Glucometer showed the result on
screen in mg dL-1
.The unit of glucose converted from mg dL-1
to mmole L-1
by
dividing the value of glucose by 18.018.
2.6. Water-borne and plasma cortisol analysis
Free cortisol concentration from water and plasma was measured using a
commercial ELISA kit (Product # 402710, Neogen Corporation, Lexington, USA,
delivered by General Scientific Traders, Pakistan). All samples were run in duplicate.
On day of analysis , all reagents and samples were removed from the freezer and kept
at room temperature. Reagents were slightly shaken before using and 25μl of cortisol
standards and samples were pipetted out and poured in 96 wells of ELISA plate. After
that, 200 μl of cortisol enzyme conjugate was loaded into each well and allow them to
stand for 10 sec. The solution was incubated at room temperature for 60 min. After
incubation, liquid from all wells was removed and ELISA plate was washed first by
adding 300 μl of 1X solution in each well and afterword, with washing buffer three
times. The remaining water droplets were removed by tabbing the plate on absorbent
paper. After remaining water, 100 μ TMB substrate was pippeted in each well and
incubated at room temperature for 15 min. The enzyme reaction was terminated by
adding 50 μl stop solution 1M-HCl, in each well and subsequently the plate was read
Chapter No. 1
Page 29
in a plate reader at 450 nm (Microplate Reader; AMPPlots 496, AMEDA
Labordianosik). The percentage bound for each standard solution was used to
generate a logarithmic curve. This curve was used to calculate the concentrations of
plasma cortisol.
The ELISA kit used for analysis of cortisol in the samples was validated by
verifying that the slope of the curve obtained by serial dilutions of sample (0, 20, 40,
60 and 80 %) with ELISA buffer matched the curve created with kit standards (slopes,
Waterborne cortisol: slope = 0.918, r2 = 0.965, P = 0.95; plasma cortisol: slope =
0.942, r2 = 0.998, P = 0.96 indicating the positive linear relationship. The precision of
kit (intra-assay coefficient of variance) was calculated by comparing the results from
repeated assays and found 9.8 % for plasma body cortisol and 9.1 for water-borne
cortisol. The inter assay (reproducibility) coefficient of variation was calculated by
an analysis of three samples in two assays and comparing the results. It was found
9.3 and 12.5 % for water-borne and plasma cortisol respectively.
The efficiency of the cortisol extraction procedure used for water samples (%
recovery) was evaluated by adding an equal volume of 10, 20, 60 and 80 ng mL-1
standards, supplied with the EIA kit to water samples collected from main tank which
supplies dechlorinated water to experimental aquaria. Cortisol from water samples
were then extracted with ethyl acetate and measured using EIA as described above by
adopting same procedure. The cortisol was eluted from the column using 2× 3 mL
volumes of and cortisol level. The minimum observed recovery of the methodology
(extraction and ethyl acetate elution) was 94.4%.
The efficiency of cortisol extraction from plasma was evaluated by adding
standard cortisol supplied with EIA kit in charcoal stripped plasma at predicting
concentrations of, 20, 40 , 60 and 80 ng g-1
. Cortisol from stripped plasma was
extracted and quantified by adopting the same procedure as described for samples.
The % extraction efficiency was found greater than 97.1.
2.6. Monoamines assay procedure
This part of research work was conducted in Department of Neuroscience,
Biomedical centrum (BMC) Uppsala University, Uppsala Sweden, under the
Chapter No. 1
Page 30
supervision of Prof. Svante Winberg and Per-Ove Thörnqvist. The procedure
described by Thornqvist et al. (2015) was adopted for the analysis of whole brain
levels of monoamines, i.e., serotonin (5-hydroxytryptamine, 5-HT) and its metabolite:
5-hydroxyindoleacetic acid (5-HIAA), Dopamine (DA) and its metabolites: 3,4-
dihydroxyphenylacetic acid (DOPAC) and homovanilic acid (HVA) as well as
norepinephrine (NE). Briefly, said hormones were extracted by homogenizing the
whole brain samples in 4% (w/v) ice-cold perchloric acid containing 10 ng ml−1
3,4-
dihydroxybenzylamine (DHBA, the internal standard). Sonifier cell disruptor B-30
(Branson Ultrasonics, Danbury, CT, USA) was used for this purpose. The
homogenate was centrifuge at 21,000 × g for 10 min at 4°Cand supernatant was
collected for analyzing the amount of monoamines in the samples.
Analysis was done by using high performance liquid chromatography with
electrochemical detection (HPLC-EC). For monoamines analysis, a reverse phase
column (Reprosil-Pur C18-AQ 3 μm, 100×4 mm column, Dr Maisch HPLC GmbH,
Ammerbuch-Entringen, Germany) set at 40°C temperature with ESA 5200
Coulochem II EC detector (ESA, Bedford, MA, USA) having two electrodes at
reducing and oxidizing potentials of −40 and +320 mV, and a guarding electrode with
a potential of +450 mV was employed. The mobile phase for running samples consist
of 1.4 mmol L−1
sodium octyl sulphate, 75 mmol L−1
sodium phosphate and 10 μmol
L−1
EDTA in deionized water containing 7% acetonitrile with 3.1 pH , that was
adjustedby using phosphoric acid .Standard curve was prepared by running known
concentrations of standard solutions and samples were quantified with
them.Technique was standardised by using DHBA as the internal standard and
recoverywas corrected with the help of HPLC software Clarity™ (DataApex Ltd,
Prague, Czech Republic).
2.7. Statistical analysis
The results are expressed as mean ± SEM. All statistical analysis was carried
out by using lme4 (Bates et al., 2014) and easyanova (Arnhold, 2013) package of R
3.2.5 (R Development Core Team, 2016). Assumption of normality, homogeneity of
variances and additivity of the model were checked by Shapiro-Wilks, Levene'sand
Tukey1-dF Test respectively. The effects of rearing environment on blood glucose,
Chapter No. 1
Page 31
whole body cortisol and brain monoamines were analysed by using ANOVA with
double factorial in a complete randomized design followed by post hoc Tukey's HSD.
Values of P<0.05 were considered statistically significant
Chapter No. 1
Page 32
3. Results
3.1. Water-born cortisol
Cortisol was not detected in water supplying to experimental aquaria. Cortisol
concentration was significantly higher in wild mahseer than captive-reared
counterpart and significantly higher in fish confronted acute stress than control group
(F1, 220 = 1509.159, p<0.001, Table 1, Fig. 1). The significant interaction between
Population and Treatment (F1, 220 = 4.125.159, p<0.05, Table 1) indicated the way, the
response of the two populations to acute stress varied. By examining the result more
closely it appears that after an acute stress, water-borne cortisol was higher in wild
fish than captive-reared mahseer. The basal level of water-borne cortisol of
(4.33±0.35 and 7.55±0.36µgL-1
), but control groups of both populations did not show
significant fluctuation during the experimental period. The repeated measure analysis
indicated that cortisol concentration changed over time (F11, 220 = 109.828, p<0.001),
while significant interaction between Time and Treatment (F11, 220 = 109.828,
p<0.001), showed the combined effect of both variables. Moreover, the significant
three-way interaction between treatment, time and populations is indicative of the
different patterns displayed by fish from both populations in both treatments over
time. During the control treatment there were no differences between the two
populations (P>0.05), no change in water-borne cortisol over time (P > 0.05). In
contrast, after acute there was a significant difference between captive reared and wild
populations (F1, 220=26.891, P<0.001), a change in water-born cortisol over time (F11,
220 =109.828, P=0.001) and an interaction between these two variables (F11, 220
=107.44, P<0.001). Water-born cortisol in wild fish was significantly elevated at 0.25
h and peaked at 2 h post stress and then started declining whereas cortisol
concentration in captive reared fish gradually built up, although peaked at 4 h post
stress, but concentration at 2 hrs was slightly less but statistically compared to observe
at 4 hrs (Table 2, Fig. 1). In wild mahseer, water-born cortisol return to basal level
after 8hrs post stress as compared to captive reared remained high even after 24 hrs
3. 2. Blood plasma cortisol
Chapter No. 1
Page 33
The pre-stress blood plasma cortisol level was significantly different in two
populations of mahseer wild and captive (Tukey’s post hoc: p=0.05; Table 3). The
significant interaction between population and treatment (two way ANOVA: F2, 100=
3.6288, p<0.01) indicated how the stress response of fish from rearing environment
varied. The plasma cortisol concentration changed after exposure to stress as
compared to pre-stress (two way ANOVA: F1, 100 = 469.1572, p<0.001; Table 3, Fig.
2), also changed over time and showed variable concentration of most of the studied
hours among wild and captive populations of mahseer (two way ANOVA: F8, 100 =
345.1709, p<0.001). The significant interaction of populations with treatment (two
way ANOVA: F1, 100 =469.1572, p<0.001) as well as with time (two way ANOVA:
F8, 150 = 345.1709, p<0.001)indicated how different rearing groups differ in their
stress response. Although both populations attained peak levels after 0.75 min of
stress, but cortisol concentration and the trend to attain peak values were significantly
different in two populations. At 0.25 min wild population fish showed rapidly
increased and highest level of cortisol, but afterword trend changed and at the 0.75
min highest level was observed in wild fish followed by captive reared fish (27.65 ±
3.01 and 17.80 ± 2.20 respectively). After word plasma cortisol level showed
decreasing trend, but wild-caught mahseer showed rapid recovery and at 6 hrs
attained levels statistically comparable to their pre-stress levels as compared to
captive fish, where it remained high even after 24 hrs. At 48 hr post stress, plasma
cortisol concentrations of all groups were statistically compared to their respective
pre-stress values (Table 4, Fig.2 )
3. 3.Blood glucose
Before stress, blood glucose level of captive reared mahseer was not
significantly different than wild-caught mahseer (Tukey’s post hoc: p=0.28). After
treatment, i.e., exposure to acute stress, a significant difference between two
populations(two way ANOVA: F1, 100= 6.03, p<0.01 Table 5, Fig.3 ), changed in
glucose level over time (two way ANOVA: F8, 100 = 265.8381, p<0.001) and
interactions between different rearing groups of fish with time (two way ANOVA: F8,
100 = 18.0537, p<0.001) and treatment (two way ANOVA: F1, 100 = 2.1872, p<0.02
Table 5, Fig.3) were observed. Like plasma cortisol, plasma glucose of all rearing
groups also differs in peak concentration, highest in wild followed by captive reared
Chapter No. 1
Page 34
fish. Although, both populations attained peak value at 2 hr, but wild mahseer showed
initially rapid increased at 0.25 min as compared to steady increased in concentration,
observed in captive reared mahseer. After stress, wild mahseer recovered their pre-
stress level earlier, i.e., at 8 hrs than captive reared fish.
3.4. Brain monoamines
3.4.1. Serotonergic activity (5HIAA/5HT ratio)
The pre stress brain serotonergic activity (5HIAA/5HT ratio) of advanced fry
of mahseer from two different populations of mahseer wild and captive was
considerably similar (Turkey’s post hoc: p = 0.62, Table 8, Fig 4). Exposure to stress
showed changes in 5HIAA/5HT brain ratio (n = 6, mean ± SEM: ANOVA: F1, 100 =
142.4145, p < 0.001, Table 7) over time (n = 6, mean ± SEM: ANOVA: F8, 100 =
222.0895, p < 0.001) at different level in two populations of mahseer (n = 6, mean ±
SE: ANOVA: F1, 100= 10.1893, p < 0.001). The significant interaction between time
and population (ANOVA: F8, 100 = 9.7529, p < 0.001) suggesting that in different
rearing group, 5HIAA/5HT ratio changed with time (ANOVA: F8, 100=222.0895, p =
0.001), Treatment x population (ANOVA: F2, 100 = 4.1220, p = 0.032). Although both
populations after stress attained their peak level at 0.75 min after stress (Table 8, Fig
4). However, captive-reared fish had significantly low 5HIAA/5HT ratio compared
with wild reared fish (Tukey’s post hoc: p = 0.001). After peak ratio, there was a
steady and continuous decline in following time period. Moreover, if we look more
closely, it appears that different population showed a somewhat difference in the
recovery period (Table 8, Fig 4). Wild populations of fish attained a comparable basal
level ratio of 5HIAA/5HT earlier, i.e., at 4 hrs after stress as compared to captive
reared fish which attained the level at 6 hrs. It was also observed that at 0.25, 0.5, 2
and 4 hr a clear difference in the ratio of 5HIAA/5HT was noted between the wild and
captive population (Tukey’s post hoc: p<0.01) while at 6, 8, 24 and 48 hr captive and
wild did not show significant differences (Tukey’s post hoc: p>0.05).
3.4.2. Dopaminergic activity (DOPAC/DA ratio)
Chapter No. 1
Page 35
Before stress, whole brain dopaminergic activity index (DOPAC/DA ratio) in
two populations of mahseer were almost similar in range (Tukey’s post hoc: p > 0.05,
Fig. 5, Table 10), while after acute physical stress, it showed changes (ANOVA: F1,
100 = 65.3270, p < 0.001, Table 9) with time (ANOVA: F8, 100 = 95.2416, p < 0.001,
Table 9) in all rearing groups and attained peak level at 0.75 hr. The significant
interaction between time and population (ANOVA: F8, 100 = 4.0743, p > 0.48) while
non-significant interaction between treatment and population (ANOVA: F1, 100
=0.4881, p =0.4863, Table 9) indicated that although DOPAC/ DA ratio changed in
both populations over time after treatment. Captive and wild fish showed significant
difference at 0.25, 0.75, 2,4 hr (Table 10, Fig. 5). However, both populations have no
significant difference at 6,8, 24 and 48 hr after stress. Wild reared fish recovered their
pre-stress level earlier, i.e. at 4 hrs as compared to captive reared fish which achieved
this level at 6 hrs
3.4.3.HVA/DA ratio
Pre-stress brain HVA/DA ratios of mahseer in two different rearing
populations were statistically similar (Tukey’s post hoc: p>0.05, Table 12, Fig. 6).
After exposure to acute stress, there was significant changed in ratio (two way
ANOVA: F1, 100 = 16.3268, p < 0.001, Table 11), at different time period (two way
ANOVA: F8, 100 = 28.77, p < 0.001). There was no interaction between population
and treatment (two way ANOVA: F1, 100 = 0.0133, p=0.908) as well as between
rearing groups and time (two way ANOVA: F8, 100 = 0.8952, p= 0.523). The captive
and wild fish show significant difference at 0.25 and 2hr in HVA/DA ratios (Tukey’s
post hoc: p = 0.05, p = 0.04, respectively). Both semi-natural and physically enriched
environment groups recovered their pre stress HVA/DA ratio earlier, i.e., at 2 hrs as
compared barren reared group which attained this at 4 hr after stress (Table12, Fig.
6).
3.4.4 Norepinephrine (NE)
No significant difference was observed in pre-stress brain norepinephrine
(NE) level of wild and captive population (Tukey’s post hoc; p = 0.55, table 14, Fig.
7). After exposure to acute stress, both populations showed significant increase in NE
Chapter No. 1
Page 36
level as compared to their pre-stress level (ANOVA: F1, 100 = 283.4336, p <0.001;
Table 13, Fig. 7), that change over time, peak at 0.75 hr and then decline gradually up
to 48 hrs (ANOVA: F8, 100 = 379.8585, p <0.001). The significant interaction between
variables indicates how the different rearing groups differ in physiological stress
response, i.e., at most of time period showed significant difference in NE level. If we
look more closely at the results, it appears that during recovery, wild mahseer
attained comparable pre-stress level of NE earlier than captive mahseer (Table 14,
Fig. 7). All brain monoamines showed positive correlation with plasma cortisol
(Figures 8 and 9, Table 15 and 16).
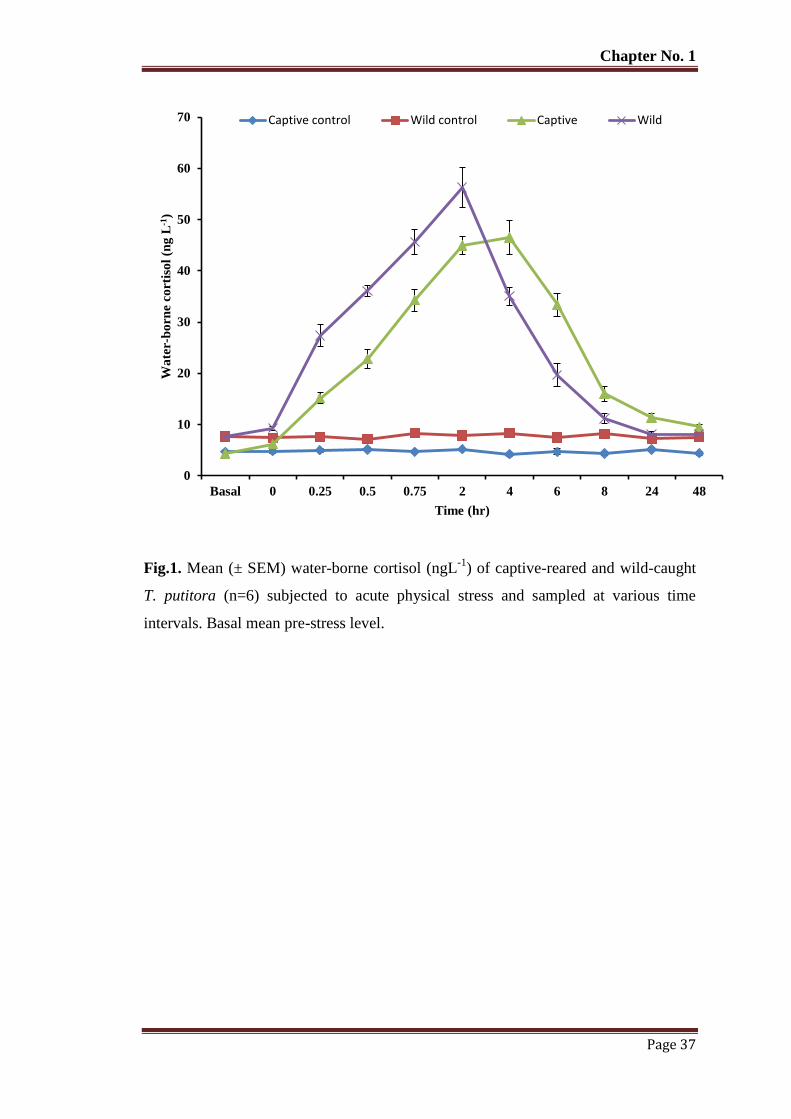
Chapter No. 1
Page 37
Fig.1. Mean (± SEM) water-borne cortisol (ngL-1
) of captive-reared and wild-caught
T. putitora (n=6) subjected to acute physical stress and sampled at various time
intervals. Basal mean pre-stress level.
0
10
20
30
40
50
60
70
Basal 0 0.25 0.5 0.75 2 4 6 8 24 48
Wa
ter-
bo
rn
e c
orti
sol
(ng
L-1
)
Time (hr)
Captive control Wild control Captive Wild
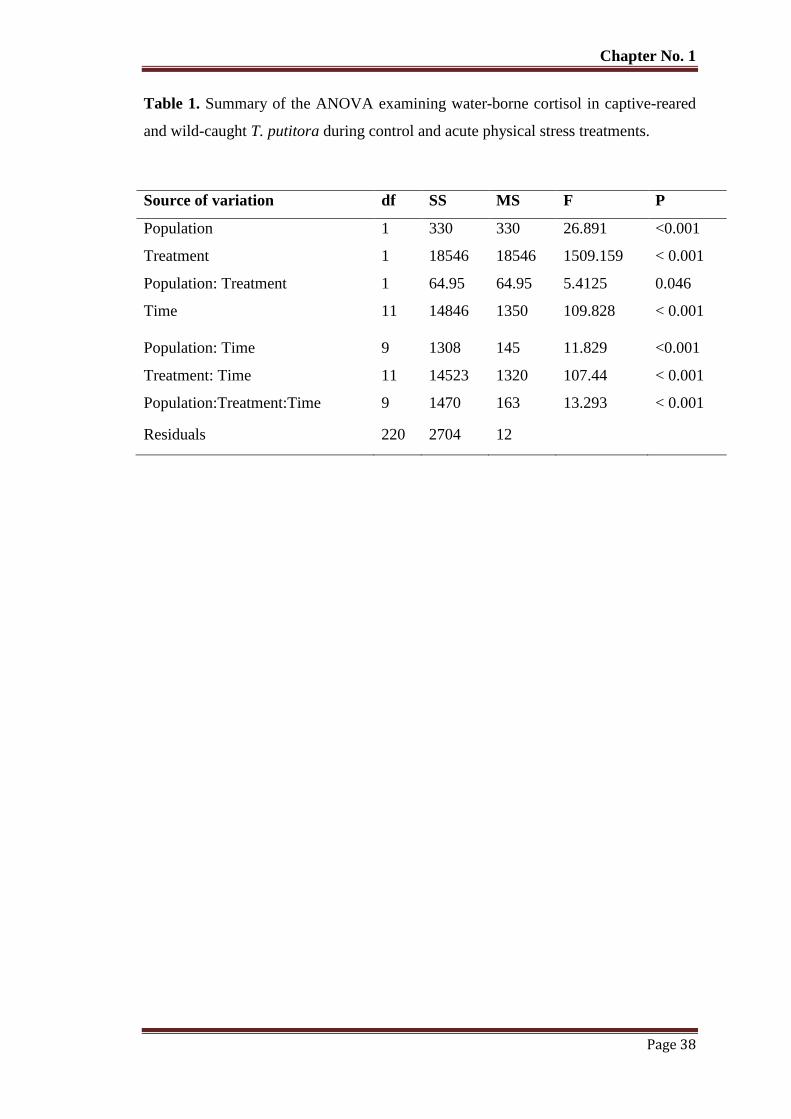
Chapter No. 1
Page 38
Table 1. Summary of the ANOVA examining water-borne cortisol in captive-reared
and wild-caught T. putitora during control and acute physical stress treatments.
Source of variation df SS MS F P
Population 1 330 330 26.891 <0.001
Treatment 1 18546 18546 1509.159 < 0.001
Population: Treatment 1 64.95 64.95 5.4125 0.046
Time 11 14846 1350 109.828 < 0.001
Population: Time 9 1308 145 11.829 <0.001
Treatment: Time 11 14523 1320 107.44 < 0.001
Population:Treatment:Time 9 1470 163 13.293 < 0.001
Residuals 220 2704 12
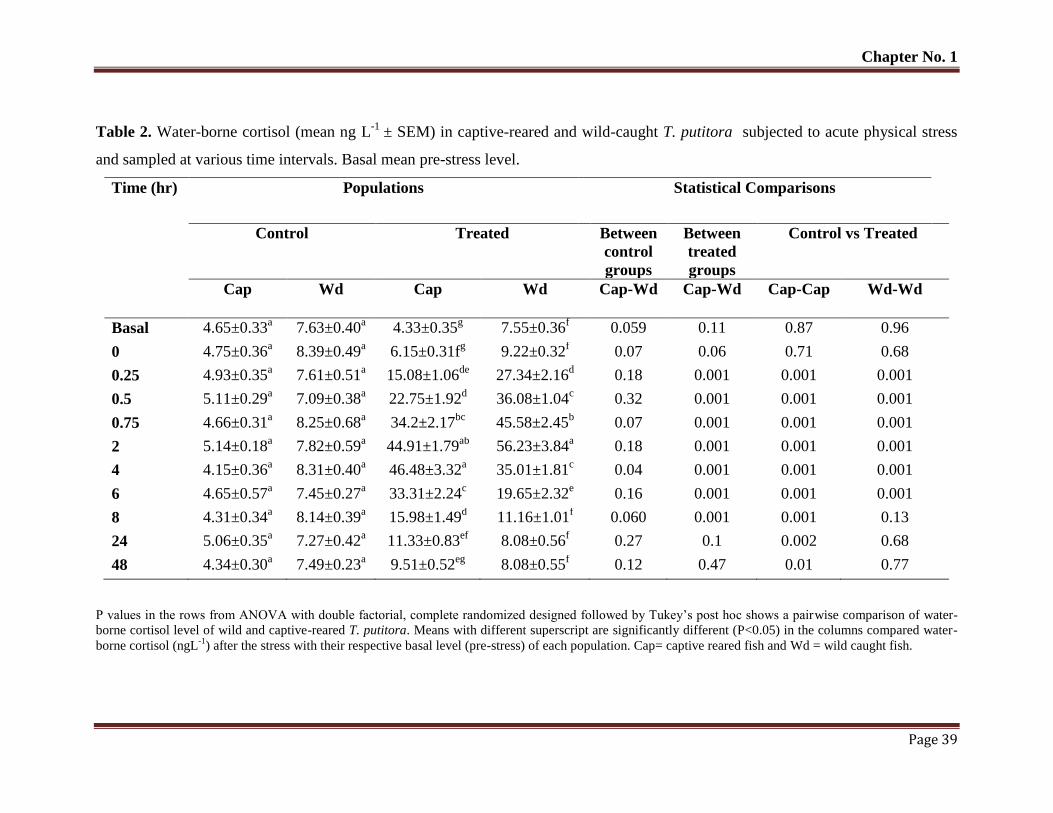
Chapter No. 1
Page 39
Table 2. Water-borne cortisol (mean ng L-1
± SEM) in captive-reared and wild-caught T. putitora subjected to acute physical stress
and sampled at various time intervals. Basal mean pre-stress level.
Time (hr) Populations Statistical Comparisons
Control Treated Between
control
groups
Between
treated
groups
Control vs Treated
Cap Wd Cap Wd Cap-Wd
Cap-Wd Cap-Cap Wd-Wd
Basal 4.65±0.33a 7.63±0.40
a 4.33±0.35
g 7.55±0.36
f 0.059 0.11 0.87 0.96
0 4.75±0.36a 8.39±0.49
a 6.15±0.31f
g 9.22±0.32
f 0.07 0.06 0.71 0.68
0.25 4.93±0.35a 7.61±0.51
a 15.08±1.06
de 27.34±2.16
d 0.18 0.001 0.001 0.001
0.5 5.11±0.29a 7.09±0.38
a 22.75±1.92
d 36.08±1.04
c 0.32 0.001 0.001 0.001
0.75 4.66±0.31a 8.25±0.68
a 34.2±2.17
bc 45.58±2.45
b 0.07 0.001 0.001 0.001
2 5.14±0.18a 7.82±0.59
a 44.91±1.79
ab 56.23±3.84
a 0.18 0.001 0.001 0.001
4 4.15±0.36a 8.31±0.40
a 46.48±3.32
a 35.01±1.81
c 0.04 0.001 0.001 0.001
6 4.65±0.57a 7.45±0.27
a 33.31±2.24
c 19.65±2.32
e 0.16 0.001 0.001 0.001
8 4.31±0.34a 8.14±0.39
a 15.98±1.49
d 11.16±1.01
f 0.060 0.001 0.001 0.13
24 5.06±0.35a 7.27±0.42
a 11.33±0.83
ef 8.08±0.56
f 0.27 0.1 0.002 0.68
48 4.34±0.30a 7.49±0.23
a 9.51±0.52
eg 8.08±0.55
f 0.12 0.47 0.01 0.77
P values in the rows from ANOVA with double factorial, complete randomized designed followed by Tukey’s post hoc shows a pairwise comparison of water-
borne cortisol level of wild and captive-reared T. putitora. Means with different superscript are significantly different (P<0.05) in the columns compared water-
borne cortisol (ngL-1
) after the stress with their respective basal level (pre-stress) of each population. Cap= captive reared fish and Wd = wild caught fish.
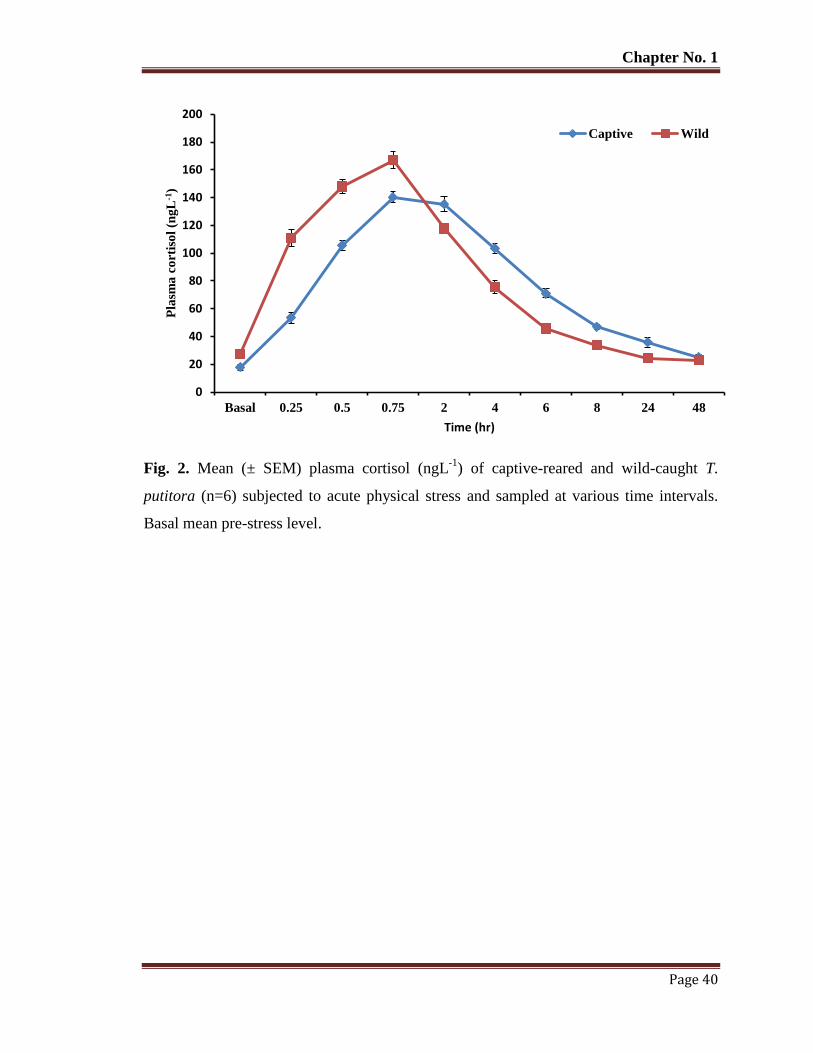
Chapter No. 1
Page 40
Fig. 2. Mean (± SEM) plasma cortisol (ngL-1
) of captive-reared and wild-caught T.
putitora (n=6) subjected to acute physical stress and sampled at various time intervals.
Basal mean pre-stress level.
0
20
40
60
80
100
120
140
160
180
200
Basal 0.25 0.5 0.75 2 4 6 8 24 48
Pla
sma
co
rtis
ol
(ng
L-1
)
Time (hr)
Captive Wild
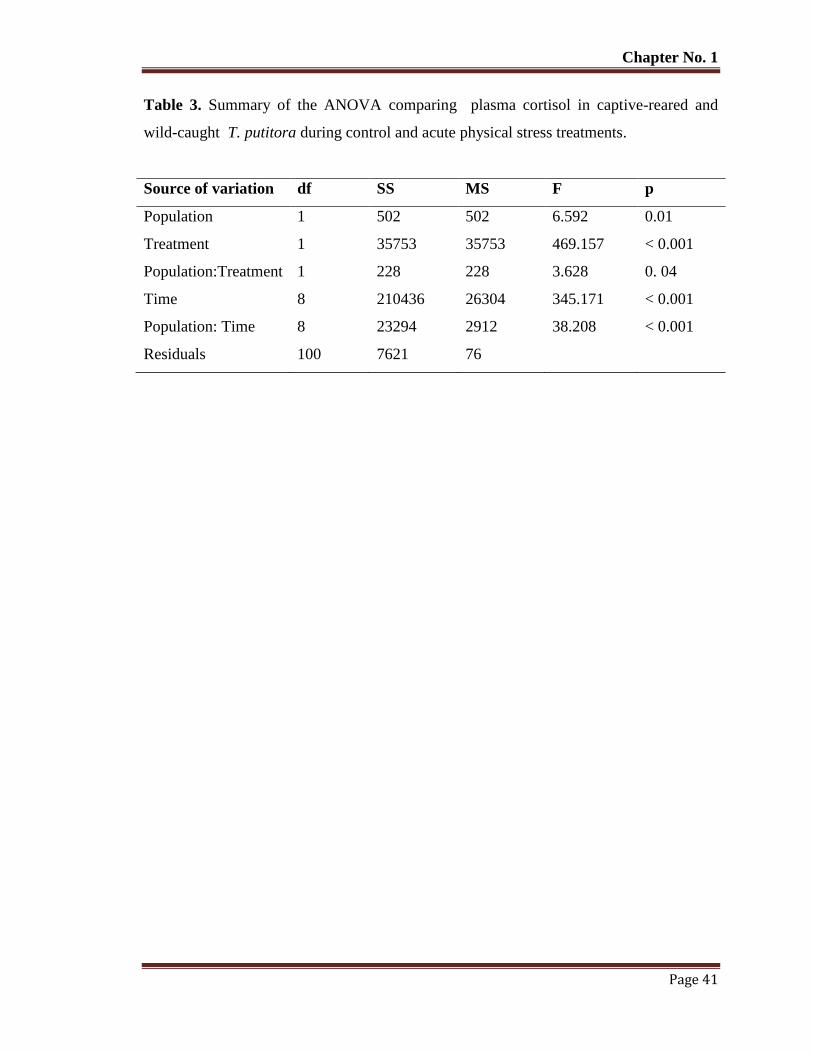
Chapter No. 1
Page 41
Table 3. Summary of the ANOVA comparing plasma cortisol in captive-reared and
wild-caught T. putitora during control and acute physical stress treatments.
Source of variation df SS MS F p
Population 1 502 502 6.592 0.01
Treatment 1 35753 35753 469.157 < 0.001
Population:Treatment 1 228 228 3.628 0. 04
Time 8 210436 26304 345.171 < 0.001
Population: Time 8 23294 2912 38.208 < 0.001
Residuals 100 7621 76
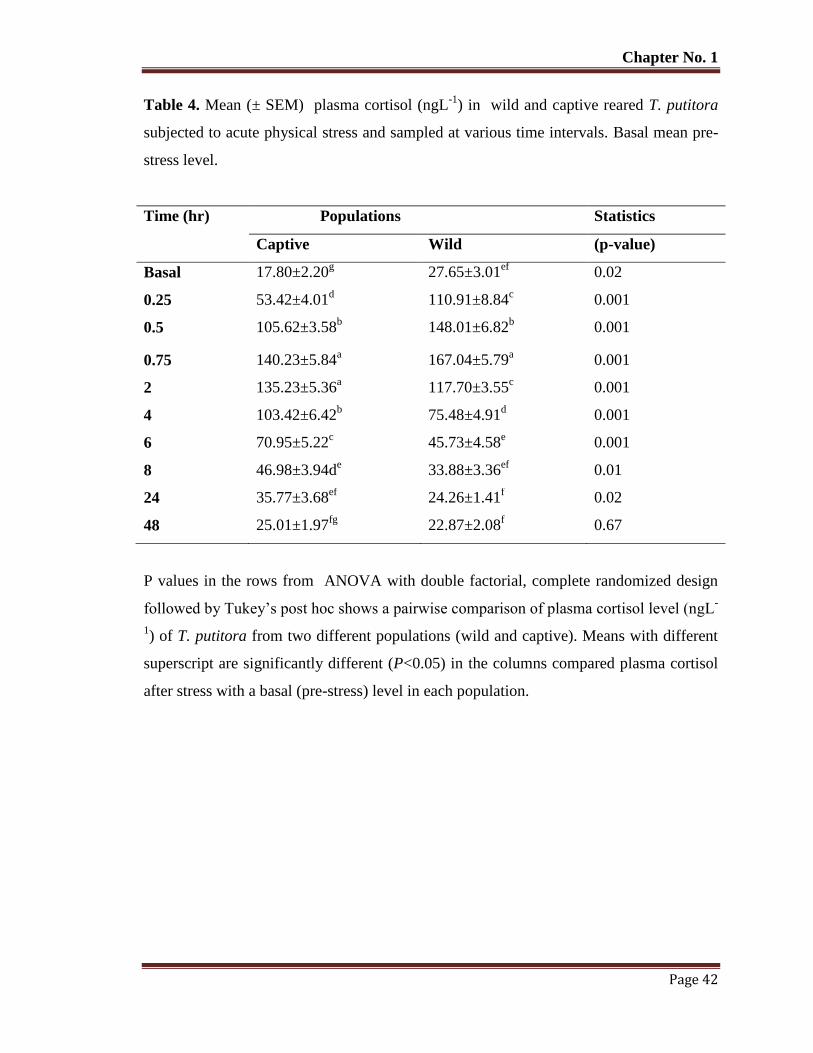
Chapter No. 1
Page 42
Table 4. Mean (± SEM) plasma cortisol (ngL-1
) in wild and captive reared T. putitora
subjected to acute physical stress and sampled at various time intervals. Basal mean pre-
stress level.
Time (hr) Populations Statistics
Captive Wild (p-value)
Basal 17.80±2.20g 27.65±3.01
ef 0.02
0.25 53.42±4.01d 110.91±8.84
c 0.001
0.5 105.62±3.58b 148.01±6.82
b 0.001
0.75 140.23±5.84a 167.04±5.79
a 0.001
2 135.23±5.36a 117.70±3.55
c 0.001
4 103.42±6.42b 75.48±4.91
d 0.001
6 70.95±5.22c 45.73±4.58
e 0.001
8 46.98±3.94de 33.88±3.36
ef 0.01
24 35.77±3.68ef
24.26±1.41f 0.02
48 25.01±1.97fg
22.87±2.08f 0.67
P values in the rows from ANOVA with double factorial, complete randomized design
followed by Tukey’s post hoc shows a pairwise comparison of plasma cortisol level (ngL-
1) of T. putitora from two different populations (wild and captive). Means with different
superscript are significantly different (P<0.05) in the columns compared plasma cortisol
after stress with a basal (pre-stress) level in each population.
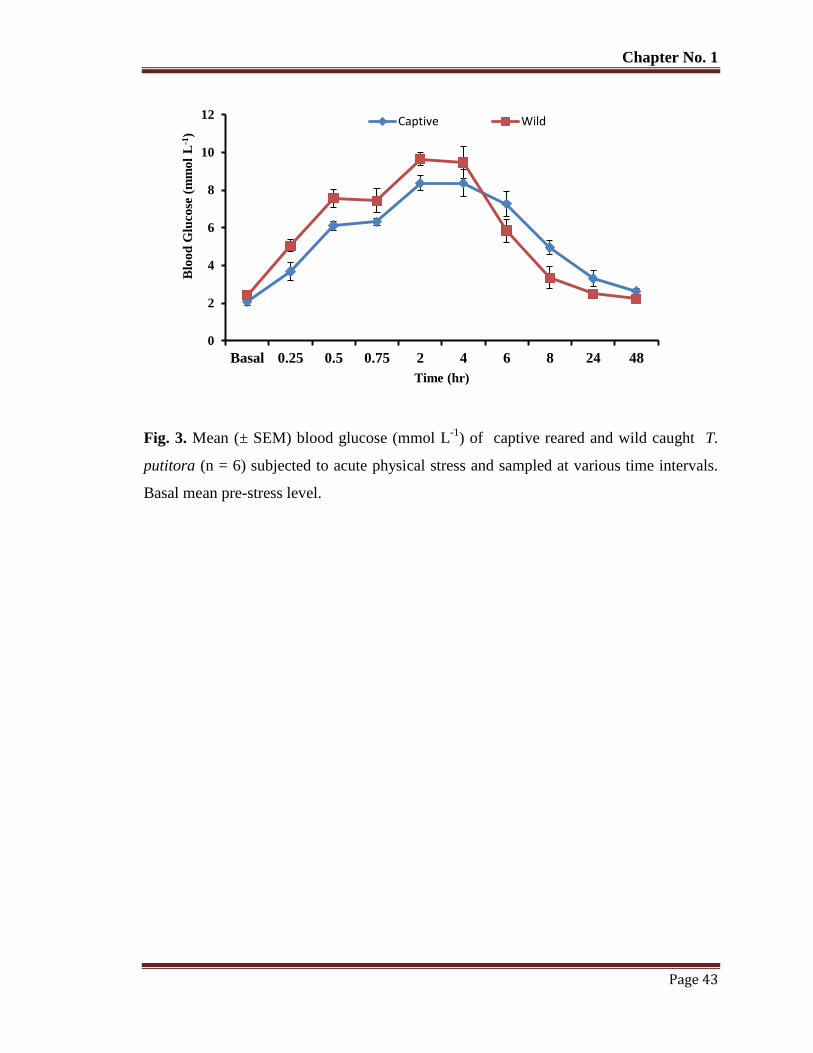
Chapter No. 1
Page 43
Fig. 3. Mean (± SEM) blood glucose (mmol L-1
) of captive reared and wild caught T.
putitora (n = 6) subjected to acute physical stress and sampled at various time intervals.
Basal mean pre-stress level.
0
2
4
6
8
10
12
Basal 0.25 0.5 0.75 2 4 6 8 24 48
Blo
od
Glu
cose
(m
mo
l L
-1)
Time (hr)
Captive Wild

Chapter No. 1
Page 44
Table 5. Summary of the ANOVA examining blood glucose in captive-reared and wild-
caught T. putitora during control and acute physical stress treatments.
Source of variation df SS MS F p
Population 1 1.590 1.590 6.036 0.006
Treatment 1 132.32 132.318 502.264 < 0.001
Population:Treatment 1 0.575 0.575 2.187 0.026
Time 8 560.27 70.033 265.838 < 0.001
Population: Time 8 38.05 4.756 18.054 < 0.001
Residuals 100 26.34 0.263
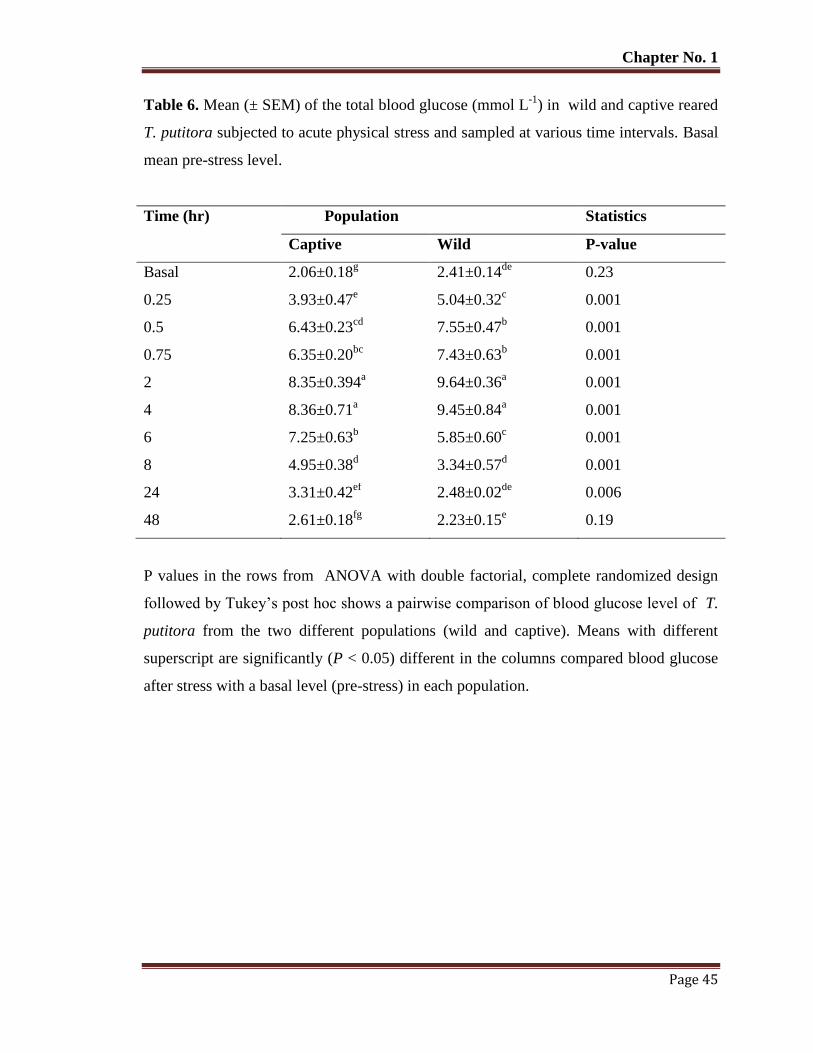
Chapter No. 1
Page 45
Table 6. Mean (± SEM) of the total blood glucose (mmol L-1
) in wild and captive reared
T. putitora subjected to acute physical stress and sampled at various time intervals. Basal
mean pre-stress level.
Time (hr) Population Statistics
Captive Wild P-value
Basal 2.06±0.18g 2.41±0.14
de 0.23
0.25 3.93±0.47e 5.04±0.32
c 0.001
0.5 6.43±0.23cd
7.55±0.47b 0.001
0.75 6.35±0.20bc
7.43±0.63b 0.001
2 8.35±0.394a 9.64±0.36
a 0.001
4 8.36±0.71a 9.45±0.84
a 0.001
6 7.25±0.63b 5.85±0.60
c 0.001
8 4.95±0.38d 3.34±0.57
d 0.001
24 3.31±0.42ef
2.48±0.02de
0.006
48 2.61±0.18fg
2.23±0.15e 0.19
P values in the rows from ANOVA with double factorial, complete randomized design
followed by Tukey’s post hoc shows a pairwise comparison of blood glucose level of T.
putitora from the two different populations (wild and captive). Means with different
superscript are significantly (P < 0.05) different in the columns compared blood glucose
after stress with a basal level (pre-stress) in each population.

Chapter No. 1
Page 46
Fig. 4. Mean (± SEM) brain serotonergic 5HIAA/5-HT ratio in captive reared and wild
caught T. putitora (n=6) subjected to acute physical stress and sampled at various time
intervals. Basal mean pre stress level.
0
0.2
0.4
0.6
0.8
1
1.2
1.4
1.6
1.8
Basal 0.25 0.5 0.75 2 4 6 8 24 48
5H
IAA
/5H
T r
ati
o
Time (hr)
Captive Wild
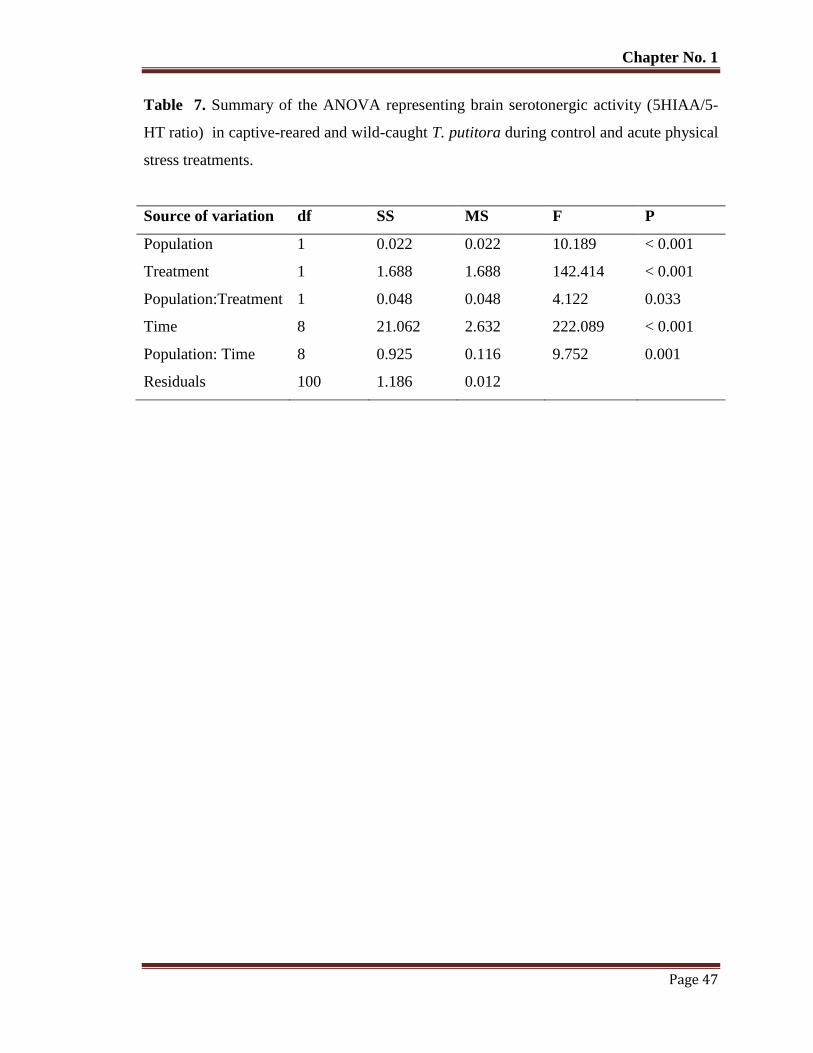
Chapter No. 1
Page 47
Table 7. Summary of the ANOVA representing brain serotonergic activity (5HIAA/5-
HT ratio) in captive-reared and wild-caught T. putitora during control and acute physical
stress treatments.
Source of variation df SS MS F P
Population 1 0.022 0.022 10.189 < 0.001
Treatment 1 1.688 1.688 142.414 < 0.001
Population:Treatment 1 0.048 0.048 4.122 0.033
Time 8 21.062 2.632 222.089 < 0.001
Population: Time 8 0.925 0.116 9.752 0.001
Residuals 100 1.186 0.012
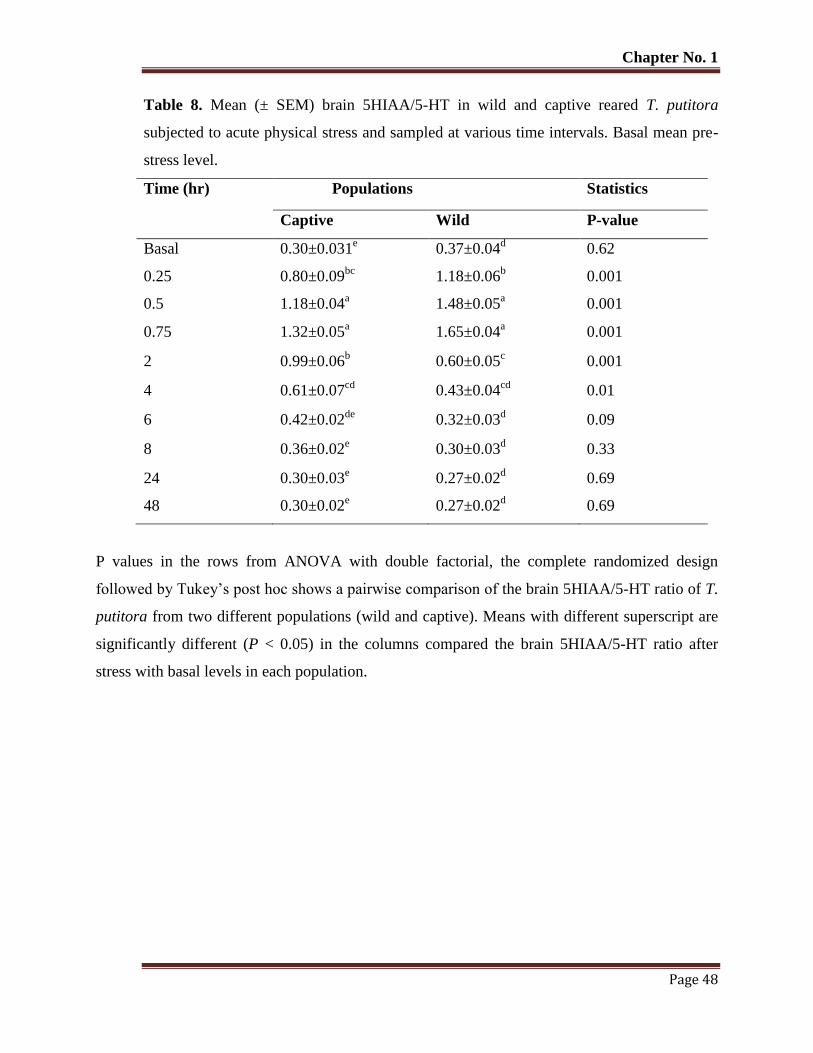
Chapter No. 1
Page 48
Table 8. Mean (± SEM) brain 5HIAA/5-HT in wild and captive reared T. putitora
subjected to acute physical stress and sampled at various time intervals. Basal mean pre-
stress level.
Time (hr) Populations Statistics
Captive Wild P-value
Basal 0.30±0.031e 0.37±0.04
d 0.62
0.25 0.80±0.09bc
1.18±0.06b 0.001
0.5 1.18±0.04a 1.48±0.05
a 0.001
0.75 1.32±0.05a 1.65±0.04
a 0.001
2 0.99±0.06b 0.60±0.05
c 0.001
4 0.61±0.07cd
0.43±0.04cd
0.01
6 0.42±0.02de
0.32±0.03d 0.09
8 0.36±0.02e 0.30±0.03
d 0.33
24 0.30±0.03e 0.27±0.02
d 0.69
48 0.30±0.02e 0.27±0.02
d 0.69
P values in the rows from ANOVA with double factorial, the complete randomized design
followed by Tukey’s post hoc shows a pairwise comparison of the brain 5HIAA/5-HT ratio of T.
putitora from two different populations (wild and captive). Means with different superscript are
significantly different (P < 0.05) in the columns compared the brain 5HIAA/5-HT ratio after
stress with basal levels in each population.
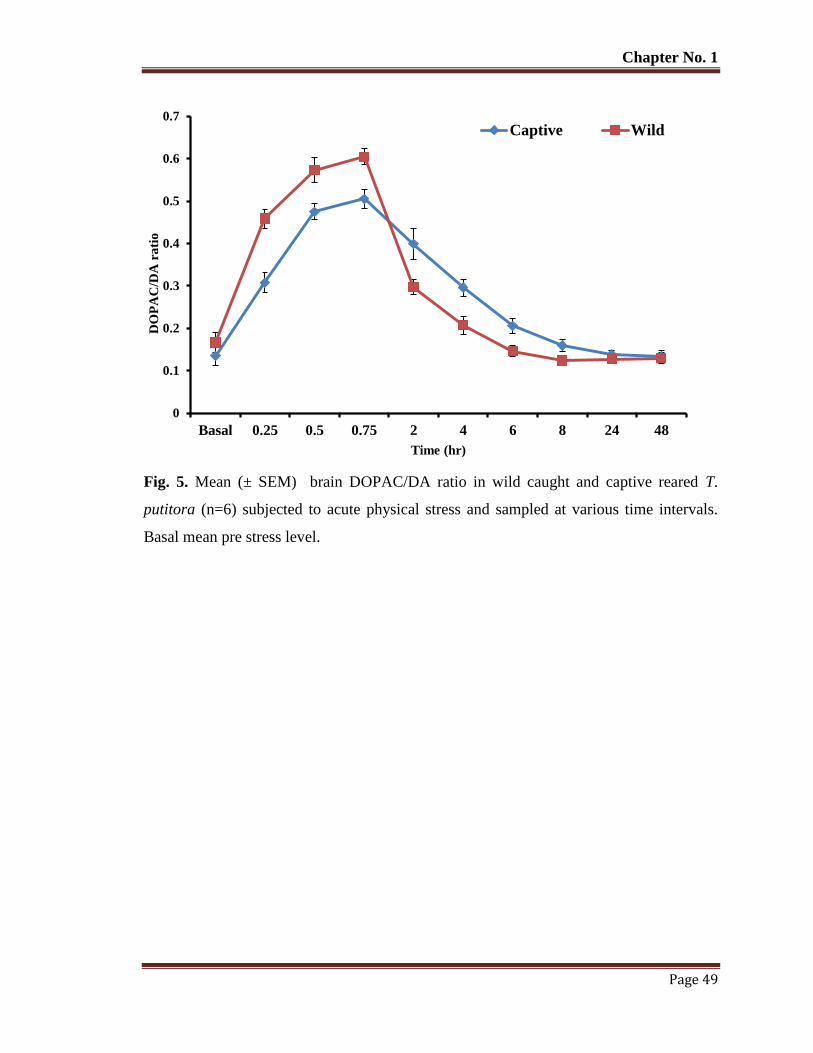
Chapter No. 1
Page 49
Fig. 5. Mean (± SEM) brain DOPAC/DA ratio in wild caught and captive reared T.
putitora (n=6) subjected to acute physical stress and sampled at various time intervals.
Basal mean pre stress level.
0
0.1
0.2
0.3
0.4
0.5
0.6
0.7
Basal 0.25 0.5 0.75 2 4 6 8 24 48
DO
PA
C/D
A r
ati
o
Time (hr)
Captive Wild
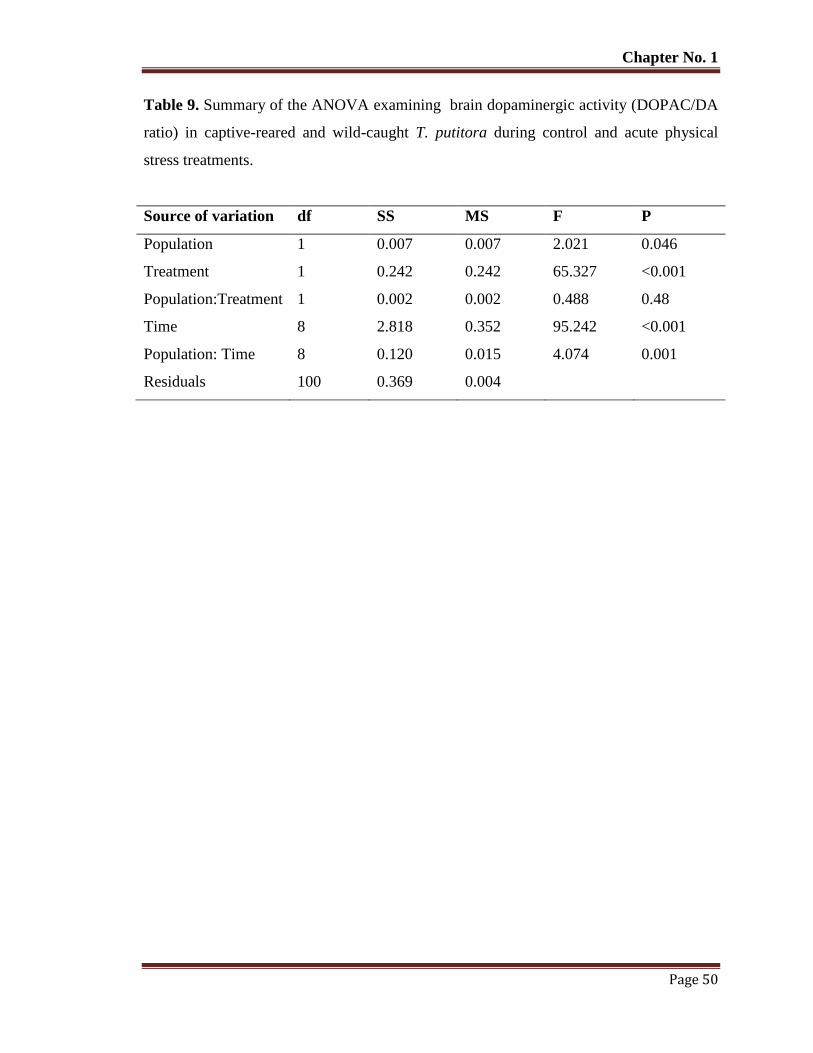
Chapter No. 1
Page 50
Table 9. Summary of the ANOVA examining brain dopaminergic activity (DOPAC/DA
ratio) in captive-reared and wild-caught T. putitora during control and acute physical
stress treatments.
Source of variation df SS MS F P
Population 1 0.007 0.007 2.021 0.046
Treatment 1 0.242 0.242 65.327 <0.001
Population:Treatment 1 0.002 0.002 0.488 0.48
Time 8 2.818 0.352 95.242 <0.001
Population: Time 8 0.120 0.015 4.074 0.001
Residuals 100 0.369 0.004
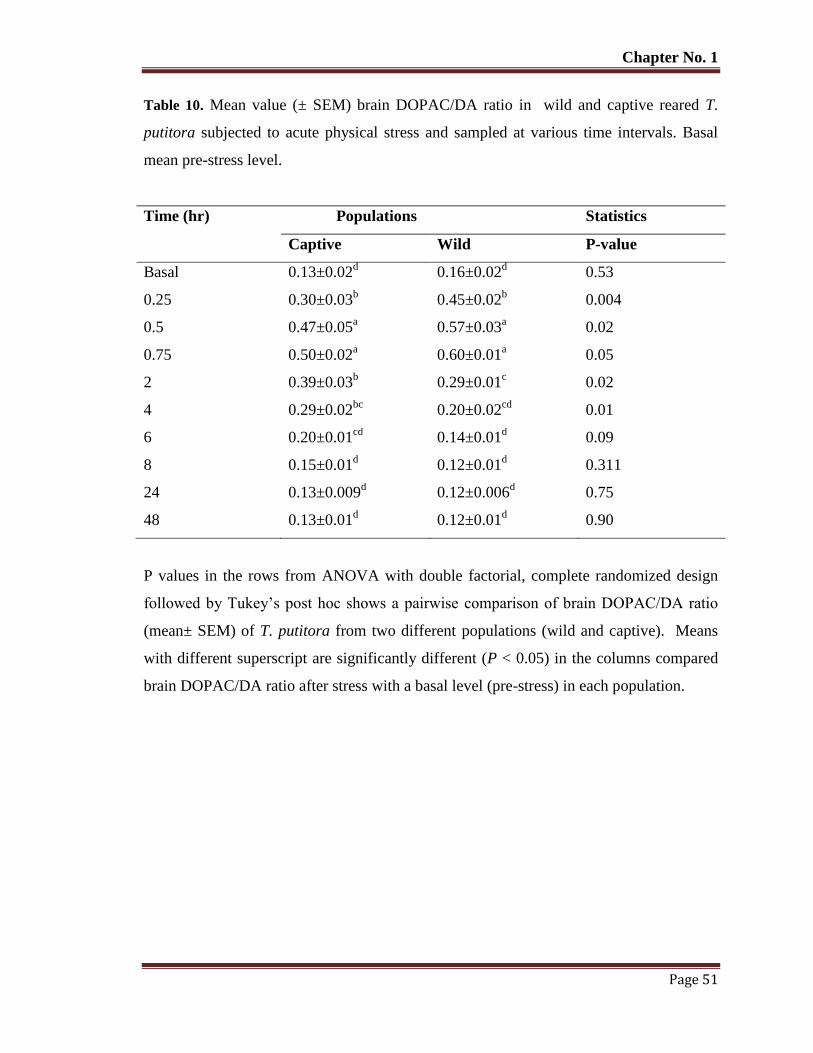
Chapter No. 1
Page 51
Table 10. Mean value (± SEM) brain DOPAC/DA ratio in wild and captive reared T.
putitora subjected to acute physical stress and sampled at various time intervals. Basal
mean pre-stress level.
Time (hr) Populations Statistics
Captive Wild P-value
Basal 0.13±0.02d 0.16±0.02
d 0.53
0.25 0.30±0.03b 0.45±0.02
b 0.004
0.5 0.47±0.05a 0.57±0.03
a 0.02
0.75 0.50±0.02a 0.60±0.01
a 0.05
2 0.39±0.03b 0.29±0.01
c 0.02
4 0.29±0.02bc
0.20±0.02cd
0.01
6 0.20±0.01cd
0.14±0.01d 0.09
8 0.15±0.01d 0.12±0.01
d 0.311
24 0.13±0.009d 0.12±0.006
d 0.75
48 0.13±0.01d 0.12±0.01
d 0.90
P values in the rows from ANOVA with double factorial, complete randomized design
followed by Tukey’s post hoc shows a pairwise comparison of brain DOPAC/DA ratio
(mean± SEM) of T. putitora from two different populations (wild and captive). Means
with different superscript are significantly different (P < 0.05) in the columns compared
brain DOPAC/DA ratio after stress with a basal level (pre-stress) in each population.
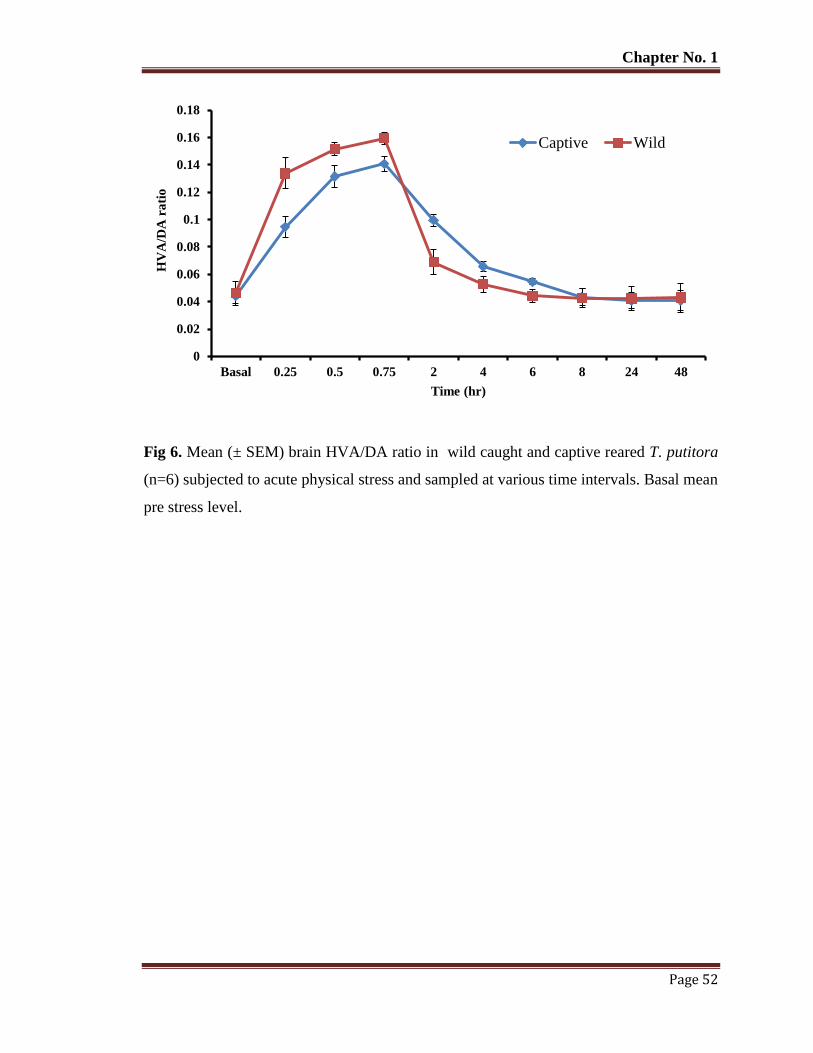
Chapter No. 1
Page 52
Fig 6. Mean (± SEM) brain HVA/DA ratio in wild caught and captive reared T. putitora
(n=6) subjected to acute physical stress and sampled at various time intervals. Basal mean
pre stress level.
0
0.02
0.04
0.06
0.08
0.1
0.12
0.14
0.16
0.18
Basal 0.25 0.5 0.75 2 4 6 8 24 48
HV
A/D
A r
ati
o
Time (hr)
Captive Wild
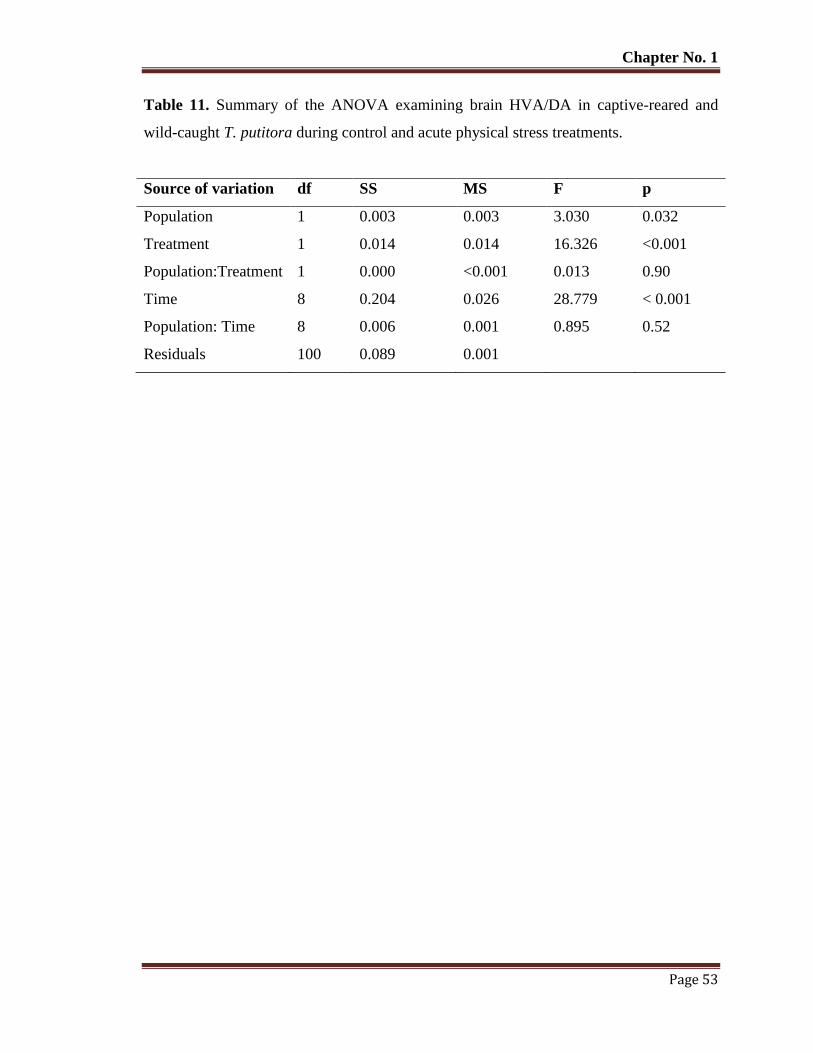
Chapter No. 1
Page 53
Table 11. Summary of the ANOVA examining brain HVA/DA in captive-reared and
wild-caught T. putitora during control and acute physical stress treatments.
Source of variation df SS MS F p
Population 1 0.003 0.003 3.030 0.032
Treatment 1 0.014 0.014 16.326 <0.001
Population:Treatment 1 0.000 <0.001 0.013 0.90
Time 8 0.204 0.026 28.779 < 0.001
Population: Time 8 0.006 0.001 0.895 0.52
Residuals 100 0.089 0.001
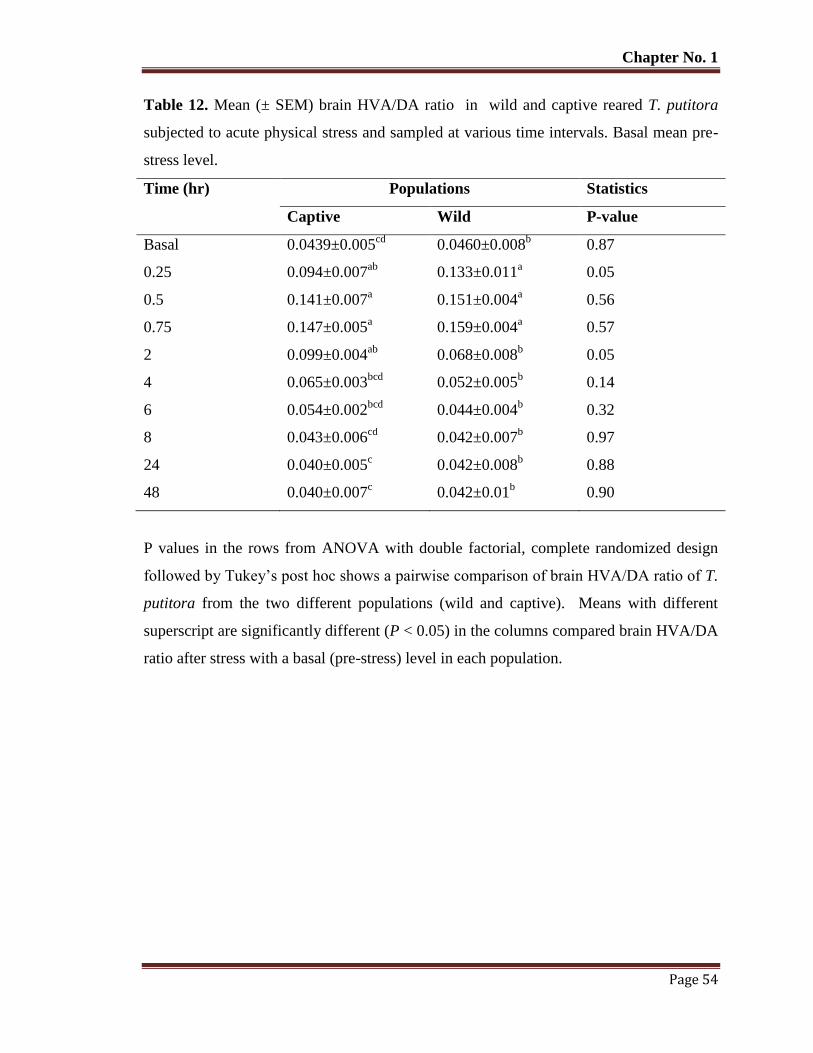
Chapter No. 1
Page 54
Table 12. Mean (± SEM) brain HVA/DA ratio in wild and captive reared T. putitora
subjected to acute physical stress and sampled at various time intervals. Basal mean pre-
stress level.
Time (hr) Populations Statistics
Captive Wild P-value
Basal 0.0439±0.005cd
0.0460±0.008b 0.87
0.25 0.094±0.007ab
0.133±0.011a 0.05
0.5 0.141±0.007a 0.151±0.004
a 0.56
0.75 0.147±0.005a 0.159±0.004
a 0.57
2 0.099±0.004ab
0.068±0.008b 0.05
4 0.065±0.003bcd
0.052±0.005b 0.14
6 0.054±0.002bcd
0.044±0.004b 0.32
8 0.043±0.006cd
0.042±0.007b 0.97
24 0.040±0.005c 0.042±0.008
b 0.88
48 0.040±0.007c 0.042±0.01
b 0.90
P values in the rows from ANOVA with double factorial, complete randomized design
followed by Tukey’s post hoc shows a pairwise comparison of brain HVA/DA ratio of T.
putitora from the two different populations (wild and captive). Means with different
superscript are significantly different (P < 0.05) in the columns compared brain HVA/DA
ratio after stress with a basal (pre-stress) level in each population.
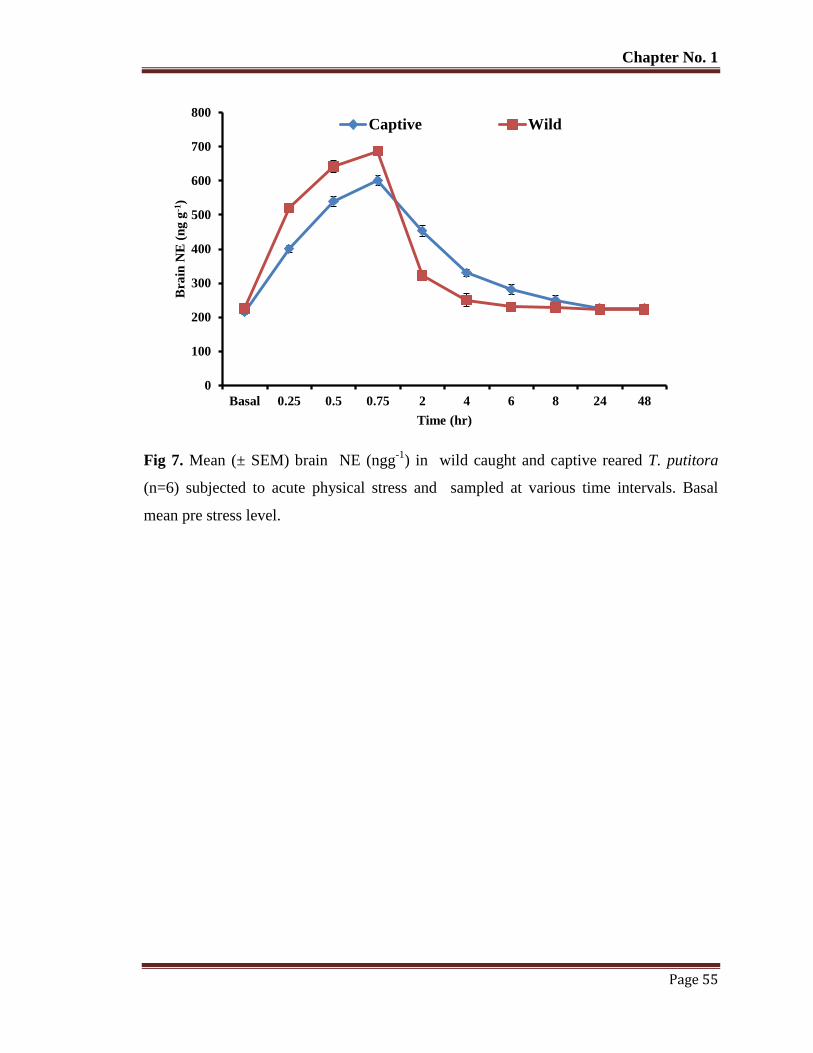
Chapter No. 1
Page 55
Fig 7. Mean (± SEM) brain NE (ngg-1
) in wild caught and captive reared T. putitora
(n=6) subjected to acute physical stress and sampled at various time intervals. Basal
mean pre stress level.
0
100
200
300
400
500
600
700
800
Basal 0.25 0.5 0.75 2 4 6 8 24 48
Bra
in N
E (
ng
g-1
)
Time (hr)
Captive Wild
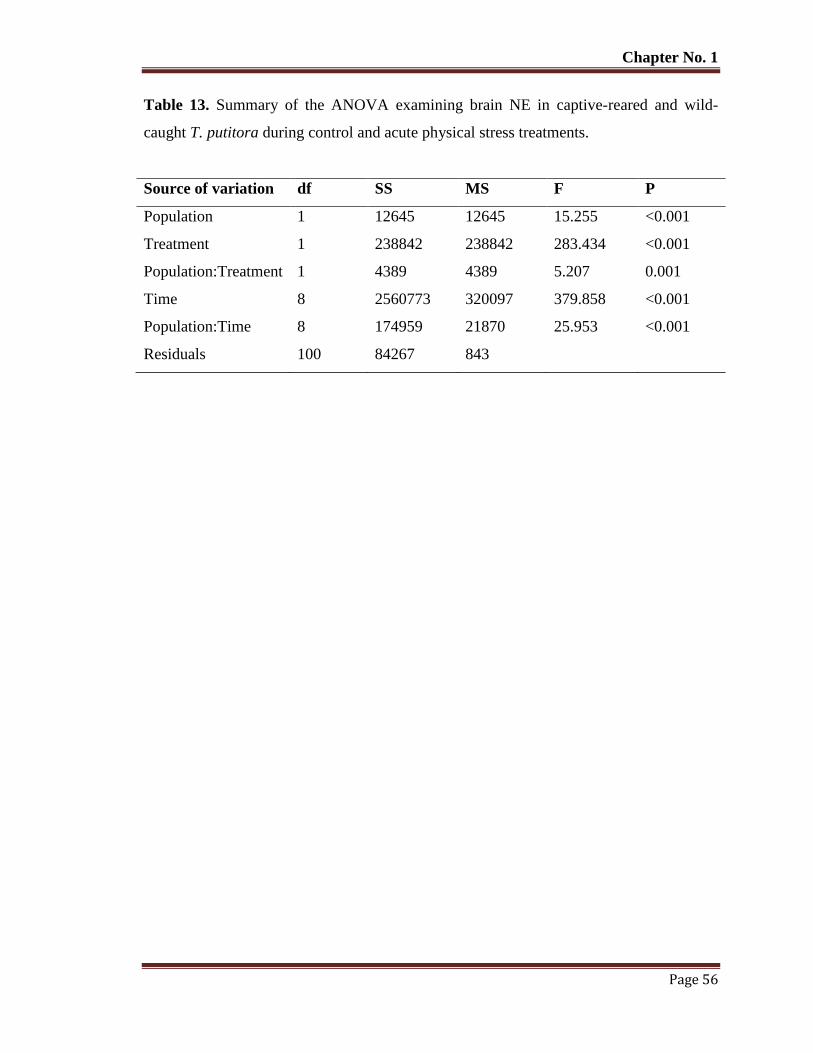
Chapter No. 1
Page 56
Table 13. Summary of the ANOVA examining brain NE in captive-reared and wild-
caught T. putitora during control and acute physical stress treatments.
Source of variation df SS MS F P
Population 1 12645 12645 15.255 <0.001
Treatment 1 238842 238842 283.434 <0.001
Population:Treatment 1 4389 4389 5.207 0.001
Time 8 2560773 320097 379.858 <0.001
Population:Time 8 174959 21870 25.953 <0.001
Residuals 100 84267 843
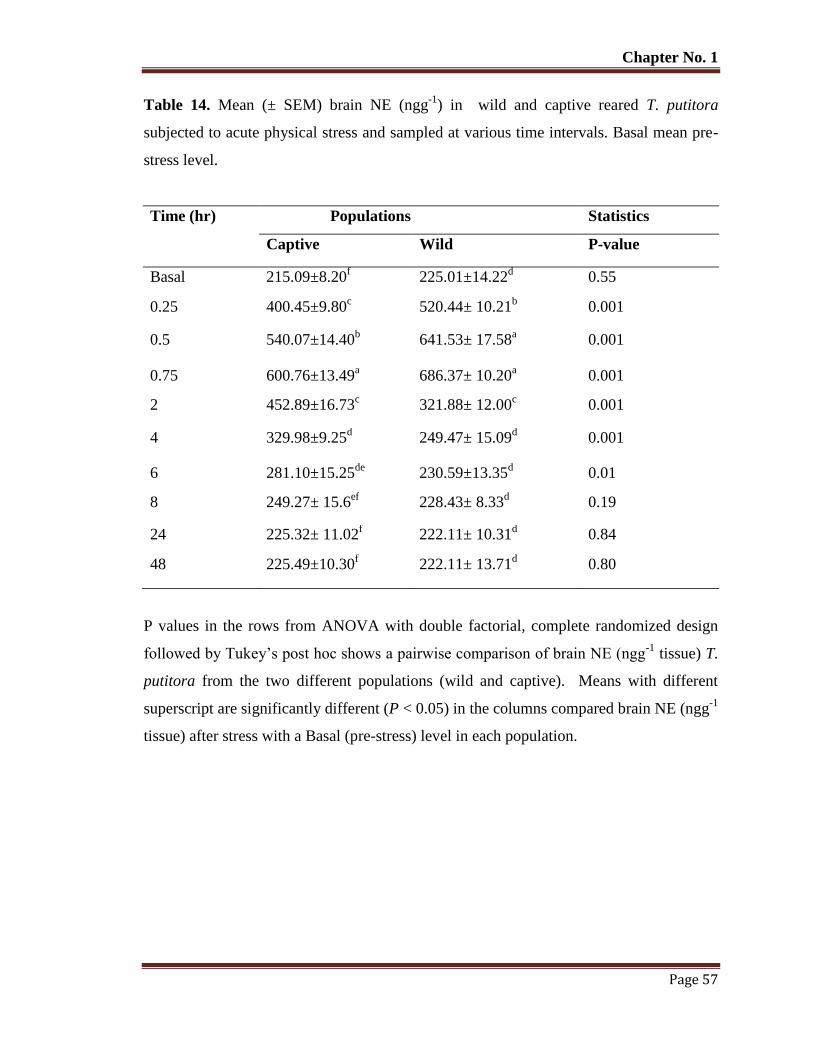
Chapter No. 1
Page 57
Table 14. Mean (± SEM) brain NE (ngg-1
) in wild and captive reared T. putitora
subjected to acute physical stress and sampled at various time intervals. Basal mean pre-
stress level.
Time (hr) Populations Statistics
Captive Wild P-value
Basal 215.09±8.20f 225.01±14.22
d 0.55
0.25 400.45±9.80c 520.44± 10.21
b 0.001
0.5 540.07±14.40b 641.53± 17.58
a 0.001
0.75 600.76±13.49a 686.37± 10.20
a 0.001
2 452.89±16.73c 321.88± 12.00
c 0.001
4 329.98±9.25d 249.47± 15.09
d 0.001
6 281.10±15.25de
230.59±13.35d 0.01
8 249.27± 15.6ef
228.43± 8.33d 0.19
24 225.32± 11.02f 222.11± 10.31
d 0.84
48 225.49±10.30f 222.11± 13.71
d 0.80
P values in the rows from ANOVA with double factorial, complete randomized design
followed by Tukey’s post hoc shows a pairwise comparison of brain NE (ngg-1
tissue) T.
putitora from the two different populations (wild and captive). Means with different
superscript are significantly different (P < 0.05) in the columns compared brain NE (ngg-1
tissue) after stress with a Basal (pre-stress) level in each population.
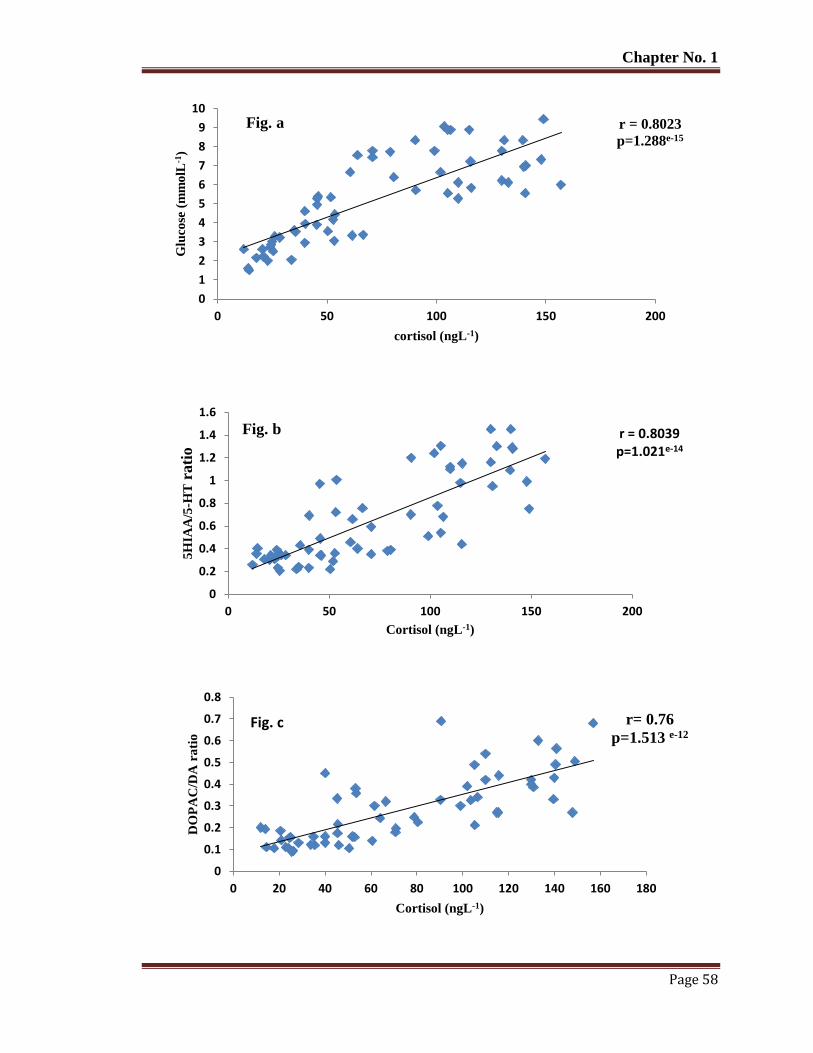
Chapter No. 1
Page 58
r = 0.8023
p=1.288e-15
0
1
2
3
4
5
6
7
8
9
10
0 50 100 150 200
Glu
cose
(m
mo
lL-1
)
cortisol (ngL-1)
Fig. a
r = 0.8039 p=1.021e-14
0
0.2
0.4
0.6
0.8
1
1.2
1.4
1.6
0 50 100 150 200
5H
IAA
/5-H
T r
ati
o
Cortisol (ngL-1)
Fig. b
r= 0.76
p=1.513 e-12
0
0.1
0.2
0.3
0.4
0.5
0.6
0.7
0.8
0 20 40 60 80 100 120 140 160 180
DO
PA
C/D
A r
ati
o
Cortisol (ngL-1)
Fig. c
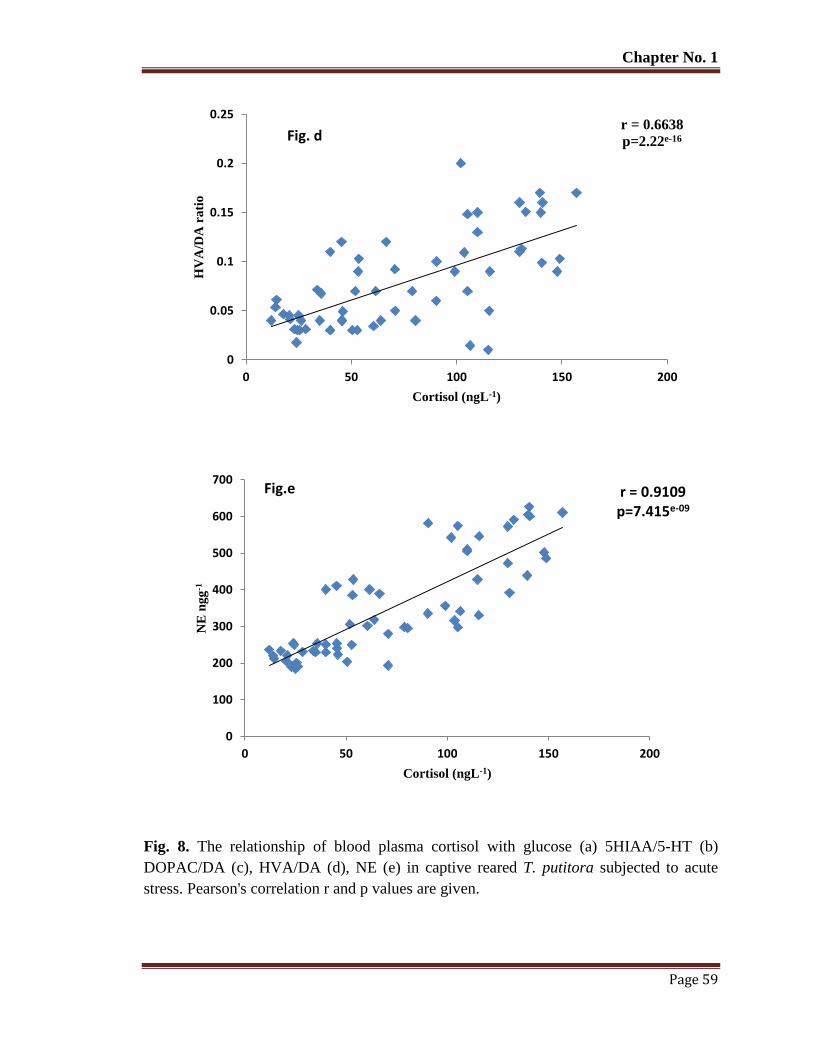
Chapter No. 1
Page 59
Fig. 8. The relationship of blood plasma cortisol with glucose (a) 5HIAA/5-HT (b)
DOPAC/DA (c), HVA/DA (d), NE (e) in captive reared T. putitora subjected to acute
stress. Pearson's correlation r and p values are given.
r = 0.6638
p=2.22e-16
0
0.05
0.1
0.15
0.2
0.25
0 50 100 150 200
HV
A/D
A r
ati
o
Cortisol (ngL-1)
Fig. d
r = 0.9109 p=7.415e-09
0
100
200
300
400
500
600
700
0 50 100 150 200
NE
ng
g-1
Cortisol (ngL-1)
Fig.e
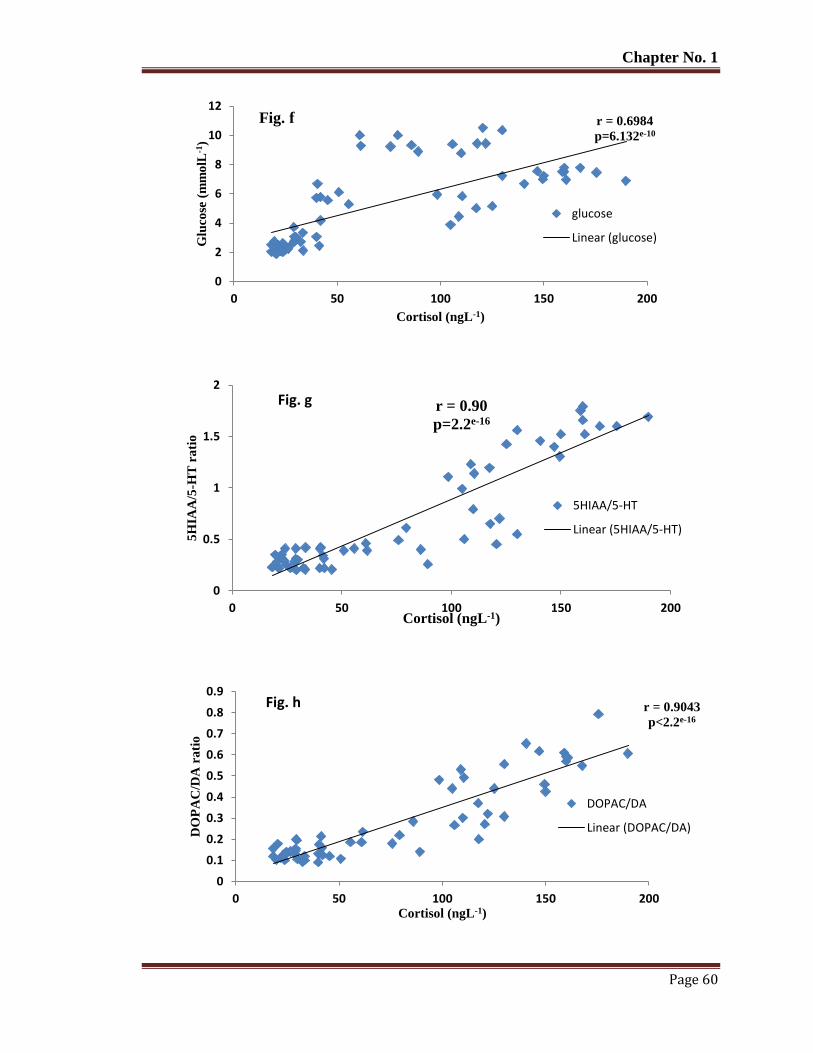
Chapter No. 1
Page 60
r = 0.6984
p=6.132e-10
0
2
4
6
8
10
12
0 50 100 150 200
Glu
cose
(m
mo
lL-1
)
Cortisol (ngL-1)
Fig. f
glucose
Linear (glucose)
r = 0.90
p=2.2e-16
0
0.5
1
1.5
2
0 50 100 150 200
5H
IAA
/5-H
T r
ati
o
Cortisol (ngL-1)
Fig. g
5HIAA/5-HT
Linear (5HIAA/5-HT)
r = 0.9043
p<2.2e-16
0
0.1
0.2
0.3
0.4
0.5
0.6
0.7
0.8
0.9
0 50 100 150 200
DO
PA
C/D
A r
ati
o
Cortisol (ngL-1)
Fig. h
DOPAC/DA
Linear (DOPAC/DA)
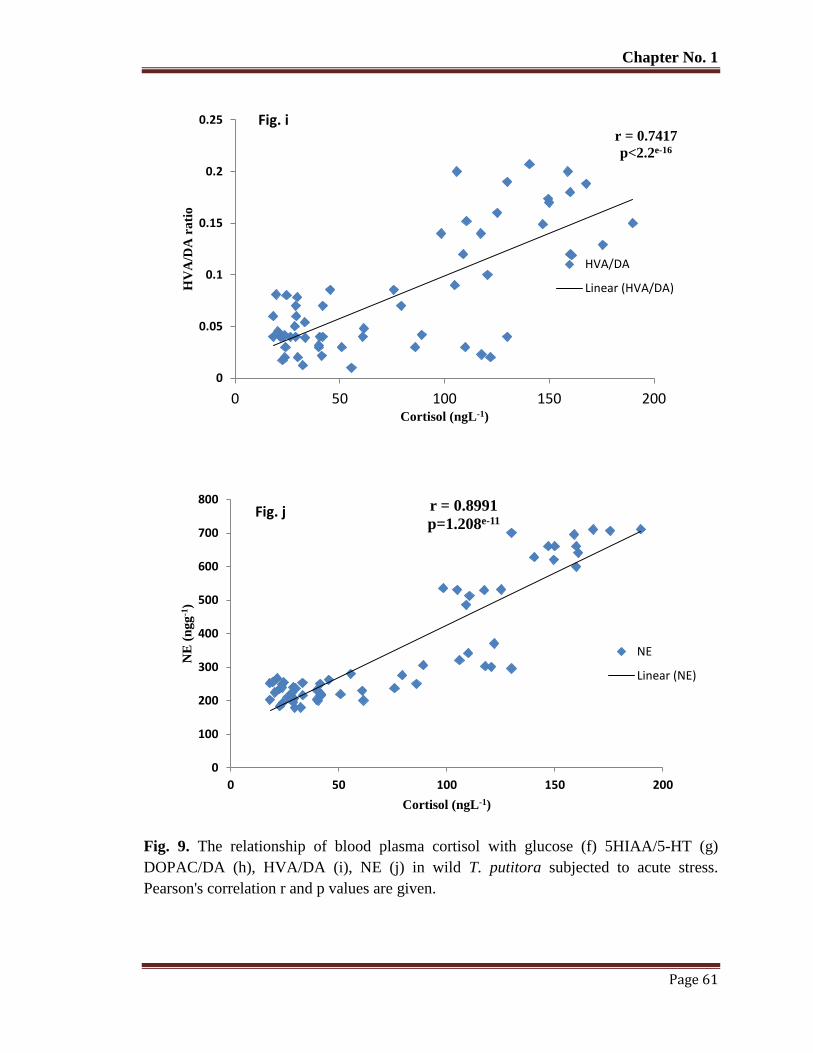
Chapter No. 1
Page 61
Fig. 9. The relationship of blood plasma cortisol with glucose (f) 5HIAA/5-HT (g)
DOPAC/DA (h), HVA/DA (i), NE (j) in wild T. putitora subjected to acute stress.
Pearson's correlation r and p values are given.
r = 0.7417
p<2.2e-16
0
0.05
0.1
0.15
0.2
0.25
0 50 100 150 200
HV
A/D
A r
ati
o
Cortisol (ngL-1)
Fig. i
HVA/DA
Linear (HVA/DA)
r = 0.8991
p=1.208e-11
0
100
200
300
400
500
600
700
800
0 50 100 150 200
NE
(n
gg
-1)
Cortisol (ngL-1)
Fig. j
NE
Linear (NE)
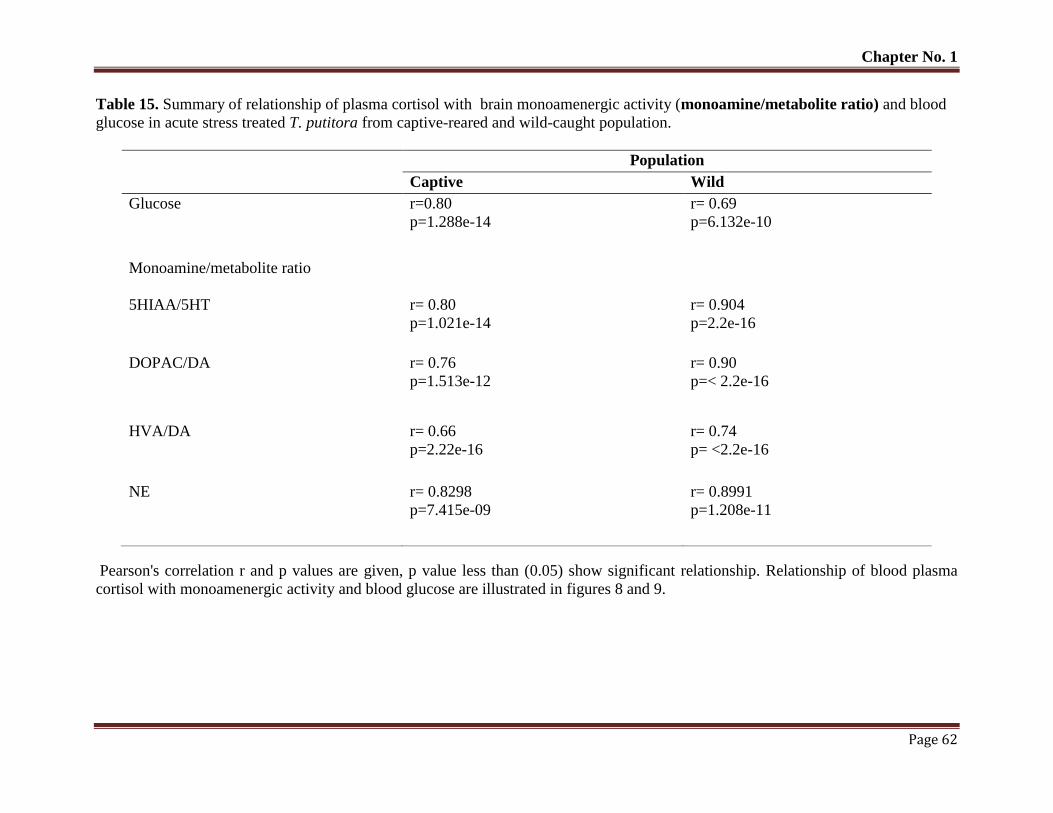
Chapter No. 1
Page 62
Table 15. Summary of relationship of plasma cortisol with brain monoamenergic activity (monoamine/metabolite ratio) and blood
glucose in acute stress treated T. putitora from captive-reared and wild-caught population.
Population
Captive Wild
Glucose r=0.80
p=1.288e-14
r= 0.69
p=6.132e-10
Monoamine/metabolite ratio
5HIAA/5HT r= 0.80
p=1.021e-14
r= 0.904
p=2.2e-16
DOPAC/DA r= 0.76
p=1.513e-12
r= 0.90
p=< 2.2e-16
HVA/DA r= 0.66
p=2.22e-16
r= 0.74
p= <2.2e-16
NE r= 0.8298
p=7.415e-09
r= 0.8991
p=1.208e-11
Pearson's correlation r and p values are given, p value less than (0.05) show significant relationship. Relationship of blood plasma
cortisol with monoamenergic activity and blood glucose are illustrated in figures 8 and 9.
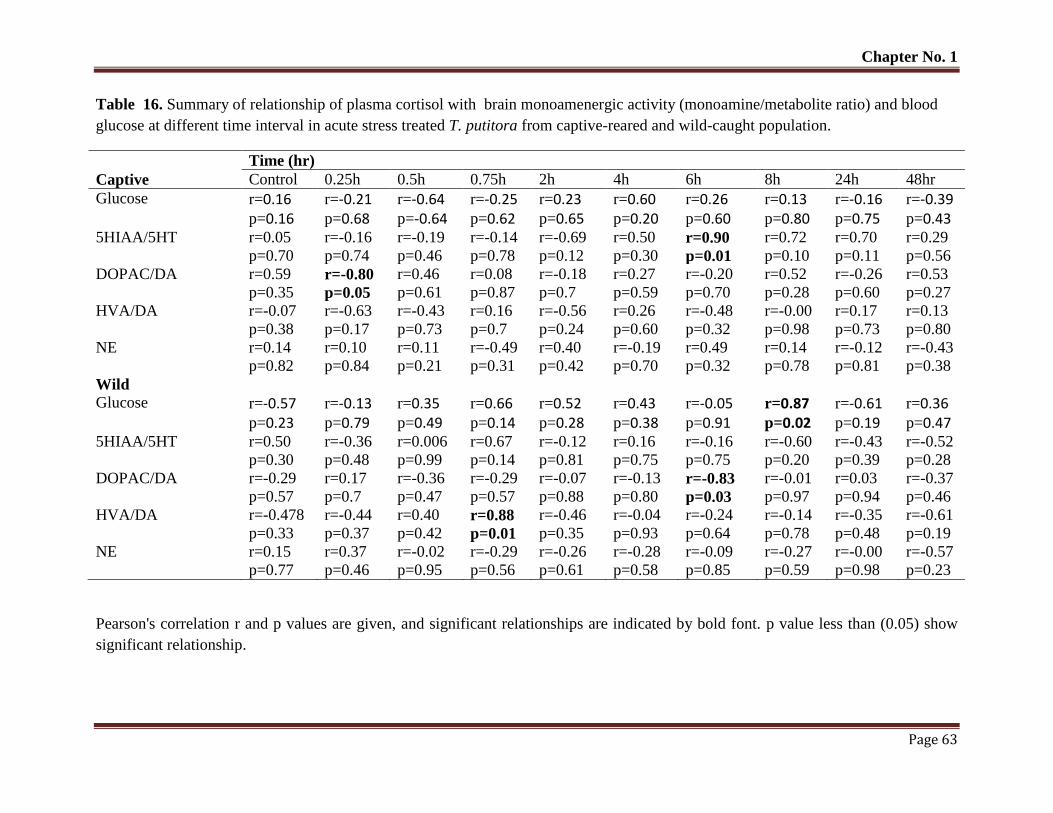
Chapter No. 1
Page 63
Table 16. Summary of relationship of plasma cortisol with brain monoamenergic activity (monoamine/metabolite ratio) and blood
glucose at different time interval in acute stress treated T. putitora from captive-reared and wild-caught population.
Time (hr)
Captive Control 0.25h 0.5h 0.75h 2h 4h 6h 8h 24h 48hr
Glucose r=0.16
p=0.16 r=-0.21
p=0.68 r=-0.64
p=-0.64 r=-0.25
p=0.62 r=0.23
p=0.65 r=0.60
p=0.20 r=0.26
p=0.60 r=0.13
p=0.80 r=-0.16
p=0.75 r=-0.39
p=0.43 5HIAA/5HT r=0.05
p=0.70
r=-0.16
p=0.74
r=-0.19
p=0.46
r=-0.14
p=0.78
r=-0.69
p=0.12
r=0.50
p=0.30 r=0.90
p=0.01
r=0.72
p=0.10
r=0.70
p=0.11
r=0.29
p=0.56
DOPAC/DA r=0.59
p=0.35 r=-0.80
p=0.05
r=0.46
p=0.61
r=0.08
p=0.87
r=-0.18
p=0.7
r=0.27
p=0.59
r=-0.20
p=0.70
r=0.52
p=0.28
r=-0.26
p=0.60
r=0.53
p=0.27
HVA/DA r=-0.07
p=0.38
r=-0.63
p=0.17
r=-0.43
p=0.73
r=0.16
p=0.7
r=-0.56
p=0.24
r=0.26
p=0.60
r=-0.48
p=0.32
r=-0.00
p=0.98
r=0.17
p=0.73
r=0.13
p=0.80
NE r=0.14
p=0.82
r=0.10
p=0.84
r=0.11
p=0.21
r=-0.49
p=0.31
r=0.40
p=0.42
r=-0.19
p=0.70
r=0.49
p=0.32
r=0.14
p=0.78
r=-0.12
p=0.81
r=-0.43
p=0.38
Wild
Glucose r=-0.57 r=-0.13 r=0.35 r=0.66 r=0.52 r=0.43 r=-0.05 r=0.87 r=-0.61 r=0.36 p=0.23 p=0.79 p=0.49 p=0.14 p=0.28 p=0.38 p=0.91 p=0.02 p=0.19 p=0.47 5HIAA/5HT r=0.50
p=0.30
r=-0.36
p=0.48
r=0.006
p=0.99
r=0.67
p=0.14
r=-0.12
p=0.81
r=0.16
p=0.75
r=-0.16
p=0.75
r=-0.60
p=0.20
r=-0.43
p=0.39
r=-0.52
p=0.28
DOPAC/DA r=-0.29
p=0.57
r=0.17
p=0.7
r=-0.36
p=0.47
r=-0.29
p=0.57
r=-0.07
p=0.88
r=-0.13
p=0.80 r=-0.83
p=0.03
r=-0.01
p=0.97
r=0.03
p=0.94
r=-0.37
p=0.46
HVA/DA r=-0.478
p=0.33
r=-0.44
p=0.37
r=0.40
p=0.42 r=0.88
p=0.01
r=-0.46
p=0.35
r=-0.04
p=0.93
r=-0.24
p=0.64
r=-0.14
p=0.78
r=-0.35
p=0.48
r=-0.61
p=0.19
NE r=0.15
p=0.77
r=0.37
p=0.46
r=-0.02
p=0.95
r=-0.29
p=0.56
r=-0.26
p=0.61
r=-0.28
p=0.58
r=-0.09
p=0.85
r=-0.27
p=0.59
r=-0.00
p=0.98
r=-0.57
p=0.23
Pearson's correlation r and p values are given, and significant relationships are indicated by bold font. p value less than (0.05) show
significant relationship.
Chapter No. 1
Page 64
4. Discussion
The current results revealed that captive reared T. putitora showed subsequently
different physiological stress response after being exposing common stressor i.e., 5 min
chasing with hand net and 2 min confinement as compared to wild counterpart. Results
of ANOVA of all physiological stress parameters clearly showed significant difference
between two populations (Tables 1, 3, 5, 7, 9, 11, 13). Generally, wild population showed
a rapid response to stressor and early recovery (Barton, 2002; Iwama et al., 2006; Zuberi
et al., 2011) as compared to captive reared population which showed attenuated response.
We are confident that differences in response between populations are due to altered
developmental patterns of captive-reared population because the experiment was
conducted in similar conditions and both populations were exposed similar stressor.
Similar difference in stress response of captive and wild population have been reported
already in many teleost species (Winberg et al., 2001; Perreault et al., 2003; Lepage et al.,
2005; Zuberi et al., 2011; Gesto et al., 2013)
Cortisol is an extensively used indicator of stress (Barton, 2000; Fridell et al.,
2007) and is often considered as an indicator of fish welfare (e.g. North et al., 2006;
Turnbull et al., 2005; Varsamos et al., 2006), it rapidly increases in stressful condition
(Zuberi et al., 2011; Barton, 2002; Wendelaar Bonga, 1997; Simontacchi et al., 2008;
Wilkes et al., 2012) like netting, crowding, handling, live hauling (Vijayan et al., 1997;
Arends et al., 1999) and exposure to predators (Zuberi et al., 2011). Cortisol secretion is
the major end result of physiological stress response and it regulates energy metabolism
(Wendelaar Bonga, 1997) and affect the fitness of the organism. Our results demonstrated
a considerable difference in pre-stress and post stress plasma and water-borne cortisol
levels in wild caught and captive reared mahseer (Table 2, 4, Fig.1, 2). Cortisol levels
after exposure to stress confirm the view that wild fish showed a typical stress response
that is rapid increased in plasma and water borne levels, i.e. at 0.75 and 2hrs respectively,
after acute stress followed by rapid recovery, at 6 and 8 hrs respectively (Zuberi et al.,
2011; Iwama et al., 2006; Barton, 2002) while captive reared mahseer showed atypical
response. The cortisol level in the captive population increases slowly and showed a
continuously increasing trend even after 4 (Plasma) and 6 hrs (Water-borne). The
Chapter No. 1
Page 65
experiment was conducted in replicate under the similar environmental condition by
using similar stress stimulus; therefore we are certain that variation in response appeared
due to physiological difference of both populations.
The results of acute stress response of wild mahseer were similar to those
observed in other fish species where the stress response normally appears between 30
min and 4 h after exposure to a stressor (Zuberi et al., 2011; Barton, 2002; Scott et al.,
2008). For example, wild caught rainbow fish (Melanoteania duboulayi) showed a
marked increase in the cortisol release rate within 30 min after exposing stress by chasing
with a simulated predator (Zuberi et al., 2011) and showed a recovery trend within 4 hrs
similar to observed in case of wild mahseer population compared to captive reared
mahseer. Similarly, in rainbow trout, Oncorhynchus mykiss Walbaum plasma cortisol
levels peaked within 30 min after the onset of mild confinement stress (Pottinger and
Moran, 1993) while water cortisol level peaked at 2 hr post mild handling stress
followed by recovery (Ellis et al., 2004). Moreover, in carp, Cyprinus carpio L. cortisol
levels returned to basal levels after 4 hr of exposure to stress by capturing and holding in
nets (Pottinger, 1998).
In acute stress the release of cortisol is temporary and it provides energy to cope
with the environment, while the prolong release of this hormone resulted in adverse
effects. The present study showed that in captive reared mahseer, water borne cortisol
level at 2 hr was 44.91 ± 91 µgL-1
statistically comparable to peak level (46.48 ± 3.32
µgL-1
) at 4 hrs, then showed decreasing trend (Fig.1, Table. 2). This result is somewhat
different with the stress response of captive reared Melanoteania duboulayi (Zuberi et al.,
2011) where water-borne cortisol increased after 4 hr of stress exposure and remained at
elevated levels. It may be due to the captive bred generation used for experimental
purpose. We used fourth generation of T. putitora as compared to fifteenth generation of
M. duboulayi. However, wild population of T. putitora showed a similar trend as
reported for wild Melanoteania duboulayi (Zuberi et al., 2011) i.e. attainment of peak
levels at 2 hrs post stress and rapid recovery. Our results of gradual increased in water-
borne cortosl for an extended period in captive reared mahseer further showed the odd
physiological response of hatchery reared fish.
Chapter No. 1
Page 66
Physiological stress response and cortisol levels after experiencing a stressful
event is heritable factor (Fevolden et al., 1991; Fevolden and Roed, 1993; Pottinger et al.,
1994; Fevolden et al., 1999), while stress responses heritability (h2) may vary noticeably
in population and species under consideration. Many scientists suggest that even a single
generation under hatchery conditions can showed profound effect on the behaviour of
fish (Álvarez and Nicieza, 2003; Salonen and Peuhkuri, 2006) while repeated stressors
can increase the heritability of plasma cortisol (Fevolden et al., 1999). In hatchery-reared
Atlantic salmon and rainbow trout heritability value of stress response were 0.05 and 0.27
respectively, while it increased to 0.56 in rainbow trout after repeated stressors (Fevolden
et al., 1999). Moreover magnitude of corticosteroid response is different among species
and depends upon the duration and severity of the stressor, environmental conditions and
developmental stage of fish (Ellis, 2004; Barton, 2002).
In fish bile, urine and gills are three main ways through which free steroids are
cleared from plasma and released into the water (Vermeirssen and Scott, 1996; Sorensen
et al., 2000). Mostly cortisol is released from the anterior region of the gills (a passive
‘leakage’) due to concentration gradient among plasma and surrounding waters (Scott et
al., 2002). Like our methodology, many investigators adopted both invasive (From blood)
and non-invasive (through water) techniques for examining the difference in
corticosteroids response to stressors in various fish species (Ellis, 2004; Barton, 2002).
In the present study, we have been using both invasive and non-invasive
approaches to screen the possible effect of rearing environment on the physiology of fish.
The plasma level of cortisol in a wild mahseer was 167 ± 0.04 ngL-1
, significantly (P <
0.05) higher than observed in captive reared mahseer (135.23 ± 5.84 ngmL-1
) (Fig. 2,
Table 4). These findings support over non-invasive results because it is well documented
that in fish water-borne cortisol level correlated with the plasma cortisol concentration
(Ellis et al., 2004). Furthermore, the results further provide evidence of the negative
impact of the captive rearing environment on the behaviour and stress response of fish.
In addition to enhancing the concentration of blood cortisol, stress typically
elevate plasma glucose levels (Pottinger et al., 2000) and this is initially boosted by
catecholamine-mediated glycogenolysis and later on by cortisol-mediated
Chapter No. 1
Page 67
gluconeogenesis (Begg and Pankhurst, 2004; Mommen et al., 1999; Guesto et al., 2016).
Cortisol and glucose are the reliable indicator of fish stress and increase level of glucose
indicate the demand of energy arise to cope with the stressful situation (Martínez-
Porchas, et al., 2009). Post-stress increases in plasma glucose are sometimes used as
alternate for activation of the HPI axis. Rises in plasma glucose may be limited in species
with limited hepatic glycogen stores (Pottinger et al., 2002; Wright et al., 2007) or show a
different increase and recovery profiles from cortisol (Pickering et al., 1982; Pottinger,
1998; Flodmark et al., 2002).
In current observation, we find no difference in basal levels of blood glucose in
both populations. However, we demonstrate here the typical increase blood glucose in
response to acute stress in wild mahseer compared to captive reared one (Table 6. Fig 3).
In current findings, blood glucose level showing an increasing trend within the initial 15
min post stress, while peak level were observed at 2 and 4 hr post stress and then
gradually decrease from 4 hr to 48 hr after stress. In the available studies, plasma glucose
usually returned to basal levels in a few hours, although recovery times strongly depend
on the species, the kind of stressor and exposure time (Biron and Benfey, 1994; Wilson et
al., 1998; Arends et al., 1999; Small, 2004; Aluru and Vijayan, 2006; Fast et al., 2008).
Similar to cortisol, the glucose levels were also returned to pre-stress values but had
taken longer time period about 24 hrs (wild population) and 48 hrs (Captive reared)
after acute physical stress compared to cortisol (Fig. 3) . Similar higher time to recover a
normal level was also reported in other teleost fish (Bracewell et al 2004; Jentoft et al.,
2005; King and Berlinsky, 2006; Fast et al., 2008). It appears that like previous
observations, blood glucose profile in both populations did not match the cortisol profiles
(Pickering et al., 1982; Pottinger, 1998; Flodmark et al., 2002). As blood glucose levels
of mahseer increased in two phases, an initial fast increase occurred in less than 0.5 h,
and is most probably the result of an increase glycogenolytic process in liver elicited by
enhanced levels of central and blood catecholamines (Guesto et al., 2016). A second
increase was observed between 45 min and 2 hrs to 4hrs, which could be related to the
secondary effects of cortisol promoting gluconeogenesis in the liver (Mommsen et al.,
1999). Similar observation reported by Guesto et al. (2016) in rainbow trout that after 5
min chasing stress plasma cortisol increased in two phases. Furthermore, captive reared
Chapter No. 1
Page 68
mahseer showed lower level of glucose at all time periods after stress as compared to
wild counterpart (Table 6, Fig. 3).. This difference in the magnitude of the glucose and
recovery time may be due to differences in previous rearing environment.
It has been reported that when fish confront a stressful condition brain serotonin
(5-HT) and catecholamine (DA and NE) systems are also activated (Winberget al., 1992;
Papoutsoglou et al., 2006; Karakatsouli et al., 2007). The elevation of 5-HIAA/5-HT
and DOPAC/DA ratios in several brain areas and up-regulation of 5-HT synthesis
appears to be an important mechanism to cope with stress (Lepage et al., 2000).
Backström et al. (2011) observed increase concentrations of brain 5-HT, 5-HIAA and
HVA and HVA/DA ratios in response to confinement. Furthermore, Øverli et al. (1999)
observed a gradual increase over time in monoamine metabolites in brain stressed fish.
Like others, we also observed increase levels of brain 5-HT/5-HIAA, DOPAC/DA, NE
and HVA/DA in response to acute stress (5 min chasing and 2 min confinement)
suggesting that a stress-induced activation of brain dopaminergic and serotonergic
systems. However, we did not find any significant variation in basal levels of
5HIAA/5HT, DOPAC/DA, NE and HVA/DA ratios between captive reared and wild
caught T. Putitora.
Acute stress caused a rapid activation of dopaminergic and serotonergic systems
in both populations (Captive reared and wild caught mahseer) indicated by elevated
levels of 5-HT/5-HIAA, DOPAC/DA, NE and HVA/DA ratios (Tables 8, 10, 12, 14
Figurs 4, 5, 6, 7).. The significant (P < 0.05), two way interactions between population
and treatment of HT/5-HIAA ratio (Table 7) and NE (Table 13) revealed the
difference in physiological stress response of both populations. The effect of stress on
the increasing trend of serotonergic activity was transient, and serotonergic ratio returns
back to control levels in a few hours (4 to 6 hr; Fig. 4). Although, like blood cortisol and
glucose, serotonergic activity also showed recovery, but in the quick way, i.e. within 4
(wild population) to 6 hr (captive reared mahseer) as compared to 8 to 24 hrs (Fig. 4) .
The observed peaks in serotonergic activities at 0.75 h after stress could be the result of
the indirect effects of other participants in the stress response such as cortisol, which is
Chapter No. 1
Page 69
known to promote serotonergic activation fish (Gesto et al., 2016; Summers and
Winberg, 2006; Weber et al., 2012).
Brain serotonergic systems influence cortisol secretion under normal and during
moderate or short-term stress (Overli et al., 1999). It appears that brain 5-HT could also
play an important role in the regulation of the HPI axis (Winberg et al., 1997). In the
mammalian brain, 5-HT stimulates the release of CRH, which in turn activates
corticotrops of the pituitary (Chaouloff, 1993; Dinan, 1996). There is also an evidence of
direct action of 5-HT on corticotrops of the mammalian pituitary (Chaouloff, 1993;
Dinan, 1996). Although the influence serotonergic systems with the release of cortisol
is not well studied in fish, but Winberg and Nilsson (1993) suggested a relationship
between HPI axis and the brain 5-HT system and reported dose dependent elevation of
plasma cortisol after treatment of rainbow trout (Oncorhynchus mykiss) with a potent 5-
HTIA receptor agonist, 8-hydroxy-2-(di-n-propylamino)-tetralin (8-OH-DPAT) (Winberg
et al., 1997). We also find positive correlation between plasma cortisol and brain
monoamines (Table 15, 16 Figurs. 8, 9) and suggest the influence of monoamines in the
regulation of HPI axis. In fact, the involvement of serotonergic activity in the stress
response is very complex and in mammals 5HT probably stimulates CRF release by the
hypothalamus (Boisvert et al., 2011; Calogero et al., 1989) and ACTH release from the
pituitary (Calogero et al., 1993). However, in fish, no such study is available.
In mammals, both stimulatory and inhibitory effects of stress on dopaminergic
activity have been reported (Höglund et al., 2001; Waters et al., 2005). In fish, several
studies have reported a stimulatory action of different kinds of stressors on the central
dopaminergic system (Backström et al., 2011; Gesto et al., 2008; Øverli et al., 1999;
Weber et al., 2012). Lepage et al., (2000) reported differences in post-tress midbrain
DOPAC/DA ratios between wild and domesticated fish. Domesticated fish displayed
lower post-stress brain 5-HIAA/5-HT and DOPAC/DA ratios than wild trout (Lepage et
al., 2000). In current study DOPAC/DA ratio increased after stress in the brain of
mahseer in both populations supporting the idea that the activation of the dopaminergic
activity due to acute stress.However, DOPAC/DA as well as HVA/DA did not show
significant interactions between population and treatment (p = 0.48, Table 9). It appears
Chapter No. 1
Page 70
that these parameters are not reliable indicators to differentiate populations on the basis
of small physiological difference. Captive reared and wild caught mahseer, although
showed statistically different physiological stress response with respect to blood and
water-borne cortisol, blood glucose, 5HIAA/5-HT and NE, but except NE all
parameters did not show highly significant interactions between population and
treatment. It may be due to interbreeding of wild and captive reared fish because of
restocking program or due to the small genetic distance between population as we have
used 4th
generation captive reared fish.
In the present study, the increase in concentration of NE after stress in both
populations indicated the involvement of the brain noradrenergic system. Like our
results, Øverli et al. (1999) also reported the rapid activation of brain norepinephric (NE)
systems in rainbow trout after acute stress. It has been reported that the NE system
involve in the stress response in mammals (Dunn et al., 2004) and probably in fish
(Øverli et al., 2001). Although both captive reared and wild mahseer had a similar basal
level of NE but the exposure of acute stress showed a significantly higher level NE at
different time interval in a wild population, compared to captive reared counterpart
indicating the difference in physiological stress response of both populations which may
be due to captive rearing divergence of hatchery reared fish.
Conclusion
The present study has demonstrated that wild-caught mahseer demonstrate
different stress response compared to the captive-reared counterpart. These findings
suggest that captive rearing can lead mahseer in the physiological divergence from wild
fish. The physiological stress response, which compared the blood plasma (invasive) and
water-born (non-invasive) cortisol, blood glucose and brain monoamines of wild mahseer
with that of their captive-reared counterparts, revealed differences in HPI-axis the level
of stress response. Thus the outcomes of this study suggest a modification of the hatchery
rearing environment in such a way that will produce fish, physiologically comparable to
their wild counterpart. These findings have important implications for a possible way of
Chapter No. 1
Page 71
improving the welfare of mahseer and in the long term improve the conservation of this
endangered species.
Chapter No. 2
Page 72
Chapter # 2
Evaluation of life skills behaviour of Captive-reared and Wild-caught
Endangered Fish Mahseer (Tor putitora)
Chapter No. 2
Page 73
ABSTRACT
Release of hatchery reared fish in the natural environment is one of the most important
strategies to replenish the natural stock of endangered fish species. Most of the
reintroduction projects are not providing the desired results, since captive-reared fish
may not possess the behavioural skills required for survival in the natural environment.
Behaviour differences between captive and wild caught fish have frequently been
observed. Here an attempt has been made to evaluate variation in the life skill
behaviours of captive-reared and wild-caught endangered fish mahseer (Tor putitora).
Under laboratory trials, boldness, exploratory, predatory and anti-predatory behaviour
of both populations were compared. The initial behavioural descriptions of mahseer
showed that wild fish display significantly (p ˂ 0.05) more exploratory, predatory and
anti-predatory behaviour in comparison to the captive reared fish. However, captive
mahseer appeared bolder as compared to their wild counterpart. These results specify
the role of rearing environment in shaping the behaviour of fish and suggest an
improvement in the already existing rearing environment, to reduce the behaviour
deficiencies and increase the post survivourship of captive reared mahseer.
Chapter No. 2
Page 74
1. Introduction
Release of captive reared animals in the natural environment is one of the most
important strategy for the conservation of severely depleted populations (Myers et al.,
2004; Braithwaite and Salvanes, 2005; Araki, et al., 2008) and replenishment of
fishery stocks to the levels that can support sustainable fisheries (Bell et al., 2006;
Lorenzen, 2005). These programs are generally used to mitigate the effects of over-
fishing, recruitment failures and environmental degradation (Myers et al., 2004).
However, the success rate of such programs would be based on both survival and
fitness of the released fish in their natural habitat. Several studies reported the low
survival of newly released hatchery reared fish in many such restocking practices
(Olla et al., 1998; Ellis et al., 2002; Araki et al., 2008), may be due to poor
performance after the release in the natural environment (Le Vay et al., 2007; Garlock
et al., 2014).
Rearing conditions strongly affect the ability of the fish to acquire important
life skills, such as predator recognition and avoidance (Yamamoto and Reinhardt,
2003; de Azevedo and Young, 2006), exploratory, predatory, foraging behaviours
(Johnsson et al., 2014), boldness (Kelley et al., 2006) and reproductive behaviour
(Kelley et al., 2006; Berejikian et al., 2009). The captive environment differs from
the wild in complexity of habitat, food availability, stocking densities and human
intervention (Huntingford, 2004). Consequently, captive animals, encounter
experiences different compared to wild counterpart. Several studies on hatchery
reared fish reveals that, lack of appropriate variation (physical, social etc.) in the
rearing environment, influences the phenotype ranging from physiology to behaviour
(Huntingford, 2004; Brännäs and Johnsson, 2008).
Captive rearing plans fail to raise individuals with natural behaviour (Araki et
al., 2008), affect the life-skills training and produces behaviorally deficient
individuals, lacking the skills to cope the challenges of wild environments (Brown
and Day, 2002; Huntingford, 2004; Bell et al., 2006; Le Vay et al., 2007; Araki et al.,
2008; Garlock et al., 2014; Johnsson et al., 2014), hence affecting the success of
reintroduction strategies (McPhee, 2003).
Chapter No. 2
Page 75
In captivity, at hatcheries, fish are typically grow in static, featureless
environments at high densities and in an excess of pellet food, thus preventing them
from competition and learning how to capture natural live prey, while wild fish which
live in more complex environments learn by previous exposure (Sundström and
Johnsson, 2001; Huntingford, 2004). Moreover, due to the absence of predators, fish
in captivity do not trade off between risk of predation and other activities like
foraging opportunities and courtship behaviour (Huntingford, 2004). Several studies
have demonstrated that high stocking density in the captive rearing environment
promotes aggression (Kaiser et al., 1995; Kelley et al., 2006). Aggressive behaviour
is often correlated with other traits such as boldness and bold individuals seek less
refuge and take greater risks to exploit the resources (Ward et al., 2004; Kelley et al.,
2006). Generally boldness is associated with life skill activities like foraging and
exploration, anti-predator behaviour, mate selection, learning ability, etc. (Brown et
al., 2007a; Wilson and Stevens, 2005) and is correlated with fitness-related traits
(Sinn et al., 2006; Brown et al., 2007b). Hence, captivity strongly affects the ability of
fish to acquire important life skills and raise questions to the validity of stock
supplementation from hatchery reared fish (Brown and Day, 2002; Huntingford,
2004; Trushenski et al., 2015).
Early life experiences and rearing environments shape an animal behaviour
and personality (Huntingford, 2004; El Balaa and Blouin-Demers, 2011). The
hatchery selection favours fish that are well adapted to captivity, but maladaptive to
the wild leading to differences in behaviour, physiology and survival (Christie et al.,
2012). Investigating the influence of captive rearing and evaluating the behaviour of
wild and captive animals is of particular importance in many contexts, including
conservation biology, behavioural ecology and captive breeding programs to restore
the wild populations (ElBalaa and Blouin-Demers, 2011).
Mahseer is among the most important semi-cold freshwater fish of Pakistan
and South Asian countries. It has great importance as food and for sport fishing
(Khajuria and Langer, 2016). However, its population in the wild environment is
reported to be declining due to several human and environmental factors and
therefore, it is declared as an endangered fish (IUCN, 2015). Fish scientists emphasize
special attention to protect this fish species from future extinction (Bhatt et al., 2016).
Chapter No. 2
Page 76
The Pakistan government has also realized the economic importance of mahseer, and
has taken steps for their conservation. Hatcheries have been established in the Punjab,
Azad Jammu and Kashmir (AJK) and Khyber Pukhtunkhwa (KP) for the artificial
propagation of this species. Moreover, for replenishment of the river and other natural
bodies, restocking program has been initiated that involve the release of artificially
propagated hatchery reared fish in natural bodies. In spite of ample efforts, the results
are not encouraging and captures of this species from natural reservoirs is
continuously declining (Personal observation and communication with Punjab
Fisheries, AJK fisheries and KP fisheries departments). It seems that hatchery reared
mahseer in the natural environment underwent heavy mortality, which may be due to
behavioural deficiencies.
We predicted that distinct captive and wild environments will generate
differences in many aspects of behavioural skills of mahseer, through differential
exposure during early development and rearing. Therefore, we designed an
experiment to study the behaviour of wild-caught and captive-reared endangered fish
and anticipated that the results will help to understand the impact of rearing
environment in shaping the behaviour, as well as help to develop a proper culture
system that could promote the welfare and conservation of this species. Quantified
behavioural traits and life-skills of wild and hatchery reared fish will further be
associated with the success of release programs of hatchery reared mahseer into their
natural environment.

Chapter No. 2
Page 77
2. Materials and methods
2.1. Fish collection from wild environment
Wild caught mahseer (mean ± SEM body mass and length 15.5±0.37g; 9.2
±0.29 cm) were captured through drift gill net (size, 25m L× 4m W; mesh size, 2cm)
from River Haro, Attock 33°46'8" N, 72°14'43" E in DMS (Degrees, Minutes,
Seconds) and transported alive (3 g/L) in oxygen filled plastic bags (36 cm L × 24cm
W; 25 L water) to the Fisheries and Aquaculture Research Center, Department of
Animal Sciences, Quaid-I-Azam University Islamabad, Pakistan. Fish were initially
housed in replicates of three (with a stocking density of 1.5 g/L: 35 fish/tank) in well
aerated circular fibreglass tanks (volume, 500 L water) containing 1cm deep gravel
(black and white colour) substrate, river stones (5-6 cm diameter) and artificial plastic
plants (25 cm height: n = 10) for at least two weeks before any further
experimentation. Temperature and photoperiod were maintained at 22.5 °C and 12:12
h light and dark respectively. Water quality in terms of total ammonia (< 0.25mg/
L), pH (from 6.8 to 7.48) and dissolved oxygen (> 5.2 to 5.6 mg/L) were found to be
in the acceptable range for mahseer. During acclimation period, wild caught fish were
gradually weaned from live food onto prepared pelleted feed (sinking pellets; Oryza
Organics fish feed, size 2 mm; 45 % crude protein, 14 % fats, crude fibre 2 % and 10
% moisture. Fish were fed 4 % body weight twice daily (9:00 h and 17:00 h).
2.2 Fish collection from captive environment
2.2.1 Conventional breeding and rearing of Mahseer
In Pakistan, artificial propagation of mahseer in captivity was started in 2001
at Mahseer Fish Hatchery Hattian Attock, Punjab, Pakistan. Generally, at hatchery,
fish brooders are prepared in structureless concrete rectangular brooders tank (50×50
ft) on prepared pelleted feed. Hand stripping is the method in practice for obtaining
eggs and sperms. The fertilized eggs are spread on the fibreglass hatching tray (size,
1.5 ft W × 15 ft L) and are placed in a hatchery room under direct water sprinkling.
After hatching (70 to 100 hrs depending upon water temperature), the hatchlings are
shifted to barren circular concrete tank (7 ft diameter × 4 ft H). After semi-quiescent
Chapter No. 2
Page 78
stage (yolk sac absorption), when fry starts exogenous feeding, they are relocated in
semi-earthen ponds (50 W × 100 L ft), earthen bed with concrete walls, having natural
food organisms (phytoplankton, zooplankton, diatoms, some protozoa etc.) but
without common aquatic weeds or other substrate. They are raised up to fingerling
stage on live feed, plus pelleted feed by adopting monoculture technique or in
combination with other species like common carp (Cypriuns carpio), rohu (Labeo
rohita).
Breed of the fourth generation, captive reared mahseer (mean ± SEM body
mass and length 15.2 ± 0.58 g and 8.5 ± 0.23 cm) was collected from the hatchery and
also transported to the Fisheries and Aquaculture Research Center. The fish were
acclimated for at least 2 weeks in well-aerated circular fibreglass tank (volume, 500 L
water) with same stocking density as used for wild fish, before starting the
experiments. The fish were maintained under a controlled photoperiod (12:12 h day:
night) and temperature (22.5 °C). Water quality parameters were maintained at
optimum level.
2.3. Behavioural Study
2.3.1. Temperament assay
2.3.1.1. Assessment of boldness: Motivation to leave shelter
The boldness assay was performed by following procedure reported
previously (Ullah et al., 2017) for the same species. Briefly, a start box (30 cm L × 60
cm W × 60 cm H) having door in the centre of one wall was set in test aquarium (90
cm L × 60 cm W × 60 cm H) that three sides were covered with black plastic for
avoiding outside disturbances. Fish from experimental aquarium were transferred by
a hand net (30 cm × 30 cm) to the start box. An individual fish was placed into the
start box and provided 2 min settling period (a standard length of time in such
experiments). After settlement, a door of the start box was raised remotely by using a
fine monofilament and fish were timed until they emerged fully from this start box.
Those fish had not emerged after 10 min, were given a maximum score (10 min) of
emerging time while those emerged sooner were considered to be bolder.
Chapter No. 2
Page 79
2.3.1.2. Exploratory behaviour
Exploratory behaviour of mahseer reared in wild and captive environments
was studied by method reported previously (Ullah et al., 2017). Briefly, the test
aquarium was divided into three habitats by setting plastic plants on one quarter left
hand side and a white, non-transparent plastic “start box” (30 cm L × 60 cm W × 60
cm H) on another one quarter right-hand side of the aquarium, while the area
between the start box and the artificial plastic plants, were kept open.
One fish from each group was placed in the start box and allowed to
familiarize with the environment for 10 min. After that, the door (30 cm W × 30 cm
H) in the centre of one wall of the box facing the open area and vegetation area was
slowly open by lifting the door in the centre of the box. The door of the start box was
remained open until the end of the trial and measured the time spent by fish in the
start box area. If the fish had not left the box after 30 min, the test was ended. If the
fish had left the box, its position in the aquarium was recorded after every 30 sec for
10 min. The number of habitat shift between box, open and vegetation area was also
recorded for each individual fish during the trial. For evaluation of behavioural
difference, ten repeats (n=10) for each wild caught and captive reared population
were performed, with a new fish in each trial.
2.3.2. Feeding on live prey
Predation of wild caught and captive reared mahseer was studied according
to the method adopted by Ullah et al. (2017). Briefly, three sides of the test
aquarium (90 cm L× 24 cm W × 24 cm H) were covered with black plastic sheets,
leaving the long end facing the video camera uncovered. The bottom of the tank
was covered with 1 cm gravel bed with a plastic plant (25 cm H; n = 4) in one
quarter. Since mahseer prefers to feed in groups (Desai, 2003), five fish (n = 5
shoals per trial) from the wild or captive population were placed in an aquarium
where earthworm were present at a density of 2 earthworm per litre. To enhance
the feeding motivation, the mahseer was fasted for 24 h before feeding trial. The
time taken until the first attack on prey was recorded for each fish in the group.
Ten trials per population (wild and captive) were run with five new fish in each
Chapter No. 2
Page 80
trial. The trial ended when all fish attacked prey at least once, or after 120 min.
The feeding behaviour of fish (Table 1) was recorded by was recorded by video
camera connected to a computer was placed in front of the longe uncovered side of
the experimental tank as previously described by (Ullah et al., 2017) for the same
species.
Table 1. The Behaviour o f mahsee r observed during feeding on live prey
(earthworm) trial (Ullah et al., 2017).
Behaviour Description
Inspection Mahseer swims towards and observe the prey
Picking Mahseer picks up the live prey and suddenly leaves
them and rapidly move away from prey
Feeding Consumption of prey
2.3.3. Anti-predator response
Wild and captive reared mahseer were exposed to predator catfish Malli
(Wallago attu) to monitor the anti-predatory response of mahseer. Two equally sized
glass aquaria (90 cm L × 60 cm W × 60 cm H) were placed next to each other,
separated by a removable cardboard divider to prevent visibility between the
aquaria. One aquarium contained a freshwater predatory catfish at least doubles
the size of the of mahseer placed in the other aquarium. The two short ends of the
test aquarium containing the catfish were covered with black plastic sheets, with
the long ends facing the mahseer and the observers uncovered. Three sides of the
aquarium containing the mahseer were covered, with the long side facing the
catfish aquarium uncovered. The bottom of the tank was covered with 1 cm gravel
bed. In the left hand side corner of the mahseer aquarium, plastic plant was
offering a possible refugee occupied approximately one third of the aquarium. The
catfish and mahseer were allowed to acclimatize in the test aquarium for one hour
before the tests started. After 30 min, the divider was carefully removed, not to
startle the fish, allowing visual contact between mahseer and catfish. The feeding
behaviour of fish (Table 2) was recorded a video camera connected to a computer
placed in front of the longe uncovered side of the experimental tank during the
Chapter No. 2
Page 81
procedures every 30 sec during 10 min. For each population, 10 trials were run,
with one new fish in each trial.
Table 2. Behaviour observed during anti-predator response trials (Ullah et al., 2017)
Inactive Behaviour
Freeze Lying motionless on the bottom of the experimental tank
Hide Motionless or low activity within the refuge
Low activity Slow movement outside the refuge
Active Behaviour
Inspection Swims toward the predator /larger fish
Move away The mahseer moves directionally away from the predator
Skitter Rapid movements with frequent changes of direction
2.2. Statistical analysis
The results are expressed as mean ± SEM.. Statistical analysis was carried out
by using lme4 (Bates et al., 2014) and easynova (Arnhold 2013) package of R 3.2.5
(R Development Core Team, 2016). The assumption of normality, homogeneity of
variances and additivity of the model were checked by Shapiro-Wilks, Levene's and
Tukey 1-dF Test respectively. The effects of changing environment on exploratory,
predatory and anti-predatory behavioural responses were analysed by ANOVA in
factorial and split plot by using ea2 command of R with double factorial in completely
randomized design followed by post hoc Tukey's HSD. The data of boldness and
habitat shift were analysed by using Welch two sample t-test. Values of p < 0.05 were
considered statistically significant.
Chapter No. 2
Page 82
3. Results
3.1. Temperament assay
3.1.1. Boldness Assessment: Latency to leave shelter
There was a significant difference in latency to leave the shelter among two
different populations. Captive reared fish preferred to leave the box area sooner than
the wild caught fish (n = 10, mean ± SEM: 5.04 ± 0.55min and 7.13 ± 0.89 min,
respectively, t = -2.51, p<0.01; Fig. 1).
3.1.2. Exploratory behaviour
Exploratory behaviour of both populations showed significant difference (p <
0.001) (Table 3, Fig. 2). The proportion of time spent in b o x a r e a between
captive reared and wild caught mahseer was significantly different (n = 10, mean ±
SEM: 32.23 ± 3.65 min and 1 9 . 8 4 ± 2.67 min, respectively; Tukey’s post hoc, p
˂0.001). Similarly, time spent in the open area also showed significant differences
(n = 10, mean ± SEM: 46.12 ± 5.00 min and 28.69 ± 2.81 min respectively, Tukey’s
post hoc, p = 0.001). Wild caught as compared to captive reared fish preferred to
spend more time in the a r e a h a v i n g p l a n t s (n = 10, mean ± SEM: 51.47 ± 4.32
min and 21.68 ± 1.66 min, respectively, Tukey’s post hoc, p = 0.001). Fish of both
populations also showed significant differences in number of habitat shifts, i .e.
movement between three different areas of aquaria, box , open and vegetat ion
(n = 10, mean ± SEM: 5.34 ± 0.47 min and 7.63 ± 0.59 min respectively, t = 3.02, p
˂ 0.04; Fig. 3).
3.3. Live prey test
In live prey tests, a significant difference was observed among populations
(Table 3, Fig. 4). Wild caught and captive reared populations showed significant
difference in live prey inspection (n= 10, mean ± SEM: 45.17 ± 3.66 min and 23.88
± 1.36 min, respectively, Tukey’s post hoc, p = 0.001), Picking time of live prey (n =
10, mean ± SEM: 76.22 ± 5.04 min and 30.55 ± 2.71 min, respectively, Tukey’s post
Chapter No. 2
Page 83
hoc, p = 0.001) as well as feeding time on live earthworm (n = 10, mean ± SEM:
88.92 ± 7.81 min and 38.77 ± 3.92 min, respectively, Tukey’s post hoc, p < 0.001).
3.4. Anti-predatory behaviour
Anti-predatory behavioural response of both populations showed significant
difference (Table 3, Fig. 5). The captive reared fish performed significantly more
inactive behaviours (freeze, hide), than wild caught fishes. However, low activity is
an inactive behaviour which is significantly higher in wild reared fish. When
comparing the proportion of time spent performing behaviours separately, a
significant difference between the two populations in all anti-predatory behaviours
(active and inactive response) was observed. There was a significant difference in
freeze behaviour (n = 10, mean ± SEM : 26.11 ± 1.12 min, 13.37 ± 1.44 min, Tukey’s
post hoc, p < 0.001), Hide and Low activity behaviour (n = 10, mean ± SEM: 20.75 ±
2.08 min, 11.35 ± 1.22 min, 9.89 ± 1.5 min and 18.06 ± 1.08 min, respectively,
Tukey’s post hoc, p < 0.001) a n d Active behaviour (Inspection: n = 10, mean ±
SEM: 23.88 ± 1.96 min and 9.05 ± 0.55 min: Move away: n = 10, mean ± SEM:11.34
± 1.23 min and 28.01 ±1.53 min: Skitter: n = 10, mean ± SEM; 8.03 ± 0.96 min and
2 0 . 3 8 ± 2.68 min, respectively, Tukey’s post hoc, p < 0.001) between captive reared
and wild caught population (Fig. 5).
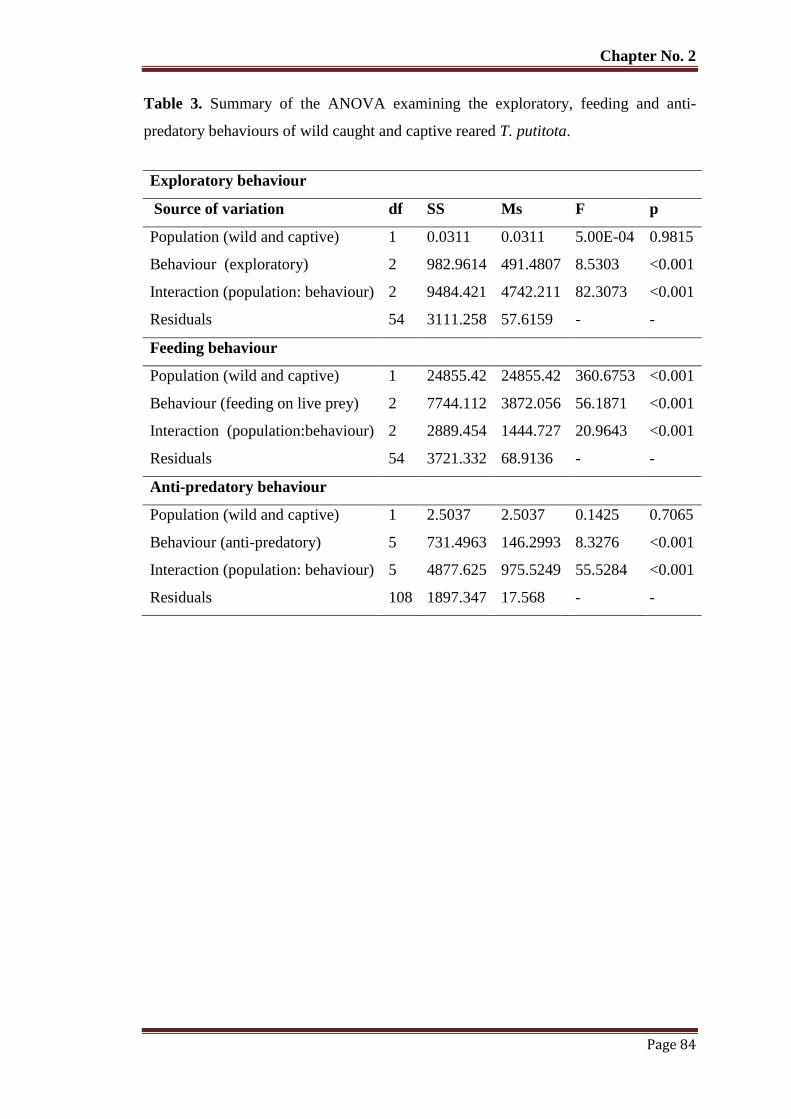
Chapter No. 2
Page 84
Table 3. Summary of the ANOVA examining the exploratory, feeding and anti-
predatory behaviours of wild caught and captive reared T. putitota.
Exploratory behaviour
Source of variation df SS Ms F p
Population (wild and captive) 1 0.0311 0.0311 5.00E-04 0.9815
Behaviour (exploratory) 2 982.9614 491.4807 8.5303 <0.001
Interaction (population: behaviour) 2 9484.421 4742.211 82.3073 <0.001
Residuals 54 3111.258 57.6159 - -
Feeding behaviour
Population (wild and captive) 1 24855.42 24855.42 360.6753 <0.001
Behaviour (feeding on live prey) 2 7744.112 3872.056 56.1871 <0.001
Interaction (population:behaviour) 2 2889.454 1444.727 20.9643 <0.001
Residuals 54 3721.332 68.9136 - -
Anti-predatory behaviour
Population (wild and captive) 1 2.5037 2.5037 0.1425 0.7065
Behaviour (anti-predatory) 5 731.4963 146.2993 8.3276 <0.001
Interaction (population: behaviour) 5 4877.625 975.5249 55.5284 <0.001
Residuals 108 1897.347 17.568 - -
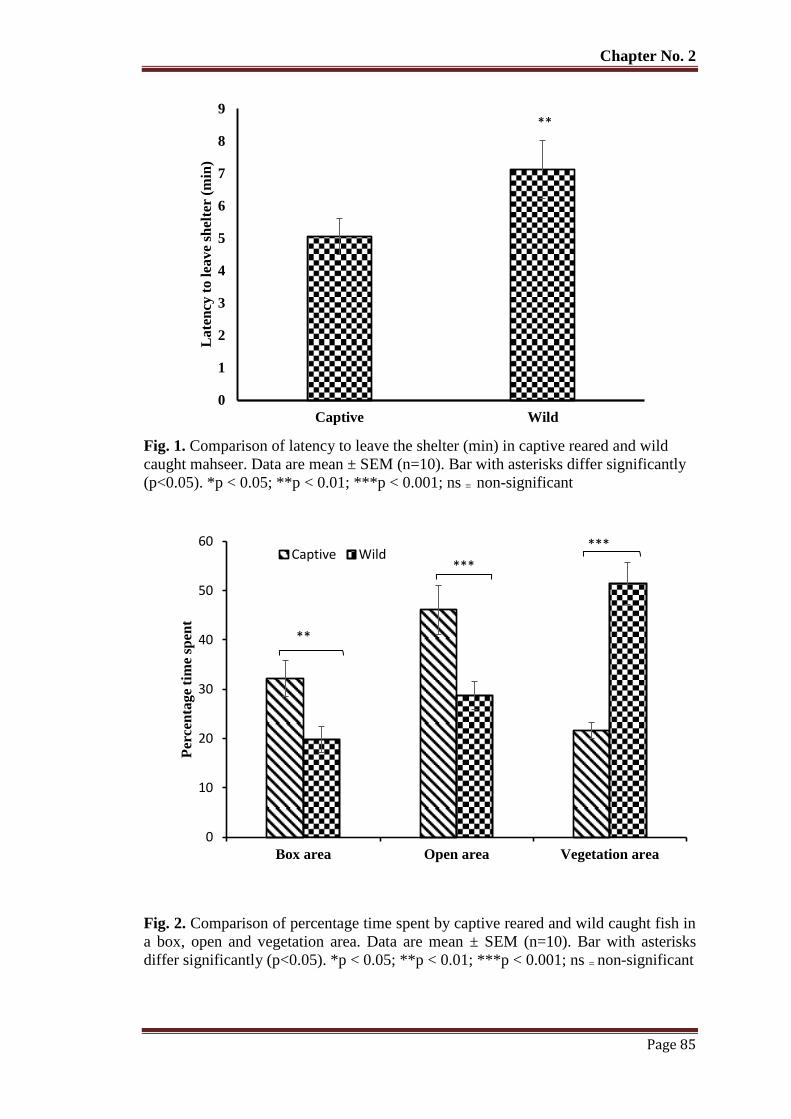
Chapter No. 2
Page 85
Fig. 1. Comparison of latency to leave the shelter (min) in captive reared and wild
caught mahseer. Data are mean ± SEM (n=10). Bar with asterisks differ significantly
(p<0.05). *p < 0.05; **p < 0.01; ***p < 0.001; ns = non-significant
Fig. 2. Comparison of percentage time spent by captive reared and wild caught fish in
a box, open and vegetation area. Data are mean ± SEM (n=10). Bar with asterisks
differ significantly (p<0.05). *p < 0.05; **p < 0.01; ***p < 0.001; ns = non-significant
0
1
2
3
4
5
6
7
8
9
Captive Wild
La
ten
cy
to
lea
ve s
helt
er (
min
)
**
0
10
20
30
40
50
60
Box area Open area Vegetation area
Per
cen
tage t
ime
spen
t
Captive Wild
**
***
***
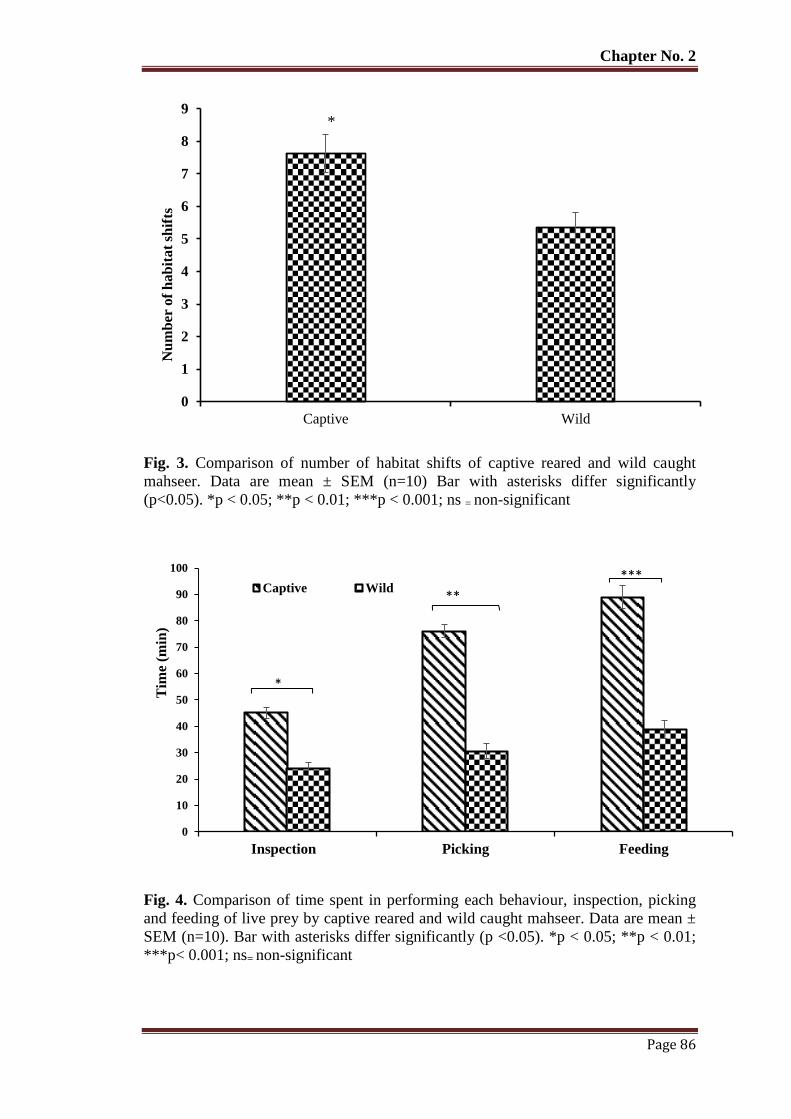
Chapter No. 2
Page 86
Fig. 3. Comparison of number of habitat shifts of captive reared and wild caught
mahseer. Data are mean ± SEM (n=10) Bar with asterisks differ significantly
(p<0.05). *p < 0.05; **p < 0.01; ***p < 0.001; ns = non-significant
Fig. 4. Comparison of time spent in performing each behaviour, inspection, picking
and feeding of live prey by captive reared and wild caught mahseer. Data are mean ±
SEM (n=10). Bar with asterisks differ significantly (p <0.05). *p < 0.05; **p < 0.01;
***p< 0.001; ns= non-significant
0
1
2
3
4
5
6
7
8
9
Captive Wild
Nu
mb
er o
f h
ab
itat
shif
ts
*
0
10
20
30
40
50
60
70
80
90
100
Inspection Picking Feeding
Tim
e (m
in)
Captive Wild
*
**
***
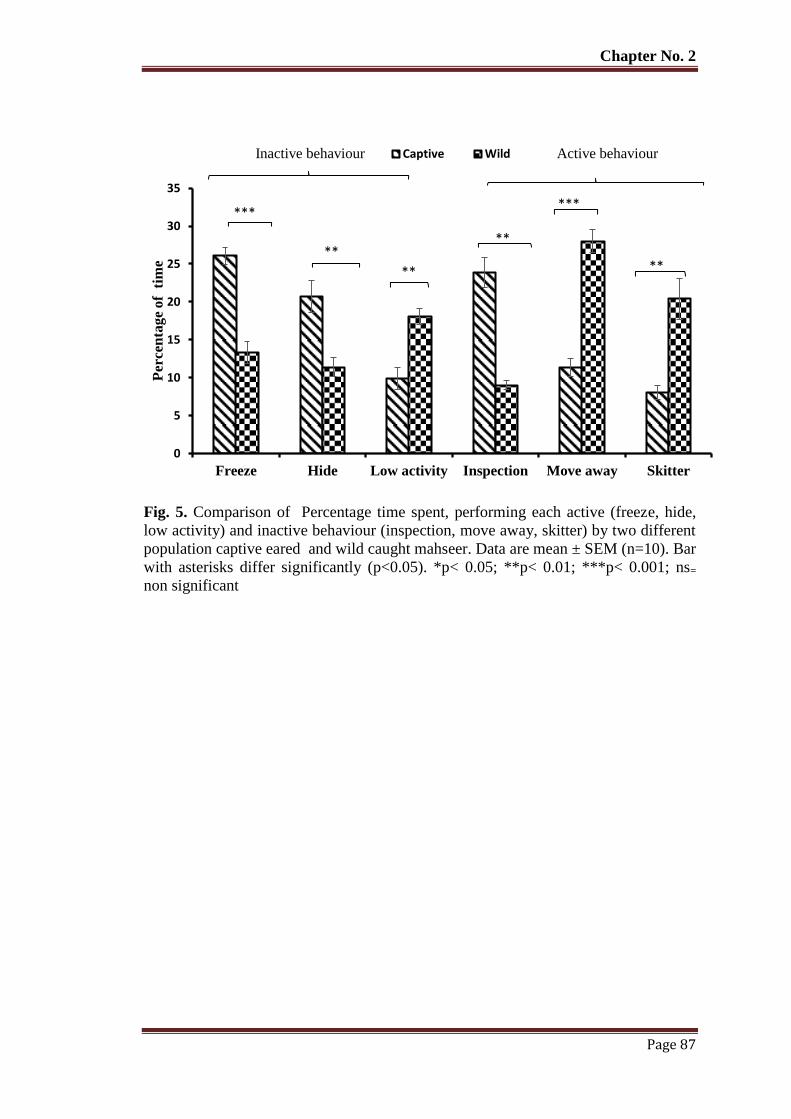
Chapter No. 2
Page 87
Fig. 5. Comparison of Percentage time spent, performing each active (freeze, hide,
low activity) and inactive behaviour (inspection, move away, skitter) by two different
population captive eared and wild caught mahseer. Data are mean ± SEM (n=10). Bar
with asterisks differ significantly (p<0.05). *p< 0.05; **p< 0.01; ***p< 0.001; ns=
non significant
0
5
10
15
20
25
30
35
Freeze Hide Low activity Inspection Move away Skitter
Percen
tag
e o
f t
ime
Captive Wild
***
**
**
**
***
**
Inactive behaviour Active behaviour
Chapter No. 2
Page 88
4. Discussion
In the current study, the behaviour of mahseer collected from wild and captive
rearing environment was evaluated. We applied different behavioural tests to compare
the boldness, exploratory, predatory and anti-predatory behaviour and observed
prominent differences in both populations. Captive rearing environment permits the
expression of behaviour patterns quite different to be observed in wild caught fish.
Previous observations have revealed that early experiences as well as rearing
environments, shaping the innate behaviours like foraging, reproduction and the
response to predators (Huntingford 2004; Braithwaite and Salvane, 2005; De
Azevedo and Young, 2006; Kelley et al., 2006; Martin et al., 2015). We also detected
disparity in the selected behaviours of the fish in all behavioural tests (Table 3).
The obvious differences in the behaviour pattern of both wild caught and
captive reared mahseer could be the effect of variable experiences and rearing
environments. It appears that captive environments permit the expression of bolder
and more exploratory behaviour in hatchery reared fish. Boldness is a fearless
behaviour like more rapid emergence from the shelter, and more frequent inspections
of predator (Kelley et al., 2006). It is, generally, associated with fitness-related traits
like aggression (Johnson et al., 2014), foraging and exploration (Wilson and Stevens,
2005) antipredator behaviour (Brown et al., 2007a; Lopez et al., 2005) mate
selection (Godin and Dugatkin, 1996) and learning (Dugatkin and Alfieri, 2003).
Captive rearing environment increases the boldness in fish (Sundström et al. 2004;
Huntingford, 2004; Kelley et al., 2006), which could be due to high density at
hatcheries as the animals need to compete for resources. Boldness, although at some
level will be adaptive (Sih et al., 2004) but not always advantageous. The more
curious and risk sensitive behaviours of bold animals as observed in captive reared
fish, increase their conspicuousness and exposed them to potential predators (Kelley
et al., 2006). Several studies have demonstrated the expression of boldness and low
post release survivorship of hatchery reared fish in the natural environment
(Huntingford, 2004; Johnsson et al., 2014). The tendency to take risks (e.g. Inspection
of predators), be exploratory and spend more time in risky areas could explain the
increase mortality of hatchery reared fish in wild (Jonsson, 1997).
Chapter No. 2
Page 89
Although , our observations of mahseer are similar to the earlier observations,
as hatchery reared mahseer is bolder and more risk sensitive than wild caught fish
(Fig. 1). However, the overall level of boldness in our captive-reared mahseer and
wild counterpart was not as high as reported by other scientists for different fish
species e.g., Atlantic cod (Gadus morhua) (Braithwaite and Salvanes, 2005), rainbow
trout (Oncorhynchus mykiss) (Sneddon, 2003) and spotted skiffa (Skiffia
multipunctata) (Kelley et al., 2006). It may be due to the fact that in Pakistan
mahseer are reared in semi-intensive culture system where stocking densities are not
as high as required for inducing high levels of boldness (Blanchet et al., 2006).
Environmental awareness is prerequisite for the survival of animals, while
exploratory behaviour permit animals to collect information from surrounding
environment more efficiently and rapidly (Braithwaite and Salvanes, 2005).
Exploratory behaviour serve as an indicator of an animal adaptation to a novel
environment and is under the influence of many factors like rearing environment,
genetics, sex and maternal factor (Burns et al., 2016), body size (Brown et al.,
2007a), brain size (Kotrschal et al., 2014), food availability and maternal effects
(Burns, 2016). The captive reared fish in our study, spent more time in the open area
and start box than wild caught fish (Fig. 2) . However, we cannot conclude that
captive-reared fish are more exploratory than wild ones. Although, according to some
scientist, fish spent more time in open area are more active (bold) and exploratory
(Sneddon, 2003; Frost et al., 2007), but in the present study it appears that captive-
reared fish is somehow reluctant to explore the area of vegetation, due to the previous
rearing exposure and experience. The results of habitat shift clearly differentiate
exploratory behaviour of captive-reared and wild caught mahseer (Fig. 3). Camacho-
Cervantes (2015) studied exploratory behavioural on guppies and concluded that
guppies engaged more suddenly in exploratory behaviour in the presence of
vegetation. Kotrschal et al. (2014) concluded that large brain size guppies were more
exploratory comparative to smaller brain guppies. These findings are similar to our
current observations as wild environments contained more vegetation, than in
captivity. Moreover, the fact that wild mahseer shows more exploratory behaviour,
may be due to previous experiences. However, our findings are somehow different to
Millot et al. (2009), who reported similar swimming activity and spatial exploration
behaviour in both wild and domesticated sea bass strains (Dicentrarchus labrax). The
Chapter No. 2
Page 90
variations in results could be due to main difference in the generation time of fish
used. We compared the wild caught fish from the fourth generation captive reared
while Millot et al. (2009), compared the domesticated sea bass with hatchery reared
counterpart produced from wild caught brooders.
Environmental variability can have positive effects on the attraction and
consumption of live prey (Braithwaite and Salvanes, 2005). Earlier studies on
salmonids suggest reduces foraging success of hatchery reared fish on live prey
(Brännäs and Johnsson, 2008; Huntingford, 2004) and expression of boldness and risk
sensitive behaviour in fish (Sundström et al., 2004; Kelly et al., 2006). Hatchery
reared fish are often slow to adopt or switch to new prey items (Olla et al., 1998)
and never reach the feeding efficiency comparable to wild fish, e.g., wild caught
brown trout consumed 75% more live prey than hatchery reared fish and even in
isolation, it utilized the prey more efficiently (Sundström and Johnsson, 2001).
Consistent with other observations, wild mahseer in the present study also ate more,
attacked quickly and consumed novel prey more efficiently than hatchery reared fish
(Fig. 4). The divergence in feeding habits may be due to previous experience of wild
fish to prey as earlier exposure and repeated experiences can improve the ability of
fish to recognize, attack and ingest the prey (Warburton, 2003; Brown et al., 2003).
Hence, reduced feeding ability of hatchery reared mahseer may be due to their lack of
previous experience with live prey.
Many Intrinsic and extrinsic factors including hunger or gut fullness, isolation
stress and threat plays important role in motivation of feeding (Hughes, 2013). For
instance hunger reduces prey-handling time in fifteen-spined sticklebacks (Spinachia
spinachia) (Hughes, 2013). However, in the present study, both wild caught and
hatchery reared populations were under similar experimental conditions and on the
same daily ration prior to the study. Thus, we assume that both hatchery reared and
wild mahseer fish were similarly motivated and difference in behaviour is mainly due
to their previous experiences and rearing environments.
Hatchery rearing environment lacks many of the natural aspects of a wild
environment, most importantly predators, and as a result hatchery-reared fish cannot
develop the acquired predator recognition and avoidance behaviours, important to
Chapter No. 2
Page 91
survive in the wild environment (Brown and Day, 2002). Previous literature has
suggested that increased artificial culture time and selection for fast growth in
aquaculture practices has resulted in dramatic anti-predatory behaviour differences
between hatchery reared and wild caught individuals (Huntingford, 2004). Berejikian
(1995) found that during live predator encounters, wild steelhead trout fry survived
significantly better than their hatchery-reared (predator naïve) counterparts. Similarly,
wild juvenile coho salmon (Oncorhynchus kisutch) consistently survived in greater
ratio and for longer time periods when exposed to a live lingcod (Ophiodon
elongates) than did hatchery-reared coho salmon (Olla and Davis, 1989). In our study,
we compared the behaviour of hatchery reared and wild-caught mahseer exposed to a
live predator and observed differences in all anti-predatory trials or in the time taken
for the mahseer to inspect the predator (Fig. 5). Wild caught fish tended to show more
active behaviour than captive reared fish in response to a predator. The result is in
agreement with Oliver et al. (2008) who found that in the presence of a threat,
lobsters raised without predators in the experimental tank showed reduced activity
than those reared together with predators. The investigatory trips of both wild caught
and captive reared mahseer towards the predator also showed a significant difference
and support the view that captive reared fish always sooner launching investigatory
trips as compared to wild counterpart (Sundström et al., 2004; Petersson and Järvi,
2006). Moreover, Kelley and Magurran (2003) observed more closer approaches of
laboratory reared fish towards the model predator and suggested that such risk taking
behaviour make captive-reared fish more prone to predation when subsequently
released into the wild.
5. Conclusion
The present study indicated the differences in behavioural patterns (boldness,
exploratory and anti-predatory behaviours) of wild caught and captive reared
populations of mahseer and confirms the role of rearing environment in shaping the
behaviour of fish. For improving the results of restocking program, the outcomes of
this study suggest a modification of the hatchery rearing environment in such a way
that could produce fish, with life skills comparable to their wild counterpart.
Chapter No. 3
Page 92
Chapter # 3
Effects of Early Rearing enrichment on Physiological Stress Response of
Mahseer (Tor Putitora)
Chapter No. 3
Page 93
ABSTRACT
Enriching rearing environment is the strategy suggested for improving the post
release survivorship of captive reared animals. Enriched rearing environment can
have positive effects on physiology, health and survival of fish. Here an attempt has
been to evaluate the impact of early rearing enrichment on the hypothalamic–
pituitary–interrenal axis (HPI-axis), blood glucose as well as brain dopaminergic and
serotonergic systems of Tor putitora. Fifteen days old hachlings of T. putitora
were reared up to advanced fry stage in barren, semi- natural and physically-enriched
environments and compared them with regard to pre stress and post stress levels of
whole body cortisol, blood glucose, whole brain serotonergic activity (5HIAA/5HT
ratio), dopaminergic activity (DOPAC/DA and HVA /DA ratios) and Norepinephrine
(NE) levels. Significantly low basal whole body cortisol, glucose and brain NE levels
were observed in a physically enriched group of fish as compared to other groups.
However, after acute stress all rearing groups showed elevated levels of cortisol,
blood glucose, brain 5HIAA/5HT, DOPAC/DA and HVA /DA ratios and NE levels
but the magnitude of response was different among different rearing groups. The
barren reared group showed higher magnitude of response as compared to semi
natural and physically-enriched groups. Similarly, the recovery rate of whole-body
cortisol, blood glucose and whole-brain monoamines were long lasting in barren
reared mahseer. We illustrate that increased structural complexity (physical
enrichment) during early rearing significantly modulate various physiological and
stress coping mechanisms of mahseer
Chapter No. 3
Page 94
1. Introduction
Golden mahseer is the National fish of Pakistan that is widely distributed in
foothills of Himalayan region and sub-continent (Chatta and Ayub, 2010; Bakawale
and Kanhere, 2013). Earlier studies indicated the abundance of Tor species in most
of the rivers of Pakistan (Mirza and Khan, 1994; Mirza et al., 1994; Zafar et al.,
2001), but recent studies reported the decline population in most parts of the country
(Chatta and Ayub, 2010) may be due to deforestation, pollution, overexploitation,
damming and habitat destruction by initiation of hydro-power projects (Lakra et al.,
2010; Nautiyal, 2011, 2014; Pandit and Grumbine, 2012; Khajuria et al., 2013; Gupta
et al., 2014, 2015; Sharma et al., 2015).
By realizing the natural threat to this species, Pakistan has initiated artificial
propagation and restocking programs for this species. The major aims of these
programs are to rehabilitate and conserve this species. Since 2001, every year,
thousands of seeds have been produced, reared in hatcheries and released into wild
under restocking programs. However, in spite of extensive stock enhancement
strategies; the population of this species is continually declining. It seems that like
other fish species, captive hatchery reared mahseer do not survive after release in wild
(Jonsson and Jonsson, 2006; Kallio-Nyberg et al., 2011). It has long been recognized
that hatchery-reared fish release does not always bring remarkable improvements in
fish stocks (Larscheid, 1995; Blaxter, 2000; Hutchison et al., 2006).
Poor post release survivorship of hatchery-reared fish can be attributed to a
multiple factors, including stocking density, rearing environment (habitat), food
availability, predator, exposure to disease organism, human interference (Huntingford,
2004). Hatchery reared fish develop trait would be detrimental in wild (Latremouille,
2003; Huntingford, 2004; Ashley, 2007). In hatcheries, fish are under the planned or
un-intentional selection pressure, thus traits which are more suitable for captivity
compared to the wild are developed (Frankhamet al.,1986; Huntingford, 2004;
Christie et al., 2012). In fish reared for conservational stocking, behaviour adapted to
natural environments are critical for stocking effectiveness (Brown and Day, 2002;
Salvanes and Braithwaite, 2006). Recent experiments on the fish show that the lack of
stimuli variation in captive rearing conditions, influences the phenotype at many
Chapter No. 3
Page 95
different levels, ranging from physiology to behaviour (Huntingford, 2004; Brännäs
and Johnsson, 2008; Brockmark and Johnsson, 2010).
Several actions like life-skills training, environmental enrichment, social
learning protocols, acclimatization at release have been suggested as solutions to
reduce the behavioural deficiencies of hatchery reared fish (Brown and Day, 2002). It
is suggested that enriched captive environments can promote shelter seeking abilities
(Salvanes and Braithwaite, 2005; Roberts et al., 2011), behavioural flexibility
(Braithwaite and Salvanes, 2005); foraging abilities (Brown et al., 2003; Strand et al.,
2010; Rodewald et al., 2011), reduced anxiety and depression and enhanced
learning/memory (Brenes et al., 2008; McQuaid et al., 2012; du Toit et al., 2012).
However, barren hatchery rearing environment with high density alters their natural
behaviours, e.g., social interactions, shoaling, shelter seeking and territorial
behaviours (Barton and Iwama, 1991; Salvanes and Braithwaite, 2005; Roberts et al.,
2011; Batzinaet al., 2014). Generally, environmental enrichment (social and physical)
enhances the performance and improves the welfare of animals held in captivity. It
not only influences the behavioural traits, but also fulfil the psychological needs of
animals in captivity (Shepherdson et al., 1998).
In captivity fish are subjected to several environmental, social, and husbandry
related stimuli that may have potentially noxious or stressful effects. Stress has been
defined as a physiological cascade of events that occurs when an individual attempts
to re-establish homeostasis in the face of a perceived threat (Schreck et al., 2001).
Upon exposure to a stressors, fish undergo a series of behavioural, physiological,
neuroendocrine and biochemical changes (Barton, 2002; Davis, 2006) in order to cope
with any potential threat (Barton, 2002). Stress responses of fish can show variation
within and between species, between strains, and even among individuals (Barton,
2002) and these differences are genetically based but influenced by individual
experience (Heath et al., 1993; Overli et al., 2005). Individuals show variation to cope
stress because stress responses are controlled by hormones (Huntingford et al., 2010;
Koolhaas et al., 2007) having moderate to high degree of heritability (Overli et al.,
2005). However, it is well documented that hatchery-reared and wild caught often
differ in their physiological stress responses (Lepageet al., 2000) may be due to
genetic environment interaction
Chapter No. 3
Page 96
The physiological responses of fish to stress may be of either an adaptive
nature, allowing for homeostatic recovery, or a maladaptive nature, having adverse
effects on survival, growth, immune response, reproductive capabilities, behaviour
and general fitness (Schreck et al., 2001; Kelley et al., 2006; Magnhagen et al., 2008).
The primary stress response in fish includes the rapid increase of circulating
catecholamines and cortisol, while the secondary response includes changes in several
hematological and biochemical parameters; the tertiary response involves alterations
at the whole animal and population level (WendelaarBonga, 1997; Barton, 2002). In
teleosts, catecholamines and corticosteroids are the respective main end-products of
the two major pathways coordinating the stress response: the brain–sympathetic–
chromaffin cells and the hypothalamus–pituitary–inter-renal cells (HPI) axes
(Balment et al., 2006; Clark et al., 2011; Guesto et al., 2013; Biamonte et al., 2015).
In addition to HPI axis, brain monoaminergic neurotransmitters also involved
in regulation of stress responses (Winberg et al., 2001; Bowman et al., 2002; Larson
et al., 2003; Perreault et al., 2003; Lepage et al., 2005; Gesto et al., 2013). Like in
other vertebrate fish also showed elevated level of brain serotonergic activity, as
indicated by an increase level of brain 5-hydroxyindoleacetic acid (5-HIAA) and ratio
of 5-HIAA to serotonin (5-hydroxytryptamine/ 5-HT) (Øverli et al.,1999, 2001;
Winberg et al., 2001; Barton et al., 2008; Gesto et al., 2013).
Data derived from several studies on fish indicate the beneficial effects of
environmental enrichment on metabolic demand (Millidine et al., 2006; Finstad et
al.,2007), stress activity (5-HIAA/5-HT) (Batzina et al., 2014; Höglund et al., 2005),
cognitive abilities ( Brown et al., 2003; Brenes et al., 2008; Kotrschal and Taborsky,
2010; McQuaid et al., 2012; du Toit et al., 2012), behaviour (Salvanes and
Braithwaite, 2005; Salvanes et al., 2007; Moberg et al., 2011; Roberts et al., 2011)
and survival in the wild (Maynard et al., 1996).
We assumed that by enriching the early rearing environment at hatcheries,
physiology of T. putitora with regard to stress response can be modulated and fish can
be prepared to cope the challenges of common stressor present in nature. The major
objective of the present study was to evaluate the effect of the early rearing
enrichment on stress responses in term of HPI axis and activities of dopaminergic and
Chapter No. 3
Page 97
serotonergic systems of advanced fry of mahseer previously reared in different rearing
environments. To test our assumptions, we devised three different rearing
environments that differ in their levels of complexity and heterogeneity. Mahseer
hatchlings were reared up to advanced fry stage in these three different rearing
environments and then compared their stress response by measuring the recovery rate
of plasma cortisol (invasive), water-borne cortisol (non-invasive), blood glucose and
brain monoamines (ratios of 5HIAA/5HT, DOPAC/DA and HVA /DA) and NE
level after acute physical stress.
Chapter No. 3
Page 98
2. Material and methods
2.1. Experimental Animals
Tor putitora 15 days, hatchlings (10-15mm; after semi-quiescent staged),
about 25000 in number, were collected from a breeding tank (barren concrete circular
tank) of Fish Hatchery Hattian Attock, Pakistan, and transported in oxygen filled
plastic bags (36cm length × 24cm width; 10 L water) of the Fisheries and Aquaculture
Research Station, Department of Animal Sciences, Faculty of Biological Sciences,
Quaid-I-Azam University Islamabad, Pakistan.
2.2. Manipulation of rearing environment
To investigate the effect of early rearing environment on exploratory,
predatory and anti-predatory behaviours, the hatchlings of mahseer (Tor putitora)
were housed in three different rearing environments, 1) Barren: Rectangular fibreglass
tanks (120 cm length × 60 cm width × 60 cm height) without any substrate (Clear
bed), while plain contained only an aerator. 2) Physically enriched: Similar size
fibreglass rectangular tanks (120 cm length × 60 cm width × 60 cm height) with 1 cm
thick 1.0 to 1.5 cm diameter gravel bed, 4 plastic plants having 12 cm height, 2PVC
pipes (10 cm length; 4 cm diameter and 5 cm length; 4 cm diameter and aerator. 3)
Semi-natural: 250 m2 earthen pond (20m × 12.5 m) with concrete walls, having
natural food organisms (phytoplankton, zooplankton, diatoms, some protozoa etc.) but
without common aquatic weeds or other substrate. Before stocking, the ponds were
limed (calcite lime; CaCO3; CaCO3; 49.42 kg/100 m2, fertilized with organic
(Animal manure; cow dung 8 kg/100 m2/week) and inorganic (Nitrogen fertilizers; 0.5
kg/100 m2/week; phosphate fertilizers; 0.25 kg/100 m2/week) fertilizer, thus to
contain a sufficient amount of natural food organisms (A conventional technique in
Pakistan for the rearing of mahseer). Replicate of three for barren and physically
enriched and two for semi-natural environments were maintained and hatchlings were
stocked at the rate of 200 hatchlings per tank and about 10,000 hatchlings per semi-
natural pond. Initially, low water level about 0.6 m in each earthen pond and 200 L in
fibreglass tanks was maintained, but after two months raised to 1 m and 350 L
respectively. All experimental groups were supplied with water from a nearby
Chapter No. 3
Page 99
freshwater stream (Rumli freshwater stream). Hatchlings in barren and physically
enriched groups were initially fed commercially available prepared powder feed
(Oryza organics fish feed, powder; 55% crude protein, 12% lipid fats, crude fiber 2%
and 10% moisture) after every second hour, then gradually changed from powder feed
(first two months)to crumbled (after two months) and then sinking pellets (last one
month) (Oryza organics fish feed, size 2 mm; 45% crude protein, 14% fats, 2% crude
fiber and 10% moisture), at the rate of 4% body weight twice per day. In the ponds
sufficient natural food organisms were maintained with the aid of fertilizer.
Additionally, some prepared feed was also provided daily. Pond fertility was checked
every fortnight with Sacchi disk and accordingly taken the step (Almazan and Boyd,
1978). The fish was reared under these conditions for 4 months (March, 2015 to June,
2015). During rearing, optimum oxygen levels in all tanks were maintained by using
aerators, pH and temperature were noted daily. Moreover, to avoid strong response
towards the handling and netting stress, all fish were inspected daily during the
experimental time period. After completion of rearing period, fish from each
experimental group were randomly selected for physiological stress response
2.3 Stress assay
2.3.1 Stress assay procedure for mahseer from barren, semi natural and physically
enriched environment
For evaluating the impact of rearing environment on the physiological stress
response of fish, T. putitora previously reared in barren, semi-natural and
physically enriched environment re-housed at a stocking density of 10.06 ± 0.05 gL-
1 in eighteen, 25L volume glass aquaria of the same size (40L×25W×25H cm), six
aquaria for each environment. Barren and physically enriched groups of fish were
almost similar in size ( body mass, 2.14 ± 0.04 and 2.17 ± 0.05g respectively ) as
compared to a semi natural pond (body mass, 2.26 ± 0.08g). Here again size
difference was controlled by maintaining the stocking density of both populations
instead of the number of fish in aquaria. The experiment was conducted in replicate
of three, with slight variation in number of fish in aquaria. Both, barren and
physically enriched reared fish similar in number in each aquaria (n=19) while
Chapter No. 3
Page 100
semi-natural environment reared fish showed variation (19, 19, 19, 19, 18 and 18) .
The six aquaria of each group were split into half for control and other for treatment
i.e. exposure to stress. All aquaria had permanent volume marks for maintaining
water volume and were well equipped with aerators and water heater, to maintain a
constant temperature of 22.5˚C. They were kept under flow through the system
(10.02 ± 0.03 mLmin-1
). Water to each aquaria was supplied from the water tank
(100 gallon) having dechlorinated water and set at a temperature (22.5 ± 0.5˚C)
similar to experimental aquaria. Water from the tank was supplied through the main
pipeline having an outlet equipped with water flow regulator at the top of each
aquaria, while the outflow of water from aquaria was controlled by Tygon® tubing
with regulator. During the experiment, the pH ranged from 6.9 to 7.2, DO was near
saturation (>6.4 mg L-1
), ammonia was less than 0.20 ppm, and salinity was 0.0 ppm.
Fish were fed once daily at 09:00 am with floating feed (Oryza organics fish feed,
pelleted; 55% crude protein, 12% lipid fats, crude fibre 2% and 10% moisture). Every
day uneaten feed and faces were removed by siphoning and about 20% water in each
aquarium was also maintained by addition of water. The experiment consists of two
treatments; control, i.e. unstressed fish and treated, i.e. exposed to acute stress.
Treated groups were stressed by following the same handling stress protocol as used
for evaluating the stress response of wild and captive populations of mahseer i.e. 5
min chasing with hand net and 2 min confinement at the corner of the aquarium.
2.3.2 Water sampling
Water samples were collected by adopting the same procedure as described in
Chapter # 1 Page # 24-26.
2.3.3 Extraction procedure of Water-borne Cortisol
Extraction of free cortisol from pre-stress and post stress samples were also done by
adopting previously mentioned methodology (Chapter # 1, Page # 26)
2.4 Experimental protocols for blood glucose, Whole body cortisol and Brain
monoamines
2. 4.1 Distribution of fish and stress assay procedure
Chapter No. 3
Page 101
Before performing the stress assay procedure, a total of 360 advanced fry of
mahseer from three different rearing environments were distributed (12 fish per
aquarium; stocking density, 5 g/L) among 30 same size (40 L×25W×25H cm; 25 L
water) experimental aquaria (differ in structural enrichment) under flow through
systems (10 ± 0.05 ml min-1
). In order to mimic their previous rearing environment , i)
Fish (n=120, body mass, 2.14 ± 0.04) previously reared in the barren environment
were distributed in ten aquaria without any substrate (Clear bed; two aerators).ii) Fish
(n=120,body mass, 2.26±0.08) previously reared in semi-natural environment were
distributed in ten aquaria having water from semi-natural ponds (turbid water;
phytoplankton, zooplankton, protozoa etc.), while iii) Fish (n=120, body mass,
2.17±0.05) previously reared in physically-enriched environment were distributed in
ten physically-enriched aquaria with gravel bed, plastic plants, PVC pipes and two
aerators). After the distribution, the fish were remained in their respective
environment without any disturbance for a period of one week under same laboratory
condition (12:12hr, light: dark; temperature, 22.5°C; DO>6.4; mgL-1
and ammonia <
0.20 mgL-1
). After one week, fish in one experimental aquarium of each group were
anaesthetized by adding (MS-222; 50mgL-1
) to the water and 6 fish from each
aquarium were collected for obtaining a basal level of whole body cortisol (invasive
method) and another six for blood glucose and brain monoamines basal levels. The
fish collected for blood glucose and brain monoamines assay were quickly picked and
approximately 20 µL of blood was collected from the caudal vasculature, by sharp
cutting of fish, tail and dissected out immediately (within 3 min) and their brain was
deep frozen in liquid nitrogen and stored at -80°C for further analysis of monoamines.
However, fish for whole body cortisol analysis also deep frozen in liquid nitrogen and
stored at -20°C.
In order to find out the comparison of the stress response of fish originated
from different rearing environment, fish in remaining aquaria were exposed to acute
handling stress by following the procedure previously adopted by Guesto et al. (2013)
for rainbow trout. Briefly, fish were chased 5 min with hand net and 2 min
confinement at the corner of aquaria and samples were collected by using the same
technique at 0.5, 0.75, 1, 2, 4, 6, 8, 24 and 48hr after acute stress. Samples from each
environmental group were collected as described previously for wild and captive
Chapter No. 3
Page 102
reared fish, i.e. every time from new aquarium requisite for a particular time period
(1 aquarium /time period / environment).
2.4.2 Blood Glucose Level: stress assay procedure
The blood glucose level was analysed with the help of digital glucometer
ACCU-CHEK®Softclix (blood glucose meter). A drop of fresh blood was placed on
the glucometer strip. The Glucometer showed the result on screen in mg/dL-1
. The
unit of glucose converted from mg/dL to mmole/L by dividing the value of glucose by
18.018.
2.4.3 Whole body Cortisol
Fish were small in size, therefore not possible to collect sufficient blood for
plasma cortisol. Cortisol was extracted from whole-body by using the method
reported by (Zuberi et al., 2014), and previously used by Sink et al. (2007) for
golden shiners and Yeh et al. (2013) for zebra fish larvae. Whole frozen individual
advanced fry of mahseer was thawed, removed excess water by using paper towel,
weighed and placed on a glass plate. The individual was sliced into small pieces and
crushed with the help of sharp blades. The paste was transferred into the glass tube
with 500µL phosphate buffer saline (PBS) and homogenized at 10000 rpm for 60-70
sec by using electric homogenizer (Model No. AHS 200). During homogenization,
sample tube was placed in a beaker filled with crushed ice. Probe of homogenizer was
washed into the sample tube with an additional 500µL aliquot of PBS. Each sample
was extracted three times with 8 volumes of ethyl acetate. During extraction, tubes
were vigorously vortex with ethyl acetate for 60s and centrifuged at 3000 rpm for 10
min at 4°C to separate the aqueous and Ethyl acetate layers. The bottom layer
(aqueous homogenate) was frozen at -80 °C for 15 min and the top ethyl acetate
containing extracted steroid hormones was collected into a new glass test tube
(16×100 mm). The glass tube was set in a water bath set at 45°C and samples were
dried under a gentle stream of nitrogen gas. The dried lipid extracts were stored at –20
°C until conducting ELISA for cortisol.
2.4.4 Water-borne and whole body cortisol estimation
Chapter No. 3
Page 103
For estimation of cortisol in water and whole body sample, the same kit as
previously mentioned (Chaper #1 and Page # 28) was used. The cortisol kit was also
validated for whole body cortisol concentrations and observed that the slope of the
curve created by kit standards matched with curve obtained by serial dilutions of
samples (0, 20, 40, 60 and 80 %) (slopes, whole body cortisol: slope = 0.932, r2 =
0.998, P = 0.96) reflecting the positive linear relationship. The intra-assay (for
precision of kit) and inter assay (reproducibility) coefficient of variation was
calculated and found to be 9.7 and 12.5 % respectively.
Furthermore, cortisol extraction efficiency from whole body was investigated
by adding predicted concentrations of cortisol (20, 40 , 60 and 80 ng g-1) in charcoal
stripped whole body homogenate. The cortisol was extracted and estimated by
following the same procedure as used for samples. The % recovery of cortisol was
greater than 96.8%. Absorbence at 450 nm was read in ELISAplate reader.All cortisol
values are reported as, ngL-1
for water borne cortisol and ngg-1 for whole body
cortisol.
2.5 Monoamines assay procedure
The analysis was done by adopting the same extraction protocol and
estimation procedures as mentioned previously (Chapter # 1, Page # 29)
2.7 Statistical analysis
All results are mentioned as mean (± SEM). Statistical analysis was carried
out by using lme4 (Bates et al., 2014) and easyanova (Arnhold, 2013) package of R
3.2.5 (R Development Core Team, 2016). The assumption of normality, homogeneity
of variances and additivity of the model were checked by Shapiro-Wilks, Levene'sand
Tukey1-dFTest respectively. The effects of rearing environment on blood glucose,
whole body cortisol and brain monoamines were analysed by using ANOVA with
double factorial in a complete randomized design followed by post hoc Tukey's HSD.
Results considered statistically significant, when value was less than 0.05 (P<0.05).
Chapter No. 3
Page 104
Correlations between whole body cortisol and brain monoaminergic activity and
whole body cortisol with glucose were tested by the Pearson's correlation test.
3. RESULTS
3.1.Water-borne cortisol
Basal levels of concentrations of advanced fry of mahseer reared in three
different environments (barren, semi natural and physically enriched) were
statistically similar (Tukey’s post hoc: p>0.05, Table 2, Fig 1), while after induced
acute stress, increase in all rearing groups. The repeated way analysis indicated that
concentration changed over time (two way ANOVA F1, 220 = 2153.858, p<0.001,
Table 1), while significant interaction between rearing groups and treatment (two way
ANOVA F20 330 = 4.122, p<0.001, Table 1) indicated the manner in which rearing
groups varied in physiological stress response. However, concentration of cortisol in
control of all treated groups did not show significant fluctuation over time (P>0.05).
The significant three-way interaction between variables (two way ANOVA, F20, 330 =
4.888, p<0.001Table 3) suggest the variation in patterns displayed by three rearing
groups in response to acute stress over time. After stress all rearing groups (barren,
semi-natural and physically enriched) showed their peak level of water borne cortisol
at 2 hrs after stress but the cortisol concentrations of barren and semi-natural reared
fish were statistically similar (P=0.11) as compared to barren verses physically
enriched and semi-natural versus physically enriched rearing groups (P=0.001 and
p=0.001 respectively).
3.2. Whole Body Cortisol
The pre-stress whole-body cortisol level was significantly different in
advanced fry of mahseer reared in physically-enriched environment compared to
barren and semi-natural environments (Tukey’s post hoc:p=0.05 and p=0.004
respectively; Table 4, Fig. 2 ), while no significant difference was observed in barren
and semi-natural environments reared fish (Tukey’s post hoc: p=0.52, Table 4). The
significant interaction between rearing environment and treatment (two way ANOVA:
F2, 150 = 4.3879, p<0.01, Table 3) indicated how the stress response of fish reared in
Chapter No. 3
Page 105
barren, semi-natural and physically enriched rearing environment varied. The whole
body cortisol concentration changed after exposure to stress as compared to pre-stress
(two way ANOVA: F1, 150 = 272.905, p<0.001; Table 3), also changed over time and
showed variable concentration at most of the studied hours among barren, semi-
natural and physically enriched environments reared fry (two way ANOVA: F8, 150 =
240.6765, p<0.001, Table 3). The significant interaction of rearing groups with
treatment (two way ANOVA: F2, 150 = 4.3879, p<0.001) as well as with time (two
way ANOVA: F16, 150 = 4.2074, p<0.001) indicated how different rearing groups
differ in their stress response. Although all groups attained peak level after 0.75 min
of stress, but cortisol concentration and the trend to attain peak values were
significantly different (Table 4, Fig. 2). At 0.25 min semi-natural environment reared
fish showed rapid increased and highest level of cortisol but afterward trend changed
and at the 0.75 min highest level was observed in barren reared fish followed by semi-
natural environment reared fish (n = 6, mean ± SE: 96.5 ± 4.50 and 85.65 ± 2.31 and
71.5 ± 2.59 ngg-1
fish respectively, Tukey’s post hoc: p=0.001, Table 4, Fig 2). After
word cortisol level showed decreasing trend, but physically enriched and semi-natural
environment reared fish showed rapid recovery and at 6 hrs attained levels statistically
comparable to their pre-stress levels as compared to barren reared fish, where it
remained high even after 8 hrs. At 24hr post stress, whole body cortisol
concentrations of all groups were statistically compared to their respective pre-stress
values (Table 4, Fig 2).
3. 3. Blood Glucose
Before stress, blood glucose level of semi-natural environment reared fry was
significantly higher than physically enriched environment reared fish (Tukey’s post
hoc: p=0.002; Table 6, Fig. 3). But statistically comparable to barren reared fish
(Tukey’s post hoc:p=0.92; Table 6, Fig 3). However, barren and physically enriched
environment reared fish showed significant difference in pre-stress blood glucose
level (Tukey’s post hoc:p=0.008, Table 6, Fig 3). After treatment, i.e. exposure to
acute stress, a significant difference between barren, semi-natural and physically
enriched environment reared fish (two way ANOVA: F1, 150 = 1678.765, p<0.001,
Table 5),changed in glucose level over time (two way ANOVA: F8, 150 = 822.259,
p<0.001, Table 5) and interactions between different rearing groups of fish with time
Chapter No. 3
Page 106
(two way ANOVA: F16, 150 = 15.612, p<0.001) and treatment (two way ANOVA: F2,
150 = 16.799, p<0.001, Table 5) were observed. Like whole body cortisol, plasma
glucose of all rearing groups also differs in magnitude at peak concentration, highest
in barren followed by semi-natural and the lowest in a physically enriched
environment reared fish . Although, all groups attained peak values at 2 hr, but semi-
natural environment reared fish showed initial rapidly increased at 0.25 min as
compared to steady increased in concentration, observed in barren and physically
enriched environment reared fish. After stress, semi-natural and physically enriched
environment reared fish recovered their pre-stress level earlier, i.e. at 24 hrs than
barren reared fish.
3.4. Brain Monoamines
3.4.1 Serotonergic activity (5HIAA/5HT ratio)
The pre stress whole brain serotonergic activity (5HIAA/5HT ratio) of
advanced fry of mahseer from three rearing environments, barren, semi-natural and
physically-enriched environment were considerably similar (Tukey’s post hoc:
p>0.05, Table 8, Fig. 4). Exposure to stress showed changes in the 5HIAA/5HT brain
ratio (n = 6, mean ± SEM: ANOVA: F1, 150 = 107.383, p < 0.001, Table 7) over time
(n = 6, mean ± SE: ANOVA: F8, 150 = 144,772, p < 0.001) at different level in three
rearing groups fish (n = 6, mean ± SEM: ANOVA: F2, 150 = 48.8568, p < 0.001). The
significant interaction between time and rearing groups (ANOVA: F16, 150 = 2.248, p
< 0.001, Table 7) suggesting that in different rearing group, 5HIAA/5HT ratio
changed with time while non significant interactions between Treatment × rearing
group (ANOVA: F2, 150 = 2.073, p = 0.052, Table 7) indicated that change in
5HIAA/5HT ratio occurred independent of the rearing environment. All rearing
groups after stress attained their peak level at 0.75 min but differ in 5HIAA/5HT ratio.
Both semi-natural and physically enriched environments reared fish had significantly
low 5HIAA/5HT ratio compared with barren reared fish (Tukey’s post hoc: p=0.05
and p=0.001, respectively, Table 8), while semi-natural and physically enriched
environments reared fish had a similar ratio (Tukey’s post hoc: p=0.09). After peak
ratio, there was a steady and continuous decline in following time period. Moreover,
if we look more closely, it appears that different rearing groups showed a somewhat
Chapter No. 3
Page 107
difference in the recovery period. Both groups of fish reared in semi-natural and
physically enriched environments attained a comparable basal level ratio of
5HIAA/5HT earlier, i.e. at 4 hrs after stress as compared to barren reared fish which
attained the level at 6 hrs (Table 8, Fig. 4 ). It was also observed that at 2 hr a clear
difference in the ratio of 5HIAA/5HT was noted between the rearing groups (Tukey’s
post hoc: p<0.01) while at 4 hr semi-natural and physically-enriched environment
reared did not show significant differences (Tukey’s post hoc: p=0.10). However, at 6
and 8 hr only a difference was observed between barren and physically enriched tank
(Tukey’s post hoc: p=0.02 and p=0.04; respectively, Table 8), while at 24 and 48 hr
of stress assay, there was no significant difference in different rearing groups with
respect to 5HIAA/5HT ratio.
3.4.2 Dopaminergic activity index DOPAC/ DA ratio
Before stress, whole brain dopaminergic activity index (DOPAC/DA ratio) in
an advanced fry of mahseer reared in three different rearing environments were
almost similar in range (Tukey’s post hoc: p>0.05, Fig. 5, Table 10), while after acute
physical stress, it showed a change (ANOVA: F1, 150 = 67.7654, p < 0.001, Table 9)
with time (ANOVA: F8, 150 = 78.720, p < 0.001, Table 9) in all rearing groups and
attained peak level at 0.75 hr. The non significant interaction between time and
rearing groups (ANOVA: F16, 150 = 1.551, p > 0.056 Table 9) as well as between
treatment and rearing group (ANOVA: F2, 150 = 2.9318, p > 0.05 Table 9) indicated
that although DOPAC/ DA ratio changed in all groups over time after treatment, but
barren and semi-natural reared fish showed almost similar ratio at all time periods
while semi-natural and physically enriched at most of the time period except at 0.25
and 0.5 hr. However, barren and physically enriched environment reared fish showed
significant (p < 0.05) variation in the DOPAC/ DA ratio at most time periods except
at 0.25, 24and 48hr. Both physically enriched and semi-natural environment reared
fish recovered their pre-stress level earlier, i.e. at 4 hrs as compared to barren reared
fish which achieved this level at 8 hrs (Table 10, Fig. 5).
3.4.3 Norepinephrine (NE)
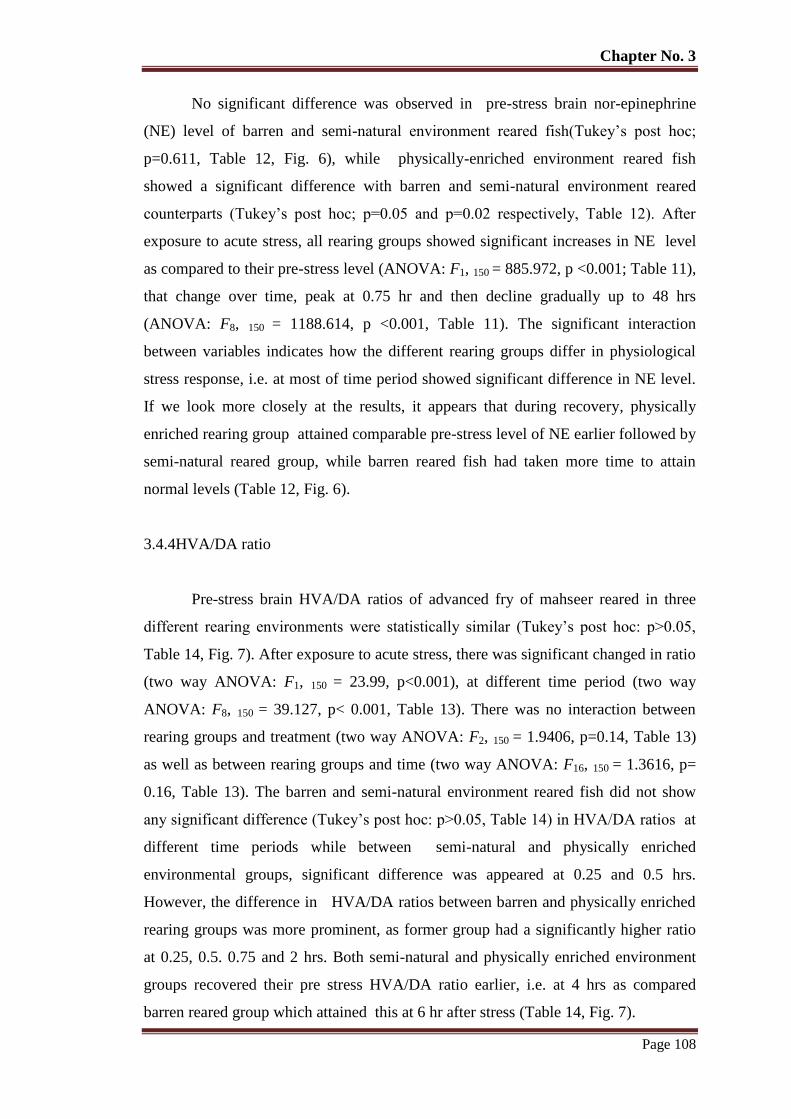
Chapter No. 3
Page 108
No significant difference was observed in pre-stress brain nor-epinephrine
(NE) level of barren and semi-natural environment reared fish(Tukey’s post hoc;
p=0.611, Table 12, Fig. 6), while physically-enriched environment reared fish
showed a significant difference with barren and semi-natural environment reared
counterparts (Tukey’s post hoc; p=0.05 and p=0.02 respectively, Table 12). After
exposure to acute stress, all rearing groups showed significant increases in NE level
as compared to their pre-stress level (ANOVA: F1, 150 = 885.972, p <0.001; Table 11),
that change over time, peak at 0.75 hr and then decline gradually up to 48 hrs
(ANOVA: F8, 150 = 1188.614, p <0.001, Table 11). The significant interaction
between variables indicates how the different rearing groups differ in physiological
stress response, i.e. at most of time period showed significant difference in NE level.
If we look more closely at the results, it appears that during recovery, physically
enriched rearing group attained comparable pre-stress level of NE earlier followed by
semi-natural reared group, while barren reared fish had taken more time to attain
normal levels (Table 12, Fig. 6).
3.4.4HVA/DA ratio
Pre-stress brain HVA/DA ratios of advanced fry of mahseer reared in three
different rearing environments were statistically similar (Tukey’s post hoc: p>0.05,
Table 14, Fig. 7). After exposure to acute stress, there was significant changed in ratio
(two way ANOVA: F1, 150 = 23.99, p<0.001), at different time period (two way
ANOVA: F8, 150 = 39.127, p< 0.001, Table 13). There was no interaction between
rearing groups and treatment (two way ANOVA: F2, 150 = 1.9406, p=0.14, Table 13)
as well as between rearing groups and time (two way ANOVA: F16, 150 = 1.3616, p=
0.16, Table 13). The barren and semi-natural environment reared fish did not show
any significant difference (Tukey’s post hoc: p>0.05, Table 14) in HVA/DA ratios at
different time periods while between semi-natural and physically enriched
environmental groups, significant difference was appeared at 0.25 and 0.5 hrs.
However, the difference in HVA/DA ratios between barren and physically enriched
rearing groups was more prominent, as former group had a significantly higher ratio
at 0.25, 0.5. 0.75 and 2 hrs. Both semi-natural and physically enriched environment
groups recovered their pre stress HVA/DA ratio earlier, i.e. at 4 hrs as compared
barren reared group which attained this at 6 hr after stress (Table 14, Fig. 7).
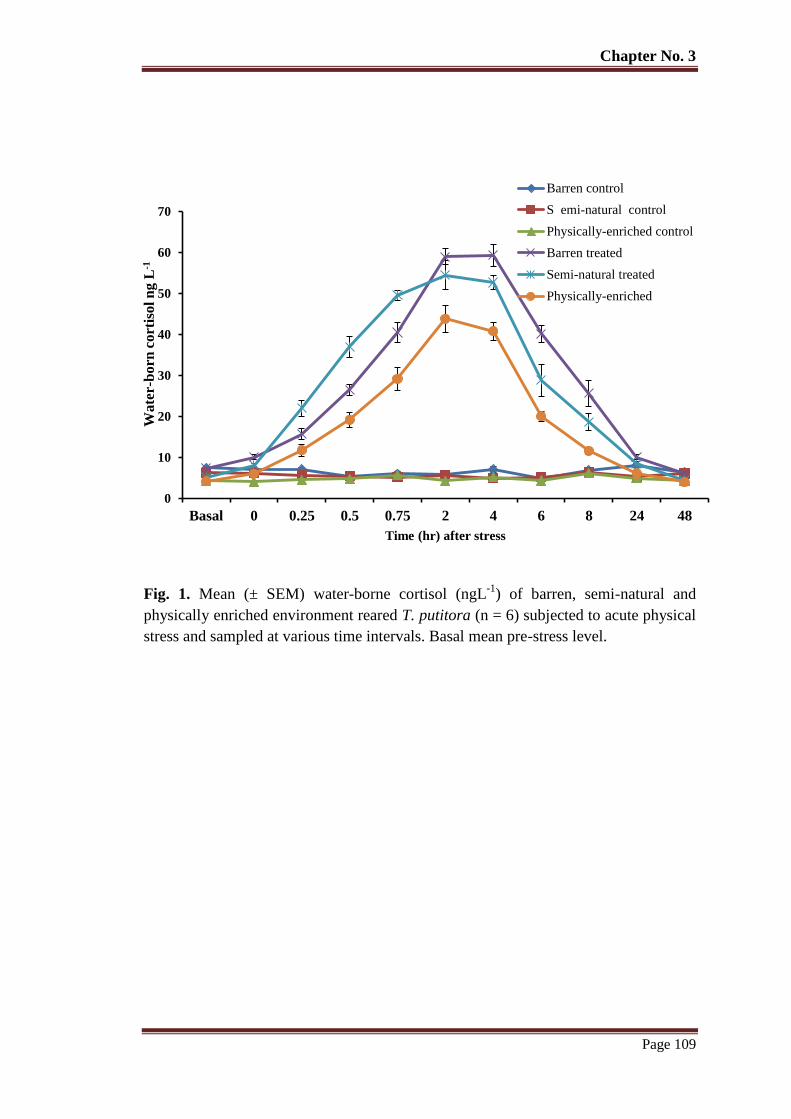
Chapter No. 3
Page 109
Fig. 1. Mean (± SEM) water-borne cortisol (ngL-1
) of barren, semi-natural and
physically enriched environment reared T. putitora (n = 6) subjected to acute physical
stress and sampled at various time intervals. Basal mean pre-stress level.
0
10
20
30
40
50
60
70
Basal 0 0.25 0.5 0.75 2 4 6 8 24 48
Wa
ter-b
orn
co
rtis
ol
ng
L-1
Time (hr) after stress
Barren control
S emi-natural control
Physically-enriched control
Barren treated
Semi-natural treated
Physically-enriched
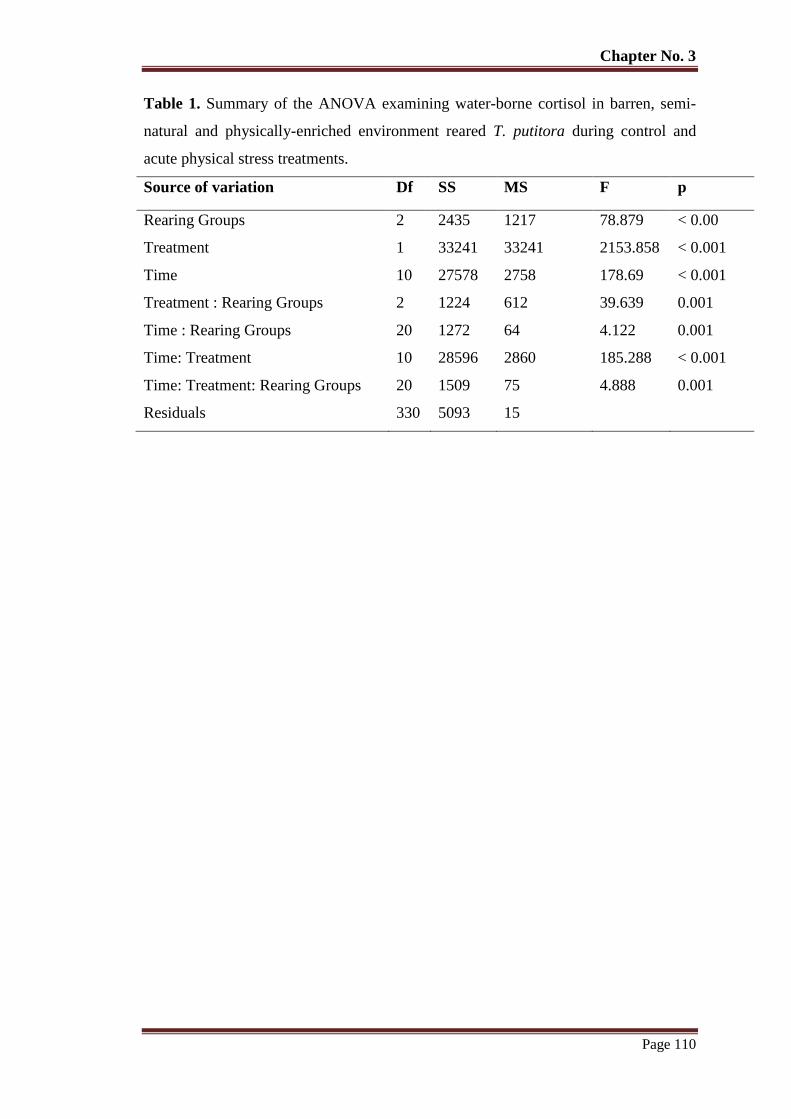
Chapter No. 3
Page 110
Table 1. Summary of the ANOVA examining water-borne cortisol in barren, semi-
natural and physically-enriched environment reared T. putitora during control and
acute physical stress treatments.
Source of variation Df SS MS F p
Rearing Groups 2 2435 1217 78.879 < 0.00
Treatment 1 33241 33241 2153.858 < 0.001
Time 10 27578 2758 178.69 < 0.001
Treatment : Rearing Groups 2 1224 612 39.639 0.001
Time : Rearing Groups 20 1272 64 4.122 0.001
Time: Treatment 10 28596 2860 185.288 < 0.001
Time: Treatment: Rearing Groups 20 1509 75 4.888 0.001
Residuals 330 5093 15
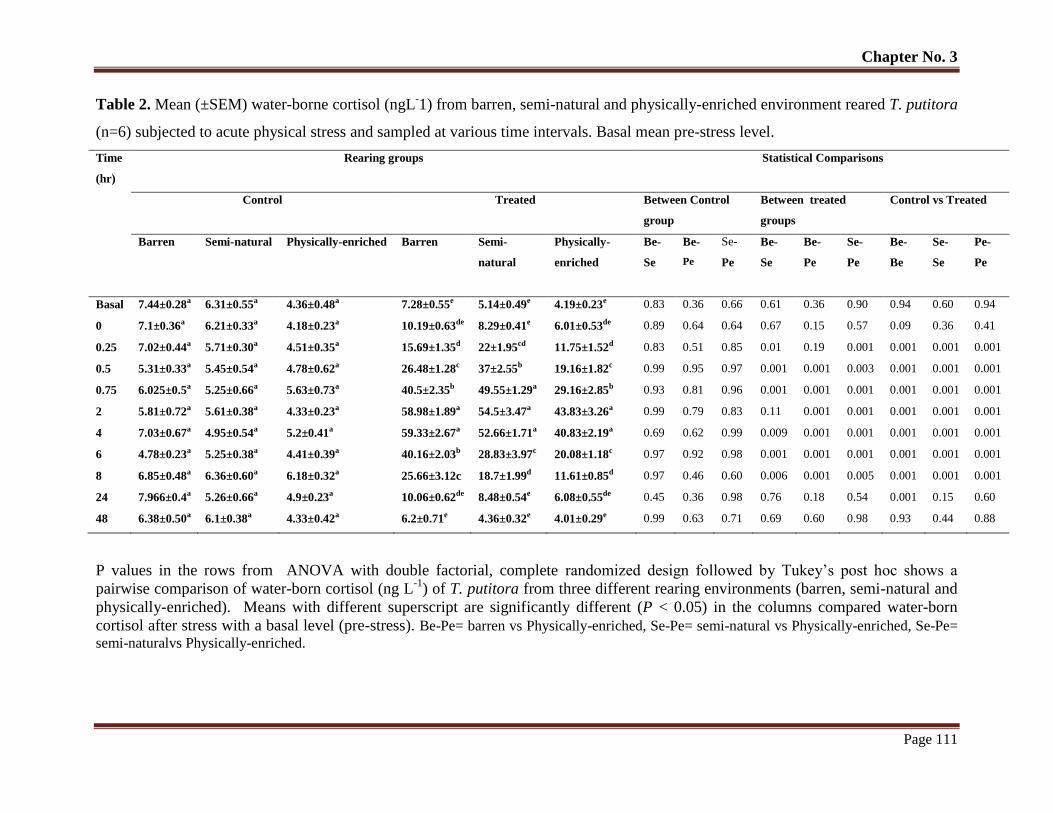
Chapter No. 3
Page 111
Table 2. Mean (±SEM) water-borne cortisol (ngL-1) from barren, semi-natural and physically-enriched environment reared T. putitora
(n=6) subjected to acute physical stress and sampled at various time intervals. Basal mean pre-stress level.
Time
(hr)
Rearing groups Statistical Comparisons
Control Treated Between Control
group
Between treated
groups
Control vs Treated
Barren Semi-natural Physically-enriched Barren Semi-
natural
Physically-
enriched
Be-
Se
Be-
Pe
Se-
Pe
Be-
Se
Be-
Pe
Se-
Pe
Be-
Be
Se-
Se
Pe-
Pe
Basal 7.44±0.28a 6.31±0.55a 4.36±0.48a 7.28±0.55e 5.14±0.49e 4.19±0.23e 0.83 0.36 0.66 0.61 0.36 0.90 0.94 0.60 0.94
0 7.1±0.36a 6.21±0.33a 4.18±0.23a 10.19±0.63de 8.29±0.41e 6.01±0.53de 0.89 0.64 0.64 0.67 0.15 0.57 0.09 0.36 0.41
0.25 7.02±0.44a 5.71±0.30a 4.51±0.35a 15.69±1.35d 22±1.95cd 11.75±1.52d 0.83 0.51 0.85 0.01 0.19 0.001 0.001 0.001 0.001
0.5 5.31±0.33a 5.45±0.54a 4.78±0.62a 26.48±1.28c 37±2.55b 19.16±1.82c 0.99 0.95 0.97 0.001 0.001 0.003 0.001 0.001 0.001
0.75 6.025±0.5a 5.25±0.66a 5.63±0.73a 40.5±2.35b 49.55±1.29a 29.16±2.85b 0.93 0.81 0.96 0.001 0.001 0.001 0.001 0.001 0.001
2 5.81±0.72a 5.61±0.38a 4.33±0.23a 58.98±1.89a 54.5±3.47a 43.83±3.26a 0.99 0.79 0.83 0.11 0.001 0.001 0.001 0.001 0.001
4 7.03±0.67a 4.95±0.54a 5.2±0.41a 59.33±2.67a 52.66±1.71a 40.83±2.19a 0.69 0.62 0.99 0.009 0.001 0.001 0.001 0.001 0.001
6 4.78±0.23a 5.25±0.38a 4.41±0.39a 40.16±2.03b 28.83±3.97c 20.08±1.18c 0.97 0.92 0.98 0.001 0.001 0.001 0.001 0.001 0.001
8 6.85±0.48a 6.36±0.60a 6.18±0.32a 25.66±3.12c 18.7±1.99d 11.61±0.85d 0.97 0.46 0.60 0.006 0.001 0.005 0.001 0.001 0.001
24 7.966±0.4a 5.26±0.66a 4.9±0.23a 10.06±0.62de 8.48±0.54e 6.08±0.55de 0.45 0.36 0.98 0.76 0.18 0.54 0.001 0.15 0.60
48 6.38±0.50a 6.1±0.38a 4.33±0.42a 6.2±0.71e 4.36±0.32e 4.01±0.29e 0.99 0.63 0.71 0.69 0.60 0.98 0.93 0.44 0.88
P values in the rows from ANOVA with double factorial, complete randomized design followed by Tukey’s post hoc shows a
pairwise comparison of water-born cortisol (ng L-1
) of T. putitora from three different rearing environments (barren, semi-natural and
physically-enriched). Means with different superscript are significantly different (P < 0.05) in the columns compared water-born
cortisol after stress with a basal level (pre-stress). Be-Pe= barren vs Physically-enriched, Se-Pe= semi-natural vs Physically-enriched, Se-Pe=
semi-naturalvs Physically-enriched.
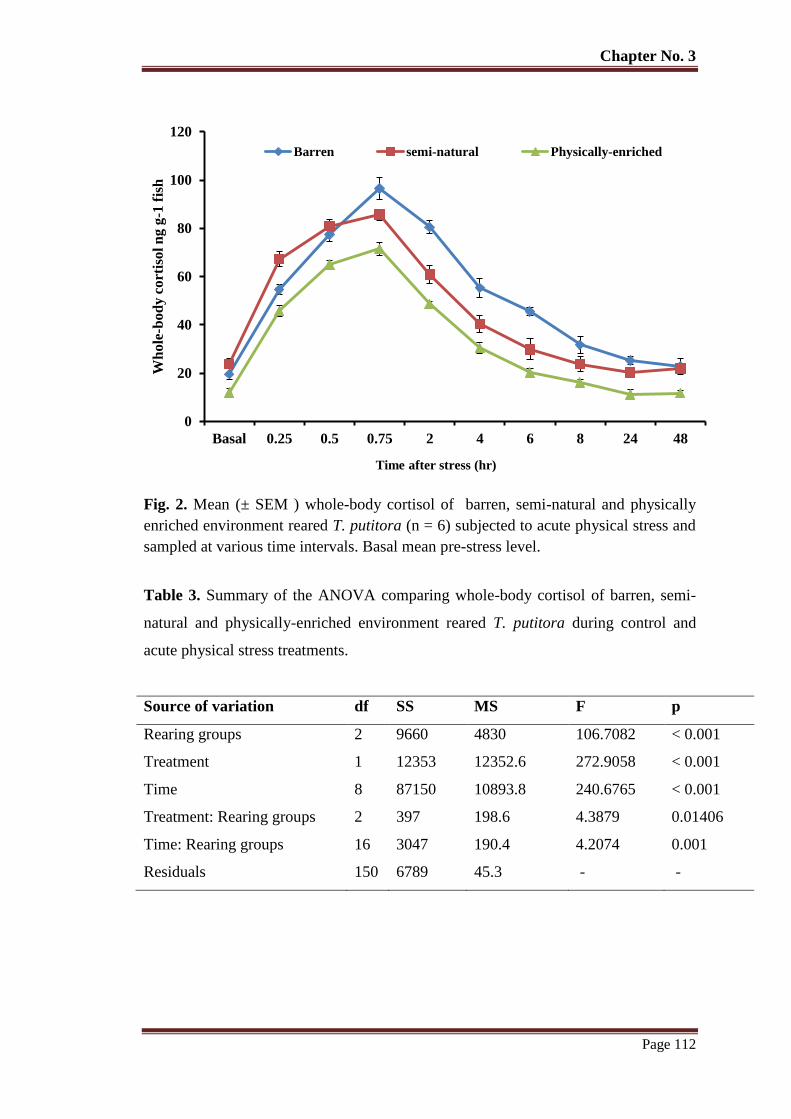
Chapter No. 3
Page 112
Fig. 2. Mean (± SEM ) whole-body cortisol of barren, semi-natural and physically
enriched environment reared T. putitora (n = 6) subjected to acute physical stress and
sampled at various time intervals. Basal mean pre-stress level.
Table 3. Summary of the ANOVA comparing whole-body cortisol of barren, semi-
natural and physically-enriched environment reared T. putitora during control and
acute physical stress treatments.
Source of variation df SS MS F p
Rearing groups 2 9660 4830 106.7082 < 0.001
Treatment 1 12353 12352.6 272.9058 < 0.001
Time 8 87150 10893.8 240.6765 < 0.001
Treatment: Rearing groups 2 397 198.6 4.3879 0.01406
Time: Rearing groups 16 3047 190.4 4.2074 0.001
Residuals 150 6789 45.3 - -
0
20
40
60
80
100
120
Basal 0.25 0.5 0.75 2 4 6 8 24 48
Wh
ole
-bo
dy
co
rtis
ol
ng
g-1
fis
h
Time after stress (hr)
Barren semi-natural Physically-enriched
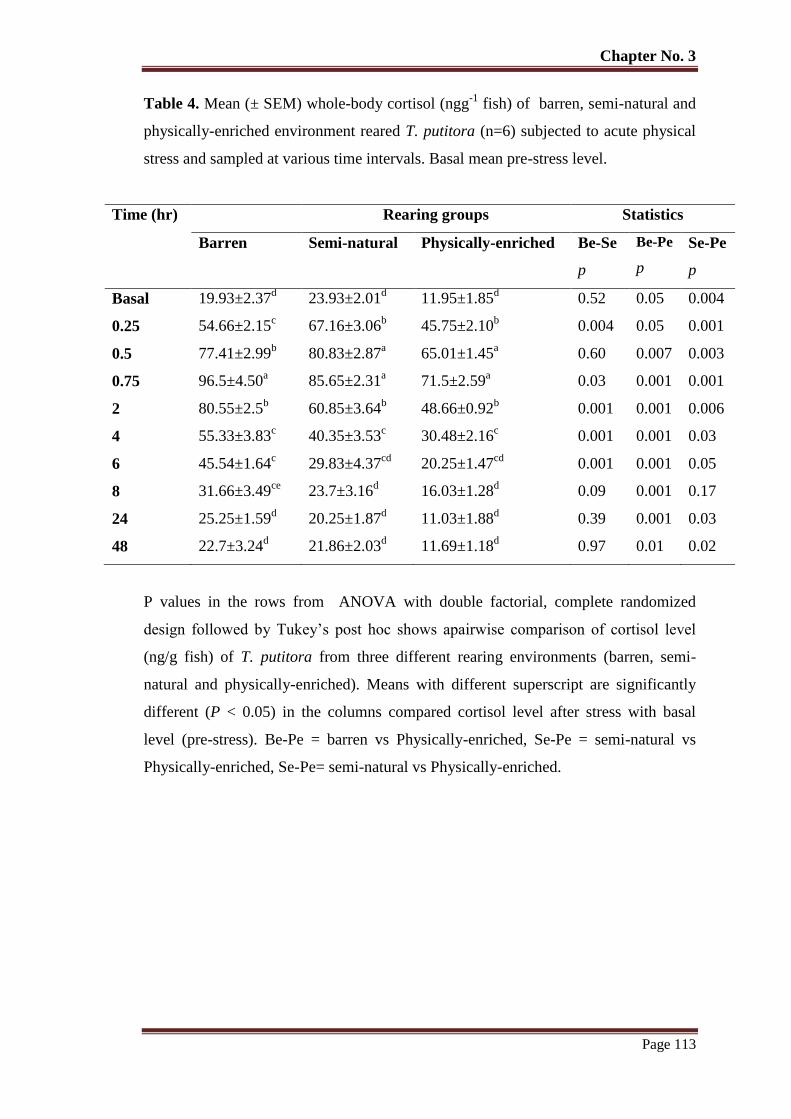
Chapter No. 3
Page 113
Table 4. Mean (± SEM) whole-body cortisol (ngg-1
fish) of barren, semi-natural and
physically-enriched environment reared T. putitora (n=6) subjected to acute physical
stress and sampled at various time intervals. Basal mean pre-stress level.
Time (hr) Rearing groups Statistics
Barren Semi-natural Physically-enriched Be-Se
p
Be-Pe
p
Se-Pe
p
Basal 19.93±2.37d 23.93±2.01
d 11.95±1.85
d 0.52 0.05 0.004
0.25 54.66±2.15c 67.16±3.06
b 45.75±2.10
b 0.004 0.05 0.001
0.5 77.41±2.99b 80.83±2.87
a 65.01±1.45
a 0.60 0.007 0.003
0.75 96.5±4.50a 85.65±2.31
a 71.5±2.59
a 0.03 0.001 0.001
2 80.55±2.5b 60.85±3.64
b 48.66±0.92
b 0.001 0.001 0.006
4 55.33±3.83c 40.35±3.53
c 30.48±2.16
c 0.001 0.001 0.03
6 45.54±1.64c 29.83±4.37
cd 20.25±1.47
cd 0.001 0.001 0.05
8 31.66±3.49ce
23.7±3.16d 16.03±1.28
d 0.09 0.001 0.17
24 25.25±1.59d 20.25±1.87
d 11.03±1.88
d 0.39 0.001 0.03
48 22.7±3.24d 21.86±2.03
d 11.69±1.18
d 0.97 0.01 0.02
P values in the rows from ANOVA with double factorial, complete randomized
design followed by Tukey’s post hoc shows apairwise comparison of cortisol level
(ng/g fish) of T. putitora from three different rearing environments (barren, semi-
natural and physically-enriched). Means with different superscript are significantly
different (P < 0.05) in the columns compared cortisol level after stress with basal
level (pre-stress). Be-Pe = barren vs Physically-enriched, Se-Pe = semi-natural vs
Physically-enriched, Se-Pe= semi-natural vs Physically-enriched.
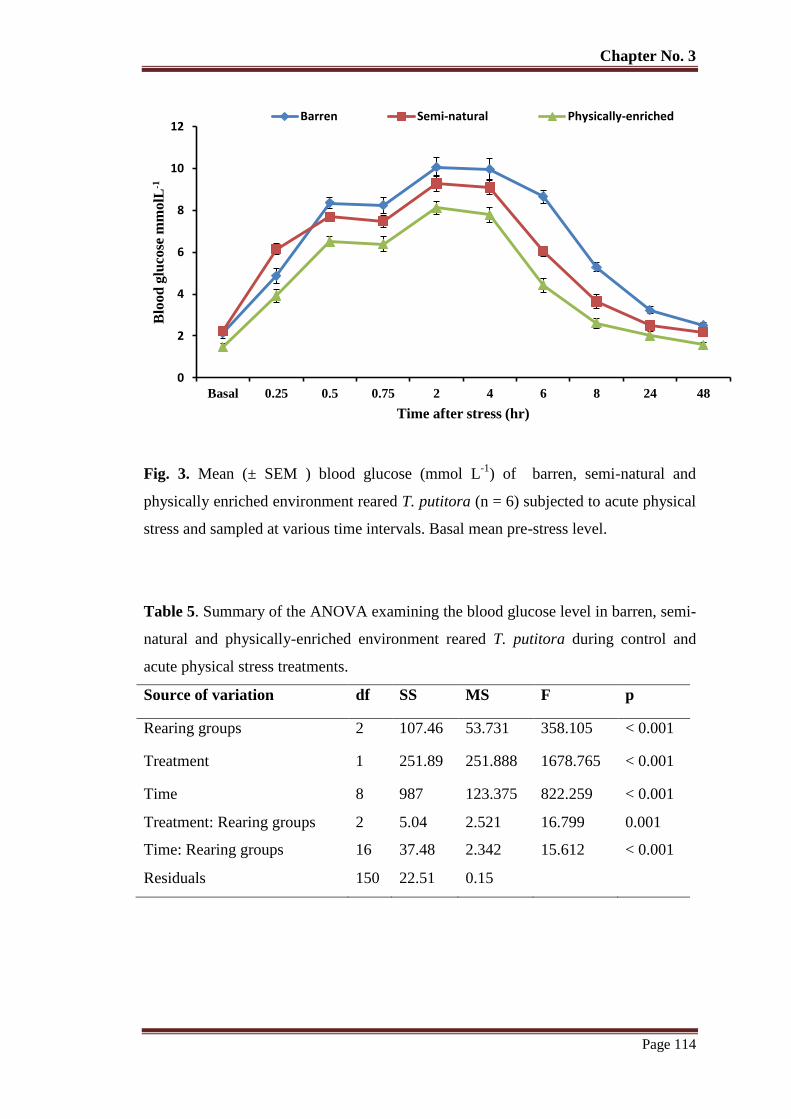
Chapter No. 3
Page 114
Fig. 3. Mean (± SEM ) blood glucose (mmol L-1
) of barren, semi-natural and
physically enriched environment reared T. putitora (n = 6) subjected to acute physical
stress and sampled at various time intervals. Basal mean pre-stress level.
Table 5. Summary of the ANOVA examining the blood glucose level in barren, semi-
natural and physically-enriched environment reared T. putitora during control and
acute physical stress treatments.
Source of variation df SS MS F p
Rearing groups 2 107.46 53.731 358.105 < 0.001
Treatment 1 251.89 251.888 1678.765 < 0.001
Time 8 987 123.375 822.259 < 0.001
Treatment: Rearing groups 2 5.04 2.521 16.799 0.001
Time: Rearing groups 16 37.48 2.342 15.612 < 0.001
Residuals 150 22.51 0.15
0
2
4
6
8
10
12
Basal 0.25 0.5 0.75 2 4 6 8 24 48
Blo
od
glu
cose
mm
olL
-1
Time after stress (hr)
Barren Semi-natural Physically-enriched

Chapter No. 3
Page 115
Table 6. Mean (±SEM) blood glucose (mmolL-1
) in barren, semi-natural and
physically-enriched environment reared T. putitora (n=6) subjected to acute physical
stress and sampled at various time intervals. Basal mean pre-stress level.
Time (hr) Rearing groups Statistics
Barren Semi-natural Physically-enriched Be-Se
p
Be-Pe
p
Se-Pe
p
Basal 2.13±0.23e 2.222±0.14
e 1.46±0.17
e 0.92 0.008 0.002
0.25 4.86±0.34c 6.14±0.25
c 3.92±0.31
c 0.001 0.001 0.001
0.5 8.35±0.24b 7.68±0.20
b 6.50±0.23
b 0.009 0.001 0.001
0.75 8.25±0.37b 7.47±0.28
b 6.38±0.36
b 0.001 0.001 0.001
2 10.5±0.46a 9.28±0.37
a 8.111±0.30
a 0.001 0.001 0.001
4 9.96±0.49a 9.08±0.34
a 7.78±0.36
a 0.001 0.001 0.001
6 8.6±0.30b 6.04±0.24
c 4.42±0.33
c 0.001 0.001 0.001
8 5.28±0.22c 3.64±0.31
d 2.61±0.23
d 0.001 0.001 0.001
24 3.2±0.17d 2.50±0.12
e 2.01±0.20
de 0.001 0.001 0.07
48 2.49±0.16e 2.17±0.12
e 1.57±0.10
e 0.342 0.001 0.02
P values in the rows from ANOVA with double factorial, complete randomized
design followed by Tukey’s post hoc shows a pairwise comparison of blood glucose
(mmol L-1
) of T. putitora from three different rearing environments (barren, semi-
natural and physically-enriched). Means with different superscript are significantly
different (P < 0.05) in the columns compared glucose after stress with a basal level
(pre-stress). Bf-Sf= barren tank reared fish vs semi-natural reared fish, Be-Pe= barren
vs Physically-enriched, Se-Pe= semi-naturalvs Physically-enriched, Se-Pe= semi-naturalvs
Physically-enriched.
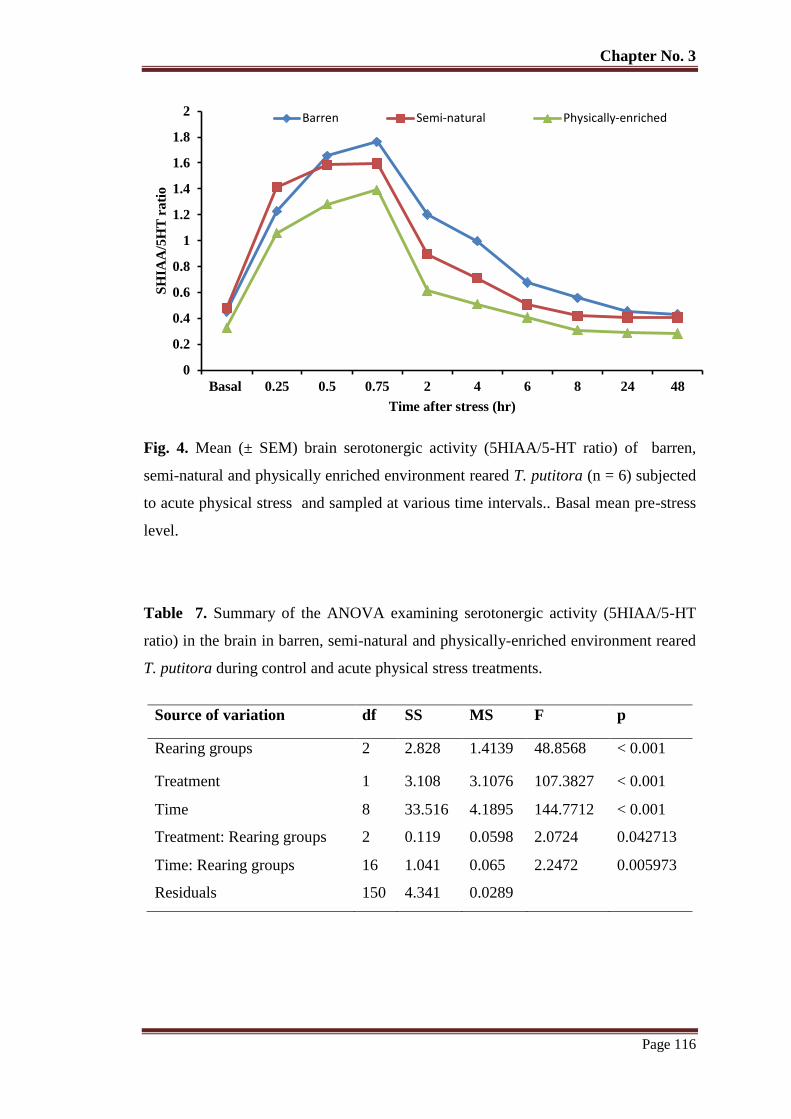
Chapter No. 3
Page 116
Fig. 4. Mean (± SEM) brain serotonergic activity (5HIAA/5-HT ratio) of barren,
semi-natural and physically enriched environment reared T. putitora (n = 6) subjected
to acute physical stress and sampled at various time intervals.. Basal mean pre-stress
level.
Table 7. Summary of the ANOVA examining serotonergic activity (5HIAA/5-HT
ratio) in the brain in barren, semi-natural and physically-enriched environment reared
T. putitora during control and acute physical stress treatments.
Source of variation df SS MS F p
Rearing groups 2 2.828 1.4139 48.8568 < 0.001
Treatment 1 3.108 3.1076 107.3827 < 0.001
Time 8 33.516 4.1895 144.7712 < 0.001
Treatment: Rearing groups 2 0.119 0.0598 2.0724 0.042713
Time: Rearing groups 16 1.041 0.065 2.2472 0.005973
Residuals 150 4.341 0.0289
0
0.2
0.4
0.6
0.8
1
1.2
1.4
1.6
1.8
2
Basal 0.25 0.5 0.75 2 4 6 8 24 48
SH
IAA
/5H
T r
ati
o
Time after stress (hr)
Barren Semi-natural Physically-enriched
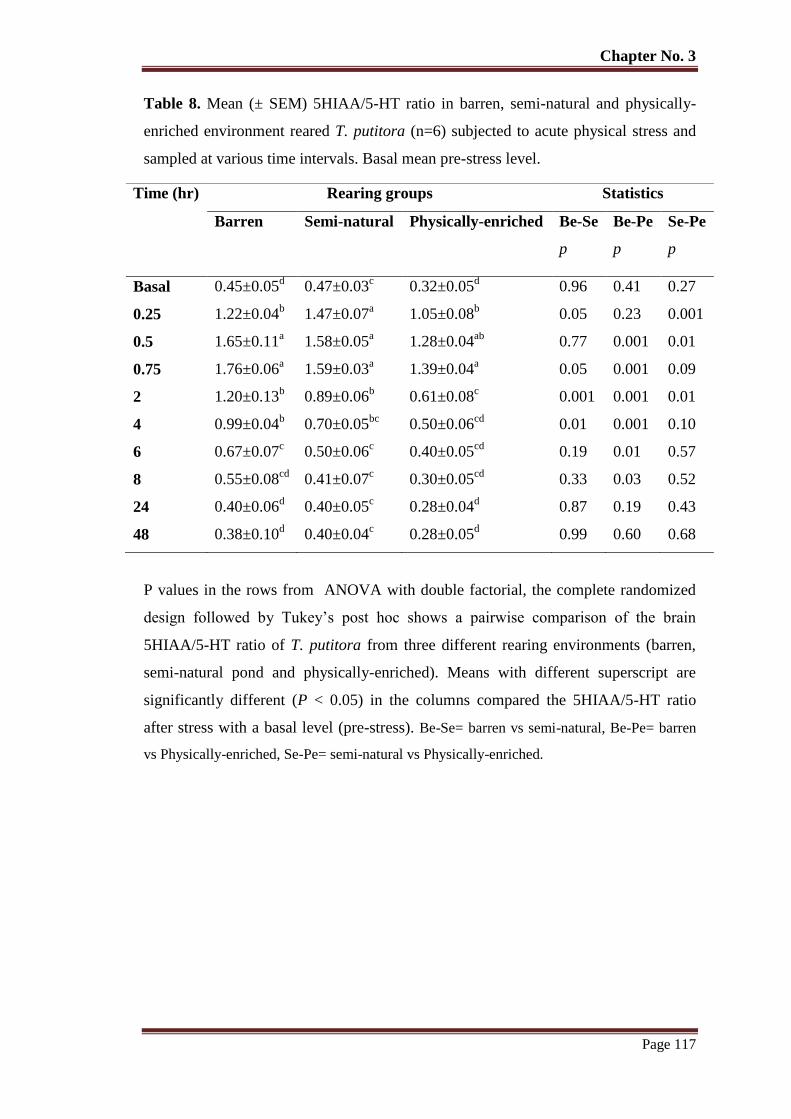
Chapter No. 3
Page 117
Table 8. Mean (± SEM) 5HIAA/5-HT ratio in barren, semi-natural and physically-
enriched environment reared T. putitora (n=6) subjected to acute physical stress and
sampled at various time intervals. Basal mean pre-stress level.
P values in the rows from ANOVA with double factorial, the complete randomized
design followed by Tukey’s post hoc shows a pairwise comparison of the brain
5HIAA/5-HT ratio of T. putitora from three different rearing environments (barren,
semi-natural pond and physically-enriched). Means with different superscript are
significantly different (P < 0.05) in the columns compared the 5HIAA/5-HT ratio
after stress with a basal level (pre-stress). Be-Se= barren vs semi-natural, Be-Pe= barren
vs Physically-enriched, Se-Pe= semi-natural vs Physically-enriched.
Time (hr) Rearing groups Statistics
Barren Semi-natural Physically-enriched Be-Se
p
Be-Pe
p
Se-Pe
p
Basal 0.45±0.05d 0.47±0.03
c 0.32±0.05
d 0.96 0.41 0.27
0.25 1.22±0.04b 1.47±0.07
a 1.05±0.08
b 0.05 0.23 0.001
0.5 1.65±0.11a 1.58±0.05
a 1.28±0.04
ab 0.77 0.001 0.01
0.75 1.76±0.06a 1.59±0.03
a 1.39±0.04
a 0.05 0.001 0.09
2 1.20±0.13b 0.89±0.06
b 0.61±0.08
c 0.001 0.001 0.01
4 0.99±0.04b 0.70±0.05
bc 0.50±0.06
cd 0.01 0.001 0.10
6 0.67±0.07c 0.50±0.06
c 0.40±0.05
cd 0.19 0.01 0.57
8 0.55±0.08cd
0.41±0.07c 0.30±0.05
cd 0.33 0.03 0.52
24 0.40±0.06d 0.40±0.05
c 0.28±0.04
d 0.87 0.19 0.43
48 0.38±0.10d 0.40±0.04
c 0.28±0.05
d 0.99 0.60 0.68
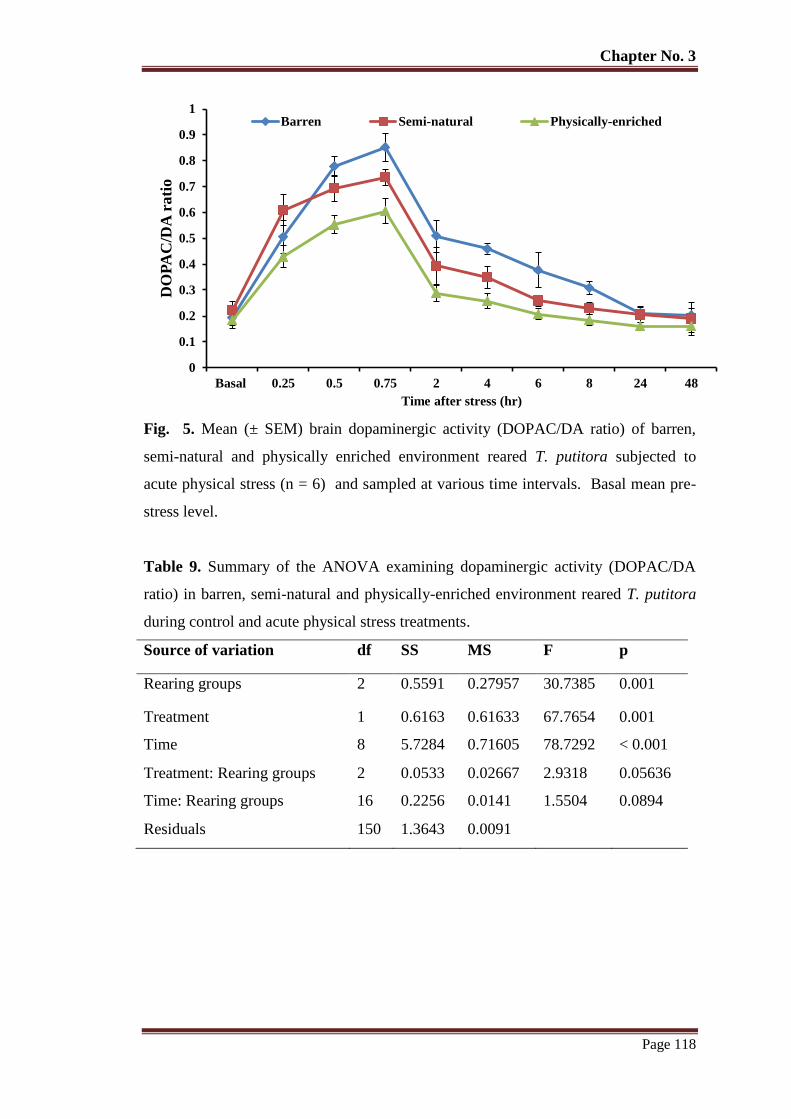
Chapter No. 3
Page 118
Fig. 5. Mean (± SEM) brain dopaminergic activity (DOPAC/DA ratio) of barren,
semi-natural and physically enriched environment reared T. putitora subjected to
acute physical stress (n = 6) and sampled at various time intervals. Basal mean pre-
stress level.
Table 9. Summary of the ANOVA examining dopaminergic activity (DOPAC/DA
ratio) in barren, semi-natural and physically-enriched environment reared T. putitora
during control and acute physical stress treatments.
Source of variation df SS MS F p
Rearing groups 2 0.5591 0.27957 30.7385 0.001
Treatment 1 0.6163 0.61633 67.7654 0.001
Time 8 5.7284 0.71605 78.7292 < 0.001
Treatment: Rearing groups 2 0.0533 0.02667 2.9318 0.05636
Time: Rearing groups 16 0.2256 0.0141 1.5504 0.0894
Residuals 150 1.3643 0.0091
0
0.1
0.2
0.3
0.4
0.5
0.6
0.7
0.8
0.9
1
Basal 0.25 0.5 0.75 2 4 6 8 24 48
DO
PA
C/D
A r
ati
o
Time after stress (hr)
Barren Semi-natural Physically-enriched
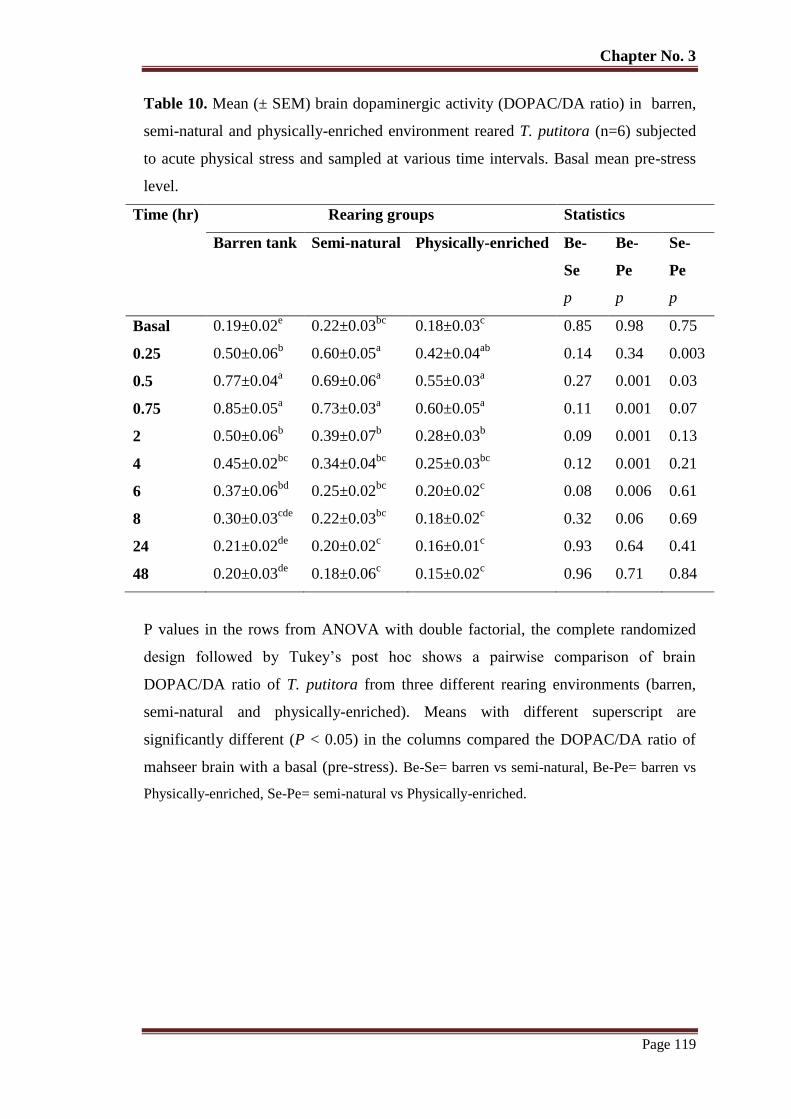
Chapter No. 3
Page 119
Table 10. Mean (± SEM) brain dopaminergic activity (DOPAC/DA ratio) in barren,
semi-natural and physically-enriched environment reared T. putitora (n=6) subjected
to acute physical stress and sampled at various time intervals. Basal mean pre-stress
level.
Time (hr) Rearing groups Statistics
Barren tank Semi-natural Physically-enriched Be-
Se
p
Be-
Pe
p
Se-
Pe
p
Basal 0.19±0.02e 0.22±0.03
bc 0.18±0.03
c 0.85 0.98 0.75
0.25 0.50±0.06b 0.60±0.05
a 0.42±0.04
ab 0.14 0.34 0.003
0.5 0.77±0.04a 0.69±0.06
a 0.55±0.03
a 0.27 0.001 0.03
0.75 0.85±0.05a 0.73±0.03
a 0.60±0.05
a 0.11 0.001 0.07
2 0.50±0.06b 0.39±0.07
b 0.28±0.03
b 0.09 0.001 0.13
4 0.45±0.02bc
0.34±0.04bc
0.25±0.03bc
0.12 0.001 0.21
6 0.37±0.06bd
0.25±0.02bc
0.20±0.02c 0.08 0.006 0.61
8 0.30±0.03cde
0.22±0.03bc
0.18±0.02c 0.32 0.06 0.69
24 0.21±0.02de
0.20±0.02c 0.16±0.01
c 0.93 0.64 0.41
48 0.20±0.03de
0.18±0.06c 0.15±0.02
c 0.96 0.71 0.84
P values in the rows from ANOVA with double factorial, the complete randomized
design followed by Tukey’s post hoc shows a pairwise comparison of brain
DOPAC/DA ratio of T. putitora from three different rearing environments (barren,
semi-natural and physically-enriched). Means with different superscript are
significantly different (P < 0.05) in the columns compared the DOPAC/DA ratio of
mahseer brain with a basal (pre-stress). Be-Se= barren vs semi-natural, Be-Pe= barren vs
Physically-enriched, Se-Pe= semi-natural vs Physically-enriched.
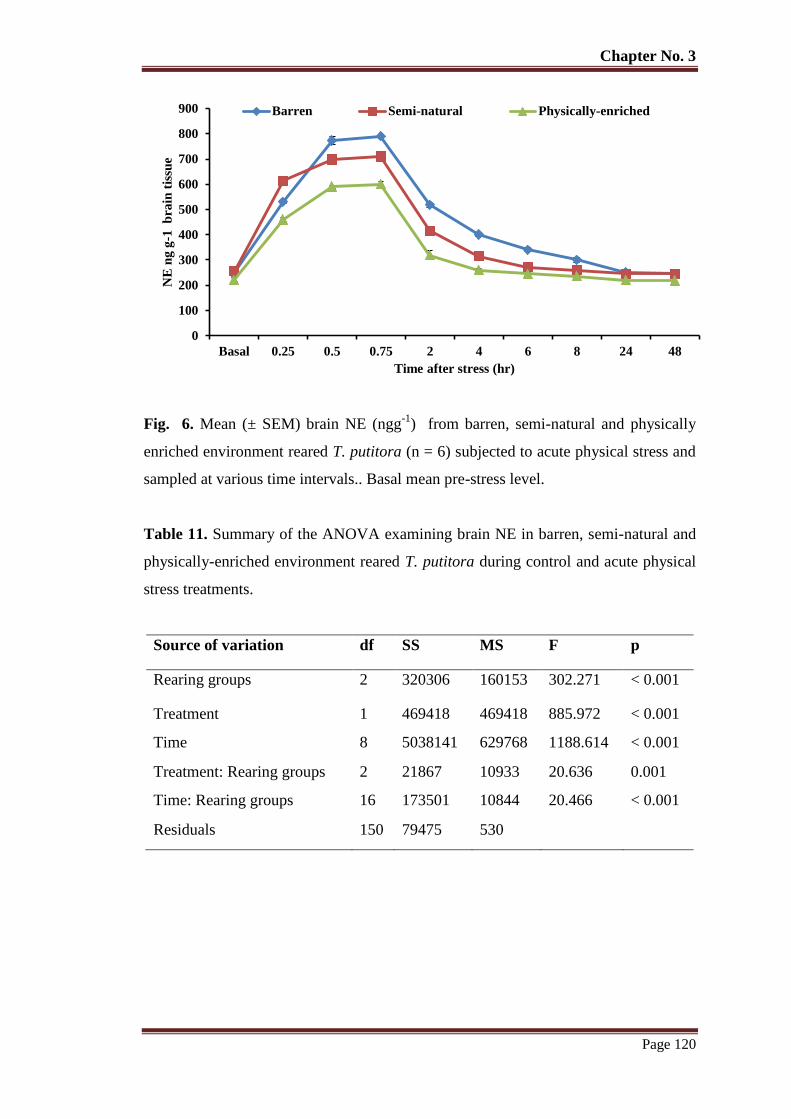
Chapter No. 3
Page 120
Fig. 6. Mean (± SEM) brain NE (ngg-1
) from barren, semi-natural and physically
enriched environment reared T. putitora (n = 6) subjected to acute physical stress and
sampled at various time intervals.. Basal mean pre-stress level.
Table 11. Summary of the ANOVA examining brain NE in barren, semi-natural and
physically-enriched environment reared T. putitora during control and acute physical
stress treatments.
Source of variation df SS MS F p
Rearing groups 2 320306 160153 302.271 < 0.001
Treatment 1 469418 469418 885.972 < 0.001
Time 8 5038141 629768 1188.614 < 0.001
Treatment: Rearing groups 2 21867 10933 20.636 0.001
Time: Rearing groups 16 173501 10844 20.466 < 0.001
Residuals 150 79475 530
0
100
200
300
400
500
600
700
800
900
Basal 0.25 0.5 0.75 2 4 6 8 24 48
NE
ng
g-1
b
rain
tis
sue
Time after stress (hr)
Barren Semi-natural Physically-enriched
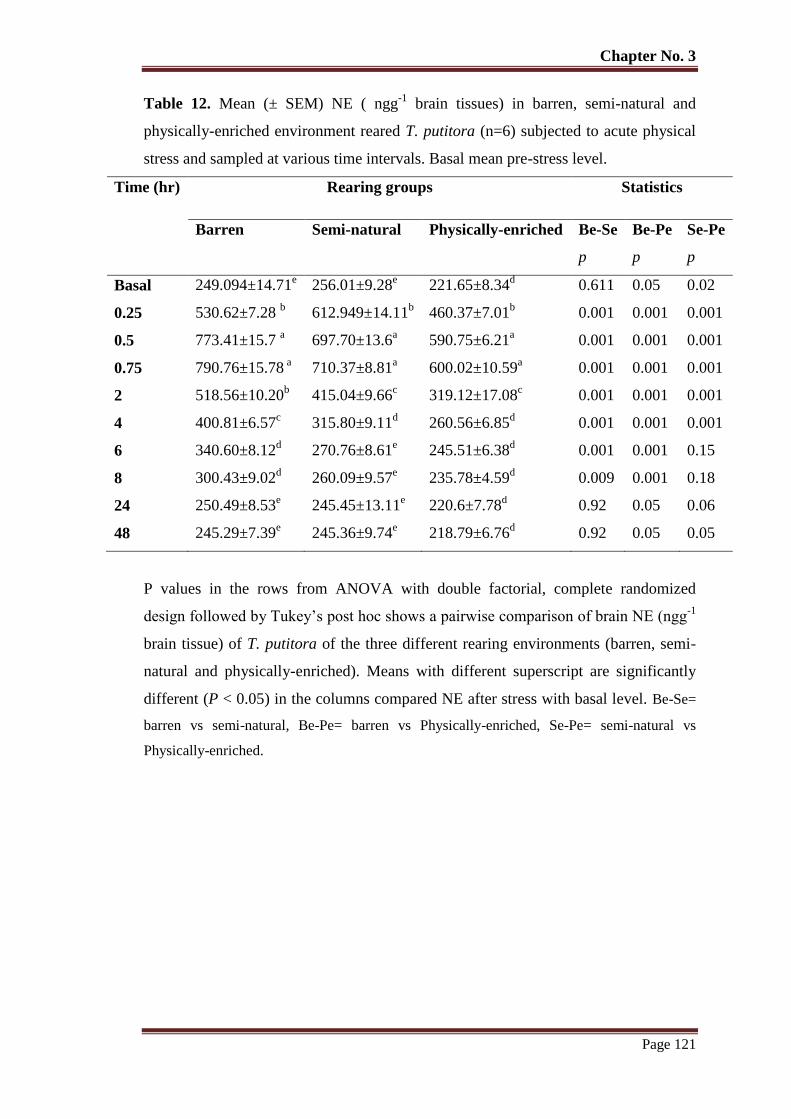
Chapter No. 3
Page 121
Table 12. Mean (± SEM) NE ( ngg-1
brain tissues) in barren, semi-natural and
physically-enriched environment reared T. putitora (n=6) subjected to acute physical
stress and sampled at various time intervals. Basal mean pre-stress level.
Time (hr) Rearing groups Statistics
Barren Semi-natural Physically-enriched Be-Se
p
Be-Pe
p
Se-Pe
p
Basal 249.094±14.71e 256.01±9.28
e 221.65±8.34
d 0.611 0.05 0.02
0.25 530.62±7.28 b 612.949±14.11
b 460.37±7.01
b 0.001 0.001 0.001
0.5 773.41±15.7 a 697.70±13.6
a 590.75±6.21
a 0.001 0.001 0.001
0.75 790.76±15.78 a 710.37±8.81
a 600.02±10.59
a 0.001 0.001 0.001
2 518.56±10.20b 415.04±9.66
c 319.12±17.08
c 0.001 0.001 0.001
4 400.81±6.57c 315.80±9.11
d 260.56±6.85
d 0.001 0.001 0.001
6 340.60±8.12d 270.76±8.61
e 245.51±6.38
d 0.001 0.001 0.15
8 300.43±9.02d 260.09±9.57
e 235.78±4.59
d 0.009 0.001 0.18
24 250.49±8.53e 245.45±13.11
e 220.6±7.78
d 0.92 0.05 0.06
48 245.29±7.39e 245.36±9.74
e 218.79±6.76
d 0.92 0.05 0.05
P values in the rows from ANOVA with double factorial, complete randomized
design followed by Tukey’s post hoc shows a pairwise comparison of brain NE (ngg-1
brain tissue) of T. putitora of the three different rearing environments (barren, semi-
natural and physically-enriched). Means with different superscript are significantly
different (P < 0.05) in the columns compared NE after stress with basal level. Be-Se=
barren vs semi-natural, Be-Pe= barren vs Physically-enriched, Se-Pe= semi-natural vs
Physically-enriched.
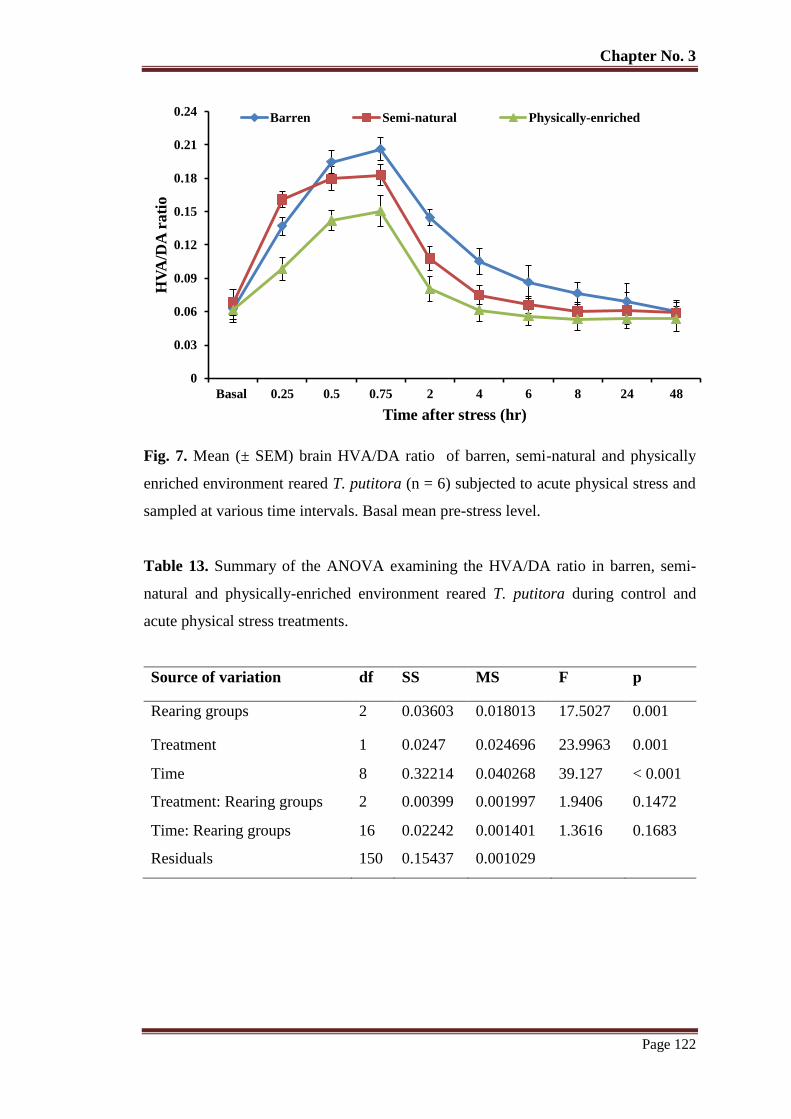
Chapter No. 3
Page 122
Fig. 7. Mean (± SEM) brain HVA/DA ratio of barren, semi-natural and physically
enriched environment reared T. putitora (n = 6) subjected to acute physical stress and
sampled at various time intervals. Basal mean pre-stress level.
Table 13. Summary of the ANOVA examining the HVA/DA ratio in barren, semi-
natural and physically-enriched environment reared T. putitora during control and
acute physical stress treatments.
Source of variation df SS MS F p
Rearing groups 2 0.03603 0.018013 17.5027 0.001
Treatment 1 0.0247 0.024696 23.9963 0.001
Time 8 0.32214 0.040268 39.127 < 0.001
Treatment: Rearing groups 2 0.00399 0.001997 1.9406 0.1472
Time: Rearing groups 16 0.02242 0.001401 1.3616 0.1683
Residuals 150 0.15437 0.001029
0
0.03
0.06
0.09
0.12
0.15
0.18
0.21
0.24
Basal 0.25 0.5 0.75 2 4 6 8 24 48
HV
A/D
A r
ati
o
Time after stress (hr)
Barren Semi-natural Physically-enriched
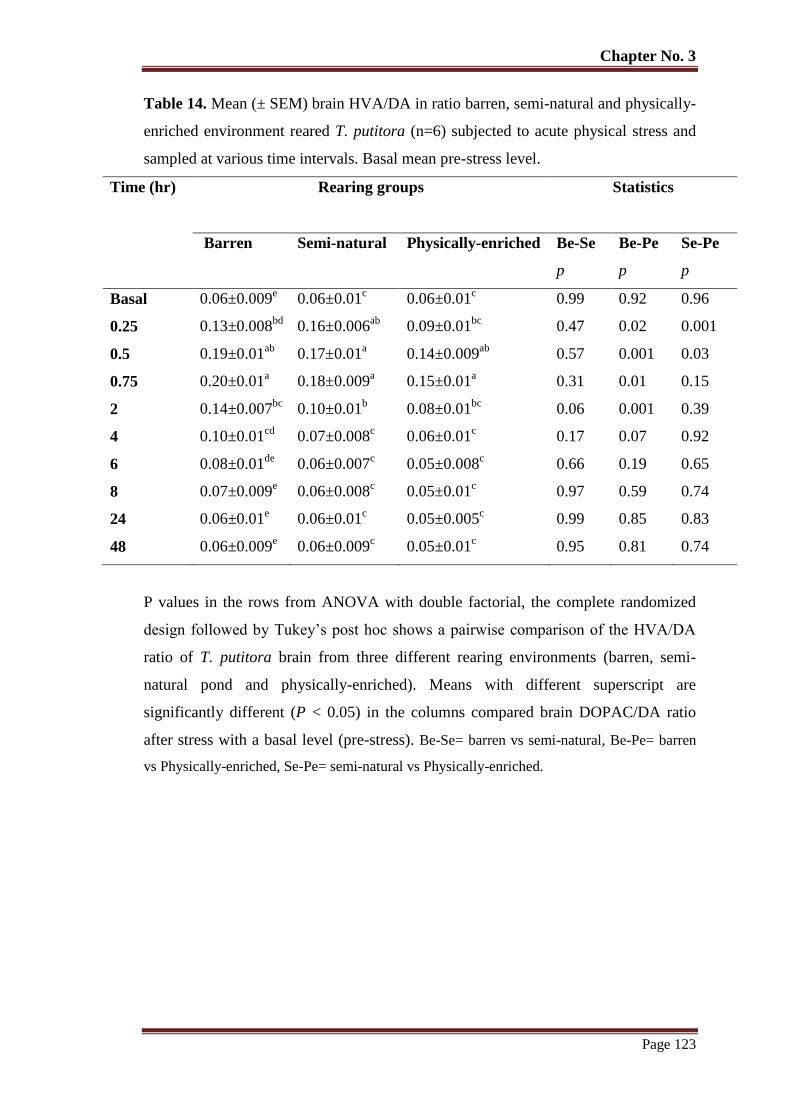
Chapter No. 3
Page 123
Table 14. Mean (± SEM) brain HVA/DA in ratio barren, semi-natural and physically-
enriched environment reared T. putitora (n=6) subjected to acute physical stress and
sampled at various time intervals. Basal mean pre-stress level.
Time (hr) Rearing groups Statistics
Barren Semi-natural Physically-enriched Be-Se
p
Be-Pe
p
Se-Pe
p
Basal 0.06±0.009e 0.06±0.01
c 0.06±0.01
c 0.99 0.92 0.96
0.25 0.13±0.008bd
0.16±0.006ab
0.09±0.01bc
0.47 0.02 0.001
0.5 0.19±0.01ab
0.17±0.01a 0.14±0.009
ab 0.57 0.001 0.03
0.75 0.20±0.01a 0.18±0.009
a 0.15±0.01
a 0.31 0.01 0.15
2 0.14±0.007bc
0.10±0.01b 0.08±0.01
bc 0.06 0.001 0.39
4 0.10±0.01cd
0.07±0.008c 0.06±0.01
c 0.17 0.07 0.92
6 0.08±0.01de
0.06±0.007c 0.05±0.008
c 0.66 0.19 0.65
8 0.07±0.009e 0.06±0.008
c 0.05±0.01
c 0.97 0.59 0.74
24 0.06±0.01e 0.06±0.01
c 0.05±0.005
c 0.99 0.85 0.83
48 0.06±0.009e 0.06±0.009
c 0.05±0.01
c 0.95 0.81 0.74
P values in the rows from ANOVA with double factorial, the complete randomized
design followed by Tukey’s post hoc shows a pairwise comparison of the HVA/DA
ratio of T. putitora brain from three different rearing environments (barren, semi-
natural pond and physically-enriched). Means with different superscript are
significantly different (P < 0.05) in the columns compared brain DOPAC/DA ratio
after stress with a basal level (pre-stress). Be-Se= barren vs semi-natural, Be-Pe= barren
vs Physically-enriched, Se-Pe= semi-natural vs Physically-enriched.
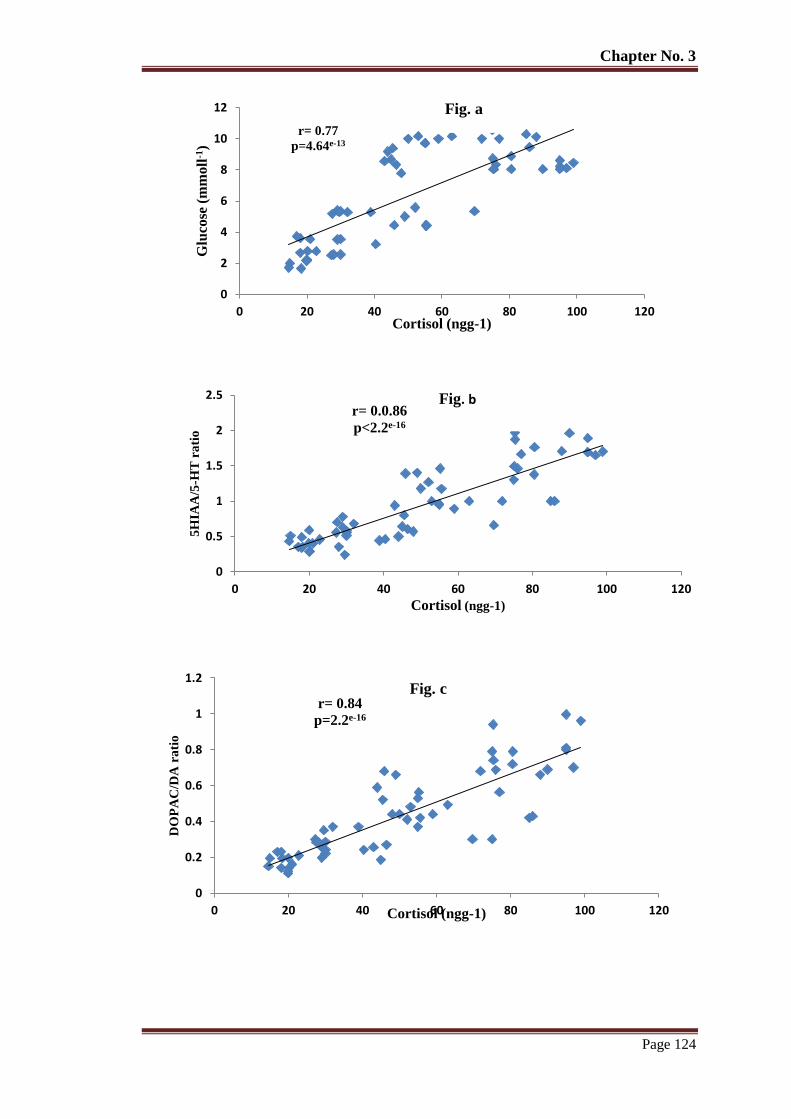
Chapter No. 3
Page 124
r= 0.77
p=4.64e-13
0
2
4
6
8
10
12
0 20 40 60 80 100 120
Glu
cose
(m
mo
ll-1
)
Cortisol (ngg-1)
r= 0.0.86
p<2.2e-16
0
0.5
1
1.5
2
2.5
0 20 40 60 80 100 120
5H
IAA
/5-H
T r
ati
o
Cortisol (ngg-1)
r= 0.84
p=2.2e-16
0
0.2
0.4
0.6
0.8
1
1.2
0 20 40 60 80 100 120
DO
PA
C/D
A r
ati
o
Cortisol (ngg-1)
Fig. c
Fig. b
Fig. a
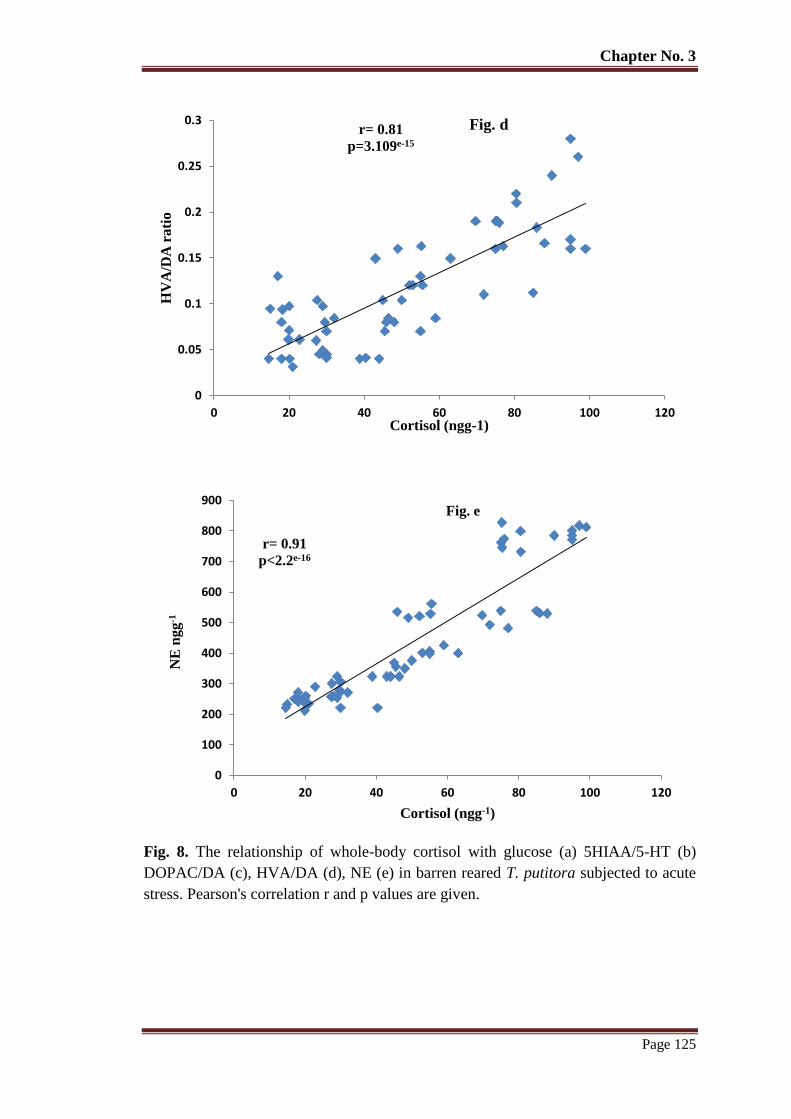
Chapter No. 3
Page 125
Fig. 8. The relationship of whole-body cortisol with glucose (a) 5HIAA/5-HT (b)
DOPAC/DA (c), HVA/DA (d), NE (e) in barren reared T. putitora subjected to acute
stress. Pearson's correlation r and p values are given.
r= 0.81
p=3.109e-15
0
0.05
0.1
0.15
0.2
0.25
0.3
0 20 40 60 80 100 120
HV
A/D
A r
ati
o
Cortisol (ngg-1)
Fig. d
r= 0.91
p<2.2e-16
0
100
200
300
400
500
600
700
800
900
0 20 40 60 80 100 120
NE
ngg
-1
Cortisol (ngg-1)
Fig. e
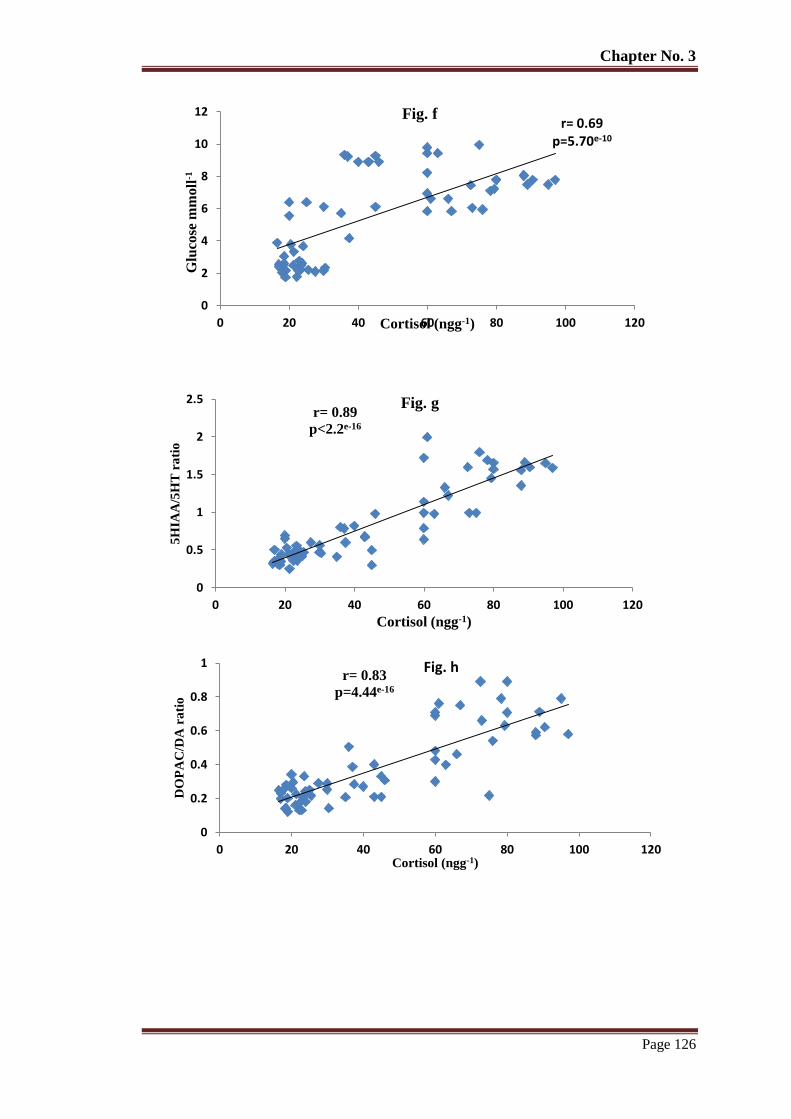
Chapter No. 3
Page 126
r= 0.69
p=5.70e-10
0
2
4
6
8
10
12
0 20 40 60 80 100 120
Glu
cose
mm
oll
-1
Cortisol (ngg-1)
Fig. f
r= 0.89
p<2.2e-16
0
0.5
1
1.5
2
2.5
0 20 40 60 80 100 120
5H
IAA
/5H
T r
ati
o
Cortisol (ngg-1)
Fig. g
r= 0.83
p=4.44e-16
0
0.2
0.4
0.6
0.8
1
0 20 40 60 80 100 120
DO
PA
C/D
A r
ati
o
Cortisol (ngg-1)
Fig. h
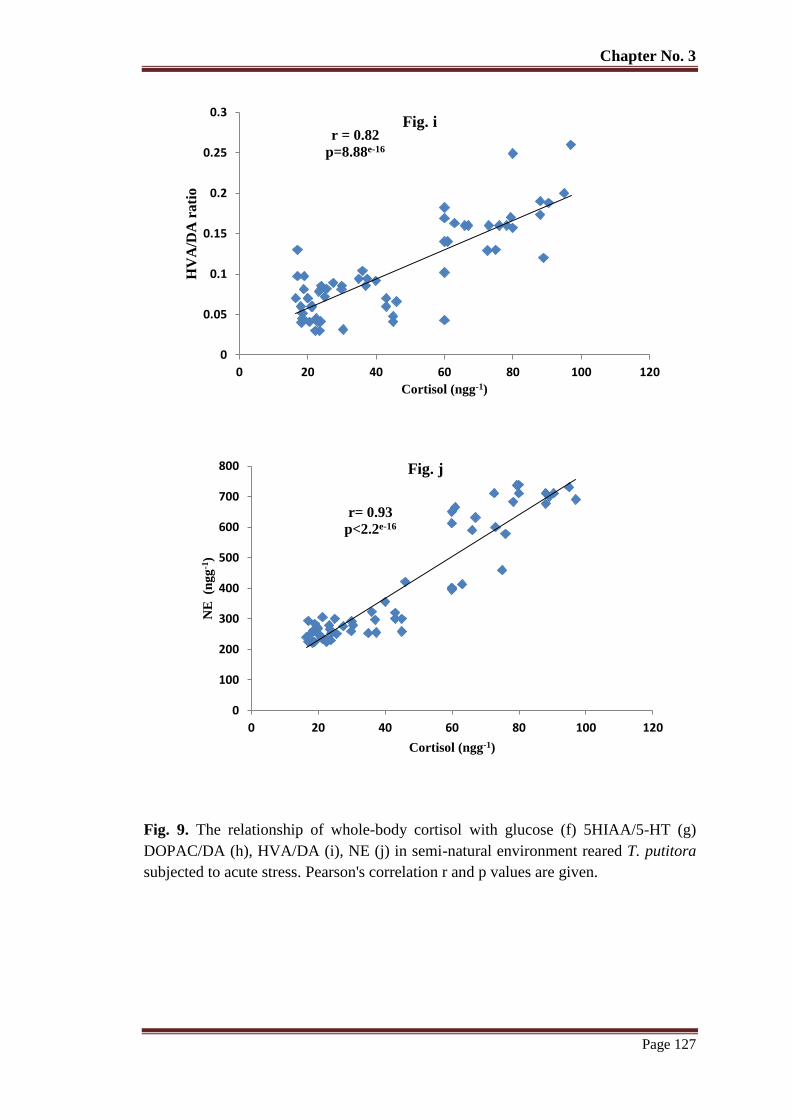
Chapter No. 3
Page 127
Fig. 9. The relationship of whole-body cortisol with glucose (f) 5HIAA/5-HT (g)
DOPAC/DA (h), HVA/DA (i), NE (j) in semi-natural environment reared T. putitora
subjected to acute stress. Pearson's correlation r and p values are given.
r = 0.82
p=8.88e-16
0
0.05
0.1
0.15
0.2
0.25
0.3
0 20 40 60 80 100 120
HV
A/D
A r
ati
o
Cortisol (ngg-1)
Fig. i
r= 0.93
p<2.2e-16
0
100
200
300
400
500
600
700
800
0 20 40 60 80 100 120
NE
(n
gg
-1)
Cortisol (ngg-1)
Fig. j
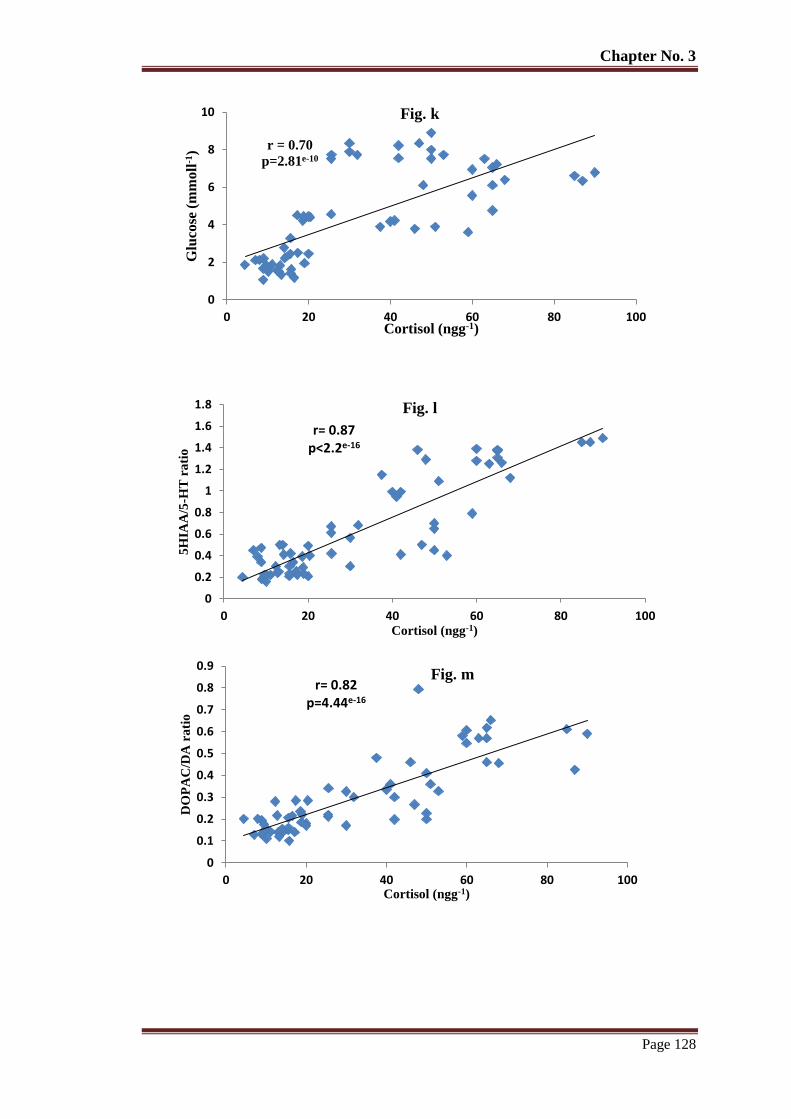
Chapter No. 3
Page 128
r = 0.70
p=2.81e-10
0
2
4
6
8
10
0 20 40 60 80 100
Glu
cose
(m
mo
ll-1
)
Cortisol (ngg-1)
Fig. k
r= 0.87
p<2.2e-16
0
0.2
0.4
0.6
0.8
1
1.2
1.4
1.6
1.8
0 20 40 60 80 100
5H
IAA
/5-H
T r
ati
o
Cortisol (ngg-1)
Fig. l
r= 0.82
p=4.44e-16
0
0.1
0.2
0.3
0.4
0.5
0.6
0.7
0.8
0.9
0 20 40 60 80 100
DO
PA
C/D
A r
ati
o
Cortisol (ngg-1)
Fig. m

Chapter No. 3
Page 129
Fig. 10. The relationship of whole-body cortisol with glucose (k) 5HIAA/5-HT (l)
DOPAC/DA (m), HVA/DA (n), NE (0) in a physically-enriched environment reared
T. putitora subjected to acute stress. Pearson's correlation r and p values are given.
r = 0.71
p=1.44e--10
0
0.05
0.1
0.15
0.2
0.25
0 20 40 60 80 100
HV
A/D
A r
ati
o
Cortisol (ngg-1)
Fig. n
r= 0.90
p<2.2e-16
0
100
200
300
400
500
600
700
0 20 40 60 80 100
NE
(n
gg
-1)
Cortisol (ngg-1)
Fig. o
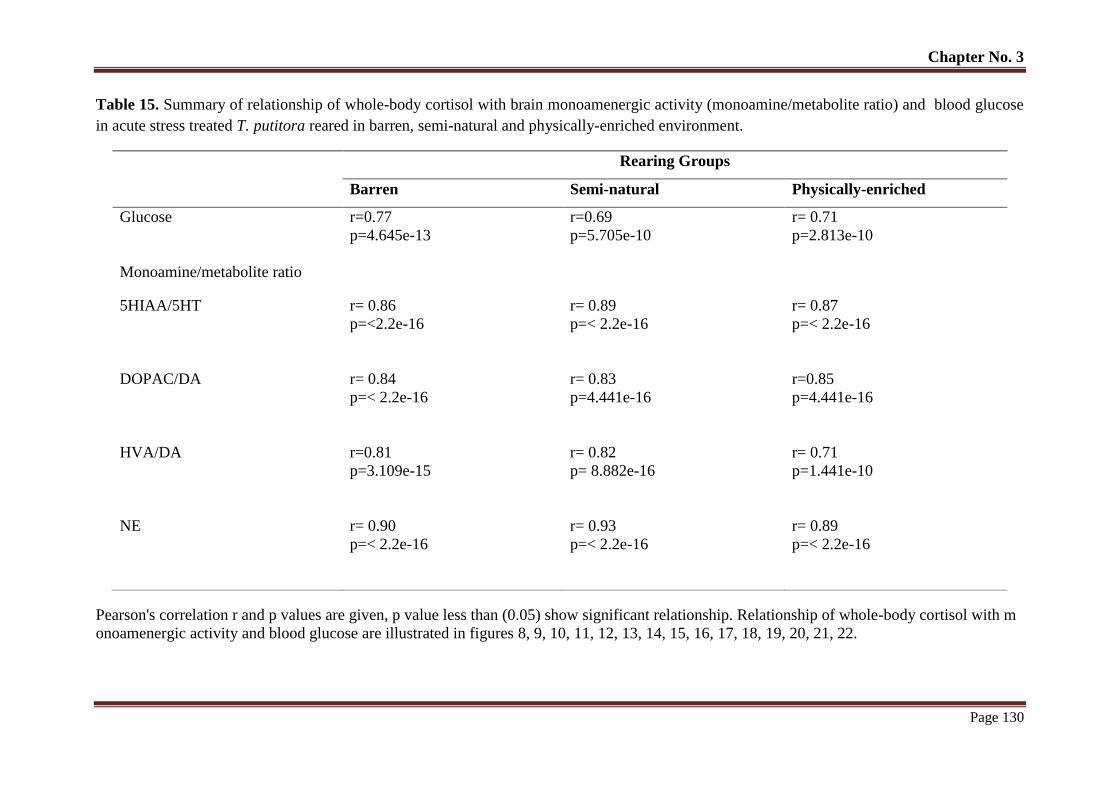
Chapter No. 3
Page 130
Table 15. Summary of relationship of whole-body cortisol with brain monoamenergic activity (monoamine/metabolite ratio) and blood glucose
in acute stress treated T. putitora reared in barren, semi-natural and physically-enriched environment.
Rearing Groups
Barren Semi-natural Physically-enriched
Glucose r=0.77
p=4.645e-13
r=0.69
p=5.705e-10
r= 0.71
p=2.813e-10
Monoamine/metabolite ratio
5HIAA/5HT r= 0.86
p=<2.2e-16
r= 0.89
p=< 2.2e-16
r= 0.87
p=< 2.2e-16
DOPAC/DA r= 0.84
p=< 2.2e-16
r= 0.83
p=4.441e-16
r=0.85
p=4.441e-16
HVA/DA r=0.81
p=3.109e-15
r= 0.82
p= 8.882e-16
r= 0.71
p=1.441e-10
NE r= 0.90
p=< 2.2e-16
r= 0.93
p=< 2.2e-16
r= 0.89
p=< 2.2e-16
Pearson's correlation r and p values are given, p value less than (0.05) show significant relationship. Relationship of whole-body cortisol with m
onoamenergic activity and blood glucose are illustrated in figures 8, 9, 10, 11, 12, 13, 14, 15, 16, 17, 18, 19, 20, 21, 22.
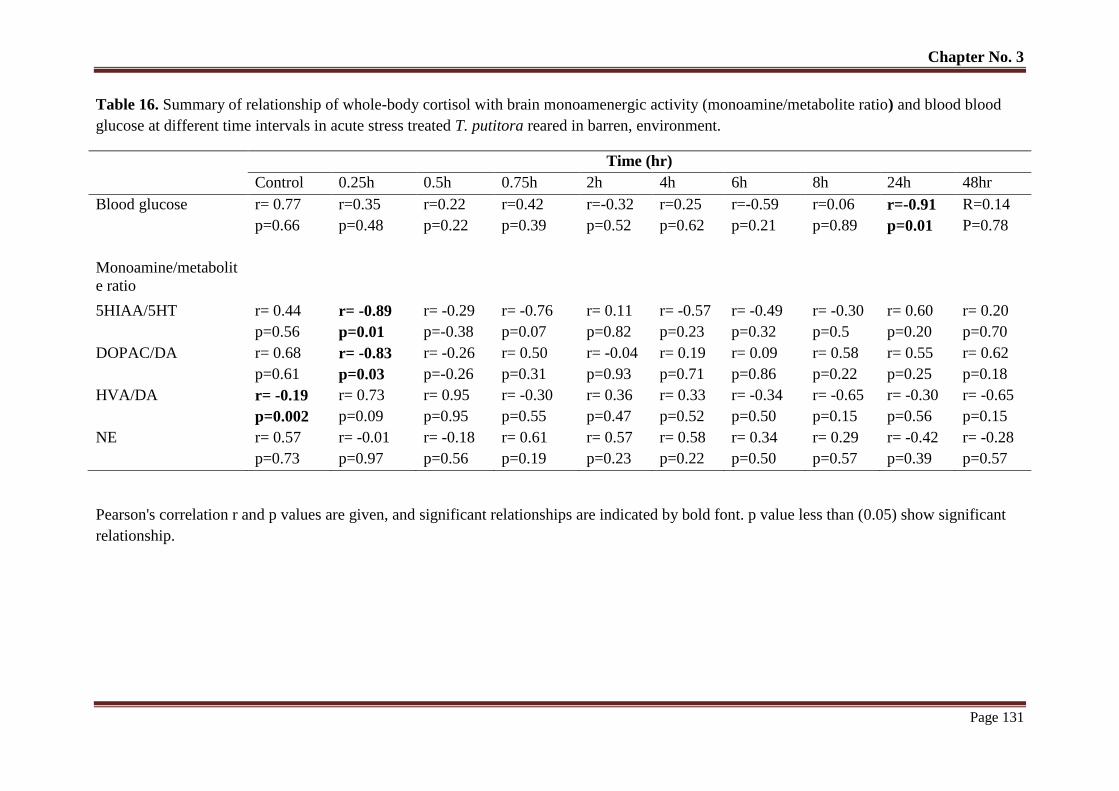
Chapter No. 3
Page 131
Table 16. Summary of relationship of whole-body cortisol with brain monoamenergic activity (monoamine/metabolite ratio) and blood blood
glucose at different time intervals in acute stress treated T. putitora reared in barren, environment.
Time (hr)
Control 0.25h 0.5h 0.75h 2h 4h 6h 8h 24h 48hr
Blood glucose r= 0.77
p=0.66
r=0.35
p=0.48
r=0.22
p=0.22
r=0.42
p=0.39
r=-0.32
p=0.52
r=0.25
p=0.62
r=-0.59
p=0.21
r=0.06
p=0.89
r=-0.91
p=0.01
R=0.14
P=0.78
Monoamine/metabolit
e ratio
5HIAA/5HT r= 0.44
p=0.56
r= -0.89
p=0.01
r= -0.29
p=-0.38
r= -0.76
p=0.07
r= 0.11
p=0.82
r= -0.57
p=0.23
r= -0.49
p=0.32
r= -0.30
p=0.5
r= 0.60
p=0.20
r= 0.20
p=0.70
DOPAC/DA r= 0.68
p=0.61
r= -0.83
p=0.03
r= -0.26
p=-0.26
r= 0.50
p=0.31
r= -0.04
p=0.93
r= 0.19
p=0.71
r= 0.09
p=0.86
r= 0.58
p=0.22
r= 0.55
p=0.25
r= 0.62
p=0.18
HVA/DA r= -0.19
p=0.002
r= 0.73
p=0.09
r= 0.95
p=0.95
r= -0.30
p=0.55
r= 0.36
p=0.47
r= 0.33
p=0.52
r= -0.34
p=0.50
r= -0.65
p=0.15
r= -0.30
p=0.56
r= -0.65
p=0.15
NE r= 0.57
p=0.73
r= -0.01
p=0.97
r= -0.18
p=0.56
r= 0.61
p=0.19
r= 0.57
p=0.23
r= 0.58
p=0.22
r= 0.34
p=0.50
r= 0.29
p=0.57
r= -0.42
p=0.39
r= -0.28
p=0.57
Pearson's correlation r and p values are given, and significant relationships are indicated by bold font. p value less than (0.05) show significant
relationship.

Chapter No. 3
Page 132
Table 17. Summary of relationship of whole-body cortisol with brain monoamenergic activity (monoamine/metabolite ratio) and blood glucose
at different time intervals in acute stress treated T. putitora reared in a physically-enriched environment.
Time (hr)
Control 0.25h 0.5h 0.75h 2h 4h 6h 8h 24h 48hr
Blood glucose r=-0.17
p=0.74
r=-0.29
p=0.57
r=0.82
p=0.04
r=0.70
p=0.11
r=0.54
p=0.26
r=-0.41
p=0.41
r=-0.05
p=0.92
r=0.58
p=0.21
r=0.46
p=0.35
r=0.31
p=0.54
Monoamine/metabolit
e ratio
5HIAA/5HT r=0.45
p=0.36
r=-0.38
p=0.45
r=-0.56
p=0.24
r=0.91
p=0.01
r=-0.80
p=0.05
r=-0.25
p=0.62
r=0.90
p=0.01
r=-0.75
p=0.08
r=-0.54
p=0.26
r=0.17
p=0.74
DOPAC/DA r=-0.11
p=0.83
r=0.54
p=0.25
r=-0.34
p=0.50
r=-0.63
p=0.17
r=0.062
p=0.90
r=-0.36
p=0.48
r=0.37
p=0.46
r=0.37
p=0.46
r=0.57
p=0.23
r=0.11
p=0.83
HVA/DA r=0.60
p=0.20
r=0.40
p=0.42
r=-0.03
p=0.94
r=0.25
p=0.63
r=0.35
p=0.49
r=0.20
p=0.70
r=-0.58
p=0.22
r=-0.29
p=0.56
r=0.64
p=0.16
r=-0.35
p=0.49
NE r= -0.30
p=0.55
r= 0.54
p=0.26
r= 0.14
p=0.78
r= -0.005
p=0.99
r= -0.90
p=0.01
r =-0.24
p=0.64
r= 0.50
p= 0.30
r= -0.01
p=0.97
r= -0.34
p=0.50
r= -0.29
p=0.57
Pearson's correlation r and p values are given, and significant relationships are indicated by bold font. p value less than (0.05) show significant
relationship.
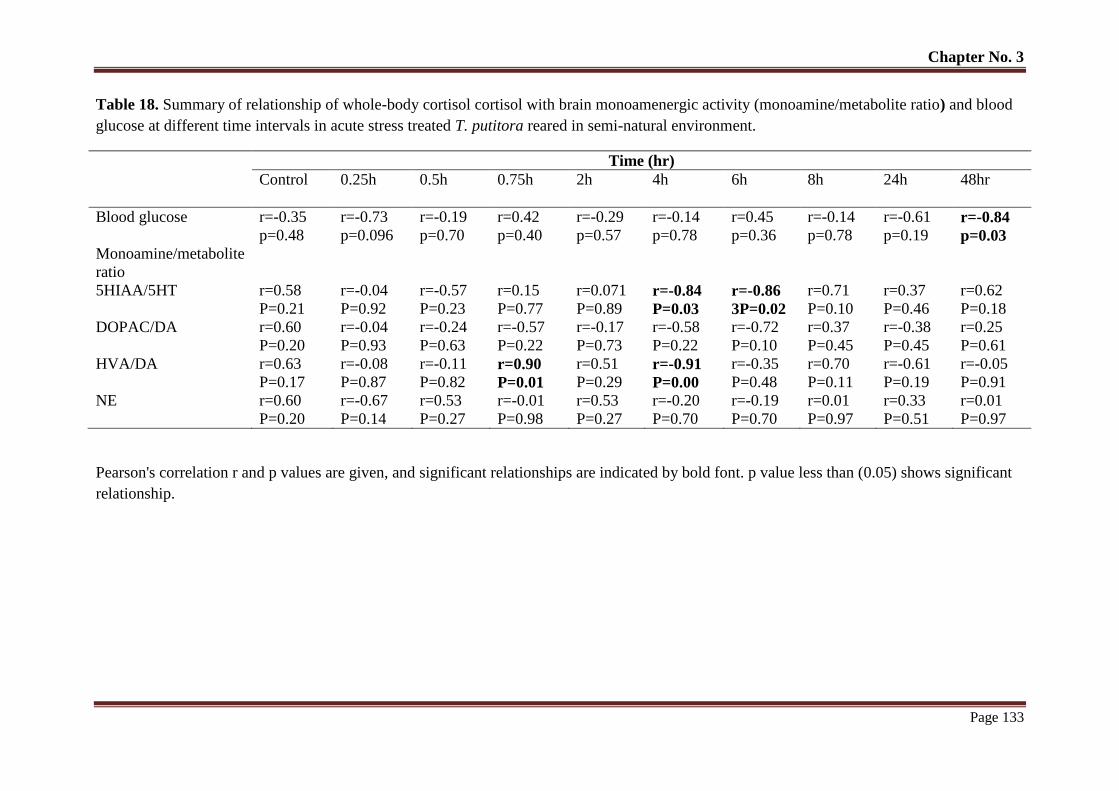
Chapter No. 3
Page 133
Table 18. Summary of relationship of whole-body cortisol cortisol with brain monoamenergic activity (monoamine/metabolite ratio) and blood
glucose at different time intervals in acute stress treated T. putitora reared in semi-natural environment.
Time (hr)
Control 0.25h 0.5h 0.75h 2h 4h 6h 8h 24h 48hr
Blood glucose r=-0.35
p=0.48
r=-0.73
p=0.096
r=-0.19
p=0.70
r=0.42
p=0.40
r=-0.29
p=0.57
r=-0.14
p=0.78
r=0.45
p=0.36
r=-0.14
p=0.78
r=-0.61
p=0.19 r=-0.84
p=0.03 Monoamine/metabolite
ratio
5HIAA/5HT r=0.58
P=0.21
r=-0.04
P=0.92
r=-0.57
P=0.23
r=0.15
P=0.77
r=0.071
P=0.89 r=-0.84
P=0.03
r=-0.86
3P=0.02
r=0.71
P=0.10
r=0.37
P=0.46
r=0.62
P=0.18
DOPAC/DA r=0.60
P=0.20
r=-0.04
P=0.93
r=-0.24
P=0.63
r=-0.57
P=0.22
r=-0.17
P=0.73
r=-0.58
P=0.22
r=-0.72
P=0.10
r=0.37
P=0.45
r=-0.38
P=0.45
r=0.25
P=0.61
HVA/DA r=0.63
P=0.17
r=-0.08
P=0.87
r=-0.11
P=0.82 r=0.90
P=0.01
r=0.51
P=0.29 r=-0.91
P=0.00
r=-0.35
P=0.48
r=0.70
P=0.11
r=-0.61
P=0.19
r=-0.05
P=0.91
NE r=0.60
P=0.20
r=-0.67
P=0.14
r=0.53
P=0.27
r=-0.01
P=0.98
r=0.53
P=0.27
r=-0.20
P=0.70
r=-0.19
P=0.70
r=0.01
P=0.97
r=0.33
P=0.51
r=0.01
P=0.97
Pearson's correlation r and p values are given, and significant relationships are indicated by bold font. p value less than (0.05) shows significant
relationship.
Chapter No. 3
Page 134
4. Discussion
In the current experiments, physical enrichment in the form of stones, PVC pipes and
vegetation showed certain positive effect on HPI axis and brain dopaminergic and
serotonergic systems and clearly differentiate the physically enriched group of fish
from barren and semi-natural groups after exposure to acute stress. Fish from barren
and the semi-natural environment reared groups had somewhat higher levels of all
studied stress parameters (whole body and water borne cortisol, blood glucose and
brain monoamines as compared to physically enriched reared group. These
differences in basal levels may be due to the presence of unpredictable stressors in the
rearing environments of barren and semi natural reared groups (Ladewig, 2000).
However, overall slightly low basal levels of stress hormones in physically enriched
groups could be due to the presence of shelter or hiding place t. It seems that
structural enrichment regulates the external disturbance and lower conspecific
aggression (Batzina et al., 2012, 2014).
Cortisol is extensively used as stress indicator. It shows an elevated level
under acute or chronic stress (Barton and Iwama, 1991; Pickering, 1998; Sumpter,
1997; Wendelaar Bonga, 1997; Barton, 2002; Ramsay et al., 2006; Zuberi et al., 2011,
2014). Here we also used cortisol for the determination of enrichment on the
physiological stress response of mahseer. Although, mostly cortisol is determined by
circulating cortisol concentrations (Barton et al., 2005) but here the fish are small to
collect blood for analysis. To overcome the limitation of insufficient blood, whole
body and waterborne cortisol was determined. Many studies analysed whole body
cortisol and suggested an appropriate indicator of stress (Pottinger et al.,2002;
Ramsay et al., 2006; Zuberi et al., 2014). The significantly low basal whole body
cortisol concentration in the physically enriched reared group of fish (Table 4)
reflects the reduce stress and beneficial impact of rearing enrichment. It appears that
rearing environment is appropriate for mahseer.
For endangered and small fish, measurement of cortisol that is released
through gills in surrounding water is an alternative way of evaluating stress (Scott
and Ellis, 2007; Scott et al., 2008; Zuberi et al., 20011). Although, in present study,
pre-stress whole body cortisol concentration in a physically enriched group showed
Chapter No. 3
Page 135
significant difference with other rearing groups but water- borne cortisol did not
clearly signify this difference. This may be due to sampling procedure or rearing
environment exposure. It is suggested that type of enrichment, exposure duration and
experimental procedure may influence the results (Näslund et al., 2013). Like our
results , in zebrafish (Danio rerio) enrichment either slightly increased concentrations
of cortisol (von Krogh et al., 2010) or did not show any significant effect (Wilkes et
al., 2012).
Like whole body cortisol, the basal levels of blood glucose also clearly
differentiate the physically enriched group from other two rearing groups. The
significantly higher basal level of blood glucose in a barren reared group of fish
reflects the presence of intermittent stressors in the rearing environment. It seems that
in structure less/featureless environment, fish don’t have any place to avoid external
disturbance while low level in the physically enriched group might be related to
reduce stress because of shelter (hiding place). Among monoamines, except NE
basal all others (5HIAA/5HT, DOPAC/DA and HVA /DA ratios) did not show any
significant difference among different rearing groups.
Scanty of literature is available on the impact of rearing environments on brain
monamines in fish. To our knowledge only two studies reported the decrease in
brain monoamines, when crucian carp Carassius carassius (Höglund et al., 2005)
and gilthead seabream Sparus aurata ( Batzina et al., 2014) reared in enriched
environments. It is reported that presence of hiding material in the rearing
environment, reduced the serotonergic activity in the brain stem and optic tectum of
C. carassius (Höglund et al., 2005). Moreover, Blue or Red-Brown substrates in the
rearing environment of gilt-head bream (S. aurata) reduced the 5-
hydroxyindoleacetic acid (5-HIAA) and serotonin levels (Batzina et al. (2014). In
contrast to our study, physical enrichment did not alter the NE level in S. aurata . The
variable results might be related to substantial differences in species and population
(Valdimarsson et al., 2000).
In contrast to basal levels, post stress response over time clearly differentiated
between different rearing groups (Tables 2, 4, 6, 8, 10, 12, 14, Figurs. 1 to 7). The
initial trend of stress response was more rapid in semi-natural pond reared fish
compared with barren and physically-enriched reared advance fry of mahseer.
Chapter No. 3
Page 136
However the recovery rate from acute handling stress was almost similar in semi-
natural pond and physically-enriched tank reared mahseer. In all trials, barren reared
tank mahseer shows more prolong stress response and recovery rate from acute stress
than semi -natura l pond and ph ys ical l y -en r i ched tank reared fish. On
contrary to our results, after acute stress cortisol levels were similar in barren and
physically reared groups of Atlantic salmon, Salmo salar (Näslund et al., 2013),
suggesting that barren environment not blunt the stress response. Our clear difference
in stress response may be due to the protocol used for studying stress response. Here
we study the stress response over time after exposing 5 min chasing and 2 min
confinement as compared to Näslund et al. (2013) where cortisol was measured at
specific time, i.e. after 30 min confinement. Both whole body and water borne
cortisol showed significant difference in magnitude at peak levels among different
rearing groups, low in physically enriched reared group in comparison to other
groups. Moreover, the same group showed rapid recovery from stress. The stress
response latencies are related to lifestyle differences (Vijayan and Moon, 1994;
Wright et al., 2007). Here it appears that physically enrichment i.e shelters reduced
the metabolic demand in mahseer which may be due to reduce stress.
In addition to cortisol, blood glucose also increased after acute stress in all
rearing groups and indicate the activation of HPI axis. Blood glucose also showed
significant differences in magnitude in all rearing groups over time. Barren rearing
showed an increase blood glucose level compare to other groups indicated the
increase demand of energy (Begg and Pankhurst, 2004). Although, in the present
study, post stress elevation of brain serotonergic activity (5HIAA/5HT ratio),
dopaminergic activity (DOPAC/DA and HVA /DA ratios) and Norepinephrine (NE)
levels and significant difference in the magnitude of these parameters were observed
among rearing groups but no study is available to compare our results. The available
study only reported the effect of enrichment on the basal level of brain monoamines S.
auratus, (Batzina et al., 2014) C. carassius (Höglund et al., 2005).
The role 5-HT in the regulation of HPI axis has been suggested previously
(Winberg et al., 1997) in rainbow trout (Oncorhynchus mykiss). The positive
correlation between whole body cortisol and brain monamines in the present study
suggest the role of monoamines in regulation of stress responses. It seems that the
Chapter No. 3
Page 137
5HT integrated stress response in response to a stressor (Øverli et al., 2005; Winberg
et al., 1992). In the present study, increase levels of monoamines (DOPAC/DA and
HVA /DA ratios and NE levels in response to acute stress and their positive relation
with cortisol (Fig 4 to 7) indicated the influence of monoamines in the regulation of
HPI axis and suggested that these parameters could be used while considering the
welfare of fish. These parameters are very well studied in mammals (Herman and
Cullinan, 1997; Torres et al., 2002) and need to be studied in depth in fish for
understanding the lying mechanism of physiological stress response and behaviour of
fish.
It has been reported that rearing of crucian carp C. carassius in aquaria with
substrate as a hiding material, led to reduced serotonergic activity in the brain stem
and optic tectum (Höglund et al., 2005). It has been also observed that mice and rats
reared in an enriched environment, had reduced brain serotonin system activation (i.e.
Reduced 5-HT, 5-HIAA and/or 5-HIAA/5-HT) as well as reduced DA levels in
specific brain areas (Brenes et al., 2008; McQuaid et al., 2012). Batzina et al. (2014)
reported that fish reared in blue or red-brown substrate has comparatively low
serotonergic activity and DA levels compared to fish reared in green substrate and or
reared without substrate. It has been previously reported that lack of hiding material
led to an elevation of 5-HT activity in the brain stem and the optic tectum compared
to fish with available hiding material when exposed to predator skin extract (Höglund
et al., 2005). These data are in line with present brain neurotransmitters results for fish
reared physically-enriched and semi-natural pond environment.
5. Conclusions
In conclusion, our main results suggest that manipulation of rearing
environment (physical enrichment) in the form presented here can reduce basal stress
levels as indicated by whole-body cortisol, water-born cortisol, blood glucose and
provide hatchery-reared mahseer with a more advantageous stress coping strategies.
Furthermore, fish reared in physically-enriched environment displayed lower post-
stress brain 5-HIAA/5-HT and DOPAC/DA ratios and central NE than barren and
semi-natural environment reared mahseer. These results have important implications
for a possible way of improving the welfare of mahseer by improving rearing
Chapter No. 3
Page 138
environment, i.e. to provide substrate or hiding place in rearing tanks. It will help to
fulfil the physiological demand of fish and reduce their stress level. Overall provide
information, how mahseer stress sensitivity can be modified by environmental
enrichment and prepare fish to cope stressful wild environment.
Chapter No. 4
Page 139
CHAPTER # 4
Effects of Enrichment on the Life Skills Development of Endangered Fish
Mahseer (Tor putitora).
Chapter No. 4
Page 140
ABSTRACT
Structural enrichment in the rearing environment, not only promotes fish welfare, but
also affect several aspects of behavioural biology of fish in aquaculture. Here an
attempt was made to use physical-enrichment to improve the behaviour of hatchery-
reared fish.In this study, three groups of 15 days old mahseer (Tor putitora)
hatchlings were reared up to advanced fry stage in barren (without any substrate),
physically-enriched (gravel bed, substrate and plants) and semi-natural environments
(earthen pond having a natural feed) respectively and the behavioural profiles of fish
from these environments were compared. We illustrate that increased structural
complexity during early life significantly affect various behavioural characteristics of
the fish. Exploratory behaviour, predation and anti-predatory response was
significantly (p ˂ 0.05) higher in fish reared in physical enrichment and semi-natural
environment than in barren-reared fish. These results have important implications for
a possible way of improving the outcomes of restocking program of endangered fish
species by modifying conventional hatchery-rearing environment
Chapter No. 4
Page 141
1. Introduction
Conventional hatchery rearing environments are lacking natural key stimuli
important for the development of natural behaviour. This can severely affect the
natural foraging, predatory and anti-predatory behaviour of animals, and become
detrimental in wild environment where the animal is highly motivated to carry out
particular behaviours (Reinhardt, 2004; Dawkins, 2006). Generally, fish are reared
and grow in earthen, semi earthen and concrete ponds in static, featureless, predator
free environments at high densities on prepared feed, which prevents them from
learning how to behave in their wild environment. The hatchery rearing environment
provide no structure or shelter, which in the wild is important as defence against
predators and it has been shown that adding shelter to the rearing environment can
decrease metabolic demands and stress levels (Millidine et al., 2006; Näslund et al.,
2013). Also, fish in a hatchery environment have high growth rate, which has recently
been connected to shorter memory duration (Brown et al., 2011). On the other hand,
wild fish live in more diverse environments and learn by experience how to capture
and handle various live preys (Sundström and Johnsson, 2001).
Several actions have been proposed as solutions to ease the foraging, predator
avoidance and reproductive behavioural deficiencies in hatchery reared fish, e.g., life-
skills training, social learning protocols, and acclimatization before release, and
environmental modification (Brown and Day, 2002). Generally, to improve the
animal welfare, environmental enrichment is mainly used in the zoo and laboratory
animals, as compare to domesticated animals (Young, 2003). However, recent
investigations on many fish species suggest that enrichment of rearing environment
can promote behavioural adaptability (Braithwaite and Salvanes, 2005) and foraging
abilities (Brown et al., 2003; Strand et al., 2010; Rodewald et al., 2011) and more
complex rearing environments promote the development of fish brains (Näslund et al.,
2012), cognition (Brown et al., 2003; Strand et al., 2010), boldness (Roberts et al.,
2011) and survival in the wild environment after restocking (Maynard et al., 1996).
Additionally, enrichment also influence social interaction (Salvanes and Braithwaite,
2005) and reduce anxiety (Maximino et al., 2010). Studies on rodent have revealed
that behavioural and neural plasticity and the development of cognitive abilities are
Chapter No. 4
Page 142
influenced positively by increasing the structural complexity of the rearing conditions
(van Praag et al., 2000).
Worldwide, restocking programs has been commonly used in attempts to
minimize the effects of over-fishing, environmental degradation and conservational
failure (Salvanes, 2001; Myers et al., 2004). Survival rates in many restocking
programs are low for newly released hatchery reared fish (Tsukamoto et al., 1997).
For successful restocking program, fish rearing conditions should be modified to
make fish as adaptive as possible to minimize mortality rates upon release into the
wild environment (Brännäs and Johnsson, 2008). Physical and social enrichment in
the rearing environment strongly enhances the ability of fish to adopt important life
skills such as exploratory behaviour, ability to feed on natural prey, and the ability to
avoid predators (Braithwaite and Salvanes, 2008). Increased environmental
complexity has been proven to promote behavioural and neuronal plasticity and
learning in fish. These adaptations will further increase the survival of fish after
release into the wild for restocking purposes (Spence et al., 2011; D’Anna et al.,
2012).
Mahseer is a world famous, high market valued game and food fish of South
Asian countries, including Pakistan, distributed in most of the trans-Himalayan
region, ranging from Afghanistan to Myanmar (Desai, 2003; Singh et al., 2009). It
inhabits the river, lakes and reservoirs and prefers high-oxygenated, clear water with
rocky bed habitat. It is sensitive to low temperature, thus congregates by hundred
during winter (Desai, 2003). Mahseer is a local migrant, shows short distance
migration for feeding and breeding purposes. Generally breed during floods and
spawn over rocky, gravel substrates (Mohan, 2000; Nautiyal et al., 2007). It is a
marginal bottom feeder and shows variation in dietary habit, as to increase in size. Fry
are carni-omnivorous, feed on diatoms filamentous algae and insects, juvenile are
insectivorous, while adult feed on filamentous algae, aquatic macrophyte and benthic
animals (Dinesh et al., 2010).
More recently, there has been an increase in anthropogenic threats to the
natural populations of mahseer, which can affect their survivability (Hussain and
Hossain, 1999). Depletion of natural populations of mahseer has been reported from
Chapter No. 4
Page 143
various parts of the world, including, Pakistan (Mirza et al., 1994), India (Nath et al.,
1994), Papua New Guinea (Coates, 1991), Nepal (Shrestha, 2002), Turkey (Balik,
1995) and Bangladesh (Hussain and Mazid, 2001). Mahseer is now identified as an
endangered species (IUCN, 2016). Scientists have suggested that special
consideration is required to protect this fish species from future elimination and
extinction (Hussain and Mazid, 2001; Islam, 2002; Rahman et al., 2005).
The early rearing environment of fish can be constructed to provide living
conditions that favour the development of more adaptive foraging, exploratory, anti-
predatory etc. behaviours. We therefore hypothesized that providing hatchery reared
mahseer with an enriched environment could promote specific behaviours (e.g. anti-
predatory, exploratory, foraging behaviour etc.), essential to cope with life threatening
challenges (searching and competition of food, predation risk etc.). To test this
hypothesis, we devised three different rearing environments that contrasted in their
levels of complexity and heterogeneity. Mahseer hatchlings were reared up to
advanced fry stage in these three different rearing environments and the behavioural
profiles of fish from these environments were compared.
Chapter No. 4
Page 144
2. Material and methods
2.1. Experimental Animals
Tor putitora 15 days, hatchlings (10-15mm; after semi-quiescent stage), about
25000 in number, were collected from a breeding tank (barren concrete circular tank)
of Fish Hatchery Hattian Attock, Pakistan, and transported in oxygen filled plastic
bags (36cm length × 24cm width; 10 L water) to the Fisheries and Aquaculture
Research Station, Department of Animal Sciences, Faculty of Biological Sciences,
Quaid-I-Azam University Islamabad, Pakistan.
2.3. Manipulation of rearing environment
To investigate the effect of early rearing environment on exploratory,
predatory and anti-predatory behaviours, the hatchlings of (Tor putitora) were housed
in three different rearing environments, 1) Barren: Rectangular fibreglass tanks
(120cm length × 60cm width × 60cm height) without any substrate (Clear bed),
while plain contained only an aerator. 2) Physically enriched: Similar size fibreglass
rectangular tanks (120cm length × 60cm width × 60cm height) with 1cm thick 1.0 to
1.5 cm diameter gravel bed, 4 plastic plants having 12 cm height, 2PVC pipes (10 cm
length; 4 cm diameter and 5cm length; 4 cm diameter and aerator = 3) Semi-natural
:250 m2
earthen pond (20m × 12.5m) with concrete walls, having natural food
organisms (phytoplankton, zooplankton, diatoms, some protozoa etc.) but without
common aquatic weeds or other substrate. Before stocking, the ponds were limed
(calcite lime; CaCO3; 49.42 kg/100 m2, fertilized with organic (Animal manure; cow
dung 8 kg/100 m2/week) and inorganic (Nitrogen fertilizers; 0.5kg/100 m
2/week;
phosphate fertilizers; 0.25 kg/100 m2/week) fertilizer, thus to provide a sufficient
amount of natural food organisms (A conventional technique in Pakistan for the
rearing of mahseer). Replicate of three for barren and physically enriched and two for
semi-natural environments were maintained and hatchlings were stocked at the rate of
200 hatchlings per tank and about 10,000 hatchlings per semi-natural pond. Initially,
low water level (about 0.6 m in each earthen pond and 200L in fibreglass tanks
maintained, but after two months raised to 1 m and 350 L respectively. All
Chapter No. 4
Page 145
experimental groups were supplied with water from a nearby freshwater stream
(Rumli freshwater stream). Hatchlings in barren and physically enriched groups were
initially fed commercially available prepared powder feed (Oryza organics fish feed,
powder; 55% crude protein, 12% fats, crude fiber 2% and 10% moisture) after every
second hour, then gradually changed from powder feed (first two months) to
crumbled (after two months) and then sinking pellets (last one month) (Oryza
organics fish feed, size 2mm; 45% crude protein, 14% fats, 2% crude fiber and 10%
moisture), at the rate of 4% body weight twice per day. In the ponds sufficient natural
food organisms were maintained with the aid of fertilizer. Additionally, some
prepared feed was also provided daily. Pond fertility was checked every fortnight with
Sacchi disk and accordingly steps were taken (Almazan and Boyd, 1978). The fish
was reared under these conditions for 4 months (March, 2015 to June, 2015). During
rearing optimum oxygen levels in all tanks were maintained by using aerators, pH and
temperature were noted daily. Moreover, to avoid strong response towards the
handling and netting stress, all fish were inspected daily during the experimental time
period. After completion of the rearing period, fish from each experimental group
were randomly subjected to behavioural tests.
2.4. Behavioural Study
Before the behavioural tests, fish from each experimental group were
randomly selected and housed separately (no. of fry 150; stocking density 1.0 g/L) in
500 L fibreglass holding tanks (three tanks per group). The enriched-reared fish had
gravel bed and plastic plants while pond reared fish had pond water in their holding
tanks. However, the Barren-reared fish had a bare tank covered in black plastic sheets
to mimic the environmental condition in which they had been reared previously. All
the groups were fed prepared sinking pellets and provided with 12 hour day/night
regime. Each group was held in their new environment for three days before any
further studies. All behavioural tests were completed within three days by a group of
3 people and at the end of every day water level of each tank was lowered down to
maintain the stocking density

Chapter No. 4
Page 146
2.5. Boldness Assessment:
Boldness is the propensity of fish to take a risk. It influences the survival,
reproduction, and finally the fitness of the animals. Several techniques are, in practice,
to measure the boldness in fish like exploratory behaviour and anti-predator behaviour
tests (Wilson and Godin, 2009), time taken to emerge into novel environment and
propensity of fish to inspect a novel object (Brown et al., 2007).Some researchers
conducted boldness tests in familiar environments (Re’ale et al., 2007), while others
using novel object and environment for studying anti-predatory and exploratory
behaviour (Wilson and Godin, 2009). Here we used latency to leave the shelter, and
exploratory behaviours, to assess the effect of rearing environment on boldness.
2.6. Latency to leave shelter
One way of assessing the boldness is to measure the time taken by fish to
leave the shelter (Brown et al., 2007). The boldness assay we used was the same as
reported by Brown et al. (2005), where a single fish was kept in a darkened, enclosed
start box already located in a novel test aquaria. Briefly, during an experiment, the fry
was transferred via hand netting (6cm × 6cm) to the start box (12cm length × 12cm
width × 24cm height) from fibreglass holding tanks. An individual fish was lifted
from the water and held in the hand net for 30 seconds, to follow a typical handling
time for such trial, and placed into the start box and left for 2 min to settle the fish (a
standard time period for such trial). After that period, a door of the start box (12cm
width × 24cm height) in the centre of one wall was opened using a fine monofilament
and the time noted within which the fry emerged fully from the start box. Fry that
emerged earlier from the start box were considered to be bolder. In each trial,
approximately twenty repeats for each experimental group was performed one by one
with a new fish. If the fish had not left and remain in the start box for 15 min, the test
was ended.
2.7. Exploratory behaviour
Exploratory behaviour, i.e. the readiness toapproach a novel shelter was
studied by following the method adopted by Ahlbeck and Holliland (2012) for
Chapter No. 4
Page 147
research on pikeperch (Sander lucioperca) behaviour. Three sides of the test aquaria
(36cm length × 24cm width × 24cm height) were covered with black plastic sheets,
leaving the long end facing the observers uncovered. The bottom of the aquaria was
covered with a 1cm gravel bed. The aquarium was divided into three “habitats”. On
the left-hand side of the test aquaria, plastic plants occupied one quarter of the area of
the test aquaria; on the right-hand side of the aquarium a white, non-transparent
plastic “start box” (12cm length × 12cm width × 24cm height) occupied one quarter
of the aquarium bottom, and the area between the start box and the artificial plastic
plants, were kept open. One fish from each group was placed in the start box and
allowed to familiarize the environment for 10 min. After this duration, the observer
used a thin rope to slowly open the lid of the box from behind the screen. The lid of
the start box was remained open until the end of the trial to measure the time spent by
fish in the box area, once leave the box and then come back in the box area. The time
taken by the fish from opening to leaving the box was recorded. If the fish had not left
and remain in the start box for 30 min, the test was ended. If the fish had left the box,
its position in the aquarium was recorded after every 30 sec for 10 min. In each trial,
approximately twenty repeats for each experimental group was performed one by one
with a new fish.
2.8. Predation (Feeding on live prey)
It is a general observation that mahseer feed in a group (schooling) instead of
alone (FAO, 2003). For observing the predatory behaviour of advanced fry, reared in
three different environments, five fry at a time originating from the same group was
housed in a test aquaria (36cm length × 24cm width × 24cm height), provided with
earthworm (novel feed for the enriched and barren environment reared fry while there
is a maximum chance that fry from the pond environment previously exposed to the
earthworms) at a density of 2 earthworm per litre. Three sides of aquaria were
covered with black plastic sheets, leaving the long end facing the observers
uncovered. The base of the aquarium was covered with a 1 cm gravel bed with a
plastic plant (12cm h) filling one quarter of the tank. To enhance feeding motivation
and providing almost similar hunger time, fish of each group in different tanks were
fasted at two hrs difference for 24 hours before shifting to the test aquarium. The time
taken in min to the first attack on prey was recorded for each fry in the group. Ten
Chapter No. 4
Page 148
trials per rearing group (three trials at a time) were run with five new fry in each trial.
The trial ended when all fish attacked prey at least once, or after 120 min. The feeding
behaviour of fry (Table 1) was observed by two observers that had two or three focal
individuals to monitor the experimental trial to ensure correct assessment of time to
first caught prey as previously described by Ahlbeck and Holliland (2012).
Table 1. Behaviour during feeding on live prey (earthworm).
Behaviour Description
Inspection of prey Swim toward and observe prey
Picking of prey Pick up the prey and suddenly leave them and rapidly
move away from prey
Feeding on prey Start eating
2.9 Anti-predator response
In nature, living with predators is an unavoidable aspect of life for almost all
fish. Therefore, to gather information through inspection about the current risk and
fine-tune their anti-predator responses to variations in predation risk is a prerequisite
for the survival of fish. Predator inspection is a natural response that fish are strongly
motivated to perform. Here, the anti-predatory behaviour of the fry reared in different
environments was observed using two equal size glass aquaria (36cm length × 24cm
width × 24cm height) placed next to each other separated by a removable card divider
to prevent visibility between the aquaria. One aquarium contained a live, fresh water
Spiny eel (Mastacembelis armatus) at least ten times the size of the advanced fry of
mahseer that was placed in the other aquarium. The two short ends of the test
aquarium containing the eel were covered with black plastic sheets, with the long ends
facing the observers uncovered. Three sides of the aquarium containing the mahseer
were covered, with the long side facing the eel aquarium uncovered. The bottom of
the tank was covered with a 1 cm gravel bed. In the left- hand-side corner of the
aquarium, a plastic plant offered a possible refuge as it occupied approximately one
third of the aquarium. The eel was allowed to acclimatize in the testaquarium10 min
before the tests started while mahseer was allowed to acclimatize for 30 min to avoid
unusual behaviour due to handling. After 10 min, the divider was carefully removed,
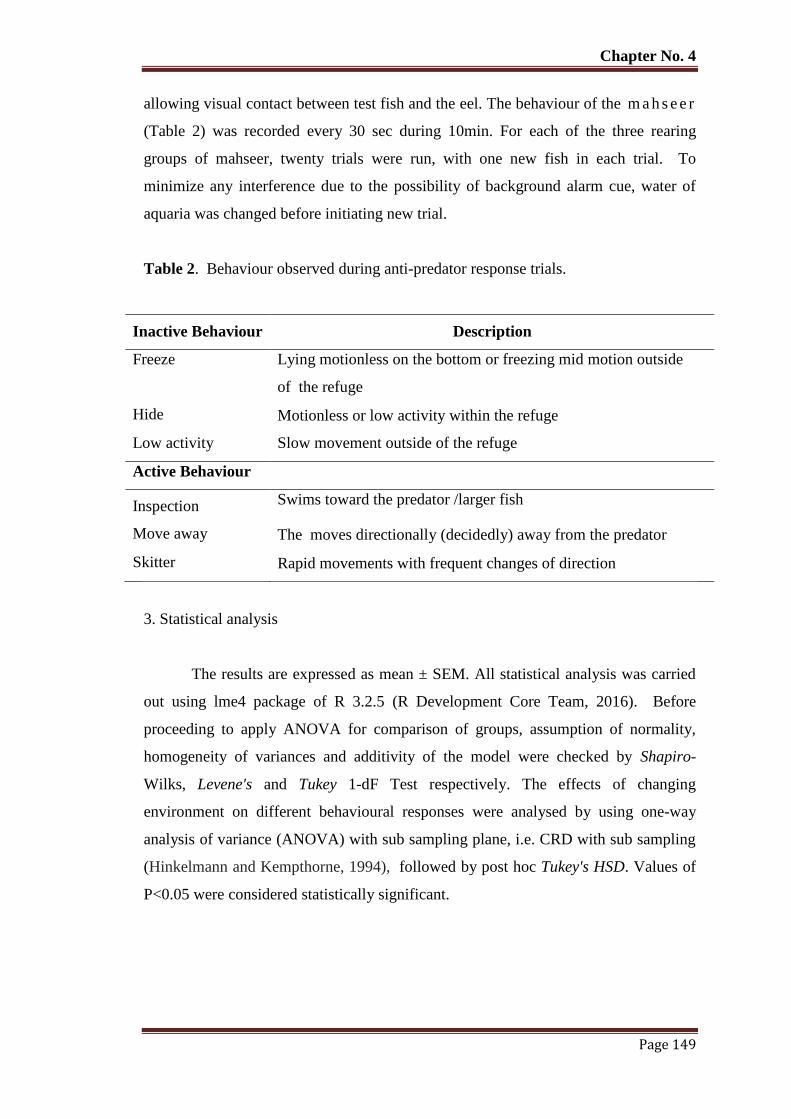
Chapter No. 4
Page 149
allowing visual contact between test fish and the eel. The behaviour of the m a h s e e r
(Table 2) was recorded every 30 sec during 10min. For each of the three rearing
groups of mahseer, twenty trials were run, with one new fish in each trial. To
minimize any interference due to the possibility of background alarm cue, water of
aquaria was changed before initiating new trial.
Table 2. Behaviour observed during anti-predator response trials.
Inactive Behaviour Description
Freeze Lying motionless on the bottom or freezing mid motion outside
of the refuge
Hide Motionless or low activity within the refuge
Low activity Slow movement outside of the refuge
Active Behaviour
Inspection Swims toward the predator /larger fish
Move away The moves directionally (decidedly) away from the predator
Skitter Rapid movements with frequent changes of direction
3. Statistical analysis
The results are expressed as mean ± SEM. All statistical analysis was carried
out using lme4 package of R 3.2.5 (R Development Core Team, 2016). Before
proceeding to apply ANOVA for comparison of groups, assumption of normality,
homogeneity of variances and additivity of the model were checked by Shapiro-
Wilks, Levene's and Tukey 1-dF Test respectively. The effects of changing
environment on different behavioural responses were analysed by using one-way
analysis of variance (ANOVA) with sub sampling plane, i.e. CRD with sub sampling
(Hinkelmann and Kempthorne, 1994), followed by post hoc Tukey's HSD. Values of
P<0.05 were considered statistically significant.

Chapter No. 4
Page 150
4. Results
4.1 Boldness Assessment
4.1.1 Latency to leave shelter
Boldness assessment or time taken by fish to leave the shelter (start box) was
significantly different among the mahseer fry previously reared in indoor barren,
enriched tanks and outdoor semi natural earthen ponds (n = 20, mean ± SE: 6.2 ± 1.78
min,2.2 ± 0.79 min and 3.9 ± 0.86 min, respectively; one way ANOVA: F2,171 =
30.85,p < 0.001; Fig. 1). Fish reared in a physical enriched environment emerged out
from the start box significantly (p < 0.001) sooner than fish reared in the barren tank
(n = 20, mean ± SE: 6.2 ± 1.78, 2.2 ± 0.793, Tukey’s post hoc:p < 0.001). However,
non-significant difference was observed between the fish reared in physical enriched
tanks and the outdoor pond environment (n = 20, mean ± SE: 2.2 ± 0.79, 3.9 ± 0.86
respectively; Tukey’s post hoc: p= 0.28), while clear difference (Tukey’s post hoc: p
< 0.001) was observed among barren and semi-natural pond reared fish in time taken
to emerge from the box.
4.1.2 Exploratory behaviour
In exploratory behaviour tests, there was a significant difference in the
percentage of time spent by fry of different rearing groups in box area after 10 min
settling time (time to familiarize the start box environment) (n = 20, mean ± SEM:
60.33 ± 6.34, 16.6 ± 4.21, 33.3 ± 4.42, One way ANOVA: F2, 171 = 86.73, p<0.001;
Fig. 2). After leaving the start box, fry from different rearing environments showed
significant variation in the time spent in open (n = 20, mean ± SEM: F2, 171 = 111.39,
p < 0.001; Fig. 2), and vegetation area (n = 20, mean ± SEM, One way ANOVA:
F2,171 = 103.19, p<0.001; Fig. 2). Barren environment reared fry spent more time in
open area compared to fry reared in in physical enrichment (n = 20, mean ± SEM
23.01 ± 5.02, and 12.6 ± 3.34 Tukey’s post hoc: p < 0.001; Fig.2), while, no
considerable difference was observed with semi-natural pond reared fry (Tukey’s
post hoc: p = 0.9; Fig. 2). Fry reared in a barren environment spent less time in
vegetation than fry reared in physically enriched and conventional semi-natural pond
Chapter No. 4
Page 151
environments (n = 20, mean ± SEM 16.66 ± 2.55, 70.6 ± 4.41, 43.3 ± 5.31, Tukey’s
post hoc: p<0.001; Fig. 2). The frequency of habitat shifts also differed among
different rearing groups (n = 20, mean ± SEM; 8.11 ± 1.33, 4.3 ± 0.333, 6.33 ± 0.33,
One way ANOVA: F2, 171 = 21.14 p < 0.001; Fig. 2). Fry reared in a physically
enriched environment showed more exploratory behaviour than barren reared fish
(Tukey’s post hoc: p < 0.001; Fig.2). However, no significant difference in habitat
shift was observed between fry previously reared in physical enriched and semi
natural environment (Tukey’s post hoc: p = 0.2; Fig. 3).
4.2 Feeding on live prey
Ten trials (5 fish each) each were used from barren, physically enriched tank
and semi-natural pond in the feeding on live prey test. A significant difference was
observed during live prey inspection (swim toward and observed live prey) among
different rearing groups n=10, mean ± SEM: 37.5 ± 6.12, 18.75 ± 3.22 a n d 21.04 ±
5.25 min one way ANOVA:
F2,85 = 42.51, p<0.001; Fig.4). However, non-significant difference was
observed between fish reared in physical enrichment and conventional semi natural
environments. (18.75 ± 3.22 min, and 21.04 ± 5.25 min, respectively, Tukey’s post
hoc: p = 0.80). The minimum time for live prey inspection was observed for fish
reared in physical enrichment (18.76 ± 3.22 min). Moreover, a significant difference
was observed in latency to pick live prey between fish reared in barren and
physically enriched environment (21.45 ± 2.39 and 63.54 ± 3.22 min, Tukey’s post
hoc: p<0.001; Fig. 4), while fish reared in the indoor physically enriched tank and
the outdoor pond environment did not show any significant difference (Tukey’s post
hoc: p < 0.06; Fig. 4). Moreover, significant differences among groups were also
observed in time taken by fry to start feeding on live prey. (n = 10, mean ± SEM;
83.54 ± 5.25 min, 2 5 ± 10.76 min and 37.70 ± 5.41 min, respectively; one way
ANOVA: F2,85 = 97.02, p < 0.001; Fig. 4) .
4.3 Anti-predatory response
There was a significant difference in freeze behaviour between the barren,
Chapter No. 4
Page 152
physical enrichment and semi-natural pond reared fry (n = 20, mean ± SEM; 31.66±
3.33 min, 1 0 ± 2.89 min and 10 ± 2.61 min, respectively; one way ANOVA: F2,171 =
195.20, p<0.001; Fig. 5). However, no considerable difference between physical
enrichment and semi-natural pond reared fry was observed (Tukey’s post hoc: p =
0.96). Hide and Low activity behaviour was also significantly different among the
three rearing groups (n = 20, mean ± SEM: 28.33± 3.33 min, 5 ± 0.89 min and 10 ±
1.41 min, respectively, one way ANOVA: F2,171 = 128, p < 0.001: n = 20, mean ±
SEM; 15 ± 2.89 min, 8 . 3 3 ±1.66 min and 11 ± 1.66 min, respectively, one way
ANOVA: F2,171 = 12.8, p < 0.001; Fig. 5). However, no difference was observed in
hide and low activity behaviour between physical enrichment and semi-natural ponds
reared fry (Tukey’s post hoc: p = 0.06 and p = 0.32; Fig. 5). Moreover, active
behaviour of all the rearing groups showed considerable variation (Inspection: n = 20,
mean ± SEM: 6.66 ± 1.66 min, 1 8 . 3 3 ± 2.49 min and 15 ± 1.66 min, respectively,
one way ANOVA: F2,171 = 37.19, p<0.001: Move away, n = 20, mean ± SEM; 8.33 ±
2.11 min, 3 1 . 6 6 ± 4.41 min and 25 ± 3.33 min, respectively, one way ANOVA:
F2,171 = 74.00, p < 0.001: Skitter, n = 20, mean ± SEM; 10.55 ± 1.01min, 2 6 . 6 6 ±
1.5 min and 28.22 ± 3.33 min, respectively, one way ANOVA: F2,171 = 50.78,
p<0.001; Fig. 5), but fry reared in physical enrichment and conventional semi-natural
pond showed almost similar inspection and move away behaviour (Tukey’s post hoc: p
= 0.86 and p = 0.99, respectively; Fig. 5).
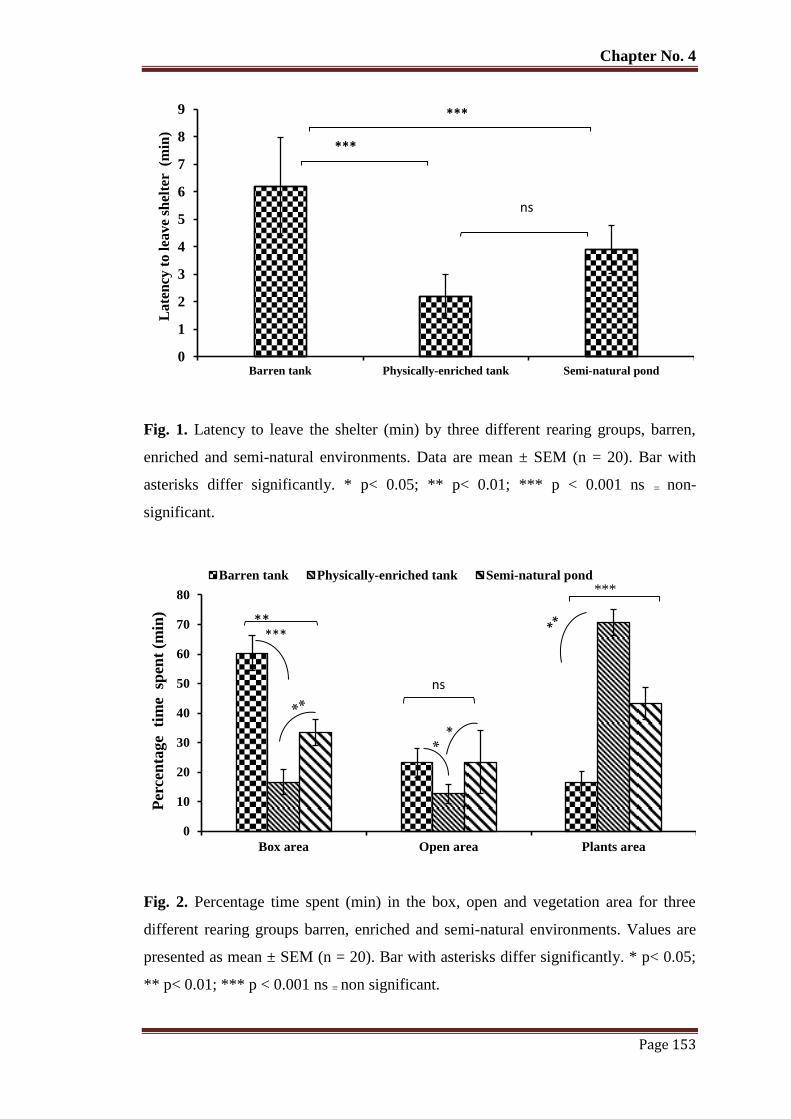
Chapter No. 4
Page 153
Fig. 1. Latency to leave the shelter (min) by three different rearing groups, barren,
enriched and semi-natural environments. Data are mean ± SEM (n = 20). Bar with
asterisks differ significantly. * p< 0.05; ** p< 0.01; *** p < 0.001 ns = non-
significant.
Fig. 2. Percentage time spent (min) in the box, open and vegetation area for three
different rearing groups barren, enriched and semi-natural environments. Values are
presented as mean ± SEM (n = 20). Bar with asterisks differ significantly. * p< 0.05;
** p< 0.01; *** p < 0.001 ns = non significant.
0
1
2
3
4
5
6
7
8
9
Barren tank Physically-enriched tank Semi-natural pond
La
ten
cy t
o l
eav
e sh
elte
r (
min
) ***
ns
***
0
10
20
30
40
50
60
70
80
Box area Open area Plants area
Per
cen
tage
tim
e s
pen
t (m
in)
Barren tank Physically-enriched tank Semi-natural pond
*** **
ns
***
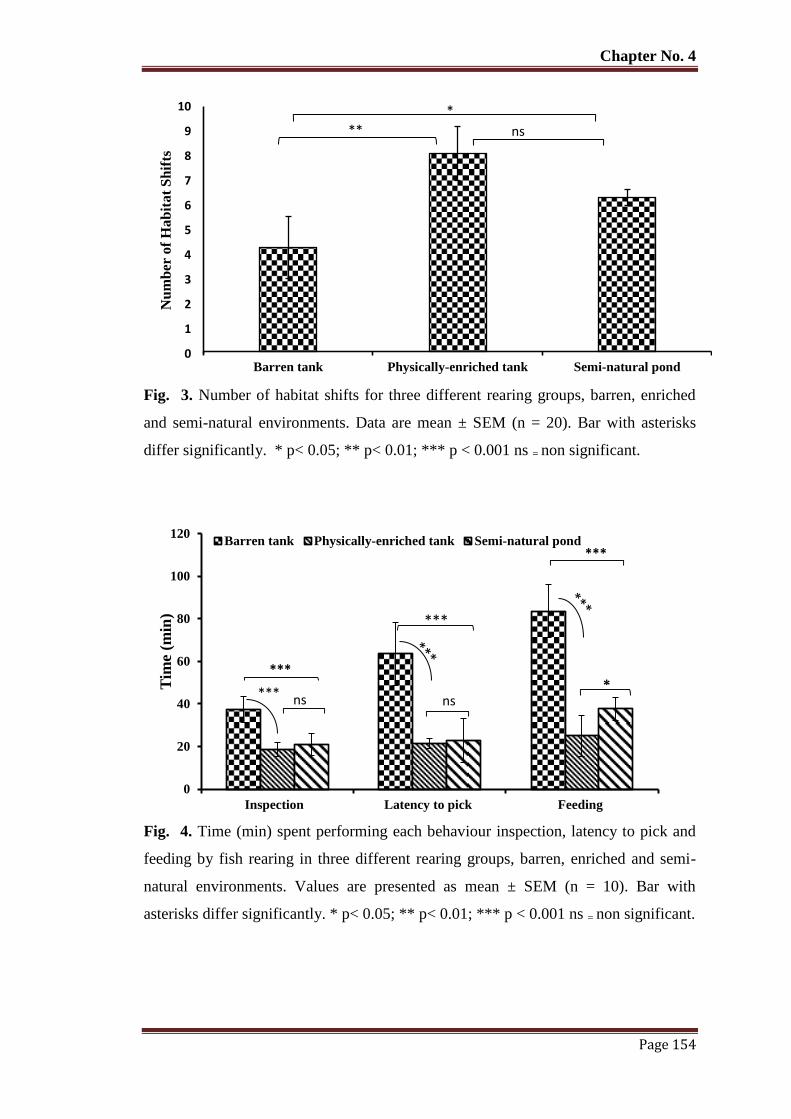
Chapter No. 4
Page 154
Fig. 3. Number of habitat shifts for three different rearing groups, barren, enriched
and semi-natural environments. Data are mean ± SEM (n = 20). Bar with asterisks
differ significantly. * p< 0.05; ** p< 0.01; *** p < 0.001 ns = non significant.
Fig. 4. Time (min) spent performing each behaviour inspection, latency to pick and
feeding by fish rearing in three different rearing groups, barren, enriched and semi-
natural environments. Values are presented as mean ± SEM (n = 10). Bar with
asterisks differ significantly. * p< 0.05; ** p< 0.01; *** p < 0.001 ns = non significant.
0
1
2
3
4
5
6
7
8
9
10
Barren tank Physically-enriched tank Semi-natural pond
Nu
mb
er o
f H
ab
ita
t S
hif
ts
** ns
*
0
20
40
60
80
100
120
Inspection Latency to pick Feeding
Tim
e (m
in)
Barren tank Physically-enriched tank Semi-natural pond
***
*** ns
***
ns *
***
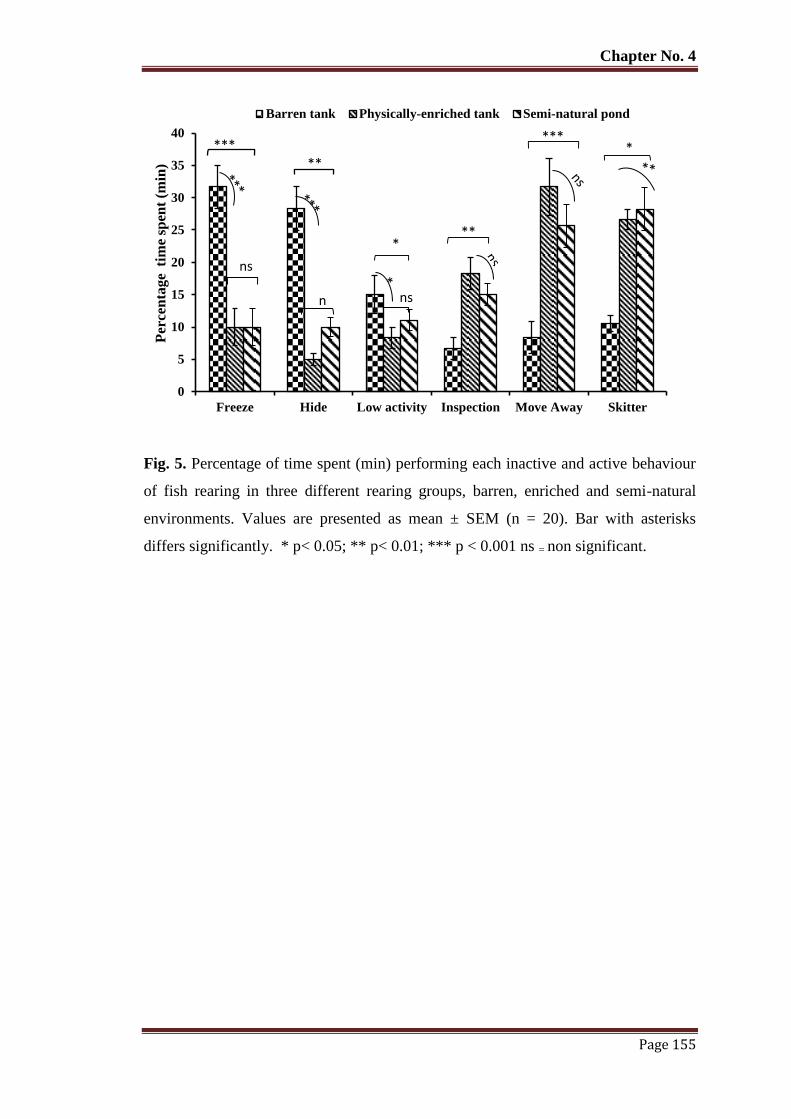
Chapter No. 4
Page 155
Fig. 5. Percentage of time spent (min) performing each inactive and active behaviour
of fish rearing in three different rearing groups, barren, enriched and semi-natural
environments. Values are presented as mean ± SEM (n = 20). Bar with asterisks
differs significantly. * p< 0.05; ** p< 0.01; *** p < 0.001 ns = non significant.
0
5
10
15
20
25
30
35
40
Freeze Hide Low activity Inspection Move Away Skitter
Per
cen
tag
e ti
me
spen
t (m
in)
Barren tank Physically-enriched tank Semi-natural pond
***
ns
**
n
*
ns
**
*** *
Chapter No. 4
Page 156
5. Discussion
In our experiments, clear behavioural differences between groups of fish reared in
a barren and enriched environment were observed. The fry reared in enriched tanks and
pond environment somehow behave similarly like latency to leave shelter, habitat
shift, predation (inspection and latency to pick prey) and anti-predatory behaviour
(freeze, hide, low activity, inspection and move away) while both groups behave
significantly different compared to the barren-reared group. These findings suggest
that the early environment manipulation affects the behaviour of the advanced fry of
mahseer. In all trials, enriched-reared fry were more active and bold in their
behavioural responses than barren-reared fish, indicating that generally, more active
behaviour has developed in the physical enriched environments.
In the latency to leave shelter assay, fish that were previously reared in
physical-enriched tank and semi-natural ponds, seemed neophobic to a lesser degree,
and emerged earlier from a start box than fish reared in the barren tank environment.
This is in accordance with previous studies showing that fish reared in an enriched
environment to demonstrate lower levels of neophobia and higher levels of boldness,
and than those kept in barren tanks (Sherwin, 2004; Braithwaite and Salvanes, 2005;
Fox et al., 2006). Zimmermann et al. (2001) also found that introduction of the newer
changes via enrichment by using novel objects and their different arrangements in
the rearing environment habituated animals to novelty, thus increasing boldness
activity while decreasing neophobia and anxiety. Salvanes and Braithwaite (2005)
also reported that, fish exposed to spatial heterogeneity during rearing, display bolder
and better curiosity aggravated behaviour. Boldness in fish improved their flexibility
and ability to handle with new environments, and prompt rapid resumption of normal
behaviour (Brown and Braithwaite, 2004), thus bold fish sooner come out of the
stress and enjoy longer foraging durations (Braithwaite and Salvanes, 2005). Kelley et
al. (2005) further explained that captive conditions promote the development of the
maladaptive risk taking behaviour that increase the chance of predation of
reintroduced species in the natural environment. According to Sih et al. (2004)
boldness is not always profitable; although at some level it will be adaptive but in
another way, bolder individuals may put themselves at more risk.
Chapter No. 4
Page 157
To acquire information about the surroundings is prerequisite for the survival
of animals (Galef and Laland, 2005) and exploratory behaviour make them to collect
this information rapidly and more efficiently from the surrounding environment
(Braithwaite and Salvanes, 2005). Exploratory behaviour of an organism is affected
by the rearing environment (Kellay and Magurran, 2003), In some earlier studies
(Braithwaite and Salvanes, 2005; Ahlbeck and Holliland, 2012), fish from enriched
environments were faster to enter a new environment which is similar to what was
observed in our exploratory behaviour test. In our exploratory behaviour test fish
reared in enriched tank appeared to spend more time in the vegetation and less time in
an open and box area, however, they are more active and shown higher exploratory
response by showing the high number of habitat shift compared to barren reared fish.
Camacho-Cervantes (2015) performed exploratory behavioural experiments on
guppies and concluded that guppies engaged more suddenly in exploratory behaviour
in the presence of vegetation. Moreover, semi-natural reared fish moving around in
the aquaria utilizing both the vegetation, start box and open area, while they did not
explore the vegetation area at the extent by physically enriched reared fish. It may be
due to their previous rearing environment (semi-natural pond) that had a large open
space for exploration, but did not have substrate (gravel) and hiding places (PVC
pipes). Maximino et al. (2010) previously reported that fish that are less anxious (less
shy) are more active (bold) and exploratory. Also anxiety has been shown to decrease
in fish through enriched environments (Braithwaite and Salvanes, 2005). Fish t h a t
w e r e exposed to rearing heterogeneity in early life were not only bolder, but seek
refuge faster than fish previously reared in a barren environment (Salvanes and
Braithwaite, 2005).
The barren reared fish in our study, spent more time in the open area and a
start box than physically enriched reared fish. However, we cannot conclude that
barren fish are more active (bold) and exploratory. Although, according to some
scientist, fish spent more time in open area are more active (bold) and exploratory
(Sneddon, 2003; Frost et al., 2007), but here it appears that barren reared fish is shy
and reluctant to explore the novel environment (vegetation) due to the previous
rearing exposure. Moreover, spending more time in the start box after 10 min settling
time also indicated its preference to the familiarized environment. Habitat shift results
in clearly differentiated exploratory behaviour of barren and enriched environment
Chapter No. 4
Page 158
reared fish. Millidine et al. (2006) found that Atlantic salmon (Salmo salar) behaved
less stressed when kept in an environment with access of structural complexity and
shelters. Kistler et al. (2011) also reported that zebrafish (Danio rerio) and Checker
barbs (Puntius oligoiepis) give preference to and spend more time in a compartment
containing clay pots and vegetation compared to an empty plain compartment without
any substrates. Several studies suggest that fish give importance to vegetation and
shelters as a source of protection, even if the fish are grown in predator-free
environment (Sloman et al., 2011).
Physical enrichment seems to improve flexibility of feeding behaviour (rapid
switching to a new food source), foraging and migration (Braithwaite and Salvanes,
2005; Hyvärinen and Rodewald, 2013). Atlantic salmon (Salmo salar) reared in
variable conditions improved foraging and migration after stocking, compared with
barren-reared salmon (Hyvärinen and Rodewald, 2013). As previously reported by
Braithwaite and Salvanes (2005), early environmental variability has positive effects
on the attraction and consumption of live prey. This is in accordance with our findings
as fish reared in an enriched and semi-natural environment started to feed on live
prey, significantly faster than barren-reared fish (Fig. 4). Brown et al. (2003) found
that only fish with both variable environment and variable food were able to move
from one live prey to another despite previous live-prey experience. For hatchery-
reared fish, that have been fed non-living food, it can be a challenge to start catching
live prey, although studies have shown that such fish can adapt to this quite quickly
(Paszkowski and Olla, 1985) indicating that the innate attraction to live prey persists
also in hatchery stocks. Even so, there are also studies showing that not all fish from a
hatchery succeed in the transition to live prey. Gillen et al. (1981) reported that 11%
of the tested individuals of hatchery reared Tiger muskellunge (Esox masquinongy
× lucius), had not switched from pellet to live food in 14 days indicating that all
individuals may not adapt to a natural diet after stocking. Still, it might not be the only
explanation to the large behavioural difference r e g a r d i n g a new prey (earthworm)
as seen in our study. Hunger and stomach fullness are the main factors influencing
motivation to eat (Losey, 1995). However, to overcome such factors in our current
trial, all of our experimental groups had been starved for 24 hours to increase their
feeding motivation. Thus, we assume that the fish were similarly motivated to feed
during the trials.
Chapter No. 4
Page 159
In our current study fry reared in an enriched environment were more prone to
perform t h e active behaviour, including predator inspection. Visual cues often elicit
predator-inspection behaviour and the higher proportion of predator inspection in the
pond-reared fish may give them a better perception of the risk imposed by an
individual approaching. The barren-reared fish had a generally less active anti-
predator response, keeping a low profile, predominately remaining motionless. This is
in accordance with earlier results reported by Salvanes and Braithwaite (2005) where
fish from enriched environments had a stronger anti-predator response than fish from
plain environments (Pitcher et al., 1986). Physically enriched-reared fish were more
active when exposed to a predator, although there were certain behaviours that did not
differ significantly among physical enriched, semi-natural pond environment reared
fry, e.g. freeze and low activity behaviour. Like our findings, Salvanes and
Braithwaite (2005) also observed that fish from the heterogeneous environment as
compared to plane or barren environment use shelter more often. Similarly, Howell
(1994) found that anti-predator responses in hatchery-reared are weaker than wild
reared fish and evidence from comparison of wild and hatchery juveniles European
sea bass (Dicentrarchus labrax) of the same size illustrate that wild fish had a
stronger anti-predator response, than hatchery reared (Malavasi et al., 2004). This
may be due to the dynamics of the rearing environment with wild fish, previously
exposed to more variable and complex environment than the hatchery reared fish.
Roberts et al. (2011) determine that two weeks of rearing of salmon in an enriched
environment considerably reduced risk taking behaviour towards a predator and took
a considerably longer time to leave a shelter. The current findings are consistent with
those observations from a number of previous studies that antipredator responses are
weaker in hatchery reared fish (Howell, 1994; Brown and Day, 2002; Malavasi et al.,
2004; Salvanes and Braithwaite, 2005).
5. Conclusions
The projects related to environmental rearing enrichment and pre-release
conditioning have been carried out mostly on mammals and birds (Seddon et al.,
2007; Griffin et al., 2001), However, our results and those of others previous studies
(Braithwaite and Salvanes, 2005; Roberts et al., 2011; Ahlbeck and Holliland, 2012;
Näslund, 2013) suggest that fish can probably benefit from manipulation (enrichment)
Chapter No. 4
Page 160
of rearing enrichment. In the current study, certain behaviours of mahseer were
modified through manipulation of physical enrichment in the early rearing
environment. These results have important implications for a possible way of
improving the outcomes of restocking program of endangered fish species by
modifying conventional hatchery-rearing environments. It is suggested that by
physical enrichment, the post survivorship of the hatchery reared mahseer can be
improved.
General Discussion
Page 161
GENERAL DISCUSSION
The overall results of the present study indicated the impact of rearing environment in
modification of behaviour and stress sensitivity of T. putitora. Many factors are influencing the
physiology and behaviour of fish, including genetics, environment and the interaction between
gene and environment. In such type of studies, variation among populations, species, strains and
even within strains often appears (Barton, 2002), therefore experimental conditions and
experimental protocols play significant role in the validity of the study. Although, physiological
responses are genetically based but alter / modify by individual experiences (Heath et al., 1993;
Overli et al., 2005). Here both invasive and non-invasive methodologies were adopted in order
to validate our results, get a clear picture and to avoid the factors confound the results.
Free living fish (wild) were collected from River Haro, a breeding site of T. putitora
while captive reared counterpart of forth generations was purchased from Mahseer Fish Hatchery
Hattian, Attock, Punjab, Pakistan, where it was successfully artificially propagated since 2001.
The wild caught fish were about 5% more in weight compared to captive reared counterparts,
therefore, for physiological stress response study, we adjusted this difference by fixing the
stocking density instead the number of fish. It is reported that small variations in body size does
not result in considerable changes in metabolism and production of cortisol (Bender et al., 2008).
Behaviour is function of generations in captivity (McPhee, 2003) and difference even in a single
generation, resulted large changes in behaviour (Álvarez and Nicieza, 2003; Salonen and
Peuhkuri, 2006), therefore caution was made for obtaining only fourth generation hatchlings for
rearing in barren, semi-natural and physically enriched environment.
In summary, captive reared population of mahseer showed atypical stress response i.e.,
lower sensitivity to stress or low activation of HPI axis and brain monoamenergic (serotonergic
and dopaminergic) systems and delay recovery period as compared to wild counterpart (Table, 8,
10, 12, 14, Fig 4 to 9. Similar attenuated response of captive reared fish has already been
reported (Winberg et al., 2001; Barton, 2002; Perreault et al., 2003; Larson et al., 2003; Lepage
et al., 2005; Iwama et al., 2006; Zuberi et al., 2011; Gesto et al., 2013) and suggested the role of
rearing environment in modification of the sensitivity to stress. Like our observations, rapid
response and early recovery to stressor of wild or free living populations has already been
General Discussion
Page 162
reported (Barton, 2002; Iwama et al., 2006; Zuberi et al., 2011). We are confident here that the
observed differences in stress response between populations are the result of altered
developmental patterns of captive-reared population because the experiment was conducted in
replicate of three under similar conditions and both populations were exposed similar stressor.
The release of cortisol is temporary and it provides energy to cope stress challenges. However,
the prolong released of cortisol by captive reared fish in response to acute stress indicate the
adverse effects hatchery rearing on the physiological stress response.
Both wild caught and captive reared fish were large enough to collect blood for the
estimation of cortisol, therefore plasma cortisol was determined for evaluation of stress response.
However, blood sampling inherent several problems like capturing / removal of fish from group
without causing stress to other members as well serial or time dependants sampling (Laidley and
Leatherland, 1988), and raise questions to the validity of the stress response study. However, in
the present study, we avoided this limitation by dividing experiment groups of both populations
in time based series and at a particular time, all fish in a designated aquarium were anaesthetized
by the addition of MS222 and sampling was done without causing stress.
For validation of plasma results, the stress response experiment was also conducted in a
flow through system and water-borne cortisol was determined. Like us, many fish researchers
also adopted both invasive (from blood) and non invasive (through water) techniques for
examining the difference in corticosteroids response to stressors (Ellis, 2004; Barton, 2002).
Both experimental approaches provide similar typical response in wild caught and atypical in
captive reared mahseer and confirmed the negative effect of hatchery rearing environment on the
physiological stress responses (Fevolden et al., 1991; Fevolden and Roed, 1993; Pottinger et al.,
1994; Fevolden et al, 1999).
The difference in magnitude of post stress, blood glucose level and recovery to normal
level among populations (Table 5, Fig. 3), also support the results of cortisol and confirm that
both populations are differ in their sensitivity to stress. The elevated levels of glucose indicate
the demand of energy rises to cope with the stressful situation (Martínez-Porchas et al., 2009).
However, glucose profile in both populations showed an initial fast increase in less than 0.5 hr,
most probably by an increase glycogenolytic process in liver in response to elevated blood

General Discussion
Page 163
catecholamines (Guesto et al., 2016) and a second burst between 45 min and 2 hrs to 4hrs, could
be related to the cortisol promoting gluconeogenesis (Mommsen et al., 1999). Similar differences
in building peak levels and returning to basal level as compared to cortisol have already been
reported (Pickering et al., 1982; Pottinger, 1998; Flodmark et al., 2002).
The concentration of blood circulating cortisol is the indicative of personality trait i.e.,
boldness. Several studies on fish and other taxa reported the links between stress reactivity and
behavioural responses (Øverli et al., 2007) and between boldness traits and stress responses
(Carere and van Oers, 2006). Huntingford et al. (2010) reported the link between activation of
cortisol receptor gene to coping strategies in carp Cyprinus carpio by observing significantly
lower activation of cortisol receptor gene in bold fish than in shy fish.
Bold fish had a significantly lower circulating level of cortisol compared to the shy one
(Huntingford et al., 2010; Raoult et al., 2011). In the present study, the significantly low
magnitude of plasma cortisol after exposure to stress (Table 4, Fig. 2), and more time spend in
open areas (Fig. 2, Chp. 2). In behavioural test specify the bold behaviour of captive reared T.
putitora compared to wild counterpart. Results are in agreement with Raoult et al. (2011)
observing the juvenile similar relationship of cortisol between bold and shy Argyosomus
japonicus. Captive environment promotes boldness in fish (Kelley et al., 2005; Huntingford,
2004) may be due to high density rearing environments and development of trait to compete
resources. Moreover, higher energy intake demand and elevated metabolism of captive-reared
fish compared to free living counterpart, also force hatchery reared fish to take risk for food and
compete others (Lepage et al., 2000; Sundstrom et al., 2004; Killen et al., 2011). The more rapid
emergence of captive reared mahseer from shelter indicates curiosity and more risk sensitive
behaviours (Einum and Fleming, 2001; Huntingford, 2004) and suggest the negative impact of
captive rearing on live skill activity because such conspicuousness makes them more prone to
predation in the wild (Kelley et al., 2005). The boldness and reduced stress response of hatchery
reared mahseer may explain the low post release survival in wild. Such traits are beneficial for
fish destined for the table, but detrimental in conservation strategies.
General Discussion
Page 164
Brain serotonergic system influences the HPI axis and regulate stress response and
behaviour of fish (Winberg et al., 1997; Overli et al., 1999). The elevated 5-HIAA/5-HT and
DOPAC/DA ratios in several brain areas and up-regulation of 5-HT synthesis under stress
suggested its role in coping stress mechanism (Lepage et al., 2000). Generally, 5-HT stimulation
inhabits the active behavioural responses like locomotion, feeding and aggressive behaviour
(Winberg et al., 1993; Leibowitz and Alexander, 1998; Øverli et al., 1998). Here like cortisol ,
the reduced levels of all monoamines in captive reared mahseer in contrast to wild counterpart
(Table 8,10, 12, 14, Fig 4, 7 chp.1) also support the view of the development of more
curiously, risk taking behaviour in hatchery reared fish. The lower post-stress brain 5-HIAA/5-
HT and DOPAC/DA in domesticated fish were well documented (Lepage et al., 2000).
Captive reared and wild caught mahseer, although showed statistically different
physiological stress response with respect to blood and water-borne cortisol, blood glucose,
5HIAA/5-HT and NE but except NE all parameters did not show highly significant
interactions between population and treatment. It may be due to interbreeding of wild and
captive reared fish because of restocking program or due to the small genetic distance between
population as we have used 4th
generation captive reared fish. Heritability as well as modulation
of the stress response by differential exposure to stressor during ontogeny is well documented
(Fevolden et al., 1999; Brown et al., 2005; Kelley and Brown, 2010).
Early rearing environment affect the physiology and shaping the behaviour of fish, while
enrichment in rearing environment, improve the behaviour and stress sensitivity of fish by
modulating HPI axis and influencing dopaminergic and serotonergic systems. Beneficial effects
of enriched rearing environment include better food utilization, improved growth and fillet
quality, increased healing erosions and survival (Arndt et al., 2001; Coulibaly et al., 2007). In the
study, presence of substrates (PVC pipes, stones and vegetation) in the rearing environment act
as means of environmental enrichment for T. putitora and improve the sensitivity to stress and
overall predatory, anti-predatory and foraging behaviour of fish.
Significantly low magnitude of almost all stress parameters in the physical enriched
group of fish after exposure to stress as compared to barren and semi-natural groups showed a
certain positive effect of environmental enrichment on HPI axis and brain dopaminergic and
General Discussion
Page 165
serotonergic systems. Fish from barren and semi natural environment reared groups had
somewhat higher levels of all studied stress parameters (whole body and water borne cortisol,
blood glucose and brain monoamines) as compared to physically enriched reared group. These
differences in basal levels may be due to the presence of unpredictable stressors in the rearing
environments of barren and semi natural reared groups (Ladewig, 2000). However, overall
slightly low basal levels of stress hormones in physically enriched groups (Table 4, Fig. 2, Chp.
3), could be due to the presence of shelter or hiding place. It seems that structural enrichment
regulates the external disturbance and lower conspecific aggression (Batzina et al., 2012, 2014).
The somewhat higher magnitude of cortisol, glucose and brain monoamines in the
barren reared group of fish (Fig. 1 to 8 chp 3) reflect their physiological stress response
comparable to wild one, but sustained high levels of all stress related parameters over time as
compared to basal values and prolong recovery from stress suggested their atypical stress
response comparable to captive reared fish. The significantly higher basal level of blood glucose
in a barren reared group of fish reflects the presence of intermittent stressors in the rearing
environment. It seems that in structure-less environment fish don’t have any place to avoid
external disturbance while low level in the physically enriched group might be related to reduce
stress because of the presence of substrate and shelter (hiding place). Similar reduced stress
shown by gilthead sea bream (Sparus aurata) in the presence of the substrate has been observed
by Batzina et al. (2012, 2014). The reduced activation of whole brain serotonergic and
dopaminergic system in the physically enriched group of T. putitora also support previous results
of beneficial effect of environmental enrichment on sensitivity of stress of fish Crucian carp
(Carassius carassius), Atlantic salmon (Salmo salar), (Höglund et al., 2005), Zebrafish Danio
rerio, (Millidine et al., 2006) and mammals (mice and rats Brenes et al., 2008; McQuaid et al.,
2012).
In mammals, both stimulatory and inhibitory effects of stress on dopaminergic activity
have been reported (Höglund et al., 2001; Waters et al., 2005). In the present study, DOPAC/DA
ratios increased after stress in all rearing groups and indicated the stimulatory effects, however
increased at a lower magnitude in a physically enriched environment reared group compared to
General Discussion
Page 166
barren reared groups. Our results support the other previously reported observations (Backström
et al., 2011; Gesto et al., 2008; Øverli et al., 1999; Weber et al., 2012).
Like physiological stress response, enriched environment reared groups also showed
improved behavioural responses and somewhat support our physiological response data.
Although semi natural and physically enriched groups did not show any significant difference in
latency to leave shelter, habitat shift, predation (inspection and latency to pick prey) and anti-
predatory behaviour (freeze, hide, low activity, inspection and move away) but their
physiological responses in terms of stress sensitivity indicated by magnitude of whole body
cortisol, blood glucose and brain monoamines and recovery from stress clearly showed the
difference among populations. However, results both physiological stress responses and
behavioural tests clearly indicated the negative impact of physically un-enriched (Barren)
environment on the behaviour and physiology of fish.
The early emergence of physical-enriched reared fish from the start box indicated their
less neophobic behaviour compared to barren reared fish. Many others also observed similarly
lower levels of neophobia and higher levels of boldness in the fish reared in an enriched
environment (Sherwin, 2004; Braithwaite and Salvanes, 2005; Fox et al., 2006) and suggested an
increase in boldness and decrease in neophobia and anxiety by improving enrichment with novel
objects having variation in the arrangements (Zimmermann et al., 2001). Salvanes and
Braithwaite (2005) used spatial heterogeneity during rearing of fish and observed bolder and
better curiosity aggravated behaviour.
Boldness of physically enriched environment reared T. putitora (Fig 1, Chp 4) and their
early recovery from stress (Table 2, 4 Fig. 1, 2, Chp. 3), showed their flexibility and ability to
handle with new environments, and prompt rapid resumption of normal behaviour (Brown and
Braithwaite, 2004). It is reported that bold fish sooner come out of the stress and enjoy longer
foraging durations (Braithwaite and Salvanes, 2005). Although, boldness at some level are
adopted, but not always profitable (Sih et al., 2004), but here physically enriched environment
reared fish showed other improved behaviour (exploratory, anti-predatory and predatory etc.)
(Fig 2 to 5 Chp. 4), and indicated their ability to tackle the situation instead of rapid maladaptive
risk taking behaviour. It is observed that in exploratory behaviour test, enriched environment
General Discussion
Page 167
reared fish spend more time in the vegetation and less time in an open and box area, (Fig. 2 Chp.
2). However, they are more active and shown a high number of habitat shift compared to barren
reared fish (Fig. 3, Chp. 2) . Similarly, guppies engaged more suddenly in exploratory behaviour
in the presence of vegetation (Camacho-Cervantes, 2015). However, semi-natural reared fish
did not explore the vegetation area at the extent by physically enriched reared fish. It may be due
to their previous rearing environment (semi-natural pond) that had a large open space for
exploration, but did not have substrate (gravel) and hiding places (PVC pipes).
Maximino et al. (2010) previously reported that fish that are less anxious (less shy) are
more active (bold) and exploratory. Similar is the case here, physically enriched reared T.
putitora showed low level anxiety indicated by low activation of HPI axis, serotonergic and
dopaminergic system and improved exploratory behaviour. Braithwaite and Salvanes (2005)
also suggested that fish exposed heterogeneity in early life seek refuge faster than fish
previously reared in a barren environment.
Conclusion
In conclusion, the present study has demonstrated that wild-caught mahseer has shown
different stress response and life skills behaviour compared to the captive-reared counterpart.
These findings suggest that captive rearing environment led mahseer in the physiological and
behavioural divergence from wild fish. The physiological stress response, which compared the
blood plasma (invasive) and water-borne (non-invasive) cortisol, blood glucose and brain
monoamines of wild mahseer with that of their captive-reared mahseer, revealed differences in
the activation HPI-axis, dopaminergic and serotonergic system (Stress sensitivity), while
behavioural study revealed differences in the frequency of boldness, exploratory and anti-
predatory behaviours. Mahseer reared in physically-enriched environment displayed lower post-
stress brain 5-HIAA/5-HT, DOPAC/DA and HVA/DA ratios and NE level than reared in barren
and semi-natural environment. On the other hand, fish reared in a barren rearing environment
more sensitive to stress response indicated by elevated whole-body cortisol, blood glucose, and
Ne levels. Our results and those of others previous studies suggest that fish can probably be
benefited from the manipulation of rearing environment (enrichment). In the current study,
General Discussion
Page 168
physical enriched environment reared fish showed improved life skill activities (exploratory,
predatory and anti-predatory behaviour) physiological stress responses (low level of anxiety, low
magnitude of stress hormones, early recovery from stress). These results have important
implications for a possible way of improving the outcomes of restocking program of endangered
fish species by modifying conventional hatchery-rearing environments. It is suggested that by
physical enrichment, the post survivorship of the hatchery reared mahseer can be improved. Thus
the outcomes suggest a modification of the hatchery rearing environment in such a way that it
will produce fish, behaviorally comparable to their wild counterpart.

References
Page 169
REFERENCES
Abrahams, M. V., & Kattenfeld, M. G. (1997). The role of turbidity as a constraint on
predator-prey interactions in aquatic environments. Behavioural Ecology and
Sociobiology, 40(3), 169-174.
Adriaenssens, B., & Johnsson, J. I. (2011). Learning and context-specific exploration
behaviour in hatchery and wild brown trout. Applied Animal Behaviour
Science, 132(1), 90-99.
Ahlbeck, I., & Holliland, P. B. (2012). Rearing environment affect important life
skills in pikeperch (Sander lucioperca). Boreal environment research, 17(3-4),
291-304.
Alanärä, A., Winberg, S., Brännäs, E., Kiessling, A., Höglund, E., & Elofsson, U.
(1998). Feeding behaviour, brain serotonergic activity levels, and energy
reserves of Arctic char (Salvelinus alpinus) within a dominance hierarchy.
Canadian Journal of Zoology, 76 (2), 212-220.
Ali, S., Barat, A., Kumar, P., Sati, J., Kumar, R., & Haldar, R. S. (2014). Study of the
length-weight relationship and condition factor for the Golden Mahseer, Tor
putitora from Himalayan rivers of India. Journal of Environmental
Biology, 35 (1), 225.
Almazan, G., & Boyd, C. E. (1978). An evaluation of Secchi disk visibility for
estimating plankton density in fish ponds. Hydrobiologia, 61(3), 205-208.
Aluru, N., & Vijayan, M. M. (2006). Aryl hydrocarbon receptor activation impairs
cortisolresponse to stress in rainbow trout by disrupting the rate-limiting steps
in steroidogenesis. Endocrinology, 147, 1895-1903.
Aluru, N., & Vijayan, M. M. (2009). Stress transcriptomics in fish: A role for
genomic cortisol signalling. Gen. Comp. Endocrinol, 164, 142-150.
References
Page 170
Alvarez, D., & Nicieza, A. G. (2003). Predator avoidance behaviour in wild and
hatchery‐reared brown trout: the role of experience and domestication. Journal
of Fish Biology, 63(6), 1565-1577.
Ameen, M., Islam, M. A., & Nishat, A. (2000). Red Book of Threatened Fishes of
Bangladesh. IUCN-The World Conservation Union, 116.
Araki, H., Berejikian, B. A., Ford, M. J., & Blouin, M. S. (2008). Fitness of hatchery-
reared salmonids in the wild. Evolutionary Applications, 1(2), 342-355.
Arends, R. J., Mancera, J. M., Munoz, J. L., Bonga, S. W., & Flik, G. (1999). The
stress response of the gilthead sea bream (Sparus aurata L.) to air exposure
and confinement. Journal of Endocrinology, 163 (1), 149-157.
Arndt, R. E., Routledge, M. D., Wagner, E. J., & Mellenthin, R. F. (2001). Influence
of raceway substrate and design on fin erosion and hatchery performance of
rainbow trout. North American Journal of Aquaculture, 63 (4), 312-320.
Arnhold, E. (2013). Package in the R environment for analysis of variance and
complementary analyses. Braz. j. vet. res. anim. sci, 50(6), 488-492.
Arora, R., & Julka, J. P. (2013). Phenotype and genotype differentiation between two
stocks of Tor putitora (Hamilton) population (pisces: cyprinidae) from
Himachal Pradesh, India. Int J Plant Anim Environ Sciences, 3, 31–41.
Ashley, Paul J. (2007). "Fish welfare: current issues in aquaculture." Applied Animal
Behaviour Science, 104.3, 199-235.
Azevedo, C.S. De., & Young, R.J. (2006). Behavioural responses of captive-born
greater rheas Rhea americana Linnaeus (Rheiformes, Rheidae) submitted to
antipredator training. Revista Brasileira de Zoologia, Curitiba, 23 (1), 186-
193.
References
Page 171
Backström, T., Schjolden, J., Øverli, Ø., Thörnqvist, P. O., & Winberg, S. (2011).
Stress effects on AVT and CRF systems in two strains of rainbow trout
(Oncorhynchus mykiss) divergent in stress responsiveness. Hormones and
behavior, 59(1), 180-186.
Bakawale, S., & Kanhere, R. R. (2013). Study on the fish species diversity of the river
Narmada in Western zone. Research Journal of Animal, Veterinary and
Fishery Sciences, 1(6), 18-20.
Baker, K. C. (1997). Straw and forage material ameliorate abnormal behaviors in
adult chimpanzees. Zoo Biology, 16(3), 225-236.
Balcombe, J. P. (2006). Laboratory environments and rodents' behavioural needs: a
review. Laboratory animals, 40(3), 217-235.
Balik, S. (1995). Freshwater fish in Anatolia, Turkey. Biological Conservation, 72(2),
213-223.
Balm, P. H. M. (1997). Immune-endocrine interactions. In: Iwama, G.K., Pickering,
A.D., Sumpter, J.P., Schreck, C.B. (Eds.), Fish Stress and Health in
Aquaculture. Cambridge University Press, Cambridge, pp. 195-221.
Balment, R. J., Lu, W., Weybourne, E., & Warne, J. M. (2006). Arginine vasotocin a
key hormone in fish physiology and behaviour: a review with insights from
mammalian models. General and comparative endocrinology, 147(1), 9-16.
Barat, A., Kumar, R., Goel, C., Singh, A. K., & Sahoo, P. K. (2016). De novo
assembly and characterization of tissue-specific transcriptome in the
endangered golden mahseer, Tor putitora. Meta gene, 7, 28-33.
Barnett, C. W., & Pankhurst, N. W. (1998). The effects of common laboratory and
husbandry practices on the stress response of greenback flounder
Rhombosolea tapirina (Günther, 1862). Aquaculture, 162(3), 313-329.

References
Page 172
Barton, B. A. (1997). Stress in finfish: Past, present, and future?a historical
perspective. In G. K. Iwama, A. D. Pickering, J. P. Sumpter, and C. B.
Schreck (eds.), Fish stress and health in aquaculture, Cambridge University
Press, Cambridge. pp. 1-34.
Barton, B. A. (2000). Salmonid fishes differ in their cortisol and glucose responses to
handling and transport stress. North American Journal of Aquaculture, 62(1),
12-18.
Barton, B. A. (2002). Stress in fishes: a diversity of responses with particular
reference to changes in circulating corticosteroids. Integrative and
comparative biology, 42(3), 517-525.
Barton, B. A., & Iwama, G. K. (1991). Physiological changes in fish from stress in
aquaculture with emphasis on the response and effects of
corticosteroids. Annual Review of Fish Diseases, 1, 3-26.
Barton, D. A., Esler, M. D., Dawood, T., Lambert, E. A., Haikerwal, D., & Brenchley,
C. (2008). Elevated brain serotonin turnover in patients with depression.
Archives of General Psychiatry, 65(1), 38-46.
Bates, D., Maechler, M., Bolker, B., & Walker, S. (2014). lme4: Linear mixed-effects
models using Eigen and S4. R package version, 1(7).
Batzina, A., & Karakatsouli, N. (2012). The presence of substrate as a means of
environmental enrichment in intensively reared gilthead seabream Sparus
aurata: growth and behavioral effects. Aquaculture, 370, 54-60.
Batzina, A., Dalla, C., Papadopoulou-Daifoti, Z., & Karakatsouli, N. (2014). Effects
of environmental enrichment on growth, aggressive behaviour and brain
monoamines of gilthead seabream Sparus aurata reared under different social
conditions. Comparative Biochemistry and Physiology Part A: Molecular &
Integrative Physiology, 169, 25-32.
References
Page 173
Batzina, A., Dimitris, K., Christina, D., Zeta Papadopoulou-Daifot.i, Stella, C., &
Nafsika, K. (2014). Blue substrate modifies the time course of stress response
in gilthead seabream Sparus aurata. Aquaculture, 247–253.
Begg, K., & Pankhurst, N. W. (2004). Endocrine and metabolic responses to stress in
a laboratory population of the tropical damselfish Acanthochromis
polyacanthus. Journal of Fish Biology, 64(1), 133-145.
Bell, J. D., Leber, K. M., Blankenship, H. L., Loneragan, N. R., & Masuda, R. (2008).
A new era for restocking, stock enhancement and sea ranching of coastal
fisheries resources. Reviews in fisheries science, 16(1-3), 1-9.
Bell, J. D., Bartley, D. M., Lorenzen, K., & Loneragan, N. R. (2006). Restocking and
stock enhancement of coastal fisheries: potential, problems and
progress. Fisheries Research, 80(1), 1-8.
Belz, J. A. (2003). Linguistic perspectives on the development of intercultural
competence in telecollaboration.
Bender, N., Heg-Bachar, Z., Oliveira, R.F., Canario, A.V.M., & Taborsky, M. (2008).
Hormonal control of brood care and social status in a cichlid fish with brood
care helpers. Physiology and Behavior, 94, 349–358.
Berejikian, B. A. (1995). The effects of hatchery and wild ancestry and experience on
the relative ability of steelhead trout fry (Oncorhynchus mykiss) to avoid a
benthic predator. Canadian Journal of Fisheries and Aquatic Sciences, 52(11),
2476-2482.
Berejikian, B. A., Tezak, E. P., Flagg, T. A., LaRae, A. L., Kummerow, E., &
Mahnken, C. V. (2000). Social dominance, growth, and habitat use of age-0
steelhead (Oncorhynchus mykiss) grown in enriched and conventional
hatchery rearing environments. Canadian journal of fisheries and aquatic
sciences, 57(3), 628-636.
References
Page 174
Berejikian, B. A., Van Doornik, D. M., Scheurer, J. A., & Bush, R. (2009).
Reproductive behavior and relative reproductive success of natural-and
hatchery-origin Hood Canal summer chum salmon (Oncorhynchus
keta). Canadian Journal of Fisheries and Aquatic Sciences, 66(5), 781-789.
Berejikian, B., Tezak, E., Riley, S., & LaRae, A. (2001). Competitive ability and
social behaviour of juvenile steelhead reared in enriched and conventional
hatchery tanks and a stream environment. Journal of Fish Biology, 59(6),
1600-1613.
Berejikian, B.A., Smith, R.J.F., Tezak, E.P., Schroder, S.L., & Knudsen, C.M. (1999).
Chemical alarm signals and complex hatchery rearing habitats affect
antipredator behavior and survival of chinook salmon (Oncorhynchus
tshawytscha) juveniles. Can. J. Fish. Aquat. Sci, 56(5), 830–838.
Bernier, N. J., & Craig, P. M. (2005). CRF-related peptides contribute to stress
response and regulation of appetite in hypoxic rainbow trout. American
Journal of Physiology-Regulatory, Integrative and Comparative
Physiology, 289(4), 982-990.
Bernier, N. J., & Peter, R. E. (2001). The hypothalamic–pituitary–interrenal axis and
the control of food intake in teleost fish. Comparative Biochemistry and
Physiology Part B: Biochemistry and Molecular Biology, 129(2), 639-644.
Bernier, N. J., Bedard, N., & Peter, R. E. (2004). Effects of cortisol on food intake,
growth, and forebrain neuropeptide Y and corticotropin-releasing factor gene
expression in goldfish. General and comparative endocrinology, 135(2), 230-
240.
Bhatt, J. P., & Pandit, M. K. (2016). Endangered Golden mahseer Tor putitora
Hamilton: a review of natural history. Reviews in fish biology and
fisheries, 26(1), 25-38.
References
Page 175
Bhatt, J. P., Nautiyal, P., & Singh, H. R. (2000). Population structure of Himalayan
mahseer, a large cyprinid fish in the regulated foothill section of the river
Ganga. Fisheries Research, 44(3), 267-271.
Bhatt, J. P., Nautiyal, P., & Singh, H. R. (2004). Status (1993-1994) of the
endangered fish Himalayan Mahseer Tor putitora (Hamilton)(Cyprinidae) in
the mountain reaches of the river Ganga. Asian Fisheries Science, 17, 341-
355.
Biron, M., & Benfey, T. J. (1994). Cortisol, glucose and hematocrit changes during
acute stress, cohort sampling, and the diel cycle in diploid and triploid brook
trout (Salvelinus fontinalis Mitchill). Fish Physiol. Biochem, 13, 153-160.
Blanchet, S., Dodson, J., & Brosse, S. (2006). Influence of habitat structure and fish
density on Atlantic salmon Salmo salar L. territorial behaviour. Journal of
Fish Biology, 68(3), 951-957.
Blaxter, J.H.S. (2000). The enhancement of marine ¢sh stocks. Advancesin Marine
Biology, 38, 2-5.
Boersma, K. S., Ryer, C. H., Hurst, T. P., & Heppell, S. S. (2008). Influences of
divergent behavioral strategies upon risk allocation in juvenile
flatfishes. Behavioral Ecology and Sociobiology, 62(12), 1959.
Boisvert, J. P., Boschuetz, T. J., Resch, J. M., Mueller, C. R., & Choi, S. (2011).
Serotonin mediated changes in corticotropin releasing factor mRNA
expression and feeding behavior isolated to the hypothalamic paraventricular
nuclei. Neuroscience letters, 498(3), 213-217.
Bonga, S. W. (1997). The stress response in fish. Physiological reviews, 77(3), 591-
625.
Borski, R. J., Hyde, G. N., Fruchtman, S., & Tsai, W. S. (2001). Cortisol suppresses
prolactin release through a non-genomic mechanism involving interactions
References
Page 176
with the plasma membrane. Comparative Biochemistry and Physiology Part
B: Biochemistry and Molecular Biology, 129(2), 533-541.
Bowman, J., Jaeger, J. A., & Fahrig, L. (2002). Dispersal distance of mammals is
proportional to home range size. Ecology, 83(7), 2049-2055.
Boyes, K. N. (2016). Applying Wildlife Conservation Tourism to Marine Endangered
Species: Identifying Indicators for Triple Bottom Line Sustainability (Doctoral
dissertation, University of Washington).
Bracewell, P., Cowx, I. G., & Uglow, R. F. (2004). Effects of handling and
electrofishing on plasma glucose and whole blood lactate of Leuciscus
cephalus. Journal of Fish Biology, 64(1), 65-71.
Braithwaite, V. A., & Salvanes, A. G. (2005). Environmental variability in the early
rearing environment generates behaviourally flexible cod: implications for
rehabilitating wild populations. Proceedings of the Royal Society of London B:
Biological Sciences, 272(1568), 1107-1113.
Braithwaite, V. A., & Salvanes, A. G. V. (2008) Cognition: learning and memory. In:
Magnhagen C, Braithwaite VA, Forsgren E, Kapoor BG (eds) Fish Behaviour.
Science Publisher, Enfield, NH.
Brambilla, F., Perna, G., Bussi, R., & Bellodi, L. (2000). Dopamine function in
obsessive compulsive disorder: cortisol response to acute apomorphine
stimulation. Psychoneuroendocrinology, 25(3), 301-310.
Brännäs, E., & Johnsson, J.I. (2008). Behaviour and welfare in farmed fish. In:
Magnhagen, C., Braithwaite, V.A., Forsgren, E., Kapoor, B.G. (Eds.), Fish
Behaviour. Science Publishers, Enfield, USA, pp. 593–627.
Brenes, J. C., Rodríguez, O., & Fornaguera, J. (2008). Differential effect of
environment enrichment and social isolation on depressive-like behavior,
spontaneous activity and serotonin and norepinephrine concentration in
References
Page 177
prefrontal cortex and ventral striatum. Pharmacology Biochemistry and
Behavior, 89(1), 85-93.
Brockmark, S., & Johnsson, J. I. (2010). Reduced hatchery rearing density increases
social dominance, postrelease growth, and survival in brown trout (Salmo
trutta). Canadian Journal of Fisheries and Aquatic Sciences, 67(2), 288-295.
Brockmark, S., Adriaenssens, B., & Johnsson, J. (2010). Less is more: density
influences the development of behavioural life skills in trout. Proceedings of
the Royal Society of London B: Biological Sciences, 277 (1696), 3035-3043.
Brown, A. D., Sisneros, J. A., Jurasin, T., & Coffin, A. B. (2016). Effects of Hatchery
Rearing on the Structure and Function of Salmonid Mechanosensory Systems.
In The Effects of Noise on Aquatic Life II (pp. 117-124). Springer New York.
Brown, C., & Braithwaite, V. A. (2004). Size matters: a test of boldness in eight
populations of the poeciliid Brachyraphis episcopi. Animal Behaviour, 68 (6),
1325-1329.
Brown, C., & Day, R. L. (2002). The future of stock enhancements: lessons for
hatchery practice from conservation biology. Fish and Fisheries, 3(2), 79-94.
Brown, C., & Laland, K. (2001). Social learning and life skills training for hatchery
reared fish. Journal of Fish Biology, 59(3), 471-493.
Brown, C., Burgess, F., & Braithwaite, V. A. (2007). Heritable and experiential
effects on boldness in a tropical poeciliid. Behavioral Ecology and
Sociobiology, 62(2), 237-243.
Brown, C., Burgess, F., & Braithwaite, V. A. (2007b). Heritable and experiential
effects on boldness in a tropical poeciliid. Behavioral Ecology and
Sociobiology, 62 (2), 237-243.
References
Page 178
Brown, C., Davidson, T., & Laland, K. (2003). Environmental enrichment and prior
experience of live prey improve foraging behaviour in hatchery-reared
Atlantic salmon. Journal of Fish Biology, 63(s1), 187-196.
Brown, C., Jones, F., & Braithwaite, V. (2005). In situ examination of boldness–
shyness traits in the tropical poeciliid, Brachyraphis episcopi. Animal
Behaviour, 70(5), 1003-1009.
Brown, C., Jones, F., & Braithwaite, V. A. (2007). Correlation between boldness and
body mass in natural populations of the poeciliid Brachyrhaphis
episcopi. Journal of Fish Biology, 71(6), 1590-1601.
Brown, G. E., & Dreier, V. M. (2002). Predator inspection behaviour and attack cone
avoidance in a characin fish: the effects of predator diet and prey experience.
Animal Behaviour, 63(6), 1175-1181.
Brown, G. E., Ferrari, M. C., Malka, P. H., Oligny, M. A., Romano, M., & Chivers,
D. P. (2011). Growth rate and retention of learned predator cues by juvenile
rainbow trout: faster-growing fish forget sooner. Behavioral Ecology and
Sociobiology, 65(6), 1267-1276.
Bunn, S. E., & Arthington, A. H. (2002). Basic principles and ecological
consequences of altered flow regimes for aquatic biodiversity. Environmental
management, 30(4), 492-507.
Burns, J. G., Price, A. C., Thomson, J. D., Hughes, K. A., & Rodd, F. H. (2016).
Environmental and genetic effects on exploratory behavior of high-and low-
predation guppies (Poecilia reticulata). Behavioral Ecology and Sociobiology,
70(8), 1187-1196.
Caddy, J. F., Defeo, D., & Defeo, O. (2003). Enhancing or restoring the productivity
of natural populations of shellfish and other marine invertebrate resources
(Vol. 448): Food & Agriculture Org.
References
Page 179
Calogero, A. E., Bagdy, G., Moncada, M. L., & D'Agata, R. (1993). Effect of
selective serotonin agonists on basal, corticotrophin-releasing hormone-and
vasopressin-induced ACTH release in vitro from rat pituitary cells. Journal of
Endocrinology, 136(3), 381-387.
Calogero, A. E., Bernardini, R., Margioris, A. N., Bagdy, G., Gallucci, W. T.,
Munson, P. J., Tamarkin, L., Tomai, T. P., Brady, L., & Gold, P. W. (1989).
Effects of serotonergic agonists and antagonists on corticotropin-releasing
hormone secretion by explanted rat hypothalami. Peptides, 10, 189-200.
Camacho-Cervantes, M., Ojanguren, A. F., & Magurran, A. E. (2015). Exploratory
behaviour and transmission of information between the invasive guppy and
native Mexican topminnows. Animal Behaviour, 106, 115-120.
Carere, C., & van Oers, K. (2004). Shy and bold great tits (Parus major): body
temperature and breath rate in response to handling stress. Physiology &
behavior, 82(5), 905-912.
Castro, K. M., & Cobb, J. S. (2005). Behaviour of hatchery‐reared and wild-caught
4th and 5th stage American lobsters, Homarus americanus. New Zealand
Journal of Marine and Freshwater Research, 39(4), 963-972.
Chaouloff, F. (1993). Physiopharmacological interactions between stress hormones
and central serotonergic systems. Brain Research Reviews, 18(1), 1-32.
Chatta, A. M., & Ayub, M. (2010). Growth performance of hatchery reared golden
mahseer (Tor macrolepis) at Sialkot, Pakistan. Biologia, 56, (1 & 2), 1-8.
Chatta, A. M., Ahmad, Z., Hayat, S., & Naqvi, S. A. (2015). Studies on Indoor
Culture of Indus Golden Mahseer (Tor macrolepis) in Central Punjab,
Pakistan. Pakistan Journal of Nutrition, 14(4), 229-233.
References
Page 180
Cheung, W. W., Pitcher, T. J., & Pauly, D. (2005). A fuzzy logic expert system to
estimate intrinsic extinction vulnerabilities of marine fishes to
fishing. Biological conservation, 124(1), 97-111.
Christie, M. R., Marine, M. L., French, R. A., & Blouin, M. S. (2012). Genetic
adaptation to captivity can occur in a single generation. Proceedings of the
National Academy of Sciences, 109(1), 238-242.
Clark, T. D., Jeffries, K. M., Hinch, S. G., & Farrell, A. P. (2011). Exceptional
aerobic scope and cardiovascular performance of pink salmon (Oncorhynchus
gorbuscha) may underlie resilience in a warming climate. Journal of
Experimental Biology, 214(18), 3074-3081.
Clarkson, B. R., Sorrell, B. K., Reeves, P. N., Champion, P. D., Partridge, T. R., &
Clarkson, B. D. (2003). Handbook for monitoring wetland
condition. Coordinated monitoring of New Zealand wetlands. A Ministry for
the Environment SMF funded project. Ministry for the Environment,
Wellington.
Clements, S. P., & Hicks, B. J. (2002). The effect of a trapping procedure on the stress
response of wild rainbow trout. North American Journal of Fisheries
Management, 22(3), 907-916.
Coates, D. (1991). Recommendations regarding fish species suitable for
stocking tributary river/streams (cold waters) and responses from the advisory
group inline with the code of practice regarding species introductions.
Recommendation 5: the introduction of Schizothorax richardsonii (Gray).
Recommendation 6: the introduction of Tor putitora (Hamilton).-
Recommendation 7: the introduction of Acrossocheilus hexagonolepis
(McClelland). Recommendation 8: the introduction of Labeo dero (Hamilton).
FAO/PNG/85/001, Field Document No. 16.
References
Page 181
Colgan, P. (1993). The motivational basis of fish behaviour. In: Pitcher, T.J. (Ed.),
Behaviour of Teleost Fishes. 2nd
edition. Chapman and Hall, London, pp.
31–56.
Consten, D., Lambert, J. G., Komen, H., & Goos, H. J. T. (2002). Corticosteroids
Affect the Testicular Androgen Production in Male Common Carp (Cyprinus
carpio L.) 1. Biology of Reproduction, 66(1), 106-111.
Coulibaly, A., Ouattara, I. N., Koné, T., N'Douba, V., Snoeks, J., Bi, G. G., &
Kouamélan, E. P. (2007). First results of floating cage culture of the African
catfish Heterobranchus longifilis Valenciennes, 1840: Effect of stocking
density on survival and growth rates. Aquaculture, 263(1), 61-67.
Craig, P. M., Al-Timimi, H., & Bernier, N. J. (2005). Differential increase in
forebrain and caudal neurosecretory system corticotropin-releasing factor and
urotensin I gene expression associated with seawater transfer in rainbow
trout. Endocrinology, 146(9), 3851-3860.
Cyr, N. E., & Romero, L. M. (2009). Identifying hormonal habituation in field studies
of stress. General and comparative endocrinology, 161(3), 295-303.
Daniels, H. V., & Watanabe, W. O. (2011). Practical flatfish culture and stock
enhancement (Eds). John Wiley & Sons.
D'Anna, G., Giacalone, V. M., Fernández, T. V., Vaccaro, A. M., Pipitone, C., Mirto,
S., & Badalamenti, F. (2012). Effects of predator and shelter conditioning on
hatchery-reared white seabream Diplodus sargus (L.,1758) released at
sea. Aquaculture, 356, 91-97.
Davis, E. P., Townsend, E. L., Gunnar, M. R., Guiang, S. F., Lussky, R. C., Cifuentes,
R. F. (2006). Antenatal beta methasone treatment has a persisting influence
on infant HPA axis regulation. Journal of Perinatology, 26(3), 147–153.
References
Page 182
Dawkins, M. S. (2006). A user's guide to animal welfare science. Trends in Ecology
& Evolution, 21(2), 77-82.
De Silva, S. S., Ingram, B., Sungan, S., Tinggi, D., Gooley, G., & Sim, S. Y. (2004).
Artificial propagation of the indigenous Tor species, empurau (T. tambroides)
and semah (T. douronensis), Sarawak, East Malaysia. Aquaculture Asia, 9(4),
15-20.
Desai, V. (2003). Synopsis of biological data on the tor mahseer Tor tor (Hamilton,
1822): Food & Agriculture Org.
DiBattista, J. D., Anisman, H., Whitehead, M., & Gilmour, K. M. (2005). The effects
of cortisol administration on social status and brain monoaminergic activity in
rainbow trout Oncorhynchus mykiss. Journal of Experimental
Biology, 208(14), 2707-2718.
Dinan, T. G. (1996). Serotonin and the regulation of hypothalamic-pituitary-adrenal
axis function. Life sciences, 58(20), 1683-1694.
Dinesh, K., Nandeesha, M. C., Nautiyal, P., & Aiyappa, P. (2010). Mahseers in India:
A review with focus on conservation and management. Indian Journal of
Animal Sciences (India).
Domagała, J., Czerniawski, R., & Pilecka-Rapacz, M. (2015). Which parameters–
rates of survival or growth–determine the best moment for stocking trout
larvae?. Archives of Polish Fisheries, 23(4), 217-222.
Doyle, R.W., Perez-Enriquez, R., Takagi, M., & Taniguchi, M. (2001). Selective
recovery of founder genetic diversity in aquacultural broodstocks and
captive, endangered fish population. Genetica, 111, 291–304.
Doyon, C., Leclair, J., Trudeau, V. L., & Moon, T. W. (2006). Corticotropin-releasing
factor and neuropeptide Y mRNA levels are modified by glucocorticoids in
References
Page 183
rainbow trout, Oncorhynchus mykiss. General and comparative
endocrinology, 146(2), 126-135.
Dudgeon, D. (2012). Threats to freshwater biodiversity globally and in the Indo-
Burma Biodiversity Hotspot. The Status and Distribution of Freshwater
Biodiversity in Indo-Burma, 1-28.
Dugatkin, L. A., & Alfieri, M. S. (2003). Boldness, behavioral inhibition and
learning. Ethology Ecology & Evolution, 15(1), 43-49.
Dunn, A. J., Swiergiel, A. H., & Palamarchouk, V. (2004). Brain circuits involved in
corticotropin‐releasing factor-norepinephrine interactions during stress. Annals
of the New York Academy of Sciences, 1018(1), 25-34.
Ebner, B. C., Thiem, J. D., & Lintermans, M. (2007). Fate of 2 year-old, hatchery‐
reared trout cod Maccullochella macquariensis (Percichthyidae) stocked into
two upland rivers. Journal of Fish Biology, 71(1), 182-199.
Ebner, B., Thiem, J., Lintermans, M., & Gilligan, D. (2006). An ecological approach
to re-establishing Australian freshwater cod populations: an application to
trout cod in the Murrumbidgee catchment. Parks, Conservation and Lands:
Canberra.
Einum, S., & Fleming, I. (2001). Implications of stocking: ecological interactions
between wild and released salmonids. Nordic Journal of Freshwater
Research, 75, 56-70.
El Balaa, R., & Blouin-Demers, G. (2011). Anti‐predatory behaviour of wild‐caught
vs captive‐bred freshwater angelfish, Pterophyllum scalare. Journal of
Applied Ichthyology, 27(4), 1052-1056.
Ellis, J. R. (2004). The occurrence of thresher shark off the Suffolk coast. Transaction
of the Suffolk Naturalists society, 40, 73-80.

References
Page 184
Ellis, T., Bagwell, N., Pond, M., Baynes, S., & Scott, A. P. (2007). Acute viral and
bacterial infections elevate water cortisol concentrations in fish
tanks. Aquaculture, 272(1), 707-716.
Ellis, T., James, J. D., Stewart, C., & Scott, A. P. (2004). A non‐invasive stress assay
based upon measurement of free cortisol released into the water by rainbow
trout. Journal of Fish Biology, 65(5), 1233-1252.
Ellis, T., North, B., Scott, A.P., Bromage, N.R., Porter, M., & Gadd, D. (2002). The
relationships between stocking density and welfare in farmed rainbow trout.
Journal of Fish Biology, 61, 493–531.
Epp, K. J., & Gabor, C. R. (2008). Innate and learned predator recognition mediated
by chemical signals in Eurycea nana. Ethology, 114(6), 607-615.
Ericsson, M., Fallahsharoudi, A., Bergquist, J., Kushnir, M. M., & Jensen, P. (2014).
Domestication effects on behavioural and hormonal responses to acute stress
in chickens. Physiology & behavior, 133, 161-169.
Everard, M., & Kataria, G. (2011). Recreational angling markets to advance the
conservation of a reach of the Western Ramganga River, India. Aquatic
Conservation: Marine and Freshwater Ecosystems, 21(1), 101-108.
Fallahsharoudi, A., de Kock, N., Johnsson, M., Ubhayasekera, S. K. A., Bergquist, J.,
Wright, D., & Jensen, P. (2015). Domestication effects on stress induced
steroid secretion and adrenal gene expression in chickens. Scientific reports, 5.
Fast, M. D., Hosoya, S., Johnson, S. C., & Afonso, L. O. B. (2008). Cortisol response
and immune-related effects of Atlantic salmon (Salmo salar Linnaeus)
subjected to short and long-term stress. Fish Shellfish Immunol, 24, 194-204.
Fevolden, S. E., & Røed, K. H. (1993). Cortisol and immune characteristics in
rainbow trout (Oncorhynchus mykiss) selected for high or low tolerance to
stress. Journal of Fish Biology, 43(6), 919-930.
References
Page 185
Fevolden, S. E., Røed, K. H., Fjalestad, K. T., & Stien, J. (1999). Poststress levels of
lysozyme and cortisol in adult rainbow trout: heritabilities and genetic
correlations. Journal of Fish Biology, 54(4), 900-910.
Fevolden, S.E., Reftsie, T., & Røed, K.H. (1991). Selection for high and low cortisol
stress response in Atlantic salmon (Salmo salar) and rainbow trout
(Oncorhynchus mykiss). Aquaculture, 95, 53-65.
Finstad, A.G., Einum, S., Forseth, T., & Ugedal, O. (2007). Shelter availability affects
behaviour, size-dependent and mean growth of juvenile Atlantic salmon.
Freshwater Biology, 52, 1710–1718.
Fitzpatrick, M. S. (2012). Effects of stress on fish reproduction, gamete quality, and
progeny. Reproductive Biotechnology in Finfish Aquaculture, 3.
Fleming, I. A., & Einum, S. (1997). Experimental tests of genetic divergence of
farmed from wild Atlantic salmon due to domestication. ICES Journal of
Marine Science: Journal du Conseil, 54(6), 1051-1063.
Flik, G., Klaren, P. H., Van den Burg, E. H., Metz, J. R., & Huising, M. O. (2006).
CRF and stress in fish. General and comparative Endocrinology, 146(1), 36-
44.
Flodmark, L. E. W., Urke, H. A., Halleraker, J. H., Arnekleiv, J. V., Vøllestad, L. A.,
& Poléo, A. B. S. (2002). Cortisol and glucose responses in juvenile brown
trout subjected to a fluctuating flow regime in an artificial stream. Journal of
Fish Biology, 60(1), 238-248.
Fox, C., Merali, Z., & Harrison, C. (2006). Therapeutic and protective effect of
environmental enrichment against psychogenic and neurogenic
stress. Behavioural brain research, 175(1), 1-8.
References
Page 186
Frankham, R. H., Hemmer, O. A., Ryder, E. G., Cothran, M. E., Soulé, N. D.,
Murray., & Snyder, M. (1986). Selection in captive environments. Zoo
Biology, 5, 127-138.
Fridell, F., Gadan, K., Sundh, H., Taranger, G. L., Glette, J., Olsen, R. E., ... &
Evensen, Ø. (2007). Effect of hyperoxygenation and low water flow on the
primary stress response and susceptibility of Atlantic salmon Salmo salar L. to
experimental challenge with IPN virus. Aquaculture, 270(1), 23-35.
Froese, R., & Pauly, D. (2000). FishBase 99. ICLARM, Los Banos, Laguna,
Philippines. World Wide Web electronic publication. http://www. Fish base.
org, 20.
Frost, A. J., Winrow-Giffen, A., Ashley, P. J., & Sneddon, L. U. (2007). Plasticity in
animal personality traits: does prior experience alter the degree of boldness?
Proceedings of the Royal Society of London B: Biological Sciences,
274(1608), 333-339.
Fuiman, L. A., Meekan, M. G., & McCormick, M. I. (2010). Maladaptive behavior
reinforces a recruitment bottleneck in newly settled fishes. Oecologia, 164(1),
99-108.
Galef, B. G., & Laland, K. N. (2005). Social learning in animals: empirical studies
and theoretical models. Bioscience, 55(6), 489-499.
Galhardo, L., & Oliveira, R. F. (2009). Psychological stress and welfare in
fish. Annual Review of Biomedical Sciences, 1-20.
Garlock, T. M., Monk, C. T., Lorenzen, K., Matthews, M. D., & St Mary, C. M.
(2014). Effects of hatchery rearing on Florida largemouth bass Micropterus
floridanus resource allocation and performance under semi‐natural
conditions. Journal of fish biology, 85(6), 1830-1842.
References
Page 187
Gerber, B., Stamer, A., & Stadtlander, T. (2015). Environmental Enrichment and its
effects on Welfare in fish.
Gesto, M., Castro, L. F. C., & Santos, M. M. (2013). Differences in retinoid levels
and metabolism among gastropod lineages: Imposex-susceptible gastropods
lack the ability to store retinoids in the form of retinyl esters. Aquatic
toxicology, 142, 96-103.
Gesto, M., Marcos A., López-Patiño., Juan Hernández., José L., Soengas., Jesús M.,
& Míguez. (2013). The response of brain serotonergic and dopaminergic
systems to an acute stressor in rainbow trout: a time course study. Journal of
Experimental Biology, 216, 4435-4442.
Gesto, M., Otero-Rodiño, C., López-Patiño, M. A., Míguez, J. M., Soengas, J. L., &
Conde-Sieira, M. (2014). Is plasma cortisol response to stress in rainbow trout
regulated by catecholamine-induced hyperglycemia?General and comparative
endocrinology, 205, 207-217.
Gesto, M., Soengas, J. L., & Míguez, J. M. (2008). Acute and prolonged stress
responses of brain monoaminergic activity and plasma cortisol levels in
rainbow trout are modified by PAHs (naphthalene, β-naphthoflavone and
benzo (a) pyrene) treatment. Aquatic Toxicology, 86(3), 341-351.
Gesto, M., Tintos, A., Soengas, J. L., & Míguez, J. M. (2009). β-Naphthoflavone and
benzo (a) pyrene alter dopaminergic, noradrenergic, and serotonergic systems
in brain and pituitary of rainbow trout (Oncorhynchus mykiss). Ecotoxicology
and environmental safety, 72(1), 191-198.
Gillen, A. L., Stein, R. A., & Carline, R. F. (1981). Predation by pellet-reared tiger
muskellunge on minnows and bluegills in experimental systems. Transactions
of the American Fisheries Society, 110(2), 197-209.
Godin, J. G. J. (1997). Evading predators. Behavioural ecology of teleost fishes, 191-
236.
References
Page 188
Gozlan, R. E., St-Hilaire, S., Feist, S. W., Martin, P., & Kent, M. L. (2005).
Biodiversity: disease threat to European fish. Nature, 435(7045), 1046-1046.
Gray, R., (2013). The Telegraph, 30 July 2011; http:// www.telegraph.co.uk/
earth/wildlife/8672417/Third of freshwater-fish-threatened-with extinction.
html. (accessed 10 February 2013).
Griffin, A. S., Evans, C. S., & Blumstein, D. T. (2001). Learning specificity in
acquired predator recognition. Animal Behaviour, 62(3), 577-589.
Grumbine, R. E., & Pandit, M. K. (2013). Threats from India's Himalaya
dams. Science, 339(6115), 36-37.
Gupta, N., Sivakumar, K., Mathur, V. B., & Chadwick, M. A. (2014). The ‘tiger of
Indian rivers’: stakeholders' perspectives on the golden mahseer as a flagship
fish species. Area, 46(4), 389-397.
Gupta, N., Sivakumar, K., Mathur, V. B., & Chadwick, M. A. (2015). Terrestrial
protected areas and managed reaches conserve threatened freshwater fish in
Uttarakhand, India. PARKS, 21(1), 89-101.
Haase, E., & R. S. Donham. (1980). Hormones and domestication. Pp. 549-565 in
Avian endocrinology (A. Epple and M. H. Stetson, Eds.). New York, Academic
Press.
Hagan, D. M., & Brooks, A. N. (1996). Dopaminergic regulation of
adrenocorticotrophic hormone, α-melanocyte-stimulating hormone and
cortisol secretion in the ovine fetus. Journal of endocrinology, 151(3), 439-
447.
Harris, J. & D. J. Bird. 2000. Modulation of the fish immune system by hormones.
Vet. Immunol. Immunopathol, 77, 163–176.
References
Page 189
Heath, D. D., Bernier, N. J., Heath, J. W., & Iwama, G. K. (1993). Genetic,
environmental, and interaction effects on growth and stress response of
chinook salmon (Oncorhynchus tshawytscha) fry. Canadian Journal of
Fisheries and Aquatic Sciences, 50(2), 435-442.
Heisler, L. K., Pronchuk, N., Nonogaki, K., Zhou, L., Raber, J., Tung, L., ... & Tecott,
L. H. (2007). Serotonin activates the hypothalamic–pituitary–adrenal axis via
serotonin 2C receptor stimulation. Journal of Neuroscience, 27(26), 6956-
6964.
Herman, J. P., & Cullinan, W. E. (1997). Neurocircuitry of stress: central control of
the hypothalamo–pituitary–adrenocortical axis. Trends in neuro
sciences, 20(2), 78-84.
Hinkelmann, K. K. (1994). Design and analysis of experiments. V. 1. Introduction to
experimental design: John Wiley and Sons.
Hoftyzer, E., Ackerman, J. D., Morris, T. J., & Mackie, G. L. (2008). Genetic and
environmental implications of reintroducing laboratory-raised unionid mussels
to the wild. Canadian Journal of Fisheries and Aquatic Sciences, 65(6), 1217-
1229.
Hoglund, E., Balm, P. H., & Winberg, S. (2000). Skin darkening, a potential social
signal in subordinate arctic charr (Salvelinus alpinus): the regulatory role of
brain monoamines and pro-opiomelanocortin-derived peptides. Journal of
Experimental Biology, 203(11), 1711-1721.
Höglund, E., Balm, P. H., & Winberg, S. (2002). Behavioural and neuroendocrine
effects of environmental background colour and social interaction in Arctic
charr (Salvelinus alpinus). Journal of Experimental Biology, 205(16), 2535-
2543.
Höglund, E., Kolm, N., & Winberg, S. (2001). Stress-induced changes in brain
serotonergic activity, plasma cortisol and aggressive behavior in Arctic charr
References
Page 190
(Salvelinus alpinus) is counteracted by L-DOPA. Physiology &
behavior, 74(3), 381-389.
Höglund, E., Weltzien, F. A., Schjolden, J., Winberg, S., Ursin, H., & Døving, K. B.
(2005). Avoidance behavior and brain monoamines in fish. Brain
research, 1032(1), 104-110.
Howell, B. R. (1994). Fitness of hatchery-reared fish for survival in the
sea. Aquaculture Research [AQUACULT. FISH. MANAGE.]. 1994.
Hughes, R. N. (1997). Diet selection. In ‘Behavioural Ecology of Teleost Fishes’.
(Ed. JG. J. Godin) pp. 134–162.
Hughes, R. N. (Ed.). (2013). Behavioural mechanisms of food selection (Vol. 20).
Springer Science & Business Media.
Huntingford, F. A. (2004). Implications of domestication and rearing conditions for
the behaviour of cultivated fishes. Journal of Fish Biology, 65(s1), 122-142.
Huntingford, F. A., Andrew, G., Mackenzie, S., Morera, D., Coyle, S. M., Pilarczyk,
M., & Kadri, S. (2010). Coping strategies in a strongly schooling fish, the
common carp Cyprinus carpio. Journal of Fish Biology, 76, 1576–1591.
Hussain, M. G., & Hossain, M. A. (1999). Controlled breeding technology and step
for conservation of gene pool of certain endangered fish species of
Bangladesh. Fisheries Newsletter, 7(1-3), 2-3.
Hussain, M. G., & Mazid, M. A. (2001). Genetic improvement and conservation of
carp species in Bangladesh. Mymensingh: Bangladesh Fisheries Research
Institute.
Hutchison, M. J., Gallagher, T., Chilcott, K., Simpson, R., Aland, G., & Sellin, M.
(2006). Impoundment stocking strategies for Australian native fishes in
eastern and northern Australia: With an assessment of the value of scales as
References
Page 191
tags for stocked barramundi, Final report to Fisheries Research and
Development Corporation (project No. 98/221), Department of Primary
Industries and Fisheries, Southern Fisheries Centre.
Hyvärinen, P., & Rodewald, P. (2013). Enriched rearing improves survival of
hatchery-reared Atlantic salmon smolts during migration in the River
Tornionjoki. Canadian Journal of Fisheries and Aquatic Sciences, 70(9),
1386-1395.
Inoue, L. A. K. A., MorAes, G., Iwama, G. K., & Afonso, L. O. B. (2008).
Physiological stress responses in the warm-water fish matrinxã (Brycon
amazonicus) subjected to a sudden cold shock. Acta amazonica, 38(4), 603-
609.
Iqbal, Z., Minhas, I. K., & Khan, M. N. (2001). Seasonal occurrence of lernaeasis in
pond aquaculture in Punjab. Proc. of 21st Pakistan Cong. Zool, 21, 159-168.
Islam, K. M. S. (2002). Feasibility of duckweed as poultry feed: A review. Indian
journal of animal sciences, 72(6), 486-491.
Islam, M. S. (2002). Evaluation of supplementary feeds for semi-intensive pond
culture of mahseer, Tor putitora (Hamilton). Aquaculture, 212(1), 263-276.
IUCN. (2015). The IUCN Red List of Threatened Species.
IUCN. (2016). The IUCN Red List of Threatened Species. Version 2016-3.
Iwama, G.K. (2006). Afonso LOB, Vijayan MM. Stress in fishes pp 319 In: Evans
DH, Claiborne JB (eds) The physiology of fishes. CRC Press Taylor and
Francis, Boca Raton. Florida; pp 601.
Jensen, P., & Andersson, L. (2005). Genomics meets ethology: a new route to
understanding domestication, behavior, and sustainability in animal breeding.
Ambio, 34, 320–324.
References
Page 192
Jentoft, S., Aastveit, A. H., Torjesen, P. A., & Andersen, Ø. (2005). Effects of stress
on growth, cortisol and glucose levels in non-domesticated Eurasian perch
(Perca fluviatilis) and domesticated rainbow trout (Oncorhynchus
mykiss). Comparative Biochemistry and Physiology Part A: Molecular &
Integrative Physiology, 141(3), 353-358.
Jepsen, N., Pedersen, S., & Thorstad, E. (2000). Behavioural interactions between
prey (trout smolts) and predators (pike and pikeperch) in an impounded
river. Regulated Rivers Research & Management, 16(2), 189-198.
Jiang, S. (2010). Aquaculture, capture fisheries, and wild fish stocks. Resource and
Energy Economics, 32(1), 65-77.
Johnsingh, A. J. T., Negi, A. S., & Mohan, D. (2006). Golden mahseer conservation
in Uttaranchal. Cheetal, 43, 9-17.
Johnson, J. E., & Jensen, B. L. (1991). Hatcheries for endangered freshwater
fishes. Battle against extinction: native fish management in the American
West. University of Arizona Press, Tucson, 199-217.
Johnsson, J. I., Brockmark, S., & Näslund, J. (2014). Environmental effects on
behavioural development consequences for fitness of captive‐reared fishes in
the wild. Journal of fish biology, 85(6), 1946-1971.
Johnsson, J. I., Petersson, E., Jönsson, E., Björnsson, B. T., & Järvi, T. (1996).
Domestication and growth hormone alter antipredator behaviour and growth
patterns in juvenile brown trout, Salmo trutta. Canadian Journal of Fisheries
and Aquatic Sciences, 53(7), 1546-1554.
Jonsson, B. (1997). A review of ecological and behavioural interactions between
cultured and wild Atlantic salmon. ICES Journal of Marine Science: Journal
du Conseil, 54(6), 1031-1039.
References
Page 193
Jonsson, B., & Jonsson, N. (2006). Cultured Atlantic salmon in nature: a review of
their ecology and interaction with wild fish. ICES Journal of Marine
Science, 63, 1162-1181.
Jule, K. R., Leaver, L. A., & Lea, S. E. (2008). The effects of captive experience on
reintroduction survival in carnivores: a review and analysis. Biological
conservation, 141(2), 355-363.
Kaiser, H., Weyl, O., & Hecht, T. (1995). The effect of stocking density on growth,
survival and agonistic behaviour of African catfish. Aquaculture
International, 3(3), 217-225.
Kallio-Nyberg, I., Saloniemi, I., Jutila, E., & Jokikokko, E. (2011). Effect of hatchery
rearing and environmental factors on the survival, growth and migration of
Atlantic salmon in the Baltic Sea. Fisheries Research, 109(2), 285-294.
Karakatsouli, N., Papoutsoglou, S. E., Pizzonia, G., Tsatsos, G., Tsopelakos, A.,
Chadio, S., & Papadopoulou-Daifoti, Z. (2007). Effects of light spectrum on
growth and physiological status of gilthead seabream Sparus aurata and
rainbow trout Oncorhynchus mykiss reared under recirculating system
conditions. Aquacultural Engineering, 36(3), 302-309.
Kekäläinen, J., Niva, T., & Huuskonen, H. (2008). Pike predation on hatchery‐reared
Atlantic salmon smolts in a northern Baltic river. Ecology of Freshwater
Fish, 17(1), 100-109.
Kelley, J. L., & Magurran, A, E. (2003) Learned predator recognition and antipredator
responses in fishes. Fish, 4, 216–226.
Kelley, J. L., & Magurran, A. E. (2003). Effects of relaxed predation pressure on
visual predator recognition in the guppy. Behavioral Ecology and
Sociobiology, 54(3), 225-232.
References
Page 194
Kelley, J. L., Magurran, A. E., & Macı́as-Garcia, C. (2005). The influence of rearing
experience on the behaviour of an endangered Mexican fish, Skiffia
multipunctata. Biological Conservation, 122(2), 223-230.
Kelley, J., & Brown, C., (2010). Predation risk and decision-making in poeciliid prey.
In: Evans, J., Pilastro, A., Schlupp, I. (Eds.), Ecology and Evolution of
Peociliid Fishes. University of Chicago Press, Chicago.
Kelley, J., Barber, D., Belknap, D., FitzGerald, S., Heteren, V., & Dickson, S. (2005).
Sand budgets at geological, historical, and contemporary time scales for a
developed beach system, Saco Bay, Maine, USA. Marine Geology, 214, 117–
142.
Kelley, K. M., Price, T. D., Galima, M. M., Sak, K., Reyes, J. A., Zepeda, O.,
Hagstrom, R., Tuan, A., Truong, T. A., & Lowe, C. G. (2006). Insulin-like
growth factor binding proteins (IGFBPs) in fish: beacons for (disrupted)
growth endocrine physiology. In Fish Endocrinology (Reinecke, M., Zaccone,
G. & Kapoor, B. G., eds), pp. 167–195.
Khajuria, B., Langer, S., & Tripathi, N. K. (2013). Status of Golden mahseer (Tor
putitora) in Jammu region (J&K). Int J Rec Sci Res, 4, 1154-1156.
Khajuria. K., & Langer, S. (2016) Distribution record on abundance of Tor putitora in
Jammu waters. International Journal of Fisheries and Aquatic Studies 4(1):
341-347.
Khan, M. A., & Sinha, M. (2000). Status of mahseer fisheries in north and north-
eastern india with a note on their conservation. Journal of the Inland Fisheries
Society of India, 32(1), 28-36.
Kieffer, J. D., & Colgan, P. W. (1991). Individual variation in learning by foraging
pumpkinseed sunfish, Lepomis gibbosus: the influence of habitat. Animal
Behaviour, 41(4), 603-611.
References
Page 195
Kieffer, J. D., & Colgan, P. W. (1992). The role of learning in fish behaviour. Reviews
in Fish Biology and Fisheries, 2(2), 125-143.
Kihslinger, R. L., & Nevitt, G. A. (2006). Early rearing environment impacts
cerebellar growth in juvenile salmon. Journal of Experimental
Biology, 209(3), 504-509.
Killen, S. S., Marras, S., & McKenzie, D. J. (2011). Fuel, fasting, fear: routine
metabolic rate and food deprivation exert synergistic effects on risk‐taking in
individual juvenile European sea bass. Journal of Animal Ecology, 80(5),
1024-1033.
King, W., & Berlinsky, D. L. (2006). Whole‐body corticosteroid and plasma cortisol
concentrations in larval and juvenile Atlantic cod Gadus morhua L. following
acute stress. Aquaculture Research, 37(13), 1282-1289.
Kistler, C., Hegglin, D., Würbel, H., & König, B. (2011). Preference for structured
environment in zebrafish (Danio rerio) and checker barbs (Puntius oligolepis).
Applied Animal Behaviour Science, 135(4), 318-327.
Koolhaas, J. M., de Boer, S. F., Buwalda, B., & Van-Reenen, K. (2007). Individual
variation in coping with stress: A multidimensional approach of ultimate
and proximate mechanisms. Brain Behav Evol, 70, 218-226.
Kotrschal, A., & Taborsky, B. (2010). Environmental change enhances cognitive
abilities in fish. PLoS Biol, 8(4), e1000351.
Kotrschal, A., Lievens, E. J., Dahlbom, J., Bundsen, A., Semenova, S., Sundvik, M.,
& Kolm, N. (2014). Artificial selection on relative brain size reveals a positive
genetic correlation between brain size and proactive personality in the guppy.
Evolution, 68(4), 1139-1149.
References
Page 196
Künzl, C., Kaiser, S., Meier, E., & Sachser, N. (2003). Is a wild mammal kept and
reared in captivity still a wild animal?. Hormones and Behavior, 43(1), 187-
196.
Ladewig, J. (2000). Chronic intermittent stress: a model for the study of long-term
stressors. The biology of animal stress, 159-169.
Laidley, C.W., & Leatherland, J.F. (1988). Cohort sampling, anaesthesia and stocking
density effects on plasma cortisol, thyroid hormone, metabolite and ion levels
in rainbow trout, Salmo gairdneri Richardson. Journal of Fish Biology, 33,
73–88.
Lakra, W. S., Goswami, M., & Sarkar, U. K. (2010). Conservation biology of Indian
mahseers. Indian Journal of Animal Sciences (India).
Larscheid, J. G. (1995). Development of an optimal stocking regime for walleyes in
East Okoboji Lake, Iowa. American Fisheries Society Symposium, 15, 472-
483.
Larson, E. T., Norris, D. O., & Summers, C. H. (2003). Monoaminergic changes
associated with socially induced sex reversal in the saddleback
wrasse. Neuroscience, 119(1), 251-263.
Larson, G., & Fuller, D. Q. (2014). The evolution of animal domestication. Annual
Review of Ecology, Evolution, and Systematics, 45, 115-136.
Laskar, B. A., Bhattacharjee, M. J., Dhar, B., Mahadani, P., Kundu, S., & Ghosh, S.
K. (2013). The species dilemma of northeast Indian mahseer (Actinopterygii:
Cyprinidae): DNA barcoding in clarifying the riddle. PloS one, 8(1), e53704.
Latremouille, D.N. (2003). Fin erosion in aquaculture and natural environments.
Reviews in Fisheries Science, 11, 315–335.
References
Page 197
Laursen, D. C., Andersson, M. Å., Silva, P. I. M., Petersson, E., & Höglund, E.
(2013). Utilising spatial distribution in two-tank systems to investigate the
level of aversiveness to crowding in farmed rainbow trout Oncorhynchus
mykiss. Applied Animal Behaviour Science, 144(3), 163-170.
Le Vay, L., Carvalho, G. R., Quinitio, E. T., Lebata, J. H., Ut, V. N., & Fushimi, H.
(2007). Quality of hatchery-reared juveniles for marine fisheries stock
enhancement. Aquaculture, 268(1), 169-180.
Leal, E., Fernández-Durán, B., Guillot, R., Ríos, D., & Cerdá-Reverter, J. M. (2011).
Stress-induced effects on feeding behavior and growth performance of the sea
bass (Dicentrarchus labrax): a self-feeding approach. Journal of Comparative
Physiology B, 181(8), 1035-1044.
Leber, K. M. (2013). Marine Fisheries marine fisheries Enhancement marine fisheries
enhancement, Coming of Age in the New Millennium. In Sustainable food
production (pp. 1139-1157). Springer New York.
Lee, J. S. F., & Berejikian, B. A. (2008). Effects of the rearing environment on
average behaviour and behavioural variation in steelhead. Journal of Fish
Biology, 72(7), 1736-1749.
Leibowitz, S. F., & Alexander, J. T. (1998). Hypothalamic serotonin in control of
eating behavior, meal size, and body weight. Biological psychiatry, 44(9),
851-864.
Lepage, O., Larson, E. T., Mayer, I., & Winberg, S. (2005). Serotonin, but not
melatonin, plays a role in shaping dominant–subordinate relationships and
aggression in rainbow trout. Hormones and behavior, 48(2), 233-242.
Lepage, O., Overli, O., Petersson, E., Jarvi, T., & Winberg, S. (2000). Differential
stress coping in wild and domesticated sea trout. Brain Behavior and
Evolution, 56(5), 259-268.

References
Page 198
Lepage, O., Øverli, Ø., Petersson, E., Järvi, T., & Winberg, S. (2001). Differential
stress coping in wild and domesticated sea trout. Brain, Behavior and
Evolution, 56(5), 259-268.
Liedtke, J., Redekop, D., Schneider, J. M., & Schuett, W. (2015). Early environmental
conditions shape personality types in a jumping spider. Frontiers in Ecology
and Evolution, 3, 134.
Lintermans, M., & Ebner, B. (2006). Background to the Australian freshwater cod’, In
An ecological approach to re-establishing Australian freshwater cod
populations: an application to trout cod in the Murrumbidgee catchment,
(Ebner, B, Thiem, J, Lintermans, M & Gilligan, D eds.) pp 5-14, Final
report to Fisheries Research and Development Corporation (project No.
2003/034), Canberra Parks, Conservation and Lands.
López, P., Hawlena, D., Polo, V., Amo, L., & Martín, J. (2005). Sources of individual
shy–bold variations in antipredator behaviour of male Iberian rock
lizards. Animal Behaviour, 69(1), 1-9.
Lorenzen, K., 2005. Population dynamics and potential of fisheries stock
enhancement: practical theory for assessment and policy
analysis. Philosophical Transactions of the Royal Society of London B: Biol.
Sci. 360. 171-189.
Lorenzen, K., Leber, K. M., & Blankenship, H. L. (2010). Responsible approach to
marine stock enhancement: an update. Reviews in Fisheries Science, 18(2),
189-210.
Losey, G. (1995). Behaviour of teleost fishes: Edited by TJ Pitcher. London:
Chapman & Hall (1993). Pp. xviii+ 715. paperback: Academic Press.
Lowe, T. E., Ryder, J. M., Carragher, J. F., & Wells, R. M. G. (1993). Flesh quality in
snapper, Pagrcrs auratus, affected by capture stress. Journal of Food
Science, 58(4), 770-773.
References
Page 199
Lowry, C. A., & Moore, F. L. (2006). Regulation of behavioral responses by
corticotropin-releasing factor. General and comparative endocrinology,
146(1), 19-27.
Lydia-du, T., Nigel, C., Bennett., Nickless, A., & Whiting, M. J. (2012). Influence of
spatial environment on maze learning in an African mole-rat. Animal
Cognition, 15(5), 797-806.
Magnhagen, C., Braithwaite, V. A., Forsgren, E., & Kapoor, B. G. (2008). Fish
behaviour. Enfield, NH: Science Publishers.
Mahanta, P. (1998). Induced spawning of the endangered golden mahseer, Tor
putitora, with ovaprim at the state fish farm near Dehradun. Indian J.
Fish, 45(4), 457-459.
Mahata, S. C., Hussain, M. G., & Mazid, M. A. (1995). Successful spawning of pond
reared mahseer Tor putitora for the first time in Bangladesh. Bangladesh J.
Environ. Sci, 1, 74-81.
Malavasi, S., Fiorin, R., Franco, A., Franzoi, P., Granzotto, A., Riccato, F., &
Mainardi, D. (2004). Fish assemblages of Venice Lagoon shallow waters: an
analysis based on species, families and functional guilds. Journal of Marine
Systems, 51(1), 19-31.
Malavasi, S., Georgalas, V., Lugli, M., Torricelli, P., & Mainardi, D. (2004).
Differences in the pattern of antipredator behaviour between hatchery‐reared
and wild European sea bass juveniles. Journal of Fish Biology, 65(s1), 143-
155.
Malik, D. S. (2011). Population dynamics and conservation management of
Himalayan mahseer (Tor species) in riverine aquatic ecosystem in Garhwal
region of Uttarakhand (India). J Appl Nat Sci, 3, 97-101.
References
Page 200
Martin, J. T. (1978). Embryonic pituitary adrenal axis, behavior development and
domestication in birds. American Zoologist, 18(3), 489-499.
Martínez-Porchas, M., Martínez-Córdova, L. R., & Ramos-Enriquez, R. (2009).
Cortisol and glucose: reliable indicators of fish stress. Pan-American Journal
of Aquatic Sciences, 4(2), 158-178.
Mathews, F., Orros, M., McLaren, G., Gelling, M., & Foster, R. (2005). Keeping fit
on the ark: assessing the suitability of captive-bred animals for
release. Biological Conservation, 121(4), 569-577.
Maximino, C., de Brito, T. M., da Silva Batista, A. W., Herculano, A. M., Morato, S.,
& Gouveia, A. (2010). Measuring anxiety in zebrafish: a critical
review. Behavioural brain research, 214(2), 157-171.
Maynard, D. J., McDowell, G. C., Tezak, E. P., & Flagg, T. A. (1996). Effect of diets
supplemented with live food on the foraging behavior of cultured fall chinook
salmon. The Progressive fish-culturist, 58(3), 187-191.
McNeil, W. J. (1991). Expansion of cultured Pacific salmon into marine
ecosystems. Aquaculture, 98(1-3), 173-183.
McPhee, M.E., (2003). Generations in captivity increases behavioral variance:
considerations for captive breeding and reintroduction programs. Biological
Conservation, 115, 71–77.
McQuaid, R. J., Audet, M. C., Jacobson-Pick, S., & Anisman, H. (2013). The
differential impact of social defeat on mice living in isolation or groups in an
enriched environment: plasma corticosterone and monoamine
variations. International Journal of Neuropsychopharmacology, 16(2), 351-
363.
References
Page 201
Menon, A. G. K. (1992). Taxonomy of mahseer fishes of the genus Tor Gray with
description of a new species from the Deccan. Journal of the Bombay Natural
History Society, 89(2), 210-228.
Mering, S., Kaliste-Korhonen, E., & Nevalainen, T. (2001). Estimates of appropriate
number of rats: interaction with housing environment. Laboratory
Animals, 35(1), 80-90.
Millidine, K., Armstrong, J., & Metcalfe, N. (2006). Presence of shelter reduces
maintenance metabolism of juvenile salmon. Functional Ecology, 20(5), 839-
845.
Millot, S., Bégout, M.-L., & Chatain, B. (2009). Exploration behaviour and flight
response toward a stimulus in three sea bass strains (Dicentrarchus labrax L.).
Applied Animal Behaviour Science, 119(1), 108-114.
Mirza, M. R., & Khan, M. S. (1994). A note on the fishes of the Badri Stream near
Swabi, Northwest Frontier Province, Pakistan. Pakistan Journal of
Zoology, 26, 361-361.
Mirza, M. R., Javed, M. N., & Tariq, M. (1994). A note on the fish fauna of the river
Zhob, Pakistan. Pakistan Journal of Zoology, 26, 189-189.
Mirza, R. S., & Chivers, D. P. (2000). Predator-recognition training enhances survival
of brook trout: evidence from laboratory and field-enclosure studies. Canadian
Journal of Zoology, 78(12), 2198-2208.
Moberg, O., Braithwaite, V. A., Jensen, K. H., & Salvanes, A. G. V. (2011). Effects
of habitat enrichment and food availability on the foraging behaviour of
juvenile Atlantic Cod (Gadus morhua L.). Environ. Biol. Fish, 91, 449-457.
Mohammed, A. H., Zhu, S. W., Darmopil, S., Hjerling-Leffler, J., Ernfors, P.,
Winblad, B., & Bogdanovic, N. (2002). Environmental enrichment and the
brain. Progress in brain research, 138, 109-134.
References
Page 202
Mohan, M. (2000). Pre-impoundment bio-ecological characteristics of River Gaula in
Kumaon Himalaya. Ph. D. thesis, Ch. Charan Singh University, Meerut.
Mohindra, V., Khare, P., Lal, K. K., Punia, P., Singh, R. K., Barman, A. S., & Lakra,
W. S. (2007). Molecular discrimination of five Mahseer species from Indian
peninsula using RAPD analysis. Acta Zool. Sin, 53(4), 725-732.
Mommsen, T. P., Vijayan, M. M., & Moon, T. W. (1999). Cortisol in teleosts:
dynamics, mechanisms of action, and metabolic regulation. Reviews in Fish
Biology and Fisheries, 9(3), 211-268.
Myers, R. A., Levin, S. A., Lande, R., James, F. C., Murdoch, W. W., & Paine, R. T.
(2004). Hatcheries and endangered salmon. Science, 303(5666), 1980-1980.
Naeem, M., Salam, A., Ashraf, M., Khalid, M., & Ishtiaq, A. (2011). External
morphometric study of hatchery reared mahseer (Tor putitora) in relation to
body size and condition factor. African Journal of Biotechnology, 10(36),
7071-7077.
Naka, F., Shiga, T., Yaguchi, M., & Okado, N. (2002). An enriched environment
increases noradrenaline concentration in the mouse brain. Brain
research, 924(1), 124-126.
Näslund, J., & Johnsson, J. I. (2014). Environmental enrichment for fish in captive
environments: effects of physical structures and substrates. Fish and Fisheries.
Näslund, J., Aarestrup, K., Thomassen, S. T., & Johnsson, J. I. (2012). Early
enrichment effects on brain development in hatchery-reared Atlantic salmon
(Salmo salar): no evidence for a critical period. Canadian Journal of Fisheries
and Aquatic Sciences, 69(9), 1481-1490.
Näslund, J., Rosengren, M., Del Villar, D., Gansel, L., Norrgård, J. R., Persson, L., &
Kvingedal, E. (2013). Hatchery tank enrichment affects cortisol levels and
References
Page 203
shelter-seeking in Atlantic salmon (Salmo salar). Canadian Journal of
Fisheries and Aquatic Sciences, 70(4), 585-590.
Nath, M., & Singh, J. (1994). A report on the decline of sport fish in the rivers and
streams of the hills of Uttar Pradesh with particular reference to the Doon
Valley region. Nature Conservators, Muzaffarnagar (India), 219-227.
Nautiyal, P. (1994). The endangered golden mahseer in Garhwal Himalaya: a decade
of retrospection. Nature Conservators, Muzaffarnagar (India), 191-196.
Nautiyal, P. (2011). The golden mahseer (a threatened fish of Himalaya).
Nautiyal, P. (2014). Review of the Art and Science of Indian Mahseer (Game Fish)
from Nineteenth to Twentieth Century: Road to Extinction or
Conservation?. Proceedings of the National Academy of Sciences, India
Section B: Biological Sciences, 84(2), 215-236.
Nautiyal, P., & Lal, M. S. (1984). Food and feeding habits of fingerlings and juveniles
of mahseer (Tor putitora Ham.) in Nayar River. Journal of the Bombay
Natural History Society. Bombay, 81(3), 642-647.
Nautiyal, P., Rizvi, A. F., & Dhasmanaa, P. (2008). Life History traits and decadal
trends in the growth parameters of Golden Mahseer, Tor putitora (Hamilton
1822) from the Himalayan stretch of the Ganga River System. Turk. J. Fish.
Aquat. Sci, 8, 125-132.
Nautiyal, P., Shivam, A., Verma, J., & Semwal, V. P. (2007). Bhgirathi River - An
endangered ecosystem. In: Proceeding of National Symposium on
Limnology (Eds. B. Venkataramani, V.D. Puranik, S.K. Apte, H.N. Gour,
S.K. Sharma, L.L. Sharma, V.S. Durve, H.C.L. Gupta, P.C. Verma and
B.K. Sharma). Department of Aquaculture College of Fisheries, Udaipur,
Rajasthan, February 19-21. pp. 164- 166.
References
Page 204
North, B. P., Turnbull, J. F., Ellis, T., Porter, M. J., Migaud, H., Bron, J., & Bromage,
N. R. (2006). The impact of stocking density on the welfare of rainbow trout
(Oncorhynchus mykiss). Aquaculture, 255(1), 466-479.
Ogale, S. N. (2002). Mahseer breeding and conservation and possibilities of
commercial culture. The Indian experience. FAO Fisheries Technical Paper,
193-212.
Oliver, M. D., Macdiarmid, A. B., Stewart, R. A., & Gardner, C. (2008). Anti-
predator behavior of captive-reared and wild juvenile spiny lobster (Jasus
edwardsii). Reviews in Fisheries Science, 16(1-3), 186-194.
Olla, B. L., & Davis, M. W. (1989). The role of learning and stress in predator
avoidance of hatchery-reared coho salmon (Oncorhynchus kisutch) juveniles.
Aquaculture, 76(3-4), 209-214.
Olla, B. L., Davis, M. W., & Ryer, C. H. (1994). Behavioural deficits in hatchery-
reared fish: potential effects on survival following release. Aquaculture
Research. Aquacult. Fish. Manage. 1994.
Olla, B. L., Davis, M. W., & Ryer, C. H. (1998). Understanding how the hatchery
environment represses or promotes the development of behavioral survival
skills. Bulletin of Marine Science, 62(2), 531-550.
Olsson, I. A. S., & Dahlborn, K. (2002). Improving housing conditions for laboratory
mice: a review of' environmental enrichment'. Laboratory animals, 36(3), 243-
270.
Orlov, A. V., Gerasimov, Y. V., & Lapshin, O. M. (2006). The feeding behaviour of
cultured and wild Atlantic salmon, Salmo salar L., in the Louvenga River,
Kola Peninsula, Russia. ICES Journal of Marine Science: Journal du Conseil,
63(7), 1297-1303.

References
Page 205
Øverli, Ø., Harris, C. A., & Winberg, S. (2000). Short-term effects of fights for social
dominance and the establishment of dominant-subordinate relationships on
brain monoamines and cortisol in rainbow trout. Brain, Behavior and
Evolution, 54(5), 263-275.
Øverli, Ø., Harris, C.A., & Winberg, S. (1999). Short-term effects of fights for social
dominance and the establishment of dominant-subordinate relationships on
brain monoamines and cortisol in rainbow trout. Brain Behavior and
Evolution, 54, 263–275.
Øverli, Ø., Kotzian, S., & Winberg, S. (2002). Effects of cortisol on aggression and
locomotor activity in rainbow trout. Hormones and Behavior, 42(1), 53-61.
Øverli, Ø., Pottinger, T. G., Carrick, T. R., Øverli, E., & Winberg, S. (2001). Brain
monoaminergic activity in rainbow trout selected for high and low stress
responsiveness. Brain, behavior and evolution, 57(4), 214-224.
Øverli, Ø., Sørensen, C., Pulman, K. G., Pottinger, T. G., Korzan, W., Summers, C.
H., & Nilsson, G. E. (2007). Evolutionary background for stress-coping styles:
relationships between physiological, behavioral, and cognitive traits in non-
mammalian vertebrates. Neuroscience & Biobehavioral Reviews, 31(3), 396-
412.
Øverli, Ø., Winberg, S., & Pottinger, T. G. (2005). Behavioral and neuroendocrine
correlates of selection for stress responsiveness in rainbow trout–a review.
Integrative and Comparative Biology, 45, 463–474.
Pandit, M. K., & Grumbine, R. E. (2012). Potential effects of ongoing and proposed,
hydropower development on terrestrial biological diversity in the Indian
Himalaya. Conserv Biol, 26, 1061–1071.
Pandit, M. K., Manish, K., & Koh, L. P. (2014). Dancing on the roof of the world:
ecological transformation of the Himalayan landscape. Bio Science, 64(11),
980-992.
References
Page 206
Pankhurst, N. W. (2011). The endocrinology of stress in fish: an environmental
perspective. General and comparative endocrinology, 170(2), 265-275.
Pankhurst, N. W., & Van Der Kraak, G. (1997). Effects of stress on reproduction and
growth of fish. Fish stress and health in aquaculture, 73-93.
Pankhurst, N.W., & Van Der Kraak, G. (2000). Evidence that acute stress inhibits
ovariansteroidogenesis in rainbow trout in vivo, through the action of cortisol.
Gen Comp.Endocrinol, 117, 225-237.
Papoutsoglou, S. E., Karakatsouli, N., Pizzonia, G., Dalla, C., Polissidis, A., &
Papadopoulou‐Daifoti, Z. (2006). Effects of rearing density on growth, brain
neurotransmitters and liver fatty acid composition of juvenile white sea bream
Diplodus sargus L. Aquaculture Research, 37(1), 87-95.
Parent, A. (1980). Comparative anatomy of the serotoninergic systems. Journal de
physiologie, 77(2-3), 147-156.
Parent, A. (1984). Functional anatomy and evolution of monoaminergic
systems. American Zoologist, 24(3), 783-790.
Paszkowski, C. A., & Olla, B. L. (1985). Foraging behavior of hatchery-produced
coho salmon (Oncorhynchus kisutch) smolts on live prey. Canadian Journal
of Fisheries and Aquatic Sciences, 42(12), 1915-1921.
Perreault, H. A., Semsar, K., & Godwin, J. (2003). Fluoxetine treatment decreases
territorial aggression in a coral reef fish. Physiology & behavior, 79(4), 719-
724.
Perry, S. F., & Bernier, N. J. (1999). The acute humoral adrenergic stress response in
fish: facts and fiction. Aquaculture, 177(1), 285-295.
References
Page 207
Petersson, E., & Järvi, T. (2006). Anti-predator response in wild and sea-ranched
brown trout and their crosses. Aquaculture, 253(1), 218-228.
Pickering, A. D. (1993). Growth and stress in fish production. Aquaculture, 111(1),
51-63.
Pickering, A. D., Pottinger, T. G., & Christie, P. (1982). Recovery of the brown trout,
Salmo trutta L., from acute handling stress: a time‐course study. Journal of
Fish Biology, 20(2), 229-244.
Pickering, A.D. (1998). Stress responses of farmed fish. In: Black, KD, Pickering,
A.D. (Eds.), Biology of Farmed Fish. Sheffield Academic Press, Sheffield,
pp. 222-255.
Pijanowski, L., Jurecka, P. M., Irnazarow, I., Kepka, M., Verburg-van Kemenade, B.
M. L., & Chadzinska, M. K. (2014). Stress response and activity of the
hypothalamus-pituitary-interrenal axis (HPI axis) in carp lines with different
susceptibility to disease. In Proceedings of the 27th conference of european
comparative endocrinologists (CECE) 2014 abstracts & programme (pp. 107-
107).
Pitcher, T., Green, D., & Magurran, A. (1986). Dicing with death: predator inspection
behaviour in minnow shoals. Journal of Fish Biology, 28(4), 439-448.
Pottinger, T. (2003). The selection of trout for high and low responsiveness to stress:
progress and prospects. Trout news, 36, 14-16.
Pottinger, T. G. (1998). Changes in blood cortisol, glucose and lactate in carp retained
in anglers' keepnets. Journal of fish biology, 53(4), 728-742.
Pottinger, T. G., & Carrick, T. R. (1999). Modification of the plasma cortisol response
to stress in rainbow trout by selective breeding. General and comparative
endocrinology, 116(1), 122-132.
References
Page 208
Pottinger, T. G., & Moran, T. A. (1993). Differences in plasma cortisol and cortisone
dynamics during stress in two strains of rainbow trout (Oncorhynchus
mykiss). Journal of Fish Biology, 43(1), 121-130.
Pottinger, T. G., Carrick, T. R., & Yeomans, W. E. (2002). The three‐spined
stickleback as an environmental sentinel: effects of stressors on whole-body
physiological indices. Journal of Fish Biology, 61(1), 207-229.
Pottinger, T. G., Moran, T. A., & Morgan, J. A. W. (1994). Primary and secondary
indices of stress in the progeny of rainbow trout (Oncorhynchus mykiss)
selected for high and low responsiveness to stress. Journal of Fish
Biology, 44(1), 149-163.
Pottinger, T. G., Pickering, A. D., & Hurley, M. A. (1992). Consistency in the stress
response of individuals of two strains of rainbow trout, Oncorhynchus mykiss.
Aquaculture, 103, 275–289.
Pottinger, T.G., Carrick, T.R., Appleby, A., & Yeomans, W.E. (2000). High blood
cortisol levels and low cortisol receptor affinity: Is the chub, Leuciscus
cephalus, a cortisol-resistant teleost? Gen. Comp. Endocrinol, 120, 108-117.
Pounder, K. C., Mitchell, J. L., Thomson, J. S., Pottinger, T. G., Buckley, J., &
Sneddon, L. U. (2016). Does environmental enrichment promote recovery
from stress in rainbow trout?. Applied Animal Behaviour Science, 176, 136-
142.
Price, E. O. (1984). Behavioral aspects of animal domestication. The quarterly review
of biology, 59(1), 1-32.
Price, E. O. (1999). Behavioral development in animals undergoing
domestication. Applied Animal Behaviour Science, 65(3), 245-271.
Price, E. O. (2000). Department of Animal Science, University of California, Davis,
CA 95616, USA.Animal domestication and behavior. Cabi, 2002.
References
Page 209
Quinones, R. M., Grantham, T. E., Harvey, B. N., Kiernan, J. D., Klasson, M.,
Wintzer, A. P., & Moyle, P. B. (2015). Dam removal and anadromous
salmonid (Oncorhynchus spp.) conservation in California. Reviews in Fish
Biology and Fisheries, 25(1), 195-215.
Rafique, M., & Khan, N. U. H. (2012). Distribution and status of significant
freshwater fishes of Pakistan. Rec. Zool. Surv. Pakistan, 21, 90-95.
Rahman, M. A., Mazid, M., Rahman, M. R., Khan, M. N., Hossain, M., & Hussain,
M. (2005). Effect of stocking density on survival and growth of critically
endangered mahseer, Tor putitora (Hamilton), in nursery ponds. Aquaculture,
249(1), 275-284.
Ramsay, J. M., Feist, G. W., Varga, Z. M., Westerfield, M., Kent, M. L., & Schreck,
C. B. (2006). Whole-body cortisol is an indicator of crowding stress in adult
zebrafish, Danio rerio. Aquaculture. 258, 565–574.
Raoult, V., Brown, C., Zuberi, A., & Williamson, J. E. (2011). Blood cortisol
concentrations predict boldness in juvenile mulloway (Argyosomus japonicus).
Japan Ethological Society, 30(2), 225-232.
Réale, D., Reader, S. M., Sol, D., McDougall, P. T., & Dingemanse, N. J. (2007).
Integrating animal temperament within ecology and evolution. Biological
reviews, 82(2), 291-318.
Reinhardt, T., & Wacker, U. (2004). Impact of ice particle habits on simulated
clouds. Geophysical research letters, 31(21).
Reinhardt, V. (2004). Common husbandry-related variables in biomedical research
with animals. Laboratory Animals, 38(3), 213-235.
References
Page 210
Roberts, L. J., Taylor, J., & de Leaniz, C. G. (2011). Environmental enrichment
reduces maladaptive risk-taking behavior in salmon reared for
conservation. Biological Conservation, 144(7), 1972-1979.
Robertson, L., Thomas, P., & Arnold, C. R. (1988). Plasma cortisol and secondary
stress responses of cultured red drum (Sciaenops ocellatus) to several
transportation procedures. Aquaculture, 68(2), 115-130.
Rodewald, P., Hyvärinen, P., & Hirvonen, H. (2011). Wild origin and enriched
environment promote foraging rate and learning to forage on natural prey of
captive reared Atlantic salmon parr. Ecology of Freshwater Fish, 20(4), 569-
579.
Ruzzante, D. E. (1994). Domestication effects on aggressive and schooling behavior
in fish. Aquaculture, 120(1-2), 1-24.
Salonen, A., & Peuhkuri, N. (2006). The effect of captive breeding on aggressive
behaviour of European grayling, Thymallus thymallus, in different contexts.
Animal Behaviour, 72(4), 819-825.
Salvanes, A. G. V. (2001) Review of ecosystem models of fjords; new insights of
relevance to fisheries management. Sarsia, 86, 441–463.
Salvanes, A. G. V., & Braithwaite, V. (2006). The need to understand the behaviour
of fish reared for mariculture or restocking. ICES Journal of Marine Science:
Journal du Conseil, 63(2), 345-354.
Salvanes, A. G. V., & Braithwaite, V. A. (2005). Exposure to variable spatial
information in the early rearing environment generates asymmetries in social
interactions in cod (Gadus morhua). Behavioral Ecology and
Sociobiology, 59(2), 250.
Salvanes, A. G. V., & J. B. Kristofersen. (2001). Mesopelagic fishes. Encyclopedia of
Ocean Sciences, 1711-1717.

References
Page 211
Salvanes, A. G. V., Moberg, O., Ebbesson, L. O., Nilsen, T. O., Jensen, K. H., &
Braithwaite, V. A. (2013). Environmental enrichment promotes neural
plasticity and cognitive ability in fish. In Proc. R. Soc. B, 280(1767), 20-31.
Salvanes, A. G., Moberg, O., & Braithwaite, V. A. (2007). Effects of early experience
on group behaviour in fish. Animal Behaviour, 74(4), 805-811.
Sangiao‐Alvarellos, S., Lapido, M., Míguez, J. M., & Soengas, J. L. (2004). Effects of
central administration of arginine vasotocin on monoaminergic
neurotransmitters and energy metabolism of rainbow trout brain. Journal of
fish biology, 64(5), 1313-1329.
Sati, J., Sah, S., Pandey, H., Ali, S., Sahoo, P. K., Pande, V., & Barat, A. (2013).
Phylogenetic relationship and molecular identification of five Indian Mahseer
species using COI sequence. Journal of Environmental Biology, 34(5), 933.
Schjolden, J., Pulman, K. G., Pottinger, T. G., Tottmar, O., & Winberg, S. (2006).
Serotonergic characteristics of rainbow trout divergent in stress
responsiveness. Physiology & behavior, 87(5), 938-947.
Schreck, C. B. (2000). Accumulation and long-term effects of stress in fish. The
biology of animal stress, 147-158.
Schreck, C. B. (2010). Stress and fish reproduction: the roles of allostasis and
hormesis. General and comparative endocrinology, 165(3), 549-556.
Schreck, C. B., Contreras-Sanchez, W., & Fitzpatrick, M. S. (2001). Effects of stress
on fish reproduction, gamete quality, and progeny. Aquaculture, 197(1), 3-24.
Scott, A. P., Hirschenhauser, K., Bender, N., Oliveira, R., Earley, R. L., Sebire, M., &
Canario, A. (2008). Non-invasive measurement of steroids in fish-holding
water: important considerations when applying the procedure to behaviour
studies. Behaviour, 145(10), 1307-1328.
References
Page 212
Scott, A. P., & Ellis, T. (2006). Measurement of fish steroids in water--a review. Gen
Comp Endocrinol, 153(1-3), 392-400.
Scott, M.C., Helfman, G.S., McTammany, M.E., Benfield, E.F., & Bolstad, P.V.
(2002). Multiscale influences on physical and chemical stream conditions
across Blue Ridge landscapes. Journal of the American Water Resources
Association, 38, 1379–1392.
Seddon, P. J., Armstrong, D. P., & Maloney, R. F. (2007). Developing the science of
reintroduction biology. Conservation biology, 21(2), 303-312.
Shafi, N., Ayub, J., Ashraf, N., & Mian, A. (2016). Genetic Diversity in Different
Populations of Mahseer (Tor putitora) in Pakistan: A RAPD Based
Study. International Journal of Agriculture & Biology, 18(6), 1181‒1187.
Sharma, K. K., Mohan, V.C., & Kouser U. (2015). Comparative accounts of merestic
count and morphometric measurements of Golden mahseer (Tor putitora)
among Chenani hydroelectric dam, Jhajjar stream and Dansar stream, (J&K)
India. Indian J. Appl Res, 5, 772–774.
Sharma, R., Peshin, R., Shankar, U., Kaul, V., & Sharma, S., (2015). Impact
evaluation indicators of an integrated pest management program in vegetable
crops in the subtropical region of Jammu and Kashmir, India. Crop Protection,
67, 191–199.
Sharp, J., Zammit, T., Azar, T., & Lawson, D. (2003). Stress-like responses to
common procedures in individually and group-housed female rats. Journal of
the American Association for Laboratory Animal Science, 42(1), 9-18.
Shepherdson, D. J. (1998). Tracing the path of environmental enrichment in zoos. In:
Shepherdson DJ, Mellen JD, Hutchins M, editors. Second nature:
environmental enrichment for captive animals. Washington DC: Smithsonian
Institution Press, pp, 1–12.
References
Page 213
Shepherdson, D. J., Mellen, J. D., & Hutchins, M. (Eds.). (2012). Second nature:
Environmental enrichment for captive animals. Smithsonian Institution.
Sherwin, C. (2004). The influences of standard laboratory cages on rodents and the
validity of research data. Animal Welfare, 13(1), 9-15.
Shrestha, C., Rai, A. K., Gurung, T. B., & Mori, K. (1990). Successful artificial
induced spawning of Himalayan mahseer (Tor putitora Hamilton) in Pokhara
Valley, Nepal. In Proceedings of the second Asian Fisheries Forum, Asian
Fisheries Socity, Manila, Philippines,pp. 573-575.
Shrestha, T. (1994). Migration and spawning of golden mahseer in Himalayan waters
of Nepal. Journal of Freshwater Biology, 6(1), 71-77.
Shrestha, T. K. (1997). The mahseer in the rivers of Nepal disrupted by dams and
ranching strategies. The mahseer in the rivers of Nepal disrupted by dams and
ranching strategies.
Shrestha, T. K. (2002). Ranching mahseer (Tor tor and Tor putitora) in the running
waters of Nepal. FAO fisheries technical paper, 297-300.
Sigholt, T., Erikson, U., Rustad, T., Johansen, S., Nordtvedt, T. S., & Seland, A.
(1997). Handling Stress and Storage Temperature Affect Meat Quality of
Farmed‐raised Atlantic Salmon (Salmo Salar). Journal of Food Science, 62(4),
898-905.
Sih, A., Bell, A., & Johnson, J. C. (2004). Behavioral syndromes: an ecological and
evolutionary overview. Trends in Ecology & Evolution, 19(7), 372-378.
Simontacchi, C., Poltronieri, C., Carraro, C., Bertotto, D., Xiccato, G., Trocino, A., &
Radaelli, G. (2008). Alternative stress indicators in sea bass Dicentrarchus
labrax, L. Journal of Fish Biology, 72(3), 747-752.
References
Page 214
Simpson, R. R., & Jackson, P. (1996). The Mary River Cod Recovery Plan,
Queensland Department of Primary Industries, Fisheries Group.
Simpson, R., & Jackson, P. (2000). The Mary River Cod research and recovery plan.
Department of Primary Industries-Fisheries Group.
Singh, N. O., Alam, M. W., Paul, A. K., & Kumar, S. (2009). Length-weight
relationship and growth pattern of Tor putitora (Hamilton) under monoculture
and polyculture systems: a case study. J. Ind. Soc. Agril. Statist, 63(1), 85-89.
Singh, R., Chaturvedi, S. K., Abhinav., & Srivastava, S. J. (2009). Ovarian regression
in Channa punctatus (Bloch)-Effects of photoperiod and temperature. Fishing
Chimes, 28, 24-27.
Sink, T., Kumaran, S., & Lochmann, R.T. (2007). Development of a whole-body
cortisolextraction procedure for determination of stress in golden shiners,
Notemigonus crysoleucas. Fish Physiol. Biochem, 33, 189–193.
Sinn, D. L., Apiolaza, L. A., & Moltschaniwskyj, N. A. (2006). Heritability and
fitness‐related consequences of squid personality traits. Journal of
evolutionary biology, 19(5), 1437-1447.
Sloman, K. A., Baldwin, L., McMahon, S., & Snellgrove, D. (2011). The effects of
mixed-species assemblage on the behaviour and welfare of fish held in home
aquaria. Applied Animal Behaviour Science, 135(1), 160-168.
Small, B. C. (2004). Effect of isoeugenol sedation on plasma cortisol, glucose, and
lactate dynamics in channel catfish Ictalurus punctatus exposed to three
stressors. Aquaculture, 238, 469-481.
Sneddon, L. (2003). The bold and the shy: individual differences in rainbow trout.
Journal of Fish Biology, 62(4), 971-975.
References
Page 215
Sneddon, L.U. (2003a). The evidence for pain in fish: The use of morphine as an
analgesic, Applied Animal Behaviour Science, 83, 153–162.
Sneddon, L.U. (2003b). Trigeminal somatosensory innervation of the head of a teleost
fish with particular reference to nociception, Brain Research, 972, 44–52.
Sørensen, C., Bohlin, L. C., Øverli, Ø., & Nilsson, G. E. (2011). Cortisol reduces cell
proliferation in the telencephalon of rainbow trout (Oncorhynchus
mykiss). Physiology & behavior, 102(5), 518-523.
Sorensen, P.W., Scott, A.P., & Kihslinger, R.L. (2000). How common hormonal
metabolites function as relatively specific pheromonal signals in the
goldfish. In: Norberg, B., Kjesbu, O.S., Taranger G.L., Andersson, E.,
Stefansson, S.O. (Eds.), Proceedings of the 6th
International Symposium on
Reproductive Physiology of Fish, Bergen, Norway, July 4–9, 1999. Bergen
2000, Bergen, Norway. pp. 125–128.
Spence, R., Magurran, A. E., & Smith, C. (2011). Spatial cognition in zebrafish: the
role of strain and rearing environment. Animal cognition, 14(4), 607-612.
Stone, R. (2007). The last of the leviathans. Science, 316(5832), 1684-1688.
Strand, D. A., Utne-Palm, A. C., Jakobsen, P. J., Braithwaite, V. A., Jensen, K. H., &
Salvanes, A. G. (2010). Enrichment promotes learning in fish. Marine Ecology
Progress Series, 412, 273-282.
Stunz, G. W., Levin, P. S., & Minello, T. J. (2001). Selection of estuarine nursery
habitats by wild-caught and hatchery-reared juvenile red drum in laboratory
mesocosms. Environmental Biology of Fishes, 61(3), 305-313.
Sullivan, R. M., & Dufresne, M. M. (2006). Mesocortical dopamine and HPA axis
regulation: role of laterality and early environment. Brain research, 1076(1),
49-59.
References
Page 216
Summers, C. H. (2005). Stress induces rapid changes in central catecholaminergic
activity in Anolis carolinensis: restraint and forced physical activity. Brain
Res. Bull, 67, 210-218.
Summers, C. H., & Winberg, S. (2006). Interactions between the neural regulation of
stress and aggression. J. Exp. Biol, 209, 4581-4589.
Summers, C. H., Korzan, W. J., Lukkes, J. L., Watt, M. J., Forster, G. L., Øverli, Ø.,
& Summers, T. R. (2005). Does serotonin influence aggression? Comparing
regional activity before and during social interaction. Physiological and
Biochemical Zoology, 78(5), 679-694.
Sumpter, J. P. (1997). The endocrinology of stress. Fish stress and health in
aquaculture, 819, 95-118.
Sundström, L. F., & Johnsson, J. I. (2001). Experience and social environment
influence the ability of young brown trout to forage on live novel prey. Animal
Behaviour, 61(1), 249-255.
Sundström, L. F., Petersson, E., Höjesjö, J., Johnsson, J. I., & Järvi, T. (2004).
Hatchery selection promotes boldness in newly hatched brown trout (Salmo
trutta): implications for dominance. Behavioral Ecology, 15(2), 192-198.
Sundström, L. F., Devlin, R. H., Johnsson, J. I., & Biagi, C. A. (2003). Vertical
position reflects increased feeding motivation in growth hormone transgenic
coho salmon (Oncorhynchus kisutch). Ethology, 109, 701-712.
Swaisgood, R. R., White, A. M., Zhou, X., Zhang, H., Zhang, G., Wei, R., &
Lindburg, D. G. (2001). A quantitative assessment of the efficacy of an
environmental enrichment programme for giant pandas. Animal
Behaviour, 61(2), 447-457.
References
Page 217
Thörnqvist, P., Hoglund, E., & Winberg, S. (2015). Natural selection constrains
personality and brain gene expression differences in Atlantic salmon (Salmo
salar). Journal of Experimental Biology, 218, 1077-1083.
Tomasso, A. O., Isely, J. J., & Tomasso Jr, J. R. (1996). Notes: Physiological
Responses and Mortality of Striped Bass Angled in Freshwater. Transactions
of the American Fisheries Society, 125(2), 321-325.
Torres, I. L. S., Gamaro, G. D., Vasconcellos, A. P., Silveira, R., & Dalmaz, C.
(2002). Effects of chronic restraint stress on feeding behavior and on
monoamine levels in different brain structures in rats. Neurochemical
research, 27(6), 519-525.
Tort, L. (2011). Stress and immune modulation in fish. Developmental &
Comparative Immunology, 35(12), 1366-1375.
Trushenski, J. T., Blankenship, H. L., Bowker, J. D., Flagg, T. A., Hesse, J. A., Leber,
K. M., MacKinlay, D. D, Maynard, D. J, Moffitt, C.M, Mudrak, V. A, &
Scribner, K. T. (2015). Introduction to a special section: hatcheries and
management of aquatic resources (HaMAR)—considerations for use of
hatcheries and hatchery-origin fish. North American Journal of
Aquaculture, 77(3), 327-342.
Tsai, C. L., Drejer, A. H., & Schatz, D. G. (2002). Evidence of a critical architectural
function for the RAG proteins in end processing, protection, and joining in V
(D) J recombination. Genes & development, 16(15), 1934-1949.
Tsalafouta, A., Papandroulakis, N., Gorissen, M., Katharios, P., Flik, G., & Pavlidis,
M. (2014). Ontogenesis of the HPI axis and molecular regulation of the
cortisol stress response during early development in Dicentrarchus
labrax. Scientific reports, 4.
References
Page 218
Tsukamoto, Y., Kato, J. I., & Ikeda, H. (1997). Silencing factors participate in DNA
repair and recombination in Saccharomyces cerevisiae. Nature, 388(6645),
900-903.
Turnbull, J., Bell, A., Adams, C., Bron, J., & Huntingford, F. (2005). Stocking density
and welfare of cage farmed Atlantic salmon: application of a multivariate
analysis. Aquaculture, 243(1), 121-132.
Ullah, I., Zuberi, A., Khan, K. U., Ahmad, S., Thörnqvist, P.-O., & Winberg, S.
(2017). Effects of enrichment on the development of behaviour in an
endangered fish mahseer (Tor putitora). Applied Animal Behaviour Science,
186, 93-100.
Ullah, N., Hazarika, P., & Handique, P.J., (2016). Biochemical Quality Assessment of
Ten Selected Drid Fish Species of North East India, International Advanced
Research Journal in Science, Engineering and Technology, 3(1), 30-33.
Valdimarsson, S. K., Metcalfe, N. B., & Skúlason, S. (2000). Experimental
demonstration of differences in sheltering behaviour between Icelandic
populations of Atlantic salmon (Salmo salar) and Arctic char (Salvelinus
alpinus). Canadian Journal of Fisheries and Aquatic Sciences, 57(4), 719-
724.
Van Praag, H., Kempermann, G., & Gage, F. H. (2000). Neural consequences of
enviromental enrichment. Nature Reviews Neuroscience, 1(3), 191-198.
Varsamos, S. G., Flik, J. F., Pepin, S. E., Wendelaar Bonga., & Breuil, G. (2006).
Husbandry stress during early life stages affects the stress response and health
status of juvenile sea bass, Dicentrarchus labrax. Fish Shellfish Immunol, 20,
83–96.
Verbeek, P., Iwamoto, T., & Murakami, N. (2008). Variable stress-responsiveness in
wild type and domesticated fighting fish. Physiology & behavior, 93(1), 83-
88.
References
Page 219
Vermeirssen, E.L.M., & Scott, A.P. (1996). Excretion of free and conjugated steroids
in rainbow trout (Oncorhynchus mykiss): evidence for branchial excretion of
the maturation-inducing steroid, 17, 20 beta-dihydroxy-4-pregnen-3-one. Gen
Comp Endocrinol, 101, 180–94.
Vijayan, M. M., & Moon, T. W. (1994). The stress response and the plasma
disappearance of corticosteroid and glucose in a marine teleost, the sea
raven. Canadian Journal of Zoology, 72(3), 379-386.
Vijayan, M. M., Pereira, C., Kruzynski, G., & Iwama, G. K. (1998). Sublethal
concentrations of contaminant induce the expression of hepatic heat shock
protein 70 in two salmonids. Aquatic Toxicology, 40(2-3), 101-108.
von Krogh, K., Sørensen, C., Nilsson, G. E., & Øverli, Ø. (2010). Forebrain cell
proliferation, behavior, and physiology of zebrafish, Danio rerio, kept in
enriched or barren environments. Physiology & behavior, 101(1), 32-39.
Warburton, K. (2003). Learning of foraging skills by fish. Fish and Fisheries, 4(3),
203-215.
Ward, A. J., Thomas, P., Hart, P. J., & Krause, J. (2004). Correlates of boldness in
three-spined sticklebacks (Gasterosteus aculeatus). Behavioral Ecology and
Sociobiology, 55(6), 561-568.
Waters, R. P., Emerson, A. J., Watt, M. J., Forster, G. L., Swallow, J. G, & Summers,
C. H. (2005). Stress induces rapid changes in central catecholaminergic
activity in Anolis carolinensis: restraint and forced physical activity. Brain
Res. Bull, 67, 210-218.
Weber, R. A., Maceira, J. P., Mancebo, M. J., Peleteiro, J. B., Martín, L. G., &
Aldegunde, M. (2012). Effects of acute exposure to exogenous ammonia on
cerebral monoaminergic neurotransmitters in juvenile Solea senegalensis.
Ecotoxicology, 21(2), 362-369.
References
Page 220
Wendelaar Bonga, S.E., (1997). The stress response infish. Physiol. Rev, 77(3), 591-
625.
Westring, C. G., Ando, H., Kitahashi, T., Bhandari, R. K., Ueda, H., Urano, A., &
Danielson, P. B. (2008). Seasonal changes in CRF-I and urotensin I transcript
levels in masu salmon: correlation with cortisol secretion during
spawning. General and comparative endocrinology, 155(1), 126-140.
Wilkes, L., Owen, S. F., Readman, G. D., Sloman, K. A., & Wilson, R. W. (2012).
Does structural enrichment for toxicology studies improve zebrafish
welfare?. Applied Animal Behaviour Science, 139(1), 143-150.
Wilson, A. D., & Godin, J.-G. J. (2009). Boldness and behavioral syndromes in the
bluegill sunfish, Lepomis macrochirus. Behavioral Ecology, 20(2), 231-237.
Wilson, A. D., & Stevens, E. D. (2005). Consistency in Context‐specific Measures of
Shyness and Boldness in Rainbow Trout, Oncorhynchus
mykiss. Ethology, 111(9), 849-862.
Wilson, J. M., Vijayan, M. M., Kennedy, C. J., Iwama, G. K., & Moon, T. W. (1998).
Beta-naphthoflavone abolishes interrenal sensitivity to ACTH stimulation in
rainbow trout. Journal of endocrinology, 157(1), 63-70.
Winberg, S. and G. E. Nilsson. (1993). Roles of brain monoamine neurotransmitters
in agonistic behavior and stress reactions, with particular reference to fish.
Comp. Biochem. Physiol, C, 106, 597–614.
Winberg, S., & Lepage, O. (1998). Elevation of brain 5-HT activity, POMC
expression, and plasma cortisol in socially subordinate rainbow trout.
American Journal of Physiology-Regulatory, Integrative and Comparative
Physiology, 274(3), 645-654.
References
Page 221
Winberg, S., & Nilsson, G. E. (1992). Induction of social dominance by L-dopa
treatment in Arctic charr. Neuroreport, 3(3), 243-246.
Winberg, S., Nilsson, A., Hylland, P., Söderstöm, V., & Nilsson, G. E. (1997).
Serotonin as a regulator of hypothalamic-pituitary-interrenal activity in teleost
fish. Neuroscience letters, 230(2), 113-116.
Winberg, S., Nilsson, G. E., & Olsén, K. H. (1992). Changes in brain serotonergic
activity during hierarchic behavior in Arctic charr (Salvelinus alpinus L.) are
socially induced. Journal of Comparative Physiology A: Neuroethology,
Sensory, Neural, and Behavioral Physiology, 170(1), 93-99.
Winberg, S., Nilsson, G. E., Spruijt, B. M., & Hoglund, U. (1993). Spontaneous
locomotor activity in Arctic charr measured by a computerized imaging
technique: role of brain serotonergic activity. Journal of Experimental
Biology, 179(1), 213-232.
Winberg, S., Øverli, Ø., & Lepage, O. (2001). Suppression of aggression in rainbow
trout (Oncorhynchus mykiss) by dietary L-tryptophan. Journal of
Experimental Biology, 204(22), 3867-3876.
Winberg, S., Winberg, Y., & Fernald, R. D. (1997). Effect of social rank on brain
monoaminergic activity in a cichlid fish. Brain, behavior and evolution, 49(4),
230-236.
Wolf, C. M., Griffith, B., Reed, C., & Temple, S. A. (1996). Avian and mammalian
translocations: update and reanalysis of 1987 survey data. Conservation
biology, 10(4), 1142-1154.
Wright, D., Nakamichi, R., Krause, J., & Butlin, R. K. (2006). QTL analysis of
behavioral and morphological differentiation between wild and laboratory
zebrafish (Danio rerio). Behavior genetics, 36(2), 271.
References
Page 222
Wright, K. A., Woods, C. M. C., Gray, B. E., & Lokman, P. M. (2007). Recovery
from acute, chronic and transport stress in the pot‐bellied seahorse
Hippocampus abdominalis. Journal of Fish Biology, 70(5), 1447-1457.
Wright, P. A., Steele, S. L., Huitema, A., & Bernier, N. J. (2007). Induction of four
glutamine synthetase genes in brain of rainbow trout in response to elevated
environmental ammonia. Journal of Experimental Biology, 210(16), 2905-
2911.
Yamamoto, T., & Reinhardt, U. G. (2003). Dominance and predator avoidance in
domesticated and wild masu salmon Oncorhynchus masou. Fisheries
Science, 69(1), 88-94.
Yaqoob, M. (2002). Production and culture of trout in the Northwest Frontier
Province and Northern Areas of Pakistan. A review. FAO fisheries technical
paper, 327-332.
Yeh, C. W., Kao, S. H., Cheng, Y. C., & Hsu, L. S. (2013). Knockdown of cyclin-
dependent kinase 10 (cdk10) gene impairs neural progenitor survival via
modulation of raf1a gene expression. Journal of Biological
Chemistry, 288(39), 27927-27939.
Young, P. S., & Cech Jr, J. J. (1993). Effects of exercise conditioning on stress
responses and recovery in cultured and wild young-of-the-year striped bass,
Morone saxatilis. Canadian Journal of Fisheries and Aquatic
Sciences, 50(10), 2094-2099.
Young, R. J. (2013). Environmental enrichment for captive animals. John Wiley &
Sons.
Young, R. J. (2003). Environmental enrichment: an historical
perspective. Environmental enrichment for captive animals. Universities
Federation for Animal Welfare (UFAW). Blackwell Science Ltd., Oxford,
UK, 1-19.
References
Page 223
Zafar, M., Nazir, A., Akhtar, N., & Rab, A. (2001) Weight–length and condition
factor relationship of a fresh water wild mahseer Tor putitora from Korang
river Islamabad. Pak J Bio Sci 6:626–627
Zimmermann, A., Stauffacher, M., Langhans, W., & Würbel, H. (2001). Enrichment-
dependent differences in novelty exploration in rats can be explained by
habituation. Behavioural brain research, 121(1), 11-20.
Zuberi, A., Ali, S., & Brown, C. (2011). A non-invasive assay for monitoring stress
responses: A comparison between wild and captive-reared rainbow fish
(Melanoteania duboulayi). Aquaculture, 321(3), 267-272.
Zuberi, A., Brown, C., & Ali, S. (2014). Effect of confinement on water-borne and
whole body cortisol in wild and captive-reared rainbow fish (Melanoteania
duboulayi). International Journal of Agriculture and Biology, 16(1), 183-188.
Zydlewski, J., McCormick, S. D., & Kunkel, J. G. (2003). Late migration and
seawater entry is physiologically disadvantageous for American shad
juveniles. Journal of fish biology, 63(6), 1521-1537.


