Embed Size (px)
Citation preview

POLITECNICO DI TORINOMaster degree in Energy and Nuclear Engineering
Photocatalytic generation ofhydrogen from cellulose
Master of Science thesis
Supervisors:Massimo Santarelli, Department of Energy, PoliTo
Joydeep Dutta, Department of Applied Physics, KTH Candidate:Rafael Eduardo Guedez Mata, Department of Energy Technology, KTH Stefano De Luca
Academic year 2021-2022

2
Abstract
Uncontrolled emission of greenhouse gases caused by consumption of fossil fuels has ledto the urgent need to develop low-emitting energy technologies such as those exploitingrenewable energies. In this context, hydrogen (H2) represents an opportunity to enhancethe development of such technologies, in light of the possibility to use it as an energystorage for non-programmable renewables, and for its potential to decarbonize key emittingsectors such as the transport sector. This study is therefore focused on photocatalyticgeneration of H2 using cellulose as sacrificial agent, with the aim of valorizing renewableresources like solar energy and the chemical energy contained in an abundant biopolymer.The types of cellulose which are most suitable for this application were determined, andthe influence on the rate of H2 production of parameters like pH of the reaction medium,and concentrations of cellulose and photocatalyst was clarified. It was found that an acidicpH, a relatively high concentration of photocatalyst and a relatively low concentration ofcellulose constitute the most advantageous configuration to maximize the performances.An estimation of the conversion efficiency from light energy to H2 energy is provided, andthe performances allowed by cellulose are compared to those allowed by more frequentlyused sacrificial agents. Finally, attempts to synthesize advanced photocatalysts with theaim of increasing the efficiency are reported.
3

4

Acknowledgments
Il ringraziamento piu grande va alla mia famiglia: mamma, papa, Benedetta, i nonni etutti gli altri. Se io sono Stefano, e se sono arrivato fino a questa tesi, e innanzitutto graziea loro.Grazie alle maestre Anna, Franca, Maria e il maestro Cammarano, per gli insegnamenti ele solide basi fornitemi che mi accompagneranno a vita.Grazie ai miei amici d’infanzia e adolescenza, agli amici di Torino, e a quelli nuoviconosciuti a Stoccolma con cui tante avventure ho vissuto.Grazie ad Ascea con il suo mare e i suoi tramonti, le lunghe passeggiate tranquille, laFiumarella, le colline piene di ulivi da cui si vede Capo Palinuro in mezzo all’azzurro, iresti di quella che un tempo fu Elea, il cibo buono, l’aria di casa.Grazie alla Svezia, coi lunghi inverni di ghiaccio che d’un tratto regalano una giornata disole, felice e inaspettata, le foreste piene di laghi blu, le giornate estive infinite, le fattorie,le casette rosse di campagna con le luci alle finestre.
5

Nomenclature
Ag3PO4 Silver Phosphate
CB Conduction Band
CdS Cadmium Sulfide
CM cellulose Carboxymethyl cellulose
DI water Deionized water
g-C3N4 Graphitic Carbon Nitride
HCOOH Formic acid
HMF Hydroxymethylfurfural
HOMO Highest Occupied Molecular Orbital
hTPA Hydroxyterephthalate
LHCE Light-energy-to-hydrogen-energy conversion efficiency
LUMO Lowest Unoccupied Molecular Orbital
N-GQDs Nitrogen doped graphene quantum dots
Na CM cellulose Sodium Carboxymethyl cellulose
PEC Photoelectrochemical cell
SDBS Sodium Dodecylbenzenesulfonate
SHE Standard Hydrogen Electrode
TiO2 Titanium Dioxide
TPA Terephthalic acid
TPES Total Primary Energy Supply
VB Valence Band
WO3 Tungsten Oxide
ZnO Zinc Oxide
6

Contents
1 Introduction 8
2 Essential theoretical background 112.1 The band theory of solid materials . . . . . . . . . . . . . . . . . . . . . . 112.2 Photocatalytic water splitting and H2 generation . . . . . . . . . . . . . . . 122.3 Beyond simple water splitting: introduction of sacrificial agents . . . . . . 15
3 Literature review 18
4 Research questions and objectives 24
5 Scope and limitations 25
6 Study design 25
7 The photocatalyst 267.1 Material preparation . . . . . . . . . . . . . . . . . . . . . . . . . . . . . . 267.2 Material characterization . . . . . . . . . . . . . . . . . . . . . . . . . . . . 27
8 Cellulose types studied 29
9 Experimental setup 31
10 Results and Discussion 3310.1 Influence of Pt loading . . . . . . . . . . . . . . . . . . . . . . . . . . . . . 3410.2 Estimation of concentration of OH• radicals . . . . . . . . . . . . . . . . . 3610.3 Comparison of different types of cellulose . . . . . . . . . . . . . . . . . . . 3710.4 Influence of cellulose and photocatalyst concentration . . . . . . . . . . . . 4110.5 Study of pH . . . . . . . . . . . . . . . . . . . . . . . . . . . . . . . . . . . 4510.6 Estimation of efficiency . . . . . . . . . . . . . . . . . . . . . . . . . . . . . 4710.7 Comparison with other sacrificial agents . . . . . . . . . . . . . . . . . . . 4910.8 Comparison with other photocatalysts . . . . . . . . . . . . . . . . . . . . 50
10.8.1 TiO2/g-C3N4 heterojunction . . . . . . . . . . . . . . . . . . . . . . 5010.8.2 Ag3PO4/N-GQDs/g-C3N4 heterojunction . . . . . . . . . . . . . . . 5310.8.3 WO3/g-C3N4 heterojunction . . . . . . . . . . . . . . . . . . . . . . 55
11 Sustainability aspects 57
12 Validity, reliability, replicability, scalability 58
13 Conclusions 58
14 Appendices 65
7

1 Introduction
As a consequence of the industrial development of the last years, the world is witnessing anincrease of the atmospheric concentration of CO2 never recorded before. CO2 is recognizedas the main contributor to the increase of the global temperature, that, according to theTreaty of Paris, must be limited to +2 °C with respect to the pre-industrial level in orderto avoid irreversible and catastrophic consequences [1]. The uptrend of the concentrationof CO2 is a direct consequence of the massive amount of fossil fuels consumed by humanity,that, despite all the efforts, still dominate the global energy mix [2]. Figure 1 shows howthe atmospheric concentration of CO2 varied over the years, recently exceeding, for thefirst time after the Mid-Pliocene Warm Period, the 400 ppm threshold [3]. Figure 2 showsinstead the evolution of the Total Primary Energy Supply (TPES) of the world by energysource, still clearly dominated by fossil fuels.
.
Figure 1: CO2 concentration in the atmosphere in the last 800,000 years [3]
8

Figure 2: World TPES from 1971 to 2016 [2].
Substantial efforts have been done in the last years to reduce the emissions by switching torenewable energy sources. Renewables, however, mostly contributed to the decarboniza-tion of the electricity sector, while the energy supply of other sectors such as the transportsector, is still largely covered by fossil fuels. As an example, it is possible to look at theItalian energy supply by source for electricity generation and transport for the same year(2014), shown respectively in Figure 3 and Figure 4.
Figure 3: Italian energy supply for electricity generation by source (2014) [2].
9

Figure 4: Italian energy supply for transport sector by source (2014) [4].
While low carbon sources account for almost half of the energy supply for electricity gen-eration, the energy supply in the transport sector is almost completely based on fossilfuels. As a solution for the decarbonization of the transport sector, in recent years wehave seen large investments in electric vehicles. A complete transition to electric vehiclesmay however be hindered due to a series of shortcomings. Huge investments are neededto upgrade the electric networks, with peak power that may double or triple in certainareas [5], and the toxicity of battery materials, whose improper disposal causes contam-ination of water, soil and air and constitutes a threat for organisms at various trophiclevels [6]. An alternative to the electrification of the transport sector is the employmentof H2 as a fuel, that can be produced from renewable energy through clean processes likeelectrolysis, photocatalysis and solar thermochemical cycles [7]. The employment of H2
would not be restricted to the transport sector, but would also be suited for electricitygeneration and heating/cooling purposes. H2 would in addition constitute a way to storeexcesses of energy produced from non-programmable renewable sources such as solar andwind energy and to balance electrical and/or heating/cooling demands in moments of lowproduction, making the energy distribution system as a whole more flexible [8]. In lightof these considerations, this dissertation investigates the photocatalytic production of H2
using cellulose as a sacrificial agent, being cellulose the most abundant biopolymer onearth [9].
The study is structured in the following sections: Section 2 provides a theoretical back-ground about the physical principles underlying the process, while Section 3 reviews theprevious advancements reported in literature and highlights what is still unknown. Basedon the information gathered from literature, Section 4 proposes the research question thatthis work attempts to answer, while Section 5 clarifies the corresponding scope and lim-
10

itations. Section 6 specifies how the experiments were structured, and Sections 7 and 8contain information about the photocatalyst material and the cellulose types employed.Section 9 describes the setup used for the experiments, whose results are reported in Sec-tion 10. Finally, Section 11 and Section 12 contain, respectively, considerations aboutsustainability aspects and validity, reliability, replicability and scalability of the work.
2 Essential theoretical background
Photocatalytic production of H2 constitutes a way to use solar energy to obtain H2 fromwater and, in case, a sacrificial agent. The process is enabled by a material, normally asemiconductor, that acts as a photocatalyst. This Section provides a theoretical back-ground useful to understand the photocatalytic role of the semiconducting material, andhow it allows to obtain H2 from water and sunlight. The role of the sacrificial agent isalso clarified.
2.1 The band theory of solid materials
The first step towards the understanding of the photocatalytic role of semiconductingmaterials, is recalling the band theory of solid materials. The band theory of solid materialsrelies on the assumption that, while in free atoms only discrete energy levels are possiblefor the electrons, corresponding to certain orbitals, in solid materials the energy levelsof several orbitals overlap forming energy bands in which the energy of the electrons isallowed to change continuously. Two types of energy bands are formed: valence band(VB), in which the electrons are still bound to the atoms, and conduction band (CB), inwhich the electrons have enough energy to freely move within the solid phase. Accordingto the distance in terms of energy that exists between VB and CB, a material can beclassified as conductor, semiconductor or insulator. In conductors, VB and CB overlap,so that electrons are always allowed to move freely. In the case of semiconductors andinsulators instead, between CB and VB there is a region in which no energy levels areavailable for the electrons. Electrons thus need to be excited by an external energy sourceto be able to jump into the CB and be free to move. The energy difference betweenthe highest occupied molecular orbital (HOMO) of the VB, and the lowest unoccupiedmolecular orbital (LUMO) of the CB is the band gap of a material. An amount of energyequal or higher than the band gap has to be provided to excite an electron to the CB.Semiconductors are characterized by a relatively small band gap, while insulator have amuch bigger band gap [10]. Figure 5 shows the energy bands of conductors, semiconductorsand insulators.
11

Figure 5: Schematic representation of VB and CB for conductors, semiconductors andinsulators.
2.2 Photocatalytic water splitting and H2 generation
According to the original idea, photocatalytic generation of H2 is achieved by splittingH2O molecules into H2 and O2 exploiting the properties of a semiconductor that acts as aphotocatalyst.
As mentioned before, electrons in a semiconductor can be excited from the VB to theCB. This can be achieved when energy is supplied to the electrons by photons with energyhigher than the band gap. Once an electron is excited to the CB, a vacancy is formed inthe VB, resulting in the formation of so-called excitons or an electron-hole pair. Accordingto the material considered, the photo-generated electrons and holes have certain electricpotentials that can be expressed, for example, with reference to a Standard HydrogenElectrode (SHE). If the potential of the holes is positive enough, they can oxidize watermolecules according to two types of reactions shown hereunder [11]:
2H2O → O2 + 4H+ + 4e−, E0 = 1.23V (1)
H2O → OH• +H+ + e−, E0 = 2.73V (2)
The reactions are reported together with the respective potential vs SHE at which theyoccur at pH 0, labeled as E0. The potential of the holes should be at least higher than
12

this value for the corresponding reaction to occur. It is possible to notice that Reaction 1requires a considerably lower potential than Reaction 2. Moreover, while Reaction 1 leadsto the formation of O2, Reaction 2 leads to formation of hydroxyl radicals OH•.
The electrons in the right side of both reactions are captured by holes generated in theVB of the photocatalyst, leaving protons in the reaction medium, while photoexcited elec-trons are used to reduce such protons according to the following reaction [12], resulting inevolution of H2:
2H+ + 2e− → H2, E0 = 0V (3)
The reduction potential vs SHE is equal to 0 at pH 0 for the definition itself of SHE, andelectrons must have a more negative potential for the reaction to occur.
The potentials needed for H2O oxidation and H2 evolution reactions are affected by thepH of the system. As Figure 6 shows, lower pH values are associated to potentials shiftedtowards more positive values and vice versa.
Figure 6: Influence of pH on O2 evolution reaction and H2 evolution reaction [13].
The semiconductor by itself does not participate directly in the reactions, but only actslike a catalyst and hence termed photocatalyst. Not every semiconductor is suitable forwater splitting, since the mentioned constraints in terms of potential for holes and photo-excited electrons need to be satisfied to drive the process. As a reminder, at pH 0, theCB of the material should be able to host electrons at a voltage equal or lower than 0
13

V, while the holes generated in the CB should have a potential at least higher than 1.23V for Reaction 1 and higher than 2.73 V for Reaction 2 to occur. A good indication ofwhether a semiconductor can be suitable or not is given by the position of its band gap.Figure 7 shows the band gap position of some common semiconductors.
Figure 7: Band gap position of some common semiconductors [14].
Among the materials reported in Figure 7, titanium dioxide (TiO2) is the most extensivelystudied, since the pioneering experiment of Fujishima and Honda in 1972, in which photo-catalytic H2 generation was shown for the first time using a titanium dioxide photo-anodein a photo-electrochemical cell (PEC) [15].
There are however important issues associated with the photocatalytic production of H2
not yet discussed above. A major issue is the recombination of photo-generated chargecarriers. Photo-excited electrons and holes, indeed, may not have the time to react in H2Ooxidation or protons reduction reactions, but can recombine resulting in a loss of efficiencyfor the photocatalytic process. Moreover, overpotentials are needed to drive the reactions.This means that, considering for example protons reduction according to Reaction 3, evenif the theoretical voltage required is 0 V vs SHE at pH 0, a more negative potential isactually needed for the reaction to occur.
A common way to address both these issues is using a noble metal co-catalyst such asplatinum (Pt), forming a junction with the photocatalyst. Pt can indeed act as an elec-tron sink, capturing the photo-excited electrons and thereby reducing the probability ofrecombination, and reduce the over-potential needed for for the reduction of protons.Further information about possible strategies to improve the performances of the photo-catalyst is provided in the literature review in Section 3.
As a final integration to this section, a schematic representation is shown in Figure 8
14

to summarize the water-splitting process. The figure shows a photocatalyst nanoparticlewith a Pt nanoparticle as co-catalyst (top-right). Upon irradiation, a photon with en-ergy higher than the photocatalyst’s band gap is absorbed by the semiconductor and anelectron is excited to the CB, leaving a hole in the VB. The hole is able to travel till thesurface of the nanoparticle, where, according for example to Reaction 2, it can oxidizea water molecule generating a proton and a hydroxyl radical (OH• radical), while thephoto-excited electron is likely captured by the Pt co-catalyst and used for reduction ofprotons and H2 evolution.
Figure 8: Schematic representation of water splitting process over a photocatalyst nanopar-ticle with Pt co-catalyst.
2.3 Beyond simple water splitting: introduction of sacrificialagents
In order to increase the efficiency of the photocatalytic process, sacrificial agents may beadded to the system. Different types of sacrificial agents exist, but the way they workis similar. Good sacrificial agents are substances with a high reducibility. Examples areorganic molecules such as methanol or glucose. Because of their high reducibility, sacri-ficial agents can be easily oxidized by photo-generated holes, providing electrons to thephotocatalyst and thus acting as holes scavengers. This results in a reduction of the re-
15

combination rate of photo-generated charges, as every hole that reacted with a sacrificialagent’s molecule is a hole that did not recombine with a photo-excited electron. Sincesacrificial agents provide electrons to the photocatalyst, they are also known as ”sacrificialelectron donors” [16]. Though the principle is similar, every sacrificial agent is associatedto a different particular set of chemical reactions. This section will clarify how celluloseworks as a sacrificial agent, being this the main focus of the present work.
Cellulose is a polysaccharide that consists of linear chains of β-1,4 linked D-glucose units,usually insoluble in water. Its degree of polymerization ranges from several hundreds tomore than ten thousands. A large quantity of hydroxyl groups is present along the cellu-lose chains, resulting in a well-ordered hydrogen bonding network and crystalline structure[9]. Figure 9 provides a graphical representation of the chemical structure of cellulose.
Figure 9: Chemical structure of cellulose.
When cellulose is used as sacrificial agent, it is first degraded to simpler and smallermolecules, which are in turn used for H2 production. The first step of the degradationprocess is the cleavage of bonds between the glucose units, liberating glucose molecules inthe system [12]. This can be achieved in the presence of protons and OH• radicals, highlyreactive species which have to be generated through simple water splitting as per reaction2. The degradation reaction of cellulose to glucose is reported in Equation 4:
(C6H10O5)n + nOH• + nH+ + ne− → n(C6H12O6) (4)
No H2 molecule is generated at this stage and no hole has been scavenged, as the degrada-tion of cellulose to glucose only requires the presence of species that have to be generatedthrough simple water splitting. However, glucose and all the downstream products in thedegradation chain can act as the hole scavengers mentioned above. Moreover, differentlyfrom cellulose, glucose and all the products of its degradation are soluble in water, en-abling a much faster kinetics [12].
Once the structure of cellulose has been broken, glucose or smaller molecules are at first
16
adsorbed on the surface of the photocatalyst and are then readily oxidized by photo-generated holes and OH• radicals, leading to the formation of H2, CO2 and CO as finalproducts [12]. The set of intermediate reactions has not been exactly defined yet, butseveral different mechanisms have been proposed.
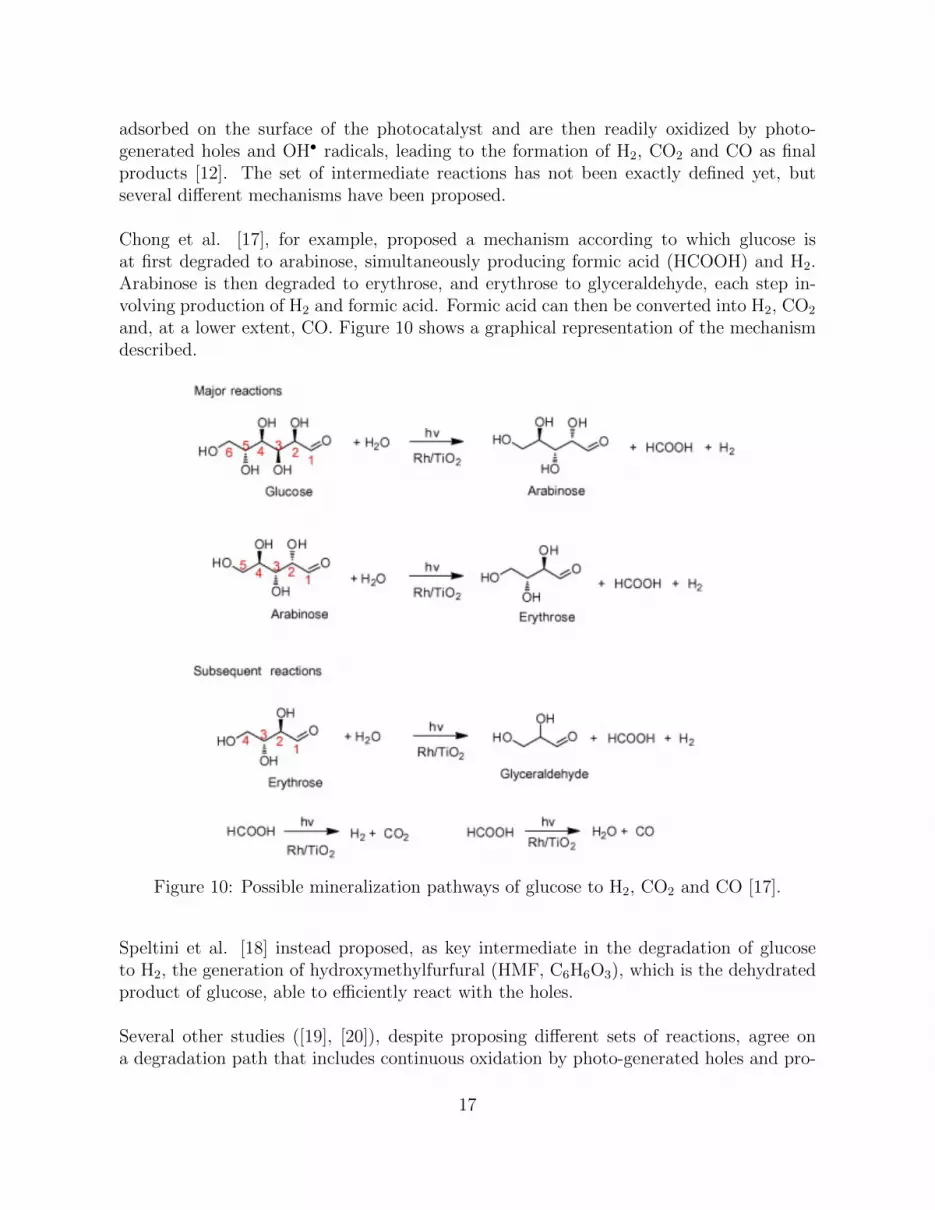
Chong et al. [17], for example, proposed a mechanism according to which glucose isat first degraded to arabinose, simultaneously producing formic acid (HCOOH) and H2.Arabinose is then degraded to erythrose, and erythrose to glyceraldehyde, each step in-volving production of H2 and formic acid. Formic acid can then be converted into H2, CO2
and, at a lower extent, CO. Figure 10 shows a graphical representation of the mechanismdescribed.
Figure 10: Possible mineralization pathways of glucose to H2, CO2 and CO [17].
Speltini et al. [18] instead proposed, as key intermediate in the degradation of glucoseto H2, the generation of hydroxymethylfurfural (HMF, C6H6O3), which is the dehydratedproduct of glucose, able to efficiently react with the holes.
Several other studies ([19], [20]), despite proposing different sets of reactions, agree ona degradation path that includes continuous oxidation by photo-generated holes and pro-
17
duction of formic acid, H2, CO2 and CO.
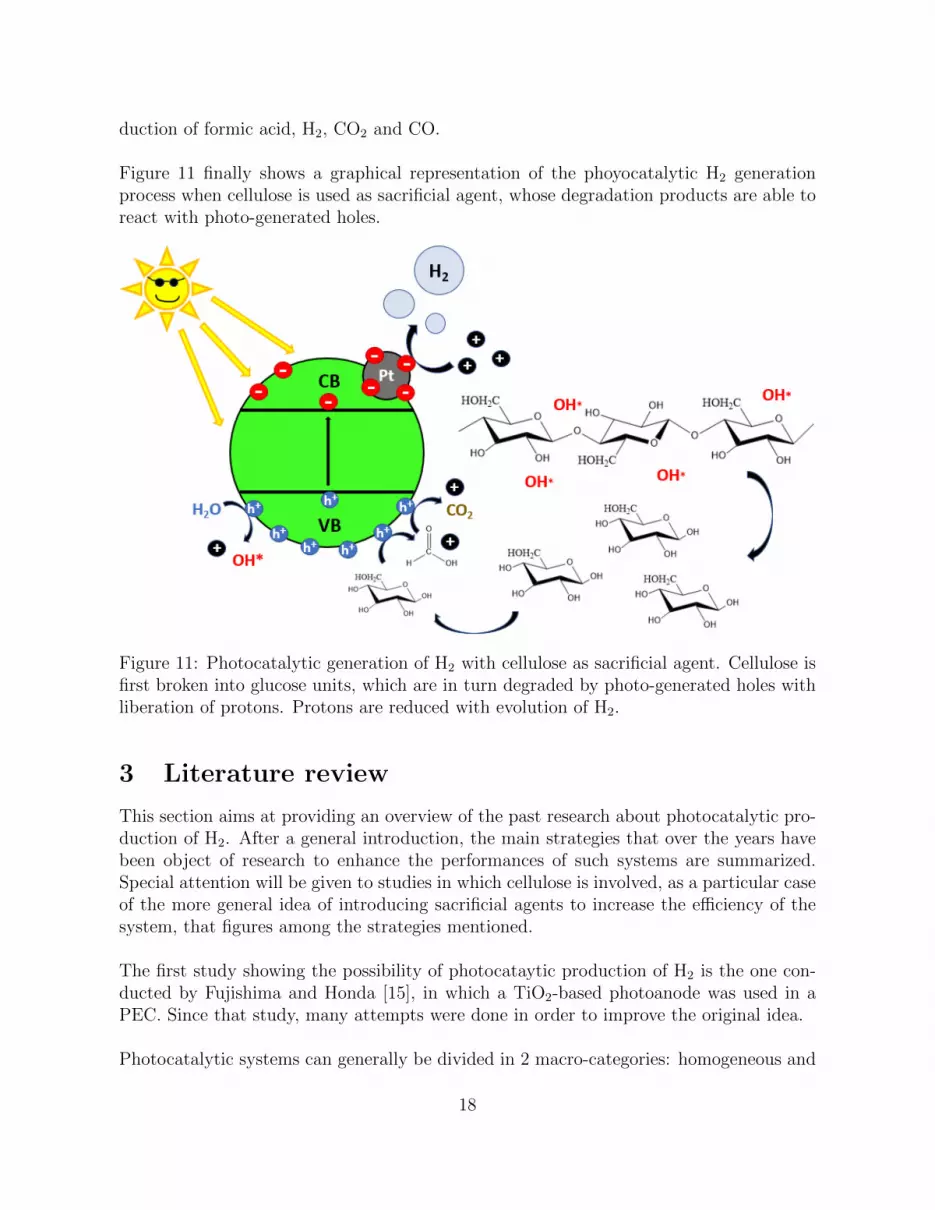
Figure 11 finally shows a graphical representation of the phoyocatalytic H2 generationprocess when cellulose is used as sacrificial agent, whose degradation products are able toreact with photo-generated holes.
Figure 11: Photocatalytic generation of H2 with cellulose as sacrificial agent. Cellulose isfirst broken into glucose units, which are in turn degraded by photo-generated holes withliberation of protons. Protons are reduced with evolution of H2.
3 Literature review
This section aims at providing an overview of the past research about photocatalytic pro-duction of H2. After a general introduction, the main strategies that over the years havebeen object of research to enhance the performances of such systems are summarized.Special attention will be given to studies in which cellulose is involved, as a particular caseof the more general idea of introducing sacrificial agents to increase the efficiency of thesystem, that figures among the strategies mentioned.
The first study showing the possibility of photocataytic production of H2 is the one con-ducted by Fujishima and Honda [15], in which a TiO2-based photoanode was used in aPEC. Since that study, many attempts were done in order to improve the original idea.
Photocatalytic systems can generally be divided in 2 macro-categories: homogeneous and
18

heterogeneous systems. In homogeneous photocatalysis all the reacting species exist in thesame phase, normally liquid. A homogeneous system typically involves an organometalliccomplex as catalyst and a photosensitizer [21]. In heterogeneous photocatalysis, instead,different phases can be identified, with a photocatalyst at the solid state opposed to aliquid phase [21]. Semiconducting materials are usually employed as photocatalysts forthis type of application, exploiting the physical principles explained in Section 2.
Heterogeneous systems are the ones that have been most extensively studied, and canin turn be divided in other 2 sub-categories: PEC systems, as in Fujishima’s and Honda’sexperiment [15], and systems where the photocatalyst is suspended in the form of powderin the reaction medium. Suspended systems showed advantages over PEC systems, suchas higher simplicity and lower cost [22], as well as a higher surface area available per gramof photocatalyst, that boosts the chemical interactions. These characteristics led to thechoice of a suspended system to carry out the present study.
Many semiconducting materials have been experimented as photocatalysts. Metal ox-ides with wide band gap, such as TiO2 and zinc oxide (ZnO) are common examples. TiO2
and ZnO have similar band gaps, around 3.2 eV, that corresponds to wavelength of 380nm [23]. The main advantage of wide band gap materials is that they are suitable forboth water oxidation and protons reduction, favoring the simplicity of the system. Theother side of the coin is that they are only active under UV light, which accounts for aminor part of the solar spectrum. More recently, innovative materials such as graphiticcarbon nitride (g-C3N4) appeared on the scene. g-C3N4 is characterized by a band gapsignificantly lower than that of TiO2: 2.7 eV against 3.2 eV [23], theoretically allowing toabsorb light up to 459 nm, but still keeping the ability to oxidize water and reduce protonsin one single material [24]. Because of the smaller band gap, however, the water oxidationmechanism is the one reported in Equation 1, that does not involve generation of OH•
radicals but leads to O2 evolution, making the material alone unsuitable for degradationof cellulose.
The achievement of an effective absorption of light is not the only necessity that char-acterizes a good photocatalytic system. Recombination of charges also severely affectsthe efficiency, as photo-generated holes and electrons may recombine instead of reactingwith water and protons. In the attempt of overcoming one or both the issues mentioned,several strategies have been identified over the years:
• Deposition of noble metals nanoparticles (plasmonic photocatalysts);• Synthesis of semiconductor-semiconductor heterojunctions;• Engineered nanostructures;• Doping;• Dye sensitization;• Introduction of sacrificial agents.
19
Deposition of noble metals nanoparticles such as Pt is helpful to reduce the re-combination of charges, as the photo-excited electrons would be attracted and trappedby the noble metal particles. The light absorption in the visible spectrum would also beenhanced due to plasmon resonance, beside catalyzing the protons reduction reaction [12].
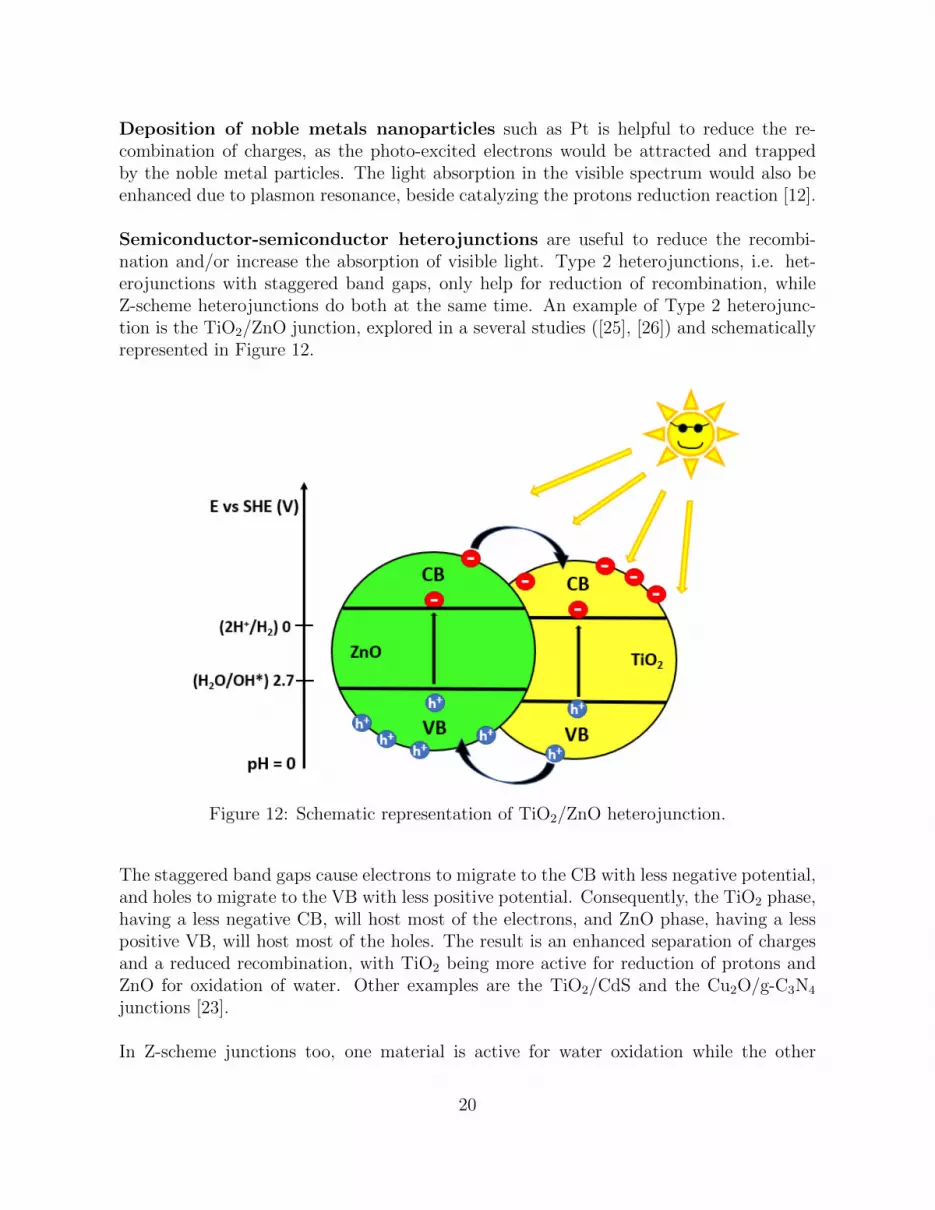
Semiconductor-semiconductor heterojunctions are useful to reduce the recombi-nation and/or increase the absorption of visible light. Type 2 heterojunctions, i.e. het-erojunctions with staggered band gaps, only help for reduction of recombination, whileZ-scheme heterojunctions do both at the same time. An example of Type 2 heterojunc-tion is the TiO2/ZnO junction, explored in a several studies ([25], [26]) and schematicallyrepresented in Figure 12.
Figure 12: Schematic representation of TiO2/ZnO heterojunction.
The staggered band gaps cause electrons to migrate to the CB with less negative potential,and holes to migrate to the VB with less positive potential. Consequently, the TiO2 phase,having a less negative CB, will host most of the electrons, and ZnO phase, having a lesspositive VB, will host most of the holes. The result is an enhanced separation of chargesand a reduced recombination, with TiO2 being more active for reduction of protons andZnO for oxidation of water. Other examples are the TiO2/CdS and the Cu2O/g-C3N4
junctions [23].
In Z-scheme junctions too, one material is active for water oxidation while the other
20

for H2 evolution. Due to engineered favorable positioning of the band gaps and interfaceconditions, the excitation of electrons occurs in 2 steps: electrons are first excited fromVB to CB of the material in charge of water oxidation and, after falling into the VB ofthe material in charge of H2 evolution, they are excited to the CB of the latter material,where they can be used for reduction of protons. An example of Z-scheme investigated inliterature is the WO3/g-C3N4 junction ([23], [27]), for which a schematic representation isprovided in Figure 13.
Figure 13: Schematic representation of WO3/g-C3N4 Z-scheme.
Due to the 2-step excitation, it is possible to employ two materials with more narrowband gaps instead of one material with wider band gap, enabling the use of 2 less en-ergetic photons instead of 1 more energetic photon and shifting the absorption towardslonger wavelengths. Also in this case the separation of the charges is enhanced, as holeswill stay in one material while electrons will migrate to the other. The Z-scheme is one ofthe most promising strategies to achieve a high efficiency. Further examples of Z-schemeare the TiO2/g-C3N4, Nb2O5/g-C3N4 and Ag3PO4/g-C3N4 junctions ([23], [28]).
Doping a semiconductor by introducing impurities in its structure is another strategyto enhance the absorption of longer wavelengths. The impurities would introduce someintermediate states within the band gap of a semiconductor allowing, like for the Z-scheme,
21

an excitation in more than 1 step and red-shifting the absorption. Nonetheless, this strat-egy is not free of drawbacks: doping with metal impurities, for example, may lead tothermal instability that negatively affect the durability of the photocatalyst [29].
Dye sensitization, as the name suggests, aims at increasing the absorption of visiblelight by introducing a dye. Dyes are indeed able to absorb visible light, causing excitationof the electrons and injection into the CB of the photocatalyst, thus increasing the amountof electrons available for protons reduction. The electrons injected into the photocatalyst’sCB should be replaced by electrons from a sacrificial agent [30]. Figure 14 schematicallyrepresents the concept.
Figure 14: Schematic representation of dye sensitization mechanism.
A major drawback associated to the use of dyes is their self-degradation, that can causeinstability and deactivation over time [30].
Introduction of sacrificial agents represents the last strategy to be mentioned, ex-tremely important to ensure a good efficiency. Recalling what has been already explainedin Subsection 2.3, their role is providing electrons to the photocatalyst compensating forthe disadvantageous thermodynamics of the water oxidation reaction. Sacrificial agents
22

used in most studies are alcohols such as methanol and ethanol, due to the ease withwhich they can can be oxidized by photo-generated holes. However, alcohols are valuableand expensive fuels in industry, which would hinder their deployment in commercial ap-plications [31]. Biomass derived substances and organic wastes such as triethanolamine,glycerol, glucose and cellulose have been proposed as cheaper, more suitable alternatives([12], [31]). Being the most abundant organic polymer on earth [9] and, consequently,being characterized by high availability and low cost, cellulose represents a particularlyinteresting option as alternative sacrificial agent for photocatalytic production of H2. Onlylimited number of studies have already been carried out about the topic, some of whichare discussed here.
Caravaca et al. [12], for example, investigated the degradation of cellulose using TiO2
as photocatalyst. Pt was used as co-catalyst for most of the experiments, even thoughother metals were also tested. The authors show that, when using commercial microcrys-talline cellulose (Alfa Aesar) as sacrificial agent, the rate of production of H2 dramaticallyimproved with respect to a system without any sacrificial agent. The production followsa linear trend, which is kept till the end even in the longest experiments, whose durationwas around 6 h. This suggests that steady state concentrations of molecules are reachedand kept in the reactor. Glucose and fescue grass were also tested as sacrificial agentsand the results compared with H2 production in the presence of cellulose. As it could beexpected, glucose, being the first product of the degradation chain of cellulose, shows arate of production higher (approximately double) than that of cellulose at same concen-tration. Fescue grass, instead, being less refined and having a more complex structure,leads to a rate of production approximately half that of cellulose. Cellulose concentrationsfrom 0.125 to 2 mg/mL were tested, obtaining a rate of production that increased withthe concentration.
Speltini et al. [18] employed TiO2/Pt as photocatalyst for the degradation of commercialfibrous long cellulose (Sigma Aldrich). Similarly to the research previously mentioned, dif-ferent concentrations of cellulose were tested, showing that the production reduced whenthe concentration exceeded a certain value. An optimum was found around 6.7 mg/mL.An analogous study about the concentration of photocatalyst revealed an optimum at 2mg/mL. However, it has not been investigated how the concentrations of cellulose andphotocatalyst influence each other. Different pH values were tested, claiming best per-formances at the natural pH of the suspension, though without trying to justify why.Interestingly, the authors proposed an in-situ dye sensitisation mechanism enabled byHMF, reported to be a product of the degradation chain of cellulose. Rice husk was alsotested as sacrificial agent, leading to a rate of production half of that of cellulose.
Chang et al. [32] also studied the influence of cellulose concentration, this time showingan optimum around 5 mg/mL, with TiO2/Pt still being the photocatalyst. The differentposition of the optimum suggests that it is most likely dependent on factors such as con-centration of photocatalyst and lighting conditions, usually different in each study. The
23

authors tried 2 types of cellulose with different crystallinity, and showed that a lower crys-tallinity enables better performances. The difference is attributed to the lower degree ofpolymerization, smaller particle size and higher water uptake when using less crystallinecellulose.
Wakerley et al. [33] used a CdS/CdOx photocatalyst and showed a significant enhance-ment of the rate of production when KOH was added with a concentration of 10 M. Instrongly basic conditions, indeed, cellulose becomes partially soluble in water, allowing afaster degradation. Moreover, different types of paper such as cardboard and newspaper,as well as biomass feedstocks like wooden branches, were successfully used as sacrificialagents in a solution of 10 M KOH.
Not much more is known about how different types of cellulose, or even cellulose deriva-tives, influence the rate of production, nor about the efficiency of conversion from lightenergy to H2 energy of such a photocatalytic system. An estimate of the efficiency is es-sential to understand if the decrease of performances associated to the use of more roughfeedstock, such as fescue grass, can be justified. The role played by parameters such aspH and mass concentrations is yet to be fully clarified, and an estimation of the concen-tration of OH• radicals in the reaction medium is missing. Moreover, it is unknown howcellulose behaves compared to other sacrificial agents at similar conditions, and not muchinformation is available regarding a photocatalyst tailored for this particular application,being most studies based on TiO2.
4 Research questions and objectives
Considering what has already been achieved in literature and what is still unknown, thestudy will address the following research questions:
• What cellulose types/derivatives are most suitable to maximize the photocatalytic pro-duction of H2?• Is it possible to provide a better basic understanding of the process, clarifying how pa-rameters such as pH and concentrations of cellulose and photocatalyst interact and affectthe production?• What is the concentration of OH• radicals in the system?• What conversion efficiency from light energy to H2 energy is it possible to achieve?• How does cellulose compare to other sacrificial agents?• What kind of photocatalyst would be better suited for the application?
Through the research questions listed, the study aims at pursuing the following objectives:
• To validate the existing knowledge about photocatalytic degradation of cellulose forH2 production, and further clarify its dynamics and key parameters;
24

• To assess how cellulose behaves in comparison to more common sacrificial agents;• To develop a photocatalyst optimized for this particular application.
5 Scope and limitations
This research aims at assessing the potential of cellulose as sacrificial agent using a lab-scale experimental setup. The results obtained will only be valid, in numerical terms, forthe particular conditions of the experiments. Different lighting conditions and differentgeometries of the reactor, for example, may indeed change the outcome, but this wasnot investigated. The objective of the study, however, is not trying to find optimal pa-rameters valid in any configuration, but rather qualitatively describing the dynamics thatcharacterize the system. The difference that the experimental conditions make hindersa comparison of the performances with those of the studies available in the literature.Costs-related dynamics were not taken into account.
6 Study design
In order to try to answer to the research questions mentioned above, the study has beenstructured as follows.
At first, a TiO2/Pt photocatalyst was prepared as explained in Section 7. Several rel-evant types of cellulose were gathered (Section 8) and an experimental apparatus was setup (Section 9). After choosing an appropriate loading of Pt (Subsection 10.1), an estima-tion of the concentration of OH• radicals in the system was performed (Subsection 10.2),and all the available types of cellulose were tested (Subsection 10.3). Using the type of cel-lulose that led to the best result, the influence of the concentrations of photocatalyst andcellulose was explored (Subsection 10.4), as well as the impact of pH (Subsection 10.5).The conversion efficiency from light energy to H2 energy was then estimated (Subsection10.6), taking into account all the information revealed by the previous experiments. Therate of H2 production enabled by cellulose was compared to that enabled by other com-mon sacrificial agents (Subsection 10.7) and, finally, some attempts were made to preparea better performing photocatalyst (Subsection 10.8).
A flow chart of the steps followed during the research is provided in Figure 15.
25
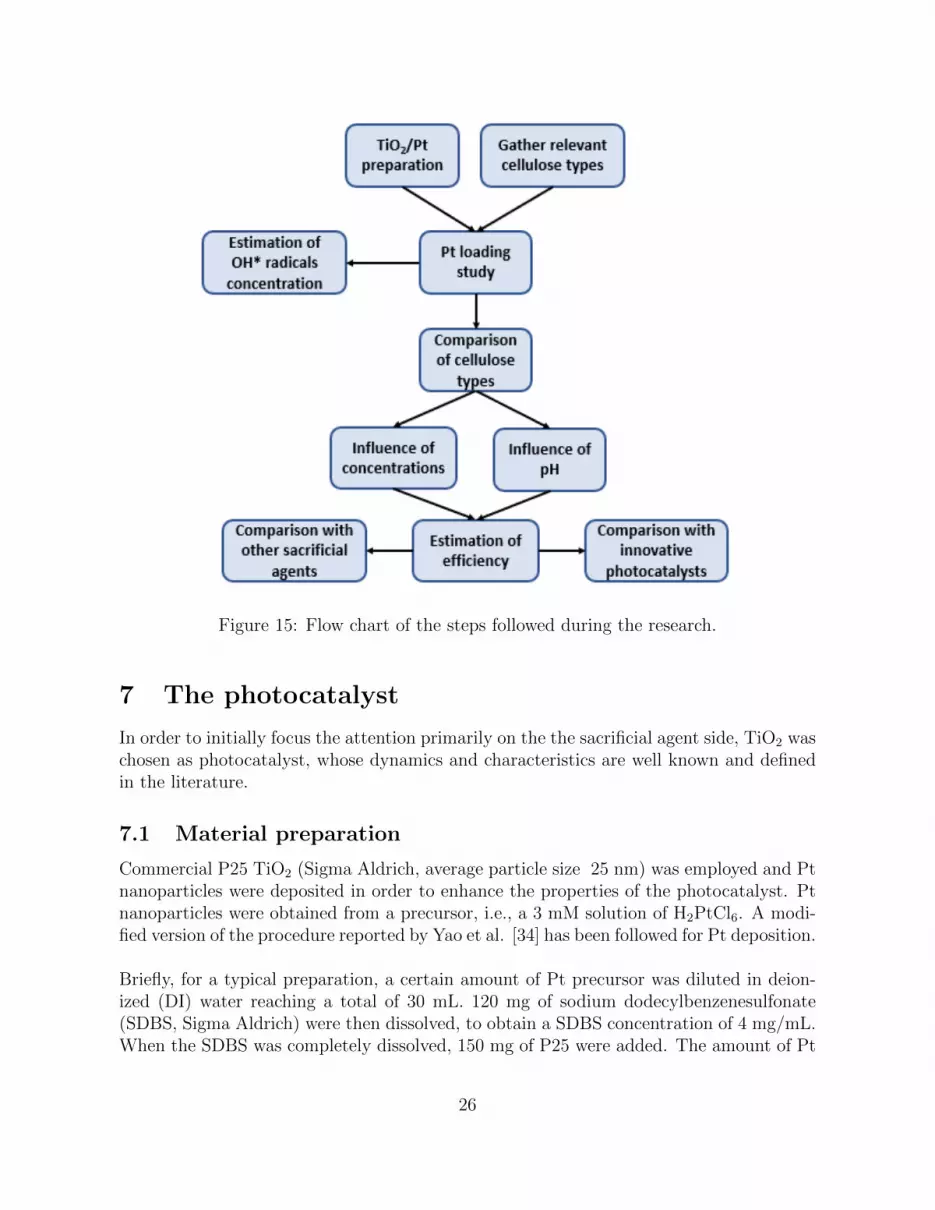
Figure 15: Flow chart of the steps followed during the research.
7 The photocatalyst
In order to initially focus the attention primarily on the the sacrificial agent side, TiO2 waschosen as photocatalyst, whose dynamics and characteristics are well known and definedin the literature.
7.1 Material preparation
Commercial P25 TiO2 (Sigma Aldrich, average particle size 25 nm) was employed and Ptnanoparticles were deposited in order to enhance the properties of the photocatalyst. Ptnanoparticles were obtained from a precursor, i.e., a 3 mM solution of H2PtCl6. A modi-fied version of the procedure reported by Yao et al. [34] has been followed for Pt deposition.
Briefly, for a typical preparation, a certain amount of Pt precursor was diluted in deion-ized (DI) water reaching a total of 30 mL. 120 mg of sodium dodecylbenzenesulfonate(SDBS, Sigma Aldrich) were then dissolved, to obtain a SDBS concentration of 4 mg/mL.When the SDBS was completely dissolved, 150 mg of P25 were added. The amount of Pt
26

precursor used was such that the Pt mass introduced was equal to a chosen percentage ofthe mass of TiO2. Three different Pt mass loadings on P25 were prepared: 0.2 %, 0.5 %and 1 %.The suspension was ultrasonicated for 30 min and magnetically stirred for 1 h. It was thenplaced in an oil bath at 70 °C where it was kept under continuous stirring, and sodiumborohydride (NaBH4) was added as a reducing agent. The role of sodium borohydide wasto reduce the Pt introduced with the precursor, so that it could nucleate and deposit ontothe TiO2 nanoparticles. The amount of reducing agent added was approximately 10 timesthe amount of Pt in terms of moles. The previously dissolved SDBS plays an importantrole: by behaving as a surfactant, it prevents agglomeration of particles and homogeneousPt nucleation in the water, favoring heterogeneous nucleation onto TiO2 nanoparticles.Also, the Pt layer on TiO2 nanoparticles is reported to be thinner and better distributedwhen SDBS is added [34].After adding the reducing agent, the suspension was aged for 2 hours in the oil bath andfinally centrifuged to recover the particles. The latter were rinsed, dried overnight at 60°C and stored for future use. Generally, higher the Pt loading, darker was the appearanceof the powder, suggesting an increase of visible light absorption caused by Pt deposition.
7.2 Material characterization
In order to compare the light absorption properties of the prepared material to those ofcommercial P25, UV-vis spectroscopy was used. Suspensions of 1 mg of P25 in 6 mL DIwater, and 1 mg of as prepared photocatalyst with 0.5 % Pt loading in a same amount ofDI water were compared in the range 300-800 nm. The results are shown in Figure 16.
27
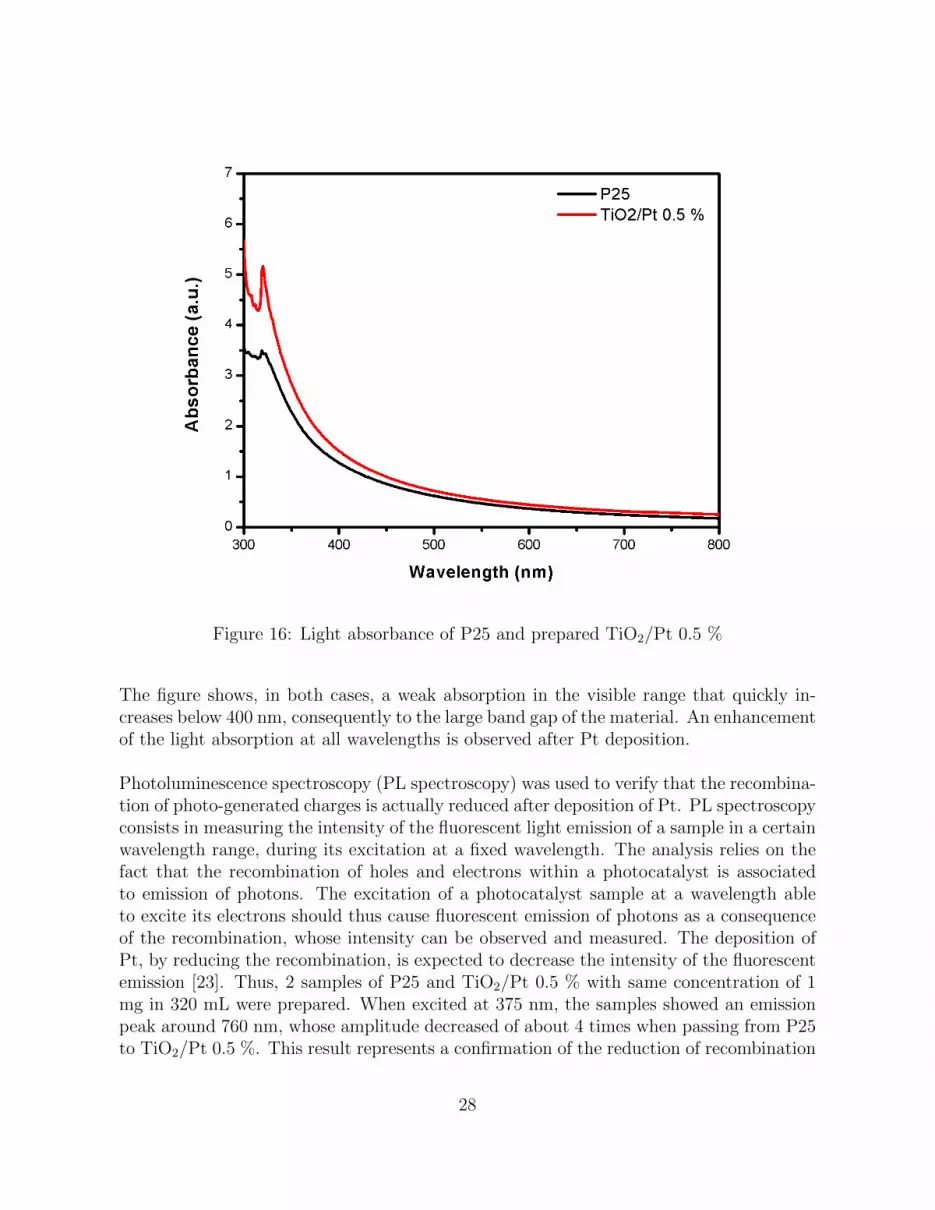
Figure 16: Light absorbance of P25 and prepared TiO2/Pt 0.5 %
The figure shows, in both cases, a weak absorption in the visible range that quickly in-creases below 400 nm, consequently to the large band gap of the material. An enhancementof the light absorption at all wavelengths is observed after Pt deposition.
Photoluminescence spectroscopy (PL spectroscopy) was used to verify that the recombina-tion of photo-generated charges is actually reduced after deposition of Pt. PL spectroscopyconsists in measuring the intensity of the fluorescent light emission of a sample in a certainwavelength range, during its excitation at a fixed wavelength. The analysis relies on thefact that the recombination of holes and electrons within a photocatalyst is associatedto emission of photons. The excitation of a photocatalyst sample at a wavelength ableto excite its electrons should thus cause fluorescent emission of photons as a consequenceof the recombination, whose intensity can be observed and measured. The deposition ofPt, by reducing the recombination, is expected to decrease the intensity of the fluorescentemission [23]. Thus, 2 samples of P25 and TiO2/Pt 0.5 % with same concentration of 1mg in 320 mL were prepared. When excited at 375 nm, the samples showed an emissionpeak around 760 nm, whose amplitude decreased of about 4 times when passing from P25to TiO2/Pt 0.5 %. This result represents a confirmation of the reduction of recombination
28
caused by Pt deposition.
8 Cellulose types studied
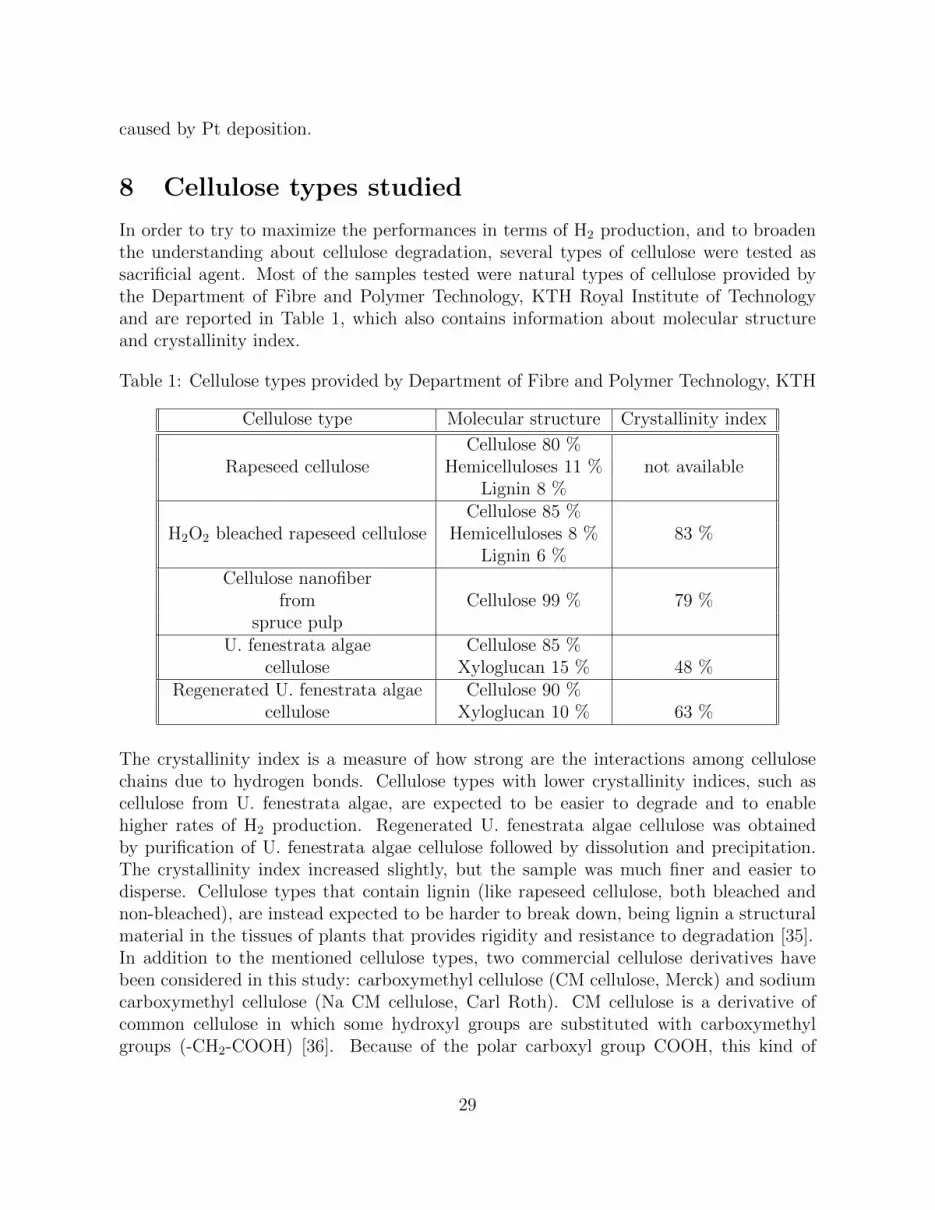
In order to try to maximize the performances in terms of H2 production, and to broadenthe understanding about cellulose degradation, several types of cellulose were tested assacrificial agent. Most of the samples tested were natural types of cellulose provided bythe Department of Fibre and Polymer Technology, KTH Royal Institute of Technologyand are reported in Table 1, which also contains information about molecular structureand crystallinity index.
Table 1: Cellulose types provided by Department of Fibre and Polymer Technology, KTH
Cellulose type Molecular structure Crystallinity index
Cellulose 80 %Rapeseed cellulose Hemicelluloses 11 % not available
Lignin 8 %Cellulose 85 %
H2O2 bleached rapeseed cellulose Hemicelluloses 8 % 83 %Lignin 6 %
Cellulose nanofiberfrom Cellulose 99 % 79 %
spruce pulpU. fenestrata algae Cellulose 85 %
cellulose Xyloglucan 15 % 48 %Regenerated U. fenestrata algae Cellulose 90 %
cellulose Xyloglucan 10 % 63 %
The crystallinity index is a measure of how strong are the interactions among cellulosechains due to hydrogen bonds. Cellulose types with lower crystallinity indices, such ascellulose from U. fenestrata algae, are expected to be easier to degrade and to enablehigher rates of H2 production. Regenerated U. fenestrata algae cellulose was obtainedby purification of U. fenestrata algae cellulose followed by dissolution and precipitation.The crystallinity index increased slightly, but the sample was much finer and easier todisperse. Cellulose types that contain lignin (like rapeseed cellulose, both bleached andnon-bleached), are instead expected to be harder to break down, being lignin a structuralmaterial in the tissues of plants that provides rigidity and resistance to degradation [35].In addition to the mentioned cellulose types, two commercial cellulose derivatives havebeen considered in this study: carboxymethyl cellulose (CM cellulose, Merck) and sodiumcarboxymethyl cellulose (Na CM cellulose, Carl Roth). CM cellulose is a derivative ofcommon cellulose in which some hydroxyl groups are substituted with carboxymethylgroups (-CH2-COOH) [36]. Because of the polar carboxyl group COOH, this kind of
29
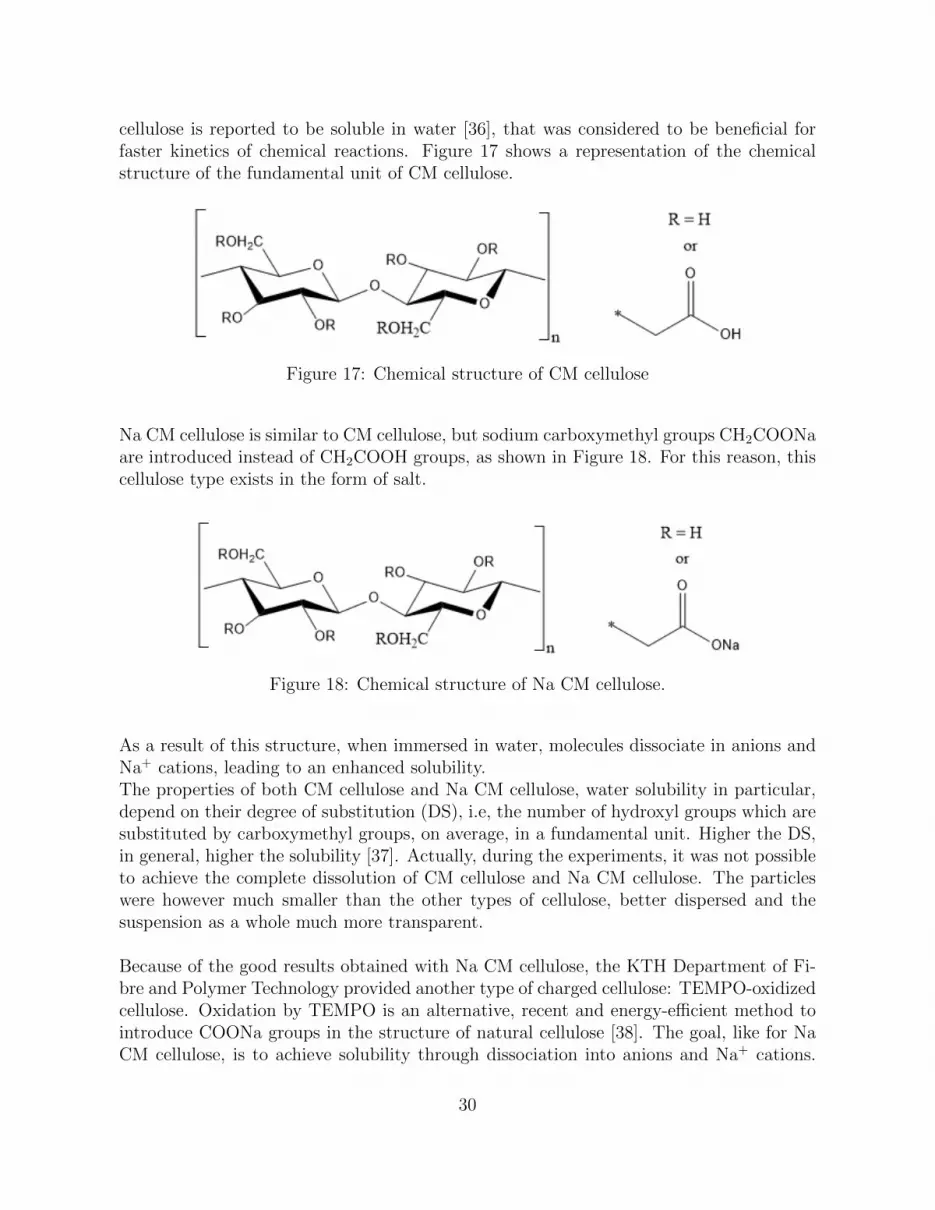
cellulose is reported to be soluble in water [36], that was considered to be beneficial forfaster kinetics of chemical reactions. Figure 17 shows a representation of the chemicalstructure of the fundamental unit of CM cellulose.
Figure 17: Chemical structure of CM cellulose
Na CM cellulose is similar to CM cellulose, but sodium carboxymethyl groups CH2COONaare introduced instead of CH2COOH groups, as shown in Figure 18. For this reason, thiscellulose type exists in the form of salt.
Figure 18: Chemical structure of Na CM cellulose.
As a result of this structure, when immersed in water, molecules dissociate in anions andNa+ cations, leading to an enhanced solubility.The properties of both CM cellulose and Na CM cellulose, water solubility in particular,depend on their degree of substitution (DS), i.e, the number of hydroxyl groups which aresubstituted by carboxymethyl groups, on average, in a fundamental unit. Higher the DS,in general, higher the solubility [37]. Actually, during the experiments, it was not possibleto achieve the complete dissolution of CM cellulose and Na CM cellulose. The particleswere however much smaller than the other types of cellulose, better dispersed and thesuspension as a whole much more transparent.
Because of the good results obtained with Na CM cellulose, the KTH Department of Fi-bre and Polymer Technology provided another type of charged cellulose: TEMPO-oxidizedcellulose. Oxidation by TEMPO is an alternative, recent and energy-efficient method tointroduce COONa groups in the structure of natural cellulose [38]. The goal, like for NaCM cellulose, is to achieve solubility through dissociation into anions and Na+ cations.
30

In this case however, instead of CH2COONa groups, more simple COONa groups areintroduced. Figure 19 shows the chemical structure of TEMPO-oxidized cellulose.
Figure 19: Chemical structure of TEMPO-oxidized cellulose.
9 Experimental setup
The experiments were run in a 3 necks round-bottomed pyrex glass flask with rated ca-pacity 25 mL, filled with 25 mL of suspension of water, photocatalyst and cellulose. Thesuspension was magnetically stirred at 500 rpm during the experiments.
The light source used was a OSRAM Ultra-Vitalux 300 W lamp, that simulates naturalsunlight. The spectral radiation distribution of the lamp provided by the manufacturer isreported in Figure 20.
Figure 20: Spectral radiation distribution of OSRAM Ultra-Vitalux lamp [40].
It is possible to appreciate, like for natural sunlight, emission in the UV region, i.e. at
31
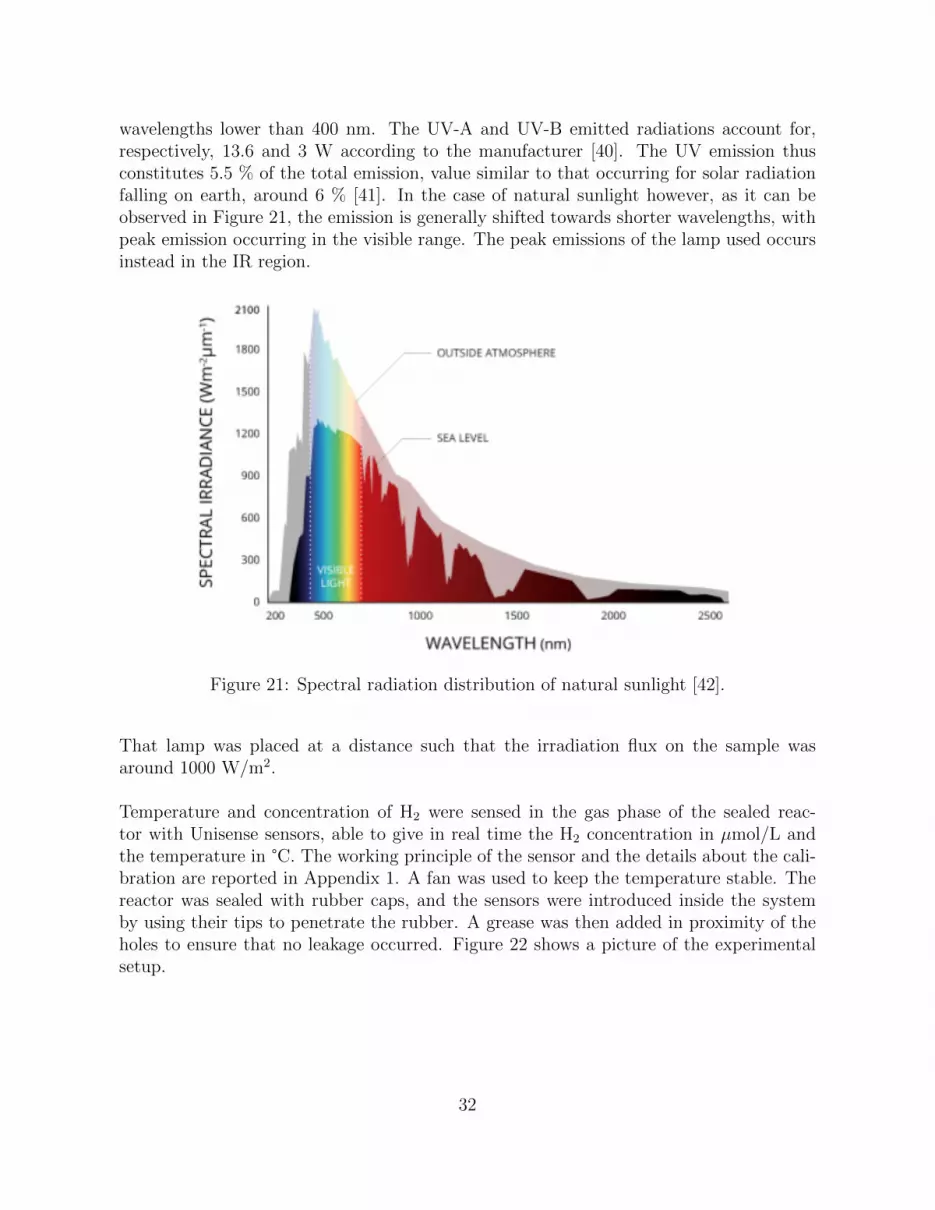
wavelengths lower than 400 nm. The UV-A and UV-B emitted radiations account for,respectively, 13.6 and 3 W according to the manufacturer [40]. The UV emission thusconstitutes 5.5 % of the total emission, value similar to that occurring for solar radiationfalling on earth, around 6 % [41]. In the case of natural sunlight however, as it can beobserved in Figure 21, the emission is generally shifted towards shorter wavelengths, withpeak emission occurring in the visible range. The peak emissions of the lamp used occursinstead in the IR region.
Figure 21: Spectral radiation distribution of natural sunlight [42].
That lamp was placed at a distance such that the irradiation flux on the sample wasaround 1000 W/m2.
Temperature and concentration of H2 were sensed in the gas phase of the sealed reac-tor with Unisense sensors, able to give in real time the H2 concentration in µmol/L andthe temperature in °C. The working principle of the sensor and the details about the cali-bration are reported in Appendix 1. A fan was used to keep the temperature stable. Thereactor was sealed with rubber caps, and the sensors were introduced inside the systemby using their tips to penetrate the rubber. A grease was then added in proximity of theholes to ensure that no leakage occurred. Figure 22 shows a picture of the experimentalsetup.
32

Figure 22: Experimental setup.
10 Results and Discussion
This section summarizes the results obtained from the experiments. At first, it is usefulto consider the outcome of a typical experiment. Figure 23 shows the variation of the H2
concentration sensed in the gas phase of the reactor, with reference to a typical experimentperformed with TiO2/Pt 0.5 % with a concentration of 0.3 mg/mL, and a concentrationof regenerated U. fenestrata algae cellulose of 0.25 mg/mL.
33

Figure 23: Evolution of H2 concentration in a typical experiment carried out with 0.3mg/mL of TiO2/Pt 0.5 %, and 0.25 mg/mL concentration of U. fenestrata algae cellulose.
Coherently with the results previously obtained in the literature, the variation of H2
concentration follows a linear trend. The irregular initial part is due to the temperaturetransition from ambient temperature to the steady state temperature of the experiment,and to the time needed to saturate the suspension with H2. The rate of H2 generationin µmol/h has been chosen as the key indicator to compare different experiments, andit can be obtained as follows. After exporting the results in excel, a linear interpolationof the concentration evolution in the steady state part of the experiment can be used toknow the slope of the line and thus the rate of change of the concentration in µmol/L/s.By multiplying such value with the volume of the gas phase, measured as the differencebetween the total capacity of the reactor and the volume of the suspension, it is possibleto obtain the rate of H2 production in µmol/s, subsequently converted in µmol/h.
10.1 Influence of Pt loading
As a first step of the experiments, a study was conducted to assess the influence of Ptloading on the H2 production. Four different mass percentages have been tested, namely 0
34
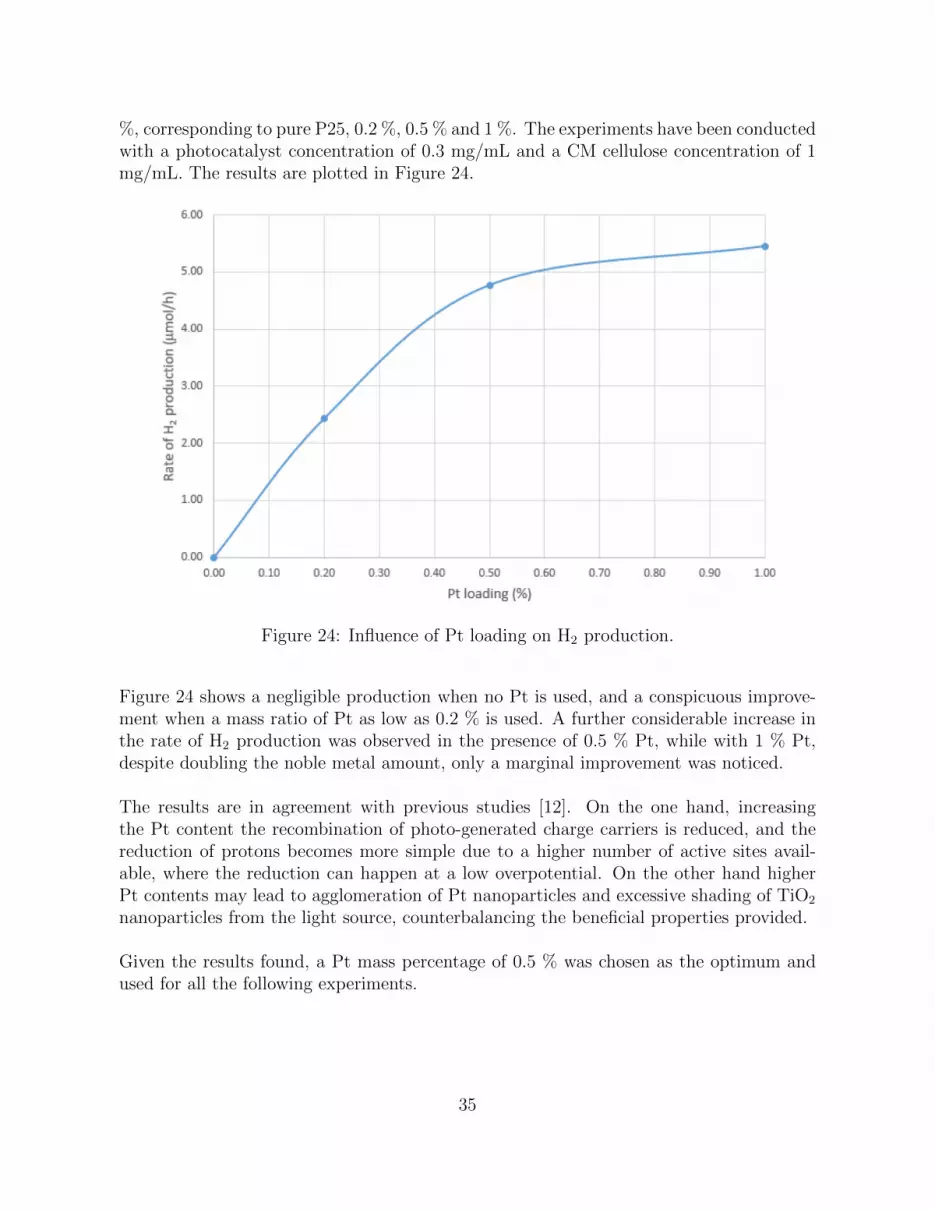
%, corresponding to pure P25, 0.2 %, 0.5 % and 1 %. The experiments have been conductedwith a photocatalyst concentration of 0.3 mg/mL and a CM cellulose concentration of 1mg/mL. The results are plotted in Figure 24.
Figure 24: Influence of Pt loading on H2 production.
Figure 24 shows a negligible production when no Pt is used, and a conspicuous improve-ment when a mass ratio of Pt as low as 0.2 % is used. A further considerable increase inthe rate of H2 production was observed in the presence of 0.5 % Pt, while with 1 % Pt,despite doubling the noble metal amount, only a marginal improvement was noticed.
The results are in agreement with previous studies [12]. On the one hand, increasingthe Pt content the recombination of photo-generated charge carriers is reduced, and thereduction of protons becomes more simple due to a higher number of active sites avail-able, where the reduction can happen at a low overpotential. On the other hand higherPt contents may lead to agglomeration of Pt nanoparticles and excessive shading of TiO2
nanoparticles from the light source, counterbalancing the beneficial properties provided.
Given the results found, a Pt mass percentage of 0.5 % was chosen as the optimum andused for all the following experiments.
35

10.2 Estimation of concentration of OH• radicals
Prior to any further experiment about H2 production, an estimation of the concentrationof OH• radicals in a photocatalytic system containing TiO2/Pt 0.5 % was performed, usingterephthalate (TPA) as a probe. TPA readily reacts with photo-generated OH• radicalsforming, among the possible reaction products, hydroxyterephthalate (hTPA) [43] as inFigure 25:
Figure 25: Reaction of TPA with OH• radicals to form hTPA [43].
hTPA is a fluorescent molecule whose presence can be detected using photoluminescence(PL) spectroscopy. It is indeed stated in literature that, when excited at a wavelength of325 nm, hTPA shows a peak fluorescent emission at 425 nm [43]. A higher concentrationof hTPA will be associated to a stronger fluorescent emission at 425 nm. A calibration inwhich several known concentrations of hTPA are associated to the corresponding intensityof the emission peak at 425 nm, allows then to find the unknown concentration of hTPAin a sample knowing the intensity of the fluorescent emission at 425 nm. Details aboutthe calibration are reported in the Appendix 2.
Once the concentration of hTPA is known, it is possible to find the steady state concen-tration of OH• radicals in the system from the kinetic equation of the formation reactionof hTPA from TPA [43]:
d[hTPA]
dt= k[TPA][OH•]ssY (5)
where k is the rate constant of the reaction and Y represents the fraction of TPA moleculesreacted with OH• radicals that form hTPA. Their values are reported to be, respectively,4.4·109 M−1s−1 and 0. [43].In this case, 25 mL of a 500 µM TPA solution were used for the experiment. TiO2/Pt 0.5% was suspended at a concentration of 0.3 mg/mL and the sample was irradiated for 5min. After centrifugation to remove the photocatalyst powder, the sample was analyzed
36

with PL spectroscopy, and a concentration of OH• radicals around 5.5·10−15 M has beenestimated. More details about the calculations are provided in Appendix 2.
10.3 Comparison of different types of cellulose
All the types of cellulose mentioned in Section 8 have been tested for H2 production, andthe results are reported in the current section. In order to perform a fair comparison,the same conditions have been set for all the experiments: a cellulose concentration of0.25 mg/mL and a photocatalyst concentration of 0.3 mg/mL, while the initial pH wasadjusted to 6 using HCl and NaOH. Cellulose was dispersed by ultrasonication of the sam-ple. For comparison, an experiment without cellulose has also been performed, in whichH2 is obtained from pure water splitting. The results are reported in Figure 26.
Figure 26: Rate of H2 production from water and different cellulose types.
The figure shows a very modest production for pure water splitting and a considerableimprovement when cellulose is introduced into the system, the magnitude of the improve-ment depending on the type of cellulose. This confirms the primary role played by thesacrificial agent in the photocatalytic reaction.
Among the natural types of cellulose, it is possible to note how those having a smallercrystallinity index (U. fenestrata algae cellulose and Regenerated U. fenestrata algae cel-lulose) led to the highest rates of production of H2. As mentioned earlier, indeed, a lower
37

crystallinity index is associated to weaker chemical bonds, that implies easier degrada-tion. Moreover, the water-soluble xyloglucan contained in U. fenestrata algae celluloseand Regenerated U. fenestrata algae cellulose may also contribute to the good perfor-mances observed. Rapeseed cellulose types led instead to much slower production rates.As a consequence of their chemical composition (high crystallinity index and presence oflignin), not only those types of cellulose are more difficult to chemically degrade, but alsoto physically break and disperse, resulting in bigger particles. Bigger particles in turntranslated into high instability of the suspension and fast agglomeration of particles, withboth cellulose and TiO2 precipitating and negatively affecting the corresponding produc-tion rates. A similar tendency has been observed, though at a smaller extent, with sprucepulp CNF, which is also characterized by a high crystallinity index.
It was in the attempt to overcome the issue of agglomeration that cellulose concentra-tion and initial pH were chosen.In order to reduce the tendency to agglomeration, a relatively small concentration of cel-lulose (0.25 mg/mL) was used, while studies in the literature ([12], [18]), that employedcommercial cellulose, used concentrations of several mg/mL.The understanding of the choice of the initial pH, requires the introduction of the conceptof zeta potential, which is strongly related to the stability of a suspension. The zeta poten-tial is a measure of the net electric charge on the surface of the particles of a suspension.The more the zeta potential of a suspension with one type of particles is far from 0, themore the suspension tends to be stable, due to the repulsive Coulombian forces amongparticles [44]. The net charge on the surface of the particles is dependent on the pH ofthe suspension. Generally, higher pH values are associated to more negative values of zetapotential, while the opposite is true for lower pH values.The photocatalytic system here considered is a suspension of two types of particles: P25TiO2 with Pt nanoparticles and cellulose. The zeta potential of P25 as a function of thepH is available in the literature and shown in Figure 27. The deposition of Pt is reportednot to significantly affect the zeta potential [45].
38
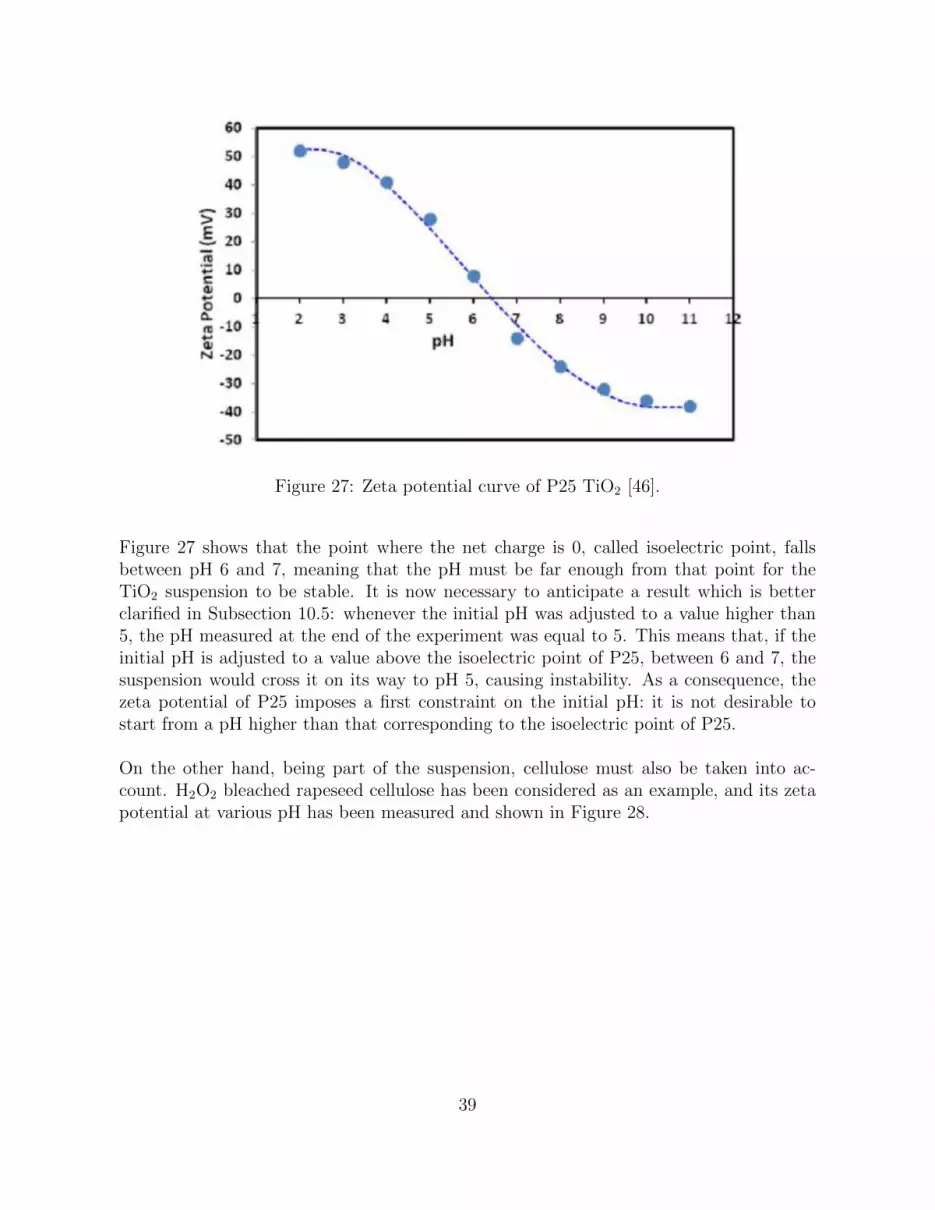
Figure 27: Zeta potential curve of P25 TiO2 [46].
Figure 27 shows that the point where the net charge is 0, called isoelectric point, fallsbetween pH 6 and 7, meaning that the pH must be far enough from that point for theTiO2 suspension to be stable. It is now necessary to anticipate a result which is betterclarified in Subsection 10.5: whenever the initial pH was adjusted to a value higher than5, the pH measured at the end of the experiment was equal to 5. This means that, if theinitial pH is adjusted to a value above the isoelectric point of P25, between 6 and 7, thesuspension would cross it on its way to pH 5, causing instability. As a consequence, thezeta potential of P25 imposes a first constraint on the initial pH: it is not desirable tostart from a pH higher than that corresponding to the isoelectric point of P25.
On the other hand, being part of the suspension, cellulose must also be taken into ac-count. H2O2 bleached rapeseed cellulose has been considered as an example, and its zetapotential at various pH has been measured and shown in Figure 28.
39

Figure 28: Zeta potential curve of H2O2 bleached cellulose
The figure displays a negative zeta potential for all the pH studied, most probably as aconsequence of the negatively charged OH groups abundant in the structure of any kind ofcellulose. This means that for pH values lower than 6, P25 and cellulose have zeta poten-tial of opposite signs, and the lower the pH, higher the difference between the potentialstends to be. As an implication, at pH 5, which is the pH reached by the system startingfrom any higher pH, as well as at any lower pH, there will be an attraction among TiO2
and cellulose particles that may cause the agglomeration observed experimentally. Thismechanism can explain the agglomeration observed, and justifies the choice of an initialpH just below the isoelectric point of P25.
This strategy worked for spruce pulp CNF, but not for rapeseed cellulose types, thateventually agglomerated anyway. No agglomeration issues were observed with other typesof cellulose, being easier to obtain a well dispersed suspension.
These considerations might explain the behavior previously observed in the research car-ried out by Speltini et al. [18], in which the best performances were obtained at the naturalpH of the suspension, which is close to 6 for DI water slightly acidified by CO2.
Finally, it is worth noting the good rates of production enabled by CM cellulose, NaCM cellulose and TEMPO-oxidized cellulose, with Na CM cellulose leading to the bestresult. This comes as a consequence of the introduction of, respectively, CH2COOH,CH2COONa and COONa groups that successfully enhance the dispersibility and reduce
40
the effort needed for chemical degradation. Since Na CM cellulose gave the best results,all the following experiments mostly focus on this type of cellulose.
10.4 Influence of cellulose and photocatalyst concentration
An analysis aiming at studying the influence of cellulose and photocatalyst concentrationis here reported.
At first, experiments were conducted keeping constant the concentration of photocata-lyst to the value of 0.3 mg/mL used so far, and varying the concentration of cellulosebetween 0.25 and 5 mg/mL. The experiments have been done for CM cellulose and NaCM cellulose, and the results are reported in Figure 29.
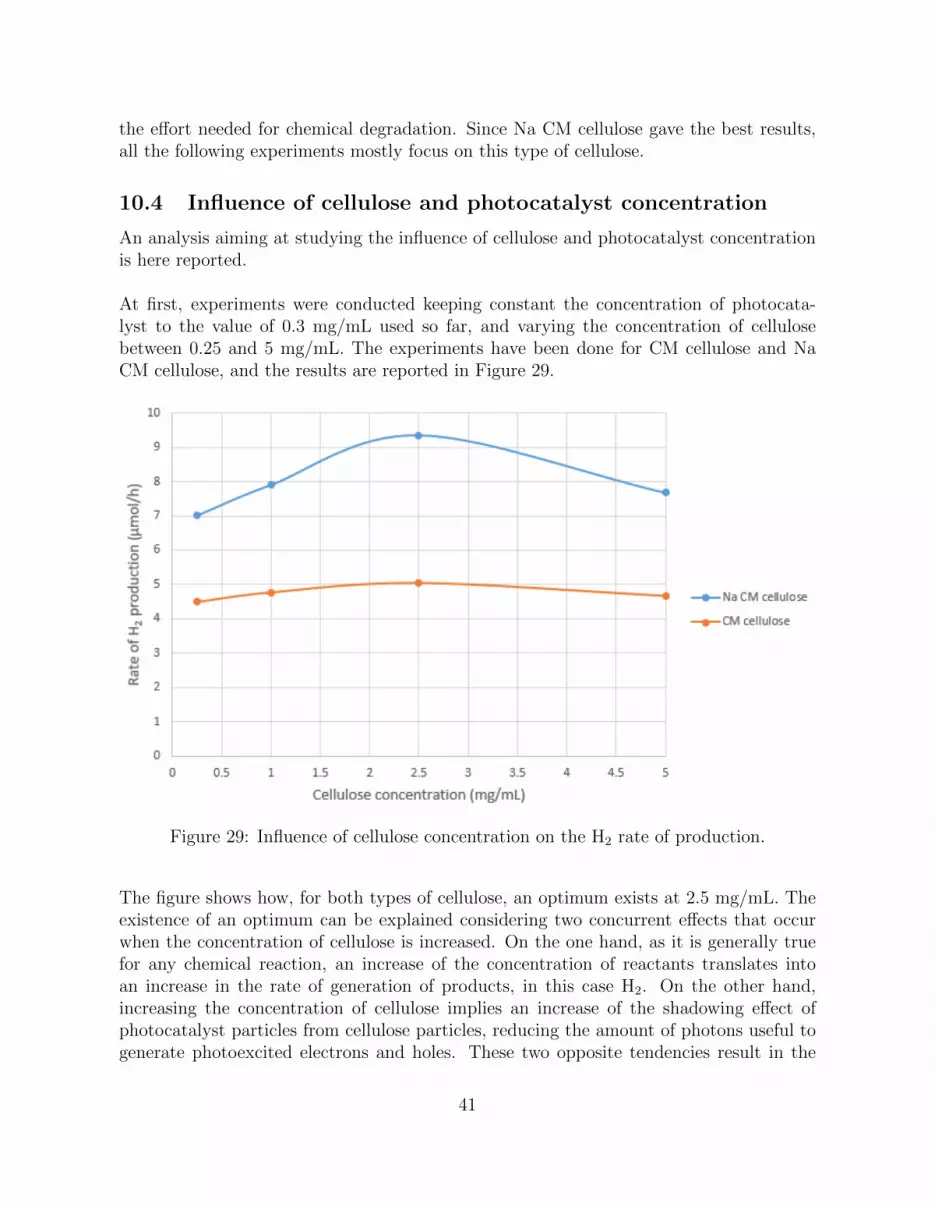
Figure 29: Influence of cellulose concentration on the H2 rate of production.
The figure shows how, for both types of cellulose, an optimum exists at 2.5 mg/mL. Theexistence of an optimum can be explained considering two concurrent effects that occurwhen the concentration of cellulose is increased. On the one hand, as it is generally truefor any chemical reaction, an increase of the concentration of reactants translates intoan increase in the rate of generation of products, in this case H2. On the other hand,increasing the concentration of cellulose implies an increase of the shadowing effect ofphotocatalyst particles from cellulose particles, reducing the amount of photons useful togenerate photoexcited electrons and holes. These two opposite tendencies result in the
41

existence of the optimum mentioned above, that occurs around the same concentrationfor both the cellulose types tested.
The influence of photocatalyst concentration has also been assessed, varying it between 0.1and 2 mg/mL at a constant concentration of cellulose equal to 0.25 mg/mL and using NaCM cellulose. Figure 30 summarizes the results obtained, both in terms of total H2 pro-duction and in terms of production normalized with respect to the mass of photocatalystused.
Figure 30: Influence of photocatalyst concentration on the total H2 production (left axis)and H2 production normalized with respect to the mass of photocatalyst (right axis).
It is possible to first appreciate how the total production increases with the concentrationwhen this is varied between 0.1 and 1 mg/mL, and how it then decreases when moving to 2mg/mL. It thus seems that, similarly to what has been shown for cellulose, increasing theconcentration of photocatalyst initially brings an advantage as more light can be absorbedand used to produce H2. When instead the concentration exceeds a certain value, mostof the light beam is likely absorbed or scattered by the portion of photocatalyst closerto the light source, so that the rest of the photocatalyst works in non-optimal lightingconditions that decrease the overall production. Also in this case it is possible to show theexistence of a concentration that maximizes the production given the working conditionsof the experiments.
42

It has to be noted that the concentrations of photocatalyst and cellulose that maximizethe production are most probably dependent on a bunch of factors such as the geometryof the reactor, the lighting conditions and the photocatalyst and cellulose type used. Achange in one of these factors may result in a change of the optimal values. The analysishere reported thus only applies to the conditions mentioned, and does not aim at providingabsolute values but rather qualitatively showing in what way the concentrations influencethe performances.
Figure 30 also allows to see how the rate of production normalized with respect to themass of photocatalyst used always decreases when the concentration is increased, despitethe total production actually increasing. Two operational strategies can therefore be high-lighted for such a photocatalytic system, one aiming at maximizing the total production,the efficiency of utilization of the light source and of the space available through higherconcentrations, and one aiming at maximizing how effectively each mass unit of photo-catalyst is used through lower concentrations. The best compromise probably lies in themiddle, and depends on key factors such as the cost of the photocatalyst.
Further experiments have been performed, again with Na CM cellulose, to observe thebehavior of the system at a different, constant concentration of photocatalyst and variableconcentration of cellulose. A concentration of photocatalyst equal to 1 mg/mL was chosen,being this the value that led to the highest total production among the ones tested. Figure31 shows, in the same graph, the total production at different cellulose concentrations, andat photocatalyst concentrations of 0.3 and 1 mg/mL.
43

Figure 31: Influence of cellulose concentration on total production at photocatalyst con-centrations of 0.3 and 1 mg/mL.
The behavior highlighted in Figure 31 may seem counter-intuitive. Indeed, it could havebeen expected that a higher concentration of photocatalyst would have allowed to de-grade more cellulose, shifting the curve up and to the right. Reality proved instead tobe different, with the highest performances in terms of production reached with a higherconcentration of photocatalyst and a much lower concentration of cellulose, and a generalshift of the curve up-left. Even the lowest concentration of cellulose tested, equal to 0.02mg/mL, led to decent performances. A possible reason is that, at a higher concentrationof photocatalyst, the transparency of the water is already dramatically reduced, implyingthat lower concentrations of cellulose are needed to allow the light to irradiate all or mostof the suspension. When 1 mg/mL of photocatalyst and 2.5 mg/mL of cellulose weretested, indeed, the solution was too dark, leading to the worst performances. The mostfavorable conditions to maximize the total production are thus a considerable amount ofphotocatalyst degrading a little quantity of cellulose.
Finally, Figure 32 shows the same graph but with reference to the production normal-ized with respect to the mass of photocatalyst.
44

Figure 32: Influence of cellulose concentration on normalized production at photocatalystconcentrations of 0.3 and 1 mg/mL.
In this case, any point at photocatalyst concentration 0.3 mg/mL exploits the materialbetter than any point at 1 mg/mL, suggesting that the trend of lower concentration forhigher specific production remains true regardless of the concentration of cellulose.
10.5 Study of pH
This section investigates the influence of suspension’s pH on the performances of the sys-tem. Before each experiment, the pH was adjusted to the desired value using HCl andNaOH.
It was observed that, whenever starting from a pH higher than 5 (maximum pH tested was10), at the end of the experiments a pH of 5 was always measured. It thus seems that pH5 represents a sort of steady state pH that the system reaches when starting from a higherpH. This can be explained keeping in mind the products involved in the degradation chainof cellulose, described in Section 4. Namely, formic acid (HCOOH) and CO2 are produced,both possibly responsible for the pH decrease of the system. Formic acid contributes tothe acidification dissociating into H+ and HCOO−, and CO2 by firstly reacting with waterforming H2CO3 and then dissociating in H+ and HCO−
3 [47]. The two acids, however,do not seem to be strong enough to lead the pH to values lower than 5, meaning thatwhen a concentration of protons corresponding to pH 5 is reached, no further dissociationoccurs. Any pH equal or higher than 5 should then lead to similar performances, being 5the steady state pH reached after few minutes regardless of the initial conditions.
45

The situation changes when a pH lower than 5 is used. When the initial pH was adjustedto any value lower than 5, the same value was measured at the end of the experiment.The system is thus unable to alter its concentration of protons when this is equal or higherthan 10−5 M. The results obtained at different pH values are summarized in Figure 33.
Figure 33: Influence of pH on H2 production. Dashed columns indicate unstable suspen-sion.
Figure 33 shows an increase of H2 production moving from pH 5 to pH 4. When the pHwas equal to 2 or 3, however, the suspension was unstable and agglomeration of particleswas observed. Thus, for those cases, the figure only shows with dashed columns the initialrate of H2 production, that however almost doubled switching from pH 5 to pH 2. Af-terwards, as the agglomeration becomes more severe, the rate of production decreases toalmost 0.What these results seem to suggest is that a low pH is in principle beneficial for the per-formances of the system, possibly due to more favorable thermodynamic conditions for H2
evolution: as Figure 6 shows, a lower pH value is associated to a less negative potentialneeded for reduction of protons. However, at pH 3 or lower the suspension becomes un-stable, canceling the effect of the more favorable thermodynamics.
In order to understand why the solution becomes unstable at low pH, it is useful tolook at the zeta potential of Na CM cellulose, shown in Figure 34.
46

Figure 34: Measured zeta-potential of Na CM cellulose.
It is possible to observe a quite negative zeta potential for pH 4 or higher, indicating anegative net charge on cellulose particles able to prevent their agglomeration. However,at pH 2 and 3, particles have a net charge close to 0, making the suspension unstable andenabling for agglomeration. This explains the results obtained for the experiments at pH2 and 3. It is interesting to note that, despite a negative zeta potential for cellulose at pH4 and 5, and a positive zeta potential for TiO2 nanoparticles, no agglomeration occurs, asinstead happens for rapeseed cellulose. The reason is probably the much smaller size ofNa CM cellulose particles.
Based on the observations reported in this section, it is possible to conclude that anacidic pH is beneficial for H2 evolution, provided that the suspension is stable. The stabil-ity of the suspension is dependent on the type of cellulose involved and its zeta potentialat different pH values. In the case of Na CM cellulose, pH 4 seems to represent the optimalcondition.
10.6 Estimation of efficiency
This sections aims at estimating the efficiency of the system, when Na CM cellulose is usedas sacrificial agent, at the values of concentrations and pH that in the previous sectionsled to the best performances among the ones tested, namely:
47

•Photocatalyst concentration: 1 mg/mL;•Cellulose concentration: 0.25 mg/mL;•pH: 4.
The type of efficiency analyzed is the light-energy-to-hydrogen-energy conversion efficiency(LHCE), that compares the energetic content of the H2 produced to the energy of the lightbeam shining on the reactor. The LHCE can be expressed as follows [48]:
ηLHCE(%) = 100(∆G0 −RTln(p0/p))RH2
EsA(6)
where ∆G0 is the change of Gibbs free energy for the water splitting reaction at 25 °C and1 atm, equal to 237200 J/mol, R is the universal gas constant, T the absolute temperatureequal to 313 K, p0 the atmospheric pressure and p the operating pressure, measured bythe sensor, RH2 the rate of H2 generation in mol/s, Es the intensity of the light shining onthe reactor, equal to 1000 W/m2, and A the area exposed to the light.Three different experiments were done to determine the rate of H2 production productionRH2 . In order to account for the area, the reactor was covered with aluminium foil wherea circular window with a 2.2 cm diameter was designed. Table 2 shows the rate of H2
production and efficiency obtained in each experiment:
Table 2: STH efficiency values for various experiments
Experiment RH2 (µmol/s) ηLHCE (%)
1 0.00252 0.142 0.00258 0.153 0.00245 0.14
All three experiments led to quite similar outcomes, that indicate a LHCE around 0.14-0.15 %. This value is fairly low, especially if compared to the value required for commercialfeasibility, around 10 % [49]. Such a low conversion of light energy to H2 energy indicatesthat efforts are necessary to synthesize a material able to exploit more efficiently thelight source. As Figure 16 shows, the photocatalyst used in the experiments significantlyabsorbs light only for wavelengths much lower than 400 nm, an extremely small part ofthe solar spectrum characterized by a higher probability to be absorbed by the glass ofthe reactor without even reaching the suspension. Moreover, it is reported that even ifall the UV light of the solar spectrum with wavelength up to 400 nm could be used, theLHCE would still be as low as 2 % [22]. For these reasons, attempts to prepare a materialwith improved absorption of light have been done and described in Section 10.8.
48
10.7 Comparison with other sacrificial agents
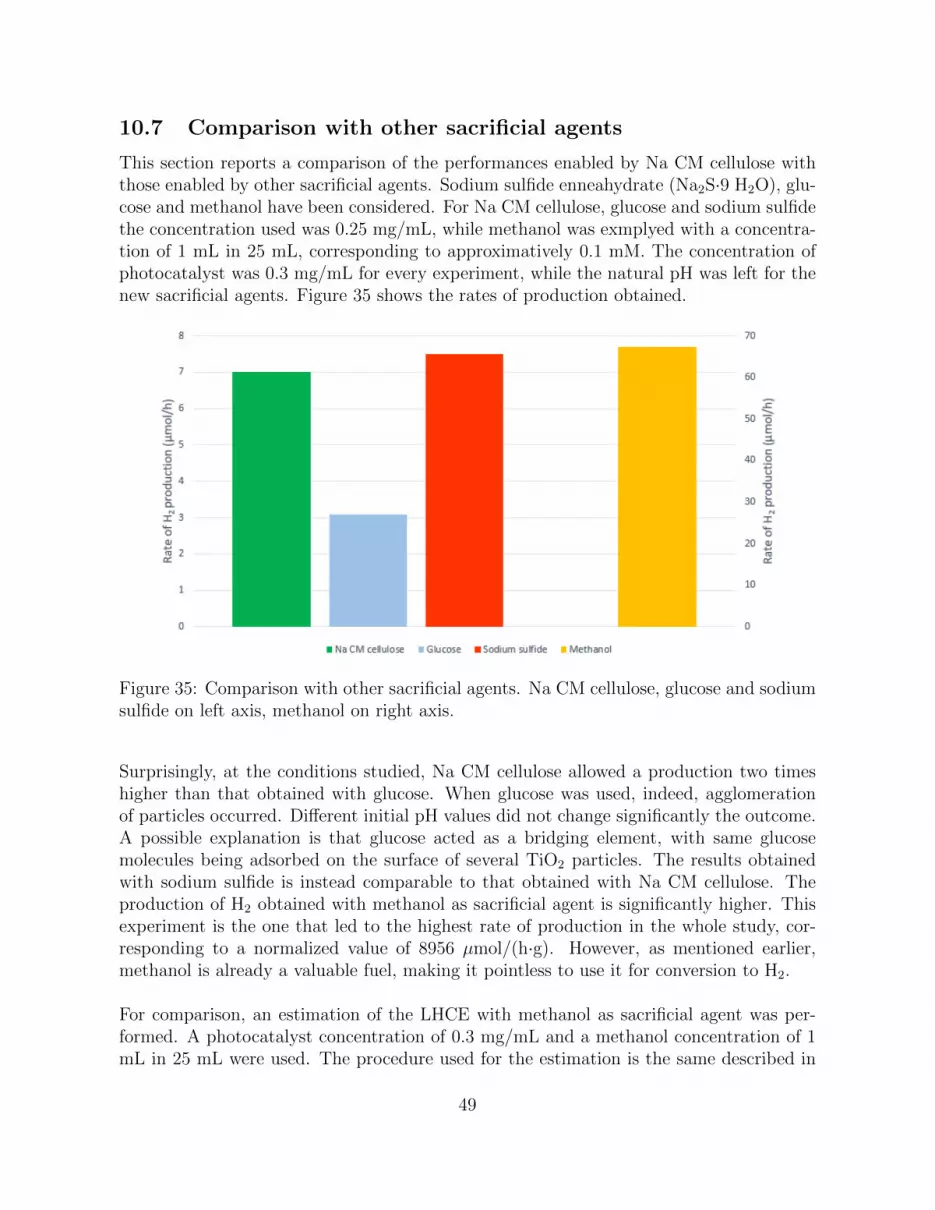
This section reports a comparison of the performances enabled by Na CM cellulose withthose enabled by other sacrificial agents. Sodium sulfide enneahydrate (Na2S·9 H2O), glu-cose and methanol have been considered. For Na CM cellulose, glucose and sodium sulfidethe concentration used was 0.25 mg/mL, while methanol was exmplyed with a concentra-tion of 1 mL in 25 mL, corresponding to approximatively 0.1 mM. The concentration ofphotocatalyst was 0.3 mg/mL for every experiment, while the natural pH was left for thenew sacrificial agents. Figure 35 shows the rates of production obtained.
Figure 35: Comparison with other sacrificial agents. Na CM cellulose, glucose and sodiumsulfide on left axis, methanol on right axis.
Surprisingly, at the conditions studied, Na CM cellulose allowed a production two timeshigher than that obtained with glucose. When glucose was used, indeed, agglomerationof particles occurred. Different initial pH values did not change significantly the outcome.A possible explanation is that glucose acted as a bridging element, with same glucosemolecules being adsorbed on the surface of several TiO2 particles. The results obtainedwith sodium sulfide is instead comparable to that obtained with Na CM cellulose. Theproduction of H2 obtained with methanol as sacrificial agent is significantly higher. Thisexperiment is the one that led to the highest rate of production in the whole study, cor-responding to a normalized value of 8956 µmol/(h·g). However, as mentioned earlier,methanol is already a valuable fuel, making it pointless to use it for conversion to H2.
For comparison, an estimation of the LHCE with methanol as sacrificial agent was per-formed. A photocatalyst concentration of 0.3 mg/mL and a methanol concentration of 1mL in 25 mL were used. The procedure used for the estimation is the same described in
49
Subsection 10.6. The result obtained is an efficiency of 0.63 %. Despite the improvementcompared to the conversion efficiency with Na CM cellulose (0.15 %), the efficiency is stillbelow 1 %, suggesting that much higher performances are required from the photocatalystside.
To summarize, Na CM cellulose behaves, at same mass concentration, better than orsimilarly to other well-known sacrificial agents which are not already a fuel, despite being,at the same time, a derivative of the most abundant polymer on earth. This proves itsgreat potential as sacrificial agent for photocatalytic production of H2.
10.8 Comparison with other photocatalysts
With the aim of achieving better performances and improve the absorption of light, 3Z-schemes involving g-C3N4 are here proposed. In order to be suitable to degrade cellu-lose, the photocatalyst must be able to generate OH• radicals through the water oxidationmechanism reported in Equation 2, while still being in condition to reduce protons withevolution of H2.
All the experiments reported in this section refer to a photocatalyst concentration of0.3 mg/mL and a concentration of Na CM cellulose of 0.25 mg/mL. Any other parametersuch as light intensity has been left unchanged.
10.8.1 TiO2/g-C3N4 heterojunction
The first Z-scheme proposed still involves TiO2. Several previous studies report the pos-sibility of a direct Z-scheme composed by TiO2 and g-C3N4 ([23], [50]). The main goal ofthis type of junction is not increasing the absorption of visible light, since TiO2 would stillact as a bottle neck, but rather exploiting the improved separation of charges promoted bythe Z-scheme. The junction is schematically depicted in Figure 36, in which it is possibleto appreciate holes in the TiO2 phase and electrons in the g-C3N4 phase.
50

Figure 36: Schematic representation of TiO2/C3N4 Z-scheme.
Yu et al. [50] employed this kind of junction to degrade formaldehyde, reporting a fasterdegradation with respect to the case in which pure TiO2 was used. A TiO2/g-C3N4 het-erojunction was thus prepared through a procedure similar to that followed by Yu et al.Briefly, a 30 mL suspension containing 300 g of P25 and 300 g of urea was ultrasonicatedand stirred for 3 h, with urea being the g-C3N4 precursor. The 1:1 mass ratio betweenP25 and urea has been chosen as it led to the best performances in the study conductedby Yu et al. After drying the suspension at 60°C, the resulting powder was ground andheated in a crucible with cover at 550 °C for 1 h., with a heating ramp of 10 °C/min.
The enhanced charge separation allowed by the Z-scheme has been proved by measur-ing the concentration of OH• radicals using TPA, with a procedure analogous to thatused in Subsection 10.2 and better clarified in Appendix 2. Two samples were preparedby suspending P25 TiO2 and the synthesized TiO2/g-C3N4, with a concentration of 0.2mg/mL, in 25 mL of a 500 µM TPA solution. The samples were then irradiated for 5 minand the respective emissions, caused by the hTPA generated when light was shined, wereobserved by PL spectroscopy. The obtained emission intensities and the correspondingconcentration of OH• radicals are displayed in Table 3.
The table shows a 3-fold increase in the concentration of OH• radicals when g-C3N4 isadded, attesting the enhanced separation of charges allowed by the Z-scheme.
51

Table 3: Emission intensity of hTPA and concentration of OH• radicals for P25 andTiO2/g-C3N4.
Material Emission intensity [OH•] (M)
P25 118.9 1.82·10−15
TiO2/g-C3N4 334.4 5.41·10−15
The UV-vis absorption spectrum displayed in Figure 37 reveals instead a decrease of theabsorption in the UV range accompanied by an increase in the visible region.
Figure 37: Light absorbance of P25 TiO2 and TiO2/g-C3N4.
The material was then tested for H2 generation. Though a modest generation of H2 couldbe observed when testing the material without any noble metal cocatalyst, Pt depositionwas necessary to achieve a considerable rate of production. Pt was therefore depositedaccording to the procedure clarified in Subsection 7.1, with a 0.5 % mass loading. Despiteall the encouraging characteristics shown above, the rate of H2 generation observed wasequal to 3.5 µmol/h, approximatively half of the rate observed when TiO2/Pt 0.5 % wasused at the same conditions.
52
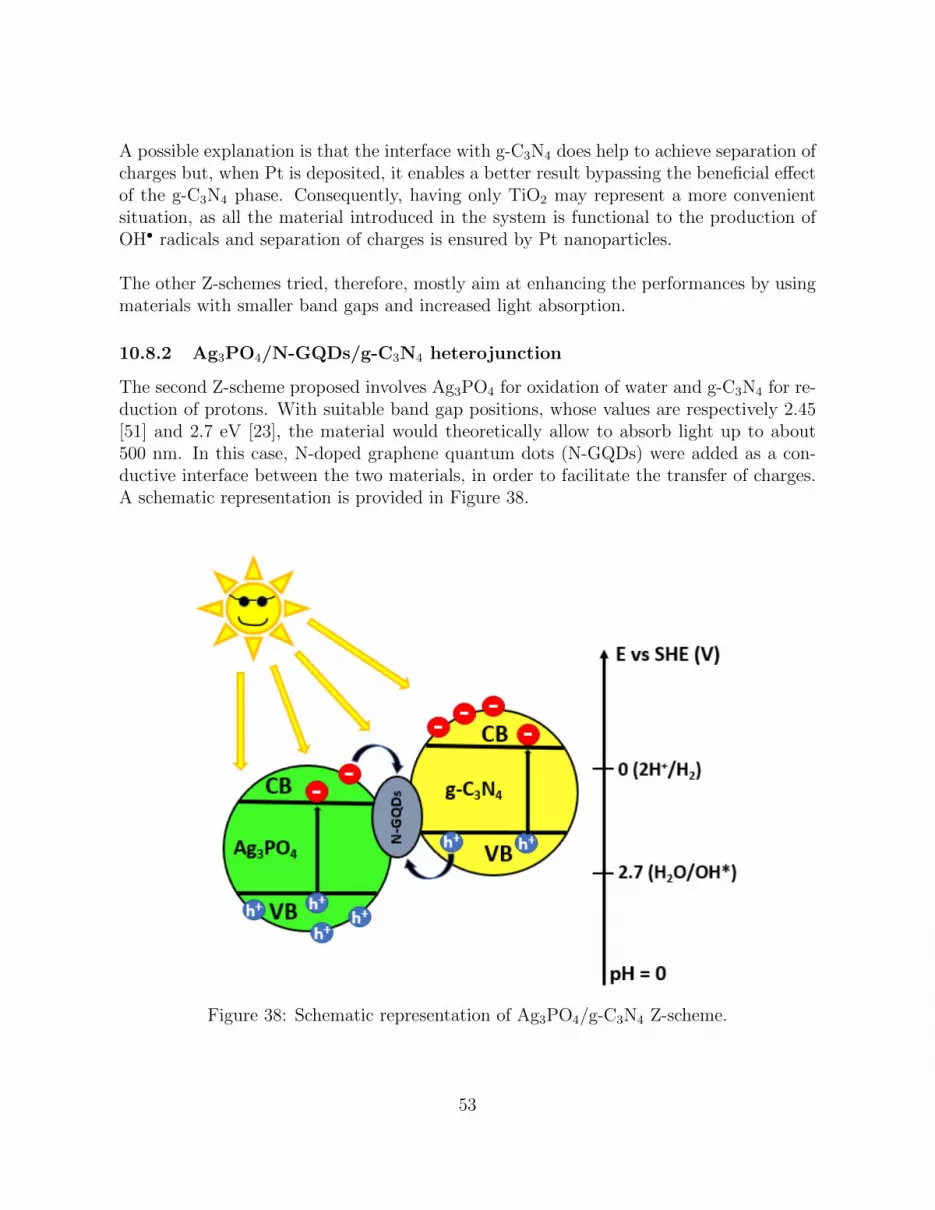
A possible explanation is that the interface with g-C3N4 does help to achieve separation ofcharges but, when Pt is deposited, it enables a better result bypassing the beneficial effectof the g-C3N4 phase. Consequently, having only TiO2 may represent a more convenientsituation, as all the material introduced in the system is functional to the production ofOH• radicals and separation of charges is ensured by Pt nanoparticles.
The other Z-schemes tried, therefore, mostly aim at enhancing the performances by usingmaterials with smaller band gaps and increased light absorption.
10.8.2 Ag3PO4/N-GQDs/g-C3N4 heterojunction
The second Z-scheme proposed involves Ag3PO4 for oxidation of water and g-C3N4 for re-duction of protons. With suitable band gap positions, whose values are respectively 2.45[51] and 2.7 eV [23], the material would theoretically allow to absorb light up to about500 nm. In this case, N-doped graphene quantum dots (N-GQDs) were added as a con-ductive interface between the two materials, in order to facilitate the transfer of charges.A schematic representation is provided in Figure 38.
Figure 38: Schematic representation of Ag3PO4/g-C3N4 Z-scheme.
53

Ag3PO4 particles were prepared following the procedure explained by Batvandi et al. [52].0.318 g of AgNO3 were dissolved in 32 mL of DI water, and 41 µL of orthophosphoric acidwere added at a rate of 1 drop every 3 seconds. 0.197 g of hexamethylenetetramine (HMT)were then added, followed by 15 minutes of magnetic stirring. The obtained product wascentrifuged and dried.
g-C3N4 sheets were prepared in a two steps process followed by thermal treatment andliquid exfoliation ([53], [54]). 5 g of melamime were heated at 520 °C in a crucible withcover for 4 hours, with a ramping rate of 5 °C/min. The obtained product was groundand heated again at 520 °C for 2 hours, with a ramping rate of 2 °C/min. An exfoliationprocess followed, according to which 1 g of g-C3N4 was dispersed in 50 mL of concentratedH2SO4 and kept for 6 hours under ultrasonication. The resultant suspension was washedwith DI water until being adjusted to pH 7, and the obtained product was dispersed in 50mL of ethanol and stored at 5 °C.
N-GQDs were prepared by dissolving 2 g of ammonium citrate tribasic in 40 mL of DIwater and refluxed at 200 °C for 30 mins. The obtained suspension adjusted to pH 7 andstored at 5 °C.
The Ag3PO4/N-GQDs/g-C3N4 was obtained following a refluxing technique reported inliterature [53]. 1 g of as prepared powder were dispersed in 30 mL of N-GQDs suspensionby 1 h ultrasonication, then stirring for 6 h and vacuum freeze drying. The remainingpowder was suspended in 15 mL of g-C3N4 suspension and ultrasonicated for 1 h. Theresulting suspension for kept at 65 °C under reflux overnight, then the condenser wasremoved until complete evaportation of the ethanol. The wet precipitate was kept in theoven at 60 °C for 3 h and finally ground.Figure 39 displays the light absorbance that has been measured for the material, with aninteresting peak in the visible region.
54

Figure 39: Light absorbance of Ag3PO4/g-C3N4 Z-scheme.
After deposition of Pt with a mass loading of 0.5 %, according to the procedure reportedin Subsection 7.1, the photocatalyst was tested for H2 prodection. Unfortunately, no H2
has been produced, most probably due to issues during the preparation of the materialyet not well clarified.
10.8.3 WO3/g-C3N4 heterojunction
The last Z-scheme proposed involves WO3 for water oxidation reaction and g-C3N4 forreduction of protons. With a band gap of 2.7 eV for both g-C3N4 and WO3 ([23], [27]),the material is expected to allow an increase of light absorption with respect to TiO2. Aschematization of the material has already been provided in Figure 13, that shows howthe positions of the band gaps are suitable for generation of OH• radicals and H2 evolution.
The photocatalyst was prepared according to the following procedure. At first, WO3
nanoaprticles have been prepared according to the method explained by Martinez-de laCruz et al. [55]. 0.00107 mol of ammonium tungstate hydrate have been dissolved in 67mL of DI water at 80 °C. 45 mL of concentrated HNO3 have then be added dropwise.The solution was kept for 40 mins under stirring at 80 °C, and was then allowed to settle
55

for 1 day at room temperature. The precipitate was collected and dried in oven at 80 °Covernight and finally thermally treated at 400 °C for 40 mins.
g-C3N4 nanosheets were prepared by keeping urea at 550 °C for 2.5 h in a crucible withcover. The obtained material was then ground into fine powder and annealed at the sametemperature for 1 h.
The WO3/g-C3N4 composite was prepared following a procedure similar to that reportedby Yang et al. [56]. WO3 and g-C3N4 were suspended in methanol and stirred for 24h. Different mass ratios of the two types of particles were tested. After volatilization ofmethanol, the particles were dried overnight at 80 °C and calcinated at 400 °C for 2 h.
The obtained powders were tested for H2 production with methanol as sacrificial agentand without any noble metal deposition, showing that a mass ratio of 1:1 leads to the bestperformances. Figure 40 shows the light absorption of the 1:1 WO3/g-C3N4 photocatalyst,that also in this case reaches the visible region.
Figure 40: Light absorbance of WO3/g-C3N4 Z-scheme.
WO3/g-C3N4 with 1:1 mass ratio was thus decorated with Pt nanoparticles with a mass
56

loading of 0.5 % and tested for H2 generation using Na CM cellulose as sacrificial agent.The rate of H2 obtained was 2 µmol/h, still less than half of that obtained with TiO2/Pt0.5 % at the same conditions.
Since the preparation of a good photocatalyst is a complex process that requires ex-perience and time, no further attempts were made within the short time available forthis study. The current lack of an estimation of the efficiency with a photocatalyst ableto absorb in the visible range, when cellulose is used as sacrificial agent, gives room forfurther research.
11 Sustainability aspects
A successful deployment of photocatalytic generation of H2 from cellulose would have sev-eral positive effects that can be listed in relation to some relevant Sustainable DevelopmentGoals [57]. Firstly, since the process represents a way to convert into fuel solar energy andthe chemical energy contained in cellulose molecules, both being renewable and abundantforms of energy, it would be helpful to achieve the SDG 7, Affordable and clean energy.The deployment of the technology would then boost local economies, industries, labour,and research, contributing simultaneously for the achievement of SDG 8, Decent workand economic growth, and SDG 9, Industry, innovation and infrastructure. The SDG11, Sustainable cities and communities, would also be pursued, as the carbon footprintof communities using the technology would be reduced. Finally, because of the reductionof CO2 emissions allowed, the technology would contribute in slowing down the ongoingclimate change in accordance to the SDG 13, Climate action. Figure 41 summarizes theSDGs involved.
Figure 41: SDGs related to the present study [57].
Possible issues may arise when it comes to the photocatalyst used, that should allow a good
57

efficiency while being affordable enough, without posing any significant environmentalthreat throughout all its life cycle.
12 Validity, reliability, replicability, scalability
The validity of the present study is ensured by the relevance of the topic investigated, wellfitting in the current framework of climate emergency, in which alternative, low carbonemitting energy sources and fuels are needed.Because of the short time span available for the study, it was not possible to repeat severaltimes every single experiment. Some key experiments, however, have been repeated mul-tiple times in order to still confer a good reliability to the observations made. Every timean experiment was repeated the results obtained were quite close to each other, suggestinga reasonable intrinsic acceptability.Since every step performed is carefully described, the replicability of the study is guaran-teed and any researcher is in condition to repeat the experiments.When performing the same study at a different scale, it is expected that, qualitatively,the trends shown are kept, though numeric results and positions of optima would mostprobably change.
13 Conclusions
This study investigated the possibility of photocatalytic H2 generation using cellulose assacrificial agent, being an innovative way to produce an environmentally friendly fuel ofrenewable origin. By employing TiO2/Pt as photocatalyst, different types of cellulosewere tested, highlighting how cellulose types with lower crystallinity index and cellulosederivatives containing CH2COOH, CH2COONa and COONa groups are most suitable forthe application. It was shown how the concentrations of photocatalyst and cellulose in-fluence the performances. Namely, a ”high” concentration of photocatalyst and a ”low”concentration of cellulose represent the optimal configuration to maximize the rate of H2
production. The pH of the reaction medium was demonstrated to be another key pa-rameter, with low pH values that, on the one hand, are helpful for H2 evolution, but, onthe other hand, hinder the stability of the suspension. A comparison with other sacrifi-cial agents showed how cellulose enables better performances than glucose at the testedconditions, while considerably higher rates of production can be achieved when methanolis employed, which is however a much more expensive option. The low light-energy-to-hydrogen-energy conversion efficiency (LHCE), estimated around 0.15 %, motivated theresearch of a new photocatalyst able to better exploit the light resource. Three suitable Z-scheme photocatalysts were tested, namely TiO2/g-C3N4, Ag3PO4/N-GQDs/g-C3N4 andWO3/g-C3N4. While TiO2/g-C3N4 and WO3/g-C3N4 showed a worsening of the perfor-mances, no useful result could be obtained with Ag3PO4/N-GQDs/g-C3N4, most probablydue to issues in the preparation process. Further research can be done to estimate the
58

LHCE with a photocatalyst able to absorb in the visible region, using a cheap, abundantand promising sacrificial agent such as cellulose.
59

References
[1] Paris Agreement, United Nations Framework Convention on Climate Change (2015),https://unfccc.int/process-and-meetings/the-paris-agreement/the-paris-agreement
[2] International Energy Agency, www.iea.org
[3] Lindsey R., ”Climate Change: Atmospheric Carbon Dioxide”, Climate.gov (2020),https://www.climate.gov/news-features/understanding-climate/climate-ch
ange-atmospheric-carbon-dioxide#:~:text=Carbon%20dioxide%20levels%20to
day%20are,least%20the%20past%20800%2C000%20years.&text=Global%20atmosph
eric%20carbon%20dioxide%20concentrations,interglacials%20(higher%20CO2).
[4] Calise F. et al., ”Detailed Modelling of the Deep Decarbonisation Scenarios withDemand Response Technologies in the Heating and Cooling Sector: A Case Studyfor Italy”, Energies (2017), 10(10), 1535
[5] Lassila J. et al., ”Network Effects of Electric Vehicles - Case From Nordic Country”,CIRED International Conference on Electricity Distribution (2011), 0773
[6] Mrozik W. et al., ”Environmental impacts, pollution sources and pathways of spentlithium-ion batteries”, Energy Environmental Science (2021), 14, 6099-6121
[7] ”Hydrogen Resources”, Energy.gov, https://www.energy.gov/eere/fuelcells/hydrogen-resources
[8] O’Neil S., ”Unlocking the Potential of Hydrogen Energy Storage”, FCHEA Fuel CellHydrogen Energy Association (2019),https://www.fchea.org/in-transition/2019/7/22/unlocking-the-potential-o
f-hydrogen-energy-storage#:~:text=Hydrogen%20energy%20storage%20is%20a,
in%20order%20to%20separate%20hydrogen.
[9] Sun S. et al., ”The role of pretreatment in improving the enzymatic hydrolysis oflignocellulosic materials”, Bioresource Technology (2016), 199, 49-58
[10] Nave R., ”Band Theory of Solids”, HyperPhysics http://hyperphysics.phy-astr.gsu.edu/hbase/Solids/band.html
[11] Siahrostami S. et al., ”One- or Two-electron Water Oxidation, Hydroxyl Radical orH2O2 Evolution”, The Journal of Physical Chemistry Letters (2017), 8, 6, 1157–1160
[12] Caravaca A. et al., ”H2 production by the photocatalytic reforming of cellulose andraw biomass using Ni, Pd, Pt and Au on titania”, Proceedings of the Royal SocietyA (2016), 472, 2191
[13] Wieserma B.J., ”Alternative and Enhanced Chemical Cleaning: Corrosion StudiesResults: FY2010”, Materials Science (2010)
60
[14] Tamirat A. G., ”Using hematite for photoelectrochemical water splitting: a review ofcurrent progress and challenges”, Nanoscale Horizons, 2016
[15] Fujishima A., Honda K., ”Electrochemical Photolysis of Water at a SemiconductorElectrode”, Nature (1972), 238, 37-38,
[16] Singh R., Dutta S., ”Integrated photocatalytic hydrogen production and pollutantsor wastes treatment: prospects and challenges”, Sustainable Fuel Technologies Hand-book (2021), 541-549
[17] Chong et al., ”Selective conversion of aqueous glucose to value-added sugar aldose onTiO2-based photocatalysts”, Journal of Catalysis (2014), 314, 101-108
[18] Speltini A. et al., ”Sunlight-promoted photocatalytic hydrogen gas evolution fromwater-suspended cellulose: a systematic study”, Photochemical Photobiological Sci-ences (2014), 13, 1410-1419
[19] Wu G., Chen, T., Zhou, G. et al., ”H2 production with low CO selectivity fromphotocatalytic reforming of glucose on metal/TiO2 catalysts”, Science in China SeriesB: Chemistry (2008), 51, 97–100
[20] Fu X. et al., ”Photocatalytic reforming of biomass: A systematic study of hydrogenevolution from glucose solution”, International Journal of Hydrogen Energy (2008),Volume 33, Issue 22, Pages 6484-6491
[21] Corredor J. et al., ”Comprehensive review and future perspectives on the photo-catalytic hydrogen production”, Journal of Chemical Technology and Biotechnology(2019), 94, 3049-3063
[22] Abe R., ”Recent progress on photocatalytic and photoelectrochemical water split-ting under visible light irradiation”, Journal of Photochemistry and Photobiology C:Photochemistry Reviews (2010), 11, 179-209
[23] San Martin S. et al., ”Unravelling the Mechanisms that Drive the Performance ofPhotocatalytic Hydrogen Production”, Catalysts (2020), 10, 901
[24] Raza W., Ahmad K., ”Chapter 6 - Graphitic carbon nitride-based photocatalystsfor hydrogen production”, Sustainable Materials and Green Processing for EnergyConversion (2022), 213-236
[25] Xie M. et al., ”Hydrogen production by photocatalytic water-splitting on Pt-dopedTiO2–ZnO under visible light”, Journal of the Taiwan Institute of Chemical Engineers(2017), 70, 161-167
[26] Perez-Larios A. et al., ”Improved hydrogen production from water splitting usingTiO2–ZnO mixed oxides photocatalysts”, Fuel (2012), 100, 139-143
61

[27] Xing P. et al., ”Preparation of WO3/g-C3N4 composites with enhanced photocat-alytic hydrogen production performance”, Applied Physics A (2019), 125, 788
[28] Du J. et al., ”Ag3PO4/g-C3N4 Z-scheme composites with enhanced visible-light-driven disinfection and organic pollutants degradation: Uncovering the mechanism”,Applied Surface Science (2021), 541, 148487
[29] Huang F. et al., ”Influences of Doping on Photocatalytic Properties of TiO2 Photo-catalyst”, Semiconductor Photocatalysis - Materials, Mechanisms and Applications(2016)
[30] Deng F. et al., ”3 - Nanomaterial-Based Photocatalytic Hydrogen Production”, Nano-materials for the Removal of Pollutants and Resource Reutilization (2019), 59-82
[31] Li Q. et al., ”Chapter 10 - Surface and interface modification strategies of CdS-basedphotocatalysts”, Interface Science and Technology (2020), 31, 313-348
[32] Chang C., ”Using cellulose polymorphs for enhanced hydrogen production from pho-tocatalytic reforming”, Sustainable Energy Fuels (2019), 3, 1971-1975
[33] Wakerley D. et al., ”Solar-driven reforming of lignocellulose to H2 with a CdS/CdOxphotocatalyst”, Nature Energy (2017), 2, 17021
[34] Yao W. et al., ”Chemical deposition of platinum nanoparticles on iridium oxide foroxygen electrode of unitized regenerative fuel cell”, Electrochemistry Communications(2007), 9, 1029-1034
[35] ”Ligning”, Wikipedia, https://en.wikipedia.org/wiki/Lignin
[36] Holtzapple M. T., ”Cellulose”, Encyclopedia of Food Sciences and Nutrition (SecondEdition) (2003), 998-1007
[37] Durig T., Karan K., ”Chapter 9 - Binders in Wet Granulation”, Handbook of Phar-maceutical Wet Granulation (2019), 317-349,
[38] Kaffashsaie E. et al., ”Direct conversion of raw wood to TEMPO-oxidized cellulosenanofibers”, Carbohydrate Polymers (2021), Volume 262, 117938
[39] Alavi M., Rai M., ”Recent progress in nanoformulations of silver nanoparticles withcellulose, chitosan, and alginic acid biopolymers for antibacterial applications”, Ap-plied M
[40] OSRAM, www.osram.com
[41] ”Solar radiation”, Kipp & Zonen, https://www.kippzonen.com/Knowledge-Center/Theoretical-info/Solar-Radiation
62

[42] ”Solar Radiation Photosynthetically Active Radia-tio”, Fondriest, https://www.fondriest.com/environmental-measurements/parameters/weather/photosynthetically-active-radiation/
[43] Page S. et al., ”Terephthalate as a probe for photochemically generated hydroxylradical”, Journal of Environmental Monitoring (2010), 12, 1658-1665
[44] Pate K., Safier P., ”12 - Chemical metrology methods for CMP quality”, Advancesin Chemical Mechanical Planarization (CMP) (2016), 299-325
[45] Benz D. et al., ”Assessing the Role of Pt Clusters on TiO2 (P25) on the PhotocatalyticDegradation of Acid Blue 9 and Rhodamine B”, The Journal of Physical ChemistryC (2020), 124, 15, 8269–8278
[46] Kalpakli Y. et al., ”Photocatalytic degradation of textile dye CI Basic Yellow 28wastewater by Degussa P25 based TiO2”, Advances in environmental research (2015),volume 4, issue 1, pages 25-38
[47] ”Ocean acidification”, National Oceanic and Atmospheric Administration,https://www.noaa.gov/education/resource-collections/ocean-coasts/ocean-acidification
[48] Kosourov S. et al., ”Evaluation of light energy to H2 energy conversion efficiency inthin films of cyanobacteria and green alga under photoautotrophic conditions”, AlgalResearch (2017), 28, 253-263
[49] Cox C. R. et al., ”Ten-percent solar-to-fuel conversion with nonprecious materials”,PNAS September 30 (2014), 111 (39), 14057-14061
[50] Yu J. et al., ”Enhanced photocatalytic performance of direct Z-scheme g-C3N4–TiO2photocatalysts for the decomposition of formaldehyde in air”, Physical ChemistryChemical Physics (2013), 15, 16883-16890
[51] Liu J. J. et al., ”Electronic structure and optical properties of Ag3PO4 photocatalystcalculated by hybrid density functional method”, Appl. Phys. Lett. (2011), 99, 191903
[52] Batvandi M. et al., ”Synthesis of Ag3PO4 microstructures with morphology-dependent optical and photocatalytic behaviors”, Applied Physics A (2020), 126,571
[53] Feng C. et al., ”Core-shell Ag2CrO4/N-GQDs@g-C3N4 composites with anti-photocorrosion performance for enhanced full-spectrum-light photocatalytic activi-ties”, Applied Catalysis B: Environmental (2018), 239, 525-536
[54] Deng Y. et al., ”Construction of plasmonic Ag and nitrogen-doped graphene quan-tum dots codecorated ultrathin graphitic carbon nitride nanosheet composites withenhanced photocatalytic activity: full-spectrum response ability and mechanism in-sight”, ACS Appl. Mater. Interfaces (2017), 9, 42816–42828
63

[55] Martinez-de la Cruz et al., ”Synthesis and characterization of WO3 nanoparticlesprepared by the precipitation method: Evaluation of photocatalytic activity undervis-irradiation”, Solid State Sciences (2010), 12, 88-94
[56] Jang M. et al., ”The influence of preparation method on the photocatalytic perfor-mance of g-C3N4/WO3 composite photocatalyst”, Ceramics International (2014), 40,11963-11969
[57] ”The 17 Goals”, United Nations, https://sdgs.un.org/goals
[58] Unisense, https://unisense.com/
64

14 Appendices
Appendix 1: Sensor working principle and calibration
The sensor works thanks to a tip containing a membrane and a Pt anode. Pushed by theeffect of pressure, some of the H2 molecules present in the sensing environment will passthrough the tip membrane and will be oxidized by the platinum electrode. The oxidationcurrent is then converted into an output voltage signal in mV [58].With a calibration of the instrument at points with known H2 concentration, it is possibleto translate the voltage output in concentration values in µmol/L. Since the temperaturewill affect the partial pressure of the gas, and thus the number of atoms that will passthrough the tip membrane in the same time amount, the calibration has to be done atthe same temperature of the experiments. Temperature is in turn measured thanks to asensor that follows the same principle, which is already calibrated by the manufacturer togive an output in °C.Experiments were carried out to figure out the steady state temperature of the location ofthe gas phase where the sensors were placed. In order to limit the temperature variationand reach reasonably soon a steady state temperature a fan was used to cool down thesystem. As a result a steady state temperature of around 40 °C was observed. Figure 42shows the temperature variation observed during one of the experiments at the sensorslocation in the gas phase.
Figure 42: Temperature evolution at the sensors’ location in the gas phase.
Thus, the H2 sensor was periodically calibrated at 40 °C. As stated in the sensor’s manual[58], 2 points with known H2 concentration and voltage output values are necessary toperform the calibration. Indeed, a linear correlation exists between voltage output and
65

concentration, which is completely defined if two points are known.
One of the two points is simply the 0 point. A H2 concentration of 0 µmol/L has beenassumed for ambient air at 40 °C. The other point has been defined by using gas composedby 95% N2 and 5% H2. A volume was filled with the mentioned gas and simultaneouslyheated up to 40 °C. The H2 concentration was found by applying the law of perfect gases:
pH2V = nH2RT (7)
where pH2 is the partial pressure of the hydrogen, V the volume occupied, nH2 the amountof moles, R the gas constant and T the temperature. pH2 is given by the total pressure ofthe gas, which is also sensed by the hydrogen sensor, multiplied times the molar fractionof hydrogen, i.e., 5%. From equation 7 it is possible to obtain an expression for theconcentration of hydrogen at the described conditions:
nH2
V=
pH2
RT(8)
Table 4 reports the voltage outputs and the H2 concentrations for a typical calibration.The calibration process was periodically repeated to ensure reliability of the measures.
Table 4: Hydrogen sensor’s calibration points
H2 Concentration (µmol/L) Voltage (mV)
0 7.331975.83 272.76
Appendix 2: Estimation of OH• radicals using TPA
As a first step towards the estimation of the concentration of OH• radicals, a calibrationwas done to find a correlation between known concentrations of hTPA and the correspond-ing intensity of the fluorescent peak at 425 nm, consequent to excitation at 325 nm. Thecalibration is summarized in Figure 43, that shows a linear relation between concentrationand intensity.
66

Figure 43: Relation between hTPA concentration and fluorescent intensity at 425 nm.
A linear interpolation of the calibrating points, whose equation is specified in the graph,allows to find an unknown concentration of hTPA given a certain fluorescent intensity.The intensity of the peak emission at 425 nm measured after the experiment with TiO2/Pt0.5 % described in Subsection 10.2 was equal to 341.8. This value, according to thecalibration curve in Figure 43, corresponds to a hTPA concentration of 1.27 µM. Then,Equation 6 was applied to find the steady state concentration of OH• radicals. In orderto provide an accurate measure the quenching rate of hTPA should be taken into account,as hTPA can also react with OH• radicals. However, being the concentration of hTPAmuch lower than that of TPA, the quenching rate has been considered negligible comparedto the generation rate. Equation 6 was then the only equation applied. Considering thesmall irradiation time, a linear approximation has been performed, according to whichEquation 6 can be re-written in the following form:
[hTPA]t1 − [hTPA]t0t1 − t0
= k[TPA]ave[OH•]ssY (9)
t0 represents the time instant at the beginning of the reaction, set equal to 0 s, while t1is the time instant associated to the end of the reaction and corresponding to 5 min. ThehTPA concentration at t1 has been obtained above, while it is equal to 0 at t0. [TPA]averepresents the average concentration of TPA, calculated as the arithmetic average of theTPA concentrations at t0 and t1. The TPA concentration at t0 is that of the originalsolution, i.e., 500 µM, while the concentration at t1 can be found using the calculated
67

concentration of hTPA at t1:
[TPA]t1 = [TPA]t0 −[hTPA]t1
Y(10)
Where Y is the fraction of reacted TPA molecules that were converted to hTPA. Theequation leads to a concentration of TPA at t1 equal to 498.2 µM.All the necessary values are thus known and the steady state concentration of OH• radicalscan be obtained.
68


