Embed Size (px)
Citation preview

Pu
NOa
b
a
ARR1AA
KDDMMC
1
oiliMsoihtz
asa
dT
dT
0d
Applied Catalysis B: Environmental 113– 114 (2012) 180– 191
Contents lists available at SciVerse ScienceDirect
Applied Catalysis B: Environmental
journa l h o me pa ge: www.elsev ier .com/ locate /apcatb
hotocatalytic degradation of rhodamine B using Mo heterogeneous catalystsnder aerobic conditions
uno U. Silvaa, Teresa G. Nunesb, Marta S. Saraivaa, Mohammad S. Shalamzaria, Pedro D. Vaza,∗∗,linda C. Monteiroa, Carla D. Nunesa,∗
CQB, Departamento de Química e Bioquímica, Faculdade de Ciências, Universidade de Lisboa, 1749-016 Lisboa, PortugalCQE, Instituto Superior Técnico, Universidade Técnica de Lisboa, Av. RoviscoPais, 1049-001 Lisboa, Portugal
r t i c l e i n f o
rticle history:eceived 22 September 2011eceived in revised form6 November 2011ccepted 18 November 2011vailable online 30 November 2011
a b s t r a c t
MCM-41 based materials were prepared with immobilized MoII and MoVI active sites based on[MoI2(CO)3] and [MoO2Cl2] cores, respectively, using a 2-aminopyridine glycidyloxypropyl derivativeas anchoring ligand. Suitable characterization by powder X-ray diffraction, FTIR and, 13C and 29Si solidstate NMR spectroscopy was accomplished. All new materials were successfully used in photodegrada-tion experiments of rhodamine B under aerobic conditions. Control experiments using neat MCM-41 anddirect photolysis of rhodamine B were also carried out. All experiments were run without any external
eywords:FTyeCM-41olybdenum
source of oxygen other than air. Photocatalytic results show that the presence of Mo and its oxidationstate is not innocent in this process. In addition, Mo catalysts act most probably by quenching rhodamineB excited state leading to extended degradation of the dye, through secondary photochemistry, beyond asimple de-ethylation process. Density functional theory (DFT) results corroborate with this showing thatwhen rhodamine B is in excited state the xanthene moiety bond orders change.
atalysis
. Introduction
Since the discovery of the periodic mesoporous molecular sievesf the M41S family by researchers at Mobil in 1992 [1], a new eran inclusion chemistry began [2]. It is now obvious that morpho-ogical control and texture of mesoporous silica, though extremelymportant for diverse applications [3,4], is now easily achieved [5].
esoporous materials are synthesized using surfactants (and co-urfactants) as structure directing agents, around which a sourcef the building blocks of interest, e.g. sodium silicate, will polymer-ze yielding the mesoporous structure after proper ageing underydrothermal conditions. This results in materials that are attrac-ive due to the considerably large pores when compared witheolites making them ideal for guest molecules uptake [1,6].
MCM-41, one of the members of the M41S family, possesses
high surface area, an ordered framework and a narrow poreize distribution. These structural features give MCM-41 potentialpplications as host material, catalyst for reactions involving large∗ Corresponding author at: CQB, Departamento de Química e Bioquímica, Facul-ade de Ciências, Universidade de Lisboa, 1749-016 Lisboa, Portugal.el.: +351 217 500 876; fax: +351 217 500 088.∗∗ Corresponding author at: CQB, Departamento de Química e Bioquímica, Facul-ade de Ciências, Universidade de Lisboa, 1749-016 Lisboa, Portugal.el.: +351 217 500 877; fax: +351 217 500 088.
E-mail addresses: [email protected] (P.D. Vaz), [email protected] (C.D. Nunes).
926-3373/$ – see front matter © 2011 Elsevier B.V. All rights reserved.oi:10.1016/j.apcatb.2011.11.036
© 2011 Elsevier B.V. All rights reserved.
molecules and as chromatographic material [7,8]. The mesoporousmaterials are of great interest for catalytic applications due to theirlarge and uniform pores that can be used as hosts for incorporationof different metals, creating and enlarging the activity inside theporous frameworks. Until now, three processes have been reportedfor active site introduction in mesoporous materials: (1) one-potsynthesis [9–11], in which metal organic or inorganic precursors aredirectly added in the parent silicon sol whereby the metal becomespart of the wall structure; (2) template-ion exchange [12], in whichthe template ions of the as-prepared materials are exchanged withother metal ions in solution; and (3) post-synthesis modificationin which the abundant surface Si–OH bonds of calcined materialsreact with (organo)metallic complexes or other metal compounds[13–16]. Specific surface properties can be tailored by either propersurface modifications [9] or isomorphous substitution of Si atomsby tri- (Al, B) or tetravalent (Ge) metal cations [10–12].
In recent years attention has been drawn to pollutant reme-diation processes. The development of techniques to accomplishsuch end is still an area under strong development, given theplethora of pollutant systems to deal with. In the particular case oftextile industry, dye pollutants are a dangerous source of environ-mental contaminants owing to their resistance to biodegradation
[16,17]. Several useful processes such as sonolysis [18], photocatal-ysis [19–21] and (photo-)Fenton reactions [22–24] have emergedas adequate approaches for the decomposition of organic com-pounds in acidic or neutral media. However, reports concerning the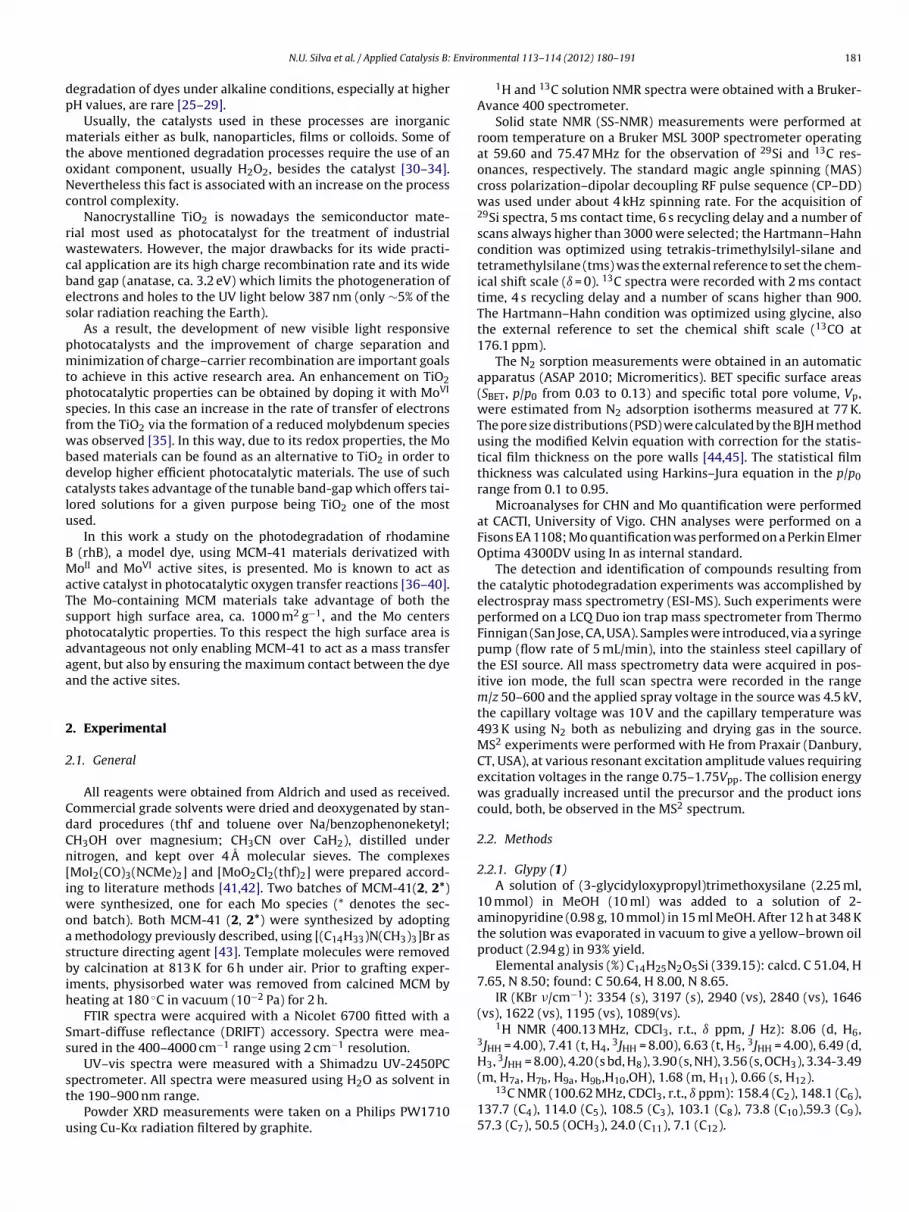
Envir
dp
mtoNc
rwcbes
pmtpsfwbdclu
BMaTspaaa
2
2
CdCn[iwoasbih
Ss
st
u
N.U. Silva et al. / Applied Catalysis B:
egradation of dyes under alkaline conditions, especially at higherH values, are rare [25–29].
Usually, the catalysts used in these processes are inorganicaterials either as bulk, nanoparticles, films or colloids. Some of
he above mentioned degradation processes require the use of anxidant component, usually H2O2, besides the catalyst [30–34].evertheless this fact is associated with an increase on the processontrol complexity.
Nanocrystalline TiO2 is nowadays the semiconductor mate-ial most used as photocatalyst for the treatment of industrialastewaters. However, the major drawbacks for its wide practi-
al application are its high charge recombination rate and its wideand gap (anatase, ca. 3.2 eV) which limits the photogeneration oflectrons and holes to the UV light below 387 nm (only ∼5% of theolar radiation reaching the Earth).
As a result, the development of new visible light responsivehotocatalysts and the improvement of charge separation andinimization of charge–carrier recombination are important goals
o achieve in this active research area. An enhancement on TiO2hotocatalytic properties can be obtained by doping it with MoVI
pecies. In this case an increase in the rate of transfer of electronsrom the TiO2 via the formation of a reduced molybdenum speciesas observed [35]. In this way, due to its redox properties, the Mo
ased materials can be found as an alternative to TiO2 in order toevelop higher efficient photocatalytic materials. The use of suchatalysts takes advantage of the tunable band-gap which offers tai-ored solutions for a given purpose being TiO2 one of the mostsed.
In this work a study on the photodegradation of rhodamine (rhB), a model dye, using MCM-41 materials derivatized withoII and MoVI active sites, is presented. Mo is known to act as
ctive catalyst in photocatalytic oxygen transfer reactions [36–40].he Mo-containing MCM materials take advantage of both theupport high surface area, ca. 1000 m2 g−1, and the Mo centershotocatalytic properties. To this respect the high surface area isdvantageous not only enabling MCM-41 to act as a mass transfergent, but also by ensuring the maximum contact between the dyend the active sites.
. Experimental
.1. General
All reagents were obtained from Aldrich and used as received.ommercial grade solvents were dried and deoxygenated by stan-ard procedures (thf and toluene over Na/benzophenoneketyl;H3OH over magnesium; CH3CN over CaH2), distilled underitrogen, and kept over 4 A molecular sieves. The complexesMoI2(CO)3(NCMe)2] and [MoO2Cl2(thf)2] were prepared accord-ng to literature methods [41,42]. Two batches of MCM-41(2, 2*)
ere synthesized, one for each Mo species (* denotes the sec-nd batch). Both MCM-41 (2, 2*) were synthesized by adopting
methodology previously described, using [(C14H33)N(CH3)3]Br astructure directing agent [43]. Template molecules were removedy calcination at 813 K for 6 h under air. Prior to grafting exper-
ments, physisorbed water was removed from calcined MCM byeating at 180 ◦C in vacuum (10−2 Pa) for 2 h.
FTIR spectra were acquired with a Nicolet 6700 fitted with amart-diffuse reflectance (DRIFT) accessory. Spectra were mea-ured in the 400–4000 cm−1 range using 2 cm−1 resolution.
UV–vis spectra were measured with a Shimadzu UV-2450PC
pectrometer. All spectra were measured using H2O as solvent inhe 190–900 nm range.Powder XRD measurements were taken on a Philips PW1710sing Cu-K� radiation filtered by graphite.
onmental 113– 114 (2012) 180– 191 181
1H and 13C solution NMR spectra were obtained with a Bruker-Avance 400 spectrometer.
Solid state NMR (SS-NMR) measurements were performed atroom temperature on a Bruker MSL 300P spectrometer operatingat 59.60 and 75.47 MHz for the observation of 29Si and 13C res-onances, respectively. The standard magic angle spinning (MAS)cross polarization–dipolar decoupling RF pulse sequence (CP–DD)was used under about 4 kHz spinning rate. For the acquisition of29Si spectra, 5 ms contact time, 6 s recycling delay and a number ofscans always higher than 3000 were selected; the Hartmann–Hahncondition was optimized using tetrakis-trimethylsilyl-silane andtetramethylsilane (tms) was the external reference to set the chem-ical shift scale (ı = 0). 13C spectra were recorded with 2 ms contacttime, 4 s recycling delay and a number of scans higher than 900.The Hartmann–Hahn condition was optimized using glycine, alsothe external reference to set the chemical shift scale (13CO at176.1 ppm).
The N2 sorption measurements were obtained in an automaticapparatus (ASAP 2010; Micromeritics). BET specific surface areas(SBET, p/p0 from 0.03 to 0.13) and specific total pore volume, Vp,were estimated from N2 adsorption isotherms measured at 77 K.The pore size distributions (PSD) were calculated by the BJH methodusing the modified Kelvin equation with correction for the statis-tical film thickness on the pore walls [44,45]. The statistical filmthickness was calculated using Harkins–Jura equation in the p/p0range from 0.1 to 0.95.
Microanalyses for CHN and Mo quantification were performedat CACTI, University of Vigo. CHN analyses were performed on aFisons EA 1108; Mo quantification was performed on a Perkin ElmerOptima 4300DV using In as internal standard.
The detection and identification of compounds resulting fromthe catalytic photodegradation experiments was accomplished byelectrospray mass spectrometry (ESI-MS). Such experiments wereperformed on a LCQ Duo ion trap mass spectrometer from ThermoFinnigan (San Jose, CA, USA). Samples were introduced, via a syringepump (flow rate of 5 mL/min), into the stainless steel capillary ofthe ESI source. All mass spectrometry data were acquired in pos-itive ion mode, the full scan spectra were recorded in the rangem/z 50–600 and the applied spray voltage in the source was 4.5 kV,the capillary voltage was 10 V and the capillary temperature was493 K using N2 both as nebulizing and drying gas in the source.MS2 experiments were performed with He from Praxair (Danbury,CT, USA), at various resonant excitation amplitude values requiringexcitation voltages in the range 0.75–1.75Vpp. The collision energywas gradually increased until the precursor and the product ionscould, both, be observed in the MS2 spectrum.
2.2. Methods
2.2.1. Glypy (1)A solution of (3-glycidyloxypropyl)trimethoxysilane (2.25 ml,
10 mmol) in MeOH (10 ml) was added to a solution of 2-aminopyridine (0.98 g, 10 mmol) in 15 ml MeOH. After 12 h at 348 Kthe solution was evaporated in vacuum to give a yellow–brown oilproduct (2.94 g) in 93% yield.
Elemental analysis (%) C14H25N2O5Si (339.15): calcd. C 51.04, H7.65, N 8.50; found: C 50.64, H 8.00, N 8.65.
IR (KBr �/cm−1): 3354 (s), 3197 (s), 2940 (vs), 2840 (vs), 1646(vs), 1622 (vs), 1195 (vs), 1089(vs).
1H NMR (400.13 MHz, CDCl3, r.t., ı ppm, J Hz): 8.06 (d, H6,3JHH = 4.00), 7.41 (t, H4, 3JHH = 8.00), 6.63 (t, H5, 3JHH = 4.00), 6.49 (d,H3, 3JHH = 8.00), 4.20 (s bd, H8), 3.90 (s, NH), 3.56 (s, OCH3), 3.34-3.49
(m, H7a, H7b, H9a, H9b,H10,OH), 1.68 (m, H11), 0.66 (s, H12).13C NMR (100.62 MHz, CDCl3, r.t., ı ppm): 158.4 (C2), 148.1 (C6),137.7 (C4), 114.0 (C5), 108.5 (C3), 103.1 (C8), 73.8 (C10),59.3 (C9),57.3 (C7), 50.5 (OCH3), 24.0 (C11), 7.1 (C12).
1 : Envir
2
wtfid
2((8
(
7
2(1
(
7
2
C(sr(
1
−
(
2
w(T(
1
(
(
2
fBepcwoson
82 N.U. Silva et al. / Applied Catalysis B
.2.2. MCM-glypy (3, 3*)A solution of glypy (1) (0.387 g, 1.1 mmol) in toluene (10 mL)
as added to a MCM-41 suspension (1 g) in toluene (10 mL), andhe mixture was heated at 373 K for 9 h. The resulting solid wasltered off and washed four times with CH2Cl2 (4 × 15 mL), thenried in vacuum at 323 K for 2 h.
.2.2.1. (3) Elemental analysis (%): found C 10.96, H 2.03, N 1.38. IR�/cm−1): 3904 (w), 3854 (w), 3840 (w), 3752 (w), 3676 (w), 3400s), 3240 (f), 2930 (m), 1654 (m), 1628 (m), 1240 (vs), 1079 (vs),00 (s).
29Si CP MAS NMR (ı ppm): −50 (T1) −57 (T2), −67 (T3), −100Q3), −110 (Q4).
13C CP MAS NMR (ı ppm): 143.1, 128.3, 124.8 (pyridine moiety),3.9 (C10), 57.3 (C9, C7), 22.2 (C11), 8.2 (C12).
.2.2.2. (3*) Elemental analysis (%): found C 11.91, H 1.98, N 1.22. IR�/cm−1): 3440 (s), 3260 (f), 2950 (m), 1630 (m), 1628 (s), 1590 (w),490 (w), 1450 (m), 1250 (vs), 1100 (vs), 818 (s).
29Si CP MAS NMR (ı ppm): −57 (T2), −67 (T3), −92 (Q2), −102Q3), −109 (Q4).
13C CP MAS NMR (ı ppm): 143.1, 128.3, 125.0 (pyridine moiety),3.6 (C10), 58.2 (C9, C7), 48.4 (OCH3), 22.2 (C11), 8.4 (C12).
.2.3. MCM-glypy-MoII (4)A solution of [MoI2(CO)3(NCMe)2] (0.335 g, 0.65 mmol) in dry
H2Cl2 (5 mL) was added to a suspension of 0.9 g of MCM-glypy3) material in dry CH2Cl2 (15 mL). The reaction mixture wastirred under a N2 atmosphere at room temperature overnight. Theesulting material was then filtered off, washed twice with CH2Cl23 × 20 mL), and dried under vacuum for 3 h.
Elemental analysis (%): found C 9.44, H 1.65, N 0.88, Mo 1.80IR (�/cm−1): 3748 (w), 3383 (vs), 2941 (m), 2030 (w), 1960 (w),
880 (w), 1668 (s), 1634 (s), 1240 (vs), 1070 (vs), 969 (m).29Si CP MAS NMR (ı ppm): −56 (T2), −65 (T3), −100.7 (Q3),
109.3 (Q4).13C CP MAS NMR (ı ppm): 154.5, 142.9 (pyridine moiety), 73.7
C10), 59.2 (C9, C7), 22.4 (C11), 8.8 (C12).
.2.4. MCM-glypy-MoVI (5)A solution of [MoO2Cl2(thf)2] (0.52 g, 1.5 mmol) in CH2Cl2 (5 mL)
as added to a suspension of the MCM-glypy (3*) (1.0 g) in CH2Cl210 mL) and the mixture stirred overnight at room temperature.he resultant solid was then filtered off and washed with CH2Cl23 × 20 mL), and dried in vacuum at room temperature for 3 h.
Elemental analysis (%): found C 8.98, H 1.76, N 0.99, Mo 4.62IR (�/cm−1): 3744 (w), 3407 (vs), 2950 (w), 2900 (w), 1667 (s),
629 (s), 1240 (vs), 1081 (vs), 958 (m), 939 (m).29Si CP MAS NMR (ı ppm): −58 (T2), −69 (T3), −101 (Q3), −109
Q4).13C CP MAS NMR (ı ppm): 154.5, 143.1 (pyridine moiety), 73.6
C10), 67.5 (C9), 58.6 (C7), 22.4 (C11), 9.3 (C12).
.3. DFT calculations
Density functional theory (DFT) calculations [46] were per-ormed using the Gaussian 03 program (rev. C02) [47], with the3LYP hybrid functional, which includes a mixture of Hartree–Fockxchange with DFT exchange-correlation given by Becke’s threearameter hybrid functional with Lee Yang and Parr’s gradient-orrected correlation functional [48]. The 6-311G** basis set [49]as used on all atoms. The starting geometry of rhB was based
n spectroscopic data and optimized without any symmetry con-traints. Frequency calculations were performed at the same levelf theory to confirm the nature of the stationary points, yieldingo imaginary frequencies for the minima. The 40 lowest energy
onmental 113– 114 (2012) 180– 191
excitations were obtained from time-dependent (TD) calculations,carried out at the same level of theory, using the TD keyword ofGaussian 03 [50]. NBO analyses were performed with the GENNBO5.0 algorithm [51].
2.4. Photocatalytic degradation experiments
The photodegradation experiments have been conducted usingan Ace Glass photoreactor cooled by water circulation. The reac-tion vessel (250 mL) is made of borosilicate glass and suitable toaccommodate an immersion well. The quartz immersion well, isdouble-walled, with inlet and outlet tubes for cooling. The inlettube extends down the annular space and ensures the upwardflow of coolant from the bottom of the well upward to the out-let. The reactor has one angled joint for the sparger tube, onevertical joint for the condenser and one Ace-Thread side arm forthe thermometer. The reactor bottom is flat to allow the use of amagnetic stirrer. The radiation source was a 450 W medium pres-sure mercury vapor lamp (from Hanovia). Of the total radiatedenergy, approximately 40–48% is in the ultraviolet portion of thespectrum and 40–43% in the visible. The radiated watt density is0.37 W/cm2.
Suspensions have been prepared by adding 150 mg ofa given nanocomposite powder to 150 mL of 20 ppm rhBaqueous solution, at neutral pH. Prior to irradiation, the sus-pensions were stirred under dark conditions for 2 h to reachsorption/desorption equilibrium. The rhB photodegradation inthe absence of catalyst (photolysis) has been also evalu-ated.
During irradiation, the suspensions were sampled at regularintervals. The concentrations of the rhB solutions were calculatedby measuring their absorbance at the maximum absorption peak(554 nm). The identification of the degradation products was doneby ESI-MS.
3. Results and discussion
3.1. Synthesis of anchoring ligand
Ligand 1, prepared during this work was obtained in 93%yield, from the reaction between 2-aminopyridine and (3-glycidyloxypropyl)trimethoxysilane, in MeOH being formulated asC14H25N2O5Si [52], according to Scheme 1.
Formation of 1 was certified by FTIR namely the new broad bandassigned to the �Si–O and �C–O–C modes of the ligand at 1089 and1195 cm−1. Also new bands from �NH and �OH modes at 3197 cm−1
and at 3354 cm−1 are observed indicating the reaction success. Theconcomitant disappearing of the band due to the oxirane ring at1256 cm−1 is also indicative that the reaction was accomplished.
The spectroscopic characterization of 1 was also performed bysolution NMR (Table S1 in supporting information). The 1H NMRspectrum of 1 exhibits peaks at ı values of 8.06 (H6), 7.41 (H4), 6.63(H5) and 6.49 (H3) ppm assigned to the protons of the pyridine ring.In addition, the protons of the aliphatic chain are also observed andassigned easily, with the H7, H9 and H10 and OH protons appearingas a broad multiplet in the 3.34–3.49 ppm range while the remain-ing signals are observed at ı values of 4.20 (H8), 1.68 (H11) and 0.66(H12) ppm. Finally, the protons of the Si(OCH3)3 group are observedas a neat singlet at 3.56 ppm and that of NH is observed at 3.90 ppm.The 13C NMR spectrum evidenced all the carbon nuclei of the ligandconfirming the structure of 1 (Table S1).
3.2. Synthesis of metal containing materials
Two batches of pure siliceous MCM-41 (hereafter denoted asMCM) 2 and 2* (* denotes a different batch) were obtained by

N.U. Silva et al. / Applied Catalysis B: Environmental 113– 114 (2012) 180– 191 183
ation o
appaS
d[s[gr4acNttbr
Titiibi
Scheme 1. Prepar
template approach, adopting a synthetic procedure describedreviously [43]. From the two MCM batches one was used to pre-are MoII containing materials while the remaining (denoted withn *) was used to prepare the MoVI counterparts, according tocheme 2.
Afterwards the silica-matrix mesoporous host material waserivatized by grafting ligand 1, yielding MCM-glypy (3, 3*)53]. Treatment of MCM-glypy (3, 3*) with a dichloromethaneolution of the molybdenum complexes [MoI2(CO)3(NCMe)2] orMoO2Cl2(thf)2] led to new metal containing materials, MCM-lypy-MoII (4) and MCM-glypy-MoVI (5). Elemental analysesevealed a 1.80 wt% Mo (0.19 mmol g−1) content for material 4 and.62 wt% Mo (0.48 mmol g−1) for material 5. The synthetic pathwaydopted is outlined in Scheme 2. All materials were convenientlyharacterized by DRIFT, powder XRD and 29Si and 13C CP MAS SS-MR. Sorption/desorption N2 isotherms were also carried out for
extural parameters estimation. All spectroscopic/textural charac-erization features discussed in the following lines were found toe in agreement with related hybrid matrix mesoporous materialsecently reported by us using the same ligand [54].
The FTIR spectra of the grafted materials are presented in Fig. 1.he DRIFT spectrum of the MCM host material is typical of a sil-cate evidencing a broad band in the 3600–2600 cm−1 range dueo hydrogen bonding silanol groups. A sharp band at 3754 cm−1
s due to silanol groups not involved in hydrogen bonding. Othermportant features comprise the band at ca. 1640 cm−1 due to ıOHending modes while the intense broad band at 1260–900 cm−1
s assigned to the asymmetric stretching vibration modes of the
Scheme 2. Preparation of derivatized mesoporo
f glypy ligand (1).
mesoporous framework (�Si–O–Si). After grafting of ligand 1, whichaffords the material MCM-glypy (3, 3*), the DRIFT spectrum showsan overall similar profile dominated by the absorptions of the hostMCM material. Additionally new bands were detected evidencingthe ligand presence within the pores. These 2940 and 2870 cm−1
bands can be assigned to the �CH stretching modes of the aliphaticchain in 1. At the same time the 1628 and 1654 cm−1bands can berelated with the �C C and �C N modes. In addition the bands at1450 and 1590 cm−1 are due to the ˇCH in-plane bending modesof the organic moieties.
After binding the molybdenum complexes [MoI2(CO)3(NCMe)2]and [MoO2Cl2(thf)2], which afford materials MCM-glypy-MoII
(4) MCM-glypy-MoVI (5), respectively, several changes/additionalbands in the corresponding DRIFT spectra are detected.
In what concerns material 4 the most remarkable feature is theobservation of three bands at 1880, 1960 and 2030 cm−1 assignedto the �C O modes. These bands are inclusively shifted relativelyto the [MoI2(CO)3(NCMe)2] precursor complex. This is indicative ofthe metal–ligand binding. Additionally, the bands due to the �C Nvibrational modes from the CH3CN ligands are not found, indicatingthat such ligands have been replaced by the immobilized ligand.The most relevant spectral feature for the MCM-glypy-MoVI (5)material is a pair of bands observed at 958 and 939 cm−1 assignedto the �symMo O modes of the [MoO2Cl2] core.
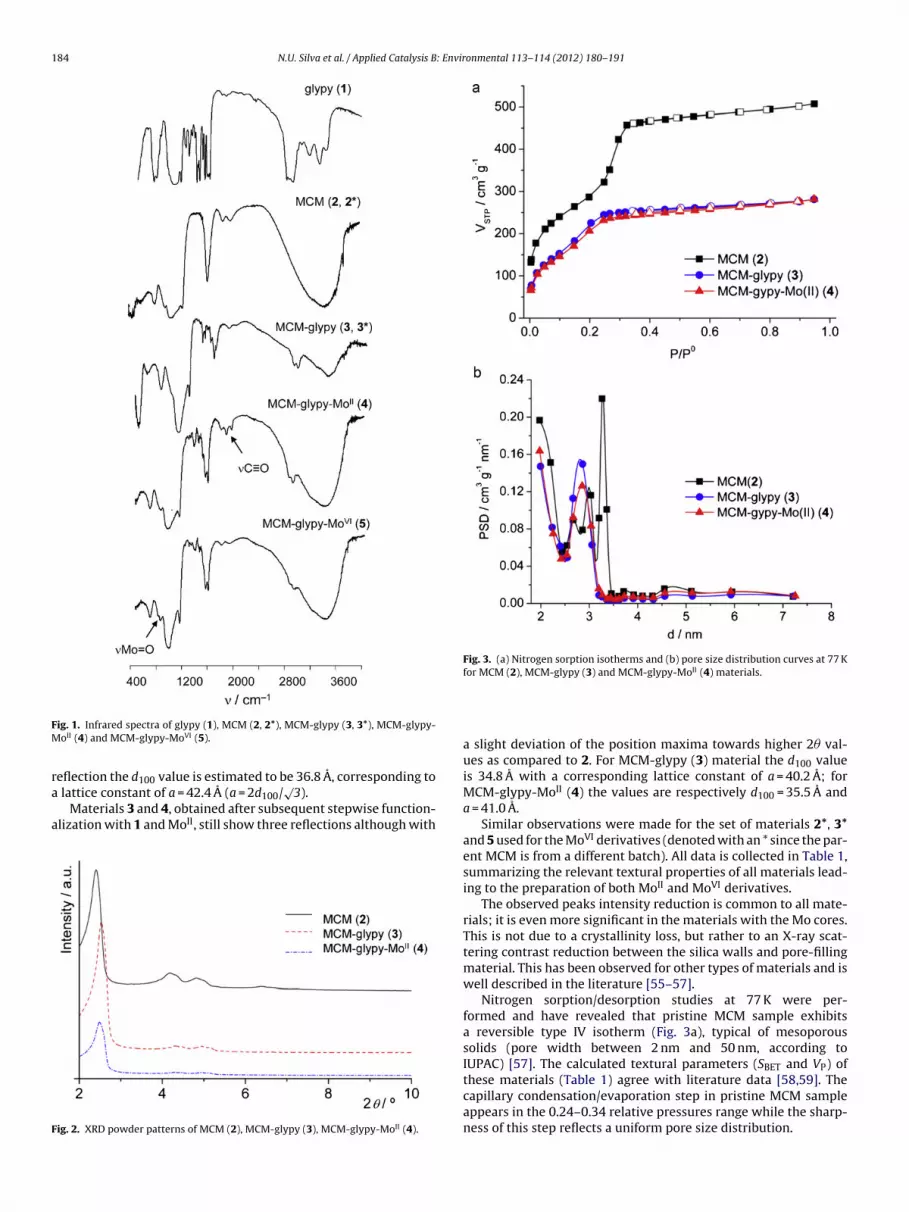
Fig. 2 shows the X-ray diffraction powder patterns of materials2–4. The calcined material MCM (2) powder pattern clearly showsfour reflections in the 2–10◦ 2� range. The peaks are indexed to ahexagonal cell as (1 0 0), (1 1 0), (2 0 0) and (2 1 0). From the (1 0 0)
us materials with MoII and MoVI species.
184 N.U. Silva et al. / Applied Catalysis B: Environmental 113– 114 (2012) 180– 191
FM
ra
a
F
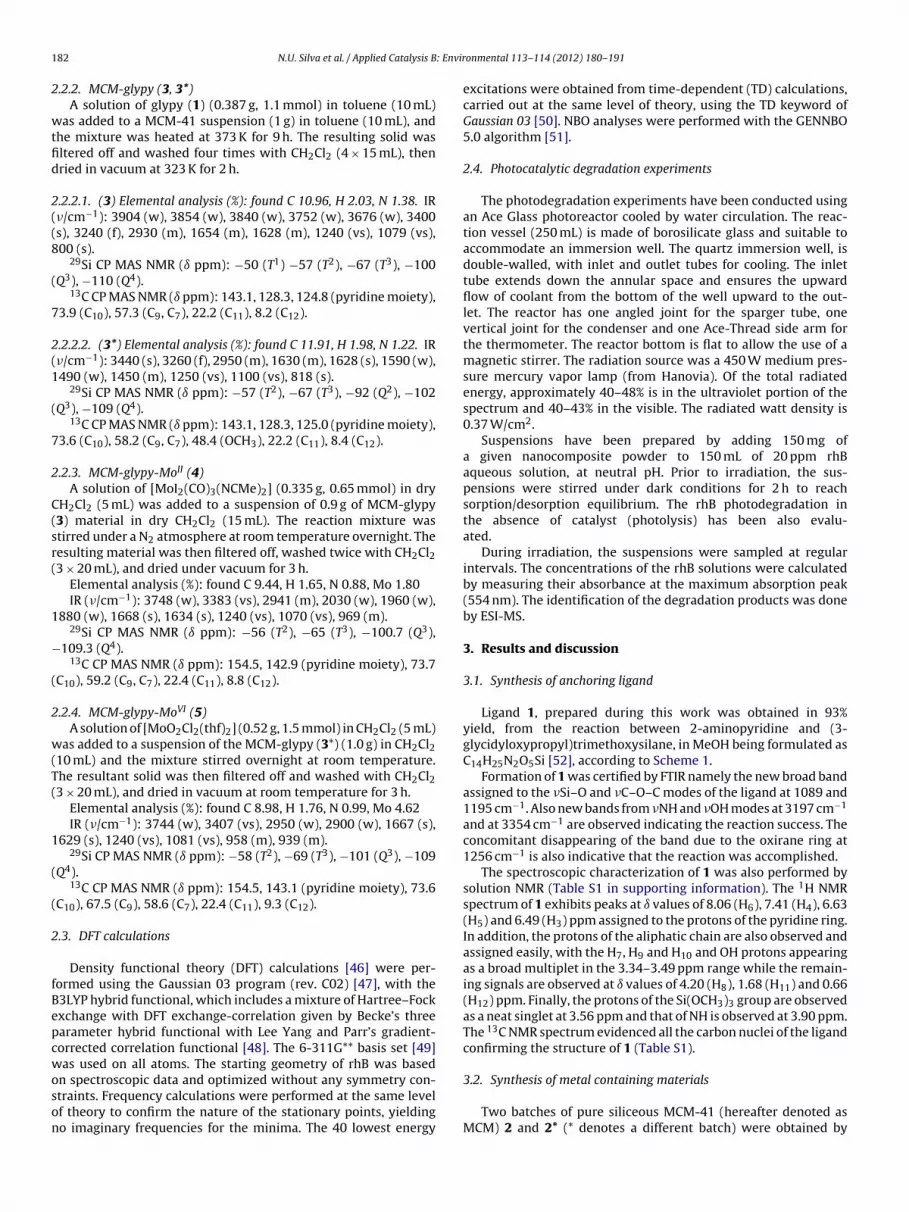
Fig. 3. (a) Nitrogen sorption isotherms and (b) pore size distribution curves at 77 Kfor MCM (2), MCM-glypy (3) and MCM-glypy-MoII (4) materials.
ig. 1. Infrared spectra of glypy (1), MCM (2, 2*), MCM-glypy (3, 3*), MCM-glypy-oII (4) and MCM-glypy-MoVI (5).
eflection the d value is estimated to be 36.8 A, corresponding to
100 lattice constant of a = 42.4 A (a = 2d100/√3).
Materials 3 and 4, obtained after subsequent stepwise function-lization with 1 and MoII, still show three reflections although with
ig. 2. XRD powder patterns of MCM (2), MCM-glypy (3), MCM-glypy-MoII (4).
a slight deviation of the position maxima towards higher 2� val-ues as compared to 2. For MCM-glypy (3) material the d100 valueis 34.8 A with a corresponding lattice constant of a = 40.2 A; forMCM-glypy-MoII (4) the values are respectively d100 = 35.5 A anda = 41.0 A.
Similar observations were made for the set of materials 2*, 3*and 5 used for the MoVI derivatives (denoted with an * since the par-ent MCM is from a different batch). All data is collected in Table 1,summarizing the relevant textural properties of all materials lead-ing to the preparation of both MoII and MoVI derivatives.
The observed peaks intensity reduction is common to all mate-rials; it is even more significant in the materials with the Mo cores.This is not due to a crystallinity loss, but rather to an X-ray scat-tering contrast reduction between the silica walls and pore-fillingmaterial. This has been observed for other types of materials and iswell described in the literature [55–57].
Nitrogen sorption/desorption studies at 77 K were per-formed and have revealed that pristine MCM sample exhibitsa reversible type IV isotherm (Fig. 3a), typical of mesoporoussolids (pore width between 2 nm and 50 nm, according toIUPAC) [57]. The calculated textural parameters (SBET and VP) ofthese materials (Table 1) agree with literature data [58,59]. The
capillary condensation/evaporation step in pristine MCM sampleappears in the 0.24–0.34 relative pressures range while the sharp-ness of this step reflects a uniform pore size distribution.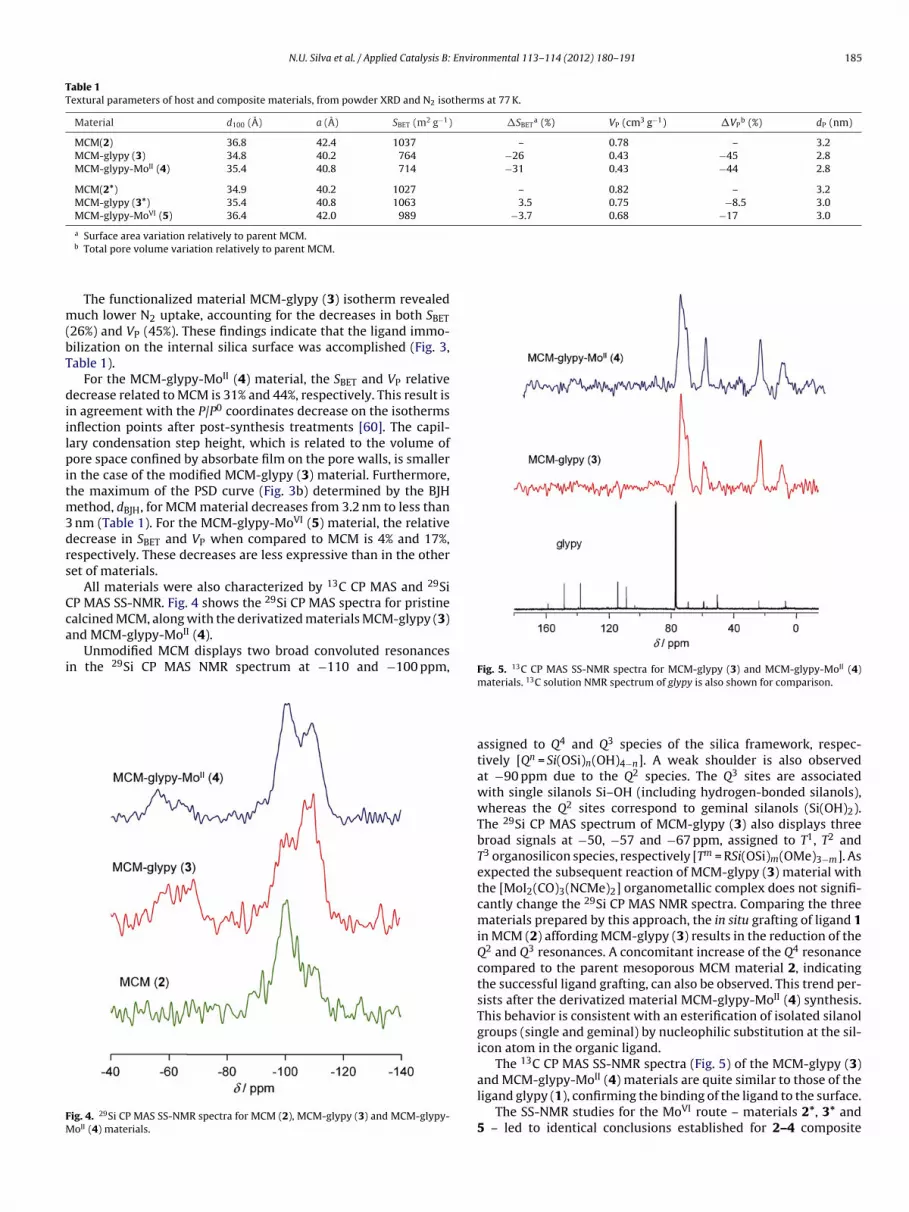
N.U. Silva et al. / Applied Catalysis B: Environmental 113– 114 (2012) 180– 191 185
Table 1Textural parameters of host and composite materials, from powder XRD and N2 isotherms at 77 K.
Material d100 (A) a (A) SBET (m2 g−1) �SBETa (%) VP (cm3 g−1) �VP
b (%) dP (nm)
MCM(2) 36.8 42.4 1037 – 0.78 – 3.2MCM-glypy (3) 34.8 40.2 764 −26 0.43 −45 2.8MCM-glypy-MoII (4) 35.4 40.8 714 −31 0.43 −44 2.8
MCM(2*) 34.9 40.2 1027 – 0.82 – 3.2MCM-glypy (3*) 35.4 40.8 1063 3.5 0.75 −8.5 3.0MCM-glypy-MoVI (5) 36.4 42.0 989 −3.7 0.68 −17 3.0
m(bT
diilpitm3drs
Cca
i
FM
a Surface area variation relatively to parent MCM.b Total pore volume variation relatively to parent MCM.
The functionalized material MCM-glypy (3) isotherm revealeduch lower N2 uptake, accounting for the decreases in both SBET
26%) and VP (45%). These findings indicate that the ligand immo-ilization on the internal silica surface was accomplished (Fig. 3,able 1).
For the MCM-glypy-MoII (4) material, the SBET and VP relativeecrease related to MCM is 31% and 44%, respectively. This result is
n agreement with the P/P0 coordinates decrease on the isothermsnflection points after post-synthesis treatments [60]. The capil-ary condensation step height, which is related to the volume ofore space confined by absorbate film on the pore walls, is smaller
n the case of the modified MCM-glypy (3) material. Furthermore,he maximum of the PSD curve (Fig. 3b) determined by the BJH
ethod, dBJH, for MCM material decreases from 3.2 nm to less than nm (Table 1). For the MCM-glypy-MoVI (5) material, the relativeecrease in SBET and VP when compared to MCM is 4% and 17%,espectively. These decreases are less expressive than in the otheret of materials.
All materials were also characterized by 13C CP MAS and 29SiP MAS SS-NMR. Fig. 4 shows the 29Si CP MAS spectra for pristine
alcined MCM, along with the derivatized materials MCM-glypy (3)nd MCM-glypy-MoII (4).Unmodified MCM displays two broad convoluted resonancesn the 29Si CP MAS NMR spectrum at −110 and −100 ppm,
ig. 4. 29Si CP MAS SS-NMR spectra for MCM (2), MCM-glypy (3) and MCM-glypy-oII (4) materials.
Fig. 5. 13C CP MAS SS-NMR spectra for MCM-glypy (3) and MCM-glypy-MoII (4)
materials. 13C solution NMR spectrum of glypy is also shown for comparison.assigned to Q4 and Q3 species of the silica framework, respec-tively [Qn = Si(OSi)n(OH)4−n]. A weak shoulder is also observedat −90 ppm due to the Q2 species. The Q3 sites are associatedwith single silanols Si–OH (including hydrogen-bonded silanols),whereas the Q2 sites correspond to geminal silanols (Si(OH)2).The 29Si CP MAS spectrum of MCM-glypy (3) also displays threebroad signals at −50, −57 and −67 ppm, assigned to T1, T2 andT3 organosilicon species, respectively [Tm = RSi(OSi)m(OMe)3−m]. Asexpected the subsequent reaction of MCM-glypy (3) material withthe [MoI2(CO)3(NCMe)2] organometallic complex does not signifi-cantly change the 29Si CP MAS NMR spectra. Comparing the threematerials prepared by this approach, the in situ grafting of ligand 1in MCM (2) affording MCM-glypy (3) results in the reduction of theQ2 and Q3 resonances. A concomitant increase of the Q4 resonancecompared to the parent mesoporous MCM material 2, indicatingthe successful ligand grafting, can also be observed. This trend per-sists after the derivatized material MCM-glypy-MoII (4) synthesis.This behavior is consistent with an esterification of isolated silanolgroups (single and geminal) by nucleophilic substitution at the sil-icon atom in the organic ligand.
The 13C CP MAS SS-NMR spectra (Fig. 5) of the MCM-glypy (3)and MCM-glypy-MoII (4) materials are quite similar to those of theligand glypy (1), confirming the binding of the ligand to the surface.
The SS-NMR studies for the MoVI route – materials 2*, 3* and5 – led to identical conclusions established for 2–4 composite

1 : Environmental 113– 114 (2012) 180– 191
m2
3
aIp(a
fssaaidaa
scfpasec
opadc
iw
s(aatpTuslap
atowmpcu
Fl(p
Fig. 6. Photographs of the solutions and of the MCM (2) powder catalyst before, dur-ing and after photocatalytic experiment. In the solutions the intense pink solution isthe 20 ppm original rhB solution (marked with −2 h), while the solution referenced
86 N.U. Silva et al. / Applied Catalysis B
aterials; a full description of spectral data can be found in Section.
.3. Photocatalytic degradation studies
The photocatalytic activity of the prepared derivatized materi-ls was evaluated on an organic dye photodegradation reaction.n the present study rhodamine B (rhB) was used as the modelollutant molecule. Control experiments of rhB direct photolysiswithout catalyst) and in the presence of pristine MCM (2) werelso performed for 2 h.
Since photo-oxidation usually takes place at the catalyst sur-ace, the adsorption characteristics of the photocatalyst/pollutantystem are considered important parameters on a photocatalytictudy. Considering this, before the photocatalytic experiments,dsorption studies have been carried out in order to check rhBbility to be adsorbed on the different materials surface. Dur-ng these experiments, performed under dark conditions, a strongecrease on rhB concentration in solution was observed forll the materials tested. The time required to ensure optimumdsorption–desorption equilibrium was found to be 2 h.
After this period all solids were dark pink in color and theolution was found to be strongly discolored. The decrease in dyeoncentration was 98.3% for 5, 94.4% for pristine MCM (2) and 93.8%or 4. At first glance and considering these results, an adsorptionrocess of rhB onto these derivatized materials can be suggested asn efficient method for rhB solutions decolorization, without anypecial equipment requirements. Fig. 6 presents the chronologicalvolution of both the solution and catalyst color for the particularase of MCM (2).
In the case of the solutions it is easily observed the strong decol-rization of the solutions (from the −2 h to 0 h in the sorptioneriod). As for the powder it is possible to verify that rhB is adsorbedt the start of the photocatalytic process and at the end is stronglyecolorized showing only a very light yellow color evidencing thelear photodecolorization of the adsorbed dye.
Fig. 7 shows the absorption spectra of the different systems stud-ed during the photo-irradiation period (the adsorption occurrence
as not considered for range reasons).The absorption spectra during the direct photolysis time clearly
how a decrease in all the characteristic rhB absorption bandsFig. 7a). A different and more complex behavior was observed forll the catalytic materials tested. However it must be noted that inll the photo-catalyzed systems a decrease on the 554 nm band withime, was visualized. This absorbance intensity decrease is accom-anied by a concomitant blue-shift of the band (hypsochromic).his phenomenon is due to the appearance of degradation prod-cts formed by the loss of one or more ethyl groups of the originalubstrate. A similar situation has already been described in theiterature [61]. Wavelengths lower than 554 nm observed in thebsorption spectra suggest the presence of different degradationroducts depending on the catalytic system used.
It must be stated that after the photo-irradiation period all cat-lysts were white in color (no dye remaining adsorbed). In face ofhese results it can be concluded that the complete decolorizationf rhB aqueous solutions and the simultaneous materials recoveryere reached. In addition we have also conducted powder XRDeasurements on the powders after irradiation. The diffraction
atterns (not shown) were found to be unaffected by the photo-atalytic conditions thus evidencing the stability of the materialsnder such high energetic conditions.
In addition another point is worth mentioning. According to
ig. 7, degradation of rhB in the presence of Mo containing cata-ysts is somewhat slower than in the direct photolysis or using MCM2). A possible cause for such happening is that the Mo species arerobably quenching rhB excited state leading to dye degradationwith “0 h” represents the time when the irradiation is started. (For interpretation ofthe references to color in this figure legend, the reader is referred to the web versionof the article.)
arising not from primary photochemistry but from secondary pro-cesses. This will be addressed later in this paper.
3.4. By-products identification
Considering the results obtained by the UV–vis spectra qualita-tive analysis, and with the purpose to understand the mechanisticdifferences between these catalysts an ESI-MS study towards iden-tification of intermediates was performed.
In order to identify and quantify the compounds formed duringthe rhB photocatalytic degradation process, ESI-MS measurementsfrom the reaction solutions, have been performed. Fig. 8 shows thetemporal evolution of rhB dye concentration during the degrada-tion processes, in terms of abundance.
From Fig. 8, ESI-MS results show that rhB degradation kineticsis in fact slower in the presence of Mo catalysts, thus corroboratingwith UV–vis data, as described above.
In addition MS spectra were used to identify the species in solu-tion that were produced during the catalytic process as reportedpreviously by others [62]. From all the photodegradation experi-ments performed the direct photolysis was the only one originating

N.U. Silva et al. / Applied Catalysis B: Environmental 113– 114 (2012) 180– 191 187
F iatedM ith inc
taSC
Feig
ig. 7. Time-dependent absorption spectra of 150 mL of a 20 ppm rhB photo-irradCM-glypy-MoII (4) and (d) MCM-glypy-MoVI (5). The arrow indicates direction w
hree products. These three products were identified as rhB–C2H4nd rhB–CO2, the latter further yielding rhB–(C2H4)2–CO2 (seecheme 3 for details). It is interesting to note that direct loss ofO2was found to occur only in the direct photolysis process. In
ig. 8. Time-dependent evolution of the main species detected by mass spectrom-try of 150 mL of a 20 ppm rhB photo-irradiated solution: (a) direct photolysis andn the presence of 150 mg of (b) MCM (2), (c) MCM-glypy-MoII (4) and (d) MCM-lypy-MoVI (5). Lines are eye guide only.
solution: (a) direct photolysis and in the presence of 150 mg of (b) MCM (2), (c)reasing time.
all the other catalytic processes CO2 loss was detected at moreadvanced stages of the degradation process. For instance, in thepresence of MCM (2) degradation of rhB led to loss of ethyl groupsand only afterwards there was loss of CO2. At the end of this cat-alytic degradation experiment the major product detected was thexanthene moiety, after consecutive loss of all ethyl groups and ofthe benzoate group.
When the degradation was performed using either the MoII orMoVI containing catalysts, some intermediates were found to besimilar (namely some de-ethyl degradates, according to Scheme 3).However at the end of the reactions, it was found that the majorproduct using material 4 as photocatalyst was aniline; in the pres-ence of photocatalyst 5 a set of small compounds was detected(Scheme 3) – aniline and hydroxyl aniline; benzoic and hydroxy-benzoic acids; dihydropyran. Most probably H2O and CO2 have alsobeen formed but cannot be probed with this MS approach. Theseachievements agree with previous published results concerningrhB photodegradation using TiO2 catalysts [63].
It should be mentioned that from the ESI-MS data no Mo specieswere detected in any of the analyzed solutions. This fact is quite rel-evant accounting for the robustness of the Mo containing catalysts
to leaching during the photocatalytic process. This results in a trueheterogeneous catalytic process.Also is important to notice that all photocatalytic experimentswere conducted under normal atmosphere, which is, using as a

188 N.U. Silva et al. / Applied Catalysis B: Environmental 113– 114 (2012) 180– 191
hB un
pdtTicaCpwhr
apTiiipMouuFc
involved orbitals in the transitions.
Scheme 3. Degradation pathways of r
ossible oxidant O2 from air, without the addition of other oxi-ants. This fact is very important, because as in other studieshe photodegradation is carried out with the addition of H2O2.hus it demonstrates the effectiveness of materials with Mo dur-ng photodegradation without addition of oxidants, leading to theonclusion that it is an environmentally friendly process, withtom economy and in terms of process becomes less expensive.ompared to previous reports on rhB degradation [61,64], theresent work deals with the successful degradation of a some-hat concentrated solution (20 ppm). The results show thatigher degradation rates are attained compared to the literatureeports.
Concerning the question of whether rhB photodegradationrises from either primary or secondary photochemistry in theresence of Mo species we conducted a control experiment.his experiment was performed using direct photolysis dur-ng 2 h and afterwards adding material 5 as photocatalyst andrradiating the mixture again. As expected, it was found that dur-ng the first irradiation period the same three products wereresent (Scheme 3, photolysis pathway). After addition of theo photocatalyst 5, ESI-MS analysis of the solution at the end
f the reaction revealed the existence of the degradation prod-cts similar to those described above for the catalyzed process
sing photocatalyst 5 (Scheme 3, MCM-glypy-MoVI pathway).rom this result it is clear that formation of such small weightompounds may be due to secondary photochemistry arisingder the different conditions reported.
from the presence of Mo photocatalysts, acting not only directlyon rhB degradation process, but also on the direct photolysisintermediates (mainly rhB–C2H4 and rhB–CO2). In addition, someof the detected degradates from these Mo-pathways include anilineand benzoic acid, which may be regarded as industrially relevantstarting materials. For instance aniline is a precursor of methylenediphenyldiisocyanate (a precursor of polyurethanes) and benzoicacid is used as a food preservative.
3.5. TD-DFT analysis
To understand some features of the photodegradation studies,time-dependent density functional theory (TD-DFT) calculationson rhB have also been conducted. The calculations were per-formed at the B3LYP/6-311g** level of theory as implemented inthe G03 package and the 40 lowest singlet–singlet transitions werepredicted. The output of the TD-DFT calculation shows a goodagreement with the experimental electronic spectrum (Fig. 9). Theassignments of the most important transitions, that are the mostrepresentative of the experimental spectrum, were performedand are summarized in Table 2 along with representation of the
Based on the predicted transitions it is possible to seeintramolecular charge transfer within xanthene itself or from thisto benzoate moiety. This is also in agreement with the results from

N.U. Silva et al. / Applied Catalysis B: Environmental 113– 114 (2012) 180– 191 189
Table 2Highest energy singlet–singlet transitions and orbital contours obtained from TD-DFT calculation at the B3LYP/6-311G** level of theory.
Excitation Compositiona Starting orbital Ending orbital E (eV) � (nm) �maxb (nm) OSc (×102)
1 H → L (75%) 2.72 456 553 86.7
2 H − 2 → L (65%) 3.73 332 354 10.2
3 H − 1 → L + 2 (83%) 4.93 251 306 25.6
4 H − 1 → L + 3 (80%) 5.16 240 258 24.0
5 H − 2 → L + 3 (73%) 5.76 215 – 38.0
Ns
gmeby
m
a H: HOMO, L: LUMO.b Experimental UV–vis values.c Oscillator strength.
BO analyses where the Wiberg bond orders change quite a bit forelected bonds (Table 3).
The orbital contours of the starting and ending orbitals for theiven transitions are shown in Table 2. The orbital character isainly bonding, resulting in a strengthening of the bonds in the
xcited state compared to the fundamental state. This is confirmed
y an increase of the Wiberg bond orders obtained from NBO anal-ses, according to Table 3.Assuming this analysis to have responsibility in the pri-ary photochemistry of rhB it may explain the fact that rhB
photodegradation, by direct photolysis leads mainly to de-ethylation and/or decarboxylation products, as observed hereand previously reported by others [61]. However, to explain theextended degradation detected when using the Mo-containingheterogeneous catalysts it seems plausible to assume that Mo cen-ters are acting as quenchers of rhB excited state which enables
the secondary photochemistry leading to the observed prod-ucts, as described earlier in this work. This is supported byliterature reports on the photocatalytic activity of Mo catalysts[36–40].
190 N.U. Silva et al. / Applied Catalysis B: Environmental 113– 114 (2012) 180– 191
Table 3Wiberg bond orders of singlet (S), triplet (T) states and respective variation obtained from NBO analysis. The colored bonds represent the weakened ( ) and strengthened( ) ones.
Numbering scheme Bond Wiber BO
S T �
C1–C6 1.610 1.550 −0.060C2–C3 1.286 1.245 −0.041C2–N22 1.251 1.222 −0.029C3–C4 1.455 1.480 0.025C4–O7 1.002 0.974 −0.028C5–C6 1.213 1.233 0.020C5–C10 1.307 1.236 −0.071O7–C8 1.000 0.973 −0.027C8–C11 1.456 1.480 0.024C9–C10 1.312 1.229 −0.083C9–C14 1.210 1.232 0.022C11–C12
C12–N21
C13–C14
FU
4
eTisdcsrAta
ugcH
uwto
ocrc
[[
[
[
[
[
[[[
[19] X. Tao, W. Ma, T. Zhang, J. Zhao, Angew. Chem. Int. Ed. 40 (2001) 3014–3016.
ig. 9. Experimental (—) and TD-DFT calculated at the B3LYP/6-311G** level (· · · ·)V–vis spectra of rhB.
. Conclusions
The present work evidences the tunable features of a given het-rogeneous catalyst towards the photodegradation of a model dye.he MCM-41 silica support has revealed some catalytic activityn the process. Despite this, the use of immobilized MoII or MoVI
pecies at the surface of MCM definitely contributed to furtheregradation of the dye for which the metal species cannot be inno-ent nor its oxidation state. In fact these have been found to triggerecondary photochemical processes most probably by quenchinghB excited state thus allowing extended degradation of the dye.dditionally, all materials showed stability under photodegrada-
ion conditions as evidenced by powder XRD measurements beforend after the process.
Additionally, the catalytic process was carried out exclusivelynder aerobic conditions, i.e., in the absence of any external oxy-en source other than air. This is an advantage over several otheratalytic processes since the addition of an oxygen source such as2O2, organic hydroperoxides or even “pure” O2 is common.
Based on previous reports, it is described that degradation of rhBnder such conditions occurs mainly via de-ethylation. Howeverhen photolysis is promoted in the presence of MCM or Mo con-
aining materials other products are formed leading to degradationf the xanthene and benzoate moieties.
DFT theoretical calculation explain why direct photolysis leadsnly to de-ethylation and/or decarboxylation by showing that
harge transfer transitions will localize mainly in those moietiesesulting in a predicted variation of bond orders. This seems to beircumvented by the use of catalytically active Mo species which[
[[
1.285 1.243 −0.0421.252 1.223 −0.0291.613 1.552 −0.061
lead to further degradation of those strengthened moieties mostprobably by quenching the excited state of rhB. Among degradatesit is also possible to find aniline (used for preparing polyurethaneprecursors) and benzoic acid (used as food preservative) whichhave industrial relevance. In this way it is shown in this work thatdegradation of a dye (rhB) can yield relevant industrial buildingblocks/additives.
Acknowledgements
The authors thank FCT, POCI and FEDER (projectPOCI/QUI/71576/2006) for financial support.
Appendix A. Supplementary data
Supplementary data associated with this article can be found, inthe online version, at doi:10.1016/j.apcatb.2011.11.036.
References
[1] C.T. Kresge, M.E. Leonowicz, W.J. Roth, J.C. Vartuli, J.S. Beck, Nature 359 (1992)710–712.
[2] K. Moller, T. Bein, Chem. Mater. 10 (1998) 2950–2963.[3] D. Zhao, P. Yang, Q. Huo, B.F. Chmelka, G.D. Stucky, Curr. Opin. Solid State Mater.
Chem. 3 (1998) 111–115.[4] P. Yang, D. Zhao, B.F. Chmelka, G.D. Stucky, Chem. Mater. 10 (1998) 2033–2036.[5] F. Rambaud, K. Valle, S. Thibaud, B. Julian-Lopez, C. Sanchez, Adv. Funct. Mater.
19 (2009) 2896–2905.[6] C.D. Nunes, P.D. Vaz, A.C. Fernandes, P. Ferreira, C.C. Romão, M.J. Calhorda, Eur.
J. Pharm. Biopharm. 66 (2007) 357–365.[7] D.M. Ford, E.E. Simanek, D.F. Shantz, Nanotechnology 16 (2005) S458–S475.[8] A. Chenite, Y.L. Page, A. Sayari, Chem. Mater. 7 (1995) 1015–1019.[9] Z. Luan, C.F. Cheng, W. Zhou, J. Klinowski, J. Phys. Chem. 99 (1995) 1018–1024.10] P.T. Tanev, M. Chibwe, T.J. Pinnavaia, Nature 368 (1994) 321–323.11] M.S. Morey, G.D. Stucky, S. Schwarz, M. Fröba, J. Phys. Chem. B 103 (1999)
2037–2041.12] A.B. Bourlinos, M.A. Karakassides, D. Petridis, J. Phys. Chem. B 104 (2000)
4375–4380.13] P.D. Vaz, C.D. Nunes, M. Vasconcellos-Dias, M.M. Nolasco, P.J.A. Ribeiro-Claro,
M.J. Calhorda, Chem. Eur. J 13 (2007) 7874–7882.14] T.A. Fernandes, C.D. Nunes, P.D. Vaz, M.J. Calhorda, P. Brandão, J. Rocha, I.S.
Gonc alves, A.A. Valente, L.P. Ferreira, M. Godinho, P. Ferreira, MicroporousMesoporous Mater. 112 (2008) 14–25.
15] M. Vasconcellos-Dias, C.D. Nunes, P.D. Vaz, P. Ferreira, P. Brandão, V. Félix, M.J.Calhorda, J. Catal. 256 (2008) 301–311.
16] V.M. Correia, T. Stephenson, S. Judd, J. Environ. Technol. 15 (1994) 917–929.17] I.I. Raffainer, P.R. Rohr, Ind. Eng. Chem. Res. 40 (2001) 1083–1089.18] N.L. Stock, J. Peller, K. Vinodgopal, P.V. Kamat, Environ. Sci. Technol. 34 (2000)
1747–1750.
20] W. Ma, J. Li, X. Tao, J. He, Y. Xu, J.C. Yu, J. Zhao, Angew. Chem. Int. Ed. 42 (2003)1029–1032.
21] S. Zhu, T. Xu, H. Fu, J. Zhao, Y. Zhu, Environ. Sci. Technol. 41 (2007) 6234–6239.22] H.J.H. Fenton, J. Chem. Soc. 6 (1894) 899–911.
Envir
[
[
[
[
[
[[[
[
[
[
[
[[
[
[[[
[[
[
[[[
[[
[
[
[
[[
[
[
[
[
[
[
[[
N.U. Silva et al. / Applied Catalysis B:
23] B. Ensing, F. Buda, P. Blochl, J.E. Baerends, Angew. Chem. Int. Ed. 40 (2001)2893–2895.
24] J. Ma, W. Song, C. Chen, W. Ma, J. Zhao, Y. Tang, Environ. Sci. Technol. 39 (2005)5810–5815.
25] S.S. Gupta, M. Stadler, C.A. Noser, A. Chosh, B. Steinhoff, D. Lenoir, C.P. Horwitz,K.-W. Schramm, T.J. Collins, Science 296 (2002) 326–328.
26] N. Chahbane, D.-L. Popescu, D.A. Mitchell, A. Chanda, D. Lenoir, A.D. Ryabov,K.-W. Schramm, T.J. Collins, Green Chem. 9 (2007) 49–57.
27] N. Chahbane, D. Lenoir, S. Souabi, T.J. Collins, K.-W. Schramm, Clean 35 (2007)459–464.
28] T.J. Collins, Acc. Chem. Res. 35 (2002) 782–790.29] S.R. Segal, S.L. Suib, L. Foland, Chem. Mater. 9 (1997) 2526–2532.30] O.C. Monteiro, M.H.M. Mendonca, M.I.S. Pereira, J.M.F. Nogueira, J. Solid State
Electrochem. 10 (2006) 41–47.31] R. Albuquerque, M.C. Neves, M.H. Mendonca, T. Trindade, O.C. Monteiro, Col-
loids Surf. A: Physicochem. Eng. Aspects 328 (2008) 107–113.32] A. Franco, M.C. Neves, M.L.R. Carrott, M.H. Mendonca, M.I. Pereira, O.C. Mon-
teiro, J. Hazard. Mater. 161 (2009) 545–550.33] M.C. Neves, J.M.F. Nogueira, T. Trindade, M.H. Mendonca, M.I. Pereira, O.C. Mon-
teiro, J. Photochem. Photobiol. A: Chem. 204 (2009) 168–173.34] O.C. Monteiro, R. Marques, M.D. Carvalho, Mater. Chem. Phys. 119 (2010)
418–423.35] W. Lee, Y.R. Do, K. Dwight, A. Would, Mater. Res. Bull. 28 (1993) 1127–1134.36] C.A. Paez, N.J. Castellanos, F.O. Martinez, F. Ziarelli, G. Agrifoglio, E.A. Paez-Mozo,
H. Arzoumanian, Catal. Today 133 (2008) 619–624.37] C.A. Paez, O. Lozada, N.J. Castellanos, F.O. Martinez, F. Ziarelli, G. Agrifoglio, E.A.
Paez-Mozo, H. Arzoumanian, J. Mol. Catal. A: Chem. 299 (2009) 53–59.38] T. Szymanska-Buzar, Coord. Chem. Rev. 249 (2005) 2195–2202.39] M. Stosur, T. Szymanska-Buzar, J. Mol. Catal. A: Chem. 286 (2008) 98–105.40] M. Zyder, A. Kochel, T. Szymanska-Buzar, J. Organomet. Chem. 694 (2009)
4196–4203.41] P.K. Baker, Chem. Soc. Rev. 27 (1998) 125–132.42] W.M. Carmichael, D.A. Edwards, G.W.A. Fowles, P.R. Marshall, Inorg. Chim. Acta
1 (1967) 93–96.43] C.D. Nunes, A.A. Valente, M. Pillinger, A.C. Fernandes, C.C. Romão, J. Rocha, I.S.
Gonc alves, J. Mater. Chem. 12 (2002) 1735–1742.44] M. Kruk, M. Jaroniec, Langmuir 13 (1997) 6267–6273.45] M. Kruk, V. Antochshuk, M. Jaroniec, J. Phys. Chem. B 103 (1999) 10670–10678.
46] R.G. Parr, W. Yang, Density Functional Theory of Atoms and Molecules, Univer-sity Press, Oxford, New York, 1989.47] Gaussian 03, Revision C.02, http://www.gaussian.com/g misc/g03/citation g03.htm.48] (a) A.D.J. Becke, Chem. Phys. 98 (1993) 5648–5652;
(b) C. Lee, W. Yang, G. Parr, Phys. Rev. B 37 (1988) 785–789.
[
[[
onmental 113– 114 (2012) 180– 191 191
49] (a) A.N.D. McLean, G.S. Chandler, J. Chem. Phys. 72 (1980) 5639–5648;(b) R. Krishnan, J.S. Binkley, R. Seeger, J.A. Pople, J. Chem. Phys. 72 (1980)650–654;(c) A.J.H. Wachters, J. Chem. Phys. 52 (1970) 1033–1036;(d) P.J. Hay, J. Chem. Phys. 66 (1977) 4377–4384;(e) K. Raghavachari, G.W. Trucks, J. Chem. Phys. 91 (1989) 1062–1065;(f) L.A. Curtiss, M.P. McGrath, J.-P. Blaudeau, N.E. Davis, R.C. Binning Jr., L. Radom,J. Chem. Phys. 103 (1995) 6104–6113;(g) M.P. McGrath, L. Radom, J. Chem. Phys. 94 (1991) 511–516.
50] (a) R.E. Stratmann, G.E. Scuseria, M.J. Frisch, J. Chem. Phys. 109 (1998)8218–8224;(b) R. Bauernschmitt, R. Ahlrichs, Chem. Phys. Lett. 256 (1996) 454–464;(c) M.E. Casida, C. Jamorski, K.C. Casida, D.R. Salahub, J. Chem. Phys. 108 (1998)4439–4449.
51] E.D. Glendening, J.K. Badenhoop, A.E. Reed, J.E. Carpenter, J.A. Bohmann, C.M.Morales, F. Weinhold, NBO 5.0. program, Theoretical Chemistry Institute, Uni-versity of Wisconsin, Madison, 2001.
52] J.A.A. Sales, A.G.S. Prado, C. Airoldi, Polyhedron 21 (2002) 2647–2651.53] C.D. Nunes, M. Pillinger, A.A. Valente, I.S. Gonc alves, J. Rocha, P. Ferreira, F.E.
Kühn, Eur. J. Inorg. Chem. 2002 (2002) 1100–1107.54] N.U. Silva, C.I. Fernandes, T.G. Nunes, M.S. Saraiva, C.D. Nunes, P.D. Vaz, Appl.
Catal A: Gen. 408 (2011) 105–116.55] B. Marler, U. Oberhagemann, S. Voltmann, H. Gies, Microporous Mater. 6 (1996)
375–383.56] W. Hammond, E. Prouzet, S.D. Mahanti, T.J. Pinnavaia, Microporous Mesoporous
Mater. 27 (1999) 19–25.57] S.J. Gregg, K.S.W. Sing, Adsorption, Surface Area and Porosity, 2nd ed., Academic
Press, London, 1982.58] M.D. Alba, A. Becerro, J. Klinowski, J. Chem. Soc., Faraday Trans. 92 (1996)
849–854.59] A.A. Romero, M.D. Alba, W. Zhou, J. Klinowski, J. Phys. Chem. B 101 (1997)
5294–5300.60] M. Kruk, M. Jaroniec, Langmuir 15 (1999) 5410–5413.61] (a) M. Cheng, W. Ma, C. Chen, J. Yao, J. Zhao, Appl. Catal. B: Environ. 65 (2006)
217–226;(b) Z. He, S. Yang, Y. Ju, C. Sun, J. Environ. Sci. 21 (2008) 268–272;(c) Z. He, C. Sun, S. Yang, Y. Ding, H. He, Z. Wang, J. Hazard. Mater. 162 (2009)1477–1486.
62] M.H. Florêncio, E. Pires, A.L. Castro, M.R. Nunes, C. Borges, F.M. Costa, Chemo-sphere 55 (2004) 345–355.
63] J.-Y. Li, W.-H. Ma, P.-P. Lei, J.-C. Zhao, J. Environ. Sci. 19 (2007) 892–896.64] Y. Li, Z. Yi, Y. Zhang, M. Wu, W. Lin, P. Duan, J. Hazard. Mater. 171 (2009)
1172–1174.


