Embed Size (px)
Citation preview

Hortscience Journal of Suez Canal University, 2019
Corresponding author e-mail: [email protected] Volume 8 (1): 55-68
Phenotypic, Biochemical and Molecular Characterization of New Egyptian Mango Genotypes
Naglaa K. H. Serry1; Mohamed S. M. Ali1 and Mohammed A. A. Hussein2 1Department of Horticulture, Faculty of Agriculture, Suez Canal University, Ismailia, Egypt
2Department of Botany, Faculty of Agriculture, Suez Canal University, Ismailia, Egypt
Received: 15/4/2019
Abstract: The first step towards improving mango production was started by the selection of eleven genotypes because of their superior horticultural characteristics and fruit quality parameters, from Suez Canal University orchard through 2016 to 2018 seasons. All studied mango genotypes (G) differed in dates of full bloom, maturity stage, bearing habit, floral malformation and fruit characteristics. All genotypes had commercially acceptable qualities and produced relatively high yield ranged from 298.7 - 394 Kg/tree. Generally, genotype No. 9 recorded the highest value (96.6%) in the general evaluation according to yield, Biennial bearing and fruit quality, followed by genotypes No. 7 and No. 5 which scored 94.0 and 91.8%, respectively. In general, these three genotypes possessed most of the desired commercial attributes of international standard. In addition, further understanding of the structure of genetic diversity was done using nine SSR markers based on their scorability, repeatability and capability to differentiate among studied genotypes. Also, analyze of DNA fingerprinting data to create molecular IDs was done to get an idea for the conservation and protection of studied genotypes. The nine SSR loci produced a total of 32 alleles with 97% polymorphism and observed alleles per locus diversified from 1 to 8 alleles with an average of 3.6 without zero alleles. The observed heterozygosity (Ho) within the loci ranged from 0.0 to 0.55 with an average value of 0.23, heterozygosity level within the genotypes varied from 0.11 to 0.44. The polymorphic information content (PIC) values ranged from 0.0 to 0.86 with an average value of 0.49, whereas the mean of discriminating power (DP) for all loci was 0.51. Regarding the probability of matching fingerprints, none of the genotypes were different or similar at all loci with any of the rest genotypes and this value ranged from low to medium with an average of 0.48. The similarity degree ranged from 0.18 to 0.90 with an average of 0.53, indicating that the genetic differences were moderate among mango genotypes under study. Whereas, seven of these genotypes produced 11 unique bands maybe accompanying to number of novel functional alleles, which can be used in mango improvement.
Keywords: Mango, Mangifera indica L., fruit quality, maturity, alternate bearing, DNA fingerprints, SSR marker, genetic diversity
INTRODUCTION
Egyptian mango (Mangifera indica L.) belongs to family Anacardiaceae is the most popular and nutritionally rich fruit and is designated as “King of fruits”. With a distinctive flavour, smell and taste, it is a unique fruit, with an incomparable tropical delicacy.
Under the Egyptian conditions, mango economically is ranked the third after citrus and grapes. It is grown through the Nile Valley. Egyptian production of mangoes was 880.875 metric tons (Egyptian Ministry of Agriculture, 2015). In Egypt, Ismailia Governorate is the main mango-growing area, known for producing the finest mangoes. The soil and climate of Ismailia are especially suitable for mangoes cultivation. Successfully planted in diversified spots of soil, mango is cultivated on 281153 feddans throughout the country (Egyptian Ministry of Agriculture, 2015). On a yearly basis, the mango harvest in Egypt starts from July and lasts until November, bringing farmers an abundant income in comparison to cultivating of other fruits.
In nature mango is heterozygous and has a great diversity in seedling genotypes, which have shown wide genetic diversity in terms of shape, colour, flavour, maturity stage, bearing habits, yield and malformation resistant.
Mango industry in Egypt has recently increased in area and production. However, some problems have
been identified as being the most serious ones faced by producers today such as: floral and vegetative malformation, alternate bearing, low yield and lack of postharvest technology. So, “selection” of some genotypes is considered the first step in the process of improving mango production.
Mango cultivars are usually divided into two groups, monoembryonic (Included Indian types) and polyembryonic (Indo Chinese types). Where, monoembryonic seeds contain one sexual embryo while polyembryonic seed contains one sexual embryo plus a number of vegetative embryos, which produce plants identical to the mother plant (Crane et al., 1997; Iyer and Degani, 1997). In polyembryonic types, it is difficult to distinguish between seedlings arise from a zygote or from nucellar tissue matches the mother plant completely; Schnell et al. (1994).
Mangoes improvement programs have been considered to be difficult for several reasons; reproductive method, long juvenile time of trees that can be range from 5 years to 7 years, high level of heterozygosity and the fruit have only one seed, in addition fruit drop in many stages results in yield reduction (Iyer and Schnell, 2009). Nature of cross-pollination and polyembryonic in mango complicates breeding programs and contributed to its wide diversity (Mukherjee, 1972).
Concerning breeding programs and academic researches, it is very important that the used genotypes

56 Serry et al., 2019 are identified and discriminated accurately and fairly (Pedersen, 2006), whereas, the results are being used and compared whether in nationally or internationally in other scientific experiments. Therefore, effective molecular markers such as RAPD, AFLP, SSRs and ISSR are needed to beat accuracy of discrimination. So, fingerprinting techniques could be used for characterization of genotypes and identification of mango cultivars/hybrids accurately (Begum et al., 2013).
Markers have many features; they are not affected by the environmental factors and covering the whole genomes and having potential of existing in unlimited numbers. Microsatellite (SSRs) markers are one of those markers which, are used newly in the genetic studies. They have short sequence repeats of DNA from 1 to 6 base pairs. These SSRs are also characterized by advantages more than other molecular markers such as; are highly polymorphic, specific markers, reproducible, and co-dominant (Ravishankar et al., 2011). Several studies have used SSR markers to determine the genetic diversity in mango (Duval et al., 2005; Eid and Hussein, 2017; Suprapaneni et al., 2013) and cultivars identification (Eiadthong et al., 1999). The analysis of pedigree (Olano et al., 2005; Viruel et al., 2005) developed the first set of 16 SSR markers for mango, of which 14 produced one or two bands per genotype as expected.
Therefore, the aims of this study were to describe the main characters of eleven new genotypes using SSR markers to enhance genetic informativeness of SSR loci and to define a fingerprinting identification system for the conservation of mango, and to creating molecular IDs for cultivated mango. This may provide an additional tool in future to investigate genetic relationships among cultivars of mango, creation of genetic maps, help in functional mapping, and carry out marker-assisted selection to save time. This could be important for the registration, conservation and protection of Egyptian mango germplasm.
MATERIALS AND METHODS
This work was conducted in three successive seasons from 2016 to 2018 using eleven genotypes of mango of Egyptian mango genotypes cultivated in Suez Canal University orchard of Ismailia Governorate, Egypt. The genotypes have vigorous tree growth and uniform age of 20 years old. Harvest time of the fruit extends from August to October. Sixty mature fruits from each genotype were divided into two groups the first one (twenty fruit) used for quality determination at firm ripe stage, the second group (forty fruit) used for shelf life at (25±1°C) and 60 -65% RH and for sensory evaluation.
Tree aspects:
Full bloom dates were recorded when about 75% of the terminal buds reached the burst stage El-Agamy et al. (2018).
The productive timing of the eleven seedling mango trees was in August (early mid-season),
September (mid-season), and up to the end-of October (late season) this means seasonality.
Malformation:
It was recorded during (March and April) by counting the number of healthy and malformed panicles for each tree then calculated as following:
Floral malformation % =
The yield (Kg/tree) for each individual tree according to the equation suggested by Wilcox (1944) on Apple and Singh (1948) taking in consideration the alternate bearing habit as follow:
Biennial bearing index =
If the index is more than 50%, this means that the tree is in alternate bearing (off-year) while the tree is in regular bearing (on-year) if the index is less than 50%.
Fruit characteristics: Fruit weight (g), fruit diameter (cm), firmness (lb/in2), % pulp, % SSC, % acidity, % vitamin C, total sugars, antioxidant activity and total phenols.
Firmness:
It was done by measuring the force required for a 7-mm probe to penetrate the pulp (midpoint between peel and endocarpon two opposite sides of mango fruit after peeling. An average was recorded for each fruit per replicate by using a hand Magness Taylor pressure tester (lb/in2).
Soluble Solids Content (SSC):
SSC was measured in fruit juice by using LCII-Digital refractometer (Medline scientific, United Kingdom, SR-95) at 20°C and expressed as percent.
Titratable Acidity:
It was determined in fruit juice by using 0.1N NaOH in the presence of phenolphthalein until pH 8.0 and expressed as citric acid percent.
Vitamin C: It was determined in juice as mg Ascorbic
acid/100 ml fruit juice by titration with 2, 6-dichlorophenolindophenol solution in the presence of oxalic acid.
Total sugars:
They were calorimetrically determined by using phenol sulphoric acid method at 490 nm wave length and the concentration was calculated as glucose.
The antioxidant activity:
The samples were analyzed using2,2-diphenyl-1-picryhydrazyl radical (DPPH) assay according to the procedures of Gadow et al. (1997), Lee et al. (2003) and Maisuthisakul et al. (2007). Diluted sample extract (100 ml; prepared at 5 different concentrations which provided 10–90% inhibition for DPPH radical) was added onto 4 mL of freshly prepared DPPH solutions (6×10⁻⁵ M in MeOH). The mixtures were shaken and kept in the dark at room temperature for 30 min. Absorbance values of the final solutions were recorded

Phenotypic, Biochemical and Molecular Characterization of New Egyptian Mango Genotypes 57
at 515 nm using a spectrophotometer (UNICO UV/Visible 2100, USA) with respect to control solution (80% MeOH instead extract in DPPH solution). The antioxidant activity of the samples was expressed as percentage inhibition of the DPPH radical, which was calculated by using the following Eq.:
I % (inhibition percentage) = × 100
Where, Ac and As are the absorbance values of the control and test samples, respectively. The sample extract concentration providing 50% inhibition (EC50) of the DPPH radical was calculated by plotting the concentration versus inhibition percentage (%).
Total phenols: Total phenols were determined by using Folin-Ciocalteu colorimetric method at 700 nm wave length and the concentration was calculated from a standard curve of pyrogallol.
Soluble solids content, Titratable acidity, vitamin C, total sugars and total soluble phenols were determined as described by A.O.A.C. (1995).
The shelf life of 50 fruits from each genotype packed in carton boxes, then held at ambient temperature at (25±1˚C) and 65% RH was assessed.
Consumer acceptance was judged at the ripe stage after shelf life, taste was scored from 1- dislike extremely to 9 - like extremely through sensorial panel of 20 tasters. Acceptance percentage was calculated as the number of fruit in like extremely category in relation to the total number of fruit according to Crisosto et al. (2003). The following equation was used:
Acceptance % = × 100
General evaluation of the seedling trees:
The seedling tree belonging to each genotype was evaluated with each other on the basis of 100 units for each. The units were divided between tree yield (40 units) alternate bearing habit (20) and for each of total sugars, ascorbic acid, seasonality and antioxidant activity score of 10 was assigned. When evaluating each property, the best grade had the maximum points while the worst grade scored zero. In this respect, the highest values for each yield, total sugars, antioxidant activity and ascorbic acid percentage were considered the best properties. The contrary was true for values of biennial bearing index, malformation and total phenols. The final grade was calculated by adding up the various points of the different characteristics for each tree. The following equation was used to determine these characters:
Characters =
*A: the highest value recorded for studied character among all treatments (lowest for biennial bearing index)
*B: the value recorded for the specific character for considered treatments.
Statistical analysis:
Preliminary data were statistically analyzed using the appropriate analysis of variance according to Steel and Torrie (1981). The experimental design was RCBD design with three replications.
Molecular analysis:
The studied 11 new Egyptian mango genotypes are located under Ismailia Governorate conditions, which are not selected as protected area. The young leaf samples of them referred to in this study by G1 to G11 were collected at the end of summer season 2018 (September) for the purposes of DNA analyzes. It is noteworthy that these genotypes originated from seed propagation, characterized by good productive properties and remarkable fruit quality. So, it is very important to the future conservation and protection of these genotypes through DNA fingerprinting. Thus, the vegetative samples for DNA tasks were stored at –20°C until use and then ground to powder in liquid nitrogen. The total DNA was extracted from frozen young leaves of a single plant of each genotype, according to the CTAB method (Porebski et al., 1997).
Selection of SSRs Primers and PCR amplification:
The nine SSR primer pairs used for PCR amplification in the present study were described before by Viruel et al. (2005), Schnell et al. (2005), Honsho et al. (2005) and Duval et al. (2005).
PCR reactions were done according to Schnell et al. (2005) in a thermos cycler (Eppendorf Master Cycler Gradient Eppendorf, Hamburg, Germany). Every reaction was repeated two times to guarantee the reproducibility of the results. PCR mixer and cycling PCR products were separated on agarose gel (2%) and ethidium bromide was used for staining to ensure the PCR amplification and determine approximately the size of the amplified fragments. Then, products were separated on Polyacrylamide gels (7%) to confirm allele sizing of the SSR loci, and then stained with ethidium bromide solution and visualized using gel documentation model (Gel-Doc 2000 with Diversity Database software Ver. 2.1, Bio-Rad Laboratories, Hercules, California, USA) for gel analysis. It was not possible to differentiate between simplex, diallelic duplex and among different types of triallelic grouping of SSR loci. So, the fragment frequencies were analyzed as multiloci and each allele was scored as present or absent (1/0).
Molecular data analysis:
The simple sequence repeat (SSR) bands were scored visually and used to calculate the following genetic parameters: the number of alleles per SSRs locus without Zero alleles (the alleles in case that no products were amplified in one or more genotypes), percent of polymorphic bands per SSR locus, maximum number of alleles per genotype, average of polymorphism, the number of unique (specific) alleles per genotype, and observed heterozygosity (Ho) were calculated by dividing the number of heterozygous genotypes per locus by the total number of genotypes.

58 Serry et al., 2019
The effective number of alleles (NE) was calculated for each marker according to Hart and Clark (1997) using the formula: NE = 1/∑ (E/F)2, where E refer to the total number of genotypes at each allele of locus i, and F the total number of alleles of the locus i in all genotypes. The heterozygosity index which also known as, polymorphism information contents (PIC) was calculated for each locus depends on number of alleles and the allele frequency from the formula: PIC = 1- ∑ pi2 where pi is the frequency of each allele. If PIC value calculated in this way, it is similar to the expression 'gene diversity' as described by Botstein et al. (1980).
Discriminating power for each locus (PD) was calculated as previous formula, but the allele frequency was replaced by the fragment or genotype frequency, according to kloosterman et al. (1993). The probability of matching fingerprints was estimated according to Jones (1972). Also, the heterozygosity level within each genotype was calculated. All previous genetic parameters and calculations were performed with the programs GENEPOP version 1.31 (Raymond and Rouset, 1995), Quantity one and Microsoft Excel.
The recorded data also were used to calculate the similarity degree according to Dice coefficient (Sneath and Sokal, 1973), using the SPSS software ver. 16. The dendrogram was produced depending on the average Linkage (Between Groups) using all recorded alleles over all the nine loci to elucidate the genetic
relationships and similarity between the 11 new Egyptian mango genotypes.
RESULTS AND DISCUSSION
The dates of full bloom, maturity and weeks from full bloom to maturity of the eleven mango genotypes are shown in Table (1). Data indicated that G5, G9 and G11 had the longest period (25.5 weeks) to reach maturity compared with the other genotypes, followed by G1, G3 and G7 which recorded 24 weeks. While, the lowest period noticed with G2, G4, G6, G10 (20 weeks) and G8 (21 weeks). As for seasonality, genotypes 1, 3, 7 and 8 were considered mid-season, while genotypes 2, 4, 6 and 10 were early mid-season. Finally, genotypes 5, 9 and 11 were late season. In general, these genotypes covered a long period in the season extend from August to October.
Floral malformation hits the yield of the plants leaving unproductive inflorescence, so, it is more important than vegetative one. Data in Table (2) shows the percentage of malformed panicles which ranged from 0-3% as an average of three years. Zero percent means free from malformation and did not show any manifestations all along the three seasons of study, this noticed in genotypes 2, 3, 5, 7, 9 and 10. The other genotypes 1, 4, 6, 8 and 11 recorded relatively low percentages of malformation and did not affect the yield.
Table (1): Dates of full bloom of eleven mango genotypes and maturity stage of fruits from 2016 to 2018 seasons
Genotype No.
Date of full bloom Date of maturity Weeks from full bloom to
maturity
Seasonality First
season Second season
Third season
First season
Second season
Third season
First season
Second season
Third season
2016 2017 2018 2016 2017 2018 2016 2017 2018
G1 3rd week
March 4th week March
3rd week March
September September September 25 24 25 Mid
G2 2nd week
March 3rd week March
3rd week March
August August August 22 21 21 Early mid
G3 3rd week March
4th week March
4th week March
September September September 25 24 24 Mid
G4 3rd week
March 4th week March
3rd week March
August August August 21 20 21 Early mid
G5 1st week
April 2nd week
April 1st week
April October October October 26 25 26 Late
G6 3rd week
March 4th week March
3rd week March
August August August 21 20 21 Early mid
G7 3rd week
March 4th week March
4th week March
September September September 25 24 25 Mid
G8 4th week March
1st week April
1st week April
September September September 22 21 21 Mid
G9 1st week
April 2nd week
April 1st week
April October October October 26 25 26 Late
G10 3rd week
March 4th week March
3rd week March
August August August 21 20 21 Early mid
G11 2nd week
April 2nd week
April 1st week
April October October October 25 25 26 Late

Phenotypic, Biochemical and Molecular Characterization of New Egyptian Mango Genotypes 59
Table (2): Malformation (%), yield and fruit quality of eleven mango genotypes at firm ripe stage (average of three seasons)
Genotype No.
Malformed panicles
(%)
Yield weight
(Kg/tree)
Fruit weight
(g)
Fruit height (cm)
Fruit width (cm)
Firmness (lb/in2)
Pulp (%)
SSC (%)
Acidity (%)
Vitamin C*
Total Sugars*
Antioxidant activity (%)
Total Phenols*
G1 2.5 c** 305.7 j 546.6 d 12.1bc 8.5ef 7.7 b 69.5 cd 18.0 h 0.7 cd 59.7 h 15.8 f 40 e 72.3 e
G2 0.0 e 334.7 e 500.5i 11.4 d 8.8cde 6.8 e 71.4bcd 19.1 f 0.5 e 67.1 f 16.2 d 33 g 68.0 g
G3 0.0 e 317.0i 558.4 c 11.0 d 8.2 f 6.9 e 69.7 cd 18.1 h 0.6 d 57.2 i 15.3 h 44 c 85.0 c
G4 2.5 c 318.3 h 504.0 g 11.5 d 8.4ef 6.9 e 72.7abc 19.5 e 0.9 a 67.7 e 15.8 f 44 c 85.3 c
G5 0.0 e 353.7 c 474.2 j 11.0 d 9.1 b 8.1 a 73.2 abc 21.3 c 0.8 b 75.3 c 17.7 c 48 b 92.1 b
G6 1.7 d 325.7 f 577.8 b 14.3 a 9.0bc 6.6 f 74.7ab 19.1 f 0.8 b 54.3 j 15.7 f 39 f 69.7 f
G7 0.0 e 381.7 b 579.9 a 12.4bc 8.2 f 7.5 c 63.5 e 22.6 b 0.7 cd 76.7 b 17.9 b 48 b 92.3 b
G8 2.8 b 298.7 k 502.5 h 12.5 b 8.9bcd 7.3 d 67.5 de 17.9 h 0.8 b 62.7 g 15.4 h 44 c 86.2 c
G9 0.0 e 394.0 a 522.4 e 11.6 d 8.6def 6.8 e 71.6abcd 24.4 a 0.5 e 84.3 a 19.6 a 49 a 96.3 a
G10 0.0 e 346.3 d 471.4 k 12.7 b 8.4 ef 6.7ef 72.5abcd 20.0 d 0.6 d 68.3 d 16.0 e 44 c 86.0 c
G11 3.0 a 320.7 g 510.6 f 12.0 c 9.6 a 7.3 d 76.1 a 18.6 g 0.71 c 67.1 f 15.4 h 43 d 75.7 d
* mg/100 ml juice; ** the values within a column with different letters are significantly different at P ≤ 0.05 according to the Duncan's multiple range test

60 Serry et al., 2019
Concerning the average of three years, all genotypes produced relatively high yield ranged from 298.7 to 394 Kg/tree (Table 2). Genotypes 9, 7 and 5 showed the highest fruit yield. It can be concluded that all the studied genotypes are commercially ones and may achieve good benefits in mango industry either in fresh market or food processing.
Data in Table (2) revealed that the different genotypes produced higher fruit weight ranging from 471.4 to 579.9 g/fruit. This means that the fruit were in the range of medium to big size fruit. This parameter could be insured in terms of fruit dimensions in both length (11.0-14.3 cm) and width (8.5-9.6 cm). Results also revealed that, firmness of the pulp was varied between genotypes and ranged from 6.6-8.1 (lb/in2). It is known that the higher the percentage of fruit pulp, the greater the economic value of it and it is desirable for fresh consumption and processing. The lowest pulp percentage was 67.5% for genotype 8, whereas the highest one was 76.1% for genotype 11 as an average of three seasons.
The acidity content (%) of fruit pulp ranged from (0.8 to 0.9) and obtained from G4, G5, G6 and G8 genotypes. Fruits of G9 contain the highest percentage of SSC (24.4%) followed by G7 (22.6%) and G5 (21.3%) as an average of three seasons. SSC percentages reflect the sweetness of the studied genotypes in this regard and consequently having
excellent taste. In addition, total sugars took the same trend of SSC. Similarly, G9 recorded the highest total sugars percentage. With respect to % vitamin C as an average of three seasons, it ranged from 54.3 to 84.3 mg/100 ml juice (Table 2).
Antioxidant compounds are physically classified according to their solubility into two major groups: water soluble (hydrophilic) antioxidants (ascorbic acid, polyphenolic compounds as flavonoids and thiols) and lipid soluble (lipophilic) antioxidants (vitamin E, carotenoids, and ubiquitous; Arnao et al., 2001). There was a positive relationship between antioxidant activity and total phenolic contents, indicating an effect of polyphenol content on antioxidant activity. The data pertaining to total phenols with antioxidant activity indicating with the highest percentage of total phenol corresponds to the highest percentage of antioxidant activity for genotype 9 (96.3% & 49%) and the lowest values for genotype 2 (68% & 33%) (Table 2).
Attractive colored peel of mango fruit is a desirable for the consumer and for getting privileged position in fresh fruit market especially for exportation. As fruit peel colour (Table 3) differed according to the genotype and ranged from attractive light green to yellow, orange with red blush or cheeks on fruit shoulders Fig (1).
Table (3): Type of embryo, fibers content and fruit peel and pulp colour eleven mango genotypes at ripening stage
Genotype No. Type of embryo Fibers* Peel colour Pulp colour
G1 Mono 3 Orange with red
blush Dark yellow
G2 Poly 3 Yellow with red
blush Yellow
G3 Mono 3 Orange with red
blush Orange
G4 Mono 1 Light green with
yellow blush Yellow
G5 Poly 1 Yellow with red
cheek Dark yellow
G6 Poly 1 Yellow Yellow
G7 Mono 1 Yellow with red
cheek Dark yellow
G8 Poly 1 Light green with red
blush Yellow
G9 Poly 1 Orange with red
cheek Orange
G10 Mono 1 Light green Yellow
G11 Poly 3 Yellow Yellow
Fibers (1 = non & 9 = maximum)

Phenotypic, Biochemical and Molecular Characterization of New Egyptian Mango Genotypes 61
Figure (1): Peel colour of mango fruit
Concerning the simulation to marketing period
(shelf life; Table 4) fruits of the eleven genotypes were ranged from 6-8 days. In addition, weight loss percentages ranged from 5.1 to 7.8%, fruit firmness ranged from 3.3 to 4.8 (lb/in2). For the consumer acceptance of mango fruits after shelf life assimilation, genotypes 9, 7 and 5 scored the highest percentage (98.0-96.0 and 95.7%). The rest of the genotype scored 82 to 90.9% (Table 4). In general, the fruits had an
attractive peel colour, very good taste with unique flavour and overall acceptance. The general evaluation for each genotype in Table (5) was estimated according to yield per tree, alternate bearing habit, total sugar, ascorbic acid, seasonality and antioxidant activity. The higher the grade for each variable, the better the quality of genotype. Genotype 9 recorded the highest score (96.6%) of the general evaluation followed by G7 (94%) while G5 had a score of (91.8%).
Table (4): Changes in fruit characteristics and consumer acceptance after held at 25°C & RH 65% average of three years
Genotype No. Shelf life (days after harvest* at 25°C &
RH 65%)
Weight loss (%)
Firmness (lb/in2) Consumer acceptance
(%)
G1
G2
G3
G4
G5
G6
G7
G8
G9
G10
G11
6
6
6
7
7
7
7
8
8
6
6
6.8
6.4
5.2
6.9
5.6
7.0
7.8
6.4
5.1
6.6
6.3
3.8
3.7
3.6
3.3
4.4
3.5
4.7
3.7
4.8
3.9
4.0
82.0
89.7
84.0
89.7
95.7
89.7
96.0
88.0
98.0
90.3
90.9
*harvest at maturity stage
Table (5): General evaluation of eleven mango genotypes according to yield (Kg/tree), biennial bearing index and fruit
quality (average of three seasons)
*Seasonality, late season = 10 mid-season = 9, early mid = 8 and early season = 10
Genotype No.
Yield Kg/tree
(40)
Biennial bearing
index (20)
*Seasonality (10)
Total sugars
(10)
Vitamin C (10)
Antioxidant activity %
(10)
Total 100%
G1 31.0 13.2 9 8.1 9.2 8.2 78.7
G2 34.0 15.7 8 8.3 7.5 6.7 80.2
G3 32.1 17.6 9 7.8 6.2 9.0 81.7
G4 32.3 11.6 8 8.1 10.0 9.0 79.0
G5 36.0 18.7 10 9.0 8.3 9.8 91.8
G6 33.1 18.2 8 8.1 9.7 8.0 85.1
G7 38.8 20.0 9 9.0 7.4 9.8 94.0
G8 30.3 14.2 9 7.8 7.3 9.0 77.6
G9 40.0 20.0 10 10.0 6.6 10.0 96.6
G10 35.2 14.8 8 8.1 9.0 9.0 84.1
G11 32.6 13.8 10 7.8 9.5 8.8 82.5

62 Serry et al., 2019
Kakar et al. (1999) studied some morphological characteristics of mango fruit cultivars, Chaikiattiyos et al. (2000) assessed about 320 “Kaew” clones collected from different areas in Thailand and selected some clones with superior horticultural characteristics for further evaluation. Desai and Dhandar (2000) studied the variation in physico-chemical and morphogenetic characters of some mango cvs in India. In addition, Mitra et al. (2001) determined the chemical composition of seven cvs and four hybrids of mature mango fruit grown in west Bengal, India. Similarly, El-Wakeel et al. (2006), and El-Sheikh and Burshaid (2010) conducted a quality evaluation of some local and imported mango cultivars grown in the “United Arab Emirates”. Wahdan et al. (2011) described and identify two new Egyptian mango genotypes using DNA Fingerprint. Singh et al. (2016) evaluated twenty eight genotypes for table and sucking purposes, in Punjab province of India.
SSR Markers informative and Genetic diversity:
The 9 amplified SSR loci across 11 new Egyptian mangoes genotypes detected a total of 32 bands or alleles (without Zero alleles). Out of 32 bands, 31 bands were (scorable polymorphic markers) polymorphic with high level of Polymorphism (97%) (Table 6). However, this was expected to exist as a result of low conservation and high variability of the amplified DNA sequences in non-coding regions of the mango genome.
Analysis of data for the 9 SSR loci revealed that 7 of them produced either one or two bands per genotype. Subsequently, the genotypes considered homozygous or heterozygous once one or two bands were presented for each locus, respectively (Callen et al., 1993). These 7 loci described as single loci as reported by Viruel et al. (2005). The results indicated that the mango genotypes under study are diploid species. On the other hand, the other two loci (LMMA_1 and mMiCIR_8) produced more bands than expected according to the diploid construction. This probably due to the genomic rearrangements accumulated or the duplication of these loci. Another reason for such case could be due to the allopolyploid nature of mango as reported by Mukherjee (1972). Thus it is possible to describe these loci as multiple loci.
The number of total observed alleles per locus varied from one (LMMA_12) to eight (mMiCIR 18) alleles with an average of 3.6 across the eleven genotypes (Table 6). The nine loci in the present study produced a few number of alleles compared to the same loci in a previous study by Eid and Hussein (2017). In the same context, Hussein (2009) reported larger values of alleles ranged from 5 to 9 alleles per locus using 35 SSR loci. One reason for such difference could be due to the large number of samples and type mango genotypes used which were more diverse.
Whereas, the estimated number of SSR alleles depends on the number of samples and the genetic variability of the samples in addition to the number of
SSRs primers used and their genome coverage. Also the variation in the number of amplified alleles in any SSR locus is a result of the differences in rates of mutation in that locus (Metais et al. 2002) which in turn are influenced by length of the repeated tandem, the structure, and type of the locus whether it is EST-SSR or gSSR.
Through the banding patterns obtained from the nine SSR loci, all eleven mango genotypes in this study could be differentiated from each other. This is attributable to highly divergent genotypes that were included in the present study. Thus, SSR markers described in the present work represents a helpful tool for cultivar identification. Effective alleles (Ne) are the measure of allelic evenness.
In the present study, the effective number of alleles (Ne) for the polymorphic markers ranged between 1 in LMMA_12 locus and 7.4 in mMiCIR_18 locus with an average of 2.4. According to the selective standard of the SSR loci, it must have at least 4 alleles per locus to be considered helpful for the evaluation of genetic diversity. Consequently, most of the 9 SSR loci in this study were useful for the evaluation of genetic diversity between the 11 mango genotypes. This high (ne) values from the fact that some loci amplified more than two alleles per locus with some genotypes. Heterozygosity expresses the presence of different alleles at one or more loci on homologous chromosomes. So, the observed heterozygosity (Ho) value within the loci was calculated from direct count and ranged from 0.0 in MIAC_3, LMMA_12 and MiSHRS_48 to 0.55 in MIAC_6 and mMiCIR_8 with average value of 0.23 (Table 6). In the present study, observed heterozygosity values were low in the most of SSR loci compared with similar analysis in a previous studies by Hussein (2009) and Eid and Hussein (2017). The results reflected that these genotypes may have not received enough external genes influx; especially these genotypes have originated in a limited geographical area (Susana et al., 2015).
Polymorphism Information Content (PIC) or gene diversity values as shown in Table (6) were somewhat high. However, four SSR loci (44%) showed a PIC value more than 0.5 and these counted informative markers (Botstein et al., 1980). The PIC value varied from 0.0 to 0.86, with average value of 0.49. While, mMiCIR_8 locus gave PIC value (0.64) higher than LMMA_1 (0.46) locus despite their similarity in the alleles numbers ´four alleles for both´. This result revealed that PIC values depend on shared frequencies of those alleles, in addition to the number of alleles (Smith et al., 2000). The mean PIC value of 0.48 reflected the intermediate level of polymorphisms of the used SSR loci and heterogeneity in the mango genotypes under study. Similar results were also reported by Schnell et al. (2005), and lower than that were reported by Eid and Hussein (2017). It is possibly due to different number of samples and level of genetic differences between the analyzed genotypes.
The results showed a wide range in the PIC values and this was indicative of the existence of specific alleles in some genotypes, which would
Phenotypic, Biochemical and Molecular Characterization of New Egyptian Mango Genotypes 63
facilitate their discrimination from another. In a related context, mMiCIR 18 locus with a DP (Discriminating Power) = 0.86 was the most informational locus, whilst the average of DP parameter for all loci was 0.51 as shown in Table (6).
Heterozygosity level is a suitable measure of genetic variability within cultivars. Taking into account that, genetic diversity can be measured as the amount of real or potential heterozygosity. Level of heterozygosity within the mango genotypes in the present study varied from 0.11 to 0.44 with a mean of 0.23 (Table 7). Despite of the mating system in mangoes is normally out cross pollination with some self-pollination. Nevertheless, level of heterozygosity within the nine genotypes was low. This can be attributed to that these genotypes not received enough free external gene flow, which is likely the source of
the excess heterozygosity as previously reported by Bodian et al. (2012) but in date palm.
Especially, these new genotypes have originated in the relatively small geographical region. The average of heterozygosity degree in the amplified SSR loci in this study was low compared to similar analysis by Hussein (2009) but in other mango cultivars. It is worth mentioning that the level of genetic variability could also be due to high mutational rate at SSR loci which are influenced by the structure, length of the repeated units and type of the locus (gSSR or est-SSR).While the loci with large number of repeat units (SSR unites) tend to show high mutational rate. Where, most SSR loci in our study consisted of small number of repeat units. As a result, any one of the alleles have any mutations may create a heterozygous condition (Bharathi, 2011).
Table (6): Various parameters and characterization of the PCR products for nine Microsatellites markers (SSRs) in
eleven new Egyptian mango genotypes
No SSR loci code Total alleles (na)
Polymorphic
Maximum number
of alleles/ genotypes
NEa HOb PICc DPd Matching of finger-
printse
Number of specific
alleles
1 LMMA_1 4 3 3 1.9 0.45 0.46 0.52 0.48 2
2 MIAC_3 2 2 1 1.4 0.00 0.30 0.30 0.70 0
3 MIAC_6 3 3 2 2.1 0.55 0.53 0.57 0.43 0
4 mMiCIR_8 4 4 3 2.8 0.55 0.64 0.70 0.30 0
5 LMMA_12 1 1 1 1.0 0.00 0.00 0.00 1.00 0
6 LMMA_15 2 2 2 1.5 0.09 0.35 0.38 0.63 0
7 mMiCIR 18 8 8 2 7.4 0.09 0.86 0.86 0.14 5
8 MiSHRS_48 6 6 1 1.2 0.00 0.81 0.81 0.19 4
9 mMiCIR_ 30 2 2 2 1.9 0.36 0.48 0.49 0.51 0
Total 32 31 11
%
polymorphism 0.97
Mean 3.3 3.4 1.9 2.4 0.23 0.49 0.51 0.48 1.2 a Effective number of alleles b Direct count heterozygosity or observed heterozygosity is calculated according to Nei (1973), 0.00 indicates that the locus is homozygous over all the studied genotypes.
cThe polymorphism information content or expected heterozygosity, and it is calculated according to Nei (1973) and reflect the ability of a marker for detecting polymorphism between the genotypes, depending on the numbers of detectable alleles and their frequency.
dThe probability of discriminating between two genotypes or more with every locus. It is calculated as 1-P (P = probability of matching fingerprints).
eThe probability of two genotypes or more having similar SSR profiles.
Genetic fingerprints for discrimination and conservation of the new Egyptian mango genotypes:
The profiles of SSR loci were combined and compared to elucidate whether any genotypes were genetically identical or not. About this, four of the genotypes (36.4%) 2, 4, 6 and number 7 had 8 identical loci. While, genotypes numbered 8, 9, 10 and 11 identical in 6 loci. On the other hand, none of the genotypes were different or similar at all loci with any of the rest genotypes. In a related context, the probability of matching fingerprints which indicated
that two or more genotypes have similar SSR profiles; it was high (100%) with locus LMMA_12 (Table 6). This value reflects that the 11 genotypes were genetically identical at the level of this locus, while this value ranged from low to medium at the level of rest loci with average of 0.48. In addition, the average of matching fingerprints between the 11 mango genotypes at the level of all loci, confirms the intermediate degree of similarity between them. A possible explanation is that these genotypes derived from seeds reproduction. Whereas, genetic segregation is more effective in the

64 Serry et al., 2019 emergence of species diversity than domestication (Dianne et al., 2016). This intermediate degree of matching fingerprints between the 11 genotypes was consistent with the registration of some specific bands (alleles) with some genotypes.
The genetic analysis of the 11 mango genotypes based on 9 SSR markers detected 11 distinct specific alleles. Seven genotypes had alleles were unique and considered as positive specific/unique alleles (Table 7). So these seven genotypes did not give identical DNA-
fingerprints. Worth mentioning, these alleles were amplified from three loci which originated from c DNA region (Table 7).
On the other hand, the non-unique polymorphic bands resulted from amplified nine loci. These bands provide further ability to distinguish between the studied mango genotypes, through presence or absence of these bands. Consequently, none of the pairs of mango genotypes in the present study considered as identical genotypes.
Table (7): Heterozygosity grade and specific/Unique alleles within genotypes examined
No Genotypes Heterozygosity Specific/Unique alleles (+)
1 G1 0.11 mMiCIR 18_230 bp, MiSHRS 48_202bp
2 G2 0.11 mMiCIR 18_240bp
3 G3 0.11 MiSHRS 48_226bp
4 G4 0.11 -
5 G5 0.22 -
6
7
8
9
10
11
G6
G7
G8
G9
G10
G11
0.22
0.33
0.33
0.22
0.44
0.33
-
-
MiSHRS 48_248bp
mMiCIR 18_340bp
LM LMMA 1_180bp, mMiCIR 18_376bp, MiSHRS 48_280bp
LMMA 1_300bp, mMiCIR 18_390bp
Mean 0.23
(+) indicates that the unique alleles are positive or present These SSR loci that generate unique alleles play
a key role in the establishment of a fingerprint of Egyptian mango cultivars at a suitable cost. However, the presence of many unique alleles can be taken as an indication of high genetic diversity in mangoes. On the other side, sign up 11 unique alleles in the present study can be accompanied with a number of novel functional alleles. This can be used in the improvement of Egyptian mangoes. In addition, the availability of a molecular marker for any interested trait will allow breeders to fast identify the seedlings that carry a specific allele. In addition to introgression of the trait into main elite genotypes during the next breeding cycle (Morcillo et al., 2013).
The genetic fingerprints have become a way for preservation or conservation of the germplasm. So, modern molecular techniques could provide more information for discovering the genetic diversity among mangoes at the level of DNA. Also, the combination between morphology and molecular description can give trend for conservation and breeding purposes.
Genetic similarity and clustering of the genotypes:
The co-dominant nature of SSR markers allows a better understanding of the pedigree relationships among the genotypes and cultivars of mango.
The data were analyzed to compute the similarity matrices according to Dice coefficient. The results revealed that, the similarity coefficient between of mango genotypes under study ranged from 0.18 to 0.90 (Table 8) with an average of 0.53. Suggesting that, the genetic differences were moderate among mango genotypes and these results are in agreement with previous study by Hussein (2009). The highest similarity degree was observed between genotypes numbered 2 and 4 (0.90), followed by (0.88) between genotypes 6 and 7 as shown in Table (8). These four genotypes had eight identical loci, and differed in one locus only. Therefore they considered to be very closely-related, probably due to that these genotypes derived from random selection for sexual seedling of the same cultivar. Where, the cross-pollination has led to the emergence of some genetic differences between them. It was noticed that, the highest degree of genetic similarity was 0.90 between genotypes2 and 4 and was 0.88 between genotypes6 and 7. While it was 0.81 between genotypes 8 and 10. These genotypes were identical or very similar in characteristics of fruits, such as; SSC%, vitamin C. and totals sugar percentage. So these loci may be responsible or in partnership with others for inheriting of these traits. On the other hand, the lowest similarity degree was 0.18 between genotypes2 and 6, also was low (0.25) comparatively between genotypes4 and 10 (Table 8). This means that

Phenotypic, Biochemical and Molecular Characterization of New Egyptian Mango Genotypes 65
these genotypes have the highest genetic distance and thus differ genetically from each other. There may be some reasons to explain this reduction. It is likely that the genetic diversity developed even among clonal offspring of the same cultivar and this is the result of accumulation of somatic mutations over many years. In addition to the selections by the propagators for improving the properties, like climatic adaptation and fruiting characteristics. Also, it can't disregard role of the genetic segregation after out cross-pollination in mangoes. All of that would have caused release of
several lines genetically different which might have originated from the same cultivar.
These genetic differences were generally consistent with the observations that there were variances between some mango genotypes in some fruits characteristics for example time of ripening, pulp% and fruit size. This indicates that these loci maybe responsible for the inheriting of these traits. Especially that most of these loci (Type of EST-SSR) have sequences located near or within the genes responsible for important economic traits in mango.
Table (8): Similarity indices (%) calculated by Dice computer package among eleven mango genotypes using nine SSR
primers
Genotypes G1 G2 G3 G4 G5 G6 G7 G8 G9 G10 G11
G1 1.000
G2 0.300 1.000
G3 0.700 0.400 1.000
G4 0.300 0.900 0.400 1.000
G5 0.667 0.476 0.762 0.571 1.000
G6 0.364 0.182 0.364 0.182 0.435 1.000
G7 0.522 0.261 0.435 0.261 0.500 0.880 1.000
G8 0.435 0.261 0.435 0.261 0.500 0.800 0.769 1.000
G9 0.545 0.273 0.455 0.273 0.522 0.667 0.800 0.720 1.000
G10 0.417 0.250 0.417 0.250 0.480 0.769 0.741 0.815 0.692 1.000
G11 0.583 0.417 0.583 0.417 0.560 0.538 0.667 0.593 0.769 0.571 1.000
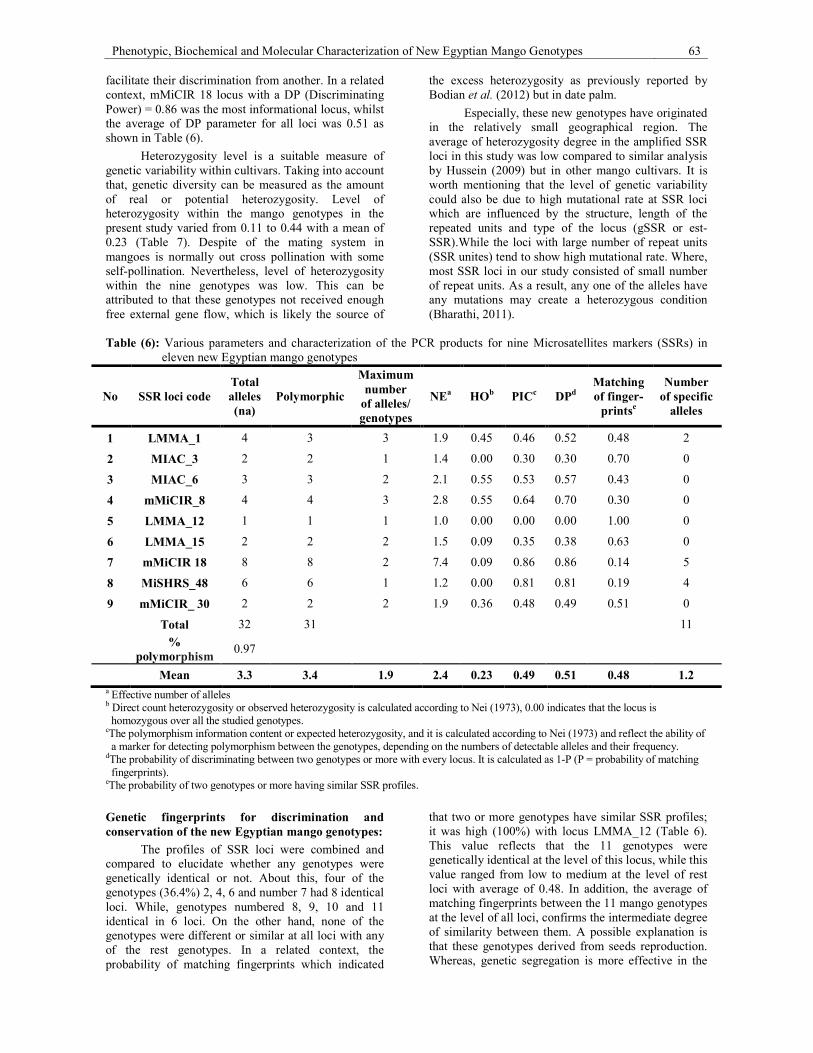
In the present study, mango genotypes were
clustered (Figure 2) and the dendrogram could be divided into three sections or clusters. Genotypes2 and 4 formed a separated cluster and both genotypes showed the highest genetic similarity. Whereas, cluster 2 consisted of three genotypes (genotypes 1, 3 and 5); it was observed that the three genotypes were very closely related to each other. Also, the same case was noticed with genotypes 6, 7, 8 and 10 which clustered together in one sub cluster. While the rest genotypes9 and 11 were clustered together in the second sub cluster.
In fact, the dendrogram generally indicates the genetic relationships among set of genotypes in a population and may express the evolutionary and parentage history for thus genotypes. This is in a case that the samples of population under study were numerous and diverse enough as reported by Tran (2005). Consequently, the dendrogram in the present study was just to assessment structure of the genetic variation not to understand any evolutionary relationships.
Figure (2): Dendrogram for eleven mango genotypes constructed from SSRs data based on Average Linkage (Between Groups), using Similarity computed according to Dice coefficient, with 22 fragments

66 Serry et al., 2019
CONCLUSION
The eleven studied mango genotypes had a superior fruit quality and differed in dates of full bloom, maturity stage, bearing habit and floral malformation. Commonly, all genotypes had a commercially acceptable quality and produced relatively a high yield ranged from 298.7-394 Kg/tree. Generally, the results showed that genotype No. 9 recorded the highest value (96.6%) in the general evaluation, followed by genotypes No. 7 and No. 5 scored 94 and 91.8%, respectively. In general, these three genotypes possessed most of the desired commercial attributes of international standard.
In addition, the cluster results showed presence of moderate similarity degree between the eleven mango genotypes. Which could be interpreted as these genotypes not received enough free external gene flow. Influenced by its origin in a relatively small geographical area, the number of samples in the present study was limited. However, this study had elucidated that microsatellite (SSR) markers were able to distinguish between all the genotypes. In addition, analysis of molecular characterization of the SSR loci could provide sufficient power to discriminate between mango genotypes and it was possible to help in the creation of molecular genetic data base for mango germplasm. Also, SSR markers were very useful to determine the genetic fingerprints of the new Egyptian mango genotypes. Moreover, estimation of the genetic distance between genotypes is important for breeders to select genotypes for genetic improvement purposes.
REFERENCES
A.O.A.C. (1995). Analysis of Association of Official Agricultural Chemists. 14th ed. Washington DC, USA, pp. 832.
Arnao, M. B., A. Cano, J. F. Alcolea and M. Acosta (2001). Estimation of free radical - quenching activity of leaf pigment extracts. Phytochemical analysis, 12(2): 138-143.
Begum, H., T. Medagam, M. Surapaneni, P. R. Boreddy, N. Gonela, N., Javaregowda, A. Ebrahimali (2013). Molecular analysis of intracultivar polymorphism of ‘Panchadarakalasa’ mango by microsatellite markers. Jordan Journal of Biological Sciences, 6: 127-136.
Bharathi, A. (2011). Phenotypic and genotypic diversity of global Finger Millet (Eleusine coracana (L.) Gaertn.) composite collection. PhD. the Tamil Nadu Agricultural University, Coimbatore.
Bodian, A., A. Mohamed and N. Khadidiatou (2012). Genetic diversity analysis of date palm (Phoenix dactylifera L.) Cultivars from Figuig oasis (Morocco) using SSR markers. International Journal of Science and Advanced Technology, 2(3): 96-104.
Botstein, D., R. L. White, M. Skolnick and R. W. Davis (1980). Construction of a genetic
linkage map in man using restriction fragment length polymorphisms. Am. J. Human Genet., 32: 314-331.
Callen, D. F., A. D. Thompson, Y. Shen, H. A. Phillips, R. I. Richards, J. C. Mulley and G. R. Sutherland (1993). Incidence and origin of null alleles in the (AC)n Microsatellite markers. Am. J. Human. Genet, 52: 922-927.
Chaikiattiyos, S., R. Kurubunjerdjit and P. Anupunt (2000). Improvement and evaluation of the selected, Kaew Sisaket. Acta Hort., 509: 185-192.
Crane, J. H., I. E. Bally, R. V. Mosqueda-Vazquez and E. Tomer (1997). Crop Production. In: The Mango: Botany, Production and Uses, Litz, R.E. (Ed.). CAB International, Wallingford, UK, pp: 203-256.
Crisosto, C. H., G. M. Crisosto and P. Metheney (2003). Consumer acceptance of ‘Brooks’ and ‘Bing’ cherries is mainly dependent on fruit SSC and visual skin color. Postharvest Biol. Technol., 28: 159-167. Davies, B.H., 1976. Carotenoids. In: Goodwin, T.W. (Ed.), Chemistry and Biochemistry.
Desai, A. R. and D. G. Dhandar (2000). Variation in physico-chemical and morphogenetic characters of some mango varieties of Goa. Proc. Sixth 1 mango Symp. Eds. S. Subhadrabandhu - A. Pichakum. Acta Hort., 509, ISHS 2000.
Dianne, V., H. Josh, A. Mallikarjuna and R. Jeffrey (2016). Evolutionary genomics of peach and almond domestication. G3; genes/Genomes/ Genetics, volume x: 1-8.
Duval, M. F., J. Bunel, C. Sitbon and A. M. Risterucci (2005). Development of Microsatellite markers for mango (Mangifera indica L.). Molecular Ecology Notes, 5: 824-826.
Eiadthong, W., K. Yonemori, A. Sugiura, N. Utsunomiya and S. Subhadrabandhu (1999). Identification of mango cultivars of Thailand and evaluation of their genetic variation using the amplified fragments by simple sequence repeat- (SSR-) anchored primers, Scientia Horticulturae, 82: 57-66.
Eid, M. and M. A. Hussein (2017). Efficiency Parameters of SSR Markers for Characterization of Some Mango Cultivars and Their Suitability in Molecular Bar-coding. New York Science Journal, 10(8): 68-76.
El-Agamy M. K., Hoda H. Aly and Samia S. Hosny (2018). Flowering and fruiting behavior of some introduced Mango cultivars grown in Giza Governorate conditions. Middle East Journal of Agriculture Research, 07(2): 559-568
El-Wakeel, H. F., M. M. Rashid, R. K. Bo Reshid (2006). Evaluation of some mango cultivar sunder eastern coast conditions of United Arab Emirates. 10th Conf. Agric. Dev. Res., Fac. Agric., Ain Shams Univ., Cairo, Egypt, 2006. Annals Agric. Sci., Sp., 1: 179-190.

Phenotypic, Biochemical and Molecular Characterization of New Egyptian Mango Genotypes 67
El-Shiekh, A. F. and R. K. Burshaid (2010). Quality evaluation of some local and imported mango cultivars grown in the United Arab Emirates. Acta Hort., 875: 365-375.
Gadow, A. V., E. Joubert and C. F. Hansmann (1997). Comparison of the antioxidant activity of rooibos tea (Aspalathus linearis) with green oolong and black tea. Food Chem, 60: 73-77.
Hart, L. and A. C. Clark (1997). Principles of population Genetics. 3rd edition. Sinauer Associates, Inc, Sunderland, U. S. A.
Honsho, C., K. Nishiyama, W. Eiadthong and K. Yonemori (2005). Isolation and characterization of new Microsatellite markers in mango (Mangifera indica). Molecular Ecology Notes, 5: 152-154.
Hussein, M. A. (2009). Identification and estimation of genetic relationships among some mango cultivars grown in Egypt using DNA techniques. Ph.D. Thesis, Suez Canal University, Egypt.
Iyer, C. P. A. and C. Degani (1997). Classical Breeding and Genetics. In: The Mango-Botany, Production and Uses, Litz, R.E. (Ed.). Wallingford Oxon/CAB International, New York, USA, pp.: 49-68.
Iyer, C. P. and R. J. Schnell (2009). Breeding and genetics. In: The mango: botany, production and uses. 2nd edn. (Litz RE, ed.). British Library, London.
Jones, D. A. (1972). Blood Samples: probability of discrimination. Journal of the Forensic science Society, 12: 355-359.
Kakar, A. A., M. A. Sheekh, G. H. Jamro and M. I. Lango (1999). Study of morphological characteristics of mango varieties. Sarhad J. of Agri., 15(4): 297-298. (c.f. Hort. Abst. 70 No. 2-1207).
Kloosterman, A. D., B. Budowlw and P. Daselaar (1993). PCR-amplification and detection of human DIS80 VNTR locus-Amplification condition, population genetics and application in forensic analysis. International Journal of legal Medicine, 105: 257-264.
Lee, S. C., J. H. Kim, S. M. Jeong, D. R. Kim, J. U. Ha, K. C. Nam and D. U. Ahn (2003). Effect of far-infrared radiation on the antioxidant activity of rice hulls. Journal of Agric. And Food Chemistry, 51(15): 4400-4403.
Maisuthisakul, P., M. Suttajit and R. Pongsawatmanit (2007). Assessment of phenolic content and free radical-scavenging capacity of some Thai indigenous plants. Food Chem., 100: 1409-1418.
Métais, I., B. Hamon, R. Jalouzot and D. Peltier (2002) Structure and level of genetic diversity in various bean types evidenced with microsatellite markers isolated from a genomic enriched library. Theoretical and Applied Genetics, 104: 1346-1352.
Mitra, S., S. Kunda and S. K. Mitra (2001).Chemical composition of some varieties and hybrids of
mango. Environment and Ecology, 19(2): 487-488. (C.f. Hort. Abst., 72: 5-4436).
Morcillo, D. C., N. Billotte, G. F. Ngando-Ebongue, M. Domonhe´do, H. Pizot, T. Cue´llar, S. Espe´out, R. Dhouib, F. Bourgis, S. Clavero, T. J. Tranbarger, B. Nouy and V. Aronde (2013). Improving palm oil quality through identification and mapping of the lipase gene causing oil deterioration. Nature Communications, 1-8.
Mukherjee, S. K. (1972). Origin of Mango (Mangifera indica L.). Economic Botany.26, 260-264.
Nei, M. (1973). Analysis of gene diversity in subdivided populations. Proc. Natl. Acad. Sci. USA, 70: 3321-3323.
Olano, C. T., R. J. Schnell, W. E. Quintanilla and R. J. Campbell (2005). Pedigree analysis of Florida mango cultivars. Proceedings of the Florida State Horticultural Society, 118: 192-197.
Pedersen, B. H. (2006). DNA fingerprinting of 51 sweet and sour prunus accessions using simple sequence repeats. Journal of Horticultural Science& Biotechnology, 81: 118-124.
Porebski, S., L. Grant Bailey and B. R. Baum (1997). Modification of a CTAP DNA extraction protocol for plants containing high polysaccharide and polyphenol components. Plant Molecular Biology Reporter, 15(1): 8-15.
Ravishankar, K. V., H. M. Bellam, A. Lalitha and R. D. Makki (2011). Development of new microsatellite markers from mango (Mangifera indica L.) and cross-species amplification. American Journal of Botany, 96-99.
Raymond, M. and F. Rouset (1995). GENEPOP (version 1.31): population genetics software for exact test and ecumenicism. J. Hered 86:248-249. http://whbiomed.curtin.edu.au/ gene-pop/
Rocha, A., L. C. Salomao, T. M. Salomao, C. D. Cruz and D. L. de Siqueira (2012). Genetic diversity of ‘Uba’ mango tree using ISSR markers. Molecular Biotechnology, 50: 108-113.
Schnell, R. J., R. J. Knight, D. M. Harkins and G. Zill (1994) Eliminating zygotic seedlings in ‘Turpentine’ mango rootstock populations by visual rouging. Hortscience, 29: 319-320.
Schnell, R. J., C. T. Olano, W. E. Quintanilla and A. W. Meerow (2005). Isolation and characterization of 15 microsatellite loci from mango (Mangifera indica L.) and cross-species amplification in closely related taxa. Molecular Ecology Notes, 5: 625-627.
Singh, N. K., A. K. Mahato, P. K. Jayaswal, A. Singh, S. Singh, N. Singh, V. Rai, S. V., Amitha Mithra, K. Gaikwad, N. Sharma, S. Lal, M. Srivastava, J. Prakash, U. Kalidindi, S. K. Singh, A. K. Singh, K. Khan, R. K. Mishra, S.

68 Serry et al., 2019
Rajan, A. Bajpai, B. S. Sandhya, P. Nischita, K. V. Ravishankar, M. R. Dinesh, N. Kumar, S. Jaiswal, M. A. Iquebal, D. Kumar, A. Rai and T. R. Sharma (2016). Origin, diversity and genome sequence of mango (Mangifera indica L.). Indian Journal of History of Science, 51: 355-368
Singh, L. B. (1948). Studies in biennial bearing. J. Hort. Sci., 24: 45-65.12.
Smith, J. S., S. Kresovich, M. S. Hopkins, S. E. Mitchell, R. E. Dean, W. L. Woodman, M. Lee and K. Porter (2000). Genetic diversity among elite sorghum inbred lines assessed with simple sequence repeats. Crop Science, 40: 226-232.
Sneath, P. H. and R. R. Sokal (1973). Numerical taxonomy. Freeman. San Francisco, 573 pp.
Steel, R.G. D. and J. H. Torrie (1981). Principles and procedures of Statistics. A Biometrical approach. Second ed. McGraw-Hill, pp.167-173.
Surapaneni, M., L. Vemireddy, H. Begum, B. Purushotham, C. Neetasri, J. Nagaraju, S. Anwar, E. A. Siddiq (2013). Population structure and genetic analysis of different utility types of mango (Mangifera indica L.) germplasm of Andhra Pradesh state of India
using microsatellite markers. Plant Systematics and Evolution, 299: 1215-1229.
Susana, G. P., M. Cristina and G. Ana (2015). Exploring genetic diversity and quality traits in a collection of onion (Allium cepa L.) landraces from north-west Spain Genetika, 47: 885-900.
Tran, T. M. (2005). Genetic variation in cultivated coffee (Coffea arabica L.) accessions in Northern New South Wales, Australia. MSc thesis. Southern Cross University.
Viruel, M. A., P. Escribano, M. Barbieri, M. Ferri, J. I. Hormaza (2005). Fingerprinting, embryo type and geographic differentiation in mango (Mangifera indica L., Anacardiaceae) with microsatellites. Molecular breeding, 14: 383-383.
Wahdan, M. T., A. Z. Abdelsalam, A. A. El-Naggar and M. A. Hussein (2011). Preliminary Horticultural Studies to Describe and Identify of Two New Egyptian Mango Strains Using DNA Fingerprint. Journal of American Science, 7(2): 641 – 650.
Wilcox, J. C. (1944). Some factors affecting apple yields in the Okanagan Valley. Sci. Agric., 25: 189-213 (C.f. J. Hort. Sci., 24(1): 45-65).
الخصائص المظھریة والبیوكیماویة والجزیئیة لتراكیب وراثیة جدیدة من المانجو المصریة
٢، محمد عبد الجواد حسین ١عليمحمد ، محمد صالح ١نجالء كمال سرى قسم البساتین ، كلیة الزراعة ، جامعة قناة السویس ، اإلسماعیلیة ، مصر١
قسم النبات الزراعي، كلیة الزراعة ، جامعة قناة السویس ، اإلسماعیلیة ، مصر٢
خصائصھا البستانیة المتمیزة وجودة تركیبًا وراثیًا لالخطوة األولى نحو تحسین إنتاج المانجو من خالل اختیار أحد عشر بدأت تحت الوراثیة المانجو تراكیباختلفت جمیع . ٢٠١٨إلى ٢٠١٦ام وعخالل األبستان جامعة قناة السویس حیث قطفت الثمار من ، ثمارھا
صفاتھا تراكیب الوراثیةالجمیع . الثمار البیوكیماویةوخصائص لزھريتشوه اال، المعاومةاإلزھار الكامل، مرحلة النضج، مواعیدسة في االدرأعلى قیمة ٩رقم تركیب الوراثيال شكل عام، سجلب. شجرة/ كجم ٣٩٤ - ٢٩٨.٧نسبیا تراوح بین اعالیمحصوال تجاریا وأنتجت متمیزة
٪ على ٩١.٨و ٩٤.٠اللتان سجلتا ٥والرقم ٧رقم تراكیب الوراثیةال، یلیھا جودة الثمرةو المعاومةفي التقییم العام وفًقا للمحصول، ) ٪٩٦.٦(لمزید من الفھم لطبیعة باإلضافة. لوبة للمعاییر الدولیةالثالث معظم الصفات التجاریة المط تراكیب الوراثیةالبشكل عام، تمتلك ھذه . التوالي
ى تركیب االختالفات الوراثیة من خالل تضخیم تسعة مواقع وراثیة بمساعدة معلمات التتابعات المكررة البسیطة والتي تم اختیارھا بناءا علتعریف جزیئي لحمایة ھذه إلنشاءیانات البصمة الوراثیة تحلیل ب. ثبات نتائجھا وقدرتھا على التمییز بین التراكیب الوراثیة تحت الدراسة
كما . حزمة لكل موقع وراثي ٣.٦بمتوسط % ٩٧بنسبة تباین ) ألیل(حزمة ٣٢ إجمالينتج عن تضخیم التسعة مواقع وراثیة عدد . التراكیب ٠.١١ت نسبة الخلط داخل التراكیب من في حین تراوح ٠.٢٣بمتوسط ٠.٥٥ إلىتراوحت نسبة الخلط المحسوبة لكل موقع وراثي من صفر
النتائج عدم وجود أظھرتوفیما یتعلق باحتمال تطابق البصمة الوراثیة، . ٠.٥١كما كان متوسط طاقة التمییز لتلك المواقع بمقدار . ٠.٤٤إلى وتراوحت درجة التشابھ الوراثي . مةتطابق أو اختالف كامل بین أي من التراكیب الوراثیة وبقیة التراكیب على مستوى جمیع المواقع المضخ
حزمة منفردة في سبعة تراكیب ١١وقد تم تسجیل . مما یشیر للمستوى المعتدل من االختالفات الوراثیة ٠.٥٣بمتوسط ٠.٩٠إلى ٠.١٨من .وراثیة قد تكون مرتبطة بجینات وظیفیة جدیدة یمكن استخدامھا في تحسین المانجو
ودة الثمار، اكتمال النمو، تبادل الحمل، بصمة الحمض النووي دنا، معلمات التتابعات المكررة البسیطة، االختالفات الوراثیةالمانجو، ج :الكلمات الدالة