Embed Size (px)
Citation preview
Phenomenological Partial Specific Volumes for G-QuadruplexDNAs
Lance M. Hellman, David W. Rodgers, and Michael G. Fried*Department of Molecular and Cellular Biochemistry and Center for Structural Biology, University ofKentucky, Lexington, KY 40536
AbstractAccurate partial specific volume (ν̄) values are required for sedimentation velocity and sedimentationequilibrium analyses. For nucleic acids, the estimation of these values is complicated by the fact thatν̄ depends on base composition, secondary structure, solvation and the concentrations and identitiesof ions in the surrounding buffer. Here we describe sedimentation equilibrium measurements of theapparent isopotential partial specific volume φ′ for two G-quadruplex DNAs and a single-strandedDNA of similar molecular weight and base composition. The G-quadruplex DNAs are a 22 nucleotidefragment of the human telomere consensus sequence and a 27 nucleotide fragment from the humanc-myc promoter. The single-stranded DNA is 26 nucleotides long and is designed to have lowpropensity to form secondary structures. Parallel measurements were made in buffers containingNaCl and in buffers containing KCl, spanning the range 0.09M ≤ [salt] ≤ 2.3M. Limiting values ofφ′, extrapolated to [salt] = 0M, were: 22-mer (NaCl-form), 0.525 ± 0.004 mL/g; 22-mer (KCl-form),0.531 ± 0.006 mL/g; 27-mer (NaCl-form), 0.548 ± 0.005 mL/g; 27-mer (KCl-form), 0.557 ± 0.006mL/g; 26-mer (NaCl-form), 0.555 ± 0.004 mL/g; 26-mer (KCl-form), 0.564 ± 0.006 mL/g. Smallchanges in φ′ with [salt] suggest that large changes in counterion association or hydration are unlikelyto take place over these concentration ranges.
KeywordsPartial specific volume; Analytical ultracentrifugation; G-quadruplex DNA; Single-stranded DNA
IntroductionThe ability of guanines to form G-tetrads was first proposed over 45 years ago (Gellert et al.1962). The role of G-tetrad containing quadruplexes in maintaining the stability ofchromosome ends was postulated approximately 25 years later (Henderson et al. 1987:Williamson et al. 1989). Today, G-quadruplex-containing telomere structures are known to beessential for the maintenance of linear chromosome structure (Greider and Blackburn 1985;Kang et al. 1992). Recently, G-quadruplexes have been proposed to function as a means forkeeping promoter regions of various genes readily accessible to regulatory proteins (Lane etal. 2008).
Sedimentation methods are increasingly used for the characterization of structures containingnucleic acids, and accurate specification of the partial specific volume (ν̄) is essential forcalculation of molecular weights and frictional ratios from sedimentation data. However,beyond the classical single-stranded and duplex DNA structures (for which ν̄ values have been
Address correspondence to: Michael G. Fried, Department of Molecular and Cellular Biochemistry University of Kentucky, 741 SouthLimestone, Lexington, KY 40536-0509. Telephone: (859) 323-1205; Telefax: (859) 323-1037; [email protected].
NIH Public AccessAuthor ManuscriptEur Biophys J. Author manuscript; available in PMC 2011 February 1.
Published in final edited form as:Eur Biophys J. 2010 February ; 39(3): 389. doi:10.1007/s00249-009-0411-7.
NIH
-PA Author Manuscript
NIH
-PA Author Manuscript
NIH
-PA Author Manuscript
tabulated by Durchschlag (1986)), relatively few nucleic acid secondary structures have beencharacterized in this way. The classical approach to measuring ν̄ involves the accuratemeasurement of solution densities at macromolecular concentrations sufficient to causemeasurable change in solution density (Lee et al. 1979). This approach requires highconcentrations of homogeneous macromolecule (typically in the range of 3-20 mg/mL) andhighly-accurate densimetry (Lee et al. 1979; Durchschlag 1986). The quantities ofmacromolecule required by this approach have limited its use to stable, easily acquiredspecimens.
An alternate method offering accurate approximations of ν̄ and requiring smaller quantities ofmacromolecule, was developed by Edelstein and Schachman (1967; 1973). This approach usessedimentation equilibrium measurement of buoyant molecular weights in H2O and D2Osolutions of differing density. Here, we use a variation of the Edelstein-Schachman method,in which the solvent density is varied by changing the salt concentration. This variation dependson the assumption, justified by counterion-condensation theory (Manning 1978), that thefractional charge neutralization of nucleic acids by monovalent cations saturates at saltconcentrations well below those typically used in analytical ultracentrifugation analysis. Wealso present an alternative approach, using known sequence molecular weights to calculate theapparent isopotential partial specific volume (φ′) directly from sedimentation equilibrium data.We use these methods to determine the φ′ of two G-quadruplex structures, for which goodexperimental values of ν̄ or φ′ do not exist, and of a single-stranded DNA, to provide a basisfor comparing these methods with results obtained by classical densimetry.
The DNAs that we have chosen to study have different base compositions and secondarystructures. Two (of 22 nt and 27 nt) have been shown to form G-quadruplex structures; one (a26-mer) is designed to be largely single-stranded (Table 1). In addition, the G-quadruplexstructures are likely to differ in secondary fold. As shown in Fig. 1A, the Na+-form of the 22-mer has a structure with a single diagonal loop and two laterals, known as a “basket”conformation (PDB identifier 143D; Wang and Patel 1993). Under crystallization conditions,the K+-form of the 22-mer can take on a conformation with a three-strand reversal that has nolateral loops, also called a “propeller” structure (PDB identifier 1KF1; Parkinson et al. 2002).However, in free solution, a 23-mer of the same sequence with an additional 5′ deoxythymidineresidue folds to form a mixed “3+1” structure distinct from the propeller structure (PDBidentifier 2JSM; Phan et al., 2007;Fig. 1C). There is evidence that the 22-mer sequence usedin the studies described here also samples the “3+1” fold in K+-solutions (Ambrus et al.,2006). It is noteworthy that the 3+1 structure also differs from the pure basket conformationthat is seen with the Na+-form (compare Figure 1 panels a and c). In both sodium and potassiumsolutions, the 22-mer forms three stacked G-tetrads connected by loops containing three un-paired nucleotides. The 27-mer also folds to form a “propeller” conformation in potassium-containing buffers (PDB identifier 1XAV; Ambrus et al. 2005). However, this sequence hasfive G-tracts that may participate in quadruplex structures. Since only four are needed to forma G-quadruplex, the 27-mer sequence has the potential to form several alternative folds. Thenumber of nucleotides present in the loops depends on which G-tracts are used in thequadruplex. The lengths of unpaired 5′ and 3′ ends are also dependent on the G-tracts involvedin structure formation and can reach lengths up to 7 or 9 nucleotides, respectively. To ourknowledge there is no high-resolution structure available for the sodium form of the 27-mer,but hydrodynamic data shown below are consistent with the idea that its structure is differentfrom that of the potassium form. Alternate possible structures of the 22-mer quadruplex DNAare contrasted in Fig. 1. Several factors contribute to partial specific volume. Among these areresidue composition, packing and solvent interactions including electrostriction (Durchschlag1986). Since our DNA molecules have different folds and offer different surfaces for solventinteraction, we anticipated that they would have different partial specific volumes. Theexperiments described below test that prediction.
Hellman et al. Page 2
Eur Biophys J. Author manuscript; available in PMC 2011 February 1.
NIH
-PA Author Manuscript
NIH
-PA Author Manuscript
NIH
-PA Author Manuscript

ExperimentalThe sequences of the DNA molecules used are given in Table 1. These DNAs were obtainedfrom Invitrogen and used without further purification. Aliquots of each sample were dialyzedagainst 10 mM Tris (pH 8.0), 1 mM EDTA (TE buffer), adjusted to contain a final concentrationof 75mM NaCl or KCl (as appropriate). Samples were heated to ∼100°C for 1 min and allowedto slowly cool to 37°C and then annealed in a water-bath overnight at 37°C. Samples weredialyzed overnight at 4°C against TE buffer, adjusted to contain working concentrations ofNaCl or KCl, as appropriate. After dialysis, buffers were thoroughly degassed and densitieswere measured using a Mettler DA-300 density meter at 4°C. For densimetry, temperature wascontrolled to ± 0.01°C.
Analytical UltracentrifugationSedimentation velocity and equilibrium experiments were performed using a Beckman XL-Aanalytical ultracentrifuge. Sedimentation velocity experiments were performed at 4°C and 40000 rpm. Absorbance measurements were made at 260 nm. Distributions of sedimentationcoefficients c(s) were determined using Sedfit (Schuck et al. 2002). Sedimentation equilibriumdata were obtained at 4°C with rotor speeds spanning the range 20 000-45 000 rpm. Equilibriumwas considered to be attained when scans taken 6 hr apart superimposed. Sedimentationequilibrium data were analyzed using equation 1.
(1)
Here, A(r) is the absorbance at radial position r, αn,0 is the concentration of the nth species at
radial position r0, and . Mn is the molecular weight of species n, φ′nthe apparent isopotential partial specific volume of the nth species, ρ the solvent density, ω theangular velocity, R is the gas constant, T the absolute temperature, and ζ is a baseline offsetterm (Laue 1995).
The apparent partial specific volume, φ′, was measured by a variation the method of Edelsteinand Schachman (1967; 1973), in which solvent densities are modulated by changing the saltconcentration. In this analysis, φ′(E-S) is given by the relation
(2)
Here k is the ratio of molecular weights under high density conditions (H) to that under lowdensity conditions (L) Edelstein and Schachman (1967; 1973). Because DNA molecularweights are not expected to change with [salt], we set k = 1 for our analyses. Q is the integratedform of Eq. 1 for a single, ideal species.
(3)
Here c is macromolecular concentration. This method allows the simultaneous determinationof M and φ′, but it requires data in which values of Q are constant within each experiment.
Hellman et al. Page 3
Eur Biophys J. Author manuscript; available in PMC 2011 February 1.
NIH
-PA Author Manuscript
NIH
-PA Author Manuscript
NIH
-PA Author Manuscript

Sources of deviation from a linear relationship of ln c with r2 include macromolecularinhomogeneity and non-ideal sedimentation.
Because the sequence molecular weights of our DNAs are accurately known, an alternate,phenomenological estimate of φ′ could be obtained by directly fitting sedimentationequilibrium data with Eq. 1, as originally described by Ebel et al. (2000). In this analysis Mnwas input as a fixed value and φ′ was allowed to float.
Structural calculationsSolvent-accessible surface areas were calculated by the Connolly method (Connolly 1983)using a probe of 1.4Å radius, implemented in the program GRASP (Nicholls et al., 1991).
ResultsSedimentation velocity experiments were performed to determine the number ofindependently-sedimenting species in each DNA preparation and to determine whether the G-quadruplex DNAs were folded into compact secondary structures or whether they were presentin unfolded, extended states. As shown in Fig. 2a, solutions of 22-mer and 26-mer containedsingle sedimenting species but the 27-mer preparations contained two discrete species.Analysis of c(M) distributions (summarized in Table 2) indicate that the 22-mer and 26-merspecies were monomeric, as was most slowly-sedimenting species present in the 27-mersamples. The faster-sedimenting peak in the 27-mer samples had an apparent molecular weightconsistent with a tetrameric structure.
As shown in Table 2, the s20,w values for the monomeric forms of 22-mer and 27-mer DNAsare larger than those of the single-stranded 26-mer, indicating that they are compactly folded.The value of s20,w for the 22-mer is similar to previously-reported values for the quadruplexstructure of this DNA (Li et al. 2005;Mekmaysy et al. 2008). To our knowledge, the s20,w valuefor the single-stranded 26-mer sequence has not been reported. Differences in s20,w for G-quadruplex DNAs annealed in NaCl and KCl buffers are likely to signify differences in thecompactness of these structures. (Parkinson et al., 2002;Wang and Patel, 1993).
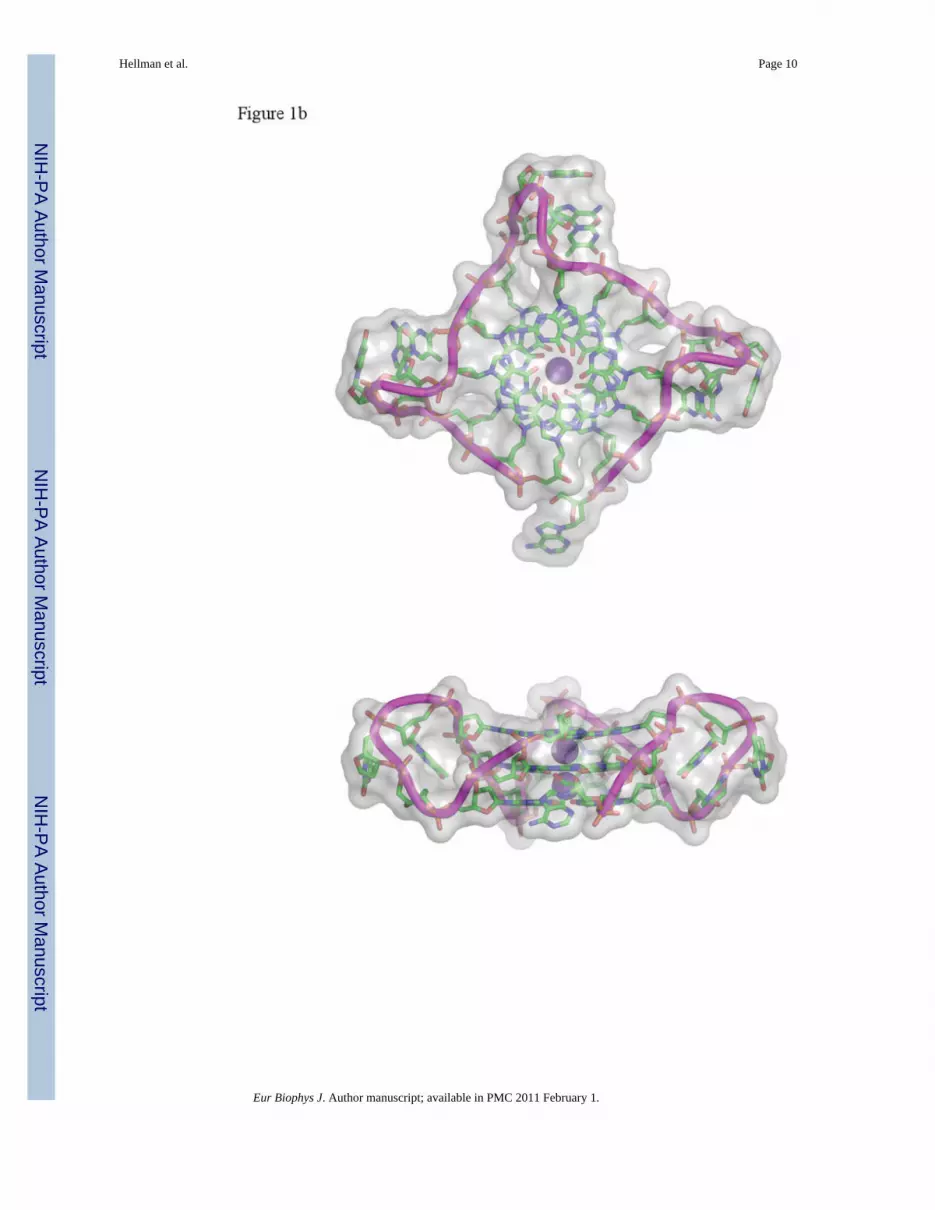
To perform the Edelstein-Schachman analysis of φ′, DNA samples were brought tosedimentation equilibrium at 4°C. Buffer densities were varied by changing [NaCl] or [KCl].Equilibrium data from the 22-mer G-quadruplex DNA (Fig. 2b) and the 26-mer ssDNA wereconsistent with a single species for each preparation, however, data for the 27-mer could notbe fit with the version of equation 1 that describes a single species. Consistent with thesedimentation velocity result (Fig. 2a), an additional term with buoyant molecular weightapproximately 4-times that of monomer was needed to account for the sedimentationequilibrium distribution of samples of 27-mer (result not shown). For the homogeneoussamples obtained with 22-mer and 26-mer DNAs, values of Q were calculated using Eq. 3.Graphs of Q as functions of [salt] and solution density, for NaCl- and KCl solutions are shownin Fig. 3. Values of φ′(E-S) were calculated from the density dependence of Q, using Eq. 2. Forthe quadruplex 22-mer in NaCl and KCl buffers values of φ′(E-S) were 0.574 ± 0.090 mL/g and0.588 ± 0.088 mL/g, respectively and the corresponding values for the 26-mer in NaCl andKCl were 0.525 ± 0.028 mL/g and 0.590 ± 0.057 mL/g, respectively (Table 3). As discussedbelow, these values and their ranges overlap with ones obtained by direct fitting of φ′ usingEq. 1 and the sequence molecular weights of the DNAs. Because samples containing the 27-mer were heterogeneous, the dependence of ln c on r2 was non-linear and unique values ofQ could not be obtained at any salt concentration. This prevented estimation of φ′ for the 27-mer quadruplex by the Edelstein-Schachman method.
Hellman et al. Page 4
Eur Biophys J. Author manuscript; available in PMC 2011 February 1.
NIH
-PA Author Manuscript
NIH
-PA Author Manuscript
NIH
-PA Author Manuscript

Phenomenological values of φ′ were obtained by fitting equilibrium data using Eq. 1, withMn fixed, but adjustable φ′, as originally described by Ebel et al. (2000). G-quadruplexstructures are stabilized by a single tightly-bound cation located in the center of each G-quartetor between two G-quartet planes (Burge et al. 2006). Our calculations used values of Mn thatassumed two non-exchanging cations per quadruplex-forming DNA molecule; if these siteswere unoccupied, this would result in errors in Mn of ≤ 1.1%. This translates into an error inφ′ of ∼ 0.5%. This uncertainty is comparable to the uncertainty in φ′ due to experimental scatter.Data was obtained over salt concentration ranges 0.09M ≤ [NaCl] ≤ 2.3M and 0.09M ≤ [KCl]≤ 2.1M (Fig. 4); over these ranges, the apparent change in φ′ with salt concentration is lessthan the scatter of data. The small dependence of φ′ values on salt concentration is inconsistentwith large, [salt] dependent conformational changes, while the absence of large changes inMn(1−φ′ρ) is inconsistent with the formation of new quaternary interactions or increases inmolecular weight due to counterion binding. These results are compatible with the predictionthat cation binding to oligoelectrolytes with charge densities like that of DNA, dissolved in1:1 salt solutions, saturates at low millimolar salt concentrations (Manning 1978). Averagevalues of φ′ for the 22-mer G-quadruplex in NaCl and KCl buffers were 0.536 ± 0.009 mL/gand 0.541 ± 0.019 mL/g; for the 26-mer ssDNA, 0.548 ± 0.021 mL/g and 0.551 ± 0.015 mL/g; and for the 27-mer G-quadruplex, 0.546 ± 0.005 mL/g and 0.556 ± 0.013 mL/g, respectively.As a result of the very small dependence of on [salt], values of φ′ extrapolated to [salt] = 0Mare virtually indistinguishable from the average values (Table 3).
DiscussionThe Edelstein-Schachman method is useful for the determination of φ′ with homogeneoussolutes in two- or three-component systems. In the variant of the method used here, we havealtered solvent density by changing salt concentration. This relies on the assumption that factorsaffecting partial specific volume will be, to a first approximation, independent of [salt] overthe range of concentrations that we have tested. The linear dependences of Q and φ′ on [salt](Figs 3 and 4) show this to be the case. We note that our experiments do not extend into thelow-salt range in which the partial specific volumes of nucleic acids are highly-dependent onsalt concentration (c.f., Durchschlag 1989). The Edelstein-Schachman approach requires alinear dependence of ln c on r2 (Eq. 3), which is not always observed for heterogeneousmacromolecular systems. The alternate approach, in which φ′ is calculated from buoyantmolecular weight data and the sequence molecular weight, does not have this drawback becausevalues are obtained by direct fitting of Eq. 1 and because the determination does not involvethe accurate measurement of differences in a parameter such as Q, as a function of solventdensity. However, we emphasize that this approach to estimating φ′ requires accurate priorknowledge of the sequence molecular weight.
The single-stranded and G-quadruplex DNAs that we have studied have different secondarystructures, different solvent-accessible surface areas and different numbers and kinds of ion-binding sites. Thus it is remarkable that the values of φ′ and φ′(E-S) obtained for 22, 26 and 27nt DNAs, in sodium and potassium buffers are so similar to one another (Table 3). Werationalize this as follows. While the base compositions of the 22, 26 and 27 nt DNAs differ,so do the proportions of bases that are stacked and the proportions that are engaged in hydrogen-bonded pairs or quartets. In addition, the relative amounts of charged and uncharged and polarand non-polar surface exposed to solvent differ from molecule to molecule and betweenconformations of the same molecule. These differences may exert compensating effectsresulting in the small range in φ′ values that we have observed.
The quadruplex-forming molecules that we have tested are mixtures of G-quartet, loop andsingle-stranded motifs; each is expected to contribute to the value of φ′ observed for thatmolecule and conformation. Thus, these experiments do not establish a value of φ′ for a pure
Hellman et al. Page 5
Eur Biophys J. Author manuscript; available in PMC 2011 February 1.
NIH
-PA Author Manuscript
NIH
-PA Author Manuscript
NIH
-PA Author Manuscript

G-quartet structure, although they provide values for quadruplex-containing structures thatmay be biologically-relevant. The values of φ′ that we observe for G-quadruplex DNAs aresimilar to ones reported for populations of multimers of dG8 and dG16 (φ′ ∼0.54 mL/g) thatwere likely to contain quadruplex structures (Hatters et al. 2001). The values of φ′ obtainedfor the single-stranded 26-mer are the same, within-error, as that measured for a differentsingle-stranded DNA by Chapman and Sturtevant (1969) and cited more recently (Durchschlag1986).
It is striking that values of φ′ do not depend significantly on the identity of the dominant buffercation for any of the DNAs that we have sampled. This is particularly intriguing in view of therange of different quadruplex folds observed for the 22-mer DNA in sodium and potassiumbuffers (Fig. 1) and the fact that both 22-mer and 27-mer quadruplex DNAs undergo shifts inhydrodynamic properties with cation substitution (Fig. 2a and Table 2). The data obtained forsingle-stranded DNA indicates that the insensitivity of φ′ to cation substitution is not a uniqueproperty of quadruplex-containing DNAs. Finally, the values of φ′ for single-stranded and G-quadruplex DNAs fall within the range observed for duplex DNA at comparable saltconcentrations (0.503 mL/g ≤ φ′ ≤ 0.579 mL/g; Cohen and Eisenberg, 1968;Bonifacio et al.,1997). Given the range of secondary structures spanned by our data and that in the literature,we conclude that at moderate salt concentrations, φ′ is at most weakly dependent on the amountand kind of secondary structure that is present in a DNA sample.
Abbreviations
ν̄ Partial specific volume
φ′ Apparent partial specific volume
φ′(E-S) Apparent partial specific volume determined by Edelstein-Schachman equation
φ′(avg) Averaged apparent partial specific volume
φ′(extrap) Extrapolated apparent partial specific volume to [salt] = 0M
Mb Buoyant molecular weight
Mapp Apparent molecular weight
sT,B Sedimentation coefficient at experimental temperature and buffer
s20,w Sedimentation coefficient at 20°C in water
f/f0 Frictional ratio
ReferencesAmbrus A, Chen D, Dai J, Jones RA, Yang D. Solution structure of the biologically relevant G-quadruplex
element in the human c-MYC promoter. Implications for G-quadruplex stabilization. Biochemistry2005;44:2048–2058. [PubMed: 15697230]
Ambrus A, Chen D, Dai J, Bialis T, Jones RA, Yang D. Human telomeric sequence forms a hybrid-typeintramolecular G-quadruplex structure with mixed parallel/antiparallel strands in potassium solution.Nucleic Acids Res 2006;34:2723–2735. [PubMed: 16714449]
Bonifacio GF, Brown T, Conn GL, Lane AN. Comparison of the electrophoretic and hydrodynamicproperties of DNA and RNA oligonucleotides duplexes. Biophys J 1997;73:1532–1538. [PubMed:9284320]
Burge S, Parkinson GN, Hazel P, Todd AK, Neidle S. Quadruplex DNA: sequence, topology andstructure. Nucleic Acids Res 2006;34:5402–5412. [PubMed: 17012276]
Chapman RE Jr, Sturtevant JM. Volume changes accompanying the thermal denaturation ofdeoxyribonucleic acid. I. Denaturation at neutral pH. Biopolymers 1969;7:527–537.
Hellman et al. Page 6
Eur Biophys J. Author manuscript; available in PMC 2011 February 1.
NIH
-PA Author Manuscript
NIH
-PA Author Manuscript
NIH
-PA Author Manuscript

Cohen G, Eisenberg H. Deoxyribonucleate solutions: sedimentation in a density gradient, partial specificvolumes, density and refractive index increments, and preferential interactions. Biopolymers1968;6:1077–1100. [PubMed: 5663407]
Connolly ML. Solvent-accessible surfaces of proteins and nucleic acids. Science 1983;221:709–713.[PubMed: 6879170]
Durchschlag, H. Specific volumes of biological macromolecules and some other molecules of biologicalinterest. In: Hinz, HJ., editor. Thermodynamic Data for Biochemistry and Biotechnology. Springer-Verlag; New York: 1986. p. 45-128.Chap. 3
Durchschlag H. Determination of the partial specific volume of conjugated proteins. Colloid Polym Sci1989;267:1139–1150.
Ebel C, Eisenberg H, Ghirlando R. Probing protein-sugar interactions. Biophys J 2000;78:385–393.[PubMed: 10620302]
Edelstein SJ, Schachman HK. The simultaneous determination of partial specific volumes and molecularweights with microgram quantities. J Biol Chem 1967;242:306–311. [PubMed: 6016615]
Edelstein SJ, Schachman HK. Measurement of partial specific volume by sedimentation equilibrium inH2O-D2O solutions. Methods Enzymol 1973;27:82–98. [PubMed: 4797942]
Gellert M, Lipsett MN, Davies DR. Helix formation by guanylic acid. Proc Natl Acad Sci USA1962;48:2013–2018. [PubMed: 13947099]
Greider CW, Blackburn EH. Identification of a specific telomere terminal transferase activity inTetrahymena extracts. Cell 1985;43:405–413. [PubMed: 3907856]
Hatters DM, Wilson L, Atcliffe BW, Mulhern TD, Guzzo-Pernell N, Howlett GJ. Sedimentation analysisof novel DNA structures formed by homo-oligonucleotides. Biophys J 2001;81:371–381. [PubMed:11423421]
Henderson E, Hardin CC, Walk SK, Tinoco I, Blackburn EH. Telomeric DNA oligonucleotides formnovel intramolecular structures containing guanine-guanine base pairs. Cell 1987;51:899–908.[PubMed: 3690664]
Kang C, Zhang X, Ratliff R, Moyzis R, Rich A. Crystal structure of four-stranded Oxytricha telomericDNA. Nature 1992;356:126–131. [PubMed: 1545863]
Lane AN, Chaires JB, Gray RD, Trent JO. Stability and kinetics of G-quadruplex structures. NucleicAcids Res 2008;36:5482–5515. [PubMed: 18718931]
Laue, TM.; Shah, BD.; Ridgeway, TM.; Pelletier, SL. Computer-aided interpretation of analyticalsedimentation data for proteins. In: Harding, SE.; Rowe, AJ.; Harding, JC., editors. AnalyticalUltracentrifugation in Biochemistry and Polymer Science. The Royal Society of Chemistry;Cambridge, England: 1992. p. 90-125.
Laue TM. Sedimentation equilibrium as thermodynamic tool. Methods Enzymol 1995;259:427–452.[PubMed: 8538465]
Lee JC, Gekko K, Timasheff SN. Measurements of preferential solvent interactions by densimetrictechniques. Methods Enzymol 1979;61:26–49. [PubMed: 481227]
Li J, Correia JJ, Wang L, Trent JO, Chaires JB. Not so crystal clear: the structure of the human telomereG-quadruplex in solution differs from that present in a crystal. Nucleic Acids Res 2005;33:4649–4659. [PubMed: 16106044]
Manning GS. Molecular theory of polyelectrolyte solutions with application to electrostatic propertiesof polynucleotides. Q Rev Biophys 1978;11:179–246. [PubMed: 353876]
Mekmaysy CS, Petraccone L, Garbett NC, Ragazzon PA, Gray R, Trent JO, Chaires JB. Effect of O6-methylguanine on the stability of G-quadruplex DNA. J Am Chem Soc 2008;130:6710–6711.[PubMed: 18447358]
Nicholls A, Sharp KA, Honig B. Protein folding and association: insights from the interfacial andthermodynamic properties of hydrocarbons. Proteins 1991;11:281–296. [PubMed: 1758883]
Parkinson GN, Lee MPH, Neidle S. Crystal structure of parallel quadruplexes from human telomericDNA. Nature 2002;417:876–880. [PubMed: 12050675]
Phan AT, Kyryavyi V, Luu KN, Patel DJ. Structure of two intramolecular G-quadruplexes formed bynatural human telomere sequences in K+ solution. Nucleic Acids Res 2007;35:6517–6525. [PubMed:17895279]
Hellman et al. Page 7
Eur Biophys J. Author manuscript; available in PMC 2011 February 1.
NIH
-PA Author Manuscript
NIH
-PA Author Manuscript
NIH
-PA Author Manuscript

Schuck P, Perungini MA, Gonzales NR, Howlett GJ, Schubert D. Size-distribution analysis of proteinsby analytical ultracentrifugation: strategies and application to model systems. Biophys J2002;82:1096–1111. [PubMed: 11806949]
Wang Y, Patel DJ. Solution structure of the human telomeric repeat d[AG3(T2AG3)3] G-tetraplex.Structure 1993;1:263–282. [PubMed: 8081740]
Williamson JR, Raghuraman MK, Cech TR. Monovalent cation-induced structure of telomeric DNA:the G-quartet model. Cell 1989;59:871–880. [PubMed: 2590943]
Hellman et al. Page 8
Eur Biophys J. Author manuscript; available in PMC 2011 February 1.
NIH
-PA Author Manuscript
NIH
-PA Author Manuscript
NIH
-PA Author Manuscript

Hellman et al. Page 9
Eur Biophys J. Author manuscript; available in PMC 2011 February 1.
NIH
-PA Author Manuscript
NIH
-PA Author Manuscript
NIH
-PA Author Manuscript
Hellman et al. Page 10
Eur Biophys J. Author manuscript; available in PMC 2011 February 1.
NIH
-PA Author Manuscript
NIH
-PA Author Manuscript
NIH
-PA Author Manuscript

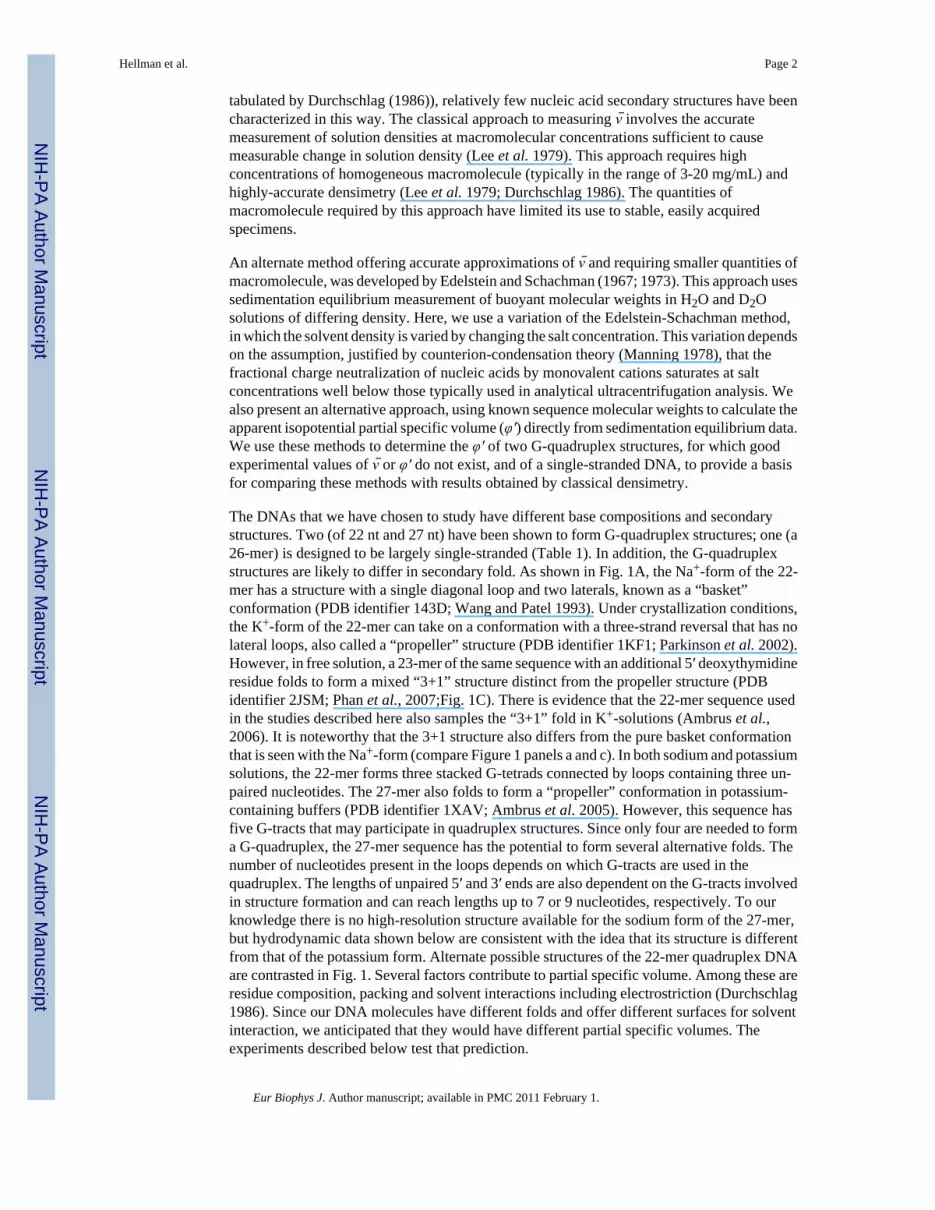
Figure 1.Conformations of the 22-mer G-quadruplex DNA depend on cation identity. Panel (a): viewsof the structure of the Na+-form of the 22-mer (PDB identifier 143D) determined by Wang andPatel (1993). This structure has a solvent-accessible surface area of 3865 Å2. The top imageis an end-view of the molecule; the bottom image, a side-view. Panel (b): views of the propellerstructure of the K+-form of the 22-mer (PDB identifier 1KF1) determined by Parkinson etal., (2002). This structure has a solvent-accessible surface area of 4461 Å2. The top image isan end-view of the molecule; the bottom image, a side-view. The central K+ ions are representedby purple spheres (ionic radii reduced by half for clarity). Panel (c): views of the mixed “3+1”structure obtained for the K+-form of the closely-related 23-mer (PDB identifier 2JSM)
Hellman et al. Page 11
Eur Biophys J. Author manuscript; available in PMC 2011 February 1.
NIH
-PA Author Manuscript
NIH
-PA Author Manuscript
NIH
-PA Author Manuscript

determined by Phan et al. (2007). The sequence of this molecule is the same as that of the 22-mer, with an additional deoxythymidine residue added at the 5′-end. This structure has asolvent-accessible surface area of 3730 Å2; a model calculation for this structure with the 5′deoxythymidine removed gave a solvent-accessible surface area of 3830 Å2. The top image isan end-view of the molecule; the bottom image, a side-view. Backbone trajectories areindicated by purple ribbons. Approximate van der Waals surfaces are indicated by the greyenvelopes surrounding each structure.
Hellman et al. Page 12
Eur Biophys J. Author manuscript; available in PMC 2011 February 1.
NIH
-PA Author Manuscript
NIH
-PA Author Manuscript
NIH
-PA Author Manuscript

Figure 2.Sedimentation analysis of DNAs. (a) Representative sedimentation velocity data at 40 000 rpmfor 22-mer G-quadruplex DNA in 10 mM Tris (pH 8.0), 1 mM EDTA (TE buffer) containing75mM KCl (red circles); 22-mer G-quadruplex DNA in TE buffer containing 75mM NaCl(blue squares); 26-mer ssDNA in TE buffer containing 75mM NaCl (green diamonds); the 27-mer G-quadruplex DNA in TE buffer containing 75mM NaCl (black triangles), and the 27-mer G-quadruplex DNA in TE buffer containing 75mM KCl (orange triangles) by analyticalultracentrifugation. The s20,w values, with 95% confidence intervals indicated in parentheseswere as follows. 22-mer (NaCl-form), 1.75s (1.73-1.80); 22-mer (KCl-form), 1.88s(1.85-1.93); 26-mer (NaCl-form), 1.72s (1.67-1.73); 27-mer (NaCl-form); 2.10s (1.94-2.16);
Hellman et al. Page 13
Eur Biophys J. Author manuscript; available in PMC 2011 February 1.
NIH
-PA Author Manuscript
NIH
-PA Author Manuscript
NIH
-PA Author Manuscript

and 27-mer (KCl-form), 2.17s (2.12-2.46). (b) Representative sedimentation equilibrium dataat 4°C for the 22-mer G-quadruplex DNA in TE buffer containing 0.4M KCl at 25 000 (green),35 000 (blue), and 45 000 rpm (red) by analytical ultracentrifugation. The smooth curvesrepresent fits of Eq. 1 to the experimental data.
Hellman et al. Page 14
Eur Biophys J. Author manuscript; available in PMC 2011 February 1.
NIH
-PA Author Manuscript
NIH
-PA Author Manuscript
NIH
-PA Author Manuscript
Figure 3.Determination of partial specific volume by the method of Edelstein and Schachman. Graphsof reduced buoyant molecular weight (Q) as a function of solvent density. (a) Samples broughtto sedimentation equilibrium in TE buffer, with indicated concentrations of NaCl. (b) Samplesbrought to sedimentation equilibrium in TE buffer, with indicated concentrations of KCl. Solidlines are least squares fits from which the QH/QL ratios were determined.
Hellman et al. Page 15
Eur Biophys J. Author manuscript; available in PMC 2011 February 1.
NIH
-PA Author Manuscript
NIH
-PA Author Manuscript
NIH
-PA Author Manuscript

Figure 4.Partial specific volumes estimated from sequence molecular weights. (a) Graph of apparentpartial specific volumes as functions of NaCl concentration and solution density (ρ). Symbols:(●) data acquired at 20 000 rpm; (■) data acquired at 25 000 rpm; (◆) data acquired at 30 000rpm; (▲) data acquired at 35 000 rpm; (▼) data acquired at 40 000 rpm; (◣) data acquired at45 000 rpm. All symbols have error bars representing 95% confidence intervals; where theycannot be seen, the interval is smaller than the size of the data symbol. The solid line is a linearfit to the data. Extrapolation to [NaCl] = 0M provides a [salt]-independent reference value ofφ′. Limiting values are as follows: 22-mer, 0.525 ± 0.004 mL/g; 26-mer, 0.555 ± 0.004 mL/g;27-mer, 0.548 ± 0.005 mL/g. (b) Graph of apparent partial specific volumes as functions ofKCl concentration and solution density (ρ). Symbols: (●) data acquired at 20 000 rpm; (■) data
Hellman et al. Page 16
Eur Biophys J. Author manuscript; available in PMC 2011 February 1.
NIH
-PA Author Manuscript
NIH
-PA Author Manuscript
NIH
-PA Author Manuscript

acquired at 25 000 rpm; (◆) data acquired at 30 000 rpm; (▲) data acquired at 35 000 rpm;(▼) data acquired at 40 000 rpm; (◣) data acquired at 45 000 rpm. All symbols have error barsrepresenting 95% confidence intervals; where they cannot be seen, the interval is smaller thanthe size of the data symbol. The solid line is a linear fit to the data. Limiting values at [KCl] =0M are: 22-mer, 0.531 ± 0.006 mL/g; 26-mer, 0.564 ± 0.006 mL/g; 27-mer, 0.557 ± 0.006 mL/g.
Hellman et al. Page 17
Eur Biophys J. Author manuscript; available in PMC 2011 February 1.
NIH
-PA Author Manuscript
NIH
-PA Author Manuscript
NIH
-PA Author Manuscript
NIH
-PA Author Manuscript
NIH
-PA Author Manuscript
NIH
-PA Author Manuscript
Hellman et al. Page 18
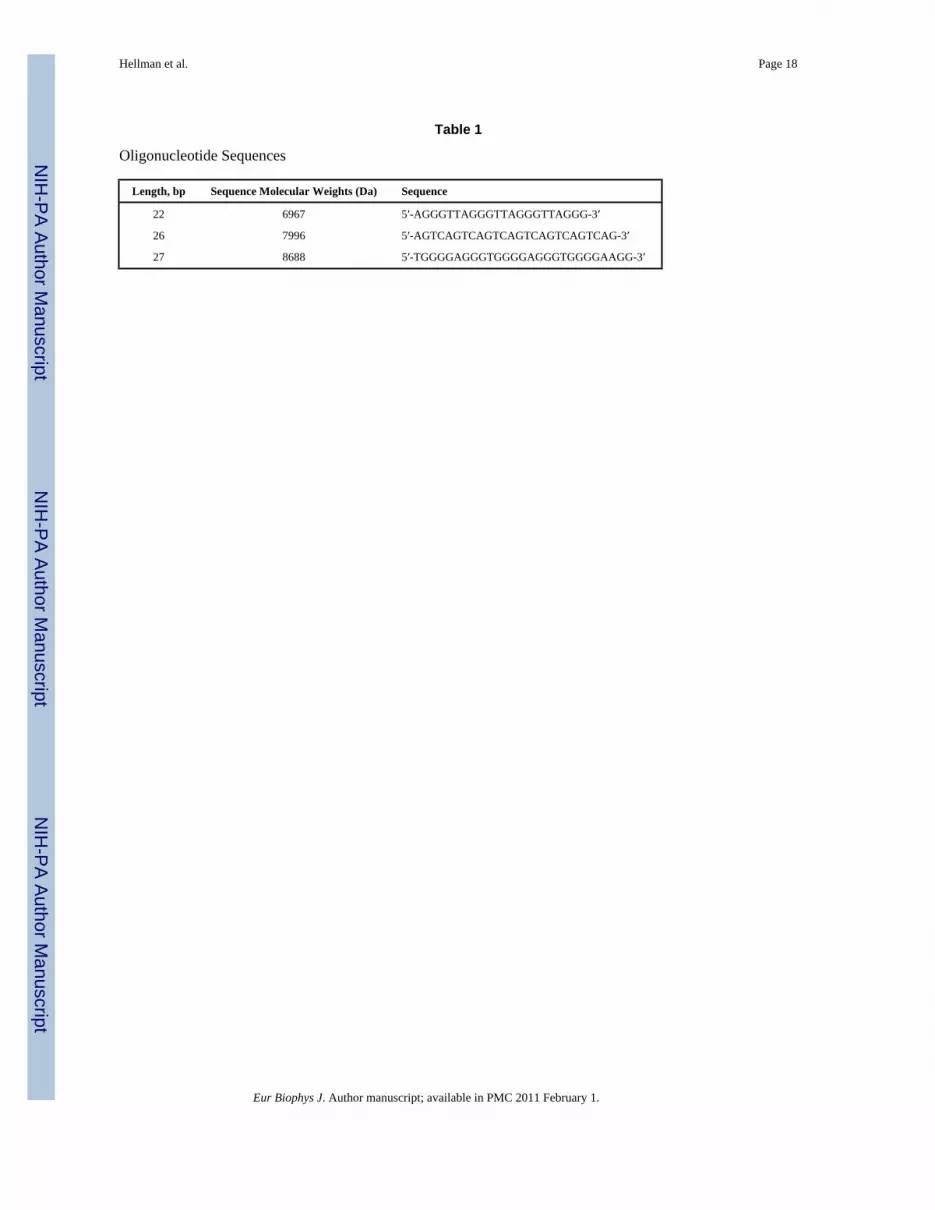
Table 1
Oligonucleotide Sequences
Length, bp Sequence Molecular Weights (Da) Sequence
22 6967 5′-AGGGTTAGGGTTAGGGTTAGGG-3′
26 7996 5′-AGTCAGTCAGTCAGTCAGTCAGTCAG-3′
27 8688 5′-TGGGGAGGGTGGGGAGGGTGGGGAAGG-3′
Eur Biophys J. Author manuscript; available in PMC 2011 February 1.

NIH
-PA Author Manuscript
NIH
-PA Author Manuscript
NIH
-PA Author Manuscript
Hellman et al. Page 19
Tabl
e 2
Sedi
men
tatio
n V
eloc
ity D
ata
DN
A F
ragm
ent
Buf
fer
Salt
s T,B
*s 2
0,w**
Map
p*(D
a)f/f
0**
22-m
erN
aCl
1.10
(1.0
9-1.
13)†
1.75
(1.7
3-1.
80)†
6762
(636
2-70
24)†
1.42
(1.3
8-1.
43)†
KC
l1.
19(1
.17-
1.22
)†1.
88(1
.85-
1.93
)†71
28(6
853-
7383
)†1.
33(1
.29-
1.35
)†
26-m
erN
aCl
1.08
(1.0
5-1.
09)†
1.72
(1.6
7-1.
73)†
7622
(737
2-79
34)†
1.58
(1.5
6-1.
62)†
KC
ln/
an/
an/
an/
a
27-m
er‡
NaC
l1.
32(1
.28-
1.36
)†2.
10(2
.04-
2.16
)†89
47(8
053-
9747
)†1.
37(1
.33-
1.41
)†
KC
l1.
33(1
.30-
1.51
)†2.
17(2
.12-
2.46
)†76
46(6
646-
8746
)†1.
33(1
.17-
1.36
)†
* - Buf
fer v
isco
sitie
s and
den
sitie
s wer
e de
term
ined
usi
ng S
ednt
erp
(Lau
e et
al.
1992
); va
lues
wer
e de
term
ined
usi
ng S
edfit
(Sch
uck
et a
l. 20
02).
**- B
uffe
r vis
cosi
ties a
nd d
ensi
ties a
long
with
s 20,
w a
nd f/
f 0 v
alue
s wer
e de
term
ined
usi
ng S
ednt
erp
(Lau
e et
al.
1992
) with
ν̄ =
0.5
4 (D
urch
schl
ag 1
989)
, and
usi
ng se
quen
ce m
olec
ular
wei
ghts
(with
two
catio
ns a
ssoc
iate
d w
ith th
e G
-qua
drup
lex
DN
As)
.
† - 95%
con
fiden
ce in
terv
al.
‡ - Slo
wer
sedi
men
ting
spec
ies.
Eur Biophys J. Author manuscript; available in PMC 2011 February 1.

NIH
-PA Author Manuscript
NIH
-PA Author Manuscript
NIH
-PA Author Manuscript
Hellman et al. Page 20
Table 3
Comparison of Partial Specific Volume Calculations
DNA Fragment Salt φ′(E-S) (mL/g) φ′(avg) (mL/g) φ′(extrap) (mL/g)
22-mer NaCl 0.574 ± 0.090 0.536 ± 0.009 0.525 ± 0.004
KCl 0.588 ± 0.088 0.541 ± 0.019 0.531 ± 0.006
26-mer NaCl 0.525 ± 0.028 0.548 ± 0.021 0.555 ± 0.004
KCl 0.590 ± 0.057 0.551 ± 0.015 0.564 ± 0.006
27-mer NaCl n/a 0.546 ± 0.005 0.548 ± 0.005
KCl n/a 0.556 ± 0.013 0.557 ± 0.006
φ′(E-S) are calculated from Q using the Edelstein-Schachman equation (1967; 1973).
φ′(avg) are the averaged φ′ calculated from the variation of Edelstein-Schachman.
φ′(extrap) are obtained by linear extrapolation of φ′(avg) to [salt] = 0M.
Eur Biophys J. Author manuscript; available in PMC 2011 February 1.


