Embed Size (px)
Citation preview
© 2004 The Royal Microscopical Society
Journal of Microscopy, Vol. 214, Pt 1 April 2004, pp. 89–98
Received 12 June 2003; accepted 7 November 2003
Blackwell Publishing, Ltd.
Phase separation in molecular layers of macromolecules at the champagne–air interface
N. PE R O N *
1
, J. M E U N I E R †, A . C A G N A *, M . VA L A D E ‡ & R . D O U I L L A R D §
*
I. T. Concept, Parc de Chancolan, 69770 Longessaigne, France
†
Laboratoire de Physique Statistique, E.N.S., 24 rue Lhomond, 75 231 Paris Cedex 05, France
‡
Comité Interprofessionnel du Vin de Champagne, 5 rue Henri-Martin, BP 135, 51204 Epernay Cedex, France
§
UMR Fractionnement des Agro-Ressources et Emballage INRA/URCA, CREA, 2 Espl. R. Garros, BP 224, 51686 Reims Cedex 2, France
Key words.
Adsorption kinetics, adsorption layer, Brewster angle microscopy, bubble, champagne, ellipsometry, ethanol, foam, liquid–air interface, macromolecules, phase separation, surface tension.
Summary
Bubble and foam stability, which are essential for the hallmarkof champagne, rely on the concentration of amphiphilicmacromolecules originating from the grape, which formmolecular layers at the interface between champagne andgas. Ellipsometry and Brewster angle microscopy experimentswere conducted at the air–champagne interface to analyse thelateral organization of the layers of macromolecules. Severalkinds of phase separations – leading in some cases to two-dimensional foams – were identified. At the beginning oflayer formation, condensed domains develop at the expense ofdilute domains. Thereafter, phase separations occur withinthe condensed domains. These findings may allow advances inthe implementation of methods predicting bubble and foamstability of champagnes.
Received 12 June 2003;
accepted 7 November 2003
Introduction
Bubbles and the consequent foam are features of primeimportance for champagne. A collar of fine bubbles is expectedat the glass periphery after disappearance of the large foamcolumn formed during pouring. This delicate phenomenon,as recognized in the profession, relies on components of theprocess that led to the champagne batch of concern.
The process of champagne making includes the usualoperations of wine making and some specific additional operations(Flanzy, 1998). The ‘must’ (i.e. juice) obtained by pressing thegrape first undergoes the usual alcoholic fermentation in a
ventilated vat. The resulting wine without effervescence iscalled base wine in the context of champagne. The base wine issubjected to an additional alcoholic fermentation in a sealedbottle, as controlled by adding an amount of sugar. This bottlefermentation is responsible for the champagne effervescence.Other operations are possibly or systematically carried outat various stages, such as filtrations, an optional artificiallyprovoked malolactic fermentation, bentonite application andthe final addition of sugar-based liquor.
The effects of various properties of champagne wine onits foam stability have been studied by sparging in a test tube(Maujean
et al
., 1990; Robillard
et al
., 1993). Measurementsconducted with ultrafiltered samples indicated that macro-molecule concentration is an essential parameter of foamstability (Malvy
et al
., 1994). Champagne wine macromoleculesare mostly proteins (10–30 mg L
−
1
) and polysaccharides(10–120 mg L
−
1
) originating from the grape (Tusseau &Van Lear, 1993).
Foam stability relies, as a general rule, on the properties ofadsorption layers of amphiphilic molecules formed at the gas–liquid interface (Lucassen, 1981; Langevin, 2000). Consequently,research concerning the surface properties of champagne hasbeen initiated recently. Ellipsometry measurements conductedon base wines together with ultrafiltered base wines providedevidence for an interfacial adsorption layer of macromoleculeswith molecular masses in excess of 10 000 (Péron
et al
., 2000).The surface activity of these macromolecules was also quantifiedby a pendent drop tensiometer procedure. Champagnes obtainedfrom experimental base wines with adjusted amounts ofmacromolecules were tested for the extent of their bubblecollar as well as for their surface properties, and a goodcorrelation was found between the two sets of data (Péron
et al
.,2001). Additionally, it was shown that the molecular mass of
Correspondence to: Dr R. Douillard. Fax: +33 326 773599;
e-mail: [email protected]
1
Present address: Physics Department, Trinity College Dublin, Ireland.
90
N. P E RO N
E T A L .
© 2004 The Royal Microscopical Society,
Journal of Microscopy
,
214
, 89–98
the amphiphile macromolecules is less than 100 000. Morerecently, surface properties of one protein originating fromgrape – grape invertase – were found to contrast strongly withthose of the raw champagne macromolecule panel (Puff
et al
.,2001). It could be deduced that grape invertase does not act asa prominent surface-active macromolecule.
It has also been found that during formation of the adsorp-tion layer, its lateral organization is inhomogeneous; thesurface is subdivided into domains with contrasting opticalproperties as evidenced from ellipsometry or Brewster anglemicroscopy measurements (Péron
et al
., 2001). The lateralinhomogeneities of macromolecule layers have been studiedin more detail, and several kinds of phase separations havebeen distinguished. These various observations are collectedin the present article.
Experimental samples and set-ups
Base wine and champagne samples
Base wines.
Base wines were produced from two vine varietiesgrown by CIVC (Comité Interprofessionnel du Vin de Champagne,Epernay, France): Chardonnay and Pinot Noir during the 1997and 1998 grape harvests. After alcoholic fermentation, apart of Chardonnay and Pinot Noir of 1998 was used withoutmalolactic fermentation and the remaining was submittedto malolactic fermentation.
Tangential ultrafiltration
. Tangential ultrafiltration of basewines was conducted for up to 70-L batches using a Hi-Flowdevice (Inceltech, Toulouse, France). The 1.8-m
2
ultrafiltrationmembrane, with a nominal molecular mass cut-off of 10 000,consists of hydrophilic polysulphone hollow fibres (30UFIB/1/S1.8/10KD, Inceltech). It is supplied with the wine to beultrafiltered by a peristaltic pump. During ultrafiltration, thetransmembrane pressure was maintained at 0.8
×
10
5
Pa. Beforeeach operation, the membrane was rinsed twice with 0.75 Lof base wine to be ultrafiltered. The device was thereafter fullyrinsed with a 12% (v/v) solution of ethanol in water and themembrane was then stored at 3
°
C.Mixtures of wine with the corresponding UF (ultrafiltered
wine) were achieved. Their RCF (relative concentration factor)was calculated as
RCF =
V
W
/(
V
W
+
V
UF
), (1)
where
V
W
is the volume of wine and
V
UF
is the volume ofultrafiltered wine in the mixture.
Bottle fermentation
. Bottle fermentation was achieved for theChardonnay as well as for the Pinot Noir vine variety from the1998 harvest. The base wine, yeasts and sucrose (24 g L
−
1
) weremixed together and then stored in 0.75-L bottles, which werefinally closed by a gas-tight plug. During this additional alcoholic
fermentation, sucrose is changed into ethanol and carbon dioxide,yielding champagne whose ethanol concentration is about 1%(v/v) more than that of the base wine. After this fermentation,which took 3 weeks, ‘lees’, the consequent sediment, were expelledand the bottles were sealed with capsules. Champagne sampleswere degassed before any evaluation of their surface propertiesor ultrafiltration. This was achieved by bubbling with nitrogen.Prior to use, the nitrogen was equilibrated with wine vapoursto avoid the evaporation of volatile compounds such as ethanol.
Frontal ultrafiltration
. Ultrafiltration of degassed champagnewas conducted for 60-cm
3
samples using a stirred frontalultrafiltration device, which consists of a Pyrex/steel celland a regenerated cellulose membrane 47 mm in diameter.The nominal molecular mass cut-off of the membrane was10 000. The cell and the membrane were carefully rinsed inultrapure water and Extran (Merck) and then several times inultrapure water. Before use, the membranes were hydratedand washed in ultrapure water for 30 min, placed in the cell,and then equilibrated with wine for 2 h before ultrafiltration.
When needed, wine samples were diluted with ultrapure water.All glass vessels were treated with chromosulphuric acid beforeuse. Syringes and needles were thoroughly rinsed with ultrapureethanol and water.
Pendant drop tensiometry
Surface tension was measured using a pendant drop tensiometerfrom IT Concept, Longessaigne, France (Labourdenne
et al
., 1994;Puff
et al
., 1998; Péron
et al
., 2000, 2001). An air bubble wasformed in the liquid at the tip of the needle of a syringe whoseplunger position was driven by a computer. The stainless-steelneedle (0.9 mm in diameter) had a 180
°
curvature to obtain arising bubble as the needle was immersed. The liquid was in aglass container with flat parallel walls (Hellma) maintained ata temperature of 20.0
±
0.1
°
C. Images of the bubbles weretaken by a camera equipped with a
×
1 magnification objective.The interfacial tension
γ
was calculated by analysing theimage assuming an axisymmetrical bubble and consideringthe hydrostatic pressure is dependent on gravity
g
in bothair and liquid. Under these assumptions, an equation for thebubble profile can be derived from the Laplace equation:
(1/
x
)d(
x
sin
θ
)/d
x
= 2/
b
−
cz
. (2)
The origin of the coordinates is at the bubble apex;
x
and
z
arethe Cartesian coordinates at any point of the bubble profile,
b
is the radius of curvature at the bubble apex,
θ
is the angle betweenthe
x
axis and the tangent to the bubble profile, and
c =
2/
a
2
,where
a
is the capillary length [
a =
(2
γ
/
(
∆ρ
g
))
1/2
, where
∆ρ
isthe difference in density between the liquid and air]. Densitiesof liquids were measured with a PAAR DMA 45 apparatus.Three bubbles were successively ejected; the useful bubble wasformed within 1 s and the surface tension was measured.
P H A S E S E PA R AT I O N AT T H E L I Q U I D – A I R I N T E R FAC E
91
© 2004 The Royal Microscopical Society,
Journal of Microscopy
,
214
, 89–98
Ellipsometry
The two ellipsometric angles
Ψ
and
∆
(Azzam & Bashara,1987) are linked to the two reflectivity coefficients
r
p
and
r
s
, inthe direction parallel and perpendicular to the incidenceplane, respectively, by
r
p
/
r
s
= tan
Ψ
exp(i
∆
). (3)
The fixed wavelength chosen for the kinetic measurementscorresponds to the Brewster conditions defined by
∆
=
±π
/2. (4)
The ellipticity coefficient of the adsorption layer measured inthe Brewster conditions for the substrate,
=
B
, is defined by
=
B
=
tan
Ψ
sin
∆
(5)
In the ideal case of an interface between two transparentmedia without roughness and thickness (Fresnel interface),
=
B
is zero. Considering interfaces whose optical anisotropycan be ignored,
=
B
is the sum of two main contributions(Meunier, 1985):
=
B
=
=
r
+
=
d
, (6)
where
=
r
is a roughness positive term which accounts forthermally induced capillary waves, whereas
=
d
dependson the presence of an adsorption layer. According to Drude’sapproach, which is a good enough approximation in the caseof molecular layers (Hénon & Meunier, 1999),
=
d
is negativewhen the refractive index within the interfacial layer is largerthan in both fluid media.
Measurements were performed using a spectroscopic phase-modulated ellipsometer (UVISEL, Jobin Yvon, Longjumeau,France). This was equipped with a xenon arc lamp. In thechosen configuration, the polarizer and the analyser were setto 45
°
; the photoelastic modulator, activated at a frequency of50 kHz, was set to 0
°
. The diameter of the light beam was setto 0.5 mm. The spectroscopic measurements were monitoredbetween 250 and 700 nm. The incidence angle was set to 53.6
°
for non-diluted wines and 53.5
°
for wines diluted with water.All measurements at the air–liquid interface were performedin an air-conditioned room at 20
±
1
°
C. The sample was pouredinto the vessel (a glass Petri dish 60 mm in diameter) just beforedata acquisition.
Brewster angle microscopy
The technique of Brewster angle microscopy (BAM) uses theproperties of the Brewster angle and the ellipticity coefficient
=
B
as in ellipsometry to observe lateral inhomogeneities withthe resolution of photonic microscopy. Considering a light
beam in Brewster conditions, polarized within the incidenceplane, the electrical field according to the p (parallel) and s(normal) directions to the incidence plane can be written as:
(7)
(8)
and the reflectivities
r
p
and
r
s
according to the two directionsare linked together by the following relation:
r
p
=
ir
s
=
B
. (9)
The two components of the reflected field are therefore:
(10)
(11)
and the reflected intensity is hence proportional to .The set-up was developed by Hénon & Meunier (1991) and
improved by Lheveder
et al
. (1998). The objective with verticalsymmetry axis (normal to the liquid surface) allows imagesfocused in the whole interface plane, with a resolution of0.8
µ
m in one direction and 1
µ
m in the other. The lightsource is an argon laser of wavelength 515 nm. Images aretaken with an amplified video camera and captured by acomputer. Focusing can be attained using a step motor, whichensures correct positioning of the objective along the verticaldirection. Two step motors allow lateral displacements of theobjective to explore the liquid surface. Experiments wereconducted in an air-conditioned room at 22
±
1
°
C. The liquidwas poured in a vessel similar to that used for ellipsometrymeasurements. For comparison purposes, the objective of theBAM was chosen so as to obtain a view field with a size close tothat of the ellipsometer beam.
Results
In the samples examined, a wide variety of observations weremade. They can be separated into categories according to thenature of the phases observed. Depending on the amountof adsorbed macromolecules, the distinct categories were‘surface devoid of macromolecule layer’, ‘coexistence of acondensed and a dilute phase’, ‘coexistence of two condensedphases’ and ‘three-dimensional objects anchored in a condensedphase’.
Nearly homogeneous surfaces
Wine
. The ellipticity of the UF obtained with a 10 000 molecularmass cutoff membrane was constant and positive, for bothchampagne and base wine samples. As an illustration, signalsobtained with ultrafiltered samples are shown in Fig. 1(A) and
E E tpi cos ,= 0 ω
Esi = 0
E E r tpr
s B sin ,= 0 = ω
Esr = 0
=B2
92 N. P E RO N E T A L .
© 2004 The Royal Microscopical Society, Journal of Microscopy, 214, 89–98
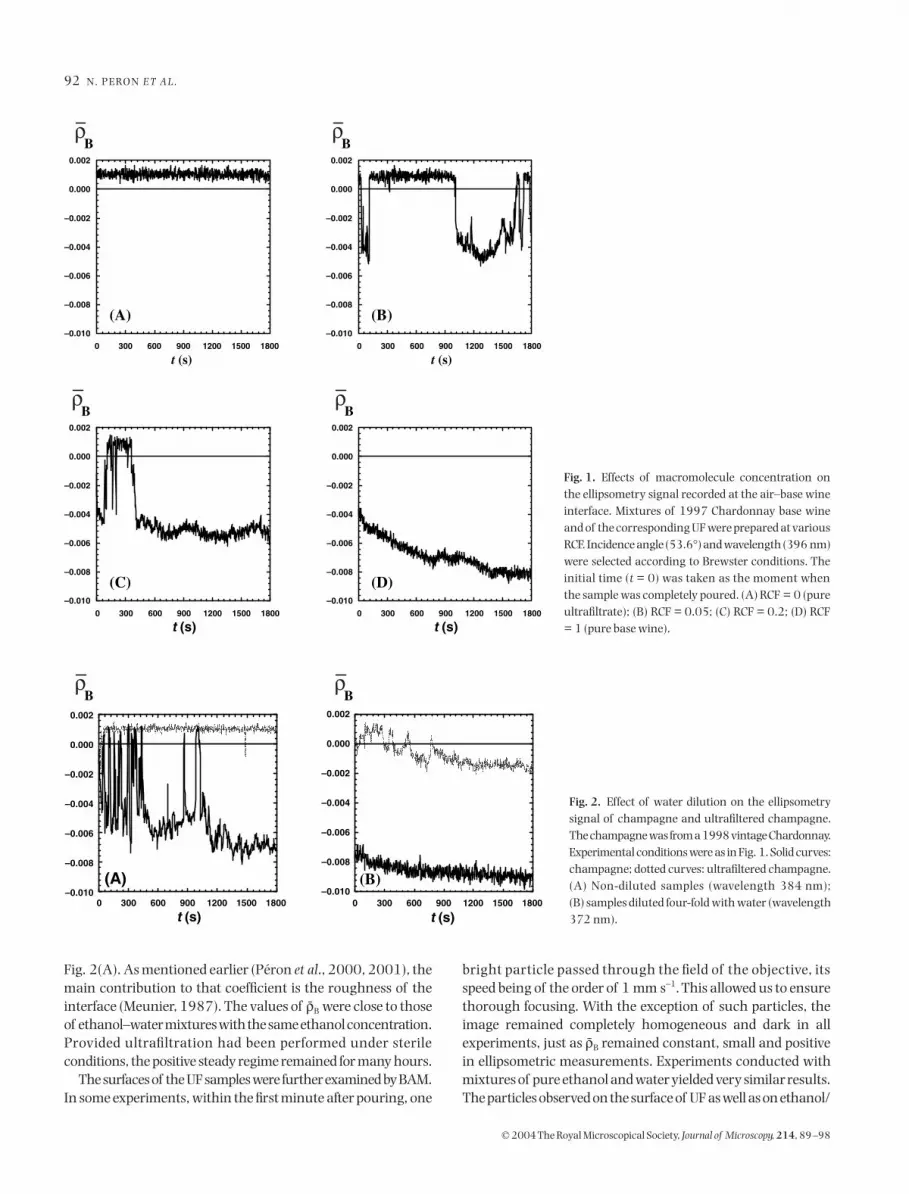
Fig. 2(A). As mentioned earlier (Péron et al., 2000, 2001), themain contribution to that coefficient is the roughness of theinterface (Meunier, 1987). The values of =B were close to thoseof ethanol–water mixtures with the same ethanol concentration.Provided ultrafiltration had been performed under sterileconditions, the positive steady regime remained for many hours.
The surfaces of the UF samples were further examined by BAM.In some experiments, within the first minute after pouring, one
bright particle passed through the field of the objective, itsspeed being of the order of 1 mm s−1. This allowed us to ensurethorough focusing. With the exception of such particles, theimage remained completely homogeneous and dark in allexperiments, just as =B remained constant, small and positivein ellipsometric measurements. Experiments conducted withmixtures of pure ethanol and water yielded very similar results.The particles observed on the surface of UF as well as on ethanol/
Fig. 1. Effects of macromolecule concentration onthe ellipsometry signal recorded at the air–base wineinterface. Mixtures of 1997 Chardonnay base wineand of the corresponding UF were prepared at variousRCF. Incidence angle (53.6°) and wavelength (396 nm)were selected according to Brewster conditions. Theinitial time (t = 0) was taken as the moment whenthe sample was completely poured. (A) RCF = 0 (pureultrafiltrate); (B) RCF = 0.05; (C) RCF = 0.2; (D) RCF= 1 (pure base wine).
Fig. 2. Effect of water dilution on the ellipsometrysignal of champagne and ultrafiltered champagne.The champagne was from a 1998 vintage Chardonnay.Experimental conditions were as in Fig. 1. Solid curves:champagne; dotted curves: ultrafiltered champagne.(A) Non-diluted samples (wavelength 384 nm);(B) samples diluted four-fold with water (wavelength372 nm).

P H A S E S E PA R AT I O N AT T H E L I Q U I D – A I R I N T E R FAC E 93
© 2004 The Royal Microscopical Society, Journal of Microscopy, 214, 89–98
water samples are therefore likely to be dust particles capturedduring the experiment. When the wine or champagne wasdiluted two- or four-fold with water, the interface with air wasalso devoid of two-dimensional phase domains.
The surface tension of any UF sample, as presented in Table 1for both ultrafiltered base wine and ultrafiltered champagne,is about 1 mN m−1 less than that of the corresponding mixtureof water and ethanol. The measured surface tension was abso-lutely constant within the experimental noise of the apparatuswhatever the duration of the experiments – hours and evendays. This 1 mN m−1 difference compares with the much larger25 mN m−1 difference between surface tensions of pure waterand UF. Thus, it is possible that some molecules of low molecularmass are adsorbed at the interface besides ethanol.
In conclusion, the surface of wine or champagne withoutmacromolecules is very much like that of pure water and ethanolmixtures with respect to its optical properties but it may includesome unidentified compounds of low molecular mass.
Water-diluted samples. Homogeneous surfaces were also observedwhen wine or champagne samples were diluted two- or four-fold with water. When the amount of ethanol was varied bywater dilution (two- or four-fold), no sign of a dilute–condensedphase coexistence was observed, because a condensed film, asestimated from its reflectivity, had already formed as the objectivewas focused a few seconds after the sample was poured intothe dish. This is consistent with the ellipsometry signal, whichis larger than for non-diluted champagne, and modulatedonly by the statistical noise of the apparatus (Fig. 2B). Dilutionwith water led therefore to rapid formation of a homogeneousfilm. In other respects, as in the case of UF, the surface tensionof champagne as well as of dilute champagne is controlled byits ethanol concentration. In fact, the observed effect of waterdilution on the kinetics of film formation shed light on therole of ethanol. From previous investigations, the ethanolmonolayer at the surface of water–ethanol mixtures (Li et al.,1993) is expected to equilibrate over a millisecond timescale(Fainerman & Miller, 1996). In the case of wine, ethanolconcentration is therefore expected to determine directly theenergy gained in the slower process of macromolecule adsorptionand consequently the kinetics of this process.
Coexistence of condensed and dilute phases
Large condensed phase domains. With many champagnes andmixtures of base wine with the corresponding UF, the ellipticitycoefficient was found to vary with time. During periods of afew seconds to several minutes, =B was positive and identicalto the value measured with pure UF samples. During otherperiods, =B was negative between 0 and −0.010. This isillustrated in Fig. 1(B,C) in the case of mixtures of a base wineand its UF, and in Fig. 2(A) in the case of a champagne. Suchdata indicate that the beam was analysing dilute and condensedphase domains of macromolecules, the transitions betweenthe two types of signal being probably the result of some lateralconvection.
The measured negative values of =B are of the usual orderof magnitude for dense molecular layers of macromoleculesat fluid interfaces (Mann et al., 1993; Beaglehole et al., 1997)Such layers are thin enough for the Drude’s equation to apply(Hénon & Meunier, 1999) and the negative sign implies thatthe optical index is higher in the adsorption layer than inthe bulk. Likewise, biological macromolecules increase theoptical index when dissolved in water (de Feijter et al., 1978;Beaglehole et al., 1997; Puff et al., 2001), as well as in mixturesof water and ethanol (Puff et al., 2001).
The time elapsed until the signal was definitely negativedecreased as the macromolecule content of the sample increased(Fig. 1A–D). Hence, the rate of covering of the liquid by thecondensed phase increases with an increase in macromoleculecontent.
When the same samples were observed by BAM, dilute/condensed phase domain separation appeared. After the samplewas poured and focusing was achieved, the whole field ofthe microscope exhibited alternately a uniform dark image(similar to that of the UF samples) or somewhat inhomogeneousmoving domains. The inhomogeneities of the latter domainswere not obvious from isolated images, but appeared moreclearly by their lateral displacement on the background. Thespeed and direction of the lateral displacements were stronglyinfluenced by artificially induced draughts. Natural convec-tions alone gave rise to random movements at speeds up to0.5 mm s−1. The mean time for the somewhat inhomogeneousmoving domains to cover the whole surface was roughlyequivalent to the delay associated with the ellipticity reachinga negative value. These domains were therefore clearly thecondensed phase domains of adsorbed macromoleculespreviously detected by ellipsometry and with sizes larger than0.4 mm (the BAM field).
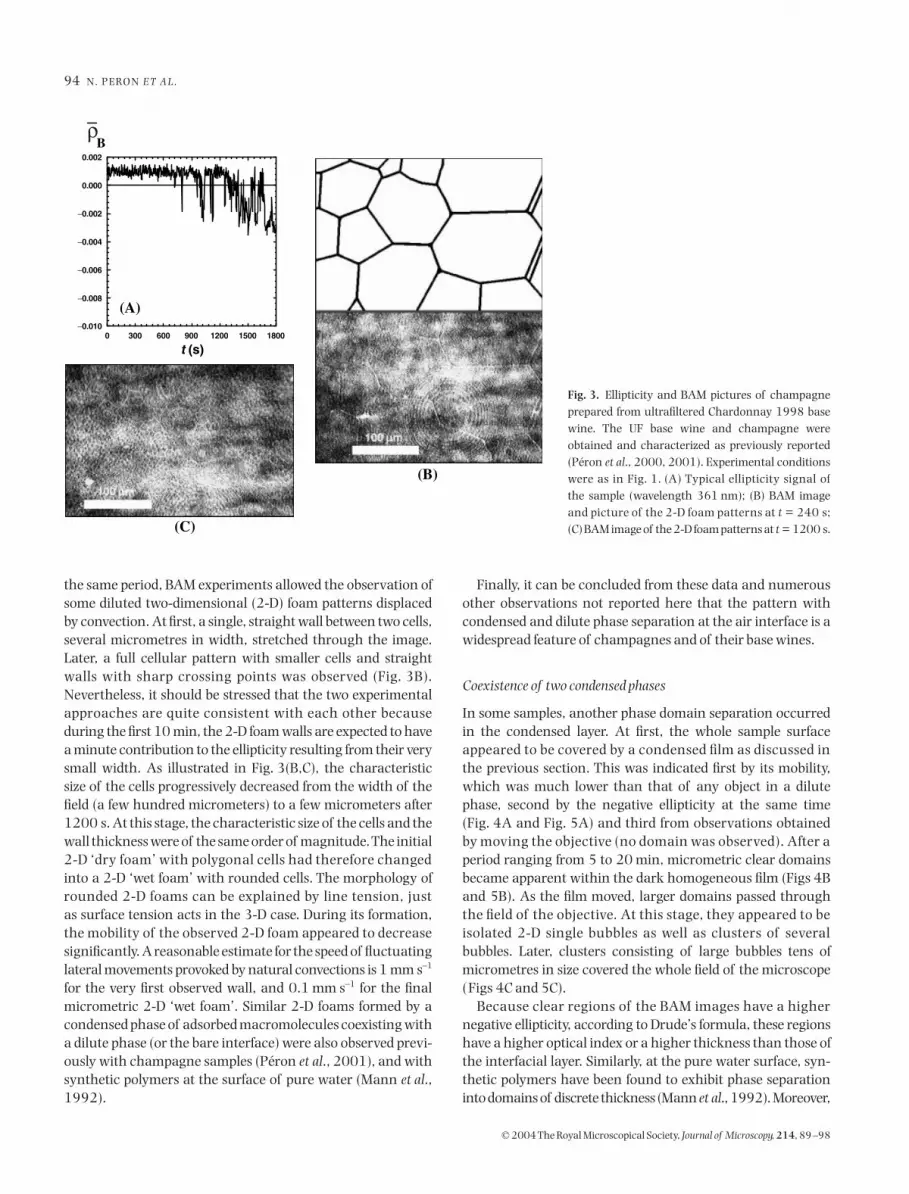
Two-dimensional foams. With the 1998 Chardonnay vintage,whose macromolecule content was reduced by ultrafiltration(Péron et al., 2001), a smaller pattern of dilute and condenseddomains was seen (Fig. 3). The positive ellipticity signal seemedindicative of a surface totally covered by the dilute phase overthe first 600 s of the experiment (Fig. 3A). However, within
Table 1. Ethanol concentration, and surface tension of UF and of ethanol–water mixtures with the same ethanol concentration. Base wine and Chardonnay champagne.
Ethanol concentration (g L−1)
Surface tension (mN m−1)
Mixture of water and ethanol
UF sample
Base wine Champagne
88 48.6 47.398 47.3 46.3
94 N. P E RO N E T A L .
© 2004 The Royal Microscopical Society, Journal of Microscopy, 214, 89–98
the same period, BAM experiments allowed the observation ofsome diluted two-dimensional (2-D) foam patterns displacedby convection. At first, a single, straight wall between two cells,several micrometres in width, stretched through the image.Later, a full cellular pattern with smaller cells and straightwalls with sharp crossing points was observed (Fig. 3B).Nevertheless, it should be stressed that the two experimentalapproaches are quite consistent with each other becauseduring the first 10 min, the 2-D foam walls are expected to havea minute contribution to the ellipticity resulting from their verysmall width. As illustrated in Fig. 3(B,C), the characteristicsize of the cells progressively decreased from the width of thefield (a few hundred micrometers) to a few micrometers after1200 s. At this stage, the characteristic size of the cells and thewall thickness were of the same order of magnitude. The initial2-D ‘dry foam’ with polygonal cells had therefore changedinto a 2-D ‘wet foam’ with rounded cells. The morphology ofrounded 2-D foams can be explained by line tension, justas surface tension acts in the 3-D case. During its formation,the mobility of the observed 2-D foam appeared to decreasesignificantly. A reasonable estimate for the speed of fluctuatinglateral movements provoked by natural convections is 1 mm s−1
for the very first observed wall, and 0.1 mm s−1 for the finalmicrometric 2-D ‘wet foam’. Similar 2-D foams formed by acondensed phase of adsorbed macromolecules coexisting witha dilute phase (or the bare interface) were also observed previ-ously with champagne samples (Péron et al., 2001), and withsynthetic polymers at the surface of pure water (Mann et al.,1992).
Finally, it can be concluded from these data and numerousother observations not reported here that the pattern withcondensed and dilute phase separation at the air interface is awidespread feature of champagnes and of their base wines.
Coexistence of two condensed phases
In some samples, another phase domain separation occurredin the condensed layer. At first, the whole sample surfaceappeared to be covered by a condensed film as discussed inthe previous section. This was indicated first by its mobility,which was much lower than that of any object in a dilutephase, second by the negative ellipticity at the same time(Fig. 4A and Fig. 5A) and third from observations obtainedby moving the objective (no domain was observed). After aperiod ranging from 5 to 20 min, micrometric clear domainsbecame apparent within the dark homogeneous film (Figs 4Band 5B). As the film moved, larger domains passed throughthe field of the objective. At this stage, they appeared to beisolated 2-D single bubbles as well as clusters of severalbubbles. Later, clusters consisting of large bubbles tens ofmicrometres in size covered the whole field of the microscope(Figs 4C and 5C).
Because clear regions of the BAM images have a highernegative ellipticity, according to Drude’s formula, these regionshave a higher optical index or a higher thickness than those ofthe interfacial layer. Similarly, at the pure water surface, syn-thetic polymers have been found to exhibit phase separationinto domains of discrete thickness (Mann et al., 1992). Moreover,
Fig. 3. Ellipticity and BAM pictures of champagneprepared from ultrafiltered Chardonnay 1998 basewine. The UF base wine and champagne wereobtained and characterized as previously reported(Péron et al., 2000, 2001). Experimental conditionswere as in Fig. 1. (A) Typical ellipticity signal ofthe sample (wavelength 361 nm); (B) BAM imageand picture of the 2-D foam patterns at t = 240 s;(C) BAM image of the 2-D foam patterns at t = 1200 s.

P H A S E S E PA R AT I O N AT T H E L I Q U I D – A I R I N T E R FAC E 95
© 2004 The Royal Microscopical Society, Journal of Microscopy, 214, 89–98
phase separation has been reported to occur in mixed proteinfilms depending on their actual biochemical structure(Sengupta & Damodaran, 2000; Sengupta et al., 2000).Considering the possible nature of wine macromolecules,
the latter situation (chemical species) seems more likely tooccur than the former (discrete thickness) in the case of a winesurface layer.
Finally, it should be pointed out that condensed–condensedphase separation, and the subsequent 2-D foams within thecondensed film, occur systematically and exclusively when usingbase wine and champagne from the Pinot Noir vine variety.This will be presented elsewhere in more detail together
Fig. 4. Ellipticity and BAM pictures of 1997 vintage Pinot Noir base wine.Experimental conditions were as in Fig. 1. (A) Typical ellipticity signal ofthe sample (wavelength 385 nm); (B) BAM image at t = 1200 s; (c) BAMimage at t = 1800 s.
Fig. 5. Ellipticity and BAM pictures of 1998 vintage Pinot Noir champagne.Experimental conditions were as in Fig. 1. (A) Typical ellipticity signal ofthe sample (wavelength 385 nm). (B) BAM image at t = 1200 s; (C) BAMimage at t = 1800 s.
96 N. P E RO N E T A L .
© 2004 The Royal Microscopical Society, Journal of Microscopy, 214, 89–98
with the effects of some oenological factors on the 2-D phaseseparation patterns.
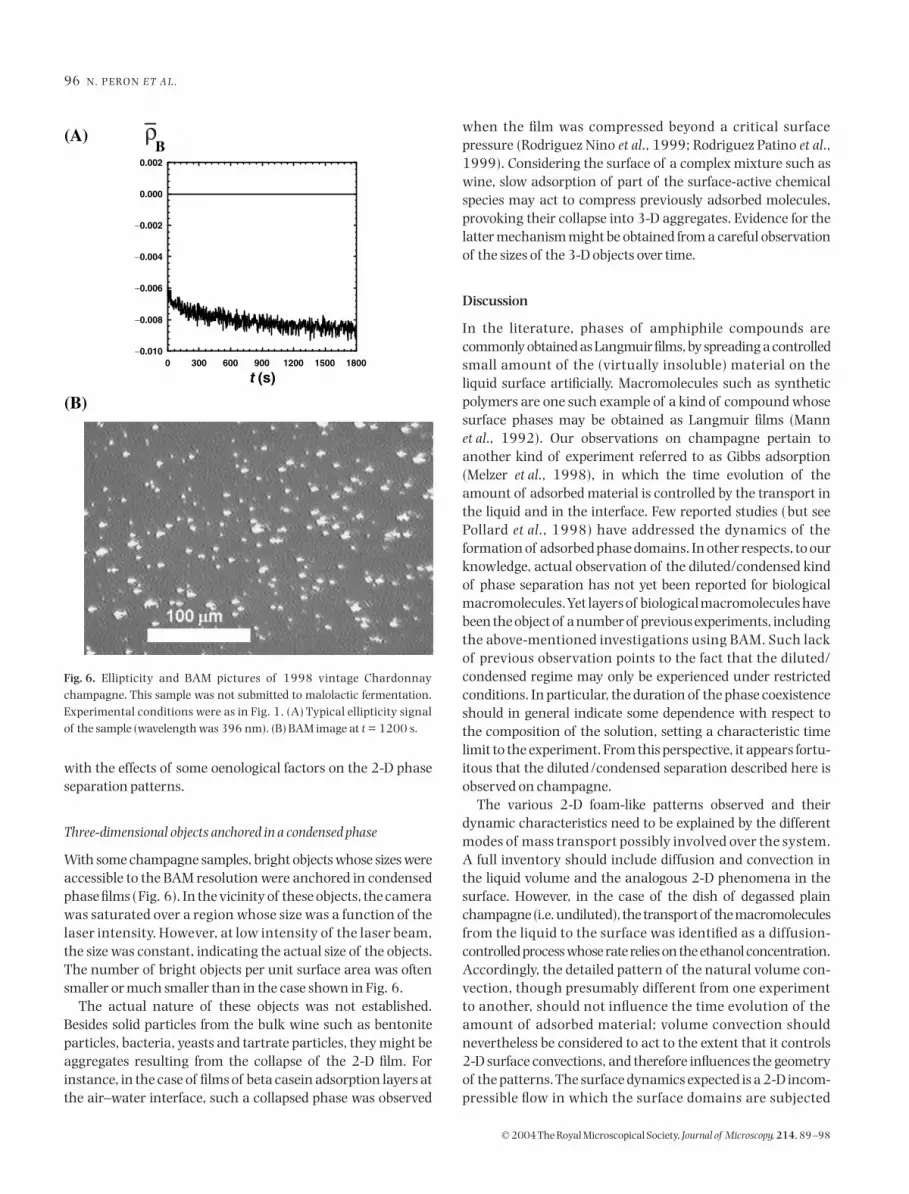
Three-dimensional objects anchored in a condensed phase
With some champagne samples, bright objects whose sizes wereaccessible to the BAM resolution were anchored in condensedphase films (Fig. 6). In the vicinity of these objects, the camerawas saturated over a region whose size was a function of thelaser intensity. However, at low intensity of the laser beam,the size was constant, indicating the actual size of the objects.The number of bright objects per unit surface area was oftensmaller or much smaller than in the case shown in Fig. 6.
The actual nature of these objects was not established.Besides solid particles from the bulk wine such as bentoniteparticles, bacteria, yeasts and tartrate particles, they might beaggregates resulting from the collapse of the 2-D film. Forinstance, in the case of films of beta casein adsorption layers atthe air–water interface, such a collapsed phase was observed
when the film was compressed beyond a critical surfacepressure (Rodriguez Nino et al., 1999; Rodriguez Patino et al.,1999). Considering the surface of a complex mixture such aswine, slow adsorption of part of the surface-active chemicalspecies may act to compress previously adsorbed molecules,provoking their collapse into 3-D aggregates. Evidence for thelatter mechanism might be obtained from a careful observationof the sizes of the 3-D objects over time.
Discussion
In the literature, phases of amphiphile compounds arecommonly obtained as Langmuir films, by spreading a controlledsmall amount of the (virtually insoluble) material on theliquid surface artificially. Macromolecules such as syntheticpolymers are one such example of a kind of compound whosesurface phases may be obtained as Langmuir films (Mannet al., 1992). Our observations on champagne pertain toanother kind of experiment referred to as Gibbs adsorption(Melzer et al., 1998), in which the time evolution of theamount of adsorbed material is controlled by the transport inthe liquid and in the interface. Few reported studies (but seePollard et al., 1998) have addressed the dynamics of theformation of adsorbed phase domains. In other respects, to ourknowledge, actual observation of the diluted/condensed kindof phase separation has not yet been reported for biologicalmacromolecules. Yet layers of biological macromolecules havebeen the object of a number of previous experiments, includingthe above-mentioned investigations using BAM. Such lackof previous observation points to the fact that the diluted/condensed regime may only be experienced under restrictedconditions. In particular, the duration of the phase coexistenceshould in general indicate some dependence with respect tothe composition of the solution, setting a characteristic timelimit to the experiment. From this perspective, it appears fortu-itous that the diluted/condensed separation described here isobserved on champagne.
The various 2-D foam-like patterns observed and theirdynamic characteristics need to be explained by the differentmodes of mass transport possibly involved over the system.A full inventory should include diffusion and convection inthe liquid volume and the analogous 2-D phenomena in thesurface. However, in the case of the dish of degassed plainchampagne (i.e. undiluted), the transport of the macromoleculesfrom the liquid to the surface was identified as a diffusion-controlled process whose rate relies on the ethanol concentration.Accordingly, the detailed pattern of the natural volume con-vection, though presumably different from one experimentto another, should not influence the time evolution of theamount of adsorbed material; volume convection shouldnevertheless be considered to act to the extent that it controls2-D surface convections, and therefore influences the geometryof the patterns. The surface dynamics expected is a 2-D incom-pressible flow in which the surface domains are subjected
Fig. 6. Ellipticity and BAM pictures of 1998 vintage Chardonnaychampagne. This sample was not submitted to malolactic fermentation.Experimental conditions were as in Fig. 1. (A) Typical ellipticity signalof the sample (wavelength was 396 nm). (B) BAM image at t = 1200 s.
P H A S E S E PA R AT I O N AT T H E L I Q U I D – A I R I N T E R FAC E 97
© 2004 The Royal Microscopical Society, Journal of Microscopy, 214, 89–98
to stresses arising from liquid convection. The consequentstrains and motions of the different domains rely on propertiessuch as line tension or surface shear viscosity, which havebeen estimated in systems other than champagne – linetension by Mann et al. (1992) and surface shear viscosity byBarentin et al. (1999). Numerous aspects of our observationson champagne remain unclear. Questions such as whetherthe macromolecules adsorb primarily in the diluted kindof phase domains deserve further investigation. Additionalinsights should be gained from observation over a field of viewcomparable with the surface of the dish. An infrared imagingtechnique of recent implementation might be appropriate(Saylor, 2001).
Conclusions
First, it should be pointed out that the two methods ofellipsometry and BAM give complementary information onthe formation and structure of the adsorption layers. Thisinformation supports the conclusions obtained separately.
The formation of adsorption layers of macromoleculesat the wine and champagne–air interface seems to be a verygeneral feature, governed by the occurrence of amphiphilemacromolecules in the wine (Péron et al., 2001). The actualnature of the macromolecules involved is not yet known,although the ethanol concentration seems to be an essentialfactor for condensed/dilute phase separation. Nevertheless, ithas been shown previously that champagne has surface prop-erties allowing the stabilization of common black films (Senéeet al., 1999) or bubble collars (Péron et al., 2001). In the lattercase, it was established that this property is directly linked tothe amphiphile macromolecule content (Péron et al., 2001).Our results strongly suggest that the surface properties andthose derived from them rely on the lateral organization ofthe condensed domains of adsorbed macromolecules. As aconsequence, prediction of the ability of champagne batchesto exhibit convenient bubble collars may be obtained from meas-urements directly related to the speed of the lateral growth ofthe condensed domains.
Acknowledgements
We gratefully acknowledge Daniel Bonn from the LPS forhis help and discussions. We also wish to thank C. Bliard forhis help in some ultrafiltration experiments and B. Montiesfor related discussions.
References
Azzam, R.M.A. & Bashara, N.M. (1987) Ellipsometry and Polarized Light.Elsevier Sciences, Amsterdam.
Barentin, C., Ybert, C., Di Meglio, J.M. & Joanny, J.F. (1999) Surface shearviscosity of Gibbs and Langmuir monolayers. J. Fluid Mech. 397,331–349.
Beaglehole, D., Lawson, F., Harper, G. & Hossain, M. (1997) Tryptophan,tryptophan-leucine, and BSA adsorption at an oil–water interface.J. Colloid Interface Sci. 192, 266–268.
Fainerman, V.B. & Miller, R. (1996) Adsorption kinetics of short-chainalcohols at the water/air interface: diffusion-controlled adsorptionunder the conditions of a nonequilibrium surface layer. J. ColloidInterface Sci. 178, 168–175.
de Feijter, J.A., Benjamins, J. & Veer, F.A. (1978) Ellipsometry as a tool tostudy the adsorption behavior of synthetic and biopolymers at theair–water interface. Biopolymers, 17, 1759–1772.
Flanzy, C. (1998) Œnologie – Fondements Scientifiques et Technologiques.Lavoisier Tec & Doc, Paris.
Hénon, S. & Meunier, J. (1991) Microscope at the Brewster angle: directobservation of first-order phase transitions in monolayers. Rev. Sci.Instrum. 62, 936–939.
Hénon, S. & Meunier, J. (1999) Brewster angle microscopy and ellipsometry.Modern Characterisation Methods of Surfactant Systems (ed. by B. P. Binks),pp. 109–145. Marcel Dekker, New York.
Labourdenne, S., Gaudry-Rolland, N., Letellier, S., Lin, M., Cagna, A.,Esposito, G., Verger, R. & Rivière, C. (1994) The oil-drop tensiometer:potential applications for studying the kinetics of (phospho) lipaseaction. Chem. Phys. Lipids, 71, 163–173.
Langevin, D. (2000) Influence of interfacial rheology on foam and emulsionproperties. Adv. Colloid Interface Sci. 88, 209–222.
Lheveder, C., Hénon, S., Mercier, R., Tissot, G., Fournet, P. & Meunier, J. (1998)A new Brewster angle microscope. Rev. Sci. Instrum. 69, 1446–1450.
Li, Z.X., Lu, J.R., Styrkas, D.A., Thomas, R.K., Rennie, A.R. & Penfold, J.(1993) The structure of the surface of ethanol/water mixtures. Mol.Physics, 80, 925–929.
Lucassen, J. (1981) Dynamic properties of free liquid films and foam.Physical Chemistry of Surfactant Action, Vol. 11: Anionic Surfactants(ed. by E. Lucassen-Reynders), pp. 217–265. Marcel Dekker, New York.
Malvy, J., Robillard, B. & Duteurtre, B. (1994) Application of image analysisto foam stability of sparkling wines. Sci. Aliments, 14, 87–98.
Mann, E.K., Hénon, S., Langevin, D. & Meunier, J. (1992) Molecular layersof a polymer at the free water surface: microscopy at the Brewsterangle. J. Phys. II France, 2, 1683–1704.
Mann, E.K., Lee, L.T., Hénon, S., Langevin, D. & Meunier, J. (1993) Polymer-surfactant films at the air–water interface. 1. Surface pressure, ellipsometry,and microscopic studies. Macromolecules, 26, 7037–7045.
Maujean, A., Poinsaut, P., Dantan, H., Brissonnet, F. & Cossiez, E. (1990)Etude de la tenue et de la qualité de mousse des vins effervescents. II:Mise au point d’une technique de mesure de la moussabilité, de la tenueet de la stabilité de la mousse des vins effervescents. Bull. O.I.V.711–712, 405–427.
Melzer, V., Vollhardt, D., Brezesinski, G. & Möhwald, H. (1998) Similaritiesin the phase properties of Gibbs and Langmuir monolayers. J. Phys.Chem. B, 102, 591–597.
Meunier, J. (1985) Measurement of the rigidity coefficient of a surfactantlayer and structure of the oil or water microemulsion interface. J. Phys.Lett. 46, L1005– L1014.
Meunier, J. (1987) Liquid interfaces: role of the fluctuations and analysisof ellipsometry and reflectivity measurements. J. Phys. 48, 1819–1831.
Péron, N., Cagna, A., Valade, M., Bliard, C., Aguié-Béghin, V. & Douillard,R. (2001) Layers of macromolecules at the champagne/air interfaceand the stability of champagne bubbles. Langmuir, 17, 791–797.
Péron, N., Cagna, A., Valade, M., Marchal, R., Maujean, A., Robillard, B.,Aguié-Béghin, V. & Douillard, R. (2000) Characterisation by drop
98 N. P E RO N E T A L .
© 2004 The Royal Microscopical Society, Journal of Microscopy, 214, 89–98
tensiometry and by ellipsometry of the adsorption layer formed at theair/champagne wine interface. Adv. Colloid Interface Sci. 88, 19–26.
Pollard, M.L., Rennan Pan, C., Steiner, C. & Maldarelli, C. (1998) Phasebehavior of sparingly soluble polyethoxylate monolayers at theair–water interface and its effect on dynamic tension. Langmuir, 14,7222–7234.
Puff, N., Cagna, A., Aguié-Béghin, V. & Douillard, R. (1998) Effect ofethanol on the structure and properties of β-casein adsorption layersat the air–buffer interface. J. Colloid Interface Sci. 208, 405–414.
Puff, N., Marchal, R., Aguié-Béghin, V. & Douillard, R. (2001) Is grapeinvertase a major component of the adsorption layer formed at the air/champagne wine interface? Langmuir, 17, 2206–2212.
Robillard, B., Delpuech, E., Viaux, L., Malvy, J., Vignes-Adler, M. &Duteurtre, B. (1993) Improvements of methods for sparkling base winefoam measurements and effect of wine filtration on foam behavior. Am.J. Enol. Vitic. 44, 387–392.
Rodriguez Nino, M.R., Sanchez, C.C. & Rodriguez Patino, J.M. (1999)
Interfacial characteristics of beta-casein spread films at the air–waterinterface. Colloids Surf. B, 12, 161–173.
Rodriguez Patino, J.M., Sanchez, C.C. & Rodriguez Nino, M.R. (1999)Structural and morphological characteristics of beta-casein monolayersat the air–water interface. Food Hydrocolloids, 13, 401–408.
Saylor, J.R. (2001) Determining liquid substrate cleanliness using infraredimaging. Rev. Sci. Instrum. 72, 4408–4414.
Senée, J., Robillard, B. & Vignes-Adler, M. (1999) Films and foams ofChampagne wines. Food Hydrocolloids, 13, 15–26.
Sengupta, T. & Damodaran, S. (2000) Incompatibility and phase separationin a bovine serum albumin/β-casein/water ternary film at the air–waterinterface. J. Colloid Interface Sci. 229, 21–28.
Sengupta, T., Razumovsky, L. & Damodaran, S. (2000) Phase separationin two-dimensional αs-casein/β-casein/water ternary film at theair–water interface. Langmuir, 16, 6583–6589.
Tusseau, D. & Van Lear, S. (1993) Etude des macromolécules des vins dechampagne. Sci. Aliments, 13, 463–482.


