Embed Size (px)
Citation preview
PERFORMANCE APPRAISAL IN NATIONAL BUSINESS AND
TECHNICAL EXAMINATIONS BOARD: EMPIRICAL ANALYSIS
Stephen Oladapo ADEWUNI
PG/MGS0816600
BEING A FACULTY SEMINAR PAPER WRITTEN AND SUBMITTED
TO THE DEPARTMENT OF BUSINESS ADMINISTRATION, IN
PARTIAL FULFILMENT OF THE REQUIREMENTS FOR THE
AWARD OF DOCTOR OF PHILOSOPHY (PhD) IN QUANTITATIVE
ANALYSIS OF THE UNIVERSITY OF BENIN, BENIN CITY,
EDO STATE, NIGERIA
Prof. G.C. OvuworieDr. E.M. AghedoChief SupervisorCo-Supervisor

APRIL, 2014.
1
ABSTRACT
For assurance of conformity and compliance of organisational
members with the goals and expectations, suitability of
prospective staff and for the purpose of training needs of
such organisations, organisations embark upon periodic
performance appraisal. Different tools, ranging from
qualitative to quantitative tools, are being employed in
carrying out performance appraisal by different
organisations. Some of these tools are however prone to some
measurement errors such as halo effect, use of un-
standardized instrument and carelessness on the part of
assessor – problem of subjectivity. This study was therefore
carried out to address the problem of using un-standardized
instrument for employee’s performance appraisal. Central to
this work is the application of a new theory (i.e. Item
Response Theory) as a tool for validating performance
appraisal instrument in National Business and Technical
Examinations Board (NABTEB). The study was aimed at
ascertaining if the relationship between task parameters and
employee’s parameter is stochastic in nature, establishing
the uni-dimensionality of each item in performance appraisal
2
instrument, examining the correlational matrix to establish
the local independence of each item and justifying the
relevance of these assumptions of IRT to performance
appraisal instrument. A forty-item appraisal instrument was
administered on 250 NABTEB staff members and their responses
were analysed using mathematical modeling of IRT and factor
analysis. The results revealed that only twenty out of the
forty items used fulfilled the assumptions of IRT while the
remaining ones need to be improved upon to become usable.
The study therefore recommends among others that before any
instrument is used for employee’s performance appraisal,
such instrument should be validated with the use of IRT.
Keywords: Performance Appraisal, Performance Appraisal
Instruments and Item Response Theory (IRT)
1.0 INTRODUCTION
Different organisations have designed different tools for
assessing their personnel. Most organisations use
qualitative approaches to personnel assessment. The
assessment, which is based on such qualitative
approaches, has been proved to be subjective (Ojerinde,
Popoola, Ojo & Onyeneho, 2012). In order to address the
3
problem of subjectivity of these approaches, researchers
have advocated for the combination of both qualitative
and quantitative approaches to personnel assessment.
However, one may want to ask which tool is most
appropriate for personnel assessment? In addressing this
question, what should be paramount to the personnel
assessor is the purpose for the assessment, the quality
of the instrument to be used and the latent trait of the
personnel to be assessed such as ability, skill,
competence and other generic attributes.
Without prejudice to the human resources policies of the
National Business and Technical Examinations Board
(NABTEB), Nigeria, it could be observed that the
assessment of personnel’s latent traits is mostly
qualitatively done. Such measurements made by the
assessors are always liable to some errors resulting from
such factors as halo-effect, inadequate and un-
standardized instrument as well as carelessness on the
part of those who develop the instruments used for the
assessment. These errors, when overlooked, always have
long term effect on the operations of organisations. They
4
may have adverse effect on the quality of services or
products of such organisations. The realization of
organisation’s goal may become difficult or impossible
while wastages of resources also become unavoidable.
Hence, effort is expected to be made to subject the
instrument to be used for personnel assessment in an
organisation to scientific analysis to ensure the
reliability and validity of such a tool. There is also
the need to ensure a balanced ability-task match when
assessing the performance of workers in an organisation.
The issues of the attributes of the assessment instrument
and personnel form the focal point of this paper. The
application of IRT to personnel assessment is presented in
this paper to address the problem of subjectivity since the
theory appears more objective in terms of relationship
between the ability of the worker and the task posed before
such a worker/staff.
Recent researchers in psychometrics have advanced from test
computation based on classical test theory (CTT) to
computing the parameters of an assessment instrument using
assumptions of item response theory (IRT) due to the5
inherent errors in measurement from the (CTT). Umoinyang,
Asim, Akwa and Bassey (2004) asserts that such errors as
bias may add to or take from true abilities of those
assessed. Also, Rust and Golombok (2000) referred to these
errors as sabotage in personality assessment, which can be
either deliberate or unconscious. Ideally, the decision
maker wishes to avoid bias but, inasmuch as our knowledge of
the world is incomplete, pure, value-free objectivity is
difficult to attain (Selden, Ingraham & Jacobson, 2001).
There is, therefore, the need to address the issue of
validity and reliability of such instruments used for
promotion of workers in most Nigerian organisations in order
to ensure objectivity in appraisal.
The aim of the study is the application of item response
theory to performance appraisal in Nigerian organisations.
The specific objectives are to:
1. Find out whether the relationship between item/task
parameters and examinee/employee parameter is
stochastic in nature;
2. Establish the uni-dimensionality of the Performance
Appraisal Instrument (PAI) used for the study;6
3. Examine the correlation matrix (correlation
coefficients) of all the items in the PAI to establish
local independence of the items used for the study;
4. Justify the relevance of IRT to performance appraisal
instrument in Nigerian examining bodies.
The study is focused on performance appraisal in Nigerian
examining bodies with emphasis on the National Business and
Technical Examinations Board (NABTEB). This research is
based on the assumptions of Item Response Theory as
identified by Duong (2004) which include assumptions about
dimensional structure of assessment instrument, local
independence of each item of the instrument and mathematical
form of the item characteristic curve (ICC).
2.0 LITERATURE REVIEW
Performance Appraisal
Employee performances appraisal is often carried out within
an organisation. Thus, the individuals within an
organisation are evaluated based on their job performance
(Cole, 2002). This process enables the organisation to
ascertain the quality of performance or competence achieved
7
or displayed by an employee and in making a judgement about
the employee’s ability (Armstrong, 2009). The appraisal of
employee’s performance is done both in private and public
organisations in Nigeria just like in most nations across
the globe. This process is referred to as personnel
assessment.
Performance appraisal is often focused on measuring latent
traits of employees. Such latent traits could be cognitive,
ability or personality characteristics of organisational
members. It must be done under a number of constraints
(Scherbaum, 2008). Performance appraisal could, therefore,
be defined as the process of appraising, evaluating or
passing value judgment about the quality of performance of
an employee with reference to his/her latent
characteristics.
Performance appraisal could be done formally or informally.
Informal appraisal is the continuing assessment of an
individual’s performance by his or her supervisor or manager
in the normal course of work. This assessment is ad hoc in
nature and determined mostly by intuitive feelings of assessor
by factual evidence of results. It is a natural by-product of8
the day-to-day relationship between immediate superior and the
subordinates (Cole, 2002). Cole further explains that the
formal appraisal, on the other hand, is an assessment of
employee performance in some systematic and planned way, and
altogether more rational and orderly than informal appraisal.
It could be seen as the on-going process of evaluating
employee performance. It is the review of employee performance
overtime on one side and the assessment of suitability of an
individual for promotion on the other.
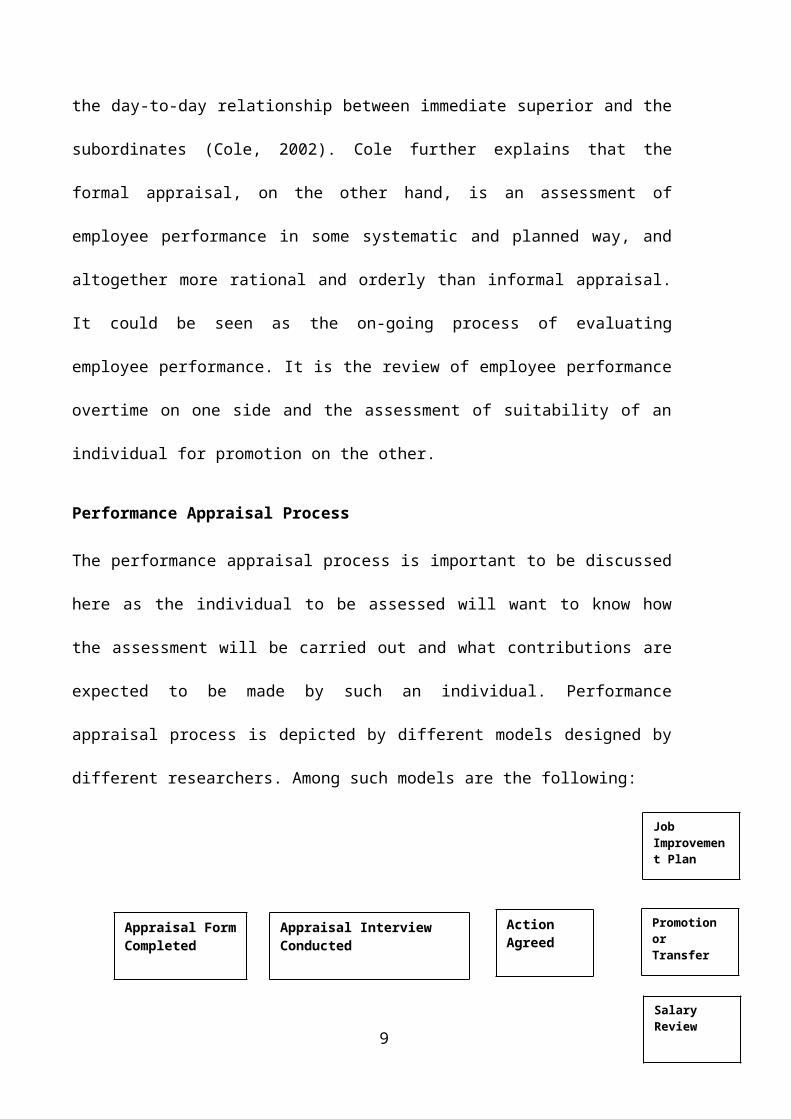
Performance Appraisal Process
The performance appraisal process is important to be discussed
here as the individual to be assessed will want to know how
the assessment will be carried out and what contributions are
expected to be made by such an individual. Performance
appraisal process is depicted by different models designed by
different researchers. Among such models are the following:
9
Appraisal FormCompleted
Appraisal Interview Conducted
Action Agreed
Job Improvement Plan
Promotion or Transfer
Salary Review

Figure 1: The Appraisal Process
Source: (Cole, 2002:299)
10
According to Cole (2002), any systematic approach to
performance appraisal starts with the completion of an
appropriate appraisal form and is followed by interview in
which the manager discusses with the organisation’s
members. Then an agreed action is either taken solely by
the manager or jointly by the manager and the individuals
being interviewed. Such an action is displayed by job
improvement plan, promotion to higher rank, transfer to
another job or a salary increase.
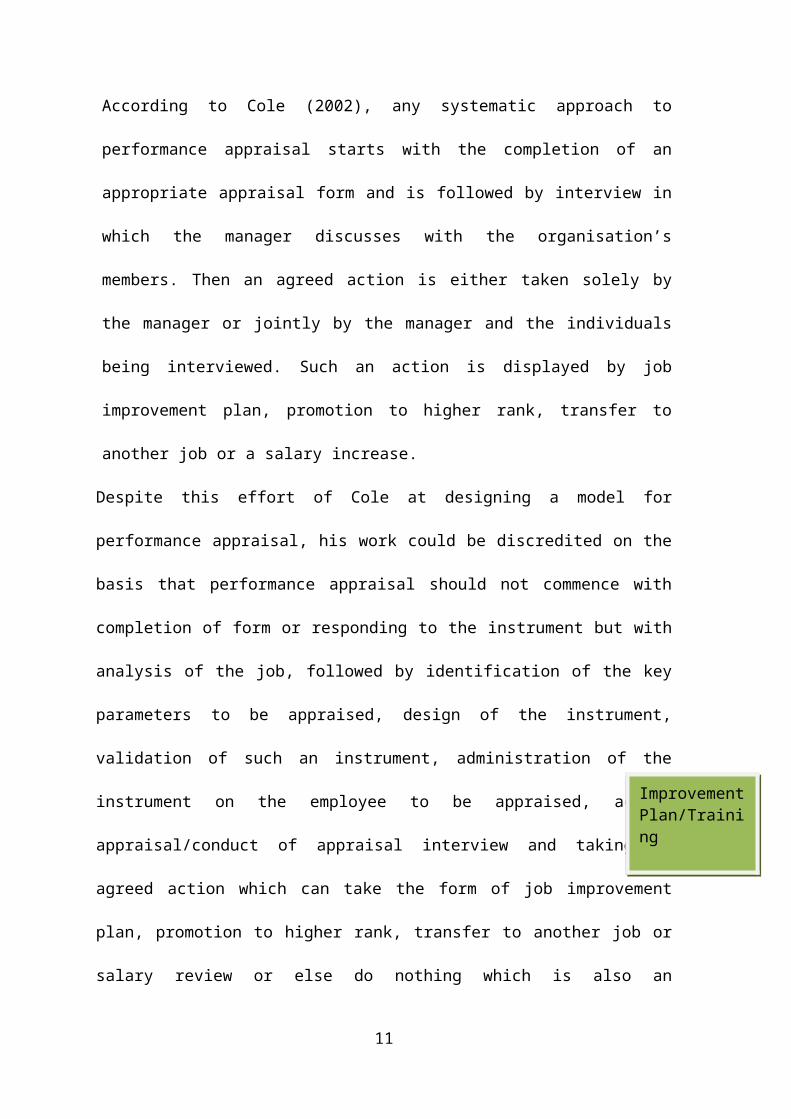
Despite this effort of Cole at designing a model for
performance appraisal, his work could be discredited on the
basis that performance appraisal should not commence with
completion of form or responding to the instrument but with
analysis of the job, followed by identification of the key
parameters to be appraised, design of the instrument,
validation of such an instrument, administration of the
instrument on the employee to be appraised, actual
appraisal/conduct of appraisal interview and taking an
agreed action which can take the form of job improvement
plan, promotion to higher rank, transfer to another job or
salary review or else do nothing which is also an
11
ImprovementPlan/Training
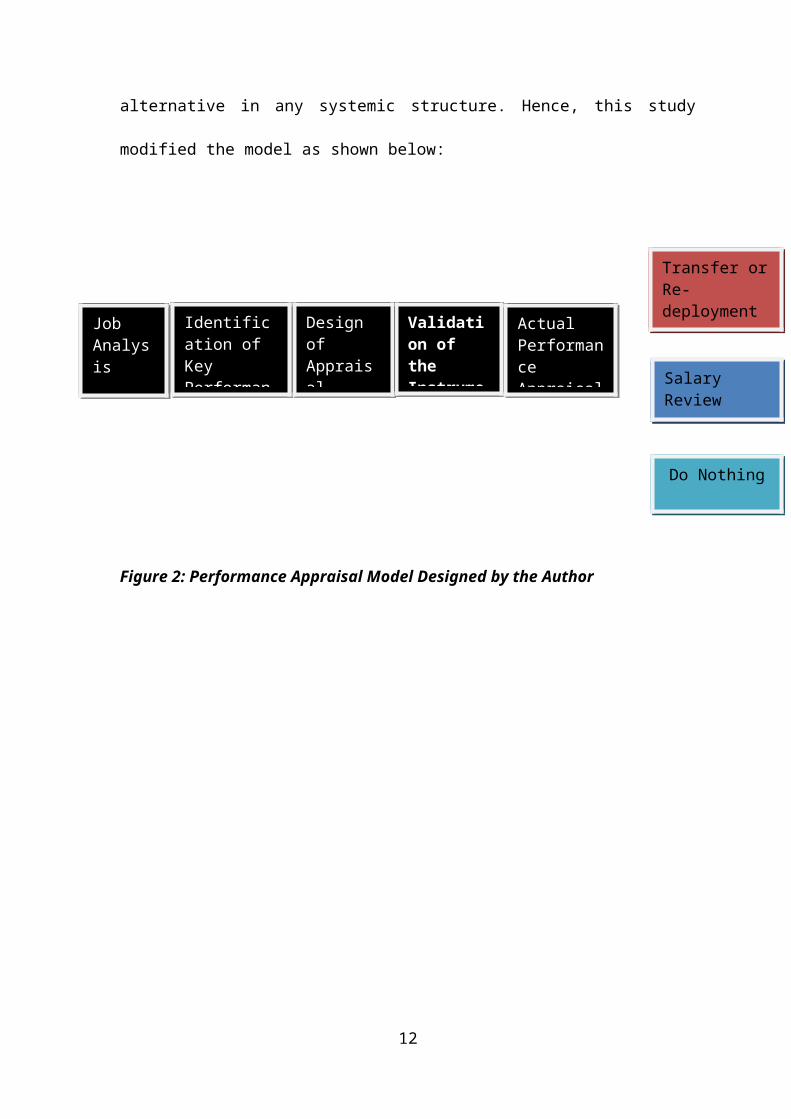
alternative in any systemic structure. Hence, this study
modified the model as shown below:
Figure 2: Performance Appraisal Model Designed by the Author
12
Job Analysis
Identification of Key Performan
Design of Appraisal
Validation of the Instrume
Actual Performance Appraisal
Transfer orRe-deployment or
Do Nothing
Salary Review
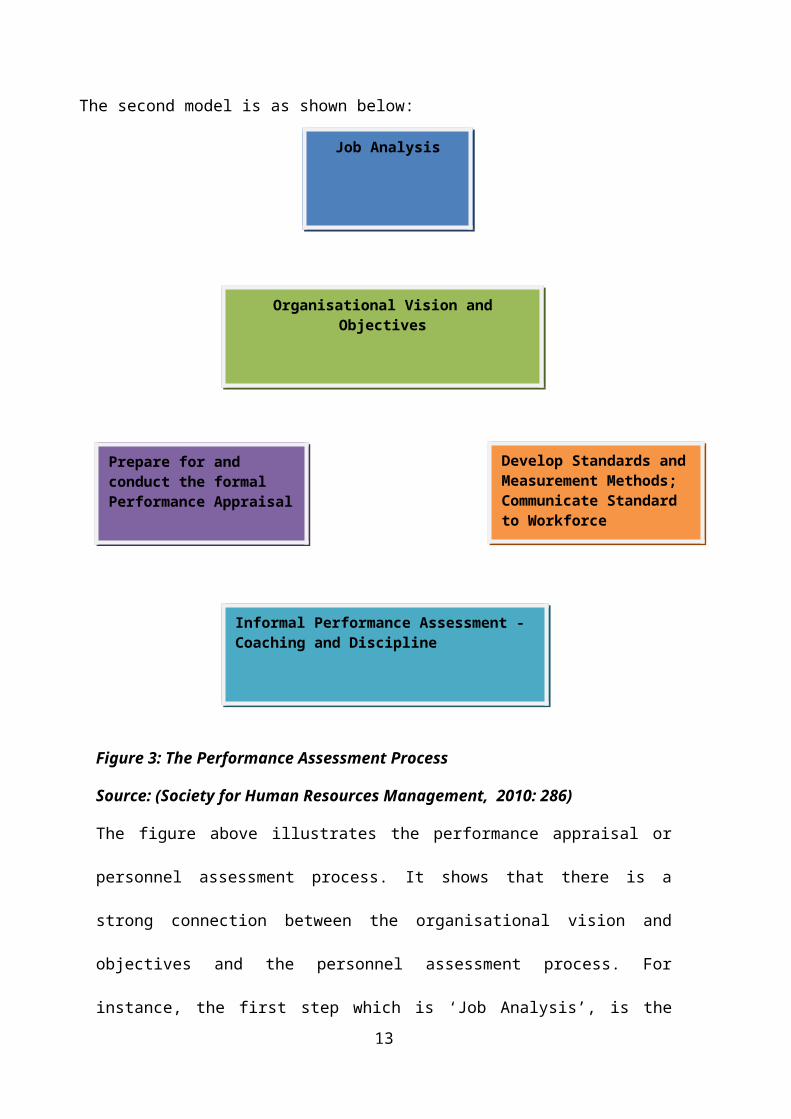
The second model is as shown below:
Figure 3: The Performance Assessment Process
Source: (Society for Human Resources Management, 2010: 286)
The figure above illustrates the performance appraisal or
personnel assessment process. It shows that there is a
strong connection between the organisational vision and
objectives and the personnel assessment process. For
instance, the first step which is ‘Job Analysis’, is the13
Job Analysis
Organisational Vision andObjectives
Develop Standards andMeasurement Methods; Communicate Standard to Workforce
Prepare for and conduct the formal Performance Appraisal
Informal Performance Assessment - Coaching and Discipline
process of identifying what a job consists of. This will
form the basis for evaluating the performance of an
employee. The job must, however, be based on the
organisational mission and objectives, the department and
the job itself. After performing job analysis, the next step
is to examine the organisation vision and objectives and
then to determine the standards of acceptable behaviour and
methods of measuring the performance. The standards of
acceptable behaviour so determined constitute the key
performance indicators (KPI) while in determining the
performance measurement method, the measuring tools or
instruments should also be given due consideration.
Performance appraisal should not be simply a once- or twice-
yearly formal interview. As its definition states,
performance appraisal is an ongoing process. While a formal
evaluation may only take place once or twice a year, people
need regular feedback on their performance to know how they
are doing. This becomes achievable through the process of
informal appraisal which is done through coaching and
discipline. Following this is the preparation for and the
14
conduct of formal performance appraisal (Van Scotter,
Motowidlo, & Cross, 2000).
Performance Assessment Instruments
Different organisations use different tools for personnel
assessment. These tools are discussed below.
Critical Incidents Records
The critical incidents method is a performance appraisal
method in which a manager keeps a written record of positive
and negative performance of employees throughout the
performance period (Van Scotter & Motowidlo, 1996). There is
no standard form used, so it is a method. Most formal
reviews take place only once or twice a year. Waiting for
formal reviews to talk to employees about what they are
doing well and when they are not performing up to
expectations may not avail the assessor an opportunity to
assess objectively as there is tendency to have forgotten
most of the salient factors or issues to be considered. Can
an assessor remember everything each of the staff under his
immediate supervision did well and messed up to evaluate
their total performance for the period of 6 to 12 months?
15
The response of course, will be ‘no’. Unfortunately, many
managers don’t keep a record of critical incidents, which
leads to problems of inaccurate measures during the formal
review meeting. Records of critical incidents are expected
to be kept by managers to avoid forgetting such in the
course of formal performance appraisal or personnel
assessment (SHRM, 2010). One error, however, managers tend
to make, is to focus on the negative actions of employees.
Management by Objectives (MBO)
The Management by Objectives (MBO) method is a process in
which managers and employees jointly set objectives for the
employees, periodically evaluate performance, and reward
according to the results. Although it is a three-step process,
no standard form is used with MBO, so it is a method. MBO is
also referred to as work planning and review, goals
management, goals and controls, and management by results (Van
Scotter, Motowidlo, & Cross, 2000).
The MBO method is one of the best methods of developing
employees. Like critical incidents, employees get ongoing
feedback on how they are doing, usually at scheduled interval
meetings. The MBO method can successfully be used with
16
employees if the organisation is committed to the process and
truly involves employees rather than trying to make them
believe that our objectives are theirs—accurate measures
(Nwachukwu, 2009).
On an organisation-wide basis, MBO is not too commonly used as
the sole assessment method. It is more commonly used based on
the evaluative assessment during the development part of the
performance appraisal. One difficult part of MBO is that in
many situations, most, if not all, employees will have
different goals, making MBO more difficult and time-consuming
than using a standard assessment form (Tziner & Kopelman,
2002). MBO is a three-step process which involves setting
individual objectives and plans which must be specific,
measurable, attainable, relevant, and time-based; giving
feedback and evaluating performance, and rewarding according to
performance.
Narrative Form
The narrative form requires a manager to write a statement
about the employee’s performance. There often is no actual
17
standard form used, but there can be a form, so narrative
can be a method or a form.
A narrative gives managers the opportunity to give their
evaluative assessment in a written form that can go beyond a
simple “check of a box” to describe an assessment item
(Armstrong, 2009). Managers can also write up a
developmental plan of how the employee will improve
performance in the future. Narratives can be used alone, but
are often combined with another method or form. Although the
narrative is ongoing, it is commonly used during the formal
review.
The system can vary. Managers may be allowed to write
whatever they want (method), or they may be required to
answer questions with a written narrative about the
employee’s performance (form). The no-form narrative method
can be the only assessment method used during the formal
review process (Van Scotter & Motowidlo 1996). But the
narrative method, when used alone, is more commonly used
with professionals and executives, not operative employees.
How we write the formal narrative assessment varies, as
writing content and styles are different. A narrative based
18
on critical incidents and MBO results is clearly the best
basis for the written assessment (Tziner & Kopelman, 2002).
Graphic Rating Scale Form
The graphic rating scale form is a performance appraisal
checklist on which a manager simply rates performance on a
continuum such as excellent, good, average, fair, and poor.
The continuum often includes a numerical scale, for example
from 1 (lowest performance
level) to 5 (highest performance level). Graphic rating scales
are probably the most commonly used form during the formal
performance appraisal (primarily for evaluative
decisions), but they should lead to development decisions as
well. It is popular because it can be used for many different
types of jobs. They are a kind of “one form fits all” form
that requires minimal time, effort, cost, and training.
Behaviorally Anchored Rating Scale (Bars) Form
The Behaviorally Anchored Rating Scale (BARS) form is a
performance appraisal that provides a description of each
assessment along a continuum. Like with graphic rating scales,
the continuum often includes a numerical scale from low to19
high. A description of each level of performance makes the
assessment a more objective and accurate measure. So if BARS
forms are more accurate, why aren’t they more commonly used
than graphic rating scale forms? (Tziner & Kopelman, 2002).
It’s partly economics and partly expertise. BARS forms have to
be customized to every different type of job. And developing
potentially hundreds of different BARS forms takes a lot of
time (which costs money) and expertise. Even when a firm has
an HR staff, the question becomes whether developing BARS
forms is the most effective use of staff members’ time.
Obviously, it depends on the types of jobs being evaluated and
the resources available to complete the evaluation process.
Ranking Method
The ranking method is a performance appraisal method that is
used to evaluate employee performance from best to worst.
There often is no actual standard form used, and we don’t
always have to rank all employees. Van Scotter and Motowidlo
(1996) asserted that managers have to make evaluative
decisions, such as who is the employee of the month, who gets
a raise or promotion, and who gets laid off. So when we have
to make evaluative decisions, we generally have to use20
ranking. However, ranking can, and when possible should, be
based on other methods and forms. Ranking can also be used for
developmental purposes by letting employees know where they
stand in comparison to their peers—they can be motivated to
improve performance.
Under the ranking method, the manager compares an employee to
other similar employees (Norm Referenced), rather than to a
standard measurement (Criterion Referenced). An offshoot of
ranking is the forced distribution method, which is similar to
grading on a curve. Predetermined percentages of employees are
placed in various performance categories, for example,
excellent, 5%; above average, 15%; average, 60%; below
average, 15%; and poor, 5%. The employees ranked in the top
group usually get the rewards (annual increment, bonus,
promotion), those not at the top tend to have the reward
withheld, and those at the bottom sometimes get punished.
Item Response Theory (IRT)
While adopting some of these tools in assessing the worker’s
performance, it is pertinent to note that most organisations
make use of examinations for staff/workers due for promotion
within the year being reviewed. Such instruments used for the21
assessment of workers are often subjected to Classical Test
Theory.
An equitable assessment instrument in performance appraisal
ensures that staff members are “fairly” assessed and that
employees of the same ability receive same results, hence a
common result. The Assessment Reforms Group (2002) defined
assessment as the process of seeking and interpreting evidence
for use by employees and their supervisors to decide where
workers are in the learning. Assessment can focus on the
individual learner, the learning community, the institution or
the educational system as a whole. Wikipedia (2010) states
that “studies of a theoretical or empirical nature addressing
the assessment of workers’ aptitude and preparation motivation
and learning styles, learning outcomes in achievement and
satisfaction in different organisational context all linger to
assessments”. Assessment instrument is the process of
documenting, usually in measurable terms, knowledge, skills,
attitude and believes. Hence, the issue of quality
performance assessment instrument cannot be handled with
levity and ineptitude. It is on this premise that the
researcher embark on improving performance assessment22
instrument in organisation through the Application of IRT.
Prior to the emergence of the new theory in testing, most
organisations in Nigeria are used to Classical Test Theory
(CTT) which is a body of related psychometric properties that
predict outcome of psychological testing when assessing the
staff performance (Adewuni & Taiwo, 2013). Generally speaking,
the aim of CTT is to understand and improve the reliability of
psychological tests.
Classical test theory (CTT) may be regarded as roughly
synonymous with true score theory. The term” classical” refers
not only to the chronology of these models but also contrasts
with the more recent psychometric theories. It assumes that
each person has a true score that would be obtained if there
were no errors in measurement. A person’s true score is
defined as the expected number of correct score over an
infinite number of independent administrations of the test
(Wikipedia, 2011). However, CTT has the following
shortcomings:
(1). It is sample dependent;
(2). It has parallel test form issues that is:
23
a. Comparing examinee scores and
b. Reliability.
(3). It lacks predictability; and
(4). “Error” is the same for everybody.
These weaknesses of CTT gave rise to the emergence of Item
Response Theory (IRT) also known as “latent trait theory,
strong true score theory or modern mental test theory”,
which is a paradigm for the design, analysis and scoring of
test, questionnaires and similar instruments measuring
abilities, attitudes or other variables. IRT is a family of
mathematical models that describe the interaction between
workers (examinees) and tasks (test items). Since it is
generally regarded as superior to classical test theory
(CTT), it is the preferred method for the development of
high stakes tests (Wikipedia, 2013).
IRT attempts to model the relationship between an
unobservable variable referred to as the examinee correctly
responding to any particular test item (Lord, 1986). It is a
proven assessment approach that can help assessors to
24
identify good or bad items, create better tests and give
better estimates of workers’ abilities.
The main idea of item response theory is that of the item
response model that is, a mathematical function describing
the probability of specified responses to an item, given
some level of quantitative attributes of the respondent.
This is explained by Item Characteristic Curve (ICC) which
scales items and people onto a common metric, helps in
standard setting, serves as foundation of equating and makes
meaning in terms of student ability.
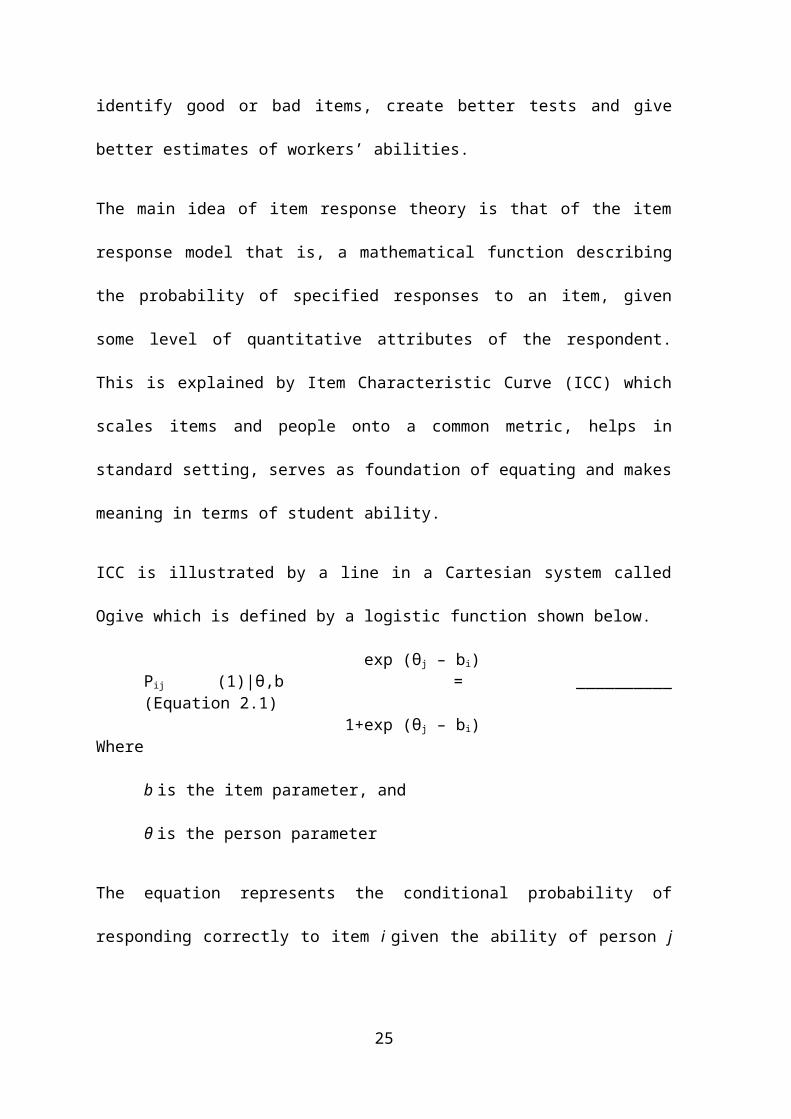
ICC is illustrated by a line in a Cartesian system called
Ogive which is defined by a logistic function shown below.
exp (θj – bi)
Pij (1)|θ,b = __________(Equation 2.1) 1+exp (θj – bi)
Where
b is the item parameter, and
θ is the person parameter
The equation represents the conditional probability of
responding correctly to item i given the ability of person j
25
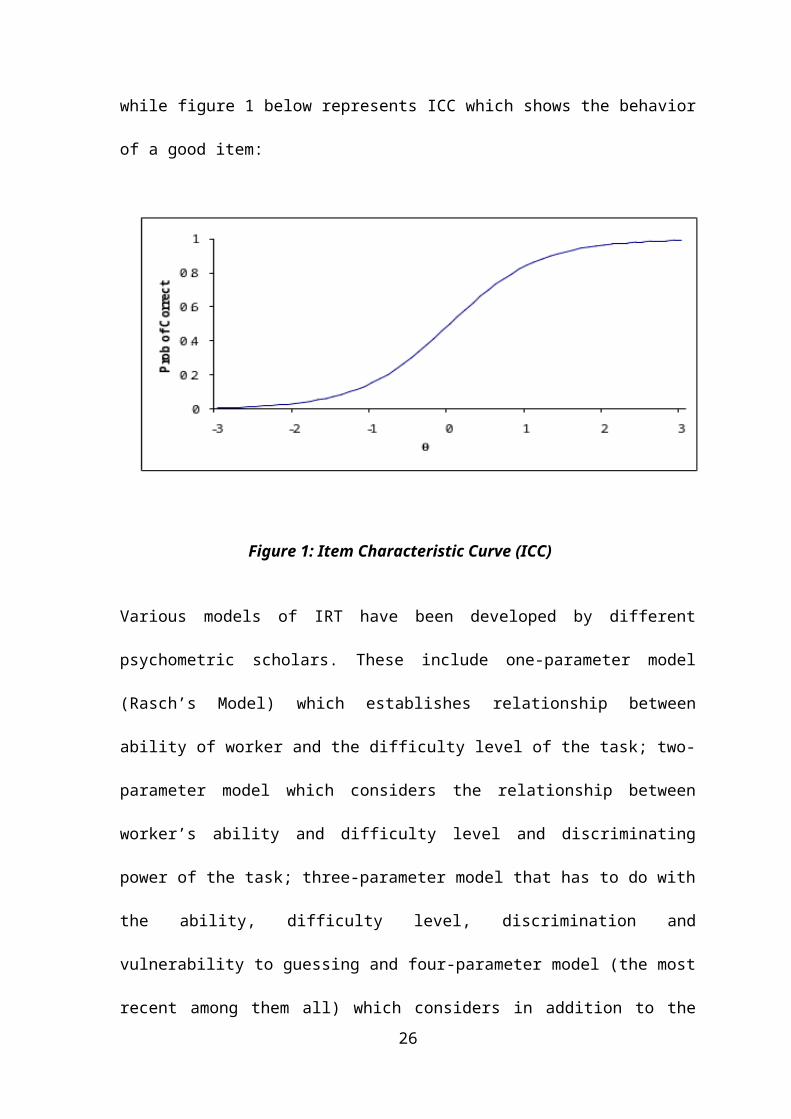
while figure 1 below represents ICC which shows the behavior
of a good item:
Figure 1: Item Characteristic Curve (ICC)
Various models of IRT have been developed by different
psychometric scholars. These include one-parameter model
(Rasch’s Model) which establishes relationship between
ability of worker and the difficulty level of the task; two-
parameter model which considers the relationship between
worker’s ability and difficulty level and discriminating
power of the task; three-parameter model that has to do with
the ability, difficulty level, discrimination and
vulnerability to guessing and four-parameter model (the most
recent among them all) which considers in addition to the26
parameters in other models, the carelessness of the
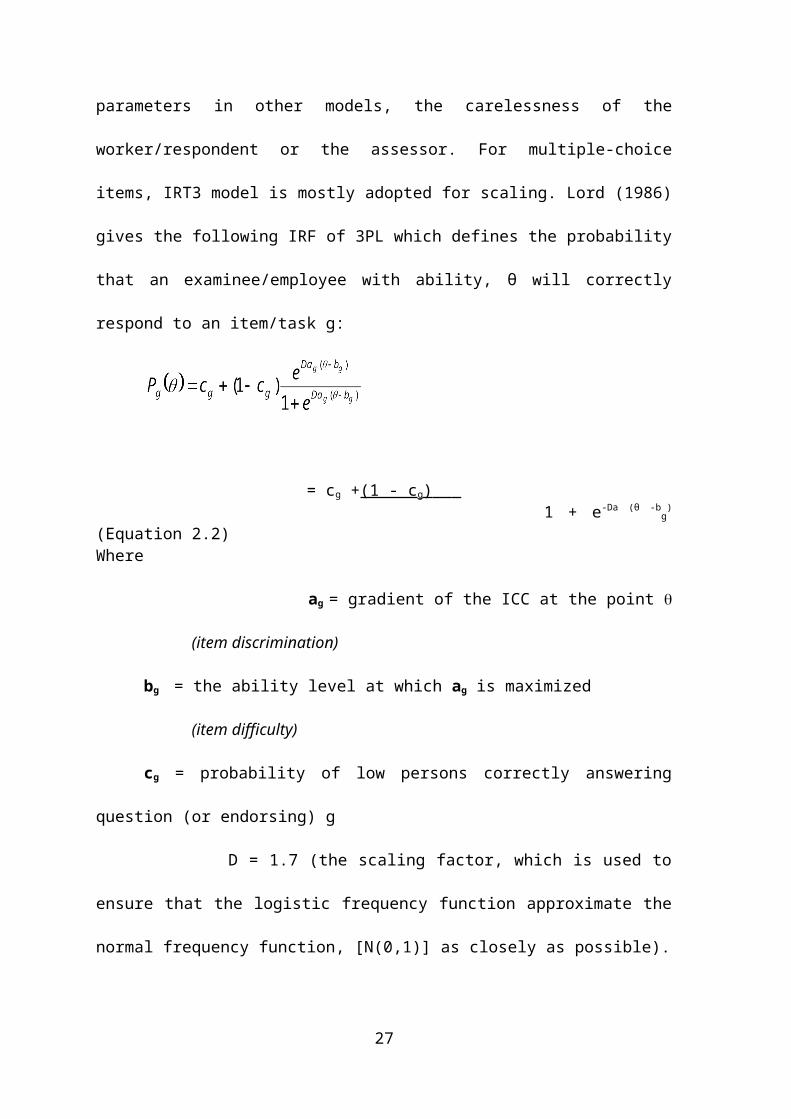
worker/respondent or the assessor. For multiple-choice
items, IRT3 model is mostly adopted for scaling. Lord (1986)
gives the following IRF of 3PL which defines the probability
that an examinee/employee with ability, θ will correctly
respond to an item/task g:
() (E
= cg +(1 - cg)___ 1 + e-Da (θ -b
g)
(Equation 2.2)Where
ag = gradient of the ICC at the point q
(item discrimination)
bg = the ability level at which ag is maximized
(item difficulty)
cg = probability of low persons correctly answering
question (or endorsing) g
D = 1.7 (the scaling factor, which is used to
ensure that the logistic frequency function approximate the
normal frequency function, [N(0,1)] as closely as possible).
27
IRT is advantageous over CTT in the sense that it is sample
independent and more objective as it shows the interplay of
task parameters and employee/worker parameter.
Due to the stochastic nature of IRT there are many
statistical principles that can be of numerous advantages to
test developers and administrators;
i. A test is a sum of its parts;
ii. Respondent’s performance can be predicted in terms
of the underlying trait;
iii. Provides a means for estimating scores for people
and characteristics of items (tasks) and
iv. Common framework for describing people and items
(tasks).
28
Basic Assumptions of the Item Response Model
The basic assumptions of the Item Response Theory as
identified by Duong (2004) include:
Dimensional Structure of Assessment Instrument
i. In general, underlying worker task performance is a set
of n latent traits.
ii. The n latent traits formulate a n–dimensional
latent space in which each worker’s position is
determined by the worker’s ability in each trait.
iii. This is like the position of a point in physical
space is determined by its coordinate in each axis.
In most of IRT models, the common assumption is that one
ability or trait is sufficient to explain the examinee’s
test performance. The models that assume a single trait is
referred to as unidimensional models. Models that assume
that many traits are necessary to account for test
performance are labeled multidimensional models. This paper,
however, focuses on unidimensional models.
Local Independence
This assumption states that an employee’s response to one
item/task does not affect her responses to any other29
items/tasks in the test. This means that only the employee’s
ability and characteristics of the item can influence
performance on the item/task. For unidimensional IRT models,
this assumption is met when the probability of an examinee’s
response pattern is equal to the product of probabilities
associated with the employee’s score for each individual
item/task.
Mathematical Form of the Item Characteristic Curve
The key issue in IRT framework is the relationship between
employee’s latent ability and probability of the employee
correctly responding to certain item/task. This relationship
is modeled by a mathematical function called Item
Characteristic Function and the graph of this function is
called Item Characteristic Curve (ICC).
3.0 METHODOLOGY
The study adopted survey design to elicit information on the
assumptions of IRT. All 700 staff members of National
Business and Technical Examinations Board (NABTEB)
constitutes the population for this study. 250 participants
were purposively sampled from NABTEB Headquarters in Benin
City and NABTEB Field Offices. In terms of location, 20030
participants were from NABTEB Headquarters and 150 from
NABTEB Field Offices. Similarly, in terms of gender, 120 and
130 participants were selected from male and female staff
respectively. The data was collected with the use of forty
(40) multiple choice items (with four options A to D)
randomly selected from the past promotion examinations used
by the examination bodies under this study.
The 40-item instrument was subjected to the assumptions of
IRT – uni-dimensionality, local independence by means of
factor analysis technique and relationship modeling with
ICC. Since this study underwent 3- parameter model of the
IRT, the 40 items were further subjected to Item Response
Function (IRF) to take care of the three parameters of the
model that is, difficulty index, discrimination index and
pseudo-guessing. After calculating the IRF for each item, it
was discovered that 20 of the items were good for IRT
assumptions while the remaining 20 items became CTT items.
4.0 DATA PRESENTATION AND ANALYSES
31
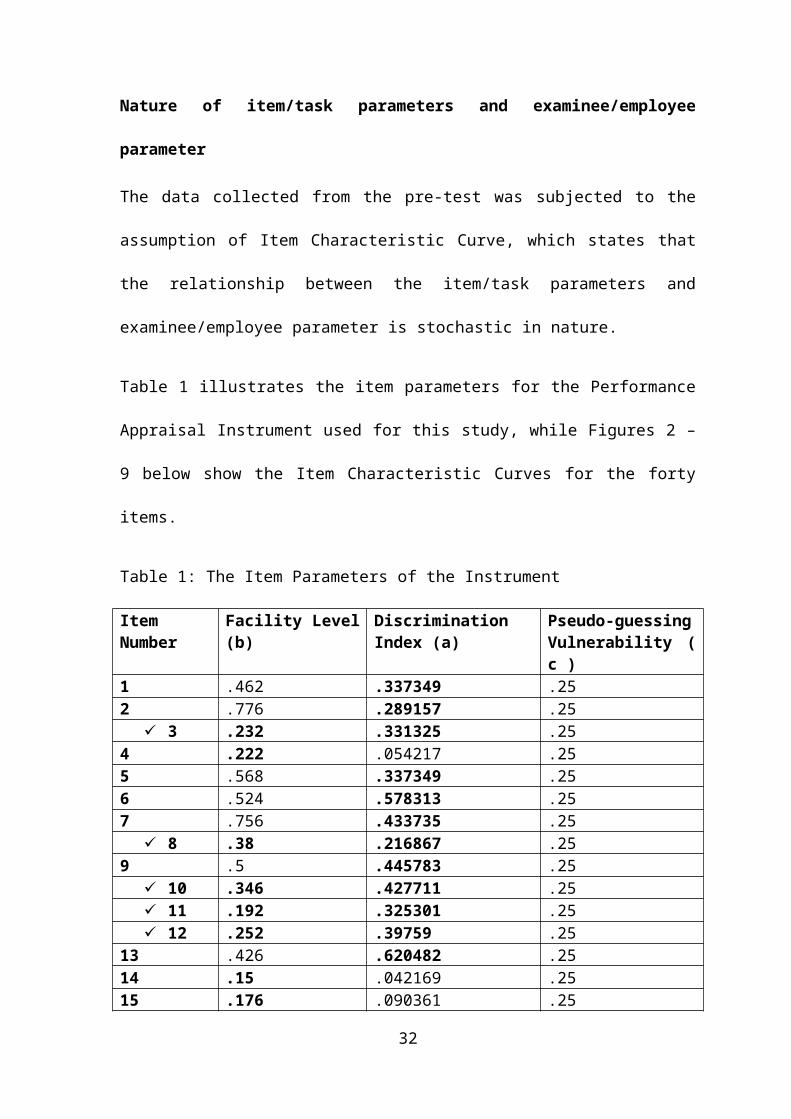
Nature of item/task parameters and examinee/employee
parameter
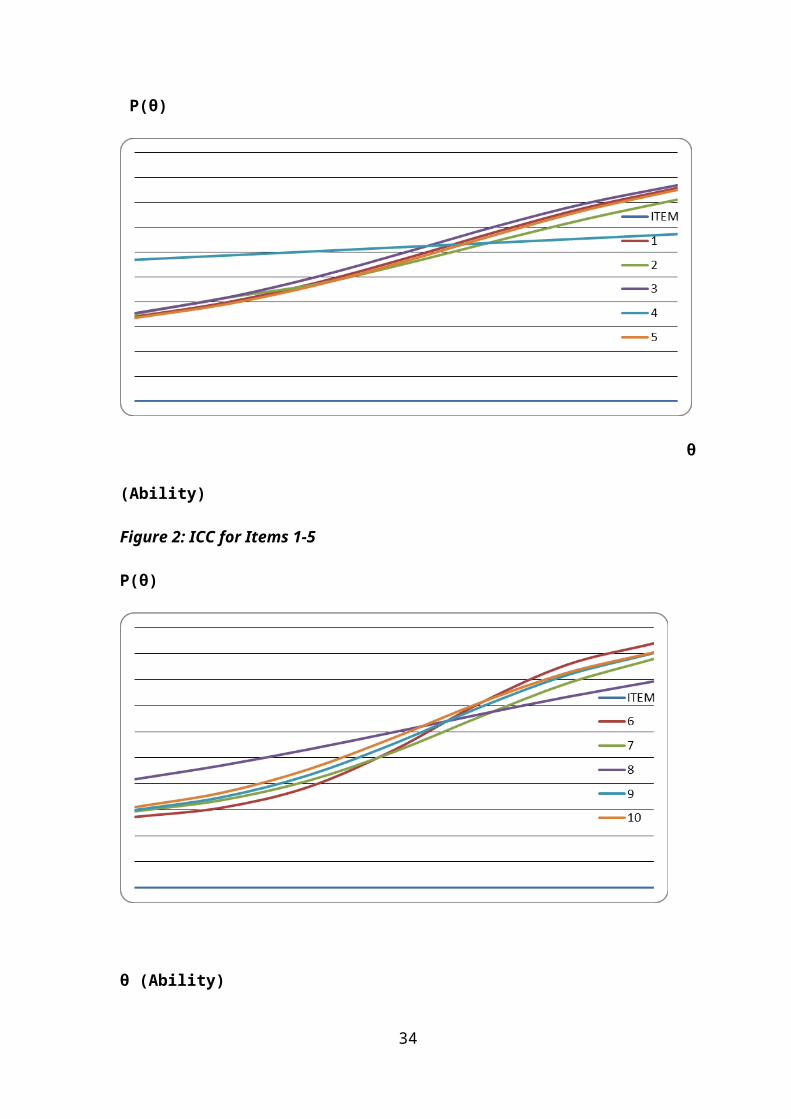
The data collected from the pre-test was subjected to the
assumption of Item Characteristic Curve, which states that
the relationship between the item/task parameters and
examinee/employee parameter is stochastic in nature.
Table 1 illustrates the item parameters for the Performance
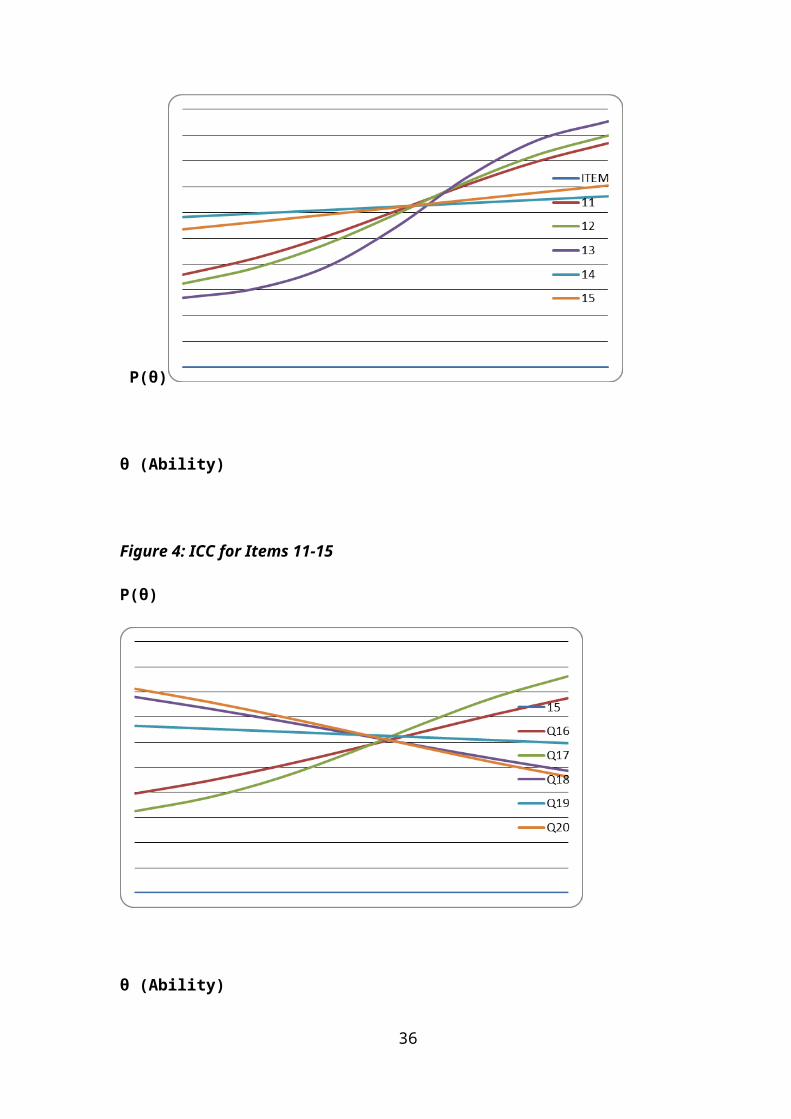
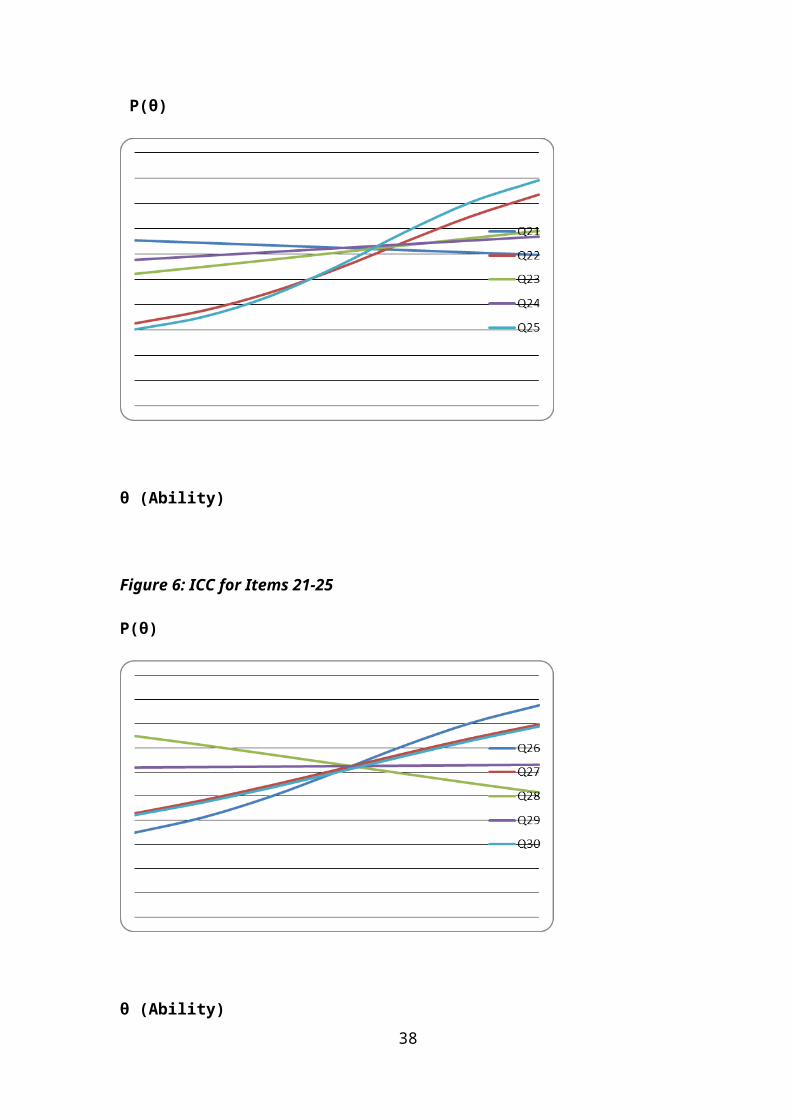
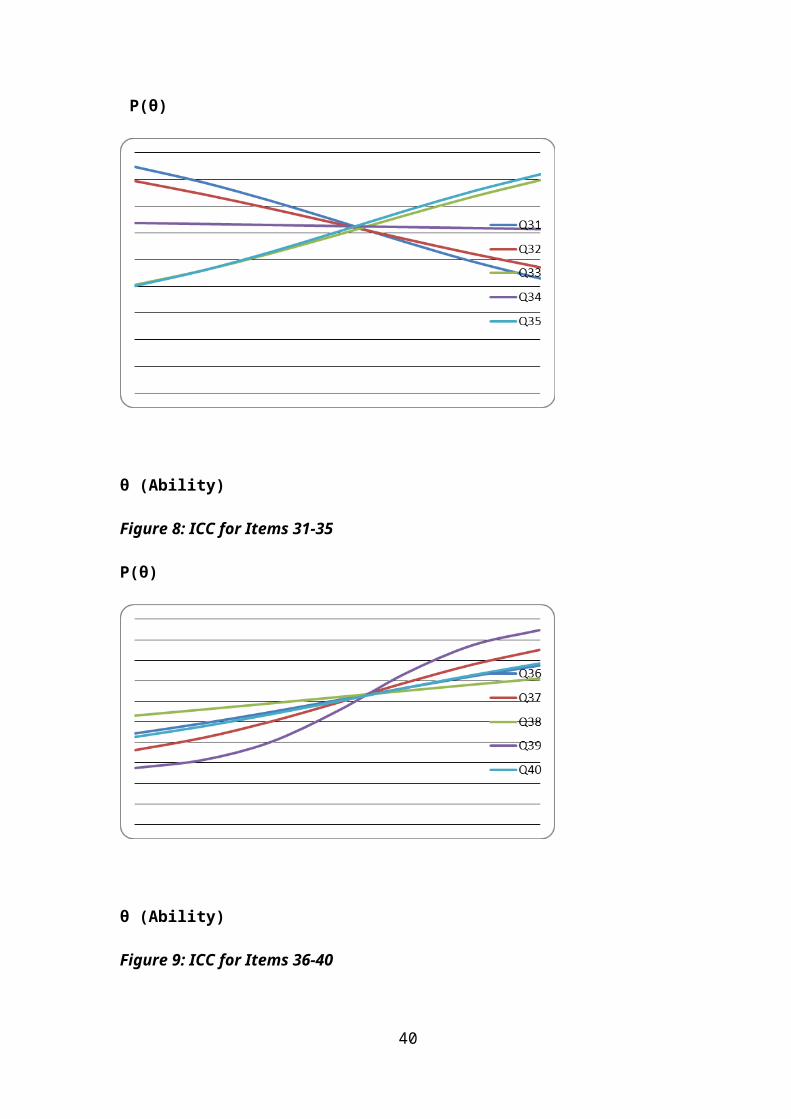
Appraisal Instrument used for this study, while Figures 2 –
9 below show the Item Characteristic Curves for the forty
items.
Table 1: The Item Parameters of the Instrument
ItemNumber
Facility Level(b)
DiscriminationIndex (a)
Pseudo-guessingVulnerability (c )
1 .462 .337349 .252 .776 .289157 .25
3 .232 .331325 .254 .222 .054217 .255 .568 .337349 .256 .524 .578313 .257 .756 .433735 .25
8 .38 .216867 .259 .5 .445783 .25
10 .346 .427711 .25 11 .192 .325301 .25 12 .252 .39759 .25
13 .426 .620482 .2514 .15 .042169 .2515 .176 .090361 .25
32
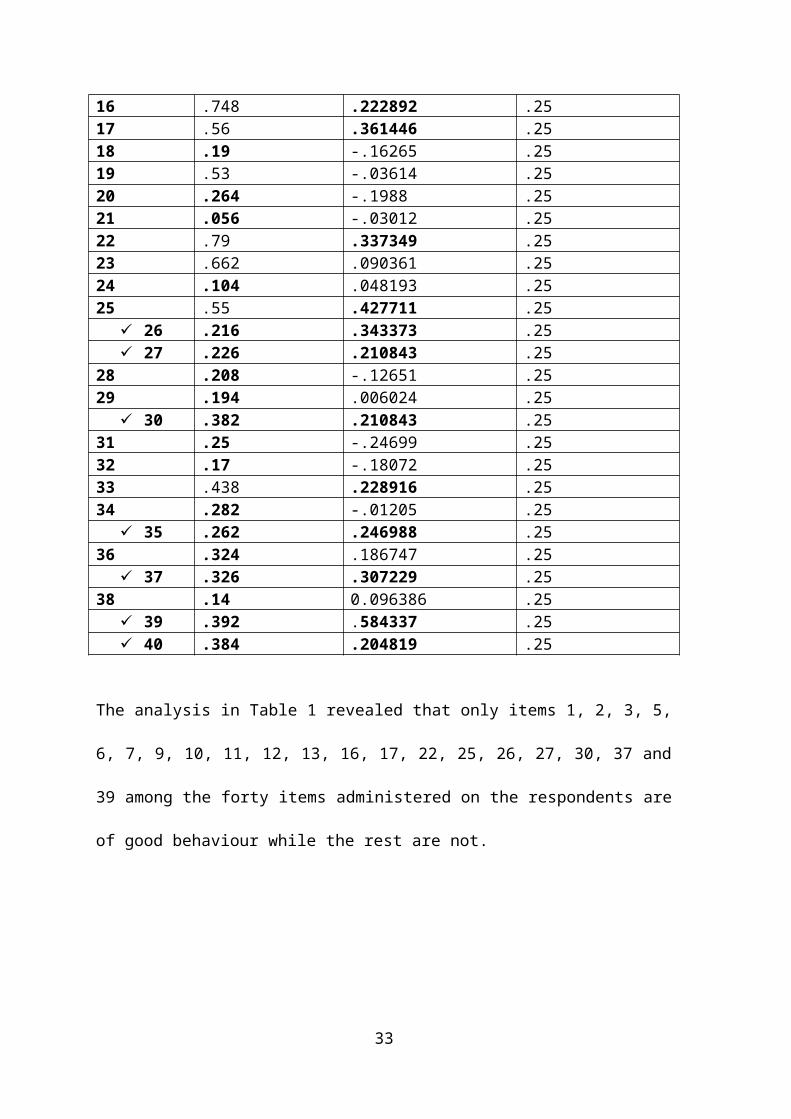
16 .748 .222892 .2517 .56 .361446 .2518 .19 -.16265 .2519 .53 -.03614 .2520 .264 -.1988 .2521 .056 -.03012 .2522 .79 .337349 .2523 .662 .090361 .2524 .104 .048193 .2525 .55 .427711 .25
26 .216 .343373 .25 27 .226 .210843 .25
28 .208 -.12651 .2529 .194 .006024 .25
30 .382 .210843 .2531 .25 -.24699 .2532 .17 -.18072 .2533 .438 .228916 .2534 .282 -.01205 .25
35 .262 .246988 .2536 .324 .186747 .25
37 .326 .307229 .2538 .14 0.096386 .25
39 .392 .584337 .25 40 .384 .204819 .25
The analysis in Table 1 revealed that only items 1, 2, 3, 5,
6, 7, 9, 10, 11, 12, 13, 16, 17, 22, 25, 26, 27, 30, 37 and
39 among the forty items administered on the respondents are
of good behaviour while the rest are not.
33
P(θ)
θ
(Ability)
Figure 2: ICC for Items 1-5
P(θ)
θ (Ability)
34

Figure 3: ICC for Items 6-10
35
P(θ)
θ (Ability)
Figure 4: ICC for Items 11-15
P(θ)
θ (Ability)
36

Figure 5: ICC for Items 16-20
37
P(θ)
θ (Ability)
Figure 6: ICC for Items 21-25
P(θ)
θ (Ability)38

Figure 7: ICC for Items 26-30
39
P(θ)
θ (Ability)
Figure 8: ICC for Items 31-35
P(θ)
θ (Ability)
Figure 9: ICC for Items 36-40
40
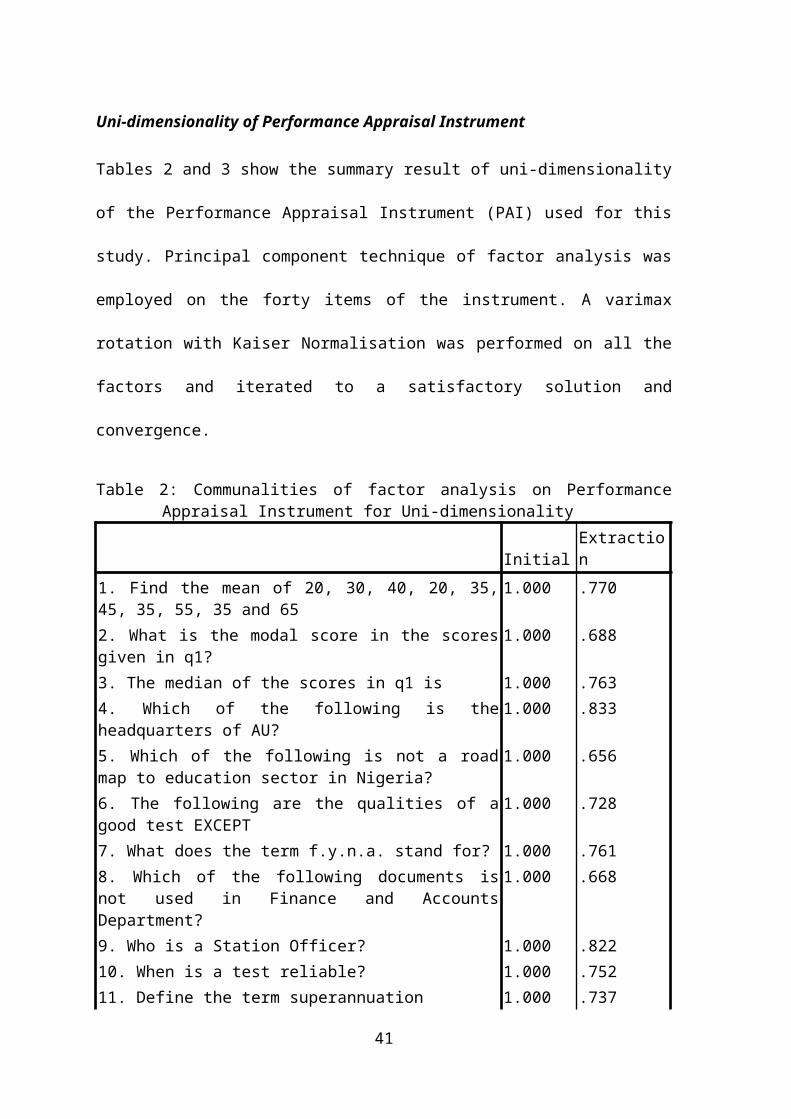
Uni-dimensionality of Performance Appraisal Instrument
Tables 2 and 3 show the summary result of uni-dimensionality
of the Performance Appraisal Instrument (PAI) used for this
study. Principal component technique of factor analysis was
employed on the forty items of the instrument. A varimax
rotation with Kaiser Normalisation was performed on all the
factors and iterated to a satisfactory solution and
convergence.
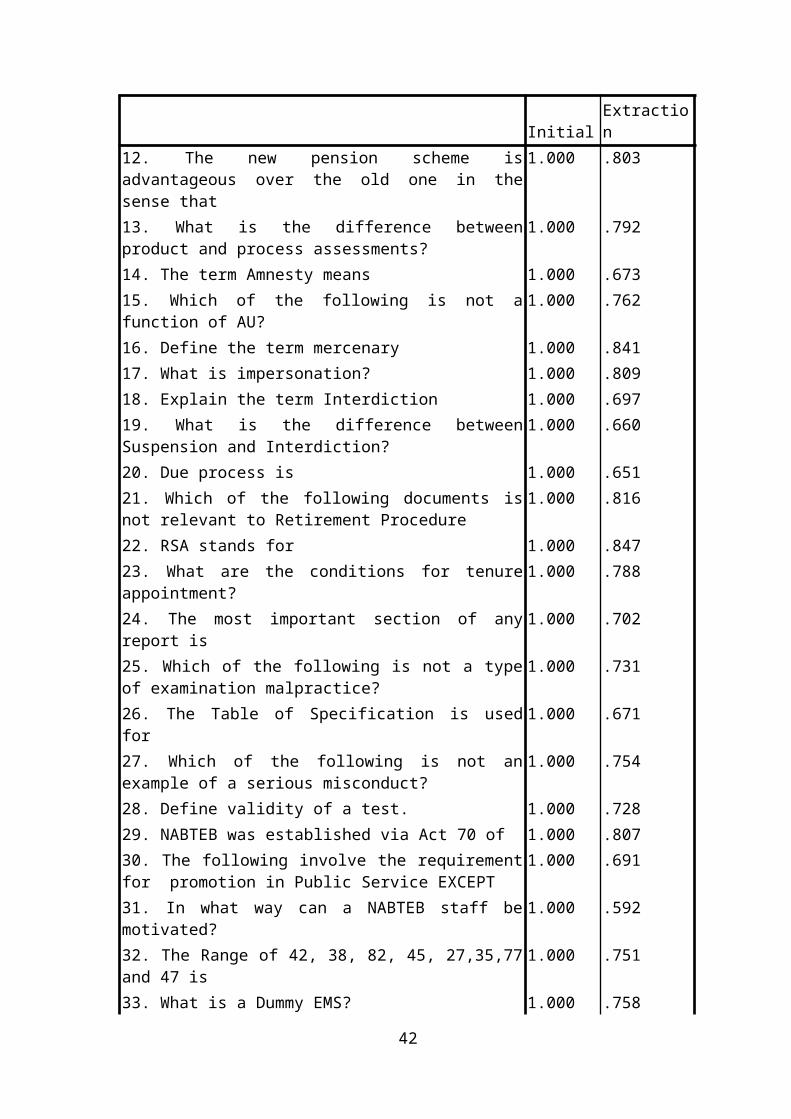
Table 2: Communalities of factor analysis on PerformanceAppraisal Instrument for Uni-dimensionality
InitialExtraction
1. Find the mean of 20, 30, 40, 20, 35,45, 35, 55, 35 and 65
1.000 .770
2. What is the modal score in the scoresgiven in q1?
1.000 .688
3. The median of the scores in q1 is 1.000 .7634. Which of the following is theheadquarters of AU?
1.000 .833
5. Which of the following is not a roadmap to education sector in Nigeria?
1.000 .656
6. The following are the qualities of agood test EXCEPT
1.000 .728
7. What does the term f.y.n.a. stand for? 1.000 .7618. Which of the following documents isnot used in Finance and AccountsDepartment?
1.000 .668
9. Who is a Station Officer? 1.000 .82210. When is a test reliable? 1.000 .75211. Define the term superannuation 1.000 .737
41
InitialExtraction
12. The new pension scheme isadvantageous over the old one in thesense that
1.000 .803
13. What is the difference betweenproduct and process assessments?
1.000 .792
14. The term Amnesty means 1.000 .67315. Which of the following is not afunction of AU?
1.000 .762
16. Define the term mercenary 1.000 .84117. What is impersonation? 1.000 .80918. Explain the term Interdiction 1.000 .69719. What is the difference betweenSuspension and Interdiction?
1.000 .660
20. Due process is 1.000 .65121. Which of the following documents isnot relevant to Retirement Procedure
1.000 .816
22. RSA stands for 1.000 .84723. What are the conditions for tenureappointment?
1.000 .788
24. The most important section of anyreport is
1.000 .702
25. Which of the following is not a typeof examination malpractice?
1.000 .731
26. The Table of Specification is usedfor
1.000 .671
27. Which of the following is not anexample of a serious misconduct?
1.000 .754
28. Define validity of a test. 1.000 .72829. NABTEB was established via Act 70 of 1.000 .80730. The following involve the requirementfor promotion in Public Service EXCEPT
1.000 .691
31. In what way can a NABTEB staff bemotivated?
1.000 .592
32. The Range of 42, 38, 82, 45, 27,35,77and 47 is
1.000 .751
33. What is a Dummy EMS? 1.000 .758
42
InitialExtraction
34. The Vision Statement of the Board is 1.000 .80435. The full meaning of ufs is 1.000 .61936. What is the meaning of PV? 1.000 .65237. Who was the last Chairman of theBoard?
1.000 .768
38. Which of the following internationalassociations does NABTEB belong?
1.000 .767
39. Complete the following statement:Certifying Skills for
1.000 .783
40. Which of the following ways can beused to control labour unrest?
1.000 .707
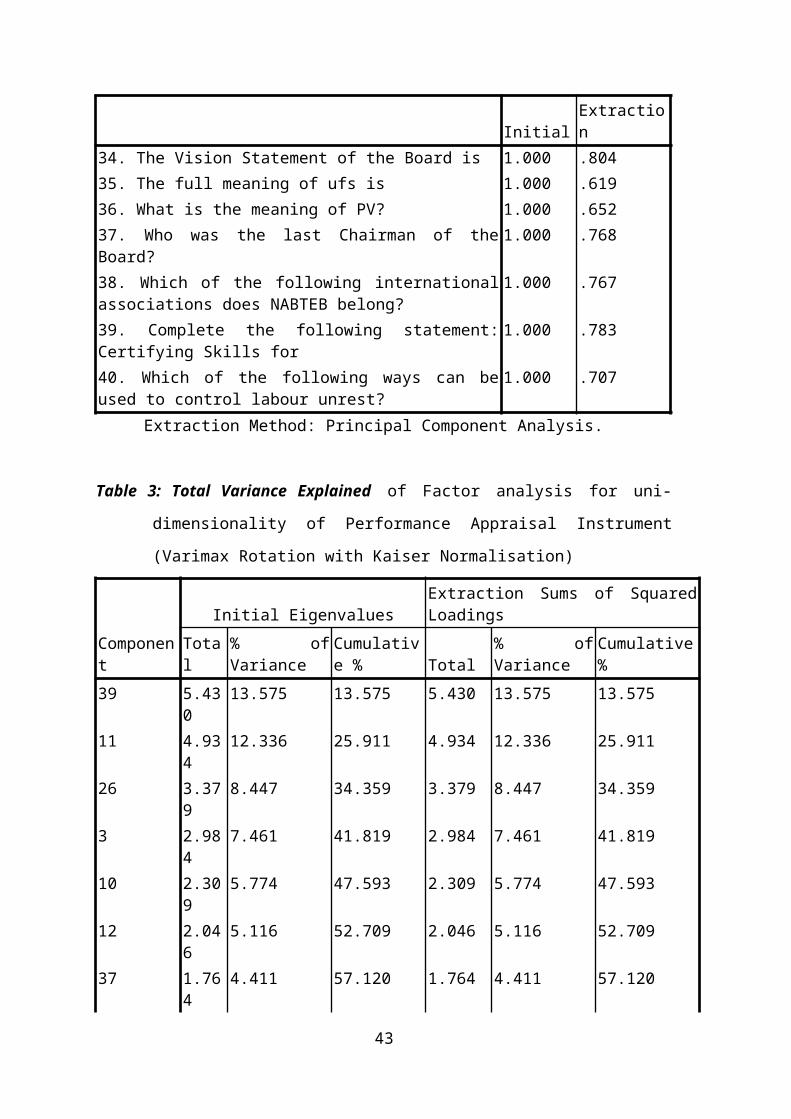
Extraction Method: Principal Component Analysis.
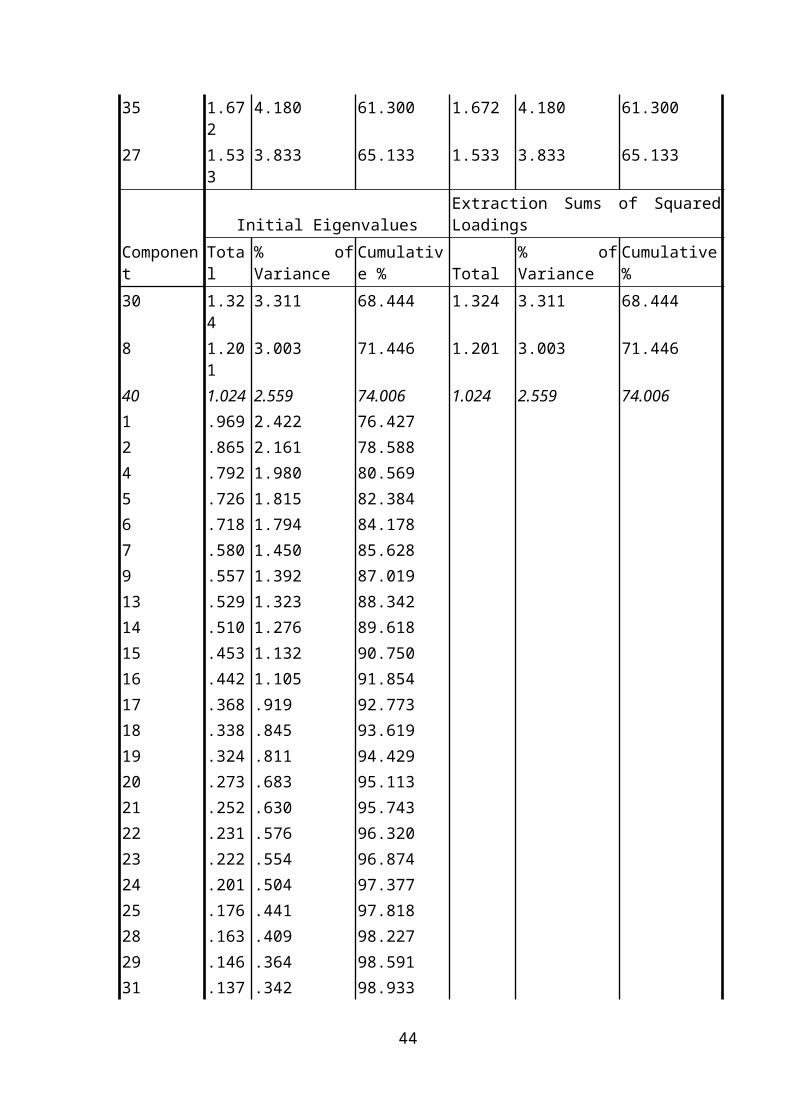
Table 3: Total Variance Explained of Factor analysis for uni-
dimensionality of Performance Appraisal Instrument
(Varimax Rotation with Kaiser Normalisation)
Component
Initial EigenvaluesExtraction Sums of SquaredLoadings
Total
% ofVariance
Cumulative % Total
% ofVariance
Cumulative%
39 5.430
13.575 13.575 5.430 13.575 13.575
11 4.934
12.336 25.911 4.934 12.336 25.911
26 3.379
8.447 34.359 3.379 8.447 34.359
3 2.984
7.461 41.819 2.984 7.461 41.819
10 2.309
5.774 47.593 2.309 5.774 47.593
12 2.046
5.116 52.709 2.046 5.116 52.709
37 1.764
4.411 57.120 1.764 4.411 57.120
43
35 1.672
4.180 61.300 1.672 4.180 61.300
27 1.533
3.833 65.133 1.533 3.833 65.133
Component
Initial EigenvaluesExtraction Sums of SquaredLoadings
Total
% ofVariance
Cumulative % Total
% ofVariance
Cumulative%
30 1.324
3.311 68.444 1.324 3.311 68.444
8 1.201
3.003 71.446 1.201 3.003 71.446
40 1.024 2.559 74.006 1.024 2.559 74.0061 .969 2.422 76.4272 .865 2.161 78.5884 .792 1.980 80.5695 .726 1.815 82.3846 .718 1.794 84.1787 .580 1.450 85.6289 .557 1.392 87.01913 .529 1.323 88.34214 .510 1.276 89.61815 .453 1.132 90.75016 .442 1.105 91.85417 .368 .919 92.77318 .338 .845 93.61919 .324 .811 94.42920 .273 .683 95.11321 .252 .630 95.74322 .231 .576 96.32023 .222 .554 96.87424 .201 .504 97.37725 .176 .441 97.81828 .163 .409 98.22729 .146 .364 98.59131 .137 .342 98.933
44
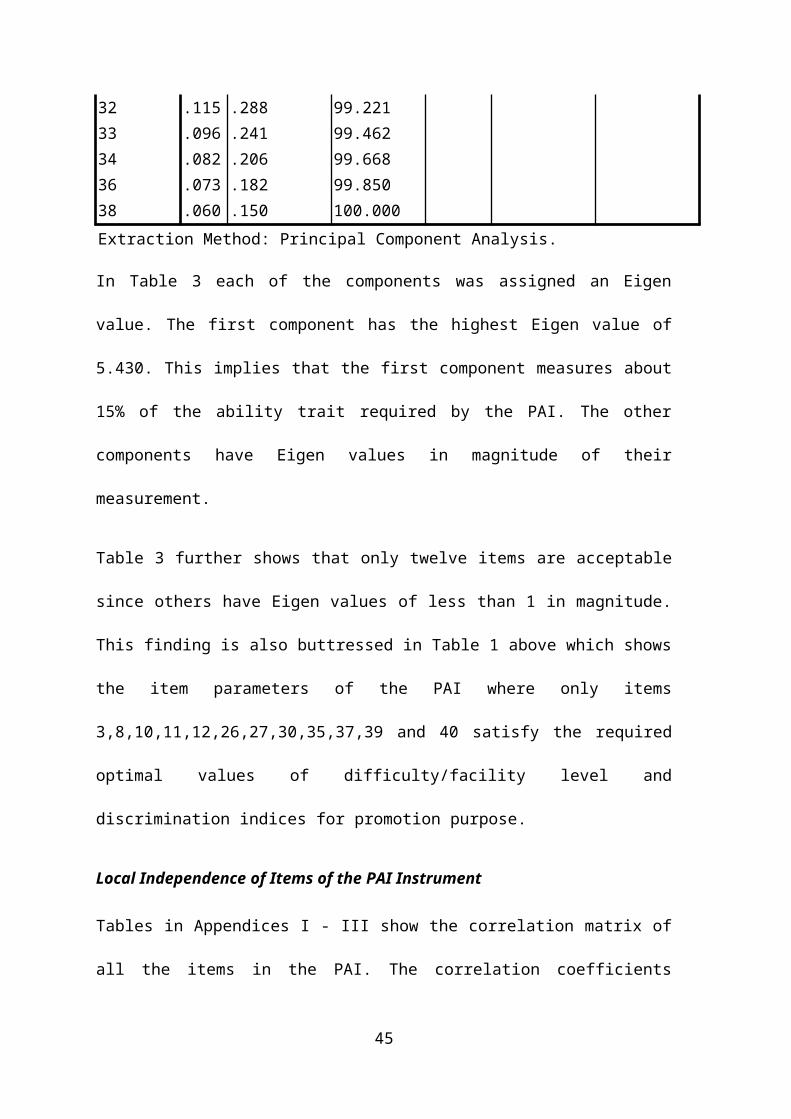
32 .115 .288 99.22133 .096 .241 99.46234 .082 .206 99.66836 .073 .182 99.85038 .060 .150 100.000Extraction Method: Principal Component Analysis.
In Table 3 each of the components was assigned an Eigen
value. The first component has the highest Eigen value of
5.430. This implies that the first component measures about
15% of the ability trait required by the PAI. The other
components have Eigen values in magnitude of their
measurement.
Table 3 further shows that only twelve items are acceptable
since others have Eigen values of less than 1 in magnitude.
This finding is also buttressed in Table 1 above which shows
the item parameters of the PAI where only items
3,8,10,11,12,26,27,30,35,37,39 and 40 satisfy the required
optimal values of difficulty/facility level and
discrimination indices for promotion purpose.
Local Independence of Items of the PAI Instrument
Tables in Appendices I - III show the correlation matrix of
all the items in the PAI. The correlation coefficients
45
obtained reveal that the items are locally independent as
their values are not more than .9. If any of the
correlations are too high (say above .9), it then becomes
necessary to remove one of the variables from the analysis,
as the two variables seem to be measuring the same thing.
Relevance of IRT to performance appraisal instrument in Nigerian
examining bodies
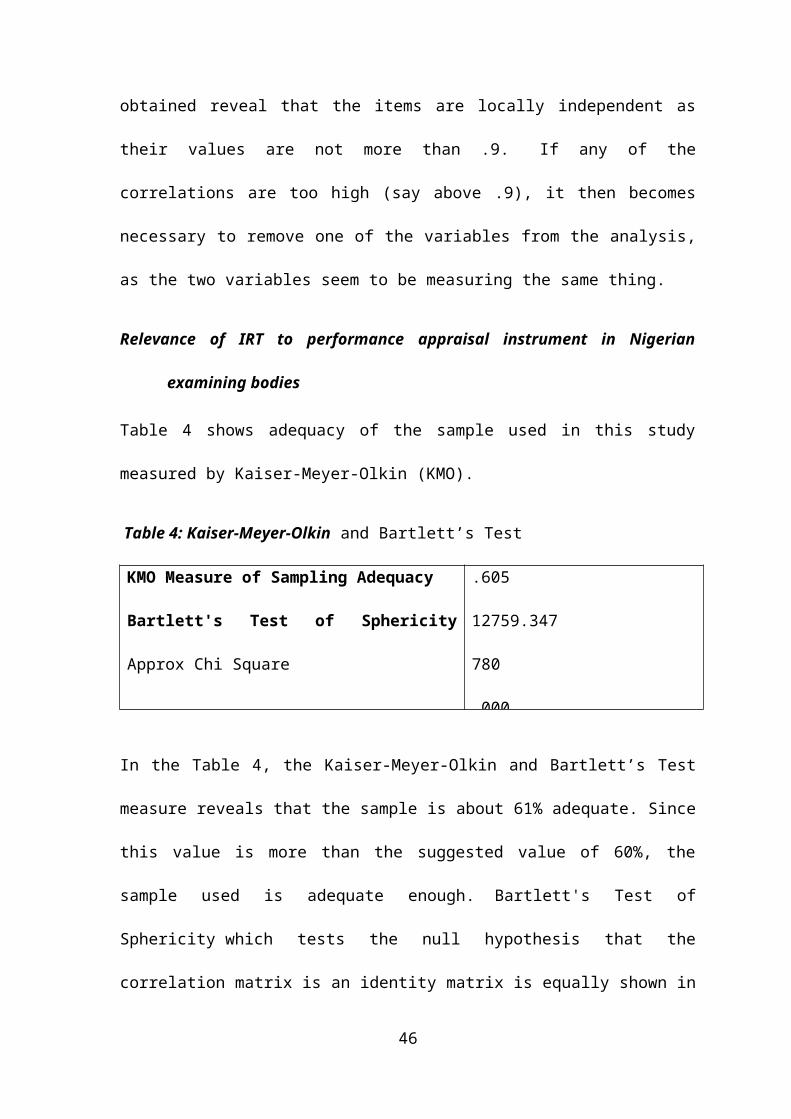
Table 4 shows adequacy of the sample used in this study
measured by Kaiser-Meyer-Olkin (KMO).
Table 4: Kaiser-Meyer-Olkin and Bartlett’s Test
KMO Measure of Sampling Adequacy
Bartlett's Test of Sphericity
Approx Chi Square
.605
12759.347
780
.000
In the Table 4, the Kaiser-Meyer-Olkin and Bartlett’s Test
measure reveals that the sample is about 61% adequate. Since
this value is more than the suggested value of 60%, the
sample used is adequate enough. Bartlett's Test of
Sphericity which tests the null hypothesis that the
correlation matrix is an identity matrix is equally shown in
46
the table. An identity matrix is matrix in which all of the
diagonal elements are 1 and all off diagonal elements are
0. The Bartlett’s test has also revealed that the
assumptions of the item response theory are significantly
relevant to performance appraisal as it has provided basis
for the rejection for the null hypothesis.
Taken together, these tests provide a minimum standard which
should be passed before a principal components analysis (or
a factor analysis) should be conducted.
Discussion of Findings
Referring to research hypothesis above, the idea behind
IRT’s uni-dimensional assumption refers to the objectivity
and validity of an instrument designed with a view to
measure a single trait. This implies that all items in a
measurement instrument must be developed to measure a single
trait. In other words, this is to say that appraisal
instrument and appraisal results seem to be most meaningful
when all the items depend only on a single trait. This
assumption could be studied and tested through factor
analytic study (Ojerinde, Popoola, Ojo & Onyeneho, 2012).
47
Similarly, the assumption of local independence states that
the probability of an employee answering a test item
correctly should not be affected by his or her performance
on any other item in the instrument. This implies that no
systematic source of variation other than the trait under
measurement should influence responses to the test items.
Thus, if the assessment is based on the latent ability of an
employee, his or her performance should not be influenced by
other traits such as inter-personal relationship. In testing
for appropriateness of this assumption, factor analysis
technique was used for this study. Ojerinde et al (2012)
assert that factor analysis technique and tetra-choric
correlation between items with exactly the same ability can
be used to test for the appropriateness of local
independence.
5.0 SUMMARY, CONCLUSIONS AND RECOMMENDATIONS
Summary of Findings
This study has revealed that for any instrument to be used
as promotion examination, such an instrument should be
validated using item response theory. It has equally
revealed that the qualitative approaches to performance48
appraisal in organisations becomes more reliable and
effective when corroborated with such quantitative method as
IRT.
Conclusion
Subjecting performance appraisal instruments to analysis
would not only make the instrument standardized but bring
about objective performance appraisal. It would equally
become useful in matching the ability of employee with task
he or she is to perform as it will result in promoting the
right calibre of staff to fill the existing vacancies. The
efforts therefore made to perform item analysis would never
be a wasted time to an organisation but would rather result
in enhanced productivity of workers and organisational
effectiveness.
Recommendations
Based on the above findings, the following recommendations
are made for more effective performance appraisal which is
aimed at promotion of staff:
1. Item analysis should be carried out periodically in order
to have a pool of standardized items to be used for
49
performance appraisal which is aimed at promotion of
staff.
2. The service of psycho-metricians should be sought where
and when needed to perform item analysis in an
organisation embarking upon performance appraisal.
3. The use of multiple choice items should be more employed
in performance appraisal to ensure objectivity in human
resources assessment procedure.
REFERENCES
Adewuni, S. O. & Taiwo M.B., (2013). NABTEB assessment andcertification process: Item analysis. Paper presentedduring an interactive capacity building workshop organizedfor NABTEB senior staff between Monday 18th March andThursday, 11th April, 2013 at NABTEB Headquarters, IkpobaHill, Benin City.
Armstrong, M. (2009). Armstrong’s handbook of human resource managementpractice. London: Kogan Press
Assessment Reform Group. (2002). Assessment for learning Available at:http://org.edu.cam.ac.uk/CIE.pdf.
Cole G.A. (2002) Management theory and practice. London: Bookpower.
Duong, M. (2004). Introduction to item response theory and itsapplications. Research Development Paper: CEP 900: Pro-seminar inLearning, Technology, and Culture (Fall 2004). London and Philadelphia:Kogan Page.
Lord, F.M. (1986). Application of item response theory to practical testingproblem. Mahwah, NJ: Lawrence Erlbaum Associate, Inc.
50
Nwachukwu, C.C. (2009) Management theory and practice. Onitsha,Nigeria: Africana-First Publishers Plc.
Ojerinde, D., Popoola, K., Ojo, F. & Onyeneho, P. (2012).Introduction to item response theory: Parameter models, estimation andapplication. Lagos, Nigeria; Goshen Printedmedia Limited.
Rust, J. & Golombok, S. (2000). Modern psychometrics: The science ofpsychological assessment (2nd ed). London: Rutledge.
Scherbaum, C.A. (2008). Applications of item response theory to personnel assessment: MAPAC Talk. Baruch College, City University of New York
Society for Human Resources Management (SHRM). (2010). Performance assessment in organisations. Sage Publications.
Selden, S.C., Ingraham, P. W., & Jacobson, W. (2001). Human resource practices in state government: Findings from a national survey. Public Administration Review,
61(5), 598-607.
Tziner, A. & Kopelman, R. E. (2002). Is there a preferredperformance rating format? A non- psychometric perspective. Applied Psychology: An International Review,51,479-503.
Umoinyang, C.O., Asim, A.E., Akwa , A,M. & Bassey, S.W.(2004). Principles & techniques of educational assessment & evaluation.Calabar: Helino Publication.
Van Scotter, J. R. & Motowidlo, S. J. (1996).Interpersonal facilitation and job dedication asseparate facets of contextual performance. Journal of Applied
Psychology, 81, 525- 531.
Van Scotter, J.R., Motowidlo, S.J., & Cross, T.C. (2000).Effects of task performance and contextual performanceon systemic rewards. Journal of Applied Psychology, 85,526-535.
51

Wikipedia. (2011). Psychometrics. Retrieved on April 24, 2013 from http://www.wikipedia.com
Wikipedia (2013). Classical Test Theory. Retrieved from
http://www.wikipedia.com on April 24, 2013.
52


