Embed Size (px)
Citation preview
1 IntroductionThe ability to perceptually `group' together different parts of the same object, and tobe able to distinguish this `grouping' from other objects, is fundamental to any reasonablysophisticated visual system. It is clear, from the very fact that visually reliant animalssuccessfully navigate through the world, that many species are capable of some form ofvisual perceptual grouping, but it is not clear from such observations what informationthey are using to accomplish this. As the Gestalt psychologists pointed out (Koffka 1935,for example), there are many sources of grouping information available. Objects aretypically composed of parts that are close together (proximity), similar in colour andshape (similarity), follow smooth contours (good continuation), and they usually move inunison, at least on a large scale (common fate). Conversely, elements which differ in any ofthese dimensions are usually parts of different objects. Except in the case of camouflage(in which conflicting grouping information is provided), grouping cues almost alwaysprovide congruent information, so it is possible that not all visually reliant animals useall such sources of grouping information.(1) Since scene segmentation is a fundamentalaspect of vision, it seems likely that information about which animals use which groupingcues will help us to understand the evolution and ecology of visual mechanisms, as wellas being a means by which we may be able to tease apart mechanisms which may appearunitary in human perception.
Kurylo et al (1997) recently showed that rats (Rattus norvegicus) are sensitive toglobal orientation defined by the perceptual-grouping principle of proximity, but not toorientation defined by element alignment (a version of good continuation). The rats
Perceptual grouping in two visually reliant species:Humans (Homo sapiens) and Australian sea lions(Neophoca cinerea)
Perception, 2001, volume 30, pages 1093 ^ 1106
Darren Burke, Paul Everingham, Tracey Rogersô, Melinda Hinton, Sophie Hall-AsplandôDepartment of Psychology, University of Wollongong, Wollongong, NSW 2522, Australia; ô AustralianMarine Mammal Research Centre, Taronga Zoo/Sydney University, Mosman, NSW 2088, AustraliaReceived 24 November 2000, in revised form 20 May 2001
Abstract. Kurylo, van Nest, and Knepper (1997 Journal of Comparative Psychology 111 126 ^ 134)have recently shown that hooded rats are able to judge the global orientation of an array ofelements if orientation is signalled by the perceptual-grouping principle of proximity, but not ifit is signalled by element alignment. Using a procedure designed to overcome some potentialproblems with the experiment of Kurylo et al, we found the same distinction in the perceptualprocessing of Australian sea lions. The sea lions were able to judge the orientation of arrayscontaining strong proximity and similarity information, but performed at chance levels judgingarrays in which element alignment signalled global orientation. Human subjects were able tojudge all three pattern types quickly and accurately. This is strong evidence of a qualitativedistinction in the way in which perceptual grouping operates in humans and the non-humanspecies tested. Whether this distinction is a consequence of evolutionary or experiential factorsis a question for future research, but the mere fact of a qualitative difference holds importantimplications for our understanding of perceptual grouping.
DOI:10.1068/p3239
(1) Since camouflage generally does involve providing conflicting grouping information, and sincegrouping information is usually redundant in other situations, animals which prey on camouflagedspecies may face selection pressure to rely less strongly on the cue that is providing the conflictinginformation. This may render them better able to detect the prey species without sacrificing theirgeneral ability to perceptually group the visual world.
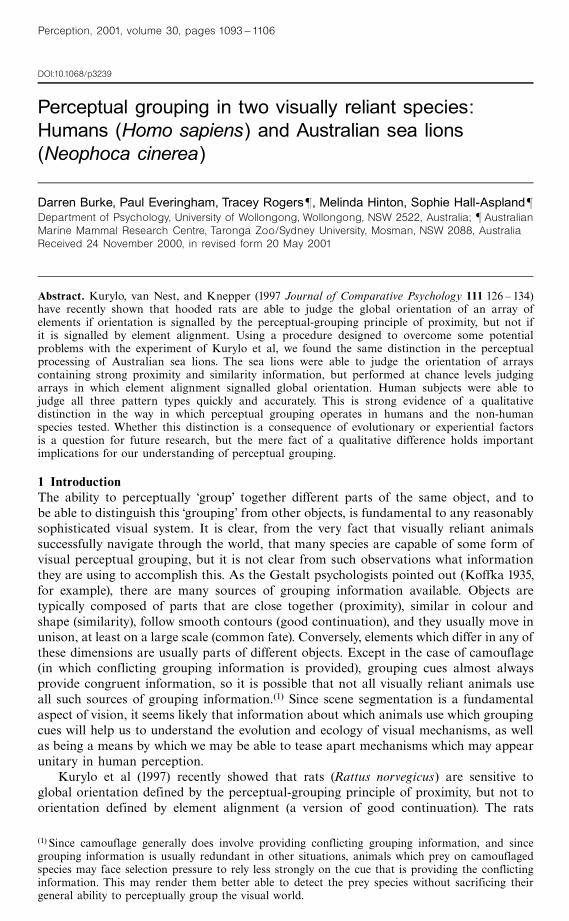
were trained to discriminate vertical from horizontal (using arrays of three horizontaland three vertical lines), and were then tested for the degree to which this trainingtransferred to stimuli in which orientation was defined exclusively by the arrangementof small, square elements presented in an array. When we view such arrays, we see themas vertical if the elements are aligned vertically but not horizontally (this is alignmentösee figure 1a) or if they are closer together vertically than they are horizontally (this isproximityösee figure 1b). The surprising conclusion of the Kurylo et al experimentis that rats also see the array defined by proximity as vertical, but are unable to useelement alignment as a cue to orientation.
This suggests that there may be a fundamental difference in the way in whichperceptual grouping operates in the human and rat visual systems, even within group-ing mechanisms that are based on the spatial arrangement of the elements. Of course,such a conclusion could only be convincingly drawn if other differences between thesubjects used in these experiments were ruled out as possible causes of the perceptualdifference. As discussed below, differences in visual acuity between rats and humanscan explain the results of Kurylo et al, but there are also other differences which areprobably important. For example, the visual environments of the human subjects andthe laboratory rats were almost certainly very different (laboratory rats live in muchless visually rich environments), and this may make (or have made, developmentally)an important difference to the kinds of grouping cues they are sensitive to.
A qualitative difference like that identified by Kurylo et al is the strongest possibleevidence that there is an important disparity between the perceptual processes of twospecies, and is, therefore, worthy of thorough investigation. If such a distinction is valid,it raises a range of questions about how evolution may have produced the difference,
(a) (b) (c)
Figure 1. Vertical versions of the three grouping principles tested in the current experiments,and low-pass spatial-frequency-filtered images of them. (a) Vertical by alignment; (b) vertical byproximity; (c) vertical by similarity (achieved by rotating elements). The low-pass filtering of thestimuli produces a clear vertical signal only in the proximity condition (see text for details).
1094 D Burke, P Everingham, T Rogers, and coworkers
what mechanisms underlie it, and what implications it holds for other possible differencesbetween the species. It is because of the potential importance of such qualitative differ-ences that we decided to compare perceptual grouping in humans and in anothernon-human, but visually reliant, species. Our primary aims were to extend the speciesused in such comparisons (particularly to another that depends on vision) whileattempting to rule out some potentially less interesting explanations of the Kurylo et alfindings. If we are to use Kurylo et al's results to guide investigations of comparativeperception, then it is important to be sure that the difference they observed is actuallycaused by a difference in some higher-order perceptual-grouping mechanism and isnot a relatively uninteresting consequence of the way in which the animals were trained,or of the particular stimuli used in the experiment. Although they carefully manipu-lated the strength of the grouping cues, ruling out some possible problems, thereremains a somewhat less obvious competing explanation, which may compromise thevalidity of their results.
One explanation of the results of Kurylo et al which they do not fully explore is thepossibility that the rats had rather poor acuity, and that they therefore saw the testpatterns much less sharply, than do human observers. The usual way to compare acuityacross species is in terms of contrast sensitivity functionsöplots of the lowest contrastat which arrays of (usually) vertical gratings of a range of spatial frequencies can bejust detected. Humans are most sensitive to gratings with a spatial frequency ofbetween 1 and 5 cycles degÿ1, but at reasonable contrasts can detect gratings over amuch wider range (between about 0.1 and 40 cycles degÿ1). As Kurylo et al note, hoodedrats, like those used in their study, cannot see gratings above about 1.5 cycles degÿ1, nomatter how high their contrast, and are more sensitive to spatial frequencies below thosethat humans can detect (Birch and Jacobs 1979; Legg 1984). This means that, if we areto estimate the information available to a rat in a visual scene, we need to remove thehigh-spatial-frequency information from it by using a low-pass spatial-frequency filterof the image. Such a technique will not allow us to see the scene as the rat does, since,for one thing, the rat is more sensitive to low-frequency information than are we,but it will at least remove from the image the information that the rat does not haveavailable to it.
As is shown in figure 1, filtering out the high-spatial-frequency information fromvertical stimuli defined only by proximity produces clear vertical lines,(2) but removingthe same high-frequency information from patterns in which verticality is defined byalignment produces a much weaker vertical signal. The difference between the low-pass filters of the patterns in figure 1 is, in fact, much less dramatic than would be asimilar filtering of the patterns used by Kurylo et al, since our alignment patternmaintains the vertical spacing between the elements, whereas they varied the verticalspacing randomly in the alignment condition. This had the effect of creating somelarge vertical gaps between elements in the alignment condition, which would reducethe strength of the low-frequency vertical signal. A simple blurring of the examplepatterns they provided (their page 129) makes this point obvious.
It seems at least possible from these considerations that the rats accurately judgedthe orientation of the proximity patterns, but not of the alignment patterns, because,to them, only the former strongly resembled the training stimuli. Indirect support forthe possibility that this underlies the perceptual discrepancy discovered by Kuryloet al is provided by another recent experiment using very similar stimuli with humanobservers (Kurylo 1997). In this experiment Kurylo discovered that the time needed tojudge the orientation of a pattern was longer for patterns in which orientation was(2) Ginsburg (1986) has argued, in fact, that information in low-spatial-frequency channels issufficient to explain grouping by proximity in humans (along with a host of other perceptualeffects). Only the proximity patterns can be discriminated in this way in the current experiments.
Perceptual grouping in humans and sea lions 1095
defined by alignment than when it was defined by proximity. Kurylo suggests that thisdifference could be due to judgments based on alignment being more computationallyintensive than those based on proximity, but, again, differences in the usefulness of low-frequency information may be sufficient to explain the difference. If the proximity (butnot the alignment) stimuli can be discriminated on the basis of low-spatial-frequencyinformation, then we might expect them to be judged more quickly because informationin the magnocellular pathway is sufficient to discriminate them, and the magnocellularpathway responds more quickly than the parvocellular pathway (Livingstone and Hubel1987, for example).
Similarly, if a rat has available to it only low-frequency information, then it is notsurprising to discover that it is much better able to judge the orientation of the patternsthat contain strong, low-frequency orientation information than of those that do not.In fact, we might expect the discrepancy between grouping on the basis of proximityand alignment discovered by Kurylo et al (1997) even if rats had no mechanism at allfor grouping together discrete elements, or if they had been trained in such a way thatthey did not engage such a mechanism when exposed to the test patterns. It seems to uspossible that training subjects with just one exemplar of vertical and one of horizontalöas Kurylo et al (1997) didömay be insufficient to ensure that they are using the c̀oncept'of verticality and/or horizontality to perform the discrimination. If they are not, thenthey will be able to successfully discriminate test stimuli which are broadly similar tothe training exemplars (like the proximity patterns), but they may find discrimina-tions between less obviously similar stimuli (like the alignment patterns) more difficult.Perhaps if the training had encouraged the rats to examine the patterns for any evidenceof global orientation, they may have been able to perform above chance on the align-ment test patterns. We indirectly explore this possibility in the current experiments.
As was outlined earlier, the experiments reported here are designed to examine inmore detail the interesting possibility that there are species differences in the abilityto use perceptual-grouping principles to segregate the visual world. We decided toexamine whether the same distinction is evident in the way in which two highly visuallyreliant species use perceptual-grouping information. The non-human species (Australiansea lions) were chosen primarily because they are representatives of highly visually reliantmammals, and because they almost certainly have quite good in-air visual acuity (seebelow). Of course, this species is also amphibious, and it has also been selected as anexperimental subject so that in later studies the effect that this may have had on thefunctioning of their visual system could be examined, but this aspect is not relevant to therationale of the current study.We are not predicting that adaptation to seeing underwaterwill have made a difference to the way in which these animals use grouping information.
We took a number of steps in an attempt to overcome the potential problemswith the study of Kurylo et al (1997) discussed above:(i) We selected a non-human species which depends strongly on vision. Australian sealions are active hunters which locate and capture underwater prey using vision (Bonner1994). There are no data available for this species, but Steller sea lions (Eumetopiasjubatus; Schusterman 1981) and California sea lions (Zalophus californianus: Schustermanand Balliet 1971) have similar in-air acuity, which is comparable to that of cats. Sincethese species are the closest living relatives of Australian sea lions there is no reasonto expect our subjects' acuity to be substantially different from theirs.(ii) We trained the sea lions with a range of horizontal and vertical exemplars. Thiswas designed to encourage them to use the c̀oncept' of vertical and/or horizontal,rather than learning particular exemplars [Kurylo et al (1997) used one of each] inorder to give the animals the best chance of demonstrating sensitivity to the groupingprinciples they were presented withöin other words, we wanted them to respond onthe basis of the stimulus containing any evidence of verticality and/or horizontality.
1096 D Burke, P Everingham, T Rogers, and coworkers
(iii) We tried to partially control for the effects of differential acuity by including agrouping by similarity condition, in which the low-pass orientation information is nomore useful than it is in the alignment condition. If the animals can group using sucha similarity cue, but are unable to use the alignment information, then this cannotbe a simple consequence of poor acuity. An ideal control for this possibility would havebeen to construct grouping patterns from elements which contain information at onlya single spatial frequency (or in a very narrow band), so that a low-pass filter willremove all of the orientation information, and so be of no use for performing the task.We did not do this in this study for two reasons. First, producing such patterns foruse in the home enclosure of the animals was logistically difficult, since we could not besure that the stimuli produced signals that were restricted to a single band of frequenciesusing the computers and monitors we had available to us. Second, there is no preciseinformation about the acuity of the species we used, and the two sea lion subjects mayhave differed somewhat in acuity, so to implement this kind of control we would havehad to measure the acuity of each of the subjects prior to producing the patterns.
2 Experiment 1: Humans (Homo sapiens)Experiment 1 was designed as a baseline against which we could compare the perfor-mance of the non-human subjects. The main function of this experiment was todemonstrate that the stimulus parameters we chose led to reliable percepts of horizontaland vertical, and that our manipulation of cue strength succeeded in producing patternswhich did actually differ in this way.
Alignment and proximity were used in this experiment because they were the cuesused by Kurylo et al (1997). The results of Kurylo et al are particularly surprisingbecause both of these grouping cues rely on the spatial arrangement of the elements toconvey orientation information. It would perhaps have been less surprising, and lessimportant, if they had discovered that rats were sensitive to grouping informationprovided by, for example, shape or luminance similarity, but not by spatial arrange-ments. In such a case the grouping information would be carried in different visualmodalities, and differential sensitivities to luminance and spatial position between thespecies could easily account for the results.
As was discussed earlier, the current experiment contains a condition in whichoverall orientation is defined by element similarity. Element similarity was manipulatedby changing the orientation of the square elements (see figure 1c). This has twoadvantages in the current context. First, it is a similarity cue which is carried by high-spatial-frequency information, so a low-pass filter of the image provides no globalorientation cue, as discussed previously. Second, element orientation is, in a sense, agrouping cue defined by the spatial arrangement of the elements, in common withproximity and alignment. It is true that the grouping cue is not related to spatiallocation in this case, but the elements are all similar, as they are in the alignment andproximity cases, which they would not be in other, more typical, manipulations ofsimilarity.
2.1 Methods2.1.1 Subjects. Thirty undergraduate psychology students from the University ofWollongong served as subjects in the experiment for nominal course credit. There weretwelve males and eighteen females. All subjects had normal or corrected-to-normalvision.
2.1.2 Apparatus. The experiment was run in a laboratory on a PowerMac 6200. Claris-Works drawing was used to generate the pictures used. RSVP (Williams and Tarr, nodate) was used to present the stimuli to the subjects and record their reaction timesand errors.
Perceptual grouping in humans and sea lions 1097
2.1.3 Stimuli. Subjects were presented with the grouping stimuli either as pairs (onehorizontal by grouping cue, the other vertical) or individually. These will be referred toas the dual-picture phase and the single-picture phase, respectively. In the dual-picturephase subjects were required to judge which of the patterns was vertical (on the leftor the right of the screen), and in the single-picture phase they were required to judgewhether the pattern was vertical or horizontal. Within each of these presentationphases, there were six different stimulus types. There were two levels of each of thethree grouping cues [alignment, similarity (rotation), and proximity]; one was a `strong'version of the cue and one a `weak' version. Pilot testing was used to determineroughly equivalent cue strengths across the different kinds of cues. We selected valuesthat produced, in the `strong' case, a fairly obvious percept of global orientation, andanother `weak' which produced a percept of global orientation that was less obvious,and generally took some time to detect. The precise parameters used to produce thestimuli are described below.
In the dual-picture phase of the experiment, the elements were 5 mm65 mmsquares. Before imposing a grouping cue on the elements, they were equally spaced8 mm apart (perturbations to this arrangement produced the grouping information, asdescribed below). In the dual-picture phase the outside edges of the two stimuli wereoccluded by a black mask with circular apertures 65 mm in diameter. The centres ofthe stimuli were separated horizontally by 118 mm. The two arrays contained elementsthat were arranged so that one array had the grouping cue signalling vertical and theother signalled horizontal. Grouping cue type and strength were always paired, sothat, for example, a weak proximity cue to vertical was always paired with a weakproximity cue to horizontal.
In the single-picture phase there was no occluding mask (the stimulus was square),and the size of the stimulus was 150% larger than the corresponding stimulus in thedual-picture phase. This was the same size and shape as the stimuli presented to thesea lions, except that they were presented with the stimuli as pairs (one on each oftwo monitors). We could not easily measure reaction time for the humans with stimulipresented on two monitors, mimicking the conditions for the sea lions, so we ran thesetwo versions of the task with our human subjects in order to investigate whether therewere effects which may have been specific to the size and shape of the stimuli used,or to presenting the stimuli as pairs.
For each of the stimulus arrangements used, measurements are reported for thedual-picture phase stimuli. The single-picture phase versions are simply 150% larger inall measurements (except rotation). The head position of the subjects was not con-trolled (since it could not be for the sea lions), but viewing distances were typically inthe range of 50 ^ 60 cm, at which 10 mm is approximately 1 deg of visual angle.Proximity metrics. In the strong vertical condition the vertical spacing of the elementsremained at 8 mm and the horizontal spacing was increased to 13.5 mm. The oppositearrangement was used for the strong horizontal condition. In the weak vertical con-dition the vertical spacing was 8 mm and the horizontal spacing was 11.25 mm. Seefigure 1 for an example.Alignment metrics. In order to create a stimulus which was vertical by alignmentinformation, all of the elements in columns 1 and 5 were moved upwards (every elementin the column was moved the same amount), and every element in columns 3 and 7were moved downwards. Elements in columns 2, 4, 6, and 8 were not moved. This resultedin a stimulus in which the elements were aligned vertically but not horizontally. Seefigure 1 for an example. In the strong version of the cue the elements were moved4.5 mm and in the weak version they were moved 1 mm. In the single-picture phase,this manipulation resulted in a stimulus which had a smooth outline in one dimension(in the orientation being cued) and an irregular outline in the non-cued orientation.
1098 D Burke, P Everingham, T Rogers, and coworkers
To prevent subjects from using this cue to make the orientation judgment (particularly thesea lion subjects who had stimuli like those in the single-picture phase), several elementswere randomly removed from the edges with smooth outlines, to make them irregular.Rotation metrics. The elements in these stimuli were equally spaced (8 mm), but eachelement in every second column was rotated 258 to the right for the strong vertical groupingcue, or 38 to the right for the weak vertical grouping cue. See figure 1 for an example.
2.2 ProcedureEach subject was tested individually. All subjects were exposed to all conditions. Generalinstructions were given to each subject verbally and written instructions were given onthe screen prior to commencement of trials.
Subjects were asked to attend to a small, centralised fixation cross before each trial.The trials were self-paced and subjects proceeded by pressing the space bar. The stim-uli then appeared and persevered until subjects made their choice or failed to make achoice within 12 s. In the dual-picture phase subjects were required to indicate theside of the screen that contained the vertical configuration. If they perceived the circleon the right side of the screen as containing the vertical pattern, they pressed the `p' keyand if it was on the left they pressed the `q' key. As mentioned previously, the stimulustypes were presented as pairs with vertical and horizontal patterns of the same typeappearing together. The side on which the vertical pattern appeared was counter-balanced for each stimulus type.
In the single-picture phase subjects had to decide whether the pattern presentedwas vertical or horizontal. The `v' key indicated that the picture was vertical and the`h' key indicated a horizontal pattern. Subjects were asked to make their responses asquickly and accurately as possible.
The dual-picture phase consisted of a block of 24 trials. There were two presentationsof each stimulus pairing in which the stimulus on the left was vertical and two in whichthe stimulus on the right was vertical. The order of presentation was randomised foreach subject. The single-picture phase consisted of a block of 24 trials (four presentationsof each stimulus, twice vertically and twice horizontally), also in random order. Theorder of the two presentation phases (single picture and dual picture) was counter-balanced across subjects.
2.3 ResultsThe measure of each subject's reaction time was obtained by calculating the meanreaction time for all correct responses in a given stimulus condition for that subject. Thesemean reaction times were analysed with two 2 (cue strength)63 (grouping principle)repeated-measures factorial ANOVAs, one for the dual-picture phase and one for thesingle-picture phase. Errors were also recorded and total errors for each subject ina given condition (out of a possible 4) were analysed in two similar 263 repeated-measures ANOVAs.
As can be seen by comparing figures 2a and 2c, and 2b and 2d, the pattern ofresults was broadly similar in the dual-picture phase and in the single-picture phase.In the analysis of the reaction time data from the single-picture phase there was asignificant main effect of cue strength (F1 29 � 15:47, p � 0:0005), but no main effectof grouping cue (F2 58 � 2:38, p � 0:10), and no interaction (F2 58 � 1:63, p � 0:21).The error data from the single-picture phase revealed a significant main effect of cuestrength (F1 29 � 19:00, p � 0:0001), and a main effect of grouping cue (F2 58 � 10:45,p � 0:0001), but no interaction (F2 58 � 1:04, p � 0:37). So, in the single-picture phasethe manipulation of difficulty appears to have been successful. The strong cues aredetected more quickly and more accurately than the weak cues. Despite attempts toequalise the relative difficulty of the cues within each of the strengths, some differencesbetween them did emerge.
,
, ,
, ,
,
Perceptual grouping in humans and sea lions 1099
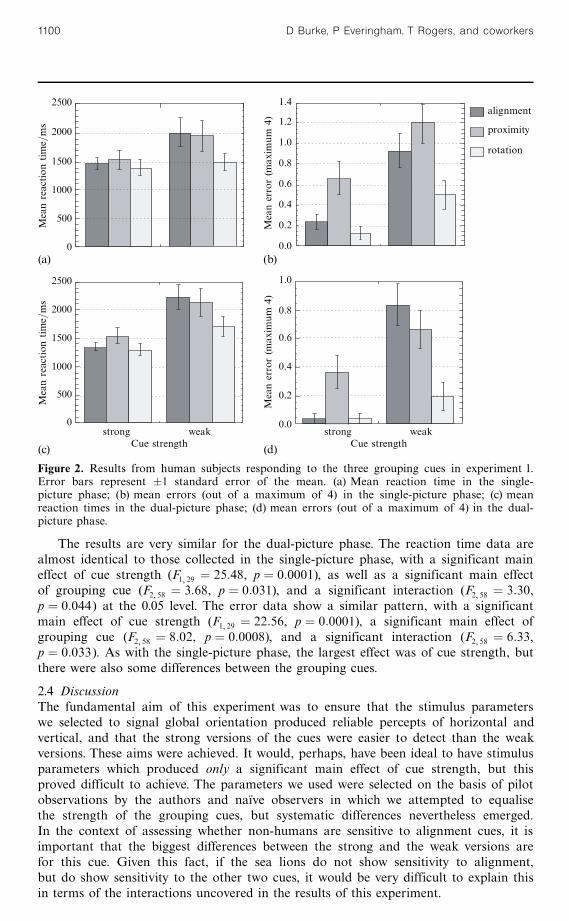
The results are very similar for the dual-picture phase. The reaction time data arealmost identical to those collected in the single-picture phase, with a significant maineffect of cue strength (F1 29 � 25:48, p � 0:0001), as well as a significant main effectof grouping cue (F2 58 � 3:68, p � 0:031), and a significant interaction (F2 58 � 3:30,p � 0:044) at the 0.05 level. The error data show a similar pattern, with a significantmain effect of cue strength (F1 29 � 22:56, p � 0:0001), a significant main effect ofgrouping cue (F2 58 � 8:02, p � 0:0008), and a significant interaction (F2 58 � 6:33,p � 0:033). As with the single-picture phase, the largest effect was of cue strength, butthere were also some differences between the grouping cues.
2.4 DiscussionThe fundamental aim of this experiment was to ensure that the stimulus parameterswe selected to signal global orientation produced reliable percepts of horizontal andvertical, and that the strong versions of the cues were easier to detect than the weakversions. These aims were achieved. It would, perhaps, have been ideal to have stimulusparameters which produced only a significant main effect of cue strength, but thisproved difficult to achieve. The parameters we used were selected on the basis of pilotobservations by the authors and na|« ve observers in which we attempted to equalisethe strength of the grouping cues, but systematic differences nevertheless emerged.In the context of assessing whether non-humans are sensitive to alignment cues, it isimportant that the biggest differences between the strong and the weak versions arefor this cue. Given this fact, if the sea lions do not show sensitivity to alignment,but do show sensitivity to the other two cues, it would be very difficult to explain thisin terms of the interactions uncovered in the results of this experiment.
,
, ,
,
, ,
alignment
proximity
rotation
2500
2000
1500
1000
500
0
2500
2000
1500
1000
500
0
Meanreaction
time=ms
Meanreaction
time=ms
1.4
1.2
1.0
0.8
0.6
0.4
0.2
0.0
1.0
0.8
0.6
0.4
0.2
0.0
Meanerror(m
axim
um4)
Meanerror(m
axim
um4)
strong weak strong weakCue strength Cue strength
(a) (b)
(c) (d)
Figure 2. Results from human subjects responding to the three grouping cues in experiment 1.Error bars represent �1 standard error of the mean. (a) Mean reaction time in the single-picture phase; (b) mean errors (out of a maximum of 4) in the single-picture phase; (c) meanreaction times in the dual-picture phase; (d) mean errors (out of a maximum of 4) in the dual-picture phase.
1100 D Burke, P Everingham, T Rogers, and coworkers
In terms of comparing the results of the sea lions and the humans, it is alsoimportant that the results from the dual-picture phase and the single-picture phase areso similar. This is despite the fact that in the single-picture phase the stimuli were150% larger, they were not surrounded by circular masks, and they had to be judged inisolation. This suggests that the prime determinant of performance in these tasks isthe strength and nature of the grouping cue in question, rather than the way in whichit is presented, or the exact nature of the decision to be made. This is obviouslyimportant in the current study because there are necessarily differences between theway in which the sea lions and the humans are exposed to the stimuli, and may wellbe differences in the nature of the decision they make. Although the sea lions will beexposed to both a vertical and a horizontal pattern on each trial, as in the dual-picturephase for the humans, they may not base their responses on a comparison betweenthe stimuli. It is encouraging, therefore, to discover that the responses of the humansubject were not substantially altered by the manner in which the stimuli were presented(paired or in isolation).
3 Experiment 2: Australian sea lions (Neophoca cinerea)As explained previously, the primary aim of the current research is to further explorethe finding of Kurylo et al (1997) that rats are sensitive to orientation informationprovided by the perceptual-grouping principle of proximity, but are not sensitive to anorientation signal carried by alignment information. The current study is an attemptto test whether the same distinction is true for a much more visually reliant species,while attempting to rule out ways by which a behavioural difference may emerge inthe absence of a genuine qualitative dichotomy in their use of grouping information.
3.1 Method3.1.1 Subjects.The subjects were two mature male Australian sea lions (Neophoca cinerea),Kotick and Orson, who were housed at Taronga Zoo in Sydney. They have been incaptivity, and have been trained to perform simple husbandry behaviours since theywere pups. These behaviours involve them responding to verbal and visual signals toenable them to be moved between pools, inspected by veterinarians, etc.
3.1.2 Stimuli. The stimuli used in the test phase of this experiment were the same asthose used in the single-picture phase of experiment 1, except that the sea lions weresimultaneously presented with a horizontal and a vertical version of the cue (as in thedual-picture phase in experiment 1) on two separate monitors. In addition to the twostrengths of each of the three grouping cues, the sea lions were also tested with a novelexemplar of the kind of stimuli used in the training phase. This served as a baselinemeasure of their performance on new patterns which contained real vertical and hori-zontal lines (which did not require sensitivity to any form of grouping information).
In the training phase the sea lions were taught the vertical/horizontal discriminationusing 20 different exemplars of horizontal and vertical. The vertical exemplars usedare shown in figure 3. The training stimuli were designed to be sufficiently complexthat they would encourage the sea lions to examine them for evidence of verticality orhorizontality. This was an attempt to give the sea lions the best chance of demonstrat-ing their possible percepts of horizontal and vertical in the test patterns, since theywere accustomed to responding to stimuli which differed in many ways except thatone always contained a vertical line (or lines) and the other a horizontal line (or lines).
3.1.3 Apparatus. The experiment was conducted in a hallway which was part of theindoor facility adjacent to the sea lions' home pools at Taronga Zoo. The apparatusconsisted of two IBM-compatible 486 PCs mounted behind a board with two screen-size (14-inch) Plexiglass windows installed. The stimuli were presented with PCXshowÕ.
Perceptual grouping in humans and sea lions 1101
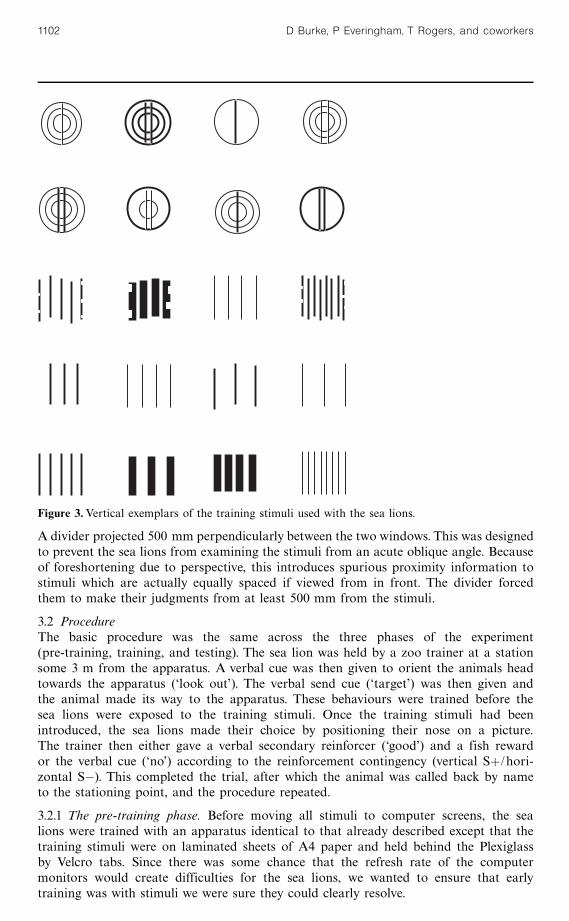
A divider projected 500 mm perpendicularly between the two windows. This was designedto prevent the sea lions from examining the stimuli from an acute oblique angle. Becauseof foreshortening due to perspective, this introduces spurious proximity information tostimuli which are actually equally spaced if viewed from in front. The divider forcedthem to make their judgments from at least 500 mm from the stimuli.
3.2 ProcedureThe basic procedure was the same across the three phases of the experiment(pre-training, training, and testing). The sea lion was held by a zoo trainer at a stationsome 3 m from the apparatus. A verbal cue was then given to orient the animals headtowards the apparatus (`look out'). The verbal send cue (`target') was then given andthe animal made its way to the apparatus. These behaviours were trained before thesea lions were exposed to the training stimuli. Once the training stimuli had beenintroduced, the sea lions made their choice by positioning their nose on a picture.The trainer then either gave a verbal secondary reinforcer (`good') and a fish rewardor the verbal cue (`no') according to the reinforcement contingency (vertical S�/hori-zontal Sÿ). This completed the trial, after which the animal was called back by nameto the stationing point, and the procedure repeated.
3.2.1 The pre-training phase. Before moving all stimuli to computer screens, the sealions were trained with an apparatus identical to that already described except that thetraining stimuli were on laminated sheets of A4 paper and held behind the Plexiglassby Velcro tabs. Since there was some chance that the refresh rate of the computermonitors would create difficulties for the sea lions, we wanted to ensure that earlytraining was with stimuli we were sure they could clearly resolve.
Figure 3.Vertical exemplars of the training stimuli used with the sea lions.
1102 D Burke, P Everingham, T Rogers, and coworkers
Which 12 of the 20 training stimuli were to be used in a training session wasdecided randomly. Whether the S� (vertical) was on the left or the right side for a giventrial was determined by following Gellerman's (1933) schedule. Training continued in thisphase until both sea lions reached a criterion of 83% correct (10=12) for four consecutivesessions.
3.2.2 The training phase. The training phase involved continuing to train the sea lionsto discriminate between vertical (S�) and horizontal (Sÿ), with the stimuli shown infigure 3, but with the stimuli presented on computer monitors. A training sessionconsisted of the presentation of three different preprogrammed blocks of twelve trials.There were usually two, but occasionally three training sessions per day.
Because the stimuli were presented on two different computers, but needed to bematched (a horizontal of one sort on the left monitor had to coincide with a vertical ofthe same sort on the other monitor), it was not possible to use a new random orderof stimuli in each session. Instead, fifteen different 12-stimulus sequences (and theiropposites, so that horizontal and vertical versions could be matched) were created, byrandomly selecting 12 of the 20 training stimuli, and then randomly selecting whether thestimulus would be horizontal or vertical. Before each training session, the three sequencesto be used were selected randomly. Each 12-trial sequence on a given computer consistedof 6 S� and 6 Sÿ stimuli, so that horizontal and vertical were counterbalanced for side ofappearance.
3.2.3 The test phase. In the test phase, the 7 test stimuli were interspersed randomlyinto 7 new sets of trials (and their opposites). Each of the new sets of trials contained4 test stimuli (and therefore 8 training stimuli). Test stimuli were reinforced nondiffer-entially (the sea lions received a `good' and a fish regardless of which stimulus theychose). This was to ensure that the sea lions could not learn which of the test stimuliwere correct. We were interested in their perception of the test patterns, not in theirability to learn to respond to the vertical pattern on the basis of differential reinforce-ment. This aim could also have been met by not rewarding the sea lions, irrespectiveof the test stimulus chosen (testing during extinction, effectively), but, since male sealions are potentially dangerous when they are frustrated, we decided not to do this.
Results on the test stimuli were included in the analysis only if performance onthe non-test stimuli in that session was at 75% or above (6 out of 8). This was toensure that we included data only from sessions in which the sea lions were properlymotivated and attentive. Testing ended when each animal had been exposed to each ofthe test stimuli 20 times (after substandard sessions were excluded).
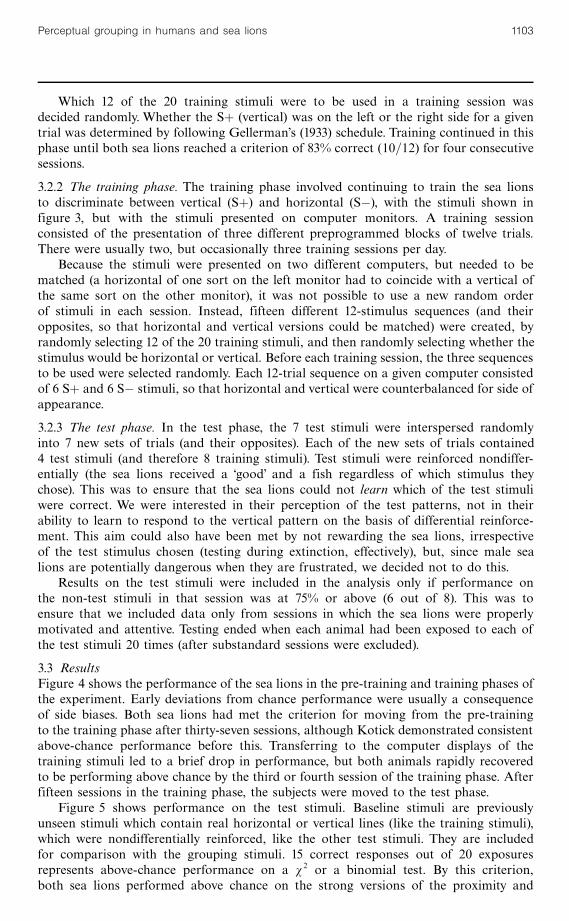
3.3 ResultsFigure 4 shows the performance of the sea lions in the pre-training and training phases ofthe experiment. Early deviations from chance performance were usually a consequenceof side biases. Both sea lions had met the criterion for moving from the pre-trainingto the training phase after thirty-seven sessions, although Kotick demonstrated consistentabove-chance performance before this. Transferring to the computer displays of thetraining stimuli led to a brief drop in performance, but both animals rapidly recoveredto be performing above chance by the third or fourth session of the training phase. Afterfifteen sessions in the training phase, the subjects were moved to the test phase.
Figure 5 shows performance on the test stimuli. Baseline stimuli are previouslyunseen stimuli which contain real horizontal or vertical lines (like the training stimuli),which were nondifferentially reinforced, like the other test stimuli. They are includedfor comparison with the grouping stimuli. 15 correct responses out of 20 exposuresrepresents above-chance performance on a w 2 or a binomial test. By this criterion,both sea lions performed above chance on the strong versions of the proximity and
Perceptual grouping in humans and sea lions 1103
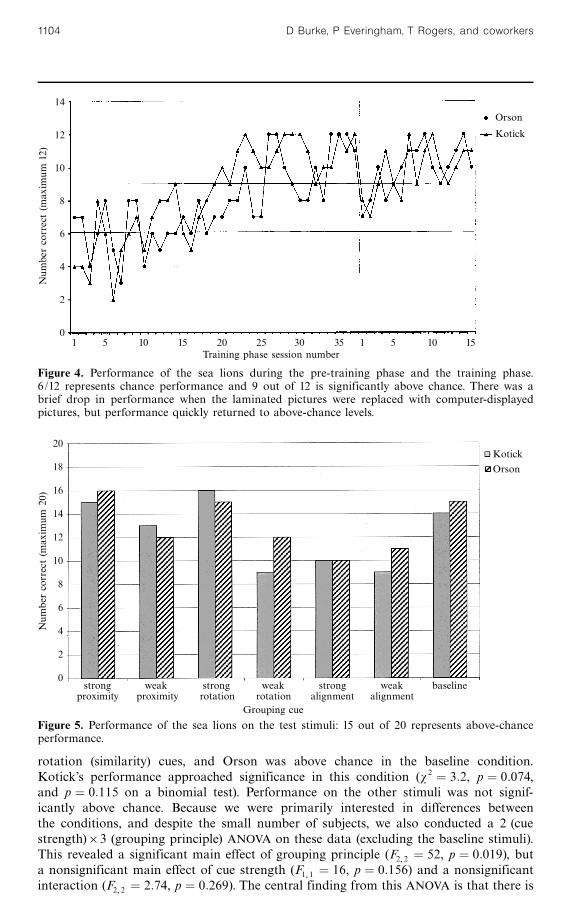
rotation (similarity) cues, and Orson was above chance in the baseline condition.Kotick's performance approached significance in this condition (w 2 � 3:2, p � 0:074,and p � 0:115 on a binomial test). Performance on the other stimuli was not signif-icantly above chance. Because we were primarily interested in differences betweenthe conditions, and despite the small number of subjects, we also conducted a 2 (cuestrength)63 (grouping principle) ANOVA on these data (excluding the baseline stimuli).This revealed a significant main effect of grouping principle (F2 2 � 52, p � 0:019), buta nonsignificant main effect of cue strength (F1 1 � 16, p � 0:156) and a nonsignificantinteraction (F2 2 � 2:74, p � 0:269). The central finding from this ANOVA is that there is
,
,
,
14
12
10
8
6
4
2
0
Num
bercorrect(m
axim
um12)
Orson
Kotick
1 5 10 15 20 25 30 35 1 5 10 15Training phase session number
Figure 4. Performance of the sea lions during the pre-training phase and the training phase.6/12 represents chance performance and 9 out of 12 is significantly above chance. There was abrief drop in performance when the laminated pictures were replaced with computer-displayedpictures, but performance quickly returned to above-chance levels.
20
18
16
14
12
10
8
6
4
2
0
Num
bercorrect(m
axim
um20)
KotickOrson
strong weak strong weak strong weak baselineproximity proximity rotation rotation alignment alignment
Grouping cue
Figure 5. Performance of the sea lions on the test stimuli: 15 out of 20 represents above-chanceperformance.
1104 D Burke, P Everingham, T Rogers, and coworkers
a significant effect of grouping principle, consistent with the w 2 analysis, but the F-ratiosfor the other effects suggest that they may have also reached significance had we beenable to run more subjects (who performed in a similar way).
3.4 DiscussionThe results of this experiment demonstrate that the sea lions were able to generalisethe horizontal/vertical discrimination to new exemplars containing real lines and to thestrong versions of the proximity and similarity patterns, but their performance was atchance levels for the other patterns. This suggests that they were able to discriminatehorizontal from vertical using proximity and similarity information, but that theywere less sensitive to them than are human subjects. Kurylo et al (1997) draw the sameconclusion about rats, with respect to proximity. It is also possible that the motivationlevels of the sea lions was not particularly high and that they therefore directed theirefforts at discriminations which they found easier, and so did not devote completeattention to the difficult versions of these cues. If this is true, it would be difficult tocompare absolute sensitivity to the grouping information across species, but we wereprimarily interested whether they showed any sign of sensitivity to the cue, which, forthese two cues, they plainly did.
The performance of both sea lions is at chance levels for both strengths of thealignment cue, suggesting that they do not have any sensitivity to this kind of informa-tion, at least as a cue to global orientation. The data from experiment 1 showed thathuman subjects find the alignment information in these patterns no less useful thanthe proximity or similarity information, so an explanation of the sea lions' failure onalignment cannot be attributed to these patterns providing intrinsically weaker verticaland horizontal signals. It seems that the sea lions were simply not sensitive to thealignment information provided.
The sea lions in this experiment performed in much the same way as the hoodedrats used by Kurylo et al (1997), despite their greater reliance on vision, greater visualacuity, training with a range of horizontal and vertical exemplars, and attempts torule out alternative explanations. This raises the possibility that the effect discovered byKurylo et al is, in fact, a consequence of the grouping cue used, and not a consequenceof the poor acuity of their subjects, or of the small number of training exemplars. So, ofthe species which have so far been tested, there is now convincing evidence of a qualita-tive difference in the ability to use alignment information as a global cue to orientationbetween humans on the one hand, and brown rats and Australian sea lions on theother. Such a distinction, of course, invites speculation about its cause.
The fact that both sea lions and rats are insensitive to global orientation defined byalignment is consistent with the possibility that only humans are sensitive to this groupingcue. If this is true, then it could be an evolved difference between humans and the otherspecies or a consequence of the kinds of visual experiences the subjects have had. Aswas mentioned earlier, to be sure that such patterns of sensitivity are a consequenceof species membership and not experiential factors, it would be necessary to ensurethat the subjects were exposed to the same kinds of visual environments, particularlyduring the development of the visual system. While it is likely that the rats used byKurylo et al developed in visually impoverished environments, this is not true ofthe sea lions used in the current study, who have always inhabited a rich visual world.If visual experience is the crucial difference between the humans and the non-humansubjects, then it must be a particular kind of visual stimulation that humans wereexposed to, but the sea lions were not, which accounts for their sensitivity to alignmentinformation. One such possibility is text, of course, in which horizontal alignment isimportant (in the main language of our human subjects). We are unable to think ofany other alignment information which only humans are exposed to, but the possibility
Perceptual grouping in humans and sea lions 1105
of experienced-based differences in perceptual grouping is interesting, and suggests arange of comparisons between subjects with different kinds of visual experiences.
The other possible reason for the differences observed between humans, rats, andsea lions is that they are a consequence of visual systems adapted (by natural selection)to meet different needs. The two non-human species tested are not closely related, theyhave faced dramatically different selection pressures for visual sensitivities, and only oneof them is strongly reliant on vision. If insensitivity to alignment information is rareamong non-humans, it is surprising that it is present in both species. Understandingwhy only some animals have sensitivity to particular grouping cues will necessarilyinvolve testing a wider range of species, and attempting to correlate abilities withecological demands placed on their visual systems, and/or phylogenetic relationships.Since it is not obvious what ecological factors faced by humans, but not by rats orsea lions, may have led to them having sensitivity to alignment information, it isdifficult to know which species should be compared from this perspective. Since weknow that humans do have sensitivity to this cue, the most profitable approach isprobably to investigate whether close relatives of humans (chimpanzees, for example)are also sensitive to alignment information. If our closest relatives are sensitive toalignment then this raises the question which other phylogenetically related speciesshow the same sensitivity (and, indirectly, which ecological factors may have driventhe evolution of such a mechanism). If chimpanzees are not sensitive to this cue, thenthis would dramatically increase the probability that human sensitivity to alignmentis a consequence of visual experiences that only they are likely to have. In either case,it is clear from the data reported here that the mechanisms underlying perceptualgrouping are dissociable.
Acknowledgements. This research was made possible only by the generous cooperation ofTaronga Zoo, in particular the staff of the marine mammal division, and especially by theoutstanding efforts of Andrew Irvine. Of course, we could also not have collected any datawithout the sea lions, so thanks also to Kotick and Orson.
ReferencesBirch D, Jacobs G H, 1979 `̀ Spatial contrast sensitivity in albino and pigmented rats'' Vision
Research 19 933 ^ 937Bonner N, 1994 Seals and Sea Lions of the World (London: Blandford)Gellerman L W, 1933 `̀ Chance orders of alternating stimuli in visual discrimination experiments''
Journal of Genetic Psychology 42 206 ^ 208Ginsburg A P, 1986 `̀ Spatial filtering and visual form perception'', in Handbook of Perception and
Human Performance volume II Cognitive Processes and Performance (New York: John Wiley)chapter 34
Koffka K, 1935 Principles of Gestalt Psychology (New York: Harcourt Brace)Kurylo D D, 1997 `̀ Time course of perceptual grouping'' Perception & Psychophysics 59 142 ^ 147Kurylo D D, Nest J van, Knepper B, 1997 `̀ Characteristics of perceptual grouping in rats''
Journal of Comparative Psychology 111 126 ^ 134Legg C R, 1984 `̀ Contrast sensitivities at low spatial frequencies in the hooded rat'' Vision Research
24 159 ^ 161Livingstone M S, Hubel D H, 1987 `̀ Psychophysical evidence for the separate channels for the
perception of form, color, movement and depth'' Journal of Neuroscience 7 3416 ^ 3468Schusterman R J, 1981 `̀ Behavioral capabilities of seals and sea lions: A review of their hearing,
visual, learning and diving skills'' Psychological Record 31 125 ^ 143Schusterman R J, Balliet R F, 1971 `̀Aerial and underwater visual acuity in the California sea
lion Zalophus californianus, as a function of luminance'' Annals of the New York Academy ofSciences 188 37 ^ 47
Williams P, Tarr M J, no date `̀ RSVP: Experimental control software for MacOs [Online]'',available at http://psychumbedu/rsvp/ [1998, May 4]
ß 2001 a Pion publication printed in Great Britain
1106 D Burke, P Everingham, T Rogers, and coworkers


