Embed Size (px)
Citation preview
www.cbre.com.cn Third Quarter 2011
© 2011, CB Richard Ellis, Inc.
People‘s Republic of China
TABLE OF CONTENTS
ECONOMIC BACKGROUND
To rein in the liquidity that has pushed up inflation, China hiked the required reserve ratio (RRR) for banks once more in the third quarter of the year, raising it to a new high of 6.56%. The slowdown in fixed asset investment growth to 25% for the first eight months in 2011 consequently dragged down China’s economic growth. Though consumption maintained steady growth, whether the recovery of foreign trade would continue in the midst of a global economy downturn is yet to be seen. The leading indicator, the purchasing managers’ index (PMI), fell gradually from April this year, yet rebounded slightly in August and September due to seasonal effects. The mediocre performance of this index reflects a cautious outlook for the economy in the short to medium term.
Asset price inflation did not accelerate, mainly because the number of cities with flat or downward housing price on a month-on-month basis increased to 47 in August, from 31 in July and 26 in June. This mitigates pressure for the government to roll out a more aggressive money-tightening policy. It is more likely that the People’s Bank of China (PBoC) will continue its stance of moderate liquidity tightening for the rest of the year. However the government may look to relax lending to SME’s as it seeks to address “shadow” lending concerns. Amidst external economic volatility both in the U.S. and the Eurozone, the RMB is expected to continue its slow but steady upward trend to balance the negative impact on export growth with inflationary pressure. Thus, the exchange rate policy should still favour the property market over the short period.
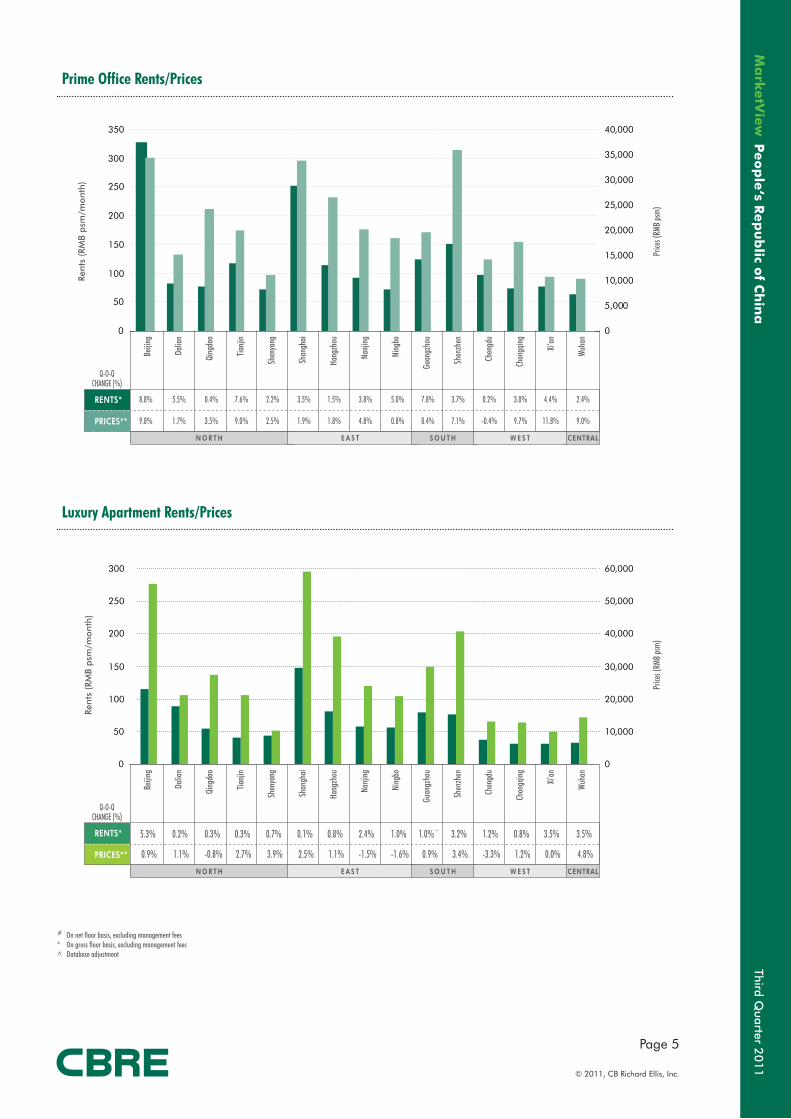
The office rental market generally showed continued growth in the third quarter of the year on the back of across-the-board rental growth in the previous quarter. First-tier cities in particular demonstrated growth from the high base of the first half of the year, with quarterly gains of around 4% to 9%. Inflating costs, coupled with unavailability of property alternatives remain major challenges for MNCs looking to consolidate large operations under one roof, pushing some occupiers to turn to decentralized areas.
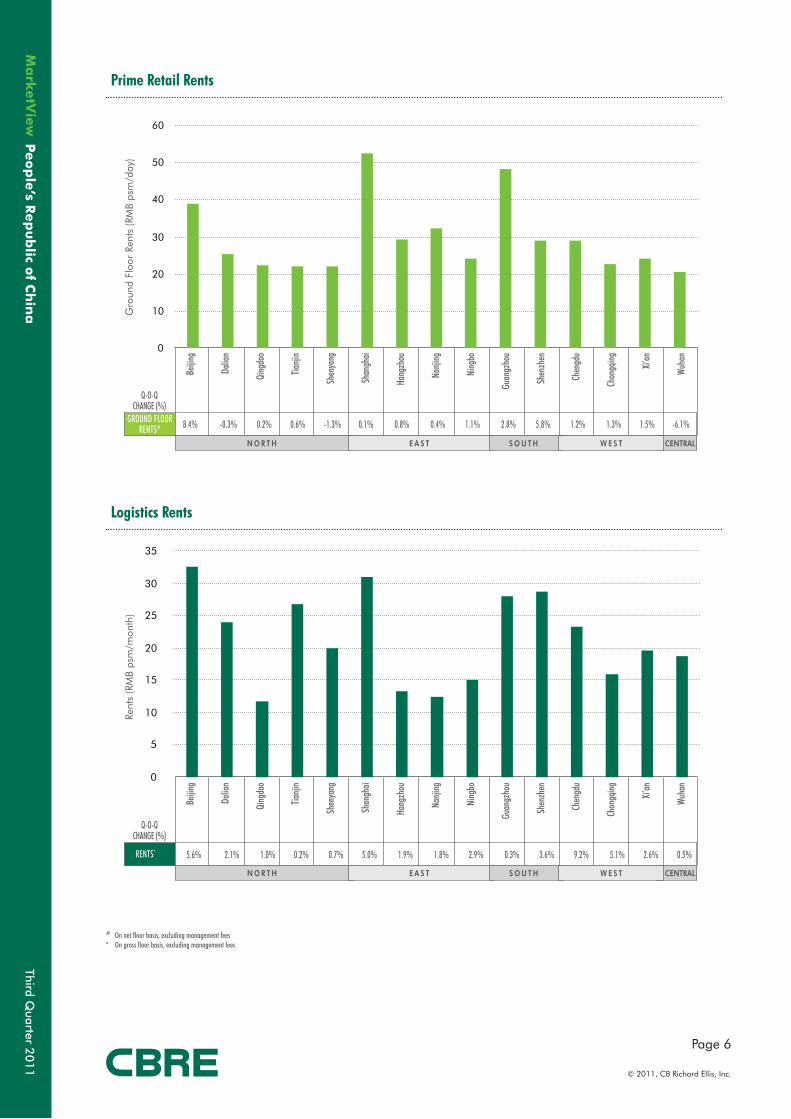
Although some cities, including Beijing, Shenyang and Wuhan, faced adequate retail property supply (each above 100,000 sm for the quarter), the prime retail market across China closed September largely on a positive note, as demand and take-up increased notably. Twelve of 15 cities we cover recorded brisk growth in rentals amidst buoyant market sentiment. Even new projects coming onto the market were well sought after as reflected in the low vacancy rates.
There have been a series of recent housing purchase restrictions across nearly all the cities we cover, with the exception of Chongqing, which adopted a separate pilot scheme of property tax and subsequent measures to reinforce the implementation of such restrictions in mid-2011. As a result luxury residential transacted volumes were severely dampened, while prices held firm. Only Qingdao, Hangzhou and Nanjing recorded tentative signs of price corrections amidst prevailing wait-and-see market sentiment. In contrast to this, the logistics property market marched on, highlighted by rising demand for modern facilities across second-tier cities, often driven by the cost advantage of inland regions. Cities with strategic positions such as Wuhan and Chongqing are deemed dominant nodes within the logistics landscape, offering access to a mature supply chain, and witnessed notable upward pressure on rentals for logistics facilities.
2 Feature Story3 Office Rental Cycle
Luxury Residential Rental Cycle4 Retail Rental Cycle
Industrial Rental Cycle5 Prime Office Rents/Prices
Luxury Apartment Rents/Prices6 Prime Retail Rents
Logistics Rents
7 NORTH CHINA8-9 Beijing10 Tianjin11 Dalian12 Shenyang13 Qingdao
14 EAST CHINA15-16 Shanghai17 Nanjing18 Hangzhou19 Ningbo
20 SOUTH CHINA21-22 Guangzhou23 Shenzhen
24 CENTRAL & WEST CHINA25-26 Chengdu27 Chongqing
28 Wuhan
29 Xi’an
MARKET PERFORMANCE
Third Quarter 2
01
1
Page 2
© 2011, CB Richard Ellis, Inc.
Peo
ple
’s Rep
ub
lic of C
hin
a
FEATURE STORY
As a regional financial hub and economic centre in South China, Shenzhen has attracted various kinds of business activities. The proportion of modern service industry in tertiary industry is forecast to exceed 60% by 2015, according to the city’s master plan, which will boost demand for office space in Shenzhen.
There have been discussions on improving integration between Hong Kong and Shenzhen for several years. Integration with Hong Kong would help enhance connectivity and develop a more effective vehicle for the Pearl River Delta region and strengthens its competitiveness in the economy of the whole country. Recently the transport infrastructure connecting these two cities has improved significantly, for example the directly accessible metro network and long-span bridge in the Western Corridor. To speed up this integration, the State Council approved the ‘Master Plan of Qianhai, Shenzhen and Hong Kong Modern Industry Co-operation Zone’ and pushed the initiative forward in 2010. Under the framework of this plan, the Qianhai area will be developed into a national hub of modern service industries and a incubator area for developing modes of economic growth.
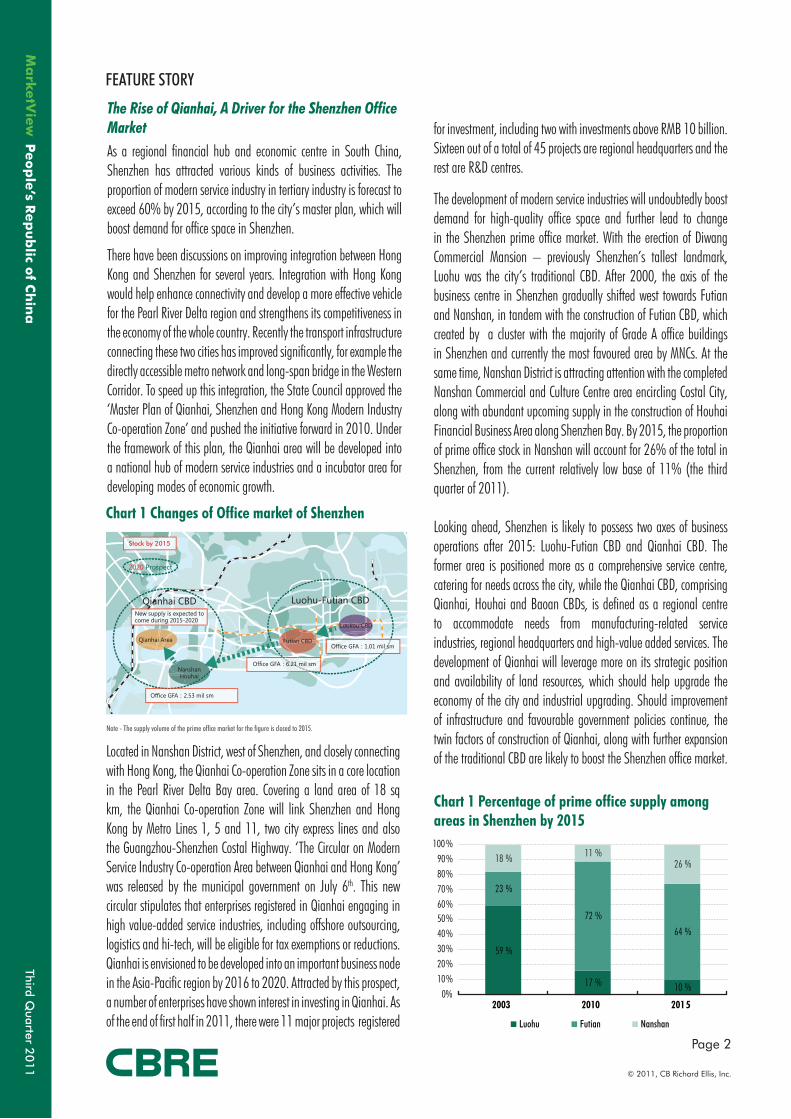
Chart 1 Percentage of prime office supply among areas in Shenzhen by 2015
The Rise of Qianhai, A Driver for the Shenzhen Office Market
The development of modern service industries will undoubtedly boost demand for high-quality office space and further lead to change in the Shenzhen prime office market. With the erection of Diwang Commercial Mansion – previously Shenzhen’s tallest landmark, Luohu was the city’s traditional CBD. After 2000, the axis of the business centre in Shenzhen gradually shifted west towards Futian and Nanshan, in tandem with the construction of Futian CBD, which created by a cluster with the majority of Grade A office buildings in Shenzhen and currently the most favoured area by MNCs. At the same time, Nanshan District is attracting attention with the completed Nanshan Commercial and Culture Centre area encircling Costal City, along with abundant upcoming supply in the construction of Houhai Financial Business Area along Shenzhen Bay. By 2015, the proportion of prime office stock in Nanshan will account for 26% of the total in Shenzhen, from the current relatively low base of 11% (the third quarter of 2011).
Looking ahead, Shenzhen is likely to possess two axes of business operations after 2015: Luohu-Futian CBD and Qianhai CBD. The former area is positioned more as a comprehensive service centre, catering for needs across the city, while the Qianhai CBD, comprising Qianhai, Houhai and Baoan CBDs, is defined as a regional centre to accommodate needs from manufacturing-related service industries, regional headquarters and high-value added services. The development of Qianhai will leverage more on its strategic position and availability of land resources, which should help upgrade the economy of the city and industrial upgrading. Should improvement of infrastructure and favourable government policies continue, the twin factors of construction of Qianhai, along with further expansion of the traditional CBD are likely to boost the Shenzhen office market.
Chart 1 Changes of Office market of Shenzhen
Note - The supply volume of the prime office market for the figure is closed to 2015.
Located in Nanshan District, west of Shenzhen, and closely connecting with Hong Kong, the Qianhai Co-operation Zone sits in a core location in the Pearl River Delta Bay area. Covering a land area of 18 sq km, the Qianhai Co-operation Zone will link Shenzhen and Hong Kong by Metro Lines 1, 5 and 11, two city express lines and also the Guangzhou-Shenzhen Costal Highway. ‘The Circular on Modern Service Industry Co-operation Area between Qianhai and Hong Kong’ was released by the municipal government on July 6th. This new circular stipulates that enterprises registered in Qianhai engaging in high value-added service industries, including offshore outsourcing, logistics and hi-tech, will be eligible for tax exemptions or reductions. Qianhai is envisioned to be developed into an important business node in the Asia-Pacific region by 2016 to 2020. Attracted by this prospect, a number of enterprises have shown interest in investing in Qianhai. As of the end of first half in 2011, there were 11 major projects registered
for investment, including two with investments above RMB 10 billion. Sixteen out of a total of 45 projects are regional headquarters and the rest are R&D centres.
2020 Prospect
Qianhai CBD Luohu-Futian CBDNew supply is expected to
come during 2015-2020
Stock by 2015
Office GFA:2.53 mil sm
Office GFA:6.21 mil sm
Office GFA:1.01 mil smQianhai Area
NanshanHouhai
Futian CBD
Luokou CBD
59 %
17 % 10 %
23 %
72 %
64 %
18 % 11 %26 %
0%10%20%30%40%50%60%70%80%90%
100 %
2003 2010 201 5
Luohu Futian Nanshan
Third Quarter 2
01
1
Page 3
© 2011, CB Richard Ellis, Inc.
Peo
ple
‘s Rep
ub
lic of C
hin
a
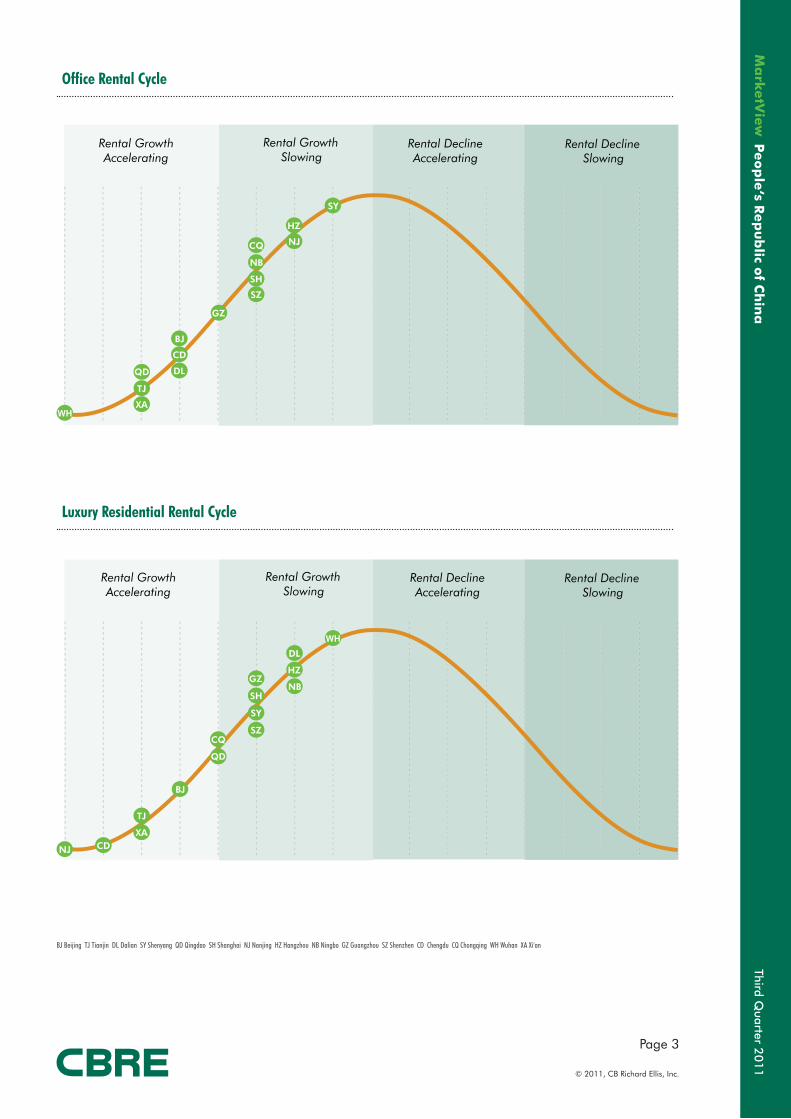
Office Rental Cycle
Luxury Residential Rental Cycle
BJ Beijing TJ Tianjin DL Dalian SY Shenyang QD Qingdao SH Shanghai NJ Nanjing HZ Hangzhou NB Ningbo GZ Guangzhou SZ Shenzhen CD Chengdu CQ Chongqing WH Wuhan XA Xi'an
CD
WH
SY
XA
SH
DLQD
BJ
GZ
SZ
TJ
NJCQ
HZ
NB
Rental Growth Accelerating
Rental Growth Slowing
Rental Decline Accelerating
Rental Decline Slowing
CD
WH
SY
XA
SH
DL
QD
BJ
GZ
SZ
TJ
NJ
CQ
HZ
NB
Rental Growth Accelerating
Rental Growth Slowing
Rental Decline Accelerating
Rental Decline Slowing
Third Quarter 2
01
1
Page 4
© 2011, CB Richard Ellis, Inc.
Peo
ple
’s Rep
ub
lic of C
hin
a
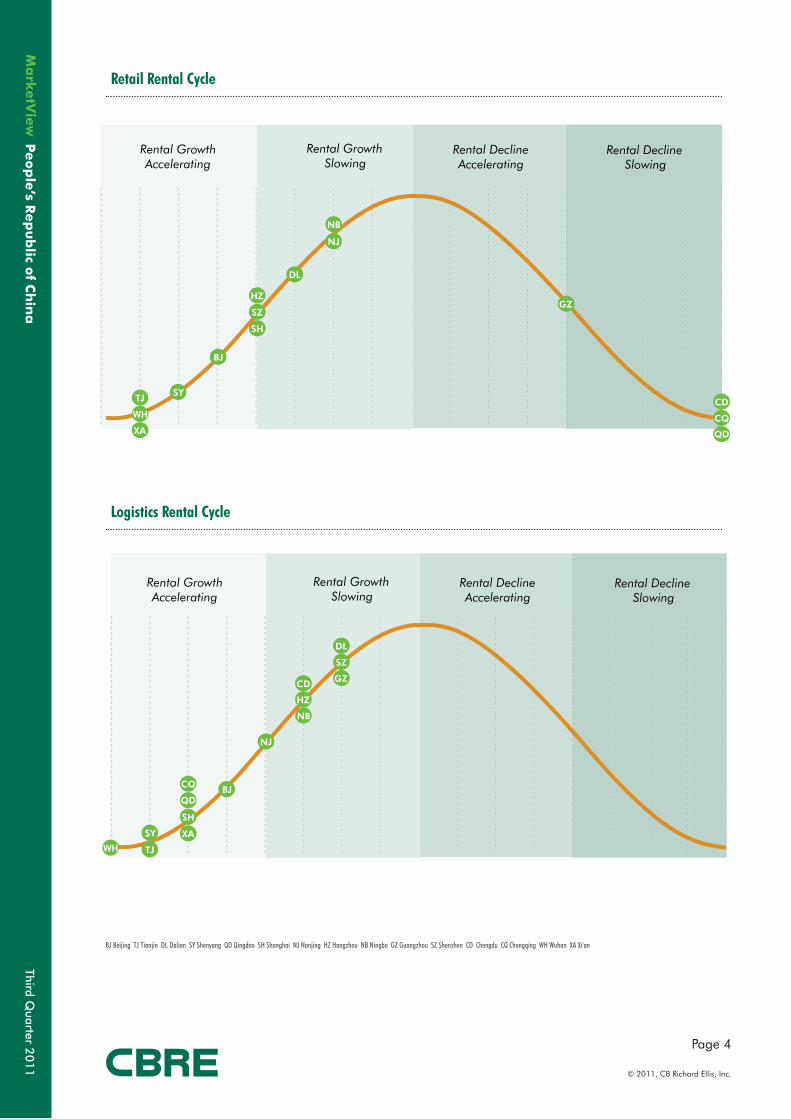
Retail Rental Cycle
Logistics Rental Cycle
BJ Beijing TJ Tianjin DL Dalian SY Shenyang QD Qingdao SH Shanghai NJ Nanjing HZ Hangzhou NB Ningbo GZ Guangzhou SZ Shenzhen CD Chengdu CQ Chongqing WH Wuhan XA Xi'an
CDWH
SY
XA
SH
DL
QD
BJ
GZSZ
TJ
NJ
CQ
HZ
NB
Rental Growth Accelerating
Rental Growth Slowing
Rental Decline Accelerating
Rental Decline Slowing
CD
WH
SY XA
SH
DL
QDBJ
GZ
SZ
TJ
NJ
CQ
HZ
NB
Rental Growth Accelerating
Rental Growth Slowing
Rental Decline Accelerating
Rental Decline Slowing
Third Quarter 2
01
1
Page 5
© 2011, CB Richard Ellis, Inc.
Peo
ple
‘s Rep
ub
lic of C
hin
a
Prime Office Rents/Prices
Luxury Apartment Rents/Prices
Price
s (RM
B ps
m)
Price
s (RM
B ps
m)
Rent
s (R
MB
psm
/mon
th)
Rent
s (R
MB
psm
/mon
th)
Q-O-Q CHANGE (%)
Q-O-Q CHANGE (%)
RENTS*
PRICES**
RENTS*
PRICES**
Beiji
ng
Dalia
n
Qing
dao
Tianj
in
Shen
yang
Shan
ghai
Hang
zhou
Nanj
ing
Ning
bo
Guan
gzho
u
Shen
zhen
Chen
gdu
Chon
gqin
g
Xi‘an
Wuha
n
Beiji
ng
Dalia
n
Qing
dao
Tianji
n
Shen
yang
Shan
ghai
Hang
zhou
Nanji
ng
Ning
bo
Guan
gzho
u
Shen
zhen
Chen
gdu
Chon
gqing Xi‘an
Wuha
n
N O R T H
N O R T H
E A S T
E A S T
S O U T H
S O U T H
W E S T
W E S T
CENTRAL
CENTRAL
# On net floor basis, excluding management fees* On gross floor basis, excluding management fees Database adjustment
0
50
100
150
200
250
300
0
10,000
20,000
30,000
40,000
50,000
60,000
0
50
100
150
200
250
300
350
0
5,000
10,000
15,000
20,000
25,000
30,000
35,000
40,000
8.8% 5.5% 0.4% 7.6% 2.2% 3.5% 1.5% 3.8% 5.0% 7.8% 3.7% 0.2% 3.0% 4.4% 2.4%
9.8% 1.7% 3.5% 9.0% 2.5% 1.9% 1.8% 4.8% 0.8% 8.4% 7.1% -0.4% 9.7% 11.8% 9.0%
5.3% 0.2% 0.3% 0.3% 0.7% 0.1% 0.8% 2.4% 1.0% 1.0%^ 3.2% 1.2% 0.8% 3.5% 3.5%
0.9% 1.1% -0.8% 2.7% 3.9% 2.5% 1.1% -1.5% -1.6% 0.9% 3.4% -3.3% 1.2% 0.0% 4.8%
Third Quarter 2
01
1
Page 6
© 2011, CB Richard Ellis, Inc.
Peo
ple
’s Rep
ub
lic of C
hin
a
Prime Retail Rents
Logistics Rents
Gro
und
Floo
r Re
nts
(RM
B ps
m/d
ay)
Rent
s (R
MB
psm
/mon
th)
Q-O-Q CHANGE (%)
Q-O-Q CHANGE (%)
GROUND FLOORRENTS#
RENTS*
Beiji
ng
Dalia
n
Qing
dao
Tianj
in
Shen
yang
Shan
ghai
Hang
zhou
Nanj
ing
Ning
bo
Guan
gzho
u
Shen
zhen
Chen
gdu
Chon
gqin
g
Xi‘an
Wuha
n
Beiji
ng
Dalia
n
Qing
dao
Tianji
n
Shen
yang
Shan
ghai
Hang
zhou
Nanji
ng
Ning
bo
Guan
gzho
u
Shen
zhen
Chen
gdu
Chon
gqing Xi‘an
Wuha
n
N O R T H E A S T S O U T H W E S T CENTRAL
N O R T H E A S T S O U T H W E S T CENTRAL
# On net floor basis, excluding management fees* On gross floor basis, excluding management fees
0
10
20
30
40
50
60
0
5
10
15
20
25
30
35
8.4% -0.3% 0.2% 0.6% -1.3% 0.1% 0.8% 0.4% 1.1% 2.8% 5.8% 1.2% 1.3% 1.5% -6.1%
5.6% 2.1% 1.0% 0.2% 0.7% 5.0% 1.9% 1.8% 2.9% 0.3% 3.6% 9.2% 5.1% 2.6% 0.5%
Third Quarter 2
01
1
Page 7
© 2011, CB Richard Ellis, Inc.
Peo
ple
‘s Rep
ub
lic of C
hin
a
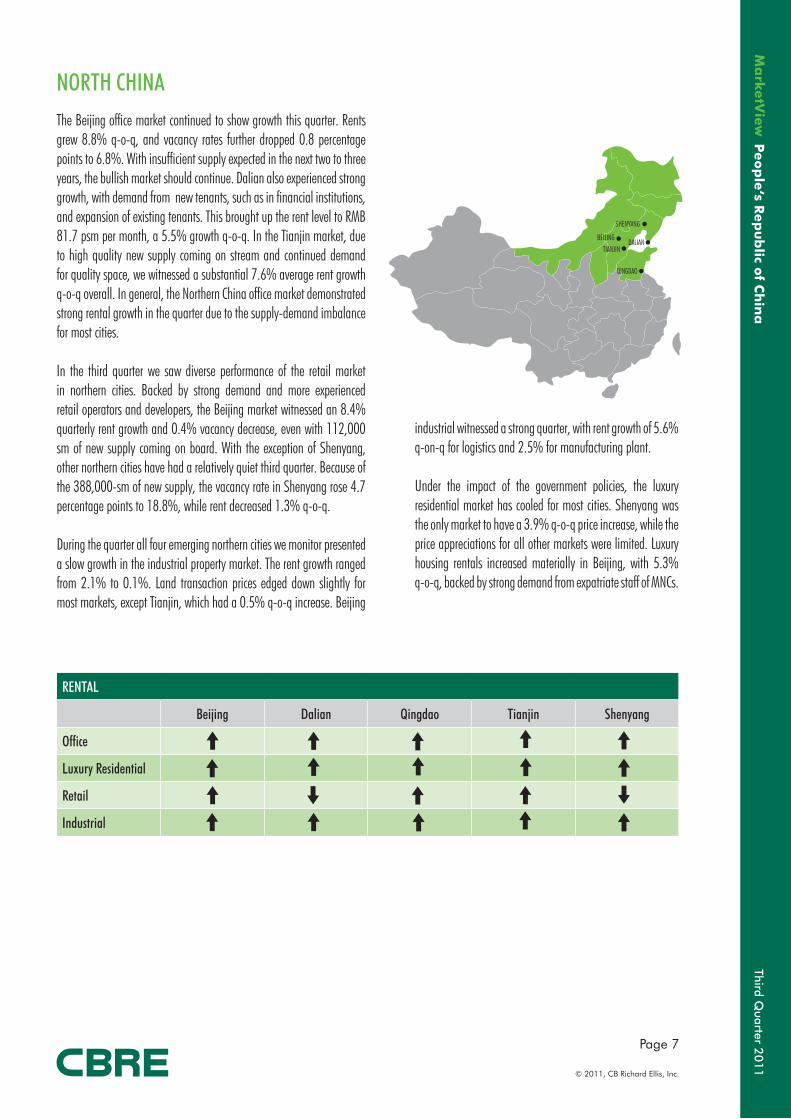
NORTH CHINAThe Beijing office market continued to show growth this quarter. Rents grew 8.8% q-o-q, and vacancy rates further dropped 0.8 percentage points to 6.8%. With insufficient supply expected in the next two to three years, the bullish market should continue. Dalian also experienced strong growth, with demand from new tenants, such as in financial institutions, and expansion of existing tenants. This brought up the rent level to RMB 81.7 psm per month, a 5.5% growth q-o-q. In the Tianjin market, due to high quality new supply coming on stream and continued demand for quality space, we witnessed a substantial 7.6% average rent growth q-o-q overall. In general, the Northern China office market demonstrated strong rental growth in the quarter due to the supply-demand imbalance for most cities.
In the third quarter we saw diverse performance of the retail market in northern cities. Backed by strong demand and more experienced retail operators and developers, the Beijing market witnessed an 8.4% quarterly rent growth and 0.4% vacancy decrease, even with 112,000 sm of new supply coming on board. With the exception of Shenyang, other northern cities have had a relatively quiet third quarter. Because of the 388,000-sm of new supply, the vacancy rate in Shenyang rose 4.7 percentage points to 18.8%, while rent decreased 1.3% q-o-q.
During the quarter all four emerging northern cities we monitor presented a slow growth in the industrial property market. The rent growth ranged from 2.1% to 0.1%. Land transaction prices edged down slightly for most markets, except Tianjin, which had a 0.5% q-o-q increase. Beijing
RENTAL
Beijing Dalian Qingdao Tianjin Shenyang
Office
Luxury Residential
Retail
Industrial
BEIJINGTIANJIN
QINGDAO
SHENYANG
DALIAN
industrial witnessed a strong quarter, with rent growth of 5.6% q-on-q for logistics and 2.5% for manufacturing plant.
Under the impact of the government policies, the luxury residential market has cooled for most cities. Shenyang was the only market to have a 3.9% q-o-q price increase, while the price appreciations for all other markets were limited. Luxury housing rentals increased materially in Beijing, with 5.3% q-o-q, backed by strong demand from expatriate staff of MNCs.
Third Quarter 2
01
1
Page 8
© 2011, CB Richard Ellis, Inc.
Peo
ple
’s Rep
ub
lic of C
hin
a
0
50
100
150
200
250
Q1
93
Q3
93
Q1
94
Q3
94
Q1
95
Q3
95
Q1
96
Q3
96
Q1
97
Q3
97
Q1
98
Q3
98
Q1
99
Q3
99
Q1
00
Q3
00
Q1
01
Q3
01
Q1
02
Q3
02
Q1
03
Q3
03
Q1
04
Q3
04
Q1
05
Q3
05
Q1
06
Q3
06
Q1
07
Q3
07
Q1
08
Q3
08
Q1
09
Q3
09
Q1
10
Q3
10
Q1
11
Q3
11
0
50
100
150
200
250
Q1
00
Q3
00
Q1
01
Q3
01
Q1
02
Q3
02
Q1
03
Q3
03
Q1
04
Q3
04
Q1
05
Q3
05
Q1
06
Q3
06
Q1
07
Q3
07
Q1
08
Q3
08
Q1
09
Q3
09
Q1
10
Q3
10
Q1
11
Q3
11
Office Luxury Residential Retail Industrial
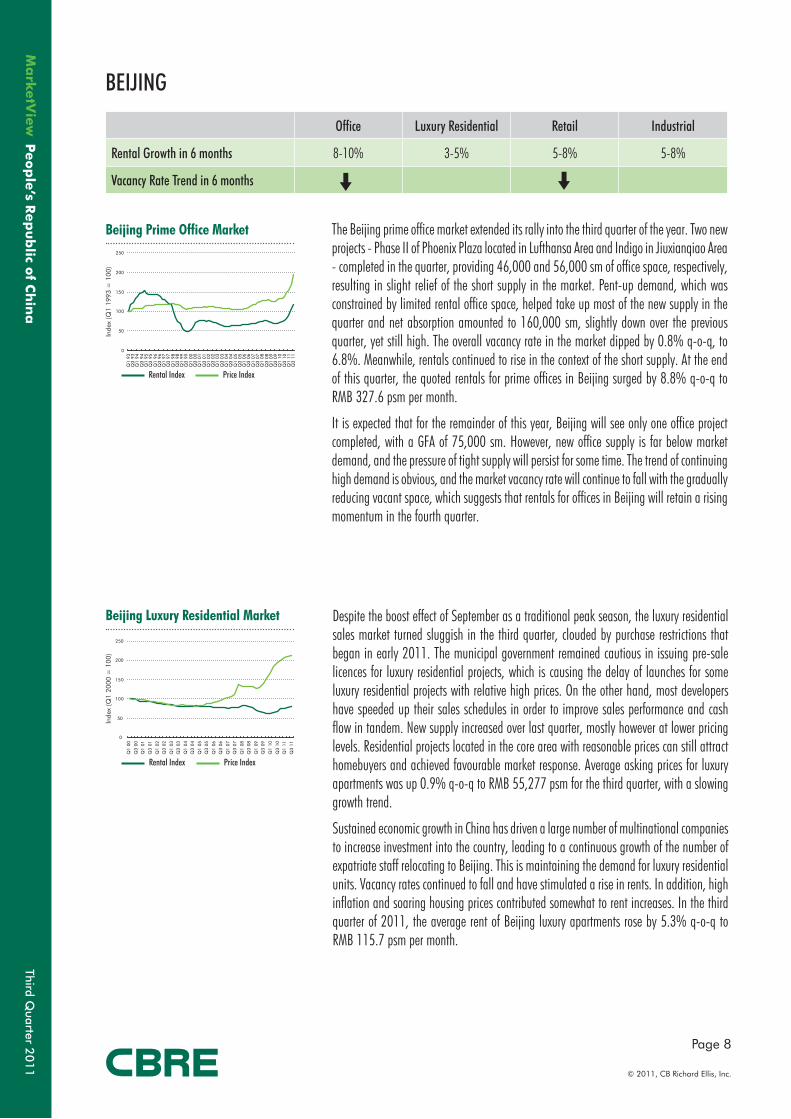
Rental Growth in 6 months 8-10% 3-5% 5-8% 5-8%
Vacancy Rate Trend in 6 months
Beijing Prime Office Market
Rental Index Price Index
Rental Index Price Index
Inde
x (Q
1 19
93 =
100
)
Beijing Luxury Residential Market
Inde
x (Q
1 20
00 =
100
)
BEIJING
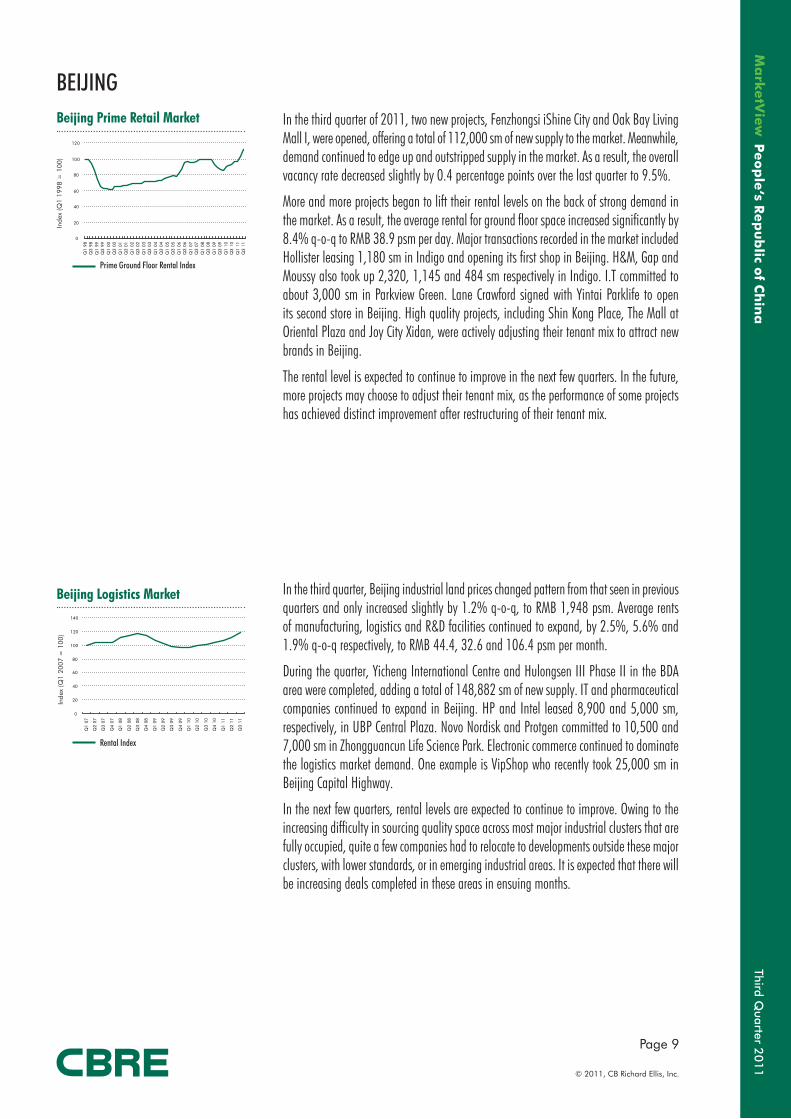
The Beijing prime office market extended its rally into the third quarter of the year. Two new projects - Phase II of Phoenix Plaza located in Lufthansa Area and Indigo in Jiuxianqiao Area - completed in the quarter, providing 46,000 and 56,000 sm of office space, respectively, resulting in slight relief of the short supply in the market. Pent-up demand, which was constrained by limited rental office space, helped take up most of the new supply in the quarter and net absorption amounted to 160,000 sm, slightly down over the previous quarter, yet still high. The overall vacancy rate in the market dipped by 0.8% q-o-q, to 6.8%. Meanwhile, rentals continued to rise in the context of the short supply. At the end of this quarter, the quoted rentals for prime offices in Beijing surged by 8.8% q-o-q to RMB 327.6 psm per month.
It is expected that for the remainder of this year, Beijing will see only one office project completed, with a GFA of 75,000 sm. However, new office supply is far below market demand, and the pressure of tight supply will persist for some time. The trend of continuing high demand is obvious, and the market vacancy rate will continue to fall with the gradually reducing vacant space, which suggests that rentals for offices in Beijing will retain a rising momentum in the fourth quarter.
Despite the boost effect of September as a traditional peak season, the luxury residential sales market turned sluggish in the third quarter, clouded by purchase restrictions that began in early 2011. The municipal government remained cautious in issuing pre-sale licences for luxury residential projects, which is causing the delay of launches for some luxury residential projects with relative high prices. On the other hand, most developers have speeded up their sales schedules in order to improve sales performance and cash flow in tandem. New supply increased over last quarter, mostly however at lower pricing levels. Residential projects located in the core area with reasonable prices can still attract homebuyers and achieved favourable market response. Average asking prices for luxury apartments was up 0.9% q-o-q to RMB 55,277 psm for the third quarter, with a slowing growth trend.
Sustained economic growth in China has driven a large number of multinational companies to increase investment into the country, leading to a continuous growth of the number of expatriate staff relocating to Beijing. This is maintaining the demand for luxury residential units. Vacancy rates continued to fall and have stimulated a rise in rents. In addition, high inflation and soaring housing prices contributed somewhat to rent increases. In the third quarter of 2011, the average rent of Beijing luxury apartments rose by 5.3% q-o-q to RMB 115.7 psm per month.
Third Quarter 2
01
1
Page 9
© 2011, CB Richard Ellis, Inc.
Peo
ple
‘s Rep
ub
lic of C
hin
a
0
20
40
60
80
100
120
Q1
98
Q3
98
Q1
99
Q3
99
Q1
00
Q3
00
Q1
01
Q3
01
Q1
02
Q3
02
Q1
03
Q3
03
Q1
04
Q3
04
Q1
05
Q3
05
Q1
06
Q3
06
Q1
07
Q3
07
Q1
08
Q3
08
Q1
09
Q3
09
Q1
10
Q3
10
Q1
11
Q3
11
Prime Ground Floor Rental Index
Rental Index
Beijing Prime Retail Market
Inde
x (Q
1 19
98 =
100
)
Beijing Logistics Market
Inde
x (Q
1 20
07 =
100
)
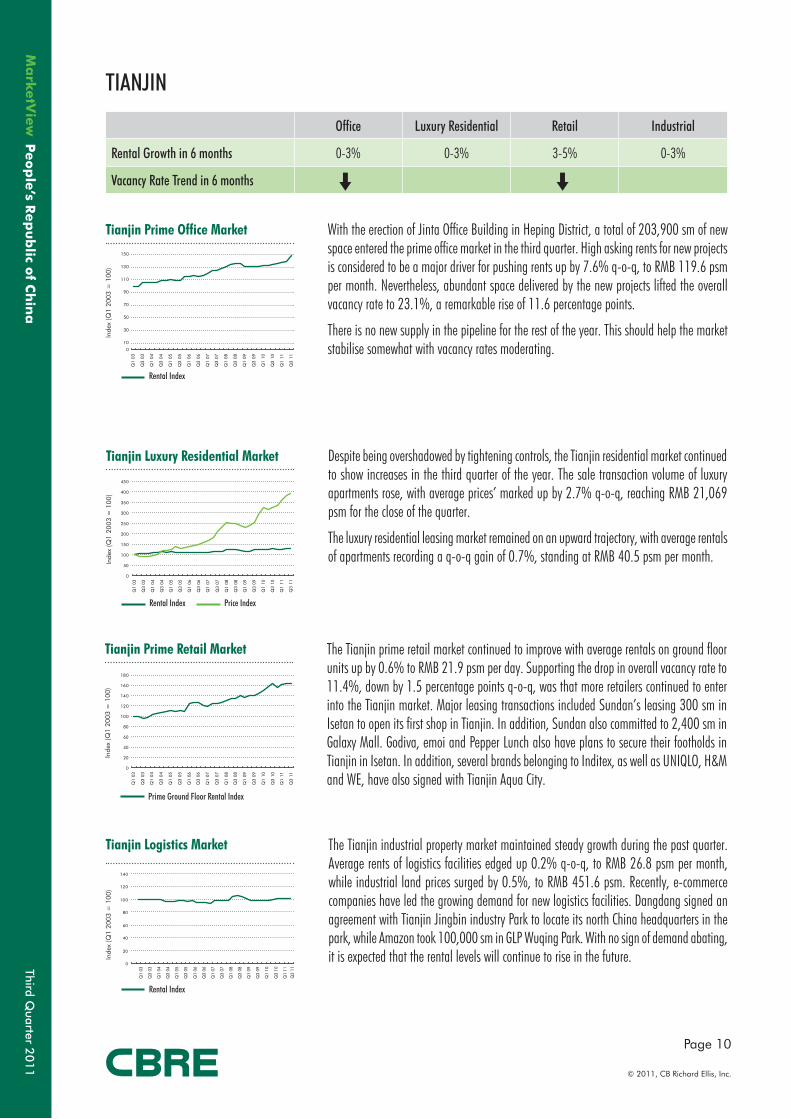
BEIJINGIn the third quarter of 2011, two new projects, Fenzhongsi iShine City and Oak Bay Living Mall I, were opened, offering a total of 112,000 sm of new supply to the market. Meanwhile, demand continued to edge up and outstripped supply in the market. As a result, the overall vacancy rate decreased slightly by 0.4 percentage points over the last quarter to 9.5%.
More and more projects began to lift their rental levels on the back of strong demand in the market. As a result, the average rental for ground floor space increased significantly by 8.4% q-o-q to RMB 38.9 psm per day. Major transactions recorded in the market included Hollister leasing 1,180 sm in Indigo and opening its first shop in Beijing. H&M, Gap and Moussy also took up 2,320, 1,145 and 484 sm respectively in Indigo. I.T committed to about 3,000 sm in Parkview Green. Lane Crawford signed with Yintai Parklife to open its second store in Beijing. High quality projects, including Shin Kong Place, The Mall at Oriental Plaza and Joy City Xidan, were actively adjusting their tenant mix to attract new brands in Beijing.
The rental level is expected to continue to improve in the next few quarters. In the future, more projects may choose to adjust their tenant mix, as the performance of some projects has achieved distinct improvement after restructuring of their tenant mix.
In the third quarter, Beijing industrial land prices changed pattern from that seen in previous quarters and only increased slightly by 1.2% q-o-q, to RMB 1,948 psm. Average rents of manufacturing, logistics and R&D facilities continued to expand, by 2.5%, 5.6% and 1.9% q-o-q respectively, to RMB 44.4, 32.6 and 106.4 psm per month.
During the quarter, Yicheng International Centre and Hulongsen III Phase II in the BDA area were completed, adding a total of 148,882 sm of new supply. IT and pharmaceutical companies continued to expand in Beijing. HP and Intel leased 8,900 and 5,000 sm, respectively, in UBP Central Plaza. Novo Nordisk and Protgen committed to 10,500 and 7,000 sm in Zhongguancun Life Science Park. Electronic commerce continued to dominate the logistics market demand. One example is VipShop who recently took 25,000 sm in Beijing Capital Highway.
In the next few quarters, rental levels are expected to continue to improve. Owing to the increasing difficulty in sourcing quality space across most major industrial clusters that are fully occupied, quite a few companies had to relocate to developments outside these major clusters, with lower standards, or in emerging industrial areas. It is expected that there will be increasing deals completed in these areas in ensuing months.
0
20
40
60
80
100
120
140
Q1
07
Q2
07
Q3
07
Q4
07
Q1
08
Q2
08
Q3
08
Q4
08
Q1
09
Q2
09
Q3
09
Q4
09
Q1
10
Q2
10
Q3
10
Q4
10
Q1
11
Q2
11
Q3
11
Third Quarter 2
01
1
Page 10
© 2011, CB Richard Ellis, Inc.
Peo
ple
’s Rep
ub
lic of C
hin
a
Tianjin Prime Office Market
Rental Index
Rental Index Price Index
Prime Ground Floor Rental Index
Rental Index
Tianjin Prime Retail Market
Tianjin Logistics Market
Tianjin Luxury Residential Market
TIANJIN
Office Luxury Residential Retail Industrial
Rental Growth in 6 months 0-3% 0-3% 3-5% 0-3%
Vacancy Rate Trend in 6 months
With the erection of Jinta Office Building in Heping District, a total of 203,900 sm of new space entered the prime office market in the third quarter. High asking rents for new projects is considered to be a major driver for pushing rents up by 7.6% q-o-q, to RMB 119.6 psm per month. Nevertheless, abundant space delivered by the new projects lifted the overall vacancy rate to 23.1%, a remarkable rise of 11.6 percentage points.
There is no new supply in the pipeline for the rest of the year. This should help the market stabilise somewhat with vacancy rates moderating.
Despite being overshadowed by tightening controls, the Tianjin residential market continued to show increases in the third quarter of the year. The sale transaction volume of luxury apartments rose, with average prices’ marked up by 2.7% q-o-q, reaching RMB 21,069 psm for the close of the quarter.
The luxury residential leasing market remained on an upward trajectory, with average rentals of apartments recording a q-o-q gain of 0.7%, standing at RMB 40.5 psm per month.
The Tianjin prime retail market continued to improve with average rentals on ground floor units up by 0.6% to RMB 21.9 psm per day. Supporting the drop in overall vacancy rate to 11.4%, down by 1.5 percentage points q-o-q, was that more retailers continued to enter into the Tianjin market. Major leasing transactions included Sundan’s leasing 300 sm in Isetan to open its first shop in Tianjin. In addition, Sundan also committed to 2,400 sm in Galaxy Mall. Godiva, emoi and Pepper Lunch also have plans to secure their footholds in Tianjin in Isetan. In addition, several brands belonging to Inditex, as well as UNIQLO, H&M and WE, have also signed with Tianjin Aqua City.
The Tianjin industrial property market maintained steady growth during the past quarter. Average rents of logistics facilities edged up 0.2% q-o-q, to RMB 26.8 psm per month, while industrial land prices surged by 0.5%, to RMB 451.6 psm. Recently, e-commerce companies have led the growing demand for new logistics facilities. Dangdang signed an agreement with Tianjin Jingbin industry Park to locate its north China headquarters in the park, while Amazon took 100,000 sm in GLP Wuqing Park. With no sign of demand abating, it is expected that the rental levels will continue to rise in the future.
Inde
x (Q
1 20
03 =
100
)In
dex
(Q1
2003
= 1
00)
Inde
x (Q
1 20
03 =
100
)In
dex
(Q1
2003
= 1
00)
0
50
100
150
200
250
300
350
400
450
Q1
03
Q3
03
Q1
04
Q3
04
Q1
05
Q3
05
Q1
06
Q3
06
Q1
07
Q3
07
Q1
08
Q3
08
Q1
09
Q3
09
Q1
10
Q3
10
Q1
11
Q3
11
0
20
40
60
80
100
120
140
160
180
Q1
03
Q3
03
Q1
04
Q3
04
Q1
05
Q3
05
Q1
06
Q3
06
Q1
07
Q3
07
Q1
08
Q3
08
Q1
09
Q3
09
Q1
10
Q3
10
Q1
11
Q3
11
0
20
40
60
80
100
120
140
Q1
03
Q3
03
Q1
04
Q3
04
Q1
05
Q3
05
Q1
06
Q3
06
Q1
07
Q3
07
Q1
08
Q3
08
Q1
09
Q3
09
Q1
10
Q3
10
Q1
11
Q3
11
0
10
30
50
70
90
110
130
150
Q1
03
Q3
03
Q1
04
Q3
04
Q1
05
Q3
05
Q1
06
Q3
06
Q1
07
Q3
07
Q1
08
Q3
08
Q1
09
Q3
09
Q1
10
Q3
10
Q1
11
Q3
11
Third Quarter 2
01
1
Page 11
© 2011, CB Richard Ellis, Inc.
Peo
ple
‘s Rep
ub
lic of C
hin
a
Dalian Prime Office Market
Rental Index
Rental Index Price Index
Prime Ground Floor Rental Index
Rental Index
Dalian Prime Retail Market
Dalian Logistics Market
Dalian Luxury Residential Market
DALIAN
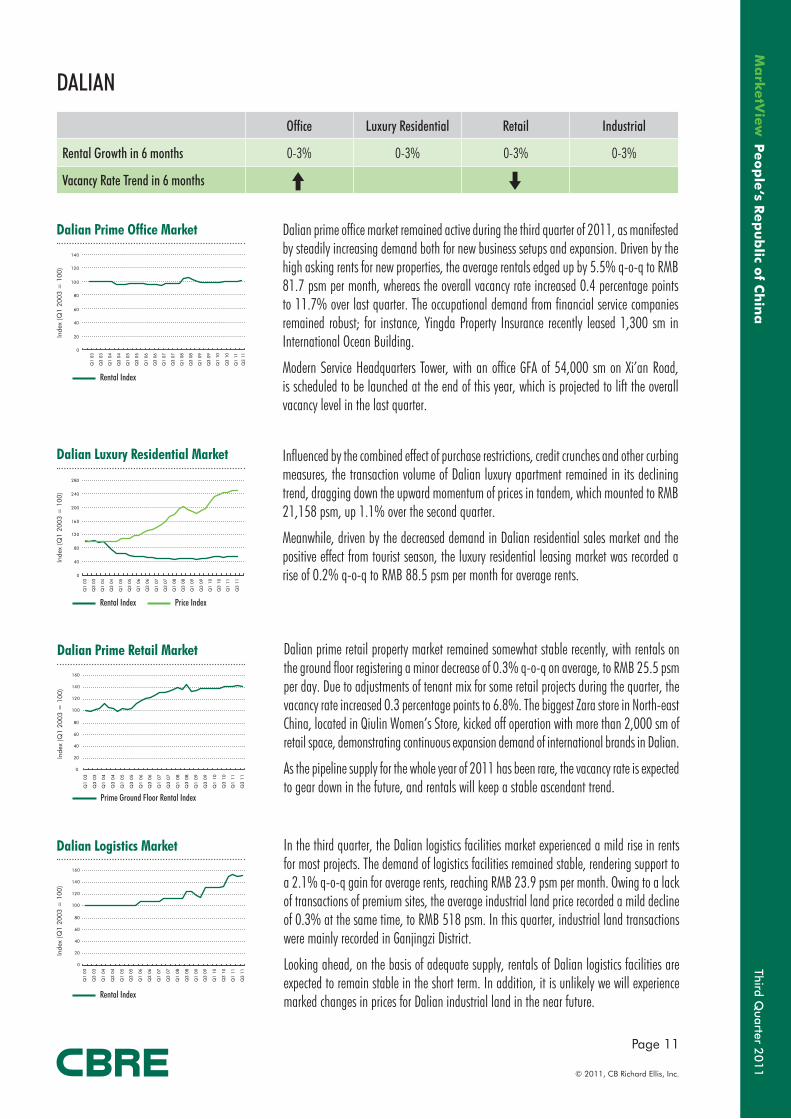
Office Luxury Residential Retail Industrial
Rental Growth in 6 months 0-3% 0-3% 0-3% 0-3%
Vacancy Rate Trend in 6 months
Dalian prime office market remained active during the third quarter of 2011, as manifested by steadily increasing demand both for new business setups and expansion. Driven by the high asking rents for new properties, the average rentals edged up by 5.5% q-o-q to RMB 81.7 psm per month, whereas the overall vacancy rate increased 0.4 percentage points to 11.7% over last quarter. The occupational demand from financial service companies remained robust; for instance, Yingda Property Insurance recently leased 1,300 sm in International Ocean Building.
Modern Service Headquarters Tower, with an office GFA of 54,000 sm on Xi’an Road, is scheduled to be launched at the end of this year, which is projected to lift the overall vacancy level in the last quarter.
Influenced by the combined effect of purchase restrictions, credit crunches and other curbing measures, the transaction volume of Dalian luxury apartment remained in its declining trend, dragging down the upward momentum of prices in tandem, which mounted to RMB 21,158 psm, up 1.1% over the second quarter.
Meanwhile, driven by the decreased demand in Dalian residential sales market and the positive effect from tourist season, the luxury residential leasing market was recorded a rise of 0.2% q-o-q to RMB 88.5 psm per month for average rents.
Dalian prime retail property market remained somewhat stable recently, with rentals on the ground floor registering a minor decrease of 0.3% q-o-q on average, to RMB 25.5 psm per day. Due to adjustments of tenant mix for some retail projects during the quarter, the vacancy rate increased 0.3 percentage points to 6.8%. The biggest Zara store in North-east China, located in Qiulin Women’s Store, kicked off operation with more than 2,000 sm of retail space, demonstrating continuous expansion demand of international brands in Dalian.
As the pipeline supply for the whole year of 2011 has been rare, the vacancy rate is expected to gear down in the future, and rentals will keep a stable ascendant trend.
In the third quarter, the Dalian logistics facilities market experienced a mild rise in rents for most projects. The demand of logistics facilities remained stable, rendering support to a 2.1% q-o-q gain for average rents, reaching RMB 23.9 psm per month. Owing to a lack of transactions of premium sites, the average industrial land price recorded a mild decline of 0.3% at the same time, to RMB 518 psm. In this quarter, industrial land transactions were mainly recorded in Ganjingzi District.
Looking ahead, on the basis of adequate supply, rentals of Dalian logistics facilities are expected to remain stable in the short term. In addition, it is unlikely we will experience marked changes in prices for Dalian industrial land in the near future.
Inde
x (Q
1 20
03 =
100
)In
dex
(Q1
2003
= 1
00)
Inde
x (Q
1 20
03 =
100
)In
dex
(Q1
2003
= 1
00)
0
20
40
60
80
100
120
140
Q1
03
Q3
03
Q1
04
Q3
04
Q1
05
Q3
05
Q1
06
Q3
06
Q1
07
Q3
07
Q1
08
Q3
08
Q1
09
Q3
09
Q1
10
Q3
10
Q1
11
Q3
11
0
40
80
120
160
200
240
280
Q1
03
Q3
03
Q1
04
Q3
04
Q1
05
Q3
05
Q1
06
Q3
06
Q1
07
Q3
07
Q1
08
Q3
08
Q1
09
Q3
09
Q1
10
Q3
10
Q1
11
Q3
11
0
20
40
60
80
100
120
140
160
Q1
03
Q3
03
Q1
04
Q3
04
Q1
05
Q3
05
Q1
06
Q3
06
Q1
07
Q3
07
Q1
08
Q3
08
Q1
09
Q3
09
Q1
10
Q3
10
Q1
11
Q3
11
0
20
40
60
80
100
120
140
160
Q1
03
Q3
03
Q1
04
Q3
04
Q1
05
Q3
05
Q1
06
Q3
06
Q1
07
Q3
07
Q1
08
Q3
08
Q1
09
Q3
09
Q1
10
Q3
10
Q1
11
Q3
11
Third Quarter 2
01
1
Page 12
© 2011, CB Richard Ellis, Inc.
Peo
ple
’s Rep
ub
lic of C
hin
a
Shenyang Prime Office Market
Rental Index
Rental Index Price Index
Prime Ground Floor Rental Index
Rental Index
Shenyang Prime Retail Market
Shenyang Logistics Market
Shenyang Luxury Residential Market
SHENYANG
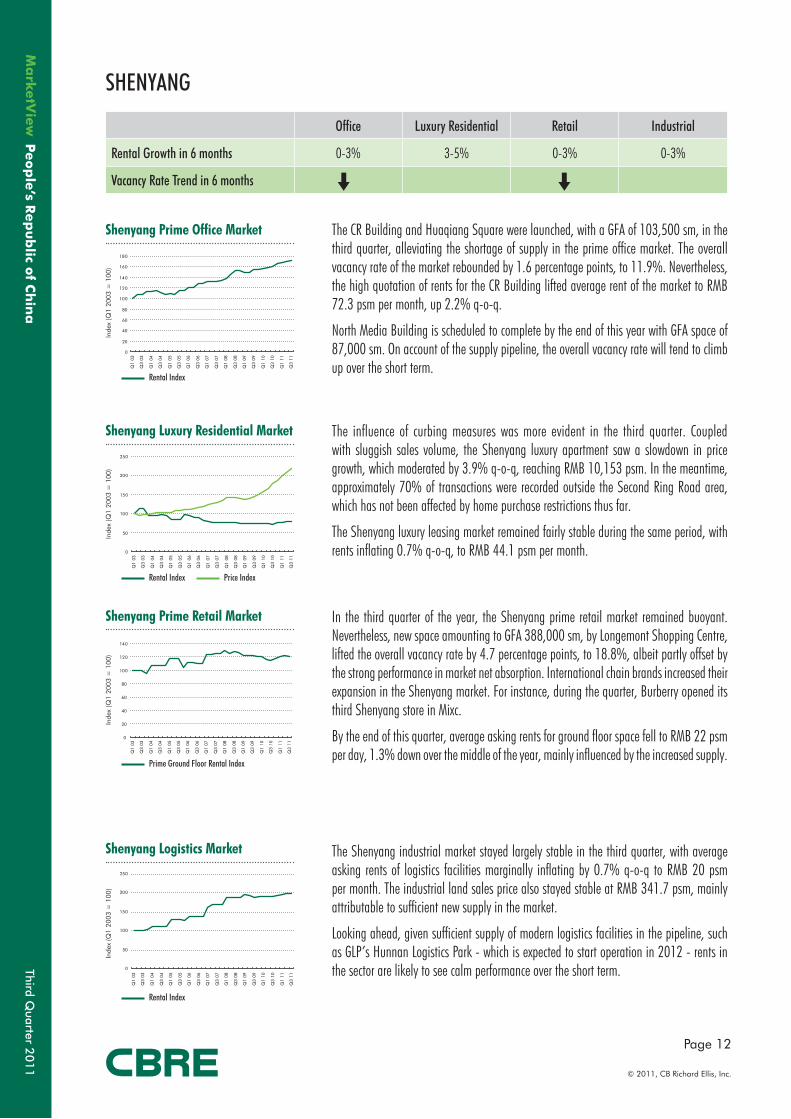
Office Luxury Residential Retail Industrial
Rental Growth in 6 months 0-3% 3-5% 0-3% 0-3%
Vacancy Rate Trend in 6 months
The CR Building and Huaqiang Square were launched, with a GFA of 103,500 sm, in the third quarter, alleviating the shortage of supply in the prime office market. The overall vacancy rate of the market rebounded by 1.6 percentage points, to 11.9%. Nevertheless, the high quotation of rents for the CR Building lifted average rent of the market to RMB 72.3 psm per month, up 2.2% q-o-q.
North Media Building is scheduled to complete by the end of this year with GFA space of 87,000 sm. On account of the supply pipeline, the overall vacancy rate will tend to climb up over the short term.
The influence of curbing measures was more evident in the third quarter. Coupled with sluggish sales volume, the Shenyang luxury apartment saw a slowdown in price growth, which moderated by 3.9% q-o-q, reaching RMB 10,153 psm. In the meantime, approximately 70% of transactions were recorded outside the Second Ring Road area, which has not been affected by home purchase restrictions thus far.
The Shenyang luxury leasing market remained fairly stable during the same period, with rents inflating 0.7% q-o-q, to RMB 44.1 psm per month.
In the third quarter of the year, the Shenyang prime retail market remained buoyant. Nevertheless, new space amounting to GFA 388,000 sm, by Longemont Shopping Centre, lifted the overall vacancy rate by 4.7 percentage points, to 18.8%, albeit partly offset by the strong performance in market net absorption. International chain brands increased their expansion in the Shenyang market. For instance, during the quarter, Burberry opened its third Shenyang store in Mixc.
By the end of this quarter, average asking rents for ground floor space fell to RMB 22 psm per day, 1.3% down over the middle of the year, mainly influenced by the increased supply.
The Shenyang industrial market stayed largely stable in the third quarter, with average asking rents of logistics facilities marginally inflating by 0.7% q-o-q to RMB 20 psm per month. The industrial land sales price also stayed stable at RMB 341.7 psm, mainly attributable to sufficient new supply in the market.
Looking ahead, given sufficient supply of modern logistics facilities in the pipeline, such as GLP’s Hunnan Logistics Park - which is expected to start operation in 2012 - rents in the sector are likely to see calm performance over the short term.
Inde
x (Q
1 20
03 =
100
)In
dex
(Q1
2003
= 1
00)
Inde
x (Q
1 20
03 =
100
)In
dex
(Q1
2003
= 1
00)
0
20
40
60
80
100
120
140
160
180
Q1
03
Q3
03
Q1
04
Q3
04
Q1
05
Q3
05
Q1
06
Q3
06
Q1
07
Q3
07
Q1
08
Q3
08
Q1
09
Q3
09
Q1
10
Q3
10
Q1
11
Q3
11
0
50
100
150
200
250
Q1
03
Q3
03
Q1
04
Q3
04
Q1
05
Q3
05
Q1
06
Q3
06
Q1
07
Q3
07
Q1
08
Q3
08
Q1
09
Q3
09
Q1
10
Q3
10
Q1
11
Q3
11
0
20
40
60
80
100
120
140
Q1
03
Q3
03
Q1
04
Q3
04
Q1
05
Q3
05
Q1
06
Q3
06
Q1
07
Q3
07
Q1
08
Q3
08
Q1
09
Q3
09
Q1
10
Q3
10
Q1
11
Q3
11
0
50
100
150
200
250
Q1
03
Q3
03
Q1
04
Q3
04
Q1
05
Q3
05
Q1
06
Q3
06
Q1
07
Q3
07
Q1
08
Q3
08
Q1
09
Q3
09
Q1
10
Q3
10
Q1
11
Q3
11
Third Quarter 2
01
1
Page 13
© 2011, CB Richard Ellis, Inc.
Peo
ple
‘s Rep
ub
lic of C
hin
a
Qingdao Prime Office Market
Rental Index
Rental Index Price Index
Prime Ground Floor Rental Index
Rental Index
Qingdao Prime Retail Market
Qingdao Logistics Market
Qingdao Luxury Residential Market
QINGDAO
Office Luxury Residential Retail Industrial
Rental Growth in 6 months 0-3% 0-3% 0-3% 0-3%
Vacancy Rate Trend in 6 months
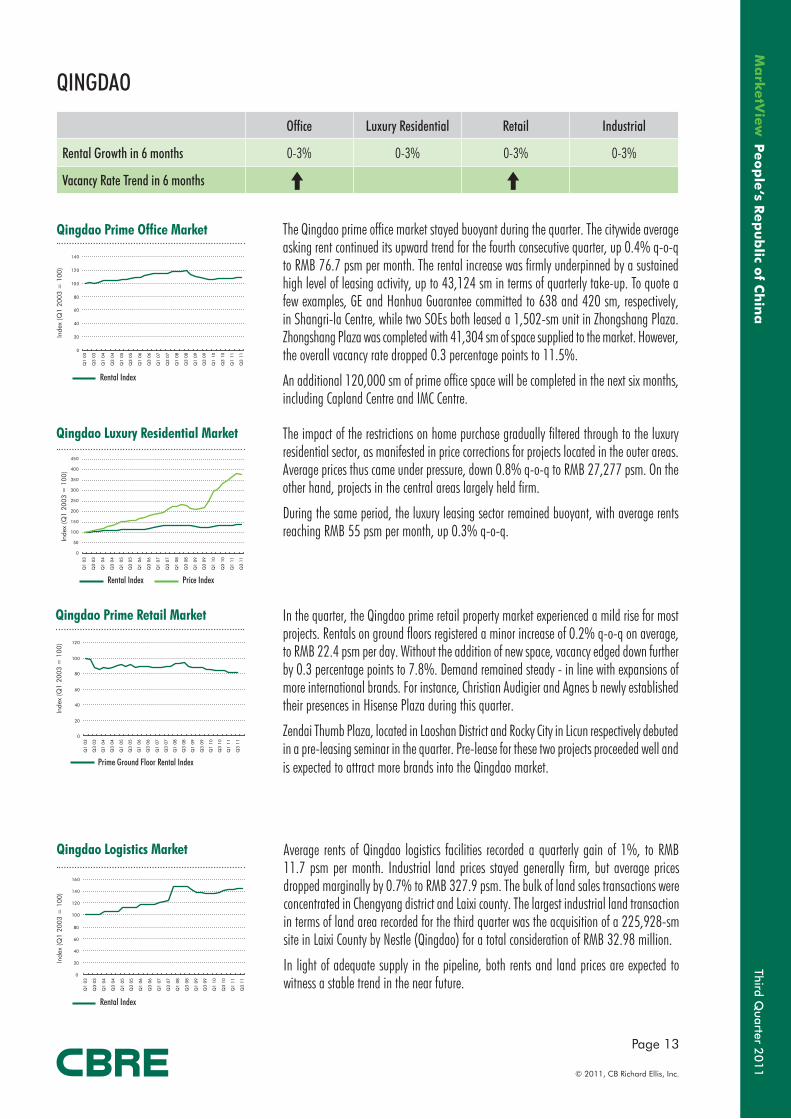
The Qingdao prime office market stayed buoyant during the quarter. The citywide average asking rent continued its upward trend for the fourth consecutive quarter, up 0.4% q-o-q to RMB 76.7 psm per month. The rental increase was firmly underpinned by a sustained high level of leasing activity, up to 43,124 sm in terms of quarterly take-up. To quote a few examples, GE and Hanhua Guarantee committed to 638 and 420 sm, respectively, in Shangri-la Centre, while two SOEs both leased a 1,502-sm unit in Zhongshang Plaza. Zhongshang Plaza was completed with 41,304 sm of space supplied to the market. However, the overall vacancy rate dropped 0.3 percentage points to 11.5%.
An additional 120,000 sm of prime office space will be completed in the next six months, including Capland Centre and IMC Centre.
The impact of the restrictions on home purchase gradually filtered through to the luxury residential sector, as manifested in price corrections for projects located in the outer areas. Average prices thus came under pressure, down 0.8% q-o-q to RMB 27,277 psm. On the other hand, projects in the central areas largely held firm.
During the same period, the luxury leasing sector remained buoyant, with average rents reaching RMB 55 psm per month, up 0.3% q-o-q.
In the quarter, the Qingdao prime retail property market experienced a mild rise for most projects. Rentals on ground floors registered a minor increase of 0.2% q-o-q on average, to RMB 22.4 psm per day. Without the addition of new space, vacancy edged down further by 0.3 percentage points to 7.8%. Demand remained steady - in line with expansions of more international brands. For instance, Christian Audigier and Agnes b newly established their presences in Hisense Plaza during this quarter.
Zendai Thumb Plaza, located in Laoshan District and Rocky City in Licun respectively debuted in a pre-leasing seminar in the quarter. Pre-lease for these two projects proceeded well and is expected to attract more brands into the Qingdao market.
Average rents of Qingdao logistics facilities recorded a quarterly gain of 1%, to RMB 11.7 psm per month. Industrial land prices stayed generally firm, but average prices dropped marginally by 0.7% to RMB 327.9 psm. The bulk of land sales transactions were concentrated in Chengyang district and Laixi county. The largest industrial land transaction in terms of land area recorded for the third quarter was the acquisition of a 225,928-sm site in Laixi County by Nestle (Qingdao) for a total consideration of RMB 32.98 million.
In light of adequate supply in the pipeline, both rents and land prices are expected to witness a stable trend in the near future.
Inde
x (Q
1 20
03 =
100
)In
dex
(Q1
2003
= 1
00)
Inde
x (Q
1 20
03 =
100
)In
dex
(Q1
2003
= 1
00)
0
20
40
60
80
100
120
140
Q1
03
Q3
03
Q1
04
Q3
04
Q1
05
Q3
05
Q1
06
Q3
06
Q1
07
Q3
07
Q1
08
Q3
08
Q1
09
Q3
09
Q1
10
Q3
10
Q1
11
Q3
11
0
50
100
150
200
250
300
350
400
450
Q1
03
Q3
03
Q1
04
Q3
04
Q1
05
Q3
05
Q1
06
Q3
06
Q1
07
Q3
07
Q1
08
Q3
08
Q1
09
Q3
09
Q1
10
Q3
10
Q1
11
Q3
11
0
20
40
60
80
100
120
Q1
03
Q3
03
Q1
04
Q3
04
Q1
05
Q3
05
Q1
06
Q3
06
Q1
07
Q3
07
Q1
08
Q3
08
Q1
09
Q3
09
Q1
10
Q3
10
Q1
11
Q3
11
0
20
40
60
80
100
120
140
160
Q1
03
Q3
03
Q1
04
Q3
04
Q1
05
Q3
05
Q1
06
Q3
06
Q1
07
Q3
07
Q1
08
Q3
08
Q1
09
Q3
09
Q1
10
Q3
10
Q1
11
Q3
11
Third Quarter 2
01
1
Page 14
© 2011, CB Richard Ellis, Inc.
Peo
ple
’s Rep
ub
lic of C
hin
a
NANJING SHANGHAI
HANGZHOUNINGBO
EAST CHINAThere is no sign of abatement in the office market across East China; all four cities we cover in the region registered positive gain in rentals during the quarter. The external economic volatility did not reduce market demand, as evidenced by a new high of net absorption in Shanghai for this year, which has supported continuous rental growth. Meanwhile, the prime retail property market fared well, underpinned by sustaining high growth of personal incomes in the region.
Despite the fact that autumn is usually a season when the market warms up, some corrections have appeared. The earlier scenario, where prices held stable or even edged up amidst shrinking transactions, has started giving way to deeper price cuts by developers to speed up the rebuilding of cash flow. As a result, both Hangzhou and Nanjing recorded downturns in prices for the first time since 2009. At the same time, more home seekers have chosen to keep renting rather than purchasing, in anticipation of a fall in prices, contributing to the continuing rise in rents. For industrial properties, fuelled by better than expected performance in the manufacturing sector, the logistics facilities market continued to gather steam across the board. The expansion of the industrial market has attracted more developer interest. For example, in the region, GLP newly expanded to Hangzhou and Suzhou via a joint venture recently established, while DB Schenker Logistics also announced expansion across China, both in the coastal regions and the interior areas.
RENTAL
Shanghai Hangzhou Nanjing Ningbo
Office
Luxury Residential
Retail
Industrial
Third Quarter 2
01
1
Page 15
© 2011, CB Richard Ellis, Inc.
Peo
ple
‘s Rep
ub
lic of C
hin
a
Shanghai Prime Office Market
Rental Index Price Index
Rental Index Price Index
Shanghai Luxury Residential Market
SHANGHAI
Office Luxury Residential Retail Industrial
Rental Growth in 6 months 5-8% 0-3% 3-5% 3-5%
Vacancy Rate Trend in 6 months
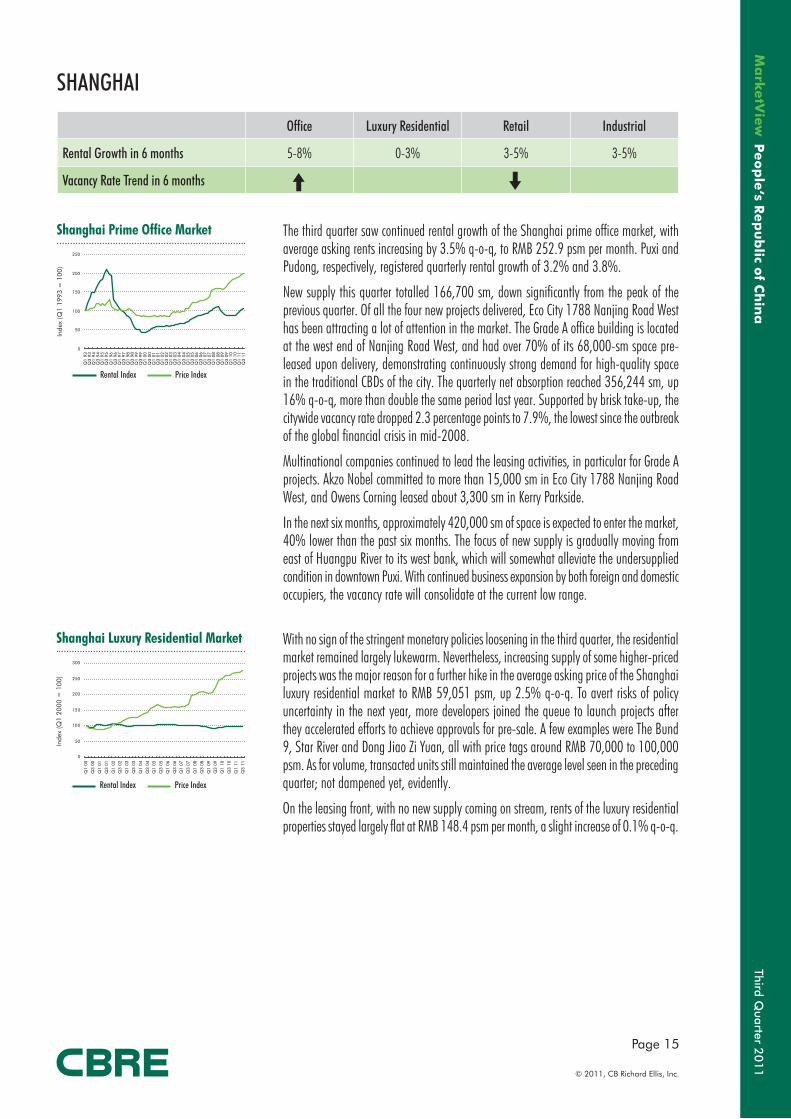
The third quarter saw continued rental growth of the Shanghai prime office market, with average asking rents increasing by 3.5% q-o-q, to RMB 252.9 psm per month. Puxi and Pudong, respectively, registered quarterly rental growth of 3.2% and 3.8%.
New supply this quarter totalled 166,700 sm, down significantly from the peak of the previous quarter. Of all the four new projects delivered, Eco City 1788 Nanjing Road West has been attracting a lot of attention in the market. The Grade A office building is located at the west end of Nanjing Road West, and had over 70% of its 68,000-sm space pre-leased upon delivery, demonstrating continuously strong demand for high-quality space in the traditional CBDs of the city. The quarterly net absorption reached 356,244 sm, up 16% q-o-q, more than double the same period last year. Supported by brisk take-up, the citywide vacancy rate dropped 2.3 percentage points to 7.9%, the lowest since the outbreak of the global financial crisis in mid-2008.
Multinational companies continued to lead the leasing activities, in particular for Grade A projects. Akzo Nobel committed to more than 15,000 sm in Eco City 1788 Nanjing Road West, and Owens Corning leased about 3,300 sm in Kerry Parkside.
In the next six months, approximately 420,000 sm of space is expected to enter the market, 40% lower than the past six months. The focus of new supply is gradually moving from east of Huangpu River to its west bank, which will somewhat alleviate the undersupplied condition in downtown Puxi. With continued business expansion by both foreign and domestic occupiers, the vacancy rate will consolidate at the current low range.
With no sign of the stringent monetary policies loosening in the third quarter, the residential market remained largely lukewarm. Nevertheless, increasing supply of some higher-priced projects was the major reason for a further hike in the average asking price of the Shanghai luxury residential market to RMB 59,051 psm, up 2.5% q-o-q. To avert risks of policy uncertainty in the next year, more developers joined the queue to launch projects after they accelerated efforts to achieve approvals for pre-sale. A few examples were The Bund 9, Star River and Dong Jiao Zi Yuan, all with price tags around RMB 70,000 to 100,000 psm. As for volume, transacted units still maintained the average level seen in the preceding quarter; not dampened yet, evidently.
On the leasing front, with no new supply coming on stream, rents of the luxury residential properties stayed largely flat at RMB 148.4 psm per month, a slight increase of 0.1% q-o-q.
Inde
x (Q
1 19
93 =
100
)In
dex
(Q1
2000
= 1
00)
0
50
100
150
200
250
Q1
93
Q3
93
Q1
94
Q3
94
Q1
95
Q3
95
Q1
96
Q3
96
Q1
97
Q3
97
Q1
98
Q3
98
Q1
99
Q3
99
Q1
00
Q3
00
Q1
01
Q3
01
Q1
02
Q3
02
Q1
03
Q3
03
Q1
04
Q3
04
Q1
05
Q3
05
Q1
06
Q3
06
Q1
07
Q3
07
Q1
08
Q3
08
Q1
09
Q3
09
Q1
10
Q3
10
Q1
11
Q3
11
0
50
100
150
200
250
300
Q1
00
Q3
00
Q1
01
Q3
01
Q1
02
Q3
02
Q1
03
Q3
03
Q1
04
Q3
04
Q1
05
Q3
05
Q1
06
Q3
06
Q1
07
Q3
07
Q1
08
Q3
08
Q1
09
Q3
09
Q1
10
Q3
10
Q1
11
Q3
11
Third Quarter 2
01
1
Page 16
© 2011, CB Richard Ellis, Inc.
Peo
ple
’s Rep
ub
lic of C
hin
a
Prime Ground Floor Rental Index
Rental Index
Shanghai Prime Retail Market
Shanghai Logistics Market
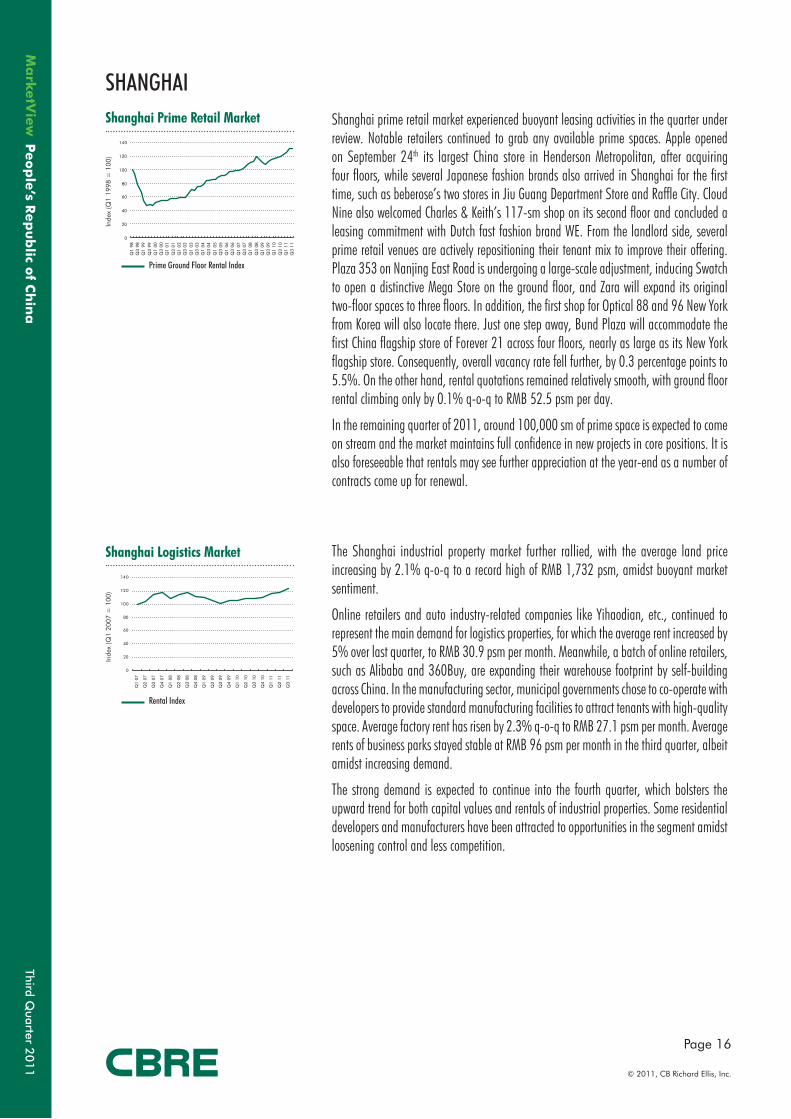
SHANGHAIShanghai prime retail market experienced buoyant leasing activities in the quarter under review. Notable retailers continued to grab any available prime spaces. Apple opened on September 24th its largest China store in Henderson Metropolitan, after acquiring four floors, while several Japanese fashion brands also arrived in Shanghai for the first time, such as beberose’s two stores in Jiu Guang Department Store and Raffle City. Cloud Nine also welcomed Charles & Keith’s 117-sm shop on its second floor and concluded a leasing commitment with Dutch fast fashion brand WE. From the landlord side, several prime retail venues are actively repositioning their tenant mix to improve their offering. Plaza 353 on Nanjing East Road is undergoing a large-scale adjustment, inducing Swatch to open a distinctive Mega Store on the ground floor, and Zara will expand its original two-floor spaces to three floors. In addition, the first shop for Optical 88 and 96 New York from Korea will also locate there. Just one step away, Bund Plaza will accommodate the first China flagship store of Forever 21 across four floors, nearly as large as its New York flagship store. Consequently, overall vacancy rate fell further, by 0.3 percentage points to 5.5%. On the other hand, rental quotations remained relatively smooth, with ground floor rental climbing only by 0.1% q-o-q to RMB 52.5 psm per day.
In the remaining quarter of 2011, around 100,000 sm of prime space is expected to come on stream and the market maintains full confidence in new projects in core positions. It is also foreseeable that rentals may see further appreciation at the year-end as a number of contracts come up for renewal.
The Shanghai industrial property market further rallied, with the average land price increasing by 2.1% q-o-q to a record high of RMB 1,732 psm, amidst buoyant market sentiment.
Online retailers and auto industry-related companies like Yihaodian, etc., continued to represent the main demand for logistics properties, for which the average rent increased by 5% over last quarter, to RMB 30.9 psm per month. Meanwhile, a batch of online retailers, such as Alibaba and 360Buy, are expanding their warehouse footprint by self-building across China. In the manufacturing sector, municipal governments chose to co-operate with developers to provide standard manufacturing facilities to attract tenants with high-quality space. Average factory rent has risen by 2.3% q-o-q to RMB 27.1 psm per month. Average rents of business parks stayed stable at RMB 96 psm per month in the third quarter, albeit amidst increasing demand.
The strong demand is expected to continue into the fourth quarter, which bolsters the upward trend for both capital values and rentals of industrial properties. Some residential developers and manufacturers have been attracted to opportunities in the segment amidst loosening control and less competition.
Inde
x (Q
1 19
98 =
100
)In
dex
(Q1
2007
= 1
00)
0
20
40
60
80
100
120
140
Q1
98
Q3
98
Q1
99
Q3
99
Q1
00
Q3
00
Q1
01
Q3
01
Q1
02
Q3
02
Q1
03
Q3
03
Q1
04
Q3
04
Q1
05
Q3
05
Q1
06
Q3
06
Q1
07
Q3
07
Q1
08
Q3
08
Q1
09
Q3
09
Q1
10
Q3
10
Q1
11
Q3
11
0
20
40
60
80
100
120
140
Q1
07
Q2
07
Q3
07
Q4
07
Q1
08
Q2
08
Q3
08
Q4
08
Q1
09
Q2
09
Q3
09
Q4
09
Q1
10
Q2
10
Q3
10
Q4
10
Q1
11
Q2
11
Q3
11
Third Quarter 2
01
1
Page 17
© 2011, CB Richard Ellis, Inc.
Peo
ple
‘s Rep
ub
lic of C
hin
a
Nanjing Prime Office Market
Rental Index
Rental Index Price Index
Prime Ground Floor Rental Index
Rental Index
Nanjing Prime Retail Market
Nanjing Logistics Market
Nanjing Luxury Residential Market
NANJING
Office Luxury Residential Retail Industrial
Rental Growth in 6 months 3-5% 0-3% 0-3% 0-3%
Vacancy Rate Trend in 6 months
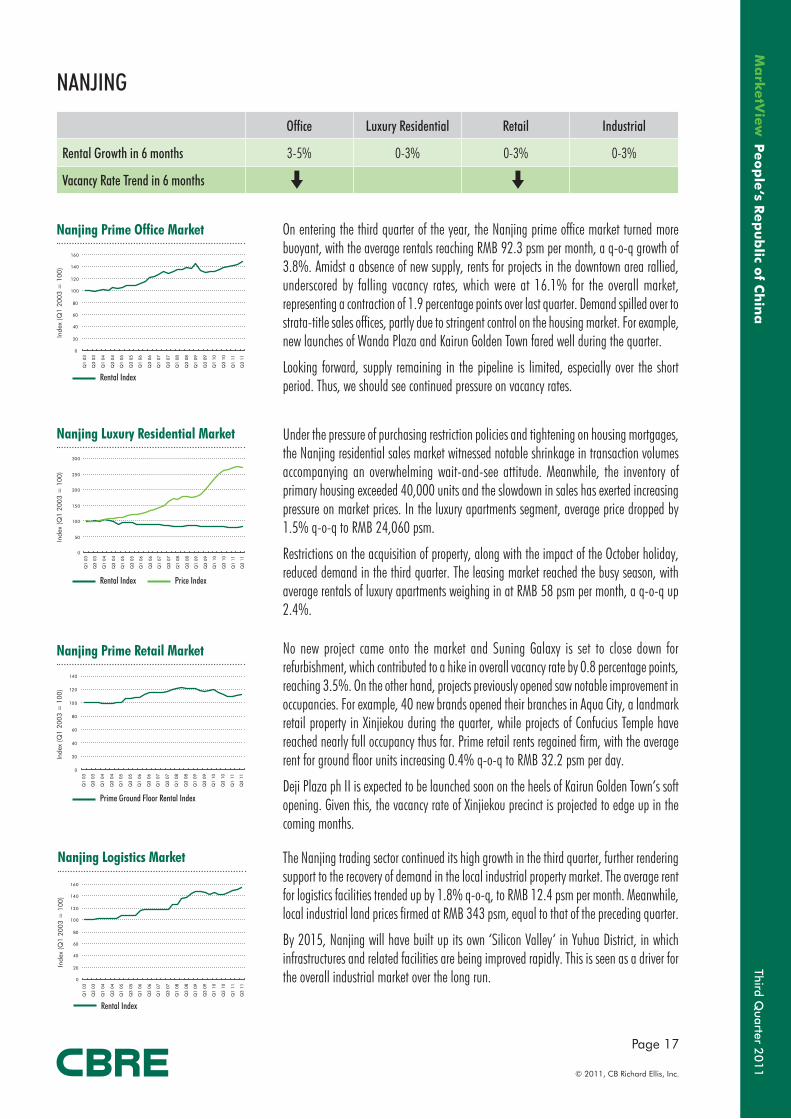
On entering the third quarter of the year, the Nanjing prime office market turned more buoyant, with the average rentals reaching RMB 92.3 psm per month, a q-o-q growth of 3.8%. Amidst a absence of new supply, rents for projects in the downtown area rallied, underscored by falling vacancy rates, which were at 16.1% for the overall market, representing a contraction of 1.9 percentage points over last quarter. Demand spilled over to strata-title sales offices, partly due to stringent control on the housing market. For example, new launches of Wanda Plaza and Kairun Golden Town fared well during the quarter.
Looking forward, supply remaining in the pipeline is limited, especially over the short period. Thus, we should see continued pressure on vacancy rates.
Under the pressure of purchasing restriction policies and tightening on housing mortgages, the Nanjing residential sales market witnessed notable shrinkage in transaction volumes accompanying an overwhelming wait-and-see attitude. Meanwhile, the inventory of primary housing exceeded 40,000 units and the slowdown in sales has exerted increasing pressure on market prices. In the luxury apartments segment, average price dropped by 1.5% q-o-q to RMB 24,060 psm.
Restrictions on the acquisition of property, along with the impact of the October holiday, reduced demand in the third quarter. The leasing market reached the busy season, with average rentals of luxury apartments weighing in at RMB 58 psm per month, a q-o-q up 2.4%.
No new project came onto the market and Suning Galaxy is set to close down for refurbishment, which contributed to a hike in overall vacancy rate by 0.8 percentage points, reaching 3.5%. On the other hand, projects previously opened saw notable improvement in occupancies. For example, 40 new brands opened their branches in Aqua City, a landmark retail property in Xinjiekou during the quarter, while projects of Confucius Temple have reached nearly full occupancy thus far. Prime retail rents regained firm, with the average rent for ground floor units increasing 0.4% q-o-q to RMB 32.2 psm per day.
Deji Plaza ph II is expected to be launched soon on the heels of Kairun Golden Town‘s soft opening. Given this, the vacancy rate of Xinjiekou precinct is projected to edge up in the coming months.
The Nanjing trading sector continued its high growth in the third quarter, further rendering support to the recovery of demand in the local industrial property market. The average rent for logistics facilities trended up by 1.8% q-o-q, to RMB 12.4 psm per month. Meanwhile, local industrial land prices firmed at RMB 343 psm, equal to that of the preceding quarter.
By 2015, Nanjing will have built up its own ‘Silicon Valley‘ in Yuhua District, in which infrastructures and related facilities are being improved rapidly. This is seen as a driver for the overall industrial market over the long run.
Inde
x (Q
1 20
03 =
100
)In
dex
(Q1
2003
= 1
00)
Inde
x (Q
1 20
03 =
100
)In
dex
(Q1
2003
= 1
00)
0
20
40
60
80
100
120
140
160
Q1
03
Q3
03
Q1
04
Q3
04
Q1
05
Q3
05
Q1
06
Q3
06
Q1
07
Q3
07
Q1
08
Q3
08
Q1
09
Q3
09
Q1
10
Q3
10
Q1
11
Q3
11
0
50
100
150
200
250
300
Q1
03
Q3
03
Q1
04
Q3
04
Q1
05
Q3
05
Q1
06
Q3
06
Q1
07
Q3
07
Q1
08
Q3
08
Q1
09
Q3
09
Q1
10
Q3
10
Q1
11
Q3
11
0
20
40
60
80
100
120
140
Q1
03
Q3
03
Q1
04
Q3
04
Q1
05
Q3
05
Q1
06
Q3
06
Q1
07
Q3
07
Q1
08
Q3
08
Q1
09
Q3
09
Q1
10
Q3
10
Q1
11
Q3
11
0
20
40
60
80
100
120
140
160
Q1
03
Q3
03
Q1
04
Q3
04
Q1
05
Q3
05
Q1
06
Q3
06
Q1
07
Q3
07
Q1
08
Q3
08
Q1
09
Q3
09
Q1
10
Q3
10
Q1
11
Q3
11
Third Quarter 2
01
1
Page 18
© 2011, CB Richard Ellis, Inc.
Peo
ple
’s Rep
ub
lic of C
hin
a
Hanghzou Prime Office Market
Rental Index
Rental Index Price Index
Prime Ground Floor Rental Index
Rental Index
Hangzhou Prime Retail Market
Hangzhou Logistics Market
Hangzhou Luxury Residential Market
HANGZHOU
Office Luxury Residential Retail Industrial
Rental Growth in 6 months 0-3% 0-3% 3-5% 3-5%
Vacancy Rate Trend in 6 months
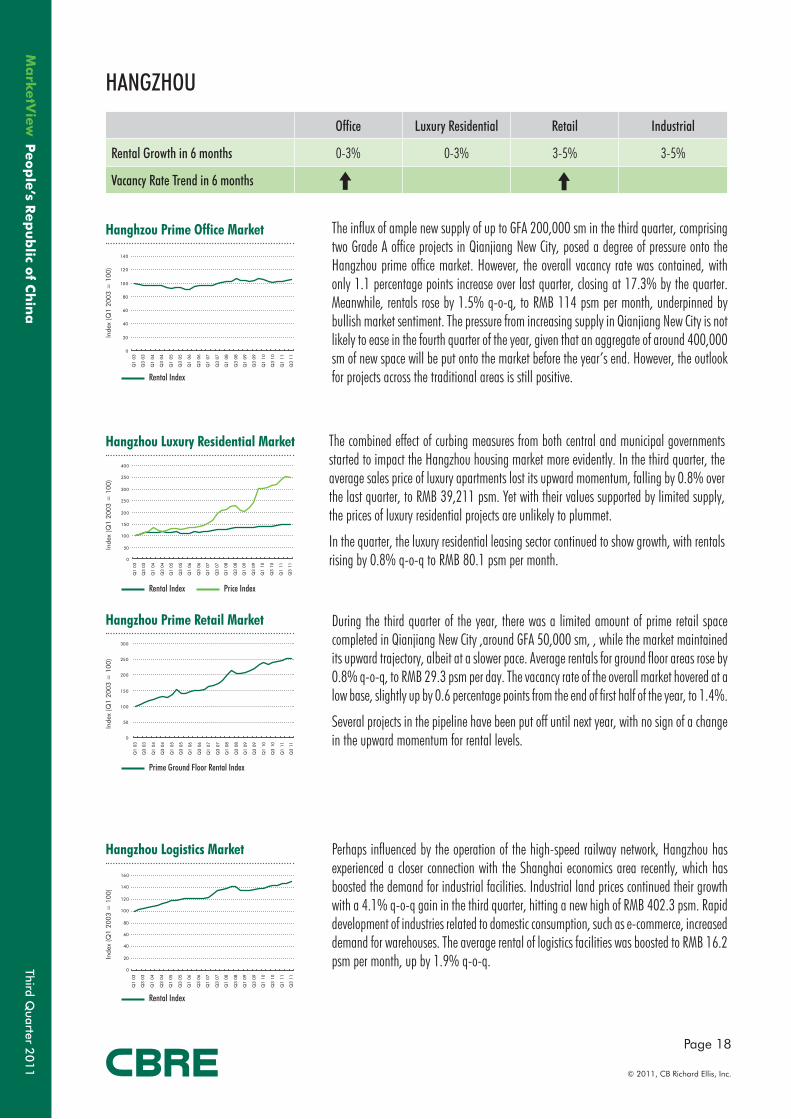
The influx of ample new supply of up to GFA 200,000 sm in the third quarter, comprising two Grade A office projects in Qianjiang New City, posed a degree of pressure onto the Hangzhou prime office market. However, the overall vacancy rate was contained, with only 1.1 percentage points increase over last quarter, closing at 17.3% by the quarter. Meanwhile, rentals rose by 1.5% q-o-q, to RMB 114 psm per month, underpinned by bullish market sentiment. The pressure from increasing supply in Qianjiang New City is not likely to ease in the fourth quarter of the year, given that an aggregate of around 400,000 sm of new space will be put onto the market before the year’s end. However, the outlook for projects across the traditional areas is still positive.
The combined effect of curbing measures from both central and municipal governments started to impact the Hangzhou housing market more evidently. In the third quarter, the average sales price of luxury apartments lost its upward momentum, falling by 0.8% over the last quarter, to RMB 39,211 psm. Yet with their values supported by limited supply, the prices of luxury residential projects are unlikely to plummet.
In the quarter, the luxury residential leasing sector continued to show growth, with rentals rising by 0.8% q-o-q to RMB 80.1 psm per month.
During the third quarter of the year, there was a limited amount of prime retail space completed in Qianjiang New City ,around GFA 50,000 sm, , while the market maintained its upward trajectory, albeit at a slower pace. Average rentals for ground floor areas rose by 0.8% q-o-q, to RMB 29.3 psm per day. The vacancy rate of the overall market hovered at a low base, slightly up by 0.6 percentage points from the end of first half of the year, to 1.4%.
Several projects in the pipeline have been put off until next year, with no sign of a change in the upward momentum for rental levels.
Perhaps influenced by the operation of the high-speed railway network, Hangzhou has experienced a closer connection with the Shanghai economics area recently, which has boosted the demand for industrial facilities. Industrial land prices continued their growth with a 4.1% q-o-q gain in the third quarter, hitting a new high of RMB 402.3 psm. Rapid development of industries related to domestic consumption, such as e-commerce, increased demand for warehouses. The average rental of logistics facilities was boosted to RMB 16.2 psm per month, up by 1.9% q-o-q.
Inde
x (Q
1 20
03 =
100
)In
dex
(Q1
2003
= 1
00)
Inde
x (Q
1 20
03 =
100
)In
dex
(Q1
2003
= 1
00)
0
20
40
60
80
100
120
140
Q1
03
Q3
03
Q1
04
Q3
04
Q1
05
Q3
05
Q1
06
Q3
06
Q1
07
Q3
07
Q1
08
Q3
08
Q1
09
Q3
09
Q1
10
Q3
10
Q1
11
Q3
11
0
50
100
150
200
250
300
350
400
Q1
03
Q3
03
Q1
04
Q3
04
Q1
05
Q3
05
Q1
06
Q3
06
Q1
07
Q3
07
Q1
08
Q3
08
Q1
09
Q3
09
Q1
10
Q3
10
Q1
11
Q3
11
0
50
100
150
200
250
300
Q1
03
Q3
03
Q1
04
Q3
04
Q1
05
Q3
05
Q1
06
Q3
06
Q1
07
Q3
07
Q1
08
Q3
08
Q1
09
Q3
09
Q1
10
Q3
10
Q1
11
Q3
11
0
20
40
60
80
100
120
140
160
Q1
03
Q3
03
Q1
04
Q3
04
Q1
05
Q3
05
Q1
06
Q3
06
Q1
07
Q3
07
Q1
08
Q3
08
Q1
09
Q3
09
Q1
10
Q3
10
Q1
11
Q3
11
Third Quarter 2
01
1
Page 19
© 2011, CB Richard Ellis, Inc.
Peo
ple
‘s Rep
ub
lic of C
hin
a
Ningbo Prime Office Market
Rental Index
Rental Index Price Index
Prime Ground Floor Rental Index
Rental Index
Ningbo Prime Retail Market
Ningbo Logistics Market
Ningbo Luxury Residential Market
NINGBO
Office Luxury Residential Retail Industrial
Rental Growth in 6 months 0-3% 0-3% 0-3% 3-5%
Vacancy Rate Trend in 6 months
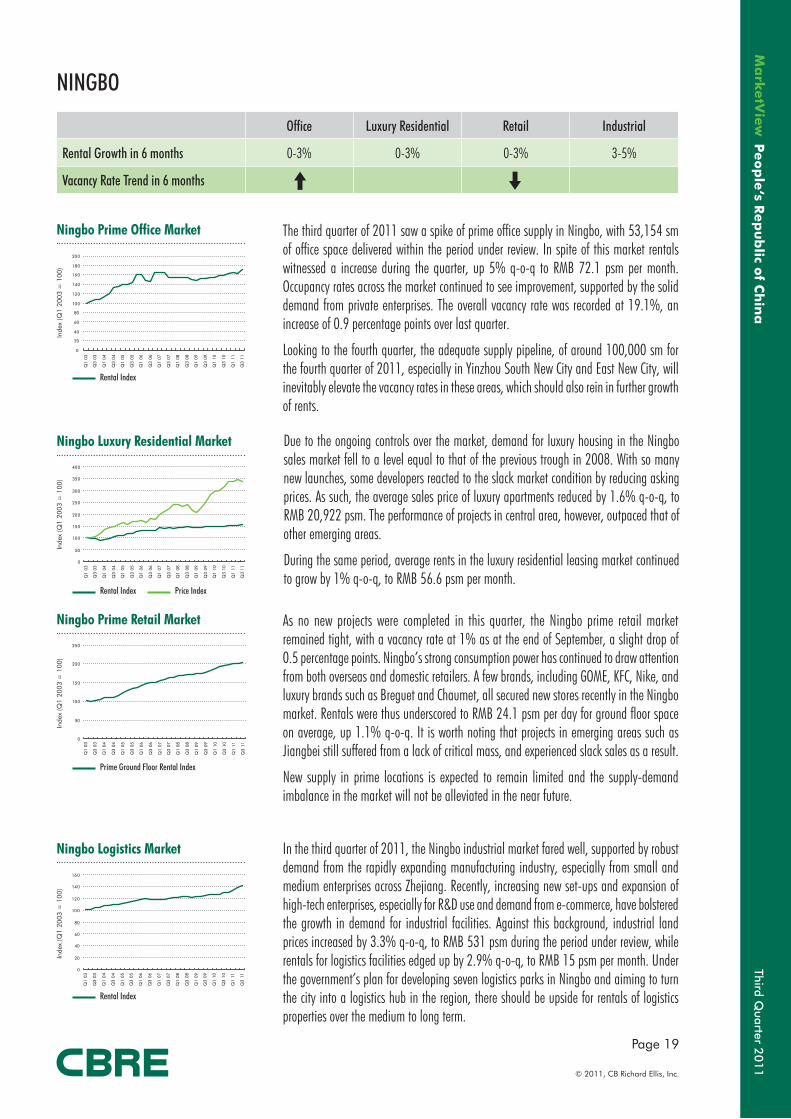
The third quarter of 2011 saw a spike of prime office supply in Ningbo, with 53,154 sm of office space delivered within the period under review. In spite of this market rentals witnessed a increase during the quarter, up 5% q-o-q to RMB 72.1 psm per month. Occupancy rates across the market continued to see improvement, supported by the solid demand from private enterprises. The overall vacancy rate was recorded at 19.1%, an increase of 0.9 percentage points over last quarter.
Looking to the fourth quarter, the adequate supply pipeline, of around 100,000 sm for the fourth quarter of 2011, especially in Yinzhou South New City and East New City, will inevitably elevate the vacancy rates in these areas, which should also rein in further growth of rents.
Due to the ongoing controls over the market, demand for luxury housing in the Ningbo sales market fell to a level equal to that of the previous trough in 2008. With so many new launches, some developers reacted to the slack market condition by reducing asking prices. As such, the average sales price of luxury apartments reduced by 1.6% q-o-q, to RMB 20,922 psm. The performance of projects in central area, however, outpaced that of other emerging areas.
During the same period, average rents in the luxury residential leasing market continued to grow by 1% q-o-q, to RMB 56.6 psm per month.
As no new projects were completed in this quarter, the Ningbo prime retail market remained tight, with a vacancy rate at 1% as at the end of September, a slight drop of 0.5 percentage points. Ningbo’s strong consumption power has continued to draw attention from both overseas and domestic retailers. A few brands, including GOME, KFC, Nike, and luxury brands such as Breguet and Chaumet, all secured new stores recently in the Ningbo market. Rentals were thus underscored to RMB 24.1 psm per day for ground floor space on average, up 1.1% q-o-q. It is worth noting that projects in emerging areas such as Jiangbei still suffered from a lack of critical mass, and experienced slack sales as a result.
New supply in prime locations is expected to remain limited and the supply-demand imbalance in the market will not be alleviated in the near future.
In the third quarter of 2011, the Ningbo industrial market fared well, supported by robust demand from the rapidly expanding manufacturing industry, especially from small and medium enterprises across Zhejiang. Recently, increasing new set-ups and expansion of high-tech enterprises, especially for R&D use and demand from e-commerce, have bolstered the growth in demand for industrial facilities. Against this background, industrial land prices increased by 3.3% q-o-q, to RMB 531 psm during the period under review, while rentals for logistics facilities edged up by 2.9% q-o-q, to RMB 15 psm per month. Under the government’s plan for developing seven logistics parks in Ningbo and aiming to turn the city into a logistics hub in the region, there should be upside for rentals of logistics properties over the medium to long term.
Inde
x (Q
1 20
03 =
100
)In
dex
(Q1
2003
= 1
00)
Inde
x (Q
1 20
03 =
100
)In
dex
(Q1
2003
= 1
00)
0
20
40
60
80
100
120
140
160
180
200
Q1
03
Q3
03
Q1
04
Q3
04
Q1
05
Q3
05
Q1
06
Q3
06
Q1
07
Q3
07
Q1
08
Q3
08
Q1
09
Q3
09
Q1
10
Q3
10
Q1
11
Q3
11
0
50
100
150
200
250
300
350
400
Q1
03
Q3
03
Q1
04
Q3
04
Q1
05
Q3
05
Q1
06
Q3
06
Q1
07
Q3
07
Q1
08
Q3
08
Q1
09
Q3
09
Q1
10
Q3
10
Q1
11
Q3
11
0
50
100
150
200
250
Q1
03
Q3
03
Q1
04
Q3
04
Q1
05
Q3
05
Q1
06
Q3
06
Q1
07
Q3
07
Q1
08
Q3
08
Q1
09
Q3
09
Q1
10
Q3
10
Q1
11
Q3
11
0
20
40
60
80
100
120
140
160
Q1
03
Q3
03
Q1
04
Q3
04
Q1
05
Q3
05
Q1
06
Q3
06
Q1
07
Q3
07
Q1
08
Q3
08
Q1
09
Q3
09
Q1
10
Q3
10
Q1
11
Q3
11
Third Quarter 2
01
1
Page 20
© 2011, CB Richard Ellis, Inc.
Peo
ple
’s Rep
ub
lic of C
hin
a
GUANGZHOU SHENZHEN
SOUTH CHINAUnderpinned by strong demand, the prime property sectors in Guangzhou and Shenzhen continued to rally over the third quarter of the year. Rental growth for office markets accelerated across these two cities, pushed by demand from domestic enterprises and new highs of net absorption. Prime retail rents in Shenzhen increased 5.8% for ground floor space, thanks to a continuous drop in vacancy rate as a consequence of the lack of supply. In Guangzhou, vacancy rates also hovered below 8%, despite the influx of supply seen in the past consecutive four quarters.
Luxury residential sales prices firmed up despite slack sales volume, due to the stringent control over the housing market. Developers maintained caution and were reluctant to launch new projects onto the market, which led to further reductions in transacted volumes. In Shenzhen, there were tentative signs that some developers have increased supply of units onto the market at the end of the quarter to meet pent-up demand; the market’s response is yet to be seen. Prime logistics premises were sought after by enterprises from various manufacturing sectors, with rentals being further driven up.
RENTAL
Guangzhou Shenzhen
Office
Luxury Residential
Retail
Industrial
Third Quarter 2
01
1
Page 21
© 2011, CB Richard Ellis, Inc.
Peo
ple
‘s Rep
ub
lic of C
hin
a
Guangzhou Prime Office Market
Rental Index Price Index
Rental Index Price Index
Guangzhou Luxury Residential Market
GUANGZHOU
Office Luxury Residential Retail Industrial
Rental Growth in 6 months 3-5% 0-3% -3-0% 0-3%
Vacancy Rate Trend in 6 months
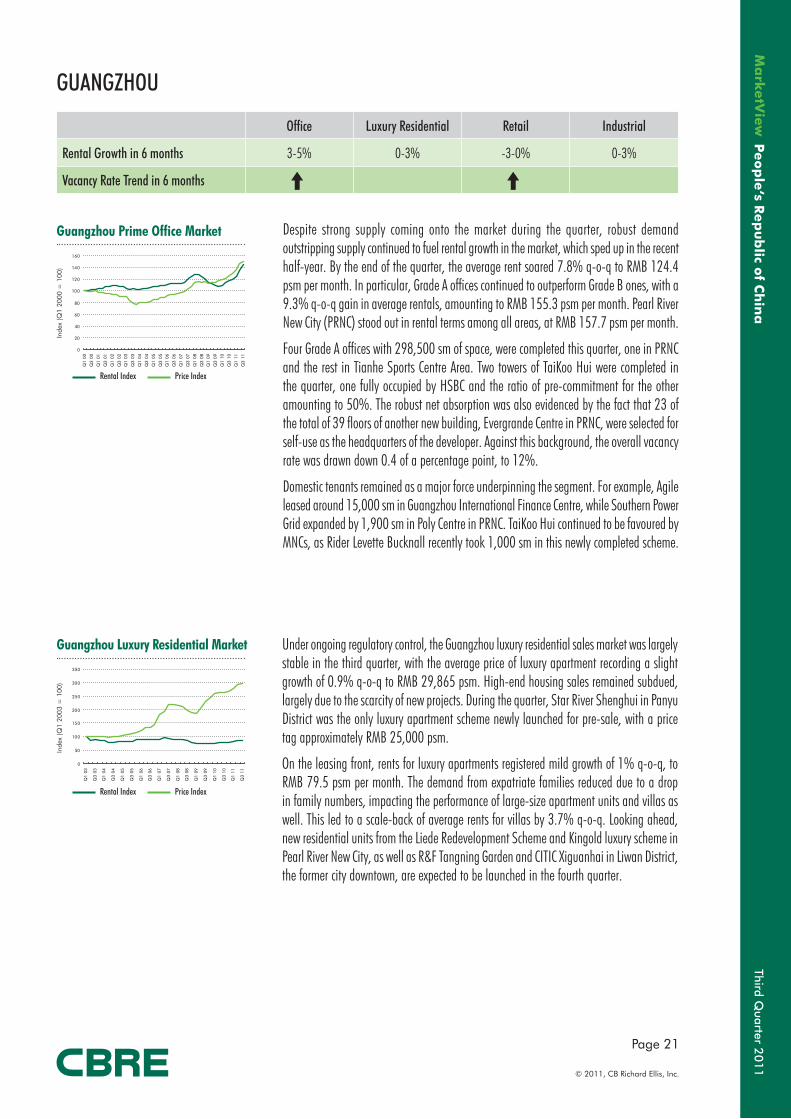
Despite strong supply coming onto the market during the quarter, robust demand outstripping supply continued to fuel rental growth in the market, which sped up in the recent half-year. By the end of the quarter, the average rent soared 7.8% q-o-q to RMB 124.4 psm per month. In particular, Grade A offices continued to outperform Grade B ones, with a 9.3% q-o-q gain in average rentals, amounting to RMB 155.3 psm per month. Pearl River New City (PRNC) stood out in rental terms among all areas, at RMB 157.7 psm per month.
Four Grade A offices with 298,500 sm of space, were completed this quarter, one in PRNC and the rest in Tianhe Sports Centre Area. Two towers of TaiKoo Hui were completed in the quarter, one fully occupied by HSBC and the ratio of pre-commitment for the other amounting to 50%. The robust net absorption was also evidenced by the fact that 23 of the total of 39 floors of another new building, Evergrande Centre in PRNC, were selected for self-use as the headquarters of the developer. Against this background, the overall vacancy rate was drawn down 0.4 of a percentage point, to 12%.
Domestic tenants remained as a major force underpinning the segment. For example, Agile leased around 15,000 sm in Guangzhou International Finance Centre, while Southern Power Grid expanded by 1,900 sm in Poly Centre in PRNC. TaiKoo Hui continued to be favoured by MNCs, as Rider Levette Bucknall recently took 1,000 sm in this newly completed scheme.
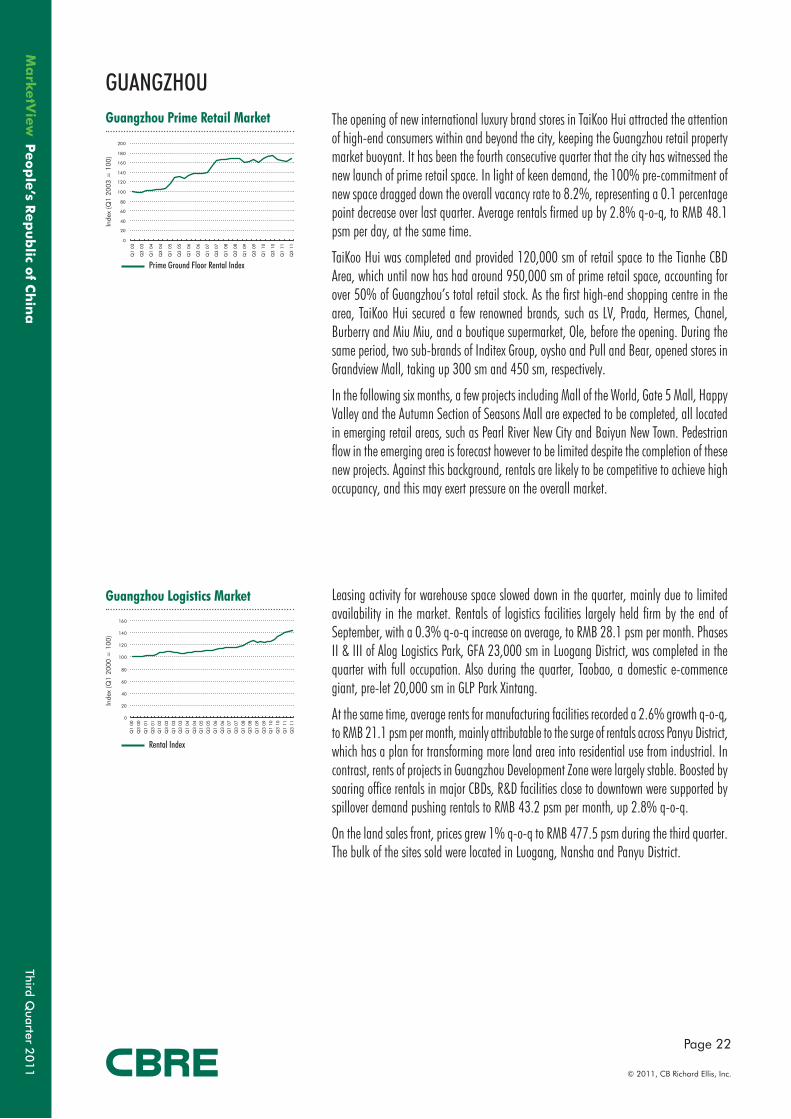
Under ongoing regulatory control, the Guangzhou luxury residential sales market was largely stable in the third quarter, with the average price of luxury apartment recording a slight growth of 0.9% q-o-q to RMB 29,865 psm. High-end housing sales remained subdued, largely due to the scarcity of new projects. During the quarter, Star River Shenghui in Panyu District was the only luxury apartment scheme newly launched for pre-sale, with a price tag approximately RMB 25,000 psm.
On the leasing front, rents for luxury apartments registered mild growth of 1% q-o-q, to RMB 79.5 psm per month. The demand from expatriate families reduced due to a drop in family numbers, impacting the performance of large-size apartment units and villas as well. This led to a scale-back of average rents for villas by 3.7% q-o-q. Looking ahead, new residential units from the Liede Redevelopment Scheme and Kingold luxury scheme in Pearl River New City, as well as R&F Tangning Garden and CITIC Xiguanhai in Liwan District, the former city downtown, are expected to be launched in the fourth quarter.
Inde
x (Q
1 20
00 =
100
)In
dex
(Q1
2003
= 1
00)
0
20
40
60
80
100
120
140
160
Q1
00
Q3
00
Q1
01
Q3
01
Q1
02
Q3
02
Q1
03
Q3
03
Q1
04
Q3
04
Q1
05
Q3
05
Q1
06
Q3
06
Q1
07
Q3
07
Q1
08
Q3
08
Q1
09
Q3
09
Q1
10
Q3
10
Q1
11
Q3
11
0
50
100
150
200
250
300
350
Q1
03
Q3
03
Q1
04
Q3
04
Q1
05
Q3
05
Q1
06
Q3
06
Q1
07
Q3
07
Q1
08
Q3
08
Q1
09
Q3
09
Q1
10
Q3
10
Q1
11
Q3
11
Third Quarter 2
01
1
Page 22
© 2011, CB Richard Ellis, Inc.
Peo
ple
’s Rep
ub
lic of C
hin
a
Prime Ground Floor Rental Index
Rental Index
Guangzhou Prime Retail Market
Guangzhou Logistics Market
GUANGZHOUThe opening of new international luxury brand stores in TaiKoo Hui attracted the attention of high-end consumers within and beyond the city, keeping the Guangzhou retail property market buoyant. It has been the fourth consecutive quarter that the city has witnessed the new launch of prime retail space. In light of keen demand, the 100% pre-commitment of new space dragged down the overall vacancy rate to 8.2%, representing a 0.1 percentage point decrease over last quarter. Average rentals firmed up by 2.8% q-o-q, to RMB 48.1 psm per day, at the same time.
TaiKoo Hui was completed and provided 120,000 sm of retail space to the Tianhe CBD Area, which until now has had around 950,000 sm of prime retail space, accounting for over 50% of Guangzhou’s total retail stock. As the first high-end shopping centre in the area, TaiKoo Hui secured a few renowned brands, such as LV, Prada, Hermes, Chanel, Burberry and Miu Miu, and a boutique supermarket, Ole, before the opening. During the same period, two sub-brands of Inditex Group, oysho and Pull and Bear, opened stores in Grandview Mall, taking up 300 sm and 450 sm, respectively.
In the following six months, a few projects including Mall of the World, Gate 5 Mall, Happy Valley and the Autumn Section of Seasons Mall are expected to be completed, all located in emerging retail areas, such as Pearl River New City and Baiyun New Town. Pedestrian flow in the emerging area is forecast however to be limited despite the completion of these new projects. Against this background, rentals are likely to be competitive to achieve high occupancy, and this may exert pressure on the overall market.
Leasing activity for warehouse space slowed down in the quarter, mainly due to limited availability in the market. Rentals of logistics facilities largely held firm by the end of September, with a 0.3% q-o-q increase on average, to RMB 28.1 psm per month. Phases II & III of Alog Logistics Park, GFA 23,000 sm in Luogang District, was completed in the quarter with full occupation. Also during the quarter, Taobao, a domestic e-commence giant, pre-let 20,000 sm in GLP Park Xintang.
At the same time, average rents for manufacturing facilities recorded a 2.6% growth q-o-q, to RMB 21.1 psm per month, mainly attributable to the surge of rentals across Panyu District, which has a plan for transforming more land area into residential use from industrial. In contrast, rents of projects in Guangzhou Development Zone were largely stable. Boosted by soaring office rentals in major CBDs, R&D facilities close to downtown were supported by spillover demand pushing rentals to RMB 43.2 psm per month, up 2.8% q-o-q.
On the land sales front, prices grew 1% q-o-q to RMB 477.5 psm during the third quarter. The bulk of the sites sold were located in Luogang, Nansha and Panyu District.
Inde
x (Q
1 20
03 =
100
)In
dex
(Q1
2000
= 1
00)
0
20
40
60
80
100
120
140
160
180
200
Q1
03
Q3
03
Q1
04
Q3
04
Q1
05
Q3
05
Q1
06
Q3
06
Q1
07
Q3
07
Q1
08
Q3
08
Q1
09
Q3
09
Q1
10
Q3
10
Q1
11
Q3
11
0
20
40
60
80
100
120
140
160
Q1
00
Q3
00
Q1
01
Q3
01
Q1
02
Q3
02
Q1
03
Q3
03
Q1
04
Q3
04
Q1
05
Q3
05
Q1
06
Q3
06
Q1
07
Q3
07
Q1
08
Q3
08
Q1
09
Q3
09
Q1
10
Q3
10
Q1
11
Q3
11
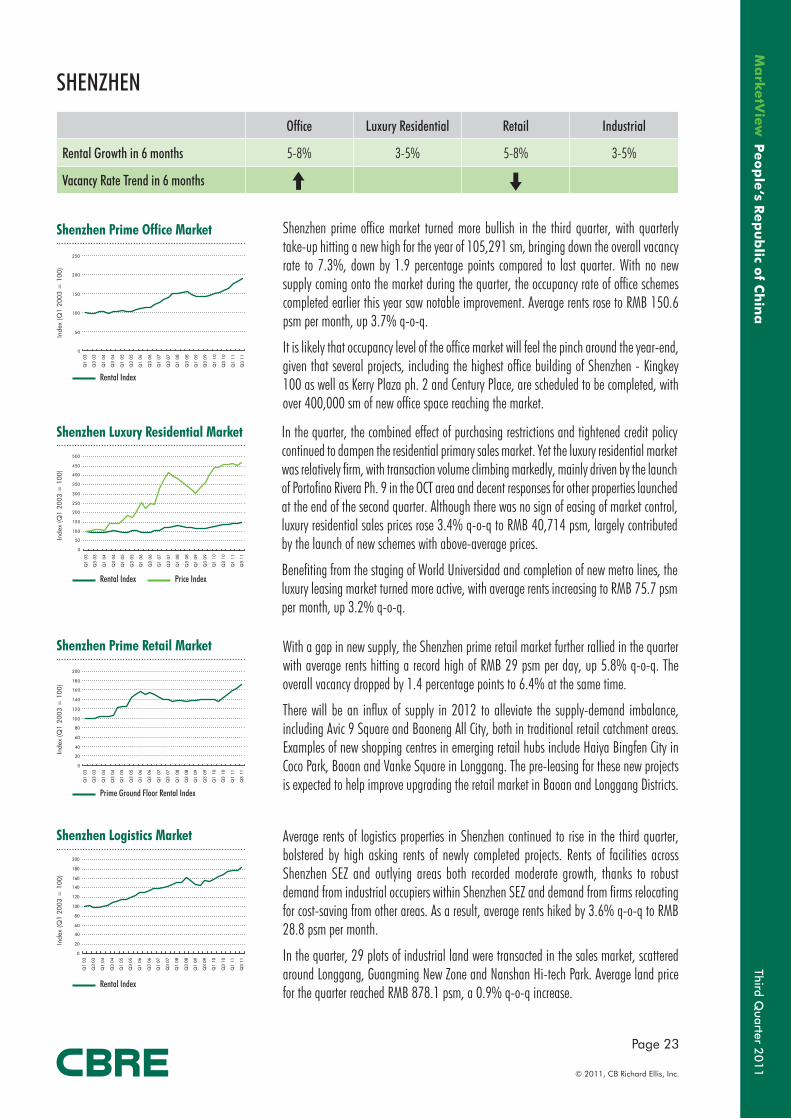
Third Quarter 2
01
1
Page 23
© 2011, CB Richard Ellis, Inc.
Peo
ple
‘s Rep
ub
lic of C
hin
a
Shenzhen Prime Office Market
Rental Index
Rental Index Price Index
Prime Ground Floor Rental Index
Rental Index
Shenzhen Prime Retail Market
Shenzhen Logistics Market
Shenzhen Luxury Residential Market
SHENZHEN
Office Luxury Residential Retail Industrial
Rental Growth in 6 months 5-8% 3-5% 5-8% 3-5%
Vacancy Rate Trend in 6 months
Shenzhen prime office market turned more bullish in the third quarter, with quarterly take-up hitting a new high for the year of 105,291 sm, bringing down the overall vacancy rate to 7.3%, down by 1.9 percentage points compared to last quarter. With no new supply coming onto the market during the quarter, the occupancy rate of office schemes completed earlier this year saw notable improvement. Average rents rose to RMB 150.6 psm per month, up 3.7% q-o-q.
It is likely that occupancy level of the office market will feel the pinch around the year-end, given that several projects, including the highest office building of Shenzhen - Kingkey 100 as well as Kerry Plaza ph. 2 and Century Place, are scheduled to be completed, with over 400,000 sm of new office space reaching the market.
In the quarter, the combined effect of purchasing restrictions and tightened credit policy continued to dampen the residential primary sales market. Yet the luxury residential market was relatively firm, with transaction volume climbing markedly, mainly driven by the launch of Portofino Rivera Ph. 9 in the OCT area and decent responses for other properties launched at the end of the second quarter. Although there was no sign of easing of market control, luxury residential sales prices rose 3.4% q-o-q to RMB 40,714 psm, largely contributed by the launch of new schemes with above-average prices.
Benefiting from the staging of World Universidad and completion of new metro lines, the luxury leasing market turned more active, with average rents increasing to RMB 75.7 psm per month, up 3.2% q-o-q.
With a gap in new supply, the Shenzhen prime retail market further rallied in the quarter with average rents hitting a record high of RMB 29 psm per day, up 5.8% q-o-q. The overall vacancy dropped by 1.4 percentage points to 6.4% at the same time.
There will be an influx of supply in 2012 to alleviate the supply-demand imbalance, including Avic 9 Square and Baoneng All City, both in traditional retail catchment areas. Examples of new shopping centres in emerging retail hubs include Haiya Bingfen City in Coco Park, Baoan and Vanke Square in Longgang. The pre-leasing for these new projects is expected to help improve upgrading the retail market in Baoan and Longgang Districts.
Average rents of logistics properties in Shenzhen continued to rise in the third quarter, bolstered by high asking rents of newly completed projects. Rents of facilities across Shenzhen SEZ and outlying areas both recorded moderate growth, thanks to robust demand from industrial occupiers within Shenzhen SEZ and demand from firms relocating for cost-saving from other areas. As a result, average rents hiked by 3.6% q-o-q to RMB 28.8 psm per month.
In the quarter, 29 plots of industrial land were transacted in the sales market, scattered around Longgang, Guangming New Zone and Nanshan Hi-tech Park. Average land price for the quarter reached RMB 878.1 psm, a 0.9% q-o-q increase.
Inde
x (Q
1 20
03 =
100
)In
dex
(Q1
2003
= 1
00)
Inde
x (Q
1 20
03 =
100
)In
dex
(Q1
2003
= 1
00)
0
50
100
150
200
250
Q1
03
Q3
03
Q1
04
Q3
04
Q1
05
Q3
05
Q1
06
Q3
06
Q1
07
Q3
07
Q1
08
Q3
08
Q1
09
Q3
09
Q1
10
Q3
10
Q1
11
Q3
11
0
50
100
150
200
250
300
350
400
450
500
Q1
03
Q3
03
Q1
04
Q3
04
Q1
05
Q3
05
Q1
06
Q3
06
Q1
07
Q3
07
Q1
08
Q3
08
Q1
09
Q3
09
Q1
10
Q3
10
Q1
11
Q3
11
0
20
40
60
80
100
120
140
160
180
200
Q1
03
Q3
03
Q1
04
Q3
04
Q1
05
Q3
05
Q1
06
Q3
06
Q1
07
Q3
07
Q1
08
Q3
08
Q1
09
Q3
09
Q1
10
Q3
10
Q1
11
Q3
11
0
20
40
60
80
100
120
140
160
180
200
Q1
03
Q3
03
Q1
04
Q3
04
Q1
05
Q3
05
Q1
06
Q3
06
Q1
07
Q3
07
Q1
08
Q3
08
Q1
09
Q3
09
Q1
10
Q3
10
Q1
11
Q3
11
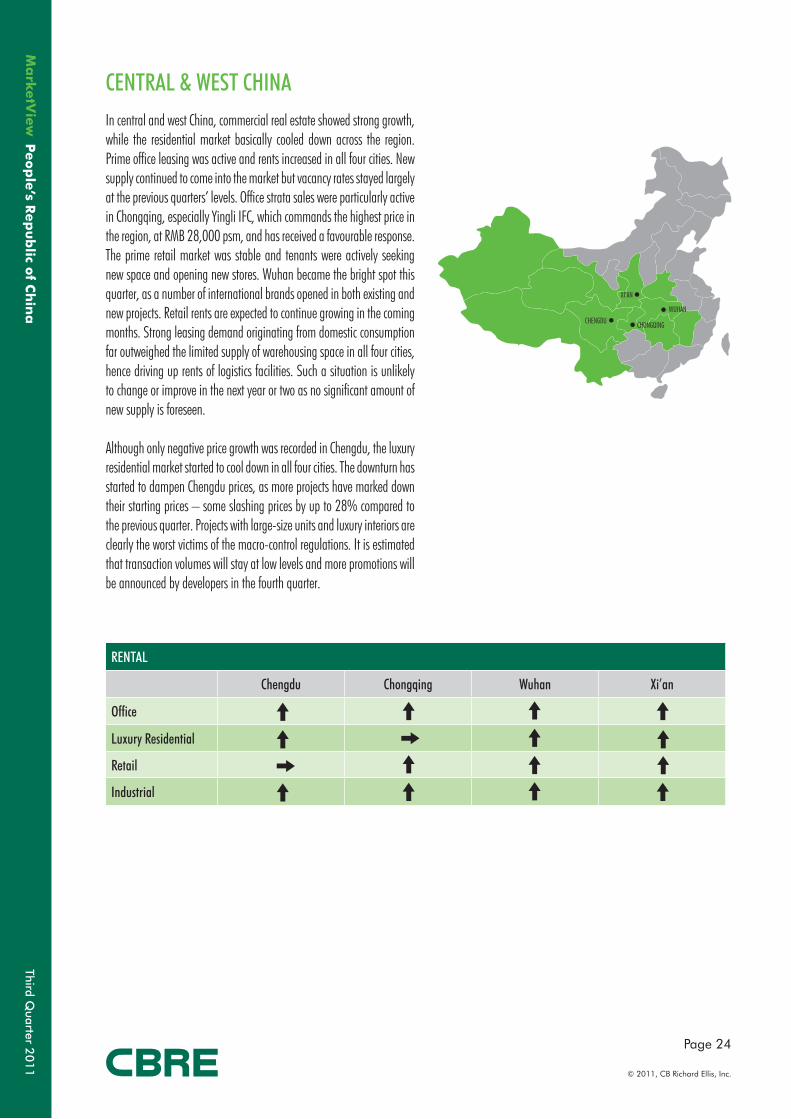
Third Quarter 2
01
1
Page 24
© 2011, CB Richard Ellis, Inc.
Peo
ple
’s Rep
ub
lic of C
hin
a
CENTRAL & WEST CHINAIn central and west China, commercial real estate showed strong growth, while the residential market basically cooled down across the region. Prime office leasing was active and rents increased in all four cities. New supply continued to come into the market but vacancy rates stayed largely at the previous quarters’ levels. Office strata sales were particularly active in Chongqing, especially Yingli IFC, which commands the highest price in the region, at RMB 28,000 psm, and has received a favourable response. The prime retail market was stable and tenants were actively seeking new space and opening new stores. Wuhan became the bright spot this quarter, as a number of international brands opened in both existing and new projects. Retail rents are expected to continue growing in the coming months. Strong leasing demand originating from domestic consumption far outweighed the limited supply of warehousing space in all four cities, hence driving up rents of logistics facilities. Such a situation is unlikely to change or improve in the next year or two as no significant amount of new supply is foreseen.
Although only negative price growth was recorded in Chengdu, the luxury residential market started to cool down in all four cities. The downturn has started to dampen Chengdu prices, as more projects have marked down their starting prices – some slashing prices by up to 28% compared to the previous quarter. Projects with large-size units and luxury interiors are clearly the worst victims of the macro-control regulations. It is estimated that transaction volumes will stay at low levels and more promotions will be announced by developers in the fourth quarter.
RENTAL
Chengdu Chongqing Wuhan Xi’an
Office
Luxury Residential
Retail
Industrial
CHENGDUWUHAN
CHONGQING
XI’AN
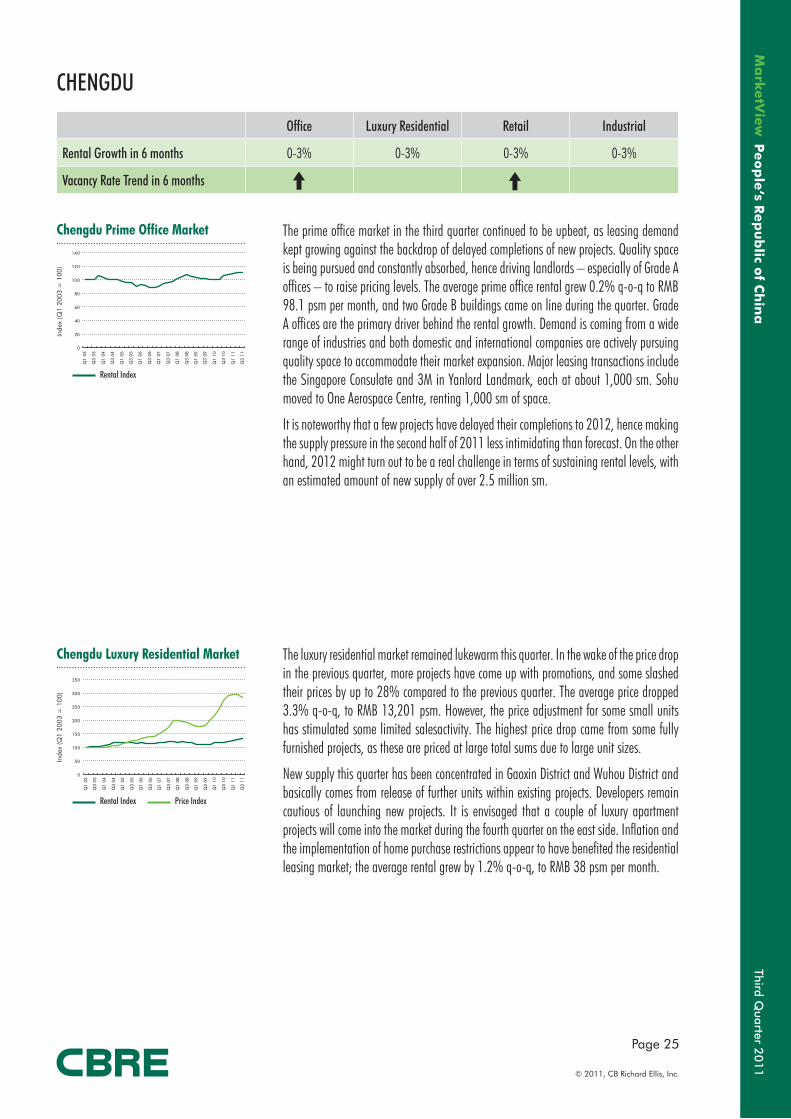
Third Quarter 2
01
1
Page 25
© 2011, CB Richard Ellis, Inc.
Peo
ple
‘s Rep
ub
lic of C
hin
a
Chengdu Prime Office Market
Rental Index
Rental Index Price Index
Chengdu Luxury Residential Market
CHENGDU
Office Luxury Residential Retail Industrial
Rental Growth in 6 months 0-3% 0-3% 0-3% 0-3%
Vacancy Rate Trend in 6 months
The prime office market in the third quarter continued to be upbeat, as leasing demand kept growing against the backdrop of delayed completions of new projects. Quality space is being pursued and constantly absorbed, hence driving landlords – especially of Grade A offices – to raise pricing levels. The average prime office rental grew 0.2% q-o-q to RMB 98.1 psm per month, and two Grade B buildings came on line during the quarter. Grade A offices are the primary driver behind the rental growth. Demand is coming from a wide range of industries and both domestic and international companies are actively pursuing quality space to accommodate their market expansion. Major leasing transactions include the Singapore Consulate and 3M in Yanlord Landmark, each at about 1,000 sm. Sohu moved to One Aerospace Centre, renting 1,000 sm of space.
It is noteworthy that a few projects have delayed their completions to 2012, hence making the supply pressure in the second half of 2011 less intimidating than forecast. On the other hand, 2012 might turn out to be a real challenge in terms of sustaining rental levels, with an estimated amount of new supply of over 2.5 million sm.
The luxury residential market remained lukewarm this quarter. In the wake of the price drop in the previous quarter, more projects have come up with promotions, and some slashed their prices by up to 28% compared to the previous quarter. The average price dropped 3.3% q-o-q, to RMB 13,201 psm. However, the price adjustment for some small units has stimulated some limited salesactivity. The highest price drop came from some fully furnished projects, as these are priced at large total sums due to large unit sizes.
New supply this quarter has been concentrated in Gaoxin District and Wuhou District and basically comes from release of further units within existing projects. Developers remain cautious of launching new projects. It is envisaged that a couple of luxury apartment projects will come into the market during the fourth quarter on the east side. Inflation and the implementation of home purchase restrictions appear to have benefited the residential leasing market; the average rental grew by 1.2% q-o-q, to RMB 38 psm per month.
Inde
x (Q
1 20
03 =
100
)In
dex
(Q1
2003
= 1
00)
0
20
40
60
80
100
120
140
Q1
03
Q3
03
Q1
04
Q3
04
Q1
05
Q3
05
Q1
06
Q3
06
Q1
07
Q3
07
Q1
08
Q3
08
Q1
09
Q3
09
Q1
10
Q3
10
Q1
11
Q3
11
0
50
100
150
200
250
300
350
Q1
03
Q3
03
Q1
04
Q3
04
Q1
05
Q3
05
Q1
06
Q3
06
Q1
07
Q3
07
Q1
08
Q3
08
Q1
09
Q3
09
Q1
10
Q3
10
Q1
11
Q3
11
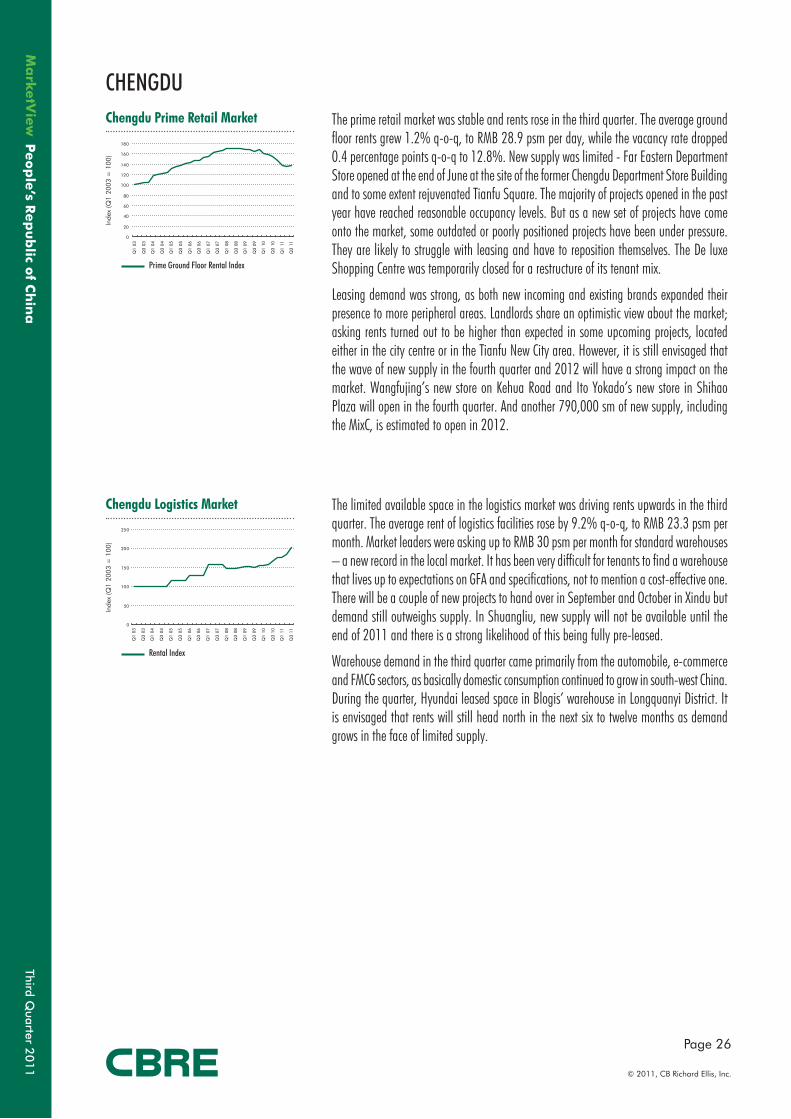
Third Quarter 2
01
1
Page 26
© 2011, CB Richard Ellis, Inc.
Peo
ple
’s Rep
ub
lic of C
hin
a
Prime Ground Floor Rental Index
Rental Index
Chengdu Prime Retail Market
Chengdu Logistics Market
CHENGDUThe prime retail market was stable and rents rose in the third quarter. The average ground floor rents grew 1.2% q-o-q, to RMB 28.9 psm per day, while the vacancy rate dropped 0.4 percentage points q-o-q to 12.8%. New supply was limited - Far Eastern Department Store opened at the end of June at the site of the former Chengdu Department Store Building and to some extent rejuvenated Tianfu Square. The majority of projects opened in the past year have reached reasonable occupancy levels. But as a new set of projects have come onto the market, some outdated or poorly positioned projects have been under pressure. They are likely to struggle with leasing and have to reposition themselves. The De luxe Shopping Centre was temporarily closed for a restructure of its tenant mix.
Leasing demand was strong, as both new incoming and existing brands expanded their presence to more peripheral areas. Landlords share an optimistic view about the market; asking rents turned out to be higher than expected in some upcoming projects, located either in the city centre or in the Tianfu New City area. However, it is still envisaged that the wave of new supply in the fourth quarter and 2012 will have a strong impact on the market. Wangfujing’s new store on Kehua Road and Ito Yokado’s new store in Shihao Plaza will open in the fourth quarter. And another 790,000 sm of new supply, including the MixC, is estimated to open in 2012.
The limited available space in the logistics market was driving rents upwards in the third quarter. The average rent of logistics facilities rose by 9.2% q-o-q, to RMB 23.3 psm per month. Market leaders were asking up to RMB 30 psm per month for standard warehouses – a new record in the local market. It has been very difficult for tenants to find a warehouse that lives up to expectations on GFA and specifications, not to mention a cost-effective one. There will be a couple of new projects to hand over in September and October in Xindu but demand still outweighs supply. In Shuangliu, new supply will not be available until the end of 2011 and there is a strong likelihood of this being fully pre-leased.
Warehouse demand in the third quarter came primarily from the automobile, e-commerce and FMCG sectors, as basically domestic consumption continued to grow in south-west China. During the quarter, Hyundai leased space in Blogis’ warehouse in Longquanyi District. It is envisaged that rents will still head north in the next six to twelve months as demand grows in the face of limited supply.
Inde
x (Q
1 20
03 =
100
)In
dex
(Q1
2003
= 1
00)
0
20
40
60
80
100
120
140
160
180
Q1
03
Q3
03
Q1
04
Q3
04
Q1
05
Q3
05
Q1
06
Q3
06
Q1
07
Q3
07
Q1
08
Q3
08
Q1
09
Q3
09
Q1
10
Q3
10
Q1
11
Q3
11
0
50
100
150
200
250
Q1
03
Q3
03
Q1
04
Q3
04
Q1
05
Q3
05
Q1
06
Q3
06
Q1
07
Q3
07
Q1
08
Q3
08
Q1
09
Q3
09
Q1
10
Q3
10
Q1
11
Q3
11
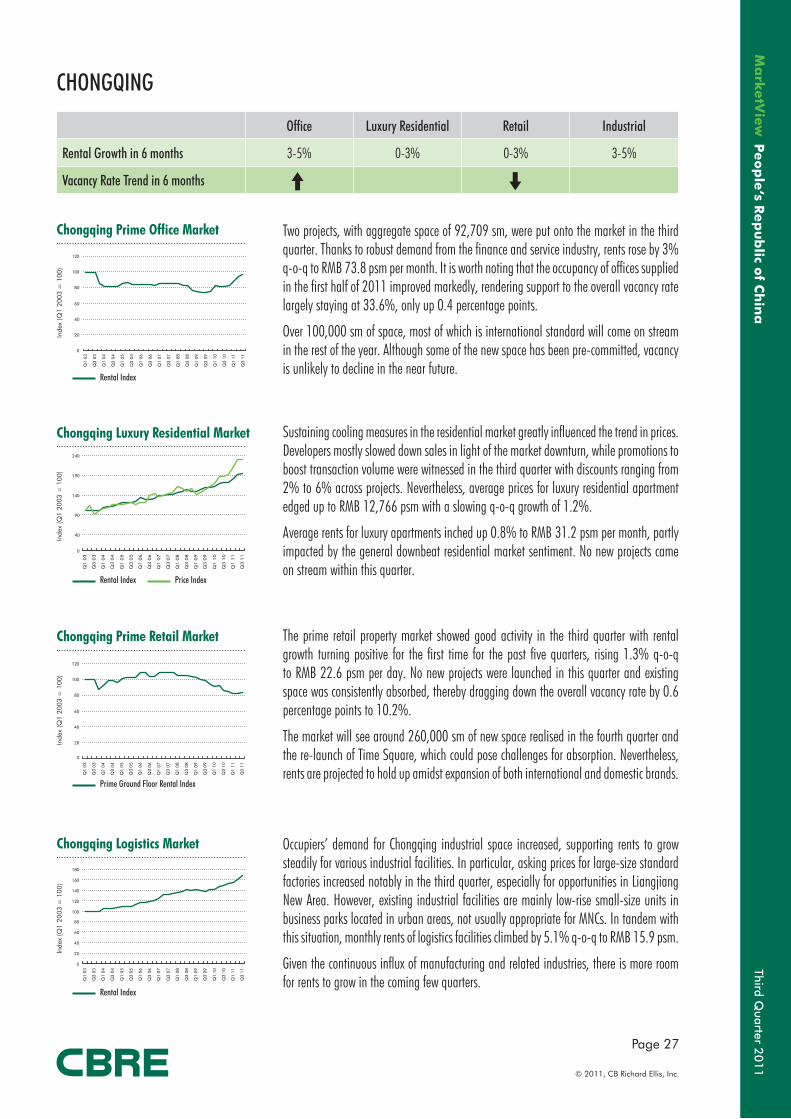
Third Quarter 2
01
1
Page 27
© 2011, CB Richard Ellis, Inc.
Peo
ple
‘s Rep
ub
lic of C
hin
a
Chongqing Prime Office Market
Rental Index
Rental Index Price Index
Prime Ground Floor Rental Index
Rental Index
Chongqing Prime Retail Market
Chongqing Logistics Market
Chongqing Luxury Residential Market
CHONGQING
Office Luxury Residential Retail Industrial
Rental Growth in 6 months 3-5% 0-3% 0-3% 3-5%
Vacancy Rate Trend in 6 months
Two projects, with aggregate space of 92,709 sm, were put onto the market in the third quarter. Thanks to robust demand from the finance and service industry, rents rose by 3% q-o-q to RMB 73.8 psm per month. It is worth noting that the occupancy of offices supplied in the first half of 2011 improved markedly, rendering support to the overall vacancy rate largely staying at 33.6%, only up 0.4 percentage points.
Over 100,000 sm of space, most of which is international standard will come on stream in the rest of the year. Although some of the new space has been pre-committed, vacancy is unlikely to decline in the near future.
Sustaining cooling measures in the residential market greatly influenced the trend in prices. Developers mostly slowed down sales in light of the market downturn, while promotions to boost transaction volume were witnessed in the third quarter with discounts ranging from 2% to 6% across projects. Nevertheless, average prices for luxury residential apartment edged up to RMB 12,766 psm with a slowing q-o-q growth of 1.2%.
Average rents for luxury apartments inched up 0.8% to RMB 31.2 psm per month, partly impacted by the general downbeat residential market sentiment. No new projects came on stream within this quarter.
The prime retail property market showed good activity in the third quarter with rental growth turning positive for the first time for the past five quarters, rising 1.3% q-o-q to RMB 22.6 psm per day. No new projects were launched in this quarter and existing space was consistently absorbed, thereby dragging down the overall vacancy rate by 0.6 percentage points to 10.2%.
The market will see around 260,000 sm of new space realised in the fourth quarter and the re-launch of Time Square, which could pose challenges for absorption. Nevertheless, rents are projected to hold up amidst expansion of both international and domestic brands.
Occupiers’ demand for Chongqing industrial space increased, supporting rents to grow steadily for various industrial facilities. In particular, asking prices for large-size standard factories increased notably in the third quarter, especially for opportunities in Liangjiang New Area. However, existing industrial facilities are mainly low-rise small-size units in business parks located in urban areas, not usually appropriate for MNCs. In tandem with this situation, monthly rents of logistics facilities climbed by 5.1% q-o-q to RMB 15.9 psm.
Given the continuous influx of manufacturing and related industries, there is more room for rents to grow in the coming few quarters.
Inde
x (Q
1 20
03 =
100
)In
dex
(Q1
2003
= 1
00)
Inde
x (Q
1 20
03 =
100
)In
dex
(Q1
2003
= 1
00)
0
20
40
60
80
100
120
Q1
03
Q3
03
Q1
04
Q3
04
Q1
05
Q3
05
Q1
06
Q3
06
Q1
07
Q3
07
Q1
08
Q3
08
Q1
09
Q3
09
Q1
10
Q3
10
Q1
11
Q3
11
0
20
40
60
80
100
120
Q1
03
Q3
03
Q1
04
Q3
04
Q1
05
Q3
05
Q1
06
Q3
06
Q1
07
Q3
07
Q1
08
Q3
08
Q1
09
Q3
09
Q1
10
Q3
10
Q1
11
Q3
11
0
20
40
60
80
100
120
140
160
180
Q1
03
Q3
03
Q1
04
Q3
04
Q1
05
Q3
05
Q1
06
Q3
06
Q1
07
Q3
07
Q1
08
Q3
08
Q1
09
Q3
09
Q1
10
Q3
10
Q1
11
Q3
11
0
40
90
140
190
240
Q1 0
3
Q3 0
3
Q1 0
4
Q3 0
4
Q1 0
5
Q3 0
5
Q1 0
6
Q3 0
6
Q1 0
7
Q3 0
7
Q1 0
8
Q3 0
8
Q1 0
9
Q3 0
9
Q1 1
0
Q3 1
0
Q1 1
1
Q3 1
1
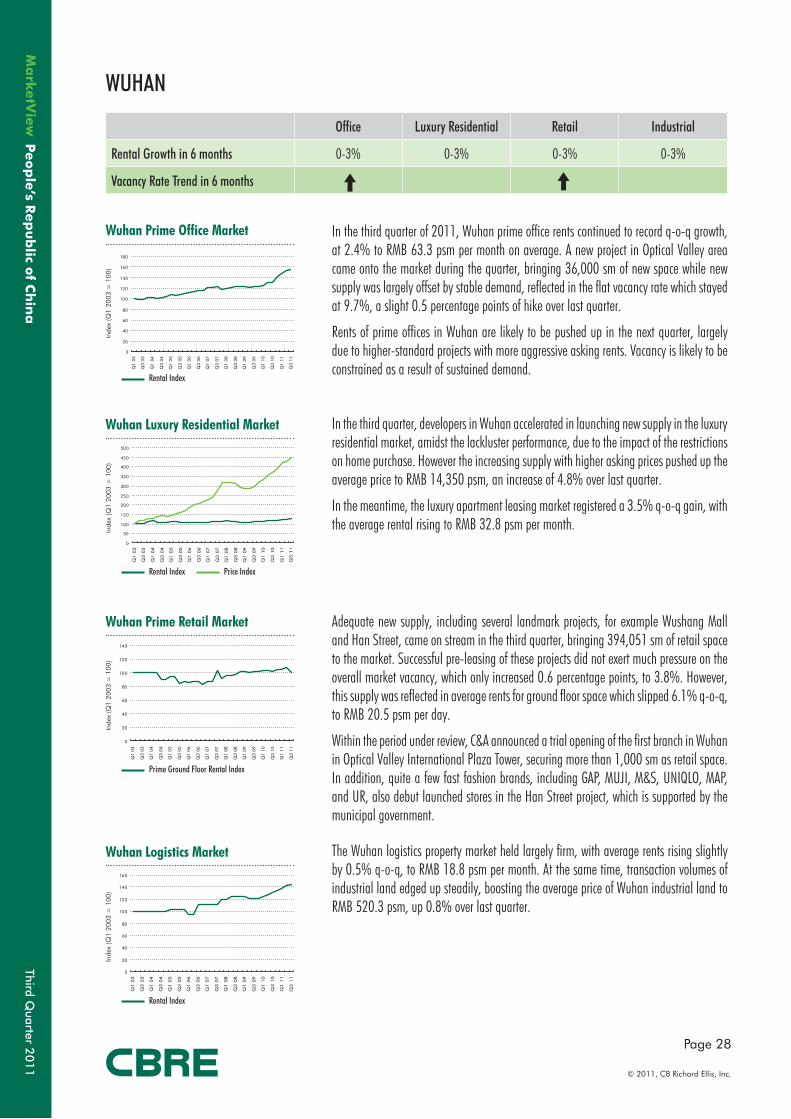
Third Quarter 2
01
1
Page 28
© 2011, CB Richard Ellis, Inc.
Peo
ple
’s Rep
ub
lic of C
hin
a
Wuhan Prime Office Market
Rental Index
Rental Index Price Index
Prime Ground Floor Rental Index
Rental Index
Wuhan Prime Retail Market
Wuhan Logistics Market
Wuhan Luxury Residential Market
WUHAN
Office Luxury Residential Retail Industrial
Rental Growth in 6 months 0-3% 0-3% 0-3% 0-3%
Vacancy Rate Trend in 6 months
In the third quarter of 2011, Wuhan prime office rents continued to record q-o-q growth, at 2.4% to RMB 63.3 psm per month on average. A new project in Optical Valley area came onto the market during the quarter, bringing 36,000 sm of new space while new supply was largely offset by stable demand, reflected in the flat vacancy rate which stayed at 9.7%, a slight 0.5 percentage points of hike over last quarter.
Rents of prime offices in Wuhan are likely to be pushed up in the next quarter, largely due to higher-standard projects with more aggressive asking rents. Vacancy is likely to be constrained as a result of sustained demand.
In the third quarter, developers in Wuhan accelerated in launching new supply in the luxury residential market, amidst the lackluster performance, due to the impact of the restrictions on home purchase. However the increasing supply with higher asking prices pushed up the average price to RMB 14,350 psm, an increase of 4.8% over last quarter.
In the meantime, the luxury apartment leasing market registered a 3.5% q-o-q gain, with the average rental rising to RMB 32.8 psm per month.
Adequate new supply, including several landmark projects, for example Wushang Mall and Han Street, came on stream in the third quarter, bringing 394,051 sm of retail space to the market. Successful pre-leasing of these projects did not exert much pressure on the overall market vacancy, which only increased 0.6 percentage points, to 3.8%. However, this supply was reflected in average rents for ground floor space which slipped 6.1% q-o-q, to RMB 20.5 psm per day.
Within the period under review, C&A announced a trial opening of the first branch in Wuhan in Optical Valley International Plaza Tower, securing more than 1,000 sm as retail space. In addition, quite a few fast fashion brands, including GAP, MUJI, M&S, UNIQLO, MAP, and UR, also debut launched stores in the Han Street project, which is supported by the municipal government.
The Wuhan logistics property market held largely firm, with average rents rising slightly by 0.5% q-o-q, to RMB 18.8 psm per month. At the same time, transaction volumes of industrial land edged up steadily, boosting the average price of Wuhan industrial land to RMB 520.3 psm, up 0.8% over last quarter.
Inde
x (Q
1 20
03 =
100
)In
dex
(Q1
2003
= 1
00)
Inde
x (Q
1 20
03 =
100
)In
dex
(Q1
2003
= 1
00)
0
20
40
60
80
100
120
140
160
180
Q1
03
Q3
03
Q1
04
Q3
04
Q1
05
Q3
05
Q1
06
Q3
06
Q1
07
Q3
07
Q1
08
Q3
08
Q1
09
Q3
09
Q1
10
Q3
10
Q1
11
Q3
11
0
50
100
150
200
250
300
350
400
450
500
Q1
03
Q3
03
Q1
04
Q3
04
Q1
05
Q3
05
Q1
06
Q3
06
Q1
07
Q3
07
Q1
08
Q3
08
Q1
09
Q3
09
Q1
10
Q3
10
Q1
11
Q3
11
0
20
40
60
80
100
120
140
Q1
03
Q3
03
Q1
04
Q3
04
Q1
05
Q3
05
Q1
06
Q3
06
Q1
07
Q3
07
Q1
08
Q3
08
Q1
09
Q3
09
Q1
10
Q3
10
Q1
11
Q3
11
0
20
40
60
80
100
120
140
160
Q1
03
Q3
03
Q1
04
Q3
04
Q1
05
Q3
05
Q1
06
Q3
06
Q1
07
Q3
07
Q1
08
Q3
08
Q1
09
Q3
09
Q1
10
Q3
10
Q1
11
Q3
11
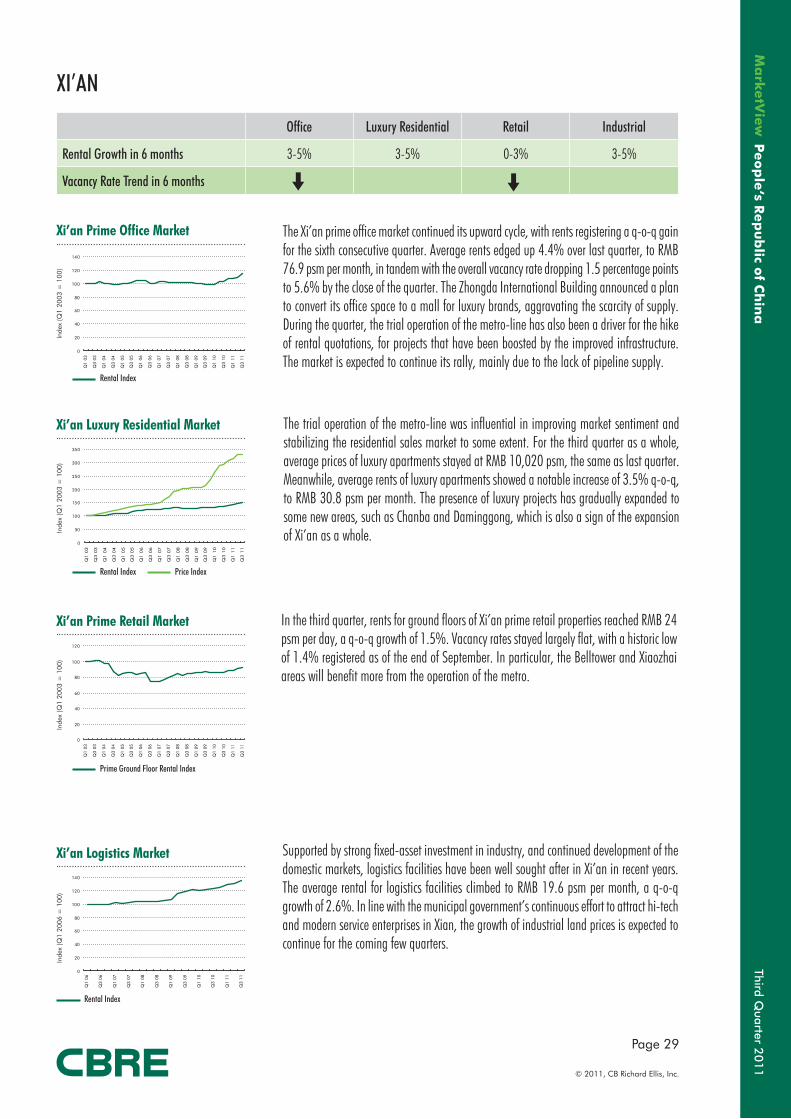
Third Quarter 2
01
1
Page 29
© 2011, CB Richard Ellis, Inc.
Peo
ple
‘s Rep
ub
lic of C
hin
a
Xi’an Prime Office Market
Rental Index
Rental Index Price Index
Prime Ground Floor Rental Index
Xi’an Prime Retail Market
Xi’an Logistics Market
Xi’an Luxury Residential Market
XI’AN
Office Luxury Residential Retail Industrial
Rental Growth in 6 months 3-5% 3-5% 0-3% 3-5%
Vacancy Rate Trend in 6 months
The Xi’an prime office market continued its upward cycle, with rents registering a q-o-q gain for the sixth consecutive quarter. Average rents edged up 4.4% over last quarter, to RMB 76.9 psm per month, in tandem with the overall vacancy rate dropping 1.5 percentage points to 5.6% by the close of the quarter. The Zhongda International Building announced a plan to convert its office space to a mall for luxury brands, aggravating the scarcity of supply. During the quarter, the trial operation of the metro-line has also been a driver for the hike of rental quotations, for projects that have been boosted by the improved infrastructure. The market is expected to continue its rally, mainly due to the lack of pipeline supply.
The trial operation of the metro-line was influential in improving market sentiment and stabilizing the residential sales market to some extent. For the third quarter as a whole, average prices of luxury apartments stayed at RMB 10,020 psm, the same as last quarter. Meanwhile, average rents of luxury apartments showed a notable increase of 3.5% q-o-q, to RMB 30.8 psm per month. The presence of luxury projects has gradually expanded to some new areas, such as Chanba and Daminggong, which is also a sign of the expansion of Xi’an as a whole.
In the third quarter, rents for ground floors of Xi’an prime retail properties reached RMB 24 psm per day, a q-o-q growth of 1.5%. Vacancy rates stayed largely flat, with a historic low of 1.4% registered as of the end of September. In particular, the Belltower and Xiaozhai areas will benefit more from the operation of the metro.
Supported by strong fixed-asset investment in industry, and continued development of the domestic markets, logistics facilities have been well sought after in Xi’an in recent years. The average rental for logistics facilities climbed to RMB 19.6 psm per month, a q-o-q growth of 2.6%. In line with the municipal government’s continuous effort to attract hi-tech and modern service enterprises in Xian, the growth of industrial land prices is expected to continue for the coming few quarters.
Inde
x (Q
1 20
03 =
100
)In
dex
(Q1
2003
= 1
00)
Inde
x (Q
1 20
03 =
100
)In
dex
(Q1
2006
= 1
00)
Rental Index
0
20
40
60
80
100
120
140
Q1
03
Q3
03
Q1
04
Q3
04
Q1
05
Q3
05
Q1
06
Q3
06
Q1
07
Q3
07
Q1
08
Q3
08
Q1
09
Q3
09
Q1
10
Q3
10
Q1
11
Q3
11
0
50
100
150
200
250
300
350
Q1
03
Q3
03
Q1
04
Q3
04
Q1
05
Q3
05
Q1
06
Q3
06
Q1
07
Q3
07
Q1
08
Q3
08
Q1
09
Q3
09
Q1
10
Q3
10
Q1
11
Q3
11
0
20
40
60
80
100
120
Q1
03
Q3
03
Q1
04
Q3
04
Q1
05
Q3
05
Q1
06
Q3
06
Q1
07
Q3
07
Q1
08
Q3
08
Q1
09
Q3
09
Q1
10
Q3
10
Q1
11
Q3
11
0
20
40
60
80
100
120
140
Q1
06
Q3
06
Q1
07
Q3
07
Q1
08
Q3
08
Q1
09
Q3
09
Q1
10
Q3
10
Q1
11
Q3
11
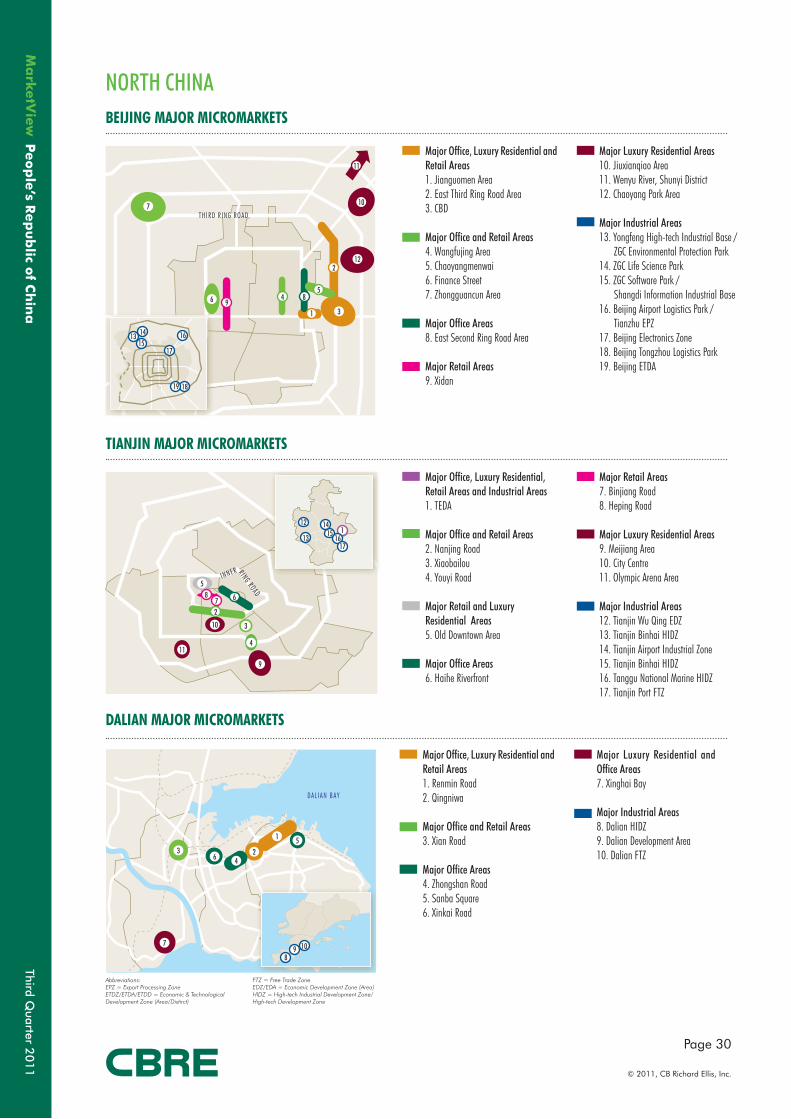
Third Quarter 2
01
1
Page 30
© 2011, CB Richard Ellis, Inc.
Peo
ple
’s Rep
ub
lic of C
hin
a
BEIJING MAJOR MICROMARKETS
31
12
10
11
2
584
96
7
13 1415
16
18
17
19
THIRD RING ROAD
TIANJIN MAJOR MICROMARKETS
310
11
2
68
4
5
9
7
12
13 15 116
14
17
INNER RING ROAD
DALIAN MAJOR MICROMARKETS
3
1
25
46
7
89 10
DALIAN BAY
Major Office, Luxury Residential and Retail Areas1. Jianguomen Area2. East Third Ring Road Area3. CBD
Major Office and Retail Areas4. Wangfujing Area5. Chaoyangmenwai6. Finance Street7. Zhongguancun Area
Major Office Areas8. East Second Ring Road Area
Major Retail Areas9. Xidan
Major Luxury Residential Areas10. Jiuxianqiao Area11. Wenyu River, Shunyi District12. Chaoyang Park Area
Major Industrial Areas13. Yongfeng High-tech Industrial Base / ZGC Environmental Protection Park14. ZGC Life Science Park15. ZGC Software Park / Shangdi Information Industrial Base16. Beijing Airport Logistics Park / Tianzhu EPZ17. Beijing Electronics Zone18. Beijing Tongzhou Logistics Park19. Beijing ETDA
Abbreviations:EPZ = Export Processing ZoneETDZ/ETDA/ETDD = Economic & Technological Development Zone (Area/Distirct)
FTZ = Free Trade ZoneEDZ/EDA = Economic Development Zone (Area)HIDZ = High-tech Industrial Development Zone/High-tech Development Zone
NORTH CHINA
Major Office, Luxury Residential, Retail Areas and Industrial Areas1. TEDA
Major Office and Retail Areas2. Nanjing Road3. Xiaobailou4. Youyi Road
Major Retail and Luxury Residential Areas5. Old Downtown Area
Major Office Areas6. Haihe Riverfront
Major Retail Areas7. Binjiang Road8. Heping Road
Major Luxury Residential Areas9. Meijiang Area10. City Centre11. Olympic Arena Area
Major Industrial Areas12. Tianjin Wu Qing EDZ13. Tianjin Binhai HIDZ14. Tianjin Airport Industrial Zone15. Tianjin Binhai HIDZ16. Tanggu National Marine HIDZ17. Tianjin Port FTZ
Major Office, Luxury Residential and Retail Areas1. Renmin Road2. Qingniwa
Major Office and Retail Areas3. Xian Road
Major Office Areas4. Zhongshan Road5. Sanba Square 6. Xinkai Road
Major Luxury Residential and Office Areas7. Xinghai Bay
Major Industrial Areas8. Dalian HIDZ9. Dalian Development Area10. Dalian FTZ
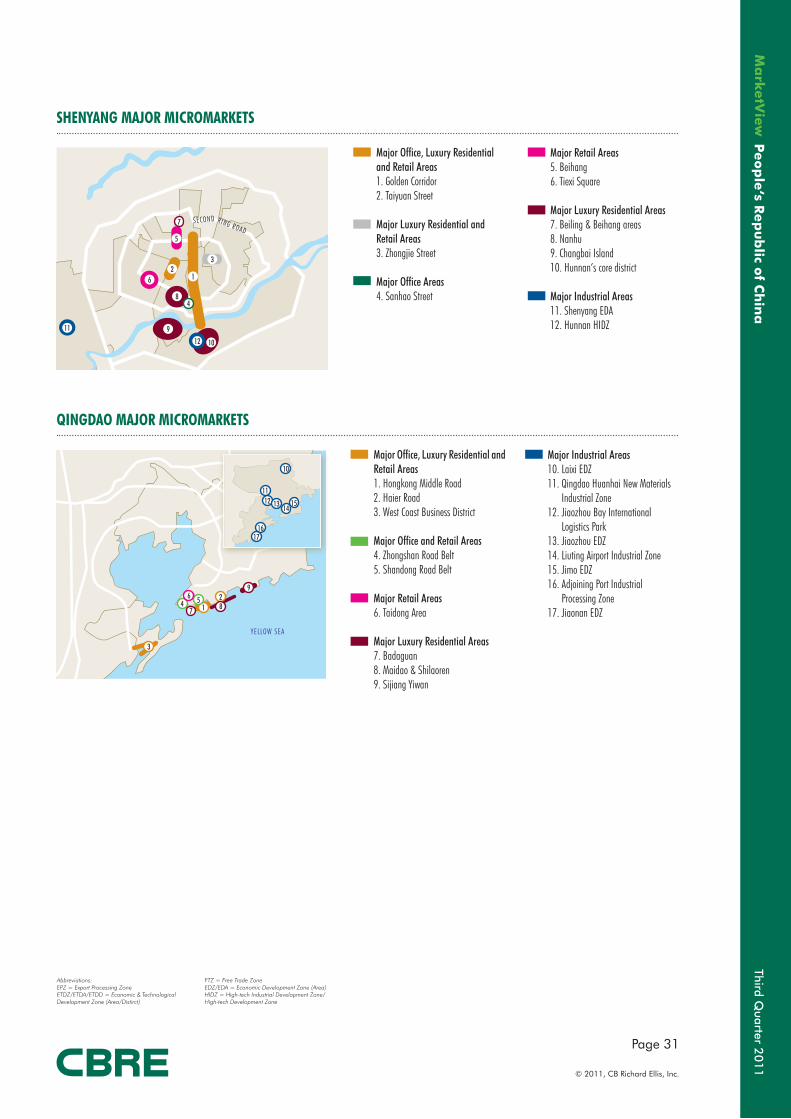
Third Quarter 2
01
1
Page 31
© 2011, CB Richard Ellis, Inc.
Peo
ple
‘s Rep
ub
lic of C
hin
a
QINGDAO MAJOR MICROMARKETS
3
1
12 13
11
2584
10
69
7
1415
1617
YELLOW SEA
SHENYANG MAJOR MICROMARKETS
3
12
8
6
5
9
10
11
12
7
4
RING ROADSECOND
Major Office, Luxury Residential and Retail Areas1. Hongkong Middle Road 2. Haier Road 3. West Coast Business District
Major Office and Retail Areas4. Zhongshan Road Belt5. Shandong Road Belt
Major Retail Areas6. Taidong Area
Major Luxury Residential Areas7. Badaguan 8. Maidao & Shilaoren 9. Sijiang Yiwan
Major Industrial Areas10. Laixi EDZ11. Qingdao Huanhai New Materials Industrial Zone12. Jiaozhou Bay International Logistics Park13. Jiaozhou EDZ14. Liuting Airport Industrial Zone15. Jimo EDZ16. Adjoining Port Industrial Processing Zone17. Jiaonan EDZ
Major Office, Luxury Residential and Retail Areas1. Golden Corridor2. Taiyuan Street
Major Luxury Residential and Retail Areas3. Zhongjie Street
Major Office Areas4. Sanhao Street
Major Retail Areas5. Beihang6. Tiexi Square
Major Luxury Residential Areas7. Beiling & Beihang areas8. Nanhu9. Changbai Island10. Hunnan’s core district
Major Industrial Areas11. Shenyang EDA12. Hunnan HIDZ
Abbreviations:EPZ = Export Processing ZoneETDZ/ETDA/ETDD = Economic & Technological Development Zone (Area/Distirct)
FTZ = Free Trade ZoneEDZ/EDA = Economic Development Zone (Area)HIDZ = High-tech Industrial Development Zone/High-tech Development Zone
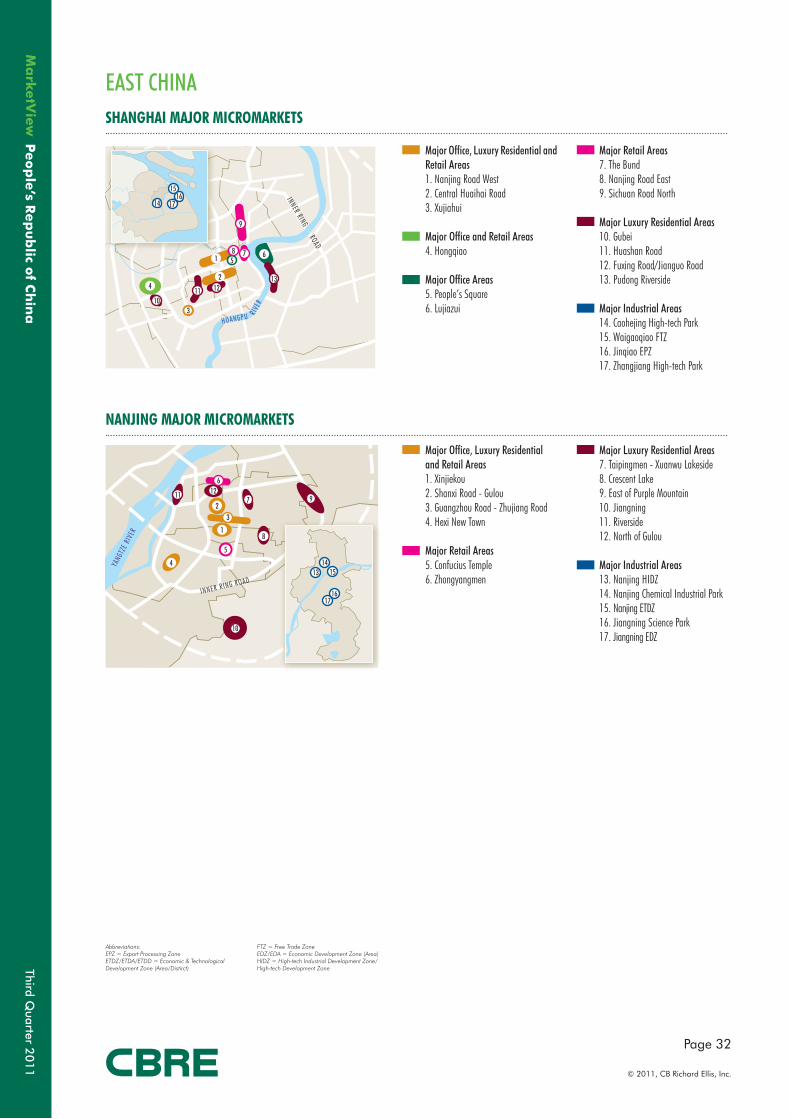
Third Quarter 2
01
1
Page 32
© 2011, CB Richard Ellis, Inc.
Peo
ple
’s Rep
ub
lic of C
hin
a
SHANGHAI MAJOR MICROMARKETS
3
1
1213
11
2
56
4
9
7
10
8
14
1516
17
INNER RING ROAD
HUANGPU RIVE
R
NANJING MAJOR MICROMARKETS
1
1211
3
6
4
97
10
8
2
5 13
1314
15
1617
YANG
TZE
RIVE
R
INNER RING ROAD
Abbreviations:EPZ = Export Processing ZoneETDZ/ETDA/ETDD = Economic & Technological Development Zone (Area/Distirct)
FTZ = Free Trade ZoneEDZ/EDA = Economic Development Zone (Area)HIDZ = High-tech Industrial Development Zone/High-tech Development Zone
EAST CHINA
Major Office, Luxury Residential and Retail Areas1. Nanjing Road West2. Central Huaihai Road3. Xujiahui
Major Office and Retail Areas4. Hongqiao
Major Office Areas5. People’s Square6. Lujiazui
Major Retail Areas7. The Bund8. Nanjing Road East9. Sichuan Road North
Major Luxury Residential Areas10. Gubei11. Huashan Road12. Fuxing Road/Jianguo Road13. Pudong Riverside
Major Industrial Areas14. Caohejing High-tech Park15. Waigaoqiao FTZ16. Jinqiao EPZ17. Zhangjiang High-tech Park
Major Office, Luxury Residential and Retail Areas1. Xinjiekou2. Shanxi Road - Gulou3. Guangzhou Road - Zhujiang Road4. Hexi New Town
Major Retail Areas5. Confucius Temple6. Zhongyangmen
Major Luxury Residential Areas7. Taipingmen - Xuanwu Lakeside8. Crescent Lake9. East of Purple Mountain 10. Jiangning11. Riverside12. North of Gulou
Major Industrial Areas13. Nanjing HIDZ14. Nanjing Chemical Industrial Park15. Nanjing ETDZ16. Jiangning Science Park17. Jiangning EDZ
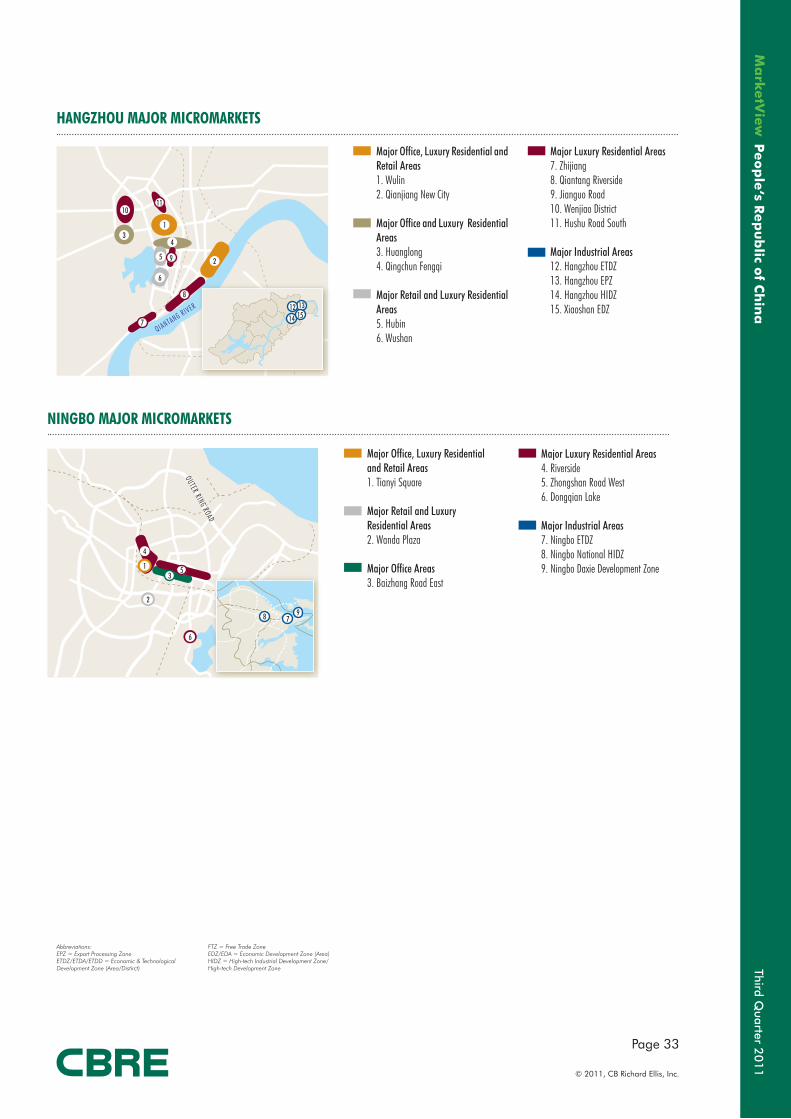
Third Quarter 2
01
1
Page 33
© 2011, CB Richard Ellis, Inc.
Peo
ple
‘s Rep
ub
lic of C
hin
a
HANGZHOU MAJOR MICROMARKETS
31
11
25
8
4
10
6
9
7
13
14 1512
QIANTANG RIVER
NINGBO MAJOR MICROMARKETS
31
2
5
4
6
78 9OUTER RING ROAD
Abbreviations:EPZ = Export Processing ZoneETDZ/ETDA/ETDD = Economic & Technological Development Zone (Area/Distirct)
FTZ = Free Trade ZoneEDZ/EDA = Economic Development Zone (Area)HIDZ = High-tech Industrial Development Zone/High-tech Development Zone
Major Office, Luxury Residential and Retail Areas1. Wulin2. Qianjiang New City
Major Office and Luxury Residential Areas3. Huanglong4. Qingchun Fengqi
Major Retail and Luxury Residential Areas5. Hubin6. Wushan
Major Luxury Residential Areas7. Zhijiang 8. Qiantang Riverside 9. Jianguo Road10. Wenjiao District11. Hushu Road South
Major Industrial Areas12. Hangzhou ETDZ 13. Hangzhou EPZ14. Hangzhou HIDZ15. Xiaoshan EDZ
Major Office, Luxury Residential and Retail Areas1. Tianyi Square
Major Retail and Luxury Residential Areas2. Wanda Plaza
Major Office Areas3. Baizhang Road East
Major Luxury Residential Areas4. Riverside5. Zhongshan Road West6. Dongqian Lake
Major Industrial Areas7. Ningbo ETDZ8. Ningbo National HIDZ9. Ningbo Daxie Development Zone
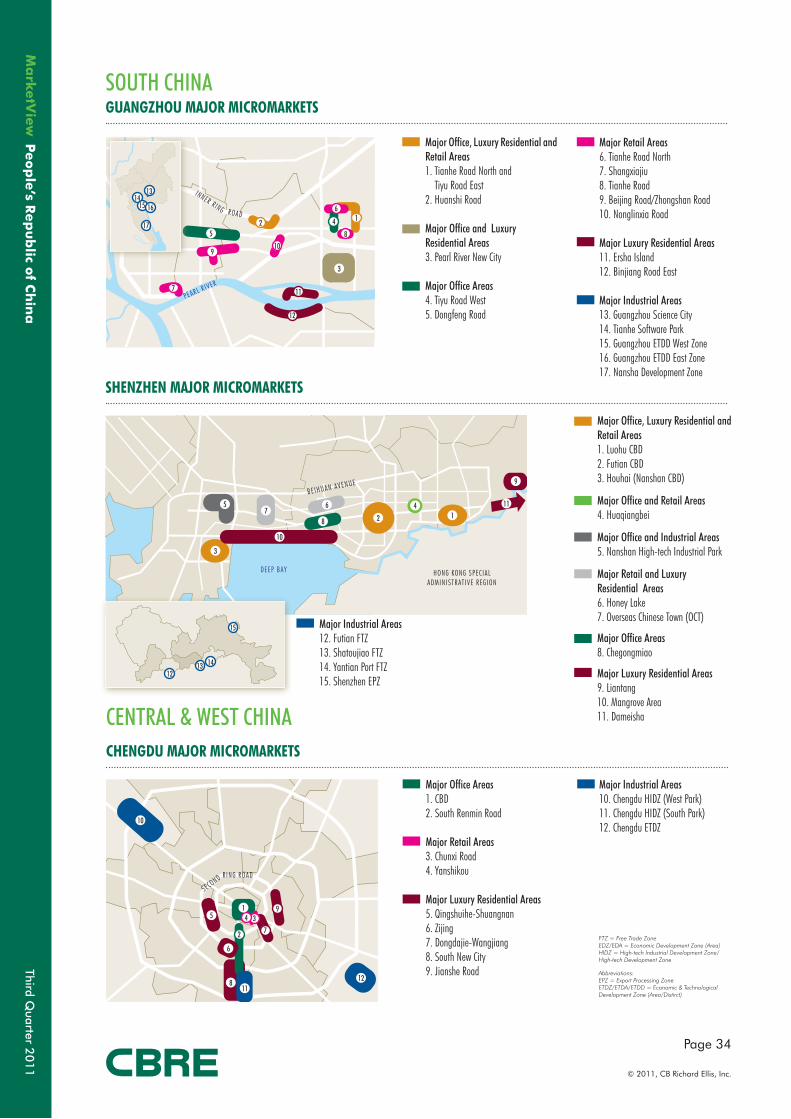
Third Quarter 2
01
1
Page 34
© 2011, CB Richard Ellis, Inc.
Peo
ple
’s Rep
ub
lic of C
hin
aCHENGDU MAJOR MICROMARKETS
3
2
5
8
4
6
7
1
10
1112
9
RING ROAD
SECOND
GUANGZHOU MAJOR MICROMARKETS
4 1
12
11
285
10
6
9
7
1314
15 16
17
INNER RING ROAD
PEARL RIVER
3
SHENZHEN MAJOR MICROMARKETS
3
111
10
28
45
9BEIHUAN AVENUE
HONG KONG SPECIAL ADMINISTRATIVE REGION
67
1213 14
15
DEEP BAY
Major Office Areas1. CBD2. South Renmin Road
Major Retail Areas3. Chunxi Road4. Yanshikou
Major Luxury Residential Areas5. Qingshuihe-Shuangnan6. Zijing7. Dongdajie-Wangjiang8. South New City9. Jianshe Road
Major Industrial Areas10. Chengdu HIDZ (West Park)11. Chengdu HIDZ (South Park)12. Chengdu ETDZ
Abbreviations:EPZ = Export Processing ZoneETDZ/ETDA/ETDD = Economic & Technological Development Zone (Area/Distirct)
FTZ = Free Trade ZoneEDZ/EDA = Economic Development Zone (Area)HIDZ = High-tech Industrial Development Zone/High-tech Development Zone
CENTRAL & WEST CHINA
Major Office, Luxury Residential and Retail Areas1. Tianhe Road North and Tiyu Road East2. Huanshi Road
Major Office and Luxury Residential Areas3. Pearl River New City
Major Office Areas4. Tiyu Road West5. Dongfeng Road
Major Retail Areas6. Tianhe Road North7. Shangxiajiu8. Tianhe Road9. Beijing Road/Zhongshan Road10. Nonglinxia Road
Major Luxury Residential Areas11. Ersha Island12. Binjiang Road East
Major Industrial Areas13. Guangzhou Science City14. Tianhe Software Park15. Guangzhou ETDD West Zone16. Guangzhou ETDD East Zone17. Nansha Development Zone
SOUTH CHINA
Major Industrial Areas12. Futian FTZ13. Shatoujiao FTZ14. Yantian Port FTZ15. Shenzhen EPZ
Major Office, Luxury Residential and Retail Areas1. Luohu CBD2. Futian CBD3. Houhai (Nanshan CBD)
Major Office and Retail Areas4. Huaqiangbei
Major Office and Industrial Areas5. Nanshan High-tech Industrial Park
Major Retail and Luxury Residential Areas6. Honey Lake7. Overseas Chinese Town (OCT)
Major Office Areas8. Chegongmiao
Major Luxury Residential Areas9. Liantang10. Mangrove Area11. Dameisha
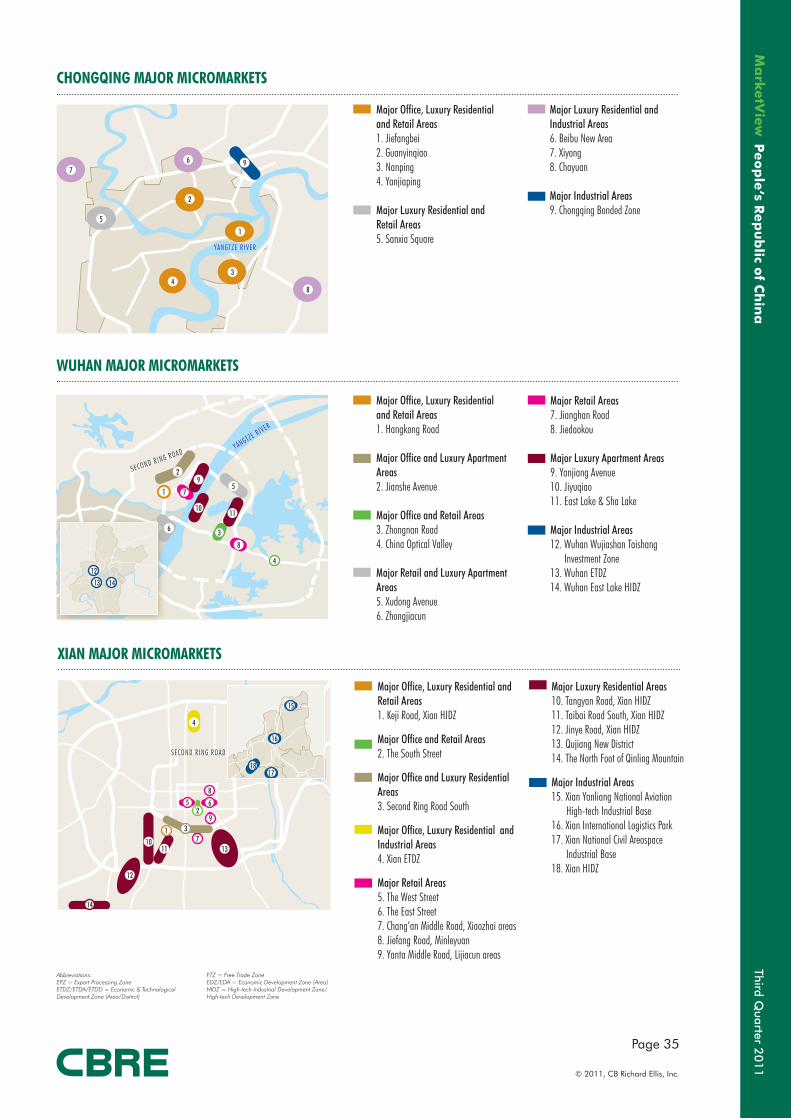
Third Quarter 2
01
1
Page 35
© 2011, CB Richard Ellis, Inc.
Peo
ple
‘s Rep
ub
lic of C
hin
a
CHONGQING MAJOR MICROMARKETS
WUHAN MAJOR MICROMARKETS
51
2
4
36
7
8
1
2
6
4
7
8
3
5
9
1011
9
1213 14
YANGTZE RIVER
SECOND RING ROADYANGTZE RIVER
Major Office, Luxury Residential and Retail Areas1. Jiefangbei2. Guanyinqiao3. Nanping4. Yanjiaping
Major Luxury Residential and Retail Areas5. Sanxia Square
Major Office, Luxury Residential and Retail Areas1. Hangkong Road
Major Office and Luxury Apartment Areas2. Jianshe Avenue
Major Office and Retail Areas3. Zhongnan Road 4. China Optical Valley
Major Retail and Luxury Apartment Areas5. Xudong Avenue6. Zhongjiacun
Major Retail Areas7. Jianghan Road8. Jiedaokou
Major Luxury Apartment Areas9. Yanjiang Avenue10. Jiyuqiao11. East Lake & Sha Lake
Major Industrial Areas12. Wuhan Wujiashan Taishang Investment Zone13. Wuhan ETDZ14. Wuhan East Lake HIDZ
Major Luxury Residential and Industrial Areas6. Beibu New Area7. Xiyong8. Chayuan
Major Industrial Areas9. Chongqing Bonded Zone
Abbreviations:EPZ = Export Processing ZoneETDZ/ETDA/ETDD = Economic & Technological Development Zone (Area/Distirct)
FTZ = Free Trade ZoneEDZ/EDA = Economic Development Zone (Area)HIDZ = High-tech Industrial Development Zone/High-tech Development Zone
XIAN MAJOR MICROMARKETS
2
13
14
12
5
9
7101
11
3
6
8
4
15
16
1718
SECOND RING ROAD
Major Office, Luxury Residential and Retail Areas1. Keji Road, Xian HIDZ
Major Office and Retail Areas2. The South Street
Major Office and Luxury Residential Areas3. Second Ring Road South
Major Office, Luxury Residential and Industrial Areas4. Xian ETDZ
Major Retail Areas5. The West Street6. The East Street7. Chang’an Middle Road, Xiaozhai areas8. Jiefang Road, Minleyuan9. Yanta Middle Road, Lijiacun areas
Major Luxury Residential Areas10. Tangyan Road, Xian HIDZ11. Taibai Road South, Xian HIDZ12. Jinye Road, Xian HIDZ13. Qujiang New District14. The North Foot of Qinling Mountain
Major Industrial Areas15. Xian Yanliang National Aviation High-tech Industrial Base 16. Xian International Logistics Park17. Xian National Civil Areospace Industrial Base18. Xian HIDZ
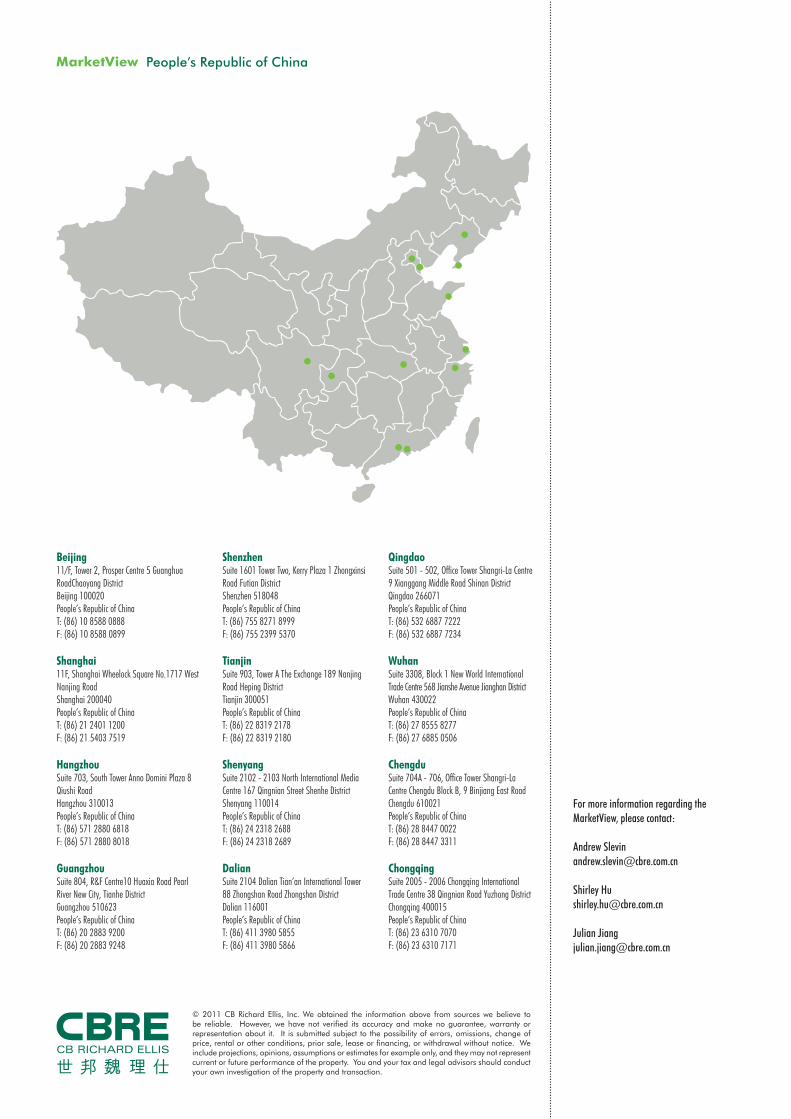
© 2011 CB Richard Ellis, Inc. We obtained the information above from sources we believe to be reliable. However, we have not verified its accuracy and make no guarantee, warranty or representation about it. It is submitted subject to the possibility of errors, omissions, change of price, rental or other conditions, prior sale, lease or financing, or withdrawal without notice. We include projections, opinions, assumptions or estimates for example only, and they may not represent current or future performance of the property. You and your tax and legal advisors should conduct your own investigation of the property and transaction.
People’s Republic of China
For more information regarding the MarketView, please contact:
Andrew [email protected]
Shirley [email protected]
Julian [email protected]
Beijing11/F, Tower 2, Prosper Centre 5 Guanghua RoadChaoyang DistrictBeijing 100020People’s Republic of ChinaT: (86) 10 8588 0888F: (86) 10 8588 0899
Shanghai11F, Shanghai Wheelock Square No.1717 West Nanjing RoadShanghai 200040People’s Republic of ChinaT: (86) 21 2401 1200F: (86) 21 5403 7519
HangzhouSuite 703, South Tower Anno Domini Plaza 8 Qiushi RoadHangzhou 310013People’s Republic of ChinaT: (86) 571 2880 6818F: (86) 571 2880 8018
GuangzhouSuite 804, R&F Centre10 Huaxia Road Pearl River New City, Tianhe DistrictGuangzhou 510623People’s Republic of ChinaT: (86) 20 2883 9200F: (86) 20 2883 9248
ShenzhenSuite 1601 Tower Two, Kerry Plaza 1 Zhongxinsi Road Futian District Shenzhen 518048People’s Republic of ChinaT: (86) 755 8271 8999F: (86) 755 2399 5370
TianjinSuite 903, Tower A The Exchange 189 Nanjing Road Heping DistrictTianjin 300051People’s Republic of ChinaT: (86) 22 8319 2178F: (86) 22 8319 2180
ShenyangSuite 2102 - 2103 North International Media Centre 167 Qingnian Street Shenhe District Shenyang 110014People’s Republic of ChinaT: (86) 24 2318 2688F: (86) 24 2318 2689
DalianSuite 2104 Dalian Tian’an International Tower 88 Zhongshan Road Zhongshan DistrictDalian 116001People’s Republic of ChinaT: (86) 411 3980 5855F: (86) 411 3980 5866
QingdaoSuite 501 - 502, Office Tower Shangri-La Centre 9 Xianggang Middle Road Shinan DistrictQingdao 266071People’s Republic of ChinaT: (86) 532 6887 7222F: (86) 532 6887 7234
WuhanSuite 3308, Block 1 New World International Trade Centre 568 Jianshe Avenue Jianghan District Wuhan 430022People’s Republic of ChinaT: (86) 27 8555 8277F: (86) 27 6885 0506
ChengduSuite 704A - 706, Office Tower Shangri-La Centre Chengdu Block B, 9 Binjiang East RoadChengdu 610021 People’s Republic of ChinaT: (86) 28 8447 0022F: (86) 28 8447 3311
ChongqingSuite 2005 - 2006 Chongqing International Trade Centre 38 Qingnian Road Yuzhong DistrictChongqing 400015People’s Republic of ChinaT: (86) 23 6310 7070F: (86) 23 6310 7171


