Embed Size (px)
Citation preview
P pl P r pt n f H n r t l nt nn xv ll , T nn
Madhuri Sharma
Southeastern Geographer, Volume 54, Number 2, Summer 2014, pp.137-160 (Article)
P bl h d b Th n v r t f N rth r l n PrDOI: 10.1353/sgo.2014.0018
For additional information about this article
Access provided by University of Tennessee @ Knoxville (24 Sep 2014 23:38 GMT)
http://muse.jhu.edu/journals/sgo/summary/v054/54.2.sharma.html
southeastern geographer, 54(2) 2014: pp. 137–160
afectan las decisiones de los consumidores sobre
dónde vivir y con quién vivir. El M-LP sugiere que
en el centro del todo del dinamismo son cinco
elementos—los desarrolladores de las viviendas
y los constructores, los prestamistas, los corre-
dores de bienes raíces, los consumidores y las
comunidades—y que en la época contemporánea,
el papel de la clase es más importante que la raza
o la cultura cuando se toman decisiones de com-
pra de vivienda. Este trabajo analiza las respues-
tas y percepciones de veinte hogares en Knoxville,
y encuentra que las respuestas a la encuesta no in-
dican diferencias significativas en términos de las
preferencias y opciones a través de razas/etnias.
Sin embargo, las entrevistas profundas sacar a
relucir perspicacias matizadas sobre aspectos de
la dirección racial, la discriminación y las prácti-
cas de prestando incobrable. Este análisis también
pone de relieve cómo las percepciones del espacio y
del lugar difieren como la orientación sexual, las
afiliaciones culturales y políticas y responsabili-
dades diferenciadas por género se entrelazan unos
con otros e influir en las decisiones de la gente
sobre dónde vivir y con quién vivir.
key words: market-led pluralism, realtors,
developers, builders, race/ethnicity, sexual
orientation.
palabras clave: mercado encabezada por
pluralismo, corredores de bienes raíces,
desarrolladores, constructores, raza/étnia,
orientación sexual
Peoples’ Perceptions of Housing Market Elements in Knoxville, Tennessee
MADHURI SHARMAUniversity of Tennessee
This article examines the role of race/ethnicity
and contemporary housing market elements
in Knoxville, Tennessee, using the framework
of Market-Led Pluralism (M-LP) as laid out in
Brown and Chung (2008). It examines how race
and class affect consumers’ decisions on where
to live and whom to live with. The M-LP suggests
that at the center of the whole dynamism are five
elements—housing developers/builders, lenders,
realtors, consumers, and communities—and that
in contemporary times, the role of class is more im-
portant than race or culture when making home
buying decisions. This paper analyzes responses
and perceptions of twenty households in Knoxville
and finds that the survey responses do not indicate
significant differences in terms of preferences and
choices across races/ethnicities. However, in-depth
interviews bring out nuanced insights on aspects
of racial steering, discrimination and bad lend-
ing practices. This analysis also highlights how
perceptions of space and place differ as the sexual
orientation, cultural and political affiliations and
gender-differentiated responsibilities intertwine
with each other and influence peoples’ decisions on
where to live and whom to live with.
Este artículo examina el papel de la raza/etnia
y los elementos del mercado de viviendas con-
temporáneas en Knoxville, Tennessee, usando el
marco del mercado encabezada por pluralismo
(M-LP) según lo establecido en Brown y Chung
(2008). El examina cómo la raza y la clase
138 sharma
introduction
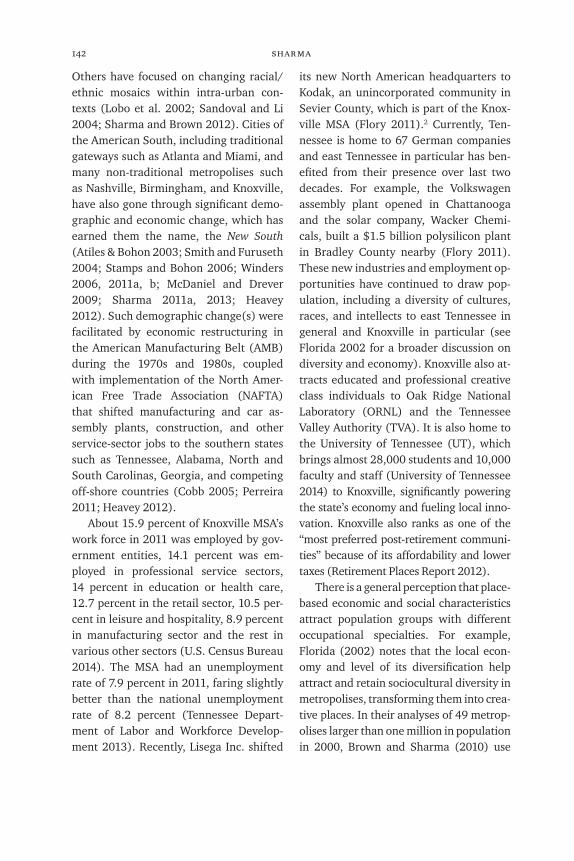
The residential mosaics created by growing diversity in contemporary U.S. urban landscapes are characterized by conflicting perspectives. The intra-urban patterns up until the 1960s and 1970s were shaped by various elements dis-cussed in the urban ecology and tradi-tional frameworks (Burgess 1925; Park 1936). In contemporary times, however, the intra-urban spaces of American metros are shaped by a complex mix of market el-ements such as realtors, developers, build-ers, and bankers/investors on one end of the spectrum and consumers (homeown-ers and renters) and communities on the other. These interactions eventually man-ifest themselves through complex mosaics of segregated and intermixed spaces that are shaped on the basis of class, race, cul-ture, lifecycle, and lifestyles of the con-sumers. Concerning intra-urban spaces, an increasing significance of housing market elements in shaping peoples’ deci-sions have been noted in the framework of Market-Led Pluralism (M-LP) by Brown and Chung (2008). They suggest that the role of traditional frameworks such as assimi-lation, stratification, and resurgent ethnic-ity miss out on adequately explaining con-temporary patterns, while the influence of market makers continue to increase. This paper examines homeowners’ perceptions of various elements of the M-LP frame-work to see how it impacts their decisions of where to live and whom to live with. This study is conducted in the mid-sized metro-politan statistical area (MSA) of Knoxville in east Tennessee (Figure 1). In doing so, I attempt to add a new perspective on var-ious ways in which the southern culture and gender differentiated roles interact
with each other and influence their home buying decisions.1
Concerning Brown and Chung’s (2008) take on contemporary urban patterns, the M-LP suggests that at the center of the whole dynamism are the five elements of the housing market: (i) the housing de-velopers/builders who continually unveil new urban spaces with culturally open communities; (ii) lending agencies that are encouraged and supported by gov-ernment policies and provide highly af-fordable mortgages to an increasingly wide range of households; (iii) real estate brokers and agents for whom the discrim-inatory practices of the past are illegal, profit reducing, and often beside the point in today’s marketplace; (iv) consumers whose preferences emphasize class-type elements such as amenities in housing and neighborhood, tempered by afforda-bility; and (v) communities that impose their own development agenda, or lack thereof, on the housing market that cre-ates distinct spaces and distinguishes one community from another. I evaluate these five elements by asking questions to the consumers, who are the ultimate decision makers. Thus, the questions answered in this analysis are: Do households think differently as consumers than the way a market-maker perceives matters? Do household perceptions differ according to their own characteristics based on their racial/ethnic composition, and neighbor-hood/housing characteristics? To what degree do the market makers influence consumer decisions in a southern metrop-olis of Knoxville?
In this paper, I answer the above ques-tions by analyzing responses from house-hold surveys and open-ended interviews conducted from the summer of 2012 to
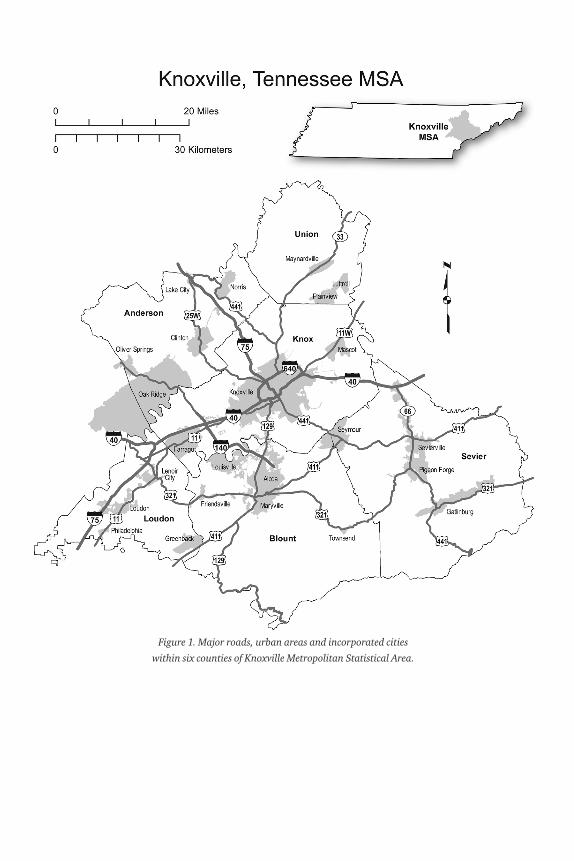
Figure 1. Major roads, urban areas and incorporated cities
within six counties of Knoxville Metropolitan Statistical Area.
140 sharma
and how it impacts residential intermix-ing; and (ii) important empirical work on the use of mixed-methods and qualitative approaches in examining residential pat-terns in American MSAs. The following section on research design discusses the study area, types of data collected, and the methodological steps employed in analyzing the quantitative and qualita-tive data collected during field work. The fourth section discusses analysis of house-hold surveys and in-depth responses along major themes of the M-LP framework. Fi-nally, in my discussions and conclusions, I highlight major findings from this analysis and some nuances from a southern me-tropolis that add a new dimension to the M-LP framework.
background
Conceptual Frameworks, Economic Context and Residential IntermixingPrevious scholars have examined ra-
cial/ethnic residential intermixing using three major frameworks: Assimilation, Stratification and Resurgent Ethnicity. As-similation, based on the melting pot ideal, suggests that immigrants start assimilat-ing into the host society with gains in so-cioeconomic status (SES) over time (Alba 2000). Stratification states that segrega-tion persists due to housing discrimina-tion, racial-stereotyping, and prejudicial preferences (Charles 2000, 2003). Resur-gent Ethnicity addresses why segregation persists even after structural forces asso-ciated with housing discrimination and prejudice declines. However, Brown and Chung (2008) challenge these frame-works as the influence of contemporary housing market has noticeably increased
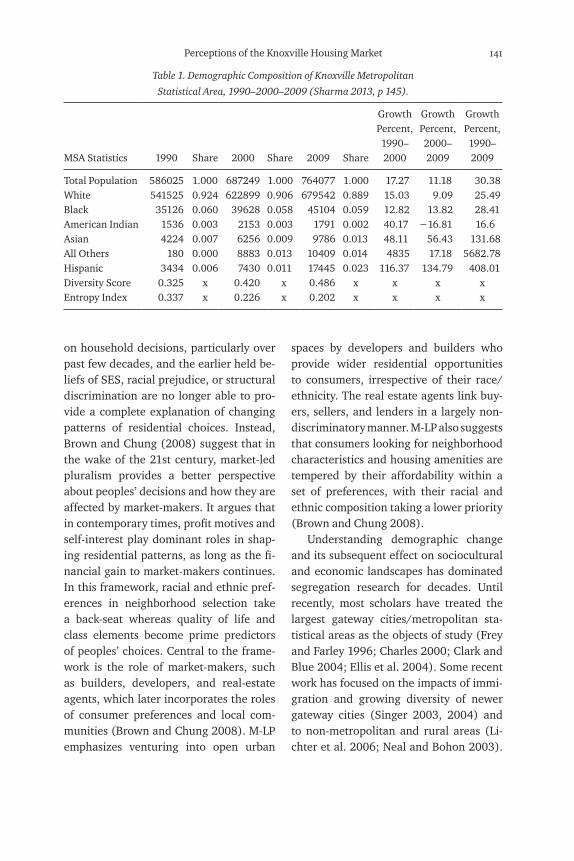
the spring of 2013 with twenty home-owners (including a few foreclosures) in the metropolitan area of Knoxville, Ten-nessee. The analyses of quantitative data from the household surveys and nuanced responses from in-depth interviews helped me examine various aspects of the M-LP’s housing market elements from consumers’ perspectives, and their role in explaining contemporary patterns in Knoxville. In doing so, reflections were also noted on foreclosure(s) that happened due to the economic crises of 2008 coupled with bad lending and mortgage practices that had become a widespread practice during the 2000s. I chose to study Knoxville as it has emerged as a new destination for diversity in the American Southeast over the past decade. Knoxville has had significant eco-nomic, social, and cultural changes since the 1990s. In particular, east Tennessee has once again started attracting manu-facturing industries that have facilitated the growth of its overall population and its diversity. Knoxville’s share of Hispanic, Asian, and African-American segments has increased by 408 percent, 132 percent, and 28 percent respectively during 1990–2009 (Table 1), and its total population is at 764,077 according to 2005–2009 ACS five-year estimate data (Figure 1, includ-ing the six counties definition of Knoxville metropolitan statistical area-MSA). As such, it is important to understand how the various elements of the housing mar-ket and the changing demographic, eco-nomic, and social contexts interact with each other to create distinct landscapes.
This paper proceeds as follows: The next section summarizes major literature on: (i) conceptual frameworks of urban ecology while comparing them with the M-LP framework, its economic context,
Perceptions of the Knoxville Housing Market 141
spaces by developers and builders who provide wider residential opportunities to consumers, irrespective of their race/ethnicity. The real estate agents link buy-ers, sellers, and lenders in a largely non- discriminatory manner. M-LP also suggests that consumers looking for neighborhood characteristics and housing amenities are tempered by their affordability within a set of preferences, with their racial and ethnic composition taking a lower priority (Brown and Chung 2008).
Understanding demographic change and its subsequent effect on sociocultural and economic landscapes has dominated segregation research for decades. Until recently, most scholars have treated the largest gateway cities/metropolitan sta-tistical areas as the objects of study (Frey and Farley 1996; Charles 2000; Clark and Blue 2004; Ellis et al. 2004). Some recent work has focused on the impacts of immi-gration and growing diversity of newer gateway cities (Singer 2003, 2004) and to non-metropolitan and rural areas (Li-chter et al. 2006; Neal and Bohon 2003).
on household decisions, particularly over past few decades, and the earlier held be-liefs of SES, racial prejudice, or structural discrimination are no longer able to pro-vide a complete explanation of changing patterns of residential choices. Instead, Brown and Chung (2008) suggest that in the wake of the 21st century, market-led pluralism provides a better perspective about peoples’ decisions and how they are affected by market-makers. It argues that in contemporary times, profit motives and self-interest play dominant roles in shap-ing residential patterns, as long as the fi-nancial gain to market-makers continues. In this framework, racial and ethnic pref-erences in neighborhood selection take a back-seat whereas quality of life and class elements become prime predictors of peoples’ choices. Central to the frame-work is the role of market-makers, such as builders, developers, and real-estate agents, which later incorporates the roles of consumer preferences and local com-munities (Brown and Chung 2008). M-LP emphasizes venturing into open urban
Table 1. Demographic Composition of Knoxville Metropolitan
Statistical Area, 1990–2000–2009 (Sharma 2013, p 145).
MSA Statistics 1990 Share 2000 Share 2009 Share
Growth Percent, 1990–2000
Growth Percent, 2000– 2009
Growth Percent, 1990–2009
Total Population 586025 1.000 687249 1.000 764077 1.000 17.27 11.18 30.38White 541525 0.924 622899 0.906 679542 0.889 15.03 9.09 25.49Black 35126 0.060 39628 0.058 45104 0.059 12.82 13.82 28.41American Indian 1536 0.003 2153 0.003 1791 0.002 40.17 −16.81 16.6Asian 4224 0.007 6256 0.009 9786 0.013 48.11 56.43 131.68All Others 180 0.000 8883 0.013 10409 0.014 4835 17.18 5682.78Hispanic 3434 0.006 7430 0.011 17445 0.023 116.37 134.79 408.01Diversity Score 0.325 x 0.420 x 0.486 x x x xEntropy Index 0.337 x 0.226 x 0.202 x x x x
142 sharma
its new North American headquarters to Kodak, an unincorporated community in Sevier County, which is part of the Knox-ville MSA (Flory 2011).2 Currently, Ten-nessee is home to 67 German companies and east Tennessee in particular has ben-efited from their presence over last two decades. For example, the Volkswagen assembly plant opened in Chattanooga and the solar company, Wacker Chemi-cals, built a $1.5 billion polysilicon plant in Bradley County nearby (Flory 2011). These new industries and employment op-portunities have continued to draw pop-ulation, including a diversity of cultures, races, and intellects to east Tennessee in general and Knoxville in particular (see Florida 2002 for a broader discussion on diversity and economy). Knoxville also at-tracts educated and professional creative class individuals to Oak Ridge National Laboratory (ORNL) and the Tennessee Valley Authority (TVA). It is also home to the University of Tennessee (UT), which brings almost 28,000 students and 10,000 faculty and staff (University of Tennessee 2014) to Knoxville, significantly powering the state’s economy and fueling local inno-vation. Knoxville also ranks as one of the “most preferred post-retirement communi-ties” because of its affordability and lower taxes (Retirement Places Report 2012).
There is a general perception that place-based economic and social characteristics attract population groups with different occupational specialties. For example, Florida (2002) notes that the local econ-omy and level of its diversification help attract and retain sociocultural diversity in metropolises, transforming them into crea-tive places. In their analyses of 49 metrop-olises larger than one million in population in 2000, Brown and Sharma (2010) use
Others have focused on changing racial/ethnic mosaics within intra-urban con-texts (Lobo et al. 2002; Sandoval and Li 2004; Sharma and Brown 2012). Cities of the American South, including traditional gateways such as Atlanta and Miami, and many non-traditional metropolises such as Nashville, Birmingham, and Knoxville, have also gone through significant demo-graphic and economic change, which has earned them the name, the New South (Atiles & Bohon 2003; Smith and Furuseth 2004; Stamps and Bohon 2006; Winders 2006, 2011a, b; McDaniel and Drever 2009; Sharma 2011a, 2013; Heavey 2012). Such demographic change(s) were facilitated by economic restructuring in the American Manufacturing Belt (AMB) during the 1970s and 1980s, coupled with implementation of the North Amer-ican Free Trade Association (NAFTA) that shifted manufacturing and car as-sembly plants, construction, and other service-sector jobs to the southern states such as Tennessee, Alabama, North and South Carolinas, Georgia, and competing off-shore countries (Cobb 2005; Perreira 2011; Heavey 2012).
About 15.9 percent of Knoxville MSA’s work force in 2011 was employed by gov-ernment entities, 14.1 percent was em-ployed in professional service sectors, 14 percent in education or health care, 12.7 percent in the retail sector, 10.5 per-cent in leisure and hospitality, 8.9 percent in manufacturing sector and the rest in various other sectors (U.S. Census Bureau 2014). The MSA had an unemployment rate of 7.9 percent in 2011, faring slightly better than the national unemployment rate of 8.2 percent (Tennessee Depart-ment of Labor and Workforce Develop-ment 2013). Recently, Lisega Inc. shifted
Perceptions of the Knoxville Housing Market 143
of its historical significance as a music city and richness in American history. In addi-tion, its booming medical, healthcare, and insurance industries, and concomitant de-mand for allied and non-basic economic activities such as services, restaurants, and tourism has also contributed to its diver-sity (Mohl 2003; Winders 2006; Chaney 2010). In a qualitative study of Latino mi-grants in Nashville, Chaney (2010) argues that residential clustering has fostered the growth of various Latino businesses and services throughout southeast Nash-ville. Like the U.S. as a whole, metropoli-tan/urban areas in Tennessee have much higher representations of diversity com-pared to their rural counterparts (Sharma 2011b). Winders (2006, 2011a, b) has emphasized that a growing share of di-versity in Nashville, particularly Latinos, are engaged in low-end service sector jobs. Her emphasis on Latino immigrants and refugees, however, focuses on shift-ing political geographies as they continue to change the social landscape of the city by negotiating their racial/ethnic iden-tities. As such, their social/work spaces become relatively integrated during the day when they are hidden as labor in hotel basements and fast-food kitchens. This situation, however, changes at night when segregated residential geographies once again materialize and southeast Nashville becomes a gathering place for the city’s foreign-born population (Winders 2006, 2011a, b). Along similar lines, Smith and Furuseth’s (2004) analysis of Charlotte, North Carolina documented significant growth in Hispanic, non-Hispanic African- American, and non-Hispanic white popu-lations between 1990 and 2000 coinciding the development of a booming science and technology park that created allied
region as a surrogate for American Man-ufacturing/Rust Belt (AMB) versus Sun Belt economies. They found that the MSAs in the AMB area suffered a heavy burden of sunk costs initially, but were soon ab-sorbed (or written off) by 2000. Several MSAs gained substantially in intermixing over the duration of 1990–2000 compared to MSAs in other regions. A good explana-tion of economic contexts’ impacts on di-versity and mixing can also be derived from history wherein the AMB’s thriving econ-omy under Fordism served as magnets for African-Americans during the Great Migra-tion, and for immigrants from Europe and the Middle East (Geib 1998). These led to the formation of various urban forms such as ethnic enclaves, ghettos, and mono-centric patterns of cities in the early 20th century, whereas edge cities and suburban enclaves became a norm in the late 20th century (Geib 1998). Noticeable growth in the populations of African-Americans and other minorities occurred at city centers due to their proximity to employment opportunities, and this legacy continues today due to community-inertia effects (Brown and Sharma 2010; Sharma and Brown 2012). The Great Migration of African-Americans to the North and the Pa-cific coast, therefore, was not synonymous with social liberation from racism and discrimination as they still lived in highly segregated spaces in their destination cit-ies and were over-represented in relatively low-paying, difficult, and hazardous jobs, primarily in three industrial groups: iron and steel, slaughtering and meatpacking, and building-construction (Geib 1998).
Nashville, Tennessee has recently been recognized as a new destination for His-panic immigrants and refugees moving to the American South, particularly because

144 sharma
While Gotham tried to better under-stand existing frameworks, Brown and Chung (2008) used qualitative methods to articulate their Market-Led Pluralism framework. M-LP was initially proposed as a rudimentary framework in Brown and Chung (2006) using census data that was subsequently refined in Chung and Brown (2007). The framework was fully articulated only in 2008 when the authors (Brown and Chung) used census-data based findings along with interviews with supply side of the housing market and com-munities from Columbus Ohio to gain bet-ter understanding of various perspectives. They extensively employed primary data, such as key informant interviews, archival research, and participant and site obser-vations from Columbus neighborhoods, and local-knowledge, focusing on the framework’s five key components—build-ers, bankers/lenders, real-estate agents, consumers, and local communities. Thus, whereas they originally spoke of the lend-ing sector simply by briefly mentioning it, in their 2008 paper, they note the follow-ing commentary by a lender that added value to the overall context,
Consumers are much more educated today at all SES levels. In 1990, when conventional mortgages were the norm, buyers often didn’t even know the difference between [or conse-quences of] a fixed or variable rate. Today major developers and lenders make a point of informing and educat-ing people. Also, home ownership is perceived by the market as much more possible, whereas that wasn’t the case in 1990 . . . [Just as] you can get into a new car for so much per month, the pitch [in today’s housing market] is
opportunities in infrastructure and con-struction, and related low-waged service activities. Overall, the southern cities, especially new Latino destinations such as Atlanta, Nashville, Birmingham, Knox-ville, and Charlotte, have shown signifi-cant gains in diversity, driven by economic growth in construction, manufacturing, technology and service sector.
Use of Qualitative Methods in Segregation ResearchZuniga and Hernandez-Leon (2005)
provide many examples concerning the use of qualitative methods in social sci-ence research. These include surveys and focus groups with government agen-cies, immigrant workers, and community members in various Midwestern states; the use of guided conversations with com-munity stakeholders, employers, and im-migrants in Louisiana; and participant-ob-servations followed by in-depth interviews in Pennsylvania. Among the few that use both quantitative and qualitative meth-ods, Gotham (2002a, b) examines Kansas City by first using U.S. Census data and then through in-depth discussions with re-altors, developers, public officials, neigh-borhood residents, and the like. He starts conceptually with the invasion-succession and stratification frameworks, illustrated through maps showing the distribution of African-Americans in 1950, 1960, and 1970. He then turns to modes such as (i) archival research using a variety of pub-lic documents and local newspaper articles concerning racial change; (ii) in-depth dis-cussions and oral histories with local resi-dents; and (iii) in-depth semi-structured interviews with real estate agents, civil rights activists, neighborhood coalition leaders, and city planners.
Perceptions of the Knoxville Housing Market 145
I attempted to recruit households from all six counties, the final sample repre-sented only four. The sample of twenty respondents, however, was an adequate representation of the geographic, socio-economic and racial/ethnic diversity of Knoxville MSA. This research focused on examining household responses concern-ing the five elements of the M-LP frame-work. To answer the questions discussed earlier in this paper, I conducted house-hold surveys and open-ended interviews with twenty homeowners, including a few foreclosures. Emphasis was placed on homeowners from major racial/eth-nic groups of white, African-American, Latino, and Asian, including mixed-race households. Respondents were not dis-criminated based on marital status, life-cycle, sexual orientation, or similar at-tributes. Methods employed for recruiting households included neighborhood recon-naissance, community leaders, friends, shops/business owners, and I also relied upon snowball and random sampling. Fly-ers were posted at strategic places such as shops/bars, and internet advertisements on craigslist (craigslist 2012) were also posted to attract wider pool of participants from different geographic locations of Knoxville since it is spatially very different in terms of affluence.
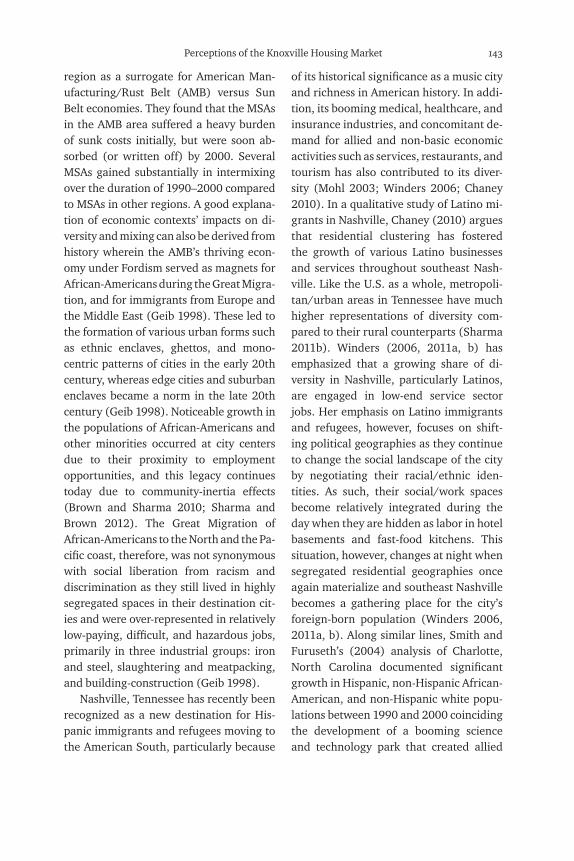
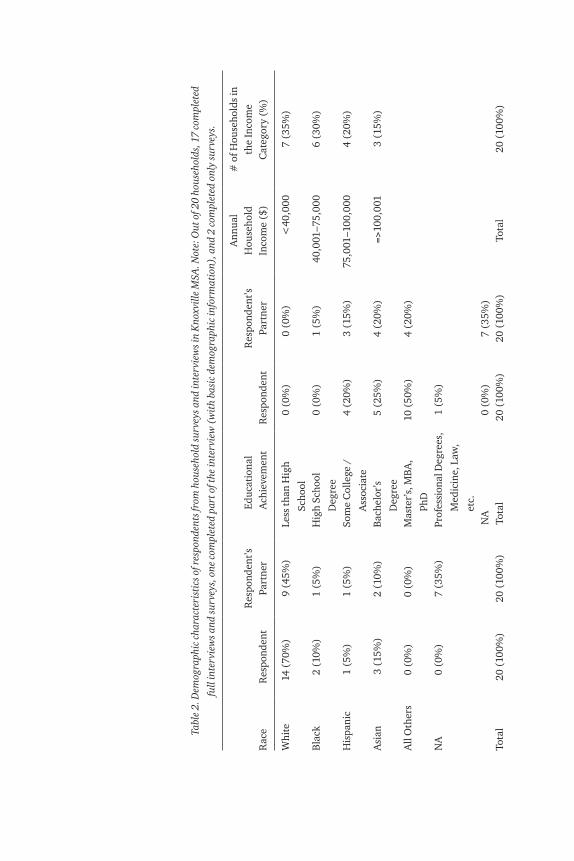
Table 2 shows the sample size and types of data collected. A concerted effort was made to have minority respondents, and a snowball sampling technique, along with help from religious and cultural in-stitutions, was sought. Table 2 shows that 70 percent of respondents were white, 10 percent were black, 15 percent were Asian, and 5 percent were Hispanic, which broadly corresponds to the overall demo-graphics of Knoxville (Table 1). The task of
[often] in terms of present or current costs, not future costs (Brown and Chung 2008, p 193).
The interviews by Gotham helped him explain various frameworks of segrega-tion, using ground-level realities in Kan-sas City. Likewise, Brown and Chung used similar methods to articulate a framework to explain contemporary intermixing patterns. By using mixed methods in this study, I help explain why distinct spaces are created in Knoxville, which enhances our understanding of the broad patterns of changing diversity and intermixing that build upon my previous quantitative stud-ies (Sharma 2011a, 2013). Such use of mixed-methods also contributes to meth-odological advancement in social science research that has generally been domi-nated by either nomothetic or ideographic approaches, but not both together. This approach thus helps to expand the M-LP framework from a household and a multi- city perspective, and demonstrates how nuanced perceptions of households can be masked in quantitative survey responses. As such, this paper also speaks to the rich-ness and quality of data gathered from mixed-method approaches and the ben-efits associated with adopting such prac-tices in social science research, particu-larly when dealing with issues pertaining to human and social behavior.
research design
This research used household surveys and in-depth, open-ended interviews with respondents from the MSA of Knoxville, Tennessee, which consists of six counties: Anderson, Blount, Knox, Loudon, Sevier, and Union (Figure 1 and Table 1). While
Tabl
e 2.
Dem
ogra
phic
cha
ract
eris
tics
of r
espo
nden
ts fr
om h
ouse
hold
surv
eys a
nd in
terv
iew
s in
Kno
xvill
e M
SA. N
ote:
Out
of 2
0 ho
useh
olds
, 17
com
plet
ed
full
inte
rvie
ws a
nd su
rvey
s, o
ne c
ompl
eted
par
t of t
he in
terv
iew
(w
ith
basi
c de
mog
raph
ic in
form
atio
n), a
nd 2
com
plet
ed o
nly
surv
eys.
Rac
eR
espo
nden
tR
espo
nden
t’s
Part
ner
Educ
atio
nal
Ach
ieve
men
tR
espo
nden
tR
espo
nden
t’s
Part
ner
Ann
ual
Hou
seho
ld
Inco
me
($)
# o
f Hou
seho
lds
in
the
Inco
me
C
ateg
ory
(%)
Whi
te14
(70
%)
9 (4
5%)
Less
than
Hig
h
Scho
ol
0 (0
%)
0 (0
%)
<40
,000
7 (3
5%)
Bla
ck2
(10%
)1
(5%
)H
igh
Scho
ol
Deg
ree
0 (0
%)
1 (5
%)
40,0
01–7
5,00
06
(30%
)
His
pani
c1
(5%
)1
(5%
)So
me
Col
lege
/
Ass
ocia
te
4 (2
0%)
3 (1
5%)
75,0
01–1
00,0
004
(20%
)
Asi
an3
(15%
)2
(10%
)B
ache
lor’
s
Deg
ree
5 (2
5%)
4 (2
0%)
=>10
0,00
13
(15%
)
All
Oth
ers
0 (0
%)
0 (0
%)
Mas
ter’
s, M
BA,
PhD
10 (
50%
)4
(20%
)
NA
0 (0
%)
7 (3
5%)
Prof
essi
onal
Deg
rees
,
Med
icin
e, L
aw,
etc.
1 (5
%)
NA
0 (0
%)
7 (3
5%)
Tota
l20
(10
0%)
20 (
100%
)To
tal
20 (
100%
)20
(10
0%)
Tota
l20
(10
0%)
IV: A
ge C
ompo
siti
onV:
Gen
der
VI:
Mar
ital
Sta
tus
Age
(Ye
ars)
Res
pond
ent
Res
pond
ent’s
Pa
rtne
rG
ende
rR
espo
nden
tR
espo
nden
t’s
Part
ner
Mar
ital
Sta
tus
of
Res
pond
ents
# o
f Hou
seho
lds
18–3
51
(5%
)3
(15%
)To
tal 5
Mal
es
3 W
hite
, 2 A
sian
5 (2
5%)
9 (4
5%)
Sing
le/U
nmar
ried
5 (2
5%)
36–5
010
(50
%)
5 (2
5%)
Tota
l 15
Fem
ales
11
Whi
te, 2
Bla
ck,
1 A
sian
, 1 L
atin
o
15 (
75%
)4
(20%
)M
arri
ed (
wit
h ki
ds)
7 (3
5%)
51–6
57
(35%
)3
(15%
)0
(0%
)7
(35%
)M
arri
ed (
no k
ids)
2 (1
0%)
66–7
52
(10%
)1
(10%
)Li
ving
wit
h pa
rtne
r2
(10%
)
> 7
50
(0%
)0
(0%
)D
ivor
ced
4 (2
0%)
Not
ap
plic
able
0 (0
%)
8 (4
0%)
Oth
ers
(Ple
ase
spec
ify)
0 (0
%)
Tota
l20
(10
0%)
20 (
100%
)To
tal
20 (
100%
)20
(10
0%)
Tota
l20
(10
0%)
VII
: Geo
grap
hyN
umbe
rs o
f res
pond
ents
from
the
coun
ties
: 14
from
Kno
x,
3 fr
om B
loun
t, 2
from
Sev
ier
and
1 fr
om L
oudo
n
148 sharma
between 1990 and 2009 whereas growth rates for Asians and Hispanics were 132 percent and 408 percent respectively for the same period. Currently, Hispanics seem to be a visible minority, particularly in the western and southern areas of the MSA, which have recently seen growth in construction, manufacturing and service sector economy (Sharma 2011a, 2013). Overall the metro has become more di-verse, with its diversity score increasing from 0.325 (1990) to 0.486 (2009), and its entropy index (measure of segrega-tion) changing from 0.337 (1990) to 0.202 (2009), thus making the whole MSA far more intermixed in 2009 than it was in 1990 (Table 1).3 The following sections discuss findings from household surveys and in-depth interviews.
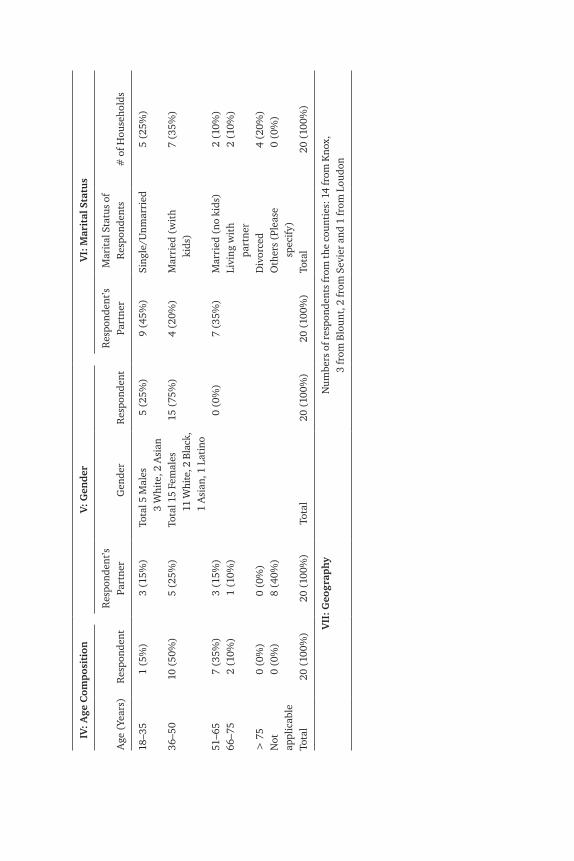
Household SurveysThe respondents represented 14 white,
2 black, 3 Asian, and 1 Latino households. Most (75 percent) respondents were fe-males, and 50 percent were between the ages of 36 and 50 years old (Table 2). 17 respondents completed both the inter-views and surveys, 1 completed part of the interview, and 2 completed only the survey. Half (50 percent) of the respond-ents had a Master’s degree or higher, 25 percent had attained Bachelor’s degree, 20 percent had some college/associate degree and one person (5 percent) had a professional degree (i.e., medicine/law). About 35 percent of all households had annual incomes lower than $40,000, 30 percent earned between $40,001 and $75,000, and the rest earned $75,001 or higher. While the largest group of house-holds comprised married couples with kids (35 percent of sample) and some were empty nesters, about 30 percent
recruiting minority respondents seemed more difficult in Knoxville, compared to my prior experience of conducting field work in Columbus, Ohio and Milwaukee, Wisconsin, both in the Midwest. This made me wonder if it had anything to do with Knoxville’s geographic location in the American Southeast and its related histor-ical and cultural context, or my position-ality as a non-native female researcher. From this small sample, however, I ob-tained varied, rich, and interesting re-sponses concerning place/space and how people thought differently about housing market elements, gender, and southern culture. Overall, this field work was very enlightening, as several realities pertain-ing to the interplay of race, class, gender, and southern culture seemed to be inter-twining in the answers of the respondents. Having obtained the household surveys and in-depth interviews, the quantitative data from the survey responses were fed into SPSS statistical software to conduct simple descriptive analyses. The recorded interviews were manually coded and tran-scribed to analyze various themes and nuances that came up during the conver-sations. Pseudonyms were created for all respondents to maintain confidentiality, and all protocols of the Institutional Re-view Board of the University of Tennessee were followed.
analysis
The Knoxville metropolitan area has had substantive growth in its total popu-lation, from 586,025 in 1990 to 764,077 in 2009 with an overall growth rate of 30.38 percent (Table 1). It is interesting to note, however, that growth rates for white and black averaged around 25 percent

Perceptions of the Knoxville Housing Market 149
from work, friends, shopping areas, and bars were valued similarly by a majority of respondents from all three racial/ethnic groups.
A majority of respondents from all three racial/ethnic groups considered the qual-ity of nearby schools and academic pro-grams very important, though many white respondents did not pay much attention to athletics and other extracurricular ac-tivities. Concerning racial composition of the student body of nearby schools, most white respondents were neutral or did not respond, though two Asian respondents and one black respondent considered this as very important. Likewise, when asked about the economic status of students and availability of special programs in nearby schools, a majority of white respondents did not respond, and a majority of Asian and black respondents considered this as important. Concerning safety in the school, a majority of white respondents did not respond whereas at least two re-spondents from Asian and black groups valued this as very important. Concerning quality of buildings/facilities, most white respondents did not respond, but both Asian respondents (with family) and one black respondent valued this attribute as very important.
Finally, when asked about the charac-teristics of a home that influenced their home-buying decisions, a majority of respondents in all three groups (white, black and Asian) valued the size of a home, availability of lawn/open space and affordability as very important attributes whereas good resale value of the home was ranked as very important by seven white and all black and Asian respondents.
Upon analyzing the survey-based re-sponses concerning where to live and
were single, including several self-identi-fied lesbians.4 Out of 20 respondents, one person had lost his/her home to foreclo-sure and was renting at the time of this interview. Another respondent had almost lost his/her house to foreclosure, but had been able to save it. 14 respondents lived in Knox County, 3 lived in Blount County, 2 were from Sevier County, and 1 was from Loudon County.
I used a Likert scale in the survey ques-tions with values ranking from 0 to 7, with 0 = not applicable, 1 = not important, and 7 = most important. The rank of 4 implied neutral. Since analyzing such responses by taking average or median values is statis-tically suspect, I chose to show how many people selected the particular numerical values on the Likert scale.
Upon being asked to rank various at-tributes pertaining to the ‘characteris-tics of the neighborhood when buying a home,’ five of the fourteen white respond-ents were neutral (4 on the Likert scale) whereas three considered it very impor-tant (5 on the Likert scale) or higher. Out of two black respondents, only one chose a value of 5 (very important), and only one of three Asian respondents did the same. Likewise, with regard to questions related to traffic in the area, socioeconomic sta-tus of the neighborhood, and availability of green space, almost all three groups (white, black and Asian) valued these attributes similarly.5 When asked about the importance of living in a neighbor-hood where most people belonged to the respondents’ own race, all three groups were neutral or did not respond. Having diversity in the neighborhood was valued as very important by only three of four-teen white respondents.6 Most other fac-tors such as garbage collection, distance
150 sharma
Yes, she [realtor] did, but in my case she steered me to keep me away from crime affected neighborhoods, because she knew I was a single non-Caucasian woman. I had to inform her of my needs and once she understood, she then became quite protective and guided me through the process of where not to buy. She felt that this subdivision was new, with several transplant Caucasians who had lived and traveled to many places, were educated, open minded, and were aware of diversity. She knew that since I was a physician, I would get a certain level of respect from the people in this community.
To the above question, Barbara, a re-tired black school teacher (in her 60s) from a middle-class neighborhood in East Knoxville said the following,
We wanted to look at properties in west Knoxville, but even our realtors would not want to show us any in that part of Knoxville. When they [realtors] saw us [she and her husband], they made excuses. There was another home on sale by the owners, which we assumed would click for us. However, when they spoke to us on telephone, they recognized that we were black, and then they would talk no further. They did not want any black people in that neighborhood, and hence we decided to come here. Even though my husband wanted a nicer home in west Knoxville, I would rather live in a community where I am welcome. So I picked up this location as I did not want to live there because of prejudice against us.
whom to live with, no significant differ-ences were found in terms of preferences and choices among respondents of differ-ent racial/ethnic background, and quality of home and life appealed to all groups alike. Similar findings were also noted in an earlier analysis of household responses in Columbus, Ohio (Brown and Chung 2008). It can thus be inferred that class and quality of life matter to all, and that the race/ethnicity of consumers is slowly losing its significance. It is also important to note, however, that some of these find-ings do not provide clear understanding about peoples choices as several sensitive questions concerning race/ethnicity were ignored by many white respondents. In the following excerpts from open-ended interviews with respondents, however, some nuances of steering, discrimination and exclusion are captured.
open-ended interviews with households
In the following paragraphs, I illustrate and discuss in-depth interviews with a few respondents from all races (white, black, Asian and Latino). Pseudonyms were cre-ated for each respondent to protect their confidentiality. Questions asked to the re-spondents focused on the roles of realtors, bankers/lenders, and developers on influ-encing their home-buying decisions.
Steering, Lending and SellingOn being asked if the realtor(s) tried to
steer the respondent toward certain geo-graphic locations when s/he was looking to buy a home, I got different responses and some of these are discussed below. Meena, an Asian female (in her 40s) from north Knox County said the following,
Perceptions of the Knoxville Housing Market 151
I was going through many job changes during 1998–2008. I took my W2 from the previous year (2007) and I was able to get loans even though I was un-employed at the time. This happened in 2007 when reckless subprime lend-ing practices were at full swing. No one really verified my ability to pay back [. . .]. There were points of time when I worried that my mortgage would be unpaid even when I turned 76.
Robert, a white foreclosure respondent from Blount County, who was renting at the time of this interview, had his monthly mortgage jump from $900/month to $1400/month, even though the bank had earlier indicated that his price would not change for two years when he applied for a balloon mortgage. Within 18 months of closing, the interest rates had jumped, making it unaffordable, and he was even-tually left with no other choice. Likewise, Pam (white) from northeast Knoxville had almost lost her home to foreclosure, but she decided to sign a second adjustable rate mortgage (ARM) at a very high rate of interest to get temporary relief and pro-tect her home from getting foreclosed. Her previous loan was also an ARM, and she made her decisions as she hoped to shop for better rates in the future.
Concerning selling their homes through a realtor’s professional help, several re-spondents expressed dissatisfaction and concerns as most realtors wanted to make quick profits. For example, Lisa, a white, divorced transplant from California in her 60s, trying to sell her condominium through a realtor, complained that she was losing her windows of opportunity due to negligence of her realtor. To moti-vate her realtors, she organized a lunch for
Carol (white, in her 40s) indicated that her realtor tried to show her homes in west and north Knox County in white, middle- class neighborhoods, even though she in-sisted that they show her homes around $100,000 value. She was born and raised in a diverse neighborhood of Virginia, and was looking for a certain texture in terms of diversity. However, after being steered continuously to areas that did not fit her needs in terms of diversity and price, she searched for a home by herself and sought her realtor’s help only for paper work. She also indicated that had she belonged to a different race/color, she was certain she would have been steered to other neigh-borhoods. By contrast, Amanda, another white female who grew up in Seymour (Sevier County) knew exactly “where not to buy.” In particular, she was referring to those parts of the town that were crime affected and mostly contained poor and minority residents.
The respondents were asked if their realtors/bankers approved them for loan amount far higher than what they needed. Some of these responses are quoted below.
Oh yes, in my case as soon as they learned I was a physician, they ap-proved me for half a million dollars, but I wanted to buy a modest home [. . .]. You know, she [realtor] has been dealing with rich guys for a long time, and this home priced at $240,000 was a modest one for her. (Meena)
We had no issues with the amount because we knew exactly what we could afford, and we told them clearly what we wanted our monthly mort-gage to be. (Barbara)
Donna (white, in her 60s), said the following:
152 sharma
are moving into this neighborhood,” or that “it is getting too many of them in this neighborhood.” The vagueness that they like to maintain, and this prejudice against “the other,” that “they are different” [. . .], seems like the Latinos are being treated far differ-ently than even the blacks . . . they are the new minority here now . . . “the outsiders”.
The same question was asked to Bob, a white middle class respondent in his 40s from Blount County. He answered that he had never lived in a diverse neighbor-hood, and hence he did not know what to compare against. However, he also added that life in the South in general and par-ticularly in Blount County in his neighbor-hood could have been far more difficult for minorities.
While conducting interviews with a few respondents, aspects of place-culture, regional-culture, and gender-based per-ceptions of inside and outside spaces were also observed. These nuances were noted when I asked respondents to elaborate their experiences with the realtors. As a majority of the respondents were women, they openly shared their experiences when dealing with realtors, bankers, and the community in general who had assumptions and perceptions of certain tasks as male-oriented. Some of these are quoted below:
Diversity, Southern Culture and Gendered SpacesLisa was surprised at the lack of diver-
sity, and used terms such as “prejudice,” “white supremacy,” and “caste system” to express her perceptions of this place and people. To quote from her response:
them at her condo. However, the realtors did not show up, nor did they care to keep her informed. She was extremely upset by their unprofessional behavior and she shared her email conversations with me voluntarily to illustrate her frustration to-ward them. Similar frustrations and con-cerns were shared by a few other home-owners as well. Concerns included lack of empathy, undervaluing of property, ignor-ing the price components associated with custom-built homes, lack of marketing strategies, and so forth.
Steering and White PrivilegeGiven the historical context of the
black-white divide in the American South, I asked a few white respondents if they felt white privilege might have positively affected their home-buying decisions. The responses to this question reflected complex intertwining of race, gender, cul-ture, and sarcasm. Quoting from Carol’s response,
Yes, I sure benefited from white privilege. Even though I am a White woman, I am well educated, aware, and an informed person, but our real-tor just assumed that we being white would have preferred a white-only neighborhood [. . .]. Things would have been entirely different had I been of a different color, because the realtors do make assumptions based on the skin color.
Concerning a few Latinos entering Car-ol’s neighborhood in recent years, some of her neighbors expressed discomfort. In Carol’s words,
Some neighbors have even made comments like, you know “oh, they
Perceptions of the Knoxville Housing Market 153
ring on my toe.” I think they thought probably it was related to some cult or something.
Katherine continued her conversations that reflected gender-based expectations and nuances of southern culture. In her words:
Here women are expected to wear make-up. People have to say prayers before they eat. When they learned I was a Catholic, this [name withheld] man would not even talk to me. That is some real prejudice. Here people asked me about my kin-folk [. . .]. When I attended our church’s renovation com-mittee meeting here, people found that very surprising because I was the only woman attending it. There was an ar-chitect [a UT professor] attending the renovation meeting at the church, and when I proposed suggestions for reno-vation of our church’s roof, he looked at me and said “you do not understand this,” and I felt so insulted. There is this southern mentality that women have their place inside home. Even though I am a white woman, I am single and divorced, and that is considered very weird here. Most people in this part of the country still feel that much of the space outside home is a space to be ma-nipulated by men, and not by women; this speaks largely of the stuck-up culture specific to this location.
Amanda, a white high school science teacher from Seymour (Sevier County), in her 30s, expressed her feelings that further re-emphasized gender-based roles and expectations and differentiation of outside versus domestic spaces. Quoting from her response:
You come to this church, it is very diverse; you go to UT (University of Tennessee), and it is great. But much of Knoxville is pretty white . . . it is like a caste system . . . top caste with white old money and the bottom caste with poor white trash and the non-literate people. I see it and feel it . . . there is a lot of prejudice. You have to know what you are listening to, and they will cover it all up with social politeness. There are a lot of wonderful and pro-gressive people in this town, but there are also a lot of backward and preju-diced people too, because their world and their culture is threatened. There is that flavor of southern white culture, white supremacy, and prejudice. These people only know the four Fs: food, football, faith and family. I am kind-a sick of it and I am gonna go back to California as soon as my condo sells.
Katherine, also a transplant from Cali-fornia, in her 60s, owned a condo in east Knox County. To the same question of di-versity, she said the following:
To find cultural diversity, you would have to go nearer to the campus, and that is what I miss most in this small town. I wonder if that is because of the southern culture, or just the place culture. I love listening to other lan-guages, and seeing other people, and trying different cuisines. Everything that is good is out there in west Knoxville. You know—food, culture, shopping and everything nice and classy. For instance, when I moved in here, people would whisper “oh, look at that woman, she has a toe ring on her feet.” They finally had the nerve to ask me, and I said “yeah, it is just a
154 sharma
reason, I did not want to even consider the northeastern part of Knox County, because people are so bigoted there. I did not want to live in an area where people did not accept diversity at all.
To the same question, Sharon, a white woman in her 70s, who lived in a mixed community in east Knox County re-sponded as follows:
Yes, east Knoxville is traditionally black, and the unfortunate myth is that it is dangerous. However, if you go up north, that is the ‘red necks’ havens—uneducated, prejudiced whites who live up there. They are afraid of change. I would never want to live there. I do not tell anybody around here that I am gay, and I would want to live in a community where I am accepted, where I do not get shot. That happens here a lot. And see, I am a Democrat, and not a Christian. So, I had to pick up a location where I was comfortable.
The above conversations indicate that sexual orientation of residents affect their home buying decisions, particularly in context of a southern metropolis of Knoxville where diversity per se is rela-tively new. Conversations about sexual-ity, same sex marriage, and their accept-ance into mainstream society have been in the news recently. These respondents feared that coming out in a southern and conservative metropolis would pose risks to their life. As indicated above, while the two gay respondents do not discuss their sexuality with their neighbors, they are still cautious about the geographic locations and communities when mak-ing decisions about buying a home. They
Being female and young worked against me. Whenever I have talked to an older male, normally a white male, they never say it explicitly, but they make you feel like you don’t know anything. The guy next door wanted to talk about an issue only with my hus-band and not with me, and that really made me upset. I mean, come on, if this was happening twenty years ago, I could have understood, but this was happening now, and I could not believe it. This is how the southern culture is.
From the above conversations, gender- based expectations and perceptions of out-side versus inside spaces are suggested by white women who grew up in the South as well as others who were California trans-plants. This speaks of distinct characteris-tics of the region and the place, which is otherwise not obvious from the household survey responses.
Space, Sexuality and PerceptionDuring the interviews, a few respond-
ents who self-identified as lesbians pre-ferred to exclude certain parts of the metropolitan area for fear of not being accepted or getting killed. For example, I asked Donna, a white woman in her 60s, why she bought a home in a rural part of north Knox County instead of any other lo-cation. Her response is quoted below:
I am a lesbian, not a heterosexual, and having a single woman live on a large property was questioned by people here—like how I kept my things together, how I maintain myself, and so on. It does not hurt me to mention that I have a gun [. . .]. That language is well understood here. For that

Perceptions of the Knoxville Housing Market 155
with lower education, prejudice, and low incomes.
discussions and conclusions
The interviews with homeowners/sellers and foreclosure(s) in Knoxville suggest mixed results, but they add new perspectives on gender, culture, and sex-uality to the framework of M-LP. These nuances were not noted in my earlier re-search in Columbus, Ohio and Milwau-kee, Wisconsin, both in the Midwest. The M-LP suggests that at present, class plays a more important role than race, and that realtors, bankers/lenders, and develop-ers do not discriminate based on race/ethnicity of a person. It also suggests that quality of life indicators and affordability are more important determinants of res-idential decisions. From the responses, varying perspectives were noted. Meena indicated that steering in her case was a directed practice by her realtor as she had asked for help with identifying a safer, educated, and tolerant community since she was Asian. Class mattered in her case as her income helped her buy a property in a community that was largely upper- income and white. Past literature suggests that in general, Asians are well assimilated into white communities (Clark and Blue 2004) whereas blacks generally occupy the lower levels in American social hier-archy (see Charles 2000, 2003 for more discussions). On the other hand, Donna and Sharon, both, bought homes in north-ern (white and rural) and eastern (black and Latino presence) parts of Knoxville, respectively. Their decisions were based primarily on their sexual orientation and prior knowledge of “prejudiced” and “dan-gerous” spaces. In addition, their income
wanted to make sure that they felt safe and accepted in their community. In particular, their identification of specific locations as “red neck,” “uneducated,” “prejudiced,” and “dangerous” for gays and lesbians influenced their decisions of where not to buy.
Earlier research on overall demographic and socio-cultural characteristics of Knox-ville metropolis suggests that the north-eastern part of Knox County and the ad-joining counties of Union and Anderson are very white (Sharma 2013). A large share of people (25 years and above) have educational levels of high school or less. Sharma (2013, p 147–48) also found that the diversity score of Union County (0.163 in 2009) and a population of 13,694 in 2009 (Sharma 2013, p 145) were the lowest of all six counties. Ameri-can Community Survey (ACS) 2005–2009 data suggests that only 14 percent to 19 percent of white labor at the census-tract scale in Union County were engaged in professional occupations whereas none of the minorities were employed. Like-wise, home-ownership for white was 99 percent to 100 percent whereas none of the minorities in the tracts owned homes. In 2009, the per capita income for total population ranged between $14,000 to $18,000 for the tracts of Union County; about 16 percent to 23 percent were em-ployed in blue-collar jobs and 20 percent to 30 percent were engaged in managerial occupations. Diversity scores for tracts in Union County ranged between 0.05 to 0.17, some of the lowest in the whole metropolitan area. These statistics for the census-tracts of Union County reaf-firm respondents’ perceptions of social and economic characteristics of parts of this metropolitan area, particularly those
156 sharma
as they were aware of their paying capacity and bought modest homes, even though they were approved for much higher amounts. Concerning trying to sell homes through assistance of realtors, Lisa and Bob expressed their frustrations as most realtors were only interested in making quick profits, and lacked professionalism when serving clients. Thus, the realtors trying to meet the expectations of buyers and sellers alike also seem questionable. To sum up, lenders and realtors are keen on doing business, and try to induce con-sumers into higher mortgage amounts to increase their margins of profit. However, they take no responsibility once the deal is closed. All these aspects, when analyzed from M-LP framework’s perspectives, indi-cate complex intertwining of race, class, gender, culture, and sexuality that are difficult to compartmentalize into cause- effect relationships. These open-ended in-terviews, however, flesh out perceptions of place and space that affect their home buying decisions in various ways.
Finally, based on the small sample of research participants, I cannot make generalized conclusions for the whole metropolitan area of Knoxville. How-ever, there are few instances of steering and discrimination felt by small numbers of black and Latino respondents in this study. Such perceptions were confirmed by white respondents who indicated that life for a minority in this part of the country is difficult. They recognized that had they been of a different race or color, things might have been far more difficult for them. It is in light of these shared views that I conclude that some practices of ra-cial stereotyping, steering, and discrimi-nation still occur in Knoxville. While class plays a larger role in influencing peoples’
status also affected their decisions of buy-ing homes as parts of east Knoxville with significant presence of black and Latino population and the rural parts in north Knoxville were more affordable.
By contrast, Barbara’s realtors steered her away from west Knoxville as she was black and west Knoxville is primarily white and middle class. Barbara worked as a school librarian, and with her archi-tect husband, possessed characteristics of a middle class household, but she faced difficulty in finding a home in a commu-nity that was primarily white. At the same time, Carol (white) was continuously being steered to whiter and middle-class neighborhoods as her realtor assumed that she might want to buy a home in a white-only community because she was white.
Concerning lending practices, the amount being borrowed by respondents was not a concern. Instead, there were few consumers who were approved for loan amounts higher than what they desired. In some cases they did not verify their repay-ment capacity, particularly when one ex-amines the case of Donna, who was given a loan based on her W2 from the previ-ous year, though she was unemployed at that time and had no income. This had happened in 2007–2008 when subprime lending practices were at their peak. The only Latino respondent in this analysis in-dicated negligence and possible discrim-ination as the bank officials ignored her because of her Latino looks and Latino last name. Robert’s home, funded by a balloon mortgage, ended up in foreclosure, and he blamed lack of clarity and hidden infor-mation as the reasons. Few respondents, however, mentioned that they made cau-tious decisions about how much to borrow
Perceptions of the Knoxville Housing Market 157
facilitated recruitment of research participants
for this study.
notes1. Knoxville metropolitan area is located in
the American Southeast. The term ‘southern cul-
ture’ in this paper mostly relates to the cultural
experiences of racial discrimination and the idea
of oppression suffered by African Americans in
this region for a long time. Due to historical rea-
sons, east Tennessee has always been very white,
and Knoxville in particular started seeing growth
of non-black minorities only since the 1990s and
2000s, now making its total non-white popu-
lation to 11 percent (Sharma 2013). The term
‘southern culture’ in this paper is suggestive of
the plantation-based economy and conservative
rural culture that was and still is averse to diver-
sity and development. There are also discussions
concerning how politeness, interaction styles,
and aggression work together in southern cul-
ture (Cohen et al. 1999). Such instances of polite
exclusion were found during conversations with
minorities, and hence the term southern culture
has been used throughout the text to provide
a context of the place and region within which
peoples’ responses should be examined.
2. Lisega Inc. is a German manufacturer
company that produces pipe supports and
hangers for the energy industry. It had its man-
ufacturing and management location at Morris-
town earlier, and has recently moved to Kodak
city in the suburban county of Sevier. Per 2010
Census definition, Sevier is now excluded from
Knoxville MSA, thus making Knoxville a five-
county MSA. In this analysis, however, the six-
county definition per 1990 and 2000 Census is
used for analysis.
3. For detailed analyses and computation of
diversity scores and Theil entropy index using
multiple racial/ethnic groups, refer to Sharma
2011a and Sharma 2013 that has computed
diversity scores and Theil entropy indices for
home buying decisions, the effect of race and skin color cannot be completely ig-nored. There is also evidence of reckless lending practice or vagueness in lending terms and conditions. As indicated by some respondents, certain spaces were not deemed safe because of their sexual-ity, culture, and political beliefs, includ-ing a few who identified themselves as non-Christians and liberal. This analysis also fleshes out the intertwining of culture and gender where women are expected to perform activities inside-home whereas activities outside-home such as buying, selling, and interacting with housing market elements or dealing with others are perceived of as men’s responsibilities. These nuances and varied perceptions add interesting and new dimensions to Brown and Chung’s (2008) framework on Mar-ket-Led Pluralism.
acknowledgementsAn earlier version of this paper was pre-
sented at the annual meeting of the Southeast-
ern Division of the Association of American
Geographers held at Asheville, North Carolina
in November 2012. Comments and suggestions
from viewers are greatly appreciated and have
been incorporated in this paper. This project
was approved via IRB protocol #8558 B by the
Office of Research and Extension at University
of Tennessee. The field work for this research
was conducted during summer 2012 to spring
2013. I thank the Office of Research and Exten-
sion and Department of Geography at Univer-
sity of Tennessee that provided me with start-up
funds as a new faculty to initiate new research.
Cartographic assistance of Will Fontanez at
Department of Geography, University of Ten-
nessee is greatly appreciated. I also thank my
colleagues Drs. Carol Harden, Sally Horn and
Hyun Kim for providing me with contacts that
158 sharma
Brown, L.A., and Sharma, M. 2010.
Metropolitan context and racial/ethnic
intermixing in residential space: U.S.
Metropolitan Statistical Areas, 1990–2000.
Urban Geography 31(1):1–28.
Burgess, E.W. 2012 [1925]. The growth of the
city: An introduction to a research project.
In The urban sociology reader, 2nd edition,
eds. J. Lin, and C. Mele, 91–99. New York:
Routledge.
Chaney, J. 2010. The formation of a Hispanic
enclave in Nashville, Tennessee.
Southeastern Geographer 50(1):17–38.
Charles, C.Z. 2000. Neighborhood racial-
composition preferences: Evidences from
a multiethnic metropolis. Social Problems
47(3):379–407.
———. 2003. The dynamics of racial
residential segregation. Annual Review of
Sociology, 29: 170–207.
Chung, S.-Y., and Brown, L.A. 2007, Racial/
ethnic residential sorting in spatial context:
Testing the explanatory frameworks. Urban
Geography 28(4):312–339.
Clark, W.A.V., and Blue, S. 2004. Race, class,
and segregation patterns in U.S. immigrant
gateway cities. Urban Affairs Review
39(6):667–688.
Cobb J.C. 2005. Beyond the ‘y’all wall:
The American South goes global. In
Globalization and the American South, eds.
J.C. Cobb, and W. Stueck, 1–18. Athens:
University of Georgia Press.
Cohen, D., Vandello, J., Puente, S., and
Rantilla, A. 1999. “When you call me
that, smile!” How norms for politeness,
interaction styles, and aggression work
together in southern culture. Social
Psychology Quarterly 62(3):257–275.
craigslist. 2012. “craigslist: Knoxville.”
Accessed 17 June 2012 at http://knoxville.
craigslist.org/.
Ellis, M., Wright, R., and Parks, V. 2004. Work
together, live apart? Geographies of racial
Knoxville, Tennessee, using six racial/ethnic
groups at the scale of census tracts for 1990,
2000 and 2009.
4. A few respondents voluntarily declared
that they were lesbians, even though that ques-
tion was neither asked in the survey form, nor
during the interview process. During their
conversations in the open-ended interviews,
they discussed about southern culture and lack
of tolerance toward gay population in certain
parts of Knoxville metropolitan area, and how
those fears shaped their home buying decisions.
5. The only Latino respondent completed
majority of the open-ended interview, but
not the survey form. Hence, the racial/ethnic
groups represented in the analyses of house-
hold surveys include only white, black and
Asian whereas her response during open-ended
conversations has been used in analyzing the
overall context.
6. Some of them felt more secure in diverse
communities instead of white/red neck areas,
as indicated in the open-ended conversations.
referencesAlba, R. ed. 2000. Beyond the melting pot
thirty-five years later: On the relevance of
a sociological classic for the immigration
metropolis of today. International Migration
Review 34(1):243–279.
Atiles, J.H., and Bohon, S.A. 2003. Camas
calientes: Housing adjustments and
barriers to social and economic adaptation
among Georgia’s rural Latinos, Southern
Rural Sociology, 19(1):97–122.
Brown, L.A., and Chung, S.-Y. 2006. Spatial
segregation, segregation indices, and the
geographical perspective. Population, Space
and Place 12(2):125–43.
———. 2008. Market-led pluralism:
Rethinking our understanding of racial/
ethnic spatial patterning in U.S. cities.
Annals of the Association of American
Geographers 98(1):180–212.
Perceptions of the Knoxville Housing Market 159
McDaniel, P.N., and Drever, A.I. 2009.
Ethnic enclave or international corridor?
Immigrant businesses in a New South city.
Southeastern Geographer 49(1):3–23.
Mohl, R.A. 2003. Globalization, Latinization,
and the nuevo New South. Journal of
American Ethnic History 22(4):31–66
Neal, M., and Bohon, S.A. 2003. The Dixie
diaspora: Attitudes toward immigrants
in Georgia. Sociological Spectrum
23(2):181–213.
Park, R.E. 2012 [1936]. Human ecology. In
The urban sociology reader, 2nd edition,
eds. J. Lin, and C. Mele, 83–91. New York:
Routledge.
Perreira, K.M. 2011. Mexican families in North
Carolina: The socio-historical contexts
of exit and settlement. Southeastern
Geographer 51(2):260–286.
Retirement Places Report. 2012. “Tennessee
growing in popularity as affordable
retirement destination.” Accessed 17 June
2012 at http://www.retirementplacesreport
.com/tennessee_cities.html.
Sandoval, J., and Li, S. 2004. The multicultural
metropolis: Changing segregation
patterns in the city of Chicago from 1990
to 2000. Paper presented at the Annual
meeting of the American Sociological
Association, San Francisco, CA, August
2004. Accessed 4 January 2014 at http://
citation.allacademic.com/meta/p_mla_
apa_research_citation/1/1/0/2/7/
pages110276/p110276-1.php.
Sharma, M., and Brown, L.A. 2012. Racial/
ethnic intermixing in intra-urban space
and socio-economic context: Columbus,
Ohio and Milwaukee, Wisconsin. Urban
Geography 33(3):317–347.
Sharma, M. 2011a. A Geographic Perspective
on intra-urban racial/ethnic diversity,
segregation, and clustering in Knoxville,
Tennessee: 1990–2000. Applied Geography
32(2):310–323.
and ethnic segregation at home and at
work. Annals of the Association of American
Geographers 94(3):620–637.
Florida, R. 2002. The rise of the creative class:
And how it is transforming work, leisure,
community and everyday life. New York:
Basic Books.
Flory, J. 2011. “Lisega dedicates Sevier
plant.” Knoxville News Sentinel Co.
Accessed 10 July 2012 at http://www
.knoxnews.com/news/2011/jun/04/
lisega-dedicates-sevier-plant/.
Frey, W.H., and Farley, R. 1996. Latino, Asian,
and black segregation in U.S. metropolitan
areas: Are multiethnic metros different?
Demography 33(1):35–50.
Geib. P. 1998. From Mississippi to Milwaukee:
A case study of the southern black
migration to Milwaukee, 1940–1970.
The Journal of Negro History
83(4):229–248.
Gotham, K.F. 2002a. Beyond invasion and
succession: School segregation, real estate
blockbusting, and the political economy
of neighborhood racial transition. City &
Community 1(1):83–111.
———. 2002b. Race, real estate, and uneven
development: The Kansas City experience,
1900–2000. Albany: State University of
New York Press.
Heavey, S. 2012. “Asians eclipsing Latinos in
immigration to U.S.: Report” Accessed 2
February 2014 at http://www.reuters.com/
article/2012/06/19/us-usa-immigration-
asians-idUSBRE85I05X20120619.
Lichter, D.T., Parisi, D., Grice, S.M., and
Taquino, M.C. 2006. National estimates of
racial segregation in rural and small town
America. Demography 44(3):563–581.
Lobo, A.P., Flores, R.J.O., and Salvo, J.J. 2002.
The impact of Hispanic growth on the
racial/ethnic composition of New York
City neighborhoods. Urban Affairs Review
37(5):703–727.
160 sharma
University of Tennessee. 2014. “About the
University of Tennessee, Knoxville.”
Accessed 3 February 2014 at http://www
.utk.edu/aboutut/.
U.S. Census Bureau. 2014. “Data Access Tools.”
Accessed 3 February 2014 at http://www
.census.gov/.
Winders, J. 2006. ‘New Americans’ in a ‘New-
South’ city? Immigrant and refugee politics
in the Music City. Social and Cultural
Geography 7(3):421–435.
———. 2011a. Re-placing southern
geographies: The role of Latino migration
in transforming the South, its identities,
and its study. Southeastern Geographer
51(2):342–358.
———. 2011b. Representing the immigrant:
Social movements, political discourse,
and immigration in the U.S. South.
Southeastern Geographer 51(4):596–614.
Zuniga, V., and Hernandez-Leon, R. 2005. eds.
New destinations: Mexican immigrants in
the United States. New York: Russell Sage
Foundation.
dr. madhuri sharma (corresponding
author, Email: [email protected]) is
an Assistant Professor at Department of
Geography, University of Tennessee. Her
research interests include racial/ethnic
residential patterns, housing mortgage issues,
social and economic inequality and mixed-
method approaches.
———. 2011b. Asians and Hispanics in the
American South: The case of Tennessee.
In Race, ethnicity and place in a changing
America, eds. J.W. Frazier, E.L. Tetty-Fio,
and N.F. Henry, 307–328. Albany: State
University of New York Press.
———. 2013. Diversity in Knoxville: An
applied perspective. Applied Geography
42:140–154.
Singer, A. 2003. “At home in the nation’s
capital: Immigrant trends in metropolitan
Washington.” The Brookings Institution.
Accessed 3 February 2014 at http://www
.brookings.edu/research/reports/2003/
06/washington-singer.
———. 2004. “The rise of new immigrant
gateways.” The Brookings Institution.
Accessed 3 February 2014 at http://
www.brookings.edu/~/media/research/
files/reports/2004/2/demographics%20
singer/20040301_gateways.pdf.
Smith, H. A., and Furuseth, O.J. 2004.
Housing, Hispanics and transitioning
geographies in Charlotte, North Carolina.
Southeastern Geographer 44(2):216–235.
Stamps, K., and Bohon, S.A. 2006. Educational
attainment in new and established Latino
metropolitan destinations. Social Science
Quarterly 87(5):1225–1240.
Tennessee Department of Labor and Workforce
Development. 2013. “Labor Force
Estimates—United States & Tennessee.”
Accessed 10 December 2013 at http://
www.tn.gov/labor-wfd/labor_figures/
Labor%20Force%20Estimates%20Feb%20
%2712.pdf.


