Embed Size (px)
Citation preview
Seediscussions,stats,andauthorprofilesforthispublicationat:https://www.researchgate.net/publication/222545367
PedogenicapproachtoresolvingthegeomorphicevolutionofthePakuariverterracesincentralTaiwan
ArticleinGeomorphology·January2007
ImpactFactor:2.79·DOI:10.1016/j.geomorph.2006.06.006
CITATIONS
18
READS
23
4authors,including:
Zeng-YeiHseu
NationalTaiwanUniversity
94PUBLICATIONS1,067CITATIONS
SEEPROFILE
W.S.Huang
NationalChungChengUnivserity,Chia…
25PUBLICATIONS67CITATIONS
SEEPROFILE
Zueng-SangChen
NationalTaiwanUniversity
121PUBLICATIONS1,471CITATIONS
SEEPROFILE
Allin-textreferencesunderlinedinbluearelinkedtopublicationsonResearchGate,
lettingyouaccessandreadthemimmediately.
Availablefrom:Zeng-YeiHseu
Retrievedon:12May2016
(2007) 14–28www.elsevier.com/locate/geomorph
Geomorphology 83
Pedogenic approach to resolving the geomorphic evolution of thePakua river terraces in central Taiwan
Heng Tsai a,⁎, Zeng-Yei Hseu b, Wen-Shu Huang a, Zueng-Sang Chen c
a Department of Geography, National Changhua University of Education, No. 1, Chinte Road, Changhua 50007, Taiwanb Department of Environmental Science and Engineering, National Pingtung University of Science and Technology, Pingtung 91201, TAIWAN
c Department of Agricultural Chemistry, National Taiwan University, Taipei 10617, Taiwan
Received 13 May 2005; received in revised form 24 May 2006; accepted 19 June 2006Available online 1 August 2006
Abstract
The southern part of the Pakua tableland in Taiwan comprises a series of wide, unpaired river terraces that have as many as sixaltitude levels, from PK-1 (highest) to PK-6 (lowest). The terrace surfaces are covered with lateritic soils. This study described,sampled and analyzed the soils from each terrace. Soil taxonomies are Oxisol, Ultisol and Inceptisol. Soil morphologicalcharacteristics were quantified as a profile development index (PDI) to determine the degree of soil development. The chemicalanalyses included cation exchange capacity (CEC) and selected extraction of Fe in soils. Based on the degree of soil development,surface deposits on terrace flights form the post-incisive soil chronosequence, supporting the hypothesis of terrace formation byfluvial processes. Soil ages were estimated based on iron crystallinity (Fed–Feo)/Fet. Analytical results indicate that river terraces inthe Pakua tableland are aged 40–400 ka. The long-term uplift rate of the tableland can be estimated using terrace ages and foldinggeometry. The variation of uplift rates demonstrates that the landscape underwent increased shortening of frontal thrusting by theChanghua Fault running beneath the tableland.© 2006 Elsevier B.V. All rights reserved.
Keywords: Pakua tableland; River terrace; Profile development index (PDI); Soil chronosequence; Iron crystallinity; Changhua Fault
1. Introduction
Taiwan has experienced oblique convergence of theEurasian plate and Philippine Sea plate since roughly5–7 Ma (Suppe, 1981; Angelier, 1986; Tsai, 1986; Ho,1988; Kao and Chen, 2000) (Fig. 1A). Tectonic com-pression from the east produced a sequential west-verging thrust-and-fold belt in west central Taiwan
⁎ Corresponding author. Tel.: +886 4 7232105 2819; fax: +886 47211186.
E-mail address: [email protected] (H. Tsai).
0169-555X/$ - see front matter © 2006 Elsevier B.V. All rights reserved.doi:10.1016/j.geomorph.2006.06.006
(Fig. 1B). The Pakua tableland comprises a frontaldeformation as an anticline in the thrust-and-fold belt(Lee et al., 1996; Deffontaines et al., 1997). Thesouthern part of the tableland comprises a series of wideand unpaired terraces developed by the Choushui Riverand its tributaries (Fig. 2) (Shih and Yang, 1985). Allterrace surfaces tilt eastward, probably due to a slippingChanghua Fault running beneath the tableland (Lee etal., 1996; Delcaillau et al., 1998; Mouthereau et al.,1999; Delcaillau, 2001). Consequently, these riverterraces are excellent geomorphic markers for measur-ing differential and absolute deformation. Unfortunate-ly, this geomorphic approach is limited by the lack of
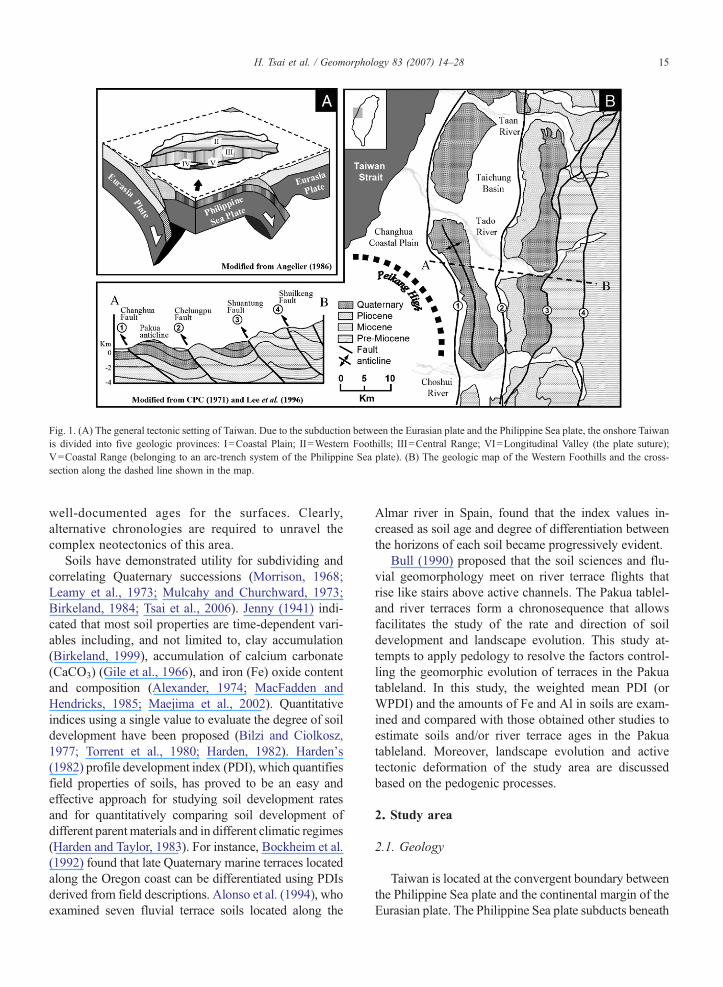
Fig. 1. (A) The general tectonic setting of Taiwan. Due to the subduction between the Eurasian plate and the Philippine Sea plate, the onshore Taiwanis divided into five geologic provinces: I=Coastal Plain; II=Western Foothills; III=Central Range; VI=Longitudinal Valley (the plate suture);V=Coastal Range (belonging to an arc-trench system of the Philippine Sea plate). (B) The geologic map of the Western Foothills and the cross-section along the dashed line shown in the map.
15H. Tsai et al. / Geomorphology 83 (2007) 14–28
well-documented ages for the surfaces. Clearly,alternative chronologies are required to unravel thecomplex neotectonics of this area.
Soils have demonstrated utility for subdividing andcorrelating Quaternary successions (Morrison, 1968;Leamy et al., 1973; Mulcahy and Churchward, 1973;Birkeland, 1984; Tsai et al., 2006). Jenny (1941) indi-cated that most soil properties are time-dependent vari-ables including, and not limited to, clay accumulation(Birkeland, 1999), accumulation of calcium carbonate(CaCO3) (Gile et al., 1966), and iron (Fe) oxide contentand composition (Alexander, 1974; MacFadden andHendricks, 1985; Maejima et al., 2002). Quantitativeindices using a single value to evaluate the degree of soildevelopment have been proposed (Bilzi and Ciolkosz,1977; Torrent et al., 1980; Harden, 1982). Harden's(1982) profile development index (PDI), which quantifiesfield properties of soils, has proved to be an easy andeffective approach for studying soil development ratesand for quantitatively comparing soil development ofdifferent parent materials and in different climatic regimes(Harden and Taylor, 1983). For instance, Bockheim et al.(1992) found that late Quaternary marine terraces locatedalong the Oregon coast can be differentiated using PDIsderived from field descriptions. Alonso et al. (1994), whoexamined seven fluvial terrace soils located along the
Almar river in Spain, found that the index values in-creased as soil age and degree of differentiation betweenthe horizons of each soil became progressively evident.
Bull (1990) proposed that the soil sciences and flu-vial geomorphology meet on river terrace flights thatrise like stairs above active channels. The Pakua tablel-and river terraces form a chronosequence that allowsfacilitates the study of the rate and direction of soildevelopment and landscape evolution. This study at-tempts to apply pedology to resolve the factors control-ling the geomorphic evolution of terraces in the Pakuatableland. In this study, the weighted mean PDI (orWPDI) and the amounts of Fe and Al in soils are exam-ined and compared with those obtained other studies toestimate soils and/or river terrace ages in the Pakuatableland. Moreover, landscape evolution and activetectonic deformation of the study area are discussedbased on the pedogenic processes.
2. Study area
2.1. Geology
Taiwan is located at the convergent boundary betweenthe Philippine Sea plate and the continental margin of theEurasian plate. The Philippine Sea plate subducts beneath
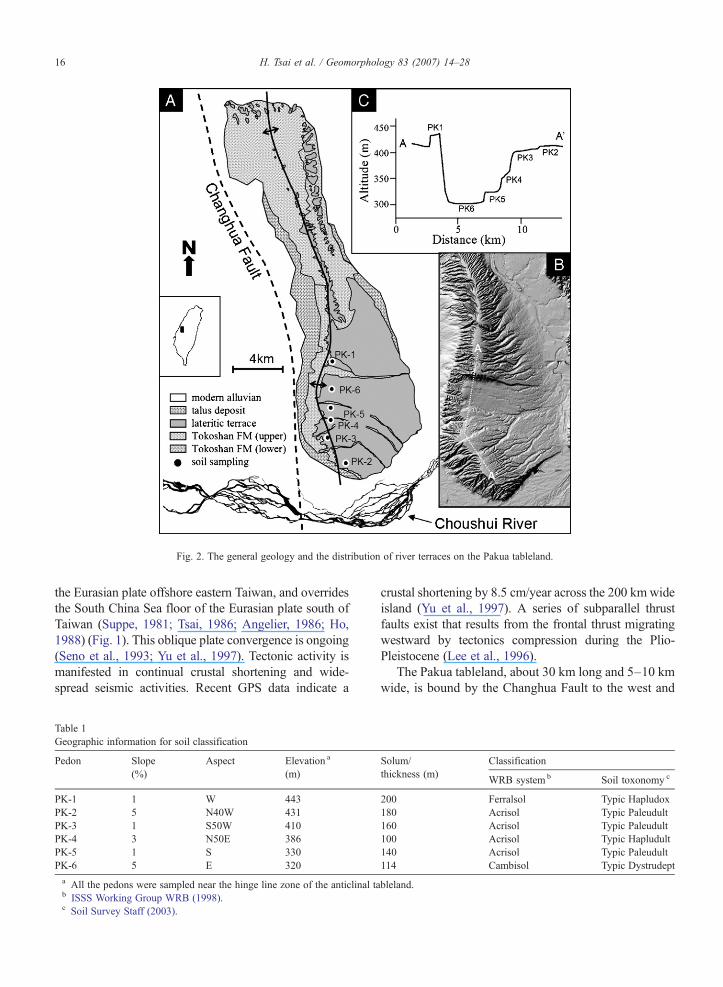
Fig. 2. The general geology and the distribution of river terraces on the Pakua tableland.
16 H. Tsai et al. / Geomorphology 83 (2007) 14–28
the Eurasian plate offshore eastern Taiwan, and overridesthe South China Sea floor of the Eurasian plate south ofTaiwan (Suppe, 1981; Tsai, 1986; Angelier, 1986; Ho,1988) (Fig. 1). This oblique plate convergence is ongoing(Seno et al., 1993; Yu et al., 1997). Tectonic activity ismanifested in continual crustal shortening and wide-spread seismic activities. Recent GPS data indicate a
Table 1Geographic information for soil classification
Pedon Slope(%)
Aspect Elevation a
(m)
PK-1 1 W 443PK-2 5 N40W 431PK-3 1 S50W 410PK-4 3 N50E 386PK-5 1 S 330PK-6 5 E 320a All the pedons were sampled near the hinge line zone of the anticlinal tab ISSS Working Group WRB (1998).c Soil Survey Staff (2003).
crustal shortening by 8.5 cm/year across the 200 kmwideisland (Yu et al., 1997). A series of subparallel thrustfaults exist that results from the frontal thrust migratingwestward by tectonics compression during the Plio-Pleistocene (Lee et al., 1996).
The Pakua tableland, about 30 km long and 5–10 kmwide, is bound by the Changhua Fault to the west and
Solum/thickness (m)
Classification
WRB system b Soil toxonomy c
200 Ferralsol Typic Hapludox180 Acrisol Typic Paleudult160 Acrisol Typic Paleudult100 Acrisol Typic Hapludult140 Acrisol Typic Paleudult114 Cambisol Typic Dystrudept
bleland.
17H. Tsai et al. / Geomorphology 83 (2007) 14–28
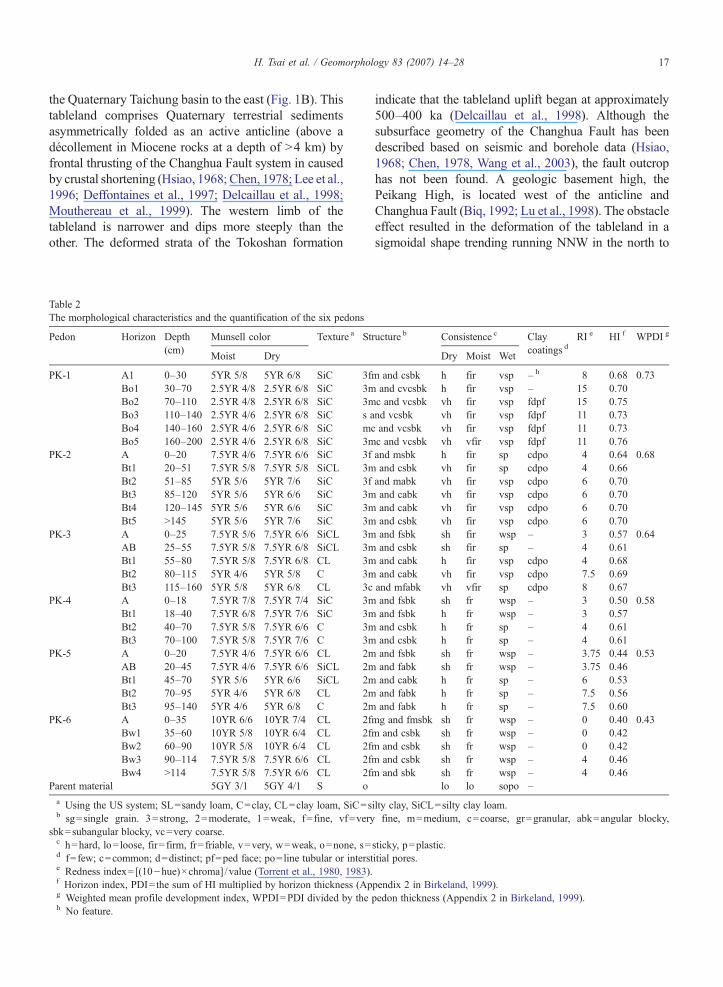
the Quaternary Taichung basin to the east (Fig. 1B). Thistableland comprises Quaternary terrestrial sedimentsasymmetrically folded as an active anticline (above adécollement in Miocene rocks at a depth of >4 km) byfrontal thrusting of the Changhua Fault system in causedby crustal shortening (Hsiao, 1968; Chen, 1978; Lee et al.,1996; Deffontaines et al., 1997; Delcaillau et al., 1998;Mouthereau et al., 1999). The western limb of thetableland is narrower and dips more steeply than theother. The deformed strata of the Tokoshan formation
Table 2The morphological characteristics and the quantification of the six pedons
Pedon Horizon Depth(cm)
Munsell color Texture a St
Moist Dry
PK-1 A1 0–30 5YR 5/8 5YR 6/8 SiC 3fBo1 30–70 2.5YR 4/8 2.5YR 6/8 SiC 3mBo2 70–110 2.5YR 4/8 2.5YR 6/8 SiC 3mBo3 110–140 2.5YR 4/6 2.5YR 6/8 SiC s aBo4 140–160 2.5YR 4/6 2.5YR 6/8 SiC mcBo5 160–200 2.5YR 4/6 2.5YR 6/8 SiC 3m
PK-2 A 0–20 7.5YR 4/6 7.5YR 6/6 SiC 3fBt1 20–51 7.5YR 5/8 7.5YR 5/8 SiCL 3mBt2 51–85 5YR 5/6 5YR 7/6 SiC 3fBt3 85–120 5YR 5/6 5YR 6/6 SiC 3mBt4 120–145 5YR 5/6 5YR 6/6 SiC 3mBt5 >145 5YR 5/6 5YR 7/6 SiC 3m
PK-3 A 0–25 7.5YR 5/6 7.5YR 6/6 SiCL 3mAB 25–55 7.5YR 5/8 7.5YR 6/8 SiCL 3mBt1 55–80 7.5YR 5/8 7.5YR 6/8 CL 3mBt2 80–115 5YR 4/6 5YR 5/8 C 3mBt3 115–160 5YR 5/8 5YR 6/8 CL 3c
PK-4 A 0–18 7.5YR 7/8 7.5YR 7/4 SiC 3mBt1 18–40 7.5YR 6/8 7.5YR 7/6 SiC 3mBt2 40–70 7.5YR 5/8 7.5YR 6/6 C 3mBt3 70–100 7.5YR 5/8 7.5YR 7/6 C 3m
PK-5 A 0–20 7.5YR 4/6 7.5YR 6/6 CL 2mAB 20–45 7.5YR 4/6 7.5YR 6/6 SiCL 2mBt1 45–70 5YR 5/6 5YR 6/6 SiCL 2mBt2 70–95 5YR 4/6 5YR 6/8 CL 2mBt3 95–140 5YR 4/6 5YR 6/8 C 2m
PK-6 A 0–35 10YR 6/6 10YR 7/4 CL 2fBw1 35–60 10YR 5/8 10YR 6/4 CL 2fBw2 60–90 10YR 5/8 10YR 6/4 CL 2fBw3 90–114 7.5YR 5/8 7.5YR 6/6 CL 2fBw4 >114 7.5YR 5/8 7.5YR 6/6 CL 2f
Parent material 5GY 3/1 5GY 4/1 S oa Using the US system; SL=sandy loam, C=clay, CL=clay loam, SiC=sb sg=single grain. 3=strong, 2=moderate, 1=weak, f= fine, vf=very
sbk=subangular blocky, vc=very coarse.c h=hard, lo= loose, fir= firm, fr= friable, v=very, w=weak, o=none, s=d f=few; c=common; d=distinct; pf=ped face; po= line tubular or interste Redness index=[(10−hue)×chroma] /value (Torrent et al., 1980, 1983).f Horizon index, PDI=the sum of HI multiplied by horizon thickness (Apg Weighted mean profile development index, WPDI=PDI divided by theh No feature.
indicate that the tableland uplift began at approximately500–400 ka (Delcaillau et al., 1998). Although thesubsurface geometry of the Changhua Fault has beendescribed based on seismic and borehole data (Hsiao,1968; Chen, 1978, Wang et al., 2003), the fault outcrophas not been found. A geologic basement high, thePeikang High, is located west of the anticline andChanghua Fault (Biq, 1992; Lu et al., 1998). The obstacleeffect resulted in the deformation of the tableland in asigmoidal shape trending running NNW in the north to
ructure b Consistence c Claycoatings d
RI e HI f WPDI g
Dry Moist Wet
m and csbk h fir vsp – h 8 0.68 0.73and cvcsbk h fir vsp – 15 0.70c and vcsbk vh fir vsp fdpf 15 0.75nd vcsbk vh fir vsp fdpf 11 0.73and vcsbk vh fir vsp fdpf 11 0.73c and vcsbk vh vfir vsp fdpf 11 0.76and msbk h fir sp cdpo 4 0.64 0.68and csbk vh fir sp cdpo 4 0.66and mabk vh fir vsp cdpo 6 0.70and cabk vh fir vsp cdpo 6 0.70and cabk vh fir vsp cdpo 6 0.70and csbk vh fir vsp cdpo 6 0.70and fsbk sh fir wsp – 3 0.57 0.64and csbk sh fir sp – 4 0.61and cabk h fir vsp cdpo 4 0.68and cabk vh fir vsp cdpo 7.5 0.69and mfabk vh vfir sp cdpo 8 0.67and fsbk sh fr wsp – 3 0.50 0.58and fsbk h fr wsp – 3 0.57and csbk h fr sp – 4 0.61and csbk h fr sp – 4 0.61and fsbk sh fr wsp – 3.75 0.44 0.53and fabk sh fr wsp – 3.75 0.46and cabk h fr sp – 6 0.53and fabk h fr sp – 7.5 0.56and fabk h fr sp – 7.5 0.60
mg and fmsbk sh fr wsp – 0 0.40 0.43m and csbk sh fr wsp – 0 0.42m and csbk sh fr wsp – 0 0.42m and csbk sh fr wsp – 4 0.46m and sbk sh fr wsp – 4 0.46
lo lo sopo –
ilty clay, SiCL=silty clay loam.fine, m=medium, c=coarse, gr=granular, abk=angular blocky,
sticky, p=plastic.itial pores.
pendix 2 in Birkeland, 1999).pedon thickness (Appendix 2 in Birkeland, 1999).
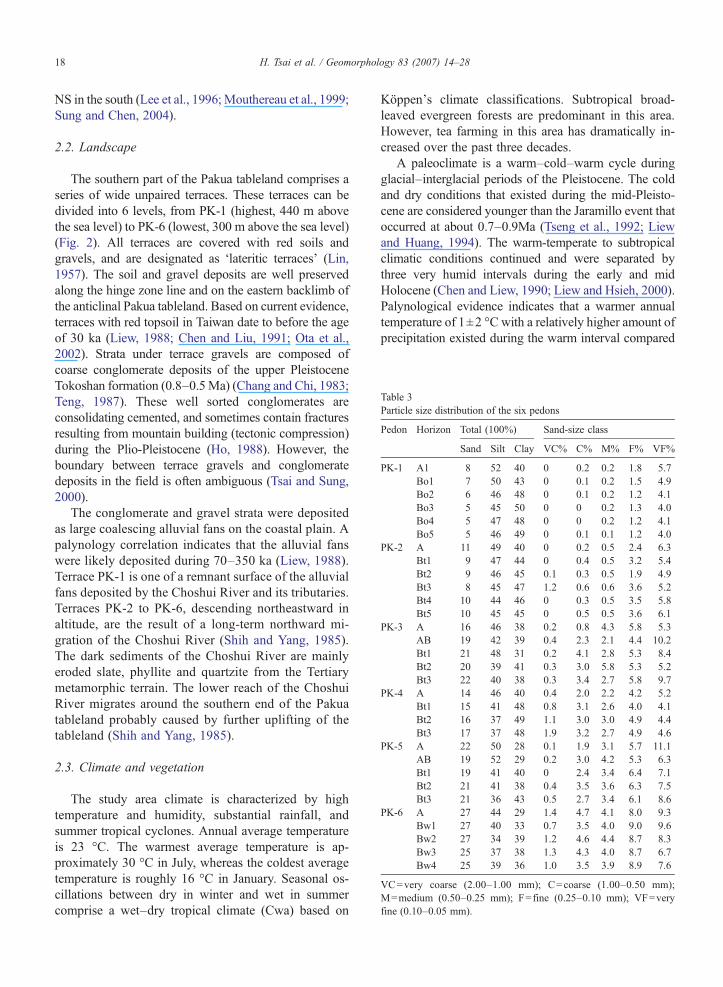
Table 3Particle size distribution of the six pedons
Pedon Horizon Total (100%) Sand-size class
Sand Silt Clay VC% C% M% F% VF%
PK-1 A1 8 52 40 0 0.2 0.2 1.8 5.7Bo1 7 50 43 0 0.1 0.2 1.5 4.9Bo2 6 46 48 0 0.1 0.2 1.2 4.1Bo3 5 45 50 0 0 0.2 1.3 4.0Bo4 5 47 48 0 0 0.2 1.2 4.1Bo5 5 46 49 0 0.1 0.1 1.2 4.0
PK-2 A 11 49 40 0 0.2 0.5 2.4 6.3Bt1 9 47 44 0 0.4 0.5 3.2 5.4Bt2 9 46 45 0.1 0.3 0.5 1.9 4.9Bt3 8 45 47 1.2 0.6 0.6 3.6 5.2Bt4 10 44 46 0 0.3 0.5 3.5 5.8Bt5 10 45 45 0 0.5 0.5 3.6 6.1
PK-3 A 16 46 38 0.2 0.8 4.3 5.8 5.3AB 19 42 39 0.4 2.3 2.1 4.4 10.2Bt1 21 48 31 0.2 4.1 2.8 5.3 8.4Bt2 20 39 41 0.3 3.0 5.8 5.3 5.2Bt3 22 40 38 0.3 3.4 2.7 5.8 9.7
PK-4 A 14 46 40 0.4 2.0 2.2 4.2 5.2Bt1 15 41 48 0.8 3.1 2.6 4.0 4.1Bt2 16 37 49 1.1 3.0 3.0 4.9 4.4Bt3 17 37 48 1.9 3.2 2.7 4.9 4.6
PK-5 A 22 50 28 0.1 1.9 3.1 5.7 11.1AB 19 52 29 0.2 3.0 4.2 5.3 6.3Bt1 19 41 40 0 2.4 3.4 6.4 7.1Bt2 21 41 38 0.4 3.5 3.6 6.3 7.5Bt3 21 36 43 0.5 2.7 3.4 6.1 8.6
PK-6 A 27 44 29 1.4 4.7 4.1 8.0 9.3Bw1 27 40 33 0.7 3.5 4.0 9.0 9.6Bw2 27 34 39 1.2 4.6 4.4 8.7 8.3Bw3 25 37 38 1.3 4.3 4.0 8.7 6.7Bw4 25 39 36 1.0 3.5 3.9 8.9 7.6
VC=very coarse (2.00–1.00 mm); C=coarse (1.00–0.50 mm);M=medium (0.50–0.25 mm); F=fine (0.25–0.10 mm); VF=veryfine (0.10–0.05 mm).
18 H. Tsai et al. / Geomorphology 83 (2007) 14–28
NS in the south (Lee et al., 1996; Mouthereau et al., 1999;Sung and Chen, 2004).
2.2. Landscape
The southern part of the Pakua tableland comprises aseries of wide unpaired terraces. These terraces can bedivided into 6 levels, from PK-1 (highest, 440 m abovethe sea level) to PK-6 (lowest, 300 m above the sea level)(Fig. 2). All terraces are covered with red soils andgravels, and are designated as ‘lateritic terraces’ (Lin,1957). The soil and gravel deposits are well preservedalong the hinge zone line and on the eastern backlimb ofthe anticlinal Pakua tableland. Based on current evidence,terraces with red topsoil in Taiwan date to before the ageof 30 ka (Liew, 1988; Chen and Liu, 1991; Ota et al.,2002). Strata under terrace gravels are composed ofcoarse conglomerate deposits of the upper PleistoceneTokoshan formation (0.8–0.5Ma) (Chang and Chi, 1983;Teng, 1987). These well sorted conglomerates areconsolidating cemented, and sometimes contain fracturesresulting from mountain building (tectonic compression)during the Plio-Pleistocene (Ho, 1988). However, theboundary between terrace gravels and conglomeratedeposits in the field is often ambiguous (Tsai and Sung,2000).
The conglomerate and gravel strata were depositedas large coalescing alluvial fans on the coastal plain. Apalynology correlation indicates that the alluvial fanswere likely deposited during 70–350 ka (Liew, 1988).Terrace PK-1 is one of a remnant surface of the alluvialfans deposited by the Choshui River and its tributaries.Terraces PK-2 to PK-6, descending northeastward inaltitude, are the result of a long-term northward mi-gration of the Choshui River (Shih and Yang, 1985).The dark sediments of the Choshui River are mainlyeroded slate, phyllite and quartzite from the Tertiarymetamorphic terrain. The lower reach of the ChoshuiRiver migrates around the southern end of the Pakuatableland probably caused by further uplifting of thetableland (Shih and Yang, 1985).
2.3. Climate and vegetation
The study area climate is characterized by hightemperature and humidity, substantial rainfall, andsummer tropical cyclones. Annual average temperatureis 23 °C. The warmest average temperature is ap-proximately 30 °C in July, whereas the coldest averagetemperature is roughly 16 °C in January. Seasonal os-cillations between dry in winter and wet in summercomprise a wet–dry tropical climate (Cwa) based on
Köppen's climate classifications. Subtropical broad-leaved evergreen forests are predominant in this area.However, tea farming in this area has dramatically in-creased over the past three decades.
A paleoclimate is a warm–cold–warm cycle duringglacial–interglacial periods of the Pleistocene. The coldand dry conditions that existed during the mid-Pleisto-cene are considered younger than the Jaramillo event thatoccurred at about 0.7–0.9Ma (Tseng et al., 1992; Liewand Huang, 1994). The warm-temperate to subtropicalclimatic conditions continued and were separated bythree very humid intervals during the early and midHolocene (Chen and Liew, 1990; Liew and Hsieh, 2000).Palynological evidence indicates that a warmer annualtemperature of 1±2 °C with a relatively higher amount ofprecipitation existed during the warm interval compared
19H. Tsai et al. / Geomorphology 83 (2007) 14–28
with the cool–dry interval in mid-Pleistocene (Liew andHsieh, 2000).
3. Material and methods
3.1. Pedons
Terrace surface deposits are well preserved along thehinge and eastern backlimb of the anticline (Pakuatableland). According to field observations, the soilsmeasure are >4m thick above the gravels in terrace PK-1,and about 1–2 m in terraces PK 2-6. Soil color rangesfrom strong brown to yellowish red in a trend that roughlyagrees with the increasing terrace altitude; i.e. as altitudeincreases, the soil color reddens.
Six pedons, labeled as the terraces, were sampledfollowing guidelines in the Soil Survey Manual (SoilSurvey Staff, 1993). Each pedon is situated on the planarsurface near the anticline hinge where the soil (and/or thesurface) is well preserved without gully erosion (Fig. 2).Saldaña et al. (1998) proposed that variability of soilproperties decreases as soil deposits age. The soils in thePakua tableland may be sufficiently old to havehomogenous soil properties. Furthermore, the uniformcolor and thickness of soil in each terrace and the similarclimate, vegetation, groundwater, and drainage condi-tions suggest that the spatial variability of soil properties
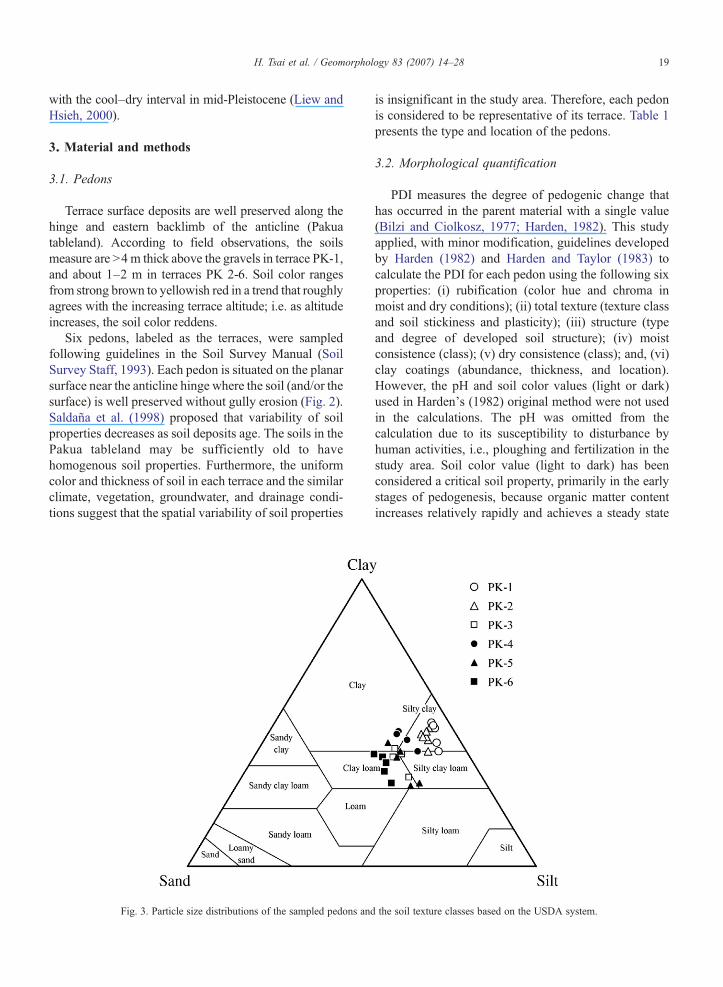
Fig. 3. Particle size distributions of the sampled pedons and
is insignificant in the study area. Therefore, each pedonis considered to be representative of its terrace. Table 1presents the type and location of the pedons.
3.2. Morphological quantification
PDI measures the degree of pedogenic change thathas occurred in the parent material with a single value(Bilzi and Ciolkosz, 1977; Harden, 1982). This studyapplied, with minor modification, guidelines developedby Harden (1982) and Harden and Taylor (1983) tocalculate the PDI for each pedon using the following sixproperties: (i) rubification (color hue and chroma inmoist and dry conditions); (ii) total texture (texture classand soil stickiness and plasticity); (iii) structure (typeand degree of developed soil structure); (iv) moistconsistence (class); (v) dry consistence (class); and, (vi)clay coatings (abundance, thickness, and location).However, the pH and soil color values (light or dark)used in Harden's (1982) original method were not usedin the calculations. The pH was omitted from thecalculation due to its susceptibility to disturbance byhuman activities, i.e., ploughing and fertilization in thestudy area. Soil color value (light to dark) has beenconsidered a critical soil property, primarily in the earlystages of pedogenesis, because organic matter contentincreases relatively rapidly and achieves a steady state
the soil texture classes based on the USDA system.
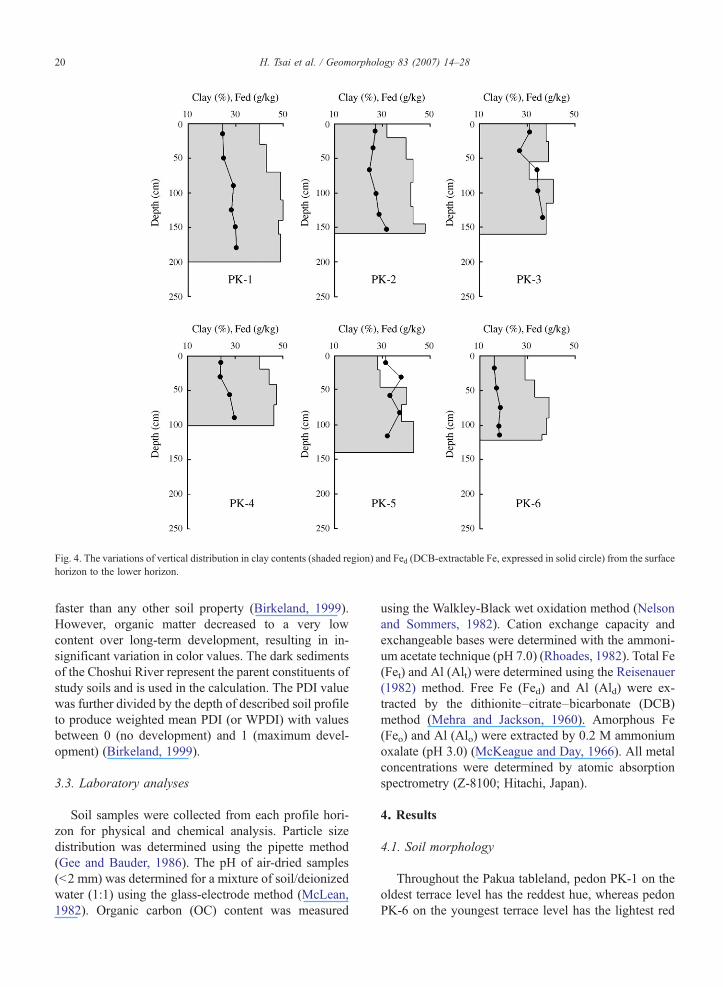
Fig. 4. The variations of vertical distribution in clay contents (shaded region) and Fed (DCB-extractable Fe, expressed in solid circle) from the surfacehorizon to the lower horizon.
20 H. Tsai et al. / Geomorphology 83 (2007) 14–28
faster than any other soil property (Birkeland, 1999).However, organic matter decreased to a very lowcontent over long-term development, resulting in in-significant variation in color values. The dark sedimentsof the Choshui River represent the parent constituents ofstudy soils and is used in the calculation. The PDI valuewas further divided by the depth of described soil profileto produce weighted mean PDI (or WPDI) with valuesbetween 0 (no development) and 1 (maximum devel-opment) (Birkeland, 1999).
3.3. Laboratory analyses
Soil samples were collected from each profile hori-zon for physical and chemical analysis. Particle sizedistribution was determined using the pipette method(Gee and Bauder, 1986). The pH of air-dried samples(<2 mm) was determined for a mixture of soil/deionizedwater (1:1) using the glass-electrode method (McLean,1982). Organic carbon (OC) content was measured
using the Walkley-Black wet oxidation method (Nelsonand Sommers, 1982). Cation exchange capacity andexchangeable bases were determined with the ammoni-um acetate technique (pH 7.0) (Rhoades, 1982). Total Fe(Fet) and Al (Alt) were determined using the Reisenauer(1982) method. Free Fe (Fed) and Al (Ald) were ex-tracted by the dithionite–citrate–bicarbonate (DCB)method (Mehra and Jackson, 1960). Amorphous Fe(Feo) and Al (Alo) were extracted by 0.2 M ammoniumoxalate (pH 3.0) (McKeague and Day, 1966). All metalconcentrations were determined by atomic absorptionspectrometry (Z-8100; Hitachi, Japan).
4. Results
4.1. Soil morphology
Throughout the Pakua tableland, pedon PK-1 on theoldest terrace level has the reddest hue, whereas pedonPK-6 on the youngest terrace level has the lightest red
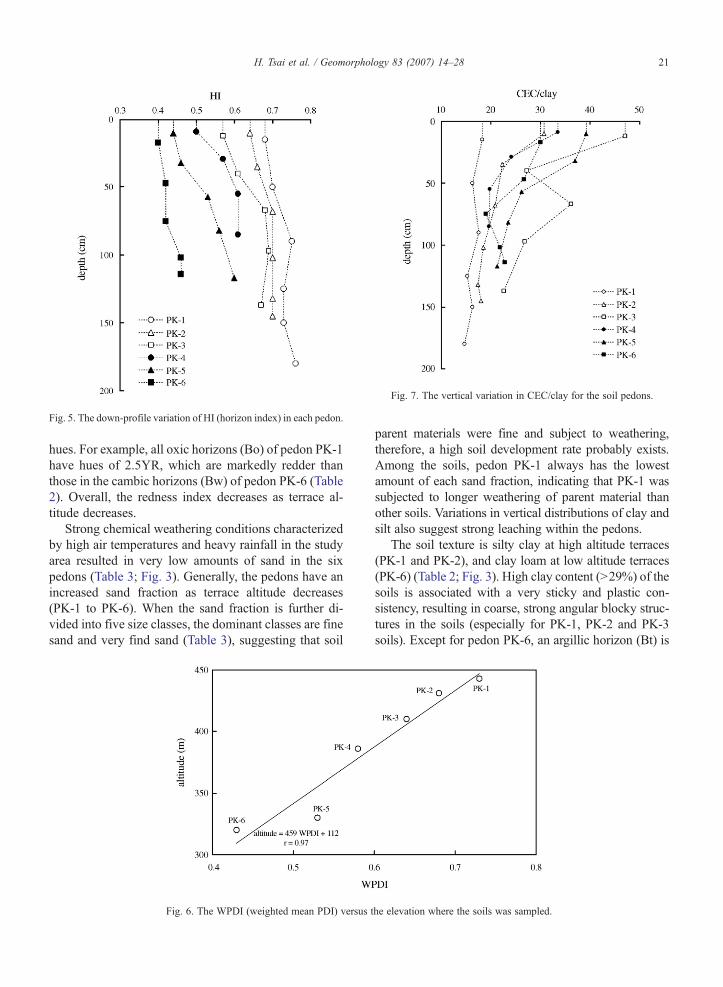
Fig. 5. The down-profile variation of HI (horizon index) in each pedon.
Fig. 7. The vertical variation in CEC/clay for the soil pedons.
21H. Tsai et al. / Geomorphology 83 (2007) 14–28
hues. For example, all oxic horizons (Bo) of pedon PK-1have hues of 2.5YR, which are markedly redder thanthose in the cambic horizons (Bw) of pedon PK-6 (Table2). Overall, the redness index decreases as terrace al-titude decreases.
Strong chemical weathering conditions characterizedby high air temperatures and heavy rainfall in the studyarea resulted in very low amounts of sand in the sixpedons (Table 3; Fig. 3). Generally, the pedons have anincreased sand fraction as terrace altitude decreases(PK-1 to PK-6). When the sand fraction is further di-vided into five size classes, the dominant classes are finesand and very find sand (Table 3), suggesting that soil
Fig. 6. The WPDI (weighted mean PDI) versus t
parent materials were fine and subject to weathering,therefore, a high soil development rate probably exists.Among the soils, pedon PK-1 always has the lowestamount of each sand fraction, indicating that PK-1 wassubjected to longer weathering of parent material thanother soils. Variations in vertical distributions of clay andsilt also suggest strong leaching within the pedons.
The soil texture is silty clay at high altitude terraces(PK-1 and PK-2), and clay loam at low altitude terraces(PK-6) (Table 2; Fig. 3). High clay content (>29%) of thesoils is associated with a very sticky and plastic con-sistency, resulting in coarse, strong angular blocky struc-tures in the soils (especially for PK-1, PK-2 and PK-3soils). Except for pedon PK-6, an argillic horizon (Bt) is
he elevation where the soils was sampled.
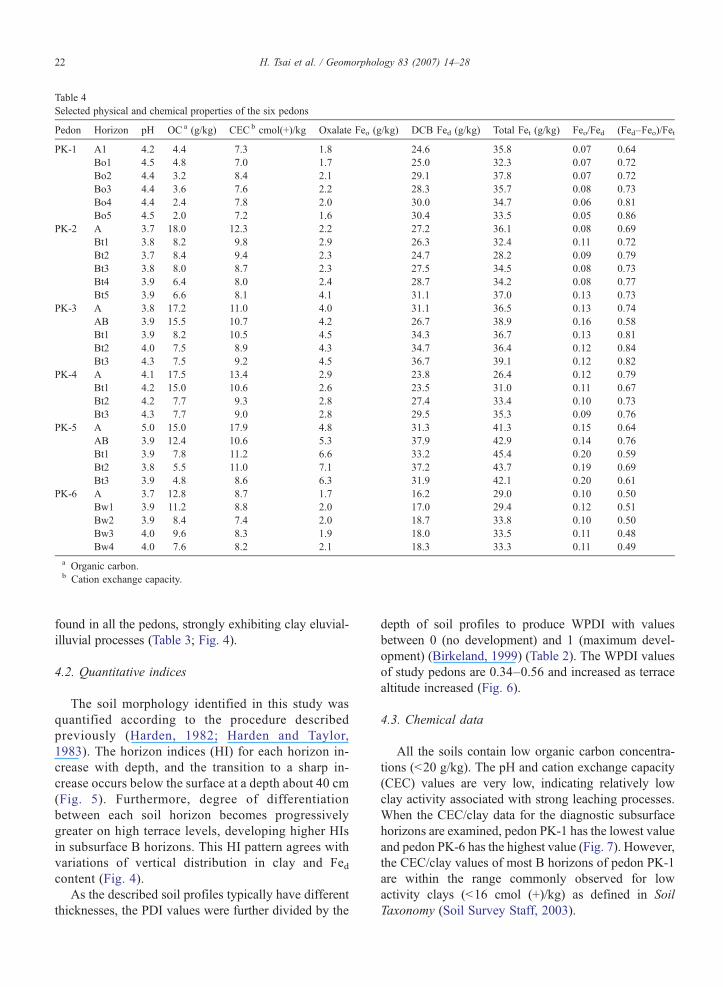
Table 4Selected physical and chemical properties of the six pedons
Pedon Horizon pH OCa (g/kg) CECb cmol(+)/kg Oxalate Feo (g/kg) DCB Fed (g/kg) Total Fet (g/kg) Feo/Fed (Fed–Feo)/Fet
PK-1 A1 4.2 4.4 7.3 1.8 24.6 35.8 0.07 0.64Bo1 4.5 4.8 7.0 1.7 25.0 32.3 0.07 0.72Bo2 4.4 3.2 8.4 2.1 29.1 37.8 0.07 0.72Bo3 4.4 3.6 7.6 2.2 28.3 35.7 0.08 0.73Bo4 4.4 2.4 7.8 2.0 30.0 34.7 0.06 0.81Bo5 4.5 2.0 7.2 1.6 30.4 33.5 0.05 0.86
PK-2 A 3.7 18.0 12.3 2.2 27.2 36.1 0.08 0.69Bt1 3.8 8.2 9.8 2.9 26.3 32.4 0.11 0.72Bt2 3.7 8.4 9.4 2.3 24.7 28.2 0.09 0.79Bt3 3.8 8.0 8.7 2.3 27.5 34.5 0.08 0.73Bt4 3.9 6.4 8.0 2.4 28.7 34.2 0.08 0.77Bt5 3.9 6.6 8.1 4.1 31.1 37.0 0.13 0.73
PK-3 A 3.8 17.2 11.0 4.0 31.1 36.5 0.13 0.74AB 3.9 15.5 10.7 4.2 26.7 38.9 0.16 0.58Bt1 3.9 8.2 10.5 4.5 34.3 36.7 0.13 0.81Bt2 4.0 7.5 8.9 4.3 34.7 36.4 0.12 0.84Bt3 4.3 7.5 9.2 4.5 36.7 39.1 0.12 0.82
PK-4 A 4.1 17.5 13.4 2.9 23.8 26.4 0.12 0.79Bt1 4.2 15.0 10.6 2.6 23.5 31.0 0.11 0.67Bt2 4.2 7.7 9.3 2.8 27.4 33.4 0.10 0.73Bt3 4.3 7.7 9.0 2.8 29.5 35.3 0.09 0.76
PK-5 A 5.0 15.0 17.9 4.8 31.3 41.3 0.15 0.64AB 3.9 12.4 10.6 5.3 37.9 42.9 0.14 0.76Bt1 3.9 7.8 11.2 6.6 33.2 45.4 0.20 0.59Bt2 3.8 5.5 11.0 7.1 37.2 43.7 0.19 0.69Bt3 3.9 4.8 8.6 6.3 31.9 42.1 0.20 0.61
PK-6 A 3.7 12.8 8.7 1.7 16.2 29.0 0.10 0.50Bw1 3.9 11.2 8.8 2.0 17.0 29.4 0.12 0.51Bw2 3.9 8.4 7.4 2.0 18.7 33.8 0.10 0.50Bw3 4.0 9.6 8.3 1.9 18.0 33.5 0.11 0.48Bw4 4.0 7.6 8.2 2.1 18.3 33.3 0.11 0.49
a Organic carbon.b Cation exchange capacity.
22 H. Tsai et al. / Geomorphology 83 (2007) 14–28
found in all the pedons, strongly exhibiting clay eluvial-illuvial processes (Table 3; Fig. 4).
4.2. Quantitative indices
The soil morphology identified in this study wasquantified according to the procedure describedpreviously (Harden, 1982; Harden and Taylor,1983). The horizon indices (HI) for each horizon in-crease with depth, and the transition to a sharp in-crease occurs below the surface at a depth about 40 cm(Fig. 5). Furthermore, degree of differentiationbetween each soil horizon becomes progressivelygreater on high terrace levels, developing higher HIsin subsurface B horizons. This HI pattern agrees withvariations of vertical distribution in clay and Fedcontent (Fig. 4).
As the described soil profiles typically have differentthicknesses, the PDI values were further divided by the
depth of soil profiles to produce WPDI with valuesbetween 0 (no development) and 1 (maximum devel-opment) (Birkeland, 1999) (Table 2). The WPDI valuesof study pedons are 0.34–0.56 and increased as terracealtitude increased (Fig. 6).
4.3. Chemical data
All the soils contain low organic carbon concentra-tions (<20 g/kg). The pH and cation exchange capacity(CEC) values are very low, indicating relatively lowclay activity associated with strong leaching processes.When the CEC/clay data for the diagnostic subsurfacehorizons are examined, pedon PK-1 has the lowest valueand pedon PK-6 has the highest value (Fig. 7). However,the CEC/clay values of most B horizons of pedon PK-1are within the range commonly observed for lowactivity clays (<16 cmol (+)/kg) as defined in SoilTaxonomy (Soil Survey Staff, 2003).
23H. Tsai et al. / Geomorphology 83 (2007) 14–28
The color of soil parent material in the Pakua tablelandis light olive brown (2.5Y 5/4). However, the six pedonshave reddish colors, which is attributable to differentdegrees of chemical weathering associated with Fereleased from silicate minerals. The DCB-extractableFe of soils ranged up to slightly over 30 g/kg (Table 4).Compared with DCB-extractable Fe, the amount ofoxalate-extractable Fe is extremely low, such that theratio of oxalate to DCB-extractable Fe (Feo/Fed value) isalways <0.2, indicating a high degree of Fe crystalliza-tion (Blume and Schwertmann, 1969). The accumulationof DCB-extractable Fe in subsurface horizons indicatesthe migration of free Fe from the eluvial horizon to thelower horizons—although the high terrace level havemore significant amounts of DCB-extractable Fe (Fig. 4).
4.4. Soil classification
Most soils in this study are classified as Ultisolsaccording to Soil Taxonomy. Based on morphology, claymigration and CEC/clay data, pedon PK-1, whosesubsurface horizons met the requirements of oxichorizon, is the oldest. Therefore, pedon PK-1 is clas-sified as a fine, mixed, hyperthermic Typic Hapludox,indicating that it is an Oxisol that has ≥40% clay in itsfine-earth fraction between the mineral soil surface andthe depth of 18 cm. Pedons PK-2, PK-3 and PK-5 arewell-developed Ultisols classified as fine, mixed, hyper-thermic Typic Paleudults. Pedon PK-4 is fine, mixed,hyperthermic Typic Hapludult. No accumulation ofilluvial clay was found in the B horizons of pedon PK-6,indicating that pedon PK-6 is a Typic Dystrudept and isthe youngest soil in the study area. A soil age sequence
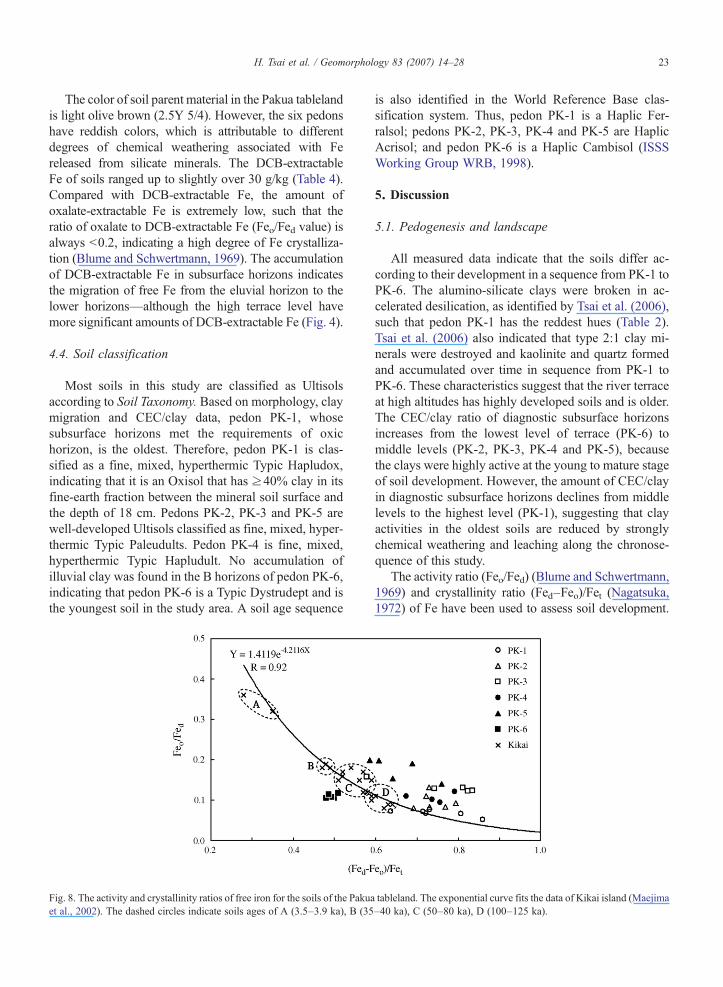
Fig. 8. The activity and crystallinity ratios of free iron for the soils of the Pakuaet al., 2002). The dashed circles indicate soils ages of A (3.5–3.9 ka), B (35
is also identified in the World Reference Base clas-sification system. Thus, pedon PK-1 is a Haplic Fer-ralsol; pedons PK-2, PK-3, PK-4 and PK-5 are HaplicAcrisol; and pedon PK-6 is a Haplic Cambisol (ISSSWorking Group WRB, 1998).
5. Discussion
5.1. Pedogenesis and landscape
All measured data indicate that the soils differ ac-cording to their development in a sequence from PK-1 toPK-6. The alumino-silicate clays were broken in ac-celerated desilication, as identified by Tsai et al. (2006),such that pedon PK-1 has the reddest hues (Table 2).Tsai et al. (2006) also indicated that type 2:1 clay mi-nerals were destroyed and kaolinite and quartz formedand accumulated over time in sequence from PK-1 toPK-6. These characteristics suggest that the river terraceat high altitudes has highly developed soils and is older.The CEC/clay ratio of diagnostic subsurface horizonsincreases from the lowest level of terrace (PK-6) tomiddle levels (PK-2, PK-3, PK-4 and PK-5), becausethe clays were highly active at the young to mature stageof soil development. However, the amount of CEC/clayin diagnostic subsurface horizons declines from middlelevels to the highest level (PK-1), suggesting that clayactivities in the oldest soils are reduced by stronglychemical weathering and leaching along the chronose-quence of this study.
The activity ratio (Feo/Fed) (Blume and Schwertmann,1969) and crystallinity ratio (Fed–Feo)/Fet (Nagatsuka,1972) of Fe have been used to assess soil development.
tableland. The exponential curve fits the data of Kikai island (Maejima–40 ka), C (50–80 ka), D (100–125 ka).
24 H. Tsai et al. / Geomorphology 83 (2007) 14–28
For example, in northern Italy the (Fed–Feo)/Fet ratiosincrease gradually with terrace age; however, the Fed/Fetratios decrease as pedon age increases (Arduino et al.,1984, 1986). Fig. 8 shows the values of (Feo/Fed) and(Fed–Feo)/Fet for all soils in the six pedons analyzed inthis study. All data, except for pedon PK-6, are withinNagatsuka's (1972) red soil region Feo/Fed≤0.4, (Fed–Feo)/Fet≥0.5. The highest terraces (i.e., PK-1 and PK-2)have low Feo/Fed and high (Fed–Feo)/Fet soil values. Atrend exists in which the crystallinity ratio of free Fegradually increased as terrace altitude increases, whereasthe activity ratio decreases. This trend is similar to thatobtained by Maejima et al. (2002), confirming that the
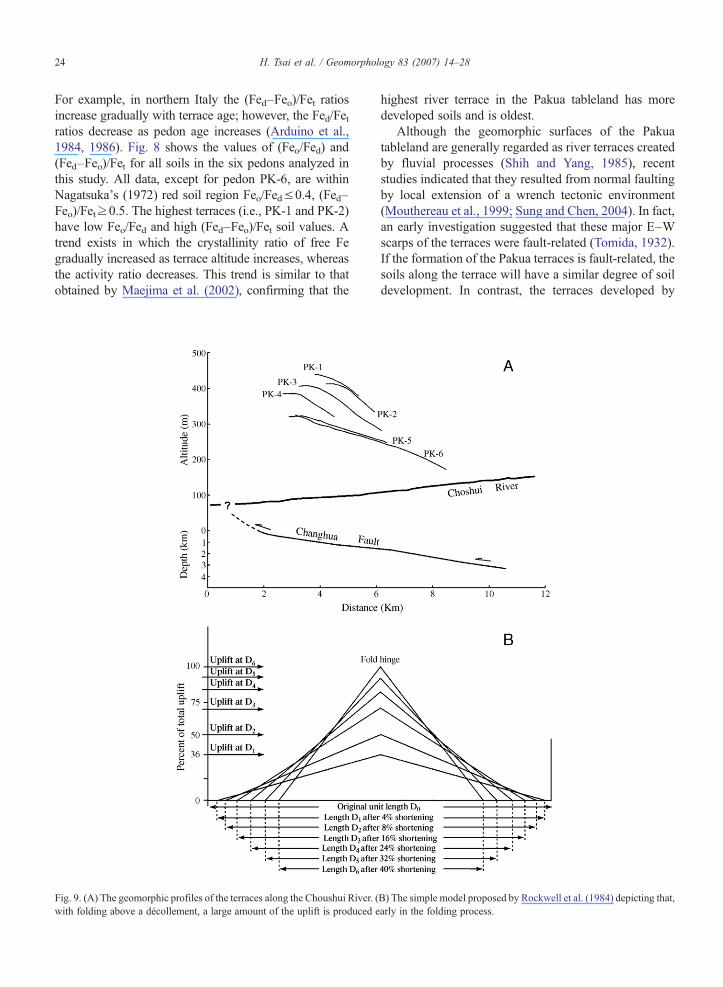
Fig. 9. (A) The geomorphic profiles of the terraces along the Choushui River. (with folding above a décollement, a large amount of the uplift is produced e
highest river terrace in the Pakua tableland has moredeveloped soils and is oldest.
Although the geomorphic surfaces of the Pakuatableland are generally regarded as river terraces createdby fluvial processes (Shih and Yang, 1985), recentstudies indicated that they resulted from normal faultingby local extension of a wrench tectonic environment(Mouthereau et al., 1999; Sung and Chen, 2004). In fact,an early investigation suggested that these major E–Wscarps of the terraces were fault-related (Tomida, 1932).If the formation of the Pakua terraces is fault-related, thesoils along the terrace will have a similar degree of soildevelopment. In contrast, the terraces developed by
B) The simple model proposed by Rockwell et al. (1984) depicting that,arly in the folding process.
25H. Tsai et al. / Geomorphology 83 (2007) 14–28
northward migration of the Choshui River will exhibit asoil chronosequence.
All study data demonstrate that the soils differ induration of development, in a sequence moving fromPK-1 to PK-6. The proposition that the surface depositson the terraces began forming at different periods in thepast and are still exposed is in agreement with the post-incisive chronosequence described by Vreeken (1975).Therefore, the argument that the terraces were devel-oped by successive river incision is supported.
5.2. Age estimations for river terraces
Terrace ages based on soil development can be esti-mated based on the positive relationship to Fe activity(Feo/Fed) and the negative relationship to Fe crystallin-ity (Fed–Feo)/Fet (Arduino et al., 1984; MacFadden andHendricks, 1985; Arduino et al., 1986). Maejima et al.(2002) estimated the age of Lateritic red soils onMinamidaito Island based on Fe activity and crystallin-ity ratios of dated soils (from ca. 35 to 125 ka) fromKikai Island. The red soils of Kikai Island were deve-loped from a coral reef. Chesworth (1973) argued thatthe affects by parent material are nullified with time.Soils in the Pakua tableland are probably >30 ka in age(Liew, 1988; Chen and Liu, 1991; Ota et al., 2002); thecomparable oceanic subtropical climate shared by KikaiIsland and the Pakua tableland may subject the soils tosimilar influences.
The Papua tableland soils have a pattern similar tothose on Kikai Island (Fig. 8). The high (Fed–Feo)/Fetratios of PK-1, PK-2, PK-3 and PK-4 indicate that theymay well be aged >125 ka. The power equation of (Fed–Feo)/Fet=0.0687 (Age0.1857) in Maejima et al. (2002)yields ages of 40–400 ka for the soils of the Pakuaterraces. However, age for individual soil sample isdifficult to determine based on the overlapping range of(Fed–Feo)/Fet values.
Assuming that soil formation began shortly after theformation of each river terrace, the estimated soil agesare relatively coincident with those of the river terraces.The maximum age determined by (Fed–Feo)/Fet valuessupports Delcaillau et al. (1998) who indicated that thetableland uplift began roughly at 50–400 ka. Based onpalynology analyses, Liew (1988) proposed that theterrace sediments were likely deposited during 70–350 ka. According to 14C dating for the lateritic terracesin the Chushan area, geologically regarded as thesouthern extension of the Pakua anticline across theChoshui River, the terrace equivalent to the PK-6 terracebased on altitude is aged ca. 31 ka (Ota et al., 2002). Asa result, these age estimates based on pedogenesis in this
study are in agreement with the estimation in previousstudies for lateritic terraces in Taiwan.
5.3. Morphotectonic implications
The deformed multiple terraces on the Pakuatableland are a useful tool for investigating the activetectonics in this area (Fig. 9A). The accumulated surfacedeformation is confirmed by the increasing river terraceslopes and altitude (Fig. 9A). The linearity of WPDIvalues versus terrace altitudes suggests that the Pakuatableland was uplifted at constant rate when the terraceswere developing, if the soil development in terms ofWPDI value increases at a relatively uniform rate (Fig.6). Based on these age estimations for terrace soil, theoverall uplift rate for the Pakua tableland is estimated at1.1 mm/year over the past 400 ka. This long-term upliftrate is attributable to about 0.33 mm/year during the400–40 ka period (terrace development) and about8 mm/year during the period from 40 ka to present (noterraces development), supporting the estimationobtained by Delcaillau et al. (1998). The rapid localuplift rate since 40 ka probably exceeds the rate of riverincision, preventing the development of river terraceslocated lower than PK-6.
The Pakua tableland has surface and subsurface geo-metries similar to those of the Ventura Avenue anticlinein California. Lee et al. (1996) attributed the surfacedeformation of the Pakua tableland to the ChanghuaFault slipping beneath the tableland. Study of theVentura Avenue anticline demonstrates that rates oftectonic activity vary over time and space as a result offolding mechanics (Rockwell et al., 1984). The steadyshortening of rootless fold buckles accounts for thereduction in uplift rate (Fig. 9B). The varying uplift ratesin the Pakua tableland reflect increased shortening bythe Changhua Fault. Fold reconstruction indicates ahorizontal east-west shortening rate that increased from2.4 mm/year (400–40 ka) to 31 mm/year (from 40 ka topresent). These rates are in agreement with GPS mea-surements that recorded a 2–33 mm/year of instanta-neous shortening velocities along the Changhua Faultbetween 1992 and 1994 (Yu et al., 1997).
Field and subsurface evidence shows that theChanghuaFault is buried and located at a depth of 3 km, with littledisplacement near the surface (Hsiao, 1968; Chen, 1978;Central Geologic Survey, 2001). Recent shallow reflectionseismic profiles demonstrated that the western wing of theasymmetric Pakua tableland is characterized by continu-ous and gently dipping strata with a dipping angle as highas 30° (Wang et al., 2003), indicating the anticline is notlocked up and allows for further deformation. Due to the
26 H. Tsai et al. / Geomorphology 83 (2007) 14–28
obstacle of the Peikang High to the west, the Pakua table-landwill further uplift in response to the crustal shorteningby the Changhua Fault and tectonic compression from theeast. This surface deformation can relieve tectonic pressureand prevent transfer of the boundary fault to the west. TheChanghua Fault remains the western-most thrust, and is aboundary fault running along the deformation front in theforeland belt of western Taiwan. The thrusting of this faultis likely to become increasingly active in the future, pre-senting a potentially serious threat to Taiwan.
6. Conclusions
The terraces soils in the southern Pakua tableland weresubject to considerable leaching andweathering. All soils,except for that of pedon PK-1 (Oxisol) and PK-6 (Incep-tisol), are Ultisols based on Soil Taxonomy classifications.The field morphology and the chemical data indicate thatthese soils differ in development duration. The degree ofsoil development increases as altitude decreases in a se-quence from PK-1 to PK-6. These soils form a post-incisive soil chronosequence that conforms with the evo-lution of the geomorphic surface developed by successiveriver incision resulting from the northward migration ofthe Choushui River in the study area.
The river terraces of the Pakua tableland are clearlyuplifted, tilted and folded by the Changhua Fault slippingbeneath the tableland. Based on the age estimation for theterraces, rates of uplift and tilt have probably increasedsince folding began, from approximately 0.33 mm/year(400–40 ka) to about 8 mm/year (from 40 ka to thepresent). The current rate of local uplift likely exceeds therate of river incision, preventing the development of riverterraces located lower than PK-6. The variation inprevious uplift rates reflects the increased shortening byfrontal thrusting of the Changhua Fault running beneaththe tableland.
Acknowledgements
The authors would like to thank the National ScienceCouncil of the Republic of China, Taiwan, for financiallysupporting this research under Contract No. NSC 91-2116-M-018-001 and NSC 92-2116-M-018-002.
References
Alexander, E.B., 1974. Extractable iron in relation to soil age onterraces along the Truckee River, Nevada. Soil Sci. Soc. Am. Proc.38, 121–124.
Alonso, P.C., Sierra, E., Ortega, C., Dorronsoro, 1994. Soil developmentindices of soils developed on fluvial terraces (Peòaranda deBracamonte, Sala manca, Spain). Catena 23, 295–308.
Angelier, J., 1986. Geodynamics of Eurasia-Philippine sea plateboundary: preface. Tectonophysics 125, IX–X.
Arduino, E., Barberis, E., Carraro, F., Forno, M.G., 1984. Estimatingrelative ages from iron-oxide/total-iron ratios of soils in thewestern Po Valley, Italy. Geoderma 33, 39–52.
Arduino, E., Barberis, E., Marsan, F.A., Zanini, E., Franchini, M.,1986. Iron oxides and clay minerals within profiles as indicators ofsoil age in Northern Italy. Geoderma 37, 45–55.
Bockheim, J.G., Kelsey, H.M., Marshall III, J.G., 1992. Soildevelopment, relative dating, and correlation of late Quaternarymarine terraces in southwestern Oregan. Quat. Res. 37, 60–74.
Bilzi, A.F., Ciolkosz, E.J., 1977. A field morphology rating scale forevaluating pedological development. Soil Sci. 124, 45–48.
Biq, C., 1992. Another coastal range on Taiwan. Ti-Chi 12, 1–14 (inChinese).
Birkeland, P.W., 1984. Holocene soil chronofunctions, Southern Alps,New Zealand. Geoderma 34, 115–134.
Birkeland, P.W., 1999. Soils and Geomorphology, 3rd ed. OxfordUniv. Press, New York.
Blume, H.P., Schwertmann, U., 1969. Genetic evaluation of profiledistribution of aluminum, iron, and manganese oxides. Soil Sci.Soc. Am. Proc. 33, 438–444.
Bull, W.B., 1990. Stream-terrace genesis: implications for soildevelopment. Geomorphology 3, 351–367.
Central Geologic Survey, 2001. An introduction to the active fault inTaiwan with explanatory text of the active fault map of Taiwan,scale 1:500,000, 2nd ed. Central Geologic Survey, Taiwan,Republic of China.
Chang, L.P., Chi, W.R., 1983. Neogene nannoplankton biostratigraphyin Taiwan and the tectonic implications. Petrol. Geol. Taiwan 19,93–147.
Chen, F.Y., Liew, P.M., 1990. Palynological study of the Sungshanformation, Taipei basin. Proc. Geol. Soc. China 33, 21–37.
Chen, J.S., 1978. A comparative study of the refraction and reflectionseismic data obtained on the Changhua Plain to the Peikang Shelf,Taiwan. Petrol. Geol. Taiwan 15, 199–217.
Chen, Y.G., Liu, T.K., 1991. Radiocarbon dates of river terraces alongthe lower Tahanchi, northern Taiwan: their tectonic and geomor-phic implications. J. Geol. Soc. China 34, 337–347.
Chesworth, W., 1973. The parent rock effect on the genesis of soil.Geoderma 10, 215–225.
Deffontaines, B., Lacombe, O., Angelier, J., Chu, H.T., Mouthereau,F., Lee, C.T., Deramond, J., Lee, J.F., Yu, M.S., Liew, P.M., 1997.Quaternary transfer faulting in the Taiwan Foothills: evidence froma multisource approach. Tectonophysics 274, 61–82.
Delcaillau, B., 2001. Geomorphic response to growing fault-relatedfolds: example from the foothills of central Taiwan. Geodin. Acta14, 265–287.
Delcaillau, B., Deffontaines, B., Floissac, L., Angelier, J., Deramond, J.,Souquet, P., Chu, H.T., Lee, J.F., 1998. Morphotectonic evidencefrom lateral propagation of an active frontal fold; Pakuashananticline, foothills of Taiwan. Geomorphology 24, 263–290.
Gee, G.W., Bauder, J.W., 1986. Particle-size analysis. In: Klut, A.(Ed.), Methods of Soil Analysis: Part 1. Physical and Mineralog-ical Methods. Agronomy Monograph, vol. 9. ASA and SSSA,Madison, WI, pp. 383–411.
Gile, L.H., Peterson, F.F., Grossman, R.B., 1966. Morphological andgenetic sequences of carbonate accumulations in desert soils. SoilSci. 101, 347–360.
Harden, J.W., 1982. A quantitative index of soil development fromfield descriptions, examples from a chronosequence in CentralCalifornia. Geoderma 28, 1–28.
27H. Tsai et al. / Geomorphology 83 (2007) 14–28
Harden, J.W., Taylor, E.M., 1983. A quantitative comparison of soildevelopment in four climatic regimes. Quat. Res. 20, 342–359.
Ho, C.S., 1988. An Introduction to the Geology of Taiwan:Explanatory Text of the Geologic Map of Taiwan, 2nd ed. CentralGeologic Survey, Taiwan, Republic of China.
Hsiao, P.T., 1968. Seismic study of the Taichung area, Taiwan. Petrol.Geol. Taiwan 6, 209–216.
ISSS Working Group WRB, 1998. World reference bases for soilresource: introduction. In: Deckers, J.A., Nachtergaele, F.O.,Spaargaren, O.C. (Eds.), 1st ed. International Society of Soil Science,International Soil Reference and Information Centre (ISRIC), andFood and Agriculture Organization (FAO). Acco, Leuven.
Jenny, H., 1941. Factors in Soil Formation. McGraw-Hill, New York.Kao, H., Chen, W.P., 2000. The Chi-chi earthquake sequence: active
out-of-sequence thrust faulting in Taiwan. Science 288,2346–2349.
Leamy, M.L., Milne, J.D.G., Pullar, W.A., Bruce, J.G., 1973.Paleopedology and stratigraphy in the New Zealand Quaternarysuccession. N. Z. J. Geol. Geophys. 16, 723–744.
Lee, J.C., Lu, C.Y., Chu, H.T., Delcaillau, B., Angelier, J.,Deffontaines, B., 1996. Active deformation and paleostressana-lysis in the Pakua anticline area, western Taiwan. Terrestr. Atmos.Ocean. Sci. 7, 431–446.
Liew, P.M., 1988. Quaternary stratigraphy in western Taiwan:Palynological correlation. Proc. Geol. Soc. China 31, 169–180.
Liew, P.M., Hsieh, M.L., 2000. Late Holocene (2 ka) sea level, riverdischarge and climate interrelationship in the Taiwan region. J.Asian Earth Sci. 18, 499–505.
Liew, P.M., Huang, S.Y., 1994. Pollen analysis and their paleoclimaticimplication in the middle Pleistocene lake deposits of the Ilandistrict, northeastern Taiwan. J. Geol. Soc. China 37, 115–124.
Lin, C.C., 1957. Topography of Taiwan. Publ. of the Taiwan ProvincialDocumentary Committee. (in Chinese).
Lu, C.Y., Jeng, F.S., Chang, K.J., Jian, W.T., 1998. Impact of basementhigh on the structure and kinematics of the western Taiwan thrustwedge: Insights from sandbox models. Terrestr. Atmos. Ocean.Sci. 9, 533–550.
Maejima, Y., Nagatsuka, S., Higashi, T., 2002. Application ofcrystallinity ratio of free iron for dating soils developed on theraised coral reef terraces of Kikai and Minami-Daito islands,southwest Japan. Quat. Res. (Daiyonki-Kenkyu) 41, 485–493.
MacFadden, L.D., Hendricks, D.M., 1985. Changes in the content andcomposition of pedogenic iron oxyhydroxides in a chronose-quence of soils in southern California. Quat. Res. 23, 189–204.
McKeague, J.A., Day, J.H., 1966. Dithionite and oxalate extractable Feand Al as acids in different various classes of soils. Can. J. Soil Sci.46, 13–22.
McLean, E.O., 1982. Soil PH and lime requirement. In: Page, A.L.,Miller, R.H., Keeney, D.R. (Eds.), Methods of Soil Analysis: Part2. Chemical and Microbiological Properties. . Agronomy Mono-graph, vol. 9. ASA and SSSA, Madison, WI, pp. 199–224.
Mehra, O.P., Jackson, M.L., 1960. Iron oxides removed from soils andclays by a dithionite-citrate system buffered with sodiumbicarbonate. Clays Clay Miner. 7, 317–327.
Morrison, R.B., 1968. Means of time-stratigraphic division and long-distance correlation of Quaternary successions. In: Morrison, R.B.,WrightJr. Jr., H.E. (Eds.), Means of Correlation of QuaternarySuccessions. Int. Assoc. Quat. Res., VII Congress., Proc., vol. 8,pp. 1–113.
Mouthereau, F., Lacombe, O., Deffontaines, B., Angelier, J., Chu, H.T.,Lee, C.T., 1999. Quaternary transfer faulting and belt frontdeformation at Pakuashan (Western Taiwan). Tectonics 18, 215–230.
Mulcahy, M.J., Churchward, H.M., 1973. Quaternary environmentsand soils in Australia. Soil Sci. 116, 156–169.
Nagatsuka, S., 1972. Studies on genesis and classification of soils inwarm-temperate region of Southwest Japan: Part 3. Some featuresin distribution and mode of existence of free iron and aluminumoxides in the soil profile. Soil Sci. Plant Nutr. 18, 147–154.
Nelson, D.W., Sommers, L.E., 1982. Total carbon, organic carbon, andorganic matter. In: Page, A.L., Miller, R.H., Keeney, D.R. (Eds.),Methods of Soil Analysis: Part 2. Chemical and MicrobiologicalProperties. Agronomy Monograph, vol. 9. ASA and SSSA,Madison WI, pp. 539–577.
Ota, Y., Shyu, B.H., Chen, Y.G., Hsieh, M.L., 2002. Deformation andage of fluvial terraces south of the Choushui River, central Taiwan,and their tectonic implications. West. Pac. Earth Sci. 2, 251–260.
Reisenauer, H.M., 1982. Chromium. In: Page, A.L., Miller, R.H.,Keeney, D.R. (Eds.), Methods of Soil Analysis: Part 2. Chemicaland Microbiological Properties. Agronomy Monograph, vol. 9.ASA and SSSA, Madison, WI, pp. 337–346.
Rhoades, J.D., 1982. Cation exchangeable capacity. In: Page, A.L.,Miller, R.H., Keeney, D.R. (Eds.), Methods of Soil Analysis: Part2. Chemical and Microbiological Properties. Agronomy Mono-graph, vol. 9. ASA and SSSA, Madison, WI, pp. 149–157.
Rockwell, T.K., Kellar, E.A., Clark, M.N., Johnson, D.L., 1984.Chronology and rates of faulting of Ventura River terraces,California. Bull. Geol. Soc. Am. 5, 1466–1474.
Saldaña, A., Stein, A., Zinck, J.A., 1998. Spatial variability of soilproperties at different scales within three terraces of the HenaresRiver (Spain). Catena 33, 139–153.
Seno, T., Stein, S., Gripp, A.E., 1993. A mode for the motion of thePhilippine Sea plate consistent with NUVEL-1 and geologicaldata. J. Geolphys. Res. 98, 17941–17948.
Shih, T.T., Yang, G.S., 1985. The active faults and geomorphicsurfaces of Pakua Tableland in Taiwan. Geographical Research ofNational Taiwan Normal University, vol. 11, pp. 173–186.
Soil Survey Staff, 1993. Examination and description of soils in thefield. Soil Survey Manual, Handbook No. 18. USDA-SCS,Washington, D.C., pp. 56–196.
Soil Survey Staff, 2003. Keys to Soil Taxonomy, 9th ed. USDA-NRCS, Washington, DC.
Sung, Q.C., Chen, Y.C., 2004. Geomorphic evidence and kinematicmodel for Quaternary transfer faulting of the Pakuashan anticline,Central Taiwan. J. Asian Earth Sci. 24, 389–404.
Suppe, J., 1981. Mechanics of mountain building in Taiwan. Mem.Geol. Soc. China 4, 67–89.
Teng, L.S., 1987. Stratigraphy records of the late Cenozoic Penglaiorogeny of Taiwan. Acta Geol. Taiwan 25, 205–224.
Tomida, 1932. The landscape on the southern Pakua Hill, Geomorphicmemorandum of Taiwan 3, 3 (in Japanese).
Torrent, J., Schwertmann, U., Schulze, D.J., 1980. Iron oxidemineralogy of some soils of two river terrace sequences inSpain. Geoderma 23, 191–208.
Torrent, J., Schwertmann, U., Fechter, H., Alferez, F., 1983.Quantitative relationship between soil color and hematite content.Soil Sci. 136, 354–358.
Tsai, H., Sung, Q.C., 2000. A discussion on the origin of terrace scarpin southern Pakua tableland, Taiwan. Bull. Geogr. Soc. China inTaipei 28, 239–253 (in Chinese).
Tsai, H., Huang, W.S., Hseu, Z.Y., Chen, Z.S., 2006. A river terracesoil chronosequence of the Pakua tableland in Taiwan. Soil Sci.171, 167–179.
Tsai, Y.B., 1986. Seismotectonics of Taiwan. Tectonophysics 125,17–38.

28 H. Tsai et al. / Geomorphology 83 (2007) 14–28
Tseng, M.H., Liew, P.M., Chi, W.R., Shih, T.S., 1992. Pollen analysisof the Tananwan formation, northern Taiwan. J. Geol. Soc. China35, 247–259.
Vreeken, W.J., 1975. Principal kinds of chronosequences and theirsignificance in soil history. J. Soil Sci. 26, 378–394.
Wang, C.Y., Kuo, S.Y., Shyu, W.L., Hsiao, J.W., 2003. Investigatingnear-surface structures under the Changhua fault, west-central
Taiwan by the reflection seismic method. Terr. Atmos. Ocean. Sci.14, 343–367.
Yu, S.B., Chen, H.Y., Kuo, L.C., 1997. Velocity field of GPS stationsin the Taiwan area. Tectonophysics 274, 41–59.


