Embed Size (px)
Citation preview

Pear Planting and Management Systems for new Blush Pears
Agriculture Victoria, Tatura
Grower guidelines
1. Literature review
2. Tree management
3. Irrigation
4. Rootstocks
5. Training system and planting density
6. Plant Growth Regulators
7. Economics
8. Appendices

1. Literature review
1.1. Bearing habits of new pear varieties
Natural bearing habits vary among pear varieties and influence precocity and yield potential. Varieties
differ in the proportion of buds that will die, remain latent, become vegetative or produce fruit (du
Plooy et al. 2002). In addition to inherent bearing habits, environmental factors and management
practices influence bud development. For example, insufficient winter chilling may increase the
proportion of latent buds (du Plooy et al. 2002) and rootstock selection is known to have a significant
effect on floral precocity (Webster 2002).
The type of buds that produce fruit differ among pear varieties and over time. Pears bear fruit on
spurs and from terminal buds of brindles (shoots shorter than 20 cm) or long shoots (Figure 1). Less
common is the formation of fruit from axillary buds (buds formed in the axils of leaves in the previous
season). In the first years of production, fruit tend to form on terminal buds of shoots (Sansavini
2002). By the time they are in their eighth leaf, many varieties are predominantly spur-bearing but
some (e.g. Williams) maintain a high level of production on shoots (Sansavini 2002).
Fruit set and quality in apples are influenced by floral bud type (spur, terminal or axillary; Tustin et al.
2011) and similar trends have been suggested to occur in pears (Webster 2002). Understanding of
floral bud quality and the bearing habits of new pear cultivars will facilitate development of
management practices. The bud behaviour of the new cultivars are currently being monitored in the
rootstock and planting systems experiment. They will provide information regarding the transition and
development of bud types over time and reveal attributes that could limit production in young trees,
e.g. poor fruit set. Decisions regarding preferred pruning techniques can then be informed by the
types of buds that produce high quality fruit and the productivity of aging wood. A number of
management techniques have the potential to increase precocity and yield. Retaining buds expected
to produce the best quality fruit and removing weak and poorly positioned buds has been shown to
improve fruit set of apples (Tustin et al. 2011). Training branches to the horizontal, to control
vegetative growth, could increase productivity of pears by reducing the proportion of vegetative buds
(du Plooy et al. 2002).
1.2. Plant Growth Regulators
Plant growth regulators (PGRs) are widely used to control vegetative and reproductive growth in
commercial fruit production. Chemical and hormonal PGRs have been shown to advance the transition
of buds from vegetative to reproductive growth and alter the proportion of bud types to maximise
fruit quality and productivity. They can promote lateral shoot development in young trees, slow shoot
growth in more vigorous cultivars and improve fruit set to overcome issues with low chill or poor
pollination. Conversely other PGRs can act as flower thinners to reduce crop loads and improve fruit
size.
Most recent PGR research in pear production has focused on breaking dormancy, reducing shoot
growth and improving fruit set.

Alternative dormancy breakers to replace hydrogen cyanamide (HC), commonly known as Dormex®,
due to its high toxicity and de-registration in some countries are being investigated. Included here are
PGRs that modify ABA metabolism since ABA is known to regulate bud dormancy (Zheng et al 2015),
and mixtures of organic compounds with mineral oils or nitrogen based compounds (such as CaNO3 or
KNO3 + urea) or various micro- and macro-nutrients (Pereira et al 2011).
Prohexadione-calcium (Pro-Ca), a gibberellin biosynthesis inhibitor, commonly known as Regalis® can
be used to control shoot growth (Smit et al 2005). Shoot growth response to the concentration and
number of applications of Pro-Ca was highly variable across pear cultivars, supporting the need to test
PGR application rates, number of doses and timing on all new cultivars.
6-Benzyladenine (BA), GA4+7, aminoethoxyvinylglycine (AVG), Pro-Ca, Thidiazuron (TDZ) and different
combinations of them are being investigated to promote parthenocarpic fruit set in a range of pear
cultivars (Öztürk and Aşkin 2015, Luz et al 2014). On ‘Conference’ pear trees with low to moderate
amount of flower buds, GA4+7 spray between full bloom and the end of bloom followed by a split
application of Pro-Ca, two and three weeks after full bloom was most effective in improving fruit set
(Vercammen et al (2015). Whilst on ‘Packham's Triumph’, GA4+7 and BA (Promalin® @1 ml/L) applied
at full bloom + AVG (Retain® @2000 mg/L) applied 15 days after full bloom showed the highest yields
in trials in Brazil (Rufato et al 2011). However, in a separate trial in Argentina, 250 mg/L of Retain®
applied at full bloom to ‘Abate Fetel’ and ‘Packham’s Triumph’ reduced yield on both cultivars, and
was only effective when applied 2 weeks after full bloom or at a lower concentration (125 mg/L)
during bloom (Sánchez et al 2011).
In apple, Maxcel® has also been shown to be slightly more effective than Promalin® (BA plus GA4+7,
the same active ingredients as Cytolin®) at promoting shoot development on young nursery trees of
various apple cultivars (Miranda Sazo and Robinson, 2014). The trees in their experiment were not
headed and had poor feathering, similar to the two year old pear trees of ‘ANP-0131’ used in the
experiment at Tatura. They applied Maxcel® at 500 ppm to the leader from the tip down to 60 cm
above the soil at 10 – 14 days after bud break. They found the number of lateral branches was
increased with increasing number of sprays from three to five successive applications applied at two
week intervals. Promalin® was slightly less effective at stimulating branching than Maxcel® and
produced feathers with more acute angles.
In ‘Conference’, it was found that phytohormone treatments that induce parthenocarpic fruit (i.e.
seedless fruit) have up to 12% smaller fruit than fruit produced from cross-pollination with compatible
pollen (Quineta and Jacquemart 2015). In ‘Packham’s Triumph’, both 100 and 200 mg/L of AVG
applied two weeks after full bloom increased fruit set and yield but fruit size was reduced (Dussi et al
2015).
List of common PGRs and their mode of action.
Maxcel® is a cytokinin. Cytokinins applied to dormant buds can induce growth. Maxcel® has been
shown to reduce fruit set and increase fruit size in apple (Table 1).
Cytolin® is a combination of gibberellins and cytokinin. Research has shown that combination of PGRs
can be more effective in modifying plant growth than individual growth regulators. Cytokinin is used
to stimulate cell division whilst gibberellin stimulates cell expansion.

Dormex® can be used to advance foliation and flowering and reduce the period of flower bloom. It is
useful in seasons or locations where there is insufficient chill to promote good bud break and
flowering.
ProGibb® is a gibberellin (GA). The ability of GAs to promote fruit set in pears by stimulation of
parthenocarpic fruit development (i.e. seedless fruit) has been known since the early 1960s. However,
dependent upon the cultivar and rate and timing of GA applied, GA can affect the amount of return
bloom, increase fruit drop and cause fruit malformation.
Regalis® is an inhibitor of gibberellin biosynthesis, and is effective at slowing shoot growth. It also
reduces the production of ethylene, which can be used to reduce fruitlet abscission and thus increase
the amount of fruit set.
ReTain® inhibits the production of ethylene in plant tissues. Ethylene affects plant processes such as
fruit maturation, ripening, and pre-harvest fruit drop. Inhibiting ethylene production with ReTain® can
help manage fruit maturation in the orchard, reduce pre-harvest fruit drop, delay harvest (which can
enhance fruit size), maintain or increase fruit firmness and enhance storage potential.

2. Tree Management
The following chapter outlines the methods used in the experimental orchard at Agriculture Victoria,
Tatura to establish trees according to four training systems (Open Tatura trellis, Vertical, Traditional
and Cordon). Refer to tables 1 to 3 for a description of each system. The pros and cons of each training
system are highlighted based on the training methods used in these experiments. These methods
should not be seen as recommendation but guidelines to aide fruit growers in their management
decisions when planting and establishing new red blushed pears cultivar, specifically ANP-0118
(Lanya®), ANP-0131 (Deliza®) and ANP-0534.
2.1 Training and pruning
2.1.1 Open Tatura trellis and Vertical
Table 1: Comparison of numbers of leaders and trees in each training system.
Training system Number of leaders Number of trees Tree spacing (m)
Open Tatura 2, 4, 6 and 8 4444, 2222, 1482, 1111 0.5, 1, 1.5, 2
Vertical 1, 2, 4 and 6 4444, 2222, 1111, 741 0.5, 1, 2, 3
Rootstocks: BP1, D6 and Quince A with Beurre Hardy inter-stem.
Winter
Four leader trees:
Establishment Pruning
Minimal pruning in winter, only remove water shoots/strong laterals from centre of V and large shoots
in the upper canopy that do not obey the 3 to 1 rule. Leave tipping long side laterals and reducing
height of trees till late Nov to reduce stimulation of vegetative growth.
• Importance of leader selection and leader angle.
• Shoots can be undercut to bend in place to prevent brittle shoots completely breaking off. The
cut will close-up once the shoot is bent downwards.
• The 2 inner leaders were cut back if the outer leaders were weaker (i.e. shorter).
• Along the leaders - don’t head 1-yr old shoots, either remove completely in winter or delay
head in late Nov/Dec. Bench cut out large shoots to encourage the outgrowth of flatter
shoots.
• Flush cut any laterals below crutch of tree that are too low.
• Bench cut strong and upright shoots if no weaker shoots in immediate vicinity to encourage
development of a calmer, flat shoot. Ideally side laterals should be < 1/3 the diameter of the
leader and emerge from the leader at > 45 degree angle.
• Remove strong shoots with a flush cut where other less vigorous shoots are available to set
fruit on.
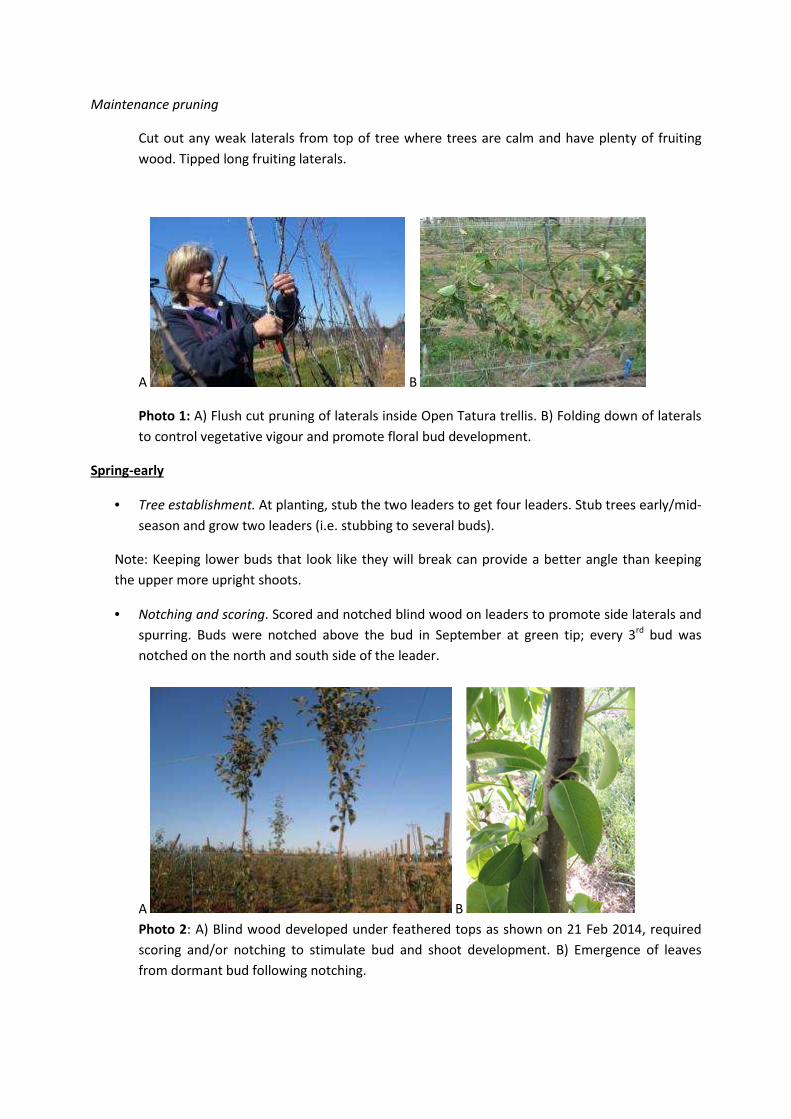
Maintenance pruning
Cut out any weak laterals from top of tree where trees are calm and have plenty of fruiting
wood. Tipped long fruiting laterals.
A B
Photo 1: A) Flush cut pruning of laterals inside Open Tatura trellis. B) Folding down of laterals
to control vegetative vigour and promote floral bud development.
Spring-early
• Tree establishment. At planting, stub the two leaders to get four leaders. Stub trees early/mid-
season and grow two leaders (i.e. stubbing to several buds).
Note: Keeping lower buds that look like they will break can provide a better angle than keeping
the upper more upright shoots.
• Notching and scoring. Scored and notched blind wood on leaders to promote side laterals and
spurring. Buds were notched above the bud in September at green tip; every 3rd bud was
notched on the north and south side of the leader.
A B
Photo 2: A) Blind wood developed under feathered tops as shown on 21 Feb 2014, required
scoring and/or notching to stimulate bud and shoot development. B) Emergence of leaves
from dormant bud following notching.

• Clip leaders to the wires.
• Plucking. Pluck leaves from leader tips to encourage leader growth.
• Stubbing
Spring - late
• Delay head top main leaders to leave 3 or 4 buds. For the method to Klik cut tops see …..
•
Note: Prune leaders to 60% of row spacing on open trellis or 80% on vertical and traditional
training systems.
• Delay head longer laterals to 15 - 30 cm to promote spur development.
• Continue to notch any bare wood.
• Pluck/rub buds from top of leaders to encourage tip growth.
• Add clothes pegs early to new shoots to promote a 45o angle.
Summer
• Delay head leaders a second time on more vigorous trees.
• Singulate leaders that are not at the top wire yet. Where the leaders have reached the top
wire, leave the current year shoots (sylleptics) around the top wire to cut back to when they
are delay headed in late November.
• Use of bamboo stakes to keep young leaders straight on freestanding trees.
• Select shoots and space.
• Regularly tape/clip shoots to the wires to prevent breakage by wind.
• On 4 leader training systems, leave outer leaders, only stub vigorous central leaders. Pull
down outer leaders more.
• Remove rootstock sucker growth.
Autumn
• Delay prune pollinators after harvest.
• Clean up crutches/lower sections of leaders by ripping out shoots and trimming back ‘antlers’
• Bench cut laterals that are too strong (break the 3:1 rule) or that are long and upright
• Some thinning of laterals can be done if they are crowd. If needed, take out laterals that are
directly behind the trunk or that will hang fruit in poor positions (where they might rub on
wires or the trunk), space laterals about a hand span apart.
• Continue to remove shoots from the centre of the Vase trees and V section of trellis.

Key Messages
• Training and management of 4-leader trees. Start off with 2 even leaders which will form the
outer leaders. Allow them to develop before either selecting an additional leader from each
of the two outer leaders or stub each of them back to promote two new shoots off each
leader.
2.2 Traditional
Table 2: Comparison of numbers of leaders and trees in each training system
Training system Number of leaders Number of trees Tree spacing
Slender spindle 1 4444 0.5
Spindle 1 2222 1
Central leader 1 1111 2
Open vase 5 to 6 741 3
Rootstocks: BP1, D6 and Quince A with Beurre Hardy inter-stem.
Winter
Spindle:
• Insert spreaders and clip leaders to the wires.
Central leader trees:
• Do not cut.
• Notched blind wood to promote lateral branches.
• Added clothes pegs to get good angle.
• Arranged laterals in a whorl around central leader.
Vase trees:
• Trained to 6 main limbs of equal size.

A B
Photo 6: Establishment of planting systems experiment showing ANP-0131 A) following planting on 16 August
2013 and B) bench grafted tree on 15 Nov 2013.
A
B
C
Photo 7: Training of ANP-0131 in planting systems trial to A) single leader and B) 4 leader, C) 6 leader on Open Tatura
Trellis on 30 August 2013.
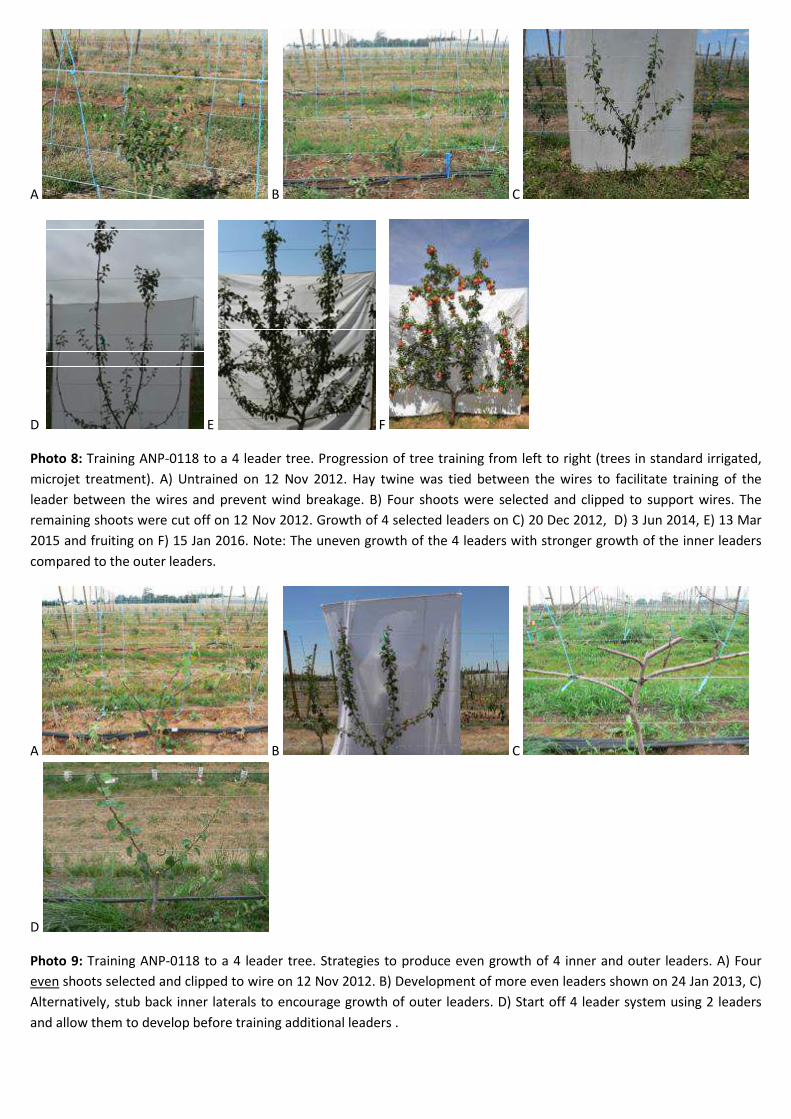
A B C
D E F
Photo 8: Training ANP-0118 to a 4 leader tree. Progression of tree training from left to right (trees in standard irrigated,
microjet treatment). A) Untrained on 12 Nov 2012. Hay twine was tied between the wires to facilitate training of the
leader between the wires and prevent wind breakage. B) Four shoots were selected and clipped to support wires. The
remaining shoots were cut off on 12 Nov 2012. Growth of 4 selected leaders on C) 20 Dec 2012, D) 3 Jun 2014, E) 13 Mar
2015 and fruiting on F) 15 Jan 2016. Note: The uneven growth of the 4 leaders with stronger growth of the inner leaders
compared to the outer leaders.
A B C
D
Photo 9: Training ANP-0118 to a 4 leader tree. Strategies to produce even growth of 4 inner and outer leaders. A) Four
even shoots selected and clipped to wire on 12 Nov 2012. B) Development of more even leaders shown on 24 Jan 2013, C)
Alternatively, stub back inner laterals to encourage growth of outer leaders. D) Start off 4 leader system using 2 leaders
and allow them to develop before training additional leaders .

2.3 Cordon System
Table 1: Comparison of numbers of leaders and trees in each training system
Training system Number of leaders Leader spacing (m) Trees/ha Tree spacing (m)
U shaped 5 0.4 2222 1
Flat 5 0.4 2222 1
Rootstock: D6
A
B
Photo 3: A) U shaped (extended) cordon and B) Flat (headed) cordon.
Cordon systems were trained by either bending the cordon up into a U shape (Photo 3A) or the ends
were taped flat to the lower wire (Photo 3B). Three leaders were then trained up between the end
leaders at a leader spacing of 40 mm. Left and right photos taken on 29 Sep 2014 and 6 Feb 2015
respectively. Note: photo 3B has 6 leaders.
Winter
• Stiff cordons were undercut with a hacksaw or notching knife to avoid breaking when laying
down.
Spring
• To produce appropriately spaced leaders off the cordon:
o encouraged buds that want to burst in the correct position
o knocked off unwanted buds on the bottom and inner side of the cordon.
o cut of any unwanted short shoots.
o repositioned end laterals.

Key Messages
• Train outer leaders first.
2.2 Fertilisation
• Zinc sulphate heptahydrate @ 2 x 25kg bags/2000L (i.e. 5.75kg Zn/ha) in late June.
• Foliar Mg spray or Epsom salts (MgSO4) @ 25kg/ha.
• Phosphate and nitrogen spray/fertigation.
• For born deficiency, apply 1 L/ha Bortrac™ (Bortrac™-150: 15% boron, 6.5% N) at 70-80%
flowering to increase pollen tube growth and at petal fall or Zinc sulphate heptahydrate at 25
kg/ha.
Note: Boron deficiency more a problem on Corella than Packham. Deficiencies are not reliably
detected in leaf analysis in summer.
2.3 Pest and disease management
• Winter oil in July.
• Copper in August.
• Cover sprays for black spot spray in most susceptible period Sep/Oct.
• Used predator mites to control two-spotted mite in addition to miticide sprays when pest
pressure was high.
2.4 Weed control
• Applied systemic such as Stomp® or Basta® in winter and early spring.
• Spot spray suckers with Basta® (200g/L glufosinate-ammonium) or Spotlight® (60g/L
carfentrazone-ethyl).
Note: low biuret urea with Basta aides uptake; Spotlight works best under high humidity and high
temperature.
2.5 Root pruning
A B
Photo 4: A) Establishment of irrigation experiments showing the difference in weed coverage
between the dripper and microjet plots on the 18 Dec 2012 following planting in July 2012.
B) Root pruning line.

2.6 Crop management
In early years of fruit production and years of adverse weather when crop loads may be lower:
• Tip longer fruiting laterals around pollination, once fruiting buds can be clearly identified.
• Apply Regulated Deficit Irrigation (RDI) to contain vegetative growth and delay application of
nitrogen to autumn.
• At flowering use bouquets and bees.
Photo 5: ANP-0118 flowering 18 Sep 2015.
Key Messages
• ANP-0534: This cultivar sets fruit in bunches and will require thinning to produce a larger fruit size.

3 Irrigation of young pears
Aim: To investigate the effects of drip irrigation and irrigation interval in newly planted pear orchards on irrigation requirement, water status, growth and yield
Treatments:
Drip (1.75 l/h @ 0.5 m spacing) verses microjet (32 l/h @ 2.0 m spacing). Standard verses frequent intervals.
Treatment Run-time Irrigation interval (Year 4)
Spring Summer Autumn Drip standard 6 h 3 days 1 – 2 days 3 days Drip frequent 2 h Daily Twice daily Daily Microjet standard 3 h 30 min 7 days 3 days 6 days Microjet frequent 1 h 10 min 2 days Daily 2 days
• Run time was based on standard wetted depth = 0.3 m • Interval calculated from ETc = 1.3 EAS ETo + Ke ETo
- ETc was the crop evapotranspiration - EAS was the effective area of shade - ETo was the reference crop evapotranspiration - Ke was the soil evaporation coefficient (Drip = 0.05 – 0.15, Microjet = 0.2 – 0.35)
Irrigation, rainfall and evapotranspiration
Over 4 years since planting in July 2012, drip and microjet treatments applied 14.3 and 22 Ml/ha, respectively. In year 4 (2015/16 season), 4.5 and 6.1 Ml/ha were applied to drip and microjet treatments, respectively.
0
500
1000
1500
2000
2500
3000
3500
4000
4500
5000
0 200 400 600 800 1000 1200 1400
Cum
ulat
ive
irrig
atio
n, r
ain
and
ET o
(mm
)
Days after planting (24 July 2012)
ETo Rain
Drip standard Drip frequent
Microjet standard Microjet frequent

Tree water stress
Stem water potential was measured during each season. In Year 1, drip irrigated trees were less stressed that microjet irrigated trees. In Year 3 and 4, frequently irrigated trees were less stressed than trees irrigated at the standard interval. Note: less negative stem water potential means less plant water stress.
Treatment Stem water potential (MPa)
Year 1 Year 2 Year 3 Year 4 Drip standard -1.10 -0.89 -1.32 -1.40 Drip frequent -1.04 -0.86 -1.26 -1.28 Microjet standard -1.13 -0.88 -1.32 -1.63 Microjet frequent -1.18 -0.91 -1.24 -1.26
F prob.(Sys) 0.02 NS NS 0.02
F prob. (Freq) NS NS 0.02 <0.001
Vegetative growth
There was no difference in leader growth during each of the first 3 years. The majority of leaders had reached the top wire. There was no difference in light interception in Year 4.
Treatment Leader growth (cm) Light interception (%)
Year 1 Year 2 Year 3 Year 4 Drip standard 74.2 89.6 40.5 33 Drip frequent 76.7 85.3 38.1 36 Microjet standard 79.4 85.6 38.8 33 Microjet frequent 67.9 84.9 43.0 32
F prob.(Sys) NS NS NS NS
F prob. (Freq) NS NS NS NS
Yield
Yield was greater in the drip irrigation treatments attributed to fruit number per tree. There was a greater density of spur flower clusters in the drip treatments. Fruit size was greater in the frequently irrigated treatments.
Treatment Yield (kg/tree)
Fruit weight (g)
Fruit number per tree
Node number per tree
Spur cluster number per tree
Drip standard 8.63 119.1 73.4 435 106 Drip frequent 8.82 125.0 71.2 436 126 Microjet standard 4.79 108.7 45.1 414 99 Microjet frequent 5.65 129.1 44.1 431 69
F prob.(Sys) <0.001 NS <0.001 NS 0.025 F prob. (Freq) NS 0.002 NS NS NS
Key Messages
• 35% less irrigation was applied in the drip treatments • Drip irrigated trees in Year 1 were less stressed • Frequently irrigated trees in Years 3 and 4 were less stressed • There was no effect of drip irrigation or irrigation interval on young tree growth • Yield increased by 167% under drip irrigation attributed to fruit number • Spur flower cluster number was higher under drip irrigation • Fruit size was greater under frequent irrigation

4 Rootstocks
Aim: To investigate the effects of currently available rootstocks on growth, yield and quality of new red-blushed pear cultivars.
Treatments:
Cultivar Rootstock
• ANP-0118 (marketed as Lanya®) • D6 • ANP-0131 (marketed as Deliza®) • D6 with Nijisseiki interstem • ANP-0534 • D6 with virus • D6 with BM2000 interstem • BP1 • Quince A with Beurre Hardy interstem • Quince C with Beurre Hardy interstem
- Planted July 2013 - 1 m x 4.5 m spacing (2222 trees per hectare) - 4 leader training system on Open Tatura trellis - Drip irrigated, fertigated - Randomised complete block design with 4 reps - 9 trees per plot with 4 guard trees - Corella and Packham pollinators in each plot
Yield and Fruit Weight (2015/16 – third leaf)
• Overall, all three cultivars had the lowest yield when grafted to BP1. • Yield of ANP-0118 and ANP-0131 was higher when grafted to Quince A and Quince C. • Yield of ANP-0534 was similar when grafted to D6 (± Nijisseiki), Quince A and Quince C. • Fruit weight of each cultivar was similar between rootstocks apart from ANP-0118 on D6 where
it was higher. • Fruit weight of ANP-0131 appeared to be reduced when grafted to Quince A, most likely due to
the high crop load.
Rootstock Yield (t/ha) Fruit weight (g)
ANP-0118 ANP-0131 ANP-0534 ANP-0118 ANP-0131 ANP-0534
D6 0.7 14.8 12.1 180 211 153
D6/Nij 0.6 15.5 11.1 157 203 164
BP1 0.6 9.9 4.6 154 227 160
QA/BH 5.2 24.8 11.4 144 188 151
QC/BH 3.0 17.7 12.4 153 203 159
Fprob
Lsd (5%)
0.003
2.5
<0.001
5.2
NS
0.004
12.8
0.036
26.6
NS
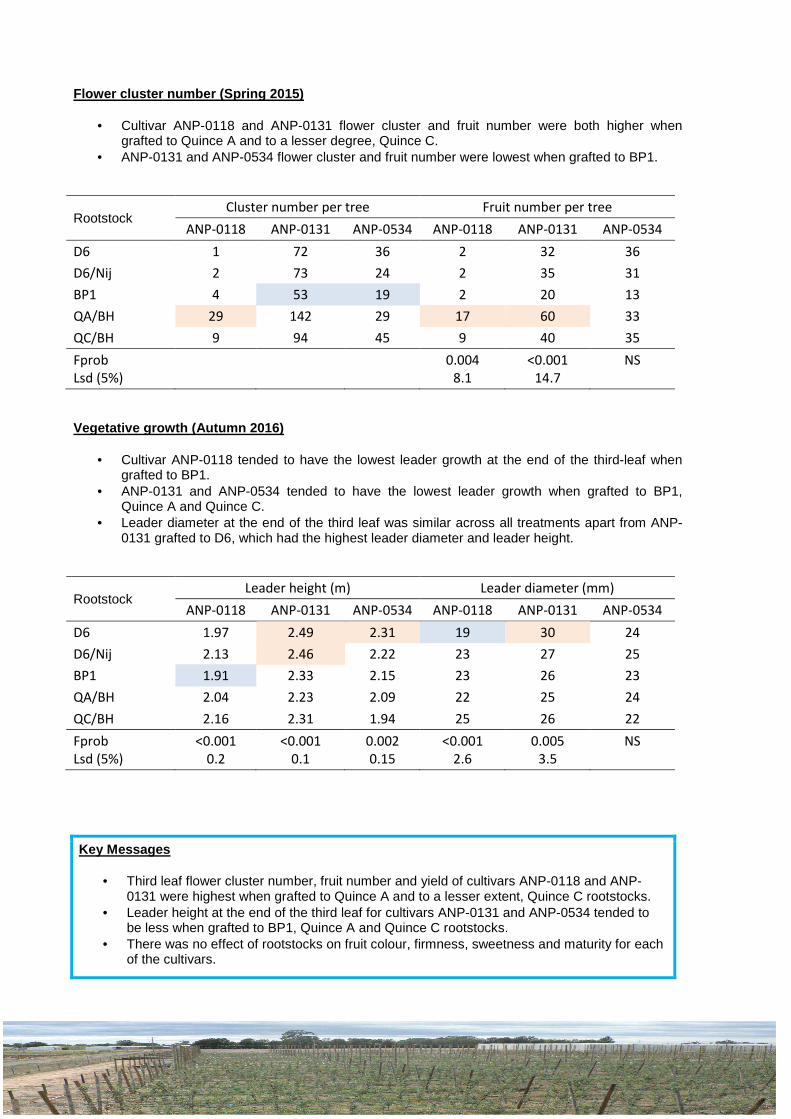
Flower cluster number (Spring 2015)
• Cultivar ANP-0118 and ANP-0131 flower cluster and fruit number were both higher when grafted to Quince A and to a lesser degree, Quince C.
• ANP-0131 and ANP-0534 flower cluster and fruit number were lowest when grafted to BP1.
Rootstock Cluster number per tree Fruit number per tree
ANP-0118 ANP-0131 ANP-0534 ANP-0118 ANP-0131 ANP-0534
D6 1 72 36 2 32 36
D6/Nij 2 73 24 2 35 31
BP1 4 53 19 2 20 13
QA/BH 29 142 29 17 60 33
QC/BH 9 94 45 9 40 35
Fprob
Lsd (5%)
0.004
8.1
<0.001
14.7
NS
Vegetative growth (Autumn 2016)
• Cultivar ANP-0118 tended to have the lowest leader growth at the end of the third-leaf when grafted to BP1.
• ANP-0131 and ANP-0534 tended to have the lowest leader growth when grafted to BP1, Quince A and Quince C.
• Leader diameter at the end of the third leaf was similar across all treatments apart from ANP-0131 grafted to D6, which had the highest leader diameter and leader height.
Rootstock Leader height (m) Leader diameter (mm)
ANP-0118 ANP-0131 ANP-0534 ANP-0118 ANP-0131 ANP-0534
D6 1.97 2.49 2.31 19 30 24
D6/Nij 2.13 2.46 2.22 23 27 25
BP1 1.91 2.33 2.15 23 26 23
QA/BH 2.04 2.23 2.09 22 25 24
QC/BH 2.16 2.31 1.94 25 26 22
Fprob
Lsd (5%)
<0.001
0.2
<0.001
0.1
0.002
0.15
<0.001
2.6
0.005
3.5
NS
Key Messages
• Third leaf flower cluster number, fruit number and yield of cultivars ANP-0118 and ANP-0131 were highest when grafted to Quince A and to a lesser extent, Quince C rootstocks.
• Leader height at the end of the third leaf for cultivars ANP-0131 and ANP-0534 tended to be less when grafted to BP1, Quince A and Quince C rootstocks.
• There was no effect of rootstocks on fruit colour, firmness, sweetness and maturity for each of the cultivars.

5. Training system and planting density
Aim: To investigate the effects of training system, tree spacing and rootstock combinations on growth, yield and quality of new red-blushed pear cultivar ANP-0131.
Treatments: Training system
Tree spacing Rootstock
• 2, 4, 6 and 8 leader Open Tatura
• Single and 2, 4 and 6 leader Vertical hedgerows
• Traditional central leader and vase (control treatment)
• 0.5 m • 1 m • 1.5 m (Open Tatura) • 2 m • 3 m (Vertical and
Traditional)
• D6 • BP1 • Quince A with Beurre
Hardy interstem
- Bench grafted July 2013 and immediately planted in
the field - 741 (3 x 4.5 m spacing) to 4444 (0.5 x 4.5 m
spacing) trees/ha - Drip irrigated, fertigated - Split-plot randomised complete block design with 3
reps - 14 m plots with 5 to 27 trees per plot and the central
8 m used as treatment trees - Corella and ANP-0534 pollinators at the ends of
each plot
Gross yield and fruit weight (2015/16 – second leaf )
• Tatura trellis systems are commonly reported to produce high yields due to increased light interception. However, yields were more influenced by rootstock and tree density than by the training system.
• There were greater fruit at higher tree densities and on quince A rootstock • Following data transformation, average gross yields were highest on the central leader
Quince A trees at 2 m spacing
Gross yield (t/ha)
F prob. Fruit weight (g)
F prob.
Training system OT 1.77
302
Trad 2.88 0.198 294 0.419
Vert 0.96
321
Tree spacing (m)
0.5 2.87
272
1 1.79 0.032 296 0.002
2 0.95
349
Rootstock BP1 0.02
312
D6 0.66 <0.001 320 0.067
QA 4.92 285
Blue (high) and yellow (low) highlighted values are significantly different.

Flower cluster number (Spring 2015)
• There was a higher proportion of axillary flower clusters (55%) compared to spur (15%) and terminal (8%) across all training system, rootstock and tree spacing combinations (LSD (P=0.05) = 4.3).
• Flower cluster number was more strongly influenced by rootstock and tree spacing than training system.
• The highest number of flower clusters were found on Quince A rootstock and D6 rootstock and at 0.5 and 1 m tree spacing. In additional the traditional training system at 2 m tree spacing performed well.
Cluster type F prob. Cluster number
F prob.
Axillary Spur Terminal
Training system
OT 47.3 12.9 4.0 6.2
Trad 58.9 17.8 11.0 0.335 13.8 0.031
Vert 59.6 13.9 9.2 12.1
Tree spacing (m)
0.5 48.9 25.3 14.7 12.5
1 59.3 12.5 7.2 <0.001 12.3 <0.001
2 57.5 6.8 2.3 7.2
Rootstock
BP1 45.0 12.8 5.1 3.5
D6 54.9 19.8 6.8 <0.001 11.3 <0.001
QA 65.8 12.0 12.4 17.3 Flower cluster types (%) and numbers categorised from low (yellow), medium (blue) to high (red). In each comparison different colours across rows and columns are significantly different.
Light Interception (2015-16)
The light interception of combinations of rootstock and tree density (RS-TD) are compared for each training system, where OT = Open Tatura, Vert = vertical and Trad = traditional training systems (i.e. central leader and vase).

Future Recommendations
In close planted systems may need to cut out every second tree at a later stage. Performance of
trees may be age dependant and could change at tree maturity.
Key Messages
• Training systems at high density were quicker to fill their allotted space in the canopy (ref leader growth rates and heights).
• Open Tatura had greater light interception at the 0.5 and 1 m tree spacing’s. • Fruit yields were more influenced by rootstock and tree density than by the training system,
with higher yields at closer tree spacing and on quince A rootstock.

6. Plant Growth Regulators
Role of common PGRs
The on-label use of agricultural chemicals is mandatory in most states across Australia. In Victoria, it’s legal to use chemicals other than 'restricted use' chemicals off-label providing that: 1) the maximum label rate is not exceeded, 2) the label frequency of application is not exceeded and 3) any specific label statements prohibiting the use are complied with. For further information on off-label use in Victoria go to http://agriculture.vic.gov.au/agriculture/farm-management/chemical-use/agricultural-chemical-use/off-label-use).
The PGRs listed in table 1 are currently not registered for use on pears and label rates of application were exceeded in the Tatura PGR experiments below. Findings in this report should not be considered as recommendations as method and rate of application may impact on PGR efficacy. Further research is required.
Table 1 : Common plant growth regulators registered for use in various temperate fruit and nut tree crops in Australia. Note that none are registered for pear.
PGR Active ingredient Registered use
Maxcel® 19 g/L 6-Benzyladenine (BA) Reduce fruit set and increasing size. Improve post-harvest firmness of apple.
Cytolin® 19 g/L GA4 + 7 19 g/L 6-Benzyladenine
Improve fruit shape in apple. Thinning in apple in combination with other PGRs. Promote lateral growth in apple & cherry.
Dormex® 520 g/L cyanamide Promote early even bud break and flowering in apple, grape, kiwifruit & plum.
ProGibb® 400 g/kg GA3 Promote berry thinning and fruit size in grape. Delay harvest in prune. Delay rind ageing and reduce creasing in citrus.
Regalis® 100 g/kg Prohexadione –Calcium (Pro-Ca)
Reduce shoot growth in apple & cherry.
Retain® 150 g/kg Aminoethoxyvinylglycine (AVG)
Improve harvest management, fruit quality and storage potential of apple & stone fruit (except cherry). Extend flower life in cherry, and increase nut set in walnut.
Maxcel ®, Cytolin ® and notching promote shoots on young trees
Aim: To investigate the effects of several PGRs on the promotion of side lateral development on two year old trees of ‘ANP-0131’ on D6 rootstock (Photo1a). The PGRs were applied at three different dates in 2014 in the lower half of the tree where there was minimal shoot development.
Treatments were Control, Cytolin®, Maxcel®, notching (Photo 1b), Cytolin® + notching, and Maxcel® + notching. The application rate of PGRs was equivalent to 475 ppm (i.e. 25 ml/L). The treatments were applied using a one litre spray bottle with the addition of a non-ionic wetter (ai. 1000 g/L polysorbate 20) at three dates: 25 September 2014 at first flower (slight leaf in upper half of tree), referred to as date 1; 10 October 2014 at slight leaf in the upper and lower half of the tree, referred to as date 2; and 31 October 2014 at full leaf emergence, referred to as date 3.

Figure 1. Comparison of the effect of two plant growth regulators Maxcel® and Cytolin® with and without notching, notching alone and a control (no notching and no PGR) on promotion of a) shoot and b) spur growth in the lower half of tree of cultivar ‘ANP-0131’ trained to two-leaders on Open Tatura trellis. Treatments were applied on 25 September 2014 (Date 1); 10 October 2014 (Date 2); and 31 October 2014 (Date 3).
There were six replicates (one tree per replicate) of two-leader upright trees on D6 rootstock planted to an Open Tatura Trellis at 0.5 m spacing. The treatments were assessed eight weeks after each application for the number of extinct (or latent) buds, active buds, spurs (1 – 2.5 cm), sprigs (2.5 – 5 cm), short shoots (5 – 20 cm) and long shoots (> 20 cm).
The most effective treatment for the promotion of long shoot development was the combination of notching + Maxcel® (Photo 2) and notching + Cytolin®, with an optimum application at date 2 (Figure 1a). For the first two application dates, the PGR & notch treatments were more effective at promoting shoot development than PGR alone, whilst the effect of PGR alone and notching alone were similar. Thus, this suggests notching aides the effectiveness of PGR application. Whilst the PGR treatments were less effective at stimulating shoots on date 3, they still stimulated more spurs than earlier applications (Figure 1b).

On the first two spray dates, there were more flower clusters (expressed as a percent of the total flower clusters per tree) on the shoots due to notching and PGR or both (Figure 2a). Whilst, there were less spur flower clusters on the PGR and PGR + notch treatments on date 2 than the control (Figure 2b), likely due to the presence of more shoots. There was no difference in total flower cluster between treatments, partly attributed to large variation in total number of flower clusters in each treatment/date combination, which is not unusual for young trees in their first cropping year. Potassium nitrate (8%) was also evaluated. Although not effective at stimulating extra spur and shoot development, potassium nitrate increased the number of axillary flower clusters when applied at date 2 (results not shown).
Figure 2. Comparison of the effect of two plant growth regulators Maxcel® and Cytolin® with and without notching, notching alone and a control (no notching and no PGR) on promotion of a) shoot and b) spur flower clusters of cultivar ‘ANP-0131’ trained to two-leaders on Open Tatura trellis. Treatments were applied on 25 September 2014 (Date 1); 10 October 2014 (Date 2); and 31 October 2014 (Date 3).

A B
Photo: Plant growth regulators (PGRs) were applied at three dates to two year old trees of ‘ANP-0131’. A) 45 days after spray with a) Maxcel® and notched at full leaf emergence on 31 October 2014 (date 3) compared to B) control (no notching and no PGR).
ProGibb ® on mature trees
Aim: To investigate the effect of ProGibb® on the promotion of fruit set on five year old trees of ‘ANP-0131’ on BP1 rootstock in 2014. Treatments were control and 37.5 mg/L (37.5 ppm) ProGibb® applied at 90% bloom on five replicates (one tree per replicate). Trees were planted on Open Tatura trellis at 3333 trees/ha. The PGR spray was applied to run-off on 25 September 2014. There were smaller fruit on the ProGibb® treatment compared to the control (Table 2, 154 g vs 224 g, LSD5% = 24.6), higher yield (21.9 kg vs 9.9 kg, LSD5% = 9.5), and higher fruit number per tree (144 vs 46, LSD5% = 50). However, the next seasons’ crop was dramatically reduced with significantly lower numbers of flower cluster on the ProGibb® treatment compared to the control (25 vs 125, LSD5% = 62). Table 2: Effect of 37.5 mg/L ProGibb® applied on 25 September 2014 on five year old trees of ‘ANP-0131’ at 90% full bloom on fruit quality and productivity.
Total
yield (kg)
Total fruit
number
Av. fruit weight (g)
Fruit length (mm)
Fruit width (mm)
Seed no.
Flower cluster no.
Control 9.9 46 224 85.8 73.5 9.6 125 ProGibb® 21.9 144 154 82.5 68.2 9.3 25 LSD5% 9.45 49.9 24.6 6.64 4.83 0.67 62
Maxcel ® and Cytolin ®
• The effectiveness of PGRs appears to be related to the stage of leaf emergence from the buds with slight leaf emergence along the entire trunk or leader providing the optimum time for PGRs in combination with notching to stimulate spur and lateral shoot growth.
• PGR treatments did not affect the total amount of flower clusters, but there were more
flower clusters on the shoots and fewer on spurs likely due to the higher proportion of longer shoots in the PGR and notching treatments.
ProGibb ®
• ProGibb® applied at 90% full bloom appears to promote fruit set with a higher number of fruit and greater yield at harvest on treated trees than on the control.
• ProGibb® did not affect fruit shape or number of seed, but appears to adversely affect the
next seasons’ crop with a large reduction in the number of flower clusters. Further research on the application rate of ProGibb® and its combination with other PGRs is required.

7. Economics: Expected returns from investing in red-blushed pears
Preliminary results
What is the most profitable way to grow the new blushed pear Deliza®? This is the question
confronting scientists researching planting systems for the new cultivars at Agriculture Victoria
Tatura.
Bred out of the Australian National Pear Breeding Program at Agriculture Victoria Tatura, and
marketed by Apple and Pear Australia, Deliza® is one of the new red-blushed pears that is
visually attractive, tastes good, has desirable texture and stores extremely well, so provides a
point of difference on the fresh market.
The planting systems being investigated at Tatura are characterised by high-density, compact
trees that use water efficiently, fruit early in life and produce consistent high yields of quality
pears. Thirty six different training system x rootstock x tree spacing combinations are being
examined. Training systems are single- and multi-leader Open Tatura (OT) and vertical 2D, and
central leader, spindle and vase 3D. Rootstocks are Quince A (QA), D6 and BP1. Tree spacings
range from 0.5 to 3 m.
The costs, benefits and risks of growing the new blushed pears are being assessed in
collaboration with local Goulburn Valley growers using discounted cash flow analysis. Potential advantages include more fresh fruit marketed at premium prices, earlier production to help
repay the high establishment costs, and efficiencies in production and harvest operations at full
bearing.
Our preliminary economic and financial assessment focused on trees grafted to QA rootstock and
trained on OT trellis at densities of 1,481, 2,222 and 4,444 trees per hectare (respectively, 1.5,
1.0 and 0.5 m between trees all with rows 4.5 m wide). In order to establish a high density of
fruiting units at a lower tree cost, the lower density plantings were trained with a greater
number of leaders per tree (8, 4 and 2, respectively).
Method
Economic performance was evaluated using discounted cash flow budgeting over a 30-year
planning horizon (Fig. 1). Performance metrics included:
• The net present value (NPV), which quantifies the addition to wealth estimated at a
required discount rate of 4.3% (based on a 6.5% cash rate less 2.2% for inflation). A NPV greater than zero indicates a profitable investment.
• The modified internal rate of return (MIRR), which quantifies the return on the extra
capital invested in growing the pears on a representative block in a Goulburn Valley
orchard.
Business risk was accommodated in the analysis through changes in farm-gate prices, yields,
packouts and prices paid for water during each year over the planning horizon. A range of values
were specified for these risky variables using the @Risk add-in to Excel. Annual cash flows were calculated from 100,000 Monte Carlo simulations, with each simulation using a different set of
variables drawn at random from their respective probability distributions. The 90% confidence
intervals (CI) for the NPV and MIRR were read from the resulting probability distribution
functions (e.g. see Fig.1).

Figure 1. Discounted cash flow method using Excel and the @Risk Monte Carlo simulator.
Financial performance was determined from the cumulative (nominal) net cash flows using the
payback period; that is, the time required for the investment in additional capital to break even.
Establishment and tree training costs
Establishment costs for the various systems under investigation in the Pear Field Laboratory at
Agriculture Victoria Tatura are shown in Table 1. These costs included ground preparation, trellis,
irrigation infrastructure, trees and planting. Netting for sun and hail protection was not included.
Establishment costs were highest for the higher density plantings, due to the additional cost of a greater number of trees and higher planting costs.
Table 1. Orchard establishment costs for Open Tatura trellis training systems (2013 values
including GST) ($/ha).
Tree
density
Ground
preparation
Trellis/supports Drip irrigation
and
fertigation
infrastructure
Trees@
$14
each
Planting
(labour
and
materials)
@ $2.15
per tree
Total
establishment
costs
1,481 4,100 8,400 3,100 20,734 3,185 39,546
2,222 4,100 8,400 3,100 31,108 4,777 51,485
4,444 4,100 8,400 3,100 62,216 9,555 87,371
The “variable” labour inputs associated with tree training, tree support, leader management,
winter pruning, tying down, thinning and summer pruning were high in the early years. Times incurred in the Pear Field Laboratory are shown in Tables 2 by tree density. Tree training costs
were considerably higher for the lower density eight- and four- leader systems in year 2.
However, on a cumulative basis, costs were more even by the end of year 3. Labour was valued
at about $23/hour (including on costs) in the analysis.
Table 2. Average time/ha (hours) for all tree training tasks, Open Tatura trellis training system
by tree density.
Density Leaders per tree Tree training times/ha (hours)
Year 2 Year 3 Cumulative
1,481 8 210.76 156.97 367.63
2,222 4 163.14 211.64 374.78
4,444 2 105.82 249.56 355.38

Price assumptions
Orchard-gate prices were assumed higher, and fruit quality on average better and more uniform
compared to the more traditional Packham’s Triumph cultivar. Based on a consumer preference
survey and observed premiums for the parent cultivar (Corella) we assumed a price premium of
20% for Deliza®. With good sized fruit (averaging 200 g), packout was assumed to be 90% (70%
class 1, 20% class 2). The average farm-gate price (net of pack-house costs) averaged over all
classes used in analysis was $530/t ($1,440/t gross).
Yield assumptions
Trees in the field experiment started producing at the third leaf stage and achieved modest
marketable yields of 0.15, 3.05 and 7.48 t/ha, respectively for plantings of 1,481, 2,222, and
4,444 trees/ha.
Yield expectations over the 30 years planning horizon are shown in Fig. 2. Production is expected
to increase rapidly to reach a maximum in year 6 or 7. Due to the varying number of leaders per
tree (2, 4 or 6 with decreasing planting density), yield at full bearing is expected to even out at 70 t/ha (with an upper limit of 90 – 100 t/ha a possibility). This compares to about 40 t/ha with
traditional plantings of Packham’s Triumph at full bearing, that typically occurs in year 10.
Figure 2. Assumed yield curves for trees grafted to Quince A rootstock trained as a multi-leader
systems on Open Tatura trellis at densities of 1,481, 2,222 and 4,444 trees/ha.
Results
Based on the assumptions discussed above, Table 3 shows the ‘economic feasibility’ (or
profitability) and the ‘financial feasibility’ (or liquidity) of investing in the new red-blushed pears under a number of scenarios.
The NPV for the ‘base’ scenario (number 1) for a planting density of 2,222 trees/ha averaged
$210,613 over 30 years, in the range $165,888 – $257,175. The NPV and its 90% confidence
interval, evaluated using a real discount rate of 4.3% p.a. are both greater than zero. The
modified internal rate of return (MIRR) averaged 8.7%, in the range 8.1 to 9.3%. These results
indicate that growers can invest in the new pears with confidence. Debt peaked at
approximately $89,083 in year three, and the investment broke even in year nine (Fig. 3).
0
10
20
30
40
50
60
70
80
1 2 3 4 5 6 7 8 9 10
Yie
ld (
t/ha)
Year from planting
1,481 trees/ha 2,222 trees/ha 4,444 trees/ha

Table 3. Sensitivity of block performance to changes in baseline assumptions for trees grafted
to Quince A rootstock and trained on Open Tatura trellis at a range of tree densities.
Economic
feasibility
Financial
feasibility
Scenario Tree
densit
y
Price
premiu
m (%)a
Year-
three
yield
(t/ha
)
Year full
bearing
achieve
d
Yield
at full
bearin
g
(t/ha)
NPV (real
$)b
MIRR
(%)c
Peak
debt
(nomina
l $)
Pay-
back
period
(years)d
(1) Base 2,222 20 3.05 6 70 210,613
(165,888–
257,175)
8.7
(8.1
–
9.3)
89,083 9
(2)
Higher price
premium
2,222 30 3.05 6 70 296,310
(247,244 –
347,360)
9.7
(9.2 –
10.2)
86,929 8
(3)
Higher
yield in
year
three
2,222 20 10 6 70 219,880
(174,696
–
266,328)
9.0
(8.4
–
9.5)
83,395 8
(4) Full
maturity
one year
later
2,222 20 3.05 7 70 199,312
(152,557
–
241,790)
8.5
(7.9
–
9.1)
91,061 9
(5) Lower
yield at
full
maturity
2,222 20 3.05 6 60 144,357
(105,735
–
184,563)
7.9
(7.1
–
8.4)
90,496 9
(6) Lower density
planting
1,481 20 0.15 7 70 204,973 (162,122
–
249,262)
9.0 (8.3
–
9.5)
82,727 9
(7)
Higher
density
planting
4,444 20 7.48 6 70 175,344
(128,552
–
225,289)
7.5
(6.9
–
8.2)
118,535 9
a. compared to Packham’s Triumph
b. the sum of the present value of the annual net cash flows over the life of the investment (real),
discounted at 4.3% p.a. (based on a 6.5% cash rate less 2.2% for inflation). 95% confidence
intervals (CI) in brackets.
c. MIRR: modified internal rate of return. 95% CI in brackets.
d. determined from the cumulative net cash flow after tax with inflation.
Sensitivity analysis (scenarios 2 to 5) suggested that a 10 percentage-point increase in the price
premium to $990/t net, or an increase in the yield in year three to 10 t/ha would have the most
positive effect on both profitability and liquidity, with the pay-back period dropping back to year
eight. In contrast, a delay by one year in achieving full yield potential (scenario 4) has the most
adverse effect on the economic performance metrics.

Should full maturity be delayed by one year, or yield at full maturity fall to 60 t/ha (scenario 5),
then the grower would be better off to plant at a lower tree density (scenario 6).
The higher density planting of 4,444 trees/ha (scenario 7) is the least profitable option, and has
the highest peak-debt. The reason is that the anticipated yields were insufficient to offset the
higher establishment costs.
Figure 3. Pay-back period for establishing a modern block of red-blushed pear trees grafted to
Quince A rootstock trained as a multi-leader systems on Open Tatura trellis at densities of
1,481, 2,222 and 4,444 trees/ha.
Key Messages
• Although preliminary, the results of this analysis suggest that growing the new red-
blushed pears in a modern orchard system characterised by high-density plantings of
compact trees that use water efficiently, fruit early in life and produce consistent high
yields of quality pears would be a profitable investment for Goulburn Valley pear growers.
-150,000
-100,000
-50,000
0
50,000
0 1 2 3 4 5 6 7 8 9 10
Cum
ulat
ive
NC
F (
$/ha
)
Year from planting
Base (2,222 trees/ha) 30% price premium10 t/ha in year 3 full maturity at year 7lower yield at full maturity lower density planting (1,481 trees/ha)higher density planting (4,444 trees/ha)

Appendix 1
8. Appendices
8.1 Tree training system diagrams
Traditional: 0.5 m 1 m 2 m 3 m spacing
Three dimensional structures. Central leader at 0.5m, 1m and 2m spacing and Vase at 3m spacing.
Vertical: 0.5 m 1 m 2 m 3m spacing
Trellis: 0.5 m 1 m 1.5m 2m spacing
0.6 m height
3.6 m height

Appendix 2
A
B
C
8.2 Time series photos of rootstock experiment
A) ANP-0131, B) ANP-0118 and C) ANP-0534 at 1 m (2222 trees/ha) on rootstock from left to right D6, D6 – Nijisseiki inter-stem, BP1, BM2000, Quince C – Beurre
Hardy inter-stem and Quince A – Beurre Hardy inter-stem on 28 Nov 2016.

Appendix 2
A
B
C
8.3 Time series photos of ANP-0131 on Open Tatura Trellis (2, 4, 6 and 8 leaders)
Tree spacing from left to right 0.5 m (4444 tree/ha), 1.0 m (2222 trees/ha) , 1.5 m (1482 trees/ha) and 2.0 m (1111 trees/ha) on BP1 rootstock on A) 6 Feb 2015, B) 4
Feb 2016 and C) 28 Nov 2016.

Appendix 2
A
B
C
8.4 Time series photos of ANP-0131 on Traditional (Spindle, central leader, vase) systems
Tree spacing from left to right 0.5 m (4444 tree/ha), 1.0 m (2222 trees/ha) , 2.0 m (1111 trees/ha) and 3.0 m (741 trees/ha) on BP1 rootstock on A) 6 Feb 2015, B) 4
Feb 2016 and C) 28 Nov 2016.

Appendix 2
A
B
C
8.5 Time series photos of ANP-0131 on Vertical systems (1, 2, 4 and 6 leaders)
Tree spacing from left to right 0.5 m (4444 tree/ha), 1.0 m (2222 trees/ha) , 2.0 m (1111 trees/ha) and 3.0 m (741 trees/ha) on BP1 rootstock on A) 6 Feb 2015, B) 4
Feb 2016 and C) 28 Nov 2016

8.6 References
du Plooy P., Jacobs G., and Cook N.C. 2002. Quantification of bearing habit on the basis of lateral bud
growth of seven pear cultivars grown under conditions of inadequate winter chilling in South
Africa. Scientia Horticulturae, 95, 185–192.
Dussi, M.C., Sepúlveda, G.M., Rosa, J.P., Elosegui, F., Fantaguzzi, S., Zon K., Prieto C. 2015. Fruit Set Control in Pear Cultivars ‘Abate Fetel’ and ‘Packham’s Triumph’. Acta Hort., 909, 381 – 386.
Luzk A.R., Muniz J., de Souza D.S., Petineli R., de A. Meyer G., Rufato L., Kretzschmar A.A. 2014. Plant
Growth Regulators Increase Yield of Pyrus communis L.‘Williams’ Pear in Southern Brazil.
Acta Hort., 1042, 325 – 330.
McClymont L., Goodwin I., Cornwall D. 2013. The pear field laboratory. Australian Fruitgrower
7(1):34.
Miranda Sazo M., Robinson T.L. 2014. Effect of Promalin, Benzyladenine and Cyclanilide on lateral
branching of apple trees in the nursery. Acta Hort., 1042, 293 – 302.
Öztürk G., Aşkin M.A. 2015. Various gibberellin treatments on parthenocarpic fruit development in
‘Deveci’ and ‘Ankara’ pear cultivars. Acta Hort., 1094, 373 – 382.
Pereira N., Oliveira C.M., Mota M., Sousa R.M. 2011. Evaluation of five dormancy breaking agents to
induce synchronized flowering in ‘Rocha’ pear. Acta Hort., 909, 423 – 428.
Quineta M., and A.-L. Jacquemart A.L. 2015. Difference between pollination and parthenocarpy in the ‘Conference’ pear production. Acta Hort., 1094, 359 – 366.
Rufato L., Kretzschmar A.A., Brighenti, A.F., Machado. B.D. 2011. Plant growth regulators increase
productivity of ‘Packham’s Triumph’ pear in Southern Brazil. Acta Hort., 909, 429 – 434.
Sánchez E., Curetti M., Retamales J. 2011. Effect of AVG application on fruit set, yield and fruit size in
‘Abate Fetel’ and ‘Packam’s Triumph’ pears in a semi-commercial statistical trial. Acta Hort.,
909, 435 – 440.
Sansavini S. 2002 Pear fruiting-branch models related to yield control and pruning. Acta Hort., 596, 627–633.
Smit M., Meintjes J.J, Jacobs G., Stassen P.J.C., Theron K.I. 2005. Shoot growth control of pear trees
(Pyrus communis L.) with prohexadione-calcium. Scientia Horticulturae 106, 515 – 529.
Tustin S., van Hooijdonk B., Breen K., Middleton S., Wilkie J., Close D., and Bound S. 2011 Are all fruit
buds created equal? Australian Fruitgrower 5(7):10-13
Vercammen J., Gomand A., Bylemans D. 2015. Improving the fruit set of ‘Conference’ with
gibberellins or Regalis. Acta Hort., 1094, 257 – 264.
Webster A.D. 2002 Factors influencing the flowering, fruit set and fruit growth of European pears.
Acta Hort., 596, 699–709.
Zheng, C., Halaly, T., Acheampong, A. K., Takebayashi, Y., Jikumaru, Y., Kamiya, Y., Or E. 2015.
Abscisic acid (ABA) regulates grape bud dormancy, and dormancy release stimuli may act
through modification of ABA metabolism. Journal of Experimental Botany, 66(5), 1527 –
1542.


