Embed Size (px)
Citation preview
Biophysical Journal Volume 85 August 2003 897–910 897
Partitioning of Individual Flexible Polymers into a NanoscopicProtein Pore
Liviu Movileanu,* Stephen Cheley,* and Hagan Bayley*y
*Department of Medical Biochemistry and Genetics, The Texas A&M University System Health Science Center, College Station, Texas;and yDepartment of Chemistry, Texas A&M University, College Station, Texas
ABSTRACT Polymer dynamics are of fundamental importance in materials science, biotechnology, and medicine. However,very little is known about the kinetics of partitioning of flexible polymer molecules into pores of nanometer dimensions. Weemployed electrical recording to probe the partitioning of single poly(ethylene glycol) (PEG) molecules, at concentrations nearthe dilute regime, into the transmembrane b-barrel of individual protein pores formed from staphylococcal a-hemolysin (aHL).The interactions of the a-hemolysin pore with the PEGs (Mw 940–6000 Da) fell into two classes: short-duration events (t ; 20ms), ;85% of the total, and long-duration events (t ; 100 ms), ;15% of the total. The association rate constants (kon) for bothclasses of events were strongly dependent on polymer mass, and values of kon ranged over two orders of magnitude. Bycontrast, the dissociation rate constants (koff) exhibited a weak dependence on mass, suggesting that the polymer chains arelargely compacted before they enter the pore, and do not decompact to a significant extent before they exit. The values of konand koff were used to determine partition coefficients (P) for the PEGs between the bulk aqueous phase and the pore lumen.The low values of P are in keeping with a negligible interaction between the PEG chains and the interior surface of the pore,which is independent of ionic strength. For the long events, values of P decrease exponentially with polymer mass, according tothe scaling law of Daoud and de Gennes. For PEG molecules larger than ;5 kDa, P reached a limiting value suggesting thatthese PEG chains cannot fit entirely into the b-barrel.
INTRODUCTION
The interaction of polymer molecules with proteinaceous
pores is of fundamental importance both in basic science and
in biotechnology. In basic science, polymers have been used
to investigate the size and shape of protein pores (Vodyanoy
and Bezrukov, 1992; Krasilnikov et al., 1992; Carneiro et al.,
1997; Merzlyak et al., 1999; Movileanu and Bayley, 2001).
The transport of polymers through pores is also of con-
siderable physiological importance (Blasi and Young, 1996;
Johnson and van Waes, 1999; Gomis-Ruth et al., 2001;
Madden et al., 2001; Salman et al., 2001), but few funda-
mental studies of the mechanism of this process have been
made. Work with protein pores also provides an opportunity
to investigate polymer dynamics and the properties of
confined polymers, which have been subjected to theoretical
inquiry (Sung and Park, 1996; Lubensky and Nelson, 1999;
de Gennes, 1999a; Muthukumar, 1999; Cifra and Bleha,
2001; Berezhkovskii and Gopich, 2003) but more limited
experimentation (Wong et al., 1997; Smith et al., 1999;
LeDuc et al., 1999; Jeppesen et al., 2001). Technological
applications of polymer-pore interactions include gel per-
meation chromatography (Gorbunov and Skvortsov, 1995;
Liu et al., 1999) and the use of protein pores as components
of biosensors (Bayley et al., 2000; Bayley and Cremer, 2001;
Wang and Branton, 2001).
The interactions of poly(ethylene glycol) (PEG) have been
examined with several protein pores (Parsegian et al., 1995;
Bezrukov, 2000). Early work included investigation of the
osmotic effects of PEG on the opening and closing of the
voltage-dependent anion channel of mitochondria (Zimmer-
berg and Parsegian, 1986). The effects of PEG on the access
resistance of pores such as those formed by alamethicin were
also examined (Vodyanoy and Bezrukov, 1992, 1993).
Especially relevant to the present work, single-channel con-
ductance and single-channel noise measurements were used
to deduce the dependence of the partitioning of PEG mole-
cules into the alamethicin pore on PEG mass, and the
diffusion coefficients of the PEG molecules within the pore
(Bezrukov and Vodyanoy, 1993, 1995; Bezrukov et al.,
1994).
A particularly useful subject for studies with polymers has
been the bacterial exotoxin a-hemolysin (aHL), which
forms large pores in lipid bilayers (Song et al., 1996;
Gouaux, 1998). The pore is formed from seven identical
subunits, each containing 293 amino acids, and its three-
dimensional structure is known (Song et al., 1996). The trans-
membrane part of the pore, which is exposed to the trans side
of the bilayer, is a b-barrel of ;20-A average diameter and
;50-A length. The cap domain, which lies on the cis side of
the bilayer, contains a large internal cavity (Fig. 1). Bez-
rukov and colleagues have investigated the interactions of
PEG with aHL in detail. In their work, which was performed
at high PEG concentrations, the partition coefficient for the
transfer of PEG from bulk solution to the interior of the pore
had a sharp dependence on PEG mass, which is not con-
sistent with scaling theory (see below). Further, single-
channel current fluctuations in the presence of PEG
Submitted July 23, 2002, and accepted for publication April 1, 2003.
Address reprint requests to Hagan Bayley, PhD, Dept. of Medical
Biochemistry and Genetics, The Texas A&M University System Health
Science Ctr., 440 Reynolds Medical Bldg., College Station, TX 77843-
1114. Tel.: 979-845-7047; Fax: 979-847-9481; E-mail: [email protected].
� 2003 by the Biophysical Society
0006-3495/03/08/897/14 $2.00

suggested that PEG binds to the wall of the lumen of the pore
in 1 M KCl (Bezrukov et al., 1996). It was also shown that
at low pH the size of PEG molecules that enter the pore is
decreased, whereas the conductance of the pore is increased;
this finding was attributed to the effect of protein charge on
water structure and hence the extent of polymer hydration
inside the pore (Bezrukov and Kasianowicz, 1997). Finally,
the interaction of PEG was reexamined with one-sided ap-
plication. The effects of cis and trans additions were differ-
ent and permitted a more detailed analysis of pore geometry
than had been possible by two-sided addition (Merzlyak
et al., 1999). In these experiments, the buffer contained 0.1
M KCl and it was concluded that there was no interaction of
PEG with the lumen of the pore at this salt concentration.
The interactions of single-stranded nucleic acids with the
aHL pore have also been studied in detail. Following the
initial report of Kasianowicz and colleagues, demonstrating
the transit of nucleic acids through the pore at ;1–5 ms/base
(Kasianowicz et al., 1996), a surge of articles has appeared
in which several aspects of the phenomenon have been
examined including the characteristic current signatures of
polynucleotides of different compositions, the impact of cisor trans entry with respect to the rate of occurrence of transit
events, the voltage and temperature dependencies of transit,
and the effect of ligands for derivatized DNAs or intra-
molecular hairpins on transit (Akeson et al., 1999;
Henrickson et al., 2000; Meller et al., 2000, 2001;
Kasianowicz et al., 2001; Vercoutere et al., 2001, 2003;
Meller and Branton, 2002; Winters-Hilt et al., 2003). The
work is intriguing because it has been suggested that it may
lead to techniques for ultrarapid DNA sequencing (Deamer
and Akeson, 2000; Marziali and Akeson, 2001; Vercoutere
and Akeson, 2002; Deamer and Branton, 2002). The
experiments with polynucleotides have prompted a large
number of theoretical treatments of the associated phenom-
ena (Lubensky and Nelson, 1999; de Gennes, 1999a,b;
Muthukumar, 1999, 2001, 2002; Nakane et al., 2002; Slater
et al., 2002; Kong and Muthukumar, 2002; Ambjornsson
et al., 2002; Berezhkovskii and Gopich, 2003).
Our group has also examined the interactions of polymers
with the aHL pore, but under very different conditions. In
particular, we have focused on the covalent attachment of
polymers (Howorka et al., 2000). A qualitative analysis of
the rates of reaction of sulfhydryl-directed PEG reagents
with a collection of pores assembled from cysteine mutants
of aHL was consistent with the position of a constriction in
the lumen of the pore (Movileanu et al., 2001). By contrast
with the results obtained by Bezrukov and colleagues,
quantitative analysis of the chemical modification data re-
vealed that, when low concentrations of the reagents are
used, they have little interaction with the wall of the lumen
and partition into the pore according to the scaling law of
Daoud and de Gennes (1977; Movileanu and Bayley, 2001).
In additional work, with covalently attached polymers, we
have examined the capture of proteins by biotin at the end
of a long PEG chain (Movileanu et al., 2000) and duplex
formation with tethered oligonucleotides (Howorka et al.,
2001a,b; Howorka and Bayley, 2002). These experiments
again revealed details of the properties of polymers, notably
their motion within the pore.
In the present work, we set out to reconcile the results
obtained from studies with free PEG at high concentrations
and chemical modification with sulfhydryl-directed PEGs,
by examining the interaction of dilute free polymers with the
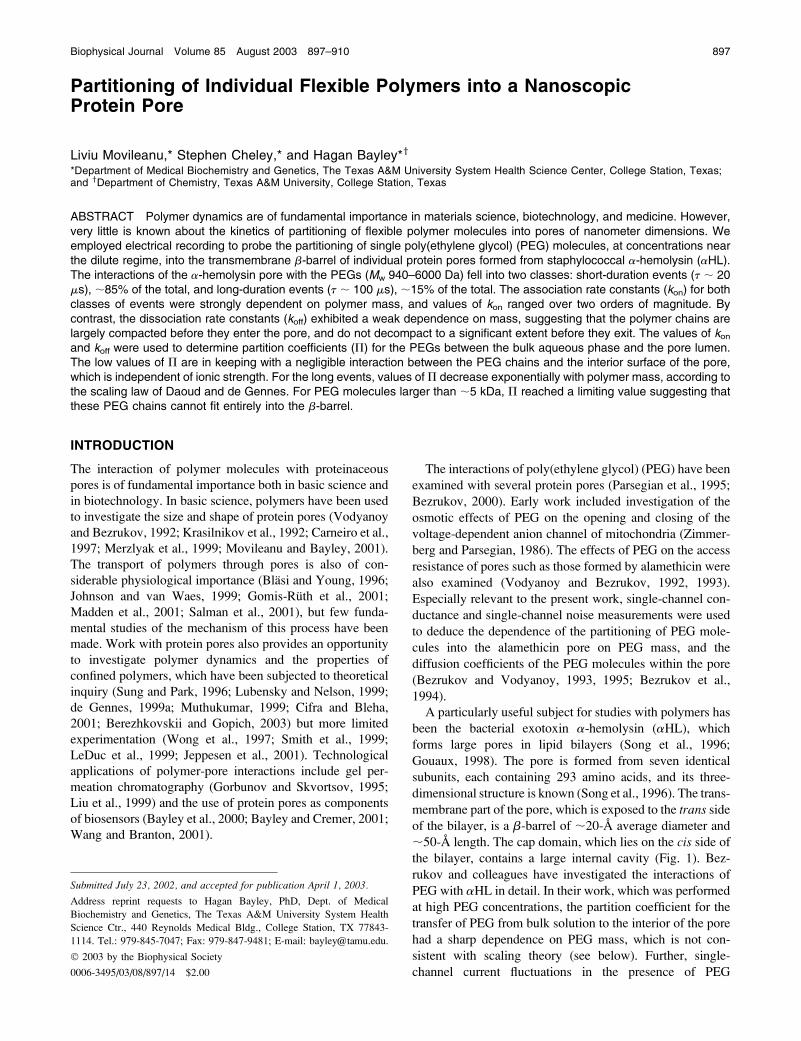
FIGURE 1 Model of the aHL pore and relative
sizes of the PEG polymers. The section through
the aHL pore shows a PEG molecule of 2.0 kDa
inside the transmembrane b-barrel. The sites
where replacements with cysteine were made are
shown (Thr-117 and Leu-135). The Flory radii of
four of the PEG molecules used here are shown.
898 Movileanu et al.
Biophysical Journal 85(2) 897–910
aHL pore by using single-channel recording at high time
resolution.
MATERIALS AND METHODS
Polyethylene glycols
Polyethylene glycols were purchased and used without further purification.
The number-average (Mn) and weight-average (Mw) molecular masses of
the reagents were determined by gel permeation chromatography by the
manufacturers. The ratio Mw/Mn is directly related to the variance of the
mass distribution of a polymer (Strobl, 1997). We used the following
reagents: PEG-0.94 k (Mw ¼ 940, Mw/Mn ¼ 1.05), PEG-2.0 k (Mw ¼ 1960,
Mw/Mn ¼ 1.03), PEG-3.1 k (Mw ¼ 3060, Mw/Mn ¼ 1.03), PEG-4.2 k (Mw ¼4240,Mw/Mn¼ 1.03), PEG-6.0 k (Mw¼ 6000,Mw/Mn¼ 1.03) from Fluka (St
Louis, MO). We also used PEG-0.30 k (Mw ¼ 296, Mw/Mn ¼ 1.05), PEG-
0.40 k (Mw ¼ 404, Mw/Mn ¼ 1.05), PEG-0.60 k (Mw ¼ 602, Mw/Mn ¼ 1.06),
and PEG-4.6 k (Mw¼ 4621,Mw/Mn¼ 1.02) from Sigma Chemical (St. Louis,
MO). To confirm the reagent mass distribution, PEGs of 3 kDa or larger were
analyzed by sodium dodecyl sulphate polyacrylamide gel electrophoresis
(SDS-PAGE) in 18% gels. The discontinuous SDS-PAGE system was
essentially as described for the electrophoresis of proteins (Laemmli, 1970)
except that a stacking gel was omitted (Zimmerman and Murphy, 1996;
Dhara and Chatterji, 1999). PEGs (20 or 100 mg) were applied to the gel
and electrophoresced overnight at 50 V. Gels were stained for 1 h with
Dragendorff’s reagent (0.6 mM bismuth subnitrate, and 0.11 M potassium
iodide in 5% (wt/vol) tartaric acid) as recommended (Dhara and Chatterji,
1999) and destained with three 5-min washes in water with shaking. All PEGs
analyzed appeared as discrete bands with only slightly increased broadening
with increasing Mw, in keeping with the manufacturer’s Mw/Mn ratios.
Sulfhydryl-directed PEG reagents
Water-soluble, sulfhydryl-directed MePEG-OPSS (monomethoxypoly
(ethylene glycol)-o-pyridyl disulfide) reagents were from Shearwater
Polymers (Huntsville, AL). Excluding the contribution of the OPSS group
(142 Da), the masses were MePEG-OPSS-0.85 k (Mw ¼ 848, Mw/Mn ¼1.02), MePEG-OPSS-1.7 k (Mw ¼ 1708, Mw/Mn ¼ 1.02), MePEG-OPSS-
2.5 k (Mw ¼ 2468, Mw/Mn ¼ 1.03), and MePEG-OPSS-5.0 k (Mw ¼ 4988,
Mw/Mn ¼ 1.02). The homogeneities of the MePEG-OPSS stocks were
determined by modifying a radiolabeled, monomeric cysteine mutant of
aHL, K8C, followed by separation of the products by SDS-PAGE and
phosphorimager analysis (Howorka et al., 2000). PEG-modified aHL
migrates more slowly than the unmodified monomeric protein in SDS gels.
The mass distributions of the polymers in the MePEG-OPSS reagents were
assessed from the broadening of the gel bands of MePEG-modified aHL-
K8C. The bands were only slightly broadened indicating that the molecular
size distribution of all four of the MePEG polymers is narrow as suggested
by the Mw/Mn ratios determined by gel permeation chromatography. The
pKa value of the reactive group OPSS is 2.0, so that the molecules are
uncharged at pH 8.5 (Movileanu et al., 2001).
Wild-type aHL
Heptameric wild-type aHL pores were obtained by treating aHL monomers,
purified from Staphylococcus aureus, with deoxycholate (Bhakdi et al.,
1981; Walker et al., 1992) and isolated from SDS-polyacrylamide gels as
previously described (Braha et al., 1997; Cheley et al., 1999).
Cysteine mutants
The single cysteine mutants T117C and L135C were constructed by cassette
mutagenesis as described previously (Cheley et al., 1999; Movileanu et al.,
2001). For bilayer recordings, mutant aHL polypeptides were synthesized in
vitro by coupled transcription and translation and assembled into homo-
heptamers by the inclusion of rabbit red blood cell membranes during
synthesis as detailed earlier (Cheley et al., 1999). The gel-purified homo-
heptamers (;0.2 mg/ml) were stored in 50 ml aliquots at �808C.
Planar bilayer recordings
Single-channel recordings were carried out with planar lipid membranes as
described previously (Montal and Mueller, 1972; Hanke and Schlue, 1993;
Movileanu et al., 2000). Both the cis and trans chambers of the apparatus
contained 1 M KCl, 10 mM Tris�HCl, pH 7.5, with 100 mM EDTA, unless
otherwise specified. Measurements were performed at room temperature (23
6 0.58C). A solvent-free planar lipid bilayer membrane of 1,2-diphytanoyl-
sn-glycerophosphocholine (Avanti Polar Lipids, Alabaster, AL) was formed
across the orifice. The transmembrane potential was applied through Ag/
AgCl electrodes connected to the bath with 1.5% agar bridges (Ultra Pure
DNA Grade, Bio-Rad Laboratories, Hercules, CA) containing 3 M KCl
(Sigma). Protein was added to the cis chamber, which was at ground. A
positive potential indicates a higher potential at the trans chamber, and
a positive current is one in which cations flow from trans to cis. Single-
channel currents were recorded by using a patch-clamp amplifier (Axopatch
200B, Axon Instruments, Foster City, CA) in the whole-cell mode (b ¼ 1)
with a CV-203BU headstage. The signals were low-pass filtered at 40 kHz
with an 8-pole Bessel filter (Model 900, Frequency Devices, Haverhill, MA).
Data analysis and statistics
A Pentium PC equipped with a DigiData 1200 A/D converter (Axon
Instruments, Foster City, CA) was used for data acquisition with Clampex
8.0 (Axon Instruments). Single-channel data for analysis were acquired at
a sampling rate of 200 kHz. Acquisition of the events was carried out with
the 50% threshold crossing technique. To avoid large binning promotion
errors, we used a 5-ms bin width for the dwell time histograms. The pro-
motion errors were then corrected automatically by pStat (in pClamp 8.0).
The distributions of closed and open durations were fitted with sums of
exponentials using the maximum likelihood method (Colquhoun and
Sigworth, 1995) to estimate the most probable values of the time constants.
The rise time (Tr) for the delay introduced by the filter for a single-channel
transition is Tr ¼ 339/fc ms, where fc is the corner frequency of the filter
(Colquhoun and Sigworth, 1995). In our case, Tr ¼ 9.2 ms. The dead time is
Td ¼ 0.54Tr ¼ 4.9 ms, which is close to the sampling interval (5.0 ms). As the
mean duration of interevent intervals is much longer than both the durations
of occupancy by PEG (the short and long spikes) and the dead time, the
contribution of phantom states (unoccupied-occupied compound states) to
the total number of states is negligible. The time constants and the true
number of events were also corrected for missed events according to
a procedure similar to that developed previously (Blatz and Magleby, 1986)
(see Online Supplement). The procedure was modified for a scheme with
one unoccupied state (with mean duration L0) and two occupied states (with
mean durations L1 and L2). To calculate corrections to the rate constants,
approximations were made based on the assumption Td\L1, L2 � L0. The
values reported in the text are corrected unless otherwise stated. Gap-free
data from the same experiments were stored simultaneously on digital
audiotape at a sampling rate of 48 kHz. For display purposes, these data were
filtered at 10 kHz.
In the case of recordings showing the reaction of single aHL pores with
MePEG-OPSS-0.85 k, the signals were filtered at 10 kHz and sampled at 50
kHz. For the macroscopic current measurements (at least 30 channels in the
bilayer), used for chemical modification experiments, the signal was filtered
at a frequency of 100 Hz and sampled at 1 kHz (data not shown).
For display and further manipulation of the single-channel current or
macroscopic current traces, we used pClamp 9.0 (Axon Instruments) and
Origin7.0 (Microcal Software, Northampton, MA).
Polymer Partitioning into a Pore 899
Biophysical Journal 85(2) 897–910
RESULTS
Partial blockade of the aHL pore byPEG molecules
Currents flowing through individual aHL pores (Fig. 1) were
recorded at 1100 mV in 1 M KCl, 10 mM Tris�HCl, pH 7.5,
containing 100 mM EDTA. In the absence of PEG, the
current flowing through the open (unoccupied) aHL pore
was 96.3 6 2.1 pA (n ¼ 32 experiments; Figs. 2 A and 3 A).
The open state was of long duration, and lasted for hours
under the stated conditions. Similarly, except at extremes of
pH and transmembrane potential, other authors have found
that wild-type aHL pores exhibit long-lived open states
(Menestrina, 1986; Korchev et al., 1995).
The addition of PEGs of various molecular masses (Fig. 1;
Table 1) to the trans side of the bilayer, at low millimolar
concentrations, produces reversible partial channel block-
ades. The extent of the block is very similar to the amplitude of
the macroscopic current reductions produced by MePEG-
OPSS reagents when they react with cysteine sulfhydryls
located in the b-barrel domain (Movileanu et al., 2001).
For example, four MePEG-OPSS reagents ranging from
MeOPSS-PEG-0.85 k to MeOPSS-PEG-5.0 k produced a 71
6 3% reduction in the macroscopic current after attachment
of a single PEG to position 117 in the barrel in 300 mM KCl at
�40 mV. The extent of block was independent of the size of
the polymer (Movileanu et al., 2001). In the present work,
which was conducted in 1 M KCl, PEG-2.0 k through PEG-
6.0 k reduced the single-channel conductance by 67 6 1%
(Figs. 2 and 3) as determined from all-points amplitude
histograms. The amplitudes were widely distributed, but this
is expected given the recording procedure and the short
lifetimes of the events, and the observed distributions could be
simulated (www.qub.buffalo.edu) by using single-value true
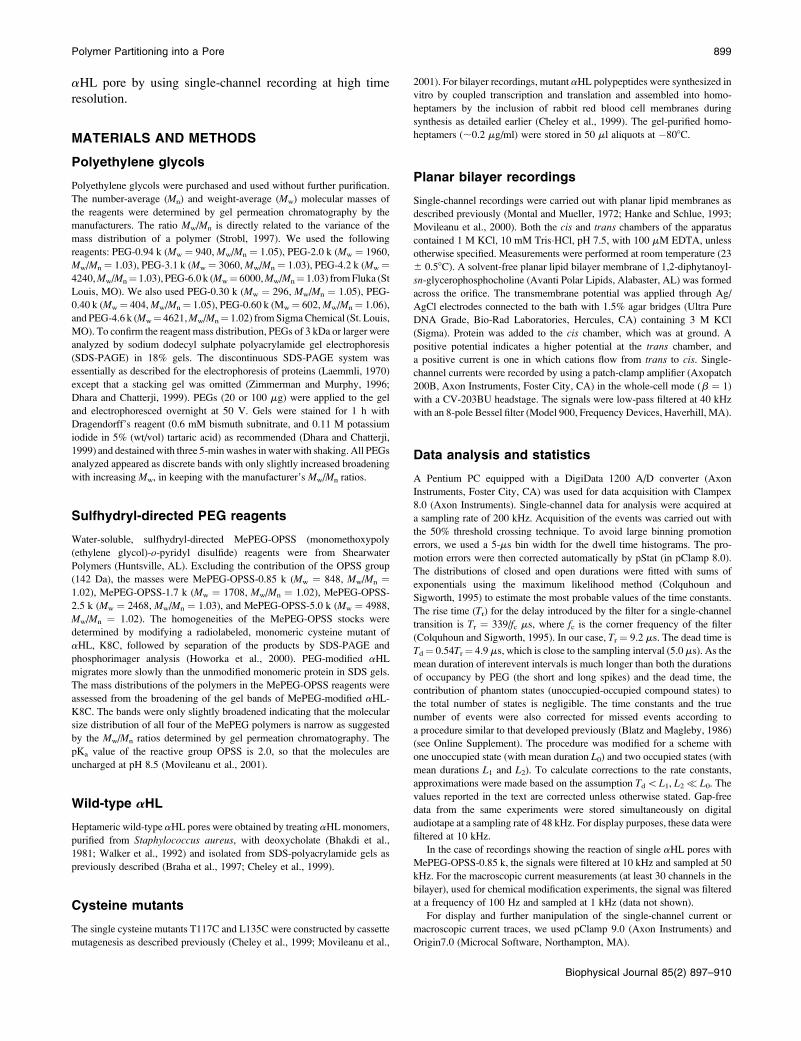
FIGURE 2 Single-channel recordings of the aHL pore in
the absence and presence of PEG-0.94 k applied to the trans
side of the bilayer. (A) no PEG; (B) 1 mM PEG-0.94 k; (C)
5 mM PEG-0.94 k; (D) 9 mM PEG-0.94 k; and (E)
semilogarithmic dwell-time histogram for PEG occupancy
events. The PEG-0.94 k concentration was 5 mM and the
recording period was 10 s. The bin size is 5 ms. A double-
exponential fit was made by the Marquardt-LSQ procedure.
The time constants derived from this experiment, un-
corrected for missed events, are 19 and 59 ms. For the traces
in A–D, the signal, which was obtained at a transmembrane
potential of 1100 mV, was low-pass filtered at 10 kHz.
The other conditions are in Materials and Methods. The
histogram in E is based on a signal filtered at 40 kHz.
900 Movileanu et al.
Biophysical Journal 85(2) 897–910
amplitudes, two t-values (see below), and 40-kHz filtering.
The similarity between the results found with the free PEGs
and those obtained by chemical modification suggests that
only one PEG is located in the transmembraneb-barrel during
the spikes produced by the free PEG molecules. For PEG-0.60
k and PEG-0.94 k (Fig. 2), the extents of block appeared to be
lower at 45 6 2% and 62 6 3%, respectively. Furthermore,
we found no detectable events for PEGs with a molecular
mass\400 Da, most probably because the events are shorter
than the rise time of the filter.
To better understand the nature of the spikes, we measured
the extent of channel block after covalent attachment of
a single PEG chain within an individual aHL pore. The
cysteine mutant homoheptamer T117C7 was reacted with
1 mM MePEG-OPSS-0.85 k from the trans side of the
bilayer (Fig. 4). A few seconds after addition of the reagent,
without stirring, the current became decorated with short
spikes (65 6 3% block from the fully open state (level 0),
n¼ 4), which most likely represent noncovalent interactions.
After ;1 s, the current dropped from level 0 to level 1 (Fig.
4 A); the magnitude of the drop (63 6 2%, n ¼ 4) was very
close to the amplitude of the blockades by free PEG-0.94 k.
The shift in the current to level 1 most probably results from
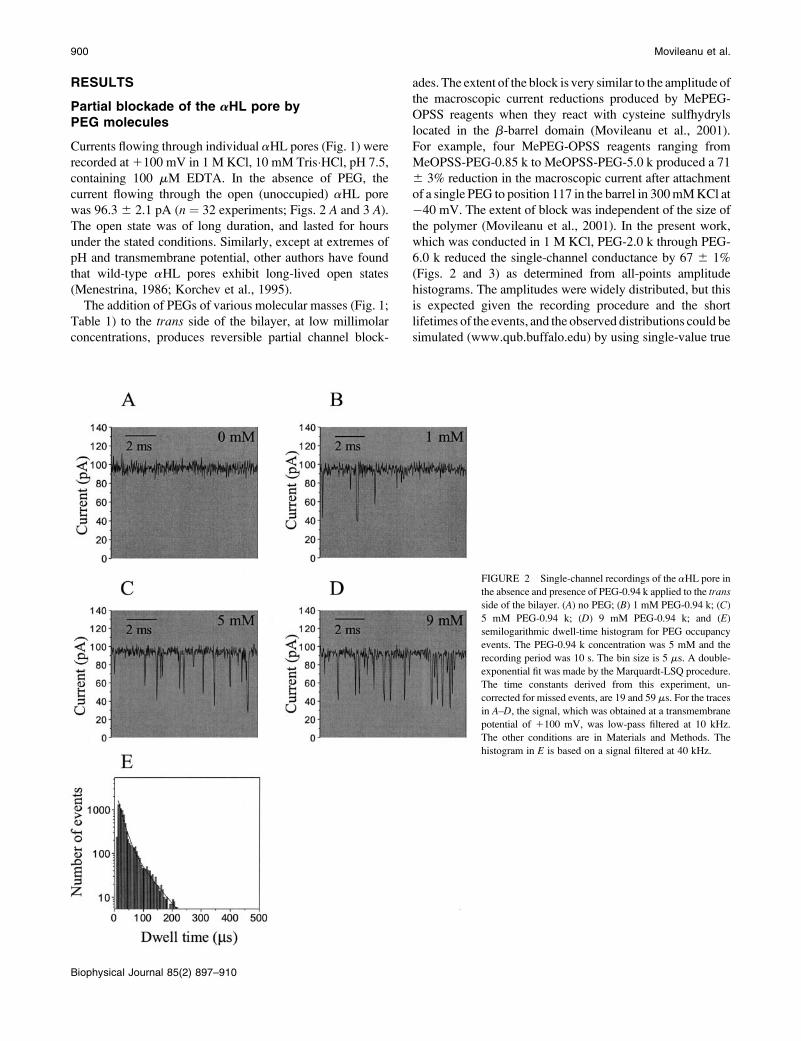
FIGURE 3 Single-channel recordings of the aHL pore in
the absence and presence of PEG-6.0 k applied to the trans
side of the bilayer: (A) no PEG; (B) 1 mM PEG-6.0 k; (C)
5 mM PEG-6.0 k; (D) expanded trace of boxed area in B;
(E) semilogarithmic dwell-time histogram for PEG occu-
pancy events. The PEG-6.0 k concentration was 5 mM and
the recording period was 200 s. The bin size is 5 ms. A
double exponential fit was made by the Marquardt-LSQ
procedure. The derived time constants, uncorrected for
missed events, are 29 and 120 ms. For the traces in A–D, the
signal, which was obtained at a holding potential of 1100
mV, was filtered at 10 kHz. The histogram in E is based on
a signal filtered at 40 kHz.
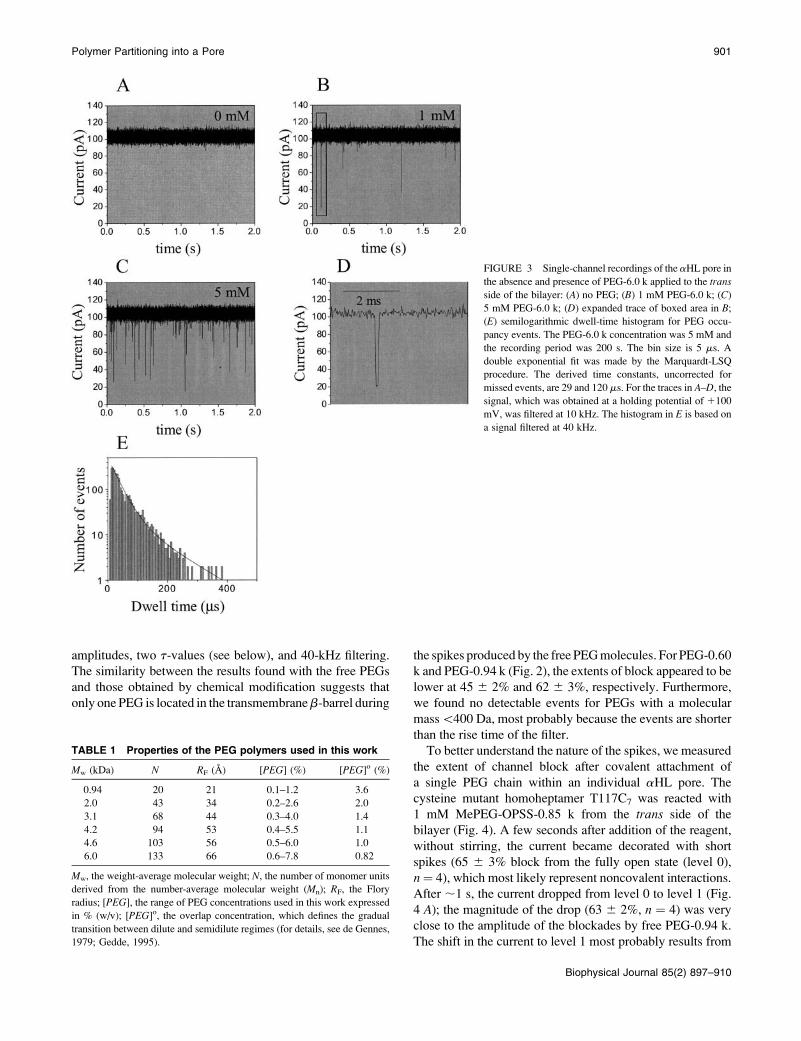
TABLE 1 Properties of the PEG polymers used in this work
Mw (kDa) N RF (A) [PEG] (%) [PEG]o (%)
0.94 20 21 0.1–1.2 3.6
2.0 43 34 0.2–2.6 2.0
3.1 68 44 0.3–4.0 1.4
4.2 94 53 0.4–5.5 1.1
4.6 103 56 0.5–6.0 1.0
6.0 133 66 0.6–7.8 0.82
Mw, the weight-average molecular weight; N, the number of monomer units
derived from the number-average molecular weight (Mn); RF, the Flory
radius; [PEG], the range of PEG concentrations used in this work expressed
in % (w/v); [PEG]o, the overlap concentration, which defines the gradual
transition between dilute and semidilute regimes (for details, see de Gennes,
1979; Gedde, 1995).
Polymer Partitioning into a Pore 901
Biophysical Journal 85(2) 897–910

the covalent attachment of a single MePEG-0.85 k molecule
at position 117 within the lumen of the transmembrane
domain of the channel.
Level 1 was also decorated with short-lived spikes, which
occurred at a lower frequency than those from level 0. The
spikes were still present after washing out the chambers of
the apparatus, suggesting that they represent movement of
the attached MePEG-0.85 k within the channel lumen. After
a few seconds, a new downward shift in the single-channel
current occurred to level 2 (Fig. 4 A), presumably as the result
of a second reaction of MePEG-OPSS-0.85 k at position 117
(Fig. 4 A). When 10 mM DTT was added to the chambers,
both PEG chains were cleaved from the Cys-117 residues as
deduced from the restoration of the current to level 0 in two
steps (Fig. 4 B).
Duration of the PEG-induced channel blocks
Semilogarithmic dwell time histograms for PEG occupancy
events were fitted to two exponentials, where toff�1 re-
presents the short-duration events and toff�2 the long-
duration events. Typical histograms, for PEG-0.94 k and
PEG-6.0 k, are shown (Figs. 2 E and 3 E, respectively). To
determine the number of exponentials for the best fit, we
applied the log likelihood ratio (LLR) test to compare
different fitting models (McManus and Magleby, 1988;
Colquhoun and Sigworth, 1995). At a confidence level of
0.95, the best model was a two-exponential fit. Fits to a three-
exponential model were not significantly better as judged by
the log likelihood ratio value. The two-exponential fits were
significantly better than fits to stretched exponentials. The
fits to the second of the two exponentials (toff�2) were
distinctly better (R ¼ 0.97 � 1.00, Marquardt-LSQ (least
squares) procedure) than the fits to the first of the two
exponentials (toff�1, R ¼ 0.84 � 0.88; Figs. 2 E and 3 E).
There are several difficulties in measuring the lifetimes of
events in the microsecond time domain (Blatz and Magleby,
1986; McManus et al., 1987; Colquhoun and Sigworth,
1995) and our data were corrected for binning and sampling
promotion errors, and missed events. The fraction of the long
events was 0.15 6 0.05 of the total, and did not vary
significantly with the PEG molecular mass. toff values were
determined at seven concentrations of PEG in the range 1–13
mM. As expected, toff�1 and toff�2 did not vary with con-
centration and so the values for each PEG were averaged.
toff�1 shows only a slight increase from 22 6 2 ms to 26 6 3
ms for the range of PEGs from PEG-0.94 k to PEG-6.0 k.
toff�2 increases from 60 6 7 ms to 120 6 10 ms over the
same range of PEG masses.
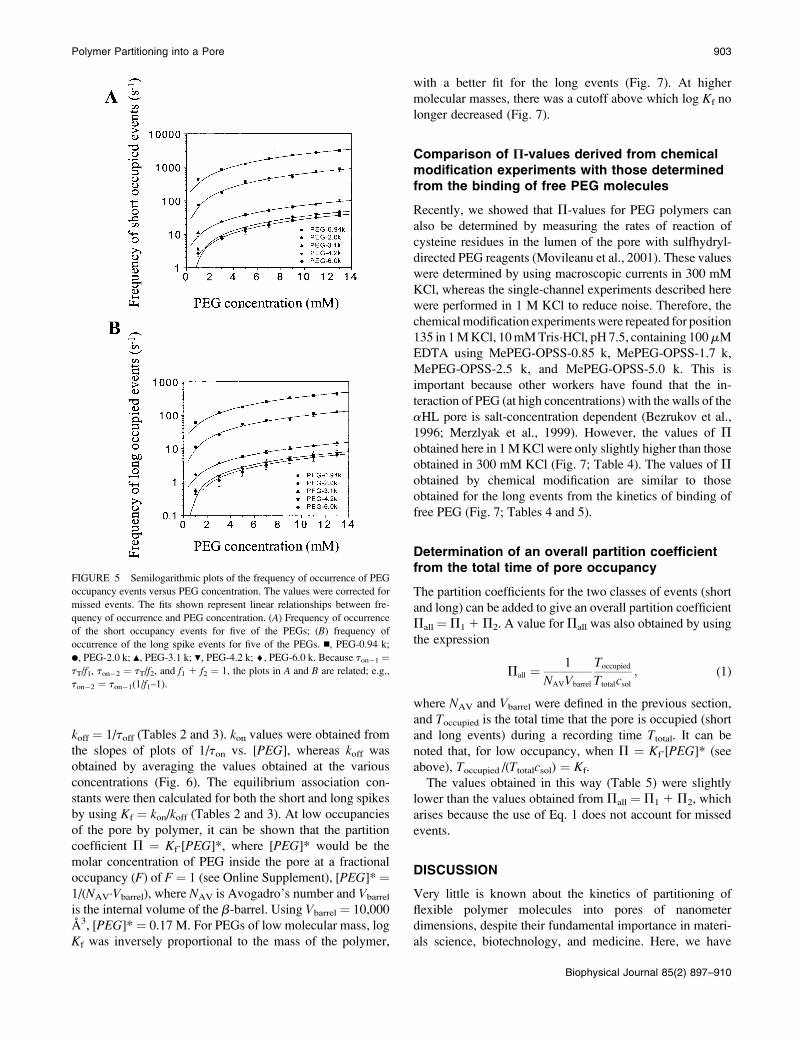
Dependence of the event frequency on thePEG concentration and molecular mass
By contrast with toff, the interevent intervals (ton) were
strongly dependent on both PEG molecular mass and the PEG
concentration in the trans chamber (Fig. 5). For example, at 3
mM polymer the frequencies of occurrence of the short events
were PEG-0.94 k, 840 6 60 s�1; PEG-2.0 k, 180 6 20 s�1;
and PEG-3.1 k, 24 6 4 s�1 (Fig. 5 A). A similar result was
obtained when the frequencies of occurrence of the long
events were separated from the total (Fig. 5 B). For example,
at 3 mM polymer the values were PEG-0.94 k, 120 6 10 s�1;
PEG-2.0 k, 26 6 2 s�1; and PEG-3.1 k, 3.6 6 0.6 s�1 (Fig.
5 B). ton values were determined for each of the two classes
of events by using ton�1 ¼ tT/f1 and ton�2 ¼ tT/f2, where tT
is the overall interevent interval (short and long events) and
f1 and f2 are the number of short and long events as a fraction
of the total number of events, as determined from the dwell
time histograms.
Dependence of kon, koff, and Kf on PEGmolecular mass
Rate constants for the association (kon) and dissociation (koff)
of PEG were determined from the t-values, by assuming
a simple bimolecular interaction such that kon ¼ 1/(ton�[PEG]), where [PEG] is the PEG concentration, and
FIGURE 4 Single-channel recording with the homoheptameric cysteine
mutant T117C7. (A) MePEG-OPSS-0.85 k (1 mM) added to the trans
chamber. The current levels are interpreted as follows: 0, fully open channel;
1, one PEG attached; 2, two PEGs attached. (B) Application of 10 mM DTT
resulted in the cleavage of both PEG chains from the protein surface. The
solution in the chambers contained 1 M KCl, 10 mM Tris�HCl, and 100 mM
EDTA, pH 8.5. The signal, which was obtained at a holding potential of
1100 mV, was low-pass filtered at 10 kHz.
902 Movileanu et al.
Biophysical Journal 85(2) 897–910
koff ¼ 1/toff (Tables 2 and 3). kon values were obtained from
the slopes of plots of 1/ton vs. [PEG], whereas koff was
obtained by averaging the values obtained at the various
concentrations (Fig. 6). The equilibrium association con-
stants were then calculated for both the short and long spikes
by using Kf ¼ kon/koff (Tables 2 and 3). At low occupancies
of the pore by polymer, it can be shown that the partition
coefficient P ¼ Kf�[PEG]*, where [PEG]* would be the
molar concentration of PEG inside the pore at a fractional
occupancy (F) of F ¼ 1 (see Online Supplement), [PEG]* ¼1/(NAV�Vbarrel), where NAV is Avogadro’s number and Vbarrel
is the internal volume of the b-barrel. Using Vbarrel ¼ 10,000
A3, [PEG]* ¼ 0.17 M. For PEGs of low molecular mass, log
Kf was inversely proportional to the mass of the polymer,
with a better fit for the long events (Fig. 7). At higher
molecular masses, there was a cutoff above which log Kf no
longer decreased (Fig. 7).
Comparison of P-values derived from chemicalmodification experiments with those determinedfrom the binding of free PEG molecules
Recently, we showed that P-values for PEG polymers can
also be determined by measuring the rates of reaction of
cysteine residues in the lumen of the pore with sulfhydryl-
directed PEG reagents (Movileanu et al., 2001). These values
were determined by using macroscopic currents in 300 mM
KCl, whereas the single-channel experiments described here
were performed in 1 M KCl to reduce noise. Therefore, the
chemical modification experiments were repeated for position
135 in 1 M KCl, 10 mM Tris�HCl, pH 7.5, containing 100mM
EDTA using MePEG-OPSS-0.85 k, MePEG-OPSS-1.7 k,
MePEG-OPSS-2.5 k, and MePEG-OPSS-5.0 k. This is
important because other workers have found that the in-
teraction of PEG (at high concentrations) with the walls of the
aHL pore is salt-concentration dependent (Bezrukov et al.,
1996; Merzlyak et al., 1999). However, the values of P
obtained here in 1 M KCl were only slightly higher than those
obtained in 300 mM KCl (Fig. 7; Table 4). The values of P
obtained by chemical modification are similar to those
obtained for the long events from the kinetics of binding of
free PEG (Fig. 7; Tables 4 and 5).
Determination of an overall partition coefficientfrom the total time of pore occupancy
The partition coefficients for the two classes of events (short
and long) can be added to give an overall partition coefficient
Pall ¼ P1 1 P2. A value for Pall was also obtained by using
the expression
Pall ¼1
NAVVbarrel
Toccupied
Ttotalcsol
; (1)
where NAV and Vbarrel were defined in the previous section,
and Toccupied is the total time that the pore is occupied (short
and long events) during a recording time Ttotal. It can be
noted that, for low occupancy, when P ¼ Kf�[PEG]* (see
above), Toccupied /(Ttotalcsol) ¼ Kf.
The values obtained in this way (Table 5) were slightly
lower than the values obtained from Pall ¼ P1 1 P2, which
arises because the use of Eq. 1 does not account for missed
events.
DISCUSSION
Very little is known about the kinetics of partitioning of
flexible polymer molecules into pores of nanometer
dimensions, despite their fundamental importance in materi-
als science, biotechnology, and medicine. Here, we have
FIGURE 5 Semilogarithmic plots of the frequency of occurrence of PEG
occupancy events versus PEG concentration. The values were corrected for
missed events. The fits shown represent linear relationships between fre-
quency of occurrence and PEG concentration. (A) Frequency of occurrence
of the short occupancy events for five of the PEGs; (B) frequency of
occurrence of the long spike events for five of the PEGs. n, PEG-0.94 k;
d, PEG-2.0 k; m, PEG-3.1 k; ., PEG-4.2 k; ¤, PEG-6.0 k. Because ton�1 ¼tT/f1, ton�2 ¼ tT/f2, and f1 1 f2 ¼ 1, the plots in A and B are related; e.g.,
ton�2 ¼ ton�1(1/f1–1).
Polymer Partitioning into a Pore 903
Biophysical Journal 85(2) 897–910
investigated the partitioning of PEG molecules from dilute
solutions into the transmembrane b-barrels of individual
protein pores formed from staphylococcal a-hemolysin. We
found low values for the partition coefficients (P) describing
the distribution of PEGs between the bulk aqueous phase and
the pore lumen, in keeping with a negligible interaction
between the PEG chains and the interior surface of the pore.
The values of P are independent of ionic strength. For a
fraction of the binding events with long dwell times, log P
decreases linearly with polymer mass in accord with the
scaling law of Daoud and de Gennes describing the entry of
flexible polymers into a narrow tube.
Correction for missed events
The dwell times of PEG molecules bound to the aHL pore
are short and therefore it was necessary to correct for missed
events. We used procedures developed earlier (Blatz and
Magleby, 1986; McManus et al., 1987; Colquhoun and
Sigworth, 1995), modified to accommodate a kinetic scheme
in which PEG molecules form two classes of binary
complexes with aHL with short and long dwell times (see
Online Supplement). We compared the uncorrected and
corrected data. As expected, when corrected, the dwell times
for the PEGs (toff) were reduced. This effect was modest
(Tables 2 and 3). The interevent intervals (ton) were also
reduced when corrected. Because the missed short binding
events tend to lengthen ton considerably, the effect was more
appreciable (Tables 2 and 3). The overall effect of the cor-
rections was to increase Kf by 21 6 3%. Although this is
significant, it does not, in fact, affect our interpretation of the
data.
Two classes of PEG binding events
We found that there are two classes of blockades of the aHL
pore by PEGs as judged by the mean durations of the events.
Approximately 85% of the events are very short with dwell
times that are independent of polymer mass and in the range of
toff�1 ¼ 22–26 ms. The long events (toff�2), which represent
;15% of the total, showed a weak dependence on polymer
mass with dwell times in the range of 60 ms (PEG-0.94 k) to
120ms (PEG-6.0 k). By contrast, the event frequency showed
a dramatic dependence on polymer mass: for example, at 3
mM, PEG-0.94 k, ton ¼ 1.2 6 0.2 ms; and PEG-6.0 k, ton ¼100 6 6 ms. Assuming simple bimolecular interactions, the
t-values were interpreted in terms of association (kon) and
dissociation (koff) rate constants, which were in turn used to
derive formation constants (Kf) for the aHL�PEG complexes.
Molecular interpretation of the two classesof PEG binding events
The short and long binding events have several similarities.
First, their amplitudes are about the same. Indeed, the
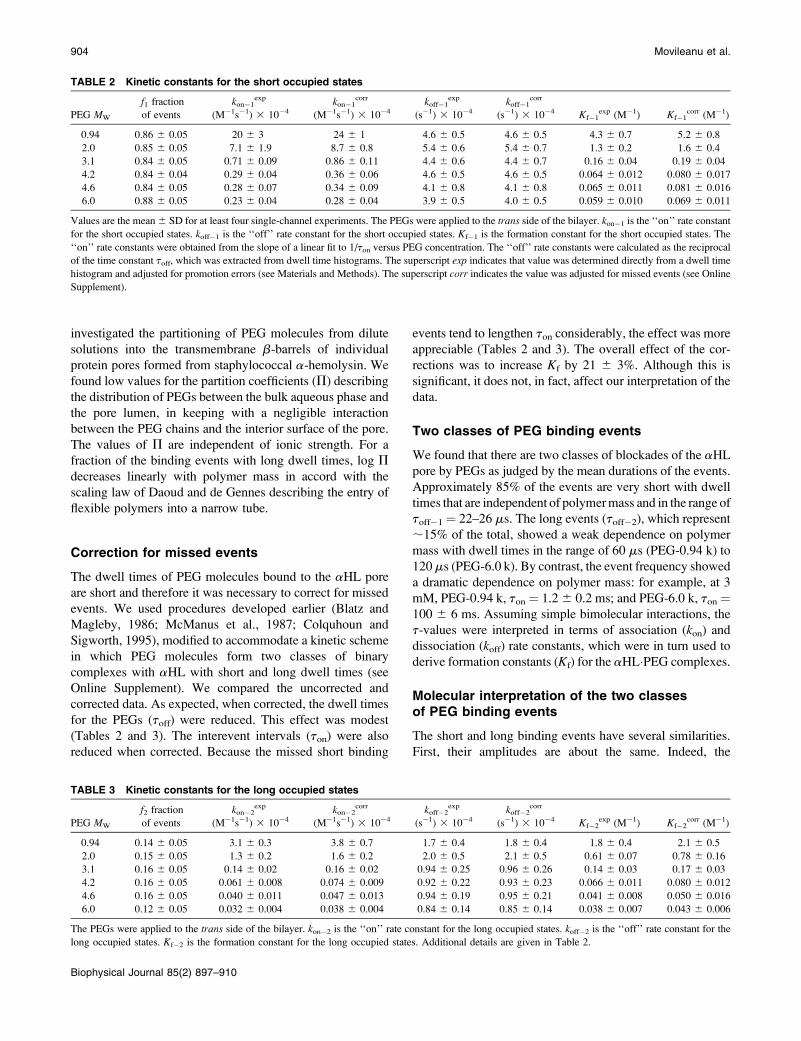
TABLE 2 Kinetic constants for the short occupied states
PEG MW
f1 fraction
of events
kon�1exp
(M�1s�1) 3 10�4
kon�1corr
(M�1s�1) 3 10�4
koff�1exp
(s�1) 3 10�4
koff�1corr
(s�1) 3 10�4 Kf�1exp (M�1) Kf�1
corr (M�1)
0.94 0.86 6 0.05 20 6 3 24 6 1 4.6 6 0.5 4.6 6 0.5 4.3 6 0.7 5.2 6 0.8
2.0 0.85 6 0.05 7.1 6 1.9 8.7 6 0.8 5.4 6 0.6 5.4 6 0.7 1.3 6 0.2 1.6 6 0.4
3.1 0.84 6 0.05 0.71 6 0.09 0.86 6 0.11 4.4 6 0.6 4.4 6 0.7 0.16 6 0.04 0.19 6 0.04
4.2 0.84 6 0.04 0.29 6 0.04 0.36 6 0.06 4.6 6 0.5 4.6 6 0.5 0.064 6 0.012 0.080 6 0.017
4.6 0.84 6 0.05 0.28 6 0.07 0.34 6 0.09 4.1 6 0.8 4.1 6 0.8 0.065 6 0.011 0.081 6 0.016
6.0 0.88 6 0.05 0.23 6 0.04 0.28 6 0.04 3.9 6 0.5 4.0 6 0.5 0.059 6 0.010 0.069 6 0.011
Values are the mean 6 SD for at least four single-channel experiments. The PEGs were applied to the trans side of the bilayer. kon�1 is the ‘‘on’’ rate constant
for the short occupied states. koff�1 is the ‘‘off’’ rate constant for the short occupied states. Kf�1 is the formation constant for the short occupied states. The
‘‘on’’ rate constants were obtained from the slope of a linear fit to 1/ton versus PEG concentration. The ‘‘off’’ rate constants were calculated as the reciprocal
of the time constant toff, which was extracted from dwell time histograms. The superscript exp indicates that value was determined directly from a dwell time
histogram and adjusted for promotion errors (see Materials and Methods). The superscript corr indicates the value was adjusted for missed events (see Online
Supplement).
TABLE 3 Kinetic constants for the long occupied states
PEG MW
f2 fraction
of events
kon�2exp
(M�1s�1) 3 10�4
kon�2corr
(M�1s�1) 3 10�4
koff�2exp
(s�1) 3 10�4
koff�2corr
(s�1) 3 10�4 Kf�2exp (M�1) Kf�2
corr (M�1)
0.94 0.14 6 0.05 3.1 6 0.3 3.8 6 0.7 1.7 6 0.4 1.8 6 0.4 1.8 6 0.4 2.1 6 0.5
2.0 0.15 6 0.05 1.3 6 0.2 1.6 6 0.2 2.0 6 0.5 2.1 6 0.5 0.61 6 0.07 0.78 6 0.16
3.1 0.16 6 0.05 0.14 6 0.02 0.16 6 0.02 0.94 6 0.25 0.96 6 0.26 0.14 6 0.03 0.17 6 0.03
4.2 0.16 6 0.05 0.061 6 0.008 0.074 6 0.009 0.92 6 0.22 0.93 6 0.23 0.066 6 0.011 0.080 6 0.012
4.6 0.16 6 0.05 0.040 6 0.011 0.047 6 0.013 0.94 6 0.19 0.95 6 0.21 0.041 6 0.008 0.050 6 0.016
6.0 0.12 6 0.05 0.032 6 0.004 0.038 6 0.004 0.84 6 0.14 0.85 6 0.14 0.038 6 0.007 0.043 6 0.006
The PEGs were applied to the trans side of the bilayer. kon�2 is the ‘‘on’’ rate constant for the long occupied states. koff�2 is the ‘‘off’’ rate constant for the
long occupied states. Kf�2 is the formation constant for the long occupied states. Additional details are given in Table 2.
904 Movileanu et al.
Biophysical Journal 85(2) 897–910
amplitudes for binding events of all PEGs of [2.0 kDa are
closely similar. Second, the relative preponderance of the two
classes of events does not vary greatly with polymer mass.
Third, theKf values of the short and long events scale with the
mass of the PEG chains in a similar (but not identical) fashion
(Tables 2 and 3; Fig. 7). Finally, there is a molecular weight
cutoff above which Kf no longer falls with molecular mass,
again this is similar for both classes of events (Tables 2 and 3;
Fig. 7). These findings suggest that the short and long events
are related in molecular terms. For example, the polymer may
fill the barrel as much as possible in both cases and interact
with the central constriction. The event classes do differ in
their toff values (by definition) and toff varies significantly
with PEG mass for the long events. They also differ in their
P-values; the polymers partition somewhat more strongly
into the barrel when the short events are considered (Table 5).
Therefore, the events probably differ subtly; for example, in
one case the polymer may enter as a hairpin and both ends
may end up near the mouth of the pore, whereas in the other
case, an end may first thread into the barrel.
Partitioning of PEG molecules into the aHL poreobeys a scaling law
We previously examined the partitioning of PEG mole-
cules into the transmembrane b-barrel of the aHL pore by
determining the rates of reaction of cysteine-directed
MePEG-OPSS reagents with cysteine residues located at
a selection of sites within the barrel (Movileanu and
Bayley, 2001). We concluded that partitioning follows the
scaling law of Daoud and de Gennes (1977; de Gennes,
1979).
P ¼ cpore=csolution ¼ expð�Nða=DÞ5=3Þ; (2)
where c is concentration; N, the number of repeat units in the
polymer chain; a, the persistence length of the polymer; and
D, the diameter of the pore. This relation applies to a narrow
tube both where the Flory radius of the polymer RF [ D(Daoud and de Gennes, 1977) and where RF ’D (de Gennes,
1979; Boyd et al., 1996). In this form, it requires that the free
energy of confinement of each segment (i.e., blob) of the
polymer within the pore is kBT, where kB is the Boltzmann
constant and T the absolute temperature (Movileanu and
Bayley, 2001).
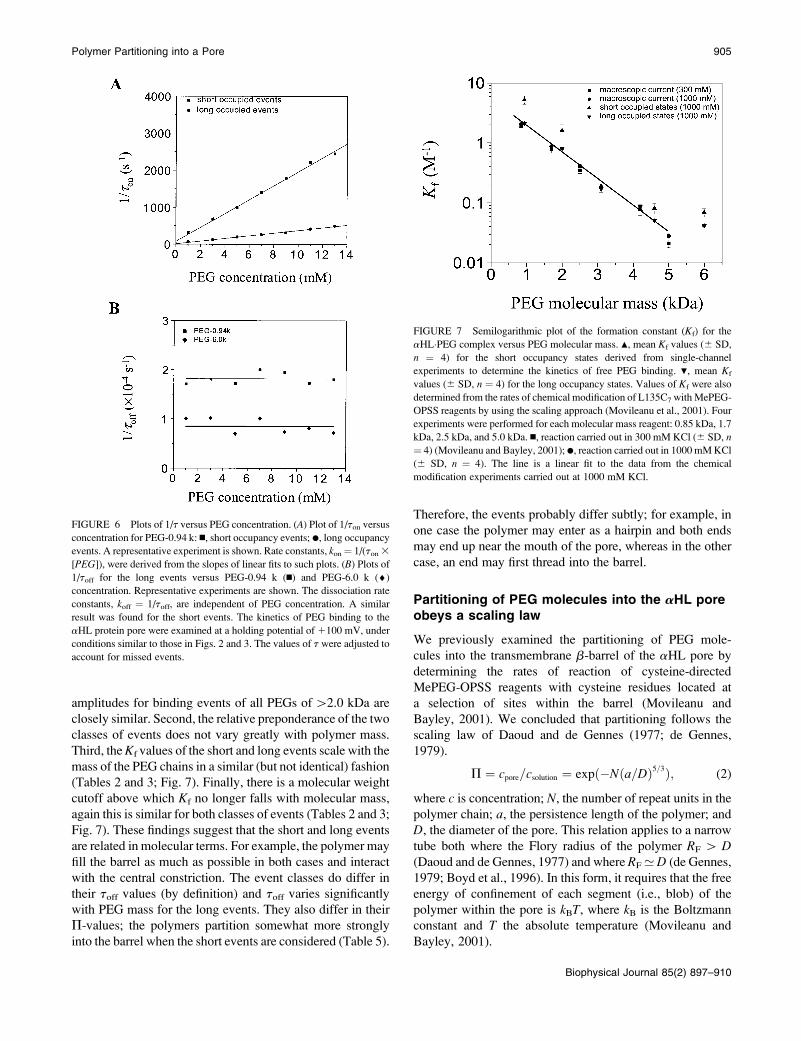
FIGURE 6 Plots of 1/t versus PEG concentration. (A) Plot of 1/ton versus
concentration for PEG-0.94 k: n, short occupancy events; d, long occupancy
events. A representative experiment is shown. Rate constants, kon ¼ 1/(ton 3
[PEG]), were derived from the slopes of linear fits to such plots. (B) Plots of
1/toff for the long events versus PEG-0.94 k (n) and PEG-6.0 k (¤)
concentration. Representative experiments are shown. The dissociation rate
constants, koff ¼ 1/toff, are independent of PEG concentration. A similar
result was found for the short events. The kinetics of PEG binding to the
aHL protein pore were examined at a holding potential of 1100 mV, under
conditions similar to those in Figs. 2 and 3. The values of t were adjusted to
account for missed events.
FIGURE 7 Semilogarithmic plot of the formation constant (Kf) for the
aHL�PEG complex versus PEG molecular mass. m, mean Kf values (6 SD,
n ¼ 4) for the short occupancy states derived from single-channel
experiments to determine the kinetics of free PEG binding. ., mean Kf
values (6 SD, n ¼ 4) for the long occupancy states. Values of Kf were also
determined from the rates of chemical modification of L135C7 with MePEG-
OPSS reagents by using the scaling approach (Movileanu et al., 2001). Four
experiments were performed for each molecular mass reagent: 0.85 kDa, 1.7
kDa, 2.5 kDa, and 5.0 kDa. n, reaction carried out in 300 mM KCl (6 SD, n
¼ 4) (Movileanu and Bayley, 2001); d, reaction carried out in 1000 mM KCl
(6 SD, n ¼ 4). The line is a linear fit to the data from the chemical
modification experiments carried out at 1000 mM KCl.
Polymer Partitioning into a Pore 905
Biophysical Journal 85(2) 897–910

Values for (a/D)5/3 were obtained from slopes of ln k9 vs.
N, and used to determine P for various chain lengths of the
polymer, where k9 is the apparent first-order rate constant for
the reaction of a MePEG-OPSS reagent within the lumen of
the pore. The original measurements were performed in 300
mM KCl and are tabulated here for position 135, which is
located near the midpoint of the transmembrane domain
(Table 4). So that a comparison could be made with the
partitioning of the free PEG molecules, the measurements
were repeated for position 135 in 1 M KCl (Table 4) and the
results were found to be closely similar.
The values of P for the long binding events of free PEG
molecules were closely similar to the values obtained from
MePEG-OPSS modification (Fig. 7; Table 5). Therefore,
these data show that a fraction of the binding events (;15%)
for PEG molecules in dilute solution show the dependence
on mass that would be expected from the scaling law of
Daoud and de Gennes. The P-values for the short events
were somewhat larger (Fig. 7; Table 5), but of the same order
of magnitude as those derived for the long events. However,
the fit with the scaling law is not as good. Indeed, there is
a suggestion of the sharper dependence on mass seen by
Bezrukov and colleagues (Bezrukov et al., 1996; Merzlyak
et al., 1999; Rostovtseva et al., 2002), but not of the extent
noted in that work.
The derivation of Daoud and de Gennes requires that the
polymer have no interaction with the wall of the pore and
that P decrease exponentially with polymer mass, because
the partitioning of larger polymers is reduced by the un-
favorable entropy of confinement. Although this approach
cannot yield P[1, the good fit of the chemical modification
data implies that the polymers do not interact strongly with
the walls of the pore lumen (Movileanu and Bayley, 2001).
In the measurements with the free PEG molecules, it would
be possible to obtain P � 1, were an interaction to occur.
However, that is not the case. The highest value of P is for
PEG-0.94 k, where P1 1P2 ¼ 1.2 (Table 5), and the overall
P determined from total occupancy times without correction
for missed events is Pall ¼ 1.1 (Table 5). Further, by contrast
with the results of Merzlyak and colleagues (Merzlyak et al.,
1999), who used very high PEG concentrations, we do not
find the interaction of PEG with the pore to depend on the
ionic strength of the solution.
Kinetics of PEG binding to the aHL pore
For both the short and long events, kon is strongly dependent
upon PEG mass, although koff shows only a weak de-
pendence (Tables 2 and 3). These findings are consistent
TABLE 5 Partition coefficients (P) of PEGs and cyclodextrins into wild-type and mutated aHL pores
Pore PEG or CD P1 P2 Pall sum Pall measured
WT-aHL PEG-0.94k 0.88 6 0.12 0.36 6 0.04 1.2 1.1 6 0.2
WT-aHL PEG-2.0k 0.24 6 0.06 0.13 6 0.02 0.37 0.29 6 0.03
WT-aHL PEG-3.1k 0.032 6 0.004 0.028 6 0.005 0.060 0.052 6 0.006
WT-aHL PEG-4.2k 0.012 6 0.003 0.013 6 0.002 0.025 0.021 6 0.004
WT-aHL PEG-4.6k 0.013 6 0.003 0.0083 6 0.0021 0.021 0.020 6 0.003
WT-aHL PEG-6.0k 0.011 6 0.003 0.0072 6 0.0014 0.018 0.017 6 0.003
WT-aHL bCD-1.1k 83* n.a. n.a.
M113N-aHL bCD-1.1k 8.3 3 105* n.a. n.a.
N139Q-aHL s7bCD-1.7ky 6.0 3 105z n.a. n.a.
P1 and P2 are the partition coefficients of the free PEGs into the lumen of the aHL pore for the short and long occupancy events, respectively, as derived
from the kinetic analysis. For the cyclodextrins, the overall partition coefficient is given, calculated from Kf values as described in the text. The overall
partition coefficient for the PEGs was calculated by using Pall ¼ P1 1 P2 or measured directly from the uncorrected total times in occupied and unoccupied
states.
*From Gu et al. (1999).ys7bCD is hepta-6-sulfato-bCD.zFrom Gu et al. (2001a).
TABLE 4 Partition coefficients determined from the apparent
first-order rate constants for the reaction between MePEG-OPSS
reagents and Cys-135 in L135C7 aHL pores
MePEG-OPSS* 1000 mM KCl 300 mM KCly
PEG-0.85k 0.34 6 0.06 0.32 6 0.04
PEG-1.7k 0.14 6 0.03 0.13 6 0.03
PEG-2.5k 0.069 6 0.009 0.058 6 0.008
PEG-5.0k 0.0040 6 0.0008 0.0032 6 0.0007
Values are the mean 6 SD of four experiments. The buffer solutions also
contained 10 mM Tris�HCl and 100 mM EDTA, pH 8.5. The polymer
concentration in the trans bath was 4 mM. The applied potential was �40
mV for the experiments at 300 mM KCl and 1100 mV for the experiments
at 1000 mM KCl. The partition coefficients (P) were calculated from the
reaction rates by applying a scaling law, which has been shown to apply to
the aHL pore (Movileanu and Bayley, 2001), ln k9 ¼ �Nða=DÞ5=31
ln k½PEG�sol, where k9 is the apparent first-order reaction rate constant; a,
the persistence length of the polymer (3.5 A) (Rex et al., 1998; Kienberger
et al., 2000); D, the diameter of the transmembrane barrel; k, the second-
order reaction rate constant; and [PEG]sol, the PEG concentration in the
bulk aqueous phase. The slope of a plot of ln k9 versus N was used to obtain
(a/D)5/3, which was used to obtain P for the various polymers from
P ¼ ð½PEG�aHL=½PEG�solÞ ¼ exp½�Nða=DÞ5=3�.*Mn values are given for the MePEG part of the molecules only.yThese values are from Movileanu and Bayley (2001).
906 Movileanu et al.
Biophysical Journal 85(2) 897–910
with the idea that the PEG molecules are compacted in
the transition state (or that there is a low preequilibrium
concentration of the compact form) and that there is little
interaction of the PEG with the lumenal walls of the b-barrel.
Hence, kon is highly dependent on PEG mass, because
attainment of the transition state is entropically disfavored,
although koff is independent of mass because the free energy
change required to reach the transition state reflects neither
a loosening of the structure nor dissociation from the walls.
In our previous work on the modification of cysteine
residues, we assumed that the bulk MePEG-OPSS solution is
equilibrated with the solution in the b-barrel of the aHL
pore. This assumption is now seen to be justified. The fastest
rates of reaction of MePEG-OPSS were observed at residue
117. MeOPSS-PEG-0.85 k (4 mM) reacted with an apparent
first-order rate constant of 1.2 s�1 and MeOPSS-PEG-5.0 k
(4 mM) at 0.0072 s�1. If we assume that the interactions that
lead to reaction correspond to the long binding events
(because the P-values for MeOPSS-PEG and the long events
are so similar), the data in Table 3 allow the rates of entry at
4 mM for PEG-0.94 k and PEG-4.6 k to be calculated as
150 s�1 and 1.9 s�1, respectively, far faster than the rates
of reaction.
The largest PEG used in the chemical modification
experiment was 5.0 kDa. In the present work PEG-6.0 k
was used, and in this case the P-value was higher than
predicted by the scaling law (Fig. 7). This result suggests that
no more PEG can enter the pore when the polymer size
exceeds ;5 kDa. As noted previously, the length of
a polymer in a pore (l ), arranged as a chain of blobs with
D ¼ Rblob, with an interblob distance of Rblob, is given by
(Daoud and de Gennes, 1977):
l ¼ ND�2=3
a5=3: (3)
When D is the internal diameter of the pore (20 A) and a is
the persistence length of PEG (3.5 A), Eq. 3 predicts that the
cutoff for a 60-A barrel is ;2.5 kDa. Because the experi-
mental cutoff is ;5 kDa, further elaboration of the theory to
account for this deviation will be necessary.
Comparison of the binding properties of PEGsand cyclodextrins
We have also been interested in the interaction of host
molecules such as cyclodextrins with the aHL pore (Gu et al.,
1999, 2001a,b; Gu and Bayley, 2000) and it is constructive
to compare the findings in the two areas. Although the
interactions of the PEGs have been reported as partition
coefficients, P, we have reported the binding of the cyclo-
dextrins as formation constants, Kf. For low (well below
saturating) concentrations of cyclodextrin, it can be shown
(see Online Supplement) that
P ¼ Kf ½PEG��; (4)
where [PEG]* is the effective concentration of a single
molecule within the volume contained by the b-barrel of the
aHL pore, ;0.17 M.
Using this simple relationship, we find that the P-value for
bCD and the wild-type aHL pore is 83, i.e., bCD partitions
far more strongly than the smallest PEG examined,
suggesting that it interacts with the lumenal wall of the
transmembrane b-barrel. For several mutants of aHL, P for
bCD approaches 106 (Gu et al., 1999, 2001b; see also Table
5, this article). Interestingly, for one of these, the M113N
homoheptamer, the interaction with PEG-2.0 k is not greatly
altered (L.M., unpublished data).
Previous studies of PEG interactionswith the aHL pore
Bezrukov and colleagues have investigated the interaction of
PEG with aHL in detail (Bezrukov et al., 1996; Bezrukov
and Kasianowicz, 1997; Merzlyak et al., 1999) and it is
interesting to compare their results with ours. However, it
should first be recognized that their studies were performed
at very high PEG concentrations.
Bezrukov and colleagues found that the partition co-
efficient for transfer of PEG from bulk solution to the interior
of the pore has a sharp dependence on PEG mass, which is
not consistent with scaling theory, in contrast with our results
(Bezrukov et al., 1996; Merzlyak et al., 1999; Rostovtseva
et al., 2002). We have noted that our data for the short events
do not fit the scaling prediction well and indeed show
a sharper dependence on mass than the long events.
However, the deviation is not of the magnitude noted in
the earlier work. Further, single-channel current fluctuations
in the presence of PEG suggested that PEG binds to the wall
of the lumen of the pore in 1 M KCl (Bezrukov et al., 1996),
whereas we have found no evidence for such an interaction.
At low salt concentrations, no interaction was found
(Merzlyak et al., 1999), in agreement with our observations.
In addition, the P-values quoted for aHL, a porin, and
alamethicin are low (Rostovtseva et al., 2002), which is
inconsistent with a strong interaction. Of course high
P-values cannot in any case be measured by using very
high PEG concentrations; at 20% PEG, a P of 5 would
require 100% PEG in the pore.
Several issues make it difficult to make a direct compar-
ison between our results and those obtained at higher PEG
concentrations. In particular, the properties of PEGs in
concentrated solutions change dramatically: the polymers are
less hydrated and less flexible, polymer-polymer interaction
is significant and the chains may behave like hard spheres,
rather than highly flexible coils (de Gennes, 1979; Merzlyak
et al., 1999). Another significant issue is the effect of osmotic
stress on the protein under investigation (Zimmerberg and
Parsegian, 1986).
It should also be noted that the existence of two classes of
interaction of the aHL pore with PEGs, the short and long
Polymer Partitioning into a Pore 907
Biophysical Journal 85(2) 897–910
events, would complicate the analysis of single channel
noise, which was used in some of the earlier work. Further,
both the chemical approach (Movileanu and Bayley, 2001)
and the present analysis of individual polymer interactions
permit P-values to be determined accurately for polymers
with molecular masses larger than 3 kDa for which P\0.1,
which was not possible in the earlier studies.
SUMMARY
We have shown that PEG molecules partition into the aHL
pore with a dependence on mass that is at least approximated
by a simple scaling law. Our results also indicate that the
PEGs have little interaction with the walls of the pore and
that partitioning is independent of ionic strength. These
findings differ from those obtained at high polymer
concentrations and suggest that more experimentation and
theoretical analysis will be required to understand this simple
system, which is highly relevant to several more complex
biological processes such as the translocation of nucleic
acids and polypeptides through transmembrane pores.
SUPPLEMENTARY MATERIAL
An online supplement to this article can be found by visiting
BJ Online at http://www.biophysj.org.
APPENDIX
Symbols and abbreviations
a Persistence length of the polymer
aHL a-hemolysin
cpore Polymer concentration inside the pore
csolution Polymer concentration in solution
D Diameter of the pore
fc Corner frequency
F Fractional occupancy
kon Association rate constant
koff Dissociation rate constant
Kf Equilibrium association constant
L0 Mean duration of unoccupied state
L1 Mean duration of occupied state 1
L2 Mean duration of occupied state 2
l Length of the b-barrel
MePEG-OPSS Methoxy-poly(ethylene glycol)-o-pyridyl disulfide
Mn Number-average molecular mass
Mw Weight-average molecular mass
N Number of units in polymer chain
NAV Avogadro’s number
PEG Poly(ethylene glycol)
[PEG]* Effective molar concentration of a single molecule of
poly(ethylene glycol) inside the pore
P Partition coefficient
RF Flory radius
SDS-PAGE Sodium dodecyl sulphate polyacrylamide gel
electrophoresis
Td Dead time
Toccupied Total time that the pore is occupied during a recording
time Ttotal
Tr Rise time
t Dwell time
Vbarrel Internal volume of the b-barrel
We thank Orit Braha, Li-Qun Gu, and Karl Magleby for valuable
discussions.
This work was supported by grants from the U.S. Department of Energy,
the National Institutes of Health, the Office of Naval Research (MURI-
1999), and the Texas Advanced Technology Program to H.B., and the Air
Force Office of Scientific Research (MURI-1998).
REFERENCES
Akeson, M., D. Branton, J. J. Kasianowicz, E. Brandin, and D. W. Deamer.1999. Microsecond time-scale discrimination among polycytidylic acid,polyadenylic acid and polyuridylic acid as homopolymers or as segmentswithin single RNA molecules. Biophys. J. 77:3227–3233.
Ambjornsson, T., S. P. Apell, Z. Konkoli, E. A. Di Marzio, and J. J.Kasianowicz. 2002. Charged polymer membrane translocation. J. Chem.Phys. 117:4063–4073.
Bayley, H., O. Braha, and L.-Q. Gu. 2000. Stochastic sensing with proteinpores. Adv. Matter. 12:139–142.
Bayley, H., and P. S. Cremer. 2001. Stochastic sensors inspired by biology.Nature. 413:226–230.
Berezhkovskii, A. M., and I. V. Gopich. 2003. Translocation of rodlikepolymers through membrane channels. Biophys. J. 84:787–793.
Bezrukov, S. M., and I. Vodyanoy. 1993. Probing alamethicin channelswith water-soluble polymers. Effect on conductance of channel states.Biophys. J. 64:16–25.
Bezrukov, S. M., I. Vodyanoy, and V. A. Parsegian. 1994. Countingpolymers moving through a single ion channel. Nature. 370:279–281.
Bezrukov, S. M., and I. Vodyanoy. 1995. Noise-induced enhancement ofsignal transduction across voltage-dependent ion channels. Nature.378:362–364.
Bezrukov, S. M., I. Vodyanoy, R. A. Brutyan, and J. J. Kasianowicz. 1996.Dynamics and free energy of polymer partitioning into a nanoscale pore.Macromolecules. 29:8517–8522.
Bezrukov, S. M., and J. J. Kasianowicz. 1997. The charge state of an ionchannel controls neutral polymer entry into its pore. Eur. Biophys. J.26:471–476.
Bezrukov, S. M. 2000. Ion channels as molecular Coulter counters to probemetabolite transport. J. Membr. Biol. 174:1–13.
Bhakdi, S., R. Fussle, and J. Tranum-Jensen. 1981. Staphylococcal a-toxin:oligomerization of hydrophilic monomers to form amphiphilic hexamersinduced through contact with deoxycholate micelles. Proc. Natl. Acad.Sci. USA. 78:5475–5479.
Blasi, U., and R. Young. 1996. Two beginnings for a single purpose: thedual-start holins in the regulation of phage lysis. Mol. Microbiol. 21:675–682.
Blatz, A. L., and K. L. Magleby. 1986. Correcting single channel data formissed events. Biophys. J. 49:967–980.
Boyd, R. H., R. R. Chance, and G. Ver Strate. 1996. Effective dimensionsof oligomers in size exclusion chromatography. A molecular dynamicssimulation study. Macromolecules. 29:1182–1190.
Braha, O., B. Walker, S. Cheley, J. J. Kasianowicz, L. Song, J. E. Gouaux,and H. Bayley. 1997. Designed protein pores as components forbiosensors. Chem. Biol. 4:497–505.
Carneiro, C. M. M., O. V. Krasilnikov, L. N. Yuldasheva, A. C. Campos deCarvalho, and R. A. Nogueira. 1997. Is the mammalian porin channel,VDAC, a perfect cylinder in the high conductance state? FEBS Lett.416:187–189.
908 Movileanu et al.
Biophysical Journal 85(2) 897–910
Cheley, S., O. Braha, X. Lu, S. Conlan, and H. Bayley. 1999. A functionalprotein pore with a ‘‘retro’’ transmembrane domain. Protein Sci. 8:1257–1267.
Cifra, P., and T. Bleha. 2001. Partition coefficients and the free energy ofconfinement from simulations of nonideal polymer systems. Macro-molecules. 34:605–613.
Colquhoun, D., and F. J. Sigworth. 1995. Fitting and statistical analysis ofsingle channel records. In Single-Channel Recording. Plenum Press,New York.
Daoud, M., and P.-G. de Gennes. 1977. Statistics of macromolecularsolutions trapped in small pores. J. Physique. 38:85–93.
de Gennes, P.-G. 1979. Scaling Concepts in Polymer Physics. CornellUniversity Press, Ithaca, NY .
de Gennes, P.-G. 1999a. Flexible polymers in nanopores. Adv. Polym. Sci.138:91–105.
de Gennes, P.-G. 1999b. Passive entry of DNA molecule into a small pore.Proc. Natl. Acad. Sci. USA. 96:7262–7264.
Deamer, D. W., and M. Akeson. 2000. Nanopores and nucleic acids:prospects for ultrarapid sequencing. Trends Biotechnol. 18:147–151.
Deamer, D. W., and D. Branton. 2002. Characterization of nucleic acids bynanopore analysis. Acc. Chem. Res. 35:817–825.
Dhara, D., and P. R. Chatterji. 1999. Electrophoretic transport ofpoly(ethylene glycol) chains through poly(acrylamide) gel. J. Phys.Chem. B. 103:8458–8461.
Gedde, U. W. 1995. Polymer Physics. Chapman & Hall, London, UK.
Gomis-Ruth, F. X., G. Moncalian, R. Perez-Luque, A. Gonzalez, E.Cabezon, F. de la Cruz, and M. Coll. 2001. The bacterial conjugationprotein TrwB resembles ring helicases and F1-ATPase. Nature. 409:637–641.
Gorbunov, A. A., and A. M. Skvortsov. 1995. Statistical properties ofconfined molecules. Adv. Coll. Interf. Sci. 62:31–108.
Gouaux, E. 1998. a-Hemolysin from Staphylococcus aureus: an archetypeof b-barrel, channel-forming toxins. J. Struct. Biol. 121:110–122.
Gu, L.-Q., O. Braha, S. Conlan, S. Cheley, and H. Bayley. 1999. Stochasticsensing of organic analytes by a pore-forming protein containinga molecular adapter. Nature. 398:686–690.
Gu, L.-Q., and H. Bayley. 2000. Interaction of the non-covalent molecularadapter, b-cyclodextrin, with the staphylococcal a-hemolysin pore.Biophys. J. 79:1967–1975.
Gu, L.-Q., S. Cheley, and H. Bayley. 2001a. Capture of a single molecule ina nanocavity. Science. 291:636–640.
Gu, L.-Q., S. Cheley, and H. Bayley. 2001b. Prolonged residence time ofa noncovalent molecular adapter, b-cyclodextrin, within the lumen ofmutant a-hemolysin pores. J. Gen. Physiol. 118:481–494.
Hanke, W., and W.-R. Schlue. 1993. Planar Lipid Bilayers. AcademicPress, London.
Henrickson, S. E., M. Misakian, B. Robertson, and J. J. Kasianowicz. 2000.Driven DNA transport into an asymmetric nanometer-scale pore. Phys.Rev. Lett. 85:3057–3060.
Howorka, S., L. Movileanu, X. Lu, M. Magnon, S. Cheley, O. Braha, andH. Bayley. 2000. A protein pore with a single polymer chain tetheredwithin the lumen. J. Am. Chem. Soc. 122:2411–2416.
Howorka, S., L. Movileanu, O. Braha, and H. Bayley. 2001a. Kinetics ofduplex formation for individual DNA strands within a single proteinnanopore. Proc. Natl. Acad. Sci. USA. 98:12996–13001.
Howorka, S., S. Cheley, and H. Bayley. 2001b. Sequence-specific detectionof individual DNA strands using engineered nanopores. Nat. Biotechnol.19:636–639.
Howorka, S., and H. Bayley. 2002. Probing distance and electrical potentialwithin a protein pore with tethered DNA. Biophys. J. 83:3202–3210.
Jeppesen, C., J. Y. Wong, T. L. Kuhl, J. N. Israelachvili, N. Mullah, S.Zalipsky, and C. M. Marques. 2001. Impact of polymer tether length onmultiple ligand-receptor bond formation. Science. 293:465–468.
Johnson, A. E., and M. A. van Waes. 1999. The translocon: a dynamicgateway at the ER membrane. Annu. Rev. Cell Dev. Biol. 15:799–842.
Kasianowicz, J. J., E. Brandin, D. Branton, and D. W. Deamer. 1996.Characterization of individual polynucleotide molecules using a mem-brane channel. Proc. Natl. Acad. Sci. USA. 93:13770–13773.
Kasianowicz, J. J., S. E. Henrickson, H. H. Weetall, and B. Robertson.2001. Simultaneous multianalyte detection with a nanometer-scale pore.Analyt. Chem. 73:2268–2272.
Kienberger, F., V. P. Pastushenko, G. Kada, H. J. Gruber, C. Riener, H.Schindler, and P. Hinterdorf. 2000. Static and dynamical properties ofsingle poly(ethylene glycol) molecules investigated by force spectros-copy. Single Mol. 1:123–128.
Kong, C. Y., and M. Muthukumar. 2002. Modeling of polynucleotidetranslocation through proteins and nanotubes. Electrophoresis. 23:2697–2703.
Korchev, Y. E., G. M. Alder, A. Bakhramov, C. L. Bashford, B. S. Joomun,E. V. Sviderskaya, P. N. R. Usherwood, and C. A. Pasternak. 1995.Staphylococcus aureus alpha-toxin-induced pores: channel-like behaviorin lipid bilayers and patch clamped cells. J. Membr. Biol. 143:143–151.
Krasilnikov, O. V., R. Z. Sabirov, V. I. Ternovsky, P. G. Merzliak, andJ. N. Muratkhodjaev. 1992. A simple method for the determination ofthe pore radius of ions channels in planar lipid bilayer membranes.FEMS Microbiol. Immunol. 105:93–100.
Laemmli, U. K. 1970. Cleavage of structural proteins during the assemblyof the head of bacteriophage T4. Nature. 227:680–685.
LeDuc, P., C. Haber, G. Bao, and D. Wirtz. 1999. Dynamics of individualflexible polymers in a shear flow. Nature. 399:564–566.
Liu, L., P. Li, and S. A. Asher. 1999. Entropic trapping of macromoleculesby mesoscopic periodic voids in a polymer hydrogel. Nature. 397:141–144.
Lubensky, D. K., and D. R. Nelson. 1999. Driven polymer translocationthrough a narrow pore. Biophys. J. 77:1824–1838.
Madden, J. C., N. Ruiz, and M. Caparon. 2001. Cytolysin-mediatedtranslocation (CMT): a functional equivalent of type III secretion ingram-positive bacteria. Cell. 104:143–152.
Marziali, A., and M. Akeson. 2001. New DNA sequencing methods. Ann.Rev. Biomed. Eng. 3:195–223.
McManus, O. B., A. L. Blatz, and K. L. Magleby. 1987. Sampling, logbinning, fitting, and plotting durations of open and shut intervals fromsingle channels and the effects of noise. Pflugers Arch. 410:530–553.
McManus, O. B., and K. L. Magleby. 1988. Kinetic states and modesof single large-conductance calcium-activated potassium channels incultured rat skeletal muscle. J. Physiol. 402:79–120.
Meller, A., L. Nivon, E. Brandin, J. Golovchenko, and D. Branton. 2000.Rapid nanopore discrimination between single polynucleotide molecules.Proc. Natl. Acad. Sci. USA. 97:1079–1084.
Meller, A., L. Nivon, and D. Branton. 2001. Voltage-driven DNAtranslocations through a nanopore. Phys. Rev. Lett. 86:3435–3438.
Meller, A., and D. Branton. 2002. Single molecule measurements of DNAtransport through a nanopore. Electrophoresis. 23:2583–2591.
Menestrina, G. 1986. Ionic channels formed by Staphylococcus aureusalpha-toxin: voltage-dependent inhibition by divalent and trivalentcations. J. Membr. Biol. 90:177–190.
Merzlyak, P. G., L. N. Yuldasheva, C. G. Rodrigues, C. M. M. Carneiro,O. V. Krasilnikov, and S. M. Bezrukov. 1999. Polymeric nonelectrolytesto probe pore geometry: application to the a-toxin transmembrane chan-nel. Biophys. J. 77:3023–3033.
Montal, M., and P. Mueller. 1972. Formation of bimolecular membranesfrom lipid monolayers and study of their electrical properties. Proc. Natl.Acad. Sci. USA. 69:3561–3566.
Movileanu, L., S. Howorka, O. Braha, and H. Bayley. 2000. Detectingprotein analytes that modulate transmembrane movement of a polymerchain within a single protein pore. Nat. Biotechnol. 18:1091–1095.
Movileanu, L., S. Cheley, S. Howorka, O. Braha, and H. Bayley. 2001.Location of a constriction in the lumen of a transmembrane pore by
Polymer Partitioning into a Pore 909
Biophysical Journal 85(2) 897–910
targeted covalent attachment of polymer molecules. J. Gen. Physiol.117:239–251.
Movileanu, L., and H. Bayley. 2001. Partitioning of a polymer intoa nanoscopic protein pore obeys a simple scaling law. Proc. Natl. Acad.Sci. USA. 98:10137–10141.
Muthukumar, M. 1999. Polymer translocation through a hole. J. Chem.Phys. 111:10371–10374.
Muthukumar, M. 2001. Translocation of a confined polymer through a hole.Phys. Rev. Lett. 86:3188–3191.
Muthukumar, M. 2002. Theory of sequence effects on DNA translocationthrough proteins and nanopores. Electrophoresis. 23:1417–1420.
Nakane, J., M. Akeson, and A. Marziali. 2002. Evaluation of nanopores ascandidates for electronic analyte detection. Electrophoresis. 23:2592–2601.
Parsegian, V. A., S. M. Bezrukov, and I. Vodyanoy. 1995. Watching smallmolecules move: interrogating ionic channels using neutral solutes.Biosci. Rep. 15:503–514.
Rex, S., M. J. Zuckermann, M. Lafleur, and J. R. Silvius. 1998.Experimental and Monte Carlo simulation studies of the thermodynamicsof polyethylene glycol chains grafted to lipid bilayers. Biophys. J. 75:2900–2914.
Rostovtseva, T. K., E. M. Nestorovich, and S. M. Bezrukov. 2002.Partitioning of differently sized poly(ethylene glycol)s into OmpF porin.Biophys. J. 82:160–169.
Salman, H., D. Zbaida, Y. Rabin, D. Chatenay, and M. Elbaum. 2001.Kinetics and mechanism of DNA uptake into the cell nucleus. Proc. Natl.Acad. Sci. USA. 98:7247–7252.
Slater, G. W., S. Guillouzic, M. G. Gauthier, J.-F. Mercier, M. Kenward,L. C. McCormick, and F. Tessier. 2002. Theory of DNA electrophoresis.Electrophoresis. 23:3791–3816.
Smith, D. E., H. P. Babcock, and S. Chu. 1999. Single-polymer dynamicsin steady shear flow. Science. 283:1724–1727.
Song, L., M. R. Hobaugh, C. Shustak, S. Cheley, H. Bayley, and J. E.Gouaux. 1996. Structure of staphylococcal a-hemolysin, a heptamerictransmembrane pore. Science. 274:1859–1865.
Strobl, G. 1997. The Physics of Polymers, 2nd Ed. Springer, Berlin.
Sung, W., and P. J. Park. 1996. Polymer translocation through a pore ina membrane. Phys. Rev. Lett. 77:783–786.
Vercoutere, W., S. Winters-Hilt, H. Olsen, D. Deamer, D. Haussler, and M.Akeson. 2001. Rapid discrimination among individual DNA hairpinmolecules at single-nucleotide resolution using an ion channel. Nat.Biotechnol. 19:248–252.
Vercoutere, W., and M. Akeson. 2002. Biosensors for DNA sequencedetection. Curr. Opin. Chem. Biol. 6:816–822.
Vercoutere, W. A., S. Winters-Hilt, V. S. DeGuzman, D. Deamer, S. E.Ridino, J. T. Rodgers, H. E. Olsen, A. Marziali, and M. Akeson. 2003.Discrimination among individual Watson-Crick bases pairs at the terminiof single DNA hairpin molecules. Nucleic Acids Res. 31:1311–1318.
Vodyanoy, I., and S. M. Bezrukov. 1992. Sizing of an ion pore by accessresistance measurements. Biophys. J. 62:10–11.
Walker, B. J., M. Krishnasastry, L. Zorn, J. J. Kasianowicz, and H. Bayley.1992. Functional expression of the a-hemolysin of Staphylococcusaureus in intact Escherichia coli and in cell lysates. J. Biol. Chem.267:10902–10909.
Wang, H., and D. Branton. 2001. Nanopores with a spark for single-molecule detection. Nat. Biotechnol. 19:622–623.
Winters-Hilt, S., W. Vercoutere, V. S. DeGuzman, D. Deamer, M. Akeson,and D. Haussler. 2003. Highly accurate classification of Watson-Crickbasepairs on termini of single DNA molecules. Biophys. J. 84:967–976.
Wong, J. Y., T. L. Kuhl, J. N. Israelachvili, N. Mullah, and S. Zalipsky.1997. Direct measurement of a tethered ligand-receptor interactionpotential. Science. 275:820–822.
Zimmerberg, J., and V. A. Parsegian. 1986. Polymer inaccessible volumechanges during opening and closing of a voltage-dependent ionicchannel. Nature. 323:36–39.
Zimmerman, S. B., and L. D. Murphy. 1996. Electrophoresis of poly-ethylene glycols and related materials as sodium dodecyl sulfate com-plexes. Anal. Biochem. 234:190–193.
910 Movileanu et al.
Biophysical Journal 85(2) 897–910


