Embed Size (px)
Citation preview
Vidyabharati International Interdisciplinary Research Journal (Special Issue) ISSN 2319-4979
Special Issue on Engineering Technologies and Management 3722
DEATH AND DEATH DRIVE: AN ELUCIDATION OF THE FREUDIAN THEORY
THROUGH THE POEM “THE TWINS” BY CHARLES BUKOWSKI.
P.Priyanga1, Dr.A.Selvaraj2*
1Research scholar, Department of English, Annamalai University, Chidambaram.
Email address: [email protected] 2Professor, Department of English, Annamalai University, Chidambaram.
Email address: selva_1963@rediffmail
ABSTRACT John Martin, Founder of the Black Sparrow Press, once told, ‘Bukowski hated any kind of dishonesty. He hated deceit.’
One cannot agree with the poetry of Charles Bukowski without understanding the truth that his is an extremely
idiosyncratic, honest and autobiographical poetry. Bukowski inflects from being melancholic to angry and sometimes
being funny and invariably humorous but always finds hope and beauty even in a desolated situation. In all his works
Bukowski is more obsessive to point out his unhappy childhood with his parents. He believes that his strict parents are
the ground cause for all his anger. This article probes the death drive of Bukowski through the death of his father,
whom he hated with passion. The poem “the twins” unravels the repressed emotional state of Bukowski through the
psychological phenomena, Repetition Compulsion. Bukowski replicates (repeats) the death of his father through dead
and living symbols which is merely Life Instincts (Eros) and Death Instincts (Thanatos). The repressed traumatic
experiences do not forbid to repeat the repressed substance as a present-day experience, rather than an episode within
the past. Sigmund Freud considered that dreams are one of the ways to peek into a person’s unconscious mind.
Repressed feelings may turn up in the fears, anxieties, and desires that a person undergoes in the dreams. Dreams are
an outlet for the unconscious mind. Instead of dreams, Bukowski’s outlet of repressed emotions is writing poetry. The
repressed emotions converge into a repetitive compulsion and take an obvious turn into the death drive.
Key Words: Repression, Unconscious, Death Drive, Dreams
“the twins” is a forty-three-line poem written
in free verse and barely divided into four
parts, within which there are discrete stanzaic
forms. The title does not refer to a direct
meaning of the substance of the poem;
instead, it facilitates an unanticipated
understanding in the last quarter, that the “the
twins” alluded to are literally the poet and the
poet’s father. The poem is a transition from a
habitual animosity towards his father to an
exalted inner proclamation of dispensed
humanity and mortality.
The majority of what Bukowski wrote
was from his childhood. They had an
influence in all his poems. Bukowski always
had repercussions with his father. Life with
his father was miserable when they moved to
2122 Longwood Avenue, what Bukowski
later called, ‘the house of agony, the house
where I almost done in’. All the terrible
incidents happened to Bukowski with his
father started at this home. The anger loomed
up when the situations got worse between the
father and the son. They brawled because of
the lack of mutual social exchange. It is his
father’s snobbery that irritated Bukowski
from his early days. He enrolled Bukowski to
a high class school in LA to fulfill his social
fantasy. Though they had significantly less
money, they joined Bukowski to the school
for bragging around the neighbors.
The anger gets activated when the
perceiver believes there is an unfair treatment
of work, when the person’s interests is not
been respected, when not heard and when
they are devalued for their actions. These
social emotions personate a person’s behavior
from the early childhood stage to the
adolescent stage. Bukowski repressed all
these anger since he was child and these
remained as domination in his future life.“A
string of reproaches against other people
leads one to suspect the existence of a string
of self-reproaches with the same content”
(Freud 1997).
It is Bukowski’s unconscious
cognitive response to anger pushes the ordeal
to repetitive compulsion. Bukowski and his
father often rebuke at each other adversely
for petty things. Bukowski’s father was not
diligent towards Bukowski, and, thus he
inscribes his father as a cruel person and his
childhood as ‘a twisted childhood’ in all his
works and interviews. Later, he poured out
his anger and wrote serious poems on his
father whom he hated with passion.
“the twins” establishes one of the
supreme motifs in Bukowski’s poems - the
fugacious nature of life and the
Vidyabharati International Interdisciplinary Research Journal (Special Issue) ISSN 2319-4979
Special Issue on Engineering Technologies and Management 3723
overemphasized import which human beings
adhere to ephemera. The free verse in the
poem helps the poet at ease to flourish all his
ideas and does not force him into a
preplanned metrical pattern. The opening
section of the poem illustrates a sick and tired
argument, one that has been walked through
life and it is crammed together in a rush of
prose. The nature of free verse is relatively
fluid and that aids the poet to disclose the
grief uncontrollably from anger to remorse.
The inclination ensues as a deference when
the death of his father drives his transcience.
Generally, readers will perceive a
usual detachment between the parent and the
child, whereas, the father and son, here,
reproach at each other for not respecting each
other’s values. Bukowski’s father has never
been satisfied with Bukowski. He searches
fault in all his routines and end up battering
and bruising him with leather belt.
Seemingly, they hated each other. He harks
back the problematic memories with his
father in the first stanza of the poem after his
death. The commencing of the poem does not
sound lamenting to his father death instead a
revival of his dissimilarity with his father.
This subsides in the end of the poem. Also,
this recollection reminds the readers about the
complexity and diversity between them.
I told him to listen
to Brahms, and I told him to learn to
paint and
drink and not be
dominated by women and dollars
but he screamed at me, For Christ’s
sake
remember your mother,
remember your country,
you’ll kill us all!...(Bukowski 2016)
Bukowski was into virtuosity and his
father was into didactics. He wished his father
was less somber and enjoyed music and life.
His father lived a life of snoberry and always
had an aim to satisfy the social fantasy among
the elitists. Bukowski backed off this attitude,
instead, he censured at these pompous people.
Bukowski resented his father only in his
poems and novels and had not confronted him
in real. This because his parents had clutches
over him for years. Also he was not rebel,
initially. “The only time he felt safe was
when he was alone in his bedroom, lying on
the counterpane, following the patterns of the
sunlight on the ceiling.” (Bukowski ,1998.)
Freud believed that it is the
unconscious mind that has a powerful
influence on the personality and could
possibly lead to psychological discomfort.
Bukowksi’s childhood events had grounds on
his psychological distress. He repressed those
emotions in his unconscious mind and
divulged it in his writing. He used poetry as
an outlet to let his fear, anger and desires into
words.
The past tense, used in the first stanza
bears out the poet’s memory of the problem
with his father. The remaining stanzas are
written in the present tense, which holds up
the here and now of his conscientious
inspection of his father’s personal effects.
I move through my father’s house
(on which he
owed me $8000 after 20
years on the same job) and look at
his dead
shoes
the way his feet curled the leather,
as if he was
angrily planting roses,
and he was, and I look at his dead
cigarette, his
last cigarette (Bukowski 2016)
In the upcoming part itself, the poet
unfolded his grief for his father’s death by an
act of perusal. Bukowski examined the
belongings of his father and endures a
separation of life from the object, thereby
mentions, “dead shoes”, “dead cigarette, his
last cigarette.” Also, he informs the readers
that his death was not miserable. The angry
face of his father sustained in his memory
even after his death. The poet doesn’t seem to
be bothered about the rhymed pattern, but the
poet minds the rhythm and stress which
impede the narrative without leaving it as a
prose.
The ego of the poet impoverishes and
there is complete loss of anger when the poet
devolves his anger into grief. Freud revised
this as a precipitate of abandoned object-
cathexis in his writings in The Great War and
in the ego and the Id.
Vidyabharati International Interdisciplinary Research Journal (Special Issue) ISSN 2319-4979
Special Issue on Engineering Technologies and Management 3724
When the poet took a stroll throughout
the house, the subdued guilt of him in the past
takes a slot. The transformation of the poet’s
resentment on his father to goodwill gives a
cue to the readers to explore Bukowski’s
unconsciousness. He turns up to mourn for
his father’s death after a tired argument of the
past and faces his own mortality in the
present. In the upcoming stanzas the poet sees
the striking reality of death.
the last bed he slept in
that night, and I feel
I should remake it
but I can’t, for father
is always your master
even when he’s gone;
(Bukowski 2016)
Bukowski reconciles the basic bond
between his father and him by harmonizing
“a father is always a master even when he’s
gone.” The poet faces up his mortality the
second time, when he consoled himself the
manners of his father’s death. He is heartened
that the way his father’s death happened was
not that pathetic unless it happens to him.
Freud affirms that the repetition
compulsion is more instinctual than the
pleasure principle and that the expressions of
the repetition compulsion exhibit to a high
degree as instinctual character. Bukowksi
instinct reminds him of the mortality after
encountering his father’s death. “Our views
have from first been dualistic, and to-day they
are even more definitely dualistic than
before now that we describe the opposition as
being, not between ego-instincts and sexual
instincts but between life instincts and death
instincts” (Freud 1920)
to die on a kitchen
floor at 7’0 clock in the
morning
while other people are
frying eggs
unless it happens to
you (Bukowski 2016)
Bukowski couldn’t stand the grief
even though the traumatic events supervened
him consciously. This pattern of repeating the
behavior and reenacting endlessly are the key
component of death drive. Bukowski reenacts
the harrowing experience which evokes his
unconscious desire to die. The latter, came up
with the cpmpulsion of death and hence, the
poem takes an elegiac form- a bereavement of
grief and a desire of an easeful death.
The displeased events inside the home
suffocates Bukowski and sends him outdoors
to examine life he had with his father outside
the house.
I go outside and pick
an orange and peel back
the bright skin;
things are still living:
the grass is growing quite
well,
the sun sends down its
rays circled by a Russian
satellite,
a dog barks senselessly
somewhere, the
neighbors peek behind
blinds. (Bukowski 2016)
He picks an orange, remarks the
growing grass, a barking dog and people peep
surreptitiously at him which connotes he is
an alien to that place. The event took place in
the present but there is a tinge of anecdotes
connected to it. In his preteen days,
Bukowski’s father would order to him to cut
and manicure the lawns ‘perfectly’. If his
father finds even a single grass ‘sticking up’,
he would bash his legs with belt. And
Bukowski had this inevitable punishment as a
boy. The failure of doing any job ‘perfectly’
impacted his mind and behavior. Also to note
Bukowski worked on several jobs and the
boss would treat him like his father.
Consequently, he collapsed in all the jobs he
worked.
Bukowski knew these episodes in his
childhood would hit him aftermath. But a
conundrum arises to the readers whether he
used the defensive mechanism to repress the
horrifying incidents from his consciousness
or sublimed it for good. Freud sums this as
Retrieval-induced forgetting. It happens when
recalling certain memories that induce the
correlated information to be forgotten. So
reiterating some memories forces the opposite
memories to be inaccessible. Disturbing or
unpleasant memories will be forgotten by
salvaging more helpful ones to the conscious.
At the moment Bukowski needed to grieve
for his father’s death. The death-drive inside
Vidyabharati International Interdisciplinary Research Journal (Special Issue) ISSN 2319-4979
Special Issue on Engineering Technologies and Management 3725
him constantly pushes his self to connect with
the distressing events. Initially, Bukowski
antagonized his father but led up to
befriending him. Bukowski reexperiences the
disassociated events and the instinctual
conflicts of the past and connects it with the
reality. Freud wrote:
The patient cannot remember
the whole of what is repressed
in him, and what he cannot
remember may be precisely
the essential part of it. He is
obliged to repeat the repressed
material as a contemporary
experience instead of
remembering it something in
the past. (Freud 1920)
The repressed material here would be
the death-drive which rushes into a narrative
of associating himself with a dead man. The
third part continues and Bukowski now
totally slided towards his father. The
estranged son’s honor as a rogue preceded
him, for he finds himself as an uncanny
person around the neighborhood.
and they say he left
it all to some women
in Duarte, but I don’t
give a damn- she can have
it; he was my old
man
and he died (Bukowski
2016)
Bukowski in these lines unveils the
honest affection on his father, “for a father is
always your master even when he’s gone”,
“he was my old man and he died”. Between
these lines, Bukowski notices the striking
reality. Being a loner and living a recluse life,
Bukowski takes liberty on his father. This
filial regard is one of the few authenticities in
life.
The last part of the poem, allude to the title of
the poem, “the twins.”
“inside, I try on a light blue
suit
much better than anything I
have ever worn
and I flap the arms like a
scarecrow in the win
but it’s no good:
I can’t keep him alive
no matter how much we hated
each other. (Bukowski 2016)
`Bukowski finds his father’s light blue
suit and tries it on him. There is an
resemblance of his father outside(body) but
not inside(personality). He stood like
scarecrow like his dead father. Even though
he looked alike in the coat, like a twin, they
couldn’t find similarities. This coerces the old
and new; the traditional and the
contemporary. The animosity towards his
father has diluted to an extent that he desires
an easeful death like him. Bukowski uses
“dead” symbols to exemplify this mortality.
The poem doesn’t begin as
lamentation for dead person, instead, the
poem The poem is an modern Elegy, a
modern representation of the ancient form.
The common attribute of an Elegy is
mourning the loss of a loved one as observed
in John Milton’s “Lycidas”. An Elegy often
contemplates the justice of the loss, the
transient life of the poet, and it restates solace
in distress; often the afterlife, as seen in
P.B.Shelly’s “Adonais” (1821) and
A.L.Tennyson’s “In Memorium” (1850) is
disposed. But it has already been noted that
Bukowski laments the death of his father and
only confronts ho own mortality. What of
justice and solace, though?
“In Memorium”, Tennyson
sympathized himself by perpetuating his faith
on God, who was made obscure now by the
development of Science and Technology. In
Bukowski’s world there is Supreme Being.
He seeks solace in life, itself, in the bright
skin of an orange, growing grass, barking
dogs and in the rays of the sun and in any
living things. “The opposition between the
ego or death instincts and the sexual or life
instincts would then cease to hold and the
compulsion to repeat would no longer possess
the importance we have ascribed to it” (Slade
2017). The sun supports life and is in no risk
of receding from the Universe. The satellite,
however was the greatest invention in the
nineteenth century, the age of the Industrial
and Scientific revolutions that so appalled
Tennyson. One century later, Bukowski seem
to be the literary heir of Tennyson. The lines
of the last stanza shortens relentlessly
revealing the ultimate intention of the poet.

Vidyabharati International Interdisciplinary Research Journal (Special Issue) ISSN 2319-4979
Special Issue on Engineering Technologies and Management 3726
very well. Grant us this
moment: standing before a mirrorin my dead
father’s suit waiting alsoto die. (Bukowski
2016)
The import of death drive and of the
repetition compulsion shows up when literary
texts repeat specific signs and symbols and
when these signs and symbols employs the
idiosyncrasies that suggests there is nothing
beyond the sign or symbol. “grant us this
moment”, Bukowski asserts this to the
universe. Beholding in the mirror at the twins,
the grotesque image of himself in his father’s
suit, the poet is waiting to die. The death
drive is death become a certainty and a
fortitude. In the clutch of the repetitive
compulsion, the subject is in a condition of
passivity where the poet’s representation
disappears and the character becomes a
character who is, possibly, dead already and
who wishes nothing but death.
Works Cited
1. Bukowski, Charles. (1960). Flower, Fist,
and Bestial Wail. Hearse Press,
California.
2. Freud, Sigmund. (1920). Beyond the
Pleasure Principle. Dover Publications,
New York.
3. ---.(1997). Dora: An Analysis of a Case of
Hysteria. Touchstone Publications, New
York.
4. Slade, Andrew. (2017) Psychoanalytic
Theory and Criticism: By Way of an
Introduction to the Writings of Sigmund
Freud. Orient Black Swan.Delhi.
5. Sounes, Howard. (1998) Charles
Bukowski: Locked in the Arms of a Crazy
Life. Grove Press,New York.
Vidyabharati International Interdisciplinary Research Journal (Special Issue) ISSN 2319-4979
Special Issue on Engineering Technologies and Management 3727
PRACTICE OF WOMEN RIGHTS AMONG WOMEN EMPLOYEES IN UNORGANIZED
SECTORS IN ARAVAKURICHY TALUK, KARUR DISTRICT
Dr. M. Dhamodharan
Assistant Professor, Department of Sociology, Annamalai University, Annamalai Nagar
ABSTRACT Women constitute half of the segment of population in India and can not be afforded to be kept out of the mainstreams.
Most of the women live in rural areas and 27 per cent of the rural women live below the poverty line. Secondly women
are vital and productive workers in India’s national economy and make one third of the labour force. Thirdly the
poorer family, the greater is the dependence on the women’s economic productivity, enhancing women’s economic
welfare of 60 million Indian households below the poverty line fourthly there is a significant gap between women’s
especially rural women’s potentiality and actual productivity. The present study aims to find out the Practice of Women
Rights among Women Employees in Unorganized Sectors in Aravakurichy Taluk, Karur District. A samples of 100
respondents selected randomly were studied. A questionnaire method of survey was used to find out the Practice of
Women Rights among Women Employees in Unorganized Sectors. The data were collected by using questionnaire as
an instrument. Percentage analysis, cross tabulation was applied in the present study. The findings and observations
are the result and outcome of the interpretations made during the study of analysis.
Key words: Women Rights, Women employees, Unorganized sectors and demographic variables
INTRODUCTION
During early vedic period women
used to participate in many religious
sacraments, especially, the yagya could not be
performed until the wife accompanied the
husband. There was the custom of
swayambara in royal families, where bride
used to choose her husband from a galaxy of
suitors.
During the past two decades,
empowerment practice in the human services
has emerged from efforts to develop more
effective and responsive service for women,
people of colour and other oppressed groups.
The goal of this method of practice is to
address the role powerlessness plays in
creating and perpetuating personal and social
problems. It can be distinguished by its focus
on developing critical awareness, increasing
feelings of collective and self-efficacy and
developing skills for personal, interpersonal,
or social change. Within our increasingly
diverse. Society, empowerment has emerged
as one perspective or practice that can be
inclusive and supportive of diversity.
Equality and empowerment of women
are necessary to bring about the egalitarian
human society. Societies cannot succeed by
suppressing the talents of half of their
members. Promoting gender equality and
empowerment of women was declared as an
important millennium development goal
adopted by the millennium summit held in
New York in September 2010.
As in other parts of the world there are
large disparities in the economic, social and
political opportunities available to men and
women in India. Gender discrimination begin
early in life, with female infants having a
lower chance of survival owing largely to
parental neglect. The discrimination
continues as the female child grows over first
in the form of smaller rations of food and
nutrition and later in the form of fewer
schooling opportunities as compared to boys.
As women enter the labour force, they face
discrimination in the labour market as well,
primarily in the form of lower wages.
In 2010, the committee on the status
of women produced a significant document,
highlighting women’s declining status, role
and participation. The report revealed that
majority of women in India did not enjoy the
rights and opportunities guaranteed to them
by the constitution. The socio-cultural setting
restricted her role in the family and the
society and kept her in the backwaters of
politics.
The national perspective plan 2005-
2010 clearly admits that the development
policies have failed to give justice to women.
Laws, education, health, family planning and
communication all reveal a sexist bias. The
plan acknowledges the necessity to get her
Vidyabharati International Interdisciplinary Research Journal (Special Issue) ISSN 2319-4979
Special Issue on Engineering Technologies and Management 3728
more space and create an egalitarian social
structure.
Women will given empowerment only
when both men and women recognize that
women should be respected and society
should contribute to empower them when all
men and women respect women and accept
their contributions whole heartedly there is no
doubt that women will gain momentum for
empowerment.
The term empowerment of women has
been used at different times under different
circumstances to mean different things for
some it implied imparting of skills to enable a
women to be economically independent. In
other cases it has been taken to mean
assertion to her human rights. In yet another
situation it has implied political participation
for political empowerment.
The impact of women in politics is
mixed. Though improved status can be visible
in certain respects, overall their situation is
not good. The status of women varies
enormously from the part of India to another.
Discrimination on the ground of sex is visible
on the status of girl children, continuing
practice of dowry and dowry killings, on the
area of health, education and political
representation.
In India Empowerment of Women is
not so easy. There is no easy solution also.
The real solution will be a holistic approach
that should be dealt with all major interrelated
issues of social and economic, justice, health
and tradition. So for such change women
should be self-equipped, have knowledge and
ability to handle self and surroundings.
Women will gain empowerment only
when both men and women recognize that
women should be respected and the society
should contribute to empower them when all
men and women respect women and accept
their contributions whole heartedly there is no
doubt that women will gain momentum for
empowerment.
Women Empowerment can be viewed
as a continuum of several interrelated and
mutually reinforcing components.
Awareness building about women’s
situation, discrimination and rights and
opportunities as a set towards gender
equality. Collective awareness building
provides a sense of group identify and the
power of working as a group.
Capacity building and skills
developments, especially the ability to
plan, make decision, organize, manage
and carry out activities to deal with
people and institutions in the World
around them.
Participation and greater control and
decision-making power in the home,
community and society.
Action to bring about greater equality
between men and women.
Social Empowerment
Social empowerment means equal
status, participation and power of decision
making at the household level and also at the
community and village level. Social
empowerment of women enables them to
participate in the decision making process in
democratic institutions. The members of the
Self Help Groups are persuaded to attend the
self help group meetings regularly. The
women those who rarely come out of their
houses slowly begin to enjoy the gatherings
and start participating in the discussion about
financial matters, health and family problems.
In the end it leads them to discuss about
politics too. This awareness which is
unknown to the poor rural women till now,
leads to social empowerment.
Economic Empowerment
Economic Empowerment is the initial
aspect of women development and greater
access to financial resources inside and
outside the household, reducing vulnerability
of poor women to crisis situation like famine,
flood, riots, death and accidents in the family
and significant increase in women’s own
income. It gives women the power to retain
income and use it at her discretion. It
providers equal access and control over
Vidyabharati International Interdisciplinary Research Journal (Special Issue) ISSN 2319-4979
Special Issue on Engineering Technologies and Management 3729
various resources at the household level.
Financial self-reliance of women both in the
household and in the external environment
lead to empowerment of women in other
spheres.
Political Empowerment
Empowerment of women in all
spheres in particular the political sphere is
crucial for their advancement and foundation
of a gender equal society. It is central to the
achievement of the goals of equality,
development and peace. Women’s political
empowerment is premised on three
fundamental and non-negotiable principles (a)
The equality between women and men (b)
Women’s rights to the full development of
their potential (c) Women’s right to self-
representation and self determination. In
empowerment the key indeed is ‘power’. It is
power to ‘access’, ‘control’ and make
‘informed choices’.
REVIEW OF LITERATURE
Tapan, Neeta (2010) has revealed in
her study need for women empowerment for
that certain hindrances that come in the way
of female literacy are poverty, early marriage,
household work, social traditions, distantly
located schools, etc. These impediments are
responsible for non-enrolment and dropouts
of girls from schools. Empowerment of
women would not be possible unless they are
properly educated.
Singh, O.R. (2011) conducted study
on education and women empowerment and
pointed out that empowerment of women
rough law is no doubt necessary but for the
improvement of the status of the women,
change in the attitudes and roles of both men
and women are essential. If women are
mightily educated they can contribute to
economic growth and development in all
spheres. Several factors, such as ignorance,
economic dependency and lack of organized
effort hinder women from realizing their
potentiality in the society. Women can
harness community resources for general
well-being provided they are empowered in
the right direction.
Prabhar Vani (2014) made a study
“Women in Rural India” and stated that
women's dependent position is the result of a
rigid distinction between men's role and
women's role in the society. This leads to
exploitation of women. In rural areas, they
are the landless agricultural labourers
members of family with uneconomic
holdings, traditional menial servants and
workers in traditional village and cottage
industries. According to the author "what
needed is awareness generation in women,
their mobilization and training for their new
political roles. They have to know about
themselves, their rights, nature of their
political system, the myriad problems facing
the country, the political process through
which decisions are made and policies
formulated.
Arundhabti Chattopadhyay (2015) has
discussed in his article Women an
Entrepreneurship that social empowerment
of women is a long and difficult process, as it
requires a change in the mindset of the
people. Entrepreneurship development among
women case be considered a possible
approach to economic empowerment of
women. This will also uplift her social shows
significantly. Through Entrepreneurship
development a women will not only generate
income for herself but also will generate
employed for other women in the locality.
This will have a multiplier effect in the
generation of income and poverty alleviation.
Mishra Shambhu Deo and Alam
Masood (2016) conducted a study on
Empowering Women in India and pointed
out that women's development is directly
related to natural development. A large
numbers of programmes initiated for women's
development by emphasis on providing equal
opportunities to women by empowering
women and creating self-reliance. "The three
aspects of gender empowerment-health and
education of women, eradication of gender
barriers in employment and full participation
of women in democracy must be given
maximum attention which could help bring
about transformation of many millions of
women of India in the main stream of natural
development.
Vidyabharati International Interdisciplinary Research Journal (Special Issue) ISSN 2319-4979
Special Issue on Engineering Technologies and Management 3730
Yadav Krishnanand, et al., (2016)
have stated that empowerment of women
does not mean setting women against men. It
means making men and women realize their
changing roles and status and develop a
consensus for harmonious living. The authors
have further said that women must realize
that they have constitutional rights to quality
health care access to education economic
security, employment opportunities,, pay
quality and political power. Now, is the
opportunity to invest in India's future, which
lies in the emancipation of women. "For,
when a woman thrives, her family thrives,
when family thrives communities flourish and
the nation reaps the benefits." The authors
have suggested that empowerment of women
can be achieved through education,
employment and their organizations. The
barriers that hinder women's access to
education, health and economic independence
must be broken.
Awasthi, Arvind, et. al. (2016) have
emphasized that against in equality literacy
with technical skill for rural women can be a
tool for empowerment, which can be
strengthened through dissemination of
information regarding agriculture and other
sectors. This can be done through audio-
visual and mass media communications
which will facilitate them to improve their
earning potential. Another boon is
electrification by rural areas which would
have the way for building infrastructure and
creation of micro enterprises that would
enhance access to finance for rural poor.
Kathryan (2017) explores in his article
that the fit between the lived reality in
entrepreneurial organizations and but list
concept of the bodhisatlva in order to see
weather just opposition of these two very
different realities earn shed light on the
impact of spiritual values in the work place.
It is conchoids that it was not easy to go
behind the stories to the way they constricted
realities. Some spoke very concretely about
what had happened in their lives. Other
landed to expound Buddhist teaching. Still
others used the opportunity to effect on the
deeper issues brought up by the nature of
entrepreneurship in U.S. culture when worked
at along side Buddhist practices.
Shandilya, Tapan Kumar (2017)
made a study on “Gender Equality and
Empowerment of Women” and stated that
all round development of a nation depends on
the socio-economic, political and cultural;
activities performed by both men and women.
As earthly life and living is enriched by
women to make it more enjoyable,
empowerment of them is an urgent need.
Women empowerment requires empowering
them economically, socially and politically so
that they make break male domination claim
equality with them. They have suggested that
for empowering women efforts by all. The
sections of the society including the voluntary
organizations and the government must be
made. For increasing women empowerment
micro-enterprises for women should be set,
up and their skills and technical knowledge
must be developed.
Singh, et al., in their study on Gender
disparities in Rural Workforce (2017)
suggested various measures to strengthen
women's empowerment and rural
development which include development of
entrepreneurial abilities of women by
organizing special types of training, effective
planning at the micro-level, adequate
representation of women in women related
development planning, development of
infrastructure facilities, encouragement to
women through formal and non-formal
education to involve themselves in the service
sectors, establishment of women's
organizations such as, co-operative societies,
mahila mandal, self-help groups, etc., aware
of women about the technical and financial
assistance available to women entrepreneurs
encouragement by government for research
and development to find out high income
generating activities suitable for women etc.
The authors have concluded that "experience,
awareness, education and competence,
willingness, confidence, self-motivation,
encouragement from family and society
contribute to empowerment of rural women.
Khullar K.K. (2017) has emphasized
in his book entitled Mahila Samakhya
Vidyabharati International Interdisciplinary Research Journal (Special Issue) ISSN 2319-4979
Special Issue on Engineering Technologies and Management 3731
Empowerment of Women through
Education that removal of women's illiteracy
is essential for empowerment. The author has
discussed the Mahila Samakhya Programme
of the Ministry of Human Resource
Development (HRD) that has transformed the
lives of the women folk in 14000 villages in
60 districts of nine states of India namely
Karnataka, Gujarat, Andhra Pradesh, Kerala,
Bihar, Assam, Jharkhand, Uttar Pradesh and
Uttranchal. This programme was started as an
awareness programme in pursuance of the
National Policy on Education 1986 as
updated in 1992. Today this programme has
entered the areas of education, health, human
rights and governance with the objective of
creating a gender jurt society. The Mahila
Sanghs in these villages run schools, banks,
dispensaries, and market and participate in
Panchayat Raj Institutions. A number of
studies have concluded that the programme is
Gandhi and both in concept and
implementation. The researcher referred the
above said research works carried out in
National and International level and
understood No study has been conducted on
the present research problem. Review of
research is very much helpful to frame the
research problem.
OBJECTIVES OF THE STUDY
To study the work life of the women
employees in the unorganized sectors.
To study the awareness of labour
legislations by the women employees
To analyze the utilization of labour rights
among the women employees and
To scrutinize the impact of labour laws
among the respondents.
METHODOLOGY
A sample design is a definite plan for
obtaining a sample from a given population.
It refers to the technique or the procedure the
researcher would adopt in selecting items for
the sample. The size of the sample refers to
the number of items to be selected from the
universe to constitute a sample. This is a
major problem before a researcher. The size
of the sample should neither be excessively
large nor too small, it should be optimum.
The universe of the present research consists
of the women employees working in textile
shops, canteens, groceries shops, hotels,
sweet shops, bag works, and small and
cottage factories located in the Aravakurichy
Taluk, Karur District. Agricultural laboures
are not included in this study as the nature of
the problems faced by them is not similar
from the problems of other unorganized
sectors. 50 women employees were identified
by adopting purposive sampling technique.
The researcher wishes to collect the data from
all the sections of unorganized sectors for
good results. It is proposed to adopt a well-
structured interview schedule for gathering
the necessary primary data from the
respondents. The researcher proposed to meet
each and every women worker and thereby
establish a good rapport through which
necessary information can be obtained from
the respondents. The respondents are
expected to Extend full co-operation for
successful data collection. The collected data
will be classified and tabulated. It will be
done by preparing a master table. Through
which sub tables will be drawn according to
the requirement of the study. The result of the
study will be mainly interpreted with the help
of simple percentage analysis. The present
study has been conducted among women only
with 100 respondents in Aravakurichy Taluk,
Karur District because the work places are
always busy, the workers are doing their
respective works and have no time for
interactions.
ANALYSIS AND INTERPRETATION
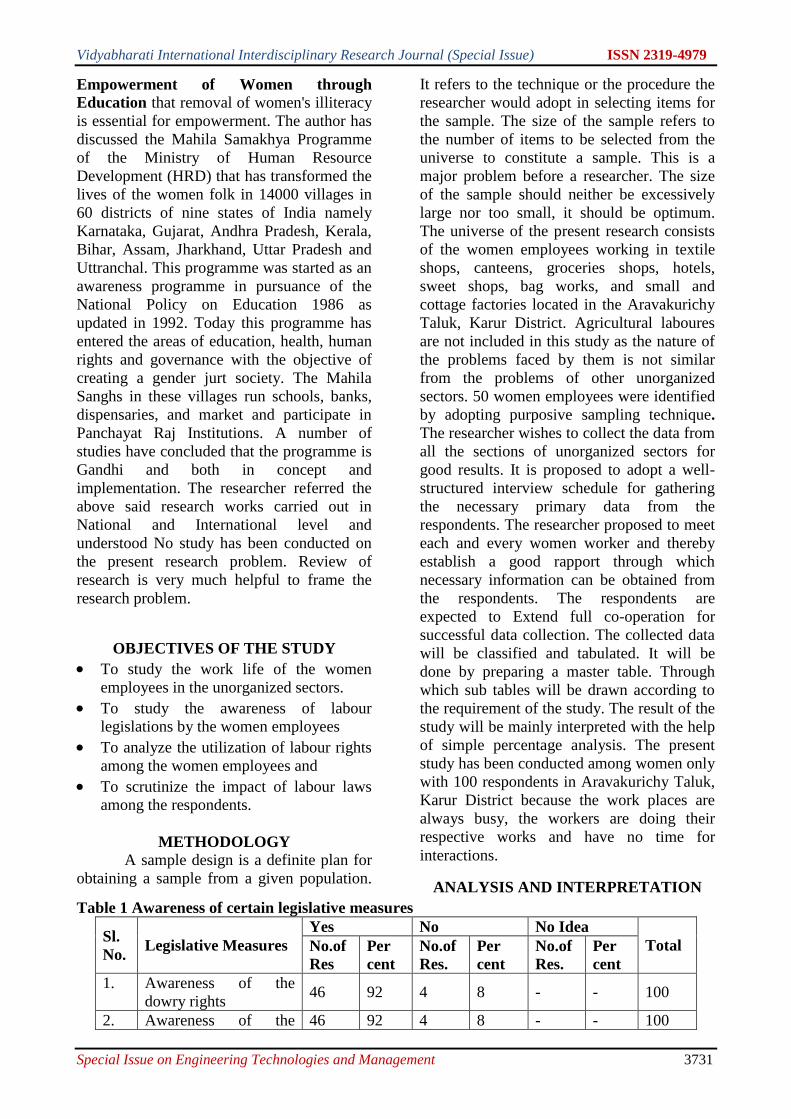
Table 1 Awareness of certain legislative measures
Sl.
No. Legislative Measures
Yes No No Idea
Total No.of
Res
Per
cent
No.of
Res.
Per
cent
No.of
Res.
Per
cent
1. Awareness of the
dowry rights 46 92 4 8 - - 100
2. Awareness of the 46 92 4 8 - - 100

Vidyabharati International Interdisciplinary Research Journal (Special Issue) ISSN 2319-4979
Special Issue on Engineering Technologies and Management 3732
property rights
3. Awareness about
women commission 22 44 25 50 3 6 100
4. Knowledge about
inter-caste marriage 4 8 42 84 4 8 100
5. Awareness about work
protection 37 74 13 26 - - 100
6. Knowledge about
maternity benefits 12 24 38 76 - - 100
7. Provision of rights to
child home - - 43 86 7 14 100
The above table No.1 represents about the
awareness of certain legislative measures by
the respondents. Out of the total most of the
respondents (92 per cent) said that they knew
about rights against dowry. This is very
important legal rights in the modern society.
But it is shocking to note that a few (8 per
cent) working women in unorganized sector
in the study area did not know about the
precious rights of dowry.
It is observed that awareness should be
created among the women in general
particularly among the illiterate women. Out
of the total most of the respondents (92 per
cent) said that they knew about property
rights. But it is note that a few (8 per cent)
working women in unorganized sector in the
study area did not know about the precious
rights of property. It is observed that
awareness should be created among the
women in general particularly among the
illiterate women.
As for as about the awareness of the women
commission is concerned This is very
important legal right in the modern society.
The most of the respondents (44 per cent)
said that they knew about the women
commission and (6 per cent) of the women
said that No idea of the women commission.
When discussing about the awareness about
intercaste marriage protection by the
respondents.
Out of the total most of the
respondents 84 per cent said that they did not
aware about the inter-caste marriage
protection measures. A few respondents 8 per
cent said that they knew about the inter-caste
marriage protection and 8 per cent rest of the
respondents said that No idea about the
intercaste marriage protection.
Out of the total most of the about the
awareness of about work protection. The
most of the respondents 74 per cent said that
they knew about work protection and very
few 26 per cent of the respondents did not
know about the work protection.
As far as Knowledge about maternity benefits
is concerned. Most of the respondents 76 per
cent did not know about the maternity
benefits and very few 24 per cent of the
respondents said that they knew about it.
Regarding the provision of rights to child
home most of the respondents 86 per cent did
not know about it and 14 per cent of the
respondents said that no idea about it.
Table - 2Awareness of certain legislative measures
Sl.
No. Legislative Measures
Yes No No Idea
Total No.of
Res
Per
cent
No.of
Res.
Per
cent
No.of
Res.
Per
cent
1. Knowledge about
holiday rights 47 94 3 6 - - 100
2. Provision of
water/food facilities in 46 92 4 8 - - 100

Vidyabharati International Interdisciplinary Research Journal (Special Issue) ISSN 2319-4979
Special Issue on Engineering Technologies and Management 3733
work place
3. Provision of intervals
on it time and other
benefits
44 88 6 12 - - 100
4. Awareness of rights to
equal wage 4 8 46 92 - - 100
5. Provision of first aid at
work place 37 74 13 26 - - 100
6. Provision of fire
service at work place 18 36 32 64 - - 100
7. Provision of home
facilities 2 4 48 96 - - 100
8. Facilities of child
education 47 94 3 6 - - 100
The above table No.2 represents about the
awareness of certain legislative measures by
the respondents.
Regarding the awareness of the knowledge
about holiday rights. The most of the
respondents (94 per cent) said that they knew
about holiday rights but it is note that a few
(86 per cent) working women in unorganized
sector in the study area did not know about
the precious do holiday rights.
Out of the total respondents most of them 92
per cent were aware of the legislative
measures of responsibility of owners to
provide good drinking water, snakes and food
stuff at lower rate, should be supplied to them
to work place. It is observed that as most of
them are educated they have learned the legal
measures which are available for them. But a
meager 8 per cent respondents did not know
about this legal measures.
As for as legal measures of intervals during
working hours and over time wages &
benefits are concerned the vast majority 88
per cent respondents were aware and
remaining 12 per cent of them did not know
about those legal measures. It is understood
that intervals, working hours rest at working
place are not displayed properly in the
industrial establishments.
As far as about awareness of the equal wage
to men this concerned. 92 per cent of the
respondents said that they did not know about
the equal wage to men.
Regarding the awareness of the provision of
first aid at work place. The most of the
respondents 74 per cent said that they knew
about it and 26 per cent working women in
unorganized sector in the study area did not
know about it.
About the provision of fire service at work
place. Most of the respondents 64 per cent of
working women did not know about it and 36
per cent of the respondents said that they
knew about it.
When asked the provision of the home
facilities. The 98 per cent of the respondents
did not know about it. Regarding knowledge
about child education. Most of the
respondents 94 per cent said that they knew
about it and very few 6 per cent of the
respondents did not know about it. It is
understood through observation that they do
not have idea about their owners
responsibility to provide assistance for their
children’s educations.
Table 3 The utilization of the certain legal rights by the respondents
Sl.
No. Legislative Measures
Yes No No Idea
Total No.of
Res
Per
cent
No.of
Res.
Per
cent
No.of
Res.
Per
cent
1. Dowry 15 30 34 68 1 2 100

Vidyabharati International Interdisciplinary Research Journal (Special Issue) ISSN 2319-4979
Special Issue on Engineering Technologies and Management 3734
2. Property 17 34 33 66 - - 100
3. Women commission 16 32 33 66 - - 100
4. Inter-caste marriage
protection 2 4 6 12 42 84 100
5. Protective measures 12 24 38 76 - - 100
6. Maternity care leave 11 22 38 76 1 2 100
7. Child home 6 12 38 76 6 12 100
The above table represents about the
utilization of certain legislative rights by the
respondents. Out of the total respondents 30
per cent said that the utilization about rights
against dowry. This is very important legal
right in the modern society but it is shocking
to note that 68 per cent vast majority of the
working women in unorganized sector in the
study area did not utilize dowry rights and 2
per cent of the respondents said that no idea
about it. It is observed that awareness should
be crated among the women in unorganized
sector.
Out of the total respondents 66 per cent of the
working women they are not using the rights
of the property sharing and 34 per cent of
them are using the rights most of the women
do not claim property from their parents and
husbands even among the educated they are
not ready to claim property.
Out of the total respondents 66 per cent of the
working women they are not using the
women commission and 34 per cent of them
are using in the women commission a
considerable respondents have contacts with
the women activists.
Regarding rights of inter-caste marriage
protection. The most of the respondents 84
per cent said no idea about it and 12 per cent
of them do not using the rights but, the 4 per
cent of them using the rights about it 84 per
cent most of the young unmarried women
workers do not know and utilize the benefits
of special marriage Act 1954.
As far as protective measures is concerned of
most of the respondents (76 per cent) do not
use it, and 24 per cent of the respondents was
using them protective measures are the
important for health of the respondents
protective measures not needed like textiles
shops.
Regarding for maternity benefits most of
them 76 per cent regarding are not using it
and 22 per cent of them are using the leave,
and 2 per cent of them said that no idea.
As most of the respondent are unmarried the
cannot avail maternity benefits. Use creche
12 per cent of them respondents using it and
12 per cent of them said that no idea.
Table 4 The utilization of the certain legal rights by the respondents
Sl.
No. Legislative Measures
Yes No No Idea
Total No.of
Res
Per
cent
No.of
Res.
Per
cent
No.of
Res.
Per
cent
1. Weekly leave 47 94 3 6 - - 100
2. Drinking water/ food facilities 39 78 11 22 - - 100
3. Tea/ food intervals 37 74 13 26 - - 100
4. Equal wage 46 92 2 4 2 4 100
5. First aid 33 66 17 34 - - 100
6. Fire service 19 38 29 58 2 4 100
7. House facility 2 4 45 90 3 6 100
8. Child education 05 10 45 90 - - 100
Out of the total respondents most of 94 per
cent of them use that the weekly leave but (6
per cent) of the respondents do not using the
rights.
Out of the total respondents most of them 78
per cent are using the legislative measures of
good drinking water, snakes and food stuff at

Vidyabharati International Interdisciplinary Research Journal (Special Issue) ISSN 2319-4979
Special Issue on Engineering Technologies and Management 3735
lower rate supplied to them of work place.
But a meager 22 per cent of the respondents
said that they did not use the right or they are
not adequate.
Out of the total respondents most of them 74
per cent use the intervals and 26 per cent of
the people do not using the rights. As far as
equal wage is concerned most of the
respondents 92 per cent of the rights to equal
wage and 4 per cent of the respondents do not
use the rights and 2 per cent of the
respondents said no idea about it.
Regarding the first aid at the working place.
Most of the respondents 66 per cent them
using the rights and 34 per cent of the
respondents did not use the rights.
Regarding the fire service at the work place.
Most of the respondents 58 per cent do not
using the rights and 38 per cent of them using
the rights and 4 per cent of them said no idea
about it most of the work place fire
extinguisher is not provided. Through the
management do not provide education facility
for children is provided by the government.
Unorganized sectors are not ready to attract
their workers as there is availability of human
resources.
Regarding house facility extinguish is
provided. The most of the respondents 90 per
cent of them do not using the rights of house
facility and 4 per cent of them are using the
rights and 6 per cent) of them said no idea
about it. The management do not help in any
way for the housing of the respondents. The
utilization of rights about the child education.
Most of the respondents 90 per cent of them
using the child education and 10 per cent of
them are using the child education rights.
MANAGERIAL IMPLICATIONS AND
CONCLUSION
The following suggestions are given to
effective use of social legislations for women
empowerment. i) Integrated approach by
government and NGOs to create awareness
about labour rights among the women, ii)
Govt. should take stringent action against the
owners who do not implement the labour
legislation iii) Establishment of women
commission, in micro levels and counter
against government officers, who act against
labours interest iv) women organizations and
associations should be encouraged to set up
their branches in rural area and report any
type of harassment or torture to legal
institutions, and v) Govt. should take steps to
establish small and large scale industries to
provide employment to women. vi) equal
wages and living wages provisions should be
intensively implemented among the
unorganized sectors to avoid exploitation of
the employers. The valuable legal rights for
women empowerment are not availed and
enforced by the woman. The democratic
political system has created a myth that
women get equality, freedom and justice. But
all these are seen on paper only not in actual
practice. Government has been taking steps to
empower the women by providing all the
required legal protection. Educational values
and employment opportunities can make
women to aware of their rights.
There is no small and large scale industries
run by governed to provide employment
opportunity for the SC and ST women.
Young women are forced to work in Xerox
shops, sweet stalls, Textile centres hotels and
other establishments. Due to poverty and
ignorance the young girls donot prefer to go
for higher studies even though educational
institutions, scholarships, and other
Government benefits are available in the
study area.
The women working in unorganized sectors
are not fully aware of the protective measures
health facilities and welfare schemes. But
they are aware of general legal rights, like
dowry, property, marriage divorcee and other
rights. Implementation of labour legislation
by the owners of the establishments are very
poor. Especially, minimum wages, maternity
benefits welfare facilities and other important
legal measures in the industrial
establishments. The women working in
unorganized sectors are not aggrieved of their
owners and do not insist them for providing
Vidyabharati International Interdisciplinary Research Journal (Special Issue) ISSN 2319-4979
Special Issue on Engineering Technologies and Management 3736
any facilities. Because the unwritten terms
and conditions of the employment between
them and their management.
There are so many villages around the
Aravakurichy Taluk, Karur District where
number of women workers are available at
cheaper rate. So that, women workers accept
the meager wages and poor facilities and
welfare measures provided by their
employees. There is a gab between the
enactment of labour legislations and
acceptance and implementation of the owners
of unorganized sectors. Based on the study
certain suggestions are given.
REFERENCES
1. Arundhabti Chattopashyay “Women an
entrepreneurship yojana, Jan-2015, pp.27-
33.
2. Awasthi, Arvind et al., “Gender
Disparities in Rural workforce”,
participation rate: All India and state level
analysis, p.1018.
3. Kathryan Goldmand Schuylor, being a
Bodhisathr, vaat work perspectives on
influence of Buddhny prachalin in
Entrepreneurial organizations, Journal of
Human values, vol-13, No.1, Jan-June
2017, pp.43-66.
4. Khullar, K.K., “Mahila Samakhya
Empowerment of women
through education”, Kurushetra, vol.55,
March 2017, p.9.
5. Mishra, Shambhu Deo and Alam,
Masood, “Empowering women in India”.
The Indian Economic Association, 89th
conference volume, Department of
Economics, Kurukshetra, University,
Kurukshetra, Haryana, December 27-29.
2019, p.1074.
6. Prabhakar, Vani, “Women in Rural
India”, Dominant publishers and
Distributors, New Delhi, 2014.
7. Shandilya, Tapan Kumar and Kumar,
Bipin, “Gender Equality and
Empowerment of women: promist and
performance”, 2017, p.1131.
8. Singh, Dr. Indrabhushan and Kumari,
Usha, “Rural Development and Women
Empowerment” Kurukshetra, Vol.55,
March 2017, p.3.
9. Singh, O.R. “Education and Women’s
Empowerment”, Social Welfare Vol.48,
No.1, April 2011.
10. Tapan, Neeta, “Need for women
empowerment”, Rawat publications, New
Delhi, 2010.
11. Yadav, Krishnananda,
Singh, “Empowerment of women in
India: Challenges and perspectives”,
p.1191.
Vidyabharati International Interdisciplinary Research Journal (Special Issue) ISSN 2319-4979
Special Issue on Engineering Technologies and Management 3737
DEFENSE MECHANISMS DISPLAYED BY CELIE IN THE COLOUR PURPLE BY
ALICE WALKER
Maria Alice Issac1, Dr S Karthik Kumar2
1PhD Scholar, Department of English Annamalai University [email protected] 2Associate Professor Annamalai University [email protected]
ABSTRACT
Alice walker was an American novelist whose books and poems never cease to explicitly portray the reality that African
American women had to face. ‘The colour purple’ by Alice Walker is a story about an African American woman’s
oppression inside her community which leads to her transformation in the end. The work won the Pulitzer Prize in
1983. The novel portrays the traumas and violence inflicted on young teenage girls. Defense mechanisms are
commonly used by the human mind to tackle unfavorable situations in their life. Even in literature, fictional characters
use defense mechanisms to handle their inner conflicts and traumas. This paper focuses on analyzing the defense
mechanisms used by Celie in Alice Walker’s novel ‘The colour purple’ in tackling her traumas and oppression. Celie is
a perfect example to show how psychoanalysis can be carried out in detail with fictional characters. Many neurotic
and mature defense mechanisms can be identified with the character. Celie tries to cope up with her conflicts and
situations with defense mechanisms like repression, sublimation, fantasy, passive aggressive behavior and
intellectualization which will be discussed in the paper.
Introduction
Alice walker was an American novelist
whose books and poems never cease to
explicitly portray the reality that African
American women had to face. Her major
works are The third life of Grange Copeland
(1970), In love and trouble ;Stories of black
women (1973), Meridian 919760, The temple
of my familiar (1989), possessing the secret
of joy(1992) etc. She has also written poetry
collections like Once (1968), Revelutionary
Petunias and other poems (1973), Collected
poems (2005), Taking the arrow out of the
heart (2018). She wrote her epic novel ‘The
colour purple’, an epistolary novel in 1982.
The book which won the Pulitzer Prize was
adapted into a film in 1985, directed by
Steven Spielberg. Later a musical version was
released in 2004, starring Oprah Winfrey and
Quincy Jones .‘The colour purple’ by Alice
Walker is a story about an African American
woman’s oppression inside her community
which leads to her transformation in the end.
The work won the Pulitzer Prize in 1983. The
novel portrays the traumas and violence
inflicted on young teenage girls. Celie, a
young teenager narrated the novel as a series
o0f letters to god. This started when her
father Alphonso, rapes and threatens to kill
her mother if she ever reveals this to anybody
other than god. At the age of 14, Celie gives
birth to a child which is taken away by
Alphonso, just like he had once done earlier.
A widowed man called Mr. __ (Albert) asks
for Nettie’s hand in marriage. Alphonso
offers Celie since she is the eldest and is a
burden to the family. Soon Nettie fled from
Alphonso and lives with Celie for a while,
after which she had to leave that place as
Mr__ starts to pursue his interest on her.
Celie then befriends other black women. She
first befriends Sophia, Mr __ daughter in law,
who fights back as her husband Harpo tries to
beat her. Celie then befriends Shug Avery, a
beautiful and confident singer who was Mr__
‘s former mistress. The two start a close
relationship and finally fall in love. Celie
discovers that Albert was hiding the letters
that Nettie had been sending her. Nettie had
joined Samuel and Corrine with their adopted
children Adam and Olivia, who are actually
Celie’s children. After knowing this truth, she
loses her belief in god and starts addressing
her letters to Nettie. She then moves with
Shug and her husband to Memphis. After the
death Mr __ , Celie inherits the house, gets
reunited with Nettie and meets her children.
Defense mechanisms are employed by
humans’ in order to tackle the unexpected
situations in life. Even fictional characters
employ these mechanisms to deal with their
traumas and problems. This paper discusses
the defense mechanisms that were employed
by the major characters of Alice Walker’s
‘The colour purple’.
The foundation of psychoanalysis was laid
down by Sigmund Freud in the 20th century.
According to his theory, the mind which is
Vidyabharati International Interdisciplinary Research Journal (Special Issue) ISSN 2319-4979
Special Issue on Engineering Technologies and Management 3738
divided into conscious and unconscious . It
works mostly with processes that are guided
by the latter. Even the sexual drives and
behavioral pattern of a person are involuntary
actions lead by the unconscious. There are
two concepts that he introduces in the book.
The first is ‘Nachträglichkeit’ which means
working through and second , ‘Uncanny’.
The first is applied in the story of the
wolfman who accidently witnesses his
parents having sex and is traumatized until he
comes to know about it in the adulthood. The
second concept is applied is applied E.T.A
Hoffman’s work ‘The sandman’, where the
child is threatened that he will lose his eyes if
he disobeyed. As a consequence,he began
related all lawyers to sandman who would
pull off his eyes. (3)
Chapter 1
Concepts ‘Nachträglichkeit’ and
‘Uncanny’ through Celie
Both concepts of ‘Nachträglichkeit’ and
uncanny can be found out from Celie’s
experiences. In her first letter to god, she
states “Maybe you can give me a sign letting
me know what is happening to me” (Walker,
2003, p. 1). She feels burdened and
dilemmatic with the sin of having sexual
relations with her father. But this trauma was
worked through and the burden was released
as she realizes that he was just her stepfather
and not real one. The concept of uncanny can
be noted with the fact that she relates all men
that came into her life with her step father,
’Remind me of Pa’ for each man (Walker,
2003, p. 22). Even as she is tortured, beaten
up and raped by her new husband, Celie
accepts it as a part of her life. According to
Cori, “the maltreatment in the early
relationship with the parent(s) naturally
leaves you defenseless and vulnerable to the
similar relations with the other(s)” (Cori,
2018, p. 170). Childhood plays an important
role in every person’s life. The treatment that
he/she receives is detrimental in molding up
the character of the person. Here as Celie is
mistreated, tortured and burdened with
responsibilities, she believes that her whole
life would be like that. (3)The mirror stage, as
mentioned by Lacan is the stage when a child
identifies itself in the mirror and starts a
journey towards selfhood. The mirror stage
for Celie according to Ross, however happens
in her youth when Shug Avery asks her to see
her vagina in the mirror. This was the
beginning of self-discovery and acceptance of
her body to Celie, thus changing her life
forever’ (p. 70). Until that moment, Celie had
associated her body as a token of her traumas
and physical pain from childhood. She was
convinced that she was ugly and did not meet
the conventional standards of beauty.
According to Ross, ‘because the female body
is the most exploited target of male
aggression, women have learned to fear or
even to hate their bodies’ (ibid., p. 70). As
Levi Strauss States, women’s bodies are
exchanged as a sign of binding them together.
(Lévi-Strauss, 1969). Celie was married off to
Mr__ without her consent. This is an example
of how men in African American societies
treat women bodies.Celie chooses to express
her feelings only through letters to god. This
very act can be interpreted as a schizoid
fantasy because she hopes that ‘god ‘will give
her all the answers. She tries to resolve all her
conflicts through this method. Another
defense mechanism is enacted by Celie on her
wedding night to withstand the unpleasant
sexual act she encounters. “I lay there
thinking about Nettie while he on top of me,
wonder if she safe. And then I think bout
Shug Avery. I know what he doing to me he
done to Shug Avery and maybe she like it. I
put my arm around him” (Walker, 2003, p.
12). She imagines herself as Shug Avery and
tries to enjoy the act while in reality it might
have been traumatic and painful to her.
According to Vaillant “defenses reflect
integrated dynamic psychological processes
for coping with reality rather than either a
deficit state or a learned voluntary strategy”
(1994, p. 45). Another instance can be noted
when the family comes together to discuss the
release of Sophia from jail. When other
members think of logical ways through which
she would be released, Celie fantasies of
Sophia being carried home by angels. , “I
don’t know what she thinks, but I think bout
angels, God coming down by chariot,
swinging down real low and carrying ole
Sofia home. I see’em all as clear as day.
Vidyabharati International Interdisciplinary Research Journal (Special Issue) ISSN 2319-4979
Special Issue on Engineering Technologies and Management 3739
Angels all in white, white hair and white
eyes, look like albinos. God all white too,
looking like some stout white man work at
the bank. Angels strike they cymbals, one of
them blow his horn, God blow out a big
breath of fire and suddenly Sofia free” (pp.
90-91).
Chapter 2
Repression, Sublimation and Passive
aggression portrayed by Celie
Passive aggressive behavior is exhibited by
Celie. When Harpo asks Celie for advice in
taming Sophia to behave like a ‘normal
‘woman, Celie advices him to ‘beat her’
(ibid., p. 36). When Sophia questions why she
advised so , Celie responds “I say it cause
I’m a fool, I say. I say it because I’m jealous
of you. I say it cause you do what I can’t”
(ibid., p. 40). As Shug Avery comes to
Mr__’s home with her husband Grady, Celie
gets frustrated because she is doing
something that Celie cant. Even when her
husband is by her side, Shug never ceases to
flirt with Mr___(Albert) “Shug laugh and
laugh when he got anything to say. Show teef
and tits aplenty. Me and Grady try to carry on
like us civilize. But it hard. When I hear Shug
laugh I want to choke her, slap Mr._face. All
this week I suffer. Grady and me feel so down
he turn to reefer, I turn to prayer” (ibid., p.
119). Her prayer is another defense
mechanism. She uses sublimation, with
which her anger and negative feeling is
converted into positive. (5)There are many
neurotic defenses that Celie shows throughout
the novel. When Mr___ beats with her
accusing her of being stubborn, Celie thinks
that she is a tree and tries to stay like wood.
“He beat me like he beat the children. Cept he
don’t never hardly beat them. He say, Celie,
git the belt. The children be outside peeking
through the cracks. It all I can do not to cry. I
make myself wood. I say myself, Celie, you a
tree. That’s how come I know trees fear man”
(Walker, 2003, p. 22).Celie is so accustomed
to suffering and torture that whenever a
positive thought comes to her mind, she
makes sure to repress it. Celie thinks that her
hopes for change and better life are never
going to be true and thinking about it might
cause more pain. The mechanism of
repression is used here “I think bout my
sister Nettie. Thought so sharp it go through
me like pain. Somebody to run to. It seem too
sweet to bear” (Walker, 2003, p. 65). Other
neurotic defense mechanisms like fantasy
and intellectualism can be seen through the
words of Celie. She believes that struggling
against these harsh conditions and standing
up for herself might cause pain and despair.
As Nettie leaves Celie in Albert’s home, she
compares it with being buried after death,.
But Celie thinks that it was better to be buried
so that she wouldn’t have to do household
work and look after anybody. Never mine,
never mine, as long as I can spell G-o-d I got
something along” (p. 17). Even then, she
finds peace in the concept of god. When
Albert’s sister visits them and tries to
empower Celie into claiming her rights and
breaking out from being a slave, Celie says
that thinks “I don’t say nothing. I think about
Nettie, dead. She fight, she run away. What
good it do? I don’t fight, I stay where I’m
told. But I’m alive” (p. 21). She has
connected death with resistance. Celie
believes that Nettie’s efforts for getting a
better life is what caused her life. Celie finds
ways to rationalize her slavery and finds
solace in such justifications. Three
mechanisms of maturity out of the five
mechanism (altruism, anticipation, humor,
sublimation and suppression) as proposed by
Vaillant are applied in her life. Out of all the
defense mechanism, the most dominating and
interesting one is sublimation. The feeling of
helplessness, anger, despair etc is transferred
into prayers in her life. All of her coping
mechanisms are suppressed with her real
anger as she finds out that Nettie’s letters
were hidden from her by Mr __. “[a] needle
and not a razor in my hand, I think” (p. 147).
As she fantasizes if killing her husband with a
razor with which she shaves him, Shug asks
her to continue sewing. She transfers the
anger that she feels into a new life when she
opens a boutique to sell that unisex pant that
she had sewn. She deserts her oppressor and
leaves with Shug Avory and her husband to
Memphis. In another instance, when Harpo
asks if she smokes, she replies“Do I look like
a fool? I ast. I smoke when I want to talk to
Vidyabharati International Interdisciplinary Research Journal (Special Issue) ISSN 2319-4979
Special Issue on Engineering Technologies and Management 3740
God. I smoke when I want to make love.
Lately I feel like me and God make love just
fine anyhow. Whether I smoke reefer or not”
(p. 220). The transformation of Celie from a
suppressed slave to a liberal who has the
audacity to joke about love making and god is
very evident. The last defense mechanism
altruism can be found out within the
interaction between all the characters of the
coloured purple. All the family members
helps Sophia get out jail and helps Henr5eitta
fight her disease. As Celie got pregnant with
her father’s child, and her mom got infuriated
and started enquiring about the child’s father,
Celie says that god is. Even as the baby is
took away, Celie believes that it was god who
took it. The psychological method of
projection is used here in diverting the real
fact that she was impregnated by her father
and the baby was kidnapped. ‘She ast me
bout the first one whose it is? I say God’s. I
don’t know no other man or what else to say.
When I start to hurt and then my stomach
start moving and then that little baby come
out my pussy chewing on it fist you could
have knock me over with a feather.’(9)The
readers come to know the reality that Celie
knows in her second letter to god where she
confesses that the father took her second boy
and sold it to a man in Monticello (10)As
soon as Celie comes to know about Shug
Avery, she is overpowered with her boldness
and beauty. She stares at her cheerful and
confident photograph the whole night (13).
All throughout her life Celie represses her
real feelings and blames everything on god,
deep inside Shug Avery is a person she wants
to be. Her stepfather says that Celie says lies.
Her lies are actually defense mechanisms to
prevent getting punished and also to deviate
from her own reality. As we take the
character Alphonso, he is a frustrated man.
He uses misuses Celie as an outlet to get out
his frustration. The defense method of
displacement is clearly seen here. Celie is an
object with which Alphonso compensates his
anger. As far as he was concerned, Celie’s
mother was clinically depressed after her
husband’s death. The woman showed signs of
anger and deprtession all throughout her life,
which affected Alphonso. Celie is considered
as an epitome of all the bad things in his life.
Blaming her gives him a kind of pleasure. He
says that Celie might give away all his things
if he was not watchful. He believes that Celie
is a bad influence on his other girls (14). She
was forcefully taken away from school and
was epitomized as being dumb. It is to be
noted that Celie’s dignity and self-respect
crumbled with her destructive relationship
with her stepfather. She has an Oedipal
fixation which doesn’t go away even after she
is married. Her character had been molded in
a way as to bear violence and suffer in
silence. She is stuck up in a dilemmatic
situation where what is the right and wrong
could be defined. Celie continues to believe
that ‘she was born that way’. Her primary
motive is just to survive and not to live (11).
Resistance is not even thinkable for Celie
who has been mentally handicapped with
threats. Her mind has been infused with ideas
like speaking out the truth would result in
disasters like her mother’s death. Situations
that brought her up inflicted a low self-esteem
that restricts her from behaving like other
normal people. Celie begs her father ‘to take
her’, when their new mammy was sick for the
protection of her little sister. Celie marries
Mr__ with no resistance due to the same low
self-esteem. Alphonso degrades Celie’s
character, says that she is not fresh and has
been spoilt twice, she lies and would give
away his things if he was not watchful. To all
these accusations, Celie remains mump.
Celie accepts her husband’s mistress without
any resistance unlike other women. As
discussed earlier, Celie’s main aim is
survival. (11)
Conclusion
Celie is a perfect example to show how
psychoanalysis can be carried out in detail
with fictional characters. Many neurotic and
mature defense mechanisms could be
identified with the character. Celie tries to
cope her conflicts and situations with defense
mechanisms like repression, sublimation,
fantasy, passive aggressive behavior and
intellectualization. Celie was psychologically
tied up with her step father’s threat that shw
received whyen she was a child. The threat
which she internalized became a frame with
which Celie viewed the whole world. She

Vidyabharati International Interdisciplinary Research Journal (Special Issue) ISSN 2319-4979
Special Issue on Engineering Technologies and Management 3741
diverted her anger and defnse into prayers. A
clear case of repression can be found out from
.The turning point of Celie’s life is when
Shug Averie asks her to see her private parts
in the mirror which began the process of self-
discovery in her. From an objectified and
colonized body, Celie begins considering her
body as her own. Cheung (1988) argues that,
‘[t]he problem with God is that he never
answers Celie’s letters. Worse still, trust in
him leads her to accept the status quo’ (p.
166). Her defense mechanism of blaming and
hoping that god would give her answers and
solve all her problems ceases there. The
threats that her father posed on her crumbles
at that point and Celie began addressing her
letters to someone living and close to her,
Nettie. According to Vaillant ‘the symptoms
of personality disorder are a means of
copying with reactions to unbearable people-
in past or present time’ (1994, p. 45). Until
then Celie needed edefemnse mechanisms to
repress her true self, but then she matures and
becomes a fearless and independent woman.
Works cited
1. Cori, J. L. (2018). Annenin Duygusal
Yokluğu. Çev. Belgin Selen Haktanır.
İstanbul: Koridor Yayıncılık.
2. Freud, A. (1993). The ego and the
mechanisms of defence. Karnac Books.
Harris, T. (1984, December).
3. Gumuz , Florentina (2019).Defense
mechanisms in ‘The colour Purple’. Book
of abstracts and proceedings, 2(3),106-
111
4. Lévi-Strauss, C. (1969). The elementary
structures of kinship (No. 340). Beacon
Press.
5. Morrison, Tony (1960) The Color Purple.
United States of America: First Harvest
Edition.
6. Ross, D. W. (1988). Celie in the Looking
Glass: The Desire for Selfhood in" The
Color Purple". Modern Fiction Studies,
34(1), 69-84
7. Vaillant, G. E. (1992). Ego mechanisms
of defense: a guide for clinicans and
researchers. American Psychiatric Pub.
8. Vaillant, G. E. (1994). Ego mechanisms
of defense and personality
psychopathology. Journal of abnormal
psychology, 103(1), 44.
Vidyabharati International Interdisciplinary Research Journal (Special Issue) ISSN 2319-4979
Special Issue on Engineering Technologies and Management 3742
A FACELESS SHELL: REPRESENTATION OF WOMEN IN JAYANTA MAHAPATRA’S
TEMPLE
Dr Salil Varma R*
Head, Centre for Research and Postgraduate Studies in English,
St. Joseph’s College, (Autonomous) Devagiri, Calicut [email protected]
ABSTRACT Jayanta Mahapatra (b 1928), is one of the most significant bilingual poets from Odisha. A Physics teacher by
profession, he started writing poetry in his mid-forties. From his first collection Close the Sky Ten by Ten (1971) to
Hesitant Light (2016), Mahapatra has been consistently preoccupied with the problems of Indian women of all ages.
This paper is an attempt to analyze the representation of the same in Temple (1989), the only book length poem of
Mahapatra. It is argued that Temple presents a bleak and realistic vision of life that women face, punctuated by
poverty, social injustice, traditional constraints, negative images of bodily processes, violation of the female body and
attack on privacy. Temple does not, in anyway attempt an idealization of women, on the contrary it is an attempt to
show how far from the ideal the condition of women is.
Keywords: Menstruation, Rape, Religion, Suicide, Womanhood.
Introduction
The concept of woman in Mahapatra’s poetry
is a vital link in understanding his tragic
vision. Temple, in many respects, continues
this vision which made its appearance in his
first collection of poems. In Mahapatra's
poetry, woman is constructed through two
concepts, gender and sex, that provide a
realistic picture of womanhood. The self in
his poetry which confronts womanhood is
devoid of all illusions and the consummate
expression of the concept of woman that he
holds is to be found in Temple. The title is
sarcastic and ironic and it illumines a
particular aspect of the male consciousness
which has its root in the adolescence of the
male mind of all times, namely, the romantic
phase which tends to idealize womanhood.
This concept of the romantic is coupled with
the image created by religion and the
resultant image tends to throw up a number of
questions regarding the credibility of such
constructs and the need for the same so as to
bring out the instabilities in such constructs.
The concept of the female body in the
world of Mahapatra’s poetry as it appears in
Temple, does not have anything Lawrentian
about it and is well within the structure of
religion that sees the body as a burden. The
phases of physical development and
experiences specific to womanhood impinge
upon the consciousness as dictated and
produced by society. The desire-existence
equation that runs through Temple tends to
reflect the interdependence of such concepts.
The gradual erosion of life based on the
desire-existence philosophy is caused by a
space that is economic and social to the core.
The failure to understand the nature of the
above mentioned conditions, Mahapatra
suggests, makes the life of the Indian women,
particularly rural women, miserable.
Mahapatra’s poetry in general and
Temple in particular, creates the impression
that all the phases of the life of a woman are a
"long play toward nothing”. The events in
Temple are placed between two incidents
which bear the distinct flavour of the concept
of "event" that bears a number of
connotations like the publicizing of
happenings and a corresponding interest of
the public for such news items. In this
universe, events are consumed by a public
that is indifferent to the train of social
scenario in which suicide and rape, occur and
with little sympathy or desire to know the
causes of sorrow and injustices.
Embedded between suicide and rape,
the extremes of human existence stem from
social problems, that need urgent attention.
Temple opens and closes with images of
violence that span both extreme old age and
late childhood, presented in the form of news
from the print media. The suicides of
Chelammal and her husband Ramanujam
with which the Temple begins and which
introduce the central character and ends with
the news of the gangrape and murder of a
nameless twelve-year-old girl whose
beheaded body is recovered by the police,
offer the reader an idea of the extent of the
violence in the tragic vision that Mahapatra
presents.
Vidyabharati International Interdisciplinary Research Journal (Special Issue) ISSN 2319-4979
Special Issue on Engineering Technologies and Management 3743
In what is titled Prologue, the poet
presents a newspaper item dated March 24,
1980 that informs the reader of the suicide of
an octogenarian couple from Kumbakonam.
From this bare and factual newspaper item,
Mahapatra constructs imaginatively the life of
Chelammal. Beginning from the moment of
the decision to commit suicide, the narrative
goes back to Chelammal’s childhood,
adolescence and youth. In what may be called
a flashback Mahapatra is able to capture not
just the life of Chelammal, but possibly all
those women of a particular period of south
India whose life carried more similarities
rather than differences. Chelammal thus
assumes a larger frame of reference and
becomes the representative of all those
women who lead lives of quiet desperation.
Her life, and death by suicide offer the poet
an opportunity to present the social forces
that drastically restrict the lives of women.
The cause of suicide is given as poverty and
isolation, conditions that are rooted in the
social spheres of existence and the latter seen
as the result of the former allows the poet to
elaborate the societal conditions that
Chelammal in particular and women in
general faced at a historical point which make
Temple a social critique of considerable
relevance.
The prologue moves rapidly to the
imaginative reconstruction of the moment of
decision to take one’s life, in this case to die
together: “Everything had been planned, yet it
was not plan / it was as though the darkness
had been washed away/ by his one command”
(1). Called a “girl of eighty, with cheeks loose
and toothless gums”, the poet sorrowfully
wonders whether she didn’t think “of the next
day’s light, / about the sun’s blissful skim on
treetops, its gleaming / on the diamond stud
in your rich neighbour’s nose?”(1). The social
disparity appears as neighbour’s diamond
stud. The neighbour’s affluence and the
richness of a sunny day, the poet tragically
realizes, did not deter the couple from taking
their lives. The aged body of both the couples
appear in the narrative as his “parenthetic
look of eighty-five years” and the “mocking
flap of the weary breasts” (2). The poem is
divided into the "Hall of Dancing", the "Hall
of Offerings" and "Sanctum Sanctorum" and
these divisions become the different images
of female existence which fuse the feminine
concept of dancing, of woman as gift to be
offered for the realization of her identity, and
the paradoxical position of the woman as a
goddess. Mahapatra offers in Temple two
voices, that of the omniscient narrator and the
voice of Chelammal. This reliance on two
voices results in greater credibility since the
imaginative build up does not go unchecked,
but is continually counterpointed by the
realistic voice of Chelammal.
Temple rests on the idea of the woman
as an object to be venerated and as an object
to be sacrificed in front of a God that is more
often a man in His guise. This world has
inculcated in the mind of woman, the need for
the identification of God with the male to
such an extent that the woman is not
conscious of being manipulated by the male.
The structure of the poem is again indicative
of the limits of the horizon of the meanings
and concepts associated with women because
of the final episode of the news item of rape
which is a description of the violence against
women which is both psychic and physical in
nature. The structure of the poem thus shows
the precarious existence of a sanctum
sanctorum lying close to a physical violence
that has extremely serious consequences and
the irony of such designations. The proximity
to violence thus represented in Temple
testifies to what Sylvie Frigon notes:
“Typically, violence done to women, but not
violence committed by women, is
representable” (4) Further the introduction of
the theme of rape through the newspaper item
addresses the need to reassess the claims of
feminism: “The mainstreaming of feminism
and the presumed liberation of women
appears to stand in contradiction to notions of
everyday sexual victimisation and the
continued inequalities that underpin it”(
Lazard, 2020, p. 8 ).
The woman that Mahapatra presents
in Temple is acutely conscious of the changes
that time brings about on the body and the
insults and assaults to which it is subjected. A
sense of unease prevails in moments of such
awareness as a feeling of being alienated
from one’s own body runs through this inner
universe of woman. The darkness of the
Vidyabharati International Interdisciplinary Research Journal (Special Issue) ISSN 2319-4979
Special Issue on Engineering Technologies and Management 3744
future is reflected in the imagery that the poet
employs. A woman’s life is often conceived
in terms of darkness which proves to be apt as
the future unrolls the vistas of pain. The
violation of the private space happens early in
this world: “By the old well the first darkness
/ Caught her unawares in the failing light /
perhaps she was thirteen” (15) The world that
Mahapatra presents is not safe for women.
Violence appears early in life; it is almost
concomitant with adolescence. Underneath /
here growing breasts two swells of pain /
felled the first touch (15). This traumatic
incident foreshadows the final image with
which the poem closes i.e. two different news
items of rape. Rape is a constant theme in
Mahapatra’s poetry, both in works like
Dispossessed Nests (1986) that preceded
Temple and a later work like Hesitant Light
(2016). Written in 1989, Temple takes a direct
approach in its treatment of rape by
vocalizing rape which has often remained
silenced. The fear of rape and rape that
remains within the domain of the unspoken is
now a clearly identified concern:
Rape and sexual assault, as with all
violence against women, remains a
significant social problem. The true
prevalence and incidence of rape and
sexual violence is very difficult to
measure, largely because sexually violent
acts most often happen in private spaces
(Stanko and Williams 2009; McMillan
2011). It is also the case that rape is one
of the most under-reported crimes,
therefore statistics about reported crime
betray the true prevalence of rape, which
is likely to be much higher (Koss and
Harvey 1991). (McMillan, 2013, p 72)
With reports of child abuse and gang rape
appearing in the print media and visual media
every day, the ubiquitous nature of rape has
almost blunted an urgent response to it,
though it has not stopped feminists from
analyzing the response to rape victims:
A pattern of derogatory judgements about
rape victims has been documented at every
level of society, prompting researchers to
analyse how and consider why people
respond to rape victims so negatively in
comparison to victims of other criminal
offences (Krahe 1991). Although most
people would recognize in the abstract that
rape is a morally unjustifiable act, it seems
that rape victims are nevertheless
particularly likely to be monitored for their
`innocence' and the degree of that
innocence in the incident itself (Lee,1984).
Public declarations of rape are scrutinized
and debated in the media and in everyday
interaction. (Anderson & Doherty, 2008, p
4)
In the world of Temple, an awareness
of the deeper passions that appear as part of
growing up is looked upon as moment of
agony, fear and utter loneliness creating a
sense of disjointed existence. The imagery
that builds up this picture does not point
towards a healthy acceptance of body. The
body's response to powerful passions is
conceived in unhealthy images: “... evenly it
spread / its humid fever into the waiting
brain” (15). The landscape is in accord with
the emotion evoked. The animal imagery
makes the setting appropriate for the
unhealthy picture of the body that controls the
natural processes of the mind:” the flood
graved village / ran briskly on and halted and
stared / like a chameleon faint with fear in the
sun” (15). This mingles with the fear of the
woman, the importance of chastity, the failure
to break free of the concept of chastity as a
presence, the awareness of being caught
within the mesh of religious purity and of
identity stemming solely from purity. The
woman in Temple is caught in “the fear of the
four thousand years of time” and “the earth-
taste under the skin” the former standing for
culture and religion and the latter for a social
reality firmly rooted to the earth to which she
belongs (16).
The woman in Temple is haunted by
an acute sense of social reality that she learns
to live with from a very early age: “One
nostril bored for the warming stud she never
wore” (16). The adolescent body remains the
point of concern when he writes of the “new-
born breasts’ slow rise” (15). The
impossibility of the definition of womanhood
independent of religion is seen in “... small
flames of vermilion played / upon the shrine
of her bare bone” (16). Mahapatra allows
social markers of class through oblique
suggestions: “Those pouting hands patted
Vidyabharati International Interdisciplinary Research Journal (Special Issue) ISSN 2319-4979
Special Issue on Engineering Technologies and Management 3745
platters of dung / on her hovel’s mud walls”
(16).
The unravelling of the universe of the
hitherto unknown body, is handled in a tragic
and realistic way, denying any possibility of a
positive beginning. The position continues to
be one that conforms to the view of the body
and the specific experiences of the female as
a curse, a need for a certain degree of
introvertedness associated with the outward
flow of the body towards womanhood which
is to some extent prescribed by society:
then, when the curse came,
everyone
could tell it by the way she shrank
into herself
the mask settling on her face,
her body seeming heavier than what it was
the world passing into flames
under her feet, (16-17)
The description of the first period that
Mahapatra presents conforms to the long
tradition of representation:
When menstruation is mentioned, it is
rarely spoken of directly but more often
euphemistically…. The silence about
menstrual experiences in literature has,
until recently, been broken only by
accounts of a woman’s first period. These
accounts often recollect feelings of horror
and confusion, or fear about apparently
inexplicable bleeding Hence, they fit the
dominant patriarchal discourse of
menstruation as unexpected, painful,
gushing blood. (Walker, 1997, p 3)
The bodily process of menstruation is situated
well within the lunar cycle as Mahapatra
notes: “And the moon hives in her body / her
face a mask. / Crimson rivulets run in an
epileptic dawn. (16 -17). Mahapatra here
touches upon a concept that has very ancient
roots:
Menstruating woman… has historically
been separated as a class pertaining to her
reproductive difference, which has
marked her dangerous, polluted and
potentially hysterical, on the one hand,
and magical, even sacred, on the other
hand—exposing a dangerous binary at
work in patriarchal cultures that must be
overturned. Indeed, it is women’s flow
that has historically been most impeded,
constrained and colonised globally owing
to its anomalous character, which can be
affirmatively re-articulated in relation to
women’s heterogeneous embodiment.
(Dyer,2020, p 5)
Though Mahapatra does not explore the
possibilities that Dyer senses, his description
of menstruation as a curse acknowledges the
existence of certain ideas in currency that
carry only negative connotations which can
be seen as the first step towards removing the
shame associated with bodily processes.
Mahapatra’s poetry does not explore the
possibilities of menstrual activism, a major
aspect of the later phases of feminism, nor is
it concerned with the dilemmas associated
with it but it does not refrain from attempting
an articulation of menstrual experience
though it does not in any way re-present the
same. The relevance of the need to open up
and of its possible implications have received
critical attention:
It is transgressive to resist the norm of
menstrual (and menopausal) concealment.
With notable exceptions, across cultures
and historical eras, we socialize this
biological process — including serious
inquiry into its form, function, and
meaning — into hiding. This is
shortsighted and at the same time deeply
revealing, as it shines a bright spotlight on
the need for change. After all, a dearth of
attention to a fundamental reality and
indeed a vital sign is not only a profound
knowledge gap, it is an exposure of the
power of misogyny and stigma to suppress
knowledge production (Bobel, 2020, p 1)
By writing about the onset of menarche and
how it is culturally received, Mahapatra
reminds one of the words of the menstrual
designer who produced Beauty in Blood:
If I have learned anything over the past
few years of producing Beauty in Blood it
is that menstruation matters more than
most people in society are willing to
recognize; it is deeply embedded in our
global body politics and is a major
contributor to the vast gender inequity
between men and women today.
Institutionalized hierarchies maintain and
support the outdated patriarchal belief that
menstruation makes the female body
Vidyabharati International Interdisciplinary Research Journal (Special Issue) ISSN 2319-4979
Special Issue on Engineering Technologies and Management 3746
inferior to the male body. (Lewis, 2020, p
viii)
The onset of menarche which is often seen as
the beginning of the possibility of a victory
over time and chance, a sign of procreative
capacity is eclipsed in a universe which is
more death-like in its aspects. The
significance of menarche has been pointed
out in feminist scholarship: “Experiences of
menstruation, while deeply personal and
embodied, also have an external biomedical
framing; menstrual blood is a private secret
that is expected to be concealed yet menarche
can have radical implications for a girl’s
lifestyle and mobility” (McCarthy & Lahiri-
Dutt,2020, p 15).
The implications of menarche for
Chelammal are negative. The universe with
its whirlpool of death and decay,
encompasses this significant event of life as
Mahapatra presents an image of afternoon,
with the river brooding over the burning
corpses on the bleak bank. Rivers, which
often stand for life and the flow of life are
juxtaposed with death and final dissolution. It
is in this context that Chelammal meets with
the realization: “She saw it all, the shallow
ponds / of her body strangling / to the mauve
tissues of, hyacinth” (17). Negative images
tumble out rejecting the possibility of any
promise of life or anything good as the stanza
closes with the images of the scattered
footsteps of virgins about like cattle-bones,
dry ordure” (17). The United Nations report
(2019) on the negative impact of
menstruation draws attention to the severity
of the situation:
The stigma and shame generated by
stereotypes around menstruation have
severe impacts on all aspects of women’s
and girls’ human rights, including their
human rights to equality, health, housing,
water, sanitation, education, freedom of
religion or belief, safe and healthy
working conditions, and to take part in
cultural life and public life without
discrimination. (Winkler,2020, p 9)
The accumulation of the morbid images
cancels out the traditionally positive
association of youth. The traditional girl
grows up surrounded by the presence of
elders. The growth of Chelammal’s body is
exposed to turmeric and myth and the aroma
of ritual” (18). The treatment of marriage in
this universe does not differ from the attitude
towards the impulse of the body for the
affirmation of life. The poet does not lose
sight of the large landscape against which
such phases of life are presented. The
landscape presented is one of social reality.
Marriage in Temple is firmly
entrenched in social reality and the possibility
of the romantic treatment of marriage as done
by the older generation is looked upon with
disfavour. The self-situated in "the turmeric
and myth and the aroma ritual" is always
conscious of the setbacks that marriage is
bound to have (18). The gradual change that
is bound to come over emotions that were
once considered desirable is a part of the
poetic universe of Mahapatra. The essential
passion that is to be consummated within the
framework of a marital relationship is
conceived in images that do not have
anything appealing about them. This universe
is defined by the staleness and transience of
such desires: “to resist with impassive face /
the unappeased lust that shall slowly settle /
like shallow back-waters in her mind” (19).
These images of stasis which contradict the
widely accepted nature of physical passions
evoke notions of passivity and life denial. The
imagery of stagnant water emphasizes the
notion of lack of fertility. This contradicts the
qualities traditionally associated with water.
This is not the water of life. The sense of
loneliness emanates from “the equation of
flushed and / unflushed tides / of her body's
promise” (19) The movement from the
promise “of the laquered spread / of peacock
feathers of her arm” to the pathetic "sense of
a small stranded crab” mirrors the movement
that is inevitable to all women in the world of
Mahapatra (19). The image of a new
consciousness of the body is lyrically
presented. The gold dust air of mustard fields
allows Chelammal one day where she
discovers with the tenderness and compassion
that “legs were mere things to run with” (20).
This mood does not last long: “The sky of
hidden footsteps / sprawling around the
woken waist where she had concealed a
copper coin / along with the saddened faces
of an indiscreet shame” also carries with it the
Vidyabharati International Interdisciplinary Research Journal (Special Issue) ISSN 2319-4979
Special Issue on Engineering Technologies and Management 3747
harsh reality in which she is trapped and is
placed beside an image that is distinctly
different (20).
The voice of Chelammal builds a
picture of her world which is conscious of her
place in her home, an approach which is
totally realistic. It is oriented towards the
social reality in which she is embedded. The
poverty and squalor of daily life is supported'
by "the cheap and benign gad in the corner"
(22) which supervises “an earthen rice-pot
simmer [ring] / over an impoverished flame”
(20).
This universe has vital ties with the
myth of feminine chastity. Mahapatra’s poem
provides instances of the inherent tension that
arises out of this myth 'about womanhood.
This sense of womanhood as a potentially
privileged, but really limiting condition is
promoted by religion and this creates a
stifling sensation in the mind of the woman
for whom the impulses of the body are quite
real. The resultant sense of guilt, helplessness
and rebelliousness are quite conspicuous in
many sections of Temple: “Our minds were
tied to the myth / that womanhood was pure,
one / with the repose of the gods, (23) but this
does not prevent Chelammal from raising the
question: “But had I no right to dream? /
which happiness is mine, if not this one? (23).
The surging of a sense of renewed life can be
heard in Chelammal’s voice: “… my breath
once again / startles me with its promise of
paradise” (23).
The woman in Mahapatra's poetry is
slowly gnawed away by an overpowering
sense of reality that is both unpleasant and
hostile. This reality is controlled by a society
that is predominantly male. Her life is the
darkness of the day that makes it “... smaller,
sinking / through the slime of dead leaves and
rot” (28). The existence of woman in this
world does not have the support of a past.
Mahapatra insists that the present is a
continuation of the past with little variation.
This world impinges on the mind of the
woman, certain religious beliefs that tend to
snuff out all her desires and wishes. This
world cannot be a place for constructive and
soothing relations. Woman is seen only as a
means, a non-entity. Woman has come to live
with the image of herself as a commodity
“and the fall of a hand on the shoulder / was
seed of mere repayment / recompense that
brings only pain” (29).
The woman tries to seek solace in
God. Religion cannot offer her solace: she
looks "to the god waiting on her old torn
calendar"(29). But religion fails to unload her
burden. Religion is only a mean voice /
circling like a stubborn fly around her rotting
loss” (29) The image of woman that
Mahapatra constructs in his poetry is that of a
trapped animal, her fate controlled and
charted by a male-dominated society. The
helplessness and fragility of the woman
surface soon : “For like the fish spawned in
rice fields / wasn’t she fated to be caught /
when the terraces were finally drained ?”
(29).
The woman in Temple is surrounded
by the rough noose of ownership and has
internalized a system that makes her accept
the "quiet bait of blood" as a sort of duty and
her frightened existence is nothing but “frail
of paper like an origami crane in the wind”
(31). She had stopped functioning somewhere
in the past. Mahapatra’s attack is directed at a
system that turns womanhood into an
insignificant faceless being that has only
marginal importance: “She simply fuses into
a pale thick smile, / a faceless shell on a
beach” (31). The psyche of the woman in
Mahapatra’s poetry goes through a process of
realization which makes the woman cling on
to the memories of the past. To fight the
"dream dark of the present” she has to walk
with the lighted lamps of the past life. The
woman is forced to dream the dreams, the
older generations have given here, dreams
which return “like the strange voices of swans
that return without fail / in the time of
wandering of autumn on the Ganga. (32).
Yet the need to question the position
assigned to her can only be stifled in this
world because the Sacred Kingdom man
evokes is based on the cowardice of women
and lacking stronger foundations. This society
has successfully inculcated in woman the
belief that a woman’s life is dependent on her
sons and has nothing to do with her existence
as such. Men are in fact the image makers and
they are responsible for creating an inflated
image of womanhood and then consciously
Vidyabharati International Interdisciplinary Research Journal (Special Issue) ISSN 2319-4979
Special Issue on Engineering Technologies and Management 3748
demanding more from the woman and then
humiliating her. Woman is still a prey to the
“incredible lie of tenderness” (33). Solitude is
her sole companion and the "ashes of solitude
scour her womb" (33).
The woman in Mahapatra’s poetry has
lost the will to long for, and she is in the
"autumn of her longing" looking up towards
"the dreamless dawn" of her fate (34). She
remains among the males, moving backward
in solitude to the realm of memory. The
woman is caught in the trap of myth and she
is made to conceive it with a sense of pity
though it turns into a sense of captivity.
Mahapatra asks the agonizing question: “Did
her simple eye press against the piety of a
myth's cage / like eager hands at the bars of
some zoo? (34). The woman cannot escape
from her fate but she cannot help wondering
“what makes the dance of unreason go on /
what bones kill the peace that flesh seeks /
what plucks the words from the epics?” (36)
Man fails to understand the woman
and tends to suppress her voice. And the
suppressed voice comes in the dream as
Chelammal’s voice. This voice has come to
believe that even her ill feelings are not to be
expressed while physical relations fail to give
meaning to life. The image conceived of
woman is that of an animal destroyed and
defeated by the male, with the help of
tradition. The pain, despair and hopelessness
become explicit when the voice of
Chelammal admits: “they do not fear me /
because I am in fear of them” (38). The fear
that one may be assaulted any time is sadly
part of a woman’s life and has a long history:
“From prehistoric times to the present, I
believe, rape has played a critical function. It
is nothing more or less than a conscious
process of intimidation by which all men
keep all women in a state of fear”
(Brownmiller 15). She is the victim of a
society which is addicted to the tragic rites of
women's looks. The "bloodless eyes" of the
society destroy women dressed in spotless
white. This woman is caught in a space which
is encircled by the "dust of lies" and the
"scabs of myth" and she is trapped in an
"ominous jungle" from which her quickened
pace cannot save her. (40)
Woman, as presented in Temple is
always at the receiving end and lacks mastery
over the circumstances in which she finds
herself. Existing in a space created by others,
her life is controlled by them and is forced to
bear the pain of experiences that she does not
desire. The woman lacks vigor and vitality
and she is one
…with life enough for death
to pass through
lonely as an acre of farm land
mist and mornings in its
throat
bursting with the rice it did
not choose. (45)
The sense evoked in the above lines is one of
helplessness of the woman. Mahapatra
presents women who lack agency in life
through the traditional image of the woman as
a field, its presence and identity
acknowledged and established only with the
presence of man. The religious image of the
woman which combines the divine with its
destructive and benign aspects is in sharp
contrast with the present condition of woman
who is caught in the “monstrous
haemorrhoids of beliefs” that construct her
(54). Mahapatra suggests that a woman like
Chelammal, completely circumscribed by the
patriarchal system, cannot have what is
generally designated as the divinely
destructive aspect that is often part of popular
imagination.
Conclusion
Temple, through the life and death of
Chelammal thus convincingly puts forward
the idea that from time to time, man has
explained woman with his concept of
"Lakshmana Rekha" which he constructs
according to his need in diverse forms. So
from the first heaviness of her body with its
crimson rivulets running in an epileptic dawn
to the "long afternoon" that set fire to her
bones, she is a prisoner of an Idea, of society,
of religion, and of even a lower God which is
man (51). She is the victim of a peculiar
concept of death with its potentiality of
Moksha even in a paradoxical act which is
both homicide and suicide, to pacify and
make her inactive. It seems that the
inculcation of such an idea would rather make
Vidyabharati International Interdisciplinary Research Journal (Special Issue) ISSN 2319-4979
Special Issue on Engineering Technologies and Management 3749
her remain within the framework that man has created for her without her knowing.
References
1. Anderson, Irina & Kathy Doherty. (2008).
Accounting for Rape: Psychology,
Feminism and Discourse Analysis in the
Study of Sexual Violence. East Sussex:
Routledge.
2. Bobel, Chris. (2020). “Introduction:
Menstruation as Lens—Menstruation as
Opportunity.” In Chris Bobel, Inga T
Winkler, Breanne Fahs, Katie Ann
Hasson, Elizabeth Arveda Kissling &
Tomi-Ann Roberts (eds.), The Palgrave
Handbook of Critical Menstruation
Studies (pp.1-5). Gateway East Singapore:
Palgrave Macmillan.
3. Brownmiller, Susan. (1975). Against Our
Will: Men Women and Rape. New York:
Fawcet Columbine.
4. Dyer, Natalie Rose. (2020). The
Menstrual Imaginary: Notes on a Wild
Fluidity. Cham, Switzerland: Palgrave
Macmillan.
5. Frigon, Sylvie. (2006). “Mapping Scripts
and Narratives of Women Who Kill Their
Husbands in Canada, 1866–1954:
Inscribing the Everyday.” In Annette
Burfoot &Susan Lord (eds.), Killing
Women: The Visual Culture of Gender
and Violence (pp. 3-20). Ontario:
Wilfrid Laurier University Press.
6. Lazard, Lisa. (2020). Sexual Harassment,
Psychology and Feminism Me Too, Victim
Politics and Predators in Neoliberal
Times. Cham, Switzerland: Palgrave
Pivot.
7. Lewis, Jen. (2020). “About the Cover:
Beauty in Blood— A Macrophotographic
Lens on Menstruation, Body Politics, and
Visual Art.” In Chris Bobel , Inga T.
Winkler ,Breanne Fahs , Katie Ann
Hasson ,Elizabeth Arveda Kissling &
Tomi-Ann Roberts (eds.). The Palgrave
Handbook of Critical Menstruation
Studies (pp.7-8). Gateway East Singapore:
Palgrave Macmillan.
8. Mahapatra, Jayanta. (1989). Temple.
Sydney: Dangaroo Press.
9. McCarthy, Annie & Kuntala Lahiri-Dutt.
(2020). “Bleeding in Public? Rethinking
Narratives of Menstrual Management
from Delhi’s Slums. “In Chris Bobel, Inga
T Winkler, Breanne Fahs, Katie Ann
Hasson, Elizabeth Arveda Kissling &
Tomi-Ann Roberts (eds.), The Palgrave
Handbook of Critical Menstruation
Studies (pp.15-30). Gateway East
Singapore: Palgrave Macmillan.
10. McMillan, Lesley. (2013). “Sexual
Victimisation Disclosure, Responses and
Impact.” In Nancy Lombard &Lesley
McMillan(eds.), Violence against
Women: Current Theory and Practice
Current Theory and Practice in Domestic
Abuse, Sexual Violence and Exploitation
(pp. 71-86). London: Jessica Kingsley
Press.
11. Walker, Anne E. (1997). The Menstrual
Cycle. London: Routledge.
12. Winkler, Inga T. (2020). “Menstruation as
Fundamental” In Chris Bobel, Inga T.
Winkler, Breanne Fahs, Katie Ann
Hasson, Elizabeth Arveda Kissling &
Tomi-Ann Roberts (eds.), The Palgrave
Handbook of Critical Menstruation
Studies (pp.9-14). Gateway East
Singapore: Palgrave Macmillan.
Vidyabharati International Interdisciplinary Research Journal (Special Issue) ISSN 2319-4979
Special Issue on Engineering Technologies and Management 3750
EFFECTIVENESS OF STATUTORY WARNING ADVERTISEMENT IN KERALA
Dr. Sumi Alex
Assistant Professor &Head of the Department, Research and Post-Graduation Department of Commerce, St.
Gregorios College Kottarakara, Kollam, Kerala
ABSTRACT
This research study has given extensive coverage regarding the effectiveness of warning advertisements in Kerala,
especially among young age people. The study has followed clear and concise objectives i.e., identifying the reason for
using alcohol and tobacco products, smoking and drinking pattern of youth in Kerala and the effectiveness of warning
advertisement among youth in Kerala. The purpose of statutory warning advertisement is to justify the formation of
objectives because a warning advertisement was introduced to reduce the usage of tobacco and alcohol. But still, India
has been witnessing a large quantity of legal and illegal tobacco and alcohol products supply. In this context, this study
has attempted to find whether the warning advertisement is effective or not. Five highly populated districts were
selected from three zones of Kerala as the study area by using the judgment sampling method. The study surveyed 792
respondents and those respondents were selected based on age criterion. The multi-dimensional analysis has given the
exact perception of respondents regarding the presentation and content of statutory warning advertisement and also
reveals the reason for starting smoking and drinking habit and reason for stop the same. Based on the consideration of
these aspects and the analysis of collected data, it could be seen that warning advertisement is not effective among
young age people in Kerala.
Keywords: Statutory warning, tobacco, alcohol, drinking pattern, smoking, perception, inactive user
Introduction
Tobacco and alcohol use is responsible for
increasing health problems and death among
people in Kerala and the usage of tobacco and
alcohol are the leading preventable cause of
death worldwide. As per the Global Adult
Tobacco Survey report, on average, tobacco
and alcohol users are losing 15 years of their
life and most of the deaths are recorded on
account of these products' usage. The report
also says that most of the death is happening
in middle and low-income nations, and
worldwide almost 80 percent of the death is
recorded on account of tobacco usage.
According to the WHO report 2014, 38.3
percent of the world's population is reported
to consume alcohol regularly and an
individual's consumption of alcohol per year
is 6.2 liters. Again this report also mentioned
that 30 percent of the Indian population
consumes alcohol regularly and 11 percent of
the Indians are moderate to heavy drinkers.
The average Indian consumes 4.3 liters of
alcohol per year and the average rural Indian
consumes 11.4 liters of alcohol per year
(WHO- Global Status Report on Alcohol and
Health, 2014). Alcohol and Tobacco usage
lead to major health problems like chronic
liver disease, cancers, cardiovascular disease,
acute alcohol poisoning, lung disease,
cancers, and cardiovascular disease (National
Alcohol Abuse and Alcoholism, 2007). They
repeatedly say that alcohol and tobacco usage
is preventable, thus many governments have
taken several measures for preventing the
usage of alcohol and tobacco products, but
still, people are using these types of products.
In this context, this study has gone through a
detailed review of prior studies and cases for
giving proper background and to illustrate the
reason for researching the effectiveness of
statutory warning advertisements on Tobacco
and Alcohol products.
Statement of Problem
Alcohol and tobacco use is the most
dangerous preventable couple cause of death
all over the world. In each year millions of
death are recorded under alcohol and tobacco
use. On average, tobacco users lose 15 years
of life. Up to half of all tobacco users will die
prematurely due to tobacco-related causes by
any year or time estimation. Most of these
deaths will be in middle and low-income
nations, which would account for almost 80
percent of all tobacco-related deaths (WHO
Report, 2008). The GAT (Global Adult
Tobacco Survey) report indicates that 34.6
percent of adults in India were using tobacco
in some form or the other. While 9 percent
said they only smoked tobacco, 21 percent
consumed tobacco in the smokeless form.
Vidyabharati International Interdisciplinary Research Journal (Special Issue) ISSN 2319-4979
Special Issue on Engineering Technologies and Management 3751
Later World health organization has
conducted a Global Adult Tobacco second-
round survey and this report indicates that
28.6 percent of adults in India were using
tobacco in some form and among the current
tobacco users in India, 87 percent are daily
users, and the remaining 13 percent of them
are occasionally using tobacco. The
interesting fact is that 24.9 percent of all
adults are using tobacco on daily basis and
3.7 percent of all adults are using tobacco
occasionally (GAT 2, 2018). The GAT 1 and
GAT 2 have revealed that numbers of tobacco
users were decreased during the period
between the two reports. The GAT 1 report
says that in India there are 274.9 million
tobacco users (age 15 and above) Among
them, 197.0 million are males and 77.9
million are females; and 216.0 million are
tobacco users from rural areas and 58.8
million are from urban areas. After seven
years, GAT 2 report reveals that the number
of tobacco users was reduced and now at
present in India, there are 266.8 million
tobacco users aged 15 or above. Among
current users, 202.0 million are men and 64.8
million are women. (GAT 2, 2018). This
indicates that the total number of tobacco
users was reduced but male tobacco users
were increased and female tobacco users were
reduced. In this context, this research study
has gone through the effectiveness of warning
advertisements in Kerala focused on young
age people to find out whether there is any
significant evidence that warning
advertisements (tobacco and alcohol) have
any significant effectiveness among young
age people from Kerala to reduce their usage
because of warning advertisement.
Objectives of the Study
1. To identify the reason for using
alcohol and tobacco products
2. To study the smoking and drinking
pattern of youth in Kerala
3. To study the effectiveness of warning
advertisements among youth in
Kerala.
Methodology of the Study
The study has used both descriptive and
analytical designs. Secondary and primary
data were used in the study. Secondary data
were collected from World Health
Organization Report-Global Adult Tobacco-
First and Second Round survey report (2010
and 2018), Global status report on alcohol
and health, 2018 (WHO), Crime Records
Bureau Kerala, National Crime Records
Bureau, National Alcohol Abuse and
Alcoholism, 2007 report, Ministry of Health
and Family Welfare-India, Published thesis,
article, and books related to tobacco and
alcohol usage. Primary data were collected
from young age people of Kerala, including
males and females. A structured questionnaire
was used to collect the opinion of sample
respondents.
Based on their survey, it was found that most
of the tobacco and alcohol users were from
this age group. Hence, Age 15 to 45 was
again categorised into three groups i.e., 15 -
25 years age group, 26 - 35 years age groups,
and 36 to 45 years age group. Then 132
sample size was again equally distributed
among the three age groups of rural and three
age groups of the urban area i.e., sample sale
from each age group (Urban 22×3 age
group=66 samples, Rural 22×3 age group=66
samples). Districts were selected by the ng
judgment sampling method with defined
criteria. Criterion with as highest populated
district total number of population was
identified from 2011 census reported total
sample size was fixed by using Neyman
Sample size calculation purposive sampling
method was again used to select sample
respondents from selected districts. The
criterion was sample respondents' age should
be between 15-45.
Analysis and Discussion
This part is illustrating the analysis result of
the collected data. A well-structured
questionnaire was used to collect the data
from 792 sample respondents. Collected data
were recorded and coded with the help of the
SPSS 25th version. Descriptive and Inferential
statistics were used to analyse the data. The
analysis tools were selected according to the
nature of variables, research questions, and
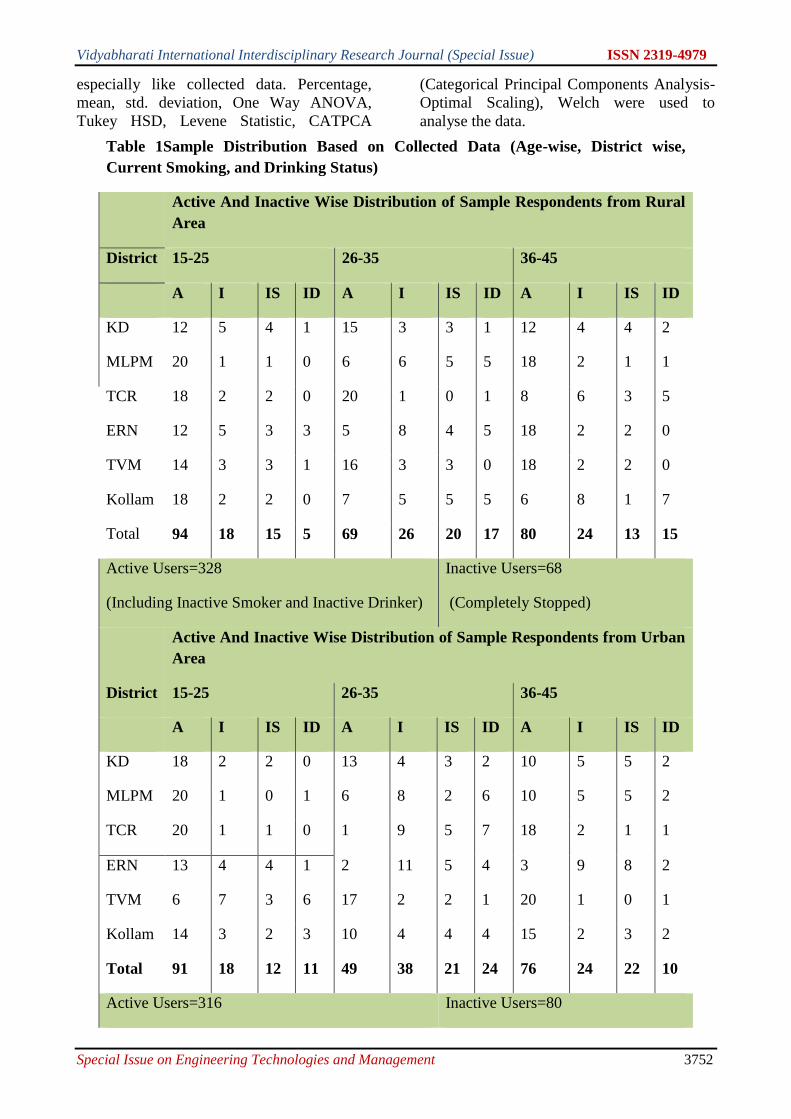
Vidyabharati International Interdisciplinary Research Journal (Special Issue) ISSN 2319-4979
Special Issue on Engineering Technologies and Management 3752
especially like collected data. Percentage,
mean, std. deviation, One Way ANOVA,
Tukey HSD, Levene Statistic, CATPCA
(Categorical Principal Components Analysis-
Optimal Scaling), Welch were used to
analyse the data.
Table 1Sample Distribution Based on Collected Data (Age-wise, District wise,
Current Smoking, and Drinking Status)
Active And Inactive Wise Distribution of Sample Respondents from Rural
Area
District 15-25 26-35 36-45
A I IS ID A I IS ID A I IS ID
KD 12 5 4 1 15 3 3 1 12 4 4 2
MLPM 20 1 1 0 6 6 5 5 18 2 1 1
TCR 18 2 2 0 20 1 0 1 8 6 3 5
ERN 12 5 3 3 5 8 4 5 18 2 2 0
TVM 14 3 3 1 16 3 3 0 18 2 2 0
Kollam 18 2 2 0 7 5 5 5 6 8 1 7
Total 94 18 15 5 69 26 20 17 80 24 13 15
Active Users=328
(Including Inactive Smoker and Inactive Drinker)
Inactive Users=68
(Completely Stopped)
Active And Inactive Wise Distribution of Sample Respondents from Urban
Area
District 15-25 26-35 36-45
A I IS ID A I IS ID A I IS ID
KD 18 2 2 0 13 4 3 2 10 5 5 2
MLPM 20 1 0 1 6 8 2 6 10 5 5 2
TCR 20 1 1 0 1 9 5 7 18 2 1 1
ERN 13 4 4 1 2 11 5 4 3 9 8 2
TVM 6 7 3 6 17 2 2 1 20 1 0 1
Kollam 14 3 2 3 10 4 4 4 15 2 3 2
Total 91 18 12 11 49 38 21 24 76 24 22 10
Active Users=316 Inactive Users=80
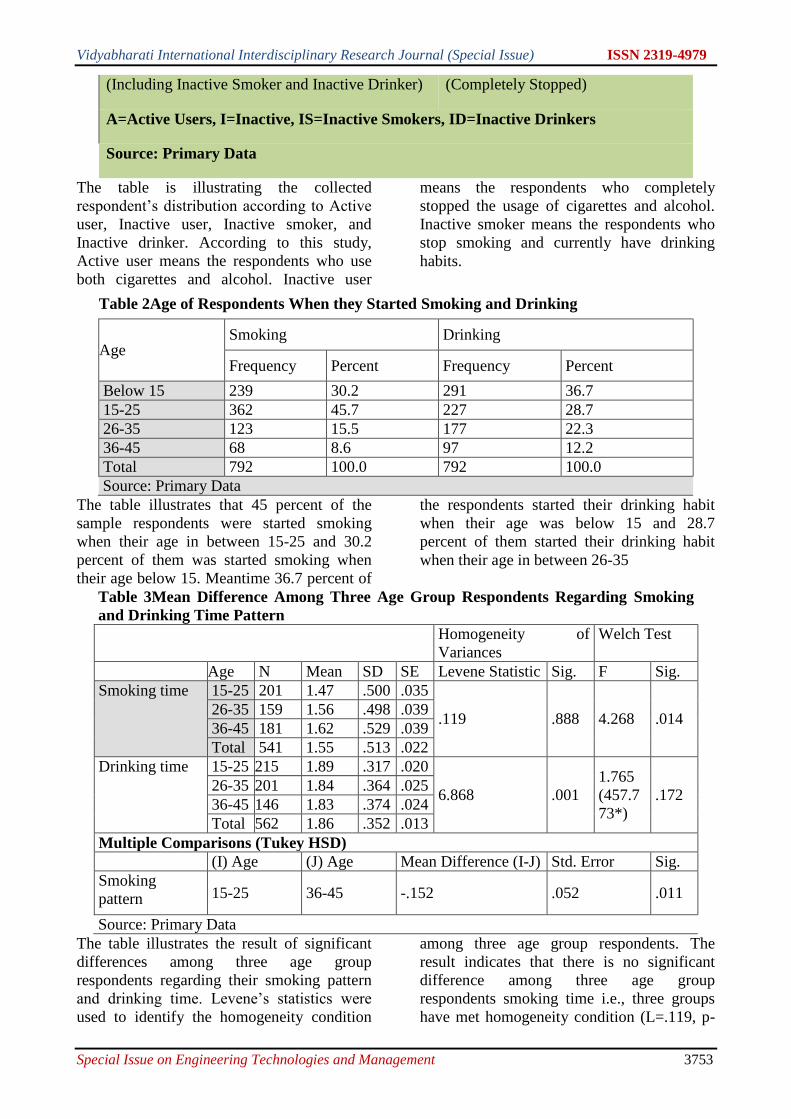
Vidyabharati International Interdisciplinary Research Journal (Special Issue) ISSN 2319-4979
Special Issue on Engineering Technologies and Management 3753
(Including Inactive Smoker and Inactive Drinker) (Completely Stopped)
A=Active Users, I=Inactive, IS=Inactive Smokers, ID=Inactive Drinkers
Source: Primary Data
The table is illustrating the collected
respondent’s distribution according to Active
user, Inactive user, Inactive smoker, and
Inactive drinker. According to this study,
Active user means the respondents who use
both cigarettes and alcohol. Inactive user
means the respondents who completely
stopped the usage of cigarettes and alcohol.
Inactive smoker means the respondents who
stop smoking and currently have drinking
habits.
Table 2Age of Respondents When they Started Smoking and Drinking
Age Smoking Drinking
Frequency Percent Frequency Percent
Below 15 239 30.2 291 36.7
15-25 362 45.7 227 28.7
26-35 123 15.5 177 22.3
36-45 68 8.6 97 12.2
Total 792 100.0 792 100.0
Source: Primary Data
The table illustrates that 45 percent of the
sample respondents were started smoking
when their age in between 15-25 and 30.2
percent of them was started smoking when
their age below 15. Meantime 36.7 percent of
the respondents started their drinking habit
when their age was below 15 and 28.7
percent of them started their drinking habit
when their age in between 26-35
Table 3Mean Difference Among Three Age Group Respondents Regarding Smoking
and Drinking Time Pattern
Homogeneity of
Variances
Welch Test
Age N Mean SD SE Levene Statistic Sig. F Sig.
Smoking time 15-25 201 1.47 .500 .035
.119 .888 4.268 .014 26-35 159 1.56 .498 .039
36-45 181 1.62 .529 .039
Total 541 1.55 .513 .022
Drinking time 15-25 215 1.89 .317 .020
6.868 .001
1.765
(457.7
73*)
.172 26-35 201 1.84 .364 .025
36-45 146 1.83 .374 .024
Total 562 1.86 .352 .013
Multiple Comparisons (Tukey HSD)
(I) Age (J) Age Mean Difference (I-J) Std. Error Sig.
Smoking
pattern 15-25 36-45 -.152 .052 .011
Source: Primary Data
The table illustrates the result of significant
differences among three age group
respondents regarding their smoking pattern
and drinking time. Levene’s statistics were
used to identify the homogeneity condition
among three age group respondents. The
result indicates that there is no significant
difference among three age group
respondents smoking time i.e., three groups
have met homogeneity condition (L=.119, p-
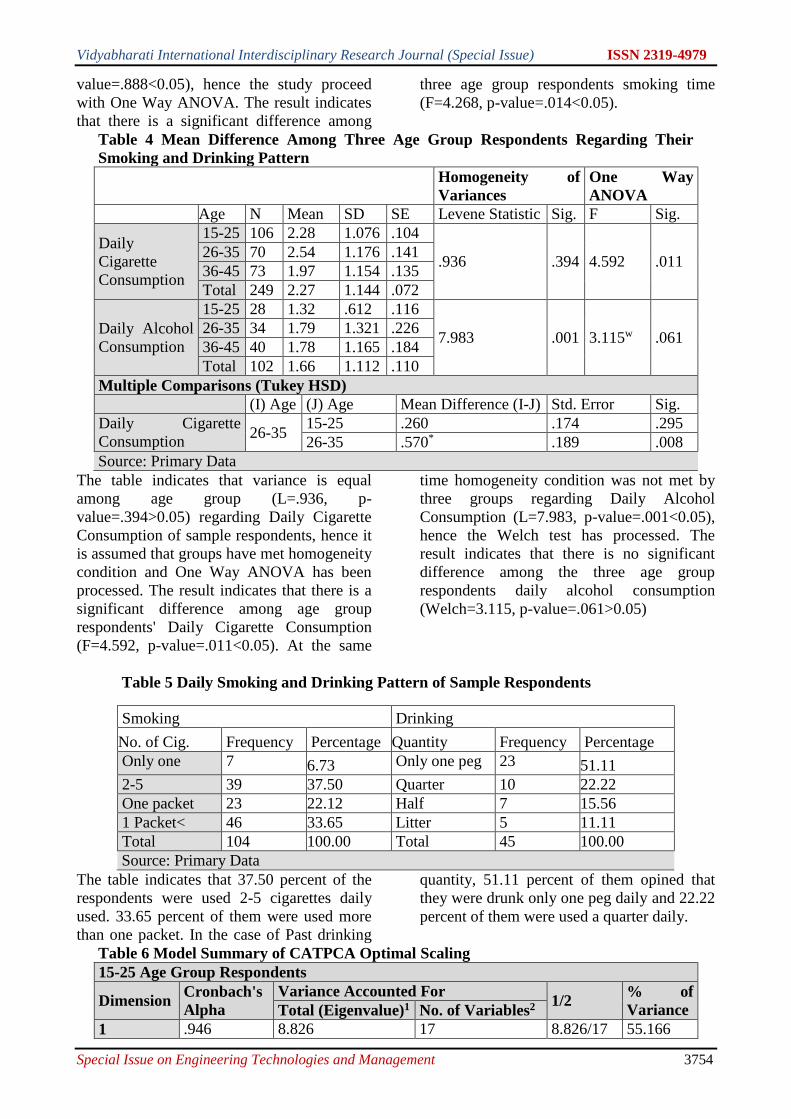
Vidyabharati International Interdisciplinary Research Journal (Special Issue) ISSN 2319-4979
Special Issue on Engineering Technologies and Management 3754
value=.888<0.05), hence the study proceed
with One Way ANOVA. The result indicates
that there is a significant difference among
three age group respondents smoking time
(F=4.268, p-value=.014<0.05).
Table 4 Mean Difference Among Three Age Group Respondents Regarding Their
Smoking and Drinking Pattern
Homogeneity of
Variances
One Way
ANOVA
Age N Mean SD SE Levene Statistic Sig. F Sig.
Daily
Cigarette
Consumption
15-25 106 2.28 1.076 .104
.936 .394 4.592 .011 26-35 70 2.54 1.176 .141
36-45 73 1.97 1.154 .135
Total 249 2.27 1.144 .072
Daily Alcohol
Consumption
15-25 28 1.32 .612 .116
7.983 .001 3.115w .061 26-35 34 1.79 1.321 .226
36-45 40 1.78 1.165 .184
Total 102 1.66 1.112 .110
Multiple Comparisons (Tukey HSD)
(I) Age (J) Age Mean Difference (I-J) Std. Error Sig.
Daily Cigarette
Consumption 26-35
15-25 .260 .174 .295
26-35 .570* .189 .008
Source: Primary Data
The table indicates that variance is equal
among age group (L=.936, p-
value=.394>0.05) regarding Daily Cigarette
Consumption of sample respondents, hence it
is assumed that groups have met homogeneity
condition and One Way ANOVA has been
processed. The result indicates that there is a
significant difference among age group
respondents' Daily Cigarette Consumption
(F=4.592, p-value=.011<0.05). At the same
time homogeneity condition was not met by
three groups regarding Daily Alcohol
Consumption (L=7.983, p-value=.001<0.05),
hence the Welch test has processed. The
result indicates that there is no significant
difference among the three age group
respondents daily alcohol consumption
(Welch=3.115, p-value=.061>0.05)
Table 5 Daily Smoking and Drinking Pattern of Sample Respondents
Smoking Drinking
No. of Cig. Frequency Percentage Quantity Frequency Percentage
Only one 7 6.73 Only one peg 23 51.11
2-5 39 37.50 Quarter 10 22.22
One packet 23 22.12 Half 7 15.56
1 Packet< 46 33.65 Litter 5 11.11
Total 104 100.00 Total 45 100.00
Source: Primary Data
The table indicates that 37.50 percent of the
respondents were used 2-5 cigarettes daily
used. 33.65 percent of them were used more
than one packet. In the case of Past drinking
quantity, 51.11 percent of them opined that
they were drunk only one peg daily and 22.22
percent of them were used a quarter daily.
Table 6 Model Summary of CATPCA Optimal Scaling
15-25 Age Group Respondents
Dimension Cronbach's
Alpha
Variance Accounted For 1/2
% of
Variance Total (Eigenvalue)1 No. of Variables2
1 .946 8.826 17 8.826/17 55.166
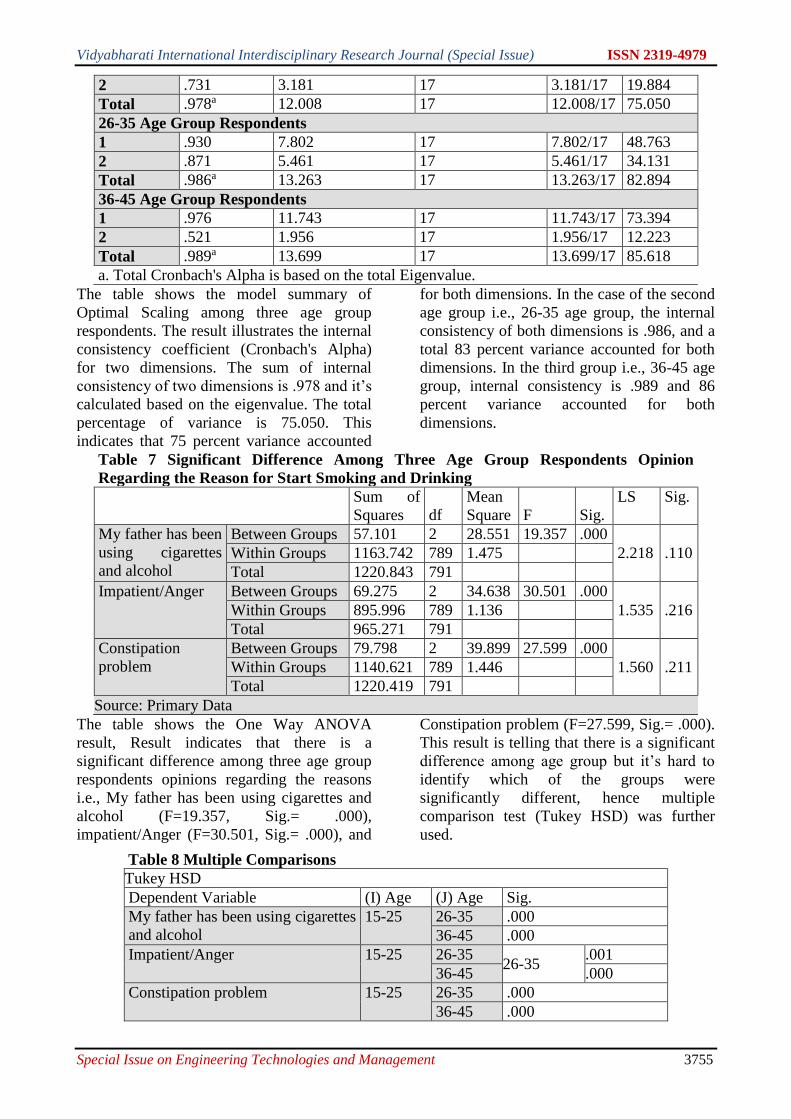
Vidyabharati International Interdisciplinary Research Journal (Special Issue) ISSN 2319-4979
Special Issue on Engineering Technologies and Management 3755
2 .731 3.181 17 3.181/17 19.884
Total .978a 12.008 17 12.008/17 75.050
26-35 Age Group Respondents
1 .930 7.802 17 7.802/17 48.763
2 .871 5.461 17 5.461/17 34.131
Total .986a 13.263 17 13.263/17 82.894
36-45 Age Group Respondents
1 .976 11.743 17 11.743/17 73.394
2 .521 1.956 17 1.956/17 12.223
Total .989a 13.699 17 13.699/17 85.618
a. Total Cronbach's Alpha is based on the total Eigenvalue.
The table shows the model summary of
Optimal Scaling among three age group
respondents. The result illustrates the internal
consistency coefficient (Cronbach's Alpha)
for two dimensions. The sum of internal
consistency of two dimensions is .978 and it’s
calculated based on the eigenvalue. The total
percentage of variance is 75.050. This
indicates that 75 percent variance accounted
for both dimensions. In the case of the second
age group i.e., 26-35 age group, the internal
consistency of both dimensions is .986, and a
total 83 percent variance accounted for both
dimensions. In the third group i.e., 36-45 age
group, internal consistency is .989 and 86
percent variance accounted for both
dimensions.
Table 7 Significant Difference Among Three Age Group Respondents Opinion
Regarding the Reason for Start Smoking and Drinking
Sum of
Squares df
Mean
Square F Sig.
LS Sig.
My father has been
using cigarettes
and alcohol
Between Groups 57.101 2 28.551 19.357 .000
2.218 .110 Within Groups 1163.742 789 1.475
Total 1220.843 791
Impatient/Anger Between Groups 69.275 2 34.638 30.501 .000
1.535 .216 Within Groups 895.996 789 1.136
Total 965.271 791
Constipation
problem
Between Groups 79.798 2 39.899 27.599 .000
1.560 .211 Within Groups 1140.621 789 1.446
Total 1220.419 791
Source: Primary Data
The table shows the One Way ANOVA
result, Result indicates that there is a
significant difference among three age group
respondents opinions regarding the reasons
i.e., My father has been using cigarettes and
alcohol (F=19.357, Sig.= .000),
impatient/Anger (F=30.501, Sig.= .000), and
Constipation problem (F=27.599, Sig.= .000).
This result is telling that there is a significant
difference among age group but it’s hard to
identify which of the groups were
significantly different, hence multiple
comparison test (Tukey HSD) was further
used.
Table 8 Multiple Comparisons
Tukey HSD
Dependent Variable (I) Age (J) Age Sig.
My father has been using cigarettes
and alcohol
15-25 26-35 .000
36-45 .000
Impatient/Anger 15-25 26-35 26-35
.001
36-45 .000
Constipation problem 15-25 26-35 .000
36-45 .000
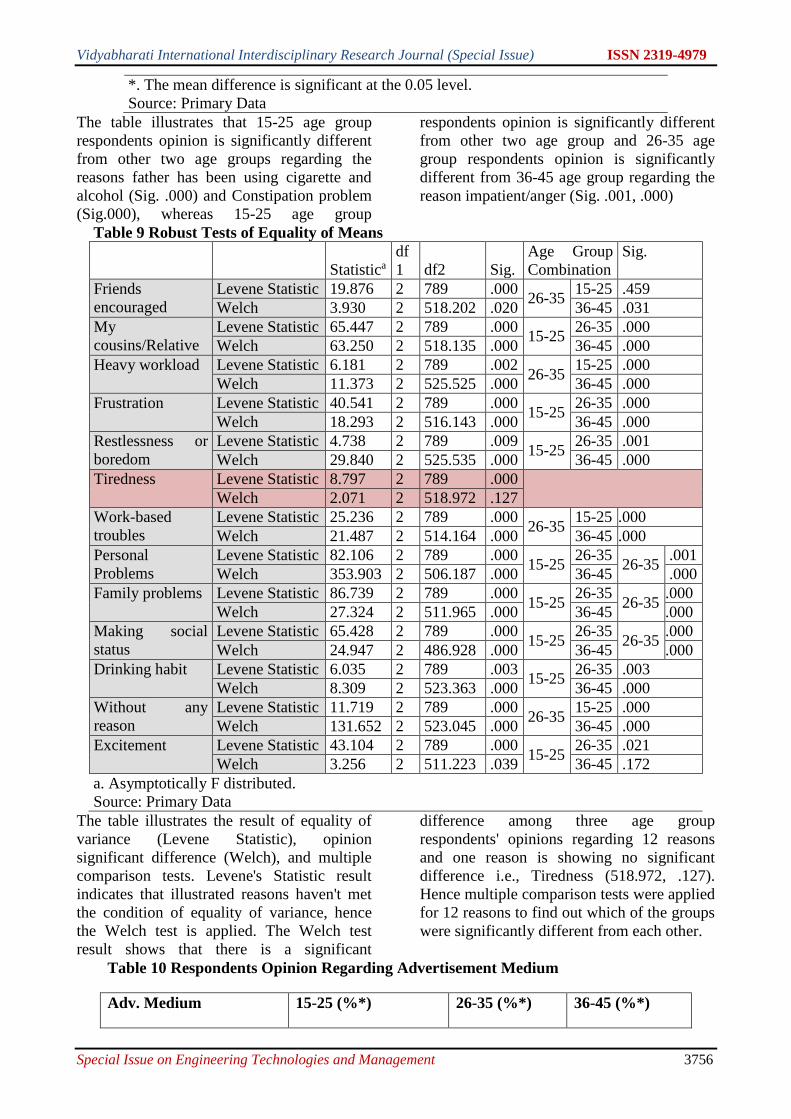
Vidyabharati International Interdisciplinary Research Journal (Special Issue) ISSN 2319-4979
Special Issue on Engineering Technologies and Management 3756
*. The mean difference is significant at the 0.05 level.
Source: Primary Data
The table illustrates that 15-25 age group
respondents opinion is significantly different
from other two age groups regarding the
reasons father has been using cigarette and
alcohol (Sig. .000) and Constipation problem
(Sig.000), whereas 15-25 age group
respondents opinion is significantly different
from other two age group and 26-35 age
group respondents opinion is significantly
different from 36-45 age group regarding the
reason impatient/anger (Sig. .001, .000)
Table 9 Robust Tests of Equality of Means
Statistica
df
1 df2 Sig.
Age Group
Combination
Sig.
Friends
encouraged
Levene Statistic 19.876 2 789 .000 26-35
15-25 .459
Welch 3.930 2 518.202 .020 36-45 .031
My
cousins/Relative
Levene Statistic 65.447 2 789 .000 15-25
26-35 .000
Welch 63.250 2 518.135 .000 36-45 .000
Heavy workload Levene Statistic 6.181 2 789 .002 26-35
15-25 .000
Welch 11.373 2 525.525 .000 36-45 .000
Frustration Levene Statistic 40.541 2 789 .000 15-25
26-35 .000
Welch 18.293 2 516.143 .000 36-45 .000
Restlessness or
boredom
Levene Statistic 4.738 2 789 .009 15-25
26-35 .001
Welch 29.840 2 525.535 .000 36-45 .000
Tiredness Levene Statistic 8.797 2 789 .000
Welch 2.071 2 518.972 .127
Work-based
troubles
Levene Statistic 25.236 2 789 .000 26-35
15-25 .000
Welch 21.487 2 514.164 .000 36-45 .000
Personal
Problems
Levene Statistic 82.106 2 789 .000 15-25
26-35 26-35
.001
Welch 353.903 2 506.187 .000 36-45 .000
Family problems Levene Statistic 86.739 2 789 .000 15-25
26-35 26-35
.000
Welch 27.324 2 511.965 .000 36-45 .000
Making social
status
Levene Statistic 65.428 2 789 .000 15-25
26-35 26-35
.000
Welch 24.947 2 486.928 .000 36-45 .000
Drinking habit Levene Statistic 6.035 2 789 .003 15-25
26-35 .003
Welch 8.309 2 523.363 .000 36-45 .000
Without any
reason
Levene Statistic 11.719 2 789 .000 26-35
15-25 .000
Welch 131.652 2 523.045 .000 36-45 .000
Excitement Levene Statistic 43.104 2 789 .000 15-25
26-35 .021
Welch 3.256 2 511.223 .039 36-45 .172
a. Asymptotically F distributed.
Source: Primary Data
The table illustrates the result of equality of
variance (Levene Statistic), opinion
significant difference (Welch), and multiple
comparison tests. Levene's Statistic result
indicates that illustrated reasons haven't met
the condition of equality of variance, hence
the Welch test is applied. The Welch test
result shows that there is a significant
difference among three age group
respondents' opinions regarding 12 reasons
and one reason is showing no significant
difference i.e., Tiredness (518.972, .127).
Hence multiple comparison tests were applied
for 12 reasons to find out which of the groups
were significantly different from each other.
Table 10 Respondents Opinion Regarding Advertisement Medium
Adv. Medium 15-25 (%*) 26-35 (%*) 36-45 (%*)

Vidyabharati International Interdisciplinary Research Journal (Special Issue) ISSN 2319-4979
Special Issue on Engineering Technologies and Management 3757
Television 79.2 73.5 72.0
News Paper 75.8 78.4 77.7
Movies at home 92.0 96.6 98.1
Theatre 86.4 81.1 78.0
Cigarette pack 73.1 69.7 71.2
Alcohol bottle 72.0 72.7 72.7
Billboards/hoardings 57.6 61.4 61.7
Source: Primary Data, *= Response percentage is calculated based on group total
The table illustrates that majority of the three
age group respondents are watching warning
advertisements when they watch movies at
home i.e., 92 percent (15-25), 97 percent (26-
35), and 98 percent (36-45)
Table 11 Respondents Opinion Regarding the Reason for stop smoking and drinking
S. N Reasons Response %*
1 Health Problem 128 38.44
2 The doctor advised me to stop drinking and smoking 210 63.06
3 Family forced 167 50.15
4 Friend forced 32 9.61
5 My teacher forced 43 12.91
6 My lover forced 65 19.52
7 My wife forced 245 73.57
8 After attending an alcohol and drug awareness seminar 24 7.21
9 Without any reason, I quit smoking/ drinking 97 29.13
10 Advertisement about the dangers of smoking & drinking 19 5.71
11 Printed warning advertisement on a cig. packet & liquor
bottle 32 9.61
Source: Primary Data, *= Response percentage is calculated based on group total (333)
The table illustrates the respondents’ opinions
regarding the reason for stopping smoking
and drinking. The majority (73.57 percent) of
them opined that their wife forced them to
quit smoking and drinking, 63.06 percent of
them opined that their doctor advised them to
stop, 50 percent of them opined that their
family forced and 33.44 percent of them quit
due to health problem. Based on the result it
could be said that awareness seminars (7.21
percent), advertisements (5.71 percent), and
printed advertisements (9.61 percent) are not
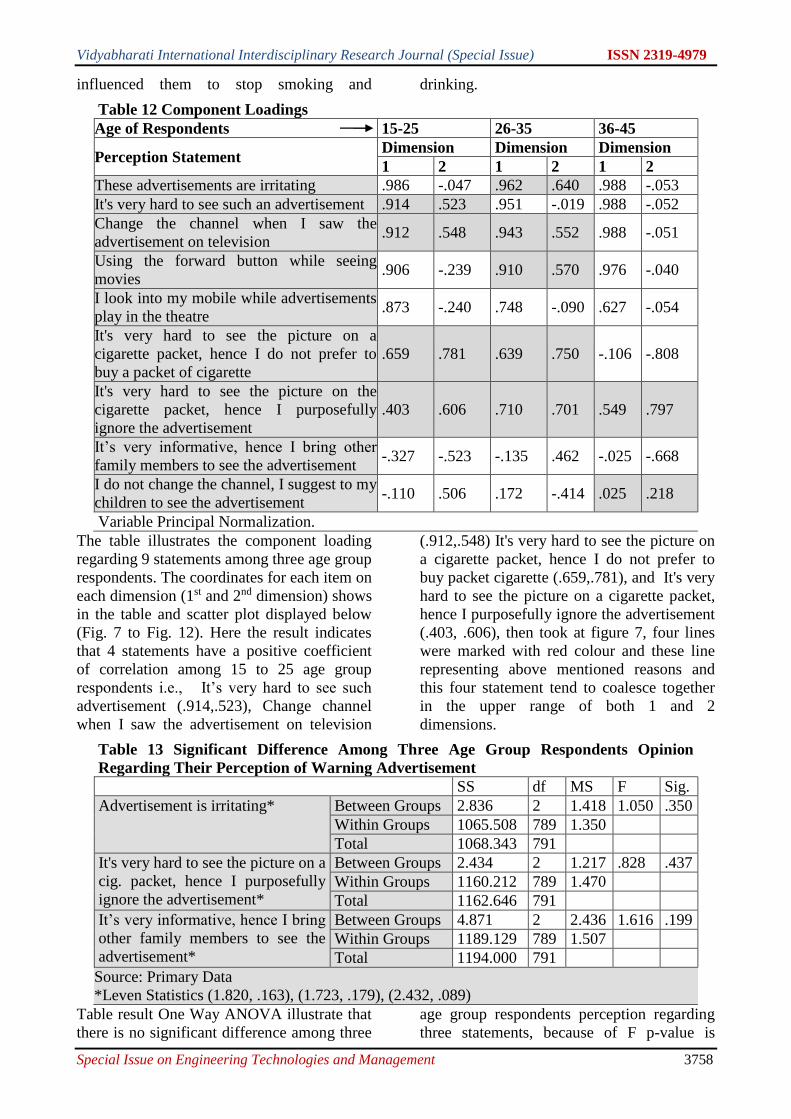
Vidyabharati International Interdisciplinary Research Journal (Special Issue) ISSN 2319-4979
Special Issue on Engineering Technologies and Management 3758
influenced them to stop smoking and drinking.
Table 12 Component Loadings
Age of Respondents 15-25 26-35 36-45
Perception Statement Dimension Dimension Dimension
1 2 1 2 1 2
These advertisements are irritating .986 -.047 .962 .640 .988 -.053
It's very hard to see such an advertisement .914 .523 .951 -.019 .988 -.052
Change the channel when I saw the
advertisement on television .912 .548 .943 .552 .988 -.051
Using the forward button while seeing
movies .906 -.239 .910 .570 .976 -.040
I look into my mobile while advertisements
play in the theatre .873 -.240 .748 -.090 .627 -.054
It's very hard to see the picture on a
cigarette packet, hence I do not prefer to
buy a packet of cigarette
.659 .781 .639 .750 -.106 -.808
It's very hard to see the picture on the
cigarette packet, hence I purposefully
ignore the advertisement
.403 .606 .710 .701 .549 .797
It’s very informative, hence I bring other
family members to see the advertisement -.327 -.523 -.135 .462 -.025 -.668
I do not change the channel, I suggest to my
children to see the advertisement -.110 .506 .172 -.414 .025 .218
Variable Principal Normalization.
The table illustrates the component loading
regarding 9 statements among three age group
respondents. The coordinates for each item on
each dimension (1st and 2nd dimension) shows
in the table and scatter plot displayed below
(Fig. 7 to Fig. 12). Here the result indicates
that 4 statements have a positive coefficient
of correlation among 15 to 25 age group
respondents i.e., It’s very hard to see such
advertisement (.914,.523), Change channel
when I saw the advertisement on television
(.912,.548) It's very hard to see the picture on
a cigarette packet, hence I do not prefer to
buy packet cigarette (.659,.781), and It's very
hard to see the picture on a cigarette packet,
hence I purposefully ignore the advertisement
(.403, .606), then took at figure 7, four lines
were marked with red colour and these line
representing above mentioned reasons and
this four statement tend to coalesce together
in the upper range of both 1 and 2
dimensions.
Table 13 Significant Difference Among Three Age Group Respondents Opinion
Regarding Their Perception of Warning Advertisement
SS df MS F Sig.
Advertisement is irritating* Between Groups 2.836 2 1.418 1.050 .350
Within Groups 1065.508 789 1.350
Total 1068.343 791
It's very hard to see the picture on a
cig. packet, hence I purposefully
ignore the advertisement*
Between Groups 2.434 2 1.217 .828 .437
Within Groups 1160.212 789 1.470
Total 1162.646 791
It’s very informative, hence I bring
other family members to see the
advertisement*
Between Groups 4.871 2 2.436 1.616 .199
Within Groups 1189.129 789 1.507
Total 1194.000 791
Source: Primary Data
*Leven Statistics (1.820, .163), (1.723, .179), (2.432, .089)
Table result One Way ANOVA illustrate that
there is no significant difference among three
age group respondents perception regarding
three statements, because of F p-value is
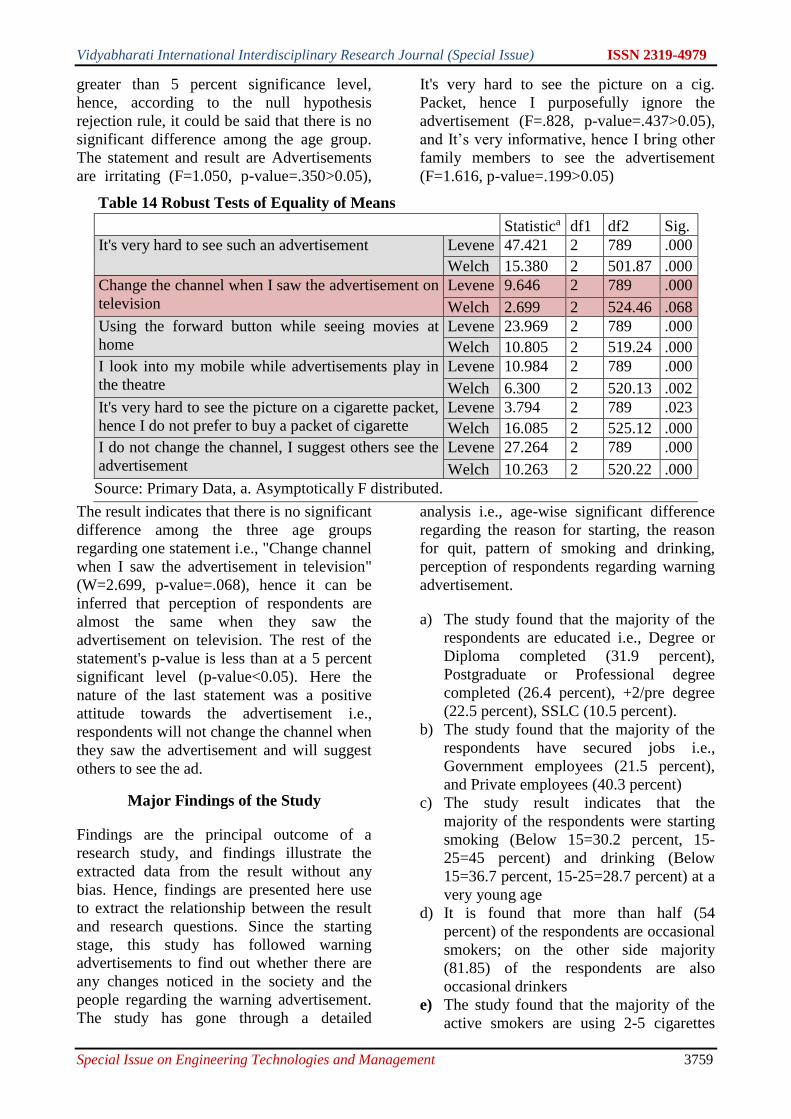
Vidyabharati International Interdisciplinary Research Journal (Special Issue) ISSN 2319-4979
Special Issue on Engineering Technologies and Management 3759
greater than 5 percent significance level,
hence, according to the null hypothesis
rejection rule, it could be said that there is no
significant difference among the age group.
The statement and result are Advertisements
are irritating (F=1.050, p-value=.350>0.05),
It's very hard to see the picture on a cig.
Packet, hence I purposefully ignore the
advertisement (F=.828, p-value=.437>0.05),
and It’s very informative, hence I bring other
family members to see the advertisement
(F=1.616, p-value=.199>0.05)
Table 14 Robust Tests of Equality of Means
Statistica df1 df2 Sig.
It's very hard to see such an advertisement Levene 47.421 2 789 .000
Welch 15.380 2 501.87 .000
Change the channel when I saw the advertisement on
television
Levene 9.646 2 789 .000
Welch 2.699 2 524.46 .068
Using the forward button while seeing movies at
home
Levene 23.969 2 789 .000
Welch 10.805 2 519.24 .000
I look into my mobile while advertisements play in
the theatre
Levene 10.984 2 789 .000
Welch 6.300 2 520.13 .002
It's very hard to see the picture on a cigarette packet,
hence I do not prefer to buy a packet of cigarette
Levene 3.794 2 789 .023
Welch 16.085 2 525.12 .000
I do not change the channel, I suggest others see the
advertisement
Levene 27.264 2 789 .000
Welch 10.263 2 520.22 .000
Source: Primary Data, a. Asymptotically F distributed.
The result indicates that there is no significant
difference among the three age groups
regarding one statement i.e., "Change channel
when I saw the advertisement in television"
(W=2.699, p-value=.068), hence it can be
inferred that perception of respondents are
almost the same when they saw the
advertisement on television. The rest of the
statement's p-value is less than at a 5 percent
significant level (p-value<0.05). Here the
nature of the last statement was a positive
attitude towards the advertisement i.e.,
respondents will not change the channel when
they saw the advertisement and will suggest
others to see the ad.
Major Findings of the Study
Findings are the principal outcome of a
research study, and findings illustrate the
extracted data from the result without any
bias. Hence, findings are presented here use
to extract the relationship between the result
and research questions. Since the starting
stage, this study has followed warning
advertisements to find out whether there are
any changes noticed in the society and the
people regarding the warning advertisement.
The study has gone through a detailed
analysis i.e., age-wise significant difference
regarding the reason for starting, the reason
for quit, pattern of smoking and drinking,
perception of respondents regarding warning
advertisement.
a) The study found that the majority of the
respondents are educated i.e., Degree or
Diploma completed (31.9 percent),
Postgraduate or Professional degree
completed (26.4 percent), +2/pre degree
(22.5 percent), SSLC (10.5 percent).
b) The study found that the majority of the
respondents have secured jobs i.e.,
Government employees (21.5 percent),
and Private employees (40.3 percent)
c) The study result indicates that the
majority of the respondents were starting
smoking (Below 15=30.2 percent, 15-
25=45 percent) and drinking (Below
15=36.7 percent, 15-25=28.7 percent) at a
very young age
d) It is found that more than half (54
percent) of the respondents are occasional
smokers; on the other side majority
(81.85) of the respondents are also
occasional drinkers
e) The study found that the majority of the
active smokers are using 2-5 cigarettes
Vidyabharati International Interdisciplinary Research Journal (Special Issue) ISSN 2319-4979
Special Issue on Engineering Technologies and Management 3760
daily and a significant percentage of
respondents are using more than one
packet in a day. In the case of drinking,
the majority of them are using one peg
daily.
f) The study found that the majority of the
inactive smokers was used cigarettes in
the past at the time of drinking, talking
with friends, Heavy workload, party time,
and Leisure time. In the case of drinkers,
the majority of them were used to
drinking at party time, leisure time, and
traveling time.
g) The study found that 15-25 years old
respondents are indicating that drinking
habits, impatience/anger feeling, and
father has been smoking are the
responsible reason for starting cigarette
smoking. The study also found that there
is a significant difference among the three
age group respondents' opinions related to
the reason for starting smoking and
drinking.
h) The study found that the majority of the
respondents opines that they quit smoking
and drinking because of their wives. Their
wives forced them to leave these habits.
The next majority opines that doctors
advised them to stop smoking and
drinking. Half of the respondents opine
that their family was forced. Only a few
of them are supporting that visual and
printed warning advertisement is effective
in related to control tobacco and alcohol.
Major Suggestions
The study has conducted a detailed analysis
regarding the pattern of smoking and
drinking, the reason for starting, the reason
for quit, and the perception regarding warning
advertisement. Based on the findings, it could
be clear that the presentation and visuals of
the advertisement are not effective and people
hated this advertisement, they felt that these
warning advertisements are irritating, hence
they intentionally avoid it. Therefore study
suggests rethinking the current advertisement
and it should be like the "Attraction-
Distraction-and Attraction" model. The
purpose of "Attraction" is to attract people to
the content of an advertisement. The purpose
of "Distraction" is to distract people with the
content i.e., content must have the power to
distract the people and this will reduce the
usage. The third and final "Attraction" is
related to the other side objective of
advertisement. The first side objective is
encouraging people to see the advertisement
because active users have been running
unhealthy life; the second objective is
encouraging people to attain healthy life or
attract them to a healthy life. The second
suggestion is to plan a periodic family
awareness campaign because the majority of
the inactive users were stopped these habits
by the influence of their family or family
members and the majority of them are started
these habits at a very young age and family
can teach them to the importance of healthy
life and the consequence related to smoking
and drinking.
References
1. Barbara Loken, Beth Hqward-Pitney
(1988). Cigarette Advertisements on
Women: An Experimental Study, Journal
of Applied Psychology, Vol. 73, No. 3,
378-382
2. Batel, P., Pessione, F., Maıtre, C. and
Rueff, B. (1995). Relationship between
alcohol and tobacco dependencies among
alcoholics who smoke. Addition, 90, 977–
980.
3. Carole L Hart, George Davey
Smith, Laurence Gruer, and Graham CM
Watt, (2010). The combined effect of
smoking tobacco and drinking alcohol on
cause-specific mortality: a 30-year cohort
study, BMC Public Health. 2010; 10:
789,doi: 10.1186/1471-2458-10-789
4. Caroline Anne Haynes (2002). The
relationship between alcohol consumption
and tobacco smoking: an examination of
the role played by social context, social
interaction and individual differences,
Published Thesis, University of Derby.
5. Durkin, Brennan, & Wakefield, (2012).
Mass media campaigns to promote
smoking cessation among adults: an
integrative review, Tobacco Control
2012; 21:127-138. Published by the BMJ

Vidyabharati International Interdisciplinary Research Journal (Special Issue) ISSN 2319-4979
Special Issue on Engineering Technologies and Management 3761
Publishing Group Limited, DOI:
10.1136/tobacco control-2011-050345
6. Easterby-Smith M., Thorpe R., Jacson P.,
Lowe A., (2008). Management Research:
An Introduction. 3rd ed. Lose Angeles,
London, New Delhi, Singapore,
Washington DC: SAGE Publications; 368
p. ISBN-10:1847871771, ISBN-13: 978-
1847871771
7. Elizabeth Burgess Dowdell, Michael A.
Posner, and Katherine Hutchinson (2011),
Cigarette Smoking and Alcohol Use
among Adolescents and Young Adults
with Asthma, Copyright © 2011 Elizabeth
Burgess Dowdell et al.
Vidyabharati International Interdisciplinary Research Journal (Special Issue) ISSN 2319-4979
Special Issue on Engineering Technologies and Management 3762
‘4A PLAN FOR INSTRUCTION’ AND TECHNOLOGY MEDIATED TEACHING:
ENHANCING ACADEMIC ACHIEVEMENT OF SECONDARY LEVEL LEARNERS AND
TEACHING COMPETENCE OF PROSPECTIVE TEACHERS
Dr.DurgaLekshmi G S1, Dr.Geetha Janet Vitus2
1Post-Doctoral Fellow Department of Education University of Kerala, Thiruvananthapuram 2Professor & HOD Department of Education University of Kerala, Thiruvananthapuram
ABSTRACT
Recent researches in instructional planning and strategy developments are not new to the field of education. But its
specificity lies where the political, economic and knowledge societies are in demand of new instructional plans and
methods for the dissemination of knowledge and information. The teaching-learning society has changed its
appearance from an information society to a knowledge society where interpersonal communication is mainly initiated
through digital mode. The Indian education system is deeply indebted to the Gurukula system of education where a
biological relationship is ensured between the teacher and the learner. But a drastic change is being noticed in our
teaching-learning society especially after the outbreak of the COVID-19 pandemic. It is high time to think about
learning strategies fit for multidiscipline as well as multi-platforms without changing the underlying principles of
instructional planning. The investigator, being a teacher educator, felt the need for a comprehensive instructional plan
befitting to both digital and actual classrooms, developed a suitable plan for multi-discipline and multi learning
platforms. The instructional plan named ‘4A Plan for Instruction’ was developed as part of her doctoral research. The
researcher checked its effectiveness in teaching English and found it effective irrespective of medium of instruction,
difference in learning environments and study-habits. Here the investigator utilises this plan for enhancing the
academic achievement of secondary level learners in multidiscipline and to develop the teaching competence of
prospective teachers. A quasi-experimental study was conducted among the first graders of secondary level in Kerala
by the prospective teachers during their practice teaching session in the pandemic learning situation to teach science
and social science. Its effectiveness is checked in terms of concept formation and achievement in learning. The major
tools used for this study were lesson transcripts based on the instructional plan, achievement test and an open ended
questionnaire for prospective teachers to report their experiences related to the lesson transaction through digital
mode using ‘4A Plan for Instruction’. Through this study, the investigator ensures the dissemination of knowledge,
professional development of teachers, and knowledge formation among students at secondary level.
Introduction
National Education Policy (NEP, 2020)
envisions an India centred education system
that contributes directly to transforming our
nation sustainably into an equitable and
vibrant knowledge society by providing high-
quality education to all. Castells (2010) calls
the emerging society as informational where
the generation and transformation of
information act as the fundamental source of
productivity and power and caters to
individual well-being and socio-economic
development. Futurists in education predict
that ICTs will have a pivotal role in global
employment. But at the same time, a
harmonious relationship between teachers and
learners as in a natural learning ecosystem
should also be ensured.
The outbreak of the COVID-19 pandemic has
changed the perceptions of the world. One of
the most radical among all changes has been
noticed in the field of education. Online
education has become the chief mode of
curriculum transaction. It is a pointer to the
future of education too. It reminds the
governments, teachers, institutions, etc. of the
necessity of a paradigm shift and stepping
into the framework of e-learning ecologies.
NEP of India aims at four years of multi-
disciplinary study at secondary level where
the major curricular and pedagogical
objectives are to minimize rote learning and
nurture holistic development and 21st-century
skills such as critical thinking, creativity,
scientific temper, communication,
collaboration, multilingualism, problem-
solving, social responsibility, and digital
learning among the individuals. It is put into
action when new models of lifelong learning
are encouraged.
The proposed curriculum focuses on
reorientation in subject-oriented pedagogy, on
the child's natural, cognitive, emotional, and
physical development and on the integration
of new teaching-learning strategies. The
thrust of new pedagogy reforms enforces real
understanding through a metacognitive way
of learning which would be more engaging,
holistic, and experiential. It creates an
Vidyabharati International Interdisciplinary Research Journal (Special Issue) ISSN 2319-4979
Special Issue on Engineering Technologies and Management 3763
opportunity for discovery, discussions, and
analysis. It is also recommended that teachers
must have the autonomy to innovate and
teach in the style that best suits their students
and also have access to the latest advances in
both pedagogy and content. As teaching in
the coming days demands more interactive
platforms, the teachers should be able to
integrate appropriate technology for
knowledge acquisition and dissemination. It
will improve the quality of education. Here a
comprehensive learning plan is demanded in
the 21stcentury knowledge society especially
when it is under the impact of a pandemic
situation. Here the investigator developed an
instructional plan named 4A Plan for
Instruction and utilises it for concept
formation and scholastic achievement.
Teaching is a joint venture where the
professional development of teachers is
always demanded. The teacher training
programs for the 21st century proposes
teachers’ understanding of their learners
including aspects of pedagogy, content
knowledge and use of technology. Studies in
instructional designs and strategies reveal that
classroom activities are either blended or
flipped in nature, which would be beneficial
for the changing needs of knowledge
societies. It is high time that education should
respond to the challenges of knowledge
societies and teachers are considered the
assets of it. In order to prepare the teachers
for a knowledge society, their views about the
changes should also be considered as it acts
as a catalyst for their professional
development.
Studies Related to Instructional
Designs/Strategies and Professional
Development of Teachersin Knowledge
Societies The real concerns of every knowledge society
are the continuous development of knowledge
and competence. Here the term professional
development will be replaced by lifelong
learning (Fenwick, 2000). Day (1999)
considers teachers as the most important asset
in a learning society where they should be
lifelong learners and engaged learning
practice in teacher education colleges fosters
learner autonomy (Bose, 2010). The
governments of every nation consider the plea
for a responsive approach to the challenges of
the emerging knowledge societies and it is
considered by their educational review
policies (Jacoby, 2010). Day& Sachs(2005)
identify teachers as the central figure in a
knowledge society where professional
development is considered as a strategy for
empowering individuals and teams to
improve their knowledge and pedagogy.
Martin (2011) defines instructional strategies
as the science of developing structured
instructions and specifications in designing
the teaching materials. Mehra&Kaur (2010)
point out that an experiential learning strategy
composed of knowledge, activity and
reflection helps in constructive learning. Li-
Tze& Hung (2015) identified that e-learning
is cost-effective and self-sustainable for
learners. The combination of face-to-face and
online learning is a common method of
instruction where face-to-face learning is a
complementary approach to maintain a good
interaction between the teacher and learner.
Hargreaves (1994) points out that teaching for
today’s knowledge society is more complex
and it needs a base of research and
experience. According to Borko and Putnam
(1997) the present educational policies are
student-centred. Hence the teachers prefer
cognitive and social construction of
knowledgeto the traditional transactions of
knowledge.Mansour and Al-Shamrani (2015)
suggest that the teachers should be given not
only the opportunities to learn new
knowledge, but also to explore new
pedagogies to make the learners ready to face
the changing situations of 21st century. The
teachers’ views about the change are
inevitable if they need to face the demands of
the knowledge society practice. In this
context, Kelchtermans (2010) defines
continuing professional development (CPD)
as ‘‘a learning process resulting from
meaningful interaction with the context (both
in time and space) and eventually leading to
changes in teachers’ professional practice
(actions) and in their thinking about that
practice’’.
Vidyabharati International Interdisciplinary Research Journal (Special Issue) ISSN 2319-4979
Special Issue on Engineering Technologies and Management 3764
Mansour &Wegerif (2010) point out that
education should be in line with the techno-
social changes associated with knowledge
societies. There is a need for ‘learning to
learn’ throughout the lifespan and to identify
the essential 21st-century skills for students
and educators.Berger &Luckman (2021)
noticed the proliferation of learning content in
the virtual environment and concluded that
this is the outcome of social constructivism
and social constructionism. Deshpande,
Kulkarni, &Metkewar (2017) propose the
need for appropriate tools for knowledge
sharing in academic research because every
research is generating new
knowledge.Majumdar (2009) points out that
knowledge society is characterised by
recognition of knowledge as the main source
of efficiency, competitiveness, and economic
growth. García-Peñalvo et.al (2017) opines
that new trends in ICT based learning are
dependent on the ability of content creators.
The educators in 21st-century knowledge
societies are in search of new content and
methods which could be adapted to their
teaching process and hence the learners have
changed their roles from consumers to
content creators. According to Singha Roy
(2019),contemporary India stands on the
threshold of a knowledge society,
characterized by proliferation of ICTs, neo-
liberal economic globalization, and use of
knowledge and education in all domains of
life. However, its access is limited in rural
areas, because of spatial and social
segregation. It is also noticed that higher
socioeconomic status is closely related to the
conditions of the knowledge society.
Lo et.al (2018) conducted a study based on
the flipped-classroom approach and found
that although the students in the flipped ICT
course had similar learning outcomes to those
in the non-flipped ICT course, the levels of
student achievement were improved after
flipping.Lekshmi (2018) conducted a quasi-
experimental study among 292 secondary
level students in Kerala by utilising an
instructional plan named 4APlan for
Instruction and an instructional module
utilising activating strategies. The study
tested the effectiveness of the package in
English language teaching and found it
effective, irrespective of the medium of
instruction, differences in study habits, and
learning environments.
Karthik et.al (2019) found that
implementation of e-learning programs will
be successful if they are based on sound
instructional design strategies. As the
eLearning settings lack an instructor’s
physical presence, it is the Instructional
strategies that fill the gap. The same but well-
structured content can be presented in
multiple ways by the instructors but the
choice of the strategy is dependent on the
knowledge, experience, and learning
environments. It stimulates the learner’s
cognitive structures and makes learning
effective.
Bell and Gilbert (1994) suggest that self-
empowerment is an aspect that helps teachers
acknowledge their accountability, autonomy
and self-directed learning. In such
frameworks, they are able to increase their
knowledge, infuse this knowledge into their
classroom materials, and become more self-
confident and involved in collaborative work.
In light of the above reviews, the investigator
attempted a study in the schools in rural areas
of Kerala state where the benefits of
knowledge societies are limited. This plan
will help the prospective teachers get adapted
to a new teaching strategy and it enhances
their teaching competencies. It also nurtures
the learning environment and activates
participation of the learners on the digital
platform through the principles of blended
and flipped learning approaches.
Purpose of the Study The investigator, being a teacher educator,
felt the need for a comprehensive
instructional plan befitting to both digital and
actual classrooms and developed a suitable
plan for multi-discipline and multi learning
platforms. The changing educational scenario
demands such a comprehensive plan for
instruction which helps the policy makers in
integrating a holistic and experiential
approach to multidisciplinary learning. The
revised educational policy of India proposes
high-quality training for teachers in content,
Vidyabharati International Interdisciplinary Research Journal (Special Issue) ISSN 2319-4979
Special Issue on Engineering Technologies and Management 3765
pedagogy, and practice giving importance to
multidisciplinary approach. It asserts “teacher
preparation is an activity that requires
multidisciplinary perspectives and
knowledge, the formation of dispositions, and
values and the development of practice under
the best mentors and also being well versed in
the latest advances in education and
pedagogy”. It highlights the importance of
digital literacy among learners.
The present study analyses to what extent the
prospective teachers find 4A Plan for
Instruction is effective for concept formation
and achievement in learning and how it caters
to their professional development. The study
analyses the effectiveness of 4A Plan for
Instruction in teaching science and social
science at secondary level with respect to
pretest and posttest scores in the total sample
and compares the effectiveness of 4A Plan for
Instruction in science and social science at
secondary level with respect to posttest
scores.
Methodology
Phases of Instructional Plan The investigator developed an instructional
plan named ‘4A Plan for Instruction’ as part
of her doctoral research. The plan comprises
four successive phases of lesson transactions.
Phase I – Acceleration has two stages 1)
Enhancing Prior Knowledge and 2)
Strengthening Cognitive Structure. Phase II –
Acquisition proceeds through 3) Activity for
Establishment and 4) Acquisition of the
Content. Phase III – Affirmation is meant for
5) Articulation of Ideas and 6) Reflection and
Self Analysis among the students. Phase IV –
Amplification is the final phase of lesson
transaction which aims at 7) Strengthening
Situated Learning Skills and help students 8)
Reciprocate to Real Life Situations. The
investigator checked its effectiveness in
English language teaching and found it
effective for concept formation and
achievement in English.
Method and Sample of the Study In the present research context, the
investigator utilises the developed
instructional plan for lesson transactions in
multi discipline. The experiment was
conducted to check the effectiveness of ‘4A
Plan for Instruction’ in science and social
science such s Physics, Biology, History and
Geography. The mode of transaction was
digital. The method adopted was quasi-
experimental in nature. 120 students from 9th
standard in Kerala state are taken as samples.
Stratified random sampling technique is used
for the selection of samples. The prospective
teachers, after being properly oriented
towards the theoretical aspect of 4A Plan for
Instruction, conducted online classes in
concerned subjects. The teachers were also
given instructions regarding lesson planning
and achievement test preparation based on the
developed instructional plan. The
effectiveness of the instructional plan is the
independent variable and the digital mode of
teaching is the dependent variable. The
students belong to Kollam and Pathanamthitta
districts of Kerala.
Teaching Platforms Used for the Study The prospective teachers used Google meet,
Zoom, Google classroom, Google docs,
Google slides, and Google forms etc. as the
main platforms for online lesson transactions.
The other apps utilised by the teacher trainees
are Kahoot for game-based lesson
transactions, blogs for reflection, Seesaw for
feedback, Anchorfm for audio podcasts,
fliphtml5.com for pdf creation, H5P tool for
making interactive videos. The teacher
trainees used virtual videos, simulated videos,
powerpoint presentations, online quizzes and
online group interactions using zoom
‘breakout rooms.’
Research Tools and Statistical Techniques
Employed The major tools used for the study are
teacher made, standardised achievement tests
in physics, biology, history and geography
(validity, reliability and inter-rater reliability
of the tests were calculated), lesson
transcripts based on 4A Plan for Instruction
and an open-ended questionnaire for
prospective teachers to report their
experiences related to the lesson transaction
through digital mode. The major statistical
techniques employed for the analysis are
measures of central tendency, measures of
dispersion, test of significance, ANCOVA,
etc.
Analysis of Data and Discussion
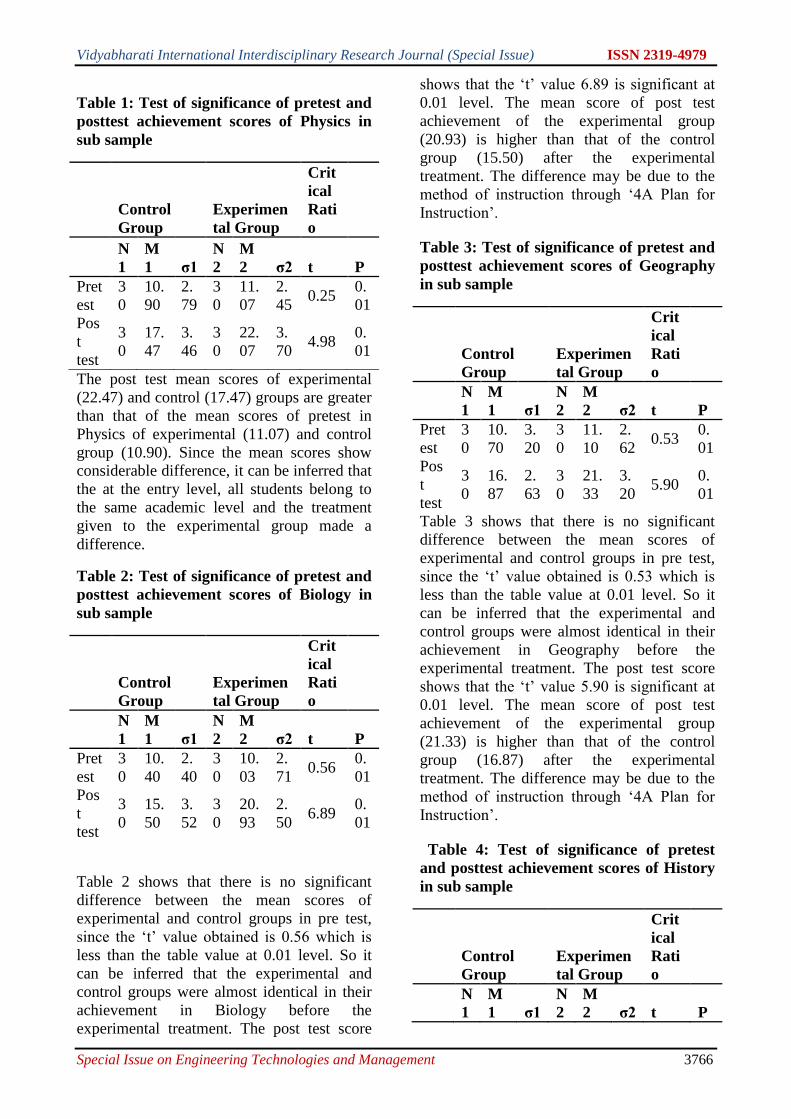
Vidyabharati International Interdisciplinary Research Journal (Special Issue) ISSN 2319-4979
Special Issue on Engineering Technologies and Management 3766
Table 1: Test of significance of pretest and
posttest achievement scores of Physics in
sub sample
Control
Group
Experimen
tal Group
Crit
ical
Rati
o
N
1
M
1 σ1
N
2
M
2 σ2 t P
Pret
est
3
0
10.
90
2.
79
3
0
11.
07
2.
45 0.25
0.
01
Pos
t
test
3
0
17.
47
3.
46
3
0
22.
07
3.
70 4.98
0.
01
The post test mean scores of experimental
(22.47) and control (17.47) groups are greater
than that of the mean scores of pretest in
Physics of experimental (11.07) and control
group (10.90). Since the mean scores show
considerable difference, it can be inferred that
the at the entry level, all students belong to
the same academic level and the treatment
given to the experimental group made a
difference.
Table 2: Test of significance of pretest and
posttest achievement scores of Biology in
sub sample
Control
Group
Experimen
tal Group
Crit
ical
Rati
o
N
1
M
1 σ1
N
2
M
2 σ2 t P
Pret
est
3
0
10.
40
2.
40
3
0
10.
03
2.
71 0.56
0.
01
Pos
t
test
3
0
15.
50
3.
52
3
0
20.
93
2.
50 6.89
0.
01
Table 2 shows that there is no significant
difference between the mean scores of
experimental and control groups in pre test,
since the ‘t’ value obtained is 0.56 which is
less than the table value at 0.01 level. So it
can be inferred that the experimental and
control groups were almost identical in their
achievement in Biology before the
experimental treatment. The post test score
shows that the ‘t’ value 6.89 is significant at
0.01 level. The mean score of post test
achievement of the experimental group
(20.93) is higher than that of the control
group (15.50) after the experimental
treatment. The difference may be due to the
method of instruction through ‘4A Plan for
Instruction’.
Table 3: Test of significance of pretest and
posttest achievement scores of Geography
in sub sample
Control
Group
Experimen
tal Group
Crit
ical
Rati
o
N
1
M
1 σ1
N
2
M
2 σ2 t P
Pret
est
3
0
10.
70
3.
20
3
0
11.
10
2.
62 0.53
0.
01
Pos
t
test
3
0
16.
87
2.
63
3
0
21.
33
3.
20 5.90
0.
01
Table 3 shows that there is no significant
difference between the mean scores of
experimental and control groups in pre test,
since the ‘t’ value obtained is 0.53 which is
less than the table value at 0.01 level. So it
can be inferred that the experimental and
control groups were almost identical in their
achievement in Geography before the
experimental treatment. The post test score
shows that the ‘t’ value 5.90 is significant at
0.01 level. The mean score of post test
achievement of the experimental group
(21.33) is higher than that of the control
group (16.87) after the experimental
treatment. The difference may be due to the
method of instruction through ‘4A Plan for
Instruction’.
Table 4: Test of significance of pretest
and posttest achievement scores of History
in sub sample
Control
Group
Experimen
tal Group
Crit
ical
Rati
o
N
1
M
1 σ1
N
2
M
2 σ2 t P
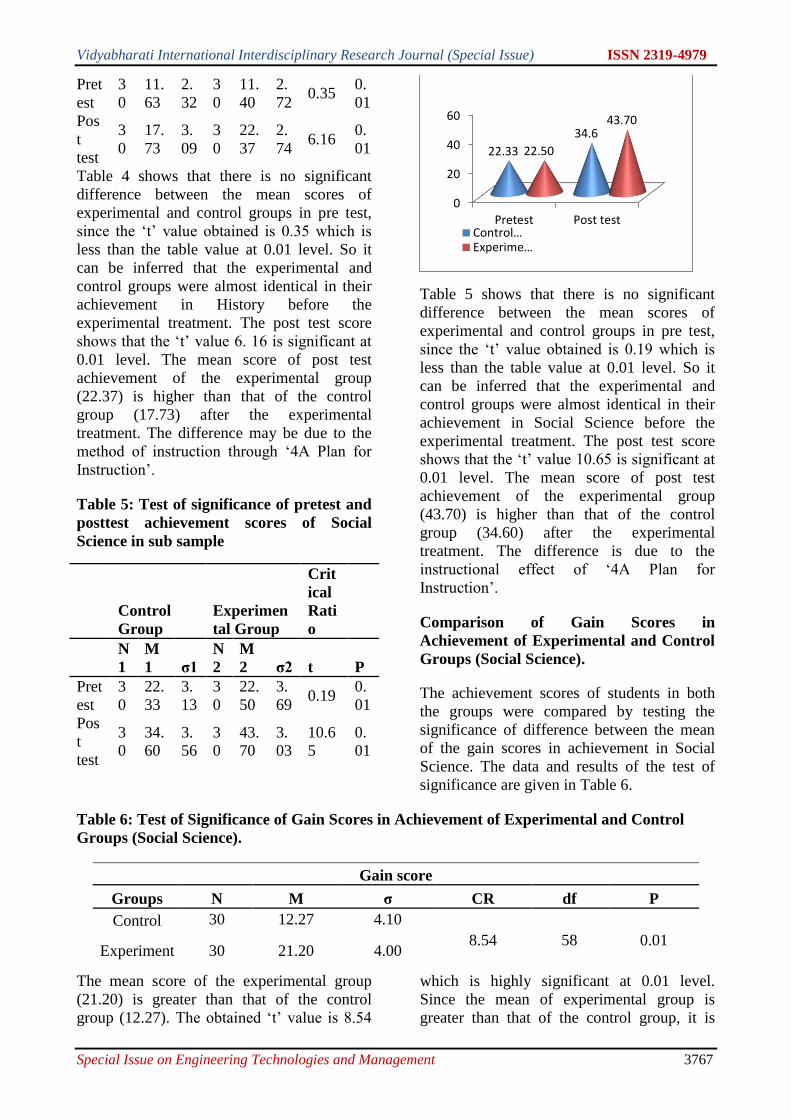
Vidyabharati International Interdisciplinary Research Journal (Special Issue) ISSN 2319-4979
Special Issue on Engineering Technologies and Management 3767
Pret
est
3
0
11.
63
2.
32
3
0
11.
40
2.
72 0.35
0.
01
Pos
t
test
3
0
17.
73
3.
09
3
0
22.
37
2.
74 6.16
0.
01
Table 4 shows that there is no significant
difference between the mean scores of
experimental and control groups in pre test,
since the ‘t’ value obtained is 0.35 which is
less than the table value at 0.01 level. So it
can be inferred that the experimental and
control groups were almost identical in their
achievement in History before the
experimental treatment. The post test score
shows that the ‘t’ value 6. 16 is significant at
0.01 level. The mean score of post test
achievement of the experimental group
(22.37) is higher than that of the control
group (17.73) after the experimental
treatment. The difference may be due to the
method of instruction through ‘4A Plan for
Instruction’.
Table 5: Test of significance of pretest and
posttest achievement scores of Social
Science in sub sample
Control
Group
Experimen
tal Group
Crit
ical
Rati
o
N
1
M
1 σ1
N
2
M
2 σ2 t P
Pret
est
3
0
22.
33
3.
13
3
0
22.
50
3.
69 0.19
0.
01
Pos
t
test
3
0
34.
60
3.
56
3
0
43.
70
3.
03
10.6
5
0.
01
Table 5 shows that there is no significant
difference between the mean scores of
experimental and control groups in pre test,
since the ‘t’ value obtained is 0.19 which is
less than the table value at 0.01 level. So it
can be inferred that the experimental and
control groups were almost identical in their
achievement in Social Science before the
experimental treatment. The post test score
shows that the ‘t’ value 10.65 is significant at
0.01 level. The mean score of post test
achievement of the experimental group
(43.70) is higher than that of the control
group (34.60) after the experimental
treatment. The difference is due to the
instructional effect of ‘4A Plan for
Instruction’.
Comparison of Gain Scores in
Achievement of Experimental and Control
Groups (Social Science).
The achievement scores of students in both
the groups were compared by testing the
significance of difference between the mean
of the gain scores in achievement in Social
Science. The data and results of the test of
significance are given in Table 6.
Table 6: Test of Significance of Gain Scores in Achievement of Experimental and Control
Groups (Social Science).
Gain score
Groups N M σ CR df P
Control 30 12.27 4.10
8.54 58 0.01 Experiment 30 21.20 4.00
The mean score of the experimental group
(21.20) is greater than that of the control
group (12.27). The obtained ‘t’ value is 8.54
which is highly significant at 0.01 level.
Since the mean of experimental group is
greater than that of the control group, it is
0
20
40
60
Pretest Post test
22.33
34.6
22.50
43.70
Control…Experime…
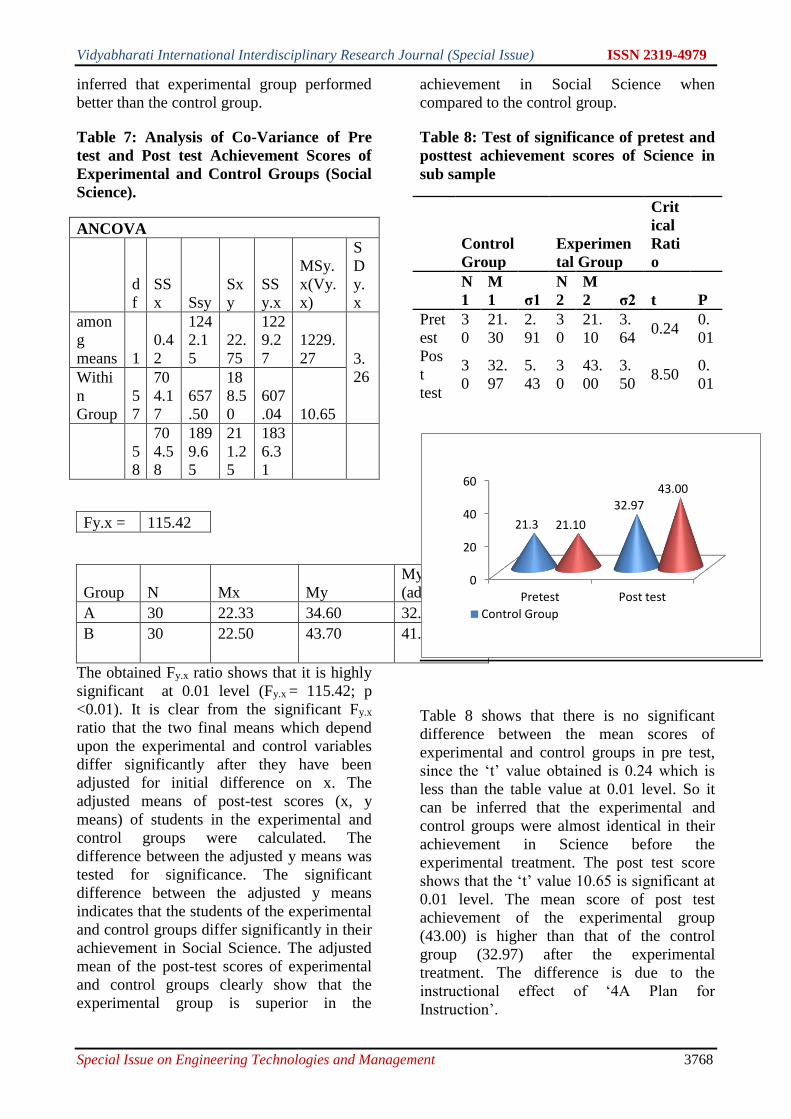
Vidyabharati International Interdisciplinary Research Journal (Special Issue) ISSN 2319-4979
Special Issue on Engineering Technologies and Management 3768
inferred that experimental group performed
better than the control group.
Table 7: Analysis of Co-Variance of Pre
test and Post test Achievement Scores of
Experimental and Control Groups (Social
Science).
ANCOVA
d
f
SS
x Ssy
Sx
y
SS
y.x
MSy.
x(Vy.
x)
S
D
y.
x
amon
g
means 1
0.4
2
124
2.1
5
22.
75
122
9.2
7
1229.
27 3.
26 Withi
n
Group
5
7
70
4.1
7
657
.50
18
8.5
0
607
.04 10.65
5
8
70
4.5
8
189
9.6
5
21
1.2
5
183
6.3
1
Fy.x = 115.42
Group N Mx My
My.x
(adjusted)
A 30 22.33 34.60 32.60
B 30 22.50 43.70 41.66
The obtained Fy.x ratio shows that it is highly
significant at 0.01 level (Fy.x = 115.42; p
<0.01). It is clear from the significant Fy.x
ratio that the two final means which depend
upon the experimental and control variables
differ significantly after they have been
adjusted for initial difference on x. The
adjusted means of post-test scores (x, y
means) of students in the experimental and
control groups were calculated. The
difference between the adjusted y means was
tested for significance. The significant
difference between the adjusted y means
indicates that the students of the experimental
and control groups differ significantly in their
achievement in Social Science. The adjusted
mean of the post-test scores of experimental
and control groups clearly show that the
experimental group is superior in the
achievement in Social Science when
compared to the control group.
Table 8: Test of significance of pretest and
posttest achievement scores of Science in
sub sample
Control
Group
Experimen
tal Group
Crit
ical
Rati
o
N
1
M
1 σ1
N
2
M
2 σ2 t P
Pret
est
3
0
21.
30
2.
91
3
0
21.
10
3.
64 0.24
0.
01
Pos
t
test
3
0
32.
97
5.
43
3
0
43.
00
3.
50 8.50
0.
01
Table 8 shows that there is no significant
difference between the mean scores of
experimental and control groups in pre test,
since the ‘t’ value obtained is 0.24 which is
less than the table value at 0.01 level. So it
can be inferred that the experimental and
control groups were almost identical in their
achievement in Science before the
experimental treatment. The post test score
shows that the ‘t’ value 10.65 is significant at
0.01 level. The mean score of post test
achievement of the experimental group
(43.00) is higher than that of the control
group (32.97) after the experimental
treatment. The difference is due to the
instructional effect of ‘4A Plan for
Instruction’.
0
20
40
60
Pretest Post test
21.3
32.97
21.10
43.00
Control Group
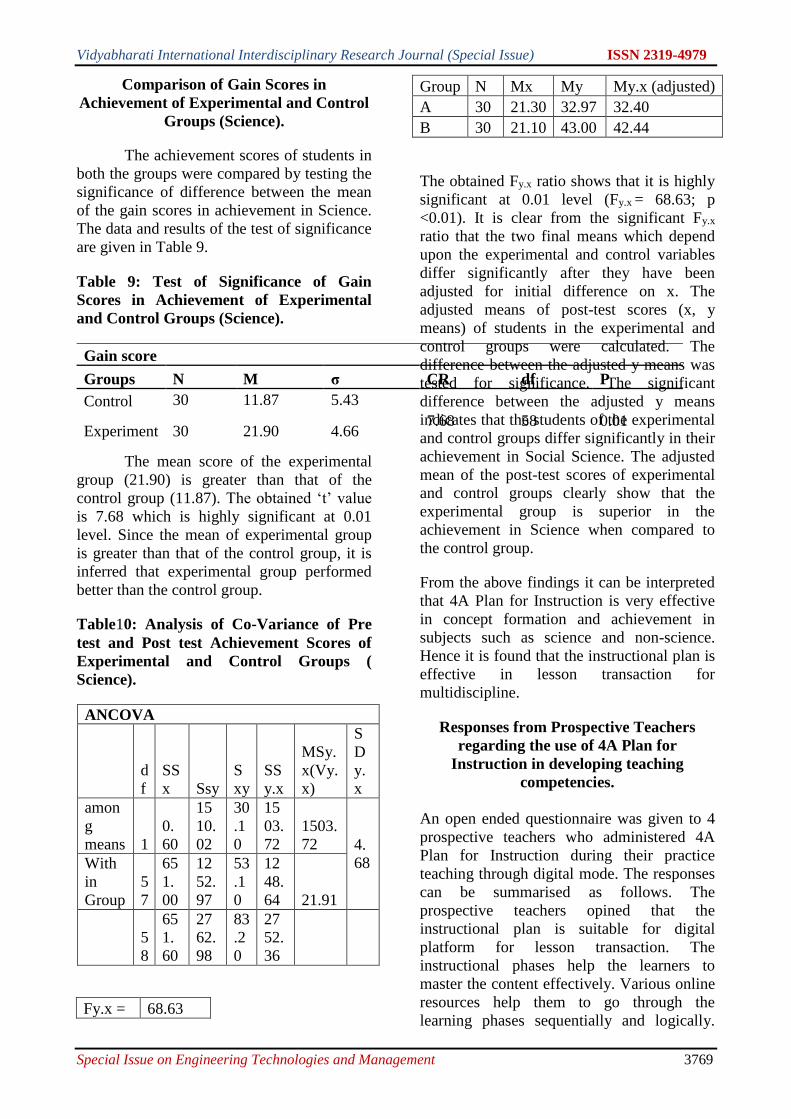
Vidyabharati International Interdisciplinary Research Journal (Special Issue) ISSN 2319-4979
Special Issue on Engineering Technologies and Management 3769
Comparison of Gain Scores in
Achievement of Experimental and Control
Groups (Science).
The achievement scores of students in
both the groups were compared by testing the
significance of difference between the mean
of the gain scores in achievement in Science.
The data and results of the test of significance
are given in Table 9.
Table 9: Test of Significance of Gain
Scores in Achievement of Experimental
and Control Groups (Science).
Gain score
Groups N M σ CR df P
Control 30 11.87 5.43
7.68 58 0.01 Experiment 30 21.90 4.66
The mean score of the experimental
group (21.90) is greater than that of the
control group (11.87). The obtained ‘t’ value
is 7.68 which is highly significant at 0.01
level. Since the mean of experimental group
is greater than that of the control group, it is
inferred that experimental group performed
better than the control group.
Table10: Analysis of Co-Variance of Pre
test and Post test Achievement Scores of
Experimental and Control Groups (
Science).
ANCOVA
d
f
SS
x Ssy
S
xy
SS
y.x
MSy.
x(Vy.
x)
S
D
y.
x
amon
g
means 1
0.
60
15
10.
02
30
.1
0
15
03.
72
1503.
72 4.
68 With
in
Group
5
7
65
1.
00
12
52.
97
53
.1
0
12
48.
64 21.91
5
8
65
1.
60
27
62.
98
83
.2
0
27
52.
36
Fy.x = 68.63
Group N Mx My My.x (adjusted)
A 30 21.30 32.97 32.40
B 30 21.10 43.00 42.44
The obtained Fy.x ratio shows that it is highly
significant at 0.01 level (Fy.x = 68.63; p
<0.01). It is clear from the significant Fy.x
ratio that the two final means which depend
upon the experimental and control variables
differ significantly after they have been
adjusted for initial difference on x. The
adjusted means of post-test scores (x, y
means) of students in the experimental and
control groups were calculated. The
difference between the adjusted y means was
tested for significance. The significant
difference between the adjusted y means
indicates that the students of the experimental
and control groups differ significantly in their
achievement in Social Science. The adjusted
mean of the post-test scores of experimental
and control groups clearly show that the
experimental group is superior in the
achievement in Science when compared to
the control group.
From the above findings it can be interpreted
that 4A Plan for Instruction is very effective
in concept formation and achievement in
subjects such as science and non-science.
Hence it is found that the instructional plan is
effective in lesson transaction for
multidiscipline.
Responses from Prospective Teachers
regarding the use of 4A Plan for
Instruction in developing teaching
competencies.
An open ended questionnaire was given to 4
prospective teachers who administered 4A
Plan for Instruction during their practice
teaching through digital mode. The responses
can be summarised as follows. The
prospective teachers opined that the
instructional plan is suitable for digital
platform for lesson transaction. The
instructional phases help the learners to
master the content effectively. Various online
resources help them to go through the
learning phases sequentially and logically.
Vidyabharati International Interdisciplinary Research Journal (Special Issue) ISSN 2319-4979
Special Issue on Engineering Technologies and Management 3770
The virtual environment was in effect
collaborative in nature and hence the given
instructional plan helped the teachers to build
collaborative workspace and thereby promote
ubiquitous learning. The prospective teachers
were able to check the understanding of the
students and thereby enhance the prior
learning of the students. They were of the
opinion that the cognitive structure of the
students can be strengthened with the help of
blended and flipped classroom strategies. The
second phase of the instructional plan was
also easy to administer in online platform.
They were able to provide necessary online
activities such online quizzes and tests for
establishing the concept. It could help the
students master the content. The third phase is
meant for articulation of ideas and for
reflection and self analysis. The availability
of web resources helped the students to
articulate their ideas and reflect upon their
learning. The phase where the prospective
teachers found it difficult to achieve the
learning outcomes were the final phase of the
instructional plan in which reciprocate to reel
life situations was not practical during the
pandemic situation and through this digital
mode of learning.
From their free responses, it could be found
that the instructional plan helped them to
master the teaching competencies in them.
The major skills and competencies they
developed during the implementation stage of
this instructional plan were proper lesson
planning and lesson transaction, engaging the
learners in meaningful learning situations,
creating collaborative workspaces in digital
learning, making the learning scenario
flexible and adaptable.
The present instructional plan utilises the
principles of flipped and blended learning.
The computer-mediated instructional space in
online classrooms is transformed into a
dynamic, interactive environment that ensures
collaborative and participatory learning. This
plan is systematic, comprehensive and
instrumental in nature. It does not always
follow a researcher-oriented approach. It
helps the teachers and learners to interact
with each other effectively. Even though the
study is experimental in nature, it is not a
simulated one and instead ensures a natural
learning environment in the digital mode of
lesson transaction. This plan enables the
learners to analyze information autonomously
and helps them to assimilate the essential
skills needed for 21st century knowledge
societies. It follows a spiral approach to
learning which is in line with the
recommendations of NPE ensuring interactive
classroom sessions contain fun, creativity,
collaboration, and exploration for experiential
learning.
Conclusion Naisbitt (1986) states “the society that is
emerging is a knowledge society, one which
is characterized by new structures of
knowledge, methods of dissemination, and a
technology that permits and sustains
unrestricted access to knowledge and control
over it”. The knowledge societies of the post-
COVID era mainly focus on the generation,
dissemination, and deployment of knowledge
mainly through digital media. It is evident
that the post-COVID educational scenario is
susceptible to e-learning ecologies. The
present study is designed for knowledge
dissemination in multi-discipline through a
single instructional plan named ‘4A Plan for
Instruction’. The effectiveness of the plan in
language teaching has already been analyzed
and it was found effective for all students
irrespective of their medium of instruction,
the difference in study habits and learning
environments. The behavioural learning
outcomes expected of students in a
knowledge society are their capacity to learn
how to learn, to transform information into
new knowledge and apply it in real-life
situations. The instructional and nurturant
effects of the plan help the learners to attain
these outcomes and enable the learners to
critically conscious of the demands of
knowledge societies such as effective
communication, collaboration, adaption to
changes. The research outputs ensure aneasy
transition from research to policy. It is
strategic, evidence-based, and rational in
nature. The selected plan strictly follows the
major principles of instruction and it is
innovative in terms of implementation, cost,
learning experience and learning outcomes. It
is in line with the decision-making factors of
Vidyabharati International Interdisciplinary Research Journal (Special Issue) ISSN 2319-4979
Special Issue on Engineering Technologies and Management 3771
educational policies and sticks to the motto
adopt, adapt and act. It also enhances the
professional development of teachers in
knowledge societies.
Bibliography
1. Bell, B., & Gilbert, J. (1994).Teacher
development as professional, personal,
and social development. Teaching and
Teacher Education, 10(5), 483-
497. https://doi.org/10.1016/0742-
051x(94)90002-7
2. Berger, P. L., &Luckmann, T.
(2021).From the social construction of
reality. The New Economic Sociology,
496-
517. https://doi.org/10.2307/j.ctv1f886rp.
22
3. Bose, S. (2010). Learning
Collaboratively with Web 2.0
technologies: Putting into action social
constructivism. https://eric.ed.gov/?id=E
D508689
4. Castells, M. (2010). The Information
Age: Economy, society, and culture.
Volume 1: The Rise of the Network
Society (2nd ed.). Oxford: Wiley
Blackwell.
5. Day, C. (1999). Professional
development and reflective practice:
Purposes, processes and
partnerships. Pedagogy, Culture and
Society, 7(2), 221-
233. https://doi.org/10.1080/1468136990
0200057
6. Deshpande, D. S., Kulkarni, P. R.,
&Metkewar, P. S. (2017). Need of the
research community. Open Source
Solutions for Knowledge Management
and Technological Ecosystems, 146-
174. https://doi.org/10.4018/978-1-5225-
0905-9.ch006
7. Fenwick, T. J. (2000). Expanding
conceptions of experiential learning: A
review of the five contemporary
perspectives on cognition. Adult
Education Quarterly, 50(4), 243-
272. https://doi.org/10.1177/0741713002
2087035
8. García-Peñalvo, F. J., Hernández-
García, Á.,Conde, M. Á., Fidalgo-
Blanco, Á., Sein-Echaluce, M. L., Alier-
Forment, M., Llorens-Largo, F., &
Iglesias-Pradas, S. (2017). Enhancing
education for the knowledge society era
with learning ecosystems. Open Source
Solutions for Knowledge Management
and Technological Ecosystems, 1-
24. https://doi.org/10.4018/978-1-5225-
0905-9.ch001
9. Government of India, Ministry of Human
Resource Development.(n.d.). National
Education Policy 2020.Accessed May 2,
2021. https://mhrd.gov.in/sites/upload_fil
es/mhrd/files/Draft_NEP_2019_EN_Rev
ised.pdf
10. Hargreaves, D. H. (1994). The new
professionalism: The synthesis of
professional and institutional
development. Teaching and Teacher
Education, 10(4), 423-
438. https://doi.org/10.1016/0742-
051x(94)90023-x
11. Jacoby, D. (2010). Teacher unionization
in school governance. Educational
Policy, 25(5), 762-
783. https://doi.org/10.1177/0895904810
374852
12. Karthik, B. S., Chandrasekhar, B. B.,
David, D. R., & Kumar, D. A.
(2019).Identification of instructional
design strategies for an effective E-
learning experience. The Qualitative
Report. https://doi.org/10.46743/2160-
3715/2019.3870
13. Kelchtermans, G. (2010). Narratives and
biography in teacher
education. International Encyclopedia of
Education, 610-
614. https://doi.org/10.1016/b978-0-08-
044894-7.00666-7
14. Lee, L., & Hung, J. C. (2015). Effects of
blended E-Learning: A case study in
higher education tax learning
setting. Human-centric Computing and
Information
Sciences, 5(1). https://doi.org/10.1186/s1
3673-015-0024-3
15. Lekshmi, D. (2018). Development of an
instructional package based on
activating strategies for teaching English
at secondary school level [Unpublished

Vidyabharati International Interdisciplinary Research Journal (Special Issue) ISSN 2319-4979
Special Issue on Engineering Technologies and Management 3772
doctoral dissertation]. University of
Kerala.
16. Lekshmi, D. (2020). 4A Plan for
Instruction: Elaborating the Psychosocial
Dimensions. International Journal of
Psychosocial Rehabilitation, 24(1),
7094-
7105. https://doi.org/10.37200/IJPR/V24
I1/PR202235
17. Lo, C. K., Lie, C. W., & Hew, K. F.
(2018). Applying “First principles of
instruction” as a design theory of the
flipped classroom: Findings from a
collective study of four secondary school
subjects. Computers & Education, 118,
150-
165. https://doi.org/10.1016/j.compedu.2
017.12.003
18. Majumder, R. (2009). Emergence of a
‘Knowledge society’: The Indian
scenario. South Asia: Journal of South
Asian Studies, 32(2), 269-
284. https://doi.org/10.1080/0085640090
3049515
19. Martin, F. (2011).Instructional design
and the importance of instructional
alignment. Community College Journal
of Research and Practice, 35(12), 955-
972. https://doi.org/10.1080/1066892080
2466483
20. Mehra, V., &Kaur, J. (2010).Indian
Educational Review. Effect of
Experiential Learning Strategy on
Enhancement of Environmental
Awareness among Primary School
Students, 47(2), 30-44.
21. Naisbitt, J., &Aburdene, P. (1986). Re-
inventing the Corporation: Transforming
Your Job and Your Company for the New
Information Society. New York: Grand
Central Pub.
22. Putnam, R. T., &Borko, H. (1997).
Teacher learning: Implications of new
views of cognition. International
Handbook of Teachers and Teaching,
1223-1296. https://doi.org/10.1007/978-
94-011-4942-6_30
23. Qablan, A. M., Mansour, N.,
Alshamrani, S., Sabbah, S.,
&Aldahmash, A. (2015).Ensuring
effective impact of continuing
professional development: Saudi science
teachers’ perspective. EURASIA Journal
of Mathematics, Science and Technology
Education, 11(3). https://doi.org/10.1297
3/eurasia.2015.1352a
24. SinghaRoy, D. K. (2019). Dynamics of
social mobility in an emerging
knowledge society: The case of rural
India. Understanding Social Dynamics in
South Asia, 107-
124. https://doi.org/10.1007/978-981-13-
0387-6_7
25. Wegerif, R., & Mansour, N. (2010).A
dialogic approach to technology-
enhanced education for the global
knowledge society. New Science of
Learning, 325-
339. https://doi.org/10.1007/978-1-4419-
5716-0_16
Vidyabharati International Interdisciplinary Research Journal (Special Issue) ISSN 2319-4979
Special Issue on Engineering Technologies and Management 3773
BREAKING THE CODES OF COURTESANS: REBIRTH OF MENAKA IN KAVITA
KANÉ’S MENAKA’S CHOICE
Krishnapriya K.L1, Dr.K.Rajaraman2*
1Ph.D. Researcher, Department of English, Annamalai University, Annamalai Nagar, Chidambaram,
Tamilnadu. [email protected] 2Professor, Department of English, Annamalai University, Annamalai Nagar, Chidambaram, Tamilnadu,
PREFACE
Mythologies are fundamentally male-centric narratives that signify, uphold and, idealize patriarchal values and ideals.
Patriarchy uses mythological stories to regulate and control women’s sexuality. Females are often treated as male
possessions to be exchanged or enjoyed. Objectification of women’s body is a common mytheme found in every
mythology across the world, and India is not an exception. Apsaras, the immortal seductresses of Indra’s court are the
direct references to female objectification in Indian mythology. Inspite of being much significant and powerful, Apsaras
play only cameo roles in Indian mythology stories. They never got a chance to be in the central stage and narrate their
stories. But the Indian-English novelist Kavita Kané disrupts this tradition by making Menaka, the most beautiful and
intelligent apsara of Indralok, as the protagonist of her novel Menaka’s Choice. The present paper investigates how
Kavita Kané lifts the veil patriarchy puts on Menaka’s character as a celestial seductress and, how she recreates her as
a woman of individuality by presenting a panoramic view of her life, highlighting the desires, motives and, aspirations
of the character.
Key Words: Feminism, Revisionist Mythology, Patriarchy, Objectification
Introduction
Mythology is a fundamental force that has
been producing and propagating social
values, communal ideals and cultural images
in a society. Myths are heralded neither as
fictions nor as speculations but, as vital
components of social life that will remain
timeless for their universality.
It is an exceptionally influential tool as
mythology can shape the culture and thus the
general characteristics of a society. Most
mythological stories are primarily male-
centric narratives that signify, uphold and
idealize patriarchal ideas and expectations.
Patriarchy has thus been using mythology as
an effective tool to consolidate its position by
pointing out and establishing social hierarchy
through portraying a wide range of
characters.
Mythological discussions of women
has predominantly based on the assumption
that male is universally being the dominant
gender and female is the subordinate one.
These narratives produce and proliferate the
gender stereotypes and reinforce the
patriarchal assumption of woman as the
“second sex”. Being the ideological
narratives of patriarchy, mythology also
creates images of women to be revered and
denounced in a society. As Kate Millet points
out, “under patriarchy the female did not
herself develop the symbols by which she is
described. As both the primitive and the
civilized worlds are male worlds, the ideas
which shaped culture in regard to the female
were also of male design. The image of
women as we know it is an image created by
men and fashioned to suit their needs” (Millet
1970). Patriarchy uses the same mythological
stories to regulate and control women’s
sexuality. Females are often treated as male
possessions to be exchanged or enjoyed.
Gods’ and heroic men’s sexual dominance
over women as well as violent sexual-based
mythemes are integral structural components
of misogynistic myths. Objectification of
women’s body is common mytheme found in
every mythology across the world, and India
is not an exception. Apsaras, the immortal
seductresses of Indra’s court are the direct
references to female objectification in Indian
mythology.
Apsaras, the Celestial Courtesans Indian mythology makes multiple
references to these celestial nymphs present
in Indra’s court as the eternal beauties
capable to seduce men and gods alike.
Apsaras are often sent to earth on the
command of their master Devendra, the king
of gods, to check the growing powers of his
opponents by alluring them into the erotic
Vidyabharati International Interdisciplinary Research Journal (Special Issue) ISSN 2319-4979
Special Issue on Engineering Technologies and Management 3774
beauty of these ladies. Beguilingly beautiful
and eternally young, apsaras are the most
effective tools for Indra to destroy his
enemies whether they are demons or ascetics.
Apsaras first appeared in Rig Veda
where it is mentioned that Urvashi is one
among the many apsaras present in Indra’s
court. Later, the epics Ramayana,
Mahabharata and, the Puranas made multiple
references by naming and describing many of
them and their contributions in the businesses
of men and gods. They are also mentioned as
the wives of Gandharvas, the musicians of
Indra’s court. In the celestial palaces, they
often dance to the music produced by
Gandharvas to entertain the gods. In Indian
mythological narratives, the apsaras, in spite
being much significant and powerful, appear
only in sub-stories or plays cameo roles as
they never get a chance to be the protagonist
of a main narrative. Apsaras never got a
chance to narrate their stories. But the Indian-
English novelist Kavita Kané disrupts this
tradition by making Menaka, the most
beautiful and intelligent apsara of Indralok, as
the protagonist of her novel Menaka’s
Choice. Kané lifts the veil patriarchy puts on
Menaka as a seductress and recreates her as a
woman of individuality by presenting a
panoramic view of her life, highlighting the
desires, motives and, aspirations of the
character.
Menaka in the Mythologies
In Indian mythology, Menaka is
famous in two aspects; the first one is her
notorious seduction of sage Vishwamitra and
the second is her status as mother to
Shakuntala, the wife of king Dushyanta. As
the first story goes, once the rishi
Vishwamitra was once undergoing a very
difficult tapas. As time passed the intensity of
his tapasya increased and it threatened Indra
as it would make Vishwamitra all powerful
and he would easily conquer heaven. So, the
cunning Indra sent Menaka, the bewitchingly
beautiful apsara, to earth. Her assigned duty
was to seduce the sage and destroy his
tapasya.
Menaka went to the forest where
Vishwamitra was performing the rituals and
engaging in meditation. She began to sing and
dance in front of him, made garland of
aromatic flowers and put it around his neck.
Being disturbed by all these, Vishwamitra
opened his eyes and his meditation was
ruined. But the angry sage was immediately
got enthralled in the seductive beauty of
Menaka and, at once proposed to marry her.
As Menaka’s purpose was to destroy the
sage-hood of Vishwamitra, she agreed to his
proposal and they got married. Shakuntala is
the daughter born to Menaka and
Vishwamitra. After the birth of Shakuntala,
Menaka abandoned the sage with
responsibilities of the daughter and returned
back to the heaven as her mission was
accomplished.
Revising the tale of Menaka
In the traditional narratives, Menaka is
portrayed as a femme fatale who used her
beauty to bewitch the sage Vishwamitra and
mercilessly abandoned him once her mission
was accomplished. But a feminist revision of
the story of Menaka unfolds in Kavita Kané’s
novel Menaka’s Choice that narrates how
Menaka emerges as an assertive woman who
controls her own life as well the lives of
others, with her demarcated choices and its
well defined execution. Menaka, born out of
Brahma’s mind, is the cleverest, most feisty
as well as exquisitely beautiful among the ten
apsaras who amuse devas and gods in the
capital of devalok, Amaravati. Menaka’s
Choice portrays two stages of Menaka’s life,
one is her unknown life in heaven where she
falls in love with the Gandharva king
Vishwavasu and the next phase is her most
talked and scandalous seduction of the sage
Vishwamitra, which happens on earth.
Kané exposes the inhuman life forced
upon apsaras in heaven where they are
prohibited to have eternal love or familial life.
“Everything was shared in Heaven; you could
not possess anything in this land of plenty.
You could have everything but own nothing”
(Kané 2015) says Kané. Indra considers them
only as objects that are created to seduce,
give pleasure and desert. Apsaras do not
possess any rights on their life. But,
shattering Indra’s expectations Menaka falls
in love with the Gandharva king Vishwavasu
and making Indra more jealous and furious,
gets pregnant from him. The infuriated Indra
decides to punish Vasu alone as he cannot
Vidyabharati International Interdisciplinary Research Journal (Special Issue) ISSN 2319-4979
Special Issue on Engineering Technologies and Management 3775
take risk with Menaka. But Menaka is
intelligent enough to understand that
Devendra couldn’t punish her or exile her. In
the face of necessity, she breaks the rules of
submissiveness, takes the complete
responsibility of the marriage, and rescues
Vasu by arguing with Indra and defeating him
with her verbal skills. In the combat of words
it is out of the question for anyone, even
Indra, to defeat Menaka. She recognizes
where her power lies; charm and wit turn to
be her weapons that disarm the opponents
Kané brilliantly reflects a heaven
where contrasting to the earthly principle of
woman’s chastity, heavenly rules are defined
to control women’s sexuality. The impression
of shame emerges with a woman’s open
manifestation of desire is revealed when
Menaka announces that “My desires should
not shame me – and I desired Vasu enough to
marry him, to have him for myself” (Kané
2015). Apsaras are treated and defined in
heaven in terms of their utilitarian object
status. Menaka realizes this objectification
and feels the hegemonic suppression
particularly from Indra. When Indra threatens
the future of her and the child, she fiercely
argues for her fundamental right to be a
mother. But Indra does not allow to keep the
child in the heaven since apsaras do not enjoy
the freedom to raise a baby. The child will be
given to some barren kings or sages to be
looked after. After long arguments with Indra,
Menaka is forced to choose between the two
blessings of her life; either she can abandon
the child and live with her gandharva in the
heaven or she can have the child and leave
Vasu and Indralok at once. Menaka is caught
in a circumstance where picking either will
result in dropping a part of herself. Finally
she is forced to leave the child behind.
Kané portrays a ravished Menaka who
shows courage to question the injustices
patriarchy imposed up on women. She
compares herself and other apsaras, whom
Indra consider as his prestigious possessions
to earthly whores. When Indra feels it as an
insult and decrees that it is the obligation of
apsaras in heaven to “please and entertain” to
which Menaka reacts,
And flirt and woo, and seduce! To allure
and exploit men, that's it! You made me a
woman that glorify beauteous creation, yet
so rudimentary. I am that beautiful,
eternally young woman who believes she
lives with the blessed in Heaven. You
gave me all the weapons of love, sex and
desire but disarmed me of my capability of
conscious choice and decision. Why? I can
be a woman, but never a wife or a mother.
Just a sexual slave.A whore. (Kané 2015)
Menaka’s comparison of a heavenly apsara
with an earthly harlot is very much relevant
since mythological tales often initiated and
put on a normal footing on devadasi tradition
and later prostitution in Indian society. The
Indian government redefines prostitution in
“Prevention of Immoral Traffic Act-1987, as
“Sexual exploitation or abuse of persons for
commercial purposes” (Khan & Singh 1987).
This is what exactly Indra is undertaking in
his heaven, taking advantage of the sexuality
and sensuality of apsaras for his personal
gain.
Indra, being the champion of
patriarchal power on heaven, takes his
ultimate revenge on the assertive woman
Menaka by plotting with the apsara Rambha.
She alleges Vasu as a molester who tried to
rape her. They executed the plan in Menaka’s
absence since she might have defended Vasu
at any cost. Discarding all his requests, Indra
turns Vasu into a “headless torso monster
Kambandh” and banishes him to earth (Kané
2015). This completely breaks Menaka as she
lost both her child and her husband. But
Menaka prevents herself from an emotional
breakdown since she knows that she has to
take revenge when the right situation comes.
And when the right time came, Menaka plays
the same plot Indra used against Vasu. She
frames Tuburu, Rambha’s lover, as a rapist
who tried to abuse her several times in the
earlier but she couldn’t reveal this as he is her
teacher. Tilotama, her dearest friend, supports
Menaka . When the puzzled Tumburu
discards the accusations and calls the two
apsaras fabricators of lies, Menaka agrees
with him and requests pardon. Menaka was
trying to prove the point that Vasu was also
deceitfully blamed and deceived by Rambha
just like they did to Tumburu. Indra couldn’t
find any words to justify what he has done.
Vidyabharati International Interdisciplinary Research Journal (Special Issue) ISSN 2319-4979
Special Issue on Engineering Technologies and Management 3776
Using her wittiness and intelligence, Menaka
wins the trial once again.
The next phase of Menaka’s life
begins when she is given the duty to distract
the meditation of the great rishi Vishwamitra
who is undertaking intense tapasya to be a
Brahmarishi. Indra was aware that only
Menaka will be able to handle the volatile
Vishwamitra as she is a matchless mixture of
beauty and brain. Menaka was ordered to
seduce Vishwamitra, give him a child and
return to devalok, trapping the sage in a
domestic life. Indra had no hope that Menaka
will obey him after what he has done to her.
But to Indra’s surprise, she accepts the work
as she considered this as a chance to escape
from the clutches of heaven. She articulates
her own action plan. Menaka goes to
Vishwamitra in the forest and presents herself
as a victim of Indra’s treachery. Later she
seduces him with the help of Kama and starts
to live with Vishwamitra in his ashram. When
time passes she comes to know that the sage
loves her enormously to that extend which he
not once loved anybody in his life.
In the beginning Menaka was strong
willed not to be confined by her relationship
with Vishwamitra. Her task was to destroy
him, but slowly she falls in love with him.
Menaka forgets all about her task and on the
contrary inspires him to endure his tapasya.
She does not want to be the reason for his
disgrace. Menaka’s decision to have a true
family with Vishwamitra can be seen as her
dissent against the patriarchal rule of heaven
which rejects the right of apsaras to have
familial life. She decides to act upon her own
needs and choices which will not be
sanctioned by the patriarchal heaven. When
Indra tries to persuade Menaka to come back
to heaven, she provides him with two
choices- he can either take her to the heaven,
face the rage of Vishwamitra or he can permit
Menaka to carry on her life with the sage so
that she will prevent him from becoming a
Brahmarishi. Indra had no choice other than
letting her to continue the life with
Vishwamitra.
Menaka gives birth to Vishwamitra’s
daughter, Shakuntala as she takes it as her
victory over Indra who snatched the first
child away from her. But after achieving a
blissful family, Vishwamitra forgets his
sagely duties and becomes a complete family
man. The goal to be a Brahmarishi seems
nothing to him in front of a happy family.
Even Menaka’s efforts couldn’t change his
mind. Menaka realizes that she is becoming
the utmost obstacle in his journey to be a
Brahmarishi, that she is finally destroying the
man, the real love of her life. Kané elevates
Menaka’s character to the next level as she is
not a self-centered woman who considers
only of her own happiness. After attaining
everything she ever wished in life, a blissful
family, Menaka chooses to leave everything
behind. She decides to disclose the truth. The
moral uprightness of Menaka seems greater
than the devas who directed her to destroy the
man. She listens to her conscience.
Menaka discloses the truth to
Vishwamitra hoping that he will hate her for
all the lies and will return to the quest to
become a Brahmarishi. Vishwamitra is
devastated in shock and infuriated when he
comes to know that Menaka acted a part in
Indra’s plan to put an end to his penance.
Menaka is determined face his wrath and to
leave him for his own good, “She had to leave
him to set him free. She was the shackle
fettering him from his path of high honour,
but no longer” (Kané 2015). Menaka wisely
redirects the situation so that his anger will
force him to take shelter in his ambition and
Vishwamitra will finally become the
Brahmarishi. When Vishwamitra resolves to
curse Indra, Menaka stops him from wasting
his spiritual powers since that’s exactly what
Indra needs. Menaka dreads that Vishwamitra
may curse her, and he curses her not to come
before him again. Menaka agrees with
Vishwamitra’s decision to give Shakuntala to
the childless Kanva who can give her a bright
future. Keeping the immense love within
themselves, Menaka and Vishwamitra
decides to part their way. Kavita Kané’s
Menaka is not the voluptuous seducer in
mythology who destroys men with beauty,
but a woman of moral strength who sacrifices
her happiness for her man’s better future. She
may have distracted him and lured him but it
is the same woman who persuades him to
achieve his lifetime goal

Vidyabharati International Interdisciplinary Research Journal (Special Issue) ISSN 2319-4979
Special Issue on Engineering Technologies and Management 3777
In Menaka’s Choice Kavita Kané
reframes the wrong perception of patriarchy
on women, especially on apsaras as the
destroyers of men. Kané’s protagonist is that
woman who encourages her man to take the
right path that leads him to the higher goals.
Kané portrays Menaka as a responsible
individual completely aware of the cost of her
decisions. As the reviewer Cris suggests,
“The title of the book Menaka’s Choice is a
paradox. Did Menaka have a choice, or was it
her struggle against the choice-less life she
was to lead? She makes her life a series of
options where she wins some, loses rest. But
she has no regrets” (Cris 2016).
Conclusion
Kané’s glance into Indra’s heaven
surprises the readers in a different level. Kané
effectively frames the celestial rules and
guidelines that bind the heavenly beings as
the mirror image of human laws. Women of
earth and heaven are deprived identically
from their individual freedom of the
expressing desires. The apsaras are mere toys
to be enjoyed by the gods and do not own any
rights of themselves. Menaka’s words
magnifies the situation when she says, “We
are but...apsara, destined to give pleasure to
all but ourselves. And it is in such a heaven
we live”( Kané 2015). The rejection of
fundamental rights to one’s own needs
indicates the hierarchical patriarchal structure
in which the women are forced to live, both
on earth and heaven. The alternate divine
world that Kané portrays exposes the
imperfections of a man-encoded mythology
that is fundamentally patriarchal and
misogynistic.
Works Cited
1. Cris, Stephen (2016, Mrch 16). “Menaka's
Choice: Paradox of Choice.” Deccan
Chronicle.
2. Kané, Kavita (2015). Menaka’s Choice.
Rupa Publications, New Delhi.
3. Khan, M.Z. and Dr.D.R.Singh (1987).
“Prostitution, Human Rights, Law, and
Voluntary Action.” The Indian Journal of
Social Work. Tata Institute of Social
Science. New Delhi
4. Millet, Kate (1970).Sexual Politics.
Doubleday, Garden City.
Vidyabharati International Interdisciplinary Research Journal (Special Issue) ISSN 2319-4979
Special Issue on Engineering Technologies and Management 3778
Enhancing Naturalist Intelligence Through Experiential Learning for Effective
Environmental Resource Management
Dr. Padma Priya P. V Assistant Professor, N. S. S. Training College Pandalam(Affiliated to University of Kerala) Pathanamthitta
Kerala state India. Email :- [email protected]
ABSTRACT Teachers may assist their students in developing or enhancing their naturalist intelligence by offering learning
opportunities that promote observation, classification, working and learning in or with the natural world that is allow
the learner free or experience nature. So experiential learning means learning through reflection on doing. Through
experiential learning students are able to receive a deeper understanding of the contents being taught. The present
study is an attempt to find out whether there is any correlation between experiential learning and naturalist
intelligence. Many research studies reveals that a person with naturalist intelligence possess a strong high
environmental consciousness. So this study throws light on Effective Environmental Resource Management by
Enhancing Naturalist Intelligence Through Experiential Learning.
Keywords: Naturalist Intelligence; Experiential Learning; Environmental Resource Management; Scientific
Naturalist; Higher secondary school students.
INTRODUCTION
For the effective management of environment
and natural resources it is important to
understand that there is far more to consider
than just the climate and the natural
resources. The interdependence of natural
environment and human involvement and
behaviour is also a central factor. The field of
environmental resource management is
concerned with the relationship of the natural
world’s diverse ecological and sociological
process. Changing current resource-use
practices to a more sustainable egalitarian
economy is a difficulty and intractable
problem.
Students must gain knowledge of
environmental concerns and natural hazards
in this era of rapid environmental problems
and issues. We are part of this world, and we
will not be able to live in it unless we learn
about it. Many of the concerns are pollution,
natural resources depletion, loss of
biodiversity, lack of conservation etc. Man
existed in harmony with nature in the
beginning, but scientific advances and
technological innovations eventually
contributed to exploitation and degradation.
As a result it is imperative that people
develop positive environmental awareness
and consciousness in order to recognize the
implications of all of these problems. Here
comes the importance of developing
Naturalist intelligence, the eighth intelligence
in Howard Gardner’s list, has to do with
observing, understanding and organizing
patterns in the natural environment.
According to Gardner, Naturalist intelligence
is the ability to identify, classify and
manipulate elements of the environment,
objects, animals or plants. They care about
the environment and like to be in touch with
nature. They are good at identifying flora and
fauna.This particular intelligence that
involves how sensitive an individual is to
nature and the world. People who excel in
this intelligence typically are interested in
growing plants, taking care of animals or
studying animals or plants. Zookeepers,
biologists, gardeners, and veterinarians are
among those that Gardner sees as having high
naturalist intelligence”(Kelly, M
2019)[15].According to Gardner
(2006)[11]Naturalistic intelligence refers to a
person’s interest in the “natural” world of
animals, plants, and the natural work around
them. It is the ability to identify and classify
patterns in natural environment. Individuals
with naturalist intelligence have a sensitivity
to and appreciation for nature. Naturalists are
inspired and rejuvenated by nature. Persons
with a high degree of naturalist intelligence
are keenly aware of how to distinguish the
diverse plants, animals, mountains, or cloud
configurations in their ecological niche.
Armstrong [1] defines naturalist intelligence
as the ability to recognize and Categorize
species, both flora and fauna, in the
surrounding environment and the ability to
process and Utilize, and preserve it .
Characteristics of Naturalist Intelligence

Vidyabharati International Interdisciplinary Research Journal (Special Issue) ISSN 2319-4979
Special Issue on Engineering Technologies and Management 3779
A person with high naturalistic intelligence
possess the following characteristics
They demonstrate a desire to learn how
things function.
They are concerned about the
environment and enjoy being in contact
with nature; they enjoy learning about
new species and behaviours.
They’re interested in employing
instruments like microscopes, binoculars,
and telescopes to aid observation.
They specialise in or take courses in
natural sciences (such as botany,
ecology, zoology, etc.)
Gardeners, farmers, biologists, and
ecologists are among their specialties.
They are aware of and grateful for
nature.
They enjoy gardening and feel more
alive when they are in the presence of
nature.
They have a hobby that involves being
outside in nature.
They care about the environment and are
concerned about pollution.•
They appreciate having pets and caring
for animals and/or plants.
They are interested in nature and read
books or publications about it.
Naturalist intelligence can be created early in
life or later in life. It can be cultivated
through the use of effective instructional
approaches. Direct observation and
investigation of the natural world should be
the centre of any activities used by a teacher
to reach children. Assist them in considering
how their learning affects the rest of the
world. Because naturalistic intelligence is
very much a hands-on experience, stepping
outside is the greatest way to acquire it. Take
a walk outside and admire the trees, grass,
and flowers, among other things. Teachers
should take their children for a field trip.
Teachers must give students the chance to
develop their intellect. Our learners must be
able to contribute to the quality of life on
Mother Earth. To improve naturalistic
intelligence, we must provide the best
educational opportunities possible.
Naturalistic intelligence can be developed in
a number of ways. By integrating naturalistic
themes and topics in the curriculum will help
us to achieve our target. Topics that would
help to enrich the curriculum could revolve
around the environment in which the students
live, where the students were able to get
hands on training. The local community /
resources can be best utilized in learning and
comprehending nature. Beetlestone [5] states
that Gardening has very real benefits for
physical development, which in turn affects
creative development. When gardening
children will have plenty of space to move
and train their bodies with large-scale
Movements such as digging, scratching,
running and bending. The benefits of
gardening activities in Addition to
influencing the physical motor of children,
can also increase children’s naturalistic
Intelligence, train patience, foster
responsibility, and build emotions and
empathy. This situation proves that gardening
activities through games can improve
children’s naturalist Intelligence Hashanah,
Harmawati, Riyana and Usman 2019[13].
So taking students outside the classroom to
explore the world is another easy way to
stimulate the naturalistic intelligence, has to
do with observing, understanding and
organizing patterns in the natural
environment. We should give opportunities to
improve intelligence. A single trip outside
will raise enough research questions in the
minds of the learner. One way to promote
true understanding of nature is to improve
naturalist intelligence. This is where the value
of outdoor education and experiential
learning comes into play. Teachers can help
students to develop naturalist intelligence by
taking class outside, and ask them to Keep a
nature diary to keep track of any changes or
discoveries they notice, Demonstrate natural
findings, Read books and articles on the
environment and nature, help them to write
articles on the environment (poems, short
stories, news articles), educating people about
the weather and wildlife, Putting up skits on
the natural world and cycles, Investigate the
foliage in their area.
Vidyabharati International Interdisciplinary Research Journal (Special Issue) ISSN 2319-4979
Special Issue on Engineering Technologies and Management 3780
Experiential learning is known as “learning
by reflection by doing” and is more broadly
defined as “learning by experience”. Hands
on learning is a form of experiential learning
that does not often require students to focus
on their work. Experiential learning differs
from role or didactic learning, in which the
learner is more passive participant. Other
types of learning, such as action learning,
adventure learning, free choice learning,
cooperative learning, service learning and
situated learning, are related but not
synonymous with it. Experiential learning is a
hands on approach to learning that shifts
away from the teacher imparting and passing
information to students from the front of the
class. It aims to offer a more engaged way of
learning by making learning an opportunity
that extends beyond classroom. The term
experiential learning is not a new catch
phrase in the education field. Research
suggests that experiential learning can help
students develop positive attitudes toward
life, encourage acceptance of responsibility,
promote community involvement, and help
students better understand their strengths and
weakness (Bouslog, 2000)[7].Rogers (1969),
[19] defines experiential learning as the use
of pupils’ knowledge and experience in the
educational process, where they develop life
skills and form a positive attitude towards
life. Thus experiential learning is related to
learning by doing. Experiential learning is an
active learning approach that enables trainees
to use and process critically their experiences
and learn. At the core of the learning process
in experiential learning are pupils themselves,
and the effectiveness of learning depends on
“how to learn” and “how to think.”During the
experiential teaching, students participate
actively, mentally, emotionally and socially
during the educational process. The teacher is
a member of the team and works with
learners to create learning situations for
learning experiences that help them interact
with learning material.(Voukelatou,
2019)[22]. Experiential learning task involves
Concrete experience ,Reflective observation
,Abstract conceptualization and Active
experimentation.
How can we develop naturalist intelligence
among students? It can only be cultivated if
students are given enough opportunities.
Experiential learning tactics are extremely
beneficial since they involve the process of
deriving meaning from first hand experiences.
Experiential learning concentrates on the
process of learning. It is learning through
reflection on doing, hence Experiential
learning strategies can be highly effective in
fostering nature awareness. Experiential
learning practises can help people become
more aware of nature. It engages the learner
at a more personal level by addressing the
needs and wants of the individual. It is about
creating an experience where by learning can
be facilitated. Moreover, learning from
experience by yourself, might be called
‘nature’s way of Learning’. Help students to
make connections between what they’ve
learned and what they’ve seen in the natural
world. Assist students in recalling knowledge
by using categories, types, segments,
qualities, and rules of thumb, among other
things.Show them how to utilise various
scientific tools. Teach them about the flora
and fauna in various countries , about farming
techniques in various climates, explain how
various scientific concepts relate to nature
like wise through experiential learning
strategies, we can foster naturalistic
Intelligence among secondary school
students, thus making learning more
reflective and meaningful.
Experiential learning strategies to develop
Naturalist intelligence
Sensory observation: feeling, smelling,
listening.
Data collection from observation.
Observation of animal behaviour.
Growing things plants, gardens.
Recycling projects and worm boxes.
Nature walk.
Field trip.
Identifying shapes in natural setup.
Observation through microscope, hand-
lens.
Identifying sounds in nature.
Modelling, measurement or scale
drawing of animals, plants or outdoor
settings.
Vidyabharati International Interdisciplinary Research Journal (Special Issue) ISSN 2319-4979
Special Issue on Engineering Technologies and Management 3781
Explore local environment.
Outdoor education can be considered
experiential, especially when learning occurs
via experiences” (Ford, 1986)[9]. The
Association for Experiential Education,
which was created in the 1970s, characterised
experiential education as “a theory that
informs numerous techniques in which people
learn via doing. “Educators intentionally
engage students in direct experience and
focused reflection in the classroom. In order
to improve people’s capacity, raise their
knowledge, develop skills, clarify values, and
expand their knowledge to make a difference
in their communities”. Environmental
resource management attempts to safeguard
and maintain ecosystem benefits for future
human generations also also maintaining
ecosystem integrity by taking into account
ethical, economic, and scientific (ecological)
factors. So environmental resource
management is linked with environmental
protection and sustainability.
To reverse ecosystem degradation, it is very
essential to understand different ecological
systems and science. To achieve this teachers
should enable students with a thorough
understanding of how ecological principles
can be applied to the management and
conservation of natural resources and
ecosystems, as well as practical skills and
techniques.
Objectives of Environmental resource
management
1.To locate environmental problems and it’s
solutions
2. To reduce the over exploitation of natural
resources
3. To control environmental pollution
4.To restore natural resources
5. Promote optimum utilization of natural
resources
6. To assess the impact of disasters and how
to overcome it
7. Promote reforestation
In this regard our duty as teachers is to
inculcate environmental resourse
management skills among the students and
ignite their minds to be environmentally
responsible. From different research works it
is very evident that Environmental
management skills is related to naturalist
intelligence of an individual. So through
experiential strategies we could develop
naturalist intelligence among students for
effective environmental resource
management.
LITERATURE REVIEW
Meyer&Maggie(1998)[17] suggest ways to
teach naturalist intelligence through
observation and field studies in an ordinary
setting such as the schoolyard. They give
emphasis to learning by doing- includes
knowledge and skills acquired outside of
book / lecture learning situations through
work, play and other life experiences.
Voukelatou (2019) [22] showed the
significant impact of experiential learning on
acquiring knowledge and developing social
skills and students' attitudes ,while
contributing to the promotion of cultural
heritage and the values of tradition this study
clearly the pics experiential learning in
teaching as well as analysing the teaching
method of the project in combination with
other different experience/ educational
techniques.
Bouhazzama&Mssassi(2020) [6] conducted
study on the impact of experiential learning
environment on secondary students.
Experiential learning activities include
simulations, field trips, discussions, role plays
were employed in the investigation and
results clearly envisages the positive impact
of an experiential learning curriculum for
secondary school students.
Banchi & Bell (2008) [2] developed a set of
interactive and experiential learning strategies
to promote learning. Environmental
awareness can be developed among
secondary school students by giving adequate
experiential activities and secondary level is
the best for inculcating positive attitude and
awareness towards nature(Sreekala, 2012)
[15]

Vidyabharati International Interdisciplinary Research Journal (Special Issue) ISSN 2319-4979
Special Issue on Engineering Technologies and Management 3782
“Discovering the Naturalist intelligence-
Science in the school yard” a book written by
Glock(1999) [12]clearly illustrates the
naturalistic traits in children and explains in
number of outdoor lessons with which we can
strengthen the naturalist intelligence of
learners.
Barton(2019)[4] pointed out that experience
learning approach is a cycle starting with
active exploration of surroundings by
students, makes note of what is happening,
then reflection followed by drawing
generalizations and preparing to experiment
for the next experience and explored the
importance of utilising resources like fields
and garden in making science subject more
real and interesting to pupil of all grades.
According to Hayes 2009 [14] states that
undergraduate Biology students can develop
naturalist intelligence by emphasising the
need for well-sounded scientific naturalist
developing curriculum that engage students in
outdoor enquiry based projects, and assisting
students in learning how to observe both the
natural world and their own learning ,all of
which are necessary skills for developing
expert naturalistic knowledge and he suggests
that professors, graduate students and
administrators can help undergraduate
Biology students to develop naturalistic
intelligence by allowing them to participate in
outdoor research.
Takur, G(2014) [21] developed a model to
nurture naturalistic intelligence through
integrated and constructivist based approach
to curriculum and pointed out that school
Gardens are a wonderful way to use the
schoolyard as a classroom, reconnect student
with the natural world and teach them
valuable gardening and agricultural concepts
and skills that integrate with several subjects
such as maths, science,art,health and physical
Education ,Social Studies as well as several
educational goals including personal and
social responsibility.
Natural settings are extremely important
because they allow children to understand
themselves, their surroundings, and their own
emotions (Marynard&Waters, 2007)[15].This
interaction promotes the children’s sense of
sharing and self-estee, Feelings expressing
and decision-making autonomy. As a result,
they will be more prepared to succeed in life.
Nature In addition to providing a learning
environment for experimentation, Discoveries
and research Children enjoy themselves when
they are not restricted themselves in a safe
setting that might bring them together. Self-
directed learning with nature and stimulation
for all senses. Using learning resources
without the help of teachers may aid in the
development of creativity and empathy in
elementary children.(Ceylan 2018) [8]
The affective bonds (connection to Nature)
and the Attentional benefits (perceived
restorativeness) at the basis of the relationship
between human beings and Nature can be a
solid starting point to foster naturalist
intelligence. The ability to “care for” and
“interact quietly” are indications of the
realization of an affective and emotional link
with nature. (Barbiero&Berto, 2018) [3]
According to research in the field of
experiential learning and multiple
intelligence, new and effective learning
strategies are needed to improve the teaching
learning process in our institution. This must
be accomplished by incorporating the key
elements of experiential learning,
Environmental education or environment
based topics in Biology .It is very essential to
create environmental concern in young
minds. As teachers we should inculcate
ecological values among learners by
enhancing their naturalistic intelligence by
exploring their immediate environment .
Naturalist intelligence, like other types of
intelligence, requires the right “environment”
, So this study throws light towards the
enhancement of naturalist Intelligence for
effective environmental resource
management through experiential learning.
STATEMENT OF THE PROBLEM
Naturalist intelligence can be fostered in
higher secondary students by emphasizing the
need for well rounded scientific naturalists,
designing curricula that engages students in
outdoor inquiry-based projects, and assisting
Vidyabharati International Interdisciplinary Research Journal (Special Issue) ISSN 2319-4979
Special Issue on Engineering Technologies and Management 3783
students in learning how to study both the
natural environment and their own learning
both of which are necessary skills for
developing expert naturalistic knowledge.
The main objective of the present study is to
find out the effectiveness of experiential
learning strategy in enhancing Naturalist
intelligence among higher secondary school
students for effective Environmental
Resource Management. So the study is titled
as “Enhancing Naturalist intelligence through
experiential learning for effective
environmental resource management”.
OBJECTIVES OF THE STUDY
1) To find out the level of Naturalist
intelligence among higher secondary
school students.
2) To develop a learning strategy based on
experiential learning.
3) To find out the level of awareness
regarding environmental resource
management among higher secondary
school students.
4) To find out the effectiveness of
experiential learning strategy in
enhancing Naturalist intelligence among
higher secondary school students.
5) To find out whether there in any positive
correlation between Naturalist
intelligence and environmental resource
management among higher secondary
school students.
HYPOTHESIS OF THE STUDY
1) Experiential learning strategy is effective
in enhancing Naturalist intelligence
among higher secondary school students.
2) There exist a positive correlation between
Naturalist intelligence and environmental
resource management among higher
secondary school students.
METHOD ADOPTED FORT THE
STUDY
The main objective of the present study was
to find out the effectiveness of experiential
learning strategy in enhancing Naturalist
intelligence among higher secondary school
students for Effective environmental resource
management. Survey cum experiment method
was adopted for the study. The investigator
select pre test - post test non equivalent group
design. Survey method was adopted to
identify the level of Naturalist intelligence
among higher secondary school students
before and after the experimentation. A
questionnaire was prepared and used to find
out whether there exist any correlation
between naturalistic intelligence and
environmental resource management among
higher secondary school students before and
after the intervention. The investigator
developed a strategy based on experiential
learning on selected environmental topics
present in the SCERT Biology text, Standard
XI. The study was conducted on a sample of
100 students of standard XI of Kerala State
syllabus where 50 each for experimental
group and control group. Experimental group
was taught with experiential learning strategy
and control group through the prevailing
method. Before and after intervention of
Experiential learning strategy Naturalist
intelligence inventory and questionnaire on
environmental resource management were
administered as pre and posttests. The
experimental group was tested for the
effectiveness of experiential learning strategy
by administering naturalistic intelligence
inventory as pretest and after intervention
post test I and post test II.
The collected data were analysed using
suitable statistical techniques such as paired t
test and independent ‘t’ test.
TOOLS AND TECHNIQUES USED FOR
THE STUDY
Naturalist intelligence inventory.
Strategy based on experiential learning.
Questionnaire to measure extent of
correlation between naturalist intelligence
and environmental resource management.
ANALYSIS AND INTERPRETATION
This section focuses on the testing of
effectiveness of experiential learning strategy
in enhancing naturalist intelligence among
higher secondary school students by
comparing scores collected before and after
administering experiential teaching (pre test
post test scores) from the two groups through
following modes.
Vidyabharati International Interdisciplinary Research Journal (Special Issue) ISSN 2319-4979
Special Issue on Engineering Technologies and Management 3784
1) Comparison of pre and post test scores of
naturalist intelligences of both control and
experimental group for the total sample
using paired t test. In order to find out
whether there exist significant difference
between pre test and post test scores of
students in control and experimental
groups on naturalistic intelligence paired t
test was adopted. Table I reveals that
critical ratios obtained for results of
paired t test are greater than table value at
0.01levels. Hence accept the hypothesis
“experiential learning strategy is effective
in enhancing Naturalist intelligence
among higher secondary school students”.
That means there is significant difference
in the pre test and post test scores in each
teaching method and also difference in the
post test I score and post II scores.
Mean pre test score for control group was
13.20 (SD =4.036) which was increased
to 28.97 (SD = 6.872) with a percentage
increase of 141.66. For experiential
group, Mean pre test score was 14.47 (SD
= 4.777) increased to 36.26 (SD = 8.31)
with percentage increase 150.58.
percentage increase from pre test to post
test scores for control group was 141.66
and experimental group was 150.58.
Table I : Results of paired t test for
comparing pre test and post test scores of
naturalistic intelligence of control group and
experimental group.
Group N Mea
n
SD CR Percenta
ge
increase
Pre test 5
0
13.2
0
4.03
6
14.0
0
141.66
Post I 5
0
28.9
7
6.87
2
Control
Pre test
5
0
13.2
0
4.03
6
5.17 150.58
Post II 5
0
19.1
4
7.10
Post I 5
0
28.9
7
6.87
2
5.04 -34.81
Post II 5
0
19.1
4
7.10
Pre test 5
0
14.4
7
4.71
7
16.1
5
148.27
Post I 5
0
36.2
6
8.31
Experime
ntal Pre
Test
5
0
14.4
7
4.71
7
9.17 92.79
Post II 5
0
27.2
2
8.66
Post I 5
0
36.2
6
8.31 5.32 -19.92
Post II 5
0
27.2
2
8.66
Analysis of the data confirms that there is
significant increase in post test scores after
administering the experiential learning
strategy and prevailing activity-oriented
method of instruction. However comparing
the percentage increase, control group has the
lesser increase compared to experiment
group. Reduction from post test I and post
test II was noted in the case of experimental
group compared to control group. This
pointed out that the students who were
exposed experiential learning strategy showed
significant development in naturalist
intelligence over control groups.
2) Comparison of pre test, post test I and
post test II of naturalist intelligence scores
between control and experimental group
evaluated using independent t test in order
to asses the extent to which experiential
learning strategy could enhance naturalist
intelligence of students at higher
secondary level, the details regarding the
test of significance of difference in the
mean pre test, post test I and post test II
Vidyabharati International Interdisciplinary Research Journal (Special Issue) ISSN 2319-4979
Special Issue on Engineering Technologies and Management 3785
scores of Naturalist intelligence among
experimental and control group are given
in table II
Measure
ment
Group Num
ber
of
stude
nts
Me
an
SD CR
Pre test Control 50 13.
20
4.0
6
1.65
*
Experim
ental
50 14.
47
4.1
7
Post test
I
Control 50 28.
97
6.8
72
3.14
**
Experim
ental
50 36.
26
8.3
1
Post test
II
Control 50 19.
14
7.1
0
5.3*
*
Experim
ental
50 27.
22
8.6
6
* indicates significant at 0.01level.
** indicates significant at 0.05level.
Table 2 reveals that critical ratio calculated
(3.142) for comparing the effectiveness of
experiential learning strategy using post test I
and post test II (5.315) were found to be
greater than the table value 2.58 at 0.05 level.
Mean scores was higher in the case of
experimental group indicates that experiential
learning strategy is effective for improving
naturalistic intelligence of students.
3) Analysis of correlation between the
naturalistic intelligence and effective
environment resource management.
Table III
Variable Naturalistic
intelligence
Environment
resource
management
Naturalistic
intelligence
1 0.25**
Environment
resource
management
1
Significant at 0.01 level
From the above table, it is evident that the
select variables of the present study, namely
Naturalist Intelligence and Environmental
resource Management are positively
correlated with each other and significant at
0.01 level. Environmental resource
Management seeks to conserve and preserve
ecosystem services for future human
generations and also maintaining ecosystem
integrity by taking into account ethical,
economic and scientific variables.
Conclusion
The data used to determine the association
between experiential learning and Naturalist
intelligence clearly demonstrates that there is
a strong positive relationship between two.
As a result it can be argued that experiential
learning experiences in the class room are
beneficial. Learners were found to be
successful in improving their Naturalist
intelligence. The findings of the study also
revealed that different aspects of
Environmental Resources Management,
among the learners is also improved by the
enhancement of Naturalist intelligence. The
multiple correlation between Naturalist
intelligence, Experiential Learning and
Ethical, economic and Scientific variables of
Environment Resource Management was
calculated and the obtained value
R=0.253nenvisages that there exists positive
correlation between the variables.
Educational Implications and limitations of
the study
The present study pointed out that by
incorporating well-defined experiential
learning strategies in the form of field trips,
nature walk, outdoor activities in curriculum
will enhance environmental consciousness
and environmental ethics of secondary school
Vidyabharati International Interdisciplinary Research Journal (Special Issue) ISSN 2319-4979
Special Issue on Engineering Technologies and Management 3786
students. It also highlights the importance of
incorporating outdoor activities into the
classroom by adopting experiential approach
in the teaching learning process, a teacher can
make her student more environment-friendly.
Keeping the results of the study in mind the
Agencies responsible to improve the quality
of education should take up the task of
developing experiential learning strategies by
utilising natural resources of the learner. The
study is limited to secondary level students of
Kerala state. The researcher have not
included other aspects of Intelligence and
cognitive development of the learner such as
influence of experiential learning approach
and academic excellence, different
experiential learning strategies other than
nature related activities like prodigy, Cross
Age peer tutoring , mnemonics etc.
References
1. Armstrong ,(2002) , “Seven Kind Of Smart
Menemukan dan Meningkatkan
Kecerdasan Anda Berdasarkan Teori
Multiple Intelligence (Jakarta: Gramedia)
2. Banchi, H., and Bell, R. (2008). "The
Many Levels of Inquiry".Science and
Children, Vol. 46, No. 2.
3. Barbiero, G.,and Berto,R, (2018), “From
Biophilia to Naturalist Intelligence Passing
Through Perceived Restorativeness And
Connection to Nature”,Ann Rev Researh
3(1): ARR.MS.ID.555604
4. Barton,T.,(2019),Experiential Learning In
And Out Of Classrooms, August
20,2019,https://servelearn.co/blog/experien
tial-learning-in-and-out-of-classrooms/
Retrieved on July 2021
5. Beetlestone ,(2012) ,”Creative Learning:
Strategi Pembelajaran untuk Melesatkan
Kreatifitas Siswa (Bandung: Nusa
Media)Naturalist Intelligence, Experiential
Learning, Environmental Resource
Management, Scientific Naturalist, Higher
secondary school students
6. Bouhazzama, M.,and Mssassi,S.,(2021),
The impact of experiential learning on
Environmental Education during a
Moroccan summer university,E3S Web of
Conferences 234, 00031,ICIES
2020,https://doi.org/10.1051/e3sconf/2021
23400031
7. Bouslog , M.,(2000), “Experiential
Learning Activities to try in your
classroom”; Retrieved from Teach hub.
Com k-12 Resources by teachers for
retrieved on May 17,2021
8. Ceylan ,M., (2018),”Effect of nature-
activities education program on the
Multiple intelligence level of children in
the age group Of 8 to 12 years “
,Educational Research and Reviews,Vol.
13(10), pp. 365-374, 23 May, 2018,DOI:
10.5897/ERR2018.3493
9. Ford, P., (1986), Outdoor education:
Definition and philosophy (pp. 1-15)
(United States, U.S. Department of
Education, Office of Educational Research
and Improvement). Las Cruces, NM: ERIC
Clearinghouse on Rural Education and
Small Schools. Retrieved on July 25, 2021
from
https://files.eric.ed.gov/fulltext/ED267941.
pdf“Frequently asked questions.” (2014).
Minnesota’s K-12 Academic Standards.
Minnesota Department of Education.
Retrieved November 26, 2017 from
Education.state.mn.us/MDE/dse/stds
10. Gardner, H., (1993), Frames of mind: The
theory of multiple intelligences. New
York, NY: Basic Books.
11. Gardner, H., (2006), Multiple
intelligences: New horizons (Completely
rev. and updated.). New York:
BasicBooks.
12. Glock, J., Wertz, S., Meyer, M., (1998),
"Discovering the naturalist intelligence-
science in the schoolyard. Zephyr Press.
ISBN-13978-1569760895.
13. Hasanah,N.,Harmawati,D. Riyana and
Usman, A, N,(2019), “Improve naturalist
intelligence of early childhood through
Gardening activities in group children a
Merauke State Pembina
Kindergarten”,IOP Conf. Series: Earth and
Environmental Science, 343 (2019)
012186,Doi:10.1088/1755-
1315/343/1/01218

Vidyabharati International Interdisciplinary Research Journal (Special Issue) ISSN 2319-4979
Special Issue on Engineering Technologies and Management 3787
14. Hayes, M.,( ),” Into the Field:
Naturalistic Education and the Future
Of”,Conservation Biology, Volume 23,
No. 5, 1075–1079-C 2009 Society for
Conservation Biology ,DOI: 10.1111/j
1523-1739.2009.01302.x
https://doi.org/10.3390/educsci9020127
15. Kelly, Melissa,(2021), “Teaching Students
Who Have a Naturalist Intelligence.”
Thought Co, Feb. 16, 2021,
thoughtco.com/naturalist-intelligence-
8098.
16. Maynard,T., Waters, J., Learning in the
outdoor environment: a missed
opportunity? Early Years, Vol. 27, No. 3,
October 2007, pp. 255–265
17. Meyer M.,(1998), Learning and Teaching
through the Naturalist Intelligence
Clearing Environmental Education in the
pacific north west; Retrieved from
ERIC.ed.Gov/7id=I5184 retrieved on May
18,2021 .
18. Ouvry, M.,(2003), Exercising muscles and
minds: outdoor play and the early years
curriculum (London,19,National Early
Years Network)
19. Rogers, C.R.,(1969), Freedom to Learn: A
View of What Education Might Become,
1st ed.; Charles, E., Ed.; Merrill Publishing
Company: Columbus, OH, USA, 1969.
[Google Scholar]
20. Sreekala K.L., (2012), Perception of
secondary school teachers on experiential
Learning strategies – A qualitative study.
Cited in Gurujyothi Research and
Reflections. Vol. 6, Issue 1
21. Thakur, G. R.,(2014) , Nurturing
Naturalistic Intelligence through integrated
curriculum and constructivist based
approach, “National level seminar on
Environmental Re-engineering series 3-
family farming, organized by Pillai
Collage of Education and research, New
Panvel, India. 8th-9th December
2014;Retrieved from Research Gate on 17
May 2021.
22. Voukelatou, G.,(2019), “The Contribution
of Experiential Learning to the
Development of Cognitive and Social
Skills in Secondary Education: A Case
Study” Innovative Methods in Teaching in
Secondary Education, Educ. Sci. 2019,
9(2), 127.

Vidyabharati International Interdisciplinary Research Journal (Special Issue) ISSN 2319-4979
Special Issue on Engineering Technologies and Management 3788
RELATIONSHIP BETWEEN CRITICAL THINKING SKILL OF ANALYSIS AND
GUIDED DISCOVERY METHOD IN PHYSICS AT HIGHER SECONDARY SCHOOL
STUDENTS OF KERALA
Dr. Nithya Prem S.R.
Post-Doctoral Fellow (ICSSR) Department of Education, University of Kerala, Thiruvananthapuram
ABSTRACT
The study focuses on Relationship between Critical thinking skill of Analysis and Guided discovery method in physics
at higher secondary school students of Kerala It finds out the effectiveness of Guided discovery method is effective for
developing Analysis the sub skill of Critical thinking skills in physics at secondary school students of Kerala . Samples
of 62 students were selected for the study. Findings from this study revealed that there is significant difference between
the control and experimental groups with respect to the post test scores for Analysis the sub skill of Critical thinking
skills in physics at secondary school students of Kerala . It finds that Guided discovery method is effective for
developing Analysis the sub skill of Critical thinking skills in physics at secondary level students of Kerala.
Key words: Critical thinking skills, Guided discovery method, Analysis
Introduction
Critical thinking is an important skill in your
real and professional life. Employers value
workers who solving the problems logically
and observe new situations from different
perspectives in order to come up with the
suitable solution. Strong critical thinking
abilities are especially important in both
secondary and higher education
environments; critical reading and thinking
skills allow high school and college students
to engage in learning at the highest level.
The nature of Guided discovery Method is
best understood through the steps of critical
thinking formulated by Dewey (1933) which
is often called the ‘scientific method’. It
includes all the processes by which the
observing and amassing of data are regulated
with a view to facilitating the formation of
explanatory conceptions and theories. Hayes
and Devitt (2008) explained that critical
thinking strategies are not widely developed
or excised during primary and secondary
education‖ (p. 65). School systems need to
reform curriculum to confirm that high school
graduates have developed a strong foundation
of critical thinking skills, enabling young
aspirants to be more successful in their
pursuits after secondary school.
According to Ennis(2015), "Critical thinking
is that the intellectually disciplined method of
actively and assuredly conceptualizing,
applying, analyzing, synthesizing, and/or
evaluating data gathered from, or generated
by, observation, experience, reflection,
reasoning, or communication, as a guide to
belief and action." it's extremely counseled
by man of science Siegel(2013),Peter
Facione(1993) and Deanna Kuhn(2015).
Analysis is the ability to understand the
information you are being presented with and
being able to communicate the meaning of
that information to others. Analysis skills will
enable to better decode the information and
add clarity to what discovered
American Philosophical Association’s Delphi
project on the definition of critical thinking, is
that the characteristics of a critical thinker
include traits such as being inquisitive, fair-
minded, flexible, diligent, and focused on
enquiry (Facione 1990). In Facione’s
taxonomy (1990, p.12), critical thinking is
composed of six main skills, each containing
sub-skills, as -
Interpretation – Categorisation, Decoding
significance, Clarifying meaning
Analysis- Examining ideas, Identifying
arguments, Analysing arguments
Evaluation- Assessing claims, Assessing
arguments
Inference- Querying evidence,
Conjecturing alternatives, Drawing
conclusions
Explanation- Stating results, Justifying
procedures, Presenting arguments
Self-regulation-Self-examination, Self-
correction
Facione (1990) asserts that critical
thinking is focused self-judgement that
results in analysis, analysis, evaluation,
Vidyabharati International Interdisciplinary Research Journal (Special Issue) ISSN 2319-4979
Special Issue on Engineering Technologies and Management 3789
and inference, as well as an explanation
of the evidential, conceptual,
methodological, or contextual thoughts
upon which such judgement is based.
Guided discovery Method is a process which
begins with the initial contact with the
problem and ends when the answer is
received in the light of the given information.
Mayer (1983) defined problem solving as a
multiple step process where the problem
solver must find the relationship between past
experience and the problem at hand and then
act upon a solution. Galadima (2002) and
Suleiman (2010) stated that problem solving
is a complex process to learn; it consists of a
series of tasks and processes that are closely
linked together to form a set of heuristic
pattern - a set of suggestions and questions
that a person follow and ask himself in order
to resolve a dilemma. The defining of the
problem depends on individual’s experience,
therefore strategies and problem solving
approach is different for problem solvers.
The social movements now shaping the world
were not imagined by the best minds of a
generation ago.Critical thinking is logical
thinking sequences that requires pupils to be
reflective, and pay attention to decision-
making which lead their values and actions.
Critical thinking allows pupils to deduct with
more logic, to process intricate information
and look at diverse sides of an issue so they
can produce more concrete conclusions.
Critical thinking is challenging approach to
knowledge and gathers wisdom. It
incorporates ideas and facts from an empirical
position and then questioning new ideas in
view of values, attitudes and
experiential philosophy.
According to Stupple, E. J. N et.al (2017) The
Critical Thinking Toolkit is a substitute
measure that examines student beliefs and
attitudes about critical thinking. According to
Reynolds (2011), The list of core Critical
thinking skills includes observation,
interpretation, analysis, Interpretation,
evaluation, explanation, and meta cognition
an individual or group engaged in a strong
way of critical thinking gives due
consideration to establish for instance.
Ennis(2015), Critical thinking is that the
intellectually disciplined method of actively
and assuredly conceptualizing, applying,
analyzing, synthesizing, and/or evaluating
data gathered from, or generated by,
observation, experience, reflection, reasoning,
or communication, as a guide to belief and
action.
Objective of the study
To find out the effectiveness of guided
discovery method in Physics ‘Analysis’, the
sub skill of critical thinking skills among
students at secondary school students of
Kerala .
Hypothesis
Guided discovery method in Physics is
effective for developing ‘Analysis’, the sub
skill of critical thinking skills among students
at secondary school students of Kerala .
Methodology
The present study“Guided discovery method
is effective for developing‘Analysis’, the sub
skill of critical thinking skills in physics at
secondary school students of Kerala ” was
intended as a quasi-experimental study and
normative survey was adopted. Pretest-
posttest Non Equivalent Group Design was
selected for the experimental part of the
study. Stratified random sampling was
selected for the study. The experimental study
was conducted on a sample of 62 students
studying in the secondary schools of Kerala.
Analysis’, the sub skill of critical thinking
skills Test in Physics at secondary students of
Kerala. ‘Analysis’, the sub skill of critical
thinking skills Test in Physics at Secondary
level was executed for the experimental and
control group as pre test and post test.
Delayed post test was conducted for the
experimental group and control group after an
interval of two weeks to examine the
retention of ‘Analysis’, the sub skill of critical
thinking skills in physics at secondary school
students of Kerala .
Appropriate statistical techniques viz.,
computation of mean, percentages, critical
ratio, and analysis of covariance (ANCOVA)
were employed for data analysis.
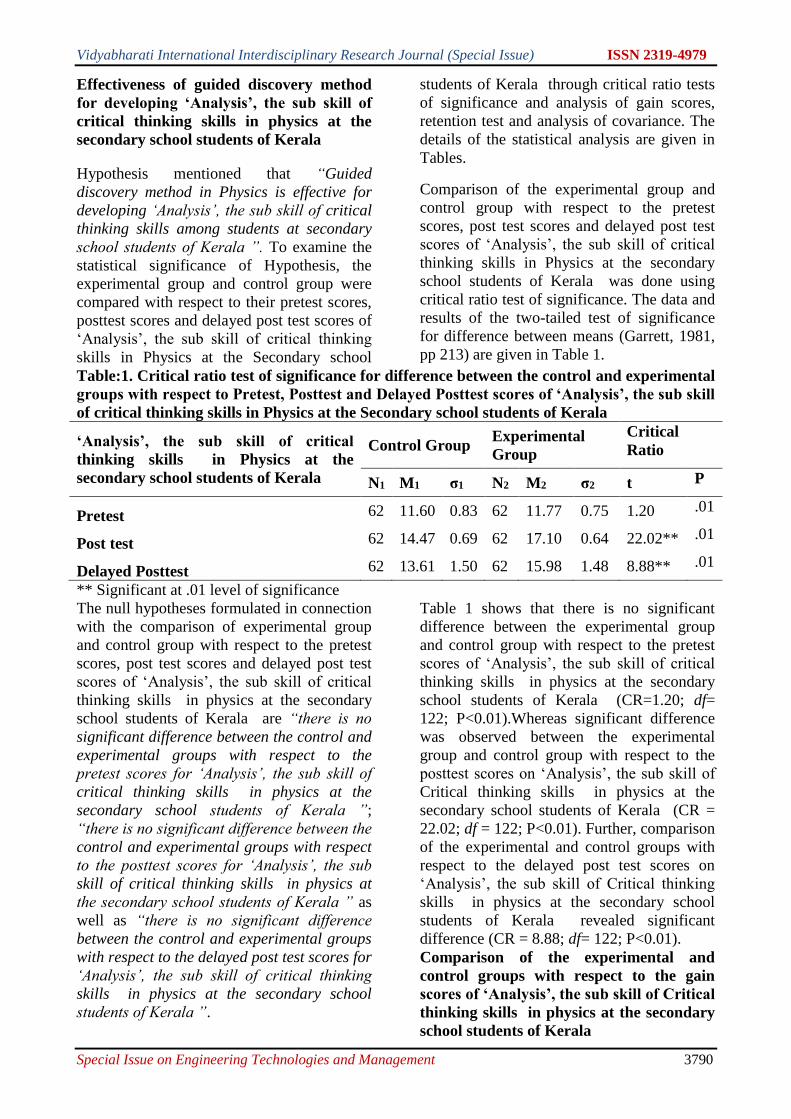
Vidyabharati International Interdisciplinary Research Journal (Special Issue) ISSN 2319-4979
Special Issue on Engineering Technologies and Management 3790
Effectiveness of guided discovery method
for developing ‘Analysis’, the sub skill of
critical thinking skills in physics at the
secondary school students of Kerala
Hypothesis mentioned that “Guided
discovery method in Physics is effective for
developing ‘Analysis’, the sub skill of critical
thinking skills among students at secondary
school students of Kerala ”. To examine the
statistical significance of Hypothesis, the
experimental group and control group were
compared with respect to their pretest scores,
posttest scores and delayed post test scores of
‘Analysis’, the sub skill of critical thinking
skills in Physics at the Secondary school
students of Kerala through critical ratio tests
of significance and analysis of gain scores,
retention test and analysis of covariance. The
details of the statistical analysis are given in
Tables.
Comparison of the experimental group and
control group with respect to the pretest
scores, post test scores and delayed post test
scores of ‘Analysis’, the sub skill of critical
thinking skills in Physics at the secondary
school students of Kerala was done using
critical ratio test of significance. The data and
results of the two-tailed test of significance
for difference between means (Garrett, 1981,
pp 213) are given in Table 1.
Table:1. Critical ratio test of significance for difference between the control and experimental
groups with respect to Pretest, Posttest and Delayed Posttest scores of ‘Analysis’, the sub skill
of critical thinking skills in Physics at the Secondary school students of Kerala
‘Analysis’, the sub skill of critical
thinking skills in Physics at the
secondary school students of Kerala
Control Group Experimental
Group
Critical
Ratio
N1 M1 σ1 N2 M2 σ2 t P
Pretest 62 11.60 0.83 62 11.77 0.75 1.20 .01
Post test 62 14.47 0.69 62 17.10 0.64 22.02** .01
Delayed Posttest 62 13.61 1.50 62 15.98 1.48 8.88** .01
** Significant at .01 level of significance
The null hypotheses formulated in connection
with the comparison of experimental group
and control group with respect to the pretest
scores, post test scores and delayed post test
scores of ‘Analysis’, the sub skill of critical
thinking skills in physics at the secondary
school students of Kerala are “there is no
significant difference between the control and
experimental groups with respect to the
pretest scores for ‘Analysis’, the sub skill of
critical thinking skills in physics at the
secondary school students of Kerala ”;
“there is no significant difference between the
control and experimental groups with respect
to the posttest scores for ‘Analysis’, the sub
skill of critical thinking skills in physics at
the secondary school students of Kerala ” as
well as “there is no significant difference
between the control and experimental groups
with respect to the delayed post test scores for
‘Analysis’, the sub skill of critical thinking
skills in physics at the secondary school
students of Kerala ”.
Table 1 shows that there is no significant
difference between the experimental group
and control group with respect to the pretest
scores of ‘Analysis’, the sub skill of critical
thinking skills in physics at the secondary
school students of Kerala (CR=1.20; df=
122; P<0.01).Whereas significant difference
was observed between the experimental
group and control group with respect to the
posttest scores on ‘Analysis’, the sub skill of
Critical thinking skills in physics at the
secondary school students of Kerala (CR =
22.02; df = 122; P<0.01). Further, comparison
of the experimental and control groups with
respect to the delayed post test scores on
‘Analysis’, the sub skill of Critical thinking
skills in physics at the secondary school
students of Kerala revealed significant
difference (CR = 8.88; df= 122; P<0.01).
Comparison of the experimental and
control groups with respect to the gain
scores of ‘Analysis’, the sub skill of Critical
thinking skills in physics at the secondary
school students of Kerala
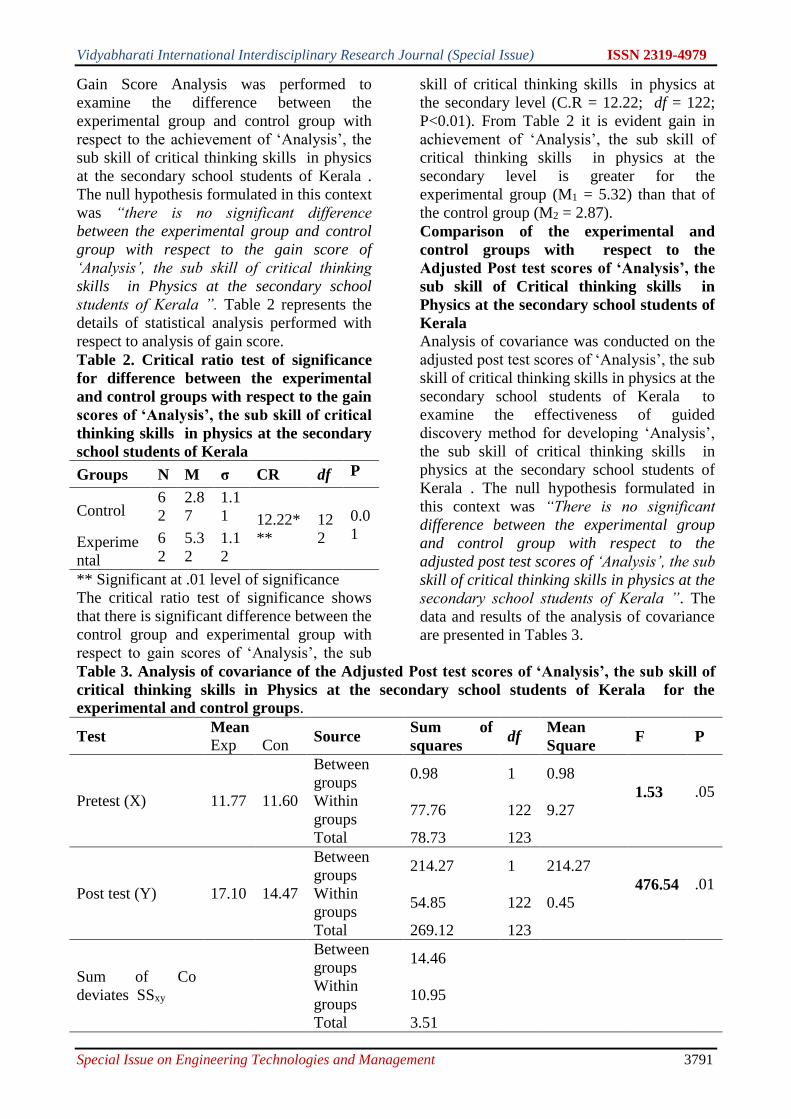
Vidyabharati International Interdisciplinary Research Journal (Special Issue) ISSN 2319-4979
Special Issue on Engineering Technologies and Management 3791
Gain Score Analysis was performed to
examine the difference between the
experimental group and control group with
respect to the achievement of ‘Analysis’, the
sub skill of critical thinking skills in physics
at the secondary school students of Kerala .
The null hypothesis formulated in this context
was “there is no significant difference
between the experimental group and control
group with respect to the gain score of
‘Analysis’, the sub skill of critical thinking
skills in Physics at the secondary school
students of Kerala ”. Table 2 represents the
details of statistical analysis performed with
respect to analysis of gain score.
Table 2. Critical ratio test of significance
for difference between the experimental
and control groups with respect to the gain
scores of ‘Analysis’, the sub skill of critical
thinking skills in physics at the secondary
school students of Kerala
Groups N M σ CR df P
Control 6
2
2.8
7
1.1
1 12.22*
**
12
2
0.0
1 Experime
ntal
6
2
5.3
2
1.1
2
** Significant at .01 level of significance
The critical ratio test of significance shows
that there is significant difference between the
control group and experimental group with
respect to gain scores of ‘Analysis’, the sub
skill of critical thinking skills in physics at
the secondary level (C.R = 12.22; df = 122;
P<0.01). From Table 2 it is evident gain in
achievement of ‘Analysis’, the sub skill of
critical thinking skills in physics at the
secondary level is greater for the
experimental group (M1 = 5.32) than that of
the control group (M2 = 2.87).
Comparison of the experimental and
control groups with respect to the
Adjusted Post test scores of ‘Analysis’, the
sub skill of Critical thinking skills in
Physics at the secondary school students of
Kerala
Analysis of covariance was conducted on the
adjusted post test scores of ‘Analysis’, the sub
skill of critical thinking skills in physics at the
secondary school students of Kerala to
examine the effectiveness of guided
discovery method for developing ‘Analysis’,
the sub skill of critical thinking skills in
physics at the secondary school students of
Kerala . The null hypothesis formulated in
this context was “There is no significant
difference between the experimental group
and control group with respect to the
adjusted post test scores of ‘Analysis’, the sub
skill of critical thinking skills in physics at the
secondary school students of Kerala ”. The
data and results of the analysis of covariance
are presented in Tables 3.
Table 3. Analysis of covariance of the Adjusted Post test scores of ‘Analysis’, the sub skill of
critical thinking skills in Physics at the secondary school students of Kerala for the
experimental and control groups.
Test Mean
Source Sum of
squares df
Mean
Square F P
Exp Con
Pretest (X) 11.77 11.60
Between
groups 0.98 1 0.98
1.53 .05 Within
groups 77.76 122 9.27
Total 78.73 123
Post test (Y) 17.10 14.47
Between
groups 214.27 1 214.27
476.54 .01 Within
groups 54.85 122 0.45
Total 269.12 123
Sum of Co
deviates SSxy
Between
groups 14.46
Within
groups 10.95
Total 3.51
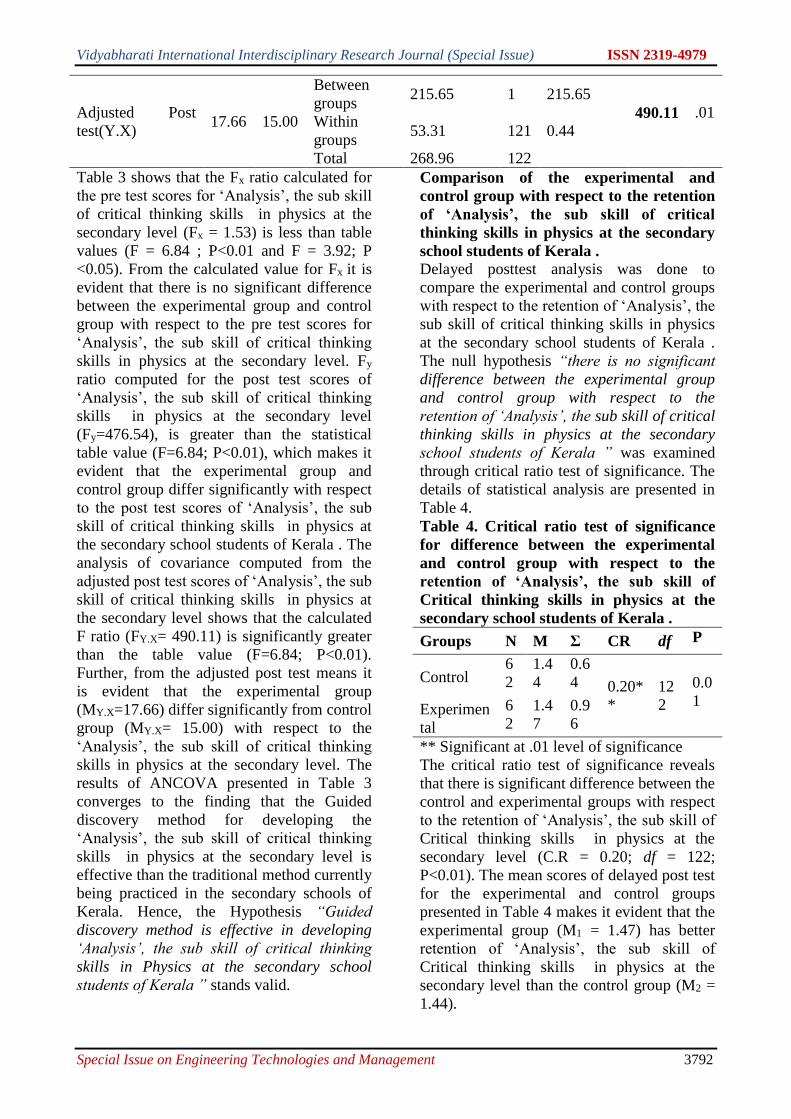
Vidyabharati International Interdisciplinary Research Journal (Special Issue) ISSN 2319-4979
Special Issue on Engineering Technologies and Management 3792
Adjusted Post
test(Y.X) 17.66 15.00
Between
groups 215.65 1 215.65
490.11 .01 Within
groups 53.31 121 0.44
Total 268.96 122
Table 3 shows that the Fx ratio calculated for
the pre test scores for ‘Analysis’, the sub skill
of critical thinking skills in physics at the
secondary level (Fx = 1.53) is less than table
values (F = 6.84 ; P<0.01 and F = 3.92; P
<0.05). From the calculated value for Fx it is
evident that there is no significant difference
between the experimental group and control
group with respect to the pre test scores for
‘Analysis’, the sub skill of critical thinking
skills in physics at the secondary level. Fy
ratio computed for the post test scores of
‘Analysis’, the sub skill of critical thinking
skills in physics at the secondary level
(Fy=476.54), is greater than the statistical
table value (F=6.84; P<0.01), which makes it
evident that the experimental group and
control group differ significantly with respect
to the post test scores of ‘Analysis’, the sub
skill of critical thinking skills in physics at
the secondary school students of Kerala . The
analysis of covariance computed from the
adjusted post test scores of ‘Analysis’, the sub
skill of critical thinking skills in physics at
the secondary level shows that the calculated
F ratio (FY.X= 490.11) is significantly greater
than the table value (F=6.84; P<0.01).
Further, from the adjusted post test means it
is evident that the experimental group
(MY.X=17.66) differ significantly from control
group (MY.X= 15.00) with respect to the
‘Analysis’, the sub skill of critical thinking
skills in physics at the secondary level. The
results of ANCOVA presented in Table 3
converges to the finding that the Guided
discovery method for developing the
‘Analysis’, the sub skill of critical thinking
skills in physics at the secondary level is
effective than the traditional method currently
being practiced in the secondary schools of
Kerala. Hence, the Hypothesis “Guided
discovery method is effective in developing
‘Analysis’, the sub skill of critical thinking
skills in Physics at the secondary school
students of Kerala ” stands valid.
Comparison of the experimental and
control group with respect to the retention
of ‘Analysis’, the sub skill of critical
thinking skills in physics at the secondary
school students of Kerala .
Delayed posttest analysis was done to
compare the experimental and control groups
with respect to the retention of ‘Analysis’, the
sub skill of critical thinking skills in physics
at the secondary school students of Kerala .
The null hypothesis “there is no significant
difference between the experimental group
and control group with respect to the
retention of ‘Analysis’, the sub skill of critical
thinking skills in physics at the secondary
school students of Kerala ” was examined
through critical ratio test of significance. The
details of statistical analysis are presented in
Table 4.
Table 4. Critical ratio test of significance
for difference between the experimental
and control group with respect to the
retention of ‘Analysis’, the sub skill of
Critical thinking skills in physics at the
secondary school students of Kerala .
Groups N M Σ CR df P
Control 6
2
1.4
4
0.6
4 0.20*
*
12
2
0.0
1 Experimen
tal
6
2
1.4
7
0.9
6
** Significant at .01 level of significance
The critical ratio test of significance reveals
that there is significant difference between the
control and experimental groups with respect
to the retention of ‘Analysis’, the sub skill of
Critical thinking skills in physics at the
secondary level (C.R = 0.20; df = 122;
P<0.01). The mean scores of delayed post test
for the experimental and control groups
presented in Table 4 makes it evident that the
experimental group (M1 = 1.47) has better
retention of ‘Analysis’, the sub skill of
Critical thinking skills in physics at the
secondary level than the control group (M2 =
1.44).
Vidyabharati International Interdisciplinary Research Journal (Special Issue) ISSN 2319-4979
Special Issue on Engineering Technologies and Management 3793
Findings emerged from section
1. There is no significant difference between
the control and experimental groups with
respect to the pretest scores (CR = 1.20; df
= 122; P<0.01) for ‘Analysis’, the sub skill
of critical thinking skills in physics at the
secondary school students of Kerala .
2. There is significant difference between the
control and experimental groups with
respect to the posttest scores (CR = 22.02;
df = 122; P<0.01) for ‘Analysis’, the sub
skill of critical thinking skills in physics at
the secondary school students of Kerala .
3. There is significant difference between the
control group and experimental group with
respect to gain scores (C.R = 12.22; df =
122; P<0.01) of ‘Analysis’, the sub skill of
critical thinking skills in physics at the
secondary school students of Kerala . The
gain in achievement of ‘Analysis’, the sub
skill of critical thinking skills in physics at
the secondary school students of Kerala is
greater for the experimental group (M1 =
5.32) than that of the control group (M2 =
2.87).
4. There is significant difference between the
experimental group and control group with
respect to the adjusted post test scores of
‘Analysis’, the sub skill of Critical
thinking skills in physics at the secondary
school students of Kerala ((FY.X =490.11;
df = 122; P<0.01). The experimental group
(MY.X = 17.10) is significantly better than
the control group (MY.X = 14.47) with
respect to the adjusted post test scores of
‘Analysis’, the sub skill of critical thinking
skills in physics at the secondary school
students of Kerala .
5. There is significant difference between the
control and experimental groups with
respect to the delayed post test scores (CR
= 8.88; df=122; P<0.01) for ‘Analysis’, the
sub skill of critical thinking skills in
physics at the secondary school students of
Kerala .
6. There is significant difference between the
control and experimental groups with
respect to the retention of ‘Analysis’, the
sub skill of critical thinking Skills in
physics at the secondary school students of
Kerala (C.R = 0.20; df = 122; P<0.01).
The experimental group (M1=1.47) has
better retention of ‘Analysis’, the sub skill
of critical thinking Skills in physics at the
secondary school students of Kerala than
the control group (M2 = 1.44).
Conclusion
Guided discovery method for developing
Critical thinking skills in physics at secondary
school students of Kerala is effective than the
existing method currently being practiced in
the secondary schools of Kerala. Teaching for
guided discovery in a context- free situation
has proved to be futile. Teaching Guided
discovery method to students in every field
facilitates organization of ideas, development
of different thought skills, and building
consistent thought models. As literature
recommend, students who attain the ability to
think critically and perceptively will perform
more effective in academically in their
current secondary school level, and will also
be better prepared for the rigors and enhanced
academic prediction in college.
References
1. Dewey, J. (1933). How We Think: A
Restatement of the Relation of Reflective
Thinking to the Educative Process .
Boston: Health and Company.
2. Ennis, Robert H.(2015)."Critical
Thinking", The Palgrave Handbook of
Critical Thinking in Higher Education.
Palgrave
Macmillandoi:10.1057/9781137378057.0
005, ISBN 9781137378057.
a. Facione, P. (1990). Critical Thinking: A
Statement of Expert Consensus for
Purposes of Educational Assessment and
Instruction, Research Findings and
Recommendations, American
Philosophical Association, Newark, Del.
3. Facione, P., & Facione, N. (1994).
Holistic critical thinking scoring rubric A
Tool for Developing and Evaluating
Critical Thinking, California Academic
Press, Insight Assessment, Millbrae, 18-
21.
4. Galadima, I. (2002). The relative effect of
heuristic problem solving instruction on

Vidyabharati International Interdisciplinary Research Journal (Special Issue) ISSN 2319-4979
Special Issue on Engineering Technologies and Management 3794
secondary school students’ performance
on algebraic word problems. The Journal
of the Mathematical Association of
Nigeria, 27(1) 190-197.
5. Hayes, K., & Devitt, A. (2008).
Classroom discussions with student-led
feedback: a useful activity to enhance
development of critical thinking skills.
Journal of Food Science Education, 7(4),
65-68. Retrieved from
http://www.ift.org/knowledge-
center/read-ift-publications/journal-of-
foodscience-education.aspx
6. Mayer, R. E. (1983). Thinking, problem –
solving and cognition. New York, NY:
W. H. Freeman and Company.
7. Stupple, E. J., Maratos, F. A., N. Elander,
J., Hunt, T. E., Cheung, K. Y., &
Aubeeluck, A. V. (2017).Development of
the Critical Thinking Toolkit (CriTT): A
measure of student attitudes and beliefs
about critical thinking. Thinking Skills
and Creativity.
8. Suleiman, B. (2010). The effect of
problem-solving models on student’s
performance in statistics word problems
(Unpublished doctoral dissertation).
University of Ilorin, Ilorin, Nigeria.
Vidyabharati International Interdisciplinary Research Journal (Special Issue) ISSN 2319-4979
Special Issue on Engineering Technologies and Management 3795
PAPPA KNOWS EVERYTHING: THE PAINFUL PLEASURE OF GABRIEL
TALLENT’S MY ABSOLUTE DARLING
Dr. Soumy Syamchand Post-Doctoral Fellow, School of Letters, Mahatma Gandhi University, Kottayam, Kerala. Email:
[email protected] https://orcid.org/0000-0002-0158-6854
ABSTRACT
The present paper focuses on the relationship between an individual and the collective memory and brings out the
concept of personalizing the traumatic historical events. It is difficult, if not impossible, to blot away atrocities from the
consciousness of an individual and traumatized childhood experience denial, repression and dissociations both at the
social and individual levels, and a probe into the past becomes imperative to understand the present and the future.
The victims of childhood abuses, rapes and long-time traumatic experience suffer from dissociation which is a
psychological process where the mind of the victim is disconnected from the bodily experience. The paper explores
Gabriel Tallent’s My Absolute Darling and the phenomenon of childhood trauma that results due to the abuses that the
child encounters and how these repressions results in a life long struggle with the self. The novel is a heartbreakingly
insightful study of the conflicted inner life of an abused victim.
Key words: Childhood Trauma, psyche, abuse, incest.
Trauma, the Greek word for wound
has departed from its real meaning and has
acquired a place within the area of
psychology, anthropology, medicine, and
literary as well as cultural studies. Traumatic
experience can have a devastating impact on
a child, altering his physical, cognitive and
social development. In turn, the impact on the
child gets profound reflection on its family as
well as on the society and provides room to
explore the Freudian phase of loss, repetition
and shared witnessing that constitute the
traumatic experience. In trauma-theoretical
approaches to literature, a distinction is often
made between “acting out” and “working
through”, terms based on Freudian
Psychoanalysis, and further developed by
critics like Dominick La Capra. When a
traumatised person is “acting out” after a
traumatic event, he or she has not yet reached
the point of coming to terms with the
experience and the emotions involved in it.
The person who is acting out often re-
experiences the event, e.g. in flashbacks,
hallucinations or dreams, which could be seen
as an (unconscious) attempt to cope with the
experience. In order to move on with their
lives, it is generally believed that the
traumatised should “work through” the
trauma. The notions of “acting out” and
“working through” are connected to the
Freudian terms of “melancholia” and
“mourning”, two possible psychological
reactions related to loss (La Capra 65). The
condition of acting out can manifest itself in
different ways. One of them consists of re-
experiencing the traumatic event: in that case
the traumatised person is likely to have
dreams, nightmares and/or illusions that take
him or her back to this event.
World Health Organization views
child abuse as an emotional or physical ill
treatment which results in potential harm to
the child’s health and development. Child
abuse includes physical, emotional, sexual
abuse and neglect. The world of a child
revolves around its parents as they provide
him with safety, security, love, and
sustenance. Child abuse violates his/her
relationship with the world and alters the
thoughts and feelings. Children are viewed as
weak and are easily oppressed
psychologically and physically making them
easy victims. A child’s brain development
takes place through the experiences it
receives from the family and environment
that envelops him but stressful incidents
affect the brain, making it more reactive and
less adaptive. The repetition of traumatic
experiences causes emotional and behavioural
problems leading to difficulties in regulating
the emotions.
According to Judith Herman, trauma
is a state of, “feeling of intense fear,
helplessness, loss of control and threat of
annihilation . . . traumatic events overwhelm
the human ordinary adaptations to life, then
adds, involve threats of life or bodily integrity
or close encounter with violence and death”
(Trauma 24). She classifies post-traumatic

Vidyabharati International Interdisciplinary Research Journal (Special Issue) ISSN 2319-4979
Special Issue on Engineering Technologies and Management 3796
stress disorder into three layers – the first is
the physical transformation and the sensitive
state of the trauma victim, the second is the
terrific experiences remains within victim’s
memory and the final is the method of
surrender when the attempt of self-defence is
paralyzed. The victim is weak to defend and
suffers from enduring vigilance and
sensitivity to environmental threat. PTSD is
seen in the survivors of repeated and
prolonged traumatic experiences and involves
symptoms like personality change, anger,
self-destructiveness and sexual behaviours.
The victims of childhood abuses, rapes and
long-time traumatic experience suffer from
dissociation which is a psychological process
where the mind of the victim is disconnected
from the bodily experience. The paper studies
the phenomenon of childhood trauma that
results due to the abuses that the child
encounters and how these repressions results
in a life long struggle with their self.
Trauma studies acclaimed great
importance in literary criticism after the
publication of Cathy Caruth’s Unclaimed
experience: Trauma, Narrative and History
and Kali Tal’s Worlds of Hurt: Reading the
literature of Trauma. Numerous literary
works especially novels has dealt with the
problems and conditions of children. The
violence against children in the manner of
physical, sexual or emotional abuse is rising
in the society and became a dark or depressed
reality in many corners of the world. Christa
Schonfelder is of the opinion that, “the
literary imagination, with its ability to
fictionalize and symbolize, can create a space
in which experiences that appear to defy
understanding and verbalization, that concern
existential dimensions of the trauma
condition especially threatening experiences
of vulnerability or morality can be explored
from multiple perspectives” (7).
Victorian literature had a more
sceptical approach and has marked the
beginning of literature concerned with
emotions of children. Many authors like
Dickens, W.H.G. Kingston, Lewis Carroll,
Charles Kingsley, Bronte sisters portrayed the
psyche of the children in their works. Genres
like adventure literature, domestic fiction,
fantasies, fairy tale and themes of child abuse
bring out the multiple perspectives of the
struggles faced by children. In African
American literature, mostly the feminist
writers took up the subject of childhood
subjugations and trauma as they had a first-
hand experience. The traumatized protagonist
in these works brings into forefront the
importance of individual trauma which is
often connected to larger social factors and
cultural ideologies. A novel dealing with
child abuse represents the children in the
world who suffers similar violence, slavery,
war, torture, rape, natural disaster etc.
The American writer, Gabriel Tallent
was born in New Mexico. He graduated from
Willamette University in 2010, and spent
time leading youth trail crews through the
backcountry of the Pacific Northwest. He
published stories in Narrative and in the St
Petersburg Review. My Absolute Darling
(2017) his debut novel, focuses on a fourteen
year old protagonist Julia, who is a victim of
sexual and physical abuse from her father
Martin. He tortures the girl claiming it as his
affection and care, but ultimately what exists
between them is an incestuous relation. The
victims of abuse suffer tremendously both
physically and mentally. The effect of abuse
may be short or long, but it destroys the
child’s sense and ability to lead a healthy
relationship. Judith Herman in her book
Father Daughter Incest points that,
Many abused children cling to the hope,
that growing up will bring escape and
freedom. But the personality formed in an
environment of coercive control is not
well adapted to adult life. The survivor is
left with fundamental problems in basic
trust, autonomy, and initiative. She
approaches the task of early adulthood -
establishing independence and intimacy -
burdened by major impairments in self-
care, in cognition and memory, in identity
and in the capacity to form stable
relationship. She is still a prisoner of her
childhood; attempting to create a new life
she encounters the trauma. (80)
My Absolute Darling is a heart
wrenching novel which revolves around a
fourteen year old Julia Alveston, who is
abused by her father. The girl is known by the
nick name Turtle and her father affectionately
Vidyabharati International Interdisciplinary Research Journal (Special Issue) ISSN 2319-4979
Special Issue on Engineering Technologies and Management 3797
calls her ‘Kibble’ or ‘My absolute darling’, is
a victim of physical, sexual, and emotional
violence. The abuse that she faces is from
Martin, her father. She expects the abuse at
any time and even waits for it, because her
psyche has reached a tune with the daily
abuse, harassment and torture by her father, a
human monster:
He comes into the room. He raises her
chin up with his knuckle and she puts her
arms around him and breathes in his scent,
wool and cigarettes and gun grease. The
sig Sauer is still in her hand. He carries her
back to his room, and she feel for him a
terrible neediness. He is so massive that to
be in his arms is skin-crawlingly good,
like returning home, like going back to
being a child. Martin cradles her in one
arm to work the cut glass knob with the
other and kicks open the door and carries
her into the bedroom with his clothes
strewn on the floor and a new bed with
new sheets and a new bedside table. (AD
327)
Martin used to crouches over her by
calling in his usual tone ‘Goddamn, Kibble’
and used to put his hands on her hip bones, on
her stomach, on her face and runs his scarred
fingertips through her hair. She bears it
facedown thinking, whether she want it or
not, but his touch gave life to her skin and it
hold him close to her. She keeps all these
within her. His approach made her lose faith
in each and everyone around her. The father
who is supposed to be a child’s protector
becomes a tyrant who destroys both her mind
and dreams. This was not what she deserved
from a father, who seduced her sexually
making her believe that he is the only one
who loved her.
Judith Herman in her work Father
Daughter Incest said that, “When a parent
compels a child to work to support the family,
that is the exploitation of child labour. When
a parent compels a child to fulfil his sexual
needs, that is incest” (4). Turtle is an object in
the hands of Martin who used her daughter to
gratify his sexual needs. At the age of six
Turtle is proficient with firearms and he
rigorously trained her in survival skills. Turtle
is affectionate to her father, but at the same
time develops a self-hatred, but also believes
that her father is perfect as she blindly loves
him. “I don’t want to get away from my
daddy, she says. And I don’t think he would
let it happen, either . . . He is my daddy” (AD
253-54). As a victim of abuses Turtle’s mind
is fragmented and is not ready to accept the
real nature of her father. She suffers from
derealisation and her distressed mind creates
an image of goodness about Martin and views
him through her mind’s eye. But Martin is a
wild creature who creeps into his daughter’s
room to rape her and compels her to do pull
ups by holding a knife under her. She is afraid
and stands on her heels and his cruel
entertainment brings blood stains in her body
parts which she never reveals to anyone. She
develops into an unusual character unlike
other children of her age as he had injected
her with fear, anger and anxiety.
Turtle fails to concentrate in her class
and her teacher suspects the abuse. Martin
used to punish Turtle brutally for every single
reason. When she fails in the vocabulary test
conducted by Martin, he asks her to work
with the Sig Sauer and repeatedly warns her.
Turtle watches each and every movement of
her father and is not able to bear his pains
because she loves him, but simultaneously the
care that Martin gives his daughter is
dangerous as she is unable to identify the
right and wrong. It is his sexual and physical
abuse that makes her to collapse into self-
hatred.
Turtle is a victim of Stockholm
syndrome which leads to an incestuous
relationship being considered as a sexual
abuse, where there is an aggressor and a
victim similar to any other abusive
relationship. Judith Herman’s voices that,
“female children are regularly subjected to
sexual assaults by adult males who are part of
their intimate social world. The aggressors
are not outcaste and strangers; they are
neighbours, family friends, uncles, cousins,
stepfathers and fathers” (Incest 7). Martin has
a control over the child as she is dependent on
him for the unconditional protection and
nurturance. Turtle is imprisoned in an abusive
cage and is in a dilemma that she cannot
prevent her fate. Her grandfather Daniel, is
aware of the fact that Martin approach
towards Turtle was wrong but not aware of
Vidyabharati International Interdisciplinary Research Journal (Special Issue) ISSN 2319-4979
Special Issue on Engineering Technologies and Management 3798
the sexual abuses that she faces. Daniel use
to advice his son but he explained it as his
protectiveness towards his daughter, but after
his death, Turtle is devoid of all hopes.
Martin continued with his tortures:
You are mine, he says, and swings the fire
poker around and strikes her on the arm
and she pitches onto her stomach in the
mud, her left arm numb, her shoulder
broken feeling and she tries to rise, get one
hand under herself and heaves up and he
plants his boot on the small of her back
and drives her to the ground. He raises the
poker into the air and she thinks; get away,
get away. Turtle, for your life get away,
but she is pinned in place by his boot and
she thinks, you have to- you have to, but
she cannot move, and he brings the fire
poker down into the back of her thighs,
and she bucks, spasms. (AD 140)
Turtle never spoke about her pains
and sufferings to others and hid the truth
about her bruise from everyone. Martin used
to cook up stories to create an impression in
order to make Turtle believe that he is a
saviour who will take any risks to protect her.
He told her about the risk he had taken to
save her from the attack of mountain lions
and other beasts. Martin argues with the
school authorities when they complain about
Turtle’s poor learning skills by stating the
fact that the poor academic performance was
a result of her poor mental sanity. Turtle
hated her teacher Anna, but it is Anna who
doubts about the abuse, by observing her
inactive attitude in studies. She gives her a
helping hand, but Turtle not only hates Anna
but women in general. Anna finds her as a
Misogynist, who has isolated herself from
peers and displayed signs of misbehaving.
The absence of her mother has created a void
in her. Judith Herman says that “the
Cinderella story warns little girls that it is
dangerous to be left alone with a widowed
father, for a widowed father must remarry . .
.” (Incest 1). Turtle’s mothers’ friend
Caroline was of the opinion that he was the
kind of guy who always needs a woman in his
life. She was well aware about his treatment
of women. After his wife’s death he turns
Turtle as the woman in his life and most of
his friends tell him that Turtle resembled her
mother.
Turtle saved the life of Brett and
Jacob from the flood risking her own life. The
boys were her seniors in school and were
exactly opposite to Turtle as their lives had
the colours that she lacked. Despite the odds,
a friendship develops among them. Turtle’s
traumatised mind finds relief in their
company and she without openly showcasing
starts to maintain a distance from Martin. In
between, Martin disappears for several
months, leaving her to provide for her and
when he returns, he brings a nine year old
girl, Cayenne. Turtle’s dislike towards
Cayenne is changed when she realizes that
Martin is trying to seduce the little girl and
realises the fact that she has to save the girl
from Martin. Cayenne becomes sympathetic
towards Turtle when she realises about the
sexual abuse that Turtle was enduring and
questions why she has not reacted. She later
learns that it was Turtle’s fear that prevented
her from taking any actions against Martin.
Martin’s torture, the pains and the
abuses made her ready to take up and face
any dangerous physical and mental situations.
She has the mental courage to overcome the
hidden dangers in her life but what made her
down is her father’s treatment and her
courage was a pseudo cover to protect herself.
Judith Herman says that “traumatic events
overwhelm the human ordinary adaptation to
life, then adds, involve threats to life or
bodily integrity, or close encounter with
violence and death” (Trauma 24). In the
novel, Turtle decides to fight her father’s
abuses. She bravely fights him and stops the
rape of Cayenne and escapes with her to her
friend Jacob’s house. It was an act of self-
defence to protect the lives of her loved ones
that she drives the blade to his skin. The
murder was the result of her love, her trauma
and her sufferings. It was the abuse of her
father that turned her into a dangerous
neurotic:
His hand, enormous, calloused, covered in
sand, clenches at her and his strength is
just like she remembers it. She hauls him
into her lap and sits stooped over him, hot
and alive in the cold water, his labored
breathing twinned with a suckering
Vidyabharati International Interdisciplinary Research Journal (Special Issue) ISSN 2319-4979
Special Issue on Engineering Technologies and Management 3799
squelch. Turtle puts a hand on his face and
holds his jaw. His mouth opens
spasmodically, and she thinks he will talk,
he will say something now, but he just
gasps, sucking air through a pit in his
chest, and she covers it with her hand and
feels the wound draw flush against her
palm, and he drags in a breath. She thinks
that he will speak, but he does not speak.
She says, I love you. (AD 389)
Anna helps Turtle to overcome the
haunted memories and Turtle finds relief in
gardening. She was also shot by Martin and
one of the bullets made a severe injury, but
finally feels a peace as her terror has left her.
The pains, abuses, neglect, attacks and
tortures trigger her thoughts in between and
anything could move her to tears. A spider, a
loud noise and so on and she would lean back
against the wall and cried. Anna tried to calm
her by providing unflinching support but
Turtle could not explain the reason of her
tears. She suffered from severe Post
Traumatic Stress Disorder.
Abused children struggle to cope
with what they are experiencing and usually
cry out their anger, feel stress, pain etc.
Society and NGOs work hard to provide
support, love and care to the victims by
providing them with good rehabilitation.
Psychological studies show that the rate of
atrocities against children is on a rise and
these burning experiences traumatize them
for the rest of their life hindering the
development of their psyche. The alarming
fact is that most of these children face abuse
from their relatives or dear ones that creates a
permanent fear in their minds and estranges
them from the world.
The scars of the atrocities in the
minds of the characters are clearly delineated
in the work and the recollections of the past
are stressful to the survivors as they are in
constant flight to evade their memories.
Childhood trauma is related to psychosis and
schizophrenia where the distressing events
cause a permanent damage to the psyche of
the individual. The victims, the perpetrators
as well as the witnesses suffer from deep-
rooted fear about the repetition of the
traumatic events. They constantly flee from
scenes of violence and lose the confidence to
face the challenges of life experiencing
emptiness in worldly relations and
redemptions through faith.
References
1. Clark, E Anna. “Too Much, Never
Enough: The Painful Pleasure of Gabriel
Tallent’s My Absolute Darling.” Review
of My Absolute Darling by Gabriel
Tallent. Los Angeles Review of Books,
29 Aug. 2017.
www.Lareviewofbooks.org/article/too-
much-never-enough-the-painful-
pleasures-ofgabriel-tallents-my-absolute-
darling/. Accessed 8 Dec. 2020.
2. Ettler, Justine. “My Absolute Darling
Review: Gabriel Tallent’s disturbing
debut novel of abuse”, Review of My
Absolute Darling by Gabriel Tallent. The
Sydney Morning Therald, 21 Nov. 2017,
www.smh.com.au/entertainment/books/m
yabsolute-darling-review-gabriel-tallents-
disturbing-debut-novel-of-
abuse20171116-gzmq0r.html. Accessed
30 Nov. 2020.
3. Herman, Judith Lewis, and Lisa
Hirschman. Father Daughter Incest.
Harvard UP, 2000.
4. Herman, Judith Lewis. Trauma and
Recovery. Basic Books, 2015.
5. Schonfelder, Christa. “Theorizing Trauma
Romantic and Postmodern Perspective on
Mental Wounds”. Wounds and Words,
Transcript Verlag, pp. 27-31, JSTOR.
6. Tallent, Gabriel. My Absolute Darling.
Harper Collins, 2017.
7. Wolff, Carlo. “My Absolute Darling:
Taboos and Everyday Trauma,”
Pittsburgh Post-Gazette, 17 Sep. 2017.
www.post-
gazette.com/ae/books/2017/09/16/Taboos
-and-every-day-traumas-myabsolute-
darling-Gabriel-
Tallent/stories/201709170026. Accessed
26 Nov. 2020.
Vidyabharati International Interdisciplinary Research Journal (Special Issue) ISSN 2319-4979
Special Issue on Engineering Technologies and Management 3800
INFLUENCE OF PERFORMANCE APPROACH ORIENTATION ON ACADEMIC
ACHIEVEMENT OF SECONDARY SCHOOL STUDENTS
PRADEEP R V
RESEARCH SCHOLAR, Department of Education, University of Kerala, Thycaud P O,
Thiruvananthapuram, Kerala-695014. [email protected]
ABSTRACT
The present study aimed at investigating whether performance approach orientation influences the academic
achievement of secondary school students. Normative survey method was used for the study, which included a
representative sample of 384 secondary school students. A multi-stage cluster sampling technique was used for the
study. Performance approach orientation test (prepared and standardized by the investigator) was administered for
data collection, and Pearson correlation coefficient was used for the analysis. Findings of the study revealed that the
calculated value of r = 0.74 and is significant at 0.05 level. (r = 0.74; p<0.05). Hence, it can be concluded that there is
a significant positive relationship between Performance approach orientation and academic achievement. The value of
shared variance is obtained as 54.93. This means that 54.93% of the variance in one variable can be explained by the
other variable. The study's findings have significant implications in the field of education. It would be critical to
educators, academicians, and curriculum developers to prepare syllabus and activities for the students that would
enhance performance approach orientation, which will improve their academic performance.
Keywords: Performance approach orientation, Goal orientation, Adaptive behavior, Competitiveness, Attention
seeking, Action orientation.
INTRODUCTION
From a very young age, children learn from
their parents and teachers that they should get
good grades in the examination, and this has
been quite a high motivation for the learners
from schools to later at the universities
(Gafoor & Kurukkan, 2015). Indeed, many
educational institutions emphasize more on
relative comparison and acquiring higher
grades among students, which pushes them to
master the content and outperform others
(Abd-el-fatta, 2018). The goals which aim at
performing well relative to others can be
defined as the performing goals (Basit & ur
Rahman, 2017). Students with high-
performance goals concentrate more on
demonstrating their abilities than the desire to
acquire knowledge (Cellar et al., 2016).
Human behavior is motivated by desire and
needs and the process of achieving them
(O’Keefe et al., 2013). The goal orientation
theory explains this concept which became an
essential theoretical framework to understand
achievement motivation (Linnenbrink, 2005).
It was broadly divided into Mastery goal
orientation and Performance goal orientation
(Senko & Tropiano, 2016). These theories
examine how the students engage in their
academic pursuits (Izadikhah et al., 2012).
Later, it was further bifurcated, leading to
four divisions, namely, Mastery approach,
Mastery avoidance, Performance approach,
and performance avoidance (Senko &
Tropiano, 2016). The present study focus on
the influence of Performance approach
orientation on the academic achievement of
secondary school students.
Performance approach orientation can be
explained into five prominent traits.
Adaptive behavior:
It is a kind of behavior in which the
individual can adapt to the surroundings and
quickly adjust to it and make it favorable for
the achievement of his/her goals (Senko &
Tropiano, 2016).
Attention seeking
It is a conscious or unconscious effort made
by an individual to get others' attention and
thereby try to gain an appreciation for his/her
work (Linnenbrink, 2005). Students with this
behavior always prefer to be the center of
attraction and be highly motivated to express
their strength to others (Darnon et al., 2007).
Action orientation
It is the ability of an individual to detach
oneself from any negative situation and
convert any situation positively into their
favor by indulging in constructive actions
(Guarino et al., 2017). People with the action-
Vidyabharati International Interdisciplinary Research Journal (Special Issue) ISSN 2319-4979
Special Issue on Engineering Technologies and Management 3801
orientated trait are highly action-oriented and
always tends to action disposition (Martin et
al., 2008). They tend to have more self-
regulated than their counterparts.
Competitiveness
It can be defined as the intense need or desire
to win in an interpersonal situation (Self-
brown & Mathews, 2003). People with a
competitive mind are motivated by
achievement, and they always strive for
success and focus on winning (Lemberger et
al., 2012).
Result orientation
It is a trait in which one learns from its
mistakes and takes a conscious effort for
improvement (Martin et al., 2008). People of
this trait will get easily bored and restless if
not provided with challenging tasks.
REVIEW OF RELATED LITERATURE
Abd-el-fatta, (2018) conducted a study to
investigate the relationship between different
goal profiles and academic achievement and
the role of learning approaches as a mediator
between goal profiles and academic
achievement. The sample chosen for the
study was 350 high school students in Oman.
Learning Process Questionnaire was used for
data collection. The study revealed that
students with mastery approach goal profiles
showed deep interest in learning, and those
with performance-avoidance goals showed
the lowest.
Basit, & Rahman (2017) carried out a study
to identify the influence of achievement goal
orientations and their effects on their
academic performance in English on
secondary school students. A survey method
was used for the study, and the PALS scale
was used to assess the student's perception,
and a multiple-choice test measured
achievement. The study revealed that students
have multiple goal orientations, and the
prominent one among them was mastery
orientation followed by performance-
approach and performance-avoidance.
Guarino, et al., (2017) have tried to explore
the indirect effects of mastery goal orientation
and cognitive ability on post-training
performance in a learner-directed training
context in the present study. A representative
sample of 114 students was chosen for the
study, ranging from 18 to 38 years. The
study's findings are off-task thoughts mediate
the positive effect of mastery goal orientation
on post-training performance; on the other
hand, declarative knowledge mediates the
positive impact of cognitive ability on post-
training performance.
Creed, & Hennessy (2016) carried out a study
to bring out a model that considers goal
orientation, including mastery approach,
performance-approach, and performance-
avoidance approach as an antecedent to
vocational identity. The study sample was
281 young adult participants with a mean age
of 26, and 77 % were women. The study
results revealed that mastery and performance
approaches were more consistent with career
exploration and more excellent career-related
strategies. On the other hand, performance
avoidance was related to more career
commitment leading to more great distress.
Damian, et al., (2014) researched how self-
oriented and socially prescribed perfectionism
predicted students' goal orientation. A
representative sample of 584 adolescent
school students was chosen for the study. The
investigator used a cross-sectional
correlational design for the study. Multiple
regression was used as an essential statistical
technique, and it was found that self-oriented
perfectionism positively predicted mastery
approach and mastery avoidance gaol
orientation. The study concluded with the
findings that perfectionism predicts the
individual difference in adolescent school
students' achievement goal orientations;
however, different forms of perfectionism are
associated with different goal orientations.
O'Keefe, et al., (2013) carried out a study
ranging to nine months to examine the
changes in mastery goal orientation,
performance approach, performance-
avoidance approach, and self-worth
contingencies. The sample chosen for the
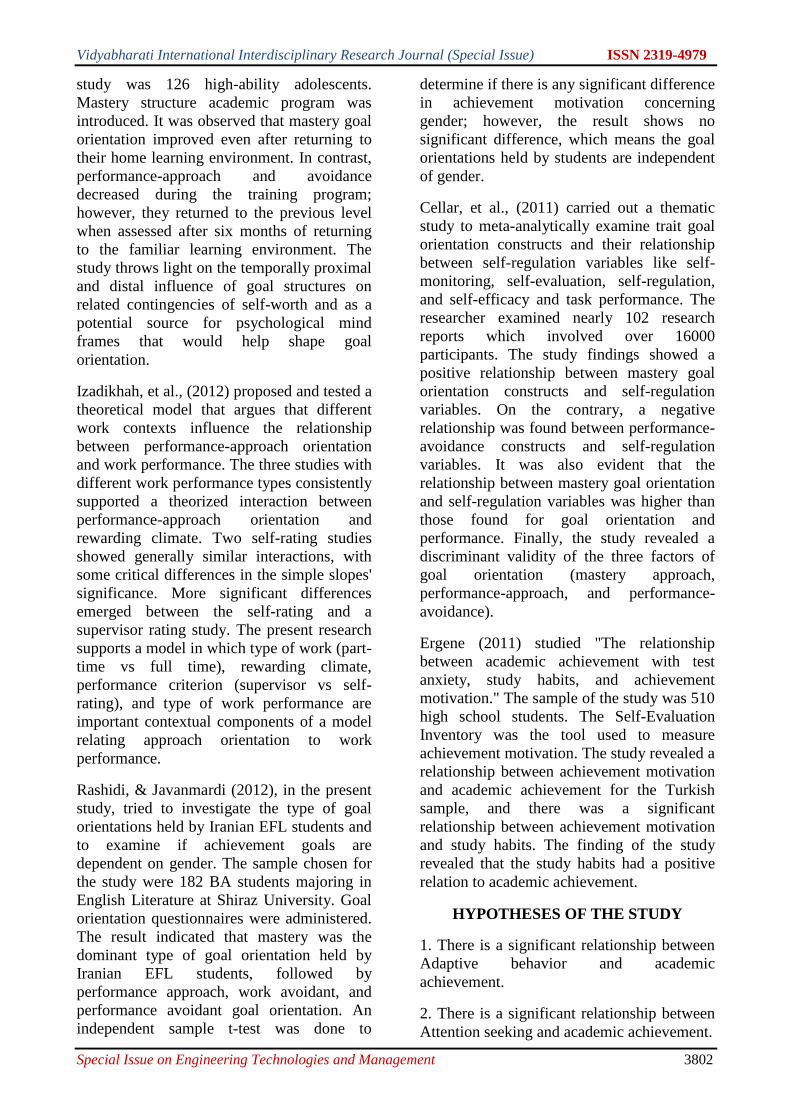
Vidyabharati International Interdisciplinary Research Journal (Special Issue) ISSN 2319-4979
Special Issue on Engineering Technologies and Management 3802
study was 126 high-ability adolescents.
Mastery structure academic program was
introduced. It was observed that mastery goal
orientation improved even after returning to
their home learning environment. In contrast,
performance-approach and avoidance
decreased during the training program;
however, they returned to the previous level
when assessed after six months of returning
to the familiar learning environment. The
study throws light on the temporally proximal
and distal influence of goal structures on
related contingencies of self-worth and as a
potential source for psychological mind
frames that would help shape goal
orientation.
Izadikhah, et al., (2012) proposed and tested a
theoretical model that argues that different
work contexts influence the relationship
between performance-approach orientation
and work performance. The three studies with
different work performance types consistently
supported a theorized interaction between
performance-approach orientation and
rewarding climate. Two self-rating studies
showed generally similar interactions, with
some critical differences in the simple slopes'
significance. More significant differences
emerged between the self-rating and a
supervisor rating study. The present research
supports a model in which type of work (part-
time vs full time), rewarding climate,
performance criterion (supervisor vs self-
rating), and type of work performance are
important contextual components of a model
relating approach orientation to work
performance.
Rashidi, & Javanmardi (2012), in the present
study, tried to investigate the type of goal
orientations held by Iranian EFL students and
to examine if achievement goals are
dependent on gender. The sample chosen for
the study were 182 BA students majoring in
English Literature at Shiraz University. Goal
orientation questionnaires were administered.
The result indicated that mastery was the
dominant type of goal orientation held by
Iranian EFL students, followed by
performance approach, work avoidant, and
performance avoidant goal orientation. An
independent sample t-test was done to
determine if there is any significant difference
in achievement motivation concerning
gender; however, the result shows no
significant difference, which means the goal
orientations held by students are independent
of gender.
Cellar, et al., (2011) carried out a thematic
study to meta-analytically examine trait goal
orientation constructs and their relationship
between self-regulation variables like self-
monitoring, self-evaluation, self-regulation,
and self-efficacy and task performance. The
researcher examined nearly 102 research
reports which involved over 16000
participants. The study findings showed a
positive relationship between mastery goal
orientation constructs and self-regulation
variables. On the contrary, a negative
relationship was found between performance-
avoidance constructs and self-regulation
variables. It was also evident that the
relationship between mastery goal orientation
and self-regulation variables was higher than
those found for goal orientation and
performance. Finally, the study revealed a
discriminant validity of the three factors of
goal orientation (mastery approach,
performance-approach, and performance-
avoidance).
Ergene (2011) studied "The relationship
between academic achievement with test
anxiety, study habits, and achievement
motivation." The sample of the study was 510
high school students. The Self-Evaluation
Inventory was the tool used to measure
achievement motivation. The study revealed a
relationship between achievement motivation
and academic achievement for the Turkish
sample, and there was a significant
relationship between achievement motivation
and study habits. The finding of the study
revealed that the study habits had a positive
relation to academic achievement.
HYPOTHESES OF THE STUDY
1. There is a significant relationship between
Adaptive behavior and academic
achievement.
2. There is a significant relationship between
Attention seeking and academic achievement.

Vidyabharati International Interdisciplinary Research Journal (Special Issue) ISSN 2319-4979
Special Issue on Engineering Technologies and Management 3803
3. There is a significant relationship between
Action orientation and academic
achievement.
4. There is a significant relationship between
Competitiveness and academic achievement.
5. There is a significant relationship between
Result orientation and academic achievement.
6. There is a significant relationship between
performance approach orientation and
academic achievement.
MATERIALS AND METHODS
Method: Correlational survey method was
used for the study.
Sample: A representative sample of 384
secondary school students from the
Thiruvananthapuram District of Kerala was
chosen for the study.
Sampling technique: Multi-stage cluster
sampling technique was used in the study for
the data collection. The following clusters
were made to select the sample.
Educational Districts: One (out of 3)
Educational Sub-Districts: Four (out of 12)
Schools: Two Schools from each Sub-district.
Class: IX std students of selected schools.
Divisions: Two from each school.
Variables: Performance approach orientation
is the independent variable, and Academic
achievement is the dependent variable.
Tools: Performance approach orientation
scale (Designed and standardized by the
investigator). The tool comprises five
components: Adaptive behavior, Attention
seeking, Action orientation, Competitiveness,
and Result orientation.
The academic achievement of students is
assessed based on the first term examination
conducted at the school. The marks were
converted to 100 for statistical calculations.
Hypothesis in the null form
1. There is no significant relationship
between Adaptive behavior and academic
achievement.
2. There is no significant relationship
between Attention seeking and academic
achievement.
3. There is no significant relationship
between Action orientation and academic
achievement.
4. There is no significant relationship
between Competitiveness and Academic
Achievement.
5. There is no significant relationship
between Result orientation and academic
achievement.
6. There is no significant relationship
between performance approach orientation
and academic achievement.
RESULTS AND DISCUSSION
Table 1 Correlation between Adaptive behavior and academic achievement
N Coefficient of
correlation (r)
t Level of
significance
SEr 95% CI
Lower
95% CI
Upper
Shared
variance
384 0.71 19.87 0.05 0.03 0.66 0.76 50.82
The calculated value of r = 0.71 and is
significant at 0.05 level. (r = 0.71; p<0.05).
Hence it can be concluded that there is a
significant positive relationship between
Adaptive behavior and academic
achievement. The value of shared variance is
obtained as 50.82. This means that 50.82% of
the variance in one variable can be explained
by the other variable.
Figure 1 Scatter plot of Adaptive behavior and
academic achievement
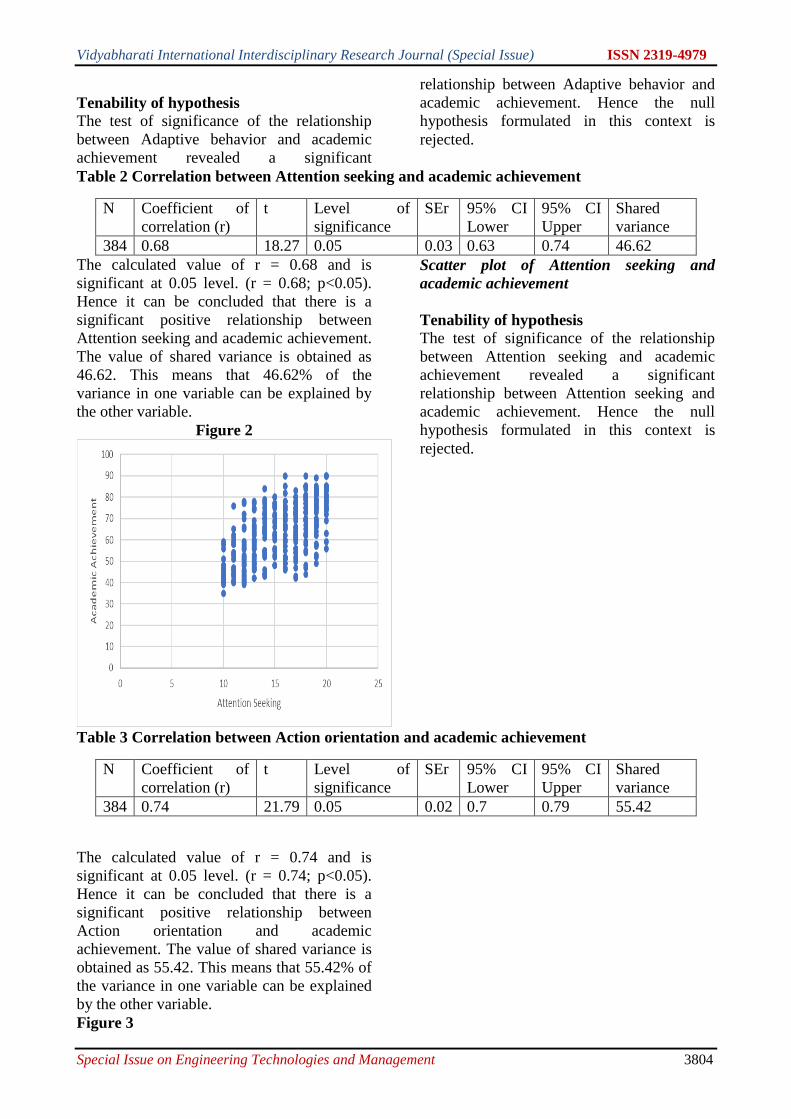
Vidyabharati International Interdisciplinary Research Journal (Special Issue) ISSN 2319-4979
Special Issue on Engineering Technologies and Management 3804
Tenability of hypothesis
The test of significance of the relationship
between Adaptive behavior and academic
achievement revealed a significant
relationship between Adaptive behavior and
academic achievement. Hence the null
hypothesis formulated in this context is
rejected.
Table 2 Correlation between Attention seeking and academic achievement
N Coefficient of
correlation (r)
t Level of
significance
SEr 95% CI
Lower
95% CI
Upper
Shared
variance
384 0.68 18.27 0.05 0.03 0.63 0.74 46.62
The calculated value of r = 0.68 and is
significant at 0.05 level. (r = 0.68; p<0.05).
Hence it can be concluded that there is a
significant positive relationship between
Attention seeking and academic achievement.
The value of shared variance is obtained as
46.62. This means that 46.62% of the
variance in one variable can be explained by
the other variable.
Figure 2
Scatter plot of Attention seeking and
academic achievement
Tenability of hypothesis
The test of significance of the relationship
between Attention seeking and academic
achievement revealed a significant
relationship between Attention seeking and
academic achievement. Hence the null
hypothesis formulated in this context is
rejected.
Table 3 Correlation between Action orientation and academic achievement
N Coefficient of
correlation (r)
t Level of
significance
SEr 95% CI
Lower
95% CI
Upper
Shared
variance
384 0.74 21.79 0.05 0.02 0.7 0.79 55.42
The calculated value of r = 0.74 and is
significant at 0.05 level. (r = 0.74; p<0.05).
Hence it can be concluded that there is a
significant positive relationship between
Action orientation and academic
achievement. The value of shared variance is
obtained as 55.42. This means that 55.42% of
the variance in one variable can be explained
by the other variable.
Figure 3
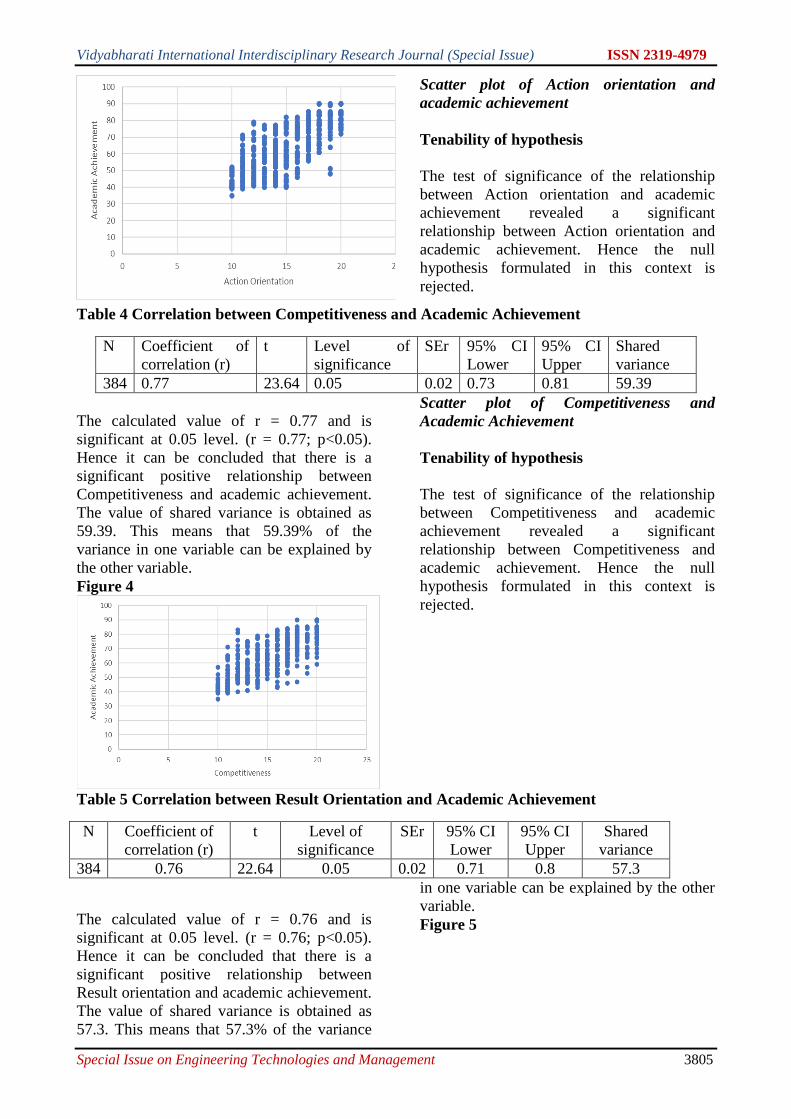
Vidyabharati International Interdisciplinary Research Journal (Special Issue) ISSN 2319-4979
Special Issue on Engineering Technologies and Management 3805
Scatter plot of Action orientation and
academic achievement
Tenability of hypothesis
The test of significance of the relationship
between Action orientation and academic
achievement revealed a significant
relationship between Action orientation and
academic achievement. Hence the null
hypothesis formulated in this context is
rejected.
Table 4 Correlation between Competitiveness and Academic Achievement
N Coefficient of
correlation (r)
t Level of
significance
SEr 95% CI
Lower
95% CI
Upper
Shared
variance
384 0.77 23.64 0.05 0.02 0.73 0.81 59.39
The calculated value of r = 0.77 and is
significant at 0.05 level. (r = 0.77; p<0.05).
Hence it can be concluded that there is a
significant positive relationship between
Competitiveness and academic achievement.
The value of shared variance is obtained as
59.39. This means that 59.39% of the
variance in one variable can be explained by
the other variable.
Figure 4
Scatter plot of Competitiveness and
Academic Achievement
Tenability of hypothesis
The test of significance of the relationship
between Competitiveness and academic
achievement revealed a significant
relationship between Competitiveness and
academic achievement. Hence the null
hypothesis formulated in this context is
rejected.
Table 5 Correlation between Result Orientation and Academic Achievement
N Coefficient of
correlation (r)
t Level of
significance
SEr 95% CI
Lower
95% CI
Upper
Shared
variance
384 0.76 22.64 0.05 0.02 0.71 0.8 57.3
The calculated value of r = 0.76 and is
significant at 0.05 level. (r = 0.76; p<0.05).
Hence it can be concluded that there is a
significant positive relationship between
Result orientation and academic achievement.
The value of shared variance is obtained as
57.3. This means that 57.3% of the variance
in one variable can be explained by the other
variable.
Figure 5
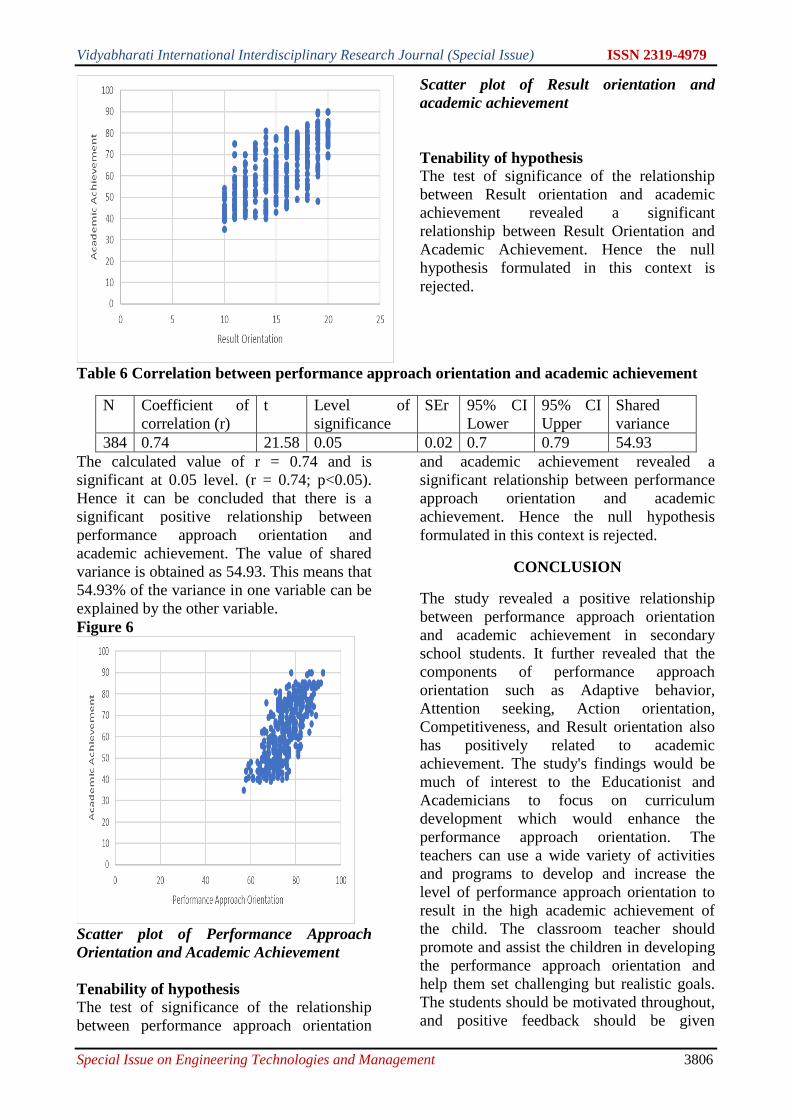
Vidyabharati International Interdisciplinary Research Journal (Special Issue) ISSN 2319-4979
Special Issue on Engineering Technologies and Management 3806
Scatter plot of Result orientation and
academic achievement
Tenability of hypothesis
The test of significance of the relationship
between Result orientation and academic
achievement revealed a significant
relationship between Result Orientation and
Academic Achievement. Hence the null
hypothesis formulated in this context is
rejected.
Table 6 Correlation between performance approach orientation and academic achievement
N Coefficient of
correlation (r)
t Level of
significance
SEr 95% CI
Lower
95% CI
Upper
Shared
variance
384 0.74 21.58 0.05 0.02 0.7 0.79 54.93
The calculated value of r = 0.74 and is
significant at 0.05 level. (r = 0.74; p<0.05).
Hence it can be concluded that there is a
significant positive relationship between
performance approach orientation and
academic achievement. The value of shared
variance is obtained as 54.93. This means that
54.93% of the variance in one variable can be
explained by the other variable.
Figure 6
Scatter plot of Performance Approach
Orientation and Academic Achievement
Tenability of hypothesis
The test of significance of the relationship
between performance approach orientation
and academic achievement revealed a
significant relationship between performance
approach orientation and academic
achievement. Hence the null hypothesis
formulated in this context is rejected.
CONCLUSION
The study revealed a positive relationship
between performance approach orientation
and academic achievement in secondary
school students. It further revealed that the
components of performance approach
orientation such as Adaptive behavior,
Attention seeking, Action orientation,
Competitiveness, and Result orientation also
has positively related to academic
achievement. The study's findings would be
much of interest to the Educationist and
Academicians to focus on curriculum
development which would enhance the
performance approach orientation. The
teachers can use a wide variety of activities
and programs to develop and increase the
level of performance approach orientation to
result in the high academic achievement of
the child. The classroom teacher should
promote and assist the children in developing
the performance approach orientation and
help them set challenging but realistic goals.
The students should be motivated throughout,
and positive feedback should be given
Vidyabharati International Interdisciplinary Research Journal (Special Issue) ISSN 2319-4979
Special Issue on Engineering Technologies and Management 3807
promptly to keep the children's enthusiasm high.
REFERENCE
1. Abd-el-fatta, S. M. (2018). The Effect of
Achievement Goals Profiles on Learning
Approaches and Academic Achievement :
A Multiple-Goals Perspective.
International Journal of School and
Cognitive Psychology, 5(3), 1–15.
https://doi.org/10.4172/2469-
9837.1000214
2. Basit, A., & ur Rahman, F. (2017).
Achievement Goal Orientations and
Performance in English: A study of
Secondary School Students. Haripur
Journal of Educational Research, 1(1),
40–52.
3. Cellar, D. F., Stuhlmacher, A. F., Young,
S. K., Fisher, D. M., Adair, C. K.,
Haynes, S., Twichell, E., Arnold, K. A.,
Royer, K., Denning, B. L., & Riester, D.
(2011). Trait Goal Orientation, Self-
Regulation, and Performance: A Meta-
Analysis. Journal of Business and
Psychology, 26(4), 467–483.
https://doi.org/10.1007/s10869-010-9201-
6
4. Cellar, D. F., Stuhlmacher, A. F., Young,
S. K., Fisher, D. M., Adair, C. K.,
Haynes, S., Twichell, E., Arnold, K. A.,
Royer, K., Denning, B. L., Riester, D.,
Adair, C. K., Haynes, S., Twichell, E.,
Arnold, K. A., Royer, K., Lynn, B., &
Devon, D. (2016). Trait Goal Orientation
, Self-Regulation , and Performance : A
Meta-Analysis Linked references are
available on JSTOR for this article : Trait
Goal Orientation , Self-Regulation , and
Performance : A Meta-Analysis. 26(4),
467–483.
5. Darnon, C., Harackiewicz, J. M., Butera,
F., Mugny, G., & Quiamzade, A. (2007).
Performance-approach and performance-
avoidance goals: When uncertainty makes
a difference. Personality and Social
Psychology Bulletin, 33(6), 813–827.
https://doi.org/10.1177/014616720730102
2
6. Gafoor, K. A., & Kurukkan, A. (2015).
Development of Academic Goal
Orientation Inventory for Senior
Secondary School Students of Kerala.
Guru Journal of Behaviour and Social
Sciences, 3(1), 352–360.
7. Guarino, S. N., Whitaker, V. L., & Jundt,
D. K. (2017). Mastery goal orientation
and cognitive ability effects on
performance in learner-guided training.
Journal of Applied Social Psychology,
47(1), 23–34.
https://doi.org/10.1111/jasp.12414
8. Izadikhah, Z., Jackson, C., & Ireland, M.
J. (2012). Effect of context on
performance approach orientation.
American Journal of Psychology, 125(2),
193–207.
https://doi.org/10.5406/amerjpsyc.125.2.0
193
9. Lemberger, M. E., Brigman, G., Webb,
L., & Moore, M. M. (2012). Student
Success Skills: An Evidence-based
Cognitive and Social Change Theory for
Student Achievement. Journal of
Education, 192(2–3), 89–99.
https://doi.org/10.1177/002205741219200
2-311
10. Linnenbrink, E. A. (2005). The dilemma
of performance-approach goals: The use
of multiple goal contexts to promote
students’ motivation and learning.
Journal of Educational Psychology,
97(2), 197–213.
https://doi.org/10.1037/0022-
0663.97.2.197
11. Martin, A. J., Marsh, H. W., Debus, R. L.,
& Malmberg, L. E. (2008). Performance
and mastery orientation of high school
and university/college students: A rasch
perspective. Educational and
Psychological Measurement, 68(3), 464–
487.
https://doi.org/10.1177/001316440730847
8
12. O’Keefe, P. A., Ben-Eliyahu, A., &
Linnenbrink-Garcia, L. (2013). Shaping
achievement goal orientations in a
mastery-structured environment and
concomitant changes in related
contingencies of self-worth. Motivation
and Emotion, 37(1), 50–64.
https://doi.org/10.1007/s11031-012-9293-

Vidyabharati International Interdisciplinary Research Journal (Special Issue) ISSN 2319-4979
Special Issue on Engineering Technologies and Management 3808
6
13. Self-brown, S. R., & Mathews, S. (2003).
Effects of classroom structure on student
achievement goal orientation. Journal of
Educational Research, 97(2), 106–112.
https://doi.org/10.1080/002206703095975
13
14. Senko, C., & Tropiano, K. L. (2016).
Comparing three models of achievement
goals: Goal orientations, goal standards,
and goal complexes. Journal of
Educational Psychology, 108(8), 1178–
1192. https://doi.org/10.1037/edu0000114
15. Sideridis, G. D. (2006). Achievement goal
orientations, “oughts,” and self-regulation
in students with and without learning
disabilities. Learning Disability
Quarterly, 29(1), 3–18.
https://doi.org/10.2307/30035528
16. Yeo, G. B., Sorbello, T., Koy, A., &
Smillie, L. D. (2008). Goal orientation
profiles and task performance growth
trajectories. Motivation and Emotion,
32(4), 296–309.
https://doi.org/10.1007/s11031-008-9099-
8
17. Yeo, G., Loft, S., Xiao, T., & Kiewitz, C.
(2009). Goal Orientations and
Performance: Differential Relationships
Across Levels of Analysis and as a
Function of Task Demands. Journal of
Applied Psychology, 94(3), 710–726.
https://doi.org/10.1037/a0015044

Vidyabharati International Interdisciplinary Research Journal (Special Issue) ISSN 2319-4979
Special Issue on Engineering Technologies and Management 3809
CHARACTERIZATIONS OF INFLATED PARAMETER DISTRIBUTIONS BASED ON
-TYPE LACK OF MEMORY PROPERTY
Rajasekharan K.E1, Sandhya E2
1Department of Statistics, EMEA College of Arts and Science Kondotti, India.
[email protected] 2Neelolpalam, S N Park Road, Thrissur, India. [email protected]
ABSTRACT Characterization of the inflated-parameter geometric distribution in terms of type lack of memory property is
established and this is extended to the characterization of inflated parameter extended geometric distribution.
Key words: zero-inflated distributions, inflated-parameter geometric distribution, measure of memory,
type lack of memory property.
Introduction
For the purpose of modeling different kinds
of count or frequency data structures in
various fields like reliability, insurance,
finance, biometrics, econometrics etc. a great
deal of research has been done in generalizing
the classical discrete distributions and is still
continuing. Modeling of count processes
based on Poisson distribution has been the
common approach. However, if the number
of observed zeros out do the expected number
of zeros, then one of the key features of the
Poisson structure is violated. For example, in
transportation research, one notable
characteristic of crash frequency data is that
the variance exceeds the mean of the crash
counts (Lord and Mannering (2010)). Often
count data exhibits more variability than the
variance under the Poisson model, a condition
called over-dispersion. Such over-dispersion
in count data can occur because of excess
zeros, unexplained heterogeneity or temporal
dependency.
The negative binomial model has a
built-in dispersion parameter that can account
for situations where the variance is greater
than the mean (Chin and Quddus (2003)).
Consequently, when count data are over-
dispersed, a number of studies have argued
for the negative binomial model as an
alternative to the Poisson model (Bliss and
Fisher (2003)).
Admitting that Poisson and negative
binomial models have been the most common
choices, in some situations they could still fail
to fit to a set of data with a lot of zeros due to
zero-inflation, over-dispersion or both (Deng
and Paul (2005)). Zero inflated count models
have gained considerable recognition as a
substitute for handling count data with a bulk
of zeros (Lambert (1992), Gupta et. al.
(1996), Lord et. al. (2004)). For these types
of count data, more zeros are noticed than
anticipated by a normal Poisson or negative
binomial process (Park and Lord (2009), Lord
et. al. (2007)).
In this paper, we discuss some
characteristics of the inflated parameter
distributions in connection with the -type
lack of memory property and the measure of
memory of discrete distributions. In Section 1
an overview of the zero-inflated distributions
and measure of memory is given. Inflated
parameter geometric distribution is discussed
in Section 2. Section 3 discusses a new
characterization of the inflated parameter
geometric distribution in the light of -type
lack of memory property. Extended
distributions inflated at the point ‘a’ and the
measure of memory of a-inflated distributions
is discussed in Section 4. Section 5 introduces
the inflated parameter extended geometric
distribution. Section 6 discusses the -type
lack of memory of this distribution.
Zero-inflated distributions and measure of
memory
Inflated parameter (zero modified)
discrete distributions are used to model
counts that encounter disproportionably large
frequencies of zeros, see Johnson et. al.
(1992). In certain applications involving
discrete data, it is sometimes found that X = 0
is observed with a frequency significantly
higher than predicted by the assumed model.
See Neyman (1939) and Feller (1943).

Vidyabharati International Interdisciplinary Research Journal (Special Issue) ISSN 2319-4979
Special Issue on Engineering Technologies and Management 3810
Zero-inflated models address the
problem that the data display a higher fraction
of zeros or non occurrences, than can be
possibly explained through any fitted
standard count model. Kolev et. al. (2000)
suggest an extension of the classical
univariate geometric, negative binomial,
Poisson, Bernoulli, binomial and logarithmic
series distributions by including an additional
parameter . It has a natural interpretation in
terms of zero inflation and because of this
they named the corresponding generalized
versions adding ‘inflated parameter’.
Let X be an arbitrary non-negative
integer valued random variable (r.v.)
such that
𝑃(𝑋 = 𝑡) = 𝑝(𝑡), 𝑡 =
0,1,2, . . . , ∑ 𝑝(𝑡) = 1∞
𝑡=0
(1.1)
and let
(1.2)
be the corresponding probability generating
function ( p.g.f.). An extra proportion of zeros
is added to the proportion of zeros from the
distribution of the r.v. X, while decreasing the
remaining proportions in an appropriate way.
The zero inflated modification, Y, of X is
defined by
(1.3)
The p.g.f. of Y is
(1.4)
𝐸(𝑌) (1.5)
𝐸(𝑌2) (1.6)
𝑉(𝑌) (1.7)
If then the corresponding zero
inflated distribution is degenerated at zero. If
, ‘nothing is changed’
In general, the inflation parameter
may take negative values provided that
and
therefore This
corresponds to the opposite phenomenon,
excluding a proportion of zeros from the
basic discrete distribution, if necessary.
Muth (1977) introduced the concept
of measure of memory of statistical
distributions in terms of the mean residual life
function employed in the reliability theory.
Nair (1983) suitably modified the above
measure of memory of evolve an expression
that enables the evaluation of memory for the
family of discrete distributions in which the
random variable assumes non-negative
integral values. It is shown that, when the
distribution lacks memory, the definition
proposed coincides with the conventional
counterpart. The measure of memory
proposed by Nair (1983) for a discrete
random variable is
(1.8)
where
Now, let MY be the measure of
memory of the zero-inflated discrete non-
negative random variable Y. Then, it can be
shown that
(1.9)
Inflated parameter geometric distribution
Kolev et. al. (2000) suggest a
generalization to the geometric distribution
by including an additional parameter
Let {w1, w2, w3, …} be a sequence of
independent binary variables
(2.1)
X
X sEsG
0 1 0P Y p
,...2,1t,tp1tYP
sG1sG XY
1 .E X
21 .E X
2221 1 .E X E X
1,
0
. ., .Y Xi e G t G t
,00YP
0. .,
1 0
pi e
p
.00p1
0p,1max
2 2
2
2 0 0.
0
r r E XM
E X r
.0t,tX|tXEtr
XE1XE1
XE1XE1XE12M
2
22
Y
XEXE
XEXEXE122
22
.1,0
0, 1
1,k
with probabilityw
with probability

Vidyabharati International Interdisciplinary Research Journal (Special Issue) ISSN 2319-4979
Special Issue on Engineering Technologies and Management 3811
Consider the zero inflated sequence
(2.2)
with,
Kolev et. al. (2000) has defined the
r.v. to be equal to the number of trials that
we need to achieve the first observed
“success” in the new constructed sequence
of independent binary
variables given by
(2.3)
The r.v. V has the usual geometric
distribution on the positive integers, ~
where
𝜋 ∗=(1 − 𝜋)(1 − 𝜌) + 𝜌 (2.4)
The r.v. is defined by the following
relations
(2.5)
The mean and variance are given by
(2.6)
(2.7)
Definition 2.1 The r.v. X defined by inflated-
parameter geometric distribution with
parameters and
is denoted by
If the defined inflated
parameter geometric distribution coincides
with the usual geometric distribution on the
non-negative integer values, with parameter
Measure of memory of X is given by
𝑀𝑋
This result implies that the measure of
memory is always negative irrespective of the
value of ρ.
type lack of memory property
In this section we obtain a
characterization of the inflated parameter
geometric distribution in the light of
type lack of memory property. Kolev et.
al. (2000) defines the type lack of
memory property as follows.
Definition 3.1 The r.v. U is said to have
type lack of
memory property if
for any and
Main Result
Theorem 3.1 Let X be a discrete r.v.
taking non-negative integral values. Then
X has an inflated parameter geometric
distribution with parameter and
if and only if the
following equivalent conditions are true.
1.
2. X has type lack of memory
property i.e.,
Proof: First assume that
Then,
...,w,w,w 321
0, 1 1
1, 1k
with probabilityw
with probability
.11
,1max
V
...,w,w,w 321
,pqtVP 1t
,...2,1t,1111t
V
1 * ,Geo
1 1 .
X
0XP
,...2,1t,1111tXP1t
1
1XE
22
1 1.
1V X
1,0
1max 1, ,1
.,IGe~X 0
,0
.
12
2112
.
0U|xUPXUP1bU|xbUP
0x .0b
,IGe~X.,ie 0
0 , 1.1
r t r and r t r s r t s
,IGe~X 0
tj tXP
jXPtjtr
| 1 .1
P X t s X s S t

Vidyabharati International Interdisciplinary Research Journal (Special Issue) ISSN 2319-4979
Special Issue on Engineering Technologies and Management 3812
(3.1)
(3.2)
(3.3)
Conversely, let and
We have, 𝑆(𝑡+1)
𝑆(𝑡)=
𝑟(𝑡)
1+𝑟(𝑡+1) and
where
On substitution, we get
𝑆(1) =𝑟(0)
1+𝑟 and
(3.4)
Hence,
𝑝(0) = 𝑆(0) − 𝑆(1)
(3.5)
(3.6)
which is of the form
where
Hence,
i.e., if and
then
Finally, to prove the equivalence of a and b
Let and
(3.7)
X has
type lack of memory property.
Conversely, let X has type lack of
memory property.
Then,
i.e., (3.8)
Now,
(3.9)
This completes the proof.
Extended distributions inflated at the point
‘a’ and their measure of memory
Let X be an arbitrary non-negative
integer valued r.v. and
integers such that
and
On inflating the r.v. Z at
‘a’ we will have the r.v. W defined by
(4.1)
,...2,1t;1
11
10 .
1r E X
1
1
1
110rtr
.
1
10rtr
, , 1.r t r s r t s
0 1,S
.S t P X t
,...3,2t;r1
r
r1
0rtS
1t
1
.1 1 r
1tStStp
r11
11
r11
11
1
11 1 .
1 1
t
r
,11111t
.
r11
1
,
r11
1IGe~X 0
10rtr
, 1,r t r s r t s
0
1~ , .
1 1X IGe
r
10rtr
1s,trsrtr
sS
stSsS|stXP
tXP
11
tS1
1sX|stXP
sStS1
1stS
1s tS
stStr
0 .1
r t r
1k,0a,kXaZ
,...2,1,0t,ktapktaZP
0
1.t
p a kt
ap1aWP
,...2,1t,ktap1ktaWP

Vidyabharati International Interdisciplinary Research Journal (Special Issue) ISSN 2319-4979
Special Issue on Engineering Technologies and Management 3813
It can be easily verified that the r.v. W
obtained by inflating the r.v. Z is same as
the r.v. obtained by extending the inflated
r.v. Y of X. Hence W = a + kY. The p.g.f.
of W is given by,
(4.2)
.
(4.4)
Hence, .
Sandhya and Rajasekharan (2012) showed
that the measure of memory of the
discrete non-negative extended r.v. Z is
given by
(4.5)
This result and other related works on
discrete distributions with change of origin
and scale is referred in Nair et. al. (2018)
Hence, measure of memory of W is given
by
(4.6)
Inflated parameter extended geometric
distribution
Let Define the r.v. Z = a +
kX.
(5.1)
integers.
(5.2)
We say that the r.v. Z defined above has an
inflated parameter extended geometric
distribution on with
parameters and
will be denoted by
(5.3)
The measure of memory of Z is given by
6. type lack of memory property for Z
A r.v. Z on
integers is said
to have lack of memory property if Z
satisfies.
(6.1)
Now,
which on simplification
(6.2)
W
W sEsG
ktaps0t
kta
1 .a
Zs G s
ktaWPktaWE0t
a kE Y
(1.5)from
0t
22 ktaWPktaWE
2 2 22 .a kaE Y k E Y
2V W k V Y 1.7from
2 2
2
2.Z a kX X
E X E X E XM M kM k
E X E X
2 2
2
2 1.W a kY Y
E X E X E XM M kM k
E X E X
.,IGe~X 0
aZP
,1111ktaZP1t
1,2,...; 1,2,...; 0,t k a
ktaZPssG0t
kta
Z
11s1
11ss
k
ka
1.
1 1
k
a
k
ss
s
,...k2a,ka,a
1,0
1,1
,1max
.,IEGeoa
XkEaZE
1.
1a k
XVkZV 2
2
22
1 1.
1k
.ZM k
1k,0a,,...k2a,ka,a
0s,t,ktaZPksaZ|stkaZP
1
1 1 1 1 ,j
j t
P Z a kt
1t111

Vidyabharati International Interdisciplinary Research Journal (Special Issue) ISSN 2319-4979
Special Issue on Engineering Technologies and Management 3814
Theorem 6.1 Let
then for any the conditional
probability has
the following equivalent representations.
a)
b)
c)
d)
e)
f)
Proof:
a)
b)
c)
d)
e)
f)
This leads to the following definition for the
type lack of memory for a r.v. Z on
Definition 6.1. The r.v. Z on
integers is said
to have type lack of memory property if
(6.3)
from
References
1. Bliss C.I. and Fisher R.A.; Fitting the
Negative Binomial Distribution to
Biological Data, Biometrics, 9 (2003),
176-200.
2. Chin H.C. and Quddus M.A.; Modeling
Count Data with Excess Zeros: An
Empirical Application to Traffic
Accidents, Sociological Methods and
Research, 32, (2003), 90-116.
3. Deng D. and Paul S.R.; Score Tests for
Zero Inflation and Over-dispersion in
Generalized Linear Models, Statistics
Sinica, 15, (2005), 257-276.
4. Feller W.; On a General Class of
Contagious Distribution, Annals of
Mathematical Statistics, 14 (1943), 389-
400.
5. Gupta P.L., Gupta R.C. and Tripathi R.C.;
Analysis of Zero-adjusted Count Data,
Computational Statistics and Data
Analysis, 23 (1996), 207-218.
6. Johnson N.L., Kotz S. and Kemp A.W.;
Univariate Discrete Distributions, Wiley
Series in Probability and Mathematical
Statistics, 2nd edition, (1992).
7. Kolev N., Minkova L. and Neytchev P.;
Inflated Parameter Family of Generalized
Power Series Distributions and their
Application in Analysis of Over dispersed
Insurance Data. ARCH Research Clearing
House, 2, (2000), 295-320.
8. Lambert D.; Zero-inflated Poisson
Regression, with an Application to
Defects in Manufacturing, Technometrics,
34, (1992), 1-14.
~ ,aZ IEGeo
,0s,0t
ksaZ|stkaZP
.11t
1 1.
1P Z a kt
1 .1
P Z a kt
| .P Z a kt P Z a kt Z a
1 | .P Z a kt P Z a kt Z a
.1tkaVP
ksaZP
stkaZPksaZ|stkaZP
1 1 .t
t11ksaZ|stkaZP
1 1̀.
1P Z a kt
1 1|
1P Z a k t s Z a ks P Z a kt
1 .1
P Z a kt
| 1P Z a k t s Z a ks P Z a ktP X a
| .P Z a kt P Z a kt Z a
| 11
P Z a k t s Z a ks P Z a kt
1 | .P Z a kt P Z a kt Z a
t11ksaZ|stkaZP
1 .P V a k t
.,...k2a,ka,a
1k,0a,,...k2a,ka,a
| 1 |P Z a k t s Z a ks P Z a kt P Z a kt Z a
0, 0.t s

Vidyabharati International Interdisciplinary Research Journal (Special Issue) ISSN 2319-4979
Special Issue on Engineering Technologies and Management 3815
9. Lord D., Washington S. and Ivan J.N.;
Further Notes on the Application of Zero
Inflated Models in Highway Safety.
Accident Analysis and Prevention, 39,
(2007), 53-57.
10. Lord D., Washington S.P. and Ivan J.N.;
Statistical Challenges with Modeling
Motor Vehicle Crashes: Understanding
the Implications of Alternative
Approaches, Research Report, Centre of
Transportation Safety, Texas
Transportation Institute, Texas A & M,
(2004).
11. Lord D. and Mannering F.; The Statistical
Analysis of Crash-frequency Data: A
Review and Assessment of
Methodological Alternatives,
Transportation Research Part A, 44,
(2010), 291-305.
12. Muth, J.E.; Reliability Models with
Positive Memory Derived from Mean
Residual Function. Theory and
Applications of Reliability, Academic
Press, (1977), 401-435.
13. Nair N.U.; A Measure of Memory of
Some Discrete Distributions, Journal of
the Indian Statistical Association, 21,
(1983), 141-147.
14. Nair N.U., Sankaran P.G. and
Balakrishnan N.; Reliability Modeling
and Analysis in Discrete Time, I Edition,
Academic Press, (2018).
15. Neyman J.; On a Class of Contagious
Distributions Applicable in Entomology
and Bacteriology, Biometrica, 30, (1939),
11-15.
16. Sandhya E. and Rajasekharan K.E.; On
the Measure of Memory of Discrete
Distributions Under Change of Origin and
Scale. International Journal of
Mathematical Sciences and Engineering
Applications, 6, (2012), 293-301.
17. Park B.J. and Lord D.; Applications of
Finite Mixture Models for Vehicle Crash
Data Analysis, Accident Analysis and
Prevention, 41, (2009), 683-691.
Vidyabharati International Interdisciplinary Research Journal (Special Issue) ISSN 2319-4979
Special Issue on Engineering Technologies and Management 3816
“AN IMPACT AND LEVEL OF COLLECTIVE BARGAINING SYSTEM OF TNSTC
EMPLOYEES AND ITS TRADE UNION – KMBAKONAM DIVISION”
1R. Kalaimathi, 2Dr. P. Hemalatha
1Research Scholar in Commerce, Govt. College for Women (Autonomous), Kumbakonam,
Affiliated to Bharathidasan University, Tiruchirappalli, Tamil Nadu 2Principal & Research Supervisor, Raja Doraisingam Govt.Arts College, Sivagangai,
Affiliated to Bharathidasan University, Tiruchirappalli, Tamil Nadu
ABSTRACT
This Paper addresses the collective bargaining of TNSTC trade union members, the future of collective bargaining, the
conditions necessary for successful collective bargaining, some of the advantages of collective bargaining, issues of
concern for employers and guidelines for employers on the process of bargaining itself. Collective bargaining is
specifically an industrial relations mechanism or tool, applicable to the employment relationship as a process. In
collective bargaining the union always has a collective interest since the negotiations are for the benefit of several
employees. Where collective bargaining is not for one employer but for several, collective interests become a feature
for both parties to the bargaining process. In collective bargaining certain essential conditions need to be satisfied,
such as the existence of the freedom of association and a labour law system. collective bargaining took a new turn as
trade unions were forced to examine seriously their approach to the preparation of proposals and the presentation of
their case to bargain collectively is the performance of the mutual obligation of the employer and the representative of
the employees to meet at reasonable times and confer in good faith with respect to wages, hours, and terms and
conditions of employment,
Keywords: TNSTC employees, Collective bargaining, Transport employees.
CONCEPT OF COLLECTIVE
BARGAINING
TNSTC is the second largest government bus
transport corporation in India and is well
known for its route coverage almost too every
remote area within Tamil Nadu. In Tamil
Nadu, TNSTC (Kumbakonam) Ltd accounts
major stake. Transportation service here is
more than 40 years old and is the back bone
of the economy of this division. In this study
area, majority of the TNSTC workers are
getting membership in various trade unions.
So that the researcher concentrate the trade
union’s collective bargaining system. The
phrase “collective bargaining was first
coined by Sidney and Beatrice Webb. This
was widely accepted, particularly in the
developed countries. Generally by collective
bargaining we mean, an essential element of
economic democracy, is a ‘two party’
procedure for arriving at a commonly agreed
solution. The term is thus used to describe the
procedure, whereby employers must attempt
to reach agreement about wage-rates and
basic conditions of labour with trade unions,
instead of with individual workers. In other
words, it is the process of discussion and
negotiation between an employer and a union
culminating in a written agreement or
contract and the adjustment of problems
arising under the agreement. The existence of
trade unions of various sorts: craft, industrial,
company, general and federations or
congresses, has been accompanied by the
formation of employers’ unions. The
interaction between these institutions
comprises the collective relations of industrial
relations.
The growth of collective bargaining is
closely associated with growth of trade
unionism. The trade union movement
revolves around collective bargaining. The
important trend in collective bargaining,
however, is the expansion in the number and
the type of subjects which it covers.
Collective bargaining as a technique for the
fulfillment of the needs and objectives of
workers and employers is an integral part of
industrial society
The Trade Unions Act, 1926 (“TU Act”) provides for formation and registration of
trade unions and in certain respects to define
the law relating to registered Trade Unions.
The TU Act defines a trade union as “any
combinations, whether temporary or
permanent, formed primarily for the purpose
of regulating the relations between workmen
and employers or between workmen and
workmen, or between employers and
Vidyabharati International Interdisciplinary Research Journal (Special Issue) ISSN 2319-4979
Special Issue on Engineering Technologies and Management 3817
employers, or for imposing restrictive
condition on the conduct of any trade or
business, and includes any federation or two
or more trade unions.”
Why employees join trade unions Employees join unions for numerous reasons:
economic (to give leverage in pay
bargaining), social justice (inequality), to gain
a voice in decision-making and for protection
against authoritarian or abusive treatment by
LMs.
Collective Bargaining in India
In India, the function of the trade unions was
limited largely to collective bargaining for
economic considerations. Collective
bargaining has been defined by the Supreme
Court (“SC”) as “the technique by which
dispute as to conditions of employment is
resolved amicably by agreement rather than
coercion”. It is a process of discussion and
negotiation between employer and workers
regarding terms of employment and working
conditions. Workers are generally represented
by trade unions with respect to expressing
their grievance concerning service conditions
and wages before the employer and the
management. Refusing to bargain collectively
in good faith with the employer is considered
to be an unfair labour practice as per the
provisions of the Industrial Disputes Act,
1947 (“IDA”) . This is generally an effective
system as it usually results in employers
undertaking actions to resolve the issues of
the workers. However, the legal procedure for
pursuing collective bargaining in India is
complicated .
Meaning and definition of Collective
Bargaining
“a mutual obligation on the employer and
employee to bargain in good faith towards
the settlement of colllective bargaining”
Louis E. Howard, collective bargaining
means “……. To get together (right of
meeting), to enter a common organization
(right of association), to determine that
whatever conditions of work are allotted shall
be the same for all workers and to make a
bargain with employers to that effect (rights
of combinations and bargaining) and
eventually in case the employers should
refuse to enter on such a bargain or fail to
honour it when entered upon, to confront
them with a united refusal to go to work or to
continue at work (right of strike).
According to Flanders “Collective
Bargaining as a means of joint regulation”
The ILO Right to Organize and Collective
Bargaining Convention (No. 98), 1949
describes
collective bargaining as: "Voluntary
negotiation between employers or employers'
organizations and workers' organizations,
with a view to the regulation of terms and
conditions of employment by collective
agreements."
“Collective bargaining” writes Harbison “is
a process of accommodation between two
institutions which have both common and
conflicting interests”.
Levels of Collective Bargaining in India
i National-level industry bargaining is
common in core industries such as banks,
coal, steel, ports and docks, and oil where the
central government plays a major role as the
employer.
ii. Industry-cum regional bargaining is
peculiar to industries where the private sector
dominates, such as cotton, jute, textiles,
engineering, tea plantation, ports and docks.
Bargaining generally occurs in two stages:
company-wide agreements are formed, which
are then supplemented with regional (i.e.
plant-level) agreements.
iii. Enterprise or plant-level bargaining
practices differ from case to case because
there is no uniform collective bargaining
procedure. Typically, the bargaining council
(or negotiating committee) is constituted by a
proportional representation of many unions in
an establishment
Advantages of Collective Bargaining
Collective bargaining has the advantage
of settlement through dialogue and
Vidyabharati International Interdisciplinary Research Journal (Special Issue) ISSN 2319-4979
Special Issue on Engineering Technologies and Management 3818
consensus rather than through conflict and
confrontation.
Collective bargaining agreements often
institutionalize settlement through
dialogue.
Collective bargaining is a form of
participation. Both parties participate in
deciding what proportion of the 'cake' is
to be shared by the parties entitled to a
share
Collective bargaining agreements
sometimes renounce or limit the
settlement of disputes through trade union
action.
Collective bargaining is an essential
feature in the concept of social
partnership towards which labour
relations should strive.
Collective bargaining has valuable by-
products relevant to the relationship
between the two parties
Collective bargaining and consequent
agreements tend to stabilize union
membership.
Collective bargaining usually has the
effect of improving industrial relations.
SCOPE OF THE STUDY
This study is mainly confined to the study of
collective bargaining of trade union and its
members of TNSTC (Kumbakonam) Ltd
towards their occupation
OBJECTIVES OF THE STUDY
The following specific objectives of the study
are as follows.
1. To study the mean score of good faith
and confidence on each management and
employees towards collective bargaining
of TNSTC Ltd, Kumbakonam division.
2. To analyses the various level of
collective bargaining towards TNSTC
Ltd, Kumbakonam division.
Area of the study: The researcher has taken
TNSTC (Kumbakonam) Ltd for this study.
The collective bargaining of the employees of
TNSTC (Kumbakonam) Ltd is studied.
Research Design
The present study is based on both primary
and secondary data were used. For collecting
the primary data using well framed
questionnaire was designed to elicit necessary
data and details collected through a sample
survey from the drivers, conductors,
technical, Administrative and others
employees of TNSTC Kumbakonam division.
The secondary data were collected from the
books, journals, web portal, and records from
Tamil Nadu State Transport Corporation
Limited, Kumbakonam division, and
publication of the department of TNSTC,
Indian Journal of Transport Management
Pune.
SAMPLING DESIGN
The sampling designs were formulated to
collect data from the employees. In TNSTC
(Kumbakonam) Ltd, the numbers of
respondents are in variably high employees
have been selected for the study. The
researcher collected for pilot study of 100
TNSTC employees were used and its implied
that reliability is not high-quality
Statistical Design : Various statistical tools
are used in analyzing the primary and
secondary data. This involves a lot of
calculation and computations. Tables, mean
score of collective bargaining were used to
judge the significance through chi-square test
. From each category of employees namely
Drivers, Conductors, Technical staff members
Administration staff members and others staff
members were selected for the study.
Statement of problem
Unions exist to deal with problems
faced by laborers, these problems may be of
any nature such as those concerning the pay,
unfair work rules, timings and so on. All the
workers working under one particular
employer is represented by the worker's
union. All the communication that happens in
between the employer and the workforce
generally takes place through the union.
Collective bargaining has addressed equity
issues from the point of view of employees -
issues such as a job security, Fair wage,
working conditions and the equal distribution
of wage increases to all. As a result,
collective bargaining process gets weakening
from industries to industries due to non-
cooperation among the trade unions.. In that
event, in collective bargaining the areas of
dispute would be narrowed, and both parties
would be likely to share a common view
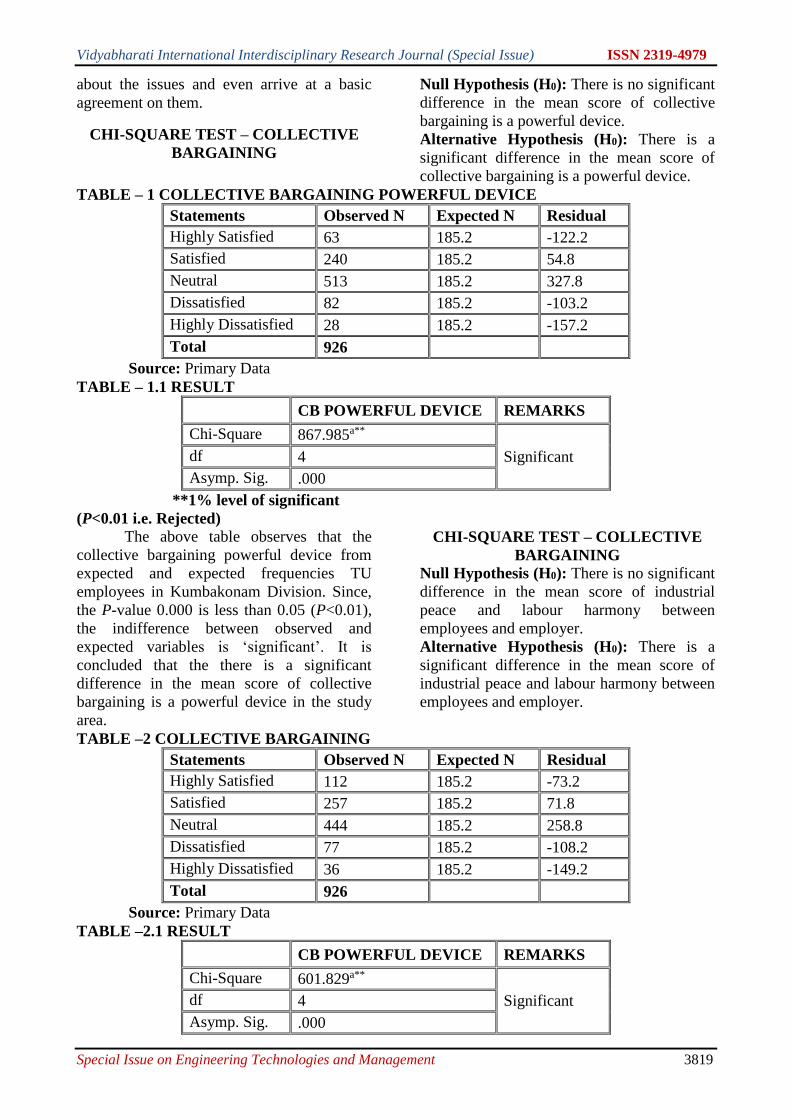
Vidyabharati International Interdisciplinary Research Journal (Special Issue) ISSN 2319-4979
Special Issue on Engineering Technologies and Management 3819
about the issues and even arrive at a basic
agreement on them.
CHI-SQUARE TEST – COLLECTIVE
BARGAINING
Null Hypothesis (H0): There is no significant
difference in the mean score of collective
bargaining is a powerful device.
Alternative Hypothesis (H0): There is a
significant difference in the mean score of
collective bargaining is a powerful device.
TABLE – 1 COLLECTIVE BARGAINING POWERFUL DEVICE
Statements Observed N Expected N Residual
Highly Satisfied 63 185.2 -122.2
Satisfied 240 185.2 54.8
Neutral 513 185.2 327.8
Dissatisfied 82 185.2 -103.2
Highly Dissatisfied 28 185.2 -157.2
Total 926
Source: Primary Data
TABLE – 1.1 RESULT
CB POWERFUL DEVICE REMARKS
Chi-Square 867.985a**
Significant df 4
Asymp. Sig. .000
**1% level of significant
(P<0.01 i.e. Rejected)
The above table observes that the
collective bargaining powerful device from
expected and expected frequencies TU
employees in Kumbakonam Division. Since,
the P-value 0.000 is less than 0.05 (P<0.01),
the indifference between observed and
expected variables is ‘significant’. It is
concluded that the there is a significant
difference in the mean score of collective
bargaining is a powerful device in the study
area.
CHI-SQUARE TEST – COLLECTIVE
BARGAINING
Null Hypothesis (H0): There is no significant
difference in the mean score of industrial
peace and labour harmony between
employees and employer.
Alternative Hypothesis (H0): There is a
significant difference in the mean score of
industrial peace and labour harmony between
employees and employer.
TABLE –2 COLLECTIVE BARGAINING
Statements Observed N Expected N Residual
Highly Satisfied 112 185.2 -73.2
Satisfied 257 185.2 71.8
Neutral 444 185.2 258.8
Dissatisfied 77 185.2 -108.2
Highly Dissatisfied 36 185.2 -149.2
Total 926
Source: Primary Data
TABLE –2.1 RESULT
CB POWERFUL DEVICE REMARKS
Chi-Square 601.829a**
Significant df 4
Asymp. Sig. .000
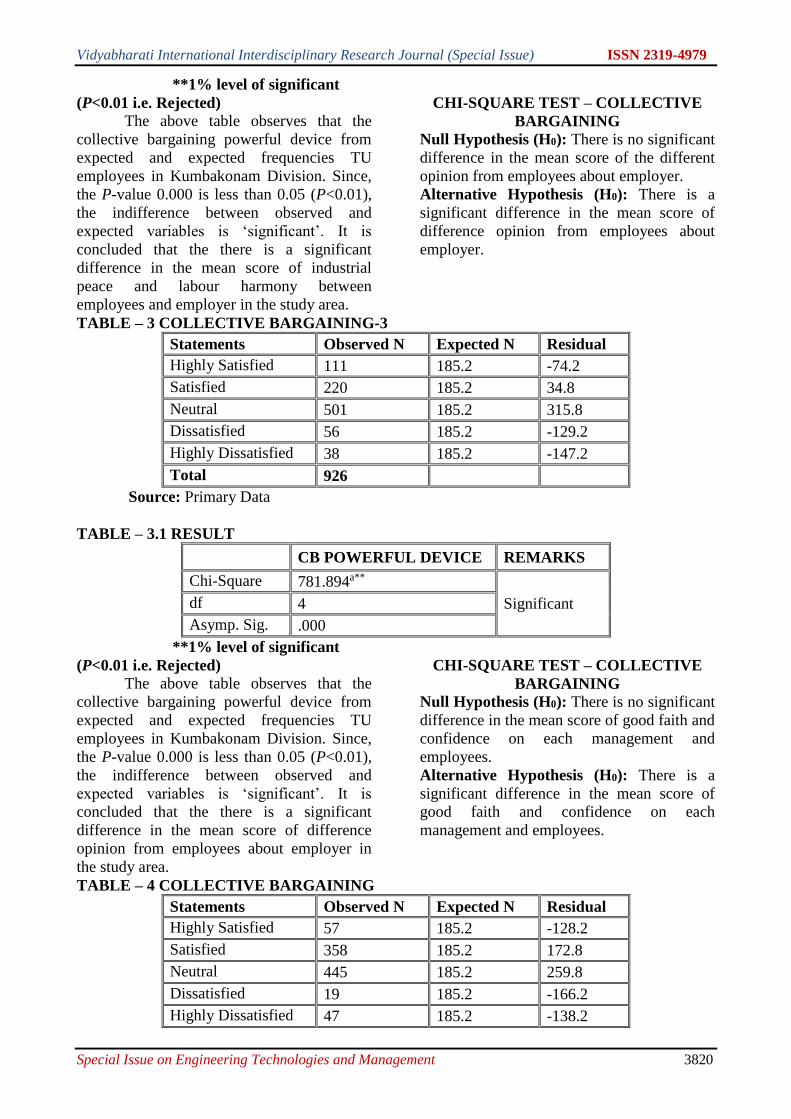
Vidyabharati International Interdisciplinary Research Journal (Special Issue) ISSN 2319-4979
Special Issue on Engineering Technologies and Management 3820
**1% level of significant
(P<0.01 i.e. Rejected)
The above table observes that the
collective bargaining powerful device from
expected and expected frequencies TU
employees in Kumbakonam Division. Since,
the P-value 0.000 is less than 0.05 (P<0.01),
the indifference between observed and
expected variables is ‘significant’. It is
concluded that the there is a significant
difference in the mean score of industrial
peace and labour harmony between
employees and employer in the study area.
CHI-SQUARE TEST – COLLECTIVE
BARGAINING
Null Hypothesis (H0): There is no significant
difference in the mean score of the different
opinion from employees about employer.
Alternative Hypothesis (H0): There is a
significant difference in the mean score of
difference opinion from employees about
employer.
TABLE – 3 COLLECTIVE BARGAINING-3
Statements Observed N Expected N Residual
Highly Satisfied 111 185.2 -74.2
Satisfied 220 185.2 34.8
Neutral 501 185.2 315.8
Dissatisfied 56 185.2 -129.2
Highly Dissatisfied 38 185.2 -147.2
Total 926
Source: Primary Data
TABLE – 3.1 RESULT
CB POWERFUL DEVICE REMARKS
Chi-Square 781.894a**
Significant df 4
Asymp. Sig. .000
**1% level of significant
(P<0.01 i.e. Rejected)
The above table observes that the
collective bargaining powerful device from
expected and expected frequencies TU
employees in Kumbakonam Division. Since,
the P-value 0.000 is less than 0.05 (P<0.01),
the indifference between observed and
expected variables is ‘significant’. It is
concluded that the there is a significant
difference in the mean score of difference
opinion from employees about employer in
the study area.
CHI-SQUARE TEST – COLLECTIVE
BARGAINING
Null Hypothesis (H0): There is no significant
difference in the mean score of good faith and
confidence on each management and
employees.
Alternative Hypothesis (H0): There is a
significant difference in the mean score of
good faith and confidence on each
management and employees.
TABLE – 4 COLLECTIVE BARGAINING
Statements Observed N Expected N Residual
Highly Satisfied 57 185.2 -128.2
Satisfied 358 185.2 172.8
Neutral 445 185.2 259.8
Dissatisfied 19 185.2 -166.2
Highly Dissatisfied 47 185.2 -138.2

Vidyabharati International Interdisciplinary Research Journal (Special Issue) ISSN 2319-4979
Special Issue on Engineering Technologies and Management 3821
Total 926
Source: Primary Data
TABLE – 4.1 RESULT
CB POWERFUL DEVICE REMARKS
Chi-Square 866.700a**
Significant df 4
Asymp. Sig. .000
**1% level of significant
(P<0.01 i.e. Rejected)
The above table observes that the
collective bargaining powerful device from
expected and expected frequencies TU
employees in Kumbakonam Division. Since,
the P-value 0.000 is less than 0.05 (P<0.01),
the indifference between observed and
expected variables is ‘significant’. It is
concluded that the there is a significant
difference in the mean score of good faith and
confidence on each management and
employees.in the study area.
CHI-SQUARE TEST – COLLECTIVE
BARGAINING
Null Hypothesis (H0): There is no significant
difference in the mean score of strength and
weakness of management in the study area.
Alternative Hypothesis (H0): There is a
significant difference in the mean score of
strength and weakness of management in the
study area.
TABLE – 5 COLLECTIVE BARGAINING POWERFUL DEVICE
Statements Observed N Expected N Residual
Highly Satisfied 73 185.2 -112.2
Satisfied 278 185.2 92.8
Neutral 489 185.2 303.8
Dissatisfied 66 185.2 -119.2
Highly Dissatisfied 20 185.2 -165.2
Total 926
Source: Primary Data
TABLE – 5.1 RESULT
CB POWERFUL DEVICE REMARKS
Chi-Square 836.905a**
Significant df 4
Asymp. Sig. .000
**1% level of significant
(P<0.01 i.e. Rejected)
The above table observes that the
collective bargaining powerful device from
expected and expected frequencies TU
employees in Kumbakonam Division. Since,
the P-value 0.000 is less than 0.05 (P<0.01),
the indifference between observed and
expected variables is ‘significant’. It is
concluded that there is a significant difference
in the mean score of strength and weakness of
management in the study area.
Conclusion
In numerable number of important
conclusions can be drawn from the findings
of this study which have collective bargaining
of TNSTC employees towards occupation.
The researcher should take the respondents
gradually from various depots under
Kumbakonam division. The union's demands
should be carefully studied. Generally, the
trade unions and the employers’ associations
are registered and it is mandatory to be
registered to conclude the collective
agreements. The disputes from the application
at workplace shall be handled between the
employer and employee. It is concludes that

Vidyabharati International Interdisciplinary Research Journal (Special Issue) ISSN 2319-4979
Special Issue on Engineering Technologies and Management 3822
the more reliable information given by TU
members and modified study were applied
and the result was ‘good’ in this study area.
References
1. Chamberlaine, N and Kulu, J: Collective
Bargaining, (McGraw-Hill, New York,
1965).2.Clegg, H: Trade Unionism Under
Collective Bargaining. (Blackwell, 1976).
2. .Fox A, and Fladners, A: Collective
Bargaining. (Faber and Faber, London,
1969).
3. F.H. Harieon. Goals .and Strategy of
Collective Bargaining, Harper~ Brothers,
1951, p.5-10
4. Dr. D.Paul Dhinakaran, “Exports and
Imports Stagnation in India During
Covid-19- A Review” GIS Business
(ISSN: 1430-3663 Vol-15-Issue-4-April-
2020).
5. Chamberl§lin N.14. Collective
Bargaining. McGraw-Hill. New YorK,
1951, p.121.
6. ILO Collective Bargaining, Geneva,
1960, p.141.
7. VikramShroff and AkshayBhargav, Trade
Unions Act And State Laws Provide
Legal Protections To Trade Unions In
India, SHRM Legal Report, March 2010.
8. All India Bank Employees’ Association v.
N.I.Tribunal, AIR 1962 SC 171.
9. Negotiated Change: Collective
Bargaining, Liberalization and
Restructuring in India, Response Books,
New Delhi.
10. Ludwig Teller, Labor Disputes and
Collective bargaining, Vol.1, 476, s 154.
Vidyabharati International Interdisciplinary Research Journal (Special Issue) ISSN 2319-4979
Special Issue on Engineering Technologies and Management 3823
“MEMBER’S SATISFACTION ON SALARY AND WAGE BENEFITS WITH TRADE
UNIONS - AT TNSTC KUMBAKONAM DIVISION “
1R. Kalaimathi, 2Dr. P. Hemalatha 1Research Scholar in Commerce, Govt. College for Women (Autonomous), Kumbakonam,
Affiliated to Bharathidasan University, Tiruchirappalli, Tamil Nadu 2Principal & Research Supervisor, Raja Doraisingam Govt.Arts College, Sivagangai,
Affiliated to Bharathidasan University, Tiruchirappalli, Tamil Nadu
ABSTRACT The existence of a strong and recognized trade union is a prerequisite to industrial peace. Decisions taken through the
process of collective bargaining and negotiations between employer and unions are more influential. Trade unions play
an important role and are helpful in effective communication between the workers and the management. A union acts
as an intermediary between employees and Corporation and provides a necessary complement to legislated benefit and
protection. Unions bargain with management for the successful increase workers salary and wages benefits through
collective bargaining. The impact of unions on worker's wage and salary benefits therefore, the aim of the study is to
analyze member’s satisfaction salary and wage benefitswith the activities of trade unions in the TNSTC kumbakonam
divisionTamil Nadu. The result of the study reveals that among the skilled, semi-skilled and unskilled workers, the
majority of the skilled workers perceive moderate satisfaction, whereas the majority of the semi-skilled and unskilled
workers perceive a high level of satisfaction with the activities of the trade unions in the study unit.
INTRODUCTION A trade union is an organized association of
workers formed to protect their rights and
interest. In the rapid programme of industrial
development of India and with the
implementation of new economic policy,
trade unions have come to occupy a critical
position in the success of industrial relations
in the country. The Trade Unionism in India
has been undergoing rapid changes due to
socioeconomic transformation also. It is an
important instrument to promote class
collaboration and harmony. They are found as
an instrument of solving social economic,
political and psychological problems of large
scale industry, machine, technology and mass
production. Trade unions can reshape the
relationship between the employers and
employees in order to maintain an atmosphere
of industrial peace and harmony. Trade
unions play a significant role in securing the
nature of the job and enforcing the rights on
the job. Unions act as an intermediary
between employees and Corporation and
provide a necessary complement to legislated
benefit and protection. Unions bargain with
management for the successful increase of
worker wages, other benefits through
collective bargaining. The impact of unions
on worker's wage and salary benefits is
presented in Table 4.11
REVIEW OF LITERATURE Review of literature paves way for a clear
understanding of the areas of research
already undertaken and throws a light on the
potential areas which are yet to be covered.
The reviews of some of the important studies
are presented in the succeeding pages.
ParagShil and Santa Kar (2013)
measured the satisfaction of the railway
employees about the role performed by the
trade unions and other activities of the trade
unions related to the up gradation of the
railway employees in the Badarpur sub-
division of N. F. Railway, They concluded
that the trade unions at Indian Railway, which
are operating in Badarpur Subdivision, in
particular, are not only playing an active role
in improving the quality of work life of
employees, but also in maintaining good
industrial relation in the organization. In fact,
the welfare of workers seems to be an
inseparable component of the functions of
these unions.
Manoranjan Dhal and Kailash B.L.
Srivastava (2002) their study, based on a
questionnaire survey in South Eastern
Railway, Kharagpur, examined the
perceptions and attitudes of actors of the
industrial relations system. Workers were
found to be satisfied with the approach of the
management but not with union leaders.
Managers were also trying to adopt people
building strategies and gain the confidence of
workers through establishing direct channels
of communication with them and bypassing
the union. They considered union leaders as
obstacles, not willing to maintain good
relationships. Union leaders succumbed to
Vidyabharati International Interdisciplinary Research Journal (Special Issue) ISSN 2319-4979
Special Issue on Engineering Technologies and Management 3824
pressure due to the loss of membership and
lack of participation of workers in union
activities. They were satisfied with the
prevailing union-management relationships,
but considered management as an opposing
force, as they were working towards
decreasing the membership and creating
multiplicity for their own interests. Thus,
union leaders had to bear the responsibility to
increase membership, work for the success of
the union as well as maintain a favourable
union-management relationship.
STATEMENT OF THE PROBLEM The trade unions have a crucial role to play in
maintaining smooth industrial relations. It is
true that the unions have to protect and
safeguard the interests of the workers through
collective bargaining. But at the same time
they have equal responsibility to see that the
organizations do not suffer on account of
their direct actions such as strikes, even for
trivial reasons. They must be able to
understand and appreciate the problems of
managements and must adopt a policy of
„give and take‟ while bargaining with the
managements. Trade unions must understand
that both management and workers depend on
each other and any sort of problem on either
side will do harm to both sides.Trade unions
are juristic entities and volitional associations
that have, historically and ideologically,
represented the aggregate strength of labour
to maximise their effectiveness in their
endeavour to fulfil their core responsibilities
and principal functions. The mandate of trade
unions is to, inter alia, protect, maintain, and
improve the working conditions of their
members. They fulfil this mandate by
ensuring that they offer services that meet, if
not exceed, members' satisfaction levels.
Trade unions ultimately exist to protect the
work- and non-work-related interest of their
members, whether these be economic, social,
political, or environmental (Venter, 2003).
Neletal. (2005) asseverate that trade unions
are membership organizations: They exist
because of their members, they are made up
of members, they serve their members'
interest, and they are governed by their
members. That is, they derive their authority
and mandate from the members. Therefore,
trade union is service providers. They must
give employees enough reason to become
attracted to them as members and to remain
members. Simply put, trade unions, as the
embodiment of workers' aspirations, owe a
duty of care to their members, and thus
should at all times, act in their best interests.
Thus, the kind and quality of services offered
by trade unions should be perceived by
members as sufficient and satisfactory.
Highly satisfied and committed union
members are more likely to support and
participate in trade union activities. Trade
unions, like any other organization that
provides services, are faced with challenges
of membership decline due to perceived poor
services or the lack thereof, and are therefore
required to devise remedial measures to
mitigate the membership decline (Kgapola,
Leslie Seth 2017). Against the backdrop of
the foregoing, the aim of the study is to
analyze the member’ssatisfaction on salary
and wage benefits with activities of trade
unions in the TNSTC kumbakonam Tamil
Nadu with the following research questions.
RESEARCH QUESTIONS The following research questions were
addressed in the study.
1. Whether there is any significant difference
between satisfaction among drivers,
conductors and Technical workers with the
activities of the trade unions?
2. Whether there is any significant
relationship between demographic variables
of the members and their satisfaction of
salary and wage benefits with activities of
trade unions?
RESEARCH METHODOLOGY The present study has been
conceptualized in order to analyze the
member’ssatisfaction on salary and wage
benefits with activities of trade unions in the
TNSTC kumbakonam division of Tamil
Nadu. The study has made use of survey
method of research to achieve the set
objectives.Among them, 100 members of
trade union were selected. Thus, the total
sample size is 100 works selected on the basis
of convenience sampling method.For the
purpose of analysis the workers were
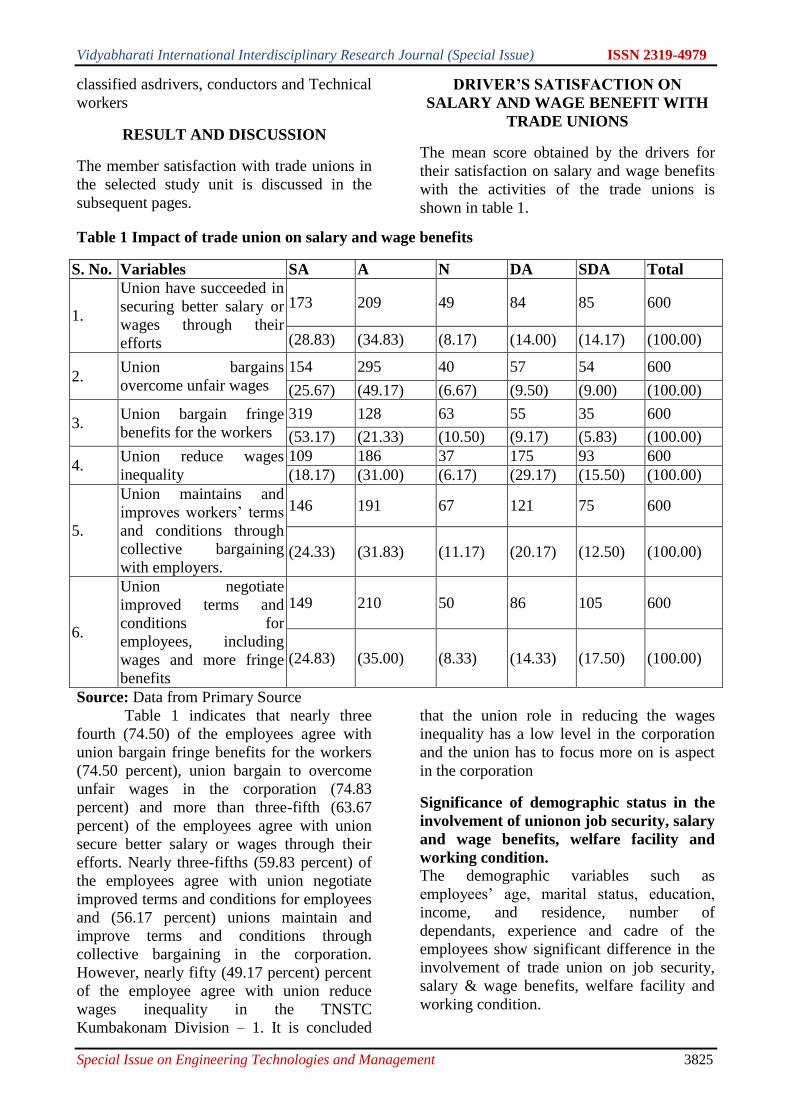
Vidyabharati International Interdisciplinary Research Journal (Special Issue) ISSN 2319-4979
Special Issue on Engineering Technologies and Management 3825
classified asdrivers, conductors and Technical
workers
RESULT AND DISCUSSION
The member satisfaction with trade unions in
the selected study unit is discussed in the
subsequent pages.
DRIVER’S SATISFACTION ON
SALARY AND WAGE BENEFIT WITH
TRADE UNIONS
The mean score obtained by the drivers for
their satisfaction on salary and wage benefits
with the activities of the trade unions is
shown in table 1.
Table 1 Impact of trade union on salary and wage benefits
S. No. Variables SA A N DA SDA Total
1.
Union have succeeded in
securing better salary or
wages through their
efforts
173 209 49 84 85 600
(28.83) (34.83) (8.17) (14.00) (14.17) (100.00)
2. Union bargains
overcome unfair wages
154 295 40 57 54 600
(25.67) (49.17) (6.67) (9.50) (9.00) (100.00)
3. Union bargain fringe
benefits for the workers
319 128 63 55 35 600
(53.17) (21.33) (10.50) (9.17) (5.83) (100.00)
4. Union reduce wages
inequality
109 186 37 175 93 600
(18.17) (31.00) (6.17) (29.17) (15.50) (100.00)
5.
Union maintains and
improves workers’ terms
and conditions through
collective bargaining
with employers.
146 191 67 121 75 600
(24.33) (31.83) (11.17) (20.17) (12.50) (100.00)
6.
Union negotiate
improved terms and
conditions for
employees, including
wages and more fringe
benefits
149 210 50 86 105 600
(24.83) (35.00) (8.33) (14.33) (17.50) (100.00)
Source: Data from Primary Source
Table 1 indicates that nearly three
fourth (74.50) of the employees agree with
union bargain fringe benefits for the workers
(74.50 percent), union bargain to overcome
unfair wages in the corporation (74.83
percent) and more than three-fifth (63.67
percent) of the employees agree with union
secure better salary or wages through their
efforts. Nearly three-fifths (59.83 percent) of
the employees agree with union negotiate
improved terms and conditions for employees
and (56.17 percent) unions maintain and
improve terms and conditions through
collective bargaining in the corporation.
However, nearly fifty (49.17 percent) percent
of the employee agree with union reduce
wages inequality in the TNSTC
Kumbakonam Division – 1. It is concluded
that the union role in reducing the wages
inequality has a low level in the corporation
and the union has to focus more on is aspect
in the corporation
Significance of demographic status in the
involvement of unionon job security, salary
and wage benefits, welfare facility and
working condition.
The demographic variables such as
employees’ age, marital status, education,
income, and residence, number of
dependants, experience and cadre of the
employees show significant difference in the
involvement of trade union on job security,
salary & wage benefits, welfare facility and
working condition.
Vidyabharati International Interdisciplinary Research Journal (Special Issue) ISSN 2319-4979
Special Issue on Engineering Technologies and Management 3826
The other demographic variables like
employees’ gender and nature of family do
not show any significant in the involvement
of union on job security, salary & wage
benefits, welfare facility and working
condition.
CONCLUSION
The study reveals that out of 100 sample
respondents, nearly 51 per cent of the
respondents expressed a high level of
satisfaction followed by 35 per cent and 13
per cent of the respondents reported moderate
and high level of satisfaction with the
activities of trade unions in the study unit.
Reference
1. Navin Kumar Koodamara (2016) "The
Changing Role and Perspective of Trade
Union in India", International Journal of
Management and Applied Science, Vol. 2,
Issue-5, pp.70-72.
2. S. Rajesh and Dr. Manoj P K (2014) "
Politicization Of Trade Unions And
Challenges To Industrial Relations In
India: A Study With A Focus On
Northern Kerala", International Journal
Of Business And Administration
Research Review. Vol.I, Issue
No.2,Pp.45-53.
3. Dr. Md. MoazzamSulaiman (2017) "
Trade Union Movement in India: A
Critical Analysis", International Journal
of Innovative Research in Science,
Engineering and Technology, Vol. 6,
Issue 7, pp. 13401- 13408.
4. Uma NathBaral (2018) "Impact of Trade
Union in the Hotel Workers", Journal of
Political Science, Vol. XVIII, pp.143-162.
5. Piyali Ghosh, Shefali Nandan1 and
Ashish Gupta (2009) "The Changing
Roles Of Trade Unions In India: A Case
Study Of National Thermal Power
Corporation (NTPC), Unchahar", Asian
Academy of Management Journal, Vol.
14, No. 1, pp.37–57.
6. ParagShil And Santa Kar (2013) "Railway
Employees‟ Perception Towards Working
Condition And Role Performed By Trade
Unions: A Study On Badarpur Sub-
Division Of N.F. Railway", International
Journal Of Social Science &
Interdisciplinary Research, Vol.2 (2), Pp.
155-173.
7. Dr. D.PaulDhinakaran, “Exports and
Imports Stagnation in India During
Covid-19- A Review” GIS Business
(ISSN: 1430-3663 Vol-15-Issue-4-April-
2020).
8. Singh Tripti and Chawla Ginni (2015)
"Antecedents and Consequences of Union
Participation: A Review", Journal of
Advanced Management Science Vol. 3,
No. 1, pp. 44-47.
9. Edward L. Zammit and Saviour Rizzo
(2002) "The perceptions of trade unions
by their members", Employee Relations,
Vol. 24 No. 1, pp. 53-68.
10. Manoranjan Dhal and Kailash B.L.
Srivastava (2002) "Trade Unionism :
Perceptions and Attitudes of Workers,
Managers and Leaders", Indian Journal of
Industrial Relations, Vol.38, No.2, pp.
177-198
11. Dr. A. John Peter, Dr. A. Savarimuthu, D.
Allen Rose Shamini and A. Jerena
Rachael (2016) "An Assessment Of
Labour Reformation Proposed In Indian
Labour Code 2015 With Special
Reference To Industrial Relations Bill",
Indian Journal Of Applied Research , Vol.
6,Issue 4, pp.78-79.
Vidyabharati International Interdisciplinary Research Journal (Special Issue) ISSN 2319-4979
Special Issue on Engineering Technologies and Management 3827
EVALUATION OF BUDGET ANALYSIS OF KUMBAKONAM MUNICIPALITY
Mrs.M.Banumathi1, Dr. Mrs. P. Hemalatha, M.Com, M. phil., M.Ed., Ph. D2
1Guest Lecturer, PG& Research Dept. of Commerce Govt. College for Women (A),
Kumbakonam. -612001 E-mail. id : [email protected] 2Research Supervisor & Principal, Raja Doraisingam Government Arts College,
Sivagangai-630561. (Affiliated to Bharathidasan University)
ABSTRACT The financial structure of Urban Local Bodies in India is mainly comprises of tax and non-tax revenues as major
source of revenues and these local bodies also receive grants-in aid and other concessions from the Government. The
expenditure of the municipalities are classified as establishment expenditures, administration expenditures, operating,
repairs & maintenance expenditures finance expenses and depreciation. Therefore this study is focussed on the
evaluation of budget analysis of Kumbakonam Municipality using trend analysis using actual and estimated values.
For further study Chi-square test is used.
Key words: Urban Local Bodies, Source of revenues, Grants-in aid.
Introduction
Financial Management is used in each and
every organisation, whether it is trading or
non-trading organisation. Finance is needed
to promote or establish business, acquire
fixed assets, make investigations such as
market survey, develop product, keep men
and machine at work It is necessary as it
guides in
Financial planning and successful
promotion of an enterprise,
In acquisition of funds at a minimum
cost,
In efficient usage and allocation of
funds,
In taking sound financial decisions and
In promoting and mobilising individual
and corporate savings.
Urban Local Government (ULG)
It refers to the governance of an urban area
by the people through their elected
representatives. The jurisdiction is limited to
a specific area which is demarcated by the
State Government.
During the period of British rule, the
institutions of local government is originated
in India. The first municipal corporation in
India was set up in 1687 at Madras. In 1726,
the municipal corporations were ste up in
Bombay and Calcutta. Under the provincial
autonomy sceme introduced by the
Government of India Act of 1935, local self-
government was declared a provincial
subject.
74th Amendment Act has added in Part IX –A
to the constitution of India. It is named as
“Municipalities” and consists of provisions
from articles 243-P to 243 G. This act aims at
revitalising and strengthening the urban
governments for the purpose of adopting the
municipalities
Municipal Finance
Every municipality has to levy, collect taxes,
duties, tolls and fees. They can get the grants-
in aid out of the funds of the State. Finance
commission for every five years review the
financial position of the municipalities.
Municipality is established for the
administration of the towns and smaller cities.
It has three authorities namely Council, the
Standing committees, and the Chief executive
officer. The State Finance Commission will
make recommendations on the following:
Amount of taxes levied by both the
Central and State Governments,
To fix the taxes, fees and rates to be
used by the local bodies, and
To recommend the steps for
improving the financial condition of
the Local Government
Sources of Revenues
The sources of revenues of the
municipalities are tax revenues, assigned

Vidyabharati International Interdisciplinary Research Journal (Special Issue) ISSN 2319-4979
Special Issue on Engineering Technologies and Management 3828
revenues, grants and contributions, service
charges and loans.
Expenditure
Total expenditure includes establishment
expenditure, operating, repairs &
maintenance expenditure, Administration
expenditure, programme expenses, finance
expenses and depreciation.
Audit of Accounts
Accounts are maintained in the way of funds
separately as Revenue & capital Fund, Water
Supply & Drainage Fund, and Elementary
Education Fund. Accounts are to be audited
properly.
Review of Literature
Om Prie Srivastava's in her research
'Municipal Government and Administration
in India" explains the various kinds of state
control and suggests remedial measures that
need to be taken. She has felt that government
should reorient its attitude in regard to
municipal corporations, providing
constructive guidance and adequate assistance
to them, as an active partner in the common
cause of city administration.
Sujatha Srinivasan in her article titled
“Financial Disclosure in Local Government‖-
A Comparative study” attempted on the
financial reporting and disclosure practices in
the public sector across the world. She
analysed the accounting and financial
reporting reforms that have taken place in the
public sector of certain of European and
Asian countries. This article also examines
the significant reforms being introduced in
the public accounting system in India. The
findings of the study shows that countries like
United States, United Kingdom, Canada,
Australia and New zealand have
comparatively better and more transparent
disclosure practices. Further the study reveals
that Indian government has taken number of
steps to introduce transparency into local
operations as e-goverence, accrual accounting
model financial statements etc.
Research Gap
Studies about the evaluation of financial
condition of Municipalities are rare
particularly Kumbakonam Municipality. And
most of the studies were dealt with either
working of Urban Local Government,
Administration of Urban Local Bodies or
General performance of the Municipalities
and no studies are related to Kumbakonam
Municipality. Therefore the present study
deals with Kumbakonam Municipality and
its budget analysis.
Need of the study
In the present economic conditions, it is not
possible for the central and State
Governments to solve the problems of the
general public. It is only the local government
that guides the state government to give
importance to the welfare of the society and
helps to solve their problems. In the case of
major cities, Municipal corporations have to
look after the welfare of the society. Hence,
the present study is made to attempt on the
evaluation of budget analysis of
Kumbakonam Municipality.
Objectives of the study
To evaluate the budget analysis of the
Kumbakonam Municipality.
To assess the findings and give
suggestions.
Hypotheses
H01: There is no significant variation in the
tax revenue of the municipality during the
study period.
H02: There is no significant variation in the
total revenue of the municipality during the
study period.
H03: There is no significant variation in the
total expenditure of the municipality during
the study period.
Tools used
For easy analysis linear trend and Chi-
square is used. Chi-square is used to find out
the significant variation in tax revenues, total
revenue and total expenditure during the
study period.
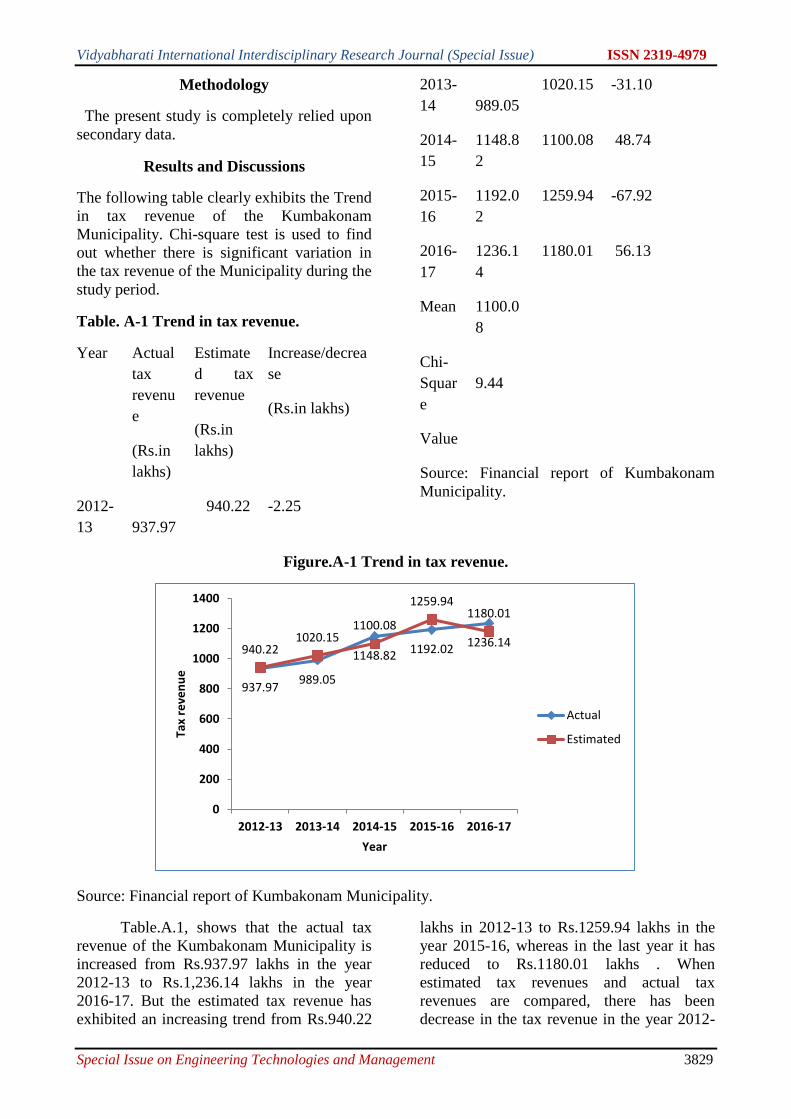
Vidyabharati International Interdisciplinary Research Journal (Special Issue) ISSN 2319-4979
Special Issue on Engineering Technologies and Management 3829
Methodology
The present study is completely relied upon
secondary data.
Results and Discussions
The following table clearly exhibits the Trend
in tax revenue of the Kumbakonam
Municipality. Chi-square test is used to find
out whether there is significant variation in
the tax revenue of the Municipality during the
study period.
Table. A-1 Trend in tax revenue.
Year Actual
tax
revenu
e
(Rs.in
lakhs)
Estimate
d tax
revenue
(Rs.in
lakhs)
Increase/decrea
se
(Rs.in lakhs)
2012-
13
937.97
940.22 -2.25
2013-
14
989.05
1020.15 -31.10
2014-
15
1148.8
2
1100.08 48.74
2015-
16
1192.0
2
1259.94 -67.92
2016-
17
1236.1
4
1180.01 56.13
Mean 1100.0
8
Chi-
Squar
e
Value
9.44
Source: Financial report of Kumbakonam
Municipality.
Figure.A-1 Trend in tax revenue.
Source: Financial report of Kumbakonam Municipality.
Table.A.1, shows that the actual tax
revenue of the Kumbakonam Municipality is
increased from Rs.937.97 lakhs in the year
2012-13 to Rs.1,236.14 lakhs in the year
2016-17. But the estimated tax revenue has
exhibited an increasing trend from Rs.940.22
lakhs in 2012-13 to Rs.1259.94 lakhs in the
year 2015-16, whereas in the last year it has
reduced to Rs.1180.01 lakhs . When
estimated tax revenues and actual tax
revenues are compared, there has been
decrease in the tax revenue in the year 2012-
937.97989.05
1148.82 1192.021236.14
940.221020.15
1100.08
1259.941180.01
0
200
400
600
800
1000
1200
1400
2012-13 2013-14 2014-15 2015-16 2016-17
Tax
reve
nu
e
Year
Actual
Estimated
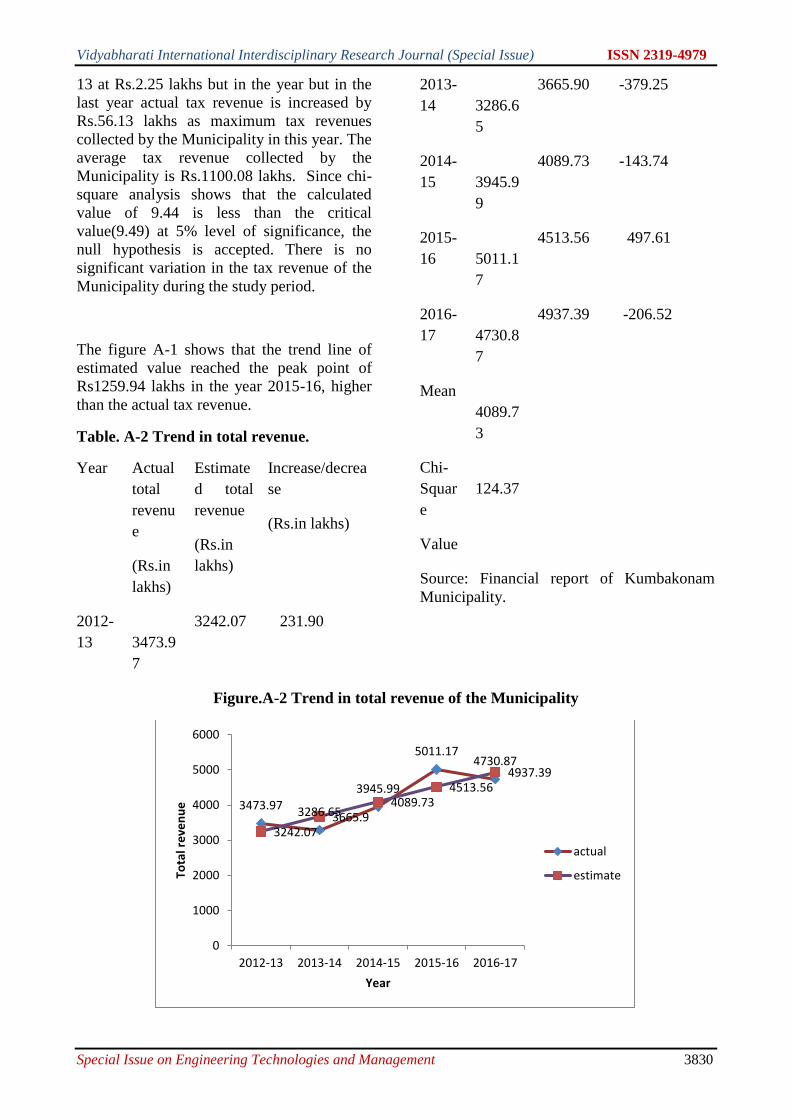
Vidyabharati International Interdisciplinary Research Journal (Special Issue) ISSN 2319-4979
Special Issue on Engineering Technologies and Management 3830
13 at Rs.2.25 lakhs but in the year but in the
last year actual tax revenue is increased by
Rs.56.13 lakhs as maximum tax revenues
collected by the Municipality in this year. The
average tax revenue collected by the
Municipality is Rs.1100.08 lakhs. Since chi-
square analysis shows that the calculated
value of 9.44 is less than the critical
value(9.49) at 5% level of significance, the
null hypothesis is accepted. There is no
significant variation in the tax revenue of the
Municipality during the study period.
The figure A-1 shows that the trend line of
estimated value reached the peak point of
Rs1259.94 lakhs in the year 2015-16, higher
than the actual tax revenue.
Table. A-2 Trend in total revenue.
Year Actual
total
revenu
e
(Rs.in
lakhs)
Estimate
d total
revenue
(Rs.in
lakhs)
Increase/decrea
se
(Rs.in lakhs)
2012-
13
3473.9
7
3242.07 231.90
2013-
14
3286.6
5
3665.90 -379.25
2014-
15
3945.9
9
4089.73 -143.74
2015-
16
5011.1
7
4513.56 497.61
2016-
17
4730.8
7
4937.39 -206.52
Mean
4089.7
3
Chi-
Squar
e
Value
124.37
Source: Financial report of Kumbakonam
Municipality.
Figure.A-2 Trend in total revenue of the Municipality
3473.97 3286.65
3945.99
5011.174730.87
3242.073665.9
4089.734513.56
4937.39
0
1000
2000
3000
4000
5000
6000
2012-13 2013-14 2014-15 2015-16 2016-17
Tota
l re
ven
ue
Year
actual
estimate
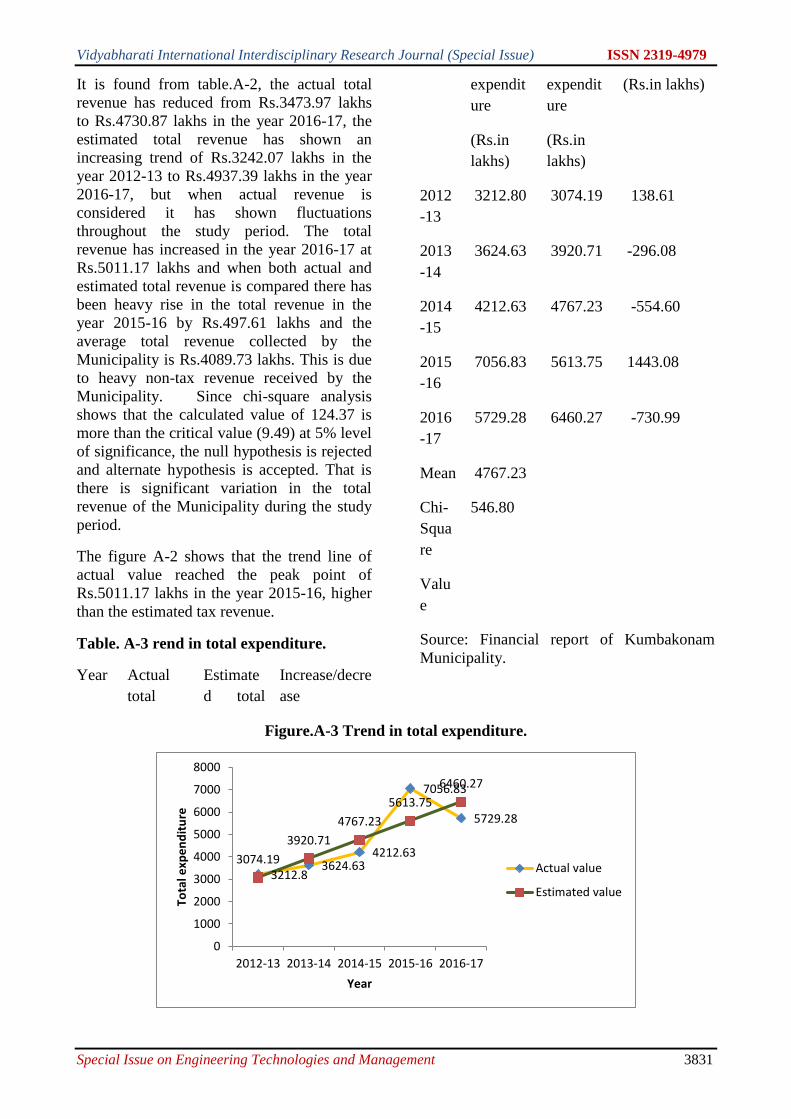
Vidyabharati International Interdisciplinary Research Journal (Special Issue) ISSN 2319-4979
Special Issue on Engineering Technologies and Management 3831
It is found from table.A-2, the actual total
revenue has reduced from Rs.3473.97 lakhs
to Rs.4730.87 lakhs in the year 2016-17, the
estimated total revenue has shown an
increasing trend of Rs.3242.07 lakhs in the
year 2012-13 to Rs.4937.39 lakhs in the year
2016-17, but when actual revenue is
considered it has shown fluctuations
throughout the study period. The total
revenue has increased in the year 2016-17 at
Rs.5011.17 lakhs and when both actual and
estimated total revenue is compared there has
been heavy rise in the total revenue in the
year 2015-16 by Rs.497.61 lakhs and the
average total revenue collected by the
Municipality is Rs.4089.73 lakhs. This is due
to heavy non-tax revenue received by the
Municipality. Since chi-square analysis
shows that the calculated value of 124.37 is
more than the critical value (9.49) at 5% level
of significance, the null hypothesis is rejected
and alternate hypothesis is accepted. That is
there is significant variation in the total
revenue of the Municipality during the study
period.
The figure A-2 shows that the trend line of
actual value reached the peak point of
Rs.5011.17 lakhs in the year 2015-16, higher
than the estimated tax revenue.
Table. A-3 rend in total expenditure.
Year Actual
total
Estimate
d total
Increase/decre
ase
expendit
ure
(Rs.in
lakhs)
expendit
ure
(Rs.in
lakhs)
(Rs.in lakhs)
2012
-13
3212.80 3074.19 138.61
2013
-14
3624.63 3920.71 -296.08
2014
-15
4212.63 4767.23 -554.60
2015
-16
7056.83 5613.75 1443.08
2016
-17
5729.28 6460.27 -730.99
Mean 4767.23
Chi-
Squa
re
Valu
e
546.80
Source: Financial report of Kumbakonam
Municipality.
Figure.A-3 Trend in total expenditure.
3212.83624.63
4212.63
7056.83
5729.28
3074.19
3920.71
4767.23
5613.75
6460.27
0
1000
2000
3000
4000
5000
6000
7000
8000
2012-13 2013-14 2014-15 2015-16 2016-17
Tota
l exp
en
dit
ure
Year
Actual value
Estimated value
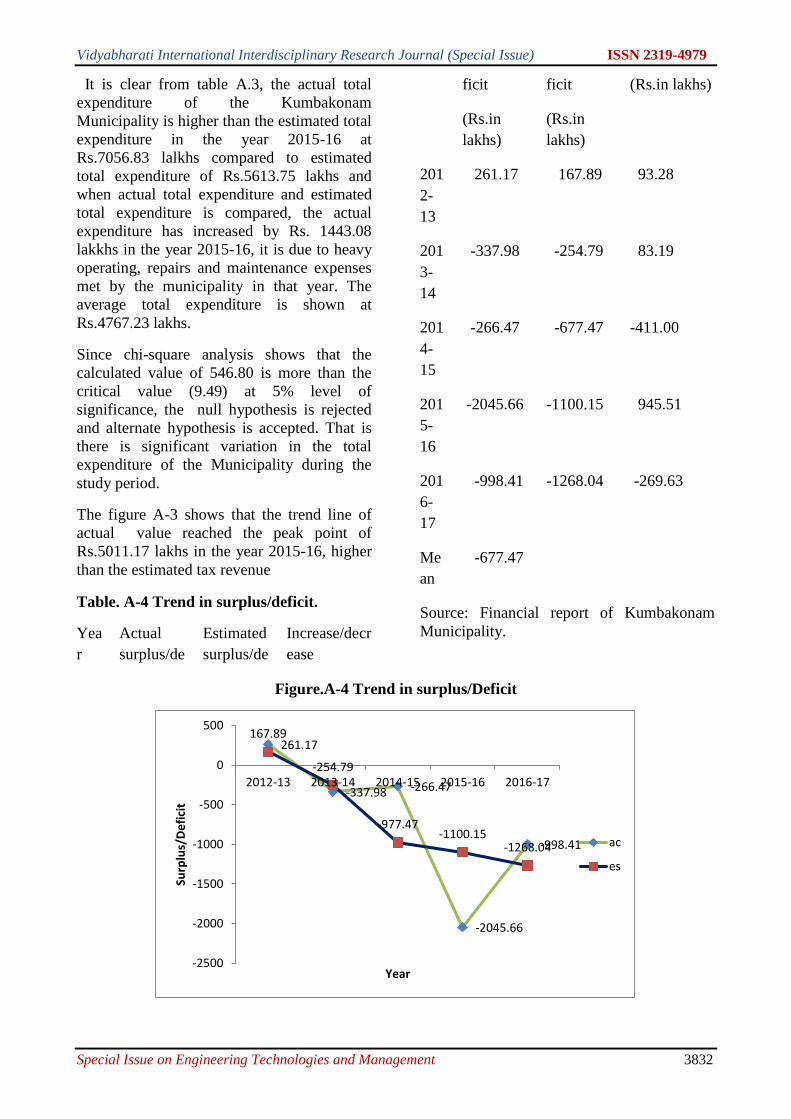
Vidyabharati International Interdisciplinary Research Journal (Special Issue) ISSN 2319-4979
Special Issue on Engineering Technologies and Management 3832
It is clear from table A.3, the actual total
expenditure of the Kumbakonam
Municipality is higher than the estimated total
expenditure in the year 2015-16 at
Rs.7056.83 lalkhs compared to estimated
total expenditure of Rs.5613.75 lakhs and
when actual total expenditure and estimated
total expenditure is compared, the actual
expenditure has increased by Rs. 1443.08
lakkhs in the year 2015-16, it is due to heavy
operating, repairs and maintenance expenses
met by the municipality in that year. The
average total expenditure is shown at
Rs.4767.23 lakhs.
Since chi-square analysis shows that the
calculated value of 546.80 is more than the
critical value (9.49) at 5% level of
significance, the null hypothesis is rejected
and alternate hypothesis is accepted. That is
there is significant variation in the total
expenditure of the Municipality during the
study period.
The figure A-3 shows that the trend line of
actual value reached the peak point of
Rs.5011.17 lakhs in the year 2015-16, higher
than the estimated tax revenue
Table. A-4 Trend in surplus/deficit.
Yea
r
Actual
surplus/de
Estimated
surplus/de
Increase/decr
ease
ficit
(Rs.in
lakhs)
ficit
(Rs.in
lakhs)
(Rs.in lakhs)
201
2-
13
261.17 167.89 93.28
201
3-
14
-337.98 -254.79 83.19
201
4-
15
-266.47 -677.47 -411.00
201
5-
16
-2045.66 -1100.15 945.51
201
6-
17
-998.41 -1268.04 -269.63
Me
an
-677.47
Source: Financial report of Kumbakonam
Municipality.
Figure.A-4 Trend in surplus/Deficit
261.17
-337.98 -266.47
-2045.66
-998.41
167.89
-254.79
-977.47-1100.15
-1268.04
-2500
-2000
-1500
-1000
-500
0
500
2012-13 2013-14 2014-15 2015-16 2016-17
Surp
lus/
De
fici
t
Year
ac
es
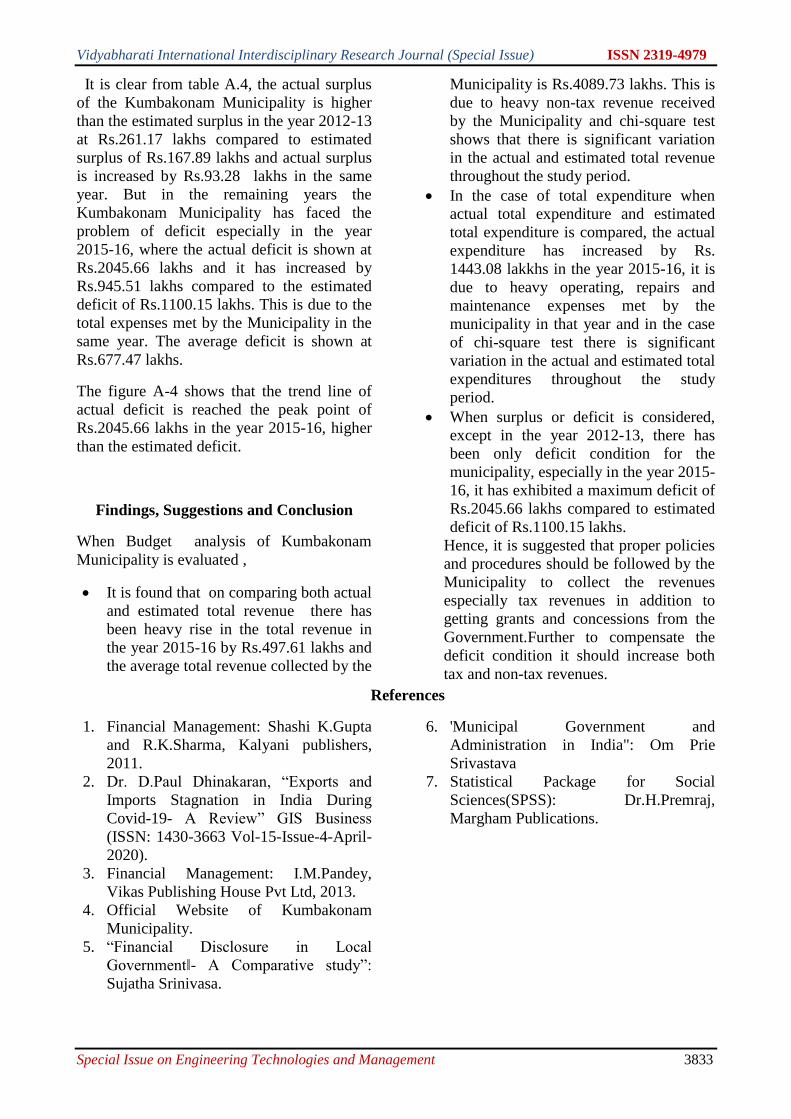
Vidyabharati International Interdisciplinary Research Journal (Special Issue) ISSN 2319-4979
Special Issue on Engineering Technologies and Management 3833
It is clear from table A.4, the actual surplus
of the Kumbakonam Municipality is higher
than the estimated surplus in the year 2012-13
at Rs.261.17 lakhs compared to estimated
surplus of Rs.167.89 lakhs and actual surplus
is increased by Rs.93.28 lakhs in the same
year. But in the remaining years the
Kumbakonam Municipality has faced the
problem of deficit especially in the year
2015-16, where the actual deficit is shown at
Rs.2045.66 lakhs and it has increased by
Rs.945.51 lakhs compared to the estimated
deficit of Rs.1100.15 lakhs. This is due to the
total expenses met by the Municipality in the
same year. The average deficit is shown at
Rs.677.47 lakhs.
The figure A-4 shows that the trend line of
actual deficit is reached the peak point of
Rs.2045.66 lakhs in the year 2015-16, higher
than the estimated deficit.
Findings, Suggestions and Conclusion
When Budget analysis of Kumbakonam
Municipality is evaluated ,
It is found that on comparing both actual
and estimated total revenue there has
been heavy rise in the total revenue in
the year 2015-16 by Rs.497.61 lakhs and
the average total revenue collected by the
Municipality is Rs.4089.73 lakhs. This is
due to heavy non-tax revenue received
by the Municipality and chi-square test
shows that there is significant variation
in the actual and estimated total revenue
throughout the study period.
In the case of total expenditure when
actual total expenditure and estimated
total expenditure is compared, the actual
expenditure has increased by Rs.
1443.08 lakkhs in the year 2015-16, it is
due to heavy operating, repairs and
maintenance expenses met by the
municipality in that year and in the case
of chi-square test there is significant
variation in the actual and estimated total
expenditures throughout the study
period.
When surplus or deficit is considered,
except in the year 2012-13, there has
been only deficit condition for the
municipality, especially in the year 2015-
16, it has exhibited a maximum deficit of
Rs.2045.66 lakhs compared to estimated
deficit of Rs.1100.15 lakhs.
Hence, it is suggested that proper policies
and procedures should be followed by the
Municipality to collect the revenues
especially tax revenues in addition to
getting grants and concessions from the
Government.Further to compensate the
deficit condition it should increase both
tax and non-tax revenues.
References
1. Financial Management: Shashi K.Gupta
and R.K.Sharma, Kalyani publishers,
2011.
2. Dr. D.Paul Dhinakaran, “Exports and
Imports Stagnation in India During
Covid-19- A Review” GIS Business
(ISSN: 1430-3663 Vol-15-Issue-4-April-
2020).
3. Financial Management: I.M.Pandey,
Vikas Publishing House Pvt Ltd, 2013.
4. Official Website of Kumbakonam
Municipality.
5. “Financial Disclosure in Local
Government‖- A Comparative study”:
Sujatha Srinivasa.
6. 'Municipal Government and
Administration in India": Om Prie
Srivastava
7. Statistical Package for Social
Sciences(SPSS): Dr.H.Premraj,
Margham Publications.

Vidyabharati International Interdisciplinary Research Journal (Special Issue) ISSN 2319-4979
Special Issue on Engineering Technologies and Management 3834
FINANCIAL ANALYSIS OF TIRUNELVELI CITY MUNICIPAL CORPORATION
Mrs.M.Banumathi1, Dr. Mrs. P. Hemalatha, M.Com, M. phil., M.Ed., Ph. D2
1Guest Lecturer,PG& Research Dept. of Commerce Govt. college for Women (A), Kumbakonam. -612001
E-mail. id : [email protected] 2Research Supervisor & Principal, Raja Doraisingam Government Arts College, Sivagangai-630561.
(Affiliated to Bharathidasan University)
ABSTRACT The main function of municipal corporations is to provide various services to the public such as Water & sewerage
facilities, Drainage facilities, Education facilities, and Hospital facilities . To provide these services Municipal
corporations should pool the resources in the form of revenues to meet out necessary Expenditures. Therefore this
article throws light on the Snapshot of Tirunelveli City Municipal Corporation’s financial analysis. Important revenue
and expenditure ratios are used for thorough analysis. Simple regression has been used as statistical tool.
Key words: Revenues, Expenditure.
Introduction
Local Government is an autonomous local
body which is free from interferences by the
Governement in certain matters but for
survival and success it has to depend upon the
government.
Local Government is defined as “authority to
determine and execute measures within a
restricted area inside and smaller than the
Whole state”- Encyclopaedia Britannica.
In the words of B.K.Gokhale, Local
Governemnt is “the Government of a
specified locality by the local people through
the representatives elected by them”
Above definitions exhibit the fact that the
Local Government is partly autonomous and
deals with matters of particular locality.
Features of Local Government
Both Urban and Rural local government
has similar features such as:
It is a territorial, non-sovereign
community.
It has a right to regulate its own affairs.
It can act independently on its own and
It allows the local community to
participate in its own affairs.
Role of Local Government
As local government has to act for the
welfare of the public and for development of
the nation, it has certain roles:
Democratic role: As democracy is
possible only when there is public
participation, Local Government
provides the number of opportunities to
the public to take part in its functions.
Educative role: Local Government is a
best educator and also an effective
method of public education in public
affairs.
Civic role: Local Government provides
civic amenities to the mass.
Managerial role: As procedures and
methods of Local Government are
simple, it can easily manage its matters.
Administrative role: According to the
changing conditions and environment
Local Government can easily alter its
rules and regulations.
Subordinate role: As Local Governemnt
is the agent of both State and Central
Governments, it carries out the
developmental programmes and projects
provided to it.
Municipal corporation: It is created in
order to provide conveniences for the
community. It has to fulfil the necessities of
the public. Municipal corporation is assigned
with two types of functions that is legislative
and administrative functions delegated by the
State Goevernment. The main functions are :
Obligatory Functions: These include supply
of water supply, construction and
maintenance of water works, Electricity,
Road transport service, construction and
maintenance of public streets, Removal &
disposal of filth& rubbish, Lighting, watering
and cleaning of public streets and public

Vidyabharati International Interdisciplinary Research Journal (Special Issue) ISSN 2319-4979
Special Issue on Engineering Technologies and Management 3835
places, construction, maintenance and
cleaning of drains & drainage work of public
latrines & urinals, Registration of Births and
Deaths, Maintenance of fire brigades,
provision of primary and Nursery Education.
Discretionary Functions: These include
Construction of public parks, gardens,
libraries, theatres, Public housing, conducting
census and surveys, Undertaking community
development programmes, Conducting
Industrial and commercial activities.
Municipal Finance
Finance is the most important for any
government. Without finance no
administration can be carried on. Municipal
corporations are provided with some sources
of revenues which include:
o Own revenues including both tax
revenues and Non-tax revenues.
o Grants,assigned fees, Devolution fund
by the State and Central Governments.
o Loans and other receipts including
lapsed deposits, fines, fees, rent on
tools& plants etc.
Expenditures
Municpal expenditures are
classified as Revenue and Capital
Expenditures.
o Revenue expenses
includes Establishment,
Administrative, operating
& maintenance and
Interest on on Loans
o Capital expenditures
include Expenses for
Capital formation and
Expenses on principal
repayment.
Statement of the problem:
As Municipal Corporation has to
render services to the society, there has been
inequlity in Tax revenue and Non-tax
revenues. Sources of revenues are inadequate
to meet out the expenditures of municipal
corporations. There has been strict provisions
in the tax implications by the Government.
Therefore this study is undertaken to study
the financial analysis of the Tirunelveli City
Municipal Corporation using ratios. For this
purpose the ratios are classified as Revenue
ratios, Expenditure ratio, and Budget
solvency ratios.
Objectives of the Study
To evaluate the financial analysis of of
the Tirunelveli City Municpal
Corporation using ratios.
To analyse the influence of revenue
ratio and expenditure ratio on operating
ratio using simple regression.
Hypotheses
H0 : Tax revenue ratio does not significantly
influences the operating ratio of Tirunelveli
City Municipal corporation.
1. H0 : Total Expenditure ratio
does not significantly influences
the operating ratio of
Tirunelveli City Municipal
corporation
Methodology
For the purpose of evaluating the financial
analysis of the corporation the collection of
the data is based on secondary sources. The
researcher referred mainly the Audited
financial statements of the corporation.
Reviews are based on articles, magazines and
the annual report of the corporation.
Financial tool in the form of ratios and
statistical tool, simple regression are used as
yardsticks for analysis.
Profile of Tirunelveli City Municipal
Corporation (TCMC)
Tirunelveli is also called as
‘Nellai’ is situated in the outskirts of the city
of Adichanallur. It is an ancient city having
some archaeological excavations. It is the
second capital of Pandya kings. In the
year(900-1200)it had been important city of
Vijayanagar empire. According to 2001
census it has a population of 4,11,831.
General Administration of TCMC
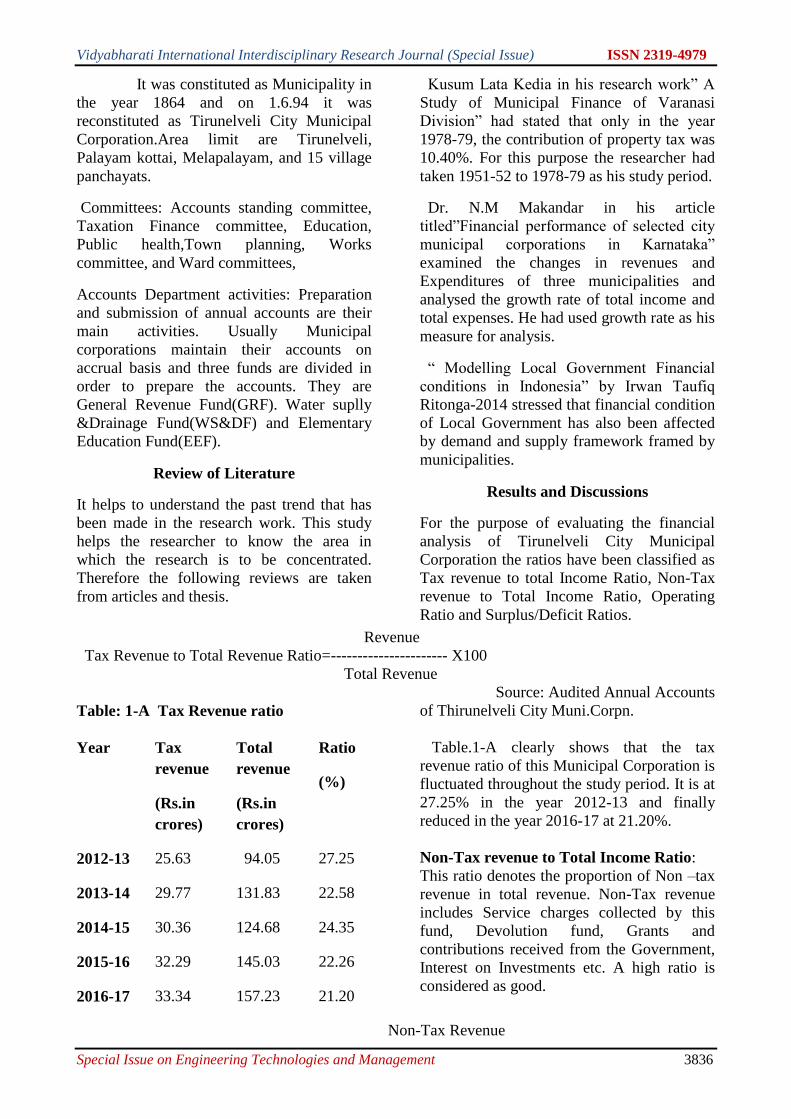
Vidyabharati International Interdisciplinary Research Journal (Special Issue) ISSN 2319-4979
Special Issue on Engineering Technologies and Management 3836
It was constituted as Municipality in
the year 1864 and on 1.6.94 it was
reconstituted as Tirunelveli City Municipal
Corporation.Area limit are Tirunelveli,
Palayam kottai, Melapalayam, and 15 village
panchayats.
Committees: Accounts standing committee,
Taxation Finance committee, Education,
Public health,Town planning, Works
committee, and Ward committees,
Accounts Department activities: Preparation
and submission of annual accounts are their
main activities. Usually Municipal
corporations maintain their accounts on
accrual basis and three funds are divided in
order to prepare the accounts. They are
General Revenue Fund(GRF). Water suplly
&Drainage Fund(WS&DF) and Elementary
Education Fund(EEF).
Review of Literature
It helps to understand the past trend that has
been made in the research work. This study
helps the researcher to know the area in
which the research is to be concentrated.
Therefore the following reviews are taken
from articles and thesis.
Kusum Lata Kedia in his research work” A
Study of Municipal Finance of Varanasi
Division” had stated that only in the year
1978-79, the contribution of property tax was
10.40%. For this purpose the researcher had
taken 1951-52 to 1978-79 as his study period.
Dr. N.M Makandar in his article
titled”Financial performance of selected city
municipal corporations in Karnataka”
examined the changes in revenues and
Expenditures of three municipalities and
analysed the growth rate of total income and
total expenses. He had used growth rate as his
measure for analysis.
“ Modelling Local Government Financial
conditions in Indonesia” by Irwan Taufiq
Ritonga-2014 stressed that financial condition
of Local Government has also been affected
by demand and supply framework framed by
municipalities.
Results and Discussions
For the purpose of evaluating the financial
analysis of Tirunelveli City Municipal
Corporation the ratios have been classified as
Tax revenue to total Income Ratio, Non-Tax
revenue to Total Income Ratio, Operating
Ratio and Surplus/Deficit Ratios.
Revenue
Tax Revenue to Total Revenue Ratio=---------------------- X100
Total Revenue
Table: 1-A Tax Revenue ratio
Year Tax
revenue
(Rs.in
crores)
Total
revenue
(Rs.in
crores)
Ratio
(%)
2012-13 25.63 94.05 27.25
2013-14 29.77 131.83 22.58
2014-15 30.36 124.68 24.35
2015-16 32.29 145.03 22.26
2016-17 33.34 157.23 21.20
Source: Audited Annual Accounts
of Thirunelveli City Muni.Corpn.
Table.1-A clearly shows that the tax
revenue ratio of this Municipal Corporation is
fluctuated throughout the study period. It is at
27.25% in the year 2012-13 and finally
reduced in the year 2016-17 at 21.20%.
Non-Tax revenue to Total Income Ratio:
This ratio denotes the proportion of Non –tax
revenue in total revenue. Non-Tax revenue
includes Service charges collected by this
fund, Devolution fund, Grants and
contributions received from the Government,
Interest on Investments etc. A high ratio is
considered as good.
Non-Tax Revenue
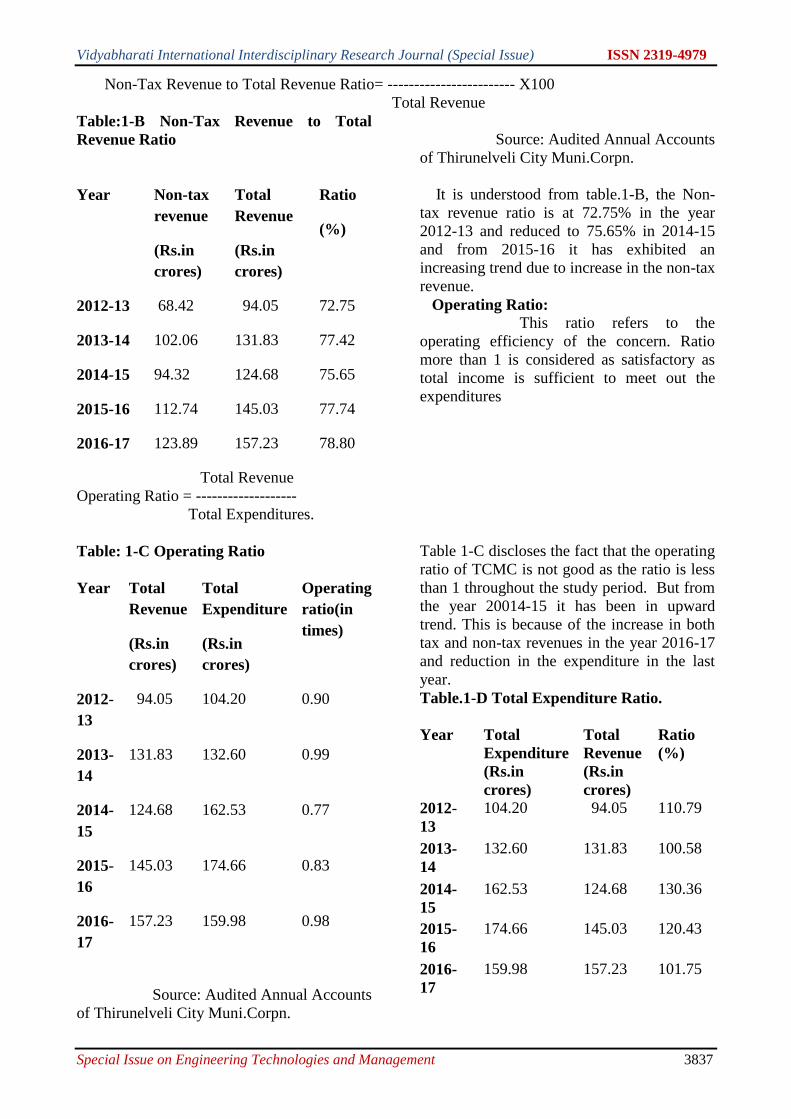
Vidyabharati International Interdisciplinary Research Journal (Special Issue) ISSN 2319-4979
Special Issue on Engineering Technologies and Management 3837
Non-Tax Revenue to Total Revenue Ratio= ------------------------ X100
Total Revenue
Table:1-B Non-Tax Revenue to Total
Revenue Ratio
Source: Audited Annual Accounts
of Thirunelveli City Muni.Corpn.
It is understood from table.1-B, the Non-
tax revenue ratio is at 72.75% in the year
2012-13 and reduced to 75.65% in 2014-15
and from 2015-16 it has exhibited an
increasing trend due to increase in the non-tax
revenue.
Operating Ratio:
This ratio refers to the
operating efficiency of the concern. Ratio
more than 1 is considered as satisfactory as
total income is sufficient to meet out the
expenditures
Total Revenue
Operating Ratio = -------------------
Total Expenditures.
Table: 1-C Operating Ratio
Source: Audited Annual Accounts
of Thirunelveli City Muni.Corpn.
Table 1-C discloses the fact that the operating
ratio of TCMC is not good as the ratio is less
than 1 throughout the study period. But from
the year 20014-15 it has been in upward
trend. This is because of the increase in both
tax and non-tax revenues in the year 2016-17
and reduction in the expenditure in the last
year.
Table.1-D Total Expenditure Ratio.
Year Non-tax
revenue
(Rs.in
crores)
Total
Revenue
(Rs.in
crores)
Ratio
(%)
2012-13 68.42 94.05 72.75
2013-14 102.06 131.83 77.42
2014-15 94.32 124.68 75.65
2015-16 112.74 145.03 77.74
2016-17 123.89 157.23 78.80
Year Total
Revenue
(Rs.in
crores)
Total
Expenditure
(Rs.in
crores)
Operating
ratio(in
times)
2012-
13
94.05 104.20 0.90
2013-
14
131.83 132.60 0.99
2014-
15
124.68 162.53 0.77
2015-
16
145.03 174.66 0.83
2016-
17
157.23 159.98 0.98
Year Total
Expenditure
(Rs.in
crores)
Total
Revenue
(Rs.in
crores)
Ratio
(%)
2012-
13
104.20 94.05 110.79
2013-
14
132.60 131.83 100.58
2014-
15
162.53 124.68 130.36
2015-
16
174.66 145.03 120.43
2016-
17
159.98 157.23 101.75

Vidyabharati International Interdisciplinary Research Journal (Special Issue) ISSN 2319-4979
Special Issue on Engineering Technologies and Management 3838
Source: Audited Annual Accounts
of Thirunelveli City Muni.Corpn.
From table.1-D, it is understood that the total
expenditure ratio has also shown fluctuations
throughout the study period. It is exhibited at
110.79% in the year 2012-13 and raised to
130.36% in the year 2014-15, and finally
reduced to 101.75% in the year 2016-17 due
to increase in both tax revenue and non-tax
revenues.
Simple Regression Analysis
To find out whether tax revenue ratio
influences the operating ratio of the TCMC
simple regression is applied. For this
Operating ratio is taken as dependent variable
and tax revenue ratio as independent variable
as operating ratio helps the corporation to
find out whether there is surplus or deficit and
also it shows the performance of the
corporation.
Hypothesis
H0 : Tax revenue ratio does not significantly
influences the operating ratio of Tirunelveli
City Municipal corporation.
H1 : Tax revenue ratio significantly
influences the operating ratio of Tirunelveli
CitMunicipal corporation.
Table.1-E Regression of Tax revenue ratio on Operating ratio
Model Summary
Model R R
Square
Adjusted R
Square
Std. Error
of the
Estimate
1 0.322 0.103 -0.195 0.10390
ANOVA
Model Sum
of
Squar
es
Df
Mean
Square
F Sig
Regressio
n
0.004 1 0.004 0.346 0.598
Residual 0.032 3 0.011
Total 0.036 4
Source: SPSS Package
Table 1-E shows that as p- value is greater at
5% level of significance the hypothesis is
accepted. That is tax revenue ratio does not
significantly influences the operating ratio of
TCMC.
Hypothesis:
H0 : Non-Tax revenue ratio does not
significantly influences the operating ratio of
Tirunelveli City Municipal corporation.
H1 : Non-Tax revenue ratio significantly
influences the operating ratio of Tirunelveli
City Municipal corporation.
Table.1-F Regression of Non-tax revenue ratio on Operating ratio
Model Summary
Model R R
Square
Adjusted R
Square
Std. Error
of the
Estimate
1 0.244 0.060 -0.254 0.10640
ANOVA

Vidyabharati International Interdisciplinary Research Journal (Special Issue) ISSN 2319-4979
Special Issue on Engineering Technologies and Management 3839
Model Sum
of
Squar
es
Df
Mean
Square
F Sig
Regressio
n
0.002 1 0.002 0.190 0.692
Residual 0.034 3 0.011
Total 0.036 4
Source: SPSS Package
Table 1-F shows that as p- value is greater at
5% level of significance the hypothesis is
accepted. That is non-tax revenue ratio does
not significantly influences the operating ratio
of TCMC.
Findings, Suggestions and Conclusion
When financial analysis of TCMC is
evaluated, it is found that throughout the
study period there has been deficit situation in
the Corporation as the operating ratio is less
than 1. This is due to heavy expenses met out
in the first three years. But in the last two
years of the study period the ratio has shown
an increasing trend. This indirectly points out
that in the fourth coming years the
Corporation will show surplus. When simple
regression is calculated both tax revenue ratio
and non-tax revenue ratio do not significantly
influences the operating ratio of TCMC..
Suggestion
It is therefore suggested that
TCMC must follow certain policies to collect
the taxes from various sources. More Grants
and concessions can be provided by the
Government so as to increase the rate of
operating ratio..
Conclusion
To conclude the financial analysis of
TCMC is not bad. To meet out the
expenditures the resources available are very
slender. In order to raise the revenues, sharing
of taxes must be in equal proportion to
functions assigned. Allocation of funds
should also be in tune with National or State
plans. If the Government provides certain
powers and along with certain grants and
concessions this municipal corporation will
render efficient services and there will be
development in the corporation.
REFERENCES
1. Dr. G. Venkatesan Local Government in
India, Indhra Padhipagam
2. Official Website of TCMC.
3. WWW.jil.co.in
4. M.Laxmikanth: Public Administration,
McGraw Hill Education (India) Pvt Ltd.-
2013 edition
5. SPSS Package.
6. Dr. D.Paul Dhinakaran, “Exports and
Imports Stagnation in India During
Covid-19- A Review” GIS Business
(ISSN: 1430-3663 Vol-15-Issue-4-April-
2020).
Vidyabharati International Interdisciplinary Research Journal (Special Issue) ISSN 2319-4979
Special Issue on Engineering Technologies and Management 3840
ON RESPONSES OF IGF-I TO ENDOGENOUS RAISING IN GROWTH HORMONE
AFTER HEAVY RESISTANCE EXERCISE USING NEW GENERALIZED
EXPONENTIAL DISTRIBUTION
S.Vijaya1 and A.Anandan2
1,2Department of Mathematics, Annamalai University, Chidambaram-608002
E.mail ID: [email protected] and [email protected]
ABSTRACT
The Generalized Exponential Distribution (GED) is one of popular stochastic mathematical model through its wide
applicability. In this study, we have selected the real time data for the responses of spontaneous increase in growth
Hormone after heavy-resistance exercise (HRE). The levels of probability density function, survival function and
hazard function of Generalized Exponential Distribution are shown in the results. The obtained statistical results are
matches with the life time data. In this manuscript, it has been recorded that the Generalized Exponential Distribution
could be an accepted stochastic model to express the life time data.
Keywords: GH, Exponential, Parameters, Hazard function, survival function.
INTRODUCTION The Generalized exponential distribution is
known that an extreme value distribution and
received an important research area in the last
few years mainly, in extreme value analysis
of extreme events. In 1895, Karl Pearson has
described the family of gamma distributions
Balakrishnan and Basu [1]. Exponential
distributions are more attractive method in
statistical modelling which gives an efficient
method of commencing a spared shape
parameter for the standard distribution to
attain flexibility and robustness. Exponential
Distribution is well connected towards the
Poisson process. The time in the middle of
two consecutive Poisson events obeys the
Exponential Distribution and it was invoked
by Kondo [2] as Pearson’s Type 𝑋
distribution. Weibull [4], Teissier [3], The
Weibull distributions have numerous
applications in life-time data analysis and
reliability engineering [4].
In the present study, we were implicated to
develop a stochastic model using life time
data of insulin like growth hormones. Human
body is made up of many tissues that are
responsible for growth among which a few
organs concentrate on IGF. Liver serves as
the important factor of circulating IGF-I,
while high concentrations are circulated by
serum [7]. Shoot up in IGF-I levels
circulations is not just by simple instigation
of IGF-I release, stored in the liver or more
tissues. IGF are composite structures and has
high-affinity binding proteins (BIP).
Characterization of six definite BIP are given
in [9] out of which four of them are found in
serum. Over 90% are constrained in 150-kDa
complex that presumes IGF-I or -11, BIP 3
along with an acid-labile subunit. BIPs are
distinctively balanced and perform
independent functions in varied tissues and
cells. Main endocrine stimulant for IGF-I
generation is growth hormone (GH), that
mediates IGF-I synthesis, fusion of segments
of 150-kDa complex of IGF-I and BIP.
Almost all IGF-I actions are moderated by
IGF-I receptor [9].
In this article, we have discussed the lifetime
data from [6], using generalized exponential
distribution [5] for selected parameters with
modifications to acquire the clear
interpretations on hazard function and
survival functions.
METHODOLOGY
Generalized exponential distribution
(GED)
A continuous r.v. 𝑋 with probability
density function
𝑓(𝑥) = {𝛽𝑒−𝛽𝑥 𝑖𝑓 𝑥 ≥ 00 𝑖𝑓 𝑥 < 0
𝛽 > 0,
is presumed to follow exponential
distribution.
GED has probability density function
𝑓(𝑥, 𝛼, 𝛽) = 𝛼𝛽(1 − 𝑒−𝛽𝑥)𝛼−1
𝑒−𝛽𝑥, 𝑥 >
0 𝑓𝑜𝑟 𝛼, 𝛽 > 0
𝑓(𝑥, 𝛼, 𝛽) = 0, 𝑜therwise

Vidyabharati International Interdisciplinary Research Journal (Special Issue) ISSN 2319-4979
Special Issue on Engineering Technologies and Management 3841
MGF is
𝑀𝑋(𝑡) = 𝐸(𝑒𝑡𝑋)
= ∫ 𝑒𝑡𝑥∞
0
𝛼𝛽(1
− 𝑒−𝛽𝑥)𝛼−1
𝑒−𝛽𝑥 𝑑𝑥
= 𝛼𝐵 (∝ ,1 −𝑡
𝛽),
Where 𝐵(𝑚, 𝑛) = ∫ 𝑦𝑛−1(1 − 𝑦)𝑚−1𝑑𝑦1
0
Replacing 𝛽 𝑏𝑦 1/𝜆 and 𝑥 by (𝑥 − 𝜇),
GED obtained is
𝑓(𝑥, 𝛼, 𝜆, 𝜇) =𝛼
𝜆(1 −
𝑒−(𝛼−1)
𝜆⁄ )
𝛼−1
𝑒−(𝛼−1)
𝜆⁄
𝑥 > 𝜆. 𝛼 > 0, 𝜆 > 0.
Extensions of GED
Major reason of the present research work is
exposure of appealing extensions of GED in
several ways and analyzing the instant
generating functions. GED is defined with a
latest criterion 𝑘 > 0 and is called 𝑘-GED. It
has been proven the following result that
combines GED as an extraordinary instance.
Theorem: 1.
Let 𝑋 be a r.v. of continuous type
(CT) and let 𝛼 , 𝛽 > 0 and 𝑘 > 0 be the
criteria. Then,
𝑓(𝑥, ∝, 𝛽, 𝑘) =∝ 𝛽 (1 −
𝑒−𝛽𝑥 𝑘⁄ )𝛼−1
𝑥𝑘−1𝑒−𝛽𝑥 𝑘⁄ ,𝑥 > 0
𝑓(𝑥, ∝, 𝛽, 𝑘) = 0, elsewhere is the p.d.f of
r.v. 𝑋 of CT.
Remark 1: If 𝑘 = 1, it becomes GED. By
above theorem, clearly
𝑓(𝑥, ∝, 𝛽, 𝑘) ≥ 0 ∀ 𝑥 > 0, ∝> 0, 𝛽 > 0, 𝑘> 0.
Now ∫ 𝑓(𝑥, ∝, 𝛽, 𝑘)𝑑𝑥∝
0
=∫ ∝ 𝛽 (1 − 𝑒−𝛽𝑥 𝑘⁄ )𝛼−1
𝑥𝑘−1𝑒−𝛽𝑥 𝑘⁄∝
0𝑑𝑥
=∝ ∫ (1 − 𝑒−𝛽𝑥 𝑘⁄ )𝛼−1
(𝑥𝑘−1𝑒−𝛽𝑥 𝑘⁄ )∝
0
𝑑
∝ [(1 − 𝑒−𝛽𝑥 𝑘⁄ )
𝛼
∝]
0
∝
= [[(1 − 𝑒𝑒−𝛽𝑥 𝑘⁄)𝛼
]]0
∞
Hence 𝑓(𝑥, 𝛼, 𝛽, 𝑘) is a PDF of r,v. 𝑋 of CT.
GED is constructed by using new variable
developed from Weibull distribution. Some of
the theorem and remarks are given here.
Theorem: 2.
Let 𝑋 be a r.v. of CT, 0, and 𝑘 > 0 be
the criteria. Then
𝑓 (𝑥, 𝛼, 𝛽, 𝑘) = 𝑘𝛼𝛽 (1
− 𝑒−𝛽𝑥𝑘)𝛼−1
𝑥𝑘−1 𝑒−𝛽𝑥𝑘
0 < 𝑥
< ∞
𝑓 (𝑥, 𝛼, 𝛽, 𝑘) = 0, 𝑒𝑙𝑠𝑒𝑤ℎ𝑒𝑟𝑒,
is p.d.f. of r.v. X of CT.
Remark: 2. If 𝑘 = 1, K- GE is reduced to
classical ED.
From previous theorem,
𝑓(𝑥, 𝛼, 𝛽, 𝑘) ≥ 0∀𝑥 > 0,∝> 0, 𝛽 > 0, 𝑘 > 0.
∫ 𝑓(𝑥, ∝, 𝛽, 𝑘)𝑑𝑥∝
0
= 𝑘𝛼𝛽 ∫ (1 −∞
0
𝑒−𝛽𝑥𝑘)𝛼−1
𝑥𝑘−1 𝑒−𝛽𝑥𝑘
𝑑𝑥
= 𝛼 ∫ (1∝
0
− 𝑒−𝛽𝑥 𝑘⁄ )𝛼−1
(𝑘𝛽𝑥𝑘−1)𝑒−𝛽𝑥𝑘) 𝑑𝑥
∝ [(1 − 𝑒−𝛽𝑥 𝑘⁄ )
𝛼
∝]
0
∝
= [[(1 − 𝑒𝑒−𝛽𝑥 𝑘⁄)𝛼
]]0
∞
=1 - 0 = 1.
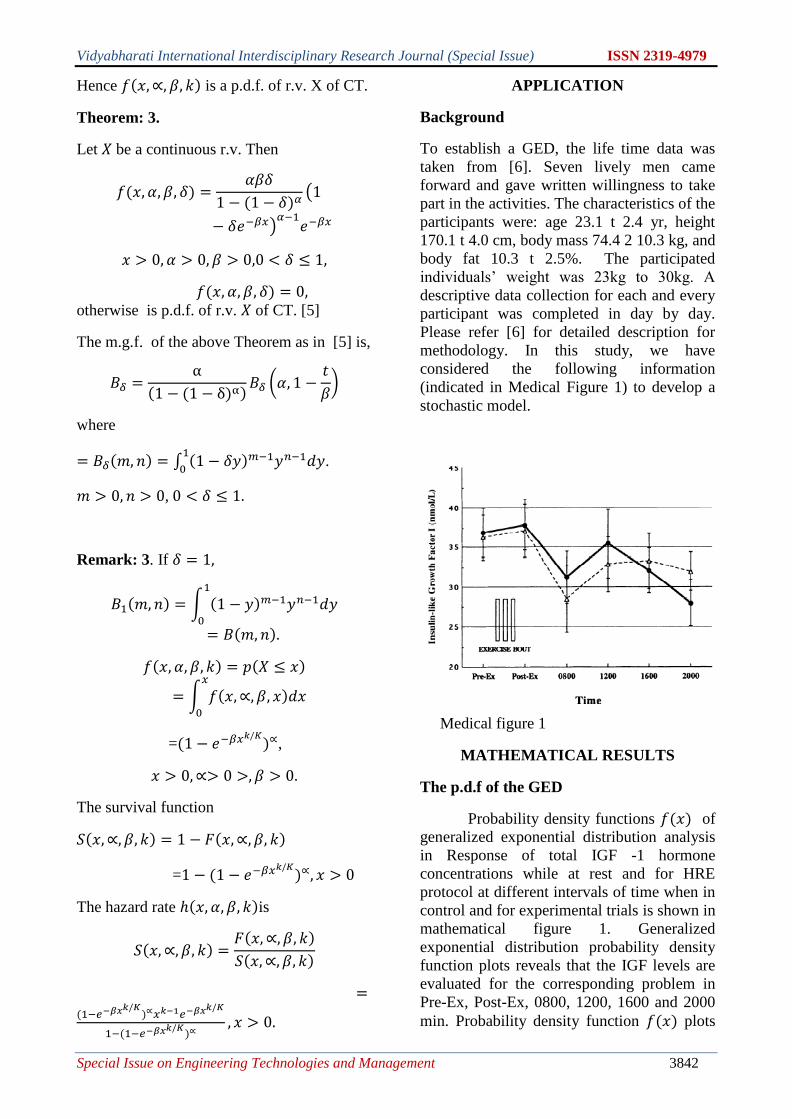
Vidyabharati International Interdisciplinary Research Journal (Special Issue) ISSN 2319-4979
Special Issue on Engineering Technologies and Management 3842
Hence 𝑓(𝑥, ∝, 𝛽, 𝑘) is a p.d.f. of r.v. X of CT.
Theorem: 3.
Let 𝑋 be a continuous r.v. Then
𝑓(𝑥, 𝛼, 𝛽, 𝛿) =𝛼𝛽𝛿
1 − (1 − 𝛿)𝛼(1
− 𝛿𝑒−𝛽𝑥)𝛼−1
𝑒−𝛽𝑥
𝑥 > 0, 𝛼 > 0, 𝛽 > 0,0 < 𝛿 ≤ 1,
𝑓(𝑥, 𝛼, 𝛽, 𝛿) = 0, otherwise is p.d.f. of r.v. 𝑋 of CT. [5]
The m.g.f. of the above Theorem as in [5] is,
𝐵𝛿 =α
(1 − (1 − δ)α)𝐵𝛿 (𝛼, 1 −
𝑡
𝛽)
where
= 𝐵𝛿(𝑚, 𝑛) = ∫ (1 − 𝛿𝑦)𝑚−1𝑦𝑛−1𝑑𝑦1
0.
𝑚 > 0, 𝑛 > 0, 0 < 𝛿 ≤ 1.
Remark: 3. If 𝛿 = 1,
𝐵1(𝑚, 𝑛) = ∫ (1 − 𝑦)𝑚−1𝑦𝑛−1𝑑𝑦1
0
= 𝐵(𝑚, 𝑛).
𝑓(𝑥, 𝛼, 𝛽, 𝑘) = 𝑝(𝑋 ≤ 𝑥)
= ∫ 𝑓(𝑥, ∝, 𝛽, 𝑥)𝑑𝑥𝑥
0
=(1 − 𝑒−𝛽𝑥𝑘/𝐾)∝,
𝑥 > 0,∝> 0 >, 𝛽 > 0.
The survival function
𝑆(𝑥, ∝, 𝛽, 𝑘) = 1 − 𝐹(𝑥, ∝, 𝛽, 𝑘)
=1 − (1 − 𝑒−𝛽𝑥𝑘/𝐾)∝, 𝑥 > 0
The hazard rate ℎ(𝑥, 𝛼, 𝛽, 𝑘)is
𝑆(𝑥, ∝, 𝛽, 𝑘) =𝐹(𝑥, ∝, 𝛽, 𝑘)
𝑆(𝑥, ∝, 𝛽, 𝑘)
=(1−𝑒−𝛽𝑥𝑘/𝐾
)∝𝑥𝑘−1𝑒−𝛽𝑥𝑘/𝐾
1−(1−𝑒−𝛽𝑥𝑘/𝐾)∝
, 𝑥 > 0.
APPLICATION
Background
To establish a GED, the life time data was
taken from [6]. Seven lively men came
forward and gave written willingness to take
part in the activities. The characteristics of the
participants were: age 23.1 t 2.4 yr, height
170.1 t 4.0 cm, body mass 74.4 2 10.3 kg, and
body fat 10.3 t 2.5%. The participated
individuals’ weight was 23kg to 30kg. A
descriptive data collection for each and every
participant was completed in day by day.
Please refer [6] for detailed description for
methodology. In this study, we have
considered the following information
(indicated in Medical Figure 1) to develop a
stochastic model.
Medical figure 1
MATHEMATICAL RESULTS
The p.d.f of the GED
Probability density functions 𝑓(𝑥) of
generalized exponential distribution analysis
in Response of total IGF -1 hormone
concentrations while at rest and for HRE
protocol at different intervals of time when in
control and for experimental trials is shown in
mathematical figure 1. Generalized
exponential distribution probability density
function plots reveals that the IGF levels are
evaluated for the corresponding problem in
Pre-Ex, Post-Ex, 0800, 1200, 1600 and 2000
min. Probability density function 𝑓(𝑥) plots
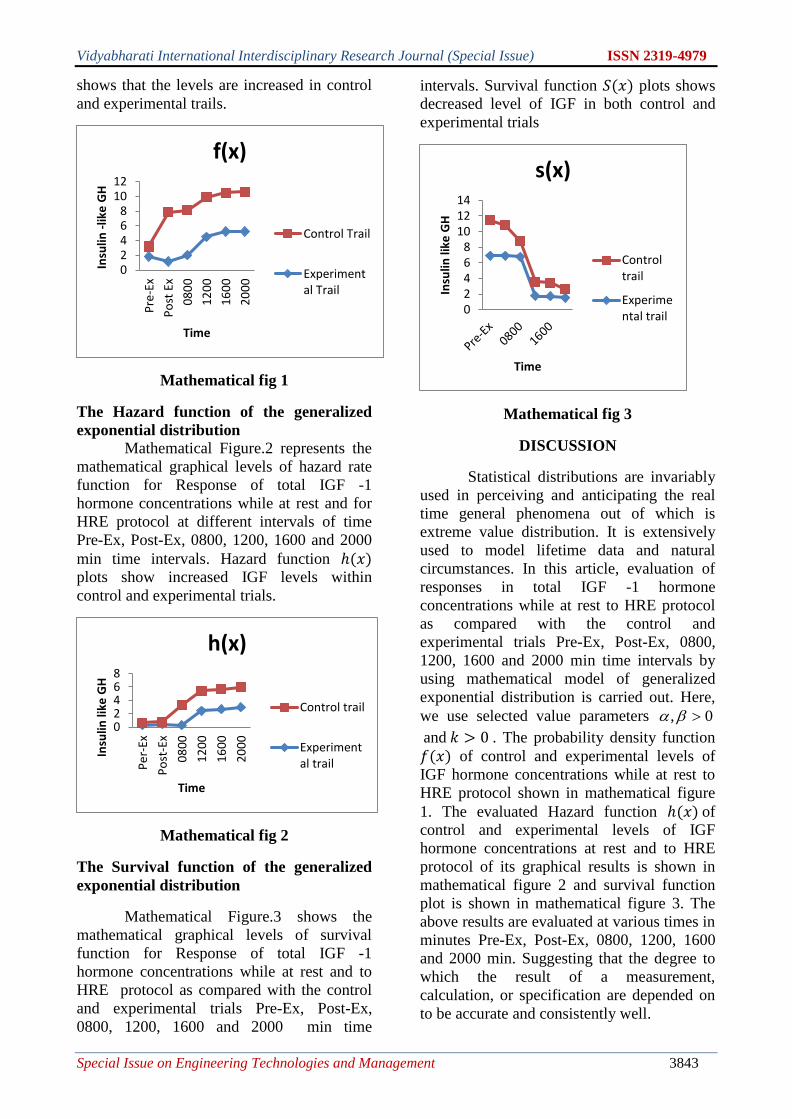
Vidyabharati International Interdisciplinary Research Journal (Special Issue) ISSN 2319-4979
Special Issue on Engineering Technologies and Management 3843
shows that the levels are increased in control
and experimental trails.
Mathematical fig 1
The Hazard function of the generalized
exponential distribution
Mathematical Figure.2 represents the
mathematical graphical levels of hazard rate
function for Response of total IGF -1
hormone concentrations while at rest and for
HRE protocol at different intervals of time
Pre-Ex, Post-Ex, 0800, 1200, 1600 and 2000
min time intervals. Hazard function ℎ(𝑥)
plots show increased IGF levels within
control and experimental trials.
Mathematical fig 2
The Survival function of the generalized
exponential distribution
Mathematical Figure.3 shows the
mathematical graphical levels of survival
function for Response of total IGF -1
hormone concentrations while at rest and to
HRE protocol as compared with the control
and experimental trials Pre-Ex, Post-Ex,
0800, 1200, 1600 and 2000 min time
intervals. Survival function 𝑆(𝑥) plots shows
decreased level of IGF in both control and
experimental trials
Mathematical fig 3
DISCUSSION
Statistical distributions are invariably
used in perceiving and anticipating the real
time general phenomena out of which is
extreme value distribution. It is extensively
used to model lifetime data and natural
circumstances. In this article, evaluation of
responses in total IGF -1 hormone
concentrations while at rest to HRE protocol
as compared with the control and
experimental trials Pre-Ex, Post-Ex, 0800,
1200, 1600 and 2000 min time intervals by
using mathematical model of generalized
exponential distribution is carried out. Here,
we use selected value parameters 0,
and 𝑘 > 0 . The probability density function
𝑓(𝑥) of control and experimental levels of
IGF hormone concentrations while at rest to
HRE protocol shown in mathematical figure
1. The evaluated Hazard function ℎ(𝑥) of
control and experimental levels of IGF
hormone concentrations at rest and to HRE
protocol of its graphical results is shown in
mathematical figure 2 and survival function
plot is shown in mathematical figure 3. The
above results are evaluated at various times in
minutes Pre-Ex, Post-Ex, 0800, 1200, 1600
and 2000 min. Suggesting that the degree to
which the result of a measurement,
calculation, or specification are depended on
to be accurate and consistently well.
02468
1012
Pre
-Ex
Po
st E
x
08
00
12
00
16
00
20
00
Insu
lin -
like
GH
Time
f(x)
Control Trail
Experimental Trail
02468
Pe
r-Ex
Po
st-E
x
08
00
12
00
16
00
20
00
Insu
lin li
ke G
H
Time
h(x)
Control trail
Experimental trail
02468
101214
Insu
lin li
ke G
H
Time
s(x)
Controltrail
Experimental trail

Vidyabharati International Interdisciplinary Research Journal (Special Issue) ISSN 2319-4979
Special Issue on Engineering Technologies and Management 3844
CONCLUSION
In conclusion, we have explicated the
mathematical expressions for some of its
essential stochastic characteristics like
probability density function, hazard function
and survival function. The obtained results
reveal that in IGF -1 hormone concentrations
while at rest to HRE protocol as compared
with the control and experimental trials Pre-
Ex, Post-Ex, 0800, 1200, 1600 and 2000 min.
In this paper, we have given mathematical
plots for control and experimental trials levels
for the corresponding medical problem in the
particular times.
REFERENCES
1. N. Balakrishnan and A.P. Basu (1995),
Exponential Distribution Theory,
Methods and Applications, John Wiley,
New York, NY, USA.
2. T. Kondo (1930), “A theory of the
sampling distribution of standard
deviation,” Journal of Biometrika, 22(
½), 34–64.
3. G. Teissier (1934), Dysharmonies et
Discontinuit´es dans la Croissance, Act.
Sci. et Industr.,No. 95 (Expos´es de
Biometrie, 1), Hermann, Paris.
4. W. Weibull (1939), A statistical theory of
the strength of ma-terials, vol. 151,
Ingeniors Vetenskaps Akademiens,
Stockholm, Sweden, (1939).
5. N.M. Rather, and T.A. Rather (2017),
New Generalizations of Exponential
Distribution with Applications, Journal
of Probability and Statistics, Article ID
2106748, doi.org/10.1155/2017/2106748.
6. William J. Kraemer, brian A. Aguilera,
mitsuyo terada, robert U. Newton, James
M. Lynch, gonny rosendaal, jeffrey M.
Mcbride, scott E. Gordon, And keijo
hakkinen (1995), Responses of IGF-I to
endogenous increases in growth Hormone
after heavy-resistance exercise, the
american physiological society.
7. A. J. D’Ercole(1977), Estimation of
somatomedin-C levels in normals and
patients with pituitary disease by
radioimmunoassay. J. Clin. Invest. 60:
648-657.
8. Jackson, A. S., and M. L. Pollock (1985).
Practical assessment of body composition.
Physician Sports Med. 13.
Jones, J. I., and D. R. Clemmons(1995),
Insulin-like growth factors and their binding
proteins: biological actions. Endocr. Rev. 16:
3-34.
Vidyabharati International Interdisciplinary Research Journal (Special Issue) ISSN 2319-4979
Special Issue on Engineering Technologies and Management 3845
DEEP LEARNING FOR LUNG NODULE CLASSIFICATION: A TECHNICAL REVIEW
Priyanka Gupta1, Anand Prakash Shukla2, Sunil Kumar Sharma3
1,2 Department of Computer Science and Engineering, KIET Group of Institutions, Ghaziabad,
Uttar Pradesh 201206, India 3Virtusa Consulting &Services Ltd, 132 turnpika rd, ste 300, Southborough, MA 01772.
E-mail:1,[email protected],[email protected],[email protected]
ABSTRACT Convolutional networks, in particular, have swiftly risen to popularity as the primary way for analysing medical
images. In recent years, however, various deep learning algorithms have been utilised in lung nodule classification,
with outstanding results when compared to many other state-of-the-art approaches. Multiple deep learning algorithms
for lung nodule classification have been employed in the past, as well as adjustments used to deep learning design to
improve the classification program's accuracy, are shown in this study and also discuss the main deep learning ideas
related to medical image analysis and contribute to the conclusion that new nodule classification issues must be solved
in order to detect cancerous tumours early.
Keywords— Lung Nodule Classification, Deep Learning, Medical Imaging.
Introduction
Deep learning (DL) has been commonly used
in a range of medical imaging challenges and
has gained improved process in a number of
medical application areas, ushering us into the
artificial intelligence (AI) era. Medical
imaging, on the other hand, poses special
obstacles to DL strategies. Lung cancer are
among the most dangerous and widespread
forms of cancer in the world, in terms of both
new patients and fatalities. Lung cancer
survival has improved significantly over the
last decade, from a median overall survival of
11 months to a 17.8% 5-year survival rate.
Early identification and treatment of lung
cancer improves the sufferer's chances of
survival. Lung cancer diagnosis requires
classifying tumours as benign or malignant,
which is achieved using image mining
techniques known as classification. Image
classification is the primary domain wherein
Deep Neural Networks play the most essential
role in medical image processing. [1] Sensibly
identifying image by subject is a vital way to
collect helpful info from wide image set. The
classification module in the mining method is
typically called classifier. The object
detection problem, which is concerned with
classification of images, is one of the most
important problems in computer vision. The
numerical properties of different image
features are evaluated, and data is grouped
into categories. Most innovative classification
methods, such as fuzzy sets, artificial neural
networks, and expert systems, have been
commonly used for image classification in
recent years, and each of them has its own set
of issues and has a lower rate of precision.
Cancers are graded clinically as small-cell
lung carcinoma (SCLC) or non-small-cell
lung carcinoma (NSCLC), with SCLCs
accounted for 15% of the overall lung cancer
population and NSCLCs accounting for 85%.
[4] Adenocarcinoma, Squamous-cell
carcinoma, and Large-cell carcinoma are the
three subtypes of NSCLC. Adenocarcinoma is
by far the most common form of lung cancer,
accounting for 40% of all lung cancer cases.
For prognostication and treatment planning, it
is essential to categorise the
form of malignancy based on histopathology
and immunohistochemistry as shown in
Figure 1. [3]
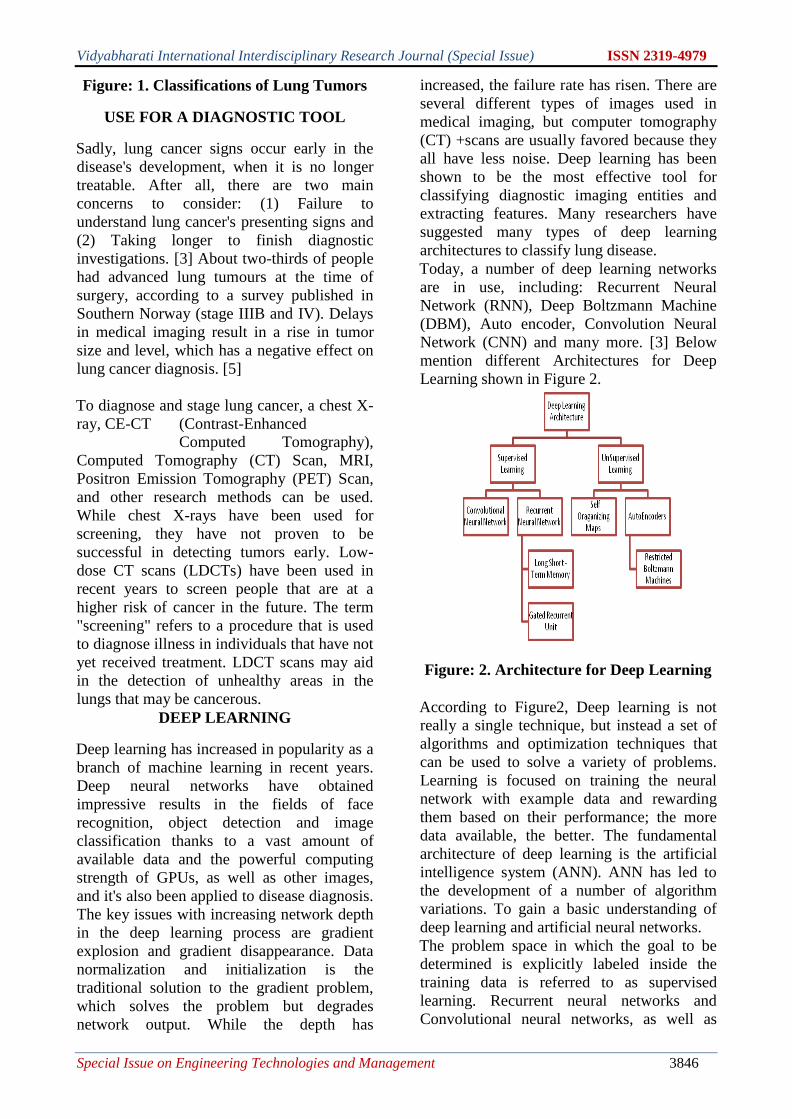
Vidyabharati International Interdisciplinary Research Journal (Special Issue) ISSN 2319-4979
Special Issue on Engineering Technologies and Management 3846
Figure: 1. Classifications of Lung Tumors
USE FOR A DIAGNOSTIC TOOL
Sadly, lung cancer signs occur early in the
disease's development, when it is no longer
treatable. After all, there are two main
concerns to consider: (1) Failure to
understand lung cancer's presenting signs and
(2) Taking longer to finish diagnostic
investigations. [3] About two-thirds of people
had advanced lung tumours at the time of
surgery, according to a survey published in
Southern Norway (stage IIIB and IV). Delays
in medical imaging result in a rise in tumor
size and level, which has a negative effect on
lung cancer diagnosis. [5]
To diagnose and stage lung cancer, a chest X-
ray, CE-CT (Contrast-Enhanced
Computed Tomography),
Computed Tomography (CT) Scan, MRI,
Positron Emission Tomography (PET) Scan,
and other research methods can be used.
While chest X-rays have been used for
screening, they have not proven to be
successful in detecting tumors early. Low-
dose CT scans (LDCTs) have been used in
recent years to screen people that are at a
higher risk of cancer in the future. The term
"screening" refers to a procedure that is used
to diagnose illness in individuals that have not
yet received treatment. LDCT scans may aid
in the detection of unhealthy areas in the
lungs that may be cancerous.
DEEP LEARNING
Deep learning has increased in popularity as a
branch of machine learning in recent years.
Deep neural networks have obtained
impressive results in the fields of face
recognition, object detection and image
classification thanks to a vast amount of
available data and the powerful computing
strength of GPUs, as well as other images,
and it's also been applied to disease diagnosis.
The key issues with increasing network depth
in the deep learning process are gradient
explosion and gradient disappearance. Data
normalization and initialization is the
traditional solution to the gradient problem,
which solves the problem but degrades
network output. While the depth has
increased, the failure rate has risen. There are
several different types of images used in
medical imaging, but computer tomography
(CT) +scans are usually favored because they
all have less noise. Deep learning has been
shown to be the most effective tool for
classifying diagnostic imaging entities and
extracting features. Many researchers have
suggested many types of deep learning
architectures to classify lung disease.
Today, a number of deep learning networks
are in use, including: Recurrent Neural
Network (RNN), Deep Boltzmann Machine
(DBM), Auto encoder, Convolution Neural
Network (CNN) and many more. [3] Below
mention different Architectures for Deep
Learning shown in Figure 2.
Figure: 2. Architecture for Deep Learning
According to Figure2, Deep learning is not
really a single technique, but instead a set of
algorithms and optimization techniques that
can be used to solve a variety of problems.
Learning is focused on training the neural
network with example data and rewarding
them based on their performance; the more
data available, the better. The fundamental
architecture of deep learning is the artificial
intelligence system (ANN). ANN has led to
the development of a number of algorithm
variations. To gain a basic understanding of
deep learning and artificial neural networks.
The problem space in which the goal to be
determined is explicitly labeled inside the
training data is referred to as supervised
learning. Recurrent neural networks and
Convolutional neural networks, as well as
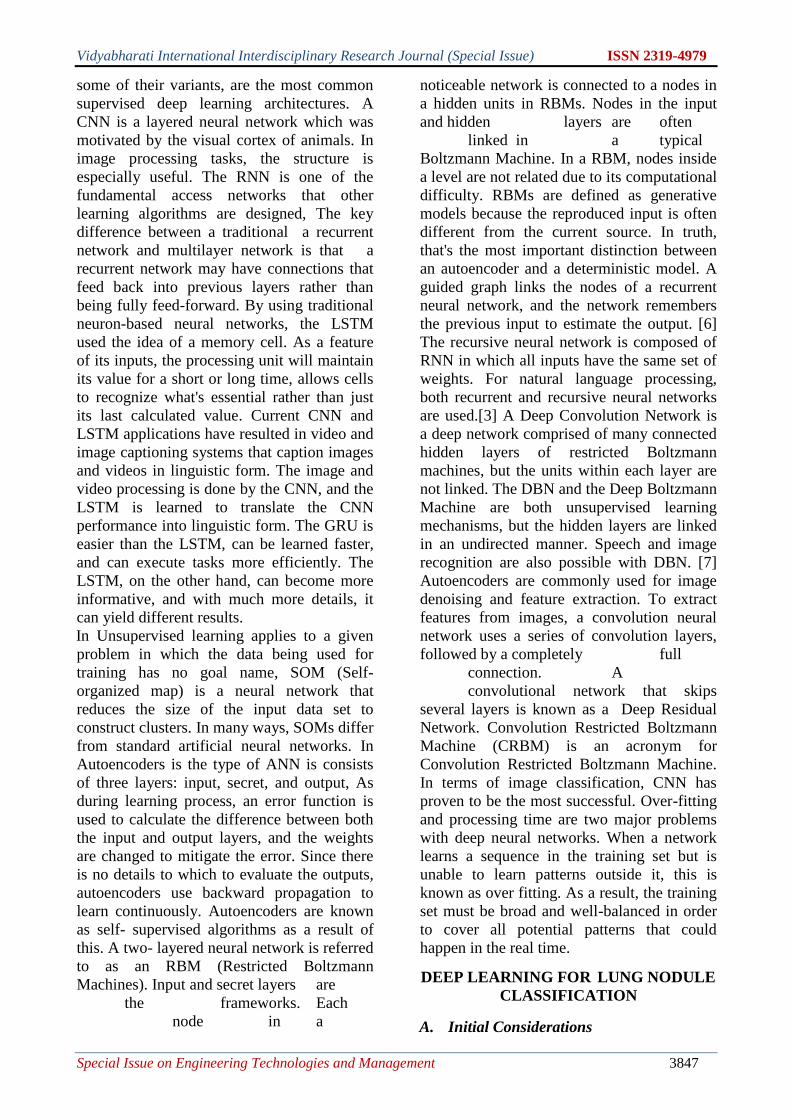
Vidyabharati International Interdisciplinary Research Journal (Special Issue) ISSN 2319-4979
Special Issue on Engineering Technologies and Management 3847
some of their variants, are the most common
supervised deep learning architectures. A
CNN is a layered neural network which was
motivated by the visual cortex of animals. In
image processing tasks, the structure is
especially useful. The RNN is one of the
fundamental access networks that other
learning algorithms are designed, The key
difference between a traditional a recurrent
network and multilayer network is that a
recurrent network may have connections that
feed back into previous layers rather than
being fully feed-forward. By using traditional
neuron-based neural networks, the LSTM
used the idea of a memory cell. As a feature
of its inputs, the processing unit will maintain
its value for a short or long time, allows cells
to recognize what's essential rather than just
its last calculated value. Current CNN and
LSTM applications have resulted in video and
image captioning systems that caption images
and videos in linguistic form. The image and
video processing is done by the CNN, and the
LSTM is learned to translate the CNN
performance into linguistic form. The GRU is
easier than the LSTM, can be learned faster,
and can execute tasks more efficiently. The
LSTM, on the other hand, can become more
informative, and with much more details, it
can yield different results.
In Unsupervised learning applies to a given
problem in which the data being used for
training has no goal name, SOM (Self-
organized map) is a neural network that
reduces the size of the input data set to
construct clusters. In many ways, SOMs differ
from standard artificial neural networks. In
Autoencoders is the type of ANN is consists
of three layers: input, secret, and output, As
during learning process, an error function is
used to calculate the difference between both
the input and output layers, and the weights
are changed to mitigate the error. Since there
is no details to which to evaluate the outputs,
autoencoders use backward propagation to
learn continuously. Autoencoders are known
as self- supervised algorithms as a result of
this. A two- layered neural network is referred
to as an RBM (Restricted Boltzmann
Machines). Input and secret layers are
the frameworks. Each
node in a
noticeable network is connected to a nodes in
a hidden units in RBMs. Nodes in the input
and hidden layers are often
linked in a typical
Boltzmann Machine. In a RBM, nodes inside
a level are not related due to its computational
difficulty. RBMs are defined as generative
models because the reproduced input is often
different from the current source. In truth,
that's the most important distinction between
an autoencoder and a deterministic model. A
guided graph links the nodes of a recurrent
neural network, and the network remembers
the previous input to estimate the output. [6]
The recursive neural network is composed of
RNN in which all inputs have the same set of
weights. For natural language processing,
both recurrent and recursive neural networks
are used.[3] A Deep Convolution Network is
a deep network comprised of many connected
hidden layers of restricted Boltzmann
machines, but the units within each layer are
not linked. The DBN and the Deep Boltzmann
Machine are both unsupervised learning
mechanisms, but the hidden layers are linked
in an undirected manner. Speech and image
recognition are also possible with DBN. [7]
Autoencoders are commonly used for image
denoising and feature extraction. To extract
features from images, a convolution neural
network uses a series of convolution layers,
followed by a completely full
connection. A
convolutional network that skips
several layers is known as a Deep Residual
Network. Convolution Restricted Boltzmann
Machine (CRBM) is an acronym for
Convolution Restricted Boltzmann Machine.
In terms of image classification, CNN has
proven to be the most successful. Over-fitting
and processing time are two major problems
with deep neural networks. When a network
learns a sequence in the training set but is
unable to learn patterns outside it, this is
known as over fitting. As a result, the training
set must be broad and well-balanced in order
to cover all potential patterns that could
happen in the real time.
DEEP LEARNING FOR LUNG NODULE
CLASSIFICATION
A. Initial Considerations

Vidyabharati International Interdisciplinary Research Journal (Special Issue) ISSN 2319-4979
Special Issue on Engineering Technologies and Management 3848
In this figure.3 show that Benign (not Cancer)
Tumor cells can only expand internally and
cannot grow by metastatic disease or
penetration. Malignant (cancer) tissues
infiltrate neighboring tissues, join blood
vessels, and spread to other parts of the body.
Related to its violent nature and late diagnosis
at advanced stages, Lung cancer is among the
most common cancer-related death rates.
Lung cancer is a type of cancer is critical for a
person's life, and it is a difficult problem to
solve. In most cases, computed tomography
(CT) and chest radiographs (X-rays) scans are
used to diagnose malignant nodules: The
existence of benign nodules, on the other
hand, can lead to erroneous judgments. The
benign and malignant nodules have a striking
similarity in their early stages. For lung
nodule identification and classification, we
used two deep three-dimensional (3D)
customised mixed connection network
(CMixNet) architectures, because of deep
convolutional neural networks' (CNN) recent
achievements in image analysis To detect
nodules, a faster R-CNN based on features
from CMixNet and U-Net, such as encoder–
decoder architecture, was used. [8]
To help the surgeon make correct decisions,
computer-assisted lung cancer detection is
needed. The CAD success functions as a
proper diagnosis for the radiologist,
enhancing radiological diagnosis accuracy
and reducing the time it takes to read an
image. There are two types of CAD systems:
1) CADx (Computer Aided Diagnostic), 2)
CADe
(Computer Aided Detection). CADe is used to
analytic methods, while CADx is used to
assess tumors malignancy and staging.
Figure: 3. Benign vs. Malignant Tumors
Machine Learning methods and techniques
are commonly used in lung cancer diagnosis
and prognosis. They can diagnose lung
disease with just
0.11 mSv of radiation. At standard doses, For
lung cancer detection, machine learning were
found to have a sensitivity of 91.5–95.9%. [9]
The following are the two major concepts to
lung nodule classifier: (1) Radiomics, that is
based on extracting picture attributes from a
lung CT scan.
(2) Neural Network - based with
Convolutions (CNN). The model is developed
using a radiomics method that extracts either
2D or 3D feature maps of lung nodules. To
define the tumour, it also needs an effective
Feature Extraction algorithm & Lung
Segmentation. Another side, CNN does not
always necessitate a feature extraction and
segmentation stage. CNN, on the other hand,
necessitates a very big dataset.
Picture Collection, Image Segmentation,
Image Pre- processing, Lung Nodule
Classification and Feature Extraction, and are
the 5 steps in the Radiomics method to Lung
Nodule Classification exhibited in fig 4. All
of these systems has its own set of difficulties.
For eg, the best image acquisition and
reconstruction protocols must be defined and
established. Segments must also be stable and
require minimal operator feedback. Features
must be produced that faithfully represent the
difficulty of the specific quantities, but they
must not be excessively complicated or
duplicate. In addition, informatics databases
allowing the inclusion of feature
representation and annotations, as well as
biological and personal data, must be
developed.
After this, since radiomics is not a mature
field of research, the computational methods
used to interpret these data must be optimized.
[10]
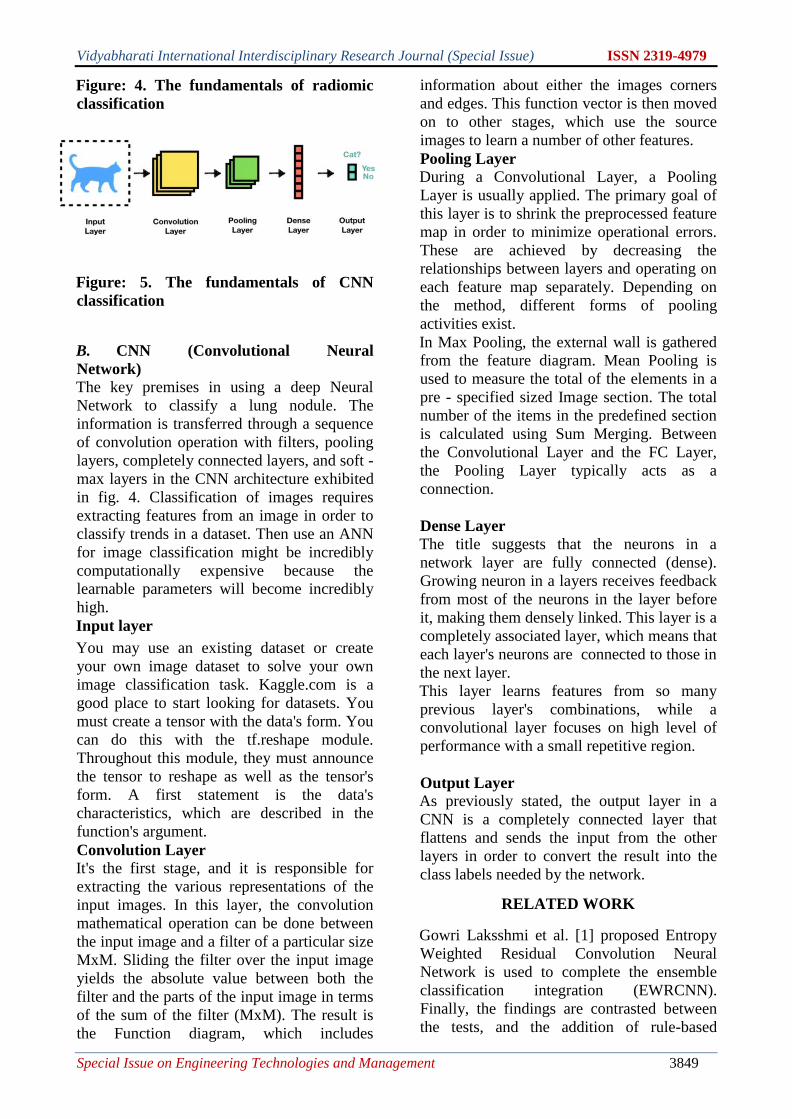
Vidyabharati International Interdisciplinary Research Journal (Special Issue) ISSN 2319-4979
Special Issue on Engineering Technologies and Management 3849
Figure: 4. The fundamentals of radiomic
classification
Figure: 5. The fundamentals of CNN
classification
B. CNN (Convolutional Neural
Network)
The key premises in using a deep Neural
Network to classify a lung nodule. The
information is transferred through a sequence
of convolution operation with filters, pooling
layers, completely connected layers, and soft -
max layers in the CNN architecture exhibited
in fig. 4. Classification of images requires
extracting features from an image in order to
classify trends in a dataset. Then use an ANN
for image classification might be incredibly
computationally expensive because the
learnable parameters will become incredibly
high.
Input layer
You may use an existing dataset or create
your own image dataset to solve your own
image classification task. Kaggle.com is a
good place to start looking for datasets. You
must create a tensor with the data's form. You
can do this with the tf.reshape module.
Throughout this module, they must announce
the tensor to reshape as well as the tensor's
form. A first statement is the data's
characteristics, which are described in the
function's argument.
Convolution Layer
It's the first stage, and it is responsible for
extracting the various representations of the
input images. In this layer, the convolution
mathematical operation can be done between
the input image and a filter of a particular size
MxM. Sliding the filter over the input image
yields the absolute value between both the
filter and the parts of the input image in terms
of the sum of the filter (MxM). The result is
the Function diagram, which includes
information about either the images corners
and edges. This function vector is then moved
on to other stages, which use the source
images to learn a number of other features.
Pooling Layer
During a Convolutional Layer, a Pooling
Layer is usually applied. The primary goal of
this layer is to shrink the preprocessed feature
map in order to minimize operational errors.
These are achieved by decreasing the
relationships between layers and operating on
each feature map separately. Depending on
the method, different forms of pooling
activities exist.
In Max Pooling, the external wall is gathered
from the feature diagram. Mean Pooling is
used to measure the total of the elements in a
pre - specified sized Image section. The total
number of the items in the predefined section
is calculated using Sum Merging. Between
the Convolutional Layer and the FC Layer,
the Pooling Layer typically acts as a
connection.
Dense Layer
The title suggests that the neurons in a
network layer are fully connected (dense).
Growing neuron in a layers receives feedback
from most of the neurons in the layer before
it, making them densely linked. This layer is a
completely associated layer, which means that
each layer's neurons are connected to those in
the next layer.
This layer learns features from so many
previous layer's combinations, while a
convolutional layer focuses on high level of
performance with a small repetitive region.
Output Layer
As previously stated, the output layer in a
CNN is a completely connected layer that
flattens and sends the input from the other
layers in order to convert the result into the
class labels needed by the network.
RELATED WORK
Gowri Laksshmi et al. [1] proposed Entropy
Weighted Residual Convolution Neural
Network is used to complete the ensemble
classification integration (EWRCNN).
Finally, the findings are contrasted between
the tests, and the addition of rule-based

Vidyabharati International Interdisciplinary Research Journal (Special Issue) ISSN 2319-4979
Special Issue on Engineering Technologies and Management 3850
classification increased the CAD system's
detection accuracy as FP elimination with
Faster R-CNN alone was lower. The goal of
this review is to use CT and X-ray images to
classify and predict the correct lung cancerous
nodule.
Shabi M et al. [2] proposed a new approach
for predicting the malignancy of nodules that
uses a global feature extractor to analyse the
size and shape of the nodule, as well as a local
feature extractor to examine the nodule's
density and composition. The deep Local–
Global network can retrieve both locally and
globally features with precision.
Panpan et al. [13] Studies in lung computed
tomography (CT) images from the readily
viewable LIDCIDRI database are used to
validate this method. The ten-fold cross-
validation approach GoogleNet, ShuffleNet,
DenseNet, and
MobileNetV2. The accuracy, sensitivity,
specificity, and position under the
receiver operator are all used to
evaluate their efficiency. GoogleNet is the
best CNN structure for CT lung tumour
detection, according to research
observations, with a precision of 94.53
percent, a yielded an average accuracy of
98.23% and a false positive rate of 1.65
percent. As compared with the traditional
support vector machine (SVM)-based CAD
scheme, our approach improved accuracy by
9.96%. In comparison to the InceptionV3 &
VGG19 model convolutional neural networks,
the number of false positives fell by 2.07%
and 2.22 %, accordingly.
Meng et al. [16] To compare the clinical
significance of a deep learning-based lung
nodule segmentation and classification
algorithm to other CT enhancement
techniques. Another well approach was put to
the test on 363 new tests using two
parameters: density classification accuracy
and nodule segmentation Dice coefficient.
The variance analysis of various different
modeling approaches was used to statistically
evaluate the results under 3 different testing
techniques. Under various CT modeling
techniques, a deep learning algorithm
combining 3D convolution neural network
and recurrent neural network (rnn) has shown
to be reasonably constant in segmentation and
classification of lung nodules.
Trajanovski et al. [17] The deep learning -
based model: (i) generalises well throughout
all datasets, with AUCs ranging from 86 to 94
percent; (ii) outperforms the commonly used
PanCan Risk Model, with an AUC of 11
percent higher; (iii) outperforms the state-of-
the-art in lung transplantation as represented
by the results of the Kaggle Data Science
Bowl 2017 contest; (iv) performs similarly to
radiologists in predicting cancer risk at the
individual stage. Ashhar et al.
[18] To distinguish lung tumours into
benign and malignant groups, researchers
used LIDC- IDRI databases to test the
efficiency of five newly established
Convolutional Neural Network architectures:
SqueezeNet, specificity of 99.06 percent, a
sensitivity of 65.67 percent, and an AUC of
86.84 percent. Asuntha et al. [22] This study
employs innovative Deep learning approach
for detecting the position of tumour lung
nodules. Learning is used to classify features
in this case. FPSOCNN is a novel FPSOCNN
that aims to minimize complexities of CNN.
Wavelet transform-based functions,
Histogram of directed Gradients (HoG), Local
Binary Pattern (LBP), Scale Invariant
Function Multimedia Tools Applications
Transform (SIFT), and Zernike Moment are
all used in this study. After removing the
texture, the good function is chosen using a
geometric, volumetric, and Fuzzy Particle
Swarm Optimization (FPSO) algorithm.
Huang et al. [23] On CT scan images of the
lung, an unique method merging DTCNN and
ELM is suggested for effective and precise
automatic benign–malignant nodules analysis.
DTCNN has demonstrated an amazing high
extraction performance, while ELM has also
been suggested as an optimized and effective
classifier. On the LIDC- IDRI dataset, the
suggested DTCNN-ELM approach obtained a
precision of 94.57 percent, and on the
FAHGMU database, it achieve a precision of
100 percent.
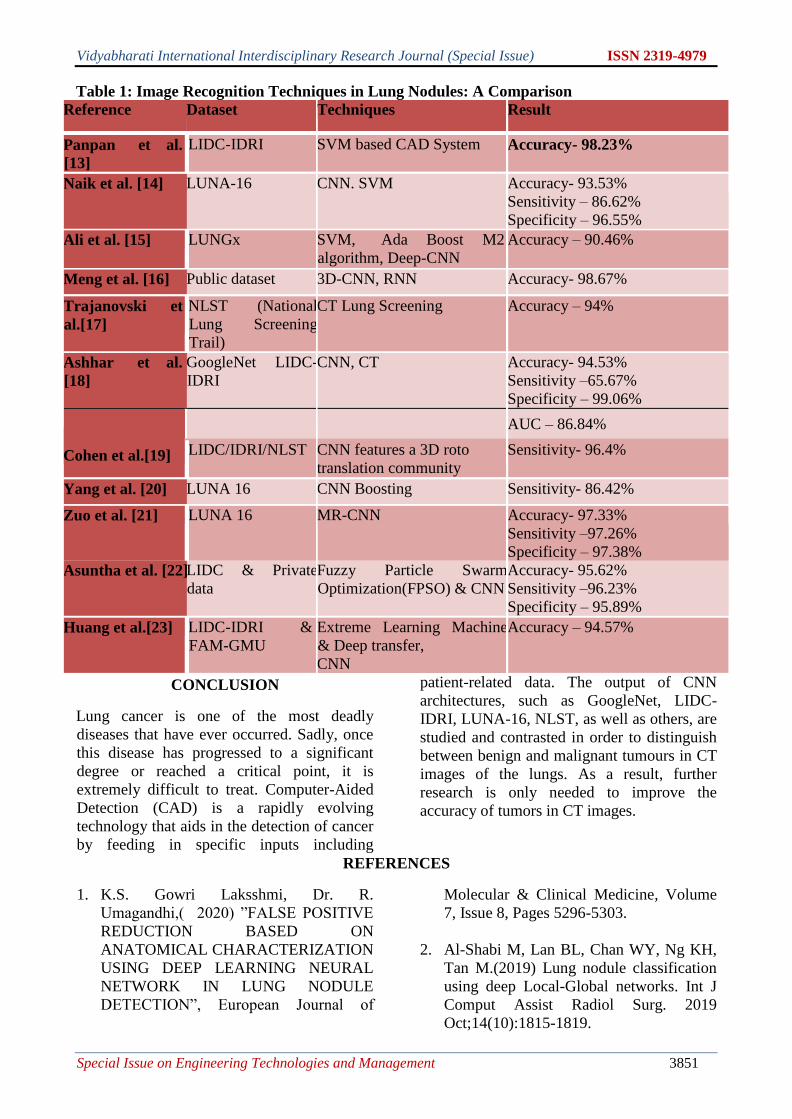
Vidyabharati International Interdisciplinary Research Journal (Special Issue) ISSN 2319-4979
Special Issue on Engineering Technologies and Management 3851
Table 1: Image Recognition Techniques in Lung Nodules: A Comparison
Reference Dataset Techniques Result
Panpan et al.
[13]
LIDC-IDRI SVM based CAD System Accuracy- 98.23%
Naik et al. [14] LUNA-16 CNN. SVM Accuracy- 93.53%
Sensitivity – 86.62%
Specificity – 96.55%
Ali et al. [15] LUNGx SVM, Ada Boost M2
algorithm, Deep-CNN
Accuracy – 90.46%
Meng et al. [16] Public dataset 3D-CNN, RNN Accuracy- 98.67%
Trajanovski et
al.[17]
NLST (National
Lung Screening
Trail)
CT Lung Screening Accuracy – 94%
Ashhar et al.
[18]
GoogleNet LIDC-
IDRI
CNN, CT Accuracy- 94.53%
Sensitivity –65.67%
Specificity – 99.06%
Cohen et al.[19]
AUC – 86.84%
LIDC/IDRI/NLST CNN features a 3D roto
translation community
Sensitivity- 96.4%
Yang et al. [20] LUNA 16 CNN Boosting Sensitivity- 86.42%
Zuo et al. [21] LUNA 16 MR-CNN Accuracy- 97.33%
Sensitivity –97.26%
Specificity – 97.38%
Asuntha et al. [22] LIDC & Private
data
Fuzzy Particle Swarm
Optimization(FPSO) & CNN
Accuracy- 95.62%
Sensitivity –96.23%
Specificity – 95.89%
Huang et al.[23] LIDC-IDRI &
FAM-GMU
Extreme Learning Machine
& Deep transfer,
CNN
Accuracy – 94.57%
CONCLUSION
Lung cancer is one of the most deadly
diseases that have ever occurred. Sadly, once
this disease has progressed to a significant
degree or reached a critical point, it is
extremely difficult to treat. Computer-Aided
Detection (CAD) is a rapidly evolving
technology that aids in the detection of cancer
by feeding in specific inputs including
patient-related data. The output of CNN
architectures, such as GoogleNet, LIDC-
IDRI, LUNA-16, NLST, as well as others, are
studied and contrasted in order to distinguish
between benign and malignant tumours in CT
images of the lungs. As a result, further
research is only needed to improve the
accuracy of tumors in CT images.
REFERENCES
1. K.S. Gowri Laksshmi, Dr. R.
Umagandhi,( 2020) ”FALSE POSITIVE
REDUCTION BASED ON
ANATOMICAL CHARACTERIZATION
USING DEEP LEARNING NEURAL
NETWORK IN LUNG NODULE
DETECTION”, European Journal of
Molecular & Clinical Medicine, Volume
7, Issue 8, Pages 5296-5303.
2. Al-Shabi M, Lan BL, Chan WY, Ng KH,
Tan M.(2019) Lung nodule classification
using deep Local-Global networks. Int J
Comput Assist Radiol Surg. 2019
Oct;14(10):1815-1819.
Vidyabharati International Interdisciplinary Research Journal (Special Issue) ISSN 2319-4979
Special Issue on Engineering Technologies and Management 3854
3. Naik, A., Edla, D.R. , (2021). Lung
Nodule Classification on Computed
Tomography Images Using Deep
Learning. Wireless Pers Commun 116,
655–690.
4. Denisenko, T. V., Budkevich, I. N., &
Zhivotovsky, B. (2018). Cell death-based
treatment of lungadenocarcinoma. Cell
Death and Disease, 9, 117.
5. Rolke, H. B., Bakke, P. S., & Gallefoss, F.
(2007). Delays in the diagnostic pathways
for primary pulmonary carcinoma in
Southern Norway. Respiratory Medicine,
101(6), 1251– 1257.
6. Li, X., & Wu, X. (2015). Constructing
long short-term memory based deep
recurrent neural networks for large
vocabulary speech recognition. In IEEE
international conference on acoustics,
speech and signal processing (pp. 4520–
4524). IEEE.
7. Jin, X., Ma, C., Zhang, Y., & Li, L.
(2017). Classifcation of lung nodules
based on convolutional deep belief
network. In 2017 10th International
symposium on computational intelligence
and design (ISCID), Hangzhou (pp. 139–
142).
8. Nasrullah Nasrullah, Jun Sang,
Mohammad S. Alam, Muhammad
Mateen, Bin Cai, Haibo Hu , Sensors
(Basel) (2019 Sep) , Automated Lung
Nodule Detection and Classification
Using Deep Learning Combined with
Multiple Strategies; 19(17): 3722.
Published online 2019 Aug 28. .
9. Schwyzer, M. (2018). Automated
detection of lung cancer at ultralow dose
PET/CT by deep neural networks—Initial
results. Lung Cancer, 126, 170–173.
10. Kumar V, Gu Y, Basu S, Berglund A,
Eschrich SA, Schabath MB, Forster K,
Aerts HJ, Dekker A, Fenstermacher D,
Goldgof DB, Hall LO, Lambin P,
Balagurunathan Y, Gatenby RA, Gillies
RJ. Radiomics: the process and the
challenges. Magn Reson
Imaging.,2012)Nov;30(9):1234-48. doi:
10.1016/j.mri.2012.06.010. Epub 2012
Aug 13. PMID: 22898692; PMCID:
PMC3563280.
11. Dabeer S, Khan MM and Islam S (2019)
Cancer diagnosis in histopathological
image: CNN based approach Informatics
in Medicine Unlocked 16:100231.
12. Patra R. (2020) Prediction of Lung Cancer
Using Machine Learning Classifier. In:
Chaubey Singapore.
13. Panpan Wu, Xuanchao Sun, Ziping Zhao,
Haishuai Wang, Shirui Pan, Björn
Schuller,(2020) "Classification of Lung
Nodules Based on Deep Residual
Networks and Migration Learning",
Computational Intelligence and
Neuroscience, vol. 2020, Article ID
8975078, 10 pages.
14. Naik, Amrita and Edla, Damodar Reddy.
(1 Jan. 2021) ‘Lung Nodule Classification
Using Combination of CNN, Second and
Higher Order Texture Features’: 1 – 9.
15. I. Ali, M. Muzammil, I. U. Haq, A. A.
Khaliq and S. Abdullah,(2021) "Deep
Feature Selection and Decision Level
Fusion for Lungs Nodule Classification,"
in IEEE Access, vol. 9, pp. 18962-18973.
16. Meng XL, Xing ZJ, Lu S, (2021 Feb) “A
deep learning-based lung nodule density
classification and segmentation method
and its effectiveness under different CT
reconstruction algorithms”;101 (7):476-
480.
17. S. Trajanovski, D. Mavroeidis,
(2021)“Towards radiologist-level cancer
risk assessment in CT lung screening
using deep learning”, Computerized
Medical Imaging and Graphics.
101883,ISSN 0895-6111.
18. S.M. Ashhar, Mokri, S. Salasiah, A.
Rahni. (Jan 2021)” Comparison of deep
learning convolutional neural network
(CNN) architectures for CT lung cancer
classification”, International Journal of
Advanced Technology and Engineering
Exploration; Bhopal Vol. 8, Iss. 74, ; 126-
134.
19. Winkels, M., & Cohen, T. S. (2019).
Pulmonary nodule detection in CT scans
with equivariant CNNs. Medical Image
Analysis, Medical Image Analysis, 55,
15–26.
20. Xie, H., Yang, D., Sun, N., Chen, Z., &
Zhang, Y. (2019). Automated pulmonary
nodule detection in CT images using deep

Vidyabharati International Interdisciplinary Research Journal (Special Issue) ISSN 2319-4979
Special Issue on Engineering Technologies and Management 3854
convolutional neural networks. Pattern
Recognition, 85, 109–119.
21. W. Zuo, F. Zhou, Z. Li and L. Wang,
(2019) "Multi-Resolution CNN and
Knowledge Transfer for Candidate
Classification in Lung Nodule Detection,"
in IEEE Access, vol. 7, pp. 32510-32521.
22. Asuntha A, and Srinivasan A 2020 Deep
learning for lung Cancer detection and
classification. Multimedia Tools and
Applications pp 1-32.
23. X. Huang, Q. Lei, T. Xie, Y. et al.”Deep
Transfer Convolutional Neural Network
and Extreme Learning Machine for lung
nodule diagnosis on CT images”,
Knowledge-Based Systems, Volume 204,
2020, 106230, ISSN 0950-7051.
Vidyabharati International Interdisciplinary Research Journal (Special Issue) ISSN 2319-4979
Special Issue on Engineering Technologies and Management 3854
AN EMPIRICAL RELATIONSHIP BETWEEN THE HAZEN-WILLIAMS AND DARCY-
WEISBACH EQUATIONS FOR FOUR TYPES OF PIPE MATERIAL
Abdulameer Layth Saeed Abdulameer1,2 Dzhumagulova Nazira Tentimishovna 3
1 Department of Hydraulics and Hydraulic Engineering, Moscow State University of Civil Engineering, PhD
student, Yaroslavskoe shosse, 26, [email protected] tel. Mob +7 (980) 0196506 2 Department of Petroleum Engineering, University of Kerbala, Assistant Lecture
3Department of Hydraulics and Hydraulic Engineering, Moscow State University of Civil Engineering,
Associate Professor, Yaroslavskoe shosse, 26, [email protected] tel. Mob +8 (926) 993 07 75
ABSTRACT
This article presents an empirical relationship between Darcy-Weisbach and Hazen-Williams equations for four types
of pipe materials (Ductile iron, GRP, concrete, and plastic) using WaterCAD V8i. Two hydraulic models have been
developed to estimate the head loss in pipes of different diameters (from 800 mm to 1200 mm) for the flow rate (1.16
𝑚3/s), (from 1600 mm to 2000 mm) for the flow rate (4. 63 𝑚3/s). The head loss values obtained from the Darcy-
Weisbach and Hazen-Williams equations were used to correlate them using IBM SPSS Statistics. The correlation
coefficient between both equations turned out to be equal (0.991, 0.990, 1.00, and 1.00) for pipe materials (Ductile
iron, GRP, concrete, and plastic). This relationship is very useful for designers in converting the head loss values
obtained using these equations.
Keywords: Hazen-Williams equation, Darcy-Weisbach equation, WaterCAD V8i, head loss, Correlation
coefficient.
INTRODUCTION
When designing systems for supplying and
removing water in pressure conduits, it is
necessary to know the hydraulic losses. This
is the basis for the subsequent selection of
pipe sizes and the necessary hydromechanical
equipment to ensure the operation of the
pipeline system [1]. The Hazen-Williams (H-
W) and Darcy-Weisbach (D-W) formulas are
the two most common drag equations for
pressurized flow. Although the application of
the former is quite widespread in practice, the
latter has a much more reasonable basis and is
acceptable in the academic literature [2] [3].
The empirical equation (H-W) uses a clear
factor (C) for each type of pipe material.
However, the coefficient of friction (f) of the
dimensionally consistent equation (D-W) is a
function of material property (absolute
roughness,) and Reynolds number (Re) in
turbulent flows, the most common flow
regime in water networks [4]. Consequently,
the manufacturer must verify the pipe
performance using both equations to assure
his customers that the product produced
meets all applicable codes and standards.
However, the frequency of using both
equations varies. As mentioned by Rossman
[5], equation (H-W) was developed only for
water and is applicable for a pipe in which a
turbulent flow is flowing, while equation (D-
W) is applicable for all flow regimes and can
be used for any type of fluid. However, the
(H-W) equation is fairly easy to use
compared to the other because all the
parameters involved are readily available in
the literature [6-13].
OBJECT OF THE STUDY
Find an empirical relationships
between the Hazen-Williams and Darcy-
Weisbach equations for various types of
project pipes for transporting treated
wastewater in the city of Karbala (Iraq) using
the WaterCAD V8i program.
The Hazen-Williams and Darcy-Weisbach
equations
The flow characteristics and frictional losses
of the pipe must be within the specified range
to make it suitable for commercial use.
Various equations are available in the
literature. For calculating pressure losses in
pipes. However, Darcy-Weisbach and Hazen-
Williams theory has gained widespread
acceptance in fluid mechanics due to its
proven accuracy compared to other equations.
Williams and Hazen (1933)
empirically derived the Equation and this
Formula is often used in the analysis of
pressure pipeline systems (such as water
distribution networks and sewers) [14]:

Vidyabharati International Interdisciplinary Research Journal (Special Issue) ISSN 2319-4979
Special Issue on Engineering Technologies and Management 3854
ℎ𝑓 =𝐾 𝐿
𝐷4.87(
𝑄
С)1.85
Eq.1
Where: ℎ𝑓- head loss (m), Q - section
flow rate (𝑚3/ s), C - Hazen-Williams
"capacity" coefficient, C value ranges from
80 for very coarse pipe to about 150 for
smooth pipe, k - Constant (0.85 for SI units,
1.32 for US units), D - Pipe diameter (m), L -
pipe length (m), g - gravitational acceleration
constant (m / s2).
Due to its non-empirical origin, the
Darcy-Weisbach equation is considered by
many engineers as the most accurate method
for modeling friction losses. Most often it
takes the following form:
ℎ𝑓 = 𝑓 𝐿
𝐷
𝑉2
2𝑔 Eq.2
Where: ℎ𝑓- head loss (m), f -
hydraulic resistance coefficient (Darcy-
Weissbach friction coefficient), D - Pipe
diameter (m), L - pipe length (m), V - flow
velocity (m / s), g - constant of gravitational
acceleration (m / s2).
We denote
𝑓 = 2 𝑓 (𝑅𝑒,∆
𝑑) Eq.3
𝑅𝑒 =𝜌𝑣𝑑
𝜇
Eq.4
Where: 𝑹𝒆 - Reynolds numbers
(dimensionless), 𝝆 - flow density (𝒌𝒈 / 𝒎𝟑),
𝑽 - average flow rate (𝒎 / 𝒔), d - length index
or pipe diameter (𝒎), 𝝁 - dynamic viscosity
(𝒌𝒈𝒎 /. 𝒔), ∆ - wall roughness (𝒎).
Recall that in the laminar flow regime:
𝑓 =64
𝑅𝑒
Eq.5
However, for the transitional and
turbulent flows for which Re ≥ 2000, friction
factor is the main issue in the (D-W)
equation. Colebrook (1939) proposed an
implicit equation (Eq. 6) for the solution of f,
which is known as Colebrook-White equation
that is recognized to be the most accurate for
the solution of Darcy’s friction factor
1
√𝑓= −2.0 𝑙𝑜𝑔 ( 𝐷⁄
3.72+
2.51
𝑅𝑒√𝑓)
Eq.6
where f is the friction factor
(dimensionless), ε is the roughness height, D
is the diameter of the pipe (m) and Re is
Reynolds Number (dimensionless).
Experiments show that the energy loss
in a turbulent fluid flow in pipes of constant
cross-section (i.e., frictional head loss) is
significantly higher than in a laminar one.
This increase in hydraulic losses is caused by
the formation of large vortices and their
disintegration, turbulent mixing of significant
masses of liquid and curvature of the
trajectories and streamlines of motion of
liquid particles. If, in a laminar flow regime,
friction head losses increase in proportion to
the velocity (and also to the flow rate) to the
first degree, then during the transition to the
turbulent regime, a certain jump in resistance
is noticeable and then a steeper increase in the
value of hf along a curve close to the second
degree parabola [1].
RESEARCH METHOD
Information has been collected on the
treated wastewater treatment plant in Karbala
(Iraq), where the current flow is 1.16 𝑚3/s,
and it is hoped that 4. 63 𝑚3/ s will complete
the construction of the sewer network for the
entire period. The two hydraulic models have
been designed with these flow rates in mind
and pipe diameters ranging from 800mm to
1200mm and 1600mm to 2000mm using
WaterCAD V8i software. The head loss was
estimated for each model for all considered
materials and pipe diameters. The Re values
calculated for the above flow conditions
ranged from 1050735 to 1584063 for the first
model and from 2905443 to 3645734 for the
second model, indicating that the flow was
turbulent in each model. This satisfies the
condition of applicability of both equations
(D-W) and (H-W), justifying a common basis
for comparing the results of both equations.
In addition, the head loss of the relationship
between the two equations was found using
IBM SPSS Statistics. As shown in the
following picture:
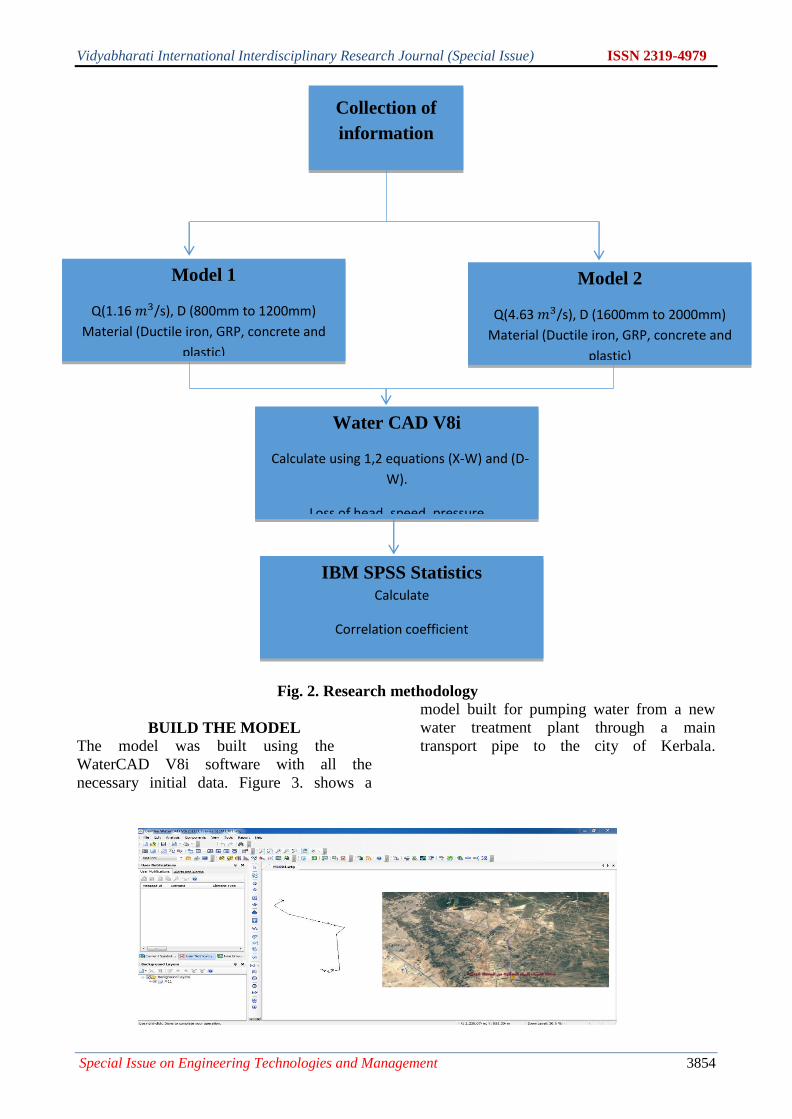
Vidyabharati International Interdisciplinary Research Journal (Special Issue) ISSN 2319-4979
Special Issue on Engineering Technologies and Management 3854
Fig. 2. Research methodology
BUILD THE MODEL
The model was built using the
WaterCAD V8i software with all the
necessary initial data. Figure 3. shows a
model built for pumping water from a new
water treatment plant through a main
transport pipe to the city of Kerbala.
Collection of
information
Model 1
Q(1.16 𝑚3/s), D (800mm to 1200mm)
Material (Ductile iron, GRP, concrete and
plastic)
Model 2
Q(4.63 𝑚3/s), D (1600mm to 2000mm)
Material (Ductile iron, GRP, concrete and
plastic)
Water CAD V8i
Calculate using 1,2 equations (X-W) and (D-
W).
Loss of head, speed, pressure
IBM SPSS Statistics
Calculate
Correlation coefficient
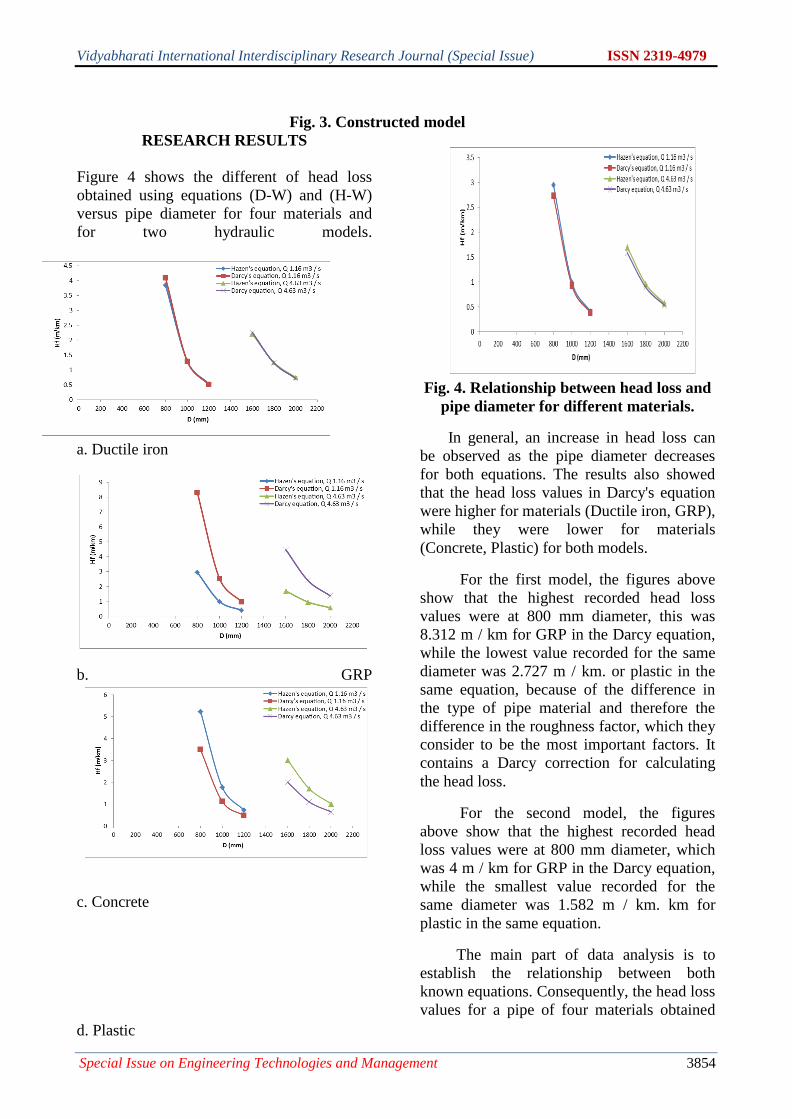
Vidyabharati International Interdisciplinary Research Journal (Special Issue) ISSN 2319-4979
Special Issue on Engineering Technologies and Management 3854
Fig. 3. Constructed model
RESEARCH RESULTS
Figure 4 shows the different of head loss
obtained using equations (D-W) and (H-W)
versus pipe diameter for four materials and
for two hydraulic models.
a. Ductile iron
b. GRP
c. Concrete
d. Plastic
Fig. 4. Relationship between head loss and
pipe diameter for different materials.
In general, an increase in head loss can
be observed as the pipe diameter decreases
for both equations. The results also showed
that the head loss values in Darcy's equation
were higher for materials (Ductile iron, GRP),
while they were lower for materials
(Concrete, Plastic) for both models.
For the first model, the figures above
show that the highest recorded head loss
values were at 800 mm diameter, this was
8.312 m / km for GRP in the Darcy equation,
while the lowest value recorded for the same
diameter was 2.727 m / km. or plastic in the
same equation, because of the difference in
the type of pipe material and therefore the
difference in the roughness factor, which they
consider to be the most important factors. It
contains a Darcy correction for calculating
the head loss.
For the second model, the figures
above show that the highest recorded head
loss values were at 800 mm diameter, which
was 4 m / km for GRP in the Darcy equation,
while the smallest value recorded for the
same diameter was 1.582 m / km. km for
plastic in the same equation.
The main part of data analysis is to
establish the relationship between both
known equations. Consequently, the head loss
values for a pipe of four materials obtained
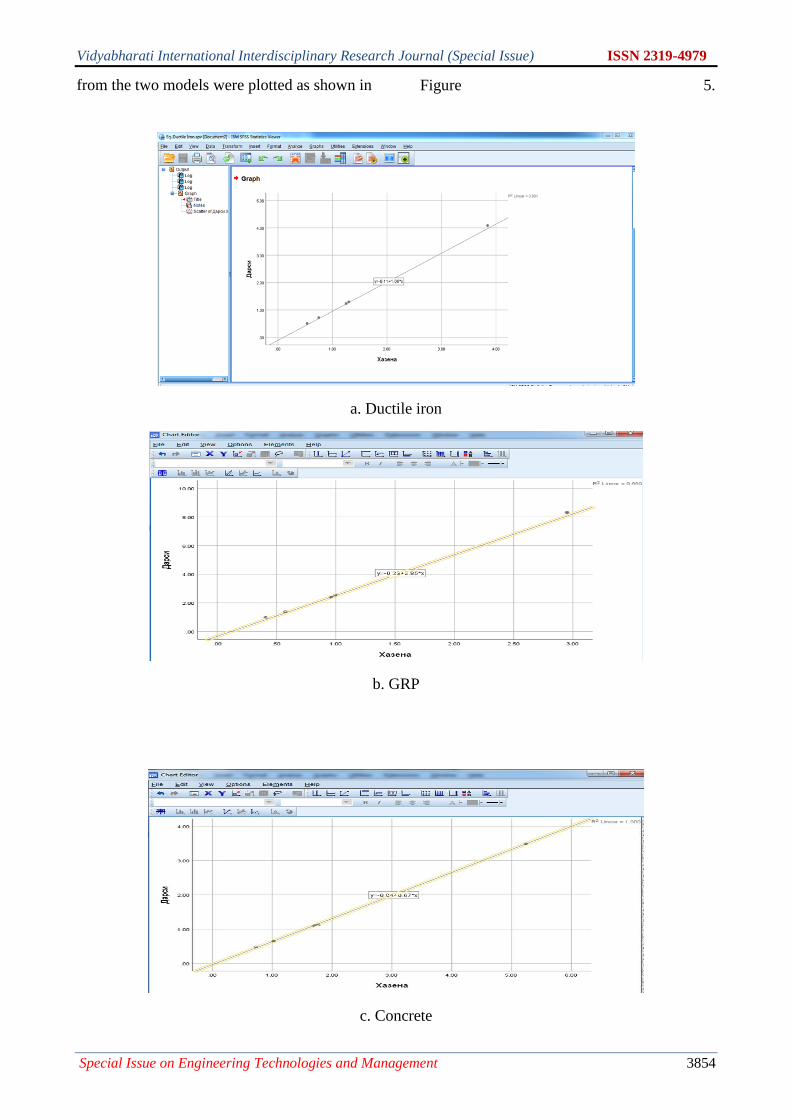
Vidyabharati International Interdisciplinary Research Journal (Special Issue) ISSN 2319-4979
Special Issue on Engineering Technologies and Management 3854
from the two models were plotted as shown in Figure 5.
a. Ductile iron
b. GRP
c. Concrete

Vidyabharati International Interdisciplinary Research Journal (Special Issue) ISSN 2319-4979
Special Issue on Engineering Technologies and Management 3854
d. Plastic
Рис.5. Darcy-Weisbach equation vs. Hazen-Williams
It has been noticed that the values are very
accurate, close to each other and follow a
certain pattern. Direction plotted for the
scatter line, whose equation was obtained
using the IBM SPSS Statistics program:
For ductile iron
𝑦 = 0.11 + 1.06 ∗ 𝑥 Eq.7
Equation (7) can be rewritten in terms of the
studied variables as: (D-W) and (H-W)
(D − W) = 0.11 + 1.06 ∗ (H − W) Eq.8
The same is with the rest of the pipe
materials.
For GRP (D − W) = 0.33 + 2.85 ∗(H − W)
Eq.9
For concert (D − W) = 0.04 + 0.67 ∗(H − W) Eq.10
For Plastic (D − W) = 7.21𝐸 − 3 +0.92 ∗ (H − W) Eq.11
where (D-V) and (H-V) are the head
losses in meters. per kilometer (m / km) of
pipe obtained by the Darcy-Weisbach and
Hazen-Williams equations, respectively.
Equations (8-11) are an empirical relationship
that will evolve in the current research. The
trend line 𝑅2 was found to be (0.991, 0.990,
1.00 and 1.00) for pipe materials (Ductile
iron, GRP, concrete and plastic), indicating
excellent statistical accuracy.
CONCLUSION
An empirical relationship between
Darcy-Weissbach (D-W) and Hazen Williams
(H-W). The equation was developed using
four types of pipe materials. The data for
establishing the proposed relationship was
obtained from hydraulic models designed to
match pipe diameters from 800 to 2000 mm
for the two models and flow rates (1.16 𝑚3/ s,
4. 63 𝑚3 / s). A unique feature of this ratio is
that it can be used to directly determine the
head loss obtained using Equation (D-W)
without calculating the friction coefficient
and Reynolds number when the
corresponding value from Equation (H-W) is
available for similar flow parameters. This
feature simplifies the job of pipe
manufacturers and related industries.
REFERENCES
1. A.L. Zuikov. Hydraulics, Volume 2,
Pressure and Open Flows. // textbook for
students of higher educational institutions.
2015.Travis, Q. B., Mays, L. W.

Vidyabharati International Interdisciplinary Research Journal (Special Issue) ISSN 2319-4979
Special Issue on Engineering Technologies and Management 3854
Relationship between Hazen–William and
Colebrook–White Roughness Values. //J
Hydraul Eng. 2007. 133(11): 1270-1273.
2. Elhay, S., Simpson, A. R.,. Dealing with
zero flows in solving the nonlinear
equations for water distribution systems.
//J Hydraul Eng. 2011. 137(10): 1216–
1224.
3. M. Niazkar, N. Talebbeydokhti and S.H.
Afzali. Relationship between Hazen-
William coefficient and Colebrook-White
friction factor: Application in water
network analysis. // European Water 58:
513-520, 2017.
4. Rossman LA EPANET 2 User’s
Manual.Water Supply and Water
Resources Division, National Risk
Management Research Laboratory,
USEPA, Cincinnati OH. 2000.
5. Liou CP Limitation and Proper Use of the
Hazem-Williams Equation, Journal of
Hydrauic Engineering. 1998. 124 (9):
951-954.
6. John D. Valiantzas. Modified Hazen–
Williams and Darcy–Weisbach Equations
for Friction and Local Head Losses along
Irrigation Laterals. //J. Irrig. Drain Eng.
2005.131:342-350.
7. Rehan Jamil and M. Abdul Mujeebu.
Empirical Relation between Hazen-
Williams and Darcy-Weisbach Equations
for Cold and Hot Water Flow in Plastic
Pipes. // WATER 10, 104-114 February 1,
2019
8. King Kuok Kuok, Po Chan Chiu, Danny
Chee Ming Ting. Evaluation of “C”
Values to Head Loss and Water Pressure
Due to Pipe Aging: Case Study of Uni-
Central Sarawak. //Journal of Water
Resource and Protection, 2020, 12, 1077-
1088.
9. Saeed Hashemi; Yves Filion, M.ASCE;
Vanessa Speight; and Andrew Long.
Effect of Pipe Size and Location on
Water-Main Head Loss in Water
Distribution Systems. //J. Water Resour.
Plann. Manage., 2020, 146(6): 06020006.
10. John D. Valiantzas. Explicit Power
Formula for the Darcy–Weisbach Pipe
Flow Equation: Application in Optimal
Pipeline Design. //J. Irrig. Drain Eng.
2008.134:454-461.
11. ACHOUR B., AMARA L. NEW
FORMULATION OF THE DARCY-
WEISBACH FRICTION FACTOR.
//Larhyss Journal, ISSN 1112-3680, n°43,
Sept 2020, pp. 13-22.
12. Angus Simpson, M.ASCE; and Sylvan
Elhay. Jacobian Matrix for Solving Water
Distribution System Equations with the
Darcy-Weisbach Head-Loss Model. //J.
Hydraul. Eng. 2011.137:696-700.
13. http://www.haestad.com. Water CAD
User’s Guide. 2002.
Vidyabharati International Interdisciplinary Research Journal (Special Issue) ISSN 2319-4979
Special Issue on Engineering Technologies and Management 3854
A MULTI BAND CONFORMAL MICROSTRIP PATCH ANTENNA WITH 7X1 ARRAY
FOR X BAND APPLICATIONS
1K.Sumalata, 2Dr.CH.R Phani Kumar
1Research Scholar, Department of EECE, GITAM Deemed to be University, Visakhapatnam 2Assistant Professor, Department of EECE, GITAM Deemed to be University, Visakhapatnam
ABSTRACT
A conformal array antenna for multi band applications is designed and simulated for various applications in X band.
The antenna is designed with a rectangular patch, and then it has iterated with a 7X 1 array in order to achieve the
multi band properties. The antenna is designed using four different substrate materials and the best antenna is
considered for the X band. The antenna is tested using various substrates which are fr4_Epoxy, Rogers RT duroid
5880tm, Rogers 4003 and Rogers 3003. The simulation is carried out using HFSS v15 and the conformal is tested using
10,30 and 60 degrees respectively. The antenna possess a good return loss, vswr and high gain with multiple
resonating points.
Index Terms—antenna, radial-waveguide, conformal array, X band.
INTRODUCTION
Multiple Input Multiple output is an
enhancement and it is originally designed for
wireless communication where the
information can be trans-received using the
mobile technology. Later the trend changes
and many applications evolved where the
MIMO is dominated, the areas are like radar
technology for vehicle tracking, bio medical,
miniature communication, ball tracking and
various other applications. This system is
fabricated using multiple antennas in various
designs and in matrix formats for more
comfortable and compatible in nature. The
basic idea is to improve the quality of
communication and make the antenna
conformal such that it can be placed at any
surface. Antennas are designed in such a way
that the electromagnetic distribution is done
in a very much better way and can be used for
multiple applications. In this paper we will
discuss about the conformal antenna which is
best suitable for X band with the operating
resonance frequency of 10GHz.
The basic idea for making the antenna as a
conformal is because the antenna can be
placed on the base of the carrier without
disturbing the dimensions of it nor the
structural imbalance. This proposed antenna
is considered as one of the prominent antenna
in the field of vehicular communication, WiFi
and LORA. This antenna structure can be
implemented on any surface and at any
heights depending on the applications. The
antenna performance is not at all effected due
to environmental conditions such as snow,
fog, dust and heavy rain.
This paper present a proposed conformal
antenna which uses the concept of MIMO and
can be used in 5G futuristic frequencies. The
antenna is tested on band of frequency from
9.5GHz to 10.5GHz. The antenna is designed
and simulated using HFSSv18. Proposed
Antenna is an conformal in nature antenna
with cylindrical in shape and the carrier axis
and the patch are configured with the angle of
inclination with 65 degrees. The antennas are
designed using 1X5 patch pattern which can
be helpful to increase the major lobe, total
gain and VSWR.
Related Work
The basic element in the conformal structure
is a regular rectangular patch antenna, which
is most of the time attributed as radiation
element. The first step always starts with the
mathematical analysis of the antenna with
reference to the selection of operating
frequency and the substrates used in the
design.
The author [1] proposed an antenna which is
used to maximise the wireless channel link in
vehicular networks. The antenna design is a
state of the art which has a combination of
patch antenna with various PIN diodes which
are used to provide multi band operations for
the frequencies which ranges from 2GHz to
12GHz. Three different stages were
implemented with a pair of diodes which are
used to switch the frequencies and provide

Vidyabharati International Interdisciplinary Research Journal (Special Issue) ISSN 2319-4979
Special Issue on Engineering Technologies and Management 3854
multi band applications. Eight antennas were
designed such that the gain can be optimized
for the said frequencies. FR4 substrate was
used with each antenna unit set to a
dimension of 30 X 30 mm. The gain was
greater than 1.8dBi throughout theoperational
bandwidth and efficiency greater than 86%
under Ultra wide band mode.
The author [2] proposed an antenna which is
conformal in nature and can be placed on a
windshield of a vehicle. The proposed
frequency band is at 1.575GHz and can be
used for Global Positioning System (G.P.S).
Sputtering and electroplating is used as a
substrate to achieve low VSWR and good
reflection coefficient. Antenna was tested by
placing at three different places on the
vehicle, front, rear windshield and rear
quarter respectively. A angle of 60 degrees
conformal was achieved with good reflection
coefficient of about -38dB.
The author [3] proposed low-profile dual-
band antenna with different polarization and
radiation properties over two bands for
vehicular communications. A fully functional
prototype was designed and tested at the
frequency ranging from 3.54GHz to
4.40GHz. Two circular patches are used
along with a rectangular patch as two layer
design which was implemented on a vehicle
for communicating with another vehicle. The
antenna possess a good gain with Uni-
directional circular polarization and
omnidirectional linear polarization.
The author [4] proposes aregular hexagon
broadband micro-strip antenna with a
frequency band of 4.74GHz to 6.79GHz for
the existing Vehicle to Vehicle
communication. It acquires an Omni
directional pattern whose out of roundness is
less than 0.5dB. Three major V cuts and three
minor V cuts were introduced on the patch to
make the antenna work for broad band which
incorporates WiFi, GPS and LTE on it. The
substrate thickness was kept to 3mm as it was
proposed to be placed on the roof of the
vehicle. The antenna was tested on
AgilentTechnologies N5242A vector network
analyser for the said frequencies and it
possess a very good reflection coefficient and
gain.
The author [5] discuss about the vehicular
technology and how in the real time scenario
as number of vehicles with vehicular
communication increases, their exist fading of
the signal at the road side unit (RSU). Two
models were proposed which are constant
correlation (CC) and exponential correlation
(EC). The paper also discuss about how the
cooperation takes place between the vehicles
using single helperselection (SHS), multi-hop
cooperative selection (MCS) and multiple
helper selection (MHS). These techniques are
used to transfer the information from one
vehicle to the road side unit with the help of
other vehicles.
The packet error probability was considered
using the correlation of antenna gain at road
side unit, which implies that if the gain of the
antenna is around 3dB, the error probability
will be less.
The author [6] proposed a low cost, compact
conformal antenna for vehicular
communications applications with good gain
and the material used to fabricate the antenna
was poly vinyl chloride with a dimensions of
55mm X 40mmX 3mm. The antenna is used
for various applications under 4G
environment. The antenna was based on
fractal geometry with various iterations made
for calculating the antenna parameters. The
maximum bend angle was up-to 120 degrees
and tested for the frequency ranging from
1.8GHz to 6.4GHz.
The author [7] proposed a dual band full
duplex antenna design for vehicular
communications with two ports of antenna,
one for transmitting and one for receiving.
Two duplex channels of 4.58-4.83GHz and
5.86-6.2GHz were used. Hairpin patch
antenna was used with six resonators which
were used to provide better characteristics of
the antenna. A 2x2 full duplex mode was
fabricated with two ports with a frequency
ranging from 4.4GHz to 6.6GHz.
The author [8] proposed a wide band 3D
antenna for roof top vehicles with a unique
design which can be used for LTE
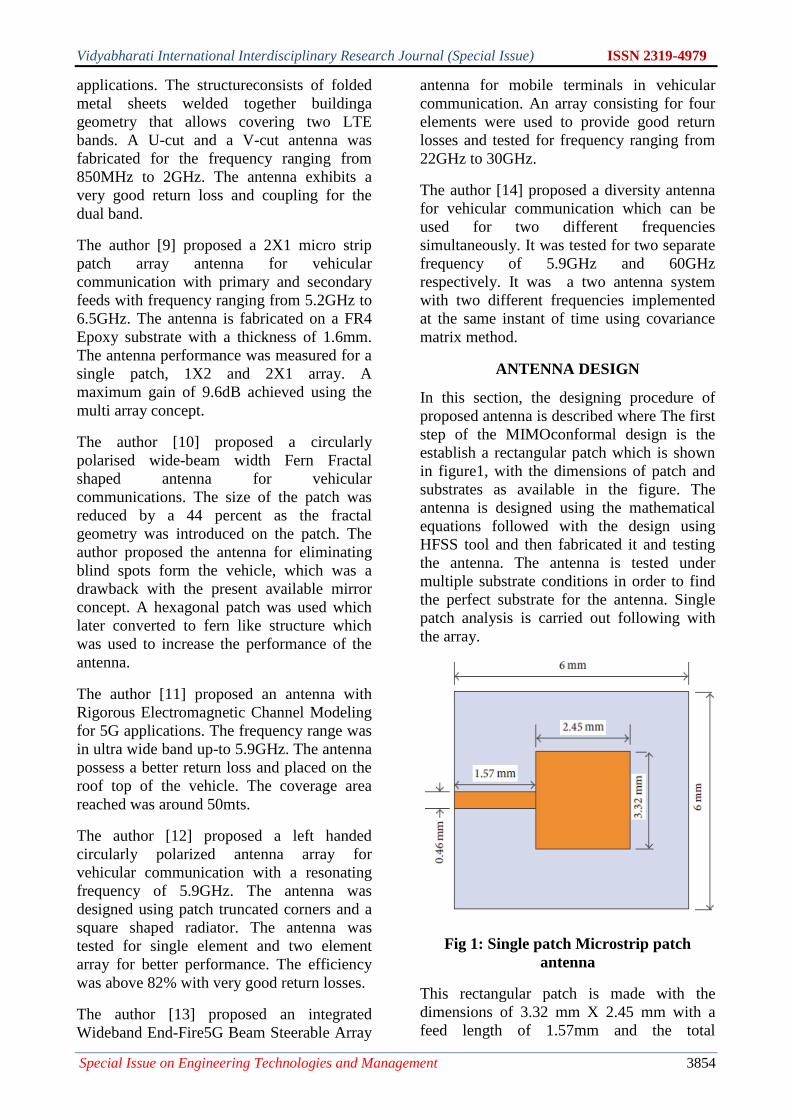
Vidyabharati International Interdisciplinary Research Journal (Special Issue) ISSN 2319-4979
Special Issue on Engineering Technologies and Management 3854
applications. The structureconsists of folded
metal sheets welded together buildinga
geometry that allows covering two LTE
bands. A U-cut and a V-cut antenna was
fabricated for the frequency ranging from
850MHz to 2GHz. The antenna exhibits a
very good return loss and coupling for the
dual band.
The author [9] proposed a 2X1 micro strip
patch array antenna for vehicular
communication with primary and secondary
feeds with frequency ranging from 5.2GHz to
6.5GHz. The antenna is fabricated on a FR4
Epoxy substrate with a thickness of 1.6mm.
The antenna performance was measured for a
single patch, 1X2 and 2X1 array. A
maximum gain of 9.6dB achieved using the
multi array concept.
The author [10] proposed a circularly
polarised wide-beam width Fern Fractal
shaped antenna for vehicular
communications. The size of the patch was
reduced by a 44 percent as the fractal
geometry was introduced on the patch. The
author proposed the antenna for eliminating
blind spots form the vehicle, which was a
drawback with the present available mirror
concept. A hexagonal patch was used which
later converted to fern like structure which
was used to increase the performance of the
antenna.
The author [11] proposed an antenna with
Rigorous Electromagnetic Channel Modeling
for 5G applications. The frequency range was
in ultra wide band up-to 5.9GHz. The antenna
possess a better return loss and placed on the
roof top of the vehicle. The coverage area
reached was around 50mts.
The author [12] proposed a left handed
circularly polarized antenna array for
vehicular communication with a resonating
frequency of 5.9GHz. The antenna was
designed using patch truncated corners and a
square shaped radiator. The antenna was
tested for single element and two element
array for better performance. The efficiency
was above 82% with very good return losses.
The author [13] proposed an integrated
Wideband End-Fire5G Beam Steerable Array
antenna for mobile terminals in vehicular
communication. An array consisting for four
elements were used to provide good return
losses and tested for frequency ranging from
22GHz to 30GHz.
The author [14] proposed a diversity antenna
for vehicular communication which can be
used for two different frequencies
simultaneously. It was tested for two separate
frequency of 5.9GHz and 60GHz
respectively. It was a two antenna system
with two different frequencies implemented
at the same instant of time using covariance
matrix method.
ANTENNA DESIGN
In this section, the designing procedure of
proposed antenna is described where The first
step of the MIMOconformal design is the
establish a rectangular patch which is shown
in figure1, with the dimensions of patch and
substrates as available in the figure. The
antenna is designed using the mathematical
equations followed with the design using
HFSS tool and then fabricated it and testing
the antenna. The antenna is tested under
multiple substrate conditions in order to find
the perfect substrate for the antenna. Single
patch analysis is carried out following with
the array.
Fig 1: Single patch Microstrip patch
antenna
This rectangular patch is made with the
dimensions of 3.32 mm X 2.45 mm with a
feed length of 1.57mm and the total

Vidyabharati International Interdisciplinary Research Journal (Special Issue) ISSN 2319-4979
Special Issue on Engineering Technologies and Management 3854
dimension of each patch is 6mm X 6mm. The
next step with the patch antenna is designing
an array with five elements. These elements
are placed as a conformal in structure. The
array figure is shown below.
Fig2: 7X1Array Microstrip patch antenna
𝑊and𝐿 of the patch are adjusted while the
simulation process is carried out in order to
provide a proper design for the array. The
size of the patch directly provides an impact
on resonant frequency, and ground mainly
affects impedance matching of the antenna
with the feed line. Through simulation and
optimization, we get that𝑊 = 3.32mm and 𝐿
= 2.45mm, the width of feed line𝑤 =
0.46mm, and the centre of the feed line is
midpoint of𝑊.The dimensions are provided
in Table 1
Table 1: Dimensions and Parameters
Paramete
rs
Dimensio
ns
Paramete
rs
Dimensio
ns
R1 1.8 X 2.2 R6 2.1 X 2.6
R2 2.1 X 2.6 R7 1.8 X 2.2
R3 2.5 X 2.9 Substrate 26 X 48
X0.25
R4 3.2 X 3.5 U-Shape 1 X 1
R5 2.5 X 2.9 Ground 26 X 48
The antenna is designed using the conformity
which means the antenna can be folded
according to the surface placed on the
element. The antenna is simulated with the
angle rate from zero, fifteen, forty-five, sixty
and ninety degrees. The antenna is flipped
using the angular mode of HFSS with a
cylindrical structure placed and the patch is
placed on the curved substrate in order to
simulate for obtaining the conformal nature.
Figure 3 provides the analysis of the antenna
for various bend angles and the substrate in
conformal nature.
Fig3: Antenna using conformal in structure
The antenna is simulated in HFSS v15 and
the simulation discussion is done in the
matter of return loss, vswr, total gain and
radiation patter for various substrate and
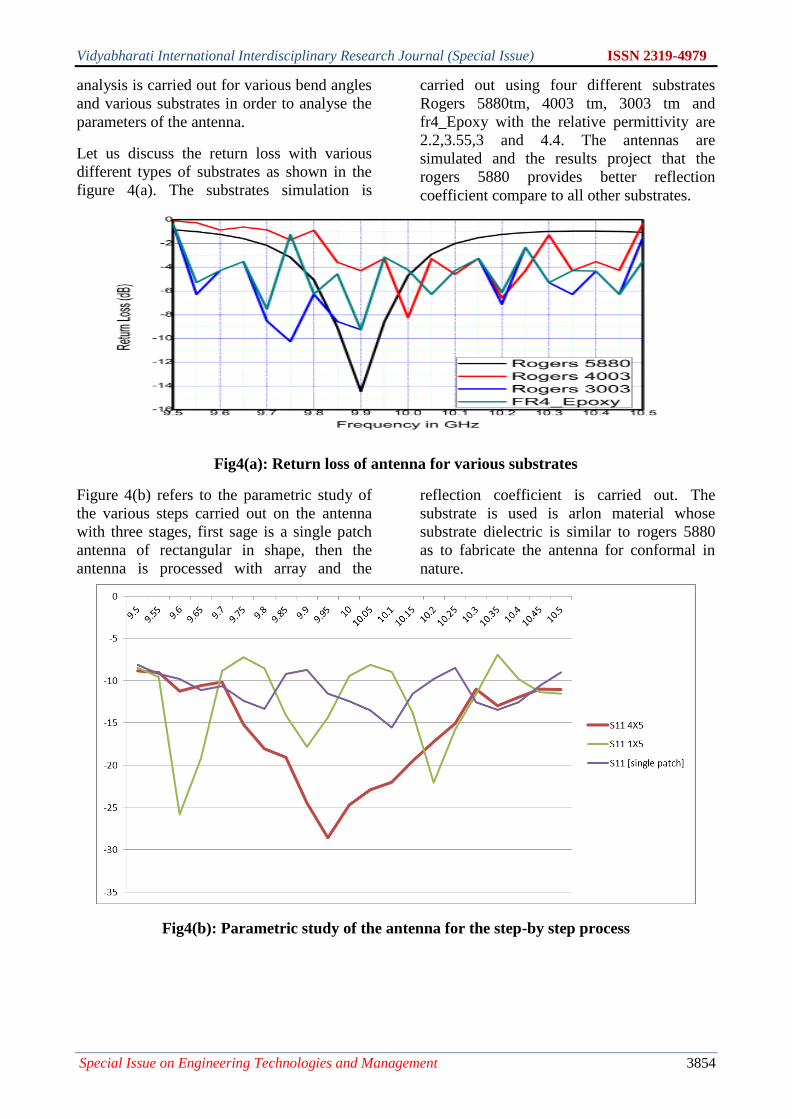
Vidyabharati International Interdisciplinary Research Journal (Special Issue) ISSN 2319-4979
Special Issue on Engineering Technologies and Management 3854
analysis is carried out for various bend angles
and various substrates in order to analyse the
parameters of the antenna.
Let us discuss the return loss with various
different types of substrates as shown in the
figure 4(a). The substrates simulation is
carried out using four different substrates
Rogers 5880tm, 4003 tm, 3003 tm and
fr4_Epoxy with the relative permittivity are
2.2,3.55,3 and 4.4. The antennas are
simulated and the results project that the
rogers 5880 provides better reflection
coefficient compare to all other substrates.
Fig4(a): Return loss of antenna for various substrates
Figure 4(b) refers to the parametric study of
the various steps carried out on the antenna
with three stages, first sage is a single patch
antenna of rectangular in shape, then the
antenna is processed with array and the
reflection coefficient is carried out. The
substrate is used is arlon material whose
substrate dielectric is similar to rogers 5880
as to fabricate the antenna for conformal in
nature.
Fig4(b): Parametric study of the antenna for the step-by step process

Vidyabharati International Interdisciplinary Research Journal (Special Issue) ISSN 2319-4979
Special Issue on Engineering Technologies and Management 3854
Fig5:vswr of antenna for various substrates
The standing wave ratio for any antenna will
be 4dB or less than the value, and in the
figure 5 it is clearly mentioned that the 5880
material possesses a very good voltage
standing wave ration and it is 30% less than
the rest of the material, due to which the
selection of material depends on the
simulation results can be decided. The
minimum vswr recorded is 1.01dB compare
to the rest of the materials at the resonating
frequency of 10GHz.
Gain Is one of the key factor in order to
decide the performance of the antenna for any
specific application, and as per the simulation
of the proposed antenna is concerned, better
gain is obtained at the resonating frequency,
making the antenna all the three parameters
successful in order to calculate the significant
bandwidth as to make the significance, it is
very important to keep the antenna reflection
coefficient less than -10dB and vswr less than
4dB and making the gain more than 3dB. The
maximum gain achieved is 4dB at the
resonating frequency as per the figure 6 using
3D plot, which is similar to the actual
performance of the antenna .The maximum
gain achieved is 4dB with a bandwidth of
700MHz as shown in the below figure 6, and
the specific bandwidth can be used for any
application related to X band.
Fig 6: Gain of the antenna achieved in the form of 3D plot
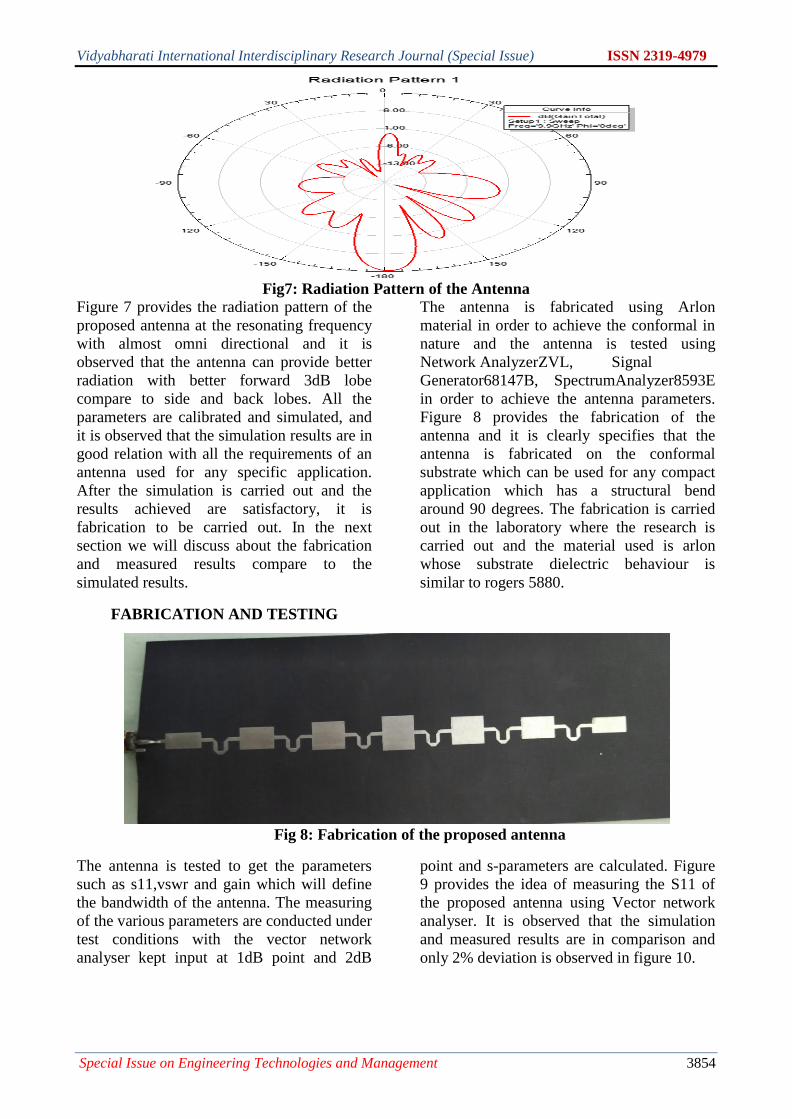
Vidyabharati International Interdisciplinary Research Journal (Special Issue) ISSN 2319-4979
Special Issue on Engineering Technologies and Management 3854
Fig7: Radiation Pattern of the Antenna
Figure 7 provides the radiation pattern of the
proposed antenna at the resonating frequency
with almost omni directional and it is
observed that the antenna can provide better
radiation with better forward 3dB lobe
compare to side and back lobes. All the
parameters are calibrated and simulated, and
it is observed that the simulation results are in
good relation with all the requirements of an
antenna used for any specific application.
After the simulation is carried out and the
results achieved are satisfactory, it is
fabrication to be carried out. In the next
section we will discuss about the fabrication
and measured results compare to the
simulated results.
FABRICATION AND TESTING
The antenna is fabricated using Arlon
material in order to achieve the conformal in
nature and the antenna is tested using
Network AnalyzerZVL, Signal
Generator68147B, SpectrumAnalyzer8593E
in order to achieve the antenna parameters.
Figure 8 provides the fabrication of the
antenna and it is clearly specifies that the
antenna is fabricated on the conformal
substrate which can be used for any compact
application which has a structural bend
around 90 degrees. The fabrication is carried
out in the laboratory where the research is
carried out and the material used is arlon
whose substrate dielectric behaviour is
similar to rogers 5880.
Fig 8: Fabrication of the proposed antenna
The antenna is tested to get the parameters
such as s11,vswr and gain which will define
the bandwidth of the antenna. The measuring
of the various parameters are conducted under
test conditions with the vector network
analyser kept input at 1dB point and 2dB
point and s-parameters are calculated. Figure
9 provides the idea of measuring the S11 of
the proposed antenna using Vector network
analyser. It is observed that the simulation
and measured results are in comparison and
only 2% deviation is observed in figure 10.
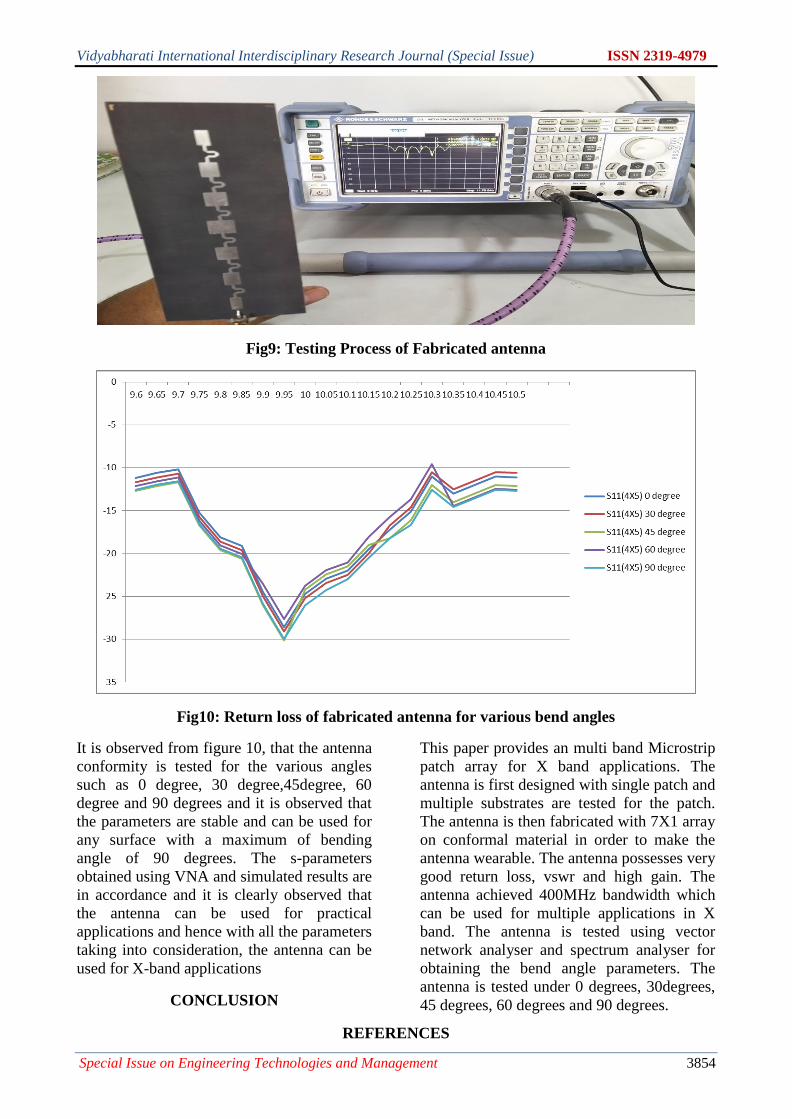
Vidyabharati International Interdisciplinary Research Journal (Special Issue) ISSN 2319-4979
Special Issue on Engineering Technologies and Management 3854
Fig9: Testing Process of Fabricated antenna
Fig10: Return loss of fabricated antenna for various bend angles
It is observed from figure 10, that the antenna
conformity is tested for the various angles
such as 0 degree, 30 degree,45degree, 60
degree and 90 degrees and it is observed that
the parameters are stable and can be used for
any surface with a maximum of bending
angle of 90 degrees. The s-parameters
obtained using VNA and simulated results are
in accordance and it is clearly observed that
the antenna can be used for practical
applications and hence with all the parameters
taking into consideration, the antenna can be
used for X-band applications
CONCLUSION
This paper provides an multi band Microstrip
patch array for X band applications. The
antenna is first designed with single patch and
multiple substrates are tested for the patch.
The antenna is then fabricated with 7X1 array
on conformal material in order to make the
antenna wearable. The antenna possesses very
good return loss, vswr and high gain. The
antenna achieved 400MHz bandwidth which
can be used for multiple applications in X
band. The antenna is tested using vector
network analyser and spectrum analyser for
obtaining the bend angle parameters. The
antenna is tested under 0 degrees, 30degrees,
45 degrees, 60 degrees and 90 degrees.
REFERENCES
Vidyabharati International Interdisciplinary Research Journal (Special Issue) ISSN 2319-4979
Special Issue on Engineering Technologies and Management 3854
1. Malik P.K., Parthasarthy, H., Tripathi,
M.P.: Alternative mathematical design of
vector potential and radiated fields for
parabolic reflector surface. In:
Unnikrishnan, S., Surve, S., Bhoir, D.
(eds.) Advances in Computing,
Communication, and Control. ICAC3
2013.Communications in Computer and
Information Science, vol. 361. Springer,
Berlin, Heidelberg (2013)
2. N. Wolff, S. Chevtchenko, A. Wentzel, O.
Bengtsson and W. Heinrich, "Switch-
Type Modulators and PAs for Efficient
Transmitters in the 5G Wireless
Infrastructure," 2018 IEEE MTT-S
International Microwave Workshop
Series on 5G Hardware and System
Technologies (IMWS-5G), Dublin, 2018,
pp. 1-3.doi: 10.1109/IMWS-
5G.2018.8484690
3. Rahim, A., Malik, P.K.,
SankarPonnapalli, V.A.: Fractal antenna
design for overtaking on highways in 5g
vehicular communication ad-hoc
networks environment. Int. J. Eng. Adv.
Technol. (IJEAT). ISSN: 2249–8958,
9(1S6), 157–160 (2019)
4. Malik, P.K., Tripathi M.P.: OFDM: A
Mathematical Review. J. Today’s Ideas–
Tomorrow’s Technol. 5(2), 97–111
(2017)
5. Arif, A., Zubair, M., Ali, M., Khan, M.U.,
Mehmood, M.Q.: A compact, low- profile
fractal antenna for wearable on-body
WBAN applications. IEEE Antennas
Wirel.Propag.Lett. 18(5), 981–985(2019)
6. Rahim A., Malik P.K., SankarPonnapalli
V.A. (2020) State of the Art: A Review
on Vehicular Communications, Impact of
5G, Fractal Antennas for Future
Communication. In: Singh P., Pawłowski
W., Tanwar S., Kumar N., Rodrigues J.,
Obaidat M. (eds) Proceedings of First
International Conference on Computing,
Communications, and Cyber-Security
(IC4S 2019). Lecture Notes in Networks
and Systems, vol 121. Springer,
Singapore. https://doi.org/10.1007/978-
981-15- 3369-3_1
7. Singh, P.K., Nandi, S.K., Nandi, S.: A
tutorial survey on vehicular
communication state of the art, and future
research directions. Veh.Commun.18,
100164 (2019). ISSN 2214-2096
8. Madhav, B.T.P., Anilkumar, T.,
Kotamraju, S.K.: Transparent and
conformal wheel-shaped fractal antenna
for vehicular communication applications.
AEU—Int. J. Electron.Commun. 91, 1–10
(2018)
9. Abdul Rahim,Praveenkumar Malik,
Analysis and design of fractal antenna for
efficient communication network in
vehicular model, Sustainable Computing:
Informatics and systems, Volume 31,
100586, ISSN 2210-5379.
10. [10] Malik, P.K., Singh, M.: Multiple
bandwidth design of micro strip antenna
for future wireless communication. Int. J.
Recent Technol.Eng. 8(2) (2019). ISSN:
2277-3878
11. Kumar, A., Gupta, M.: A review on
activities of fifth generation mobile
communication system. Alexandria Eng.
J. 57(2), 1125–1135 (2018)
12. Rahim, A., Raghavendra, K., International
Journal of Engineering and Advanced
Technology, 2019, 8(6 Special Issue 3),
pp. 1813–1816
13. Abdul Rahim, Dr.Praveen Kumar Malik,
Analysis and Design of Planner Wide
Band Antenna for Wireless
Communication Applications: Fractal
Antennas, Design Methodologies and
Tools for 5G Network Development and
Application, IGI Global,page196-208.
14. W. Cao, L. Ma, S. Li, C. Zhou, and Y.
Liu, "Conformal multi-beamdirectional
array antenna," in 2016 11th International
Symposium onAntennas, Propagation and
EM Theory (ISAPE), 2016, pp. 315-317.
15. Abdul Rahim , Dr.Praveen Kumar Malik
and Dr.V.A.SankarPonnapalli, Design
and Analysis of Multi Band Fractal
Antenna for 5G Vehicular
Communication, Test Engineering and
Management,volume 83,pg26487 –
26497, March-April 2020
Vidyabharati International Interdisciplinary Research Journal (Special Issue) ISSN 2319-4979
Special Issue on Engineering Technologies and Management 3854
NODAL PRICING CALCULATION IN DISTRIBUTED ENVIRONMENT WITH ZIP
LOAD
Sapna Ladwal1, Anil Kumar2
1Scholar, Department, of Electrical Engineering, Deen Bandhu Chhotu Ram University of Science and
Technology, Murthal(Sonipat), Haryana, INDIA. [email protected] 2Assistant professor, Department of Electrical Engineering,
Deen Bandhu Chhotu Ram University of Science and Technology, Murthal(Sonipat), Haryana, INDIA.
ABSTRACT
Distributed environment in power system is one of the factors to adopt the real time pricing structure for efficient
operation of distribution networks. It is the distribution network operator’s key responsibility to determine the real time
prices based tariff structure for smart distribution systems. The prices must take into account the effect of load and be
based on the change in the operating state of the system. The main contributions of the paper are: (i) Nodal prices
determination in the presence of harmonic and ZIP load, (ii) impact of Solar (PV) based DG on nodal prices. The
method uses marginal loss coefficients (MLCs) to obtain the nodal prices at each bus. The results are obtained for
IEEE 33 bus test system and compared with realistic ZIP and Normal or constant power (CP) loads.
Keywords: Distribution system, load model, harmonic load, nodal prices, solar (PV) based DG.
Introduction
The distribution system is a crucial element
of connecting the consumers to the power
supply and provides many vital services viz.
Grid connection, metering and billing
services, power delivery, reliability, Standby
service, supplemental service, Ancillary
services, power factor correction and other
power quality services, access to markets for
the sale of supply [1]. Competitive electricity
market sustainability and market efficiency
are dependent on the transparent pricing
structure. It is observed that the techniques
used for the transmission pricing can also be
applied to the distribution system, such as
nodal pricing, which is an efficient method
for calculation of the marginal cost of energy
along with the marginal cost of losses [4]. A
dispersed generation is considered to allocate
the losses using marginal loss coefficients and
direct loss coefficients to determine the nodal
price [5]. Distributed environment have
become an essential part of the distribution
network due to environmental constraints and
regulatory policies worldwide, and it is
essential to determine their impact on the
prices at the nodes. Authors in [9] studied the
impact of renewable energy integration on
nodal prices considering the effect of loads
that normally operate a fraction of a 24 hour
period. Loads that normally operate a fraction
of a 24 hour period usually called intermittent
load. Nodal pricing based method is also used
for the location of DG as discussed in [16]. In
[2] the solar energy generation according to
the demand side and nodal price is found by
OPF formulation.
European study says it is essential to improve
the implementation of zonal pricing before
searching into the introduction of nodal
prices[24]. Nodal pricing merits like
increased efficiency in the dispatch of the
generating units, reduced redispatch cost,
providing incentives to both generators and
consumers based on the physical constraints,
and incentives could reduce overall cost. Two
questions addressed here are 1). when
investing in new capacity 2). when trading
energy. On the other hand, the nodal pricing
method has some demerits, like nodal prices
neither provide optimal signals for the grid
expansion to the system operator nor ensure
the recovery of the grid's fixed cost. Nodal
pricing under certain circumstances may
decrease liquidity.
The nodal price behavior considering the ZIP
and RIC loads is considered in [17] with the
load flow based formulation. An optimal
power flow based approach for distribution
system nodal prices with seasonal load impact
was presented in [18]. However, the impact
of renewable energy with its cost was not
considered

Vidyabharati International Interdisciplinary Research Journal (Special Issue) ISSN 2319-4979
Special Issue on Engineering Technologies and Management 3854
Mathematical Model for Radial
Distribution Systems
The harmonic load flow algorithm is
developed in this paper based on forward and
backward sweep methods. This method does
not require formation of BIBC, BCBV
matrices and identification of the nodes
beyond each branch. The proposed method
reduces data preparation to solve load flow in
the distribution system, uses simple equations
and requires less computation time per
iteration. A simple radial distribution system
with a source at one end and load at the other
end with two nodes with voltages and
impedance is shown in Figure1. The
mathematical model is presented in this
section considering the impact of normal and
realistic ZIP loads into account. The load
flow algorithm used in this paper consists of
forward and backward sweep methods. The
forward sweep is mainly a voltage drop
calculation from sending end to receiving end
of a feeder or a lateral and the backward
sweep is primarily a current summation based
on voltage updates from far end of the feeder
to sending end.
I
Figure1 Equivalent circuit model of RDS
The steps involved in the proposed harmonic
load flow method are given below.
(a). Load currents calculation
𝐼𝐿[𝑘] = [𝑃𝐿(𝑘)+𝑄𝐿(𝑘)
𝑣(𝑘)]∗
𝑓𝑜𝑟𝑘 = 1,2,3, … . 𝑛 (1)
𝐼𝐿3[𝑘] = [𝑃𝐿3(𝑘)+𝑄𝐿3(𝑘)
𝑣3(𝑘)]∗
𝑓𝑜𝑟𝑘 = 1,2,3, … . 𝑛 (2)
𝐼𝐿5[𝑘] = [𝑃𝐿5(𝑘)+𝑄𝐿5(𝑘)
𝑣5(𝑘)]∗
𝑓𝑜𝑟𝑘 = 1,2,3, … . 𝑛 (3)
𝐼𝐿7[𝑘] = [𝑃𝐿7(𝑘)+𝑄𝐿7(𝑘)
𝑣7𝑘]∗
𝑓𝑜𝑟𝑘 = 1,2,3, … . 𝑛 (4)
Where
𝐼𝐿are the load currents.
𝐼𝐿3,𝐼𝐿5 and 𝐼𝐿7 are load currents for 3rd, 5th
and 7th harmonics.
𝑣are the bus voltages
𝑣3, 𝑣5 and 𝑣7 are harmonic voltages.
𝑃𝐿, 𝑄𝐿are the real and reactive power load
demand.
𝑃𝐿3, 𝑃𝐿5 and 𝑃𝐿7 are real harmonic powers
injected taken as 1%, 0.5% and 0.25% of 𝑃𝐿
respectively.
𝑄𝐿3, 𝑄𝐿5 and 𝑄𝐿7 are reactive harmonic
powers injected taken as 1%, 0.5% and 0.25%
of 𝑄𝐿 respectively.
𝑛is total number of buses.
(b). Backward sweep to sum up line section
current: starting from the last branch and
moving towards the root node, the current in
branch 𝐼𝐻is:
𝐼𝐿𝐻(se (i)) =𝐼𝐿𝐻(se (i))+𝐼𝐿𝐻(re (i)) for
i=1,2,3,…nb, where H=1,3,5,7 (5)
𝐼𝐻 = 𝐼𝐿𝐻(𝑟𝑒) (6)
where
H is order of harmonic taken as 1st
(fundamental), 3rd, 5th and 7th.
𝐼𝐻are the branch currents for all harmonics
nb is the total number of branches.
𝑠𝑒, 𝑟𝑒are sending and receiving end nodes
respectively.
(c). Forward sweep to update nodal voltages:
starting from the first node and moving
towards the last node.
(i). Voltage drops in each branch are:
∆V𝐻(𝑘) = 𝑍𝐻(𝑘) ∗ 𝐼𝐻(𝑘) (7)
Here 𝑍𝐻= 𝑅 + j*𝑋𝐻 and 𝑋𝐻= (H*𝑋)
where H=1, 3, 5 and 7
(ii). The voltages at the receiving end node i
is:
𝑉𝐻(𝑟𝑒(𝑘)) = 𝑉𝐻(𝑠𝑒(𝑘)) − ∆V𝐻(𝑘)
𝑓𝑜𝑟𝑘 = 1,2,3,… 𝑛 (8)
(iii). Voltage deviations in present and
previous iterations:
𝑑𝑒𝑙𝑉𝐻 = 𝑉𝐻 − 𝑣𝐻 (9) (iv). Convergence Criterion
𝑑𝑒𝑙𝑉𝑚𝑎𝑥[𝐻] = (max (𝑑𝑒𝑙𝑉𝐻)) (10)
(v). Updating Voltages in each phase
𝑣𝐻 = 𝑉𝐻 (11)
Knowing branch currents, the real and
reactive power losses can be obtained as:
𝑃𝑙𝑜𝑠𝑠𝐻(𝑖) = 𝐼𝐻(𝑖)2 × 𝑅(𝑖)𝑓𝑜𝑟𝑖 = 1,2,3, … 𝑛𝑏 (12)
𝑄𝑙𝑜𝑠𝑠𝐻(𝑖) = 𝐼𝐻(𝑖)2 × 𝑋𝐻(𝑖)𝑓𝑜𝑟𝑖 = 1,2,3, …𝑛𝑏 (10)

Vidyabharati International Interdisciplinary Research Journal (Special Issue) ISSN 2319-4979
Special Issue on Engineering Technologies and Management 3854
The total real as well as reactive power loss
TPL and TQL is given by
TPL𝐻 = ∑ Ploss𝐻(i)𝑛𝑏
𝑖=1 (13)
TQL𝐻 = ∑ Qloss𝐻(i)𝑛𝑏
𝑖=1 (14)
Algorithm for proposed load flow solution
Step 1: Read bus data and line data.
Step 2: Initialize the bus voltages as 𝑣(𝑘) =1.0 and corresponding 𝑣ℎ(𝑘) as 10%, 7.5%
and 5% for H= 3, 5 and 7 respectively.
Step 3: Calculate load currents 𝐼𝐿𝐻[𝑘] using
eqns. (1-4).
Step 4: Calculate branch currents using eqns.
(5-6).
Step 5: Calculate the voltage drops in all three
phases using eqn. (7).
Step 6: After calculating voltage drops find
receiving end voltages in the forward
direction
Using eqn. (8)
Step 7: Find 𝑑𝑒𝑙𝑉𝐻 using eqns. (9). Update
the voltages in all three phases as shown in
eqn. (11).
Step 8: Find error in voltage𝑖. 𝑒𝑑𝑒𝑙𝑉𝑚𝑎𝑥[𝐻]. If it is less than 0.00001 then load flow is
Converged otherwise go to step 3.
Step 9: Once load flow is converged bus
voltages and branch currents are known, then
find
Power loss using eqns. (12-14)
Step 10: Stop.
The eqn. (5-6) is used to find branch currents,
and it is explained using four bus radial
systems as follows—figure2 shown the four
bus radial distribution system.
Figure 2 Sample radial distribution system
Branch Sending end Receiving
end
1 1 2
2 2 3
3 3 4
Load currents are calculated using the eqn.
(1)
For four buses, the load currents
IL=[
0×××
]
Let ILL=IL
nb is the number of branches (nb=3)
for k=nb:-1:1
ILL(se(k))=ILL(se(k))+ILL(re(k))
end
k=3
ILL(3)=ILL(3)+ILL(4)
k=2
ILL(2)=ILL(2)+ILL(3)
k=1
ILL(1)=ILL(1)+ILL(2)
Branch currents Ibr=ILL(re)
Ibr=[
𝐼𝐿𝐿(2)𝐼𝐿𝐿(3)𝐼𝐿𝐿(4)
]==[
𝐼𝐿𝐿(2) + 𝐼𝐿𝐿(3) + 𝐼𝐿𝐿(4)
𝐼𝐿𝐿(3) + 𝐼𝐿𝐿(4)𝐼𝐿𝐿(4)
]
Modeling of Solar (PV) Units
The Beta probability distribution function
(BPDF) require for estimating the hourly
solar irradiance [1]. BPDF is based on
historical data collected for three years [2].
The solar irradiance sample and wind speed
samples produced by MCS. In the Monte
Carlo method, a simulation can typically
involve over 20000 evaluations of the model,
which is computationally expensive.
1 2 3 4 B1 B2 B3

Vidyabharati International Interdisciplinary Research Journal (Special Issue) ISSN 2319-4979
Special Issue on Engineering Technologies and Management 3854
Figure3. 24 hours active power of PV Units
The 24 hours output power of each Solar
(PV) Units is obtained based on the above
maintained data. It is shown in Figure3.
However, we have to use the average power
output of day in the Solar (PV) Units. The
average value of active power generation of
Solar (PV) unit is 0.216MW respectively.
Nodal Pricing of Distribution Networks
In order to obtain the nodal prices at each bus
of a distribution system, the MLCs have to be
defined first. MLCs are coefficients that
indicate the marginal or incremental deviation
in total active power loss due to the changes
in active and reactive power injections at a
particular node of the system [17].
𝜌𝑃𝑘 =𝜕𝐿
𝜕𝑃𝑘 (15)
𝜌𝑄𝑘 =𝜕𝐿
𝜕𝑄𝑘 (16)
where
𝑳: The total power loss
𝝆_𝑷𝒌: The active power MLC at node 𝒌of
the system
𝝆𝑸𝒌: The reactive power MLC at node 𝒌 of
the system
The connection point between the distribution
and transmission system is called as the
power supply point (PSP). If 𝜆 is the
electricity price (in $/MWh) or the active
power price at PSP, then the nodal prices of
active and reactive powers at various nodes
can be obtained as follows:
𝑁𝑃𝑘 = 𝜆 + 𝜆. 𝜌𝑃𝑘 = 𝜆(1 + 𝜌𝑃𝑘) (17)
𝑁𝑄𝑘 = 𝜆. 𝜌𝑄𝑘 (18)
where𝑵𝑷𝒌($/MWh) and 𝑵𝑸𝒌($/MVARh)
are the active and reactive power nodal
prices at node k of the system respectively.
The reactive power price at PSP is taken as
zero.
Charges for marginal losses for loads
The charges for marginal losses for loads can
be calculated as [16]:
𝐶𝐿𝑘 = ∑ 𝜆𝑡(𝑇𝑡=1
𝜕𝐿𝑡
𝜕𝑃𝑘,𝑡)𝑃𝑖,𝑡 + (
𝜕𝐿𝑡
𝜕𝑄𝑘,𝑡)𝑄𝑘,𝑡 (19)
where
𝐶𝐿𝑘: The marginal loss charges for load at
node 𝑘 of the system
𝜆𝑡: Electricity price at PSP for hour 𝑡
𝑃𝑘,𝑡, 𝑄𝑘,𝑡: Load active and reactive power
demands at node k of the system for hour 𝑡
𝑻:The total number of hours of the study
Determination of Marginal Loss
Coefficients The active and reactive power MLCs are
determined using the Jacobian matrix method.
This method of determining the MLCs was
proposed by the authors in [15]. The method
is designed based on the fact that there exists
no direct correlation between the power
losses and power injections. Hence, the
intermediary variables such as bus voltages
and angles obtained from AC power flows are
utilized to determine the MLCs. The
following sets of linear equations are utilized
in this method.
[𝝆𝑷𝒌
𝝆𝑸𝒌] =
[ 𝝏𝑷𝟏𝝏𝜽𝟏
𝝏𝑷𝟐𝝏𝜽𝟏
⋯𝝏𝑷𝒏𝝏𝜽𝟏
⋮ ⋱ ⋮𝝏𝑷𝟏𝝏𝜽𝒏
𝝏𝑷𝟐𝝏𝜽𝒏
⋯𝝏𝑷𝒏𝝏𝜽𝒏
𝝏𝑷𝟏𝝏𝑽𝟏
𝝏𝑷𝟐𝝏𝑽𝟏
⋯𝝏𝑷𝒏𝝏𝑽𝟏
⋮ ⋱ ⋮𝝏𝑷𝟏𝝏𝑽𝒏
𝝏𝑷𝟐𝝏𝑽𝒏
⋯𝝏𝑷𝒏𝝏𝑽𝒏
|
|
𝝏𝑸𝟏𝝏𝜽𝟏
𝝏𝑸𝟐𝝏𝜽𝟏
⋯𝝏𝑸𝒏𝝏𝜽𝟏
⋮ ⋱ ⋮𝝏𝑸𝟏𝝏𝜽𝒏
𝝏𝑸𝟐𝝏𝜽𝒏
⋯𝝏𝑸𝒏𝝏𝜽𝒏
𝝏𝑸𝟏𝝏𝑽𝟏
𝝏𝑸𝟐𝝏𝑽𝟏
⋯𝝏𝑸𝒏𝝏𝑽𝟏
⋮ ⋱ ⋮𝝏𝑸𝟏𝝏𝑽𝒏
𝝏𝑸𝟐𝝏𝑽𝒏
⋯𝝏𝑸𝒏𝝏𝑽𝒏]
−𝟏
[
𝝏𝑳
𝝏𝜽𝟏⋮
𝝏𝑳
𝝏𝜽𝒏𝝏𝑳
𝝏𝑽𝟏⋮
𝝏𝑳
𝝏𝑽𝒏]
(20)
0 2 4 6 8 10 12 14 16 18 20 22 240
1
2
3
4
5
6
7
x 105
Hours
Active p
ow
er
in w
att
(W)

Vidyabharati International Interdisciplinary Research Journal (Special Issue) ISSN 2319-4979
Special Issue on Engineering Technologies and Management 3854
𝝏𝑷𝒌
𝝏𝜽𝒋= 𝑽𝒌𝑽𝒋[𝑮𝒌𝒋 𝐬𝐢𝐧(𝜽𝒌 − 𝜽𝒋) −
𝑩𝒌𝒋 𝐜𝐨𝐬(𝜽𝒌 − 𝜽𝒋)] (21)
𝝏𝑷𝒌
𝝏𝜽𝒌= −𝑩𝒌𝒌𝑽𝒊
𝟐 − ∑ 𝑽𝒌𝑽𝒋[𝑮𝒌𝒋 𝐬𝐢𝐧(𝜽𝒌 −𝒏𝒋=𝟏
𝜽𝒋) − 𝑩𝒌𝒋 𝐜𝐨𝐬(𝜽𝒌 − 𝜽𝒋)]
(
22)
𝝏𝑷𝒌
𝝏𝑽𝒋= 𝑽𝒌[𝑮𝒌𝒋 𝐜𝐨𝐬(𝜽𝒌 − 𝜽𝒋) + 𝑩𝒌𝒋 𝐬𝐢𝐧(𝜽𝒌 −
𝜽𝒋)] (23)
𝝏𝑷𝐤
𝝏𝑽𝐤= 𝑮𝒌𝒌𝑽𝒌 + ∑ 𝑽𝒋[𝑮𝒌𝒋 𝐜𝐨𝐬(𝜽𝒌 − 𝜽𝒋) +𝒏
𝒋=𝟏
𝑩𝒌𝒋 𝐬𝐢𝐧(𝜽𝒌 − 𝜽𝒋)]
(
24)
𝝏𝑸𝒌
𝝏𝜽𝒋= −𝑽𝐤𝑽𝒋[𝑮𝒌𝒋 𝐜𝐨𝐬(𝜽𝒌 − 𝜽𝒋) +
𝑩𝒌𝒋 𝐬𝐢𝐧(𝜽𝒌 − 𝜽𝒋)] (25)
𝝏𝑸𝒌
𝝏𝜽𝒌= −𝑮𝒌𝒌𝑽𝒌
𝟐 + ∑ 𝑽𝒌𝑽𝒋[𝑮𝒌𝒋 𝐜𝐨𝐬(𝜽𝒌 −𝒏𝒋=𝟏
𝜽𝒋) + 𝑩𝒌𝒋 𝐬𝐢𝐧(𝜽𝒌 − 𝜽𝒋)]
(
26)
𝝏𝑸𝒌
𝝏𝑽𝒋= 𝑽𝒌[𝑮𝒌𝒋 𝐬𝐢𝐧(𝜽𝒌 − 𝜽𝒋) − 𝑩𝒌𝒋 𝐜𝐨𝐬(𝜽𝒌 −
𝜽𝒋)] (27)
𝝏𝑸𝐤
𝝏𝑽𝐤= −𝑩𝒌𝒌𝑽𝒌 + ∑ 𝑽𝒋[𝑮𝒌𝒋 𝐬𝐢𝐧(𝜽𝒌 −𝒏
𝒋=𝟏
𝜽𝒋) − 𝑩𝒌𝒋 𝐜𝐨𝐬(𝜽𝒌 − 𝜽𝒋)]
(
28)
The total loss of the distribution system is
given by
𝑳 =𝟏
𝟐∑ ∑ 𝑮𝒌𝒋[𝑽𝒌
𝟐 +𝑽𝒋𝟐 − 𝟐𝑽𝒌𝑽𝒋𝐜𝐨𝐬(𝜽𝒌 −𝒏
𝒋=𝟏𝒏𝒌=𝟏
𝜽𝒋)] (29)
From this equation, the derivative of loss
with respect to voltage angles and
magnitudes can be derived as follows: 𝝏𝑳
𝝏𝜽𝒌= 𝟐∑ 𝑽𝒌𝑽𝒋𝑮𝒌𝒋 𝐬𝐢𝐧(𝜽𝒌 − 𝜽𝒋)
𝒏𝒋=𝟏 (30)
𝝏𝑳
𝝏𝑽𝐤= 𝟐∑ 𝑮𝒌𝒋[𝑽𝐤 − 𝑽𝒋 𝐜𝐨𝐬(𝜽𝐤 − 𝜽𝒋)]
𝒏𝒋=𝟏 (31)
where
𝑽𝒌, 𝑽𝒋: The voltage magnitudes at the
sending and receiving end nodes
respectively
𝜽𝒌, 𝜽𝒋: The voltage angles at the sending
and receiving end nodes respectively
𝑮𝒌𝒋: The conductance of the 𝒌 − 𝒋𝒕𝒉
element of the Y-bus matrix
𝑩𝒌𝒋: The susceptance of the 𝒌 − 𝒋𝒕𝒉 element
of the Y-bus matrix
𝒏 : The total number of nodes in the
system.
Reconciliated Marginal Loss Coefficients
The approximate total losses of the system
can also be obtained from the MLCs as
follows:
𝑳𝒂𝒑𝒑𝒓𝒐𝒙 = ∑ [𝝆𝑷𝒌.𝒏𝒌=𝟏 𝑷𝒌 + 𝝆𝑸𝒌. 𝑸𝒌] (32)
where𝑃𝑘 and 𝑄𝑘 are the active and reactive
power injections at node 𝑘 respectively. As
concluded by authors in [16], it was observed
that the value of losses approximated using
MLCs were almost as twice as the actual
losses of the system. This leads to over
estimation of the nodal prices of the system.
Hence, the MLCs have to be adjusted in order
to estimate the exact cost of losses, which is
done using the factor of reconciliation ( 𝑅𝑓).
𝑹𝒇 =𝑳
𝑳𝒂𝒑𝒑𝒓𝒐𝒙 (33)
With the application of reconciliation, the
new active and reactive nodal prices are
obtained as shown below:
𝑁𝑃𝑘 = 𝜆 + 𝜆. 𝑅𝑓. 𝜌𝑃𝑘 = 𝜆(1 + 𝑅𝑓. 𝜌𝑃𝑘) (34)
𝑁𝑄𝑘 = 𝜆. 𝑅𝑓. 𝜌𝑄𝑘 (35)
Realistic ZIP Load Modeling
The realistic time varying load model which
is voltage dependent is used in this work. For
each hour of the study, the load is assumed to
be a combination of residential, industrial and
commercial loads.
𝑃𝑘(𝑡) = 𝑃𝑘𝑜(𝑡) [𝛼(𝑡) (𝑉𝑘(𝑡)
𝑉𝑜)𝑛𝑝𝑟
+
𝛽(𝑡) (𝑉𝑘(𝑡)
𝑉𝑜)𝑛𝑝𝑐
+ 𝛾(𝑡) (𝑉𝑘(𝑡)
𝑉𝑜)𝑛𝑝𝑘
] (36)
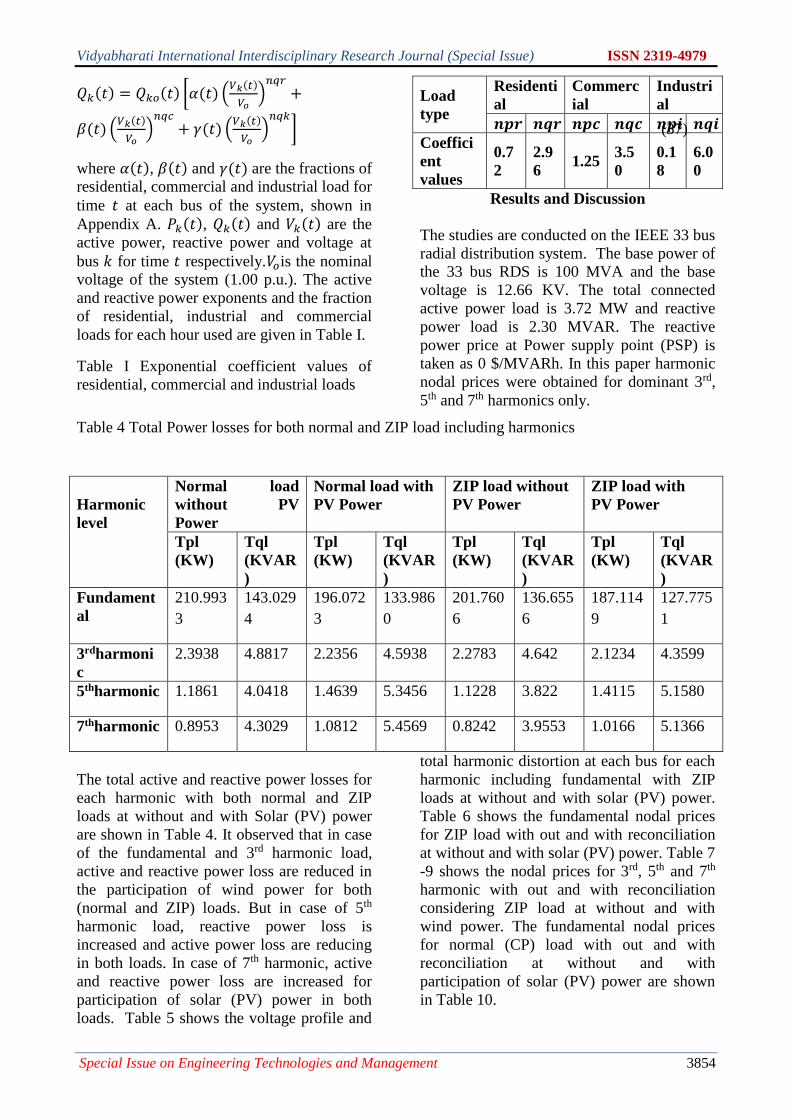
Vidyabharati International Interdisciplinary Research Journal (Special Issue) ISSN 2319-4979
Special Issue on Engineering Technologies and Management 3854
𝑄𝑘(𝑡) = 𝑄𝑘𝑜(𝑡) [𝛼(𝑡) (𝑉𝑘(𝑡)
𝑉𝑜)𝑛𝑞𝑟
+
𝛽(𝑡) (𝑉𝑘(𝑡)
𝑉𝑜)𝑛𝑞𝑐
+ 𝛾(𝑡) (𝑉𝑘(𝑡)
𝑉𝑜)𝑛𝑞𝑘
] (37)
where 𝛼(𝑡), 𝛽(𝑡) and 𝛾(𝑡) are the fractions of
residential, commercial and industrial load for
time 𝑡 at each bus of the system, shown in
Appendix A. 𝑃𝑘(𝑡), 𝑄𝑘(𝑡) and 𝑉𝑘(𝑡) are the
active power, reactive power and voltage at
bus 𝑘 for time 𝑡 respectively.𝑉𝑜is the nominal
voltage of the system (1.00 p.u.). The active
and reactive power exponents and the fraction
of residential, industrial and commercial
loads for each hour used are given in Table I.
Table I Exponential coefficient values of
residential, commercial and industrial loads
Load
type
Residenti
al
Commerc
ial
Industri
al
𝒏𝒑𝒓 𝒏𝒒𝒓 𝒏𝒑𝒄 𝒏𝒒𝒄 𝒏𝒑𝒊 𝒏𝒒𝒊 Coeffici
ent
values
0.7
2
2.9
6 1.25
3.5
0
0.1
8
6.0
0
Results and Discussion
The studies are conducted on the IEEE 33 bus
radial distribution system. The base power of
the 33 bus RDS is 100 MVA and the base
voltage is 12.66 KV. The total connected
active power load is 3.72 MW and reactive
power load is 2.30 MVAR. The reactive
power price at Power supply point (PSP) is
taken as 0 $/MVARh. In this paper harmonic
nodal prices were obtained for dominant 3rd,
5th and 7th harmonics only.
Table 4 Total Power losses for both normal and ZIP load including harmonics
Harmonic
level
Normal load
without PV
Power
Normal load with
PV Power
ZIP load without
PV Power
ZIP load with
PV Power
Tpl
(KW)
Tql
(KVAR
)
Tpl
(KW)
Tql
(KVAR
)
Tpl
(KW)
Tql
(KVAR
)
Tpl
(KW)
Tql
(KVAR
)
Fundament
al
210.993
3
143.029
4
196.072
3
133.986
0
201.760
6
136.655
6
187.114
9
127.775
1
3rdharmoni
c
2.3938 4.8817 2.2356 4.5938 2.2783 4.642 2.1234 4.3599
5thharmonic 1.1861 4.0418 1.4639 5.3456 1.1228 3.822 1.4115 5.1580
7thharmonic 0.8953 4.3029 1.0812 5.4569 0.8242 3.9553 1.0166 5.1366
The total active and reactive power losses for
each harmonic with both normal and ZIP
loads at without and with Solar (PV) power
are shown in Table 4. It observed that in case
of the fundamental and 3rd harmonic load,
active and reactive power loss are reduced in
the participation of wind power for both
(normal and ZIP) loads. But in case of 5th
harmonic load, reactive power loss is
increased and active power loss are reducing
in both loads. In case of 7th harmonic, active
and reactive power loss are increased for
participation of solar (PV) power in both
loads. Table 5 shows the voltage profile and
total harmonic distortion at each bus for each
harmonic including fundamental with ZIP
loads at without and with solar (PV) power.
Table 6 shows the fundamental nodal prices
for ZIP load with out and with reconciliation
at without and with solar (PV) power. Table 7
-9 shows the nodal prices for 3rd, 5th and 7th
harmonic with out and with reconciliation
considering ZIP load at without and with
wind power. The fundamental nodal prices
for normal (CP) load with out and with
reconciliation at without and with
participation of solar (PV) power are shown
in Table 10.
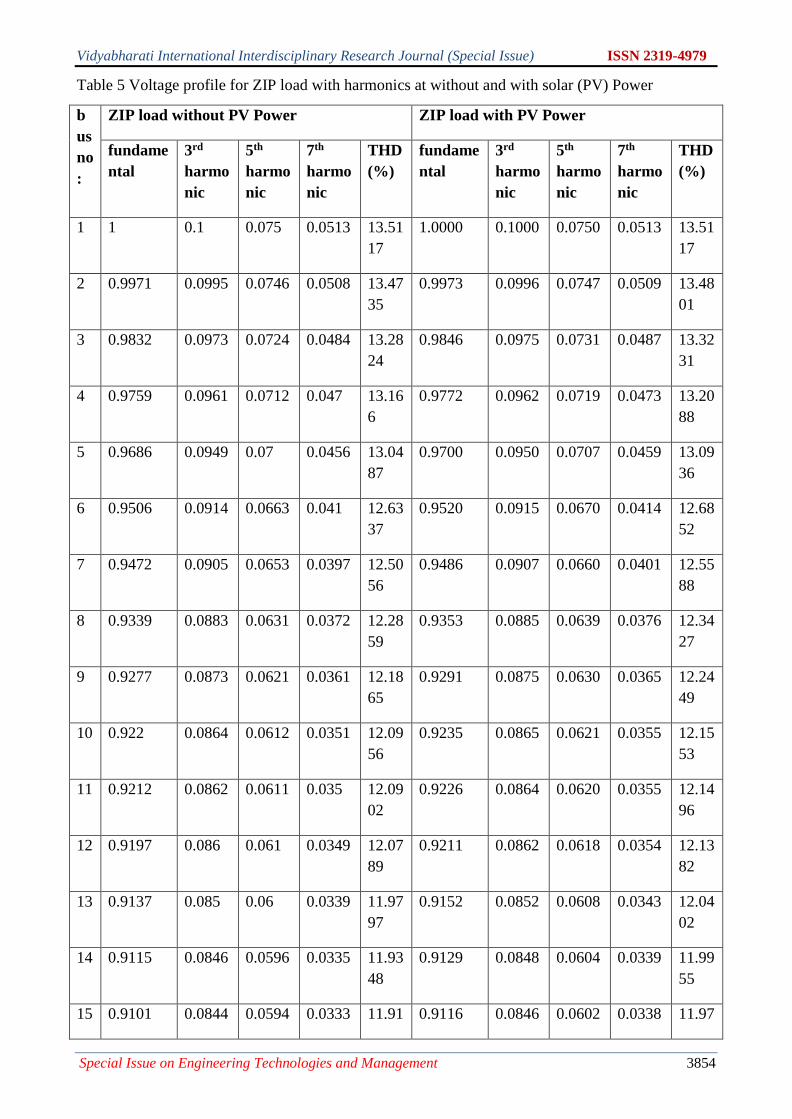
Vidyabharati International Interdisciplinary Research Journal (Special Issue) ISSN 2319-4979
Special Issue on Engineering Technologies and Management 3854
Table 5 Voltage profile for ZIP load with harmonics at without and with solar (PV) Power
b
us
no
:
ZIP load without PV Power ZIP load with PV Power
fundame
ntal
3rd
harmo
nic
5th
harmo
nic
7th
harmo
nic
THD
(%)
fundame
ntal
3rd
harmo
nic
5th
harmo
nic
7th
harmo
nic
THD
(%)
1 1 0.1 0.075 0.0513 13.51
17
1.0000 0.1000 0.0750 0.0513 13.51
17
2 0.9971 0.0995 0.0746 0.0508 13.47
35
0.9973 0.0996 0.0747 0.0509 13.48
01
3 0.9832 0.0973 0.0724 0.0484 13.28
24
0.9846 0.0975 0.0731 0.0487 13.32
31
4 0.9759 0.0961 0.0712 0.047 13.16
6
0.9772 0.0962 0.0719 0.0473 13.20
88
5 0.9686 0.0949 0.07 0.0456 13.04
87
0.9700 0.0950 0.0707 0.0459 13.09
36
6 0.9506 0.0914 0.0663 0.041 12.63
37
0.9520 0.0915 0.0670 0.0414 12.68
52
7 0.9472 0.0905 0.0653 0.0397 12.50
56
0.9486 0.0907 0.0660 0.0401 12.55
88
8 0.9339 0.0883 0.0631 0.0372 12.28
59
0.9353 0.0885 0.0639 0.0376 12.34
27
9 0.9277 0.0873 0.0621 0.0361 12.18
65
0.9291 0.0875 0.0630 0.0365 12.24
49
10 0.922 0.0864 0.0612 0.0351 12.09
56
0.9235 0.0865 0.0621 0.0355 12.15
53
11 0.9212 0.0862 0.0611 0.035 12.09
02
0.9226 0.0864 0.0620 0.0355 12.14
96
12 0.9197 0.086 0.061 0.0349 12.07
89
0.9211 0.0862 0.0618 0.0354 12.13
82
13 0.9137 0.085 0.06 0.0339 11.97
97
0.9152 0.0852 0.0608 0.0343 12.04
02
14 0.9115 0.0846 0.0596 0.0335 11.93
48
0.9129 0.0848 0.0604 0.0339 11.99
55
15 0.9101 0.0844 0.0594 0.0333 11.91 0.9116 0.0846 0.0602 0.0338 11.97
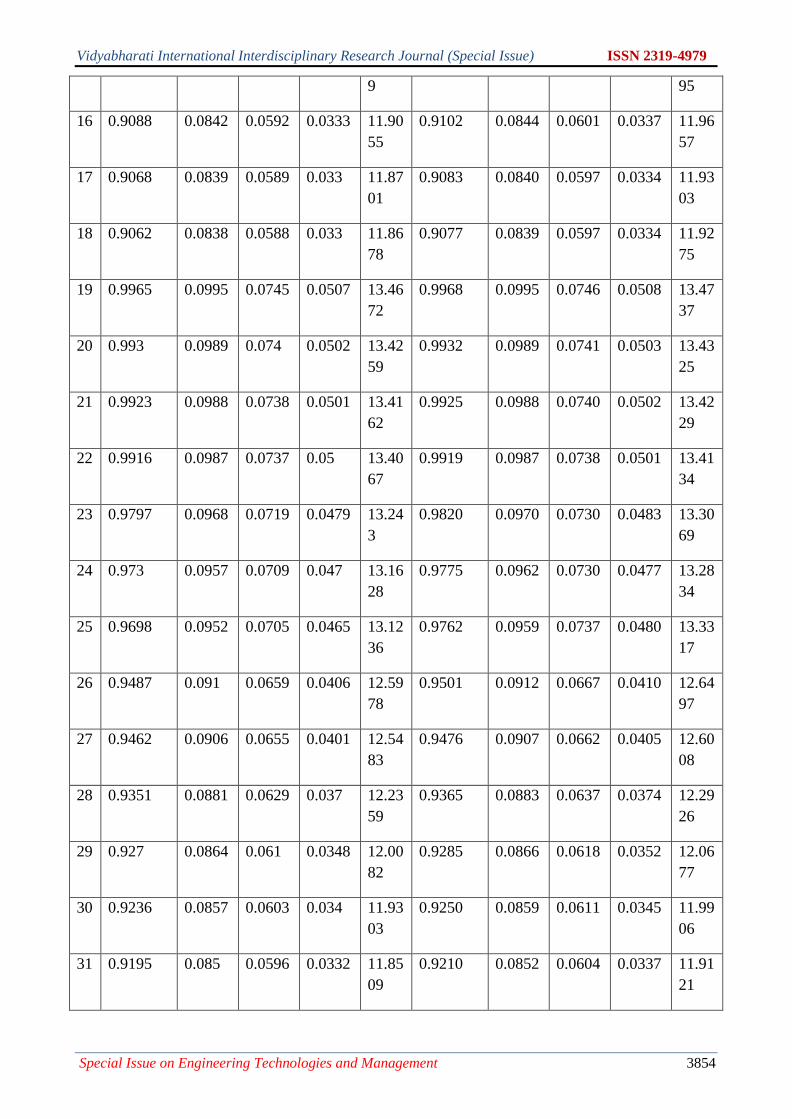
Vidyabharati International Interdisciplinary Research Journal (Special Issue) ISSN 2319-4979
Special Issue on Engineering Technologies and Management 3854
9 95
16 0.9088 0.0842 0.0592 0.0333 11.90
55
0.9102 0.0844 0.0601 0.0337 11.96
57
17 0.9068 0.0839 0.0589 0.033 11.87
01
0.9083 0.0840 0.0597 0.0334 11.93
03
18 0.9062 0.0838 0.0588 0.033 11.86
78
0.9077 0.0839 0.0597 0.0334 11.92
75
19 0.9965 0.0995 0.0745 0.0507 13.46
72
0.9968 0.0995 0.0746 0.0508 13.47
37
20 0.993 0.0989 0.074 0.0502 13.42
59
0.9932 0.0989 0.0741 0.0503 13.43
25
21 0.9923 0.0988 0.0738 0.0501 13.41
62
0.9925 0.0988 0.0740 0.0502 13.42
29
22 0.9916 0.0987 0.0737 0.05 13.40
67
0.9919 0.0987 0.0738 0.0501 13.41
34
23 0.9797 0.0968 0.0719 0.0479 13.24
3
0.9820 0.0970 0.0730 0.0483 13.30
69
24 0.973 0.0957 0.0709 0.047 13.16
28
0.9775 0.0962 0.0730 0.0477 13.28
34
25 0.9698 0.0952 0.0705 0.0465 13.12
36
0.9762 0.0959 0.0737 0.0480 13.33
17
26 0.9487 0.091 0.0659 0.0406 12.59
78
0.9501 0.0912 0.0667 0.0410 12.64
97
27 0.9462 0.0906 0.0655 0.0401 12.54
83
0.9476 0.0907 0.0662 0.0405 12.60
08
28 0.9351 0.0881 0.0629 0.037 12.23
59
0.9365 0.0883 0.0637 0.0374 12.29
26
29 0.927 0.0864 0.061 0.0348 12.00
82
0.9285 0.0866 0.0618 0.0352 12.06
77
30 0.9236 0.0857 0.0603 0.034 11.93
03
0.9250 0.0859 0.0611 0.0345 11.99
06
31 0.9195 0.085 0.0596 0.0332 11.85
09
0.9210 0.0852 0.0604 0.0337 11.91
21

Vidyabharati International Interdisciplinary Research Journal (Special Issue) ISSN 2319-4979
Special Issue on Engineering Technologies and Management 3854
32 0.9186 0.0848 0.0594 0.0331 11.83
41
0.9201 0.0850 0.0602 0.0335 11.89
52
33 0.9184 0.0848 0.0593 0.0331 11.82
96
0.9198 0.0849 0.0602 0.0335 11.89
04
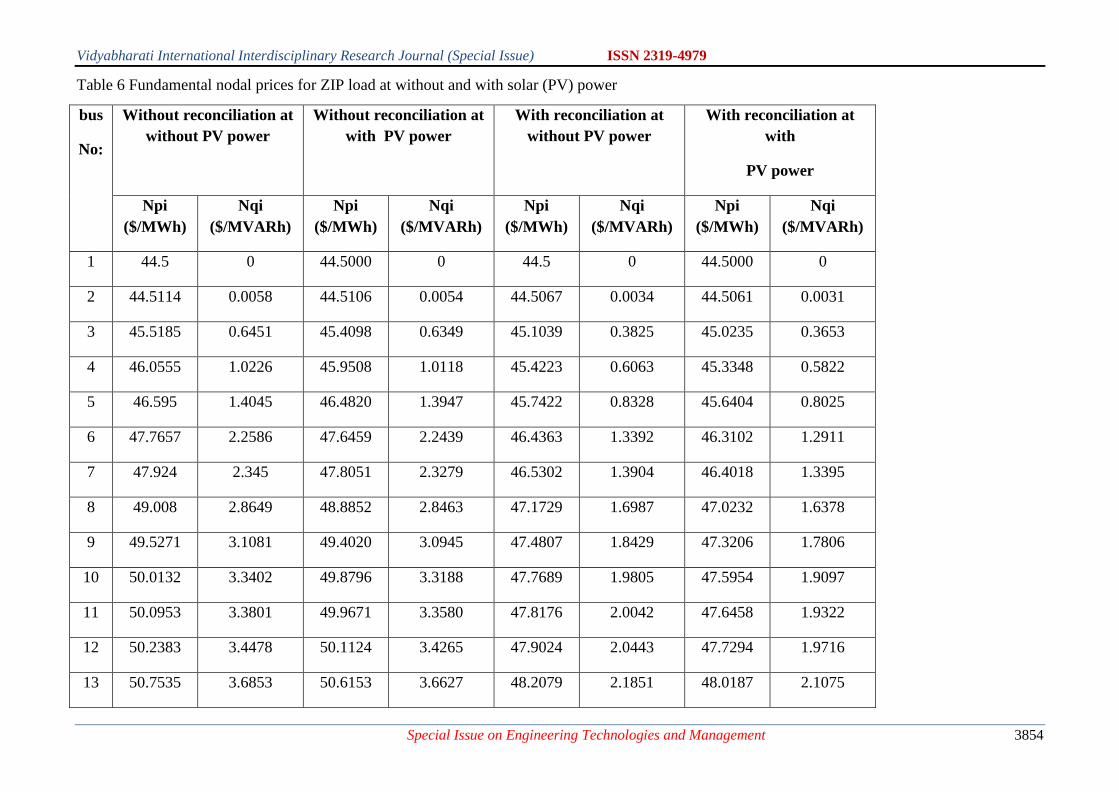
Vidyabharati International Interdisciplinary Research Journal (Special Issue) ISSN 2319-4979
Special Issue on Engineering Technologies and Management 3854
Table 6 Fundamental nodal prices for ZIP load at without and with solar (PV) power
bus
No:
Without reconciliation at
without PV power
Without reconciliation at
with PV power
With reconciliation at
without PV power
With reconciliation at
with
PV power
Npi
($/MWh)
Nqi
($/MVARh)
Npi
($/MWh)
Nqi
($/MVARh)
Npi
($/MWh)
Nqi
($/MVARh)
Npi
($/MWh)
Nqi
($/MVARh)
1 44.5 0 44.5000 0 44.5 0 44.5000 0
2 44.5114 0.0058 44.5106 0.0054 44.5067 0.0034 44.5061 0.0031
3 45.5185 0.6451 45.4098 0.6349 45.1039 0.3825 45.0235 0.3653
4 46.0555 1.0226 45.9508 1.0118 45.4223 0.6063 45.3348 0.5822
5 46.595 1.4045 46.4820 1.3947 45.7422 0.8328 45.6404 0.8025
6 47.7657 2.2586 47.6459 2.2439 46.4363 1.3392 46.3102 1.2911
7 47.924 2.345 47.8051 2.3279 46.5302 1.3904 46.4018 1.3395
8 49.008 2.8649 48.8852 2.8463 47.1729 1.6987 47.0232 1.6378
9 49.5271 3.1081 49.4020 3.0945 47.4807 1.8429 47.3206 1.7806
10 50.0132 3.3402 49.8796 3.3188 47.7689 1.9805 47.5954 1.9097
11 50.0953 3.3801 49.9671 3.3580 47.8176 2.0042 47.6458 1.9322
12 50.2383 3.4478 50.1124 3.4265 47.9024 2.0443 47.7294 1.9716
13 50.7535 3.6853 50.6153 3.6627 48.2079 2.1851 48.0187 2.1075
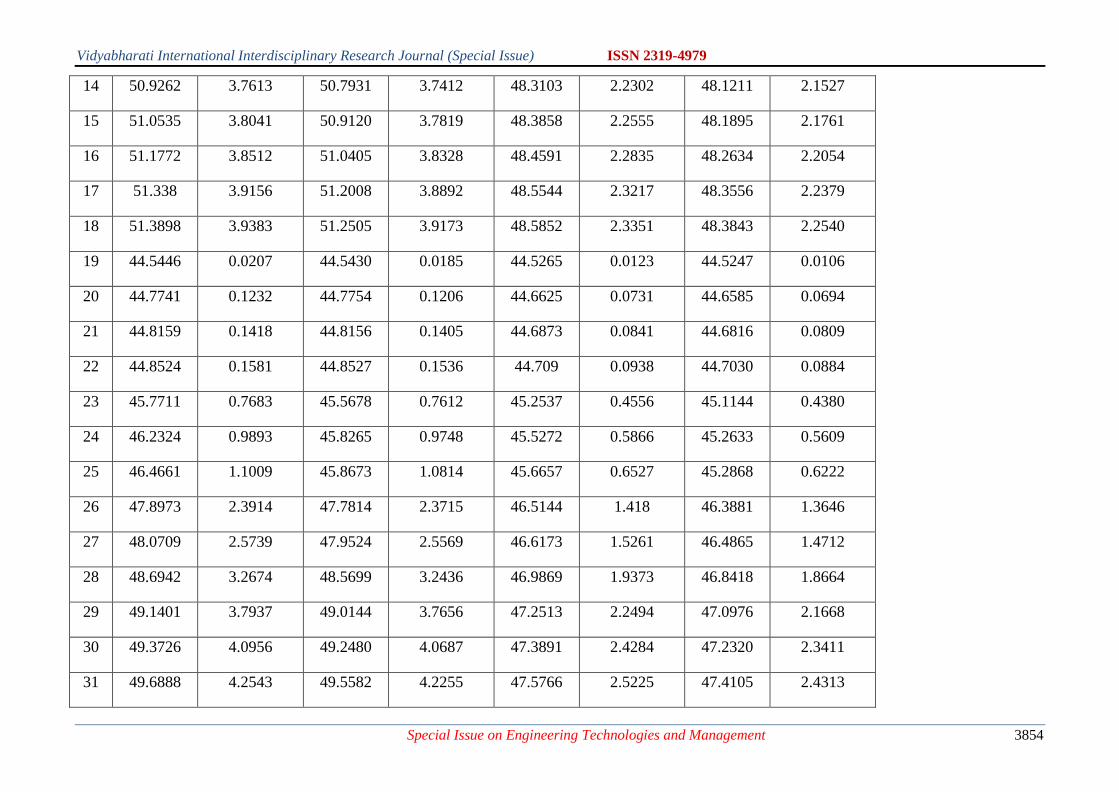
Vidyabharati International Interdisciplinary Research Journal (Special Issue) ISSN 2319-4979
Special Issue on Engineering Technologies and Management 3854
14 50.9262 3.7613 50.7931 3.7412 48.3103 2.2302 48.1211 2.1527
15 51.0535 3.8041 50.9120 3.7819 48.3858 2.2555 48.1895 2.1761
16 51.1772 3.8512 51.0405 3.8328 48.4591 2.2835 48.2634 2.2054
17 51.338 3.9156 51.2008 3.8892 48.5544 2.3217 48.3556 2.2379
18 51.3898 3.9383 51.2505 3.9173 48.5852 2.3351 48.3843 2.2540
19 44.5446 0.0207 44.5430 0.0185 44.5265 0.0123 44.5247 0.0106
20 44.7741 0.1232 44.7754 0.1206 44.6625 0.0731 44.6585 0.0694
21 44.8159 0.1418 44.8156 0.1405 44.6873 0.0841 44.6816 0.0809
22 44.8524 0.1581 44.8527 0.1536 44.709 0.0938 44.7030 0.0884
23 45.7711 0.7683 45.5678 0.7612 45.2537 0.4556 45.1144 0.4380
24 46.2324 0.9893 45.8265 0.9748 45.5272 0.5866 45.2633 0.5609
25 46.4661 1.1009 45.8673 1.0814 45.6657 0.6527 45.2868 0.6222
26 47.8973 2.3914 47.7814 2.3715 46.5144 1.418 46.3881 1.3646
27 48.0709 2.5739 47.9524 2.5569 46.6173 1.5261 46.4865 1.4712
28 48.6942 3.2674 48.5699 3.2436 46.9869 1.9373 46.8418 1.8664
29 49.1401 3.7937 49.0144 3.7656 47.2513 2.2494 47.0976 2.1668
30 49.3726 4.0956 49.2480 4.0687 47.3891 2.4284 47.2320 2.3411
31 49.6888 4.2543 49.5582 4.2255 47.5766 2.5225 47.4105 2.4313
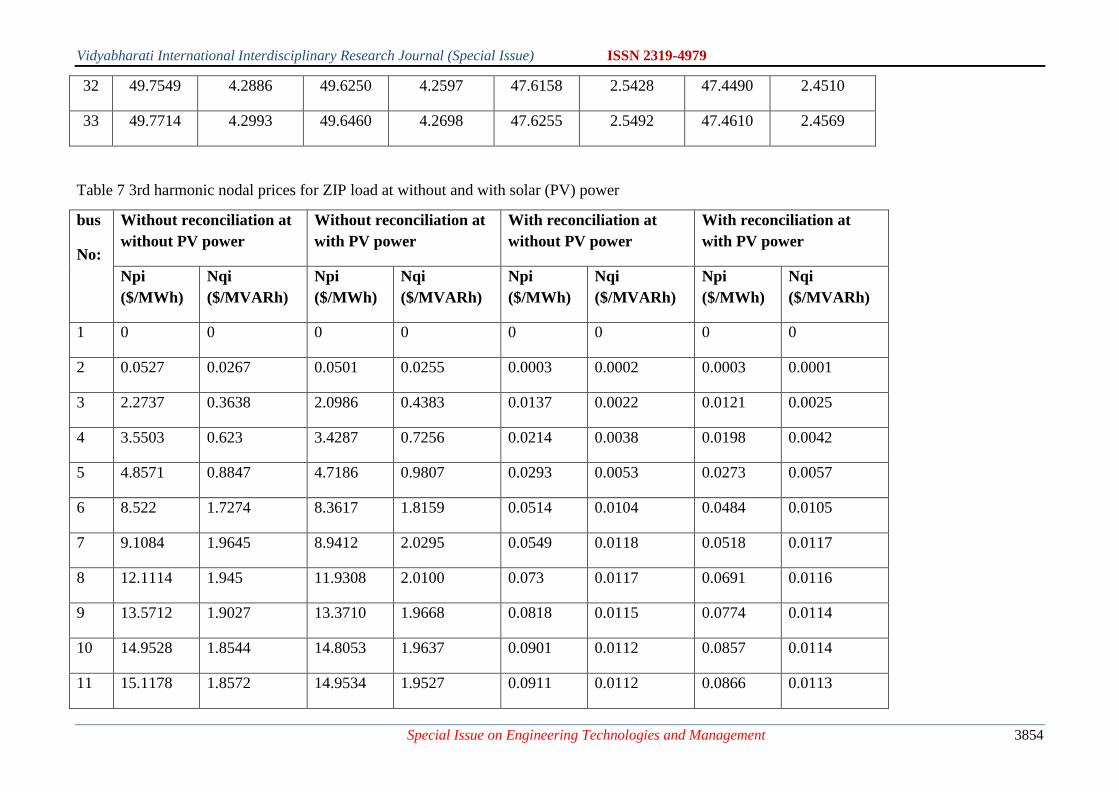
Vidyabharati International Interdisciplinary Research Journal (Special Issue) ISSN 2319-4979
Special Issue on Engineering Technologies and Management 3854
32 49.7549 4.2886 49.6250 4.2597 47.6158 2.5428 47.4490 2.4510
33 49.7714 4.2993 49.6460 4.2698 47.6255 2.5492 47.4610 2.4569
Table 7 3rd harmonic nodal prices for ZIP load at without and with solar (PV) power
bus
No:
Without reconciliation at
without PV power
Without reconciliation at
with PV power
With reconciliation at
without PV power
With reconciliation at
with PV power
Npi
($/MWh)
Nqi
($/MVARh)
Npi
($/MWh)
Nqi
($/MVARh)
Npi
($/MWh)
Nqi
($/MVARh)
Npi
($/MWh)
Nqi
($/MVARh)
1 0 0 0 0 0 0 0 0
2 0.0527 0.0267 0.0501 0.0255 0.0003 0.0002 0.0003 0.0001
3 2.2737 0.3638 2.0986 0.4383 0.0137 0.0022 0.0121 0.0025
4 3.5503 0.623 3.4287 0.7256 0.0214 0.0038 0.0198 0.0042
5 4.8571 0.8847 4.7186 0.9807 0.0293 0.0053 0.0273 0.0057
6 8.522 1.7274 8.3617 1.8159 0.0514 0.0104 0.0484 0.0105
7 9.1084 1.9645 8.9412 2.0295 0.0549 0.0118 0.0518 0.0117
8 12.1114 1.945 11.9308 2.0100 0.073 0.0117 0.0691 0.0116
9 13.5712 1.9027 13.3710 1.9668 0.0818 0.0115 0.0774 0.0114
10 14.9528 1.8544 14.8053 1.9637 0.0901 0.0112 0.0857 0.0114
11 15.1178 1.8572 14.9534 1.9527 0.0911 0.0112 0.0866 0.0113
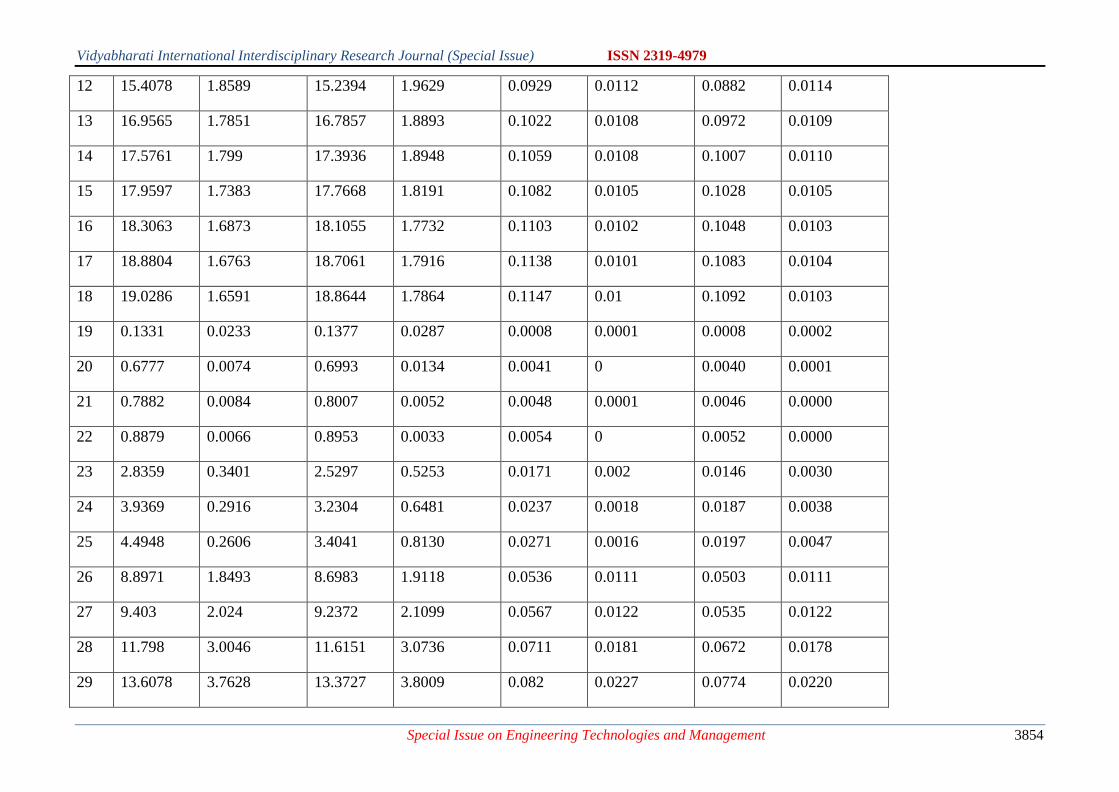
Vidyabharati International Interdisciplinary Research Journal (Special Issue) ISSN 2319-4979
Special Issue on Engineering Technologies and Management 3854
12 15.4078 1.8589 15.2394 1.9629 0.0929 0.0112 0.0882 0.0114
13 16.9565 1.7851 16.7857 1.8893 0.1022 0.0108 0.0972 0.0109
14 17.5761 1.799 17.3936 1.8948 0.1059 0.0108 0.1007 0.0110
15 17.9597 1.7383 17.7668 1.8191 0.1082 0.0105 0.1028 0.0105
16 18.3063 1.6873 18.1055 1.7732 0.1103 0.0102 0.1048 0.0103
17 18.8804 1.6763 18.7061 1.7916 0.1138 0.0101 0.1083 0.0104
18 19.0286 1.6591 18.8644 1.7864 0.1147 0.01 0.1092 0.0103
19 0.1331 0.0233 0.1377 0.0287 0.0008 0.0001 0.0008 0.0002
20 0.6777 0.0074 0.6993 0.0134 0.0041 0 0.0040 0.0001
21 0.7882 0.0084 0.8007 0.0052 0.0048 0.0001 0.0046 0.0000
22 0.8879 0.0066 0.8953 0.0033 0.0054 0 0.0052 0.0000
23 2.8359 0.3401 2.5297 0.5253 0.0171 0.002 0.0146 0.0030
24 3.9369 0.2916 3.2304 0.6481 0.0237 0.0018 0.0187 0.0038
25 4.4948 0.2606 3.4041 0.8130 0.0271 0.0016 0.0197 0.0047
26 8.8971 1.8493 8.6983 1.9118 0.0536 0.0111 0.0503 0.0111
27 9.403 2.024 9.2372 2.1099 0.0567 0.0122 0.0535 0.0122
28 11.798 3.0046 11.6151 3.0736 0.0711 0.0181 0.0672 0.0178
29 13.6078 3.7628 13.3727 3.8009 0.082 0.0227 0.0774 0.0220
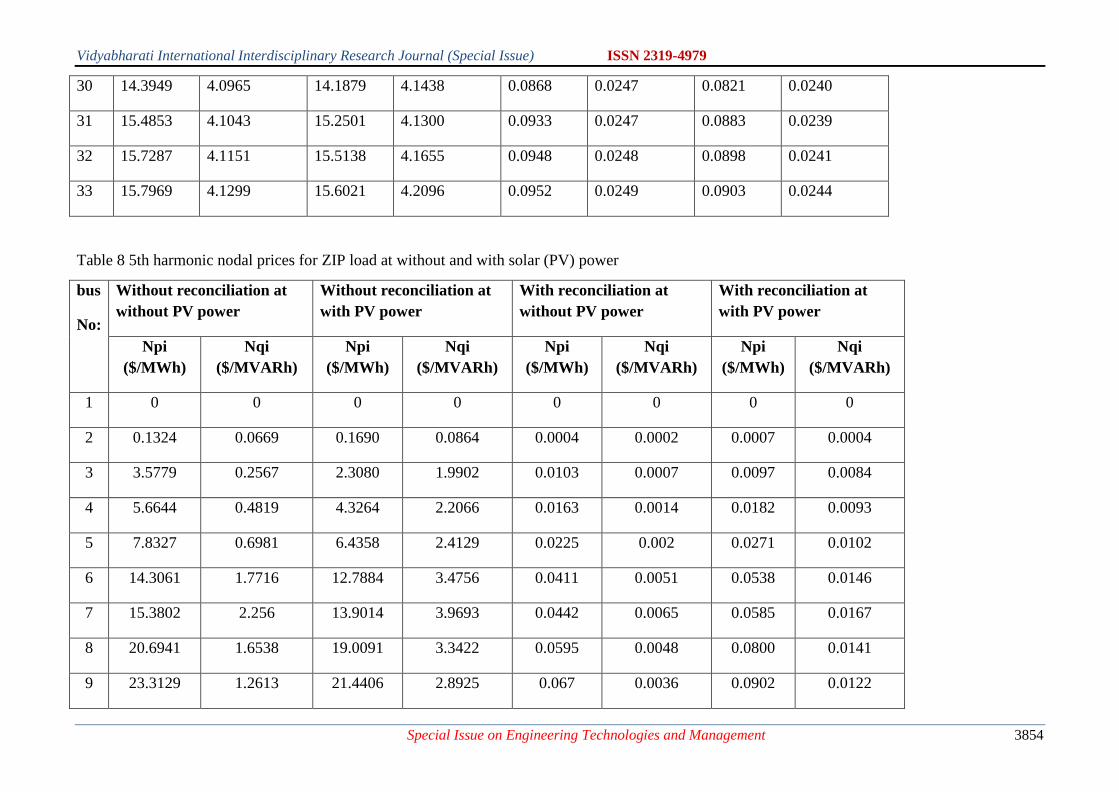
Vidyabharati International Interdisciplinary Research Journal (Special Issue) ISSN 2319-4979
Special Issue on Engineering Technologies and Management 3854
30 14.3949 4.0965 14.1879 4.1438 0.0868 0.0247 0.0821 0.0240
31 15.4853 4.1043 15.2501 4.1300 0.0933 0.0247 0.0883 0.0239
32 15.7287 4.1151 15.5138 4.1655 0.0948 0.0248 0.0898 0.0241
33 15.7969 4.1299 15.6021 4.2096 0.0952 0.0249 0.0903 0.0244
Table 8 5th harmonic nodal prices for ZIP load at without and with solar (PV) power
bus
No:
Without reconciliation at
without PV power
Without reconciliation at
with PV power
With reconciliation at
without PV power
With reconciliation at
with PV power
Npi
($/MWh)
Nqi
($/MVARh)
Npi
($/MWh)
Nqi
($/MVARh)
Npi
($/MWh)
Nqi
($/MVARh)
Npi
($/MWh)
Nqi
($/MVARh)
1 0 0 0 0 0 0 0 0
2 0.1324 0.0669 0.1690 0.0864 0.0004 0.0002 0.0007 0.0004
3 3.5779 0.2567 2.3080 1.9902 0.0103 0.0007 0.0097 0.0084
4 5.6644 0.4819 4.3264 2.2066 0.0163 0.0014 0.0182 0.0093
5 7.8327 0.6981 6.4358 2.4129 0.0225 0.002 0.0271 0.0102
6 14.3061 1.7716 12.7884 3.4756 0.0411 0.0051 0.0538 0.0146
7 15.3802 2.256 13.9014 3.9693 0.0442 0.0065 0.0585 0.0167
8 20.6941 1.6538 19.0091 3.3422 0.0595 0.0048 0.0800 0.0141
9 23.3129 1.2613 21.4406 2.8925 0.067 0.0036 0.0902 0.0122
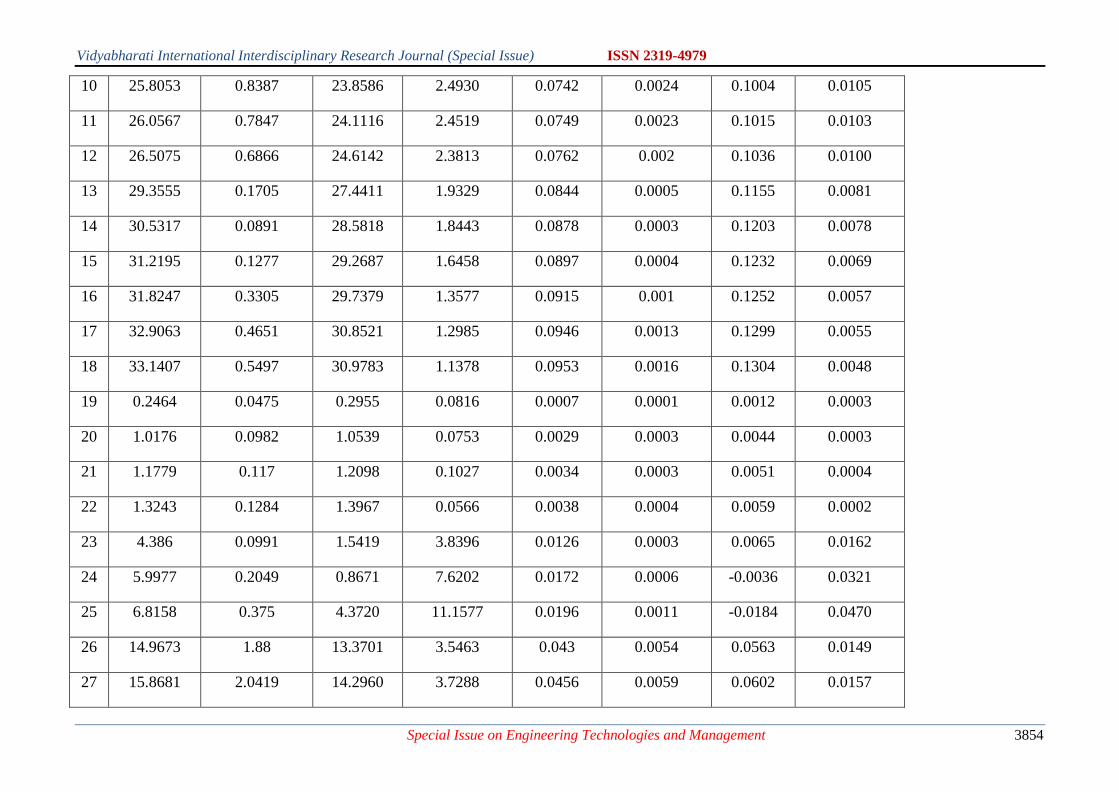
Vidyabharati International Interdisciplinary Research Journal (Special Issue) ISSN 2319-4979
Special Issue on Engineering Technologies and Management 3854
10 25.8053 0.8387 23.8586 2.4930 0.0742 0.0024 0.1004 0.0105
11 26.0567 0.7847 24.1116 2.4519 0.0749 0.0023 0.1015 0.0103
12 26.5075 0.6866 24.6142 2.3813 0.0762 0.002 0.1036 0.0100
13 29.3555 0.1705 27.4411 1.9329 0.0844 0.0005 0.1155 0.0081
14 30.5317 0.0891 28.5818 1.8443 0.0878 0.0003 0.1203 0.0078
15 31.2195 0.1277 29.2687 1.6458 0.0897 0.0004 0.1232 0.0069
16 31.8247 0.3305 29.7379 1.3577 0.0915 0.001 0.1252 0.0057
17 32.9063 0.4651 30.8521 1.2985 0.0946 0.0013 0.1299 0.0055
18 33.1407 0.5497 30.9783 1.1378 0.0953 0.0016 0.1304 0.0048
19 0.2464 0.0475 0.2955 0.0816 0.0007 0.0001 0.0012 0.0003
20 1.0176 0.0982 1.0539 0.0753 0.0029 0.0003 0.0044 0.0003
21 1.1779 0.117 1.2098 0.1027 0.0034 0.0003 0.0051 0.0004
22 1.3243 0.1284 1.3967 0.0566 0.0038 0.0004 0.0059 0.0002
23 4.386 0.0991 1.5419 3.8396 0.0126 0.0003 0.0065 0.0162
24 5.9977 0.2049 0.8671 7.6202 0.0172 0.0006 -0.0036 0.0321
25 6.8158 0.375 4.3720 11.1577 0.0196 0.0011 -0.0184 0.0470
26 14.9673 1.88 13.3701 3.5463 0.043 0.0054 0.0563 0.0149
27 15.8681 2.0419 14.2960 3.7288 0.0456 0.0059 0.0602 0.0157
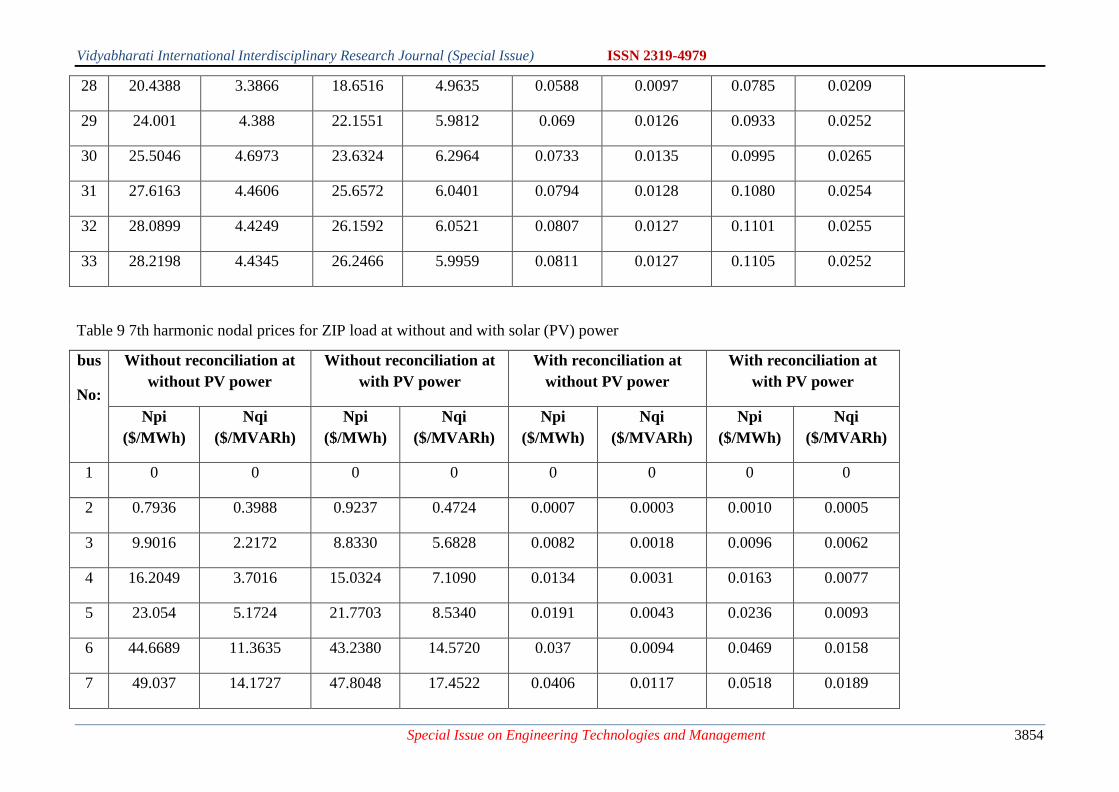
Vidyabharati International Interdisciplinary Research Journal (Special Issue) ISSN 2319-4979
Special Issue on Engineering Technologies and Management 3854
28 20.4388 3.3866 18.6516 4.9635 0.0588 0.0097 0.0785 0.0209
29 24.001 4.388 22.1551 5.9812 0.069 0.0126 0.0933 0.0252
30 25.5046 4.6973 23.6324 6.2964 0.0733 0.0135 0.0995 0.0265
31 27.6163 4.4606 25.6572 6.0401 0.0794 0.0128 0.1080 0.0254
32 28.0899 4.4249 26.1592 6.0521 0.0807 0.0127 0.1101 0.0255
33 28.2198 4.4345 26.2466 5.9959 0.0811 0.0127 0.1105 0.0252
Table 9 7th harmonic nodal prices for ZIP load at without and with solar (PV) power
bus
No:
Without reconciliation at
without PV power
Without reconciliation at
with PV power
With reconciliation at
without PV power
With reconciliation at
with PV power
Npi
($/MWh)
Nqi
($/MVARh)
Npi
($/MWh)
Nqi
($/MVARh)
Npi
($/MWh)
Nqi
($/MVARh)
Npi
($/MWh)
Nqi
($/MVARh)
1 0 0 0 0 0 0 0 0
2 0.7936 0.3988 0.9237 0.4724 0.0007 0.0003 0.0010 0.0005
3 9.9016 2.2172 8.8330 5.6828 0.0082 0.0018 0.0096 0.0062
4 16.2049 3.7016 15.0324 7.1090 0.0134 0.0031 0.0163 0.0077
5 23.054 5.1724 21.7703 8.5340 0.0191 0.0043 0.0236 0.0093
6 44.6689 11.3635 43.2380 14.5720 0.037 0.0094 0.0469 0.0158
7 49.037 14.1727 47.8048 17.4522 0.0406 0.0117 0.0518 0.0189
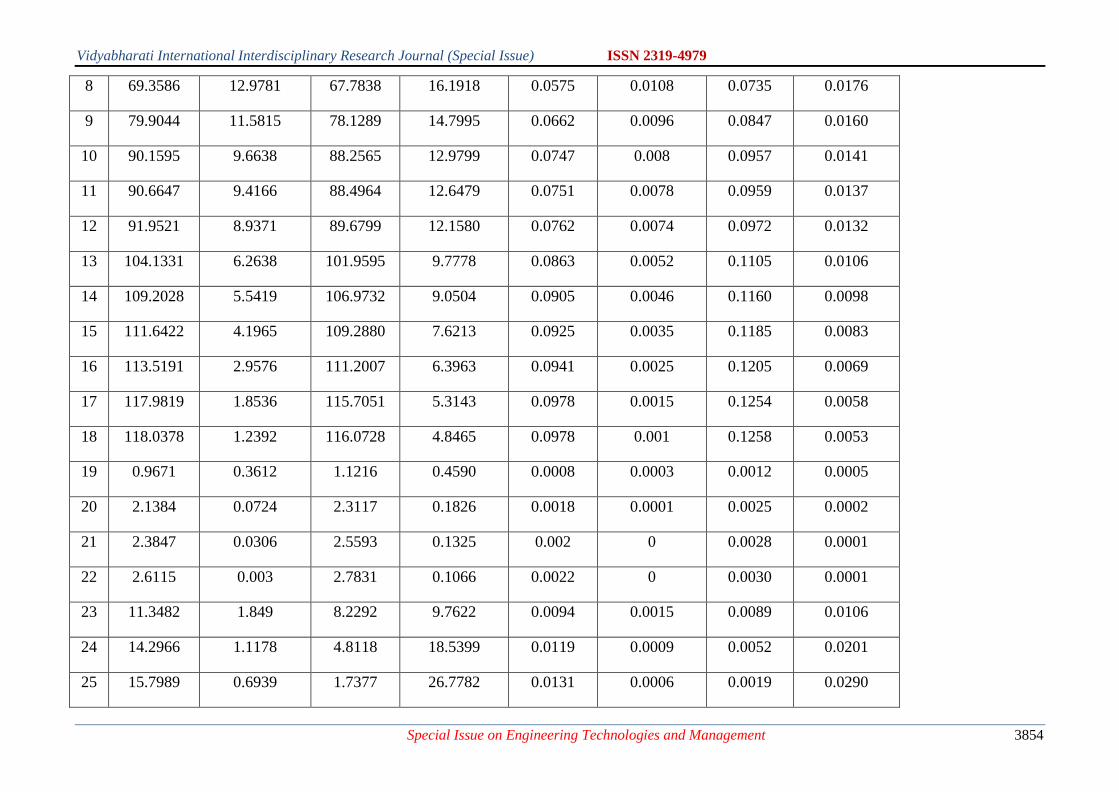
Vidyabharati International Interdisciplinary Research Journal (Special Issue) ISSN 2319-4979
Special Issue on Engineering Technologies and Management 3854
8 69.3586 12.9781 67.7838 16.1918 0.0575 0.0108 0.0735 0.0176
9 79.9044 11.5815 78.1289 14.7995 0.0662 0.0096 0.0847 0.0160
10 90.1595 9.6638 88.2565 12.9799 0.0747 0.008 0.0957 0.0141
11 90.6647 9.4166 88.4964 12.6479 0.0751 0.0078 0.0959 0.0137
12 91.9521 8.9371 89.6799 12.1580 0.0762 0.0074 0.0972 0.0132
13 104.1331 6.2638 101.9595 9.7778 0.0863 0.0052 0.1105 0.0106
14 109.2028 5.5419 106.9732 9.0504 0.0905 0.0046 0.1160 0.0098
15 111.6422 4.1965 109.2880 7.6213 0.0925 0.0035 0.1185 0.0083
16 113.5191 2.9576 111.2007 6.3963 0.0941 0.0025 0.1205 0.0069
17 117.9819 1.8536 115.7051 5.3143 0.0978 0.0015 0.1254 0.0058
18 118.0378 1.2392 116.0728 4.8465 0.0978 0.001 0.1258 0.0053
19 0.9671 0.3612 1.1216 0.4590 0.0008 0.0003 0.0012 0.0005
20 2.1384 0.0724 2.3117 0.1826 0.0018 0.0001 0.0025 0.0002
21 2.3847 0.0306 2.5593 0.1325 0.002 0 0.0028 0.0001
22 2.6115 0.003 2.7831 0.1066 0.0022 0 0.0030 0.0001
23 11.3482 1.849 8.2292 9.7622 0.0094 0.0015 0.0089 0.0106
24 14.2966 1.1178 4.8118 18.5399 0.0119 0.0009 0.0052 0.0201
25 15.7989 0.6939 1.7377 26.7782 0.0131 0.0006 0.0019 0.0290
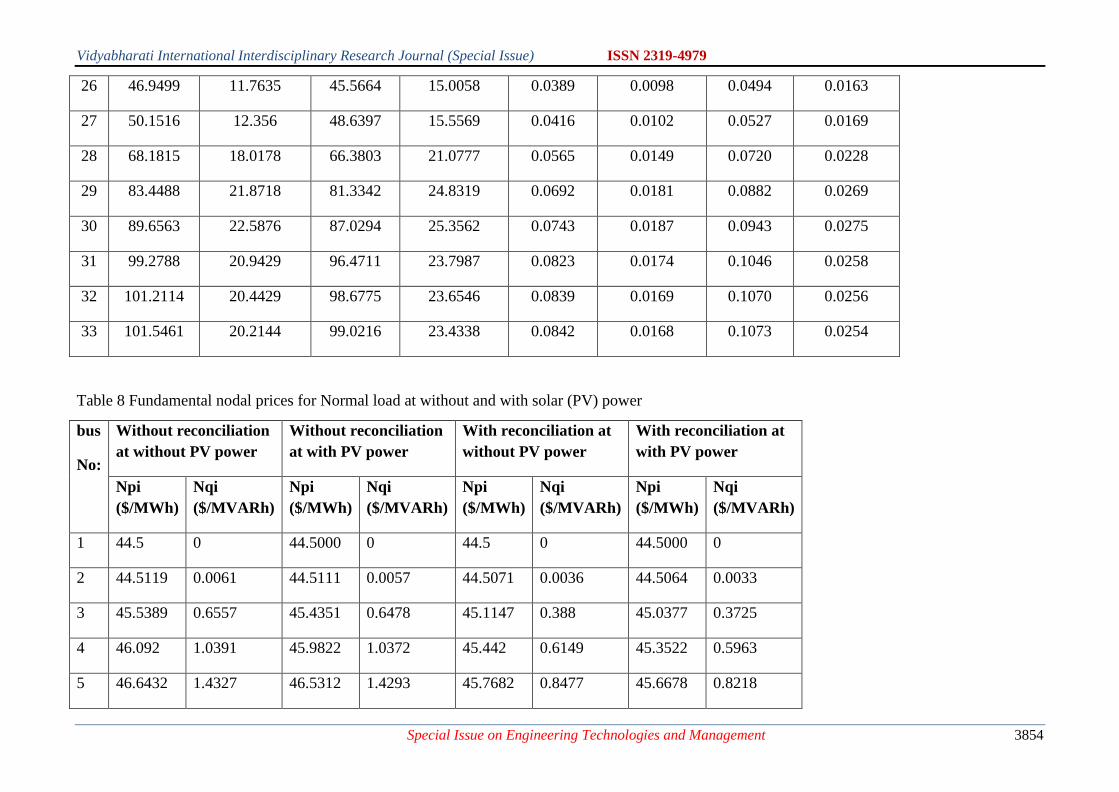
Vidyabharati International Interdisciplinary Research Journal (Special Issue) ISSN 2319-4979
Special Issue on Engineering Technologies and Management 3854
26 46.9499 11.7635 45.5664 15.0058 0.0389 0.0098 0.0494 0.0163
27 50.1516 12.356 48.6397 15.5569 0.0416 0.0102 0.0527 0.0169
28 68.1815 18.0178 66.3803 21.0777 0.0565 0.0149 0.0720 0.0228
29 83.4488 21.8718 81.3342 24.8319 0.0692 0.0181 0.0882 0.0269
30 89.6563 22.5876 87.0294 25.3562 0.0743 0.0187 0.0943 0.0275
31 99.2788 20.9429 96.4711 23.7987 0.0823 0.0174 0.1046 0.0258
32 101.2114 20.4429 98.6775 23.6546 0.0839 0.0169 0.1070 0.0256
33 101.5461 20.2144 99.0216 23.4338 0.0842 0.0168 0.1073 0.0254
Table 8 Fundamental nodal prices for Normal load at without and with solar (PV) power
bus
No:
Without reconciliation
at without PV power
Without reconciliation
at with PV power
With reconciliation at
without PV power
With reconciliation at
with PV power
Npi
($/MWh)
Nqi
($/MVARh)
Npi
($/MWh)
Nqi
($/MVARh)
Npi
($/MWh)
Nqi
($/MVARh)
Npi
($/MWh)
Nqi
($/MVARh)
1 44.5 0 44.5000 0 44.5 0 44.5000 0
2 44.5119 0.0061 44.5111 0.0057 44.5071 0.0036 44.5064 0.0033
3 45.5389 0.6557 45.4351 0.6478 45.1147 0.388 45.0377 0.3725
4 46.092 1.0391 45.9822 1.0372 45.442 0.6149 45.3522 0.5963
5 46.6432 1.4327 46.5312 1.4293 45.7682 0.8477 45.6678 0.8218
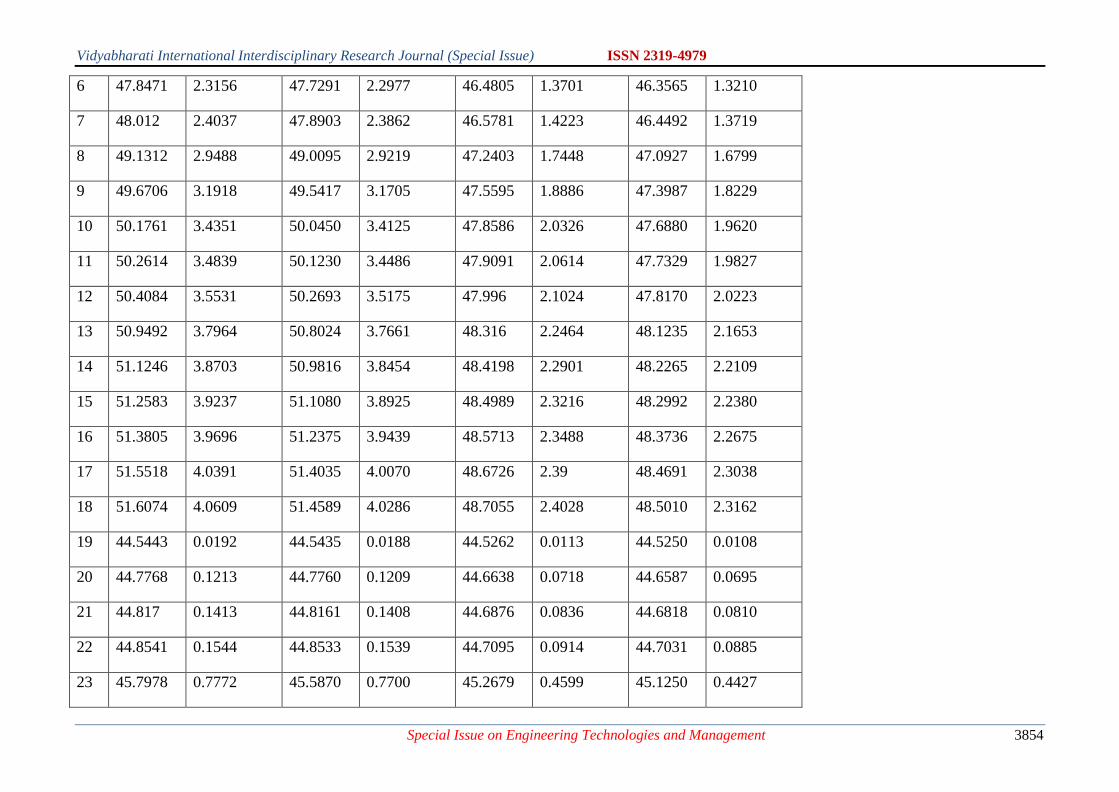
Vidyabharati International Interdisciplinary Research Journal (Special Issue) ISSN 2319-4979
Special Issue on Engineering Technologies and Management 3854
6 47.8471 2.3156 47.7291 2.2977 46.4805 1.3701 46.3565 1.3210
7 48.012 2.4037 47.8903 2.3862 46.5781 1.4223 46.4492 1.3719
8 49.1312 2.9488 49.0095 2.9219 47.2403 1.7448 47.0927 1.6799
9 49.6706 3.1918 49.5417 3.1705 47.5595 1.8886 47.3987 1.8229
10 50.1761 3.4351 50.0450 3.4125 47.8586 2.0326 47.6880 1.9620
11 50.2614 3.4839 50.1230 3.4486 47.9091 2.0614 47.7329 1.9827
12 50.4084 3.5531 50.2693 3.5175 47.996 2.1024 47.8170 2.0223
13 50.9492 3.7964 50.8024 3.7661 48.316 2.2464 48.1235 2.1653
14 51.1246 3.8703 50.9816 3.8454 48.4198 2.2901 48.2265 2.2109
15 51.2583 3.9237 51.1080 3.8925 48.4989 2.3216 48.2992 2.2380
16 51.3805 3.9696 51.2375 3.9439 48.5713 2.3488 48.3736 2.2675
17 51.5518 4.0391 51.4035 4.0070 48.6726 2.39 48.4691 2.3038
18 51.6074 4.0609 51.4589 4.0286 48.7055 2.4028 48.5010 2.3162
19 44.5443 0.0192 44.5435 0.0188 44.5262 0.0113 44.5250 0.0108
20 44.7768 0.1213 44.7760 0.1209 44.6638 0.0718 44.6587 0.0695
21 44.817 0.1413 44.8161 0.1408 44.6876 0.0836 44.6818 0.0810
22 44.8541 0.1544 44.8533 0.1539 44.7095 0.0914 44.7031 0.0885
23 45.7978 0.7772 45.5870 0.7700 45.2679 0.4599 45.1250 0.4427
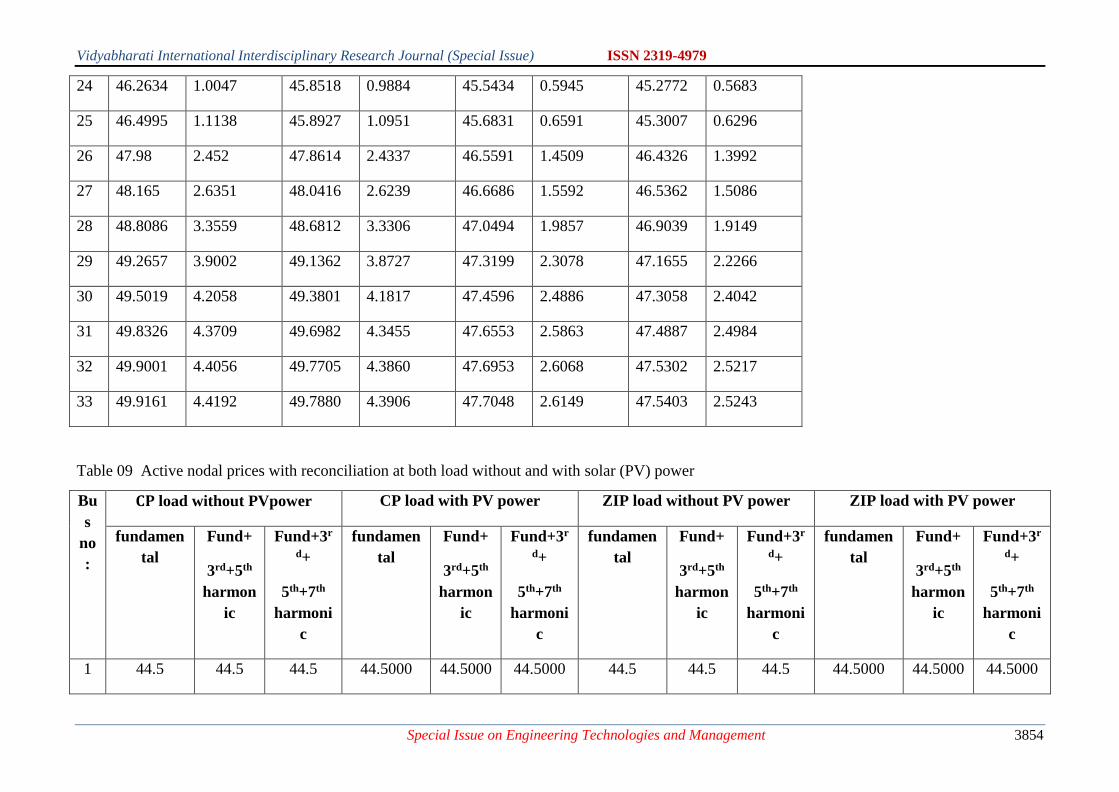
Vidyabharati International Interdisciplinary Research Journal (Special Issue) ISSN 2319-4979
Special Issue on Engineering Technologies and Management 3854
24 46.2634 1.0047 45.8518 0.9884 45.5434 0.5945 45.2772 0.5683
25 46.4995 1.1138 45.8927 1.0951 45.6831 0.6591 45.3007 0.6296
26 47.98 2.452 47.8614 2.4337 46.5591 1.4509 46.4326 1.3992
27 48.165 2.6351 48.0416 2.6239 46.6686 1.5592 46.5362 1.5086
28 48.8086 3.3559 48.6812 3.3306 47.0494 1.9857 46.9039 1.9149
29 49.2657 3.9002 49.1362 3.8727 47.3199 2.3078 47.1655 2.2266
30 49.5019 4.2058 49.3801 4.1817 47.4596 2.4886 47.3058 2.4042
31 49.8326 4.3709 49.6982 4.3455 47.6553 2.5863 47.4887 2.4984
32 49.9001 4.4056 49.7705 4.3860 47.6953 2.6068 47.5302 2.5217
33 49.9161 4.4192 49.7880 4.3906 47.7048 2.6149 47.5403 2.5243
Table 09 Active nodal prices with reconciliation at both load without and with solar (PV) power
Bu
s
no
:
𝐂𝐏 load without PVpower CP load with PV power ZIP load without PV power ZIP load with PV power
fundamen
tal
Fund+
3rd+5th
harmon
ic
Fund+3r
d+
5th+7th
harmoni
c
fundamen
tal
Fund+
3rd+5th
harmon
ic
Fund+3r
d+
5th+7th
harmoni
c
fundamen
tal
Fund+
3rd+5th
harmon
ic
Fund+3r
d+
5th+7th
harmoni
c
fundamen
tal
Fund+
3rd+5th
harmon
ic
Fund+3r
d+
5th+7th
harmoni
c
1 44.5 44.5 44.5 44.5000 44.5000 44.5000 44.5 44.5 44.5 44.5000 44.5000 44.5000
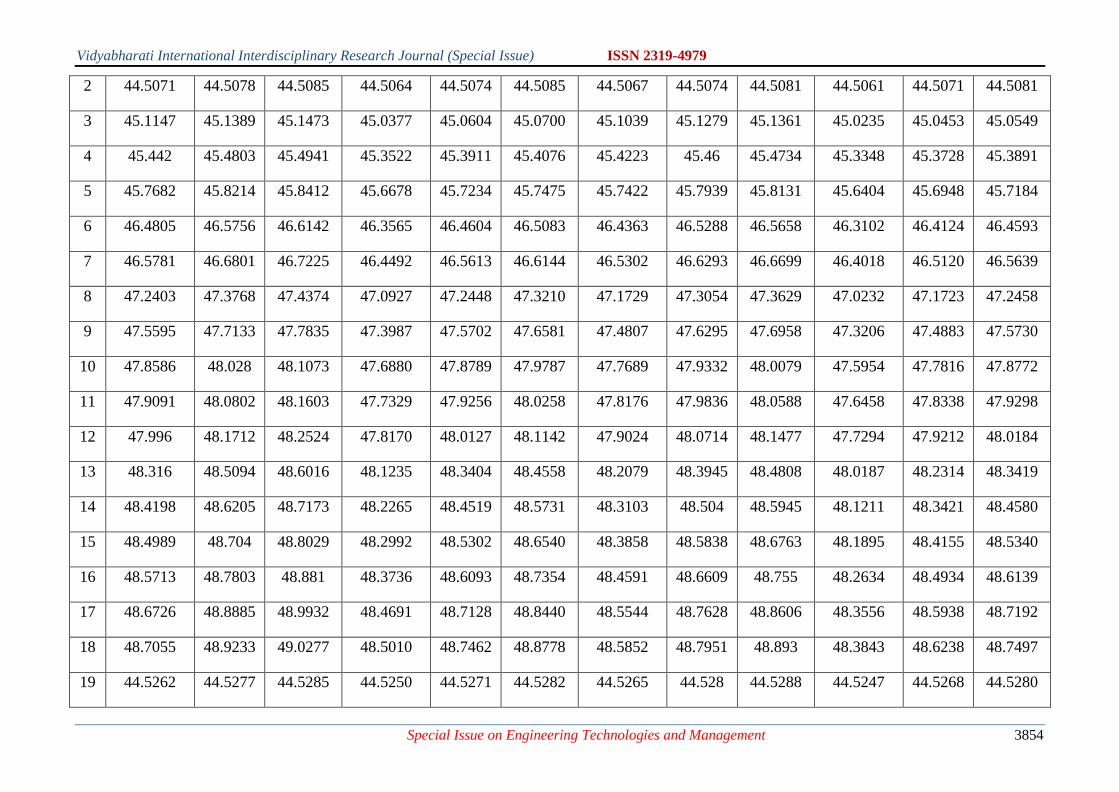
Vidyabharati International Interdisciplinary Research Journal (Special Issue) ISSN 2319-4979
Special Issue on Engineering Technologies and Management 3854
2 44.5071 44.5078 44.5085 44.5064 44.5074 44.5085 44.5067 44.5074 44.5081 44.5061 44.5071 44.5081
3 45.1147 45.1389 45.1473 45.0377 45.0604 45.0700 45.1039 45.1279 45.1361 45.0235 45.0453 45.0549
4 45.442 45.4803 45.4941 45.3522 45.3911 45.4076 45.4223 45.46 45.4734 45.3348 45.3728 45.3891
5 45.7682 45.8214 45.8412 45.6678 45.7234 45.7475 45.7422 45.7939 45.8131 45.6404 45.6948 45.7184
6 46.4805 46.5756 46.6142 46.3565 46.4604 46.5083 46.4363 46.5288 46.5658 46.3102 46.4124 46.4593
7 46.5781 46.6801 46.7225 46.4492 46.5613 46.6144 46.5302 46.6293 46.6699 46.4018 46.5120 46.5639
8 47.2403 47.3768 47.4374 47.0927 47.2448 47.3210 47.1729 47.3054 47.3629 47.0232 47.1723 47.2458
9 47.5595 47.7133 47.7835 47.3987 47.5702 47.6581 47.4807 47.6295 47.6958 47.3206 47.4883 47.5730
10 47.8586 48.028 48.1073 47.6880 47.8789 47.9787 47.7689 47.9332 48.0079 47.5954 47.7816 47.8772
11 47.9091 48.0802 48.1603 47.7329 47.9256 48.0258 47.8176 47.9836 48.0588 47.6458 47.8338 47.9298
12 47.996 48.1712 48.2524 47.8170 48.0127 48.1142 47.9024 48.0714 48.1477 47.7294 47.9212 48.0184
13 48.316 48.5094 48.6016 48.1235 48.3404 48.4558 48.2079 48.3945 48.4808 48.0187 48.2314 48.3419
14 48.4198 48.6205 48.7173 48.2265 48.4519 48.5731 48.3103 48.504 48.5945 48.1211 48.3421 48.4580
15 48.4989 48.704 48.8029 48.2992 48.5302 48.6540 48.3858 48.5838 48.6763 48.1895 48.4155 48.5340
16 48.5713 48.7803 48.881 48.3736 48.6093 48.7354 48.4591 48.6609 48.755 48.2634 48.4934 48.6139
17 48.6726 48.8885 48.9932 48.4691 48.7128 48.8440 48.5544 48.7628 48.8606 48.3556 48.5938 48.7192
18 48.7055 48.9233 49.0277 48.5010 48.7462 48.8778 48.5852 48.7951 48.893 48.3843 48.6238 48.7497
19 44.5262 44.5277 44.5285 44.5250 44.5271 44.5282 44.5265 44.528 44.5288 44.5247 44.5268 44.5280
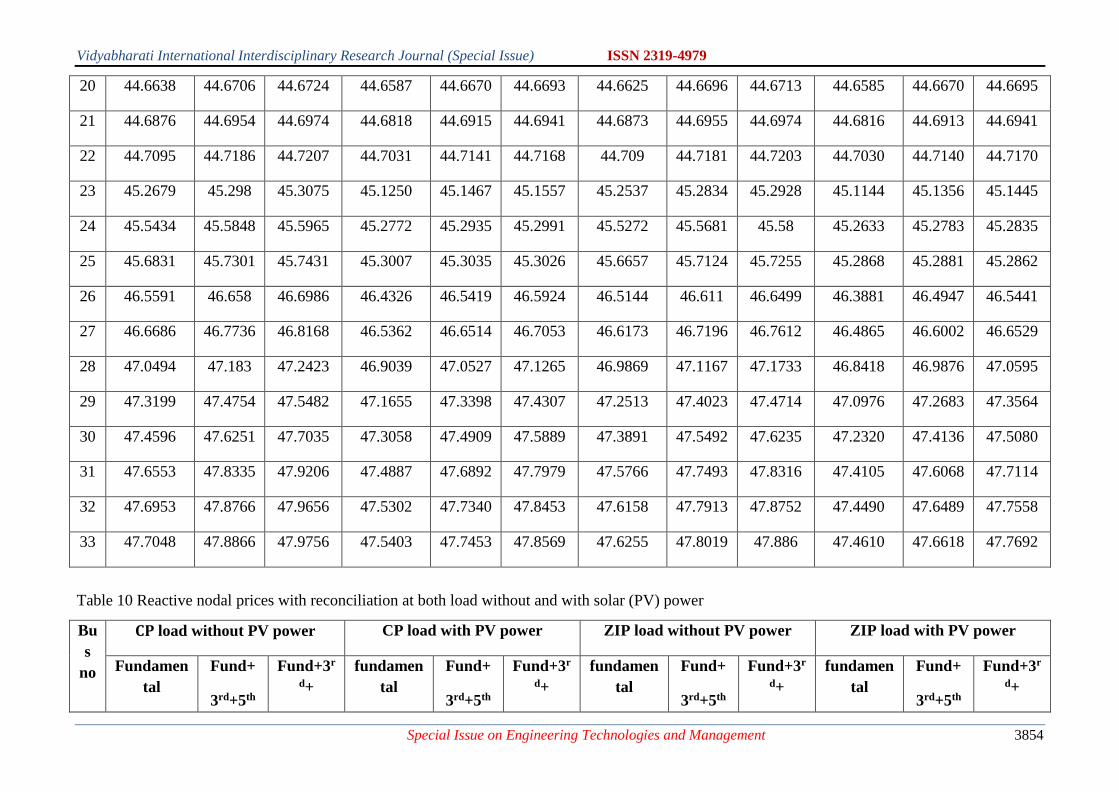
Vidyabharati International Interdisciplinary Research Journal (Special Issue) ISSN 2319-4979
Special Issue on Engineering Technologies and Management 3854
20 44.6638 44.6706 44.6724 44.6587 44.6670 44.6693 44.6625 44.6696 44.6713 44.6585 44.6670 44.6695
21 44.6876 44.6954 44.6974 44.6818 44.6915 44.6941 44.6873 44.6955 44.6974 44.6816 44.6913 44.6941
22 44.7095 44.7186 44.7207 44.7031 44.7141 44.7168 44.709 44.7181 44.7203 44.7030 44.7140 44.7170
23 45.2679 45.298 45.3075 45.1250 45.1467 45.1557 45.2537 45.2834 45.2928 45.1144 45.1356 45.1445
24 45.5434 45.5848 45.5965 45.2772 45.2935 45.2991 45.5272 45.5681 45.58 45.2633 45.2783 45.2835
25 45.6831 45.7301 45.7431 45.3007 45.3035 45.3026 45.6657 45.7124 45.7255 45.2868 45.2881 45.2862
26 46.5591 46.658 46.6986 46.4326 46.5419 46.5924 46.5144 46.611 46.6499 46.3881 46.4947 46.5441
27 46.6686 46.7736 46.8168 46.5362 46.6514 46.7053 46.6173 46.7196 46.7612 46.4865 46.6002 46.6529
28 47.0494 47.183 47.2423 46.9039 47.0527 47.1265 46.9869 47.1167 47.1733 46.8418 46.9876 47.0595
29 47.3199 47.4754 47.5482 47.1655 47.3398 47.4307 47.2513 47.4023 47.4714 47.0976 47.2683 47.3564
30 47.4596 47.6251 47.7035 47.3058 47.4909 47.5889 47.3891 47.5492 47.6235 47.2320 47.4136 47.5080
31 47.6553 47.8335 47.9206 47.4887 47.6892 47.7979 47.5766 47.7493 47.8316 47.4105 47.6068 47.7114
32 47.6953 47.8766 47.9656 47.5302 47.7340 47.8453 47.6158 47.7913 47.8752 47.4490 47.6489 47.7558
33 47.7048 47.8866 47.9756 47.5403 47.7453 47.8569 47.6255 47.8019 47.886 47.4610 47.6618 47.7692
Table 10 Reactive nodal prices with reconciliation at both load without and with solar (PV) power
Bu
s
no
𝐂𝐏 load without PV power CP load with PV power ZIP load without PV power ZIP load with PV power
Fundamen
tal
Fund+
3rd+5th
Fund+3r
d+
fundamen
tal
Fund+
3rd+5th
Fund+3r
d+
fundamen
tal
Fund+
3rd+5th
Fund+3r
d+
fundamen
tal
Fund+
3rd+5th
Fund+3r
d+
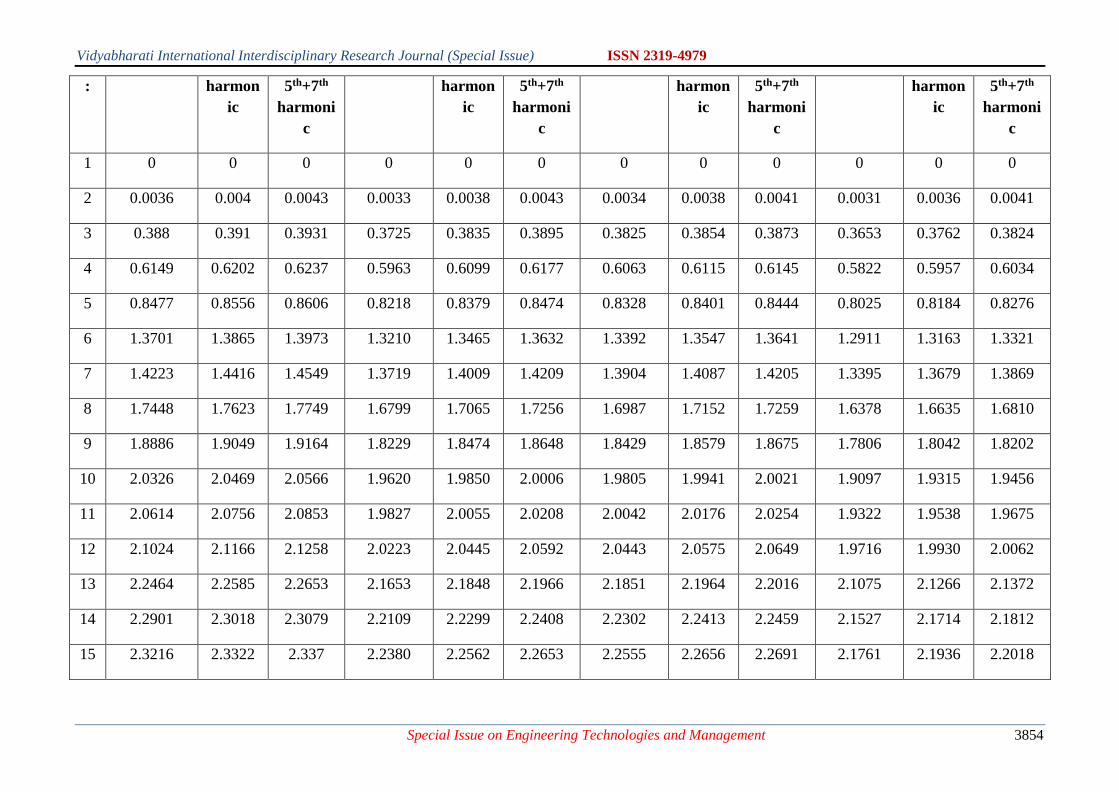
Vidyabharati International Interdisciplinary Research Journal (Special Issue) ISSN 2319-4979
Special Issue on Engineering Technologies and Management 3854
: harmon
ic
5th+7th
harmoni
c
harmon
ic
5th+7th
harmoni
c
harmon
ic
5th+7th
harmoni
c
harmon
ic
5th+7th
harmoni
c
1 0 0 0 0 0 0 0 0 0 0 0 0
2 0.0036 0.004 0.0043 0.0033 0.0038 0.0043 0.0034 0.0038 0.0041 0.0031 0.0036 0.0041
3 0.388 0.391 0.3931 0.3725 0.3835 0.3895 0.3825 0.3854 0.3873 0.3653 0.3762 0.3824
4 0.6149 0.6202 0.6237 0.5963 0.6099 0.6177 0.6063 0.6115 0.6145 0.5822 0.5957 0.6034
5 0.8477 0.8556 0.8606 0.8218 0.8379 0.8474 0.8328 0.8401 0.8444 0.8025 0.8184 0.8276
6 1.3701 1.3865 1.3973 1.3210 1.3465 1.3632 1.3392 1.3547 1.3641 1.2911 1.3163 1.3321
7 1.4223 1.4416 1.4549 1.3719 1.4009 1.4209 1.3904 1.4087 1.4205 1.3395 1.3679 1.3869
8 1.7448 1.7623 1.7749 1.6799 1.7065 1.7256 1.6987 1.7152 1.7259 1.6378 1.6635 1.6810
9 1.8886 1.9049 1.9164 1.8229 1.8474 1.8648 1.8429 1.8579 1.8675 1.7806 1.8042 1.8202
10 2.0326 2.0469 2.0566 1.9620 1.9850 2.0006 1.9805 1.9941 2.0021 1.9097 1.9315 1.9456
11 2.0614 2.0756 2.0853 1.9827 2.0055 2.0208 2.0042 2.0176 2.0254 1.9322 1.9538 1.9675
12 2.1024 2.1166 2.1258 2.0223 2.0445 2.0592 2.0443 2.0575 2.0649 1.9716 1.9930 2.0062
13 2.2464 2.2585 2.2653 2.1653 2.1848 2.1966 2.1851 2.1964 2.2016 2.1075 2.1266 2.1372
14 2.2901 2.3018 2.3079 2.2109 2.2299 2.2408 2.2302 2.2413 2.2459 2.1527 2.1714 2.1812
15 2.3216 2.3322 2.337 2.2380 2.2562 2.2653 2.2555 2.2656 2.2691 2.1761 2.1936 2.2018
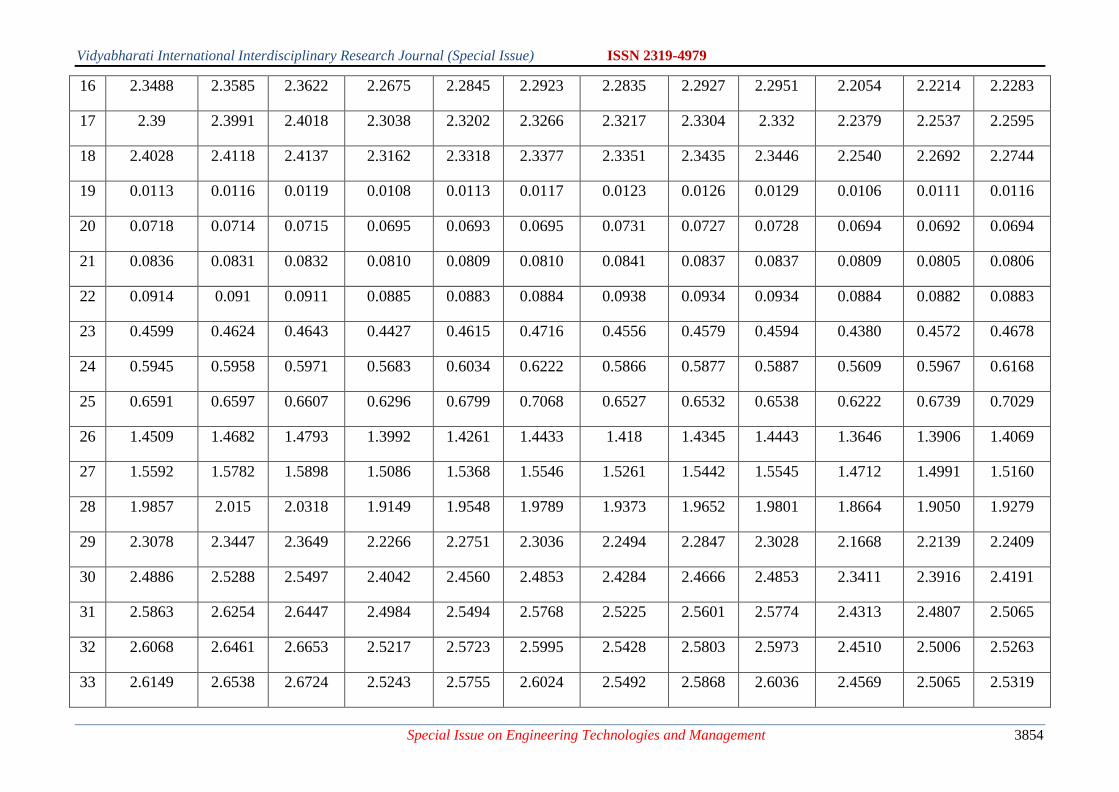
Vidyabharati International Interdisciplinary Research Journal (Special Issue) ISSN 2319-4979
Special Issue on Engineering Technologies and Management 3854
16 2.3488 2.3585 2.3622 2.2675 2.2845 2.2923 2.2835 2.2927 2.2951 2.2054 2.2214 2.2283
17 2.39 2.3991 2.4018 2.3038 2.3202 2.3266 2.3217 2.3304 2.332 2.2379 2.2537 2.2595
18 2.4028 2.4118 2.4137 2.3162 2.3318 2.3377 2.3351 2.3435 2.3446 2.2540 2.2692 2.2744
19 0.0113 0.0116 0.0119 0.0108 0.0113 0.0117 0.0123 0.0126 0.0129 0.0106 0.0111 0.0116
20 0.0718 0.0714 0.0715 0.0695 0.0693 0.0695 0.0731 0.0727 0.0728 0.0694 0.0692 0.0694
21 0.0836 0.0831 0.0832 0.0810 0.0809 0.0810 0.0841 0.0837 0.0837 0.0809 0.0805 0.0806
22 0.0914 0.091 0.0911 0.0885 0.0883 0.0884 0.0938 0.0934 0.0934 0.0884 0.0882 0.0883
23 0.4599 0.4624 0.4643 0.4427 0.4615 0.4716 0.4556 0.4579 0.4594 0.4380 0.4572 0.4678
24 0.5945 0.5958 0.5971 0.5683 0.6034 0.6222 0.5866 0.5877 0.5887 0.5609 0.5967 0.6168
25 0.6591 0.6597 0.6607 0.6296 0.6799 0.7068 0.6527 0.6532 0.6538 0.6222 0.6739 0.7029
26 1.4509 1.4682 1.4793 1.3992 1.4261 1.4433 1.418 1.4345 1.4443 1.3646 1.3906 1.4069
27 1.5592 1.5782 1.5898 1.5086 1.5368 1.5546 1.5261 1.5442 1.5545 1.4712 1.4991 1.5160
28 1.9857 2.015 2.0318 1.9149 1.9548 1.9789 1.9373 1.9652 1.9801 1.8664 1.9050 1.9279
29 2.3078 2.3447 2.3649 2.2266 2.2751 2.3036 2.2494 2.2847 2.3028 2.1668 2.2139 2.2409
30 2.4886 2.5288 2.5497 2.4042 2.4560 2.4853 2.4284 2.4666 2.4853 2.3411 2.3916 2.4191
31 2.5863 2.6254 2.6447 2.4984 2.5494 2.5768 2.5225 2.5601 2.5774 2.4313 2.4807 2.5065
32 2.6068 2.6461 2.6653 2.5217 2.5723 2.5995 2.5428 2.5803 2.5973 2.4510 2.5006 2.5263
33 2.6149 2.6538 2.6724 2.5243 2.5755 2.6024 2.5492 2.5868 2.6036 2.4569 2.5065 2.5319
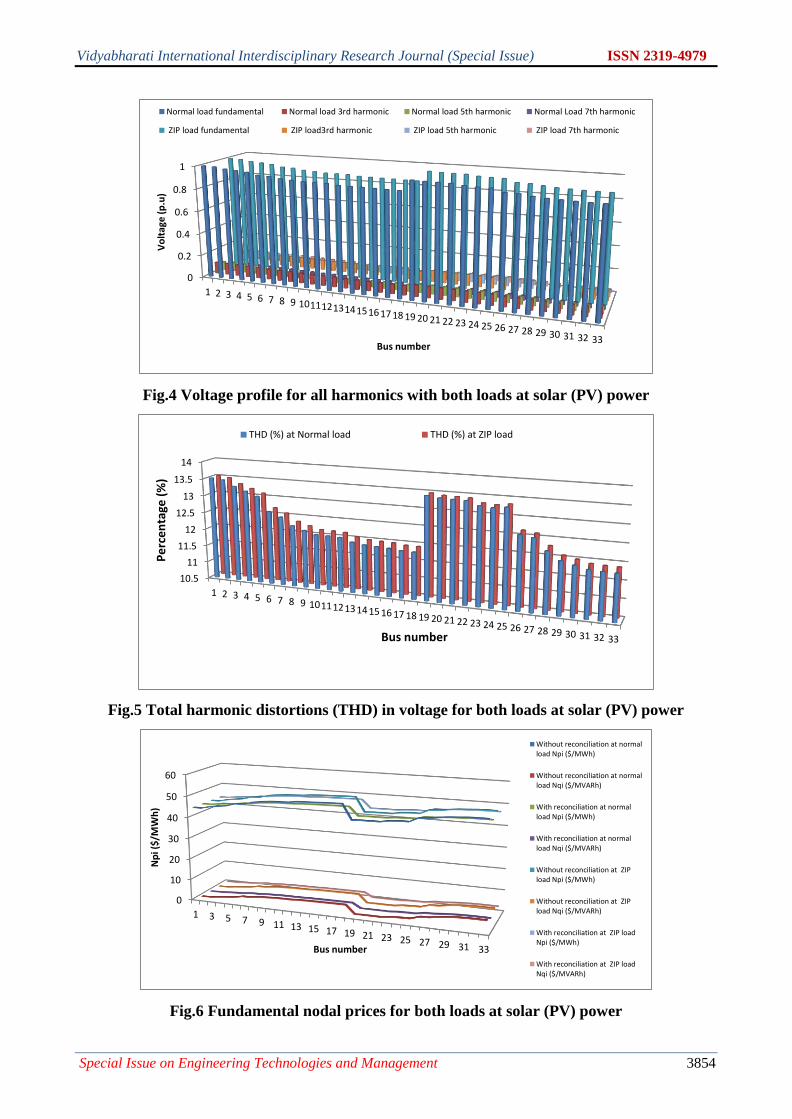
Vidyabharati International Interdisciplinary Research Journal (Special Issue) ISSN 2319-4979
Special Issue on Engineering Technologies and Management 3854
Fig.4 Voltage profile for all harmonics with both loads at solar (PV) power
Fig.5 Total harmonic distortions (THD) in voltage for both loads at solar (PV) power
Fig.6 Fundamental nodal prices for both loads at solar (PV) power
0
0.2
0.4
0.6
0.8
1
1 2 3 4 5 6 7 8 9 1011121314151617 18 19 20 21 22 23 24 25 26 27 28 29 30 31 32 33
Vo
ltag
e (
p.u
)
Bus number
Normal load fundamental Normal load 3rd harmonic Normal load 5th harmonic Normal Load 7th harmonic
ZIP load fundamental ZIP load3rd harmonic ZIP load 5th harmonic ZIP load 7th harmonic
10.5
11
11.5
12
12.5
13
13.5
14
1 2 3 4 5 6 7 8 9 1011121314 15 16 17 18 19 20 21 22 23 24 25 26 27 28 29 30 31 32 33
Pe
rce
nta
ge (
%)
Bus number
THD (%) at Normal load THD (%) at ZIP load
0
10
20
30
40
50
60
1 3 5 7 9 11 13 15 17 19 21 23 25 27 29 31 33
Np
i ($
/MW
h)
Bus number
Without reconciliation at normalload Npi ($/MWh)
Without reconciliation at normalload Nqi ($/MVARh)
With reconciliation at normalload Npi ($/MWh)
With reconciliation at normalload Nqi ($/MVARh)
Without reconciliation at ZIPload Npi ($/MWh)
Without reconciliation at ZIPload Nqi ($/MVARh)
With reconciliation at ZIP loadNpi ($/MWh)
With reconciliation at ZIP loadNqi ($/MVARh)
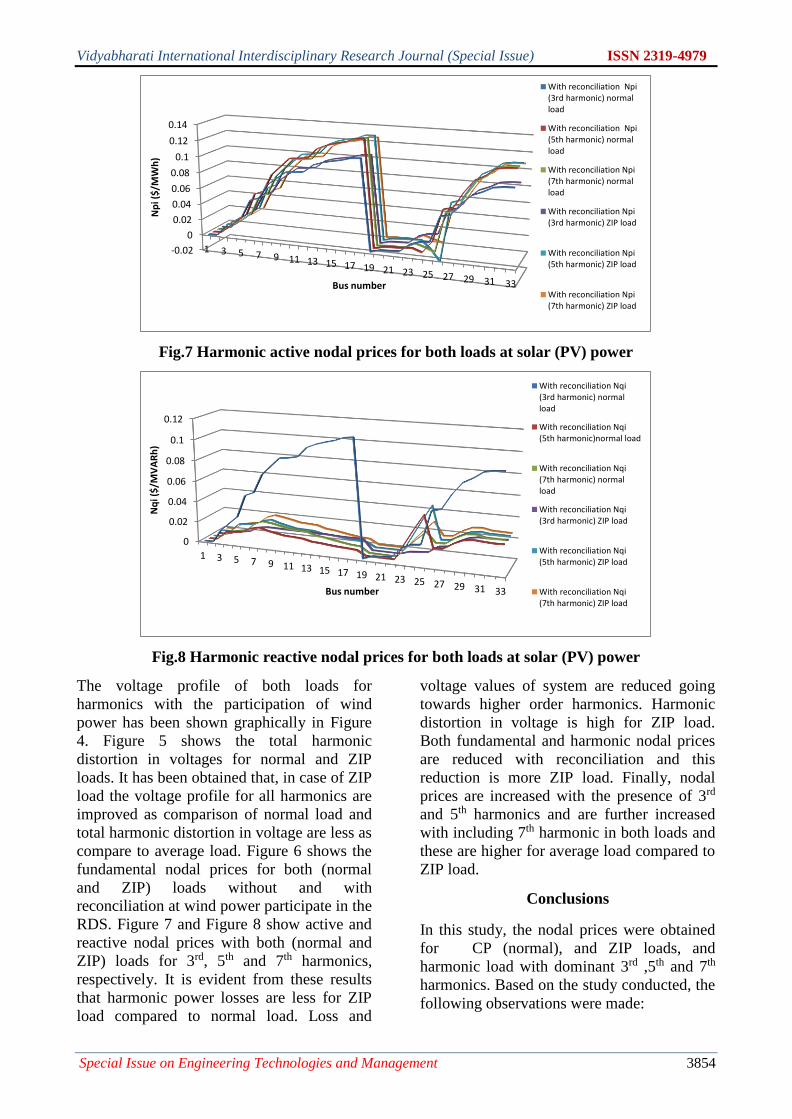
Vidyabharati International Interdisciplinary Research Journal (Special Issue) ISSN 2319-4979
Special Issue on Engineering Technologies and Management 3854
Fig.7 Harmonic active nodal prices for both loads at solar (PV) power
Fig.8 Harmonic reactive nodal prices for both loads at solar (PV) power
The voltage profile of both loads for
harmonics with the participation of wind
power has been shown graphically in Figure
4. Figure 5 shows the total harmonic
distortion in voltages for normal and ZIP
loads. It has been obtained that, in case of ZIP
load the voltage profile for all harmonics are
improved as comparison of normal load and
total harmonic distortion in voltage are less as
compare to average load. Figure 6 shows the
fundamental nodal prices for both (normal
and ZIP) loads without and with
reconciliation at wind power participate in the
RDS. Figure 7 and Figure 8 show active and
reactive nodal prices with both (normal and
ZIP) loads for 3rd, 5th and 7th harmonics,
respectively. It is evident from these results
that harmonic power losses are less for ZIP
load compared to normal load. Loss and
voltage values of system are reduced going
towards higher order harmonics. Harmonic
distortion in voltage is high for ZIP load.
Both fundamental and harmonic nodal prices
are reduced with reconciliation and this
reduction is more ZIP load. Finally, nodal
prices are increased with the presence of 3rd
and 5th harmonics and are further increased
with including 7th harmonic in both loads and
these are higher for average load compared to
ZIP load.
Conclusions
In this study, the nodal prices were obtained
for CP (normal), and ZIP loads, and
harmonic load with dominant 3rd ,5th and 7th
harmonics. Based on the study conducted, the
following observations were made:
-0.02
0
0.02
0.04
0.06
0.08
0.1
0.12
0.14
1 3 5 7 9 11 13 15 17 19 21 23 25 27 29 31 33
Np
i ($
/MW
h)
Bus number
With reconciliation Npi(3rd harmonic) normalload
With reconciliation Npi(5th harmonic) normalload
With reconciliation Npi(7th harmonic) normalload
With reconciliation Npi(3rd harmonic) ZIP load
With reconciliation Npi(5th harmonic) ZIP load
With reconciliation Npi(7th harmonic) ZIP load
0
0.02
0.04
0.06
0.08
0.1
0.12
1 3 5 7 9 11 13 15 17 19 21 23 25 27 29 31 33
Nq
i ($
/MV
AR
h)
Bus number
With reconciliation Nqi(3rd harmonic) normalload
With reconciliation Nqi(5th harmonic)normal load
With reconciliation Nqi(7th harmonic) normalload
With reconciliation Nqi(3rd harmonic) ZIP load
With reconciliation Nqi(5th harmonic) ZIP load
With reconciliation Nqi(7th harmonic) ZIP load

Vidyabharati International Interdisciplinary Research Journal (Special Issue) ISSN 2319-4979
Special Issue on Engineering Technologies and Management 3854
With harmonic load, the losses are
higher compared to the CP and ZIP
load.
Nodal prices reduce with PV for all
types of loads.
Harmonic distortion in voltage is
obtained high for ZIP load.
The nodal prices are higher with the
presence of harmonics and these are
higher for CP load compared to ZIP
load.
Reference
1. Khare V, Nema S, Baredar P, “Status of
solar–wind renewable energy in India”
Renew Sustain Energy Rev vol-27, pp.1-
10, 2013.
2. Elhadidy MA, Shaahid SM, “Parametric
study of hybrid (wind + solar + diesel)
power generating systems”, Renew
Energy , vol.21, pp.129-39, 2000.
3. S.R. Gampa, D. Das, “Optimum
placement and sizing of DGs considering
average hourly variations of load”, Int. J.
Electr. Power Energy Syst, vol.66, pp.25–
40, 2015.
4. Duong Quoc Hung, N. Mithulananthan
and Kwang Y. Lee, “Optimal placement
of dispatchable and nondispatchable
renewable DG units in distribution
networks for minimizing energy loss,”
Int. J. Electr. Power Energy Syst, vol.55,
pp.179–186, 2014.
5. B. Singh, V. Mukherjee, P. Tiwari, “A
survey on impacts assessment of DG and
FACTS controllers in power systems,”
Renew Sustain Energy Rev, vol.42,
pp.846-882, 2015.
6. M. Raoofat, AR. Malekpour, “Optimal
allocation of dispersed generations and
remote control able switches to improve
the network performance on side ring
operation strategy of dispersed
generations,” Electr Power Compon Syst,
vol.39, no.16, pp.1809-1827, 2011.
7. Augusto CRM, etal, “ A mixed-integer
linear programming approaches for
optimal type, size and allocation of DGs
in radial distribution systems,” Electr
PowerSystRes, vol.97, pp.133–43, 2013.
8. S Kaur, G Kumbhar, J.A Sharma,
“MINLP technique for optimal placement
of multiple DG units in distribution
systems,” Electr Power Energy Syst,
vol.63, pp.609–17, 2014.
9. [9] YM Atwa, EF. El-Saadany,
“Probabilistic approach for optimal
allocation of wind-based dispersed
generation in distribution systems,” IET
Renew Power Gener, vol.5, no.1, pp.79–
88, 2009.
10. N Khalesi, N Rezaei, MR Haghifam, “DG
allocation with application of dynamic
programming for loss reduction and
reliability improvement,” Electr Power
Energy Syst, vol.33, no.2, pp.288–295,
2011.
11. Ghayeni. M., Ghazi. R (2011).
“Transmission network cost allocation
with nodal pricing approach based on
Ramsey pricing concept,” Generation,
Transmission and Distribution, IET
.5(3):384-392.
12. J. M. Lopez-Lezama, J. Contreras, A.
Padilha-Feltrin (2012). “Location and
contract pricing of dispersed generation
using a genetic algorithm,” Int.J. Electr.
Power Energy Syst.36 (1):117-126.
13. Qian Zhao, Peng Wang, Goel. L., Yi Ding
(2011). “Impacts of renewable energy
penetration on nodal price and nodal
reliability in distributed power system,”
Power and Energy Society General
Meeting, IEEE: 1-6.
14. R. K. Singh, S. K. Goswami (2010).
“Optimum allocation of dispersed
generations based on nodal pricing for
profit, loss reduction, and voltage
improvement including voltage rise
issue,” Int. J. Electr. Power Energy Syst,
32(6): 637-644.
15. Sotkiewicz. P.M., Vignolo. J.M (2006).
“Nodal pricing for distribution networks:
efficient pricing for efficiency enhancing
DG,” Power Systems, IEEE Transactions
on, 21(2):1013-1014.
16. Sooraj Narayan K., Ashwani Kumar
(2015). “Distribution system nodal
pricing analysis with realistic ZIP load
and variable wind power source,” IEEE
India Int. Conf. (INDICON – 2015):1-6.

Vidyabharati International Interdisciplinary Research Journal (Special Issue) ISSN 2319-4979
Special Issue on Engineering Technologies and Management 3854
17. Karimulla Polisetti, Ashwani Kumar
(2016). “Distribution System Nodal
Prices Determination for Realistic ZIP
and Seasonal Loads: An Optimal Power
Flow Approach,” RAEREST2016,
Procedia Technology, 25:702-709.
18. [M. Hosseini, H. A. Shayanfar, M. F.
Firuzabad (2008). “Modeling of series
and shunt distribution FACTS devices in
distribution systems load flow,” Regular
paper, J. Electrical Systems, 4(4):1-12.
19. S. Chanda, B. Das (2011). “Identification
of weak buses in a power network using
novel voltage stability indicator in radial
distribution System,” International
Conference on Power Electronics,
IICPE.2011:1-4.
20. S. Banerjee, C. K. Chanda, S. C. Konar
(2009). “Determination of the weakest
branch in a radial distribution network
using local Voltage Stability Indicator at
the proximity of the Voltage Collapse
Point,” Third International Conference on
Power Systems, Kharagpur, INDIA:27-
29.
21. Sotkiewicz. P.M., Vignolo. J.M (2007).
“Towards a Cost Causation-Based Tariff
for Distribution Networks with DG,”
Power Systems, IEEE Transactions on
.22(3):1051-1060.
22. P.M. De Oliveira-De Jesus and M. T.
Ponce de Leão (2005). “Cost Loss
Allocation in Distribution Networks with
High Penetration of Distributed
Renewable Generation -- A Comparative
Study, in Proc Int. Conf. Renew. Energy
and Power. Quality .Zaragoza.
23. Mutale. J., Strbac. G., Curcic. S., Jenkins.
N (2000). “Allocation of losses in
distribution systems with embedded
generation”, Generation,Transmission and
Distribution, IEE Proceedings,147(1):7-
14.
24. https://fsr.eui.eu/nodal-zonal-pricing/

Vidyabharati International Interdisciplinary Research Journal (Special Issue) ISSN 2319-4979
Special Issue on Engineering Technologies and Management 3854
REVIEW ON VARIOUS MACHINE LEARNING TECHNIQUES FOR EARLY
PREDICTION OF MELANOMA SKIN CANCER
1P.MuthuKumar, 2 Dr.T.Velumani 1Ph.D Research Scholar, Department of Computer Science, Rathinam College of Arts and Science
(Autonomous), Coimbatore 641 021. E-Mail : [email protected] 2Assistant Professor, Department of Computer Science, Rathinam College of Arts and Science
(Autonomous), Coimbatore 641 021 E- mail: [email protected]
ABSTRACT
The abnormal development of skin cells is known as skin cancer. It's a common cancer that can develop anywhere on
the body, although it's most commonly found on sun-exposed skin. UV radiation from the sun can damage the DNA in
your skin cells, leading to the formation of malignant cells over time. Skin cancer can affect anyone, however certain
factors can raise one's risk. Lighter skin, a history of sunburns, and a personal or family history of skin cancer are all
risk factors. The chances of surviving skin cancer differ depending on the type of malignancy. When not treated early,
some types of skin cancer can be fatal, while others have a low mortality risk. Melanoma is a cancer that is fatal after it
has spread, but it is treatable in its early stages. Melanoma treatment requires an early diagnosis and recognition
method based on dermoscopy. Dermatologists with advanced training, on the other hand, have a significant advantage
in terms of diagnosis accuracy. Many efforts are being made to build automatic image analysis systems in order to
overcome this challenge. In this paper, various machine learning techniques used for early prediction of melanoma
skin cancer is discussed.
Keywords: Skin Cancer, Melanoma, Machine Learning Techniques, Early Prediction, Dermatology
INTRODUCTION
One of the common cancers that
frighten the people throughout the world is
skin cancer. According to the American
Cancer Society (ACS), approximately 106110
new cases of melanoma will be diagnosed in
the United States by 2021, and around 7180
people will die from melanoma.Melanoma is
responsible for approximately 1% of all
diagnosed cases of skin cancer (Melanoma,
basal cell carcinoma, and squamous cell
carcinoma shown in figure 1), but it accounts
for over 75% of all skin cancer-related deaths.
Melanoma claims 10,000 lives per year,
which equates to one death every 52 minutes.
According to the Melanoma Research
Alliance, melanoma stages 0, 1, and 2 have a
five-year survival rate of 98.4 percent. After
five years, stage 3 melanoma had a survival
rate of 63.6 percent[1].. The survival rate for
stage 4 melanoma is 22.5 percent. Melanoma
spreads quickly, therefore good monitoring
and diagnosis of skin lesions are critical for
improving the disease's survivability.
One of the most essential procedures
for examining skin lesions is Dermoscopy
because it can obtain high-resolution images
of the skin without being interrupted by
reflections on the surface. This high-
resolution imaging is used by specially
educated professionals to assess the
likelihood of melanoma early on, with
diagnostic accuracy of up to 80% [2].
However, only limited experienced
dermatologist is available throughout the
world. In the academic research community,
there has been an effort to construct machine-
driven image analysis software to identify
different skin-related disorders using
dermoscopy images in order to solve this
problem. For two primary reasons, previous
computer-aided classification systems have
been less successful: 1) The database isn't
quite up to par as previous research relied on
a small number of dermoscopy skin lesion
images, algorithms were unable to learn and
extract valuable information. 2) Because
people's computing abilities were restricted in
the past, they had few ideas for dealing with a
large number of photos.
Fig.1 Types of cancer
Vidyabharati International Interdisciplinary Research Journal (Special Issue) ISSN 2319-4979
Special Issue on Engineering Technologies and Management 3854
Dermatologists created the ABCDEs,
a mnemonic that highlights recognized visual
traits and cues of malignant Melanoma moles,
to help with appropriate detection and
suspicious mole tracing. Asymmetrical shape,
Diameter, Color, Evolution over time and
Border irregularities, are the acronyms for the
ABCDE mnemonic. The shape, location on
the body, and arrangement of lesions can also
reveal details about the skin condition
[3].Convolution neural networks (CNNs)
have been employed in recent research in
digital skin diagnostics to categorize images
of melanoma and nevi with accuracies
comparable to those attained by
dermatologists [4-6]. Prior studies used a
huge number of photos to train their
algorithms, which were then confirmed by
consensus decisions. When images are
validated in this way, there is a strong chance
that the CNN will learn the dermatologists'
decision-making process, including all
probable errors. The purpose of this paper is
to find the various Machine Learning[ML]
algorithms available for pre detecting the
melanoma skin cancer, its advantages and
disadvantages.
ROLE OF ARTIFICIAL
INTELLIGENCE AND ML IN
DERMATOLOGY
Artificial intelligence (AI) is a discipline of
computer science that employs machines and
programs to replicate intelligent human
behavior, whereas machine learning (ML) is a
tool made up of a subset of AI that allows AI
to fulfill its aims. Logistic regression, random
forest, and deep learning are examples of ML
algorithms and statistical methodologies.
Although machine learning may appear
mysterious at first, it is closely related to
classic statistical models that most
dermatologists are familiar with. Machine
Learning Technique is divided into three
types:
1. Supervised Learning – Need input
called features and output called
Labels. The algorithm is trained on
labeled images of melanoma and
benign pigmented lesions before being
applied to a new collection of skin
images that have never been seen
before. The most common type of
learning in dermatology is supervised
learning.[7]
2. Unsupervised Learning – Need only
input unlabeled data. This method can
detect unknown data clusters or
anomalies.[7]
3. Reinforcement Learning –
Combination of Supervised and
Unsupervised techniques that uses trial
and error approach.[7]
In dermatology, a variety of machine
learning methods are routinely utilized.
Most machine learning algorithms are
statistical learning methods; for example,
linear regression, logistic regression, k-
nearest neighbor (k-NN), support vector
machine (SVM), random forest (RF), and
natural language processing are some of
the most prominent statistical learning
methods (NLP). The k-NN algorithm is
used to classify and predict data depending
on the number of k neighbors [8,9]. SVMs
are used to categorize data by locating a
hyperplane that separates groups [10].RFs
produce a network of random decision
trees in order to discover the most frequent
result across all of the randomly produced
decision trees [11]. NLP examines
enormous amounts of text in order to
detect patterns [12].
DERMATOLOGY AND MACHINE
LEARNING
Deep learning is a kind of machine
learning that simulates how neurons
process information using statistical and
mathematical models. Artificial neural
networks (ANNs), also known as neural
networks (NNs), are made up of
interconnected units (such as nodes,
neurons, and process layers). The human
brain's network of neurons is the
inspiration for ANNs. The ANN's neurons,
or nodes, are grouped into layers, which
are linear arrays. Each node receives data
from other connections with weighted
connections. Choosing the number of
nodes in each layer, the number of layers
in the network, and the path of the
connections between the nodes are all part
Vidyabharati International Interdisciplinary Research Journal (Special Issue) ISSN 2319-4979
Special Issue on Engineering Technologies and Management 3854
of the process of creating an ANN [13].
Input layers, output layers, and hidden
layers are all present in a conventional
ANN. Through a learning process, ANNs
are taught to execute certain tasks, such as
categorization. ANNs can learn either
supervised or unsupervised; however
supervised learning is more prevalent. A
training set in supervised learning contains
examples of input and output targets [13].
The weights of the inputs are modified as
the ANN is trained to reduce the error
between the network output and the proper
output [13].
MELANOMA AND MACHINE
LEARNING
Melanoma is the fifth most frequent
invasive cancer in the United States, and its
prevalence is on the rise globally [14, 15].
Melanomas are also the cause of the majority
of skin cancer-related deaths [14]. A total
body skin examination is used to screen for
skin cancer. Unfortunately, according to
statistics from the National Health Interview
Survey, screening rates are shockingly low
(16 percent for men and 13 percent for
women) [16]. As a result, the earliest deep
learning algorithms targeted on classifying
melanoma in order to overcome low
screening rates and better respond.
Esteva et al. in 2017 [17] published
one of the first landmark studies to accurately
diagnose malignant melanoma. The CNN
employed in this investigation was Google
Inception V3, which has been pretrained on
1.28 million images of general items. The
authors used 129,450 dermoscopic and
clinical images to train the algorithm using
transfer learning. This was the first classifier
to classify keratinocyte cancer versus
seborrheic keratosis and malignant melanoma
vs benign nevi with the same accuracy as
dermatologists. The CNN was accurate 72.1
percent of the time, while two dermatologists
were accurate 65.56 and 66 percent of the
time, respectively. The CNN's total area
under the receiveroperating characteristic
(AUROC or AUC) was [91 percent], which
was similar to 21 dermatologists' average
output predictions.
SS Hans et al (2018) used 12 clinical
images for classifying skin cancer using deep
learning algorithms.They used biopsy-proven
images from the Asan test dataset and the
Edinburgh dataset to compare the
performances of the panel of dermatologists
and their algorithm.Because of disparities in
patient ethnicity and variations in total image
contrast due to differential lighting and
backdrop, the Edinburgh dataset's diagnosis
accuracy was slightly lower than the Asan
dataset's.
Limitations:This is limited to classify
only 12 clinical images.To properly reflect
the world's population, these algorithms must
be trained and validated across a wider range
of population sets. The majority of algorithms
are tested on Caucasian or Asian patients.
[18]
H. A. Haenssle et al (2018) compared
a CNN's diagnostic performance to that of a
large worldwide group of 58 dermatologists,
30 experts. They showed CNN outperforms
well and coincides with the dermatologists’
decision on skin cancer.
Limitations:The limitation of this
method includes their study's test sets did not
include the complete range of lesions, due to
a lack of authenticated images, melanocytic
lesions from various skin types and genetic
backgrounds were few.[19]
CNN design was proposed by
Rehman et al. [2018], which consisted of 16
distinct filters with 7*7 kernel sizes and
pooling layers for down sampling.
Melanoma, Seborrheic keratosis, and nevus
were used to train the suggested model for
both malignant and benign illnesses. The
segmented image's RGB channels are
normalized with a zero mean and unit
variance. This normalized matrix was input to
CNN for feature extraction, and the fully
connected layer is made up of three layer
ANN classifiers that classify skin lesions as
benign or malignant.[20]
The proposed approach by Lopez et al
[2019] is based on the VGGNet (Very Deep
Convolutional Network for Large-Scale
Visual Recognition) convolutional neural
network architecture and employs the transfer
learning paradigm.It makes use of a pre-
existing convolutional neural network (CNN)
Vidyabharati International Interdisciplinary Research Journal (Special Issue) ISSN 2319-4979
Special Issue on Engineering Technologies and Management 3854
architecture called VGGNet, which was
created by the University's Visual Geometry
Group of the University of Oxford in three
ways: (i) training the CNNfrom the ground
up; (ii) applying the transfer learning
paradigmuse features from a VGGNet that
has been pre-trained on a larger dataset(iii)
maintaining the transfer learning paradigm
while fine-tuning the CNN architecture.
Limitations:(i)Not using a larger
dataset to reduce the danger of overfitting; (ii)
No fine-tuning hyper parameters and
regularization modifications; and (iii) training
the architecture with Imagenet, a general
dataset. [21]
Brinker et al [2019] trained a
convolutional neural network (CNN) using
advanced deep learning methods with 12,378
open-source dermoscopic images,. They
compared the CNN's performance against that
of 157 dermatologists from 12 German
university hospitals using 100 images. The
deep neural network outperformed
dermatologists in terms of sensitivity,
specificity, and receiver operating
characteristics.
Limitations: Still additional clinical
data are to be considered for better
performance of the proposed method[22].
Cui X et al [2019] proposed an
Artificial Intelligence method for detecting
Melanoma skin cancer. There were two
portions to the regular machine learning and
deep learning methods, with a total of four
experiments. They tested four image
segmentation algorithms with groundtruths
that were built by three dermatologists and
then re-checked by a senior dermatologist in
the standard machine learning experiment.
After feature extraction, four melanoma
classifiers were compared using the best
segmentation findings. Comparative tests
were conducted on four popular models in
recent years in the deep learning segment, and
the best model for melanoma diagnosis was
chosen.
Limitations:The limitations includes:
the severity of the melanoma samples utilized
in this experiment is not divided, and all of
the non-melanoma samples are benign nevi.
As a result, further research is needed to
define the severity of melanoma, and the data
utilized to do so should be expanded to cover
certain problematic situations like dysplastic
nevus. Due to the limited quantity of data
used in the experiment, machine learning
outperforms deep learning in this case.
However, as the amount of data grows, the
benefits of deep learning will become more
apparent. More information should be
gathered and used in future research [23].
JinenDaghrir [2020] presented a
system based on three separate ways of
prediction: Two traditional machine learning
classifiers and a convolutional neural network
were trained with a set of data identifying the
borders, texture, and color of a skin lesion.
The results of these systems are then pooled
using majority vote to improve their
performance. Experiments have demonstrated
that combining the three strategies yields the
maximum level of accuracy. [24]
Limitations: Scalability Issues
Vijayalakshmi M M [2020] proposed
a hybrid approach using CNN and Support
Vector Machine and finally predicted the
Melanoma Skin cancer using image
processing tools. She did preprocessing steps
to remove hair, shadow and glare. She used
ISIC dataset. [25].
Limitations: This is limited to only
few datasets
M.A. Kadampur [2019] suggested a
cloud-based model-driven architecture that
employs deep learning algorithms in its core
implementations to build models that aid in
the more accurate prediction of skin cancer.
The work demonstrates how to create models
and use them to classify dermal cell
pictures.They devised a platform that allows
anyone with no programming experience to
create complicated deep learning models. It
hinted at general techniques and looping
patterns in the building of deep learning
models, allowing for more flexibility in
creating deep learning classifiers.
Limitations: Their approaches are not
programmatically implemented.[26]
A. Dascalu et al.[2019] used
sonification and a rudimentary skin magnifier
with polarized(SMP) light to investigate the
effects of image quality on diagnosis
accuracy .SMP dermoscopy images were
sonified after being processed by a first deep
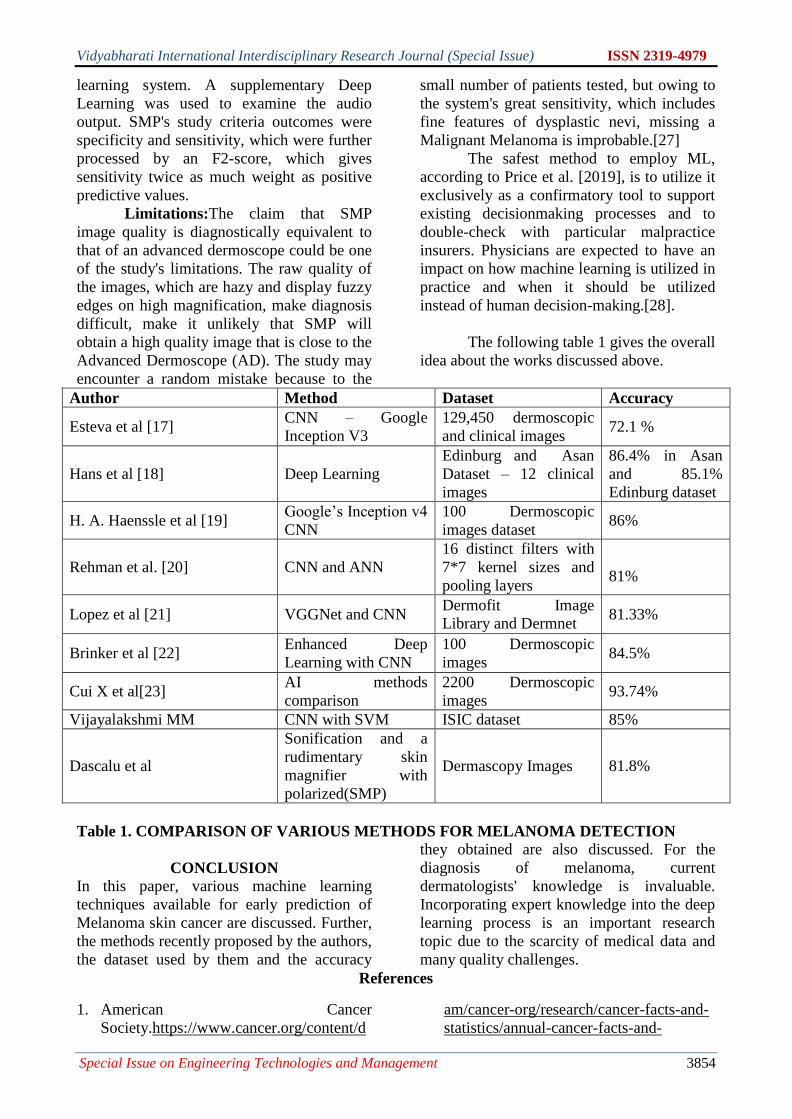
Vidyabharati International Interdisciplinary Research Journal (Special Issue) ISSN 2319-4979
Special Issue on Engineering Technologies and Management 3854
learning system. A supplementary Deep
Learning was used to examine the audio
output. SMP's study criteria outcomes were
specificity and sensitivity, which were further
processed by an F2-score, which gives
sensitivity twice as much weight as positive
predictive values.
Limitations:The claim that SMP
image quality is diagnostically equivalent to
that of an advanced dermoscope could be one
of the study's limitations. The raw quality of
the images, which are hazy and display fuzzy
edges on high magnification, make diagnosis
difficult, make it unlikely that SMP will
obtain a high quality image that is close to the
Advanced Dermoscope (AD). The study may
encounter a random mistake because to the
small number of patients tested, but owing to
the system's great sensitivity, which includes
fine features of dysplastic nevi, missing a
Malignant Melanoma is improbable.[27]
The safest method to employ ML,
according to Price et al. [2019], is to utilize it
exclusively as a confirmatory tool to support
existing decisionmaking processes and to
double-check with particular malpractice
insurers. Physicians are expected to have an
impact on how machine learning is utilized in
practice and when it should be utilized
instead of human decision-making.[28].
The following table 1 gives the overall
idea about the works discussed above.
Author Method Dataset Accuracy
Esteva et al [17] CNN – Google
Inception V3
129,450 dermoscopic
and clinical images 72.1 %
Hans et al [18] Deep Learning
Edinburg and Asan
Dataset – 12 clinical
images
86.4% in Asan
and 85.1%
Edinburg dataset
H. A. Haenssle et al [19] Google’s Inception v4
CNN
100 Dermoscopic
images dataset 86%
Rehman et al. [20] CNN and ANN
16 distinct filters with
7*7 kernel sizes and
pooling layers
81%
Lopez et al [21] VGGNet and CNN Dermofit Image
Library and Dermnet 81.33%
Brinker et al [22] Enhanced Deep
Learning with CNN
100 Dermoscopic
images 84.5%
Cui X et al[23] AI methods
comparison
2200 Dermoscopic
images 93.74%
Vijayalakshmi MM CNN with SVM ISIC dataset 85%
Dascalu et al
Sonification and a
rudimentary skin
magnifier with
polarized(SMP)
Dermascopy Images 81.8%
Table 1. COMPARISON OF VARIOUS METHODS FOR MELANOMA DETECTION
CONCLUSION
In this paper, various machine learning
techniques available for early prediction of
Melanoma skin cancer are discussed. Further,
the methods recently proposed by the authors,
the dataset used by them and the accuracy
they obtained are also discussed. For the
diagnosis of melanoma, current
dermatologists' knowledge is invaluable.
Incorporating expert knowledge into the deep
learning process is an important research
topic due to the scarcity of medical data and
many quality challenges.
References
1. American Cancer
Society.https://www.cancer.org/content/d
am/cancer-org/research/cancer-facts-and-
statistics/annual-cancer-facts-and-

Vidyabharati International Interdisciplinary Research Journal (Special Issue) ISSN 2319-4979
Special Issue on Engineering Technologies and Management 3854
figures/2021/cancer-facts-and-figures-
2021.pdf
2. Ali, A. R. A. &Deserno, T. M. A
Systematic Review of Automated
Melanoma Detection in Dermatoscopic
Images and its Ground Truth Data.
ProcSpie8318, doi:Artn 83181i
10.1117/12.912389 (2012).
3. Skin Cancer Facts and Statistics [Online].
Available: www.skincancer.org
4. Esteva A, Kuprel B, Novoa RA, Ko J,
Swetter SM, Blau HM, et al.
Dermatologist-level classification of skin
cancer with deep neural networks. Nature
2017;542(7639):115.
5. Haenssle HA, Fink C, Schneiderbauer R,
Toberer F, Buhl T, Blum A, et al. Man
against machine: diagnostic performance
of a deep learning convolutional neural
network for dermoscopic melanoma
recognition in comparison to 58
dermatologists. Ann Oncol
2018;29(8):1836e42.
6. Marchetti MA, Codella NC, Dusza SW,
Gutman DA, Helba B, Kalloo A, et al.
Results of the 2016 international skin
imaging collaboration international
symposium on biomedical imaging
challenge: comparison of the accuracy of
computer algorithms to dermatologists for
the iagnosis of melanoma from
dermoscopic images. J Am AcadDermatol
2018;78(2):270e7. e271.
7. Murphy KP. Machine learning: a
probabilistic perspective.Cambridge: MIT
Press; 2012.
8. Coomans D, Massart DL. Alternative k-
nearest neighbour rules in supervised
pattern recognition:part 1 k-Nearest
neighbour classification by using
alternative voting rules. Anal ChimActa.
1982;136: 15–27.
9. Altman NS. An introduction to kernel and
nearest neighbor nonparametric
regression. Am Stat.1992;46:175–85.
10. Hearst MA, Dumais ST, Osuna E, Platt J,
Scholkopf B. Support vector machines.
IEEE IntellSyst Appl. 1998;13:18–28.
11. Breiman L. Random forests. Mach Learn.
2001;45:p.5–32.
12. Manning CD, Schu¨tze H. Foundations of
statistical natural language processing.
Cambridge: MIT Press;1999.
13. Zou J, Han Y, So S-S. Overview of
artificial neural networks. In: Livingstone
DJ, editor. Artificial neural networks:
methods and applications. Totowa:
Humana Press; 2009.
https://doi.org/10.1007/978- 1-60327-
101-1_2.
14. Arnold M, Holterhues C, Hollestein LM,
et al. Trends in incidence and predictions
of cutaneousmelanoma across Europe up
to 2015. J EurAcadDermatolVenereol.
2014;28:1170–8.
15. Johnson MM, Leachman SA, Aspinwall
LG, et al. Skin cancer screening:
recommendations for data driven
screening guidelines and a review of the
US Preventive Services Task Force
controversy. Melanoma Manag.
2017;4:13–37.
16. Coups EJ, Geller AC, Weinstock MA,
Heckman CJ, Manne SL. Prevalence and
correlates of skin cancer screening among
middle-aged and older white adults in the
United States. Am J Med. 2010;123: 439–
45.
17. Esteva A, Kuprel B, Novoa RA, et al.
Dermatologist level classification of skin
cancer with deep neural networks. Nature.
2017;542:115–8.
18. Han SS, Kim MS, Lim W, Park GH, Park
I, Chang SE. Classification of the clinical
images for benign and malignant
cutaneous tumors using a deep learning
algorithm. J Invest Dermatol.
2018;138:1529–38.
19. Haenssle HA, Fink C, Schneiderbauer R,
et al. Man against machine: diagnostic
performance of a deep learning
convolutional neural network for
dermoscopic melanoma recognition in
comparison to 58 dermatologists. Ann
Oncol. 2018;29:1836–42.
20. M. Rehman, S.H. Khan, S.D. Rizvi, Z.
Abbas and A. Zafar, “Classification of
skin lesion by interference of
segmentation and convolotion neural
network,” In 2018 2ndInternational
Conference on Engineering Innovation
(ICEI), 2018 Jul 5,(pp. 81-85), IEEE.

Vidyabharati International Interdisciplinary Research Journal (Special Issue) ISSN 2319-4979
Special Issue on Engineering Technologies and Management 3854
21. Romero-Lopez A, Giro-i-Nieto X,
Burdick J, MarquesO. Skin lesion
classification from dermoscopic images
using deep learning techniques. Calgary:
ACTA Press. 2017.
https://www.actapress.com/PaperInfo.asp
x?paperId=456417. Accessed 18 Dec
2019.
22. Brinker TJ, Hekler A, Enk AH, et al. A
convolutional neural network trained with
dermoscopic images performed on par
with 145 dermatologists in a clinical
melanoma image classification task. Eur J
Cancer. 2019;111:148–54.
23. Cui X, Wei R, Gong L, et al. Assessing
the effectiveness of artificial intelligence
methods formelanoma: a retrospective
review. J Am AcadDermatol.
2019;81:1176–80.
24. J. Daghrir, L. Tlig, M. Bouchouicha and
M. Sayadi, "Melanoma skin cancer
detection using deep learning and
classical machine learning techniques: A
hybrid approach," 2020 5th International
Conference on Advanced Technologies
for Signal and Image Processing (ATSIP),
2020, pp. 1-5, doi:
10.1109/ATSIP49331.2020.9231544.
Vijayalakshmi M
25. M "Melanoma Skin Cancer Detection
26. using Image Processing and Machine
27. Learning" Published in International
28. Journal of Trend in Scientific Research
29. and Development
30. (ijtsrd), ISSN: 2456-
31. 6470, Volume-3 |
32. Issue-4, June 2019,
33. pp.780-784
25. Vijayalakshmi M M "Melanoma Skin
Cancer Detection using Image
Processing and Machine Learning"
Published in International Journal of
Trend in Scientific Research and
Development (ijtsrd), ISSN: 2456-6470,
Volume-3 | Issue-4, June 2019, pp.780-
784
26. Vijayalakshmi M
27. M "Melanoma Skin Cancer Detection
28. using Image Processing and Machine
29. Learning" Published in International
30. Journal of Trend in Scientific Research
31. and Development
32. (ijtsrd), ISSN: 2456-
33. 6470, Volume-3 |
34. Issue-4, June 2019,
35. pp.780-784
36. Vijayalakshmi M
37. M "Melanoma Skin Cancer Detection
38. using Image Processing and Machine
39. Learning" Published in International
40. Journal of Trend in Scientific Research
41. and Development
42. (ijtsrd), ISSN: 2456-
43. 6470, Volume-3 |
44. Issue-4, June 2019,
45. pp.780-784
26. Mohammad Ali Kadampur, Sulaiman Al
Riyaee, Skin cancer detection: Applying a
deep learning based model driven
architecture in the cloud for classifying
dermal cell images,
Informatics in Medicine Unlocked,
Volume 18, 2020, 100282, ISSN 2352-
9148,
https://doi.org/10.1016/j.imu.2019.10028
2.
27. Dascalu A, David EO. Skin cancer
detection by deep learning and sound
analysis algorithms: a prospective clinical
study of an elementary dermoscope.
EBioMedicine. 2019;43:107–13.
28. Price WN, Gerke S, Cohen IG. potential
liability for physicians using artificial
intelligence. JAMA. 2019;322:1765–6.
Vidyabharati International Interdisciplinary Research Journal (Special Issue) ISSN 2319-4979
Special Issue on Engineering Technologies and Management 3854
Improvisational Behavior and Consequences on Business Performance and Stress of
Entrepreneurs during Economic Downturn
1Dr. Veena Prasad Vemuri, 2Dr. Pallavi Kiran Ingale, 3Dr. Bhagyashri Deshpande, 4Biju Abraham
1I/C Principal, NKES College of Arts Commerce and Science, Mumbai 2Assistant Professor, Vaikunth Mehta National Institute of Cooperative Management Pune,
Savitribai Phule Pune University Road, near Chatursingi Temple, Ganeshkhind,
Pune, Maharashtra 411007 3Assistant Professor, MIT World Peace University Survey No, 124, Paud Rd,
Kothrud, Pune, Maharashtra 411038 4Assistant Professor of Economics, NMSM GOVT. College Kalpetta, Wayanad, Kerala
ABSTRACT Small and medium-sized companies (SMEs), which include self-employed individuals, account for 90% of all
businesses and 70% of all jobs globally. An estimated tens of millions of people's employment are in jeopardy due to
the Covid-19 outbreak. The findings of a worldwide investigation performed in 2020 are presented in this paper.
Entrepreneurs in 23 nations account for more than three-quarters of the world's gross domestic product. Most small
company owners faced severe threats to their viability. We also witness resilience in how businesses dealt with the
epidemic by being agile, adaptable, exploring new possibilities, employing government backing, giving back to society,
and even harbouring development dreams beyond the pandemic itself. In the pandemic, the emotional well-being of
entrepreneurs decreased by 12 per cent, putting their firms at risk. To remain productive, entrepreneurs use a variety
of well-being tools, including social support and self-care measures. To wrap up the paper, we look at five themes that
will shape the post-Covid economy: digitalization, 'local' emphasis; inclusive business models; increasing personal and
business resilience, and we provide five practical strategies for entrepreneurs to safeguard their well-being amid these
developments.
1. Introduction:
Economic growth depends on
entrepreneurship. According to the World
Bank, small and medium-sized firms (SMEs)
make up 90 per cent of businesses
worldwide1 (99.8 per cent in the European
Union2 and 99.9 per cent in the United
States). 70% of the world's workforce is
employed in the service sector, accounting for
50% of GDP in OECD nations and 40% in
developing economies. Because of their
smaller size, these enterprises are more
susceptible to economic downturns than their
larger counterparts. Job losses at small and
medium-sized firms (SMEs) are often
overlooked in the media, even though the
total number of SMEs losing jobs is likely
more significant than that of big businesses.
In light of the current severity of the Covid-
19 epidemic, it is necessary to have a better
understanding of the challenges faced by
entrepreneurs and their expectations for the
future, both short-term and long-term. More
than 5,000 entrepreneurs from 23 countries
were surveyed for this research. An
entrepreneur had to be the company's CEO
and own a significant portion of it to be
included in the study. According to the
European Union's definition of small and
medium-sized enterprises (SMEs), we had
both established and start-up entrepreneurs
running businesses of all sizes with a
maximum of 250 workers. Our sample
includes 3,796 SME owners and managers
and 1,410 self-employed people. Australia,
Bangladesh, Bosnia and Herzegovina,
Canada, Chile, China, Colombia, Denmark,
France, Germany, India, Italy, Japan, New
Zealand, Norway, Pakistan, Poland, Slovakia,
Spain, Sweden, UK, and the United States
were the 23 participating nations. These 23
nations account for 75% of the world's GDP
and 56% of the world's population.
With the support of entrepreneurial
groups, chambers of commerce, and direct
Vidyabharati International Interdisciplinary Research Journal (Special Issue) ISSN 2319-4979
Special Issue on Engineering Technologies and Management 3854
contact with SME owner-managers and the
self-employed, we conducted a
comprehensive survey of entrepreneurs.
During the first wave of the pandemic
(between April and the end of August 2020),
lockdowns were implemented in most nations
to restrict the spread of the Coronavirus,
which was assessed in this report. Many
schools, colleges, and companies were shut
down during data collecting, despite differing
lockdown legislation in different nations.
2. Methodology:
A total of 5,206 entrepreneurs from
23 countries were surveyed between April
and August 2020 for this research. We were
unable to discern any significant differences
between the early and late responses7.
Therefore we decided to merge the data.
Entrepreneur associations, chambers of
commerce, and direct email contact with
SME owner-managers and the self-employed
were used to conduct the poll.Associations
were invited to pass forward invitations to
participate in our online survey to their
members. The survey was not paid for
participation by entrepreneurs. When
participants completed the study, they were
given comments on their psychological
resources for coping with stress and
adversity.
We looked at how well our sample of
entrepreneurs represented the entrepreneurial
culture in each country we studied (see
Appendix). We compared our results to those
from the Global Entrepreneurship Monitor
(GEM), the world's most significant
entrepreneurship research initiative, which
polls representative household samples of
entrepreneurs.
Requests for the entire comparison
and sample descriptions may be made.
Overall, firms in our sample are more active
in the business service sector (53.3 per cent)
than GEM (21.9 per cent), less involved in
the extractive (2.6 per cent) and
manufacturing (13.6 per cent) sectors, and
more active in consumer-oriented services
(30.5 per cent) than GEM (44%). There are
13.1 workers in our sample, compared to
GEM's 4.25 employees, although they are of
comparable age (11.12 vs 11.1 years). When
compared to GEM samples of entrepreneurs,
entrepreneurs in our research are somewhat
older (45.6 against 44.2 years old), more
educated (75.6 per cent have a university
degree versus 29.9 per cent in GEM), and
more likely to be male (68.2 versus 61.4 per
cent). In Japan, we had 84 participants,
whereas, in the United States, we had 1081.
3. Entrepreneurs' businesses were
affected by the pandemic:
The Covid-19 epidemic harmed entrepreneurs
in this sector. While some businesses are
doing well, most indicate that the epidemic
has badly impacted their company and are
concerned about its survival. The main issue
was reduced commerce, but businesses also
faced payment delays and paying for
company maintenance. As a consequence,
several companies had to decrease
employment.
3.1.Impact on entrepreneurs' businesses:
Worryingly, the epidemic
jeopardized the very survival of 61% of
enterprises. In our survey, entrepreneurs in
China (95.3%), Bangladesh (91.6%), and
Pakistan (71.7%) were the most pessimistic,
while entrepreneurs in Norway (40.8%),
Poland (43.5%), and Denmark (47.2%) were
the most optimistic. Even in these nations,
however, over 40% of entrepreneurs feared
for their enterprises' survival. So, only in our
sample, 3,162 enterprises and 41,578 people
are in danger.
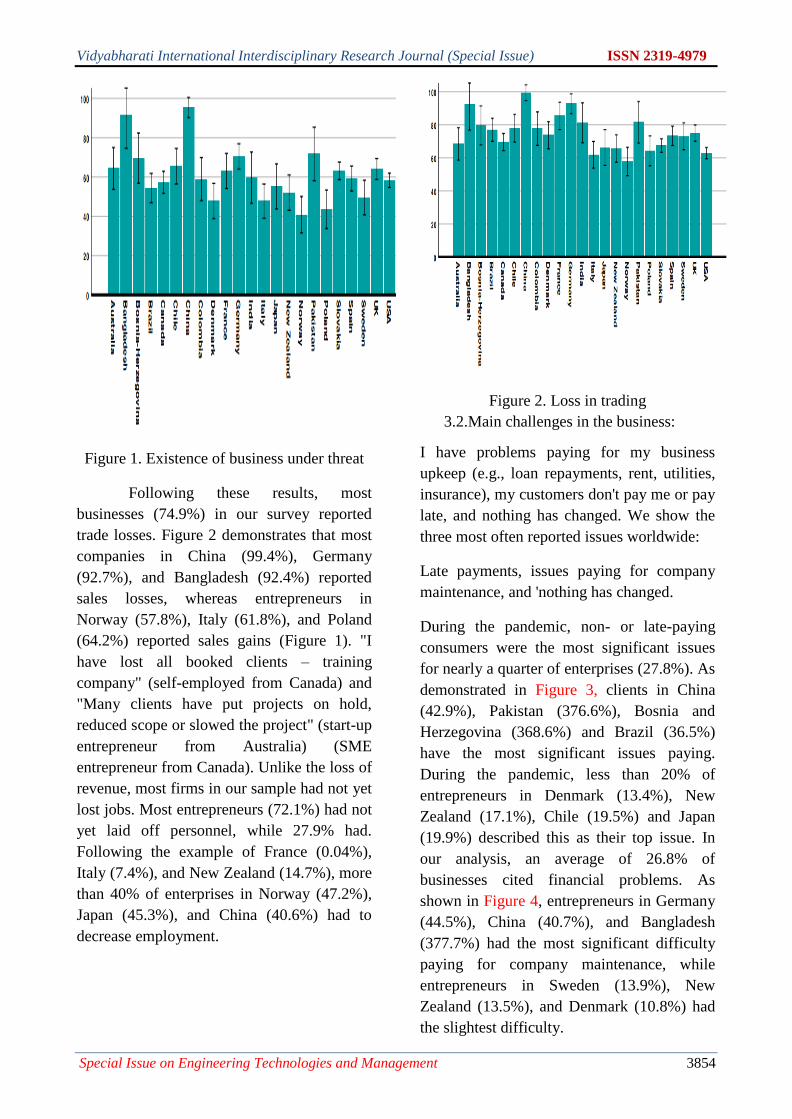
Vidyabharati International Interdisciplinary Research Journal (Special Issue) ISSN 2319-4979
Special Issue on Engineering Technologies and Management 3854
Figure 1. Existence of business under threat
Following these results, most
businesses (74.9%) in our survey reported
trade losses. Figure 2 demonstrates that most
companies in China (99.4%), Germany
(92.7%), and Bangladesh (92.4%) reported
sales losses, whereas entrepreneurs in
Norway (57.8%), Italy (61.8%), and Poland
(64.2%) reported sales gains (Figure 1). "I
have lost all booked clients – training
company" (self-employed from Canada) and
"Many clients have put projects on hold,
reduced scope or slowed the project" (start-up
entrepreneur from Australia) (SME
entrepreneur from Canada). Unlike the loss of
revenue, most firms in our sample had not yet
lost jobs. Most entrepreneurs (72.1%) had not
yet laid off personnel, while 27.9% had.
Following the example of France (0.04%),
Italy (7.4%), and New Zealand (14.7%), more
than 40% of enterprises in Norway (47.2%),
Japan (45.3%), and China (40.6%) had to
decrease employment.
Figure 2. Loss in trading
3.2.Main challenges in the business:
I have problems paying for my business
upkeep (e.g., loan repayments, rent, utilities,
insurance), my customers don't pay me or pay
late, and nothing has changed. We show the
three most often reported issues worldwide:
Late payments, issues paying for company
maintenance, and 'nothing has changed.
During the pandemic, non- or late-paying
consumers were the most significant issues
for nearly a quarter of enterprises (27.8%). As
demonstrated in Figure 3, clients in China
(42.9%), Pakistan (376.6%), Bosnia and
Herzegovina (368.6%) and Brazil (36.5%)
have the most significant issues paying.
During the pandemic, less than 20% of
entrepreneurs in Denmark (13.4%), New
Zealand (17.1%), Chile (19.5%) and Japan
(19.9%) described this as their top issue. In
our analysis, an average of 26.8% of
businesses cited financial problems. As
shown in Figure 4, entrepreneurs in Germany
(44.5%), China (40.7%), and Bangladesh
(377.7%) had the most significant difficulty
paying for company maintenance, while
entrepreneurs in Sweden (13.9%), New
Zealand (13.5%), and Denmark (10.8%) had
the slightest difficulty.
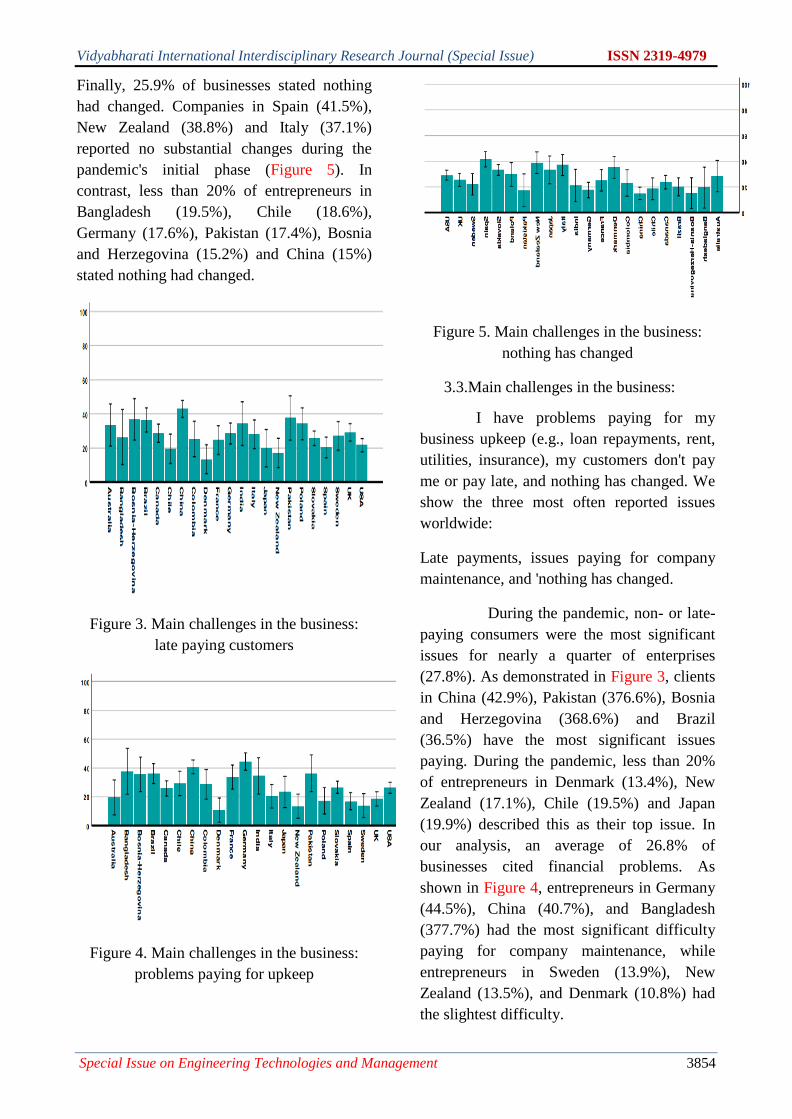
Vidyabharati International Interdisciplinary Research Journal (Special Issue) ISSN 2319-4979
Special Issue on Engineering Technologies and Management 3854
Finally, 25.9% of businesses stated nothing
had changed. Companies in Spain (41.5%),
New Zealand (38.8%) and Italy (37.1%)
reported no substantial changes during the
pandemic's initial phase (Figure 5). In
contrast, less than 20% of entrepreneurs in
Bangladesh (19.5%), Chile (18.6%),
Germany (17.6%), Pakistan (17.4%), Bosnia
and Herzegovina (15.2%) and China (15%)
stated nothing had changed.
Figure 3. Main challenges in the business:
late paying customers
Figure 4. Main challenges in the business:
problems paying for upkeep
Figure 5. Main challenges in the business:
nothing has changed
3.3.Main challenges in the business:
I have problems paying for my
business upkeep (e.g., loan repayments, rent,
utilities, insurance), my customers don't pay
me or pay late, and nothing has changed. We
show the three most often reported issues
worldwide:
Late payments, issues paying for company
maintenance, and 'nothing has changed.
During the pandemic, non- or late-
paying consumers were the most significant
issues for nearly a quarter of enterprises
(27.8%). As demonstrated in Figure 3, clients
in China (42.9%), Pakistan (376.6%), Bosnia
and Herzegovina (368.6%) and Brazil
(36.5%) have the most significant issues
paying. During the pandemic, less than 20%
of entrepreneurs in Denmark (13.4%), New
Zealand (17.1%), Chile (19.5%) and Japan
(19.9%) described this as their top issue. In
our analysis, an average of 26.8% of
businesses cited financial problems. As
shown in Figure 4, entrepreneurs in Germany
(44.5%), China (40.7%), and Bangladesh
(377.7%) had the most significant difficulty
paying for company maintenance, while
entrepreneurs in Sweden (13.9%), New
Zealand (13.5%), and Denmark (10.8%) had
the slightest difficulty.
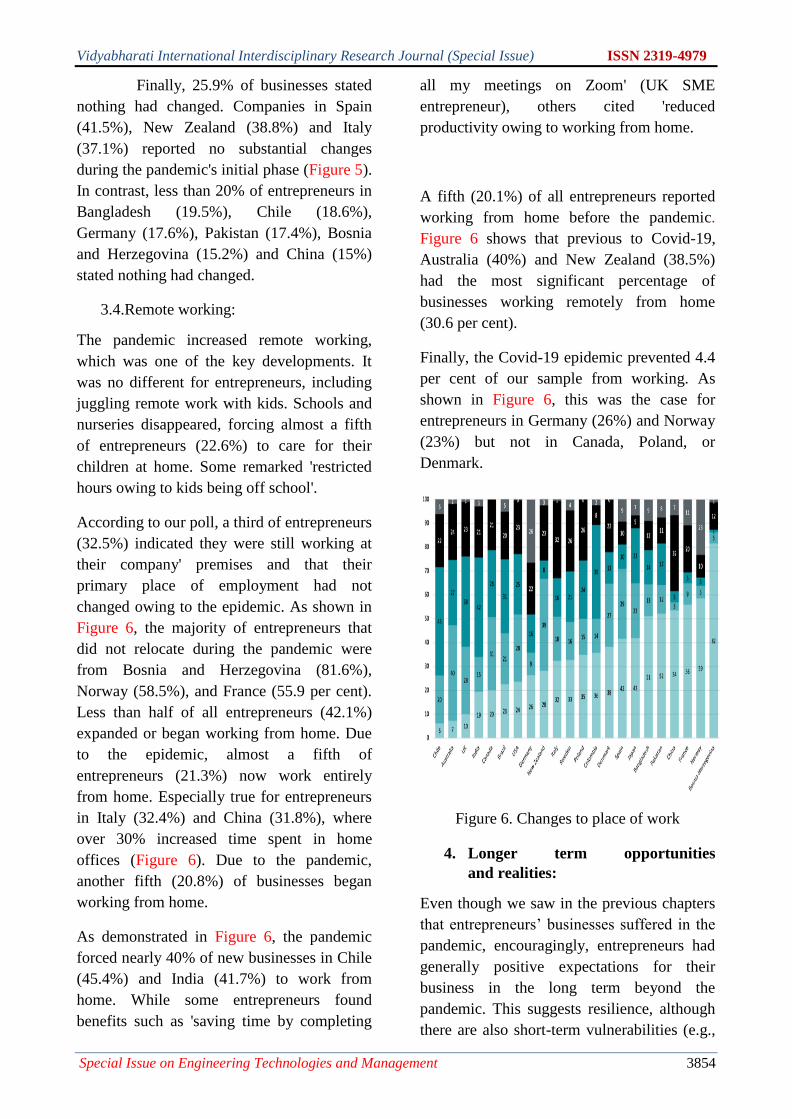
Vidyabharati International Interdisciplinary Research Journal (Special Issue) ISSN 2319-4979
Special Issue on Engineering Technologies and Management 3854
Finally, 25.9% of businesses stated
nothing had changed. Companies in Spain
(41.5%), New Zealand (38.8%) and Italy
(37.1%) reported no substantial changes
during the pandemic's initial phase (Figure 5).
In contrast, less than 20% of entrepreneurs in
Bangladesh (19.5%), Chile (18.6%),
Germany (17.6%), Pakistan (17.4%), Bosnia
and Herzegovina (15.2%) and China (15%)
stated nothing had changed.
3.4.Remote working:
The pandemic increased remote working,
which was one of the key developments. It
was no different for entrepreneurs, including
juggling remote work with kids. Schools and
nurseries disappeared, forcing almost a fifth
of entrepreneurs (22.6%) to care for their
children at home. Some remarked 'restricted
hours owing to kids being off school'.
According to our poll, a third of entrepreneurs
(32.5%) indicated they were still working at
their company' premises and that their
primary place of employment had not
changed owing to the epidemic. As shown in
Figure 6, the majority of entrepreneurs that
did not relocate during the pandemic were
from Bosnia and Herzegovina (81.6%),
Norway (58.5%), and France (55.9 per cent).
Less than half of all entrepreneurs (42.1%)
expanded or began working from home. Due
to the epidemic, almost a fifth of
entrepreneurs (21.3%) now work entirely
from home. Especially true for entrepreneurs
in Italy (32.4%) and China (31.8%), where
over 30% increased time spent in home
offices (Figure 6). Due to the pandemic,
another fifth (20.8%) of businesses began
working from home.
As demonstrated in Figure 6, the pandemic
forced nearly 40% of new businesses in Chile
(45.4%) and India (41.7%) to work from
home. While some entrepreneurs found
benefits such as 'saving time by completing
all my meetings on Zoom' (UK SME
entrepreneur), others cited 'reduced
productivity owing to working from home.
A fifth (20.1%) of all entrepreneurs reported
working from home before the pandemic.
Figure 6 shows that previous to Covid-19,
Australia (40%) and New Zealand (38.5%)
had the most significant percentage of
businesses working remotely from home
(30.6 per cent).
Finally, the Covid-19 epidemic prevented 4.4
per cent of our sample from working. As
shown in Figure 6, this was the case for
entrepreneurs in Germany (26%) and Norway
(23%) but not in Canada, Poland, or
Denmark.
Figure 6. Changes to place of work
4. Longer term opportunities
and realities:
Even though we saw in the previous chapters
that entrepreneurs’ businesses suffered in the
pandemic, encouragingly, entrepreneurs had
generally positive expectations for their
business in the long term beyond the
pandemic. This suggests resilience, although
there are also short-term vulnerabilities (e.g.,
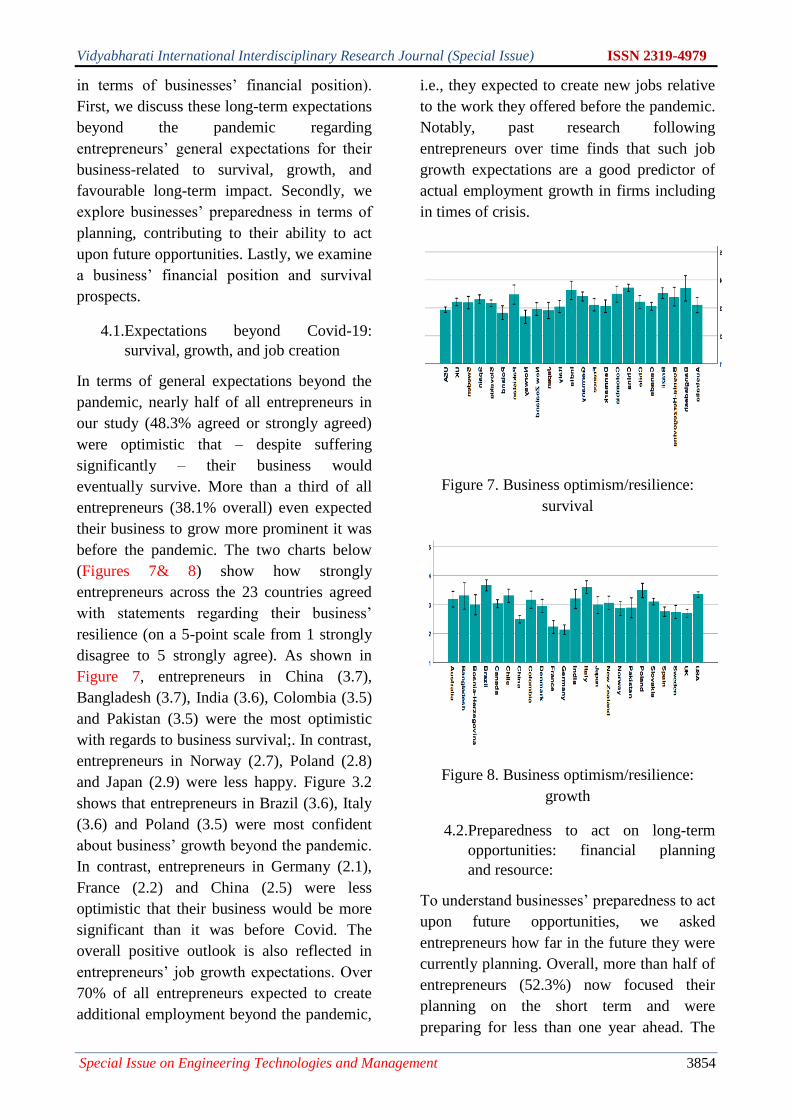
Vidyabharati International Interdisciplinary Research Journal (Special Issue) ISSN 2319-4979
Special Issue on Engineering Technologies and Management 3854
in terms of businesses’ financial position).
First, we discuss these long-term expectations
beyond the pandemic regarding
entrepreneurs’ general expectations for their
business-related to survival, growth, and
favourable long-term impact. Secondly, we
explore businesses’ preparedness in terms of
planning, contributing to their ability to act
upon future opportunities. Lastly, we examine
a business’ financial position and survival
prospects.
4.1.Expectations beyond Covid-19:
survival, growth, and job creation
In terms of general expectations beyond the
pandemic, nearly half of all entrepreneurs in
our study (48.3% agreed or strongly agreed)
were optimistic that – despite suffering
significantly – their business would
eventually survive. More than a third of all
entrepreneurs (38.1% overall) even expected
their business to grow more prominent it was
before the pandemic. The two charts below
(Figures 7& 8) show how strongly
entrepreneurs across the 23 countries agreed
with statements regarding their business’
resilience (on a 5-point scale from 1 strongly
disagree to 5 strongly agree). As shown in
Figure 7, entrepreneurs in China (3.7),
Bangladesh (3.7), India (3.6), Colombia (3.5)
and Pakistan (3.5) were the most optimistic
with regards to business survival;. In contrast,
entrepreneurs in Norway (2.7), Poland (2.8)
and Japan (2.9) were less happy. Figure 3.2
shows that entrepreneurs in Brazil (3.6), Italy
(3.6) and Poland (3.5) were most confident
about business’ growth beyond the pandemic.
In contrast, entrepreneurs in Germany (2.1),
France (2.2) and China (2.5) were less
optimistic that their business would be more
significant than it was before Covid. The
overall positive outlook is also reflected in
entrepreneurs’ job growth expectations. Over
70% of all entrepreneurs expected to create
additional employment beyond the pandemic,
i.e., they expected to create new jobs relative
to the work they offered before the pandemic.
Notably, past research following
entrepreneurs over time finds that such job
growth expectations are a good predictor of
actual employment growth in firms including
in times of crisis.
Figure 7. Business optimism/resilience:
survival
Figure 8. Business optimism/resilience:
growth
4.2.Preparedness to act on long-term
opportunities: financial planning
and resource:
To understand businesses’ preparedness to act
upon future opportunities, we asked
entrepreneurs how far in the future they were
currently planning. Overall, more than half of
entrepreneurs (52.3%) now focused their
planning on the short term and were
preparing for less than one year ahead. The
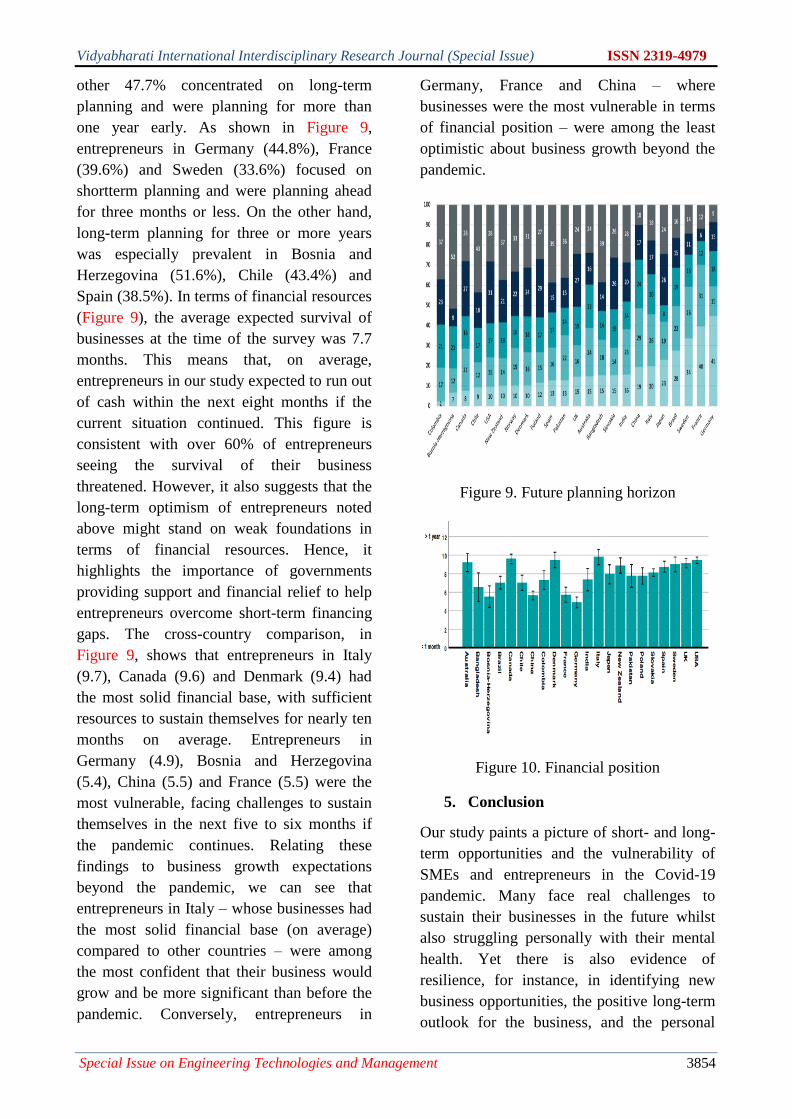
Vidyabharati International Interdisciplinary Research Journal (Special Issue) ISSN 2319-4979
Special Issue on Engineering Technologies and Management 3854
other 47.7% concentrated on long-term
planning and were planning for more than
one year early. As shown in Figure 9,
entrepreneurs in Germany (44.8%), France
(39.6%) and Sweden (33.6%) focused on
shortterm planning and were planning ahead
for three months or less. On the other hand,
long-term planning for three or more years
was especially prevalent in Bosnia and
Herzegovina (51.6%), Chile (43.4%) and
Spain (38.5%). In terms of financial resources
(Figure 9), the average expected survival of
businesses at the time of the survey was 7.7
months. This means that, on average,
entrepreneurs in our study expected to run out
of cash within the next eight months if the
current situation continued. This figure is
consistent with over 60% of entrepreneurs
seeing the survival of their business
threatened. However, it also suggests that the
long-term optimism of entrepreneurs noted
above might stand on weak foundations in
terms of financial resources. Hence, it
highlights the importance of governments
providing support and financial relief to help
entrepreneurs overcome short-term financing
gaps. The cross-country comparison, in
Figure 9, shows that entrepreneurs in Italy
(9.7), Canada (9.6) and Denmark (9.4) had
the most solid financial base, with sufficient
resources to sustain themselves for nearly ten
months on average. Entrepreneurs in
Germany (4.9), Bosnia and Herzegovina
(5.4), China (5.5) and France (5.5) were the
most vulnerable, facing challenges to sustain
themselves in the next five to six months if
the pandemic continues. Relating these
findings to business growth expectations
beyond the pandemic, we can see that
entrepreneurs in Italy – whose businesses had
the most solid financial base (on average)
compared to other countries – were among
the most confident that their business would
grow and be more significant than before the
pandemic. Conversely, entrepreneurs in
Germany, France and China – where
businesses were the most vulnerable in terms
of financial position – were among the least
optimistic about business growth beyond the
pandemic.
Figure 9. Future planning horizon
Figure 10. Financial position
5. Conclusion
Our study paints a picture of short- and long-
term opportunities and the vulnerability of
SMEs and entrepreneurs in the Covid-19
pandemic. Many face real challenges to
sustain their businesses in the future whilst
also struggling personally with their mental
health. Yet there is also evidence of
resilience, for instance, in identifying new
business opportunities, the positive long-term
outlook for the business, and the personal
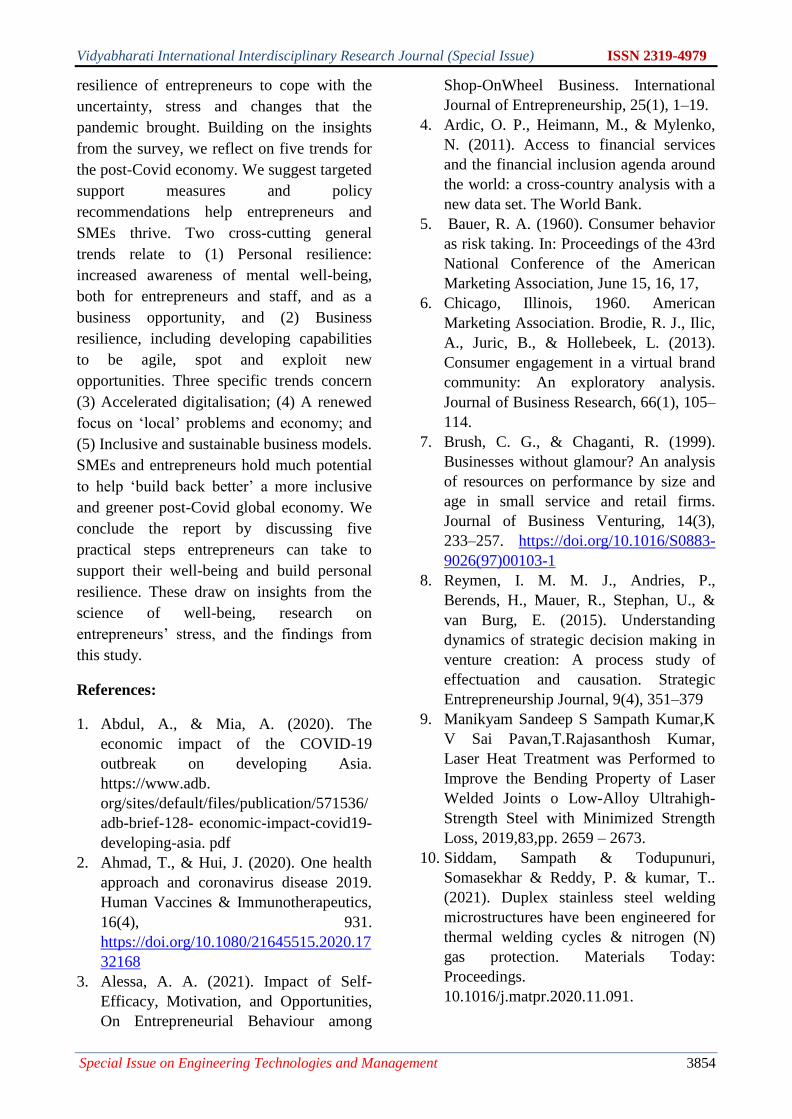
Vidyabharati International Interdisciplinary Research Journal (Special Issue) ISSN 2319-4979
Special Issue on Engineering Technologies and Management 3854
resilience of entrepreneurs to cope with the
uncertainty, stress and changes that the
pandemic brought. Building on the insights
from the survey, we reflect on five trends for
the post-Covid economy. We suggest targeted
support measures and policy
recommendations help entrepreneurs and
SMEs thrive. Two cross-cutting general
trends relate to (1) Personal resilience:
increased awareness of mental well-being,
both for entrepreneurs and staff, and as a
business opportunity, and (2) Business
resilience, including developing capabilities
to be agile, spot and exploit new
opportunities. Three specific trends concern
(3) Accelerated digitalisation; (4) A renewed
focus on ‘local’ problems and economy; and
(5) Inclusive and sustainable business models.
SMEs and entrepreneurs hold much potential
to help ‘build back better’ a more inclusive
and greener post-Covid global economy. We
conclude the report by discussing five
practical steps entrepreneurs can take to
support their well-being and build personal
resilience. These draw on insights from the
science of well-being, research on
entrepreneurs’ stress, and the findings from
this study.
References:
1. Abdul, A., & Mia, A. (2020). The
economic impact of the COVID-19
outbreak on developing Asia.
https://www.adb.
org/sites/default/files/publication/571536/
adb-brief-128- economic-impact-covid19-
developing-asia. pdf
2. Ahmad, T., & Hui, J. (2020). One health
approach and coronavirus disease 2019.
Human Vaccines & Immunotherapeutics,
16(4), 931.
https://doi.org/10.1080/21645515.2020.17
32168
3. Alessa, A. A. (2021). Impact of Self-
Efficacy, Motivation, and Opportunities,
On Entrepreneurial Behaviour among
Shop-OnWheel Business. International
Journal of Entrepreneurship, 25(1), 1–19.
4. Ardic, O. P., Heimann, M., & Mylenko,
N. (2011). Access to financial services
and the financial inclusion agenda around
the world: a cross-country analysis with a
new data set. The World Bank.
5. Bauer, R. A. (1960). Consumer behavior
as risk taking. In: Proceedings of the 43rd
National Conference of the American
Marketing Association, June 15, 16, 17,
6. Chicago, Illinois, 1960. American
Marketing Association. Brodie, R. J., Ilic,
A., Juric, B., & Hollebeek, L. (2013).
Consumer engagement in a virtual brand
community: An exploratory analysis.
Journal of Business Research, 66(1), 105–
114.
7. Brush, C. G., & Chaganti, R. (1999).
Businesses without glamour? An analysis
of resources on performance by size and
age in small service and retail firms.
Journal of Business Venturing, 14(3),
233–257. https://doi.org/10.1016/S0883-
9026(97)00103-1
8. Reymen, I. M. M. J., Andries, P.,
Berends, H., Mauer, R., Stephan, U., &
van Burg, E. (2015). Understanding
dynamics of strategic decision making in
venture creation: A process study of
effectuation and causation. Strategic
Entrepreneurship Journal, 9(4), 351–379
9. Manikyam Sandeep S Sampath Kumar,K
V Sai Pavan,T.Rajasanthosh Kumar,
Laser Heat Treatment was Performed to
Improve the Bending Property of Laser
Welded Joints o Low-Alloy Ultrahigh-
Strength Steel with Minimized Strength
Loss, 2019,83,pp. 2659 – 2673.
10. Siddam, Sampath & Todupunuri,
Somasekhar & Reddy, P. & kumar, T..
(2021). Duplex stainless steel welding
microstructures have been engineered for
thermal welding cycles & nitrogen (N)
gas protection. Materials Today:
Proceedings.
10.1016/j.matpr.2020.11.091.

Vidyabharati International Interdisciplinary Research Journal (Special Issue) ISSN 2319-4979
Special Issue on Engineering Technologies and Management 3854
11. K B SAI SANJANA1 , K SAI
MOUNIKA2 , T RAJA SANTHOSH
KUMAR3 & D V SRIKANTH4,
THERMAL ANALYSIS OF
ADVANCED IC ENGINE CYLINDER,
International Journal of Automobile
Engineering Research and Development
(IJAuERD) ISSN(P): 2277-4785;
ISSN(E): 2278-9413 Vol. 6, Issue 3, Jun
2016, 17-26
12. Cohen, S., Kamarck, T., and Mermelstein,
R. (1983). A global measure of perceived
stress. Journal of Health and Social
Behavior, 24, 386-396. And Cohen, S.
and Williamson, G. Perceived Stress in a
Probability Sample of the United States.
Spacapan, S. and Oskamp, S. (Eds.) The
Social Psychology of Health. Newbury
Park, CA: Sage, 1988.
13. Weinberger, E., Wach, D., Stephan, U., &
Wegge, J. (2018). Having a creative day:
Understanding entrepreneurs’ daily idea
generation through a recovery lens.
Journal of Business Venturing, 33(1), 1-
19.
14. Hirshkowitz, M., Whiton, K., Albert, S.
M., Alessi, C., Bruni, O., DonCarlos, L.,
Hazen, N., Herman, J., Katz, E.S.,
KheirandishGozal, L., Neubauer, D.N.,
O’Donnel, A.E., Ohayon, M., Peever, J.,
Rawding, R., Sacheva, R.C., Setters, B.,
Vitiello, M.V., Ware, C., & Hillard, P. J.
A. (2015). National Sleep Foundation’s
sleep time duration recommendations:
methodology and results summary. Sleep
health, 1(1), 40-43.
15. Blair, S. N., LaMonte, M. J., &
Nichaman, M. Z. (2004). The evolution of
physical activity recommendations: how
much is enough?. The American journal
of clinical nutrition, 79(5), 913S-920S.
Vidyabharati International Interdisciplinary Research Journal (Special Issue) ISSN 2319-4979
Special Issue on Engineering Technologies and Management 3854
NEOLITHIC CULTURES IN INDIAN SUBCONTINENT
Vikas Kumar
Assistant Professor, Department of History Ram Lal Anand College University Of Delhi
E-mail: [email protected]
ABSTRACT The Neolithic or the ‘New Stone Age’ is the last phase of the stone age cultures across the world and it is preceded by
the Mesolithic (middle stone age). The present paper makes an argument in support of the recent academic
understanding that the Neolithic culture in the Indian subcontinent was a result of local developments and was not
introduced by either Mesopotamia or the Fertile Crescent. The Paper also brings out the vibrant cultural pattern
across the subcontinent with the help of relevant illustrations from the different parts of the subcontinent. The Neolithic
phase of Indian History was also not homogeneously spread across the length and breadth of the subcontinent. There
were local variations as far as the material culture, subsistence pattern, tool technology or the chronology is
concerned.
Keywords: Food processing, archaeology, carbon dating, cultural spread, excavation, material culture, and
ceramics
Main Paper
In the Indian subcontinent as elsewhere, the
neolithic phase marks the transition towards
‘food processing’. This has led scholars to
term this phase as a ‘Revolutionary phase’. 1
A change in lifestyle has been remarkable and
the Neolithic phase has been a witness to the
transition of human societies from ‘being
hunters to breeders and gradually a food
producer.’ 2 The Neolithic was not only a
change in lifestyle, tool technology, diet but
also the ecological setting in which the early
human societies were attempting to adapt to
new subsistence patterns.
Large groups of human societies
migrated across the world and there were
many catalysts responsible for these
interrelated changes. Changes in climate and
environment towards the end of Pleistocene
and onset of Holocene, demographic growth
on account of protein rich diet and cultural
and technological advancements have all
been quite instrumental in shaping the way
Neolithic appears today in academic circles.
Brian Fagan and Nadia Durrani hint that
Neolithic was perhaps the platform on which
the later period civilizations developed and
ushered. 3
1 See Gordon Childe, “The Urban Revolution” in
The Town Planning Review, 21(1); 3-17, 1950. 2 See B. P. Sahu, From Hunters to Breeders:
Faunal Background of Early India, Anamika
Prakashan, 1988. 3 See Brian M. Fagan and Nadia Durrani, World
Prehistory: A Brief Introduction, Routledge,
2016.
Initially, the scholars believed that
Indian subcontinent experienced food
production as an impact of western
developments, but the developments after
seventies brought India on the global map of
prehistoric developments reaffirming the
Neolithic phase of Indian history.
Excavations and studies at Mehrgarh fully
establish that wheat and barley were
cultivated in the subcontinent almost
simultaneously to the dates of the fertile
crescent thus doing away with the idea of
‘inspired by the west’. Some scholars
forwarded the theory of diffusion of the art of
cultivation to other parts of the subcontinent
but the discoveries made at peninsula and
north-east have also attested to the
independent developments in the various
regions and sub-regions of the subcontinent
irrespective of the developments in the fertile
crescent, Africa and China.
It can be said that the process of food
production in the Indian subcontinent was
spread over a vast span of time roughly from
the eighth century millennium to 1000 BCE.
A brief survey of early neolithic finds in the
subcontinent would make it clear that the
entire subcontinent was experiencing
Neolithic in some form or the other in the
different periods. Neolithic celts were
discovered by Le Mesurie in the Raichur
district and John Lubbock in the Brahmaputra
valley in 1852 and 1867 respectively. Based
on the vast spread of the Neolithic discoveries
spread over the entire subcontinent R.S.
Sharma classified the entire phase into three
subcategories while V.K. Jain, on the basis of
Vidyabharati International Interdisciplinary Research Journal (Special Issue) ISSN 2319-4979
Special Issue on Engineering Technologies and Management 3854
further evidence argues in favour of six
subcategories of the Neolithic phase in the
Indian subcontinent.4 Tool types, subsistence
patterns and the material life was responsible
for this classification. However, it also needs
to be emphasised that ceramic ware and
traditions were also responsible for variations
in the cultural patterns and layers of
habitation.
The six zones of Neolithic in Indian
subcontinent are as follows:
(i) North-west, Mehrgarh area
dated around 7th to 4th millennium BCE
(ii) Northern, Kashmir valley
dated around 2500 to 1500 BCE
(iii) Central India, Vindhyan region
dated around 4000 to 1200 BCE
(iv) Mid-Gangetic basin, eastern U.P
and western Bihar dated around 2000 to 1500
BCE
(v) Eastern India dated around
1500 BCE
(vi) Peninsular India dated around
2500 to 1500 BCE
Some of the regions were
contemporary to the Harappan Civilization
and also furnished the evidence of copper and
advanced ceramic ware besides beads and
bricks.
A discussion of these six zones would
further add to the argument regarding the
indigenous developments of Neolithic in
Indian context.
Balochistan, Indus plains and the
vicinity comprise the north-western zone of
the Indian Neolithic map. Geographically,
this region was in close proximity to the
fertile crescent and Mesopotamia but
nevertheless the developments here were
simultaneous and one cannot say that the
developments here were solely the result of
the influence coming from Mesopotamia or
the fertile crescent. The major sites are
Mehrgarh, Kili Ghul Muhammad, Rana
Ghundai and Anjira spread over the sub-
regions and localities of the North western
region. Other sites discovered later were
Ghumla, Rehman Dheri, Tarkai Kila and
4 V.K. Jain, Prehistory and Protohistory of India,
D.K. Printworld, 2006.
Rehman Dheri. D.K. Chakrabarti opines that
the developments at Mehrgarh gradually
brought the entire region under its influence. 5
The major evidence from this zone includes
evidence for the cultivation of barley, hearth,
non-ceramic and ceramic phases besides a
variety of harvesting tools. Even the ceramic
phase shows the distinction of handmade and
wheel made, sun dried and kiln-fired ceramic
ware.
Kashmir valley provides evidence of
the Northern zone of the Neolithic phase with
Burzahom, Gufkral and Kanishpur (in
Baramulla district) as the prominent sites.
The flood plains of river Jhelum have
revealed a large number of Neolithic sites.
The Kashmir neolithic sites are multicultural
with evidence of megalithic and historical
phases as well. There is no clear evidence of a
mesolithic phase in this zone. The major
features include pet burials, pit dwellings,
hearths and pits with post-holes around them,
domesticated varieties of wheat, barley, lentil.
Remains of both wild and domesticated
sheep, goat, dogs, deer, etc. Polished stone
tools include large quern, tools of bone, horn,
beads of steatite, handmade crude grey ware,
wheel made pottery.
The Vindhyan and Kaimur ranges
near Rivers Ganga, Son and Belan comprise
the Neolithic zone of Central India.
Prominent sites are Koldihawa, Mahagara,
Mahadaha, Chopani Mando, etc. Major finds
at this zone include evidence of domesticated
rice, cord impressed ware, huts, post holes,
burials, cattle pen, pestle, querns, pottery, etc.
Pottery was handmade, initially poorly fired
with rice husk and straw as tempering
material. Cord impressed pottery, sometimes
with designs, are the prominent finds.
The Neolithic sites in the mid-
Gangetic basin are located around Ganga,
Sarayu and Ghagra with prominent sites such
as Narhan, Chirand, Imlidih, Sohgaura,
Taradih and Senuar. The major finds include
bangles, fish remains, cultivated rice,
terracotta, bone and antler tools and
ornaments, etc.
5 D.K. Chakrabarti, India: An Archaeological
History, Oxford, 1999, p.117.
Vidyabharati International Interdisciplinary Research Journal (Special Issue) ISSN 2319-4979
Special Issue on Engineering Technologies and Management 3854
The Eastern Zone comprises sites like
Pandu Rajar Dhibi, Kuchai, Golbai Sasan,
Mahishdal and Baridih etc. Prominent finds
include a gritty red handmade ware, mace
heads, pounders and grinding stones, black
and red ware, bone tools, etc.
The North-eastern zone is represented
by Sarutaru, Napchik, Daojali Hading, etc.
with evidence of polished stone tools,
shouldered axes and cord impressed pottery.
Some scholars believe that the Neolithic
culture in the North-East zone has a close
connection with South-East Asia and China.
There is clear evidence of cultivation of rice
and fishing in this zone. Interestingly, the
presence of celts continued even into the later
periods and the north-east settlements provide
a date much later somewhere around 1500
BCE when parts of the north-west and north
had been acquainted with metal either copper
or iron.
The Neolithic cultural zone in South
India has been very fascinating. Most of the
sites are located in the peninsula and Deccan
plateau and there is good evidence of animal
domestication and cultivation of crops like
ragi, kulathi, etc. The prominent sites are
located in the proximity of rivers Bhima and
Kaveri in the Raichur-Shorapur doab and are
Sanganakallu, Hallur, Tekkalkotta, Kupgal,
Piyampalli, T. Narsipur, Piklihal, Utnur,
Palavoy, etc. the nearby source of water and
dryland ecology made this zone convenient
for animal husbandry and the evidence of
cattle pens, hoof marks and ‘ash-mounds’
attest the same. Other finds include circular
and wattle-daub huts, hearths, storage areas,
charred grains of millet, barley, horse gram,
etc. Ash mounds were the places where dung
of domesticated animals was collected. The
entire area was later set afire either for a ritual
purpose or simply for cleaning the area for
the next season. Some scholars have opined
that at the time of migrating or moving out
along with the cattle, the settlers would have
burnt down the accumulated dung. Whatever
may be the reason, these ‘ash-mounds’
certainly indicate the prevalence of animal
domestication of an organised level with
cattle-pens and even a place designated to
collect the waste and dung. Hoof marks of
domesticated cattle have been found on some
of these ‘ash-mounds’.
Conclusion
The above discussion of the various
zones of Neolithic culture in the Indian
subcontinent reinforces the argument that the
developments of Neolithic cultures in the
Indian subcontinent were neither
homogeneous nor an offshoot of the
Mesopoatmian or western developments. The
Neolithic phase of Indian history needs to be
seen in a larger and local dynamic. It also
needs to be emphasised that while some
zones, for example the north west were much
ahead chronologically and were gradually
inching towards metal based civilization, the
ones in south and east were still experiencing
a transition from Mesolithic to Neolithic. The
broader parameters of the Neolithic include
tools suited for agricultural activities, settled
habitations, elaborate burials, cattle pens,
crafts, pottery, domestication of plants and
animals and of course a more balanced and
stable environment.


![PART 2 US CMA Section A [Financial Statement Analysis] (25%)](https://img.dokumen.tips/doc/110x75/6334b12fb9085e0bf5092416/part-2-us-cma-section-a-financial-statement-analysis-25.jpg)
