Embed Size (px)
Citation preview

Parallel File System AnalysisThrough Application I/O Tracing
S.A. Wright1, S.D. Hammond2, S.J. Pennycook1, R.F. Bird1,J.A. Herdman3, I. Miller3, A. Vadgama3, A. Bhalerao1 and
S.A. Jarvis1
1Performance Computing and Visualisation, Department of Computer Science, University ofWarwick, UK
2Scalable Computer Architectures/CSRI, Sandia National Laboratories, Albuquerque, NewMexico, USA
3Supercomputing Solution Centre, UK Atomic Weapons Establishment, Aldermaston,Reading, UK
Email: [email protected]
Input/Output (I/O) operations can represent a significant proportion of the run-time of parallel scientific computing applications. Although there have beenseveral advances in file format libraries, file system design and I/O hardware,a growing divergence exists between the performance of parallel file systemsand the compute clusters that they support. In this paper we document thedesign and application of RIOT, an I/O tracing toolkit being developed at theUniversity of Warwick with our industrial partners at the Atomic WeaponsEstablishment and Sandia National Laboratories. We use the toolkit to assessthe performance of three industry-standard I/O benchmarks on three contrastingsupercomputers, ranging from a mid-sized commodity cluster to a large-scaleproprietary IBM BlueGene/P system. RIOT provides a powerful frameworkin which to analyse I/O and parallel file system behaviour – we demonstrate,for example, the large file locking overhead of IBM’s General Parallel FileSystem, which can consume nearly 30% of the total write time in the FLASH-IO benchmark. Through I/O trace analysis we also assess the performance ofHDF-5 in its default configuration, identifying a bottleneck created by the useof sub-optimal MPI hints. Furthermore, we investigate the performance gainsattributed to the Parallel Log-structured File System (PLFS) being developed byEMC Corporation and the Los Alamos National Laboratory. Our evaluation ofPLFS involves two HPC systems with contrasting I/O backplanes and illustratesthe varied improvements to I/O that result from the deployment of PLFS (rangingfrom up to 25× speed-up in I/O performance on a large I/O installation to 2×
speed-up on the much smaller installation at the University of Warwick).
Keywords: High Performance Computing; Input/Output; MPI; Checkpointing; File Systems
1. INTRODUCTION
The substantial growth in the size of supercomputers– over two orders of magnitude in terms of processingelements since 1993 – has created machines of extremecomputational power and scale. As a result, usershave been able to develop increasingly sophisticatedand complex computational simulations, advancingscientific understanding across multiple domains.Historically, industry and academia have focusedon the development of scalable parallel algorithmsand their deployment on increasingly sophisticatedhardware, creating a perception that supercomputerperformance is synonymous with the number offloating-point operations that can be performed each
second (FLOP/s).
One of the consequences of this has been that someof the vital contributors to application run-time havedeveloped at a much slower rate. One such area is thatof input and output (I/O), typically required to readdata at the start of a run and write state informationon completion.
As we advance towards exa-scale computing, theincreasing number of compute components will havehuge implications for system reliability. As a result,checkpointing – where the system state is periodicallywritten to persistent storage so that, in the case of ahardware or software fault, the computation can berestored and resumed – is becoming common-place.The cost of checkpointing is a slowdown at specific
The Computer Journal, Vol. ??, No. ??, ????

2 S.A. Wright, et al.
points in the application in order to achieve some levelof resilience. Understanding the cost of checkpointing,and the opportunities that might exist for optimisingthis behaviour, presents a genuine opportunity toimprove the performance of parallel applications atscale.
The Message Passing Interface (MPI) has become thede facto standard for managing the distribution of dataand process synchronisation in parallel applications.The MPI-2 [1] standard introduced MPI-IO, a libraryof functions designed to standardise the output of datato the file system in parallel. The most widely adoptedMPI-IO implementation is ROMIO [2] which is used byboth OpenMPI [3] and MPICH2 [4], as well as by anumber of vendor-based MPI solutions [5, 6].
In addition to the standardisation of parallel I/Othrough MPI, many file format libraries exist to furtherabstract low-level I/O operations (e.g. data formatting)from the application. Libraries such as HDF-5 [7],NetCDF [8] and Parallel NetCDF [9] allow applicationsto output data in a standardised format, enablinginformation to be more easily utilised by multipleparallel applications. Optimisations can also be madeto a single library, creating improvements in the datathroughput of many dependent applications.
Unfortunately this has, in part at least, encouragedcode designers to treat these libraries as a black-box,instead of investigating and optimising the data storageoperations required by their applications. The resulthas been poor I/O performance that does not utilisethe full potential of expensive parallel disk systems.
In this paper we document the design and applicationof the RIOT I/O Toolkit (referred to throughout theremainder of this paper by the recursive acronymRIOT), first introduced in [10], to demonstrate theI/O behaviours of three standard benchmarks atscale on a variety of contrasting high-performancecomputing (HPC) systems. RIOT is a collectionof tools specifically designed to enable the tracingand subsequent analysis of application I/O activity.This tool is able to trace parallel file operationsperformed by the ROMIO layer and relate these totheir underlying POSIX file operations. We note thatthis recording of low-level parameters permits analysisof I/O middleware, file format libraries, applicationbehaviour and even the underlying file systems utilisedby large clusters.
Specifically this paper makes the following contribu-tions:
• We present RIOT, an I/O tracer designed tointercept the file functions in the MPI-2 standard,as well as the low-level system calls triggered bythe MPI-IO library. Our tool records not only thetiming information, but also information relatingto how much data is written and the file offsetto which it is written. We also introduce a post-processing tool capable of generating statistical
summaries and graphical representations of anapplication’s parallel I/O activities;
• Using RIOT we analyse the I/O behaviourof three industry-standard benchmarks: theBlock-Tridiagonal (BT) solver, from NASA’sParallel Benchmark (NPB) Suite; the FLASH-IO benchmark, from the University of Chicagoand the Argonne National Laboratory (ANL);and IOR, a HPC file system benchmark whichis used during procurement and file systemassessment [11, 12]. Our analysis employs threecontrasting platforms: a mid-size commoditycluster located at the University of Warwick,a large-scale capacity resource housed at theOpen Computing Facility (OCF) at the LawrenceLivermore National Laboratory (LLNL) and aproprietary IBM BlueGene/P (BG/P) systeminstalled at the Daresbury Laboratory in the UK;
• Through using RIOT we demonstrate the signif-icant overhead associated with file locking on asmall-scale installation of IBM’s General ParallelFile System (GPFS) and contrast this to a largerGPFS installation, as well as to a large-scale Lus-tre installation. We provide an analysis of both thelocking semantics of the contrasting file systems aswell as the different hardware configurations;
• RIOT is the first tool, to our knowledge, to showthe relationship between POSIX and MPI functioncalls and thus allow developers to analyse thePOSIX file behaviour that is a direct result ofMPI-IO calls. In Section 6.1 we utilise this abilityto visualise the performance of the FLASH-IObenchmark, demonstrating a significant slow downin performance due to the use of sub-optimal MPIhints. We optimise the application’s behaviourusing MPI hint directives and achieve more thana 2× improvement in write bandwidth;
• Finally, through I/O trace analysis, we provideinsight into the performance gains reported by theParallel Log-structured File System (PLFS) [13,14] – a novel I/O middleware being developed byEMC Corporation and the Los Alamos NationalLaboratory (LANL) to improve file write times.We show how improvements in I/O performancecan be demonstrated on relatively small parallelfile systems and how large gains can be achievedon much larger installations. We also offersome insight into why this is the case and howPLFS reduces file system contention, improvingachievable bandwidth.
The remainder of this paper is structured as follows:Section 2 gives an overview of related work in thearea of parallel I/O analysis and optimisation; Section3 outlines the design and implementation of RIOT;Section 4 describes the experimental set up used in thispaper, ranging from the configuration of the machines
The Computer Journal, Vol. ??, No. ??, ????
Parallel File System Analysis Through Application I/O Tracing 3
Ganglia Collectl Darshan IPM RIOT
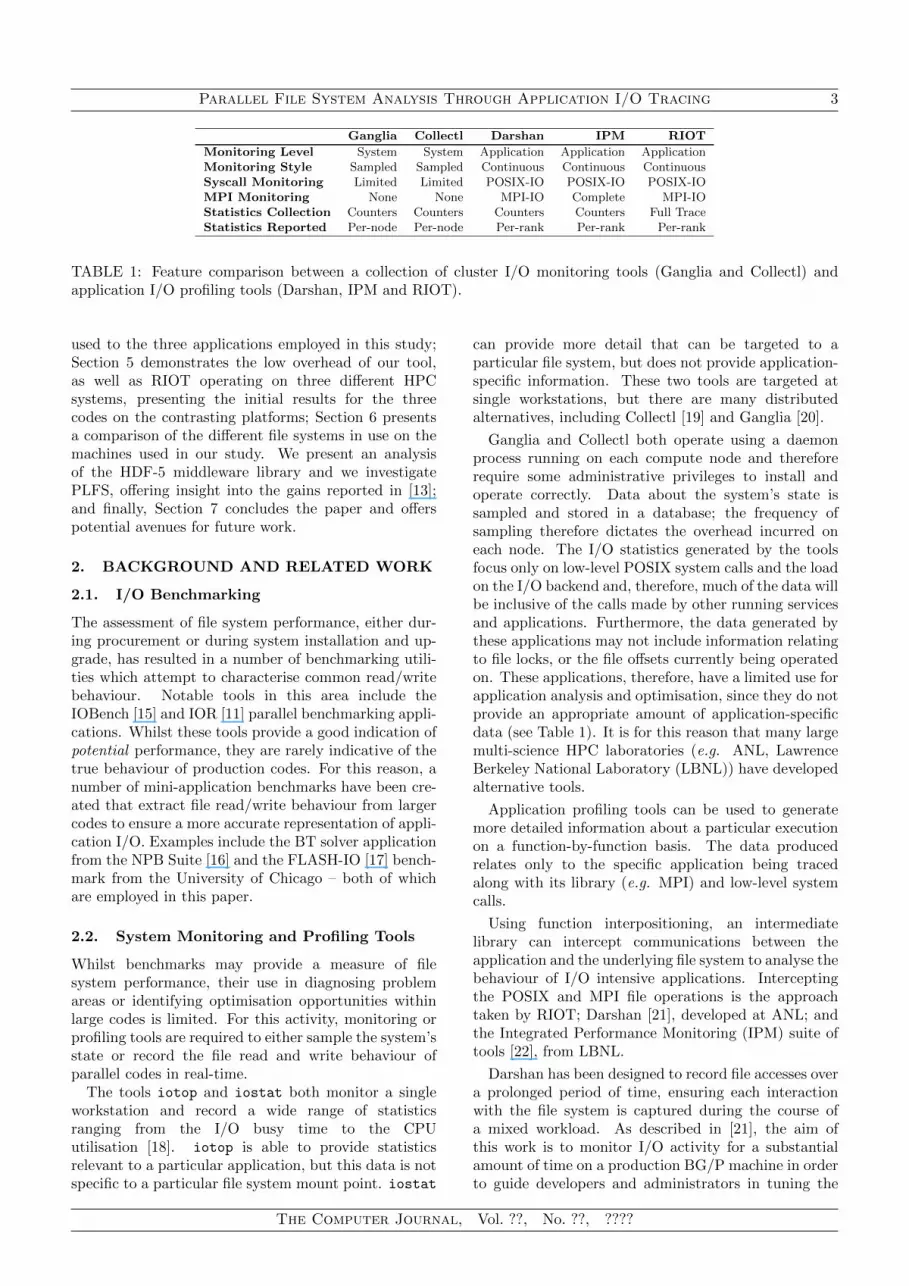
Monitoring Level System System Application Application ApplicationMonitoring Style Sampled Sampled Continuous Continuous ContinuousSyscall Monitoring Limited Limited POSIX-IO POSIX-IO POSIX-IOMPI Monitoring None None MPI-IO Complete MPI-IOStatistics Collection Counters Counters Counters Counters Full TraceStatistics Reported Per-node Per-node Per-rank Per-rank Per-rank
TABLE 1: Feature comparison between a collection of cluster I/O monitoring tools (Ganglia and Collectl) andapplication I/O profiling tools (Darshan, IPM and RIOT).
used to the three applications employed in this study;Section 5 demonstrates the low overhead of our tool,as well as RIOT operating on three different HPCsystems, presenting the initial results for the threecodes on the contrasting platforms; Section 6 presentsa comparison of the different file systems in use on themachines used in our study. We present an analysisof the HDF-5 middleware library and we investigatePLFS, offering insight into the gains reported in [13];and finally, Section 7 concludes the paper and offerspotential avenues for future work.
2. BACKGROUND AND RELATED WORK
2.1. I/O Benchmarking
The assessment of file system performance, either dur-ing procurement or during system installation and up-grade, has resulted in a number of benchmarking utili-ties which attempt to characterise common read/writebehaviour. Notable tools in this area include theIOBench [15] and IOR [11] parallel benchmarking appli-cations. Whilst these tools provide a good indication ofpotential performance, they are rarely indicative of thetrue behaviour of production codes. For this reason, anumber of mini-application benchmarks have been cre-ated that extract file read/write behaviour from largercodes to ensure a more accurate representation of appli-cation I/O. Examples include the BT solver applicationfrom the NPB Suite [16] and the FLASH-IO [17] bench-mark from the University of Chicago – both of whichare employed in this paper.
2.2. System Monitoring and Profiling Tools
Whilst benchmarks may provide a measure of filesystem performance, their use in diagnosing problemareas or identifying optimisation opportunities withinlarge codes is limited. For this activity, monitoring orprofiling tools are required to either sample the system’sstate or record the file read and write behaviour ofparallel codes in real-time.
The tools iotop and iostat both monitor a singleworkstation and record a wide range of statisticsranging from the I/O busy time to the CPUutilisation [18]. iotop is able to provide statisticsrelevant to a particular application, but this data is notspecific to a particular file system mount point. iostat
can provide more detail that can be targeted to aparticular file system, but does not provide application-specific information. These two tools are targeted atsingle workstations, but there are many distributedalternatives, including Collectl [19] and Ganglia [20].
Ganglia and Collectl both operate using a daemonprocess running on each compute node and thereforerequire some administrative privileges to install andoperate correctly. Data about the system’s state issampled and stored in a database; the frequency ofsampling therefore dictates the overhead incurred oneach node. The I/O statistics generated by the toolsfocus only on low-level POSIX system calls and the loadon the I/O backend and, therefore, much of the data willbe inclusive of the calls made by other running servicesand applications. Furthermore, the data generated bythese applications may not include information relatingto file locks, or the file offsets currently being operatedon. These applications, therefore, have a limited use forapplication analysis and optimisation, since they do notprovide an appropriate amount of application-specificdata (see Table 1). It is for this reason that many largemulti-science HPC laboratories (e.g. ANL, LawrenceBerkeley National Laboratory (LBNL)) have developedalternative tools.
Application profiling tools can be used to generatemore detailed information about a particular executionon a function-by-function basis. The data producedrelates only to the specific application being tracedalong with its library (e.g. MPI) and low-level systemcalls.
Using function interpositioning, an intermediatelibrary can intercept communications between theapplication and the underlying file system to analyse thebehaviour of I/O intensive applications. Interceptingthe POSIX and MPI file operations is the approachtaken by RIOT; Darshan [21], developed at ANL; andthe Integrated Performance Monitoring (IPM) suite oftools [22], from LBNL.
Darshan has been designed to record file accesses overa prolonged period of time, ensuring each interactionwith the file system is captured during the course ofa mixed workload. As described in [21], the aim ofthis work is to monitor I/O activity for a substantialamount of time on a production BG/P machine in orderto guide developers and administrators in tuning the
The Computer Journal, Vol. ??, No. ??, ????

4 S.A. Wright, et al.
I/O backplanes used by large machines.Similarly, IPM [23] uses an interposition layer to
catch all calls between the application and the filesystem. This trace data is then analysed in order tohighlight any performance deficiencies that exist in theapplication or middleware. Based on this analysis,the authors were able to optimise two applications,achieving a 4× improvement in I/O performance.
Darshan and IPM both collect data using countersto record I/O statistics. By contrast, RIOT recordsall I/O events in memory and thus provides users witha full trace of file activities. As a result, RIOT’s post-processing tools can relate individual POSIX operationsto their parent MPI-IO function calls, permittinganalysis not only of the application’s I/O behaviour butalso of the underlying POSIX file behaviour inducedby the use of MPI-IO. This data can then be usedto analyse the performance of a particular peice ofmiddleware. Furthermore, RIOT is able to highlightany deficiencies that may exist within a ROMIO filesystem driver or provide guidance as to which MPI hintsmay benefit a particular application or file system.
Table 1 summarises the features of each of the toolsdescribed above.
2.3. Distributed File Systems
The I/O backplane of high-performance clusters isgenerally provided by a distributed file system. The twomost widely used file systems are IBM’s GPFS [24] andthe Lustre File System [25], both of which are analysedin this study. Whilst both ultimately serve the samepurpose, their architectures are somewhat different.
A Lustre installation consists of a number of ObjectStorage Servers (OSS) and a single, dedicated MetadataServer (MDS). Conversely, GPFS uses a number ofI/O servers, and distributes metadata over each ofthem. Whilst the MDS in Lustre uses its own harddrives to store metadata (e.g. directory tree, filestructure), GPFS can be configured to store this dataeither to the same disks as the raw data, or to higherperformance metadata-specific disks, depending on theconfiguration.
2.4. Virtual File Systems
In addition to distributed file systems, a variety ofvirtual file systems have been produced to furtherimprove performance. The Parallel Log-structured FileSystem (PLFS) [13] and Zest [26] have both been shownto improve file write performance. In these systems,multiple parallel writes are written sequentially to thefile system with a log tracking the current data. Writingsequentially to the file system in this manner offerspotentially large gains in write performance, at thepossible expense of later read performance [27].
In the case of Zest, data is written sequentially usingthe fastest path to the file system available. There is,
however, no read support in Zest; instead, it servesas a transition layer, caching data that is later copiedto a fully featured file system at a later non-criticaltime. The result of this is high write throughput butno ability to restart the application until the data hasbeen transferred and rebuilt on a read-capable system.
In a similar vein to [28] and [29], in whichI/O throughput is vastly improved by transparentlypartitioning a data file (creating multiple, independent,I/O streams), PLFS uses file partitioning as well asa log-structured file system to further improve thepotential I/O bandwidth. Through our tracing tools,we offer an in-depth analysis of the benefits offered byPLFS (see Section 6.3).
We previously introduced RIOT in [10, 30]. In thispaper we significantly extend this work as follows:
• We utilise a custom I/O benchmark designedspecifically to assess the impact of using RIOTon I/O intensive applications. We demonstratethat the performance overheads incurred throughthe use of RIOT are minimal, thus making it anappropriate tool for tracing large and long-runningproduction-grade codes;
• We demonstrate the first applications of RIOTon a proprietary BlueGene system, IBM’s highlyscalable, low power massively parallel HPCplatform;
• We present a detailed application of RIOT in acomparative study of the I/O performance of amid-range and a large-scale commodity cluster,and also the IBM BG/P. The contrasting I/Oconfiguration of these three platforms are exten-sively evaluated, offering insight into potential fu-ture designs and also demonstrating the versatilityof RIOT;
• We complement our previous analysis of collectivebuffering [30] with an assessment of the use ofdedicated I/O aggregators, such as the dedicatedI/O nodes found in the BG/P. Our results showthat collecting the data from many nodes prior tocommitting the data to the file system can lead toexceptional I/O performance;
• We utilise RIOT’s ability to visualise file writebehaviour to analyse the write pattern used byHDF-5 with data-sieving enabled. This dataclearly demonstrates how a single MPI writeoperation is decomposed into a series of smallerPOSIX lock, read, write, unlock cycles;
• Through a new case study, we demonstrate thata RIOT trace can be used to detect performancebottlenecks in an application’s I/O. By disablingdata-sieving (a problem highlighted by RIOT)and enabling collective buffering in the FLASH-IObenchmark, we increase the achievable bandwidthof this industry-standard benchmark by 2× on twoof our three test systems.
The Computer Journal, Vol. ??, No. ??, ????

Parallel File System Analysis Through Application I/O Tracing 5
MPI-IOBandwidths and
Overheads
Perceived and Effective POSIX
Bandwidths
File LockingOverheads
Concurrent POSIXOperations
Application
libriot
MPI
ROMIO (incl. PLFS)
libc / POSIX Layer
Operating System
StorageFile System
Post
-Pro
cess
or (
riot-
stat
s)
Application Libraries (HDF-5, etc.)
n-1 1 0
I/O Event Trace
Merge and Sort
MPI_File_read/write()
POSIX read/write()
POSIX read/write()
0.00032 0 23 1 00.00045 0 13 1 0. . . . .. . . . .0.00321 0 24 1 2048
Event Buffer(s)
FIGURE 1: Tracing and Analysis Workflow using the RIOT Toolkit.
3. RIOT OVERVIEW
The left-hand side of Figure 1 depicts the usual flowof I/O in parallel applications; generally, applicationseither utilise the MPI-IO file interface directly, or use athird party library such as HDF-5 or NetCDF. In bothcases, MPI is ultimately used to perform the read andwrite operations. In turn, the MPI library calls uponthe MPI-IO library which, in the case of both OpenMPIand MPICH, is the ROMIO implementation [2]. TheROMIO file system driver [31] then calls the system’sPOSIX file operations to read and write the data to thefile system. In this paper we utilise the PLFS ROMIOfile system driver during our experiments.
RIOT is an I/O tracing tool that can be utilisedeither as a dynamically loaded library (via run-timepre-loading and linking) or as a static library (linkedat compile time). In the case of the former, the sharedlibrary uses function interpositioning to place itselfin the library stack immediately prior to execution.When compiled as a dynamic library, RIOT redefinesseveral functions from the POSIX system-layer andMPI libraries – when the running application makescalls to these functions, control is instead passed tohandlers in the RIOT library. These handlers allowthe original function to be performed, timed andrecorded into a log file for each MPI rank. Byusing the dynamically loadable libriot, applicationrecompilation is avoided; RIOT is therefore able tooperate on existing application binaries and remaincompiler and implementation language agnostic.
For situations where dynamic linking is either notdesirable or is only available in a limited capacity (such
as in the BG/P system used in this study), a staticlibrary can be built. A compiler wrapper is used tocompile RIOT into a parallel application using the-wrap functionality found in the Linux linker.
As shown in Figure 1, libriot intercepts I/O callsat three positions. In the first instance MPI-IO callsare intercepted and redirected through RIOT, usingeither the PMPI interface, or dynamic or static linking.In the second instance POSIX calls made by the MPIlibrary are intercepted, and in the final instance anyPOSIX calls made by the ROMIO file system interfaceare caught and processed by RIOT.
Traced events in RIOT are recorded in a bufferstored in main memory. Whilst the size of the bufferis configurable, our experiments have led us to setthe buffer size at 8 MB. This allows approximately340,000 operations to be stored before needing to beflushed to the disk. This delay of logging (by storingevents in memory) may have a small affect on computeperformance (since the memory access patterns maychange), but storing trace data in memory helps toprevent any distortion of application I/O performance.In the event that the buffer becomes full, the data iswritten out to disk and the buffer is reset. This repeatsuntil the application has terminated.
Time coherence is maintained across multiple nodes,by overloading the MPI Init function to force all ranksto wait on an MPI Barrier before each resetting theirrespective timers. This allows us to order events evenafter nodes have experienced a degree of time drift.
After the recording of an application trace iscomplete, a post-execution analysis phase can beconducted (shown on the right-hand side of Figure 1).
The Computer Journal, Vol. ??, No. ??, ????

6 S.A. Wright, et al.
Minerva Sierra BlueGene/P
Processor Intel Xeon 5650 Intel Xeon 5660 PowerPC 450CPU Speed 2.66 Ghz 2.8 Ghz 850 MhzCores per Node 12 12 4Nodes 258 1,849 1,024Interconnect QLogic TrueScale 4X QDR InfiniBand 3D Torus Collective TreeFile System GPFS Lustre GPFSI/O Servers / OSS 2 24 4Theoretical Bandwidth ∼4 GB/sec ∼30 GB/sec ∼6 GB/secStorage Disks
Number of Disks 96 3,600 110 35Disk Size 2 TB 450 GB 147 GB 500 GBDisk Speed 7,200 RPM 10,000 RPM 15,000 RPM 7,200 RPMBus Type Nearline SAS SAS Fibre Channel S-ATARaid Level 6 (8 + 2) 6 (8 + 2) 5 (4 + 1)
Metadata DisksNumber of Disks 24 30 (+2)a N/ADisk Size 300 GB 147 GB N/ADisk Speed 15,000 RPM 15,000 RPM N/ABus Type SAS SAS N/ARaid Level 10 10 N/A
TABLE 2: Benchmarking platforms used in this study.
During execution RIOT builds a file lookup table andfor each operation only stores the time, the rank, afile identifier, an operation identifier and the file offset.After execution, these log files are merged and time-sorted into a single master log file, as well as a masterfile database. Using the information stored, RIOT can:
• Produce a complete run-time trace of application’sI/O behaviour;
• Demonstrate the file locking behaviour of aparticular file system;
• Calculate the effective POSIX bandwidth achievedby MPI to the file system;
• Visualise the decomposition of an MPI fileoperation into a series of POSIX operations;
• Demonstrate how POSIX operations are queuedand then serialised by the I/O servers.
Throughout this paper we make a distinction betweeneffective MPI-IO and POSIX bandwidths – MPI-IO bandwidths refer to the data throughput of theMPI functions on a per MPI-rank basis. POSIXbandwidths relate to the data throughput of the POSIXread/write operations as if performed serially andcalled directly by the MPI library. We make thisdistinction due to the inability to accurately reportthe perceived POSIX bandwidth due to the non-deterministic nature of parallel POSIX writes. Theperceived POSIX bandwidth is therefore bounded belowby the perceived MPI bandwidth (since the POSIXbandwidths must necessarily be at least as fast as theMPI bandwidths), and is bounded above by the effectivePOSIX bandwidth multiplied by the number of ranks(assuming a perfect parallel execution of each POSIXoperation).
4. EXPERIMENTAL SETUP
In this paper we demonstrate RIOT working on threedistinct HPC systems. We utilise the recently installedMinerva supercomputer, located at the University ofWarwick’s Centre for Scientific Computing, the Sierracluster from the OCF at LLNL and, finally, the IBMBG/P proprietary system housed at the DaresburyLaboratory in the United Kingdom.
Minerva and Sierra are built from similar compo-nents, utilising commodity Intel Xeon dual-socket hex-core Westmere-EP processors, clocked at 2.66 GHz and2.80 GHz respectively. The interconnect between Min-erva nodes is QLogic’s TrueScale 4X QDR InfiniBand,offering a theoretical maximum bandwidth of 32 Gb/s.Each Minerva node is connected through InfiniBand toits two I/O nodes. Similarly, Sierra compute nodes arealso connected via InfiniBand to the 24-node storagesystem utilised in this study – the I/O backplane usedin these experiments is part of LLNL’s “islanded I/O”network, whereby many large I/O systems are sharedbetween multiple clusters in the computing facility.
The BG/P system used for the experiments inthis paper is a single cabinet, consisting of 1,024compute nodes. Each node contains a single quad-processor compute card clocked at 850 MHz. TheBlueGene features dedicated networks for point-to-point communications and MPI collective operations.File system and complex operating system calls (suchas timing routines) are routed over the MPI collectivetree to specialised higher-performance login or I/Onodes enabling the design of the BlueGene computenode kernel to be significantly simplified to reduce
aSierra’s MDS uses 32 disks: two configured in RAID-1 forjournalling data, 28 disks configured in RAID-10 for the datavolume itself and a further two disks to be used as hot spares.
The Computer Journal, Vol. ??, No. ??, ????
Parallel File System Analysis Through Application I/O Tracing 7
Function Tracing LevelMinerva Sierra BG/P
24 48 96 24 48 96 32 64 128
None 44.00 84.54 150.91 44.75 60.32 119.72 71.31 120.26 262.96MPI File write POSIX 44.22 93.05 150.72 46.78 67.07 113.41 68.99 113.52 256.70
Complete 44.36 84.66 155.48 46.33 70.72 123.89 69.00 116.13 256.89
None 26.39 50.62 100.96 36.25 71.13 129.69 71.46 101.24 140.40MPI File write all POSIX 26.17 51.95 101.08 38.59 68.44 131.63 70.59 100.93 135.17
Complete 26.99 50.66 99.95 38.11 64.32 127.30 70.70 100.09 139.02
None 12.91 25.83 57.00 37.52 70.68 127.12 61.37 69.50 96.83MPI File write at all POSIX 11.81 28.27 55.39 36.64 63.91 126.87 61.48 70.87 98.30
Complete 13.20 27.08 54.51 36.27 73.06 135.99 60.78 72.06 96.96
None 7.26 12.22 25.81 2.77 5.41 15.04 47.74 56.97 182.20MPI File read POSIX 6.73 11.99 25.10 5.83 6.66 19.57 48.45 57.27 190.51
Complete 7.05 12.46 26.10 2.36 5.00 16.42 48.41 57.60 179.90
None 21.09 26.03 40.66 15.81 21.56 49.47 55.92 65.89 203.63MPI File read all POSIX 19.85 27.17 42.31 18.63 24.73 58.97 56.27 64.52 211.50
Complete 20.67 26.62 41.24 16.99 25.74 63.82 58.97 68.57 209.91
None 2.21 3.61 6.36 4.41 4.56 5.15 36.73 37.89 41.23MPI File read at all POSIX 2.33 3.79 5.87 4.14 4.72 5.56 36.45 39.97 44.06
Complete 2.14 3.70 5.60 4.83 4.71 5.31 38.53 40.63 45.33
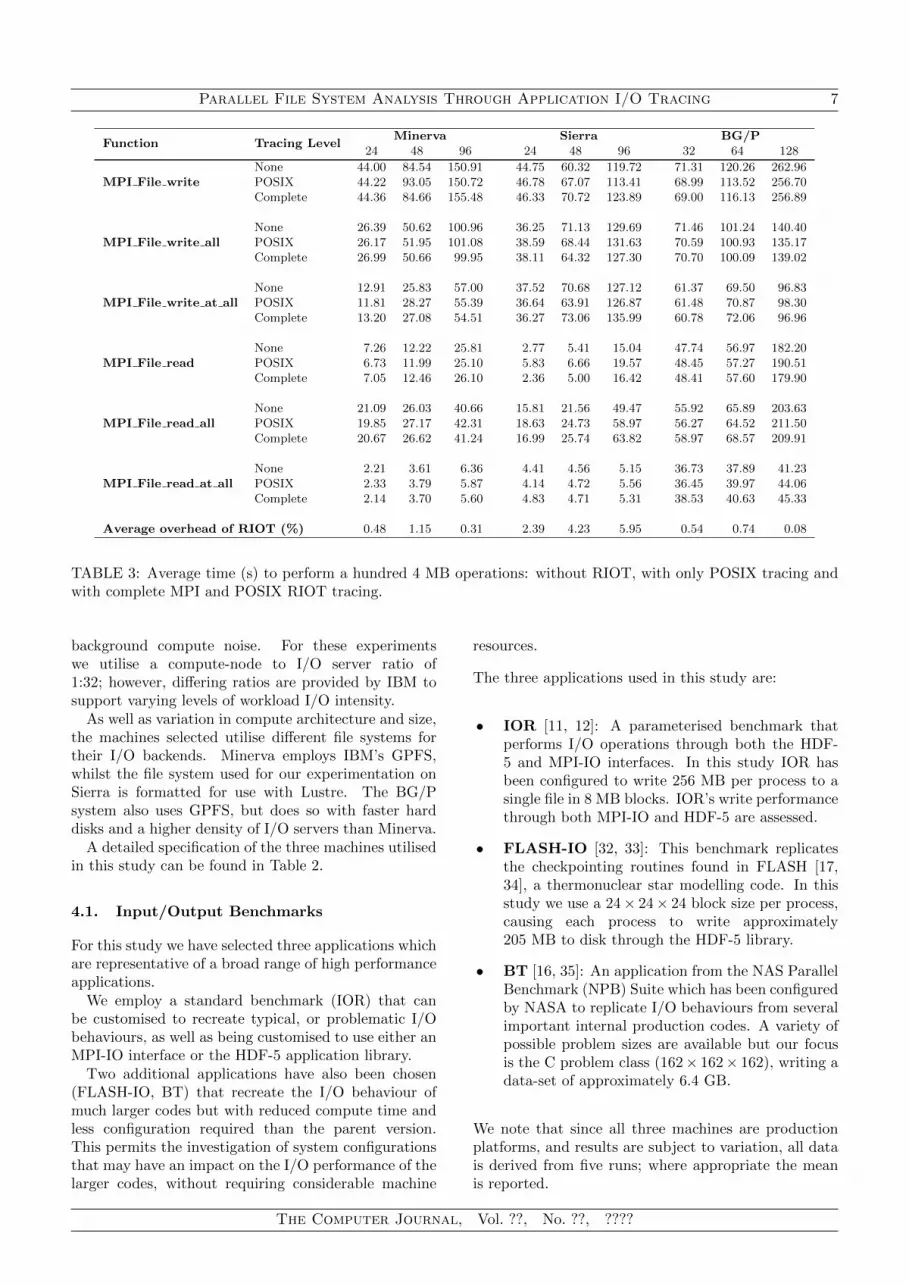
Average overhead of RIOT (%) 0.48 1.15 0.31 2.39 4.23 5.95 0.54 0.74 0.08
TABLE 3: Average time (s) to perform a hundred 4 MB operations: without RIOT, with only POSIX tracing andwith complete MPI and POSIX RIOT tracing.
background compute noise. For these experimentswe utilise a compute-node to I/O server ratio of1:32; however, differing ratios are provided by IBM tosupport varying levels of workload I/O intensity.
As well as variation in compute architecture and size,the machines selected utilise different file systems fortheir I/O backends. Minerva employs IBM’s GPFS,whilst the file system used for our experimentation onSierra is formatted for use with Lustre. The BG/Psystem also uses GPFS, but does so with faster harddisks and a higher density of I/O servers than Minerva.
A detailed specification of the three machines utilisedin this study can be found in Table 2.
4.1. Input/Output Benchmarks
For this study we have selected three applications whichare representative of a broad range of high performanceapplications.
We employ a standard benchmark (IOR) that canbe customised to recreate typical, or problematic I/Obehaviours, as well as being customised to use either anMPI-IO interface or the HDF-5 application library.
Two additional applications have also been chosen(FLASH-IO, BT) that recreate the I/O behaviour ofmuch larger codes but with reduced compute time andless configuration required than the parent version.This permits the investigation of system configurationsthat may have an impact on the I/O performance of thelarger codes, without requiring considerable machine
resources.
The three applications used in this study are:
• IOR [11, 12]: A parameterised benchmark thatperforms I/O operations through both the HDF-5 and MPI-IO interfaces. In this study IOR hasbeen configured to write 256 MB per process to asingle file in 8 MB blocks. IOR’s write performancethrough both MPI-IO and HDF-5 are assessed.
• FLASH-IO [32, 33]: This benchmark replicatesthe checkpointing routines found in FLASH [17,34], a thermonuclear star modelling code. In thisstudy we use a 24× 24× 24 block size per process,causing each process to write approximately205 MB to disk through the HDF-5 library.
• BT [16, 35]: An application from the NAS ParallelBenchmark (NPB) Suite which has been configuredby NASA to replicate I/O behaviours from severalimportant internal production codes. A variety ofpossible problem sizes are available but our focusis the C problem class (162× 162× 162), writing adata-set of approximately 6.4 GB.
We note that since all three machines are productionplatforms, and results are subject to variation, all datais derived from five runs; where appropriate the meanis reported.
The Computer Journal, Vol. ??, No. ??, ????

8 S.A. Wright, et al.
12 24 48 96 192 384 768 15360
200
400
600
Cores
Ban
dw
idth
(MB
/s)
Minerva Sierra BG/P
(a)
12 24 48 96 192 384 768 15360
200
400
600
Cores
Ban
dw
idth
(MB
/s)
Minerva Sierra BG/P
(b)
12 24 48 96 192 384 768 15360
200
400
600
Cores
Ban
dw
idth
(MB
/s)
Minerva Sierra BG/P
(c)
16 64 256 10241
10
100
1000
10000
Cores
Ban
dw
idth
(MB
/s)
Minerva Sierra BG/P
(d)
FIGURE 2: Perceived MPI write bandwidth for (a) IOR (through MPI-IO), (b) IOR (through HDF-5), (c) FLASH-IO (through HDF-5), and (d) BT Class C (through MPI-IO), measured using RIOT.
5. PERFORMANCE ANALYSIS
5.1. RIOT Performance Analysis
We first use an I/O benchmark specifically designed toassess the overheads which our toolkit may introduce atrun-time. Since RIOT requires all I/O functions to beinterposed, we utilise a custom benchmark designed toperform a known set of read and write operations overa series of files. Write sizes of 256 KB, 1 MB, 4 MB and16 MB per process were performed 100 times for bothread and write operations.
Table 3 shows the time taken to perform 100operations, each 4 MB in size (other file sizesdemonstrate similar effects and so the results aretherefore not shown), in three configurations: (i)without RIOT, (ii) with RIOT configured to onlytrace POSIX file calls and, (iii) with RIOT performinga full trace of MPI and POSIX file activity. Ourbenchmark reports timings for the six MPI-IO functionsthat we believe to be the most commonly used in
scientific codes. It should be noted that we wouldexpect the overhead of RIOT associated with otherMPI-IO functions to be approximately the same, sincethe function interposition and timings routines wouldbe equivalent.
In Table 3 we see that RIOT adds minimal overheadto an application’s run-time, although it is particularlydifficult to precisely quantify this overhead since themachines employed operate production workloads. Insome cases the overheads appear negligible (or indeedpresent themselves as slight improvements over theoriginal run-time). We account for this by thefact that the machines and their I/O backplanes areshared resources and are therefore subject to a small('10%) variation in run-time performance. Despitethis variability (which is a feature of any large-scaleproduction system) the low variation between run-times with and without RIOT loaded demonstrates theminimal impact that our toolkit has on applicationrun-time. This is a key feature of our design and
The Computer Journal, Vol. ??, No. ??, ????

Parallel File System Analysis Through Application I/O Tracing 9
12 24 48 96 192 384 768 15360.01
0.1
1
10
100
Cores
Ban
dw
idth
(MB
/s)
Minerva Sierra BG/P
(a)
12 24 48 96 192 384 768 15360.01
0.1
1
10
100
Cores
Ban
dw
idth
(MB
/s)
Minerva Sierra BG/P
(b)
12 24 48 96 192 384 768 15360.01
0.1
1
10
100
Cores
Ban
dw
idth
(MB
/s)
Minerva Sierra BG/P
(c)
FIGURE 3: Effective POSIX bandwidth for (a) IOR (through MPI), (b) IOR (through HDF-5), and (c) FLASH-IO(through HDF-5), measured using RIOT.
12 24 48 96 192 384 768 15360.01
0.1
1
10
100
Cores
Ban
dw
idth
(MB
/s)
Minerva Sierra BG/P
(a)
12 24 48 96 192 384 768 15360.01
0.1
1
10
100
Cores
Ban
dw
idth
(MB
/s)
Minerva Sierra BG/P
(b)
12 24 48 96 192 384 768 15360.01
0.1
1
10
100
Cores
Ban
dw
idth
(MB
/s)
Minerva Sierra BG/P
(c)
FIGURE 4: Effective MPI bandwidth for (a) IOR (through MPI), (b) IOR (through HDF-5), and (c) FLASH-IO(through HDF-5), measured using RIOT.
is an important consideration for profiling activitiesassociated with large codes that may already takeconsiderable lengths of time to run in their own right.
5.2. I/O Subsystem Performance
We next use RIOT to trace the write behaviour of thethree codes in five different configurations. Figure 2shows the perceived bandwidth achieved by each ofthe benchmarks on the three different systems. Itis interesting to note that the two HDF-5 basedcodes (FLASH-IO and IOR through HDF-5) performsignificantly worse than the other two codes on bothMinerva and Sierra. The parallel HDF-5 library, bydefault, attempts to utilise data-sieving in order totransform many discontinuous small writes into a singlemuch larger write. In order to do this, a large region(containing the target file locations) is locked and readinto memory. The small changes are then made to theblock in memory, and the data is then written back outto persistent storage in a single write operation. Whilstthis offers a large improvement in performance forsmall unaligned writes [36], many HPC applications are
Processors16 64 256 1,024
MinervaPOSIX 159.65 84.90 24.48 —MPI 21.41 4.95 1.11 —
SierraPOSIX 169.56 40.78 7.98 1.55MPI 14.49 1.94 0.44 0.09
BG/PPOSIX 132.10 49.06 21.10 8.75MPI 84.15 2.88 8.58 3.45
TABLE 4: Effective POSIX and MPI bandwidths(MB/s) achieved on the three platforms for BT.
constructed to perform larger sequential file operations.The use of file locks will help to maintain file
coherence but, as RIOT is able to demonstrate,when writes do not overlap, the locking, readingand unlocking of file regions may create a significantoverhead – this is discussed further in Section 6.1.
Also of note in Figure 2(d) is that BT performssignificantly better on the BlueGene/P after 256processors are used (note the logarithmic-scale). Due to
The Computer Journal, Vol. ??, No. ??, ????
10 S.A. Wright, et al.
12 24 48 96 192 3840
20
40
60
80
100
Processors
Per
centa
geof
tim
esp
ent
infu
nct
ion
(%)
Write Read Locks Other
(a)
12 24 48 96 192 3840
20
40
60
80
100
Processors
Per
centa
geof
tim
esp
ent
infu
nct
ion
(%)
Write Read Locks Other
(b)
32 64 128 2560
20
40
60
80
100
Processors
Per
centa
geof
tim
esp
ent
infu
nct
ion
(%)
Write Read Locks Other
(c)
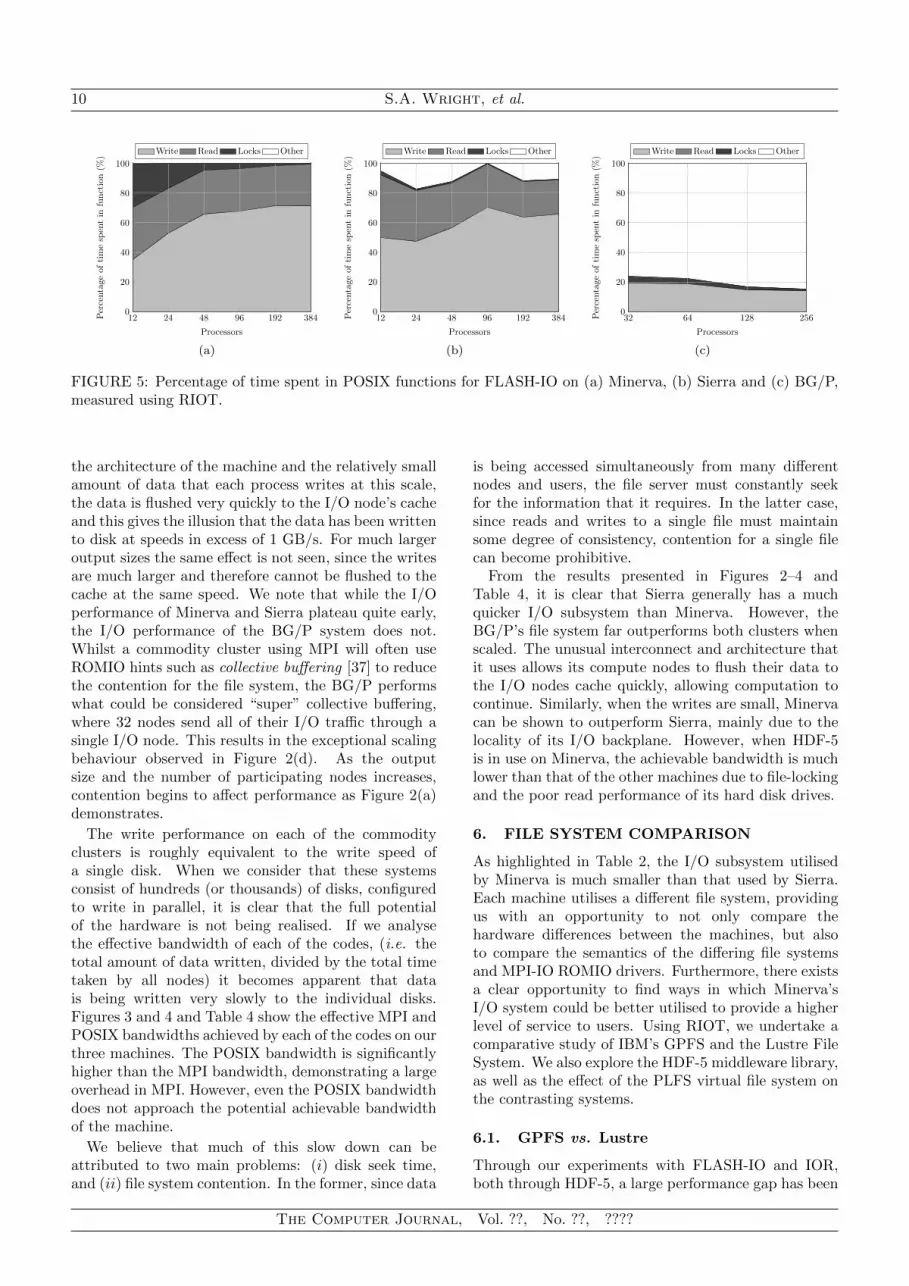
FIGURE 5: Percentage of time spent in POSIX functions for FLASH-IO on (a) Minerva, (b) Sierra and (c) BG/P,measured using RIOT.
the architecture of the machine and the relatively smallamount of data that each process writes at this scale,the data is flushed very quickly to the I/O node’s cacheand this gives the illusion that the data has been writtento disk at speeds in excess of 1 GB/s. For much largeroutput sizes the same effect is not seen, since the writesare much larger and therefore cannot be flushed to thecache at the same speed. We note that while the I/Operformance of Minerva and Sierra plateau quite early,the I/O performance of the BG/P system does not.Whilst a commodity cluster using MPI will often useROMIO hints such as collective buffering [37] to reducethe contention for the file system, the BG/P performswhat could be considered “super” collective buffering,where 32 nodes send all of their I/O traffic through asingle I/O node. This results in the exceptional scalingbehaviour observed in Figure 2(d). As the outputsize and the number of participating nodes increases,contention begins to affect performance as Figure 2(a)demonstrates.
The write performance on each of the commodityclusters is roughly equivalent to the write speed ofa single disk. When we consider that these systemsconsist of hundreds (or thousands) of disks, configuredto write in parallel, it is clear that the full potentialof the hardware is not being realised. If we analysethe effective bandwidth of each of the codes, (i.e. thetotal amount of data written, divided by the total timetaken by all nodes) it becomes apparent that datais being written very slowly to the individual disks.Figures 3 and 4 and Table 4 show the effective MPI andPOSIX bandwidths achieved by each of the codes on ourthree machines. The POSIX bandwidth is significantlyhigher than the MPI bandwidth, demonstrating a largeoverhead in MPI. However, even the POSIX bandwidthdoes not approach the potential achievable bandwidthof the machine.
We believe that much of this slow down can beattributed to two main problems: (i) disk seek time,and (ii) file system contention. In the former, since data
is being accessed simultaneously from many differentnodes and users, the file server must constantly seekfor the information that it requires. In the latter case,since reads and writes to a single file must maintainsome degree of consistency, contention for a single filecan become prohibitive.
From the results presented in Figures 2–4 andTable 4, it is clear that Sierra generally has a muchquicker I/O subsystem than Minerva. However, theBG/P’s file system far outperforms both clusters whenscaled. The unusual interconnect and architecture thatit uses allows its compute nodes to flush their data tothe I/O nodes cache quickly, allowing computation tocontinue. Similarly, when the writes are small, Minervacan be shown to outperform Sierra, mainly due to thelocality of its I/O backplane. However, when HDF-5is in use on Minerva, the achievable bandwidth is muchlower than that of the other machines due to file-lockingand the poor read performance of its hard disk drives.
6. FILE SYSTEM COMPARISON
As highlighted in Table 2, the I/O subsystem utilisedby Minerva is much smaller than that used by Sierra.Each machine utilises a different file system, providingus with an opportunity to not only compare thehardware differences between the machines, but alsoto compare the semantics of the differing file systemsand MPI-IO ROMIO drivers. Furthermore, there existsa clear opportunity to find ways in which Minerva’sI/O system could be better utilised to provide a higherlevel of service to users. Using RIOT, we undertake acomparative study of IBM’s GPFS and the Lustre FileSystem. We also explore the HDF-5 middleware library,as well as the effect of the PLFS virtual file system onthe contrasting systems.
6.1. GPFS vs. Lustre
Through our experiments with FLASH-IO and IOR,both through HDF-5, a large performance gap has been
The Computer Journal, Vol. ??, No. ??, ????

Parallel File System Analysis Through Application I/O Tracing 11
0.65 0.66 0.67
10
13
16
Time (s)
Off
set
(MB
)Lock Read Write Unlock
(a)
0.65 0.66 0.67
10
13
16
Time (s)
Off
set
(MB
)
Lock Read Write Unlock
(b)
FIGURE 6: Composition of a single, collective MPI write operation on MPI ranks 0 and 1 (Figures (a) and(b) respectively) of a two processor run of FLASH-IO, called from the HDF-5 middleware library in its defaultconfiguration.
0.64 0.65 0.66
10
13
16
Time (s)
Off
set
(MB
)
Lock Read Write Unlock
(a)
0.64 0.65 0.66
10
13
16
Time (s)
Off
set
(MB
)
Lock Read Write Unlock
(b)
FIGURE 7: Composition of a single, collective MPI write operation on MPI ranks 0 and 1 (Figures (a) and (b)respectively) of a two processor run of FLASH-IO, called from the HDF-5 middleware library after data-sieving hasbeen disabled.
identified between using the HDF-5 file format libraryand performing I/O directly via MPI-IO. Whilst a slightslowdown may be expected, since there is an additionallayer in the software stack to traverse, the decrease inperformance is quite large (up to a 50% slowdown).Figure 5 shows the percentage of MPI file write timespent in each of the four main contributing POSIX filefunctions.
For the Minerva supercomputer, at low core counts,there is a significant overhead associated with filelocking (Figure 5(a)). In the worst case, on a singlenode, this represents an approximate slowdown of 30%in performance. The reason for the use of file locking
in HDF-5 is that data-sieving is often utilised to writesmall unaligned blocks in much larger blocks. Thepenalty for this is that data must be read into memoryprior to writing; this behaviour can prove to be a largeoverhead for many applications, where the writes mayperform much better were data-sieving to be disabled.Figure 5(c) shows how the BG/P does not perform data-sieving and therefore there is no overhead associatedwith reading data into memory. However, due to theuse of dedicated I/O nodes, the compute nodes spendapproximately 80% of their MPI write time waiting forthe I/O nodes to complete.
In contrast to Minerva, the same locking overhead
The Computer Journal, Vol. ??, No. ??, ????

12 S.A. Wright, et al.
12 24 48 96 192 3840
100
200
300
400
500
600
Cores
Ban
dw
idth
(MB
/s)
Original No DS CB and No DS
(a)
12 24 48 96 192 3840
100
200
300
400
500
600
Cores
Ban
dw
idth
(MB
/s)
Original No DS CB and No DS
(b)
FIGURE 8: Perceived bandwidth for the FLASH-IO benchmark in its original configuration (Original), with data-sieving disabled (No DS), and with collective buffering enabled and data-sieving disabled (CB and No DS) on (a)Minerva and (b) Sierra, as measured by RIOT.
is not experienced by Sierra; however up to 20% ofthe MPI write time is spent waiting for other ranks.It is also of note that Minerva’s I/O subsystem isbacked by relatively slow 7,200 RPM 2 TB NearlineSAS hard drives; Sierra on the other hand uses muchquicker 10,000 RPM 450 GB SAS enterprise-class harddisk drives, providing a much smaller seek time, amuch greater bandwidth and various other performanceadvantages (e.g. greater rotational vibration tolerance).As a consequence of this, a single Sierra I/O node canservice a read request much more quickly than one ofMinerva’s, providing an overall greater level of service.
Despite Sierra having 12 times more I/O servers,nearly 40 times more disks (which also spin fasterand are connected through a faster bus connection),its performance is not significantly greater (asdemonstrated in Figure 2). One explanation for thisis that ultimately, reads and writes to a single file mustbe serialised, in part at least, by the I/O servers.
We next explore two ways to improve the perfor-mance of I/O intensive codes. Firstly, we utilise RIOTto analyse why we experience such a slowdown withHDF-5 based applications on the Minerva and Sierrasupercomputers; secondly, we use RIOT to analyse thebehaviour of the PLFS virtual file system, developedat LANL, to gain more understanding into how a log-based file system and transparent file partitioning canoffer such impressive improvements in achievable band-width.
6.2. Middleware Analysis: HDF-5
Using RIOT’s tracing and visualisation capabilities, theexecution of a small run of the FLASH-IO benchmark(using a 16× 16× 16 grid size and only two processors)is investigated. Figure 6 shows the composition of a
single MPI-IO write operation in terms of its POSIXoperations. Rank 0 (Figure 6(a)) spends the majorityof its write time performing read, lock and unlockoperations, whereas Rank 1 (Figure 6(b)) spends muchof its time performing only lock, unlock and writeoperations. Since Rank 1 writes to the end of the file,increasing the end-of-file pointer, there is no data forit to read in during data-sieving; Rank 0, on the otherhand, will always have data to read (since there will bezeroes present between its current position and the newend-of-file pointer).
Also of interest is the fact that both processors aresplitting one large write into five lock, read, write,unlock cycles. This is indicative of using data-sieving,with the default 512 KB buffer, to write approximately2.5 MB of data. When performing a write of thissize, where all the data is “new”, data-sieving maybe detrimental to performance. In order to test thishypothesis we located the MPI Info set operations inthe FLASH-IO source code (used to set the MPI-IOhints) and added additional operations to disable data-sieving. We then performed the same experiment inorder to visualise the write behaviour with data-sievingdisabled. Figure 7 shows that now the MPI-IO writeoperation is consumed by a single write operation, andthe time taken to perform the write is shorter than thatfound in Figure 6.
Using the problem size benchmarked previously(24 × 24 × 24), we performed further executions ofFLASH-IO on Minerva and Sierra using between 1and 32 compute nodes (12 to 384 processors) in threeconfigurations: firstly, in its original configuration;secondly, with data-sieving disabled; and, finally,with collective buffering enabled and data-sievingdisabled. Figure 8(a) demonstrates the resulting
The Computer Journal, Vol. ??, No. ??, ????

Parallel File System Analysis Through Application I/O Tracing 13
improvement on Minerva, showing a 2× increase inwrite bandwidth over the unmodified code. Betterperformance is observed when using collective buffering.On Sierra (Figure 8(b)) we see a similar improvementin performance (approximately 2× improvement inbandwidth). We also see that on a single node (12processor cores), performing only data-sieving is slightlyfaster than using collective buffering, and beyond thiswe see that using collective buffering increases thebandwidth by between 5% and 20%.
It should be noted that this result does not meanthat data-sieving will always decrease performance. Inthe case that data in an output file is being updated(rather than a new output file generated), using data-sieving to make small differential changes may improveperformance.
6.3. Virtual File System Analysis: PLFS
PLFS is an I/O interposition layer designed primarilyfor checkpointing and logging operations. PLFSintercepts MPI-IO calls through a ROMIO file systemdriver and transparently translates them from n-processes writing to 1 file, to n-processes writing to n-files. The middleware creates a view over the n-files, sothat the calling application can operate on these files asif they were all concatenated into a single file. The useof multiple files by the PLFS layer helps to significantlyimprove file write times, as multiple, smaller files canbe written simultaneously. Furthermore, improved readtimes have also been demonstrated when using the samenumber of processes to read back the file as were usedin its creation [14].
Table 5 presents the average perceived and effectiveMPI-IO and POSIX bandwidths achieved by the BTbenchmark when running with and without the PLFSROMIO file system driver. Note that, as previously,effective bandwidth in this table refers to the bandwidthof the operations as if called serially and hence are muchlower than the perceived bandwidths.
When not using PLFS we see that the effectivePOSIX write bandwidth decreases as the applicationsare scaled. PLFS partially reverses this trend as writesare no longer dependent on operations performed byother processors and can therefore be flushed to the fileserver’s cache much more quickly. The log-structurednature of PLFS also increases the bandwidth, as datacan be written in a non-deterministic sequential mannerwith a log file keeping track of the data ordering.For a BT Class C execution on 256 processors, PLFSincreases the bandwidth from 115.2 MB/s perceivedbandwidth up to 3,118.08 MB/s on the Sierra cluster,representing a 27-fold increase in write performance.
Much smaller gains are seen on Minerva, but due toits rather limited I/O hardware this is to be expected.There are fewer I/O servers to service read and writerequests on Minerva and as a result there is much lessbandwidth available for the compute nodes.
Figure 9 demonstrates that during the execution ofBT on 256 processors, concurrent POSIX write callswait much less time for access to the file system.As each process is writing to its own unique file, ithas access to its own unique file stream, reducingfile system contention. For non-PLFS writes we seea stepping effect where all POSIX writes are queuedand complete in a serialised, non-deterministic manner.Conversely, on larger I/O installations, PLFS writesdo not exhibit this stepping behaviour, and on smallerI/O installations they exhibit this behaviour to a muchlesser extent, as the writes are not waiting on otherprocesses to complete.
7. CONCLUSIONS
Parallel I/O operations continue to represent asignificant bottleneck in large-scale parallel scientificapplications. This is, in part, because of the slowerrate of development that parallel storage has witnessedwhen compared to that of microprocessors. Othercauses include limited optimisation at code level and theuse of complex file formatting libraries. Contemporaryapplications can often exhibit poor I/O performancebecause code developers lack an understanding of howtheir code utilises I/O resources and how best tooptimise for this.
In this paper we document the design, implementa-tion and application of RIOT, a toolkit with which theseissues might be addressed. We demonstrate RIOT’sability to intercept, record and analyse information re-lating to file reads, writes and locking operations withinthree standard industry I/O benchmarks. RIOT hasbeen utilised on two commodity clusters as well an IBMBG/P supercomputer.
The results generated by our tool illustrate thedifference in performance between the relatively smallI/O subsystem installed on the Minerva cluster andthe much larger Sierra I/O backplane. Whilst thereis a large difference in the size and complexity ofthese I/O systems, much of the performance differencesoriginate from the contrasting file systems that theyuse. Furthermore, through using the BG/P locatedat Daresbury Laboratory, we have demonstrated thatexceptional performance can be achieved on small I/Osubsystems where dedicated I/O aggregators are used,allowing data to be quickly flushed from the computenode to an intermediate node.
RIOT provides the opportunity to:
• Calculate not only the bandwidth perceived by auser, but also the effective bandwidth achieved bythe I/O servers. This has highlighted a significantoverhead in MPI, showing that the POSIX writeoperations to the disk account for little over half ofthe MPI write time. It has also been shown thatmuch of the time taken by MPI is consumed byfile locking behaviours and the serialisation of file
The Computer Journal, Vol. ??, No. ??, ????

14 S.A. Wright, et al.
5.5 6 6.5 7 7.5 80
5
10
15
20
25
Time (s)
Con
curr
ent
PO
SIX
write()
call
sMPI-IO PLFS
(a)
5.5 6 6.5 7 7.5 80
5
10
15
20
25
Time (s)
Con
curr
ent
PO
SIX
write()
call
s
MPI-IO PLFS
(b)
FIGURE 9: Concurrent write() operations for BT Class C on 256 processors on (a) Minerva, and (b) Sierra.
MPI-IO PLFS16 64 256 16 64 256
Perceived BandwidthMinerva 223.36 53.76 61.44 276.32 224.64 125.44Sierra 222.24 126.08 115.20 337.12 1,518.08 3,118.08
Effective POSIX BandwidthMinerva 12.39 1.72 0.83 72.07 36.60 8.86Sierra 169.56 40.78 7.98 235.44 538.13 437.88
Effective MPI BandwidthMinerva 13.96 0.84 0.24 17.27 3.51 0.49Sierra 13.89 1.97 0.45 21.07 23.72 12.18
TABLE 5: Perceived and Effective Bandwidth (MB/s) for BT class C through MPI-IO and PLFS, measured usingRIOT.
writes by the I/O servers;
• Demonstrate the significant overhead associatedwith using the HDF-5 library to store data grids.Through our analysis we have shown that on asmall number of cores, the time spent acquiringand releasing file locks can consume nearly 30% ofthe file write time. Furthermore, on small-scale,multi-user I/O systems, reading data into memory,in order to perform data-sieving, can prove verycostly;
• Visualise the write behaviour of MPI when data-sieving is in use, showing how large file writes aresegmented into many 512 KB lock, read, write,unlock cycles. Through adjusting the MPI hints todisable data-sieving we have shown that on someplatforms, and for some applications, data-sievingmay degrade performance;
• Analyse the performance gains resulting fromPLFS. In this paper, we have demonstrated a25× speed-up on the Sierra supercomputer throughusing PLFS. The increased number of individualfile streams allows an I/O server to better handlemany concurrent write requests. Even on the muchsmaller Minerva cluster, PLFS was able to yield
almost a 2× speed-up;
Next we plan to utilise the log files produced by RIOTto create an automated benchmark generator. Webelieve that RIOT can be used to create synthetic I/Obenchmarks with which I/O configuration options forthe host or file system can be quickly assessed. We alsobelieve this offers an opportunity for many laboratoriesto release I/O benchmarks that recreate the I/Ooperations in classified, production-grade applications.
FUNDING
This work is supported in part by The RoyalSociety through their Industry Fellowship Scheme(IF090020/AM). The performance modelling research isalso supported jointly by AWE and the TSB KnowledgeTransfer Partnership grant number KTP006740.
Access to the LLNL OCF is made possible throughcollaboration with the UK Atomic Weapons Establish-ment under grants CDK0660 (The Production of Pre-dictive Models for Future Computing Requirements)and CDK0724 (AWE Technical Outreach Programme).
Sandia National Laboratories is a multiprogram lab-oratory managed and operated by Sandia Corporation,
The Computer Journal, Vol. ??, No. ??, ????

Parallel File System Analysis Through Application I/O Tracing 15
a Lockheed Martin Company, for the United States De-partment of Energy’s National Nuclear Security Admin-istration under contract DE-AC04-94AL85000.
ACKNOWLEDGEMENTS
Access to the Minerva supercomputer was provided bythe Centre for Scientific Computing at the Universityof Warwick.
We are grateful to Scott Futral, Todd Gamblin, JanNunes and the Livermore Computing Team for accessto, and help in using, the Sierra machine located atLLNL. We are also indebted to John Bent at EMCCorporation, and Meghan Wingate McClelland at theLos Alamos National Laboratory for their expert adviceand support concerning PLFS.
The authors would also like to thank the HighPerformance Computing team, and especially ColinMorey, at the Daresbury Laboratory (UK) for accessto the IBM BG/P system.
REFERENCES
[1] Message Passing Interface Forum (1998) MPI2:A Message Passing Interface Standard. HighPerformance Computing Applications, 12, 1–299.
[2] ANL/MCS-TM-234 (1997) ROMIO: A High-Performance, Portable MPI-IO Implementation.Argonne, IL.
[3] Gabriel, E. et al. (2004) Open MPI: Goals, Concept,and Design of a Next Generation MPI Implementation.Lecture Notes in Computer Science (LNCS), 3241, 97–104.
[4] Gropp, W. (2002) MPICH2: A New Start for MPIImplementations. Lecture Notes in Computer Science(LNCS), 2474, 7–42.
[5] Almasi, G. et al. (2004) Implementing MPI onthe BlueGene/L Supercomputer. Lecture Notes inComputer Science (LNCS), 3149, 833–845.
[6] Bull (2010) BullX Cluster Suite Application Developer’sGuide. Les Clayes-sous-Bois, Paris.
[7] Koziol, Q. and Matzke, R. (1998) HDF5 – A NewGeneration of HDF: Reference Manual and User Guide.Champaign, Illinois, USA.
[8] Rew, R. K. and Davis, G. P. (1990) NetCDF: AnInterface for Scientific Data Access. IEEE ComputerGraphics and Applications, 10, 76–82.
[9] Li, J., Liao, W., Choundhary, A., Ross, R., Thakur,R., Gropp, W., Latham, R., Siegel, A., Gallagher,B., and Zingale, M. (2003) Parallel netCDF: A High-Performance Scientific I/O Interface. Proceedings ofthe ACM/IEEE Supercomputing Conference (SC’03),Pheonix, AZ, November, pp. 39–50. ACM New York,NY.
[10] Wright, S. A., Pennycook, S. J., Hammond, S. D.,and Jarvis, S. A. (2011) RIOT – A ParallelInput/Output Tracer. Proceedings of the 27th AnnualUK Performance Engineering Workshop (UKPEW’11),Bradford, UK, July, pp. 25 – 39. The University ofBradford, Bradford, UK.
[11] Shan, H., Antypas, K., and Shalf, J. (2008) Character-izing and Predicting the I/O Performance of HPC Ap-plications using a Parameterized Synthetic Benchmark.Proceedings of the ACM/IEEE Supercomputing Confer-ence (SC’08), November. IEEE Press Piscataway, NJ,Austin, TX.
[12] LBNL-62647 (2007) Using IOR to Analyze the I/OPerformance for HPC Platforms. Lawrence BerkeleyNational Laboratory. Berkeley, CA.
[13] Bent, J., Gibson, G., Grider, G., McClelland,B., Nowoczynski, P., Nunez, J., Polte, M., andWingate, M. (2009) PLFS: A Checkpoint Filesystem forParallel Applications. Proceedings of the ACM/IEEESupercomputing Conference (SC’09), Portland, OR,November, pp. 21:1–21:12. ACM, New York, NY.
[14] Polte, M., Lofstead, J., Bent, J., Gibson, G., Klasky,S. A., Liu, Q., Parashar, M., Schwan, K., and Wolf, M.(2009) ... And Eat It Too: High Read Performance inWrite-Optimized HPC I/O Middleware File Formats.Proceedings of the 4th Annual Workshop on PetascaleData Storage (PDSW’09), Portland, OR, November,pp. 21–25. ACM, New York, NY.
[15] Wolman, B. and Olson, T. (1989) IOBENCH: ASystem Independent IO Benchmark. ACM SIGARCHComputer Architecture News, 17, 55–70.
[16] Bailey, D. H. et al. (1991) The NAS Parallel Bench-marks. International Journal of High PerformanceComputing Applications, 5, 63–73.
[17] Rosner, R. et al. (2000) Flash Code: StudyingAstrophysical Thermonuclear Flashes. Computing inScience & Engineering, 2, 33–41.
[18] Layton, J. (2012). HPC Storage – Getting Startedwith I/O Profiling. http://hpc.admin-magazine.
com/Articles/HPC-Storage-I-O-Profiling (accessedFebruary 02, 2012).
[19] (2011). Collectl. http://collectl.sourceforge.net
(accessed January 16, 2012).
[20] (2011). Ganglia Monitoring System. http://ganglia.
sourceforget.net (accessed January 16, 2012).
[21] Carns, P., Latham, R., Ross, R., Iskra, K., Lang, S.,and Riley, K. (2009) 24/7 Characterization of PetascaleI/O Workloads. Proceedings of the IEEE InternationalConference on Cluster Computing and Workshops(CLUSTER’09), New Orleans, LA, September, pp. 1–10. IEEE Computer Society, Los Alamitos, CA.
[22] Fuerlinger, K., Wright, N., and Skinner, D. (2010)Effective Performance Measurement at Petascale Us-ing IPM. Proceedings of the IEEE 16th InternationalConference on Parallel and Distributed Systems (IC-PADS’10), Shanghai, China, December, pp. 373–380.IEEE Computer Society, Washington, DC.
[23] Uselton, A., Howison, M., Wright, N. J., Skinner, D.,Keen, N., Shalf, J., Karavanic, K. L., and Oliker, L.(2010) Parallel I/O Performance: From Events to En-sembles. Proceedings of the IEEE International Sym-posium on Parallel Distributed Processing (IPDPS’10),Atlanta, GA, April, pp. 1–11. IEEE Computer Society,Los Alamitos, CA.
[24] Schmuck, F. and Haskin, R. (2002) GPFS: A Shared-Disk File System for Large Computing Clusters.Proceedings of the First USENIX Conference on Fileand Storage Technologies (FAST’02), Monterey, CA,
The Computer Journal, Vol. ??, No. ??, ????

16 S.A. Wright, et al.
January, pp. 231–244. USENIX Association Berkeley,CA.
[25] Schwan, P. (2003). Lustre: Building a File Systemfor 1000-node Clusters. http://lustre.org (accessedOctober 23, 2011).
[26] Nowoczynski, P., Stone, N., Yanovich, J., andSommerfield, J. (2008) Zest Checkpoint StorageSystem for Large Supercomputers. Proceedings ofthe 3rd Annual Workshop on Petascale Data Storage(PDSW’08), Austin, TX, November, pp. 1–5. IEEEComputer Society, Los Alamitos, CA.
[27] Polte, M., Simsa, J., Tantisiriroj, W., Gibson, G.,Dayal, S., Chainani, M., and Uppugandla, D. K. (2008)Fast Log-based Concurrent Writing of Checkpoints.Proceedings of the 3rd Annual Workshop on PetascaleData Storage (PDSW’08), Austin, TX, November, pp.1–4. IEEE Computer Society, Los Alamitos, CA.
[28] Wang, Y. and Kaeli, D. (2003) Source Level Transfor-mations to Improve I/O Data Partitioning. Proceedingsof the 1st International Workshop on Storage NetworkArchitecture and Parallel I/Os (SNAPI’03), New Or-leans, LA, September–October, pp. 27–35. ACM, NewYork, NY.
[29] Wang, Y. and Kaeli, D. (2003) Profile-guidedI/O Partitioning. Proceedings of the 17th AnnualInternational Conference on Supercomputing (ICS’03),San Francisco, CA, June, pp. 252–260. ACM, NewYork, NY.
[30] Wright, S. A., Hammond, S. D., Pennycook, S. J., andJarvis, S. A. (2011) Light-weight Parallel I/O Analysisat Scale. Lecture Notes in Computer Science (LNCS),6977, 235–249.
[31] Thakur, R., Gropp, W., and Lusk, E. (1996) AnAbstract-Device Interface for Implementing PortableParallel-I/O Interfaces. Proceedings of the 6th Sympo-sium on the Frontiers of Massively Parallel Computa-tion (FRONTIERS’96), Annapolis, MD, October, pp.180–187. IEEE Computer Society, Los Alamitos, CA.
[32] Zingale, M. (2011). FLASH I/O Benchmark Routine –Parallel HDF 5. http://www.ucolick.org/~zingale/
flash_benchmark_io/ (accessed February 21, 2011).[33] Argonne National Laboratory (2011). Parallel I/O
Benchmarking Consortium. http://www.mcs.anl.
gov/research/projects/pio-benchmark/ (accessedFebruary 21, 2011).
[34] Fryxell, B., Olson, K., Ricker, P., Timmes, F.,Zingale, M., Lamb, D., MacNeice, P., R.Rosner,Truran, J., and H.Tufo (2000) FLASH: An AdaptiveMesh Hydrodynamics Code for Modeling AstrophysicalThermonuclear Flashes. The Astrophysical JournalSupplement Series, 131, 273.
[35] RNR-94-007 (1994) The NAS Parallel Benchmarks.NASA Ames Research Center. Moffet Field, CA.
[36] Thakur, R., Gropp, W., and Lusk, E. (1999) Data-Sieving and Collective I/O in ROMIO. Proceedingsof the 7th Symposium on the Frontiers of MassivelyParallel Computation (FRONTIERS’99), Annapolis,MD, February, pp. 182–191. IEEE Computer Society,Los Alamitos, CA.
[37] Nitzberg, B. and Lo, V. (1997) Collective Buffering:Improving Parallel I/O Performance. Proceedings ofthe 6th IEEE International Symposium on High Perfor-mance Distributed Computing (HPDC’97), Portland,
OR, August, pp. 148–157. IEEE Computer Society,Washington, DC.
The Computer Journal, Vol. ??, No. ??, ????


