Embed Size (px)
Citation preview
k i i_ A
Pan American Health Organization PAHO/ACMR 11/2Original: English
ELEVENTH MEETING OF THEADVISORY COMMITTEE ON MEDICAL RESEARCH
Washington, D.C.
19-23 June 1972
INTER-AMERICAN INVESTIGATION
OF MORTALITY IN CHILDHOOD
The issue of this document does not constitute formal publication. Itshould not be reviewed, abstracted, or quoted without the consent ofthe Pan American Health Organization. The authors alone are responsiblefor statements expressed in signed papers.
-- t
.4
INTER-AMERICAN INVESTIGATION OF MORTALITY IN CHILDHOOD*
Progress Report for the Advisory Committee on Medical Research**
The objectives and procedures of this continental research program arewell known to the Advisory Committee on Medical Research through previous doc-uments(l, 2) The attached Provisional Report for the First Year of the Inves-tigation(3) provides a partial analysis of the questionnaires for 17,198 deathsin the first year of the 13 Latin American projects. This analysis and othersin working drafts on birth weight, breast feeding, provision of foods and socio-economic and related factors serve as a basis for a final report of the Inves-tigation which is now underway and is to be published in book form with thetitle Patterns of Mortality in Childhood. Additional analyses and reports willbe published later.
The results obtained indicate that new approaches and varied actionsare advisable in programs at international, national and local levels for im-provement of the health of the population, especially of infants and young chil-dren in the Americas. A member of this Committee requested that the results ofthe Investigation be presented to you in relation to the next steps that shouldbe taken and that concrete recommendations be made so that the Committee couldconsider support for future activities. Thus a few of the highlights are des-cribed, principally to show the evidence for the types of actions which arerecommended. The brief summary will be followed by specific recommendationsto insure maximum benefits from this large collaborative investigation.
HIGHLIGHTS OF THE RESULTS OF THE INVESTIGATION
First, our community research program has indicated to all of us, theprincipal collaborators and the staff in the field and in the Pan AmericanHealth Organization, that immediate actions are essential for establishment ofquality in vital statistics, in hospital statistics and in basic populationdata. The Investigation shows surprising deficiencies in the collection ofsuch data for nearly all projects - and that such deficiencies are serious.Varying percentages of deaths were not registered, as many as 44 per cent ofthe neonatal deaths and 20 per cent of the deaths under 5 years of age in oneproject. Thus the foundations for health planning are not well constructed;in fact, the data on mortality in childhood are so incomplete that they inva-lidate comparisons of mortality for practically any two countries. The defi-nitions of a live birth and a fetal death of the World Health Organization arenot applied consistently which affects reporting and registration of neonataldeaths. The comparability of infant mortality and life expectancy for evenhighly developed countries is questionable due to differences in inclusions ofdeaths of low birth weights.
*This research project was made possible by a contract with the Agency forInternational Development of the United States of America to the Pan AmericanHealth Organization.
**Report prepared by Dr. Ruth R. Puffer and Dr. Carlos V. Serrano, for theEleventh Meeting of the Advisory Committee on Medical Research of the PanAmerican Health Organization, 19-23 June 1972.
- 2-
Many deaths of infants, especially of those of low birth weight whichoccur in hospitals, are omitted from all types of reports, that is reportsof hospital discharges and of births and deaths. In fact the only referenceto a birth or death may be found on the delivery record of the mother or inthe delivery book. Such deaths are forgotten. The Provisional Report(3)provides data on unregistered deaths and the attached Report of the Meetingof Principal Collaborators(4) describes the organized search being conductedin Santiago, Chile, to establish complete information on all neonatal deaths.Also the latter gives recommendations for improvements in vital and hospitalstatistics. The discovery of incompleteness of data regarding infants isimportant not only for quality of the research program and for future researchon the relation of nutritional status of the mother and outcome of pregnancybut also for new efforts to establish sound procedures for quality and com-parability of vital statistics for countries of the world.
Second, measurement of the magnitude of health problems in infancy andchildhood such as nutritional deficiency and prematurity as well as the inter-relationships of diseases and factors responsible for excessive mortalityrequires utilization of associated as well as underlying causes of death.The underlying causes have been defined as the top of the iceberg; such impor-tant problems as nutritional deficiency, usually an associated cause of death,are below the surface, out of sight. The analyses of multiple causes of deathreveal that nutritional deficiency is the most serious health problem ininfancy and childhood in Latin America. Thirty-eight to 69 per cent of thedeaths were due to nutritional deficiency as the underlying or associatedcause of death in these 13 projects. Death rates from nutritional deficiencyare very high in infancy, varying from 5.6 to 37.1 per 1,000 live births inthe 13 cities and were in excess of 20 per 1,000 live births in 5 areas out-side the cities. Of the deaths with infectious diseases as the underlyingcause the percentages with an associated nutritional deficiency varied from40 for Kingston to 71 for Recife and 76 for Ribeirao Preto. These findingsindicate the need for consideration of the susceptibility of the host as wellas the infectious agent in designing preventive programs.
Limited breast feeding was noted in several projects, especially inthose in Brazil and San Salvador. The finding of unusually high proportionsof neonatal deaths of infants classed premature on the basis of birth weightby the WHO definition of 2,500 grams or less points to the need for additionalinformation and greater understanding of the role of low birth weight in natal-ity and mortality. Clarification is urgent of the relationship between thenutrition and health of mothers and the birth weights of their products.
Thus the data on multiple causes serve to uncover problems and showthe need for redesign of preventive programs to consider susceptibility todisease, that is the nutritional status, and also to extend nutrition programsin order to prevent morbidity and mortality in infancy and childhood.
Third, excessive reproductive wastage was noted through the study of
outcome of products of previous pregnancies with as many as 38 per cent ofthe products dead as fetal deaths or deaths in infancy and childhood in onecity. In all areas infant mortality among previous products was higher than
- 3 -
during the period of the Investigation, thus indicating the concentration of';· with ecsvinfant mortality in a vulnerable group of the population, that is in mothers
with excessive reproductive loss.
In several projects birth rates are high, around 40 per 1,000 popula-tion and many of the deaths were of high birth orders in which infant mortal-ity is excessive. The effect of shift from births of high birth orders tothose of low order was illustrated by data from the Province of Santiago whichexperienced a 32 per cent reduction in its birth rate from 37.6 in 1962 to25.6 per 1,000 population in 1969. Such a shift results in a lower infantdeath rate. The Investigation is indicating the value of analyses of infantmortality considering many variables for sound knowledge necessary for plan-ning and conduct of family planning programs aiming for survival of infants.However, for full understanding of the existing situation as well as forevaluation of changes, attention should be directed to the provision of theessential basic data regarding births by birth order, age of mother, birthweight, etc., with the requirement of quality, completeness and accuracy ofdata as discussed in the first point. At present such data are non-existentfor practically all countries of the world and yet are fundamental for thestudy of human reproduction.
Fourth, analyses of socio-economic variables including availability ofwater supplies and health services, education of the mother, occupation ofthe father,etc., indicate excessive mortality in vulnerable groups of thepopulation. Prevention of many diseases requires elimination of the methodof spread of the infectious agent as well as improvement of the nutritionalstatus. Provision of water to homes is vital. The complexity of problemsnecessitates a multidisciplinary and multisectorial approach in health plan-ning.
The most important and overall significance of this research is thatthe size and nature of the health problems are being uncovered and that theyrequire solutions adapted to the areas. Thus, the results indicate the valueof a broad approach and new policy of the Organization for community centeredresearch as an essential part of the planning of health programs. The patternsof mortality differ markedly in areas and countries of the world as do thesolutions to those problems. The results of research in a highly developedcountry may not be applicable to the problem or solution in a developing area.For example, a vaccination program against measles will prevent needless com-plications and deaths of young children in a highly developed society but vac-cination only may not be sufficient to prevent deaths in a developing society.The deaths from measles occur mainly in a highly susceptible group, the nutri-tionally deficient. These children are at great risk of death from infectiousdiseases; if measles is prevented, the death may still be produced by anotherinfectious agent. The contributory cause may be kwashiorkor or marasmus or anill-defined nutritional deficiency state. Thus the nature of the problem,measles in the nutritionally deficient young child, and the solution, vaccina-tion plus prevention of nutritional deficiency, is more complicated than in thehighly developed countries. The magnitude and complexity of health problemsneed to be uncovered as well as new designs sought - ideally through opera-tional research.
The Report of the Meeting of the Ministers of Health of the AndeanRegion expresses well our recommendation in this field, (in translation),namely:
"If we really desire to invest resources efficiently, weneed to measure or evaluate the existing problems and touncover those that remain hidden and whose magnitude isunknown. Operational research acquires utmost importance,equally in measurement of the advance and productivityof the actual systems and in attaining bases for estab-blishment of new designs and methods of work. Thus, itis important that our countries not remain in isolationbut that endeavors be combined for the conduct of jointresearch programs such as the 'investigation of mortal-ity in children under 5 years of age', carried out bythe Pan American Sanitary Bureau with the participationof various countries, among them Bolivia, Chile andColombia, members of the 'group', which is now nearlycompleted."
SPECIFIC RECOMMENDATIONS
Our first and comprehensive recommendation is for the establishmentand implementation of the policy by the Organization that community centeredresearch, preferably coordinated, is necessary for uncovering and designinghealth programs in all areas of the Continent; and that the Organization andother international agencies promote and coordinate such research with thelocal collaboration of health services, universities and institutes. Theimplementation of this policy requires the creation of centers and programswith major emphasis on epidemiology, statistics and pathology for the prepara-tion of research oriented personnel. The proposed community centered researchprojects should constitute excellent training opportunities for the variousmembers of research teams.
Earlier this year at the Meeting of Principal Collaborators, pertinentrecommendations were made for actions and research in the following fivefields:
- Registration of Vital Events and Vital Statistics
- Hospital Records, Procedures and Statistics
- Maternal and Child Health and Nutrition
- Education in Health Sciences
- Future Research Programs
These recommendations which are given in detail in the document shouldserve as the basis for next steps in local, national and international programs.Each principal collaborator has unique opportunities for utilizing the resultsof the Investigation and these recommendations in his area and country. Several
-5-
collaborators will influence health programs and obtain actions in the futurethrough education in schools of medicine and public health. Others as healthofficials and planners are establishing new maternal and child health programs,as in Bolivia and Recife. One principal collaborator has already revisedprocedures and regulations for recording deaths in hospitals and another isutilizing the findings from the search for unregistered deaths (and births)to establish correct procedures in hospitals and civil registration offices.
Several specific proposals for programs by staff of the Pan AmericanHealth Organization have been or are being designed and submitted for supportby the Organization and other agencies. The objectives and work plans of
four such proposals are described briefly.
Methodology for Maternal and Child Health Programs
The long-range objective of this project is to develop methodology for
use in planning and conducting effective comprehensive, coordinated programsin maternal and child health, with active participation of the university,
health agencies and the community. Emphasis is placed on the coverage of high
risk groups, on the constant improvement and use of statistical data for dynamicevaluation and for changes in actions as indicated.
The immediate objectives are as follows:
1. To develop and test criteria for identification and measurement ofhigh risk groups and to provide them with adequate medical care.
Health services to pregnant women and to children under 2 years of age will
have the highest priority. The criteria and the procedures will be developed
bearing in mind their potential application in other places.
2. To develop and test procedures of coordination between university,health agencies and community in the implementation of programs of
maternal and child health in which optimum use of existing resources will be
made.
3. To define and test procedures of evaluation of results from actionsin coordinated programs of maternal and child health. This will
include the establishment of surveillance procedures for obtaining high quality
data for current utilization and periodic analyses of their efficiency.
4. To developed the basic structure and facilities for conducting com-munity centered research, for in-program and in-service training of
all components of the health team and for the execution of special programs in
which national and international agencies may combine efforts for specific
purposes and gain experience from coordinated actions.
The work plan provides for a planning phase of two years in which the
basic criteria and procedures would be prepared, the resources available
evaluated and a trial or pilot project would be conducted in Recife or Campinas,
Brazil.
-6-
In the main phase of the program for a period of 5 years, the experiencegained in the trial project would be applied in seven other urban areas followedby expansion to their respective rural areas. In this phase research would beconducted and methods for extending health services to vulnerable groups wouldbe developed. These programs are to be designed to obtain the maximum benefitof the existing resources having as the target the vulnerable individual, fam-ily and community groups.
International agencies,such as UNDP, PAHO/WHO, UNICEF, World Food Program,W. K. Kellogg Foundation, Agency for International Development and others,couldjoin resources for complementary actions for financing various phases of thislarge program in which research is an important component.
Study of Outcome of Pregnancies and Survival of Newborn
The long-term objective of this project is to develop accurate andcomparable statistics in the field of human reproduction as well as on birthweight and survival of products of gestation and to promote their full utiliza-tion for planning and evaluating actions, for teaching in health sciences andfor conduct of community centered research in maternal and child health.
The immediate objectives are as follows:
1. To develop and introduce procedures for recording and handling ofdata regarding each pregnancy and its outcome (early and late fetal
death and live birth), birth weight, health and nutritional status and survivalof live births, with the active participation of health and university personnel.
2. In order to understand the implication of certain interrelationshipsbetween the outcome of pregnancies, circumstances of delivery and
biological and sociological factors, periodic analyses of data collected willbe made and the results utilized for evaluation and readjustment of programs.
3. To establish the foundation for the conduct of a prospective studyon the nutritional status of pregnant women and their reproductive
histories (parity, spacing, outcome and survival of previous children) and therelationship of these factors with the course of pregnancy, birth weight, thehealth condition of the newborn and during early childhood.
The work plan includes a pilot phase of two years within a local pro-gram of maternal and child health in a city such as Recife, Brazil. A setof recommendations for recording and reporting standard basic data (forms andtabulations) will be prepared and discussed at a planning conference and amanual of procedures elaborated. These procedures will be tested with thefull cooperation of local health agencies and university units and will beaccompanied by educational activities directed to professional and auxiliarypersonnel, administrators of hospitals and health centers, students and mid-wives.
-7--
In the main phase the procedures tested and revised will be graduallyimplemented in various centers with introduction at regional and nationallevels. After standard procedures are introduced, collaborative longitudinalstudies of human reproduction will be planned and conducted.
Intensive Program to Improve Vital and Health Statistics in Latin America
The Department of Health Statistics has developed a proposal for anintensive program for improvement of vital and health statistics. The emphasison health planning has created a widespread awareness of the needs for statis-tical data which has resulted in use of available data, often incomplete incoverage and of unknown quality. Also the Inter-American Investigation ofMortality in Childhood demonstrates serious and surprising deficiencies ofdata from death registration systems as well as in hospital statistics. Anew approach - a strategy - for rapid improvement has been devised with anexpanding program for its initiation with teams of consultants working forimprovement of civil registration, hospital statistics and statistics ofhealth centers.
Effect of Malnutrition on the Immune Response to Infectious Diseases
The synergistic action of infectious diseases and nutritional deficiencyis responsible for excessive mortality in childhood in the areas of the Inves-tigation. In spite of important findings of studies by Smythe et al(6)Woodruff(7) and Marigo(8) and others, the mechanism of the interrelationshipsbetween immunity response and nutritional deficiency has not been clearlyestablished.
The existing PAHO/WHO program on Training and Research in Immunology,as well as the great interest on the part of various scientists (such asDr. Carlos Marigo in Sao Paulo) could be used to conduct investigations inthis promising area with implications even in the field of cancer.
A research project with the following objectives could be proposed:
1. To measure immune responsiveness in malnourished and well-nourishedliving children and in children recovering from malnutrition.
2. To study histopathologic changes occurring in thymus and bursa-dependent lymphoid tissues during malnutrition as revealed byautopsy.
3. To study histologiccally the state of immunologic system of chil-dren who die in the newborn period and its relationship to maternalnutrition and health and to conditions during pregnancy and birth.
Lc
-8-
Patterns of Breast Feeding
Other agencies are interested in research indicated by the Investiga-tion. For example, the MIL Research Limited of England at the request ofthe FAO Nutrition Division has proposed an investigation on breast feedingaimed:
1. To measure trends in breast feeding in areas of rapid urbaniza-tion and surrounding rural areas in order to determine the extentof the problem.
2. To provide the basis of a strategy for encouragement of breastfeeding.
3. To develop alternative strategies for improving infant nutrition.
4. To provide the basis for education in weaning foods using locallygrown cereals and vegetables rather than expensive milk products.
Recife, Brazil, has been tentatively selected as one of the areas inview of the provisional results of the Investigation, the other areas beingconsidered are Ibadan, Dakar, New Delhi and Kuala Lumpur. Research of thistype is considered essential to define mechanisms to improve chances of sur-vival of children in areas in which socio-economic and environmental condi-tions are unfavorable and in which early weaning patterns exist.
Other Projects
The World Health Organization has adapted the methodology of the Inves-tigation in order to obtain accurate measures of infant and child mortalityin areas of the world without satisfactory statistics. This activity of WHO,utilizing funds from the United Nations Population Program,is a direct resultof our Investigation. A period of six months is being used for training ofnational personnel. The four projects already designed are in the followingcountries: Afghanistan, Sierra Leone, Algeria and Indonesia.
Thus the methodology of the Investigation is suitable for adaptationfor projects designed for the study of mortality or of specific health problemsin many areas of the world.
The ultimate success of the Investigation depends on the actions takenfor the health of children through out the continent, through the combinedefforts of the principal collaborators, health authorities and educatorsas well as those of the international organizations. The greatest contribu-tion of the Investigation will be the acceptance and implementation of theprinciple that community centered research should be incorporated as anefficient and essential part of programs for uncovering health problems andfor seeking new designs for their solution.
-9-
REFERENCES
(1) Puffer, R. R.: Initial Phases of the Inter-American Investigation ofMortality in Childhood, English Edition of the Boletin de la OficinaSanitaria Panamericana, 1968. Document originally prepared for theSeventh Meeting of the Advisory Committee on Medical Research, June1968. (Also available in Spanish).
(2) Progress Report of the Inter-American Investigation of Mortality inChildhood, presented to the Ninth Meeting of the Advisory Committeeon Medical Research,June 1970. (Also available in Spanish).
(3) Inter-American Investigation of Mortality in Childhood, ProvisionalReport for First Year, Pan American Health Organization, September1971. (Also available in Spanish).
(4) Inter-American Investigation of Mortality in Childhood, Report ofMeeting of Principal Collaborators, 24-28 January 1972. (Also avail-able in Spanish).
(5) Planteamientos Generales, Reuni6n de Ministros de Salud Pfblica (GrupoSubregional Andino), Lima, Perú, Diciembre 1971. Documento Preliminardel Ministerio de Salud Pfblica de Colombia.
(6) Smythe, P.M., et al: Thymolymphatic Deficiency and Depression of Cell-mediated Immunity in Protein-Calorie Malnutrition, The Lancet, pages939-943, October 30, 1971.
(7) Woodruff, J. F. The Lancet, page 92, January 8, 1972.
(8) Marigo, C.: Thymic Alterations Found at Necropsies of Sao Paulo,Brazil. Study of 500 autopsies. Document presented at the WHO StudyGroup on Immunology, Geneva, June 1971.
Attachments: 1) Provisional Report of the First Year of the Inter-AmericanInvestigation of Mortality in Childhood.
2) Report of the Meeting of Principal Collaborators of theInter-American Investigation of Mortality in Childhood.
April 26, 1972
PAN AMERICAN HEALTH ORGANIZATION
S/j Pan American Sanitary Bureau, Regional Office jf the
WORLD HEALTH ORGANIZATION
IN REPLY REFER TO:
525 TWENTY-THIRD STREET, N.W., WASHINGTON, D.C. 20037, U.S.A.
INTER-AMERICAN INVESTIGATION OF MORTALITY IN CHILDHOOD
Report ofMeeting of Principal Collaborators
24-28 January 1972
qP
CABLE ADDRESS: OFSANPAN
TELEPHONE 223-4700
INTER-AMERICAN INVESTIGATION OF MORTALITY IN CHILDHOOD
Report of Meeting of Principal Collaborators
Washington, D.C., 24-28 January 1972
TABLE OF CONTENTS
Page
I. INTRODUCTION ............................................... 1
II. SUMMARY OF PRELIMINARY RESULTS OF THE INVESTIGATION ........ 2
III. PARTIAL ANALYSIS OF DATA ON SAMPLES FROM CALI AND KINGSTON . 3
IV. SPECIFIC ACCOMPLISHMENTS RESULTING FROM THE INVESTIGATION .. 7
V. RECOMMENDED ACTIONS IN UTILIZATION OF RESULTS .............. 13
A. Quality of Registration of Vital Events and VitalStatistics ........................................... 13
B. Hospital Records, Procedures and Statistics .......... 15
C. Maternal and Child Health and Nutrition .............. 17
D. Education in Health Sciences ......................... 20
E. Conclusions and Recommendations for Future ResearchPrograms ............................................. 21
VI. FUTURE PLANS ........................................ 25
APPENDICES ......................................................... 26
-i -
INTER-AMERICAN INVESTIGATION OF MORTALITY IN CHILDHOOD
Report of Meeting of Principal Collaborators
Washington, D.C., 24-28 January 1972
I. INTRODUCTION
A meeting of the principal collaborators of the projects of the Inter-
American Investigation of Mortality in Childhood was held at the Pan American
Health Organization from January 24-28, 1972. The purpose of the meeting was
to review the progress made in the analysis of data, to insure its completeness,
to make plans and recommendations for its full utilization in health and educa-
tion programs and to recommend research needed for introduction of practicalmeasures for solution of problems. The Investigation has laid a foundation in
community centered research and in demonstrating measures to establish quality
of data. The principal collaborators are the ones to give leadership for
actions and research of the future.
At this time the Provisional Report for the First Year of the Investigationwas available in English and Spanish for review by collaborators. For this report,
questionnaires on 17,198 deaths in the firat year from the 13 Latin American pro-
jects were used for analysis. Additional questionnaires for unregistered deaths
are being completed in several areas in order that the final report may be com-
plete. The total number of deaths for the two years is expected to be around
34,000 for the Latin American projects and 1,000 for the United States and
Canadian projects.
In addition to the Provisional Report, working drafts of analyses of otherpertinent material in which the interrelationships of diseases and other factors
were considered were available to the collaborators, namely, Birth Weight, BreastFeeding, Provision of Foods, Socio-economic and Related Factors and History ofCommunicable Diseases. For the subdivision and analysis of several variables,
the data for the two years are needed.
Partial findings from the probability sample of households in Cali and
the Kingston Area were presented.
During the general sessions, principles for future actions resulting
from the experience gained during the Investigation were discussed, and thesediscussions served as the basis for recommendations formulated by five working
groups.
*This research project was made possible by a contract with the Agency for
A- International Development of the United States of America to the Pan AmericanHealth Organization.
-2-
*.II. SUMMARY OF PRELIMINARY RESULTS OF THE INVESTIGATION
Some of the highlights of the Report for the First Year of theInvestigation of the 13 Latin American projects and of the exploratory 4
analyses in five working drafts were given with the principal objective ofplanning the final report and of utilizing the results for actions and *planning of future activities. For the meeting of the Advisory Committeeon Medical Research of the Organization, a member of the Committee hasrequested that the results be presented in relation to the next steps needed -and that concrete recommendations be made so that the Advisory Committeecan consider support for future activities in these fields. A summary of theresults of the Investigation follows:
a. First, to establish quality in our projects for the inclusion ofinformation regarding all deaths under 5 years, we have discov-
ered a serious situation in hospital and registration procedures. In sev- -eral areas significant proportions of deaths,particularly of those occurringin the first few days of life and of infants of low birth weight,were notregistered. Although this is being changed with additional efforts, forexample in San Juan and Santiago, concerted actions are needed to improvethe quality of reporting of these events.
b. Excessive mortality in childhood has been revealed - often inexcess of the official statistics. The situation in rural areas
is very serious with rates as much as twice those in the cities. These '
findings indicate the need for action in cities and especially in ruralareas.
c. The role of infectious diseases as underlying causes of death hasbeen clarified, with diarrheal disease and measles the principal
causes. The synergistic association of infectious diseases and nutritionaldeficiencies indicates that the susceptibility of the host as well as thespecific agent must be considered in effective programs for control of infec-tious diseases. From 40 to 76 per cent of the deaths from infectious dis-eases had nutritional deficiency as an associated cause.
d. Only through the study of multiple causes is measurement possibleof the magnitude of health problems in infancy and childhood,
such as nutritional deficiency and prematurity as well as the infectiousdiseases, certain perinatal causes, etc., and the interrelationships of thesecauses. Nutritional deficiency was the underlying or an associated cause of38 to 69 per cent of the deaths from all causes of children under 5 years ofage, excluding the neonatal deaths and immaturity was an associated causeof 47 to 72 per cent of the neonatal deaths.
e. Nutritional deficiency constitutes the most serious health problemin infancy and childhood in Latin America. Death rates are very
high in infancy and the situation is even more serious in the rural areas.Preliminary analyses of foods provided to deceased children indicate probabledeficiencies in foods with proteins. Thus, the data serve to show the needfor extended and improved nutrition programs.
- 3 -
f. Excessive reproductive wastage was found in several areas fromthe study of outcome of previous products of pregnancy. In all
areas infant mortality among previous products was higher than in theInvestigation. Mortality was greater among infants of higher birth ordersand older mothers. Reduction of the birth rate as in the Province ofSantiago with introduction of family planning practices results in a shiftfrom births of higher birth orders to those of low birth orders and thusa lower death rate.
g. Limited breast feeding was found in several projects especiallyin those in Brazil and San Salvador. Since higher proportions
of the,deaths were due to diarrhea in infants with weaning started, furtherinvestigation of these relationships is advisable which in turn should leadto improvement in feeding of infants.
h. Socio-economic factors such as education and occupation are beinganalyzed and the interrelationships studied. The level of educa-
tion of mothers varied widely from over one-half with no education in Recife(52.4 per cent) and in Rural San Salvador (61.6) and Viacha (62.3) to lessthan 10 per cent with no education in Kingston and the City of San Juan. Inthe analysis of deaths by occupation of father and education of mother, dif-ferences were noted in neonatal and postneonatal mortality. Educationallevel of the mother appears to be the best single index of socio-economicstatus as it measures the effect of several factors such as income, occupa-tion, nutrition and environment in addition to education. Thus, the socio-economic aspects of these problems deserve consideration in planning healthprograms.
i. Piped water supplies were available to less than 20 per cent ofthe homes of deceased children in two cities and three rural areas
with excessive mortality under 5 years of age. Prevention of spread of dis-ease requires provision of water to the homes.
I1I. PARTIAL ANALYSIS OF DATA ON SAMPLES FROM CALI AND KINGSTON
Data have been processed for the two-year period for only two areas,Cali and Kingston. The opportunities for analyses are many, but for thisrreeting only those data which can be compared with those already availableon deaths were presented.
Many differences between the sample and death populations stood outfrom review of tables provided. Some support strongly the hypotheses thatthe deaths of children come from very selected parts of the population.Other differences may have been produced by varying definitions and pro-cedures between the sample survey and the death study.
-4-- 4 -
Interview response -
In Cali, about 5 per cent of 2,621 dwellings in the sample were vacant.For those occupied, the household interview was completed in 96 per cent, andin another 4 per cent, information was obtained from a neighbor. The experi-ence in the Kingston Area was somewhat different. In Metropolitan Kingstonand St. Andrew, 5 per cent of dwellings were also vacant, but interviews werecompleted with a household member for only 85 per cent and for another 2 percent with a neighbor. The large number of households where no one was foundat home in Kingston (12 per cent) creates problems in estimating total popula-tions for the area.
Distribution of sample population
The age distributions of the population in the sample households in thetwo areas were shown. For the Kingston Area, these numbers, scaled up on thebasis of the sampling ratio of 1/39.5533, provide an estimate of the popula-tion of the metropolitan area 445,687 in mid-1969. Interpolation from datain 1960 and 1970 censuses gives a population for 1969 of 478,000. The sampleresult is 7 per cent under this. However, the non-response rate was approx-imately 12 per cent. Since this non-response was based primarily on familiesnever at home, it may be reasonable to assume that the smaller-sized familiesare the non-respondents. In the Kingston Metropolitan Area, 18.5 per cent ofthe population are under 5 years of age and 44.9 per cent under 15 years ofage, and an estimated 42.7 per cent are under 14 years. Preliminary censusdata show the population under 14 in the Kingston and St. Andrew Parishes tobe 41 per cent.
Reporting of vital events
From the data obtained in the sample households on vital events, thedeath rates were estimated for the study areas. From total death rates inCali and in the Kingston Area and age specific rates, together with rates for --the two countries, Colombia and Jamaica, for the most recent year for which *data were available, it was immediately obvious that in these two areas thesamples have not provided adequate estimates of mortality. Birth rates, onthe other hand, as estimated from the sample households, were 28.0 in Cali %and 40.5 in the Kingston Area. The rate for Cali appears low and for Kingstonelevated. Index cards are being prepared for all births and deaths reported -in the household interviews and it is hoped that they can be checked against A
registration records to determine whether they have been registered or not.
Environmental conditions
In bothareas, Cali and Kingston, as well as in rural St. Andrew, waterwas piped into the homes of the children who died far less frequently than to a-~all families with children under 5 years of age. For example, the observednumber with piped water inside the house among deaths in Cali was 365, butfrom the sample data, 553 of the 667 would have been expected to have pipedwater. Moreover, families with children under 5 years were less likely to
have piped water in their homes than other families in the communities.
-5-
Medical care
Mothers of living children under 5 years of age included in thesample received more prenatal care than the mothers of deceased childrenin both Cali and the Kingston Area. Many fewer of the mothers in the sam-ple were in the group with no prenatal care and many more in the grouphaving four or more visits. Prenatal care began earlier in pregnancy forthe mothers in the sample than for the mothers of the deceased children.Many more of the sample mothers in both Cali and Kingston first receivedattention in the second or third month of pregnancy.
Analysis of vaccination status of the deceased children and the livingchildren in the sample suggests that the living children receive more protec-tion. At one year of age, children in the sample were more frequently immu-nized against whooping cough, diphtheria, tetanus and poliomyelitis in bothCali and Kingston.
Socio-cultural and biological factors
Families of living children in Cali differed from those of deceasedchildren with respect to the presence of parents in the home and their maritalstatus. The greatest difference was related to the marital status of parents.In the sample, the proportion of households with parents married was greaterthan for the deaths, where common-law unions were more frequent. Similarly,in Kingston in the households with both parents present, common-law unionswere more frequent for parents of deceased childrenthan of the living. Alsoin Kingston, there was for the deaths, when compared with the sample, a greatexcess of households with only the mother present. The educational level ofmothers of deceased children was significantly lower than that of mothers ofchildren in the sample in Cali. In the Kingston Area, no differences wereapparent.
It would appear that family size is not different for the living anddeceased persons except in rural St. Andrew where the differences may be dueto the small numbers.
Nutritional status
The average weights by month of age for children under 5 years of agefrom the samples for the two areas, Cali and Kingston, were shown graphically.together with the range of weights. Also plotted were the curves for standardaverage weights used in the Investigation as a basis for assessment of nutri-tional status and the curves for 90 per cent, 75 per cent, and 60 per cent ofthe standard. For males in Cali, average weights are above the standard until6 months of age, falling into the area of 90 to 100 per cent of the standarduntil 11 months. From then to 5 years of age, the points follow the 90 percent curve reasonably well. The data for females in Cali suggest weightsbelow the standard begin to occur earlier in life and that shortly after oneyear of age, the average weights are under 90 per cent of the standard andwithin the range of Grade I malnutrition.
-6-
In Kingston, the average weights for males are in general above the -
standard curve until 10 months of age. From 10 to 20 months, they are close
to the 90 per cent curve. For the rest of the age span to 5 years, averages
are usually above the 90 per cent curve. The average weights for females in
Kingston are reasonably close to the 90 per cent curve.
Information on breast feeding as obtained in household interviews canbe compared with similar information presented in the Provisional Report
for deceased children. In Cali, of the deaths from 1 through 11 months of
age, more were breast fed than would be expected from the sample data; for
those children dying from 1-4 years of age, the proportion breast fed was
similar to that for the sample. The findings for Kingston are similar withmore breast feeding among the deaths than the sample. Extra effort may have -
been expended to obtain this information from mothers of deceased children
than from the mothers in the sample. In fact, the mother may have more fre-
quently been the source of information for the deaths than for the sample. rIt will be important to examine the results in more detail comparing the
groups where information was provided by the mother.
The questions for the sample households with respect to food received
by the child were the same as those in the interviews regarding the deceased
children. For almost every food in all age groups, expected numbers in Cali ¡~-
are higher than those observed for the deaths, suggesting better nutrition
in the sample group. In Kingston, it also appears that the living children
at the younger ages have more foods introduced than those who are to die, but
in the 2-4 year group, there is little difference.
Measurement of arm circumference was included in the sample as a pos-sible second indicator of nutritional status. Average arm circumference in
centimeters with ranges of values are given by month of age and sex, together
with the standard measurements, which appear in The Assessment of the Nutri-tional Status of the Community by D. B. Jelliffe. In Cali as with weights,
average arm circumferences are near the standard in the first six months of
life, and fall to the 90 per cent level in the next 12 months. From 20 months
on, the averages are usually between the 90 and 100 per cent level for both
males and females. In Kingston, the average arm circumferences are near the
standard in the first 4 months, falling to the 90 per cent level in the next
6 months, and in the second 10 months are below the latter level. They rise
above the 90 per cent level from 20 months to 5 years. The arm circumferences
of children in Kingston are higher than those in Cali in the 2-4 year age group. -
These data which are provisional indicate the need for further tabula-
tions and exploration. The quality varies in the projects in part dependent
on the training, experience and supervision of the interviewers. They indicate
the value of the introduction of probability sampling which will give useful
results, especially in socio-cultural and biologic data regarding the general
population, but also they serve to point out the needs for improvements in
utilizing these methods.
* .
_-
-7-
IV. SPECIFIC ACCOMPLISHMENTS RESULTING FROM THE INVESTIGATION
The accomplishments reported by the principal collaborators havebeen described briefly in five fields, followed by actions of a generalnature in the final section.
Vital statistics
The lack of registration of deaths in early life in Santiago resulted
in a well organized search in the six most important maternities for deathsunder 28 days of premature births in accordance with the sampling ratio
(one in each five for the first eight months and one in three for 16 months).The results in one institution indicated that the unregistered deaths were
frequently those of low birth weight, and death occurred soon after birth.However, some full term births were not registered. The document prepared
by the principal collaborator in Santiago had several recommendations for
actions in Chile as well as in other countries. After the search is completedin other five institutions in March 1972, a report on the findings should bereleased for use in Chile and in other countries. It is expected that between
two and three hundred deaths will be discovered and added to the Investigation
so that the total for the Santiago project will be of the order of 2,700-2,800.Two measures were given for solution of the problem of non registration of
deaths in Chile; actions by the National Committee on Vital and Health Statis-
tics and the National Health Service by establishing standards and directly by
the chiefs of maternities in Santiago.
An organized search for unregistered deaths was conducted in Cartagena
which resulted in the discovery of 20 per cent of the deaths under 5 years of
age in the first year of the Investigation. A pilot zone has been established
in Cartagena, as well as in several other areas in Colombia, for developing
procedures for collection of data in a National Information System.
In Sao Paulo, a search was made for birth certificates of the deceased
infants included in the Investigation and 9.5 per cent of the deaths under 1
year of age were not registered as births, and 82.5 per cent of these births
had occurred in hospitals. A document was published to alert hospital admin-
istrators to the problem of improving vital statistics.
In Chaco, a continuous improvement in registration procedure has beennoted and standards of the National Plan for Health Statistics are being
applied.
Hospital statistics
In San Juan, Argentina, a Manual for Procedures in Hospitals was devel-
oped in the first year and is in use in the Province. The principal hospitalprepares a monthly list of the deaths by age in the maternity and in other
Services of the hospital which aids in the evaluation of their mortality andis also forwarded to the Vital Statistics Office of the Provincial Health
Service.
-8- 4
u-
In Kingston, the WHO definition of a live birth was introduced in thehospitals in the early phases of the Investigation and steps are being takenfor improvement of records and procedures in hospitals. L
Registration of live births is being established in the hospitals inCartagena as well as in other areas in Colombia. This is an important devel- ?
opment as previously records of baptisms were used for live birth statistics.
Hospital records and procedures are being improved in Recife. ~
The project in Ribeiráo Preto designed a record for use in the mater-nities so that the product of each delivery would be known and so that alldeaths of live born infants would be included in the Investigation.
Definitions of WHO are being introduced in institutions in Santiagofor correct procedures with live births, fetal deaths and neonatal deaths.
Maternal and child health
The actions in Recife as a result of the Investigation are outstanding.The principal collaborator was appointed Secretary of Health of the State ofPernambuco on March 15, 1971, and some members of the staff of the projectwere incorporated into the Ministry of Health. The results of the first yearof the Investigation are being utilized as the basis for the program in thenew ministry. A document "Plano de Safide" for 1972-1975 has been developedbased principally on the Investigation, since the research program providedthe first accurate statistical data on mortality in childhood in Recife.Copies of the document were provided to the group. The seriousness of thenutrition problem is the basis for supplementary supervised feeding of infantsand children 1-4 years.
Vaccination programs against measles were undertaken in Recife and LaPaz during the second year of the Investigation. In La Paz, 35,427 vaccina-tions to children 1-4 years of age were given in three years, 1969-1971. As ~the result of early findings of high fatality from measles which were reportedto the Meeting of Ministers of Public Health in 1968, a recommendation wasmade for continent-wide use of measles vaccine. Vaccination programs are under-way in Argentina and the State of Sao Paulo and other parts of Brazil. Thevaccination program against measles is continuing in La Paz and has beenextended to the rest of Bolivia.
Committee action has been taken in Sao Paulo for planning for utiliza-tion of the findings in maternal and child health and planning of the Ministryof Health.
In Bolivia, the results are being used in the new integrated maternaland child health program in which AID and UNICEF are participating. This pro-gram in which national standards will be carried out is planned for four localareas, Santa Cruz, La Paz, Chuquisaca and Cochabamba. The establishment of A
the structure of services, medical education and operational research in demo- $graphy, applied nutrition and epidemiology of abortions are incorporated.
-9-
In Kingston, findings have been reported to a Nutrition Committeeof the Ministry of Finance and to the Maternal and Child Health Committeeof the Ministry of Health for actions.
In the San Francisco project, a weekly case-conference system wasset up to review each death and this was used as a teaching device for staff,students of maternal and child health and residents in pediatrics. Theseconferences were attended at times by a pathologist and neonatalogist andphysicians from the community. Also, there were several meetings withphysicians in the community to discuss the problem of sudden infant deaths,which represent about 10 per cent of the total deaths.
In Santiago, a paper has been published on acute bronchopneumonia asa contribution to the knowledge of the problem in the program of the NationalHealth Service against broncopneumonia. Also, a working group of specialistsin maternal and child health and planning is responsible for the design of aclinical record for the newborn.
Education
The Investigation is being utilized continuously in teaching programsin schools of medicine and public health and nearly all of the principal col-laborators described specific activities in this field.
In California, students are utilizing material collected in the Inves-tigation for theses and special studies. In Sao Paulo the methodology andthe results are being used in the courses of preventive medicine in the schoolof public health and special courses on demography. Also, they were used inan intensive course on demography of the Department of Sociology of theCatholic University of Rio de Janeiro on April 1971. Also in Sao Paulo, thebasic data are serving for theses and special studies. In Sherbrooke, in amedical school oriented toward community based research, subjects for researchprojects for medical students, residents and graduate students have beenselected from the Investigation of mortality and probability samples. Impor-tant components of the master of science program in epidemiology derive fromthe research in childhood.
In Recife, the public health nurse who participated in the Investigationhas utilized the material in the teaching as professor of nursing and in herparticipation in meetings in other areas of Brazil, thus giving leadership topromotion of research and its utilization in education of nurses.
Research
In S5o Paulo, the sample of living children was used for a more inten-sive study of nutrition.
The findings on breast feeding have interested a research group inElngland to develop research on breast feeding in Recife as well as in Ibadan,Nigeria.
- 10 -
The principal collaborator in Ribeirao Pr8to presented certain aspectsof the methodology and results in the meeting of the International Epidemio-logical Association held in Ibadan, Nigeria, in April 1970. Also the datafrom the Investigation served as the basis for a study of seasonal variation -in mortality from diarrheal disease and malnutrition. Results were used bythe pediatrics departments as well as in departments of preventive medicinefor conferences and meetings and will be presented to the Medical Associationof the Region of Ribeirao Preto in 1972.
Plans have been made for inclusion of Chaco Province in an investiga- _tion on nutrition in the northeast of Argentina considering medical, biologicaland socio-economic aspects. These are tentative plans for a study on provisionof and demand for medical attention and on subregistration of vital events.
In Sherbrooke, the probability sample of households has served as aframework for several special regional studies, among which are those on 4-
dietary habits, on the role of maternal nutrition on the products of pregnancy,on the familial distribution of obesity on population patterns of health prac-tices, on fertility characteristics of women of reproductive age, on the roleof distance to hospitals on mortality patterns, and on the aggregation ofarthritic diseases. On a more global aspect, the Investigation has aided inpromoting the orientation of the department toward population based epidemio-logical research.
In California, a new research project has received financial support
for the study of the patterns of delivery of community health care to childrenunder 5 years of age in Alameda County, one of the counties included in theInvestigation.
Other actions
The World Health Organization has adapted the methodology of the Inves-tigation in order to obtain accurate measures of infant and child mortalityin areas of the world without satisfactory statistics. This activity of WHOutilizing funds from the United Nations Population Program is a direct resultof our Investigation. A period of six months is being used for training ofnational personnel. The four projects with the approximate dates of establish-ment are in the following countries:
1. Afghanistan - January 1972 3. Algeria - March 1972
2. Sierra Leone - March 1972 4. Indonesia - July 1972
Because of the importance of this research, the Head of Demographic StatisticsSection of WHO participated in our meeting.
The principal collaborator in California presented material from theInvestigation at a conference in Uganda, and has participated in discussionsof possible applications of the methods used in the Investigation for studiesby medical schools in Africa and India.
- 11 -
Material from the Investigation was used by the principal collaboratorin San Salvador in a meeting on medical education held in Guatemala for themedical schools of Central America. In Mexico, a large meeting of the"Jornadas de Salud Pública" was held in the National Medical Center for SocialSecurity on July 9, 1971. The material from the Investigation was presentedby four persons with the principal collaborator of Monterrey giving an anal-ysis of the data for Monterrey. This meeting created great interest in thehealth problems revealed.
At a Maternal and Child Health Conference sponsored by the Ministry ofHealth and the University of the West Indies on June 3, 1971, in Kingston,Jamaica, several papers were presented using data from the Investigation andthe discussions centered on the needs for extending prenatal care and preven-tive measures to a higher proportion of the mothers, infants and young chil-dren.
-On March 10, 1969, a meeting was held in Buenos Aires, Argentina, with
representatives of the Ministry of Health, Association of Faculties of Medicine,pediatricians, the two principal collaboratos in Argentina and Central Officestaff. One of the direct results was the provision of greater pathological
& services in San Juan.
In Sherbrooke, Canada, the results of specific phases of the Investiga-tion have been presented to meetings of the Canadian Genetics Society, theCanadian Association of Teachers of Social and Preventive Medicine, Canadian-French Association for Advancement of Science, Symposium on Perinatalogy andCanadian Pediatrics Society.
Several meetings have been held in Brazil. The first was held on March7, 1969, in the Ministry of Health in Rio de Janeiro. On October 1971, twomeetings were developed by the principal collaborator in Sao Paulo; the resultsof the first year of the Investigation were presented to a large group at theSchool of Public Health which included leaders in maternal and child healthand nutrition as well as vital statistics. Several meetings were held in Recife,and a seminar for the Northeast Area of Brazil is scheduled for which the resultsof the Investigation will be utilized for planning. The principal collaboratorin Recife presented some of the findings at a national seminar on maternal andchild health in Salvador sponsored by the University of Bahia and the Associationof Faculties of Medicine. Great interest is developing throughout Brazil.
The three principal collaborators in Colombia participated in a meetingin the Ministry of Health of Colombia on October 22, 1971, in which the health
problems revealed were discussed and solutions sought.
Preliminary results of the Inter-American Investigation of Mortality inChildhood in La Paz were presented by the principal collaborator in a seminaron education on maternal and child health directed to the community in Sucre,Bolivia, in June 1971 and by the professor of pediatrics at the meeting of theBolivian Society of Pediatrics in Cochabamba in October 1971.
- 12 - 4
The pathological findings on deaths were presented by the principal
collaborator in Chaco in an Argentinian-Paraguayan Meeting on Pediatrics.
In Sao Paulo, the provisional results have been presented in three
congresses, namely, Congress of the Paulista Association of Medicine,Brazilian Congress of Hygiene and the Medical Congress of the State ofEspirito Santo.
A Workshop on Pediatric Pathology was conducted in Sao Paulo, Brazil, A4
from 23 March-lO April 1970, in which eleven pathologist from the projectsof the Investigation participated. Another workshop is planned for early1972 to be conducted in San Salvador, El Salvador.
Members of the Central Office staff have participated in internationalmeetings which included the following:
- Consultation on Growth and Development, Consultation on MultipleCause Analysis, Study Group on International Classification ofDisease, WHO, Geneva, October 5-25, 1969.
- Consultation on Fetal, Infant and Childhood Mortality, WHO, Geneva,March 14-22, 1971. 4-
- Meeting for Planning of Socio-economic Studies of Perinatal Mortality,WHO, Geneva, January 10-14, 1972.
- Internal Meeting on Nutritional Aspects of the Investigation, PAHO,
Washington, D.C., March 16-18, 1970. Recommendations were made for
the Section on Nutrition in the 1975 Revision of the InternationalClassification of Diseases.
- Regional Meeting on Revision of International Classification of 4
Diseases, PAHO, Caracas, December 7-11, 1970.
- Protein Advisory Group, FAO/WHO/UNICEF, Washington, D.C., October26, 1971. A paper was prepared for this meeting as the basis fordiscussions and some of the provisional findings were included inthe report of the meeting. 4
- Regional Advisory Committee on Health Statistics, PAHO, Washington,D.C., December 6-10, 1971.
e -
- 13 -
V. RECOMMENDED ACTIONS IN UTILIZATION OF RESULTS
Working Groups formulated several principles and recommendations which
resulted from the experience gained during the course of the Inter-American
Investigation of Mortality in Childhood. These are given in the following
five sections of this report.
-· A. Quality of Registration of Vital Events and Vital Statistics
On the basis of the experience acquired in the Investigation on quality
of the registration of vital events, the group considers of highest priority
and urgency that the countries develop programs designed to improve and main-
tain the quality of registration of births and deaths in early life so that
more complete and accurate vital statistics may be available for the countries.
To this end, the following recommendations are formulated.
1. Registration
1.1. The definitions* of live birth and fetal death of the WorldHealth Organization should be disseminated widely for univer-
sal application. The physicians, obstetricians and pediatricians, as well ashospital administrators, midwives, nurses, and others attending births should
know these definitions in order to collaborate efficiently in their uniformapplication. The group believes that periodic studies should be conducted
for verification of the extent to which these definitions are respected.
1.2. The governments should adopt measures and legislation to
facilitate the prompt registration of all vital events. An
example of such measures is the establishment of offices or agents of Civil
Registration in hospitals in order to insure that all the births and deaths
are registered.
1.3. The officials of Civil Registration should insure that thebirth of each child who dies at less than one year of age
_w is included in the registry of births as well as in the registry of deathsand that the services of Civil Registration establish procedures for the con-
trol of the quality and completeness of registration.
1.4. The institutions and persons who provide health services cancontribute efficiently to improvement of the quality of vital
statistics. The education of the parents during prenatal care and followingdelivery on the importance of registration and the requirement of registration
for obtaining health services (care of the well child, etc.) are examples of
the mechanisms which can be utilized. In the case of deliveries attended by
professionals (physician or midwife) a certificate should be prepared for the
family to present for registration. This will improve the quality of theregistered information as well as facilitate the procedure.
1 Definitions in Appendix III.
- 14 -
2. Data on Certificates and Reports
2.1. The principal usera of the information should be consultedregarding the types of data to be included as a minimum in
reports on births and deaths. Such data ought to be applicable to all thecountry but for the development of special programs and of research certainadditional data could be incorporated in apecified periods and regions.
2.2. For consideration of items to be included on birth anddeath certificates, those listed in Principles for a Vital
Statistics System of the United Nations are recommended as a minimum. Inaddition to the minimal data on births, that is date of birth, date ofregistration, type of birth, sex, legitimacy and person who attended thedelivery, the group suggests adding hour of occurrence, weight at birth andorder of birth. In addition to the minimal data regarding characteristicsof the mother, that is date of birth or age, number of previous deliveriesto the mother divided into fetal deaths, live births currently living andlive births that are dead, place of usual residence of the mother, the grouprecommends adding education and occupation of the parents.
The minimal data for deaths include date of death, date ofregistration, date of birth or age of decedent, place of occurrence, causesof death, person who certified the death, place of usual residence and sex.The group recommends the following additional data for infant deaths (lessthan one year of age): for the infant exact age at death and weight at birth;age, occupation and education of the parents and the number of previous deliv-eries to the mother divided into fetal deaths, live births currently livingand live births that are dead.
For the data on fetal deaths, early or late or both inaccordance with the requirements, the minimal and additional data would besimilar to that for infant deaths.
3. Vital Statistics
In order to improve the quality of vital statistics, educationalprograms, studies and tabulations are recommended.
3.1. Schools of medicine, public health and others in the healthsciences should teach students the correct utilization of
vital statistics in order to improve the health services for the popula-tion and that teaching be introduced into the curriculum of students of medicineand in postgraduate programs; correct use of the international model of themedical certificate of cause of death including the concept of the underlyingcause of death and the correct form of completing the certificate. Also, per-sonnel responsible for coding causes of death should be taught the use of therules of selection and classification of the underlying cause of death of theWorld Health Organization.
:
- 15 -
3.2. The tabulations recommended in the International Classifica-tion of Diseases of WHO will be made for deaths and those of
the Principles for a Vital Statistics System of UN for live births. For neo-natal and infant deaths additional tabulations are needed by age of mother,birth order and weight at birth.
3.3. The health services should make prospective studies throughperiodic visits to the homes of samples of the population to
record the occurrence of vital events with subsequent verification in the of-fices of Civil Registration and samples should be taken of children attendingpublic health clinics to verify the registration of their birth.
3.4. Deaths in hospitals should be studied by age with emphasison the death rate in the first 24 hours of life, neonatal
deaths, etc. The inclusion of neonatal deaths should be checked usingsampling of clinical records and deaths with autopsies to insure the registra-tion of all. In addition, maternities and emergency services should use arecord (card for example) for recording minimum data regarding all productsof conception and these records could be sent periodically to the offices ofCivil Registration in order to improve registration.
4. Multiple Causes of Death
The group recommends that selected areas begin coding multiple causesof death using the medical certificates of cause of death or special forms. Fordeaths of children under 5 years of age, uniform tabulations should be made,especially those which have proven valuable in the Inter-American Investigationof Mortality in Childhood. The value of utilizing multiple causes in the studyof morbidity and mortality should be taught in courses in schools of medicineand public health.
B. Hospital Records, Procedures and Statistics
On the basis of identification of difficulties encountered in the Inves-tigation in hospital procedures with records of live births and deaths occurringin those institutions, recommendations are given regarding certain aspects ofthe records, procedures and hospital statistics, including education and training,with special emphasis on births and infant deaths.
1. Records and Procedures Regarding Births and Infant Deaths
In order that information is recorded and available for these vitalevents, principles are given for four types of records.
1.1. Admission Information
The admission record provides the name of the patient and hisaddress in sufficient detail so that the home may be reached if necessary. Inaddition, this record indicates the socio-economic status, that is, the classi-fication for the social service department when there is one in the hospital.If prenatal and postnatal care are provided in an outpatient service, suitable
notations are needed for coordination of these services._
- 16-
1.2. Clinical Obstetrical Record
This clinical record_provides the evolution of the pregnancy,the delivery and the puerperium, lactation, conditions and characteristicsof the product of conception with the number of the corresponding clinicalrecord. Again it is important to establish on the record the exact addresswith reference to the patient.
1.3. Clinical Record of Newborn
This basic clinical record requires the application of thedefinition*of WHO for a live birth. The following are essential data forinclusion:
- For the mother, her name, age, exact address, prenatal care íand number of her clinical record.
- Sex of the infant, date and exact time (hour and minute) of thebirth. If a multiple birth occurs,a clinical record is requiredfor each product with clear indícation of the order of birth.
- Weight and length at birth.
- Number and order of the previous pregnancies with additions formultiple births.
- Clinical data including condition at birth, breast feeding, evolu-tion, congenital anomalies.
- If death occurs, day and exact time (hour and minute), underlyingand associated causes of death and whether an autopsy was performed.
1.4. Individual Card or Sheet for Fach Infant Death and Fetal Death
This card or sheet includes the identifying data with adequateinformation regarding the mother, her address and the underlying and associatedcauses of death.
1.5. Manual of Procedures and Rules
Each hospital develops and places in use a manual which servesto guide the routine activities in respect to records and procedures. A team ofhospital staff, responsible and trained, collects and records data on theseclinical records which are to be preserved for at least one year after death.
2. Hospital Statistics
It is important that the hospital administrators have at all timesexact knowledge of births and deaths in the hospital. Specifically, the hospitaladministrators should receive information daily, weekly and monthly on livebirths, fetal deaths and deaths by age with a periodic evaluation of mortality.
* Definition in Appendix III.
4.
- 17 -
Each hospital ought to prepare and issue certificates of birth, fetal deathand death for the prompt registration of these events in the office of CivilRegistration. It is advisable that the office or an official of CivilRegistration works within the hospital in coordination with the health person-nel in order to carry out effectively this task. When conditions permit, itis advisable that the hospital be responsible for the inscriptions in the officeof Civil Registration.
3. Education and Training
The effective conduct of actions on hospital records requires thesatisfactory preparation of responsible personnel. This includes trainingin several fields and the first is the training of the professionals and stu-dents in health sciences at the pre-and postgraduate levels, including theadministrative personnel. Emphasis is recommended on concepts of multiplecauses of death (underlying and associated) and completion of death certif-icates with utilization of the data in statistical analyses and in research.Inservice training is indicated of personnel in charge of the record systemwith attention to procedures, clinical records and reports. The training ofauxiliary personnel is likewise important for their future responsibilitiesin the system.
Other groups for training are the technical personnel in statistics,voluntary workers assisting in activities in the hospital and officials ofCivil Registration. Also the education of the mothers is important, especiallyregarding the value and benefits of registration.
It is most important to use various methods of dissemination ofinformation in order to establish communication with persons of all levels ofthe community.
C. Maternal and Child Health and Nutrition
The Inter-American Investigation of Mortality in Childhood is providingthe most exact measurement possible of the magnitude of problems of child health
in the study areas. Knowledge of the size of the death rates, of the causesand factors which determine the excessive mortality in the areas of the Inves-tigation is indicating the need for development of actions for solving the highpriority problems within an integrated and coordinated context of maternal andchild health.
The group of principal collaborators considers that the informationobtained is, in general, applicable to the situation of Latin America and thusthe findings of-the Investigation should be considered in the determinationand programing of activities in maternal and child health.
The group considers of greatest importance the following general prin-ciples in the planning of a program of maternal and child health:
1. It is absolutely necessary to rely on information of quality forevaluation of the programs and to develop research programs leading
to the knowledge of the magnitude of the high priority problems and the most
appropriate mechanisms of solutions.
- 18 -
2. A program of medical attention to the mother and child ought tohave clearly defined objectives. The results of the Investigation
indicate the need for promoting optimal nutrition in children and in pregnantand lactating women. They also indicate the need for prevention of infectiousdiseases and for promotion of adequate patterns of reproduction as high pri-ority goals in order to reach optimal levels of growth and development. 4
3. The planning and conduct of a program of maternal and child health -care ought to have a multidisciplinary and intersectorial approach. -
The services ought to take into account the concept of risk at the level ofthe community, family and individual for establishing a better distribution of -resources.
4. The total program of maternal and child health ought to be an inte-gral part of a general health plan. The establishment of goals of
coverage of the components of the program and the establishment of operationalprocedures for the development of activities are considered important. Alsoit is necessary that in each central level in the health services there arepersonnel highly qualified in the field of maternal and child health.
5. The scarcity of resources as well as the size of the vulnerablegroups and the urgent need for extension of health services to the
rural areas require the maximum use of personnel and the active participation
of the community with the focus on well supervised, delegated and simplifiedmedicine. On the other hand, the services of maternal and child health ought
to be continuous, that is, with coordination of prenatal, delivery and post-
partum and postnatal care.
6. The adequate orientation, the efficient conduct and the readjust-ment of programs require operational research and continuous inserv-
ice training of personnel.
Recommendations
On the basis of the previous fundamental principles, the following spec-ified recommendations are made:
1. The prevention and recuperation from nutritional deficiency inmothers and children are considered by the group as activities of
the highest priority. The following actions are recommended:
1.1. Intensive promotion of breast feeding, insisting with the stu-dents of medicine, nursing and public health on the advantages d
of breast milk and developing massive programs of community education includingthe schools.
1.2. Development of effective programs of health and nutritioneducation particularly using practical methods and means
accesible to the vulnerable population. Such programs may or may not include 4components of recuperation and supplementary feeding of the groups of high risk(mothers and children) and ought to include aspects of hygiene and of adequate
techniques of preparation of food.
- 19 -
1.3. The prevention of malnutrition and its recuperation requireeffective control of infective and parasitic diseases. The
prevention of infant diarrhea and diseases as measles are obligatory.
1.4. Orientation and education in aspects of reproduction such asconcept of high risk of very young mothers and the older mothers is an essen-tial component for optimal health for mothers and their products.
1.5. Because of the seriousness of malnutrition in rural areas,the group recommends the extension of programs of prevention
and recuperation in nutrition to the suburban and rural areas.
2. In order to seek an increase in the coverage of services of maternaland child health, the group recommends the application of three
basic principles of health administration.
2.1. Regionalization of health services with the criteria of estab-blishment of graduated levels of medical attention with a
double flow of service and advisory services.
2.2. Integration of preventive and curative services in a functionaland programed manner, and not only by physical linkage of
services, in such a way that there is continuous care to mothers and children.
2.3. Medical attention delegated to auxiliary personnel with ele-mentary preparation in order to extend at least in a minimal
level the health care to all the maternal and child population.
It is undeniable that the promotion of maternal and child health inthe community especially at the level of the groups at high risk is also anessential reason for increasing the demand for timely services.
3. The group recommends that the schools of medicine and public healthand other schools of health sciences conduct research and also give
advice on research (in coordination with health services) oriented to knowledgeof high priority problems of groups of the population at great risk for definingof the most effective methods of application of resources for the solution ofthe problems. Equally, it is highly recommended that teaching institutionsparticipate in inservice training programs of all components of the healthgroup and in integrated programs and community education.
4. The Workshop on Pediatric Pathology promoted by the Investigation wasvery successful and the group recommends that a training program in
this important discipline be developed in one or more centers.
5. The high mortality due to measles indicates the need that all coun-tries carry out the recommendation already made of the meeting of
the Ministers of Health in Buenos Aires (1968) in the development of programsof vaccination against this disease.
6. The group considers of great importance the extension of servicesof environmental health particularly of piped water to all sectors
of the population including rural areas. This measure is an indispensablecomponent in the control of gastrointestinal diseases.
- 20 -
D. Education in Health Sciences
On the basis of the experience during the Inter-American Investigation -of Mortality in Childhood, the group considers important the establishment ofthe following principles and recommendations:
1. The universities and especially the faculties of medicine and sec- stions of health sciences in general are valuable instruments of
change among which the principal objectives are to stimulate community devel- ~opment. -
Toward this end, teaching and research combine their objectivesand procedures, constituting an inseparable whole whose influence on the atti-tude of the student will be reflected in the future in the quality and exten-sion of the provision of services. To consolidate this gain, the action oughtto include all personnel in the health team, placing particular emphasis ontypes of personnel insufficient in number and training. In some areas it willbe necessary to diversify the types of professions, creating, for example,groups of technicians in such fields as electronic computation, which is in-dispensable for the requirements of our programs in the immediate future. Thetraining of health manpower to provide services in the rural areas is a clearnecessity in our countries.
Biosocial research, conducted with similar methodology and principlesused in this Investigation, contributes to the diagnosis of the health situa-tion in a region or country. Such research is valuable to orient policies; itis useful in the development of health plans and programs. Furthermore, itallows universities to design and adapt curricula and plans of studies in thearea of health, according to the needs and real problems of a population. Thecontribution of the results obtained are particularly important in emphasizingthe coordination which should exist between obstetrics and pediatrics, and alsoin demonstrating its methodology as a useful tool for general application.
2. The preparation of students in health sciences requires their full -knowledge and utilization of the scientific method in order for them
to acquire a sound and critical judgment and an investigative attitude. Forthe foregoing a focus is needed on statistical methods which provide in prac-tice quantitative medicine and epidemiology as an indispensable foundation ineducation in the field of health. The physician, as the principal producer ofdata, ought to have knowledge of their handling, utilization and significanceand to know with precision the principles of the natural history of disease andthe multiplicity of causation. This last will enable him to understand thereal contribution of causes of death, on the basis of the concept of associa-tion including the role of biological, social and environmental elements in-separable from certain morbid conditions. Through the use of the concept ofmultiple causation, the application of integrated medicine with emphasis onprevention can be obtained.
- 21 -
3. The limiting concept of the "patient-physician" relationship hasbeen transformed into the broader one of 1"community-health team".
The preparation of health personnel ought to be such as to maintain communitymedicine, with training of auxiliary personnel capable of performing adequatelytheir delegated functions and broadening the health services progressively toall segments of the population.
4. For satisfactory utilization of resources, it is necessary thatthe medical student receive training in basic principles of health
planning and administration.
5. In order to obtain team approach, the health sciences facultieswithin the universities ought to be coordinated.
6. The relationships between universities and health services shouldbecome closer and to this end the following three mechanisms are
recommended. First, the students of health sciences ought to use for instruc-tion not only the university hospital but also the regional hospitals andhealth centers and posts. In this way the student will know the type of medi-cal attention which he will have to provide later. Second, the members of thehealth services ought to perform teaching functions and members of the univer-sity should be members of the sectional councils and technical committees ofthe health services. Third, the results of research and studies carried outby the universities in the community favor coordination for the utilizationof this information by the members of the health services for the developmentof concrete actions for the benefit of the population.
7. Adequate continuation of the efforts undertaken by the differentparticipating teams in the Inter-American Investigation of Mortality
in Childhood should be gained through the creation of teaching centers in thedifferent schools and faculties in which knowledge of the instruments and pro-cedures utilized during this Investigation is projected and multiplied by allmeans possible. All the experiences, including the negative ones which wereencountered, are useful to accelerateknowledge of the solutions to health pro-blems of the population. The possibilities of developing an active interchangeof undergraduate students and professionals through fellowships and programswith adequate assistance ought to be studied.
E. Conclusions and Recommendations for Future Research Programs
The Inter-American Investigation of Mortality in Childhood is pointingout important health problems such as the excessive mortality in nearly all theareas, the serious deficiencies in the systems of health statistics and theimportant role of the various social, biological and environmental factorswhich are related to health problems.
Many of the conditions described and the problems revealed need to becharacterized more completely and it is also necessary to find adequate solu-tions in order to attain the greatest efficiency with the existing resources.
- 22 --
The group of collaborators considers that future research on various aspects :of community health should have high priority and that development of such Lresearch would constitute one of the most important results of this Investiga-tion. The following principles were pointed out to serve as the basis for aresearch policy for the future.
1. Coordinated epidemiological research of the collaborative type ecarried out in the Inter-American Investigation of Mortality in
Childhood ought to be stimulated widely since it leada to the discovery andmeasurement of health problema in different regions and thus enables comparison ~of their relative magnitude and greater comprehension of these problems. Inview of the fact that the factors which affect the health of mothers and chil-dren are multiple and complex and thus require a multisectorial and multidis-ciplinary approach for solution, it is advisable that the health agencies, bothnational and international, and the respective universities exercise jointresponsibility. Emphasis is given to the important role of the Pan AmericanHealth Organization as the agency for promotion and coordination of researchin the Americas.
2. Research of an operational type oriented to the search for effectivesolutions to the most serious health problems ought to receive the
highest priority. In general, agencies such as the Pan American HealthOrganization ought to promote the type of epidemiological research which canbenefit more than one area and, ideally, more than one country. Similar datacan be obtained from studies in several areas which will benefit entire coun-tries and even regions; in other words, knowledge acquired at one site canoften be applied in other areas. The value of these additional investigationsdepends largely on the efforts exerted and the succesa in obtaining data ofthe highest quality. Since one of the most common problems is the lack ofquality in basic data for health planning and other uses, it is necessary toestablish various types of mechanisms for obtaining improvements in the quality J:of the information in both demographic and health aspects.
3. It is considered indispensable that all coordinated research of acollaborative type include a phase of careful planning with a stage -
of pilot testing. The aspects related to determination of samples, methodsand procedures, plans for processing and analysis of results, administration,financing and training of personnel ought to be carefully planned before ini- Vtiation of the principal phase of an investigation. The experience acquiredin these community centered research programs ought to be made known and rutilized for the best direction and management of future epidemiological inves-tigations.
4. The Inter-American Investigation of Mortality in Childhood and thesimilar investigation of mortality of adults have demonstrated that
studies of community health of high quality can be conducted in Latin America.Due to the great impact that this type of research can have on teaching of thehealth sciences and in the orientation of programs, it is highly desirable that
4-
- 23 -
future studies be conducted through coordinated efforts of the universitiesand health services. Furthermore, the group considers it of major importancethat the countries and the Pan American Health Organization establish pro-grams for the preparation of personnel for development of epidemiologicalresearch.
Recommendations
Based on the previous principles as well as on the contributions whichthe two continental investigations of mortality in adults and childhood havemade, the following recommendations are formulated:
1. The group of principal collaborators recommends that the Pan AmericanHealth Organization exercise as a high priority and permanent func-
tion not only the promotion but also the conduct and coordination of researchof the collaborative type in basic health aspects of the community so that theresults of such research may serve for guidance for specific measures. Inthis connection, the group requests that the principles and recommendationson research which were agreed on in this meeting be transmitted for considera-tion by the Advisory Committee on Medical Research of the Pan American HealthOrganization.
2. The group recommends the creation of a center or program for trainingof personnel in epidemiological research. Likewise. it recommends
that the important component of training in research on community health beintroduced. The creation of a system of fellowships for training personnel whowould participate in the development of the several stages of a research pro-gram such as the present one would be a highly effective mechanism for thepromotion of epidemiological research.
3. On the basis of the provisional results of the Investigation, thegroup considers the following broad fields to have high priority for
future research especially as related to maternal and child health.
3.1. Operational Community Studies on Provision of Health Servicesin Maternal and Child Health.
Within this field the following aspects of research are recom-mended to be studied either separately or combined:
- Identification and stratification of the population groupsof high risk (mothers, children, families, etc.), takinginto account biological, socio-cultural and environmentalfactors.
- Measurement of the coverage and quality of health servicesat the prenatal, delivery and postpartum levels as well asof those related with infant health control.
- Determination and evaluation of systems for extension ofhealth services to suburban and rural areas.
- 24 -
3.2. Community Centered Research Oriented to Improvement of -Nutritional Status.
- Studies of factors which determine the patterns of breast -feeding with emphasis on causes of early weaning, takinginto account the nutritional status of the mother, herreproductive history and other biological and social fac- ~tors.
- Studies of methods of developing integrated and efficient -programs in applied nutrition which include health educa-tion in general and nutrition education in particular andsupplementary feeding.
- Study of the causes and characteristics of malnutrition inyoung children taking into account factors such as nutri-tional status of the mother, birth weight, breast feeding,morbidity, environmental and socio-cultural factors.
- Comparative basic studies on the patterns of births bybirth weight and on the causes of differences, consideringbiological and environmental factors. Such studies shouldlead into comparative studies on growth and development.
3.3. Epidemiological Research in the Field of Human Reproduction.
- Studies, ideally of longitudinal type, on the outcome ofpregnancies taking into account biological factors in themother as age, nutritional status, reproductive history, ~practices of family planning as well as social and environ-mental factors. Studies of this type can provide informa-tion on the factors which determine differences in the pat-terns of reproduction apparent in the provisional resultsof the Investigation and also for implementation of programs -oriented to optimal health of mothers and children. e
- Studies on knowledge and attitudes of the parents in rela- ~-tion to aspects of reproduction, such as the size of thefamily, the acceptance of pregnancies and spacing, utiliza-tion of methods of family planning, etc., and evaluation ofprograms involving human reproduction.
4. The group recommends that each collaborator describe the solutions fapplied to operational difficulties encountered in the development
of his project. The experiences could be combined and edited with the additionof recommendations on organization and administration of thistype of communitycentered research. Such a document would aid greatly in the development offuture epidemiological studies and in the training of research staff.
-
- 25 -
VI. FUTURE PLANS
In considering future plans, reference was made first to actionsrecommended by the PAHO Regional Advisory Committee on Health Statisticswhich met on December 6-10, 1971. A strategy was recommended for the rapidimprovement of vital and health statistics in the Americas. As background,the administrative problems in the countries were pointed out as well as thedeficiencies in the preliminary findings in the Inter-American Investigationof Mortality in Childhood - especially in lack of registration and unsatis-factory procedures in hospitals regarding deaths in early life. The Committeerecommended an intensive program - a crash program - to stimulate the countriesto solve the deficiencies.
The principal collaborators in the Investigation can be of great assist-ance in the new intensive program by pointing out the difficulties encounteredand the recommended solutions to the problems. Also they can be of assistancein the program in several other ways, for example, in training programs.
The publication of reports from the Inter-American Investigation ofMortality in Childhood was discussed briefly with emphasis on coordinationbetween the central office and the projects in order to utilize the samebases for rates and to release the same findings. In addition to the publica-tion of the overall comprehensive report in English and Spanish which mustbe completed as soon as possible, other special publications would follow.Excerpts from the first report could be published, as was done in the adultstudy, which could be utilized for wider distribution of the findings and foruse with students. Each principal collaborator was asked to contribute areport utilizing the material of his project.
For adequate distribution of the reports within the countries, the prin-cipal collaborators are the ones to assist through recommendations and localdistributions.
The ultimate success of the Inter-American Investigation of Mortalityin Childhood depends on the resulting actions, especially for the health ofchildren throughout the Continent, which requires the combined efforts of prin-cipal collaborators, health authorities and educators.
APPENDICES: I. List of ParticipantsII. Working Groups for Formulation of Recommendations
III. Definitions
HS-RFebruary 7, 1972
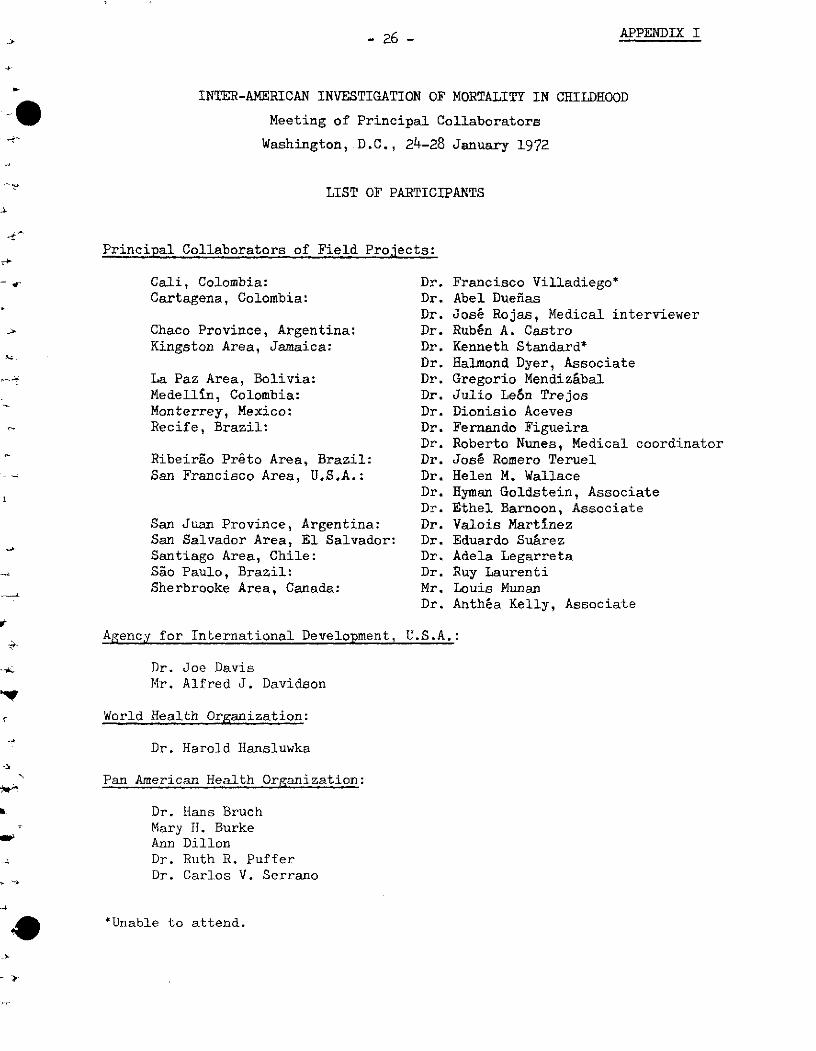
- 26 - APPENDIX I
INTER-AMERICAN INVESTIGATION OF MORTALITY IN CRILDHOOD
Meeting of Principal Collaborators
Washington, D.C., 24-28 January 1972
LIST OF PARTICIPANTS
Principal Collaborators of Field Projects:
Cali, Colombia:Cartagena, Colombia:
Chaco Province, Argentina:Kingston Area, Jamaica:
La Paz Area, Bolivia:Medellin, Colombia:Monterrey, Mexico:Recife, Brazil:
Ribeirao Preto Area, Brazil:San Francisco Area, U.S.A.:
San Juan Province, Argentina:San Salvador Area, El Salvador:Santiago Area, Chile:Sao Paulo, Brazil:Sherbrooke Area, Canada:
Dr.Dr.Dr.Dr.Dr.Dr.Dr.Dr.Dr.Dr.Dr.Dr.Dr.Dr.Dr.Dr.Dr.Dr.Dr.Mr.Dr.
Francisco Villadiego*Abel DueñasJosé Rojas, Medical interviewerRubén A. CastroKenneth Standard*Halmond Dyer, AssociateGregorio MendizábalJulio León TrejosDionisio AcevesFernando FigueiraRoberto Nunes, Medical coordinatorJosé Romero TeruelHelen M. WallaceHyman Goldstein, AssociateEthel Barnoon, AssociateValois MartinezEduardo SuárezAdela LegarretaRuy LaurentiLouis MunanAnthéa Kelly, Associate
Agency for International Development, U.S.A.:
Dr. Joe DavisMr. Alfred J. Davidson
World Health Organization:
Dr. Harold Hansluwka
Pan American Health Organization:
Dr. Hans BruchMary II. BurkeAnn DillonDr. Ruth R. PufferDr. Carlos V. Serrano
*Unable to attend.
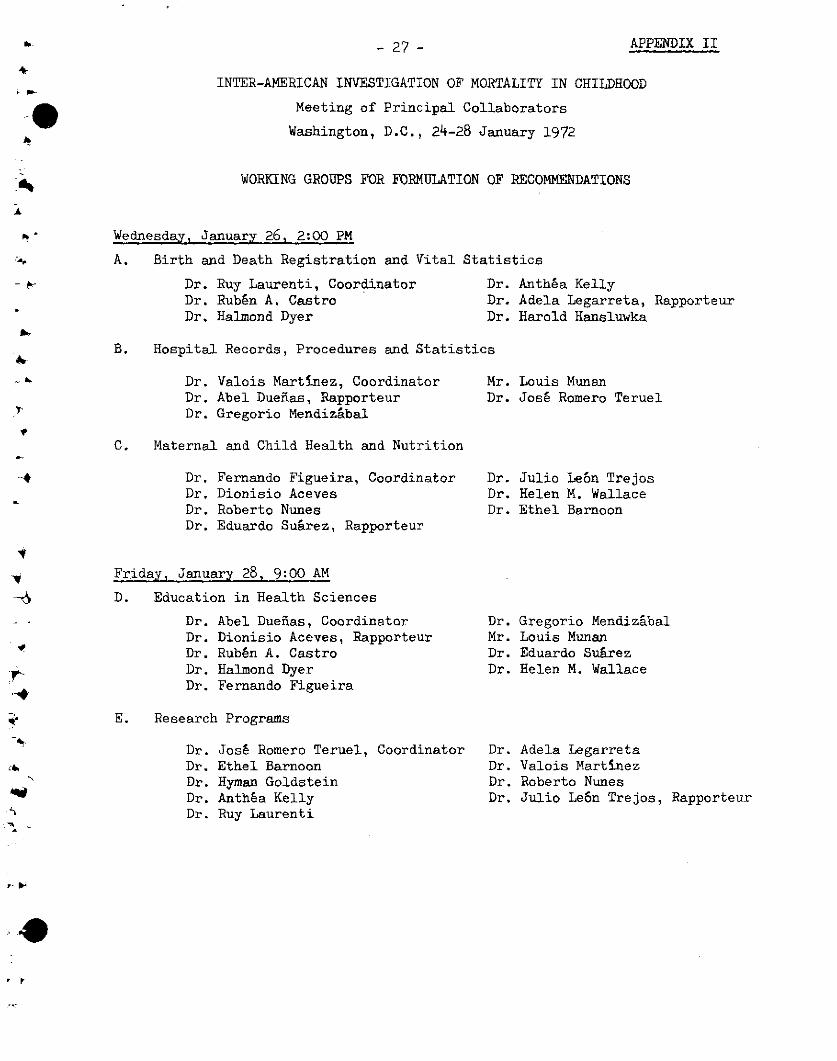
- 27 - APPENDIX II
INTER-AMERICAN INVESTIGATION OF MORTALITY IN CHILDHOOD
Meeting of Principal Collaborators
Washington, D.C., 24-28 January 1972
WORKING GROUPS FOR FORMULATION OF RECOMMENDATIONS
Wednesday, January 26, 2:00 PM
A. Birth and Death Registration and Vital Statistics
Dr. Ruy Laurenti, CoordinatorDr. Rubén A. CastroDr. Halmond Dyer
Dr. Anthéa KellyDr. Adela Legarreta,Dr. Harold Hansluwka
Rapporteur
B. Hospital Records, Procedures and Statistics
Dr. Valois Martinez, CoordinatorDr. Abel Dueñas, RapporteurDr. Gregorio Mendizábal
Mr. Louis MunanDr. José Romero Teruel
C. Maternal and Child Health and Nutrition
Fernando Figueira, CoordinatorDionisio AcevesRoberto NunesEduardo Suárez, Rapporteur
Dr. Julio León TrejosDr. Helen M. WallaceDr. Ethel Barnoon
Friday, January 28, 9:00 AM
D. Education in Health Sciences
Dr.Dr.Dr.Dr.Dr.
Abel Dueñas, CoordinatorDionisio Aceves, RapporteurRubén A. CastroHalmond DyerFernando Figueira
Dr.Mr.Dr.Dr.
Gregorio Mendiz&balLouis MunanEduardo SuárezHelen M. Wallace
E. Research Programs
José Romero Teruel, CoordinatorEthel BarnoonHyman GoldsteinAnthéa KellyRuy Laurenti
Dr.Dr.Dr.Dr.
Adela LegarretaValois MartinezRoberto NunesJulio Le6n Trejos, Rapporteur
Dr.Dr.Dr.Dr.
Dr.Dr.Dr.Dr.Dr.
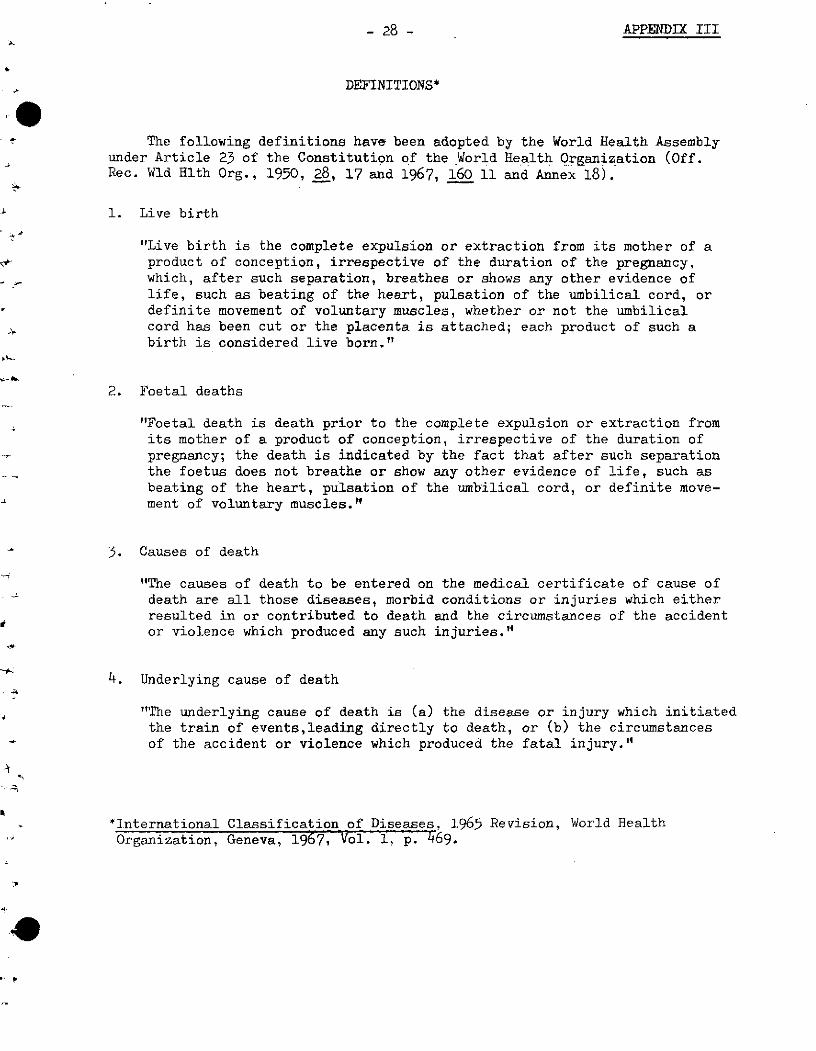
- 28 - APPENDIX III
DEFINITIONS*
The following definitions have been adopted by the World Health Assemblyunder Article 23 of the Constitution of the World Health Organization (Off.Rec. Wld Hlth Org., 1950, 28, 17 and 1967, 160 11 and Annex 18).
1. Live birth
"Live birth is the complete expulsion or extraction from its mother of aproduct of conception, irrespective of the duration of the pregnancy,which, after such separation, breathes or shows any other evidence oflife, such as beating of the heart, pulsation of the umbilical cord, ordefinite movement of voluntary muscles, whether or not the umbilicalcord has been cut or the placenta is attached; each product of such abirth is considered live born."
2. Foetal deaths
"Foetal death is death prior to the complete expulsion or extraction fromits mother of a product of conception, irrespective of the duration ofpregnancy; the death is indicated by the fact that after such separationthe foetus does not breathe or show any other evidence of life, such asbeating of the heart, pulsation of the umbilical cord, or definite move-ment of voluntary muscles."
3. Causes of death
"The causes of death to be entered on the medical certificate of cause ofdeath are all those diseases, morbid conditions or injuries which eitherresulted in or contributed to death and the circumstances of the accidentor violence which produced any such injuries."
4. Underlying cause of death
"The underlying cause of death is (a) the disease or injury which initiatedthe train of events,leading directly to death, or (b) the circumstancesof the accident or violence which produced the fatal injury."
*International Classification of Diseases, 1965 Revision, World HealthOrganization, Geneva, 1967, Vol. 1, p. 469.
INTER-AMERICAN INVESTIGATION OF MORTALTY IN CHILW OOD
FIRST YEAR OF INVESTIGATION
PROVISIONAL REPORTSeptember 1971
PAN AMERICAN HEALTH ORGANIZATIONPan American Sanitary Bureau - Regional Office of the
WORLD HEALTH ORGANIZATIONWashington, D.C., U.S.A.
INTER-AMERICAN INVESTIGATION OF MORTALITY IN CHILDHOOD
FIRST YEAR OF INVESTIGATION
PROVISIONAL REPORTSeptember 1971
PAN AMERICAN HEALTH ORGANIZATIONPan American Sanitary Bureau - Regional Office of the
WORLD HEALTH ORGANIZATIONWashington, D.C., U.S.A.
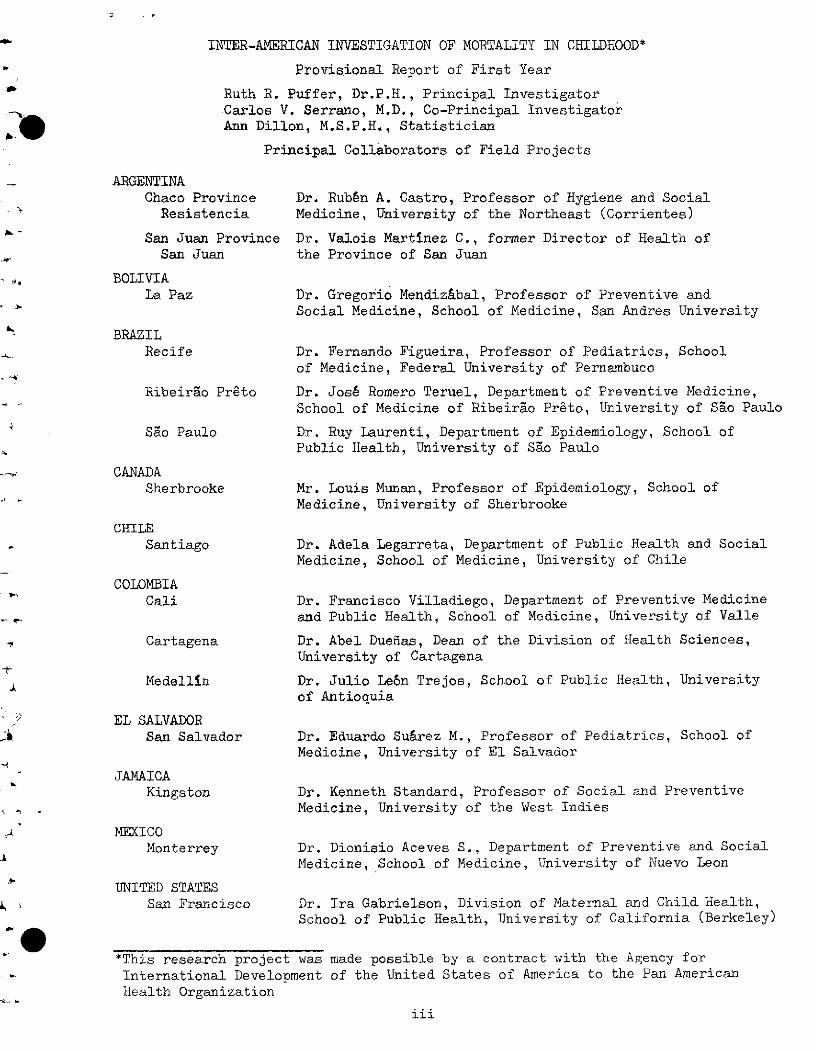
INTER-AMERICAN INVESTIGATION OF MORTALITY IN CHILDHOOD*
Provisional Report of First Year
Ruth R. Puffer, Dr.P.H., Principal InvestigatorCarlos V. Serrano, M.D., Co-Principal InvestigatorAnn Dillon, M.S.P.H., Statistician
Principal Collaborators of Field Projects
ARGENTINAChaco Province
Resistencia
San Juan ProvinceSan Juan
BOLIVIALa Paz
BRAZILRecife
Ribeirao Preto
Sáo Paulo
CANADASherbrooke
CHILESantiago
COLOMBIACali
Cartagena
Medellin
EL SALVADORSan Salvador
JAMAICAKingston
MEXICOMonterrey
UNITED STATESSan Francisco
Dr. Rubén A. Castro, Professor of Hygiene and SocialMedicine, University of the Northeast (Corrientes)
Dr. Valois Martinez C., former Director of Health ofthe Province of San Juan
Dr. Gregorio Mendiz&bal, Professor of Preventive andSocial Medicine, School of Medicine, San Andres University
Dr. Fernando Figueira, Professor of Pediatrics, Schoolof Medicine, Federal University of Pernambuco
Dr. José Romero Teruel, Department of Preventive Medicine,School of Medicine of Ribeirao Preto, University of Sao Paulo
Dr. Ruy Laurenti, Department of Epidemiology, School ofPublic Health, University of Sao Paulo
Mr. Louis Munan, Professor of Epidemiology, School ofMedicine, University of Sherbrooke
Dr. Adela Legarreta, Department of Public Health and SocialMedicine, School of Medicine, University of Chile
Dr. Francisco Villadiego, Department of Preventive Medicineand Public Health, School of Medicine, University of Valle
Dr. Abel Dueñas, Dean of the Division of Health Sciences,University of Cartagena
Dr. Julio Le6n Trejos, School of Public Health, Universityof Antioquia
Dr. Eduardo Suárez M., Professor of Pediatrics, School ofMedicine, University of El Salvador
Dr. Kenneth Standard, Professor of Social and PreventiveMedicine, University of the West Indies
Dr. Dionisio Aceves S., Department of Preventive and SocialMedicine, School of Medicine, University of Nuevo Leon
Dr. Ira Gabrielson, Division of Maternal and Child Health,School of Public Health, University of California (Berkeley)
*This research project was made possible by a contract with the Agency for
International Development of the United States of America to the Pan American
Health Organization
iii
-4
3 .
Assistance in classification of medical data and multiple causes of deathhas been rendered by the following: .- 4
Dr. Dario Curiel, Professor of Hygiene and Social Medicine, Razetti Schoolof the Faculty of Medicine, Central University of Venezuela;
Dr. Ruy Laurenti, principal collaborator of Sao Paulo, Brazil;
Dr. Roberto Nunes, associate collaborator of Recife, Brazil;
Dr. Valois Martínez C., principal collaborator of San Juan, Argentina; and,
Dr. Carlos A. Sagastume, associate collaborator of San Salvador, El Salvador.
L
Explanation of symbols
Quantity zero ................................
Quantity more than zero but less than 0.05 ... 0.0
iv
la IW
INTER-AMERICAN INVESTIGATION OF MORTALITY IN CHILDHOOD
Provisional Report of First Year
Table of Contents
Page
INTRODUCTION ........................................ .......... 1
I. FIFTEEN PROJECTS IN THE AMERICAS . .......... ............ 5
II. QUALITY OF INFORMATION ..................................... 9
III. MORTALITY IN CHILDREN UNDER 5 YEARS OF AGE ................. 15
Mortality by Age Group ... 15Mortality by Causes .................... *......... 24
*~~~~ ^ Infant Mortality ............................... ......... 27Neonatal Mortality .......................... 36..... 36Mortality in Early Childhood ............................ 47Infectious Diseases....... 53Nutritional Deficiency ................................. 61Congenital Anomalies .................................. . 68Other Specific Causes .................................. 71
IV. MEDICAL AND HEALTH SERVICES ................................ 77
Prenatal Care ............ .............................. 77Place of Birth ........................................ 81Place of Death ......................................... 84
Vaccinations ............................................ 87
*) V. SOCIO-CULTURAL AND BIOLOGICAL FACTORS ...................... 91
Marital Relationship of Parents ........................ 91Age of Mother and Birth Order ................. 93
r, _Outcome of Previous Pregnancies ....................... 102Education of the Mother ...... .......................... 106Breast Feeding ......................... ................ 108
VI. ENVIRONMENTAL CONDITIONS ............................... ...... 113
Water Supplies ........................................ 113Toilet Facilities ........... .......................... . 116Housing Conditions ........................ ..... 118
VII. UTILIZATION OF RESULTS ... ......... ........ 123
, REFERENCES ............................. 129
C _L APPENDIX ........................................................... 131
INTER-AMERICAN INVESTIGATION OF MORTALITY IN CHILDHOOD
Provisional Report of First Year
The development of continental, coordinated research on mortality inchildhood in selected, widely separated areas of the Americas was a recom-mendation from the earlier research on mortality in adults(1)as a satisfac-
tory method of gaining greater understanding of the health problems in- infancy and early childhood. Such knowledge was considered essential for
reaching goals such as the one contained in the Charter of Punta del Esteof reducing the mortality of children under 5 years of age by 50 per centwithin a period of 10 yearsj2)
The current Investigation of Mortality in Childhood(3)was planned and
is being developed with the overall objective of determining death rates in
infancy and early childhood which are as accurate and comparable as possible.Other specific objectives are defined as follows:
- To investigate the effect of nutritional, socio-biological and
environmental factors on mortality under 5 years of age.
- To analyze the multiple causes of death (underlying and asso-
ciated causes) of children under 5 years of age and to studyinterrelationships such as those existing between infectious
diseases, nutritional deficiency states and socio-biologicalfactors.
- To study biologic and sociologic differences in children who die
in infancy and early childhood and in those who live.
- To provide sound material for improvement of maternal and childhealth programs and for use in teaching programs of schools of
ef- medicine and of public health.
The field work of data collection in each project has been developed
along three main lines of activity carried out simultaneously, utilizingstandard definitions and uniform procedures. The three types of data col-lected are 1) deaths of children under 5 years of age who were residents of
the areas; 2) a probability sample of households and living children under
5 years of age; and 3) records of births to residents of the area.
For the study of deaths the starting point was the detection of all
such vital events by the team of the Investigation, using all the official
and non-official sources available in each area. A home visit was made to
the family by a public health nurse or a social worker with the purpose of
obtaining information on environmental conditions, family composition, pre-vious deaths in the household, reproductive history of the mother of the
study child, age, education and occupation of the parents, nutritional his-
tory and summary of medical attention provided to the study child from birth
2
to death. A physician interviewer collected all pertinent medical informa-tion available from hospitals, clinics, private physicians and autopsy recordsas well as from the family of the dead child when considered necessary. Themedical part of the official death certificate was transcribed and the ques-tionnaire was completed with a final summary and a statement of the multiplecauses. The phase of data collection of deaths extended over a period of 24consecutive months.
For the study of households and living children in the area data were ~obtained from a pre-selected sample, collected in monthly portions during thesame 24 months as the study of deaths. Applicable information was obtainedfor each family by a public health nurse or a social worker, similar to thatcollected for the families of dead children, as well as data related to themedical and nutritional history of each living child under 5 years of age.
Information regarding births was obtained from hospitals and clinicsas well as from official vital statistics reports in order to determine asaccurately as possible the number of births to residents of the area duringthe study period. Such information is indispensable for calculation of deathrates in infancy.
Insuring the necessary high quality of information in the variousaspects and levels of the phase of data collection has presented challengingproblems which will be discussed in the section on quality of the information.The intensive efforts necessary to solve such problems, especially with regardto completeness of the collection process for deaths, have resulted in unavoid-able delays in the termination of this phase of the Investigation.
The approach of comprehensive analysis including determination of themultiple causes and related factors involved in mortality constitutes an out-standing feature of this Investigation. It enables a detailed and full de-scription of the morbid conditions leading to death in childhood and the rec-ognition of high risk groups. This knowledge will make possible sound recom-mendations for actions needed to reduce mortality and improve the conditionof survivors.
The comparison between urban, suburban and rural communities includedin the Investigation is revealing important differences that will contributeto a better understanding of the causes and factors determining the patternsof mortality. These data indicate higher mortality in rural areas than incities and the need for extension of health programs into rural areas.
Since data are practically complete for nearly all areas for the firstyear, preliminary analyses have been made and provisional results are pre-sented. The purpose of this report is to review the tabulations and analysesto ensure that the data are as complete and accurate as possible, as well asto promote the utilization of the results in local, national and internationalhealth programs. Thus, the data presented are provisional; additional deathsmay be discovered and included in the final report; the presentation of resultsof the projects may be improved; and other changes as well as additional anal-yses are planned for the final report. Already the Investigation has stimulated
improvements in local procedures. ilowever, it .i,: hoped that this repor will]serve as the basis for many actions, especially in thte fields of maternal andchild health and vital and hospital statistics. Also, this report indicatesfields for additional research leading to the determination of practical meth-ods for prevention of the serious problems revealed by the Investigation, ofwhich nutritional deficiency states seem to be the most outstanding and theone requiring highest priority.

5
í. I. FIFTEEN PROJECTS IN THE AMERICAS
Fifteen projects, widely separated in 10 countries of the Americas,have been developed in which the standard protocol and procedures of theInter-American Investigation of Mortality in Childhood have been followed.The locations of these projects are shown on a map of the Americas (Figure 1).Six of the projects are limited to cities, in four of which only a sample ofthe deaths under 5 years of age were studied. The six cities and the corre-sponding selection of deaths of residents for study in the first year of theInvestigation are as follows:
Cali, Colombia - Sample of 1 in 2 deathsCartagena, Colombia - All deathsMedellin, Colombia - Sample of 1 in 3 deathsMonterrey, Mexico - All deathsRecife, Brazil - All deaths of three districts,
Beberibe, Casa Amarela, EncruzilhadaSao Paulo, Brazil - Sample of 1 in 4.25 deaths
The projects in Colombia were selected to provide data for the threedistinctly different regions of the country, the Pacific, Caribbean andCentral regions. Because of the values in teaching, involvement of the
Faculties of Medicine in Cali and Cartagena and the Faculty of the Schoolof Public Health in Medellin through relatively small projects seemed pref-erable to one large project in Colombia.
The other nine projects include, in addition to the central city,suburban communities and rural areas in which deaths of all residents arestudied; the subdivisions of these projects are as follows:
Chaco Province, Argentina
Resistencia (San Fernando Department)Six rural departments (Comandante Fernández, General Donovan,
Libertad, Presidencia de la Plaza, lo. de Mayo, Quitilipi)
Kingston Area, Jamaica
Kingston and St. Andrew Parish, urban
St. Andrew Parish, rural
La Paz Area, Bolivia
La PazViacha (small community on Altiplano)
Ribeirao Preto Area, Brazil
Ribeirao PretoFranca (small community)Five rural communities (Batatais, Brodosqui, Cravinhos,
Jardin6polis, Sertáozinho)
6
San Francisco Area, United States
San FranciscoSuburban area (parts of three counties, Alameda,
Contra Costa, San Mateo)
San Juan Province, Argentina
San Juan (Capital Department) -ISuburban departments (Chimbas, Rawson, Rivadavia,
Santa Lucía)Rural departments (Rest of Province) -
San Salvador Area, El Salvador
San SalvadorRural communities (Apopa, Nejapa, Quezaltepeque)
Santiago Area, Chile
Santiago - sample of 1 in 5 deaths for first 8 monthsand 1 in 3 deaths for last 4 months
Suburban communities (Colina, Lampa, Quilicura, Til-Til)
Sherbrooke Area, Canada
SherbrookeDesignated area of Eastern Townships
The 15 central cities vary in population from slightly over one hun-dred thousand to over 5 million. Likewise, the 11 other areas vary in sizefrom the small community of Viacha, Bolivia, of 10,000 population to largersuburban and rural areas in the projects in Argentina, Canada and the UnitedStates. The numbers of live births for the year and the estimated popula-tions for the mid-period are needed for these other areas as well as for thecentral cities. In those areas in which a sample of deaths was taken thesize of the population and the number of live births have been reduced pro-portionally to that of the sample. For example, the sample for Cali is onein two deaths and thus the population base is one-half the estimated popula-tion and the number of live births is one-half the births in the year.
The 13 projects in Latin America were started in 1968 in -the iollow-ing months: 2 projects in June, 7 in July, 3 in August and 1 project inSeptember. The San Francisco project was initiated in June 1969 and theSherbrooke project in January 1970. At this time complete data for the -first year of the latter two projects are not available for analysis. Table 1 con-tains data for the 13 Latin American projects regarding the area, the selec-tion of deaths and the time period, as well as the estimated bases for the _
calculation of death rates and the provisional numbers of deaths for thefirst year. The population estimates and numbers of live births are sub-ject to revision on the basis of the censuses taken in -the 1970 census periodand on additional information on live births in the areas of thc projects.
O5
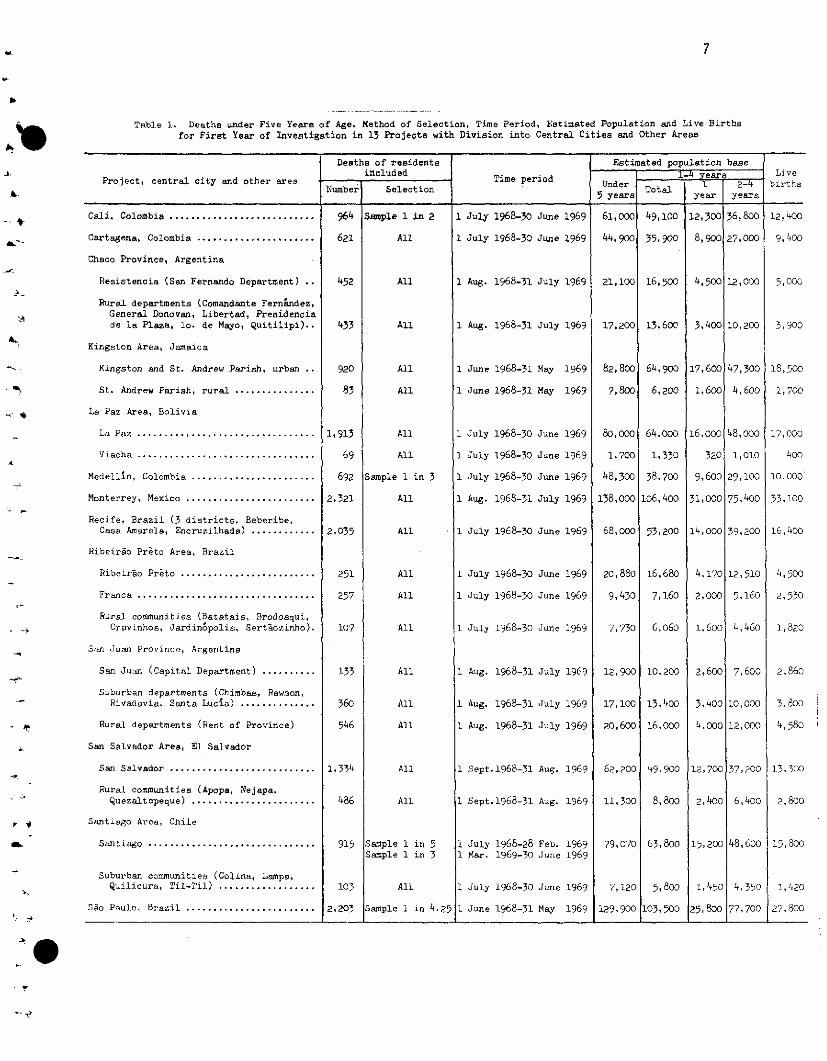
7
Table 1. Deathe under Five Years of Age, Method of Selection, Time Period, Estimated Population and Live Birthsfor Firet Year of Investigation in 13 Projecte with Division into Central Cities and Other Areas
Deaths of residents Estimated population base
Project, central city and other area included Time period 1-4 bis LiveNumber Selection nder Total
5 years year years
Cali, Colombia ...........................
Cartagena, Colombia ......................
Chaco Province, Argentina
Resistencia (San Fernando Department) ..
Rural departments (Comandante Fernández,General Donovan, Libertad, Presidenciade la Plaza, lo. de Mayo, Quitilipi)..
Kingston Area, Jamaica
Kingston and St. Andrew Parish, urban ..
St. Andrew Parish, rural ...............
La Paz Area, Bolivia
La Paz .................................
Viacha .................................
Medellin, Colombia .......................
Monterrey, Mexico ........................
Recife, Brazil (3 districts, Beberibe,Casa Amarela, Encruzilhada) ............
Ribeirao Preto Area, Brazil
Ribeirao Preto .........................
Franca .................................
Rural communities (Batatais, Brodosqui,Cravinhos, Jardin6polis, Sertaozinho).
Sanr Juan Province, Argentina
San Juan (Capital Department) ..........
Suburban departments (Chimbas, Rawson,Rivadavia, Santa Lucia) ..............
Rural departments (Rest of Province)
San Salvador Area, El Salvador
San Salvador ..........................
Rural communities (Apopa, Nejapa,Quezaltepeque) .......................
Santiago Area, Chile
Santiago ..............................
Suburban communities (Colina, Lampa,Quilicura, Til-Til) ..................
Sao Paulo, Brazil ........................
964
621
452
433
920
83
1,913
69
692
2,321
2,035
251
257
107
133
360
546
1,334
486
915
103
2,203
Sample 1 in 2
All
All
All
All
All
All
All
Sample 1 in 3
All
All
All
All
All
All
All
All
All
All
Sample 1 in 5Sample 1 in 3
All
1 July 1968-30 June 1969
1 July 1968-30 June 1969
1 Aug. 1968-31 July 1969
1 Aug. 1968-31 July 1969
1 June 1968-31 May
1 June 1968-31 May
1 July 1968-30 June
1 July 1968-30 June
1 July 1968-30 June
1 Aug. 1968-31 July
1969
1969
1969
1969
1969
1969
1 July 1968-30 June 1969
1 July
1 July
1968-30 June 1969
1968-30 June 1969
1 July 1968-30 June 1969
1 Aug. 1968-31 July 1969
1 Aug.
1 Aug.
1968-31 July 1969
1968-31 July 1969
1 Sept.1968-31 Aug. 1969
1 Sept.1968
-31 Aug. 1969
1 July 1968-28 Feb. 19691 Mar. 1969-30 June 1969
1 July 1968-30 June 1969
Sample 1 in 4.25 1 June 1968-31 May 1969
61,000
44,900
21,100
17,200
82,800
7,800
80,000
1,700
48,300
138,000
49,100
35,900
16,500
13,600
12,300
8,900
36,800
27,000
4,500 12,000
3,400 10,200
12,400
9,400
5,000
3,900
64,900 17,600 47,300 18,500
6,200 1,600 4,600 1,700
64,000
1,330
38,700
106,400
68,000o 53,200
20,880
9,430
7,730
16,680
7,160
6,060
12,9001 10,200
17,100
20,600
13,400
16,000
62,2001 49,900
11,3001 8,800
79,070
7,120
129,900
63,800
5,800
103,500
16,000
320
9,600
31,000
14,000
4,170
2,000
1,600
2,600
3,400
4,000
48,000
1,010
29,100
75,400
39,200
12,510
5,160
4,460
7,600
10,000
12,000
12,700137,200
2,4001 6,400
17,000
400
10,000
33, 100
16, 4oo
4,500
2,530
1,820
2,860
3,800
4,580
13, 300
2,800
115,200148,600 115,800
1,4501 4,350 1,420
25,800 77,700 27,800
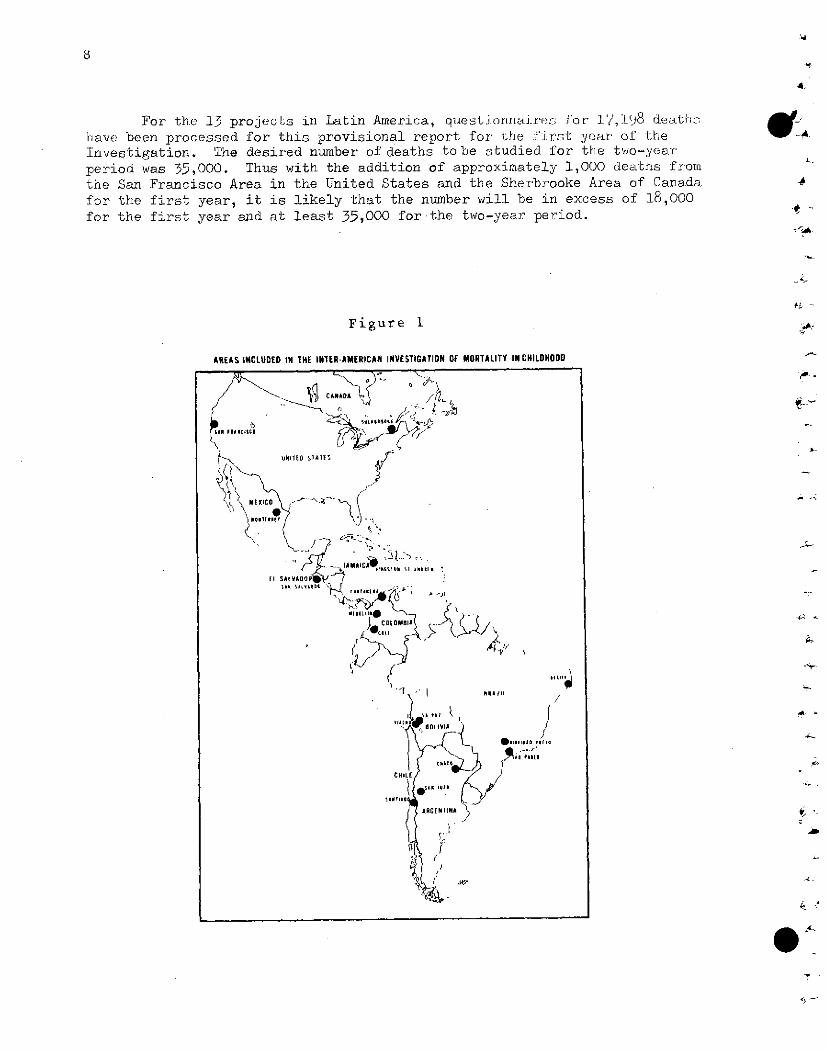
For th.e 13 projects in Latin Arnerica, quest.iornnire::; for 1'/,198 deathlflhave been processed for this provisional report for Lthe first year of theInvestigation. The desired number of deaths tobe studied for the two-yearperiod was 355,000. Thus with the addition of approximately 1,000 deaths from
the San Francisco Area in the United States and the Sherbrooke Area of Canada
for the first year, it is likely that the number will be in excess of 18,000
for the first year and at least 35,000 for the two-year period. *'
Figure 1
AREAS INCLUDED IN THE INTER-AMERICAN INVESTIGATION OF MORTALITY IN CHILDHOOD
SAN IR CAAcoA
El SALV DR
,SA SAI4A.'O {A,,-.
|CAOL eoIA
' /. ..... .
% / ja'- 3 +
9
II. QUALITY OF THE INFORMATION
To attain the goal of death rates in infancy and childhood as accu-rate and comparable as possible requires information on all deaths under 5years of age in each area. This has proved to be a far greater challengethan originally visualized. Many deaths in the first few hours and days oflife are not registered and are difficult to find. In several projects theprincipal collaborators have been and are continuing to search for missingdeaths. Early in the Investigation one principal collaborator realizedthat he had not found all the deaths in early life; he thought that theremust be a clandestine cemetery in his area. To his surprise he discoveredthat the "clandestine cemetery" was in the central hospital, where unreg-istered deaths were found through reviewing notations in the delivery book.Another principal collaborator was amazed to learn, after the Investigationwas practically complete, that the obstetric nurse maintained her own bookof vital events. This book contained information about deaths occurring soonafter birth which were not included in the hospital statistics nor in theInvestigation. These searches for unregistered deaths have necessitateddelays in processing and analyzing the material. However, this emphasis onquality is a required component of research, and if additional deaths can befound, they will be included in the final report! Comparisons of resultsamong the projects indicate certain deficiencies in completeness of the datain a few projects which are apparent in the interpretation of the material.
Although the primary source of information regarding the occurrenceof a death was the death certificate, in the planning phase it was recog-nized that some of the deaths would not be registered and that other meansof knowing about them should be incorporated into the local procedures.Registration of deaths was believed to be nearly complete in cities but lesscomplete in rural areas. However, it was soon discovered that deaths inearly life without registration either as births or deaths were occurring inhospitals in the cities, even in university hospitals. Tabulations from theprobability sample of households of their members (the population) and thevital events in the 12 months prior to the household interview proved useful
in estimating birth and death rates in the population and, thus, for judgingthe accuracy of death rates in the Investigation. Also, another useful meas-ure was the level of the death rate in the first 24 hours of life. In theUnited States this death rate has been reduced from a higher level to approx-imately 10 dea s per 1,000 live births and has remained at this level forseveral years.i Actions already taken in this field are described in thenote prepared for the WHO Consultation on Fetal, Infant and Childhood Mortal-ity.(5)
*Since the tabulations were prepared for this report, 9 additional question-naires have been received for deaths in the first year in Medellín, mainlydeaths without registration. In San Juan, the principal collaborator hasobtained information indicating 35 additional deaths in the first year.
10
In all projects search for all deaths under 5 years of age was recom-mended. Although the WHO definition* of a live birth was to be used irre-spective of local laws and practice, the registration as a fetal death of aliveborn child who died shortly after birth was a possible source of a missingneonatal death. In several areas investigations were made of fetal deathsto determine if, in fact, any of those deaths were actually deaths of live-
born children which should be included in the Investigation. This was doneroutinely in La Paz and on a sample basis in Santiago, Sao Paulo and Cali. -In all of these projects, unregistered deaths of liveborn children were dis-covered from this activity, with La Paz being more productive than the otherareas.
Other sources of checking for unregistered deaths were the recordsof the Investigation, the questionnaires for the deaths and for the sample
of households. For example, each death of a liveborn product of a multiplepregnancy should have been included in the file of deaths from which thedeaths to be investigated (all in some areas and only a sample in others) A
were drawn. Often, however, although both twins may have died only one
death certificate had been filed. From the reproductive histories of the
mothers and from the section on deaths in the past year, information was
available for deaths eligible to be included in the Investigation. Also,deaths under 5 years of age reported in the sample of households as having
occurred during the time period of the Investigation were checked againstthe death file and a few such deaths were added from this source, notablyin Recife and La Paz.
Careful checking to assure inclusion of all deaths under 5 years of
age during the period of the Investigation was encouraged in all of the pro-
jects. The extent and intensity of the checking varied with the projects.In those cities in which the deaths were selected by sampling, as in Cali,Medellin, Santiago and Sao Paulo, search for deaths without registrationproved complicated and the results cannot be measured as well as in the otherprojects.
Special mention must be made of the Kingston project. There deathsin hospitals were reported immediately to the local staff and were the source
of information for the home visits by nurses. The completed questionnaireswere matched with death certificates in the final phase of the Investigation.Some death certificates in Jamaica are filed many months after the death, due
*"Live birth is the complete expulsion or extraction from its mother of a
product of conception, irrespective of the duration of the pregnancy, which,
after such separation, breathes or shows any other evidence of life, such
as beating of the heart, pulsation of the umbilical cord, or definite move-ment of voluntary muscles, whether or not the umbilical cord has been cutor the Vlacenta is attached; each product of such a birth is considered liveborrn."(
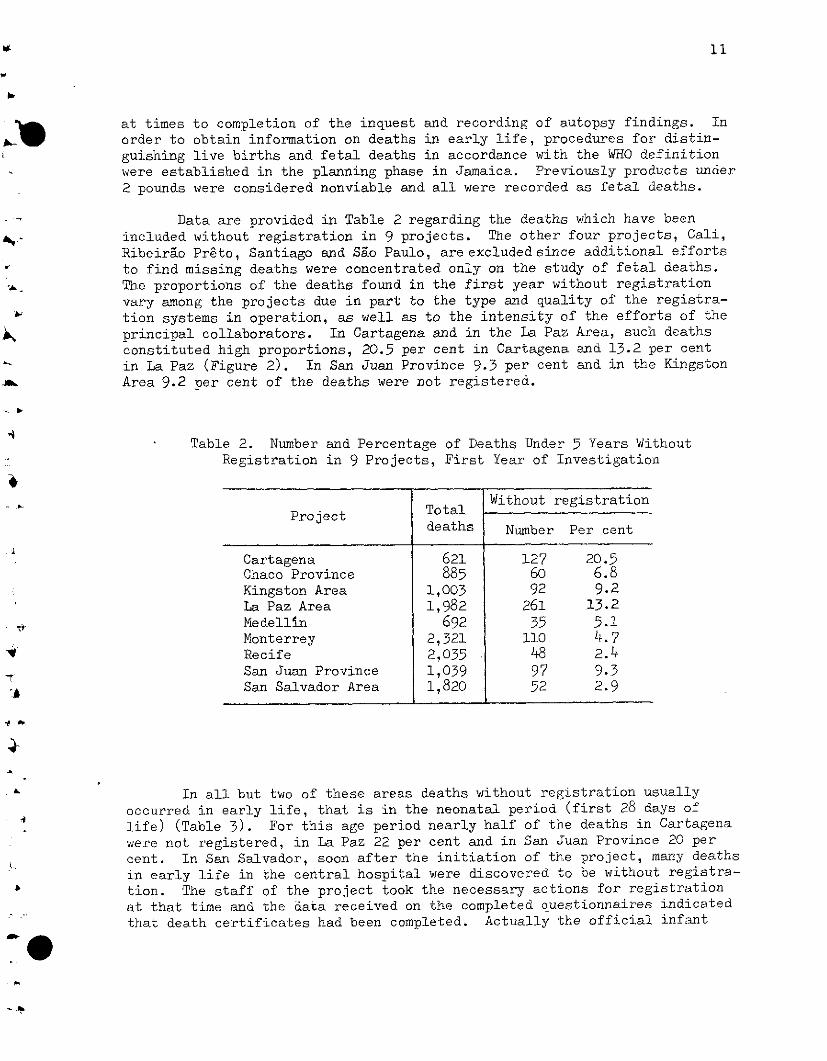
11
at times to completion of the inquest and recording of autopsy findings. In
W_~ _order to obtain information on deaths in early life, procedures for distin-guishing live births and fetal deaths in accordance with the WHO definitionwere established in the planning phase in Jamaica. Previously products under2 pounds were considered nonviable and all were recorded as fetal deaths.
Data are provided in Table 2 regarding the deaths which have been
included without registration in 9 projects. The other four projects, Call,
Ribeirao Preto, Santiago and Sao Paulo, are excludedsince additional efforts
to find missing deaths were concentrated only on the study of fetal deaths.
The proportions of the deaths found in the first year without registrationvary among the projects due in part to the type and quality of the registra-
tion systems in operation, as well as to the intensity of the efforts of the
principal collaborators. In Cartagena and in the La Paz Area, such deathsconstituted high proportions, 20.5 per cent in Cartagena and 13.2 per cent
in La Paz (Figure 2). In San Juan Province 9.3 per cent and in the Kingston
iras Area 9.2 per cent of the deaths were not registered.
Table 2. Number and Percentage of Deaths Under 5 Years WithoutRegistration in 9 Projects, First Year of Investigation
Without registrationProjectoa
deaths Number Per cent
Cartagena 621 127 20.5Chaco Province 885 60 6.8Kingston Area 1,003 92 9.2La Paz Area 1,982 261 13.2Medellin 692 35 5.1Monterrey 2,321 110 4.7Recife 2,035 48 2.4San Juan Province 1,039 97 9.3San Salvador Area 1,820 52 2.9
In all but two of these areas deaths without registration usually
occurred in early life, that is in the neonatal period (first 28 days of
life) (Table 3). For this age period nearly half of the deaths in Cartagenawere not registered, in La Paz 22 per cent and in San Juan Province 20 per
cent. In San Salvador, soon after the initiation of the project, many deaths
in early life in the central hospital were discovered to be without registra-
tion. The staff of the project took the necessary actions for registration
at that time and the data received on the completed questionnaires indicated
that death certificates had been completed. Actually the official infant
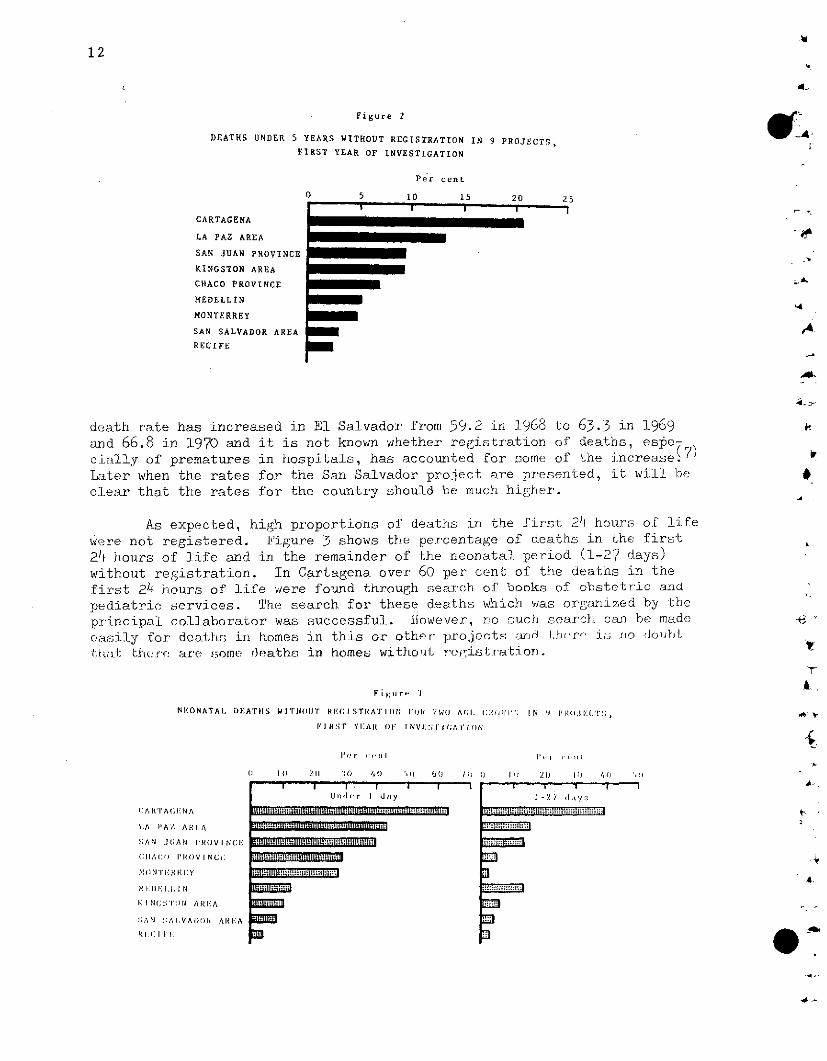
Figure 2
DEATHS UNDER 5 YEARS WITHOUT REGISTRATION IN 9 PROJECTS,
FIRST YEAR OF INVESTIGATION
Per cent
CARTAGENA
LA PAZ AREA
SAN JUAN PROVINCE
KINGSTON AREA
CHACO PROVINCE
MEDELLIN
MONTERREY
SAN SALVADOR AREA
RECIFE
O 15 20 25
A.
£4
4,- ,
death rate has increased in El Salvador from 59.2 in 1968 to 63.3 in 1969and 66.8 in 1970 and it is not known whether registration of deaths, espe-cially of prematures in hospitals, has accounted for some of the increase. 7 )
Later when the rates for the San Salvador project are presented, it will beclear that the rates for the country should be much higher.
As expected, high proportions of deaths in the first 24 hours of lifewere not registered. Figure 3 shows the percentage of deaths in the first24 hours of life and in the remainder of the neonatal period (1-27 days)without registration. In Cartagena over 60 per cent of the deaths in thefirst 24 hours of life were found through search of books of obstetric andpediatric services. The search for these deaths which was organized by theprincipal collaborator was successful. However, no such search can be madeeasily for deathi.; in homes in this or other' projectn ,nd h,¡r', i:.; fio Idoilbt+l:;t t;hrre are some *leaths in homes withou-l relgistratiorn.
Fi:jur, 3
NE.ONATAL DEATrlS WlT1lOUT REI(;ISTTRAT ION ,'oR 'WO( Ar;I :liul IN 'I i'
I:RS'I YlAR í fl INVl:'I ¡<(;ATION
{' r (.1eil 1' , 1
II) 2I 1 ( 4) '. (1,0 /0i ) 1 2) II) /,0) ',o
C A RTIA( 1: NA
I.A IAZ ARHI.A
';AN JUAN I;<lOVINC:l.
CIIA<: I'ROV I NCI:
M() N'I'I: R E Y
MI.: I1) I1. II I N
I N(;;' '(>N A; I:A
:;AN S;AI.VAI)>)R ARII:A
RI:C l 1F 1
u r 1 d·Unidc r I daiy
~~mnniir~~~rl'1mii~~ü~l lIii ~Riliii
1 U y
1 -2/ daly:;
3
3
12
.?J
&
4-
- -
_ _ _ _·I
m
A
i i i
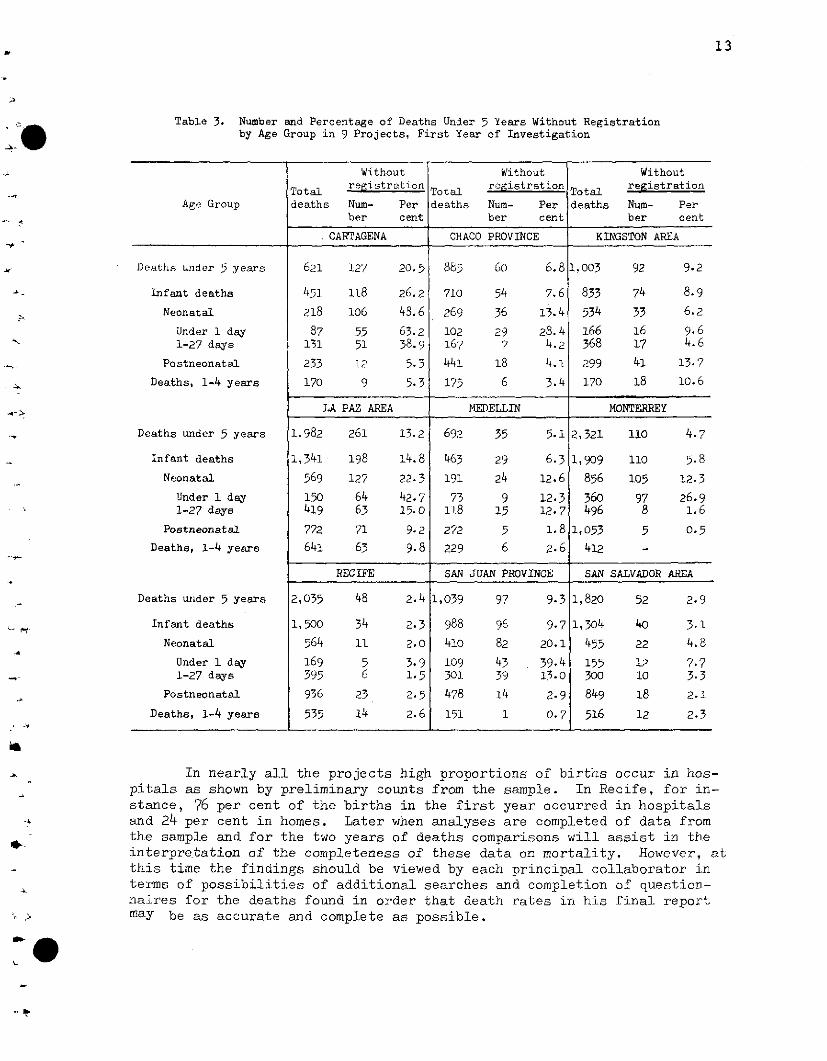
13
Table 3. Number and Percentage of Deaths Under 5 Years Without Registrationby Age Group in 9 Projects, First Year of Investigation
Without Without WithoutTotal registration Total registration Total registration
Age Group deaths Num- Per deaths Num- Per deaths Num- Perber cent ber cent ber cent
CARTAGENA CHACO PROVINCE KINGSTON AREA
Deaths under 5 years 621 127 20.5 885 60 6.8 1,003 92 9.2
Infant deaths 451 l18 26.2 710 54 7.6 833 74 8.9
Neonatal 218 106 43.6 269 36 13.4 534 33 6.2
Under 1 day 87 55 63.2 102 29 28.4 166 16 9.61-27 days 131 51 38.9 167 7 4.2 368 17 4.6
Postneonatal 233 12 5.3 441 18 4.1 299 41 13.7
Deaths, 1-4 years 170 9 5.3 175 6 3.4 170 18 10.6
LA PAZ AREA MEDELLIN MONTERREY
Deaths under 5 years 1,982 261 13.2 692 35 5.1 2,321 110 4.7
Infant deaths 1,341 198 14.8 463 29 6.3 1,909 110 5.8
Neonatal 569 127 22.3 191 24 12.6 856 105 12.3
Under 1 day 150 64 42.7 73 9 12.3 360 97 26.91-27 days 419 63 15.0 11.8 15 12.7 496 8 1.6
Postneonatal 772 71 9.2 272 5 1.8 1,053 5 0.5
Deaths, 1-4 yeare 641 63 9.8 229 6 2.6 412 -
RECIFE SAN JUAN PROVINCE SAN SALVADOR AREA
Deaths under 5 years 2,035 48 2.4 1,039 9? 9.3 1,820 52 2.9
Infant deaths 1,500 34 2.3 988 96 9.7 1,304 40 3.1
Neonatal 564 11 2.0 410 82 20.1 455 22 4.8
Under 1 day 169 5 3.9 109 43 39.4 155 1;' 7.71-27 days 395 6 1.5 301 39 13.0 300 10 3.3
Postneonatal 936 23 2.5 478 14 2.9 849 18 2.1
Deaths, 1-4 years 535 14 2.6 151 1 0.7 516 12 2.3
In nearly all the projects high proportions of births occur in hos-pitals as shown by preliminary counts from the sample. In Recife, for in-stance, 76 per cent of the births in the first year occurred in hospitalsand 24 per cent in homes. Later when analyses are completed of data fromthe sample and for the two years of deaths comparisons will assist in theinterpretation of the completeness of these data on mortality. However, atthis time the findings should be viewed by each principal collaborator interms of possibilities of additional searches and completion of question-naires for the deaths found in order that death rates in his final reportmay be as accurate and complete as possible.
14
The study of other data such as those on birth weights will contrib-ute to measuring indirectly the problem of registration as well as leadingto a better understanding of the differences in the role of factors influ-encing mortality in early life. The differences in the distribution ofdeaths by birth weight are so puzzling that much more needs to be knownabout reproduction, birth weight and mortality in early life. If registra-tion of deaths is incomplete, registration of births will likewise be incom-plete especially of births of low birth weight. Thus, even if data on livebirths were available in all of these areas, their completeness and qualityneed improvement.
The proportion of deaths in which home interviews were conductedvaried widely in the projects and depended on the completeness and accuracyof the address given on the death certificate or hospital record. Also, thelate discovery of unregistered deaths after the field work was thought to becompleted, and several months after the death had occurred, resulted inserious handicaps for carrying out home interviews. This was especially true ~in projects of Cartagena, La Paz, Medellin and Monterrey.
Finally, the quality of information, especially the clinical data,depends on the place of birth and of death. The place of birth was usuallyobtained in the family interview. However, when the death occurred in thehospital soon after birth, the clinical records in the hospital provided theplace of birth as well as the place of death. Data regarding the place ofbirth and the place of death are given in a later section of this report.Also, the source of medical data for the assignment of multiple causes isprovided in the section on causes of mortality. Thus, throughout this re-port the quality of the basic information is considered in relation to theresults of the Investigation.
4i_ Q
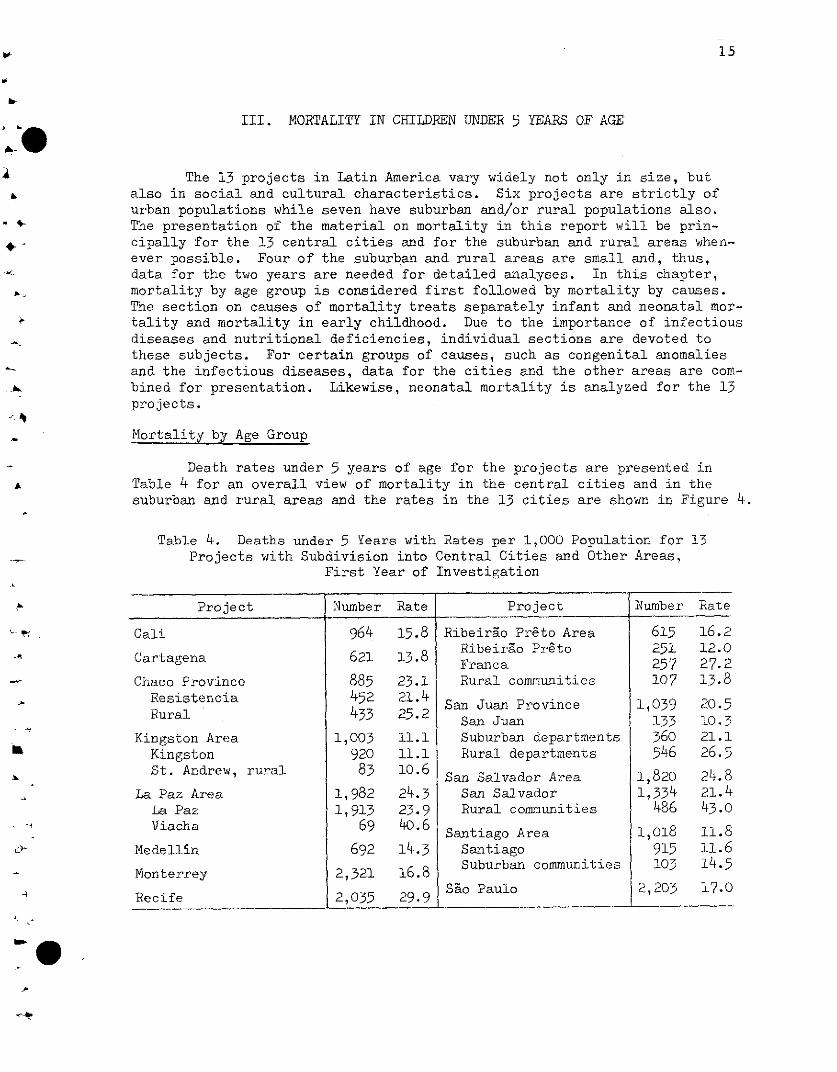
15
III. MORTALITY IN CHILDREN UNDER 5 YEARS OF AGE
The 13 projects in Latin America vary widely not only in size, butalso in social and cultural characteristics. Six projects are strictly ofurban populations while seven have suburban and/or rural populations also.The presentation of the material on mortality in this report will be prin-cipally for the 13 central cities and for the suburban and rural areas when-ever possible. Four of the suburban and rural areas are small and, thus,data for the two years are needed for detailed analyses. In this chapter,mortality by age group is considered first followed by mortality by causes.The section on causes of mortality treats separately infant and neonatal mor-tality and mortality in early childhood. Due to the importance of infectiousdiseases and nutritional deficiencies, individual sections are devoted tothese subjects. For certain groups of causes, such as congenital anomaliesand the infectious diseases, data for the cities and the other areas are com-bined for presentation. Likewise, neonatal mortality is analyzed for the 13projects.
Mortality by Age Group
Death rates under 5 years of age for the projects are presented inTable 4 for an overall view of mortality in the central cities and in thesuburban and rural areas and the rates in the 13 cities are shown in Figure 4.
Table 4. Deaths under 5 Years with Rates per 1,000 Population for 13Projects with Subdivision into Central Cities and Other Areas,
First Year of Investigation
Project Number Rate Project Number Rate
Cali 964 15.8 Ribeirao Preto Area 615 16.2Ribeirao Preto 251 12.0
Cartagena 621 13.8 rc 257 27.2Franca 257 27.2
Chaco Province 885 23.1 Rural communities 107 13.8Resistencia 452 21.4Resistencia 452 21.4 San Juan Province 1,039 20.5
San Juan 133 10.3Kingston Area 1,003 11.1 Suburban departments 360 21.1
Kingston 920 11.1 Rural departments 546 26.5St. Andrew, rural 83 10.6 San Salvador Area 1,820 24.8
La Paz Area 1,982 24.3 San Salvador 1,334 21.4La Paz 1,913 23.9 Rural communities 486 43.0Viacha 69 40.6 óSantiago Area 1,018 11.8
Medellin 692 14.3 Santiago 915 11.6onteey 2,321 16.8 Suburban communities 103 14.5
Recife 2,035 29.9 Sao Paulo 2,203 17.0Recife 2,035 29.9
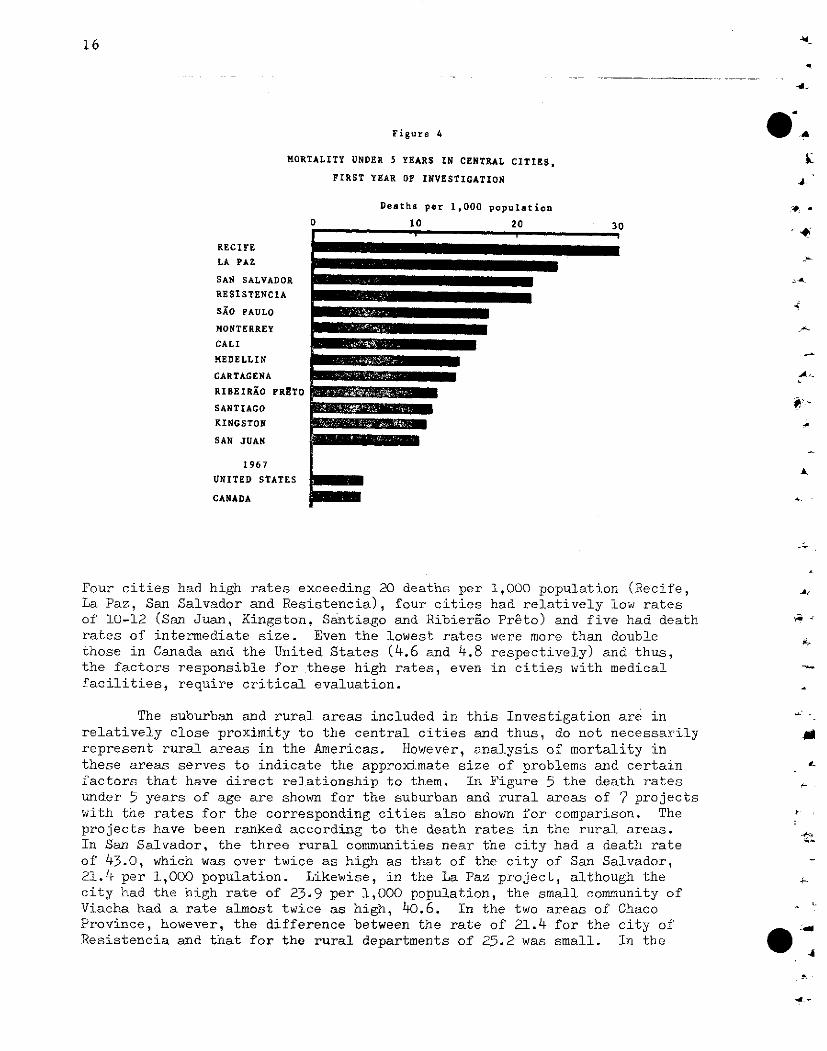
16
Figure 4
MORTALITY UNDER 5 YEARS IN CENTRAL CITIES,
FIRST YEAR OF INVESTIGATION .
Deaths per 1,000 population 4 -
0 10 20 30
RECIFE
LA PAZ
SAN SALVADOR -RESISTENCIA
SAO PAULO
MONTERREY "
CALI
MEDELLIN
CARTAGENA -,
RIBEIRAO PReTO
SANTIAGO -t'KINGSTON
SAN JUAN
1967
UNITED STATES
CANADA
Four cities had high rates exceeding 20 deaths per 1,000 population (Recife,La Paz, San Salvador and Resistencia), four cities had relatively low ratesof 10-12 (San Juan, Kingston, Santiago and Ribierao Preto) and five had deathrates of intermediate size. Even the lowest rates were more than doublethose in Canada and the United States (4.6 and 4.8 respectively) and thus,the factors responsible for these high rates, even in cities with medicalfacilities, require critical evaluation.
The suburban and rural areas included in this Investigation are inrelatively close proximity to the central cities and thus, do not necessarilyrepresent rural areas in the Americas. However, analysis of mortality inthese areas serves to indicate the approximate size of problems and certain Lfactors that have direct relationship to them. In Figure 5 the death ratesunder 5 years of age are shown for the suburban and rural areas of 7 projectswith the rates for the corresponding cities also shown for comparison. Theprojects have been ranked according to the death rates in the rural areas.In San Salvador, the three rural communities near the city had a death rateof 43.0, which was over twice as high as that of the city of San Salvador,21.4 per 1,000 population. Likewise, in the La Paz project, although thecity had the high rate of 23.9 per 1,000 population, the small community ofViacha had a rate almost twice as high, 40.6. In the two areas of ChacoProvince, however, the difference between the rate of 21.4 for the city of _
Resistencia and that for the rural departments of 25.2 was small. In the.4
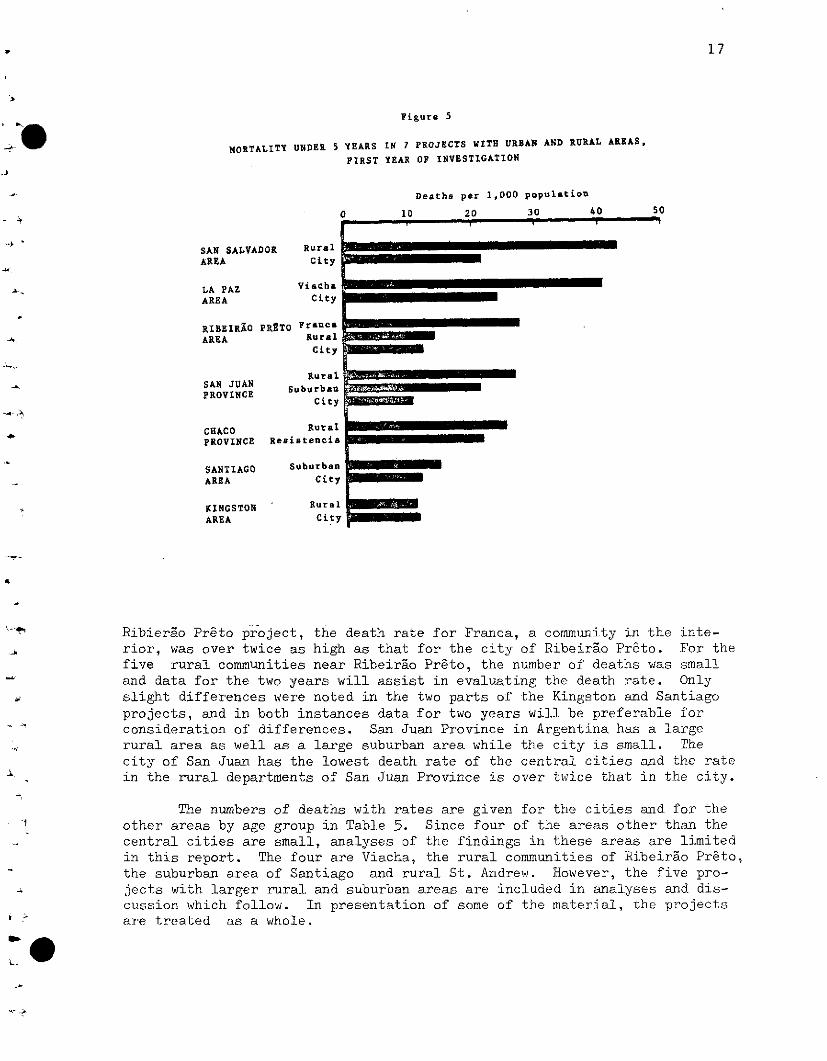
17
Figure 5
MORTALITY UNDER 5 YEARS IN 7 PROJECTS WITH URBAN AND RURAL AREAS.FIRST YEAR OF INVESTIGATION
Deaths per 1,000 population
0 10 20 30 40 50
SAN SALVADOR Rural
AREA City
LA PAZ ViachaAREA City
RIBEIRIO PRgTO FrancaAREA Rural
City
_ualdRutal
SAN JUAN uraSuburban
PROVINCE City
CHACO RuralPROVINCE Resistencia
SANTIAGO SuburbanAREA City
KINGSTON RuralAREA City
Ribierao Preto project, the death rate for Franca, a community in the inte-rior, was over twice as high as that for the city of Ribeirao Preto. For thefive rural communities near Ribeirao Preto, the number of deaths was smalland data for the two years will assist in evaluating the death rate. Only
slight differences were noted in the two parts of the Kingston and Santiago
projects, and in both instances data for two years will be preferable forconsideration of differences. San Juan Province in Argentina has a large
rural area as well as a large suburban area while the city is small. Thecity of San Juan has the lowest death rate of the central cities and the ratein the rural departments of San Juan Province is over twice that in the city.
The numbers of deaths with rates are given for the cities and for theother areas by age group in Table 5. Since four of the areas other than thecentral cities are small, analyses of the findings in these areas are limitedin this report. The four are Viacha, the rural communities of Ribeirao Preto,the suburban area of Santiago and rural St. Andrew. However, the five pro-
jects with larger rural and suburban areas are included in analyses and dis-cussion which follow. In presentation of some of the material, the projectsare treated as a whole.
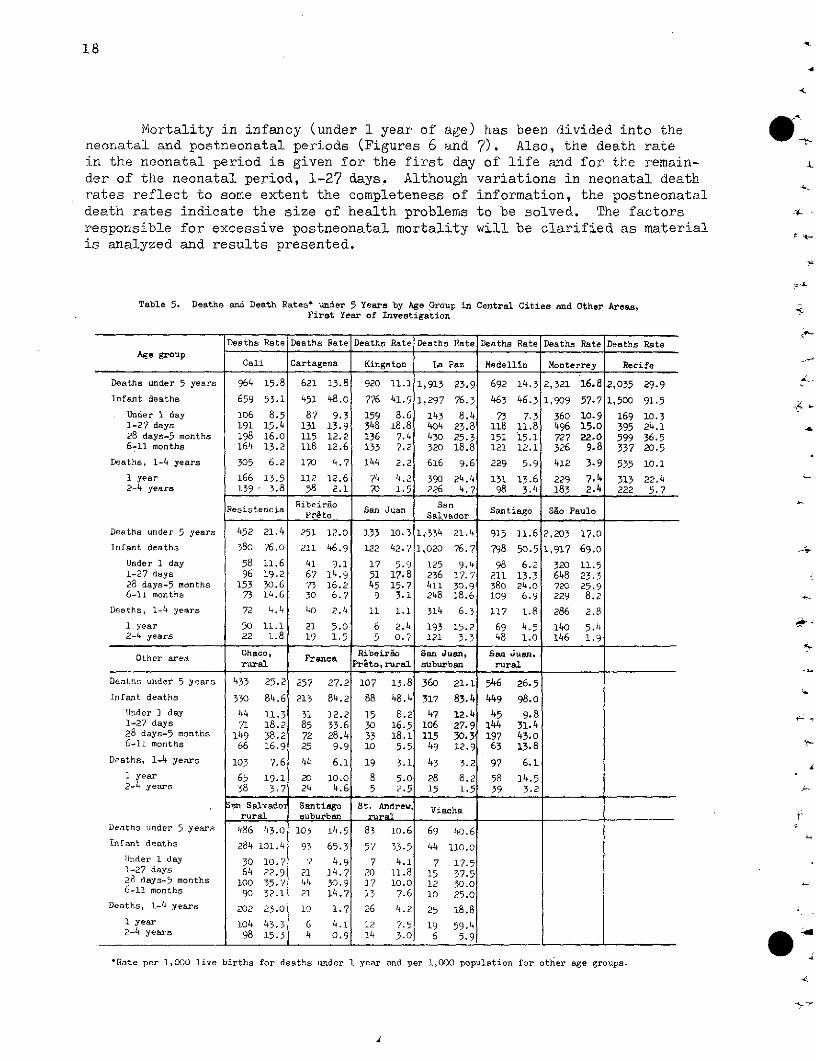
18
Mortality in infancy (under 1 year of age) has been divided into the:neonatal and postneonatal periods (Figures 6 and 7). Also, the death ratein the neonatal period is given for the first day of life and for the remain-der of the neonatal period, 1-27 days. Although variations in neonatal deathrates reflect to some extent the completeness of information, the postneonataldeath rates indicate the size of health problems to be solved. The factorsresponsible for excessive postneonatal mortality will be clarified as materialis analyzed and results presented.
Table 5. Deaths and Death Rates under 5 Years by Age Group in Central Cities and Other Areaa,Firat Year of Investigation
Deatha Rate Deatha Rate Deaths Rate Deaths Rate Deaths Rate Deaths Rate Deaths RateAge group
Cali Cartagena Kingston La Paz Medellin Monterrey Recife
Deaths under 5 years 964 15.8 621 13.8 920 11.1 1,913 23.9 692 14.3 2,321 16.8 2,035 29.9
Infant deaths 659 53.1 451 48.0 776 41.9 1,297 76.3 463 46.3 1,909 57.7 1,500 91.5
Under 1 day 106 8.5 87 9.3 159 8.6 143 8.4 73 7.3 360 10.9 169 10.31-27 days 191 15.4 131 13.9 348 18.8 404 23.8 118 11.8 496 15.0 395 24.128 days-5 months 198 16.0 115 12.2 136 7.4 430 25.3 151 15.1 727 22.0 599 36.56-11 months 164 13.2 118 12.6 133 7.2 320 18.8 121 12.1 326 9.8 337 20.5
Deaths, 1-4 years 305 6.2 170 4.7 144 2.2 616 9.6 229 5.9 412 3.9 535 10.1
1 year 166 13.5 112 12.6 74 4.2 390 24.4 131 13.6 229 7.4 313 22.42-4 years 139 3.8 58 2.1 70 1.5 226 4.7 98 3.4 183 2.4 222 5.7
Ribeireo SanResistencia Prto San Juan Salvador Santiago So PauloPrato Salvador
Deaths under 5 years 452 21.4 251 12.0 133 10.3 1,-334 21.4 915 11.6 2,203 17.0
Infant deaths 380 76.0 211 46.9 122 42.7 1,020 76.7 798 50.5 1,917 69.0
Under 1 day 58 11.6 41 9.1 17 5.9 125 9.4 98 6.2 320 11.51-27 days 96 19.2 67 14.9 51 17.8 236 17.7 211 13.3 648 23.328 days-5 months 153 30.6 73 16.2 45 15.7 411 30.9 380 24.0 720 25.96-11 months 73 14.6 30 6.7 9 3.1 248 18.6 109 6.9 229 8.2
Deaths, 1-4 years 72 4.4 40 2.4 11 1.1 314 6.3 117 1.8 286 2.8
1 year 50 11.1 21 5.0 6 2.4 193 15.2 69 4.5 140 5.42-4 years 22 1.8 19 1.5 5 0.7 121 3.3 48 1.0 146 1.9
Chaco, Ribeirao 8
an Juan, San Juan,rural Prsto,rural suburban rural
Deaths under 5 years 433 25.2 257 27.2 107 13.8 360 21.1 546 26.5
Infant deaths 330 84.6 213 84.2 88 48.4 317 83.4 449 98.o
llnder 1 day 44 11.3 31 12.2 15 8.2 47 12.4 45 9.81-27 days 71 18.2 85 33.6 30 16.5 106 27.9 144 31.428 days-5 months 149 38.2 72 28.4 33 18.1 115 30.3| 197 43.06-11 months 66 16.9 25 9.9 10 5.5 49 12.9 63 13.8
Deaths, 1-4 years 103 7.6 44 6.1 19 3.1 43 3.2 97 6.1
1 year 65 19.1 20 10.O 8 5.0 28 8.2 58 14.52-4 years 38 3.7 24 4.6 5 2.5 15 1.5 39 3.2
San Salvadoi Santiago St. Andrew, Viacharural suburban rural
Deaths under 5 years 5 486 43.0 103 14.5 83 10.6 69 40.6
Infant deaths 284 101.4 93 65.3 57 33.5 44 110.0
Uider 1 day 30 10.7 7 4.9 7 4.1 7 17.51-27 days 64 22.9 21 14.7 20 11.8 15 37.528 days-5 months 100 35.7 44 30.9 17 10.0 12 30.06-11 months 90 32.1 21 14.7 13 7.6 10 25.0
Deatha, 1-4 years 202 23.0 10 1.7 26 4.2 25 18.8
1 year 104 43.3 6 4.1 12 7.5 19 59.42-4 years 98 15.3 4 0.9 14 3.0 6 5.9
·Rate per 1,000 live births for deaths under 1 year and per 1,000 population for other age groups.
*1S
l-- 4-
.4.
.
4
.-
: -
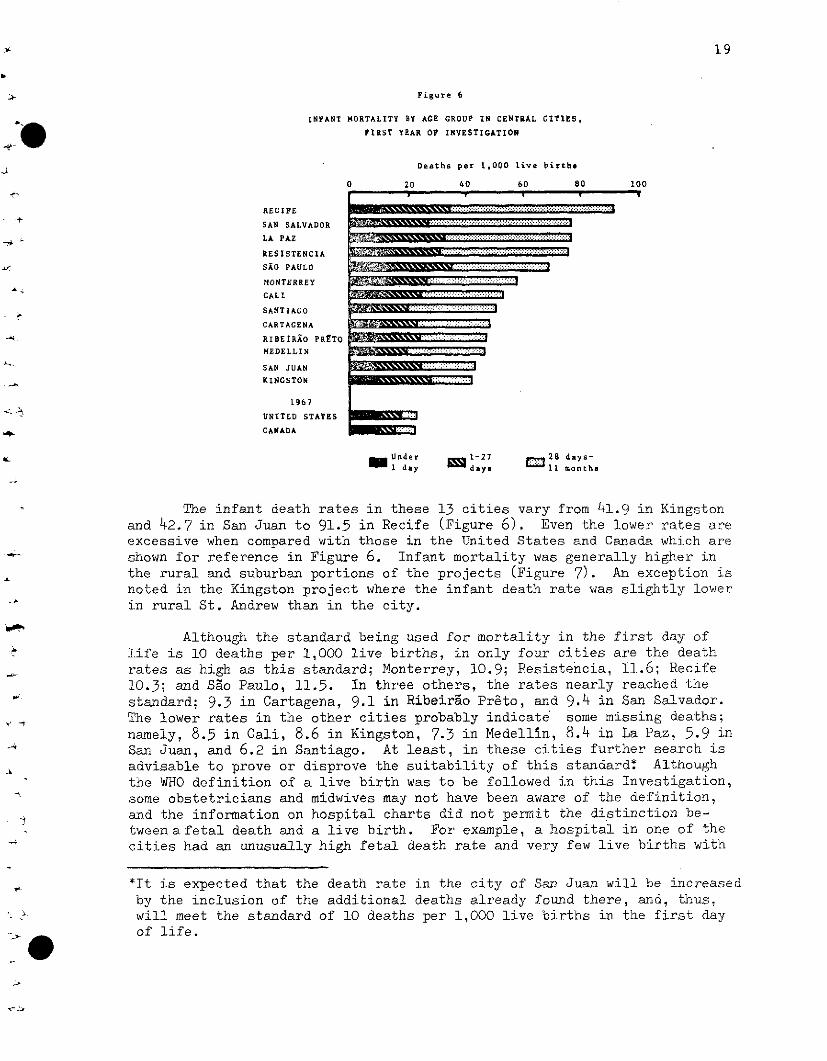
19
Figure 6
INFANT MORTALITY BY AGE GROUP IN CENTRAL CITIES,
FIRST YEAR OF INVESTIGATION
Deaths per 1,000 live birthe
0 20 40 60 80 100
RECIPE
SAN SALVADOR
LA PAZ
RESISTENCIA
SAO PAULO
MONTERREYNALITERRE Y fl. ?.:: .:: :.::.:.::::::!::::::: ::!::·:
CALI
SANTIAGO
CARTACENA
RIBEIRAO PRtTO
MEDELLIN
SAN JUAN
KINGSTON
1967
UNITED STATES
CANADA
- Under 1-27 28 days-1 day days 11 months
The infant death rates in these 13 cities vary from 41.9 in Kingstonand 42.7 in San Juan to 91.5 in Recife (Figure 6). Even the lower rates areexcessive when compared with those in the United States and Canada which areshown for reference in Figure 6. Infant mortality was generally higher inthe rural and suburban portions of the projects (Figure 7). An exception isnoted in the Kingston project where the infant death rate was slightly lowerin rural St. Andrew than in the city.
Although the standard being used for mortality in the first day oflife is 10 deaths per 1,000 live births, in only four cities are the deathrates as high as this standard; Monterrey, 10.9; Resistencia, 11.6; Recife10.3; and Sao Paulo, 11.5. In three others, the rates nearly reached the
standard; 9.3 in Cartagena, 9.1 in Ribeiráo Preto, and 9.4 in San Salvador.The lower rates in the other cities probably indicate some missing deaths;namely, 8.5 in Cali, 8.6 in Kingston, 7.3 in Medellin, 8.4 in La Paz, 5.9 inSan Juan, and 6.2 in Santiago. At least, in these cities further search isadvisable to prove or disprove the suitability of this standard* Althoughthe WHO definition of a live birth was to be followed in this Investigation,some obstetricians and midwives may not have been aware of the definition,and the information on hospital charts did not permit the distinction be-tween a fetal death and a live birth. For example, a hospital in one of thecities had an unusually high fetal death rate and very few live births with
*It is expected that the death rate in the city of San Juan will be increasedby the inclusion of the additional deaths already found there, and, thus,will meet the standard of 10 deaths per 1,000 live births in the first dayof life.
-,)
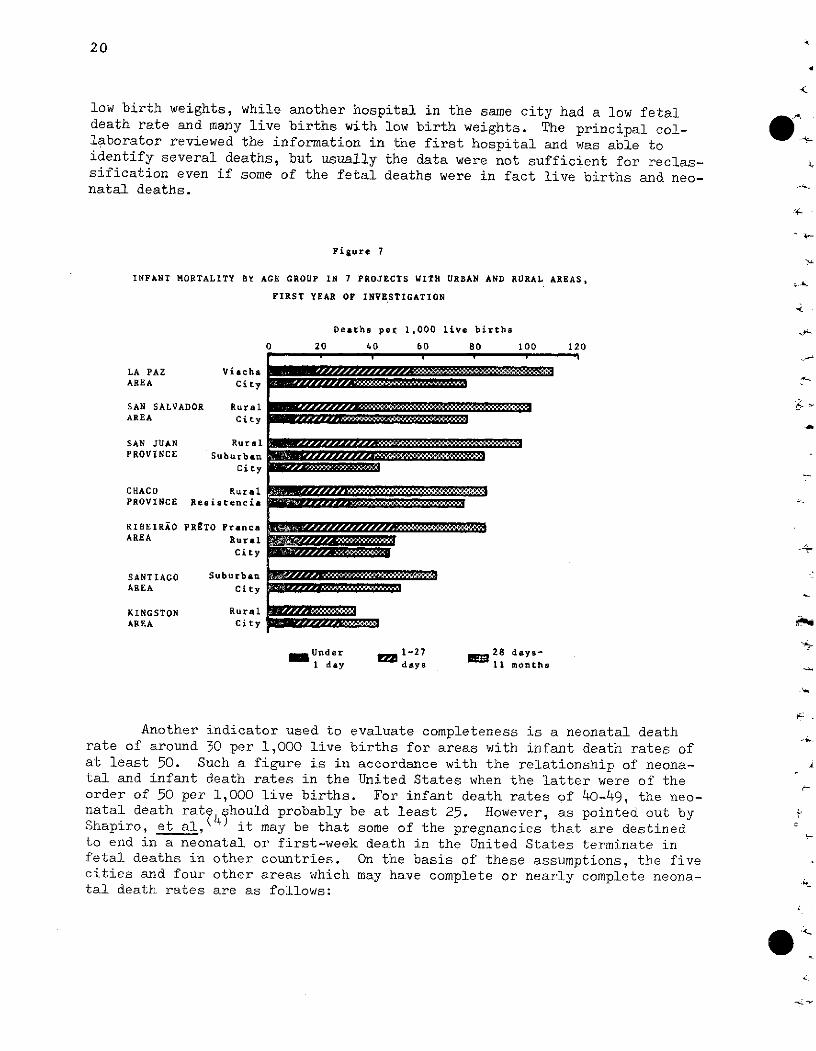
20
low birth weights, while another hospital in the same city had a low fetaldeath rate and many live births with low birth weights. The principal col-laborator reviewed the information in the first hospital and was able toidentify several deaths, but usually the data were not sufficient for reclas-sification even if some of the fetal deaths were in fact live births and neo-natal deaths.
Figure 7
INFANT MORTALITY BY AGE GROUP IN 7 PROJECTS WITH URBAN AND RURAL AREAS,
FIRST YEAR OF INVESTIGATION
Deaths per 1,000 live births
0 20 40 60 80 100 120r 1 , '~' ' ~
LA PAZ ViachaAREA City
SAN SALVADOR RuralAREA City
SAN JUAN RuralPROVINCE Suburban
City
CHACO RuralPROVINCE Resistencia
RIBEIRAO PR£TO FrancaAREA Rural
City
SANTIAGO SuburbanAREA City
KINGSTON RuralAREA City fJs.. _*
Under _ 1-27 28 days-1 day days 11 months
Another indicator used to evaluate completeness is a neonatal deathrate of around 30 per 1,000 live births for areas with infant death rates ofat least 50. Such a figure is in accordance with the relationship of neona-tal and infant death rates in the United States when the latter were of theorder of 50 per 1,000 live births. For infant death rates of 40-49, the neo-natal death rate should probably be at least 25. However, as pointed out byShapiro, et al, 4 it may be that some of the pregnancies that are destinedto end in a neonatal or first-week death in the United States terminate infetal deaths in other countries. On the basis of these assumptions, the fivecities and four other areas which may have complete or nearly complete neona-tal death rates are as follows:
�·�·C�·�
L
BLWí1�5�15�
aa�lí�%·�·T�·�:
3es�a�btl�i?17�.�··�.'�
sSB�BBa�SII�J11�
�Bdl?�i�l��
�Frj$�g�ižl�C?·�C�
BISI�DZ��
g�I�m�ž�.
Bkl�?s�cr�a�rr�
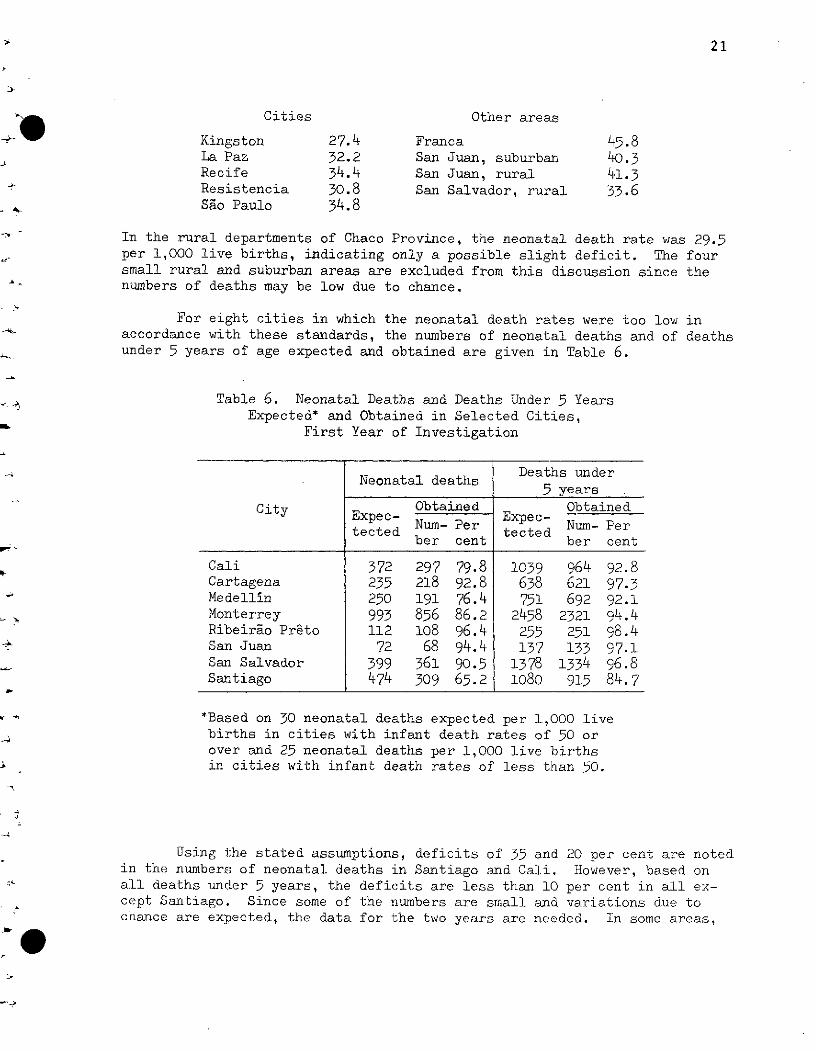
Cities
KingstonLa PazRecifeResistenciaSao Paulo
Other areas
27.432.234.430.834.8
FrancaSan Juan, suburbanSan Juan, ruralSan Salvador, rural
In the rural departments of Chaco Province, the neonatal death rate was 29.5per 1,000 live births, indicating only a possible slight deficit. The foursmall rural and suburban areas are excluded from this discussion since thenumbers of deaths may be low due to chance.
For eight cities in which the neonatal death rates were too low inaccordance with these standards, the numbers of neonatal deaths and of deathsunder 5 years of age expected and obtained are given in Table 6.
Table 6. Neonatal Deaths and Deaths Under 5 YearsExpected* and Obtained in Selected Cities,
First Year of Investigation
Deaths underNeonatal deaths
5 years
City Obtained Obtainedtce Num- Per ec Num- Pertected tectedber cent ber cent
Cali 372 297 79.8 1039 964 92.8Cartagena 235 218 92.8 638 621 97.3Medellin 250 191 76.4 751 692 92.1Monterrey 993 856 86.2 2458 2321 94.4Ribeiráo Preto 112 108 96.4 255 251 98.4San Juan 72 68 94.4 137 133 97.1San Salvador 399 361 90.5 1378 1334 96.8Santiago 474 309 65.2 1080 915 84.7
*Based on 30 neonatal deaths expected per 1,000 livebirths in cities with infant death rates of 50 orover and 25 neonatal deaths per 1,000 live birthsin cities with infant death rates of less than 50.
Using the stated assumptions, deficits of 35 and 20 per cent are notedin the numbers of neonatal deaths in Santiago and Cali. However, based onall deaths uncler 5 years, the deficits are less than 10 per cent in all ex-cept Santiago. Since some of the numbers are small and variations due tochance are expected, the data for the two years are needed. In some areas,
21
45.840.341.333.6
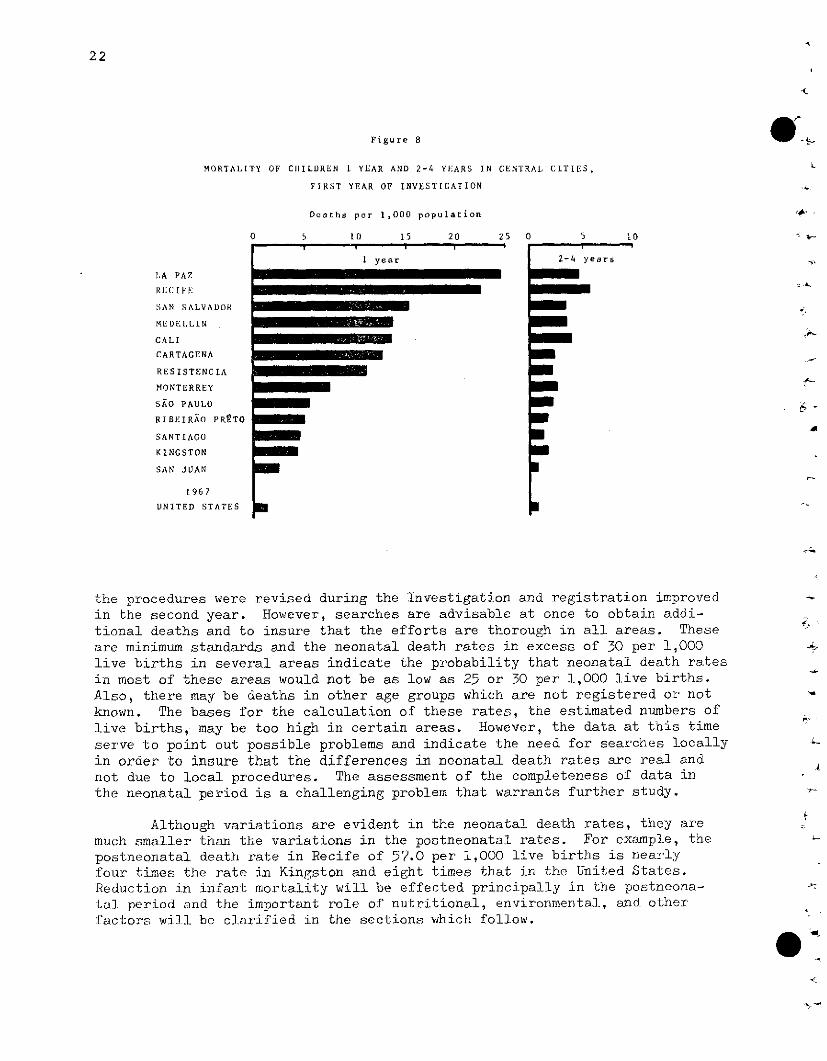
-1
22
Figure 8
MORTALITY OF CHILDREN 1 YEAR AND 2-4 YEARS IN
FIRST YEAR OF INVESTIGATION
CENTRAL CITIES,
LA PAZ
RKEC(:IF E
SAN SALVADOR
MEDELLIN
CALI
CARTAGENA
RESISTENCIA
MONTERREY
SAO PAULO
RIBEIRAO PROTO
SANTIAGO
KINGSTON
SAN JUAN
1967
UNITED STATES
Deaths per 1,000 population
5 10 15 20 25! , , i
1 year
_ ·. g W
- ~_P
=l
- l
ar
5
the procedures were revised during the Investigation and registration improvedin the second year. However, searches are advisable at once to obtain addi-tional deaths and to insure that the efforts are thorough in all areas. Theseare minimum standards and the neonatal death rates in excess of 30 per 1,000live births in several areas indicate the probability that neonatal death ratesin most of these areas would not be as low as 25 or 30 per 1,000 live births.Also, there may be deaths in other age groups which are not registered or notknown. The bases for the calculation of these rates, the estimated numbers oflive births, may be too high in certain areas. However, the data at this time
serve to point out possible problems and indicate the need for searches locallyin order to insure that the differences in neonatal death rates are real andnot due to local procedures. The assessment of the completeness of data inthe neonatal period is a challenging problem that warrants further study.
Although variations are evident in the neonatal death rates, they aremuch smaller than the variations in the postneonatal rates. For example, thepostneonatal death rate in Recife of 57.0 per 1,000 live births is nearlyfour times the rate in Kingston and eight times that in the United States.Reduction in infant mortality will be effected principally in the postneona-tal period and the important role of nutritional, environmental, and otherfactors will be clarified in the sections which follow.
.4'
.O
i
r-
.r
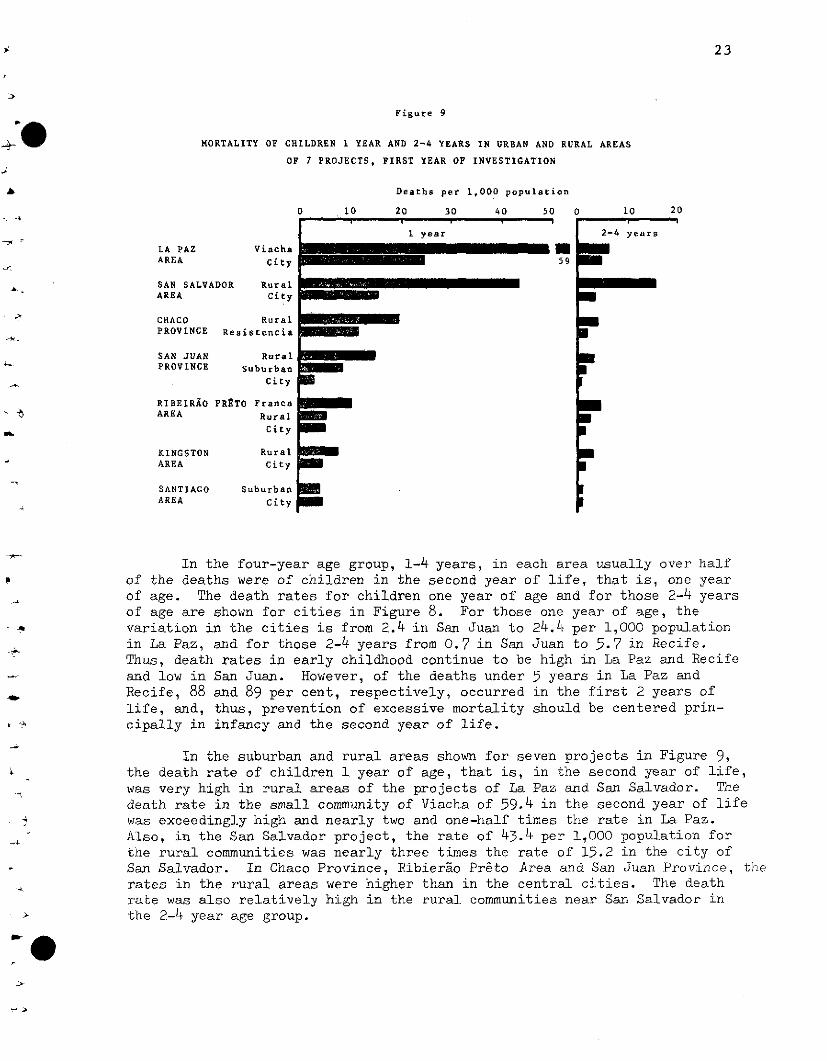
23
Figure 9
MORTALITY OF CHILDREN 1 YEAR AND 2-4 YEARS IN URBAN AND RURAL AREAS
OF 7 PROJECTS, FIRST YEAR OF INVESTIGATION
Deaths per 1,000 population
LA PAZ ViachaAREA City
SAN SALVADOR RuralAREA City
CHACO RuralPROVINCE Resistencia
0 10 20 30 40 5<
I 1 year
0 10 20
2-4 years
59
SAN JUAN RuralPROVINCE Suburban
City
RIBEIRAO PRATO FrancaAREA Rural
City
KINGSTON RuralAREA City
SANTIAGO SuburbanAREA City
In the four-year age group, 1-4 years, in each area usually over halfof the deaths were of children in the second year of life, that is, one yearof age. The death rates for children one year of age and for those 2-4 yearsof age are shown for cities in Figure 8. For those one year of age, thevariation in the cities is from 2.4 in San Juan to 24.4 per 1,000 populationin La Paz, and for those 2-4 years from 0.7 in San Juan to 5.7 in Recife.Thus, death rates in early childhood continue to be high in La Paz and Recifeand low in San Juan. However, of the deaths under 5 years in La Paz andRecife, 88 and 89 per cent, respectively, occurred in the first 2 years oflife, and, thus, prevention of excessive mortality should be centered prin-cipally in infancy and the second year of life.
In the suburban and rural areas shown for seven projects in Figure 9,the death rate of children 1 year of age, that is, in the second year of life,was very high in rural areas of the projects of La Paz and San Salvador. Thedeath rate in the small community of Viacha of 59.4 in the second year of lifewas exceedingly high and nearly two and one-half times the rate in La Paz.Also, in the San Salvador project, the rate of 43.4 per 1,000 population forthe rural communities was nearly three times the rate of 15.2 in the city ofSan Salvador. In Chaco Province, Ribierao Preto Area and San Juan Province, trates in the rural areas were higher than in the central cities. The deathrate was also relatively high in the rural communities near San Salvador inthe 2-4 year age group.
he
I�ieiaae�---
-·t,
1
ob
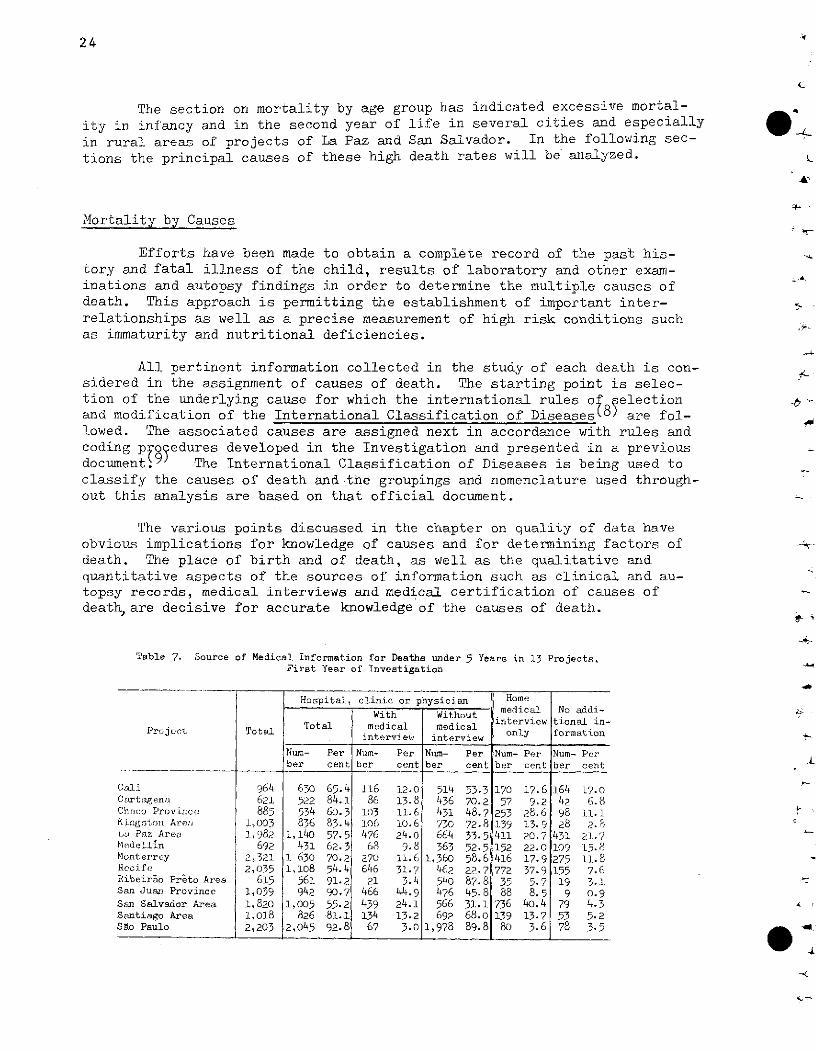
24
The section on mortality by age group has indicated excessive mortal-ity in infancy and in the second year of life in several cities and especially iin rural areas of projects of La Paz and San Salvador. In the following sec-tions the principal causes of these high death rates will be analyzed.
Mortality by Causes
Efforts have been made to obtain a complete record of the past his-tory and fatal illness of the child, results of laboratory and other exam-inations and autopsy findings in order to determine the multiple causes ofdeath. This approach is permitting the establishment of important inter-relationships as well as a precise measurement of high risk conditions suchas immaturity and nutritional deficiencies.
All pertinent information collected in the study of each death is con-sidered in the assignment of causes of death. The starting point is selec-tion of the underlying cause for which the international rules of selection -and modification of the International Classification of Diseases( 8) are fol-lowed. The associated causes are assigned next in accordance with rules andcoding prfoedures developed in the Investigation and presented in a previousdocument.9) The International Classification of Diseases is being used toclassify the causes of death and the groupings and nomenclature used through-out this analysis are based on that official document.
The various points discussed in the chapter on quality of data haveobvious implications for knowledge of causes and for determining factors ofdeath. The place of birth and of death, as well as the qualitative andquantitative aspects of the sources of information such as clinical and au-topsy records, medical interviews and medical certification of causes ofdeath, are decisive for accurate knowledge of the causes of death.
Table 7. Source of Medical Information for Deathe under 5 Years in 13 Projects,Firet Year of Investigation
Hospital, clinic or physician Homemedical No addi-With Without
Total medical medical nterview tional in~~~~~~Projc~ct Total ~only formationinterview interview
Num- Per Num- Per Nu- Per Num- Per Num- Perber cent ber cent ber cent ber cent ber cent
Cali 964 630 65.4 16 12.0 514 53.3 170 17.6 164 17.0Cartagena 621 522 84.1 86 13.8 436 70.2 57 9.2 42 6.8Chnco Province 885 534 60.3 103 11.6 431 48.7 253 28.6 98 11.1Kingston Area 1,003 836 83.4 106 10.6 730 72.8 139 13.9 28 2.Ln Paz Area 1,982 1,140 57.5 476 24.0 664 33.5 411 20.7 431 2]..7Medellin 692 431 62.3 68 9.8 363 52.5 152 22.0 109 15.8Monterrey 2,321 1 630 '70.2 270 11.6 1,360 58.6 416 17.9 275 11.8Recife 2,035 1,108 54.4 646 31.7 462 22.7 772 37.9 155 7.6Ribeirao Prato Area 615 561 91.2 21 3.4 540 87.8 35 5.7 19 3.1San Juan Province 1,039 942 90.7 466 44.9 476 45.8 88 8.5 9 0. 9San Salvador Area 1,820 1,005 55.2 439 24.1 566 31.1 736 40.4 79 4.3Santiago Area 1,018 826 81.1 134 13.2 692 68.0 139 13.7 53 5.2Sao Paulo 2,203 2,045 92.8 67 3.0 1,978 89.8 80 3.6 78 3.5
.. ~~~~~~~~~7 3.5 $ ~
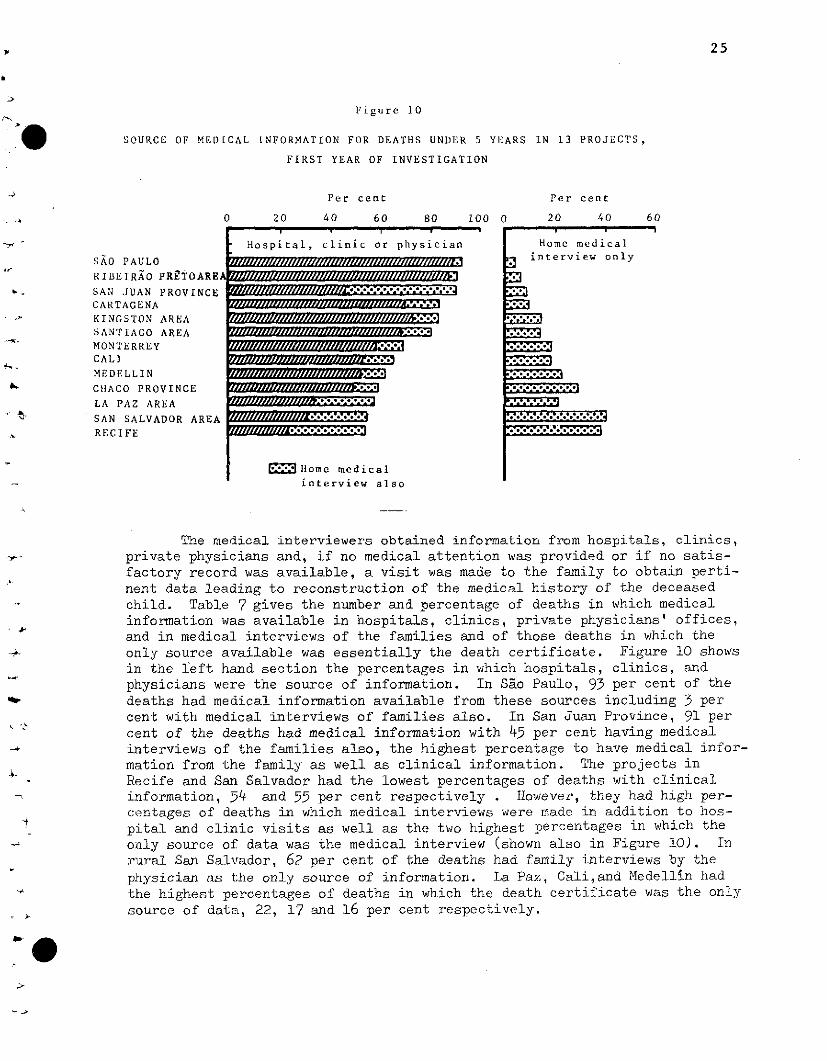
25
Figure 10
SOURCE OF MEDICAL INFORMATION FOR DEATHS UNDER 5 YEARS IN 13 PROJECTS,
FIRST YEAR OF INVESTIGATION
Per cent Per cent
0 20 40 60 80 100 0 20 40 4
SAO PAULO
RIBEIRAO PReT(
SAN JUAN PROVCARTAGENAKINGSTON AREA
SANTIAGO AREAMONTERREYCALI
)AREI
iNCE ///////////////// /////////' . ..;
Hospital, clinic or physician Home medical
. interview only
m
X3
LLIN
O PROVINCE
AZ AREA
SALVADOR AREA
in~Home medícalinterview also
The medical interviewers obtained information from hospitals, clinics,
private physicians and, if no medical attention was provided or if no satis-
factory record was available, a visit was made to the family to obtain perti-
nent data leading to reconstruction of the medical history of the deceased
child. Table 7 gives the number and percentage of deaths in which medical
information was available in hospitals, clinics, private physicians' offices,
and in medical interviews of the families and of those deaths in which the
only source available was essentially the death certificate. Figure 10 shows
in the left hand section the percentages in which hospitals, clinics, and
physicians were the source of information. In Sao Paulo, 93 per cent of the
deaths had medical information available from these sources including 5 percent with medical interviews of families also. In San Juan Province, 91 per
cent of the deaths had medical information with 45 per cent having medical
interviews of the families also, the highest percentage to have medical infor-
mation from the family as well as clinical information. The projects in
Recife and San Salvador had the lowest percentages of deaths with clinical
information, 54 and 55 per cent respectively . However, they had high per-
centages of deaths in which medical interviews were made in addition to hos-
pital and clinic visits as well as the two highest percentages in which the
only source of data was the medical interview (shown also in Figure 10). In
rural San Salvador, 62 per cent of the deaths had family interviews by the
physician as the only source of information. La Paz, Cali,and Medellin had
the highest percentages of deaths in which the death certificate was the only
source of data, 22, 17 and 16 per cent respectively.
MEDE
CHAC
LA P
SANRECI
60
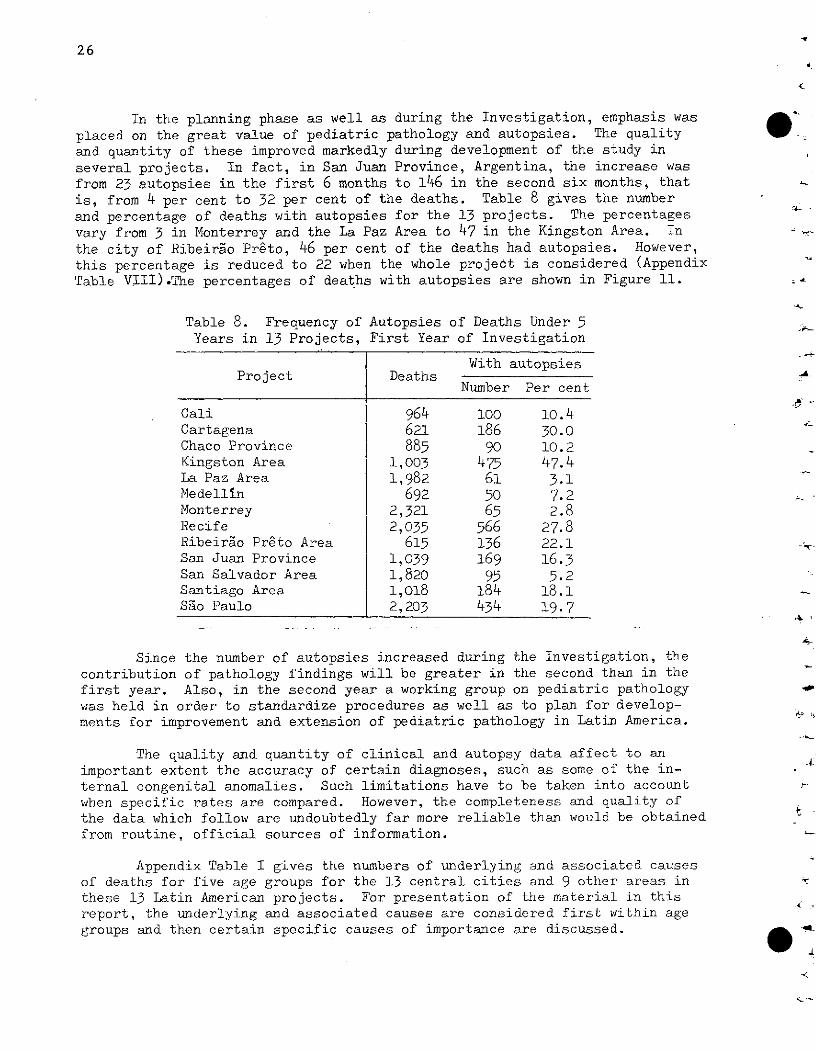
26
In the planning phase as well as during the Investigation, emphasis wasplaced on the great value of pediatric pathology and autopsies. The qualityand quantity of these improved markedly during development of the study inseveral projects. In fact, in San Juan Province, Argentina, the increase wasfrom 23 autopsies in the first 6 months to 146 in the second six months, thatis, from 4 per cent to 32 per cent of the deaths. Table 8 gives the numberand percentage of deaths with autopsies for the 13 projects. The percentagesvary from 3 in Monterrey and the La Paz Area to 47 in the Kingston Area. Inthe city of Ribeirao Preto, 46 per cent of the deaths had autopsies. However,this percentage is reduced to 22 when the whole project is considered (AppendixTable VIII).The percentages of deaths with autopsies are shown in Figure 11.
Table 8. Frequency of Autopsies of Deaths Under 5Years in 13 Projects, First Year of Investigation
With autopsiesProject Deaths
Number Per cent
Cali 964 100 10.4Cartagena 621 186 30.0Chaco Province 885 90 10.2Kingston Area 1,003 475 47.4La Paz Area 1,982 61 3.1Medellín 692 50 7.2Monterrey 2,321 65 2.8Recife 2,035 566 27.8Ribeirao Preto Area 615 136 22.1San Juan Province 1,039 169 16.3San Salvador Area 1,820 95 5.2Santiago Area 1,018 184 18.1Sao Paulo 2,203 434 19.7
Since the number of autopsies increased during the Investigation, thecontribution of pathology findings will be greater in the second than in thefirst year. Also, in the second year a working group on pediatric pathologywas held in order to standardize procedures as well as to plan for develop-ments for improvement and extension of pediatric pathology in Latin America.
The quality and quantity of clinical and autopsy data affect to animportant extent the accuracy of certain diagnoses, such as some of the in-ternal congenital anomalies. Such limitations have to be taken into accountwhen specific rates are compared. However, the completeness and quality ofthe data which follow are undoubtedly far more reliable than would be obtainedfrom routine, official sources of information.
Appendix Table I gives the numbers of underlying and associated causesof deaths for five age groups for the 13 central cities and 9 other areas inthese 13 Latin American projects. For presentation of the material in thisreport, the underlying and associated causes are considered first within agegroups and then certain specific causes of importance are discussed.
.A:
,k-
4
11-
&- S
~4
el4:
la -«
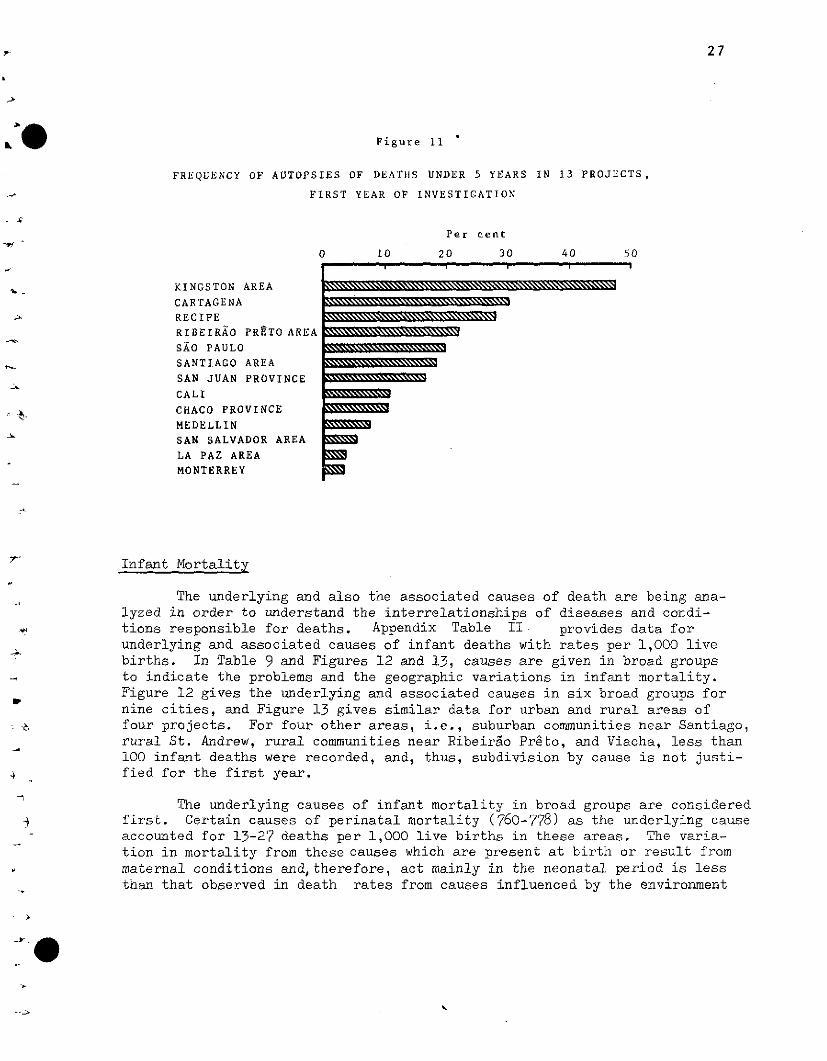
27
Figure 11
FREQUENCY OF AUTOPSIES OF DEAT}]S UNDER 5 YEARS IN 13 PROJECTS,
FIRST YEAR OF INVESTIGATION
Per cent
0 10 20 30 40 50
KINGSTON AREA
CARTAGENA
RECIFE
RIBEIRAO PRETO AREA
SAO PAULO
SANTIAGO AREA
SAN JUAN PROVINCE
CALI
CHACO PROVINCE
MEDELLIN
SAN SALVADOR AREA
LA PAZ AREA
MONTERREY rInfant Mortality
The underlying and also the associated causes of death are being ana-lyzed in order to understand the interrelationships of diseases and condi-tions responsible for deaths. Appendix Table II provides data forunderlying and associated causes of infant deaths with rates per 1,000 livebirths. In Table 9 and Figures 12 and 13, causes are given in broad groupsto indicate the problems and the geographic variations in infant mortality.Figure 12 gives the underlying and associated causes in six broad groups fornine cities, and Figure 13 gives similar data for urban and rural areas offour projects. For four other areas, i.e., suburban communities near Santiago,rural St. Andrew, rural communities near Ribeirao Preto, and Viacha, less than100 infant deaths were recorded, and, thus, subdivision by cause is not justi-fied for the first year.
The underlying causes of infant mortality in broad groups are consideredfirst. Certain causes of perinatal mortality (760-778) as the underlying causeaccounted for 13-27 deaths per 1,000 live births in these areas. The varia-tion in mortality from these causes which are present at birth or result frommaternal conditions and,therefore, act mainly in the neonatal period is lessthan that observed in death rates from causes influenced by the environment
_ · _· ·
L�E�iC�PCI�
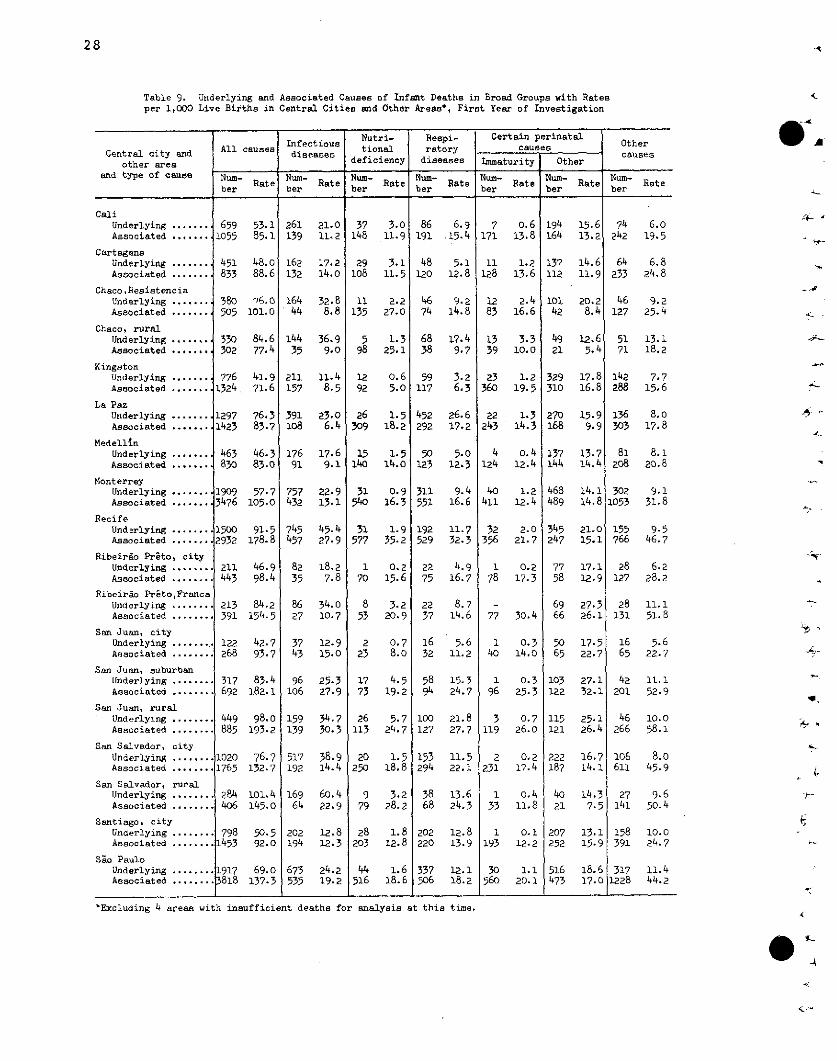
28
Table 9. Underlying and Associated Causes of Infant Deaths in Broad Groups with Ratesper 1,000 Live Births in Central Cities and Other Areas', First Year of Investigation
*4 AInectu Nutri- Respi- Certain perinatalCentral city and All causes ie tional ratory causes
other area deficiency diseases Immaturity Otherand type of cause - Num- Num- Num- Num- Num
Rate N -Rate Rate N um- Rate N um- Rate Rate Num- atber ber ber ber ber ber ber
CaliUnderlying ........ 659Associated ........ 1055
CartagenaUnderlying .......Associated .......
Chaco,ResistenciaUnderlying ........Associated ........
53.1 26185.1 139
48.0 16288.6 132
380 '76.0 164505 101.0 44
Chaco, ruralUnderlying ...... .. 330 84.6 144Associated ........ 302 77.4 35
776 41.91 2111324 71.6 157
La PazUnderlying ....... 1297 76.3Associated ........ 1423 83.7
MedellinUnderlying ........Associated .......
MonterreyUnderlying ........Associated ........
Recife
391108
463 46.3 176830 83.0 91
1909 57.7 7573476 105.0 432
Underlying ........ 1500 91.5 745Associated ........ 2932 178.8 457
Ribeirao Preto, cityUnderlying ........Associated ........
Ribeirao Preto,FrancaUnderlying ........Associated .......
San Juan, cityUnderlying ........Associated .......
San Juan, suburbanUnderlying .......Associated .......
8235
8627
3743
317 83.4 96692 182.1 106
San Juan, ruralUnderlying ....... 449 98.0 159Associated ...... . 885 193.2 139
San Salvador, cityUnderlying ........Associated ........
1020 76.7 5171765 132.7 192
San Salvador, ruralUnderlying . 21....... 284 101 169Associated ....... 1 406 145.0 64
Santiago, cityUnderlying ........Associated ........
Sao PauloUnderlying ........Associated ........
798 50.5 2021453 92.0 194
1917 69.0 6733818 137.3 535
21.0 3711.2 1148
17.214.0
29108
32.8 118.8 135
36.99.0
11.48.5
598
1292
23.0 1266.4 3o9
17.6 159.1 14o0
22.9 3113.1 540
45.427.9
18.27.8
34.010.7
31577
170
853
12.9 215.0 23
25.327.9
34.730.3
1773
26113
38.9 2014.4 250
60.4 922.9 79
12.8 2812.3 203
24.2 1 4419.2 516
_ _ _ _ _ _ _ _ _ _ _ L 1 _ _ _ _ _ _ 1
3.0 8611.9 191
3.1 14811.5 120
2.2 4627.0 74
1.3 6825.1 38
0.6 595.0 117
1.5 45218.2 292
1.514.0
50123
0.9 31116.3 551
1.9 19235.2 529
0.2 2215.6 75
3.2 2220.9 37
0.78.o
4.519.2
1632
5894
5.7 10024.7 127
1.5 15318.8 294
3.2 3828.2 68
1.8 20212.8 220
1.6 1 33718.6 506
6.9 715.4 171
o.6 19413.8 164
1.213.6
9.2 1214.8 83
17.41 139.7 39
3-2 236.3 360
26.6 2217.2 243
5.0 412-3 124
9.4 4016.6 1 411
11.7 3232.3 356
4.9 1 7116.7 78
15.3 124.7 96
21.8 327.7 119
11.5 222.1 231
13.6 124.3 33
12.813.9
12.118.2
1193
30560
137112
2.4 10116.6 142
3.3 4910.0 21
1.2 32919.5 310
1.314.3
0.412.4
270168
137144
1.2 46812.4 489
2.0 34521.7 247
0.2 7717.3 58
30.46966
O.3 5014.0 65
0.325.3
0.726.0
103122
115121
0.2 22217.4 187
0.4 14011.8 21
0.112.2
1.120.1
207252
516473
15.613.2
4-- ,74 6.0
242 19.5
14.6 64 6.811.9 233 24.8
20.2 46 9.28.4 127 25.4
12.6 51 13.15.4 71 18.2
17.8 142 7.716.8 288 15.6
15.99.9
13.714.4
136 8.0303 17.8
81 8.1208 20.8
14.1 302 9.114.8 1053 31.8
21.0 155 9.515.1 766 46.7
17.1 28 6.212.9 127 28.2
27.3 28 11.126.1 131 51.8
17.5 16 5.622.7 65 22.7
27.1 42 11.132.1 201 52.9
'u
25.1 46 10.026.4 66 58.1
16.7 106 8.014.1 611 45.9
14.3 27 9.67.5 141 50.4
13.115.9
18.617.0
158 10.0391 24.7
317 11.41228 44.2
*Excluding 4 areas with insufficient deaths for analysis at this time.
_4
451833
KingstonUnderlying .......Associated ........
211 46.9443 98.4
213 84.2391 154.5
.122 42.7¡ 268 93.7
5.1 1112.8 128
8.7 -14. 77
5.6 111.2 40
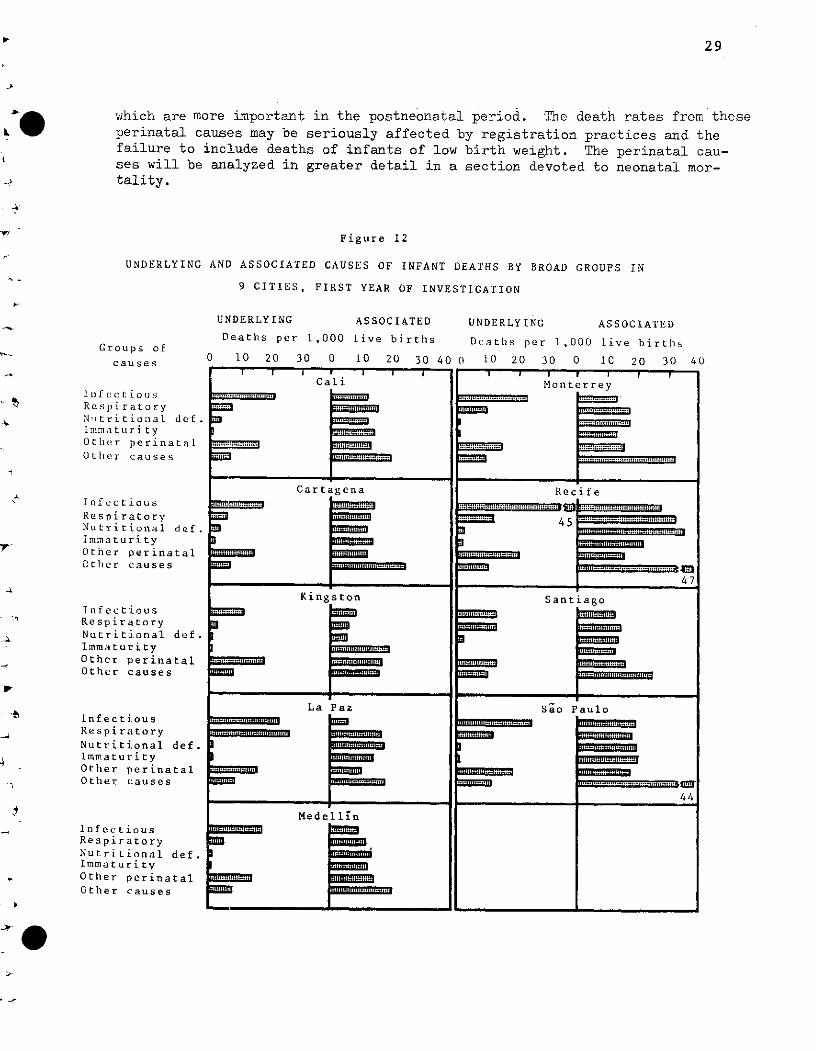
29
which are more important in the postneonatal period. The death rates from theseperinatal causes may be seriously affected by registration practices and thefailure to include deaths of infants of low birth weight. The perinatal cau-ses will be analyzed in greater detail in a section devoted to neonatal mor-tality.
Figure 12
UNDERLYING AND ASSOCIATED CAUSES OF INFANT DEATHS BY BROAD GROUPS IN
9 CITIES, FIRST YEAR OF INVESTIGATION
UNDERLYING ASSOCIATED UNDERLYING ASSOCIATED
Deaths per 1,000 live births Dcaths per 1,000 live birthsGroups ofcauses 10 0 30 10 20 3 0 40 0 10 20 30 0 10 20 30 40cause s I__ __ ___ __ ___ __
T I I , a ...i i I 1 3 ,Cali Monterrey
lnfectious ==----=__.... ..Respiratory 3 :ilNutritional def. 3£imma t ii r i t yOther perinatalOLither causes 3
Cartagena RecifeInfect ous r ::::::::::::::::::::::::::::::Respiratory 45Nutritional def.
=ImmaturityOther perinatalCtlier causes i
47
Kingston SantiagoInfectious 3=RespiratoryNutritional def.ImmaturityOther perinatalOther causes
La Paz Sao PauloInfectiousRespiratory
Nutritional def.ImmaaturityOther perinatalOther causes .... .......
44
98~~~~~ ~~MedellinInfectiousRespiratory :::Nutritional def.ImmaturityOther perinatalOther causes
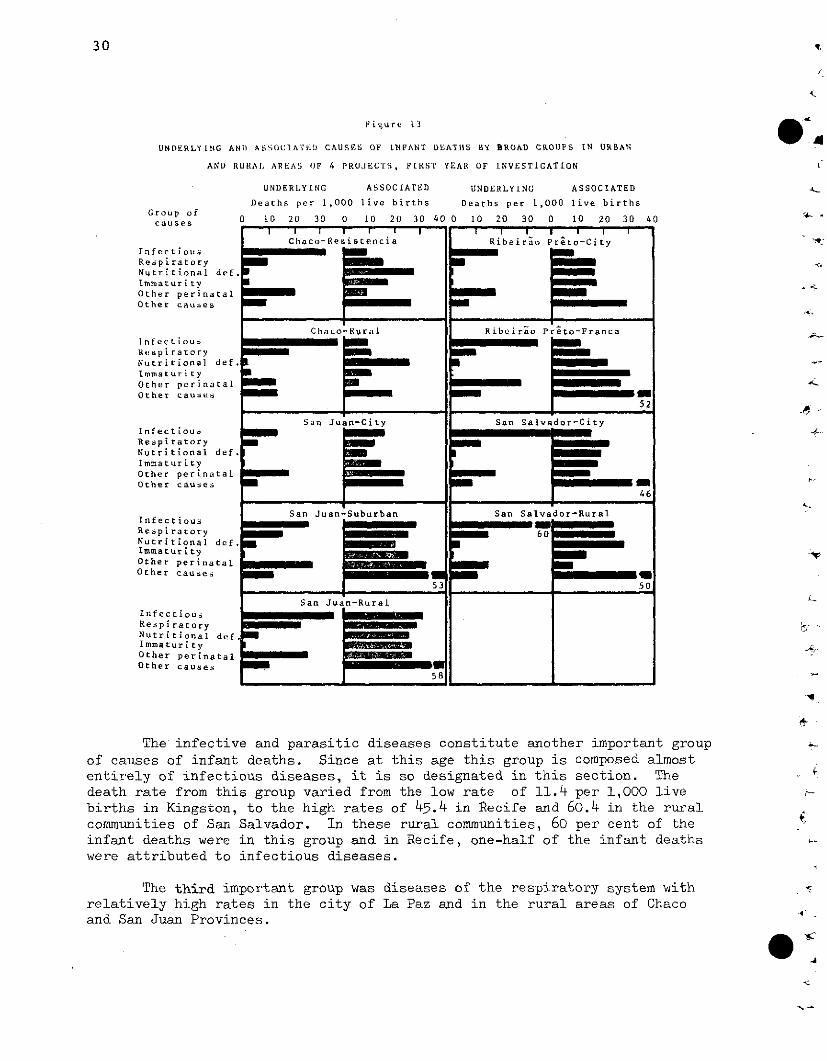
UNDERLYING AND ASSOCIATE1) CAUSIS OF lNFANT DI)ATIIS BY BROAD GROUPS IN URBAN
AND RURAL AREAS OF 4 PROJECTS, FIRST YEAR OF INVESTIGATION
Group ofcauses
Infectio suRespiratoryNutritional def.ImmaturityOther perinatalOther causes
lnfectiousRespiratoryNutritional def.ImmaturityOther perinatalOther causes
InfectiousRespiratoryNutritional def.ImmaturityOther perinatalOther causes
InfectiousRespiratoryNutritional def.ImmaturityOther perinatalOther causes
InfectiousRespiratoryNutritional def.ImmaturityOther perinatalOther causes
o
UNDERLYING ASSOCIATED
Deaths per 1,000 live births
UNDERLYING ASSOCIATED
Deaths per 1,000 live births
10 20 30 0 10 20 30 40 0 10 20 30 0 10 20 30 460
í1-
'-
The infective and parasitic diseases constitute another important groupof causes of infant deaths. Since at this age this group is composed almostentirely of infectious diseases, it is so designated in this section. Thedeath rate from this group varied from the low rate of 11.4 per 1,000 livebirths in Kingston, to the high rates of 45.4 in Recife and 60.4 in the ruralcommunities of San Salvador. In these rural communities, 60 per cent of theinfant deaths were in this group and in Recife, one-half of the infant deathswere attributed to infectious diseases.
The third important group was diseases of the respiratory system withrelatively high rates in the city of La Paz and in the rural areas of Chacoand San Juan Provinces.
e
30 t
k
.
Chaco-Resistencia Ribeirao Preto-City
Chaco-Rural Ribeirao Preto-Franca
52
San Juan-City San Salvador-City
46
San Juan-Suburban San Salvador-Rural
60
5 0
Can Juan-Rural
585
-a1
C
_ 4
L
4 ,
31
The associated as well as the underlying causes of death contribute toour knowledge of factors responsible for excessive mortality. The associatedcauses of death have a markedly different distribution than the underlyingcauses (as shown in Table 9 and Figures 12 and 13). According to the rulesof the International Classification, immaturity as an underlying cause is"not to be used if any other cause of perinatal mortality is reported.'" Thus,usually, immaturity is coded as an associated cause of death. The sum ofdeaths due to immaturity as an underlying or associated cause gives the totaldeaths in which immaturity contributed directly or indirectly to mortality.In Recife, for example, immaturity was assigned as a cause for 388 deathswhich gave a rate of 23.7 per 1,000 live births.
Another important cause responsible directly or indirectly for highinfant death rates in developing countries is nutritional deficiency. Therole of this cause in mortality has not been revealed in the past, principallybecause infectious diseases are usually assigned as underlying causes and alsobecause in the previous Revision of the International Classification ofDiseasest1 0 )deaths attributed to nutritional deficiency were coded in two sec-tions. Often in the 1955 Revision of the Classification they were coded tothe category of nutritional maladjustment (772) in the group of Other DiseasesPeculiar to Early Infancy. Some deaths would have been coded in the sectionfor Avitaminoses and Other Metabolic Diseases.
In the 1965 Revision of the Classification in use at the present time,nutritional deficiencies are brought together in one group entitled Avitamin-oses and Other Nutritional Deficiency (260-269). Since deaths are rarely dueto a specific avitaminosis in developing countries, in the reports of theInvestigation the term nutritional deficiency is used for this group. Inthis report, thus, the term nutritional deficiency is essentially equivalentto the group of conditions referred to as protein-calorie malnutrition.
As with immaturity, nutritional deficiency is usually assigned as anassociated cause. For example, in the city of San Salvador, nutritionaldeficiency was assigned as the underlying cause of 20 infant deaths and asassociated cause of 250 deaths. As can be observed in Figures 12 and 13,nutritionaldeficiencies and immaturity appear as important associated causesand not as underlying causes of death. This is in marked contrast to theinfections and to the other causes of perinatal mortality. Likewise, thedeath rates from diseases of the respiratory system are usually higher asassociated than as underlying causes. Thus, the real magnitude of thesehealth problems is measured by the use of the multiple causes approach.
Both immaturity and nutritional deficiency indicate a deficiency inweight and development of a child. If immaturity, 777, is assigned, a codefor nutritional deficiency is not needed to describe the deficiency state ofthe child. In areas where birth weights are not obtained and clinical dataare incomplete, the distinction between an immature baby and one with nutri-tional deficiency is difficult. Such deaths would be assigned to a nutri-tional deficiency category. Thus, the rules of the Investigation have beenestablished to eliminate duplication and permit addition of these causes to
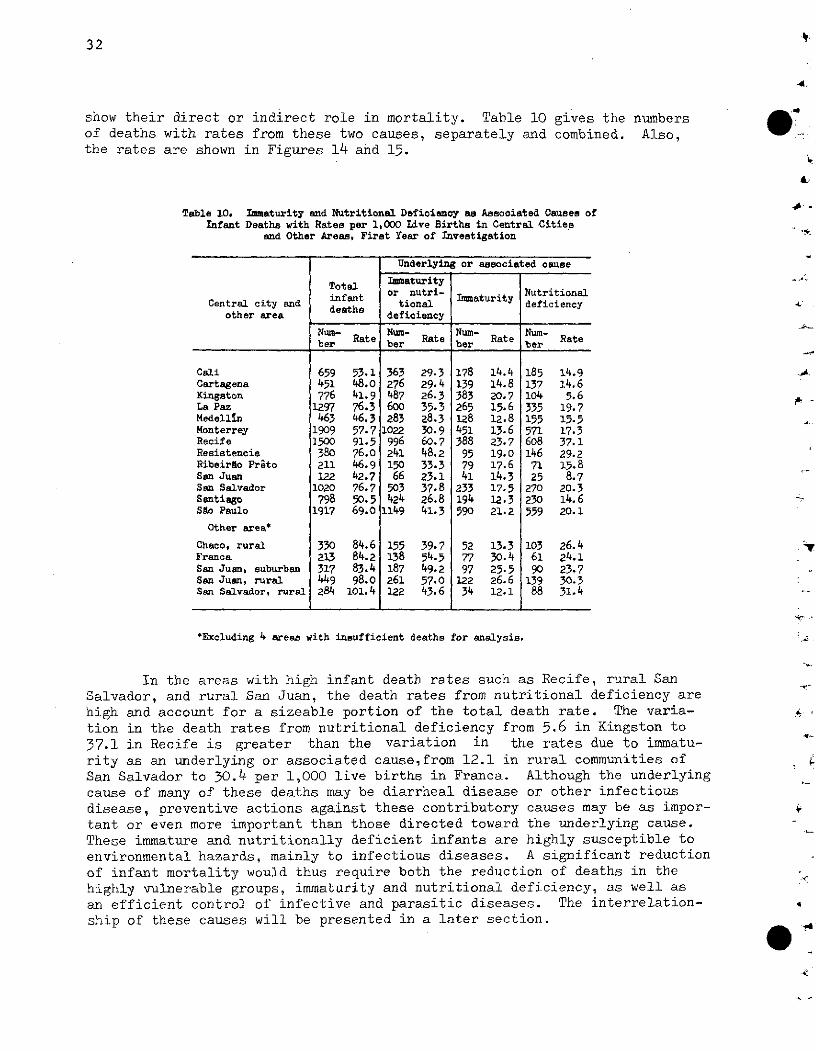
32
-4
show their direct or indirect role in mortality. Table 10 gives the numbersof deaths with rates from these two causes, separately and combined. Also,the rates are shown in Figures 14 and 15.
A,
Table 10. Immaturity and Nutritional Deficiency as Associated Causes ofInfant Deaths with Rates per 1,000 Live Births in Central Cities
and Other Areas, Firet Year of Investigation
Underlying or asociated cause
Total ImmaturityCentralor cnutri- Iaiatfnity Nutritional
other are death deficiency
Num- Num- Num- Num-ber Rate ber ber ber
Cali 659 53.1 363 29.3 178 14.4 185 14.9Cartagena 451 48.0 276 29.4 139 14.8 137 14.6Kingston 776 41.9 487 26.3 383 20.7 104 5.6La Paz 1297 76.3 600 35.3 265 15.6 335 19.7Medelln 463 46.3 283 28.3 128 12.8 155 15.5Monterrey 1909 57.7 1022 30.9 451 13.6 571 17.3Recife 1500 91.5 996 60.7 388 23.7 608 37.1Resistencia 380 76.0 241 48.2 95 19.0 146 29.2Ribeirno Preto 211 46.9 150 33.3 79 17.6 71 15.8San Juan 122 42.7 66 23.1 41 14.3 25 8.7San Salvador 1020 76.7 503 37.8 233 17.5 270 20.3Santiago 798 50.5 424 26.8 194 12.3 230 14.6S.o Paulo 1917 69.o 1149 41.3 590 21.2 559 20.1
Other area*
Chaco, rural 330 84.6 155 39.7 52 13.3 103 26.4Franca 213 84.2 138 54.5 77 30.4 61 24.1San Juan, suburban 317 83.4 187 49.2 97 25.5 90 23.7San Juan, rural 449 98.0 261 57.0 122 26.6 139 30.3San Salvador, rural 284 101.4 122 43.6 34 12.1 88 31.4
*Excluding 4 areas with insufficient deaths for analysis.
In the areas with high infant death rates such as Recife, rural SanSalvador, and rural San Juan, the death rates from nutritional deficiency arehigh and account for a sizeable portion of the total death rate. The varia-tion in the death rates from nutritional deficiency from 5.6 in Kingston to37.1 in Recife is greater than the variation in the rates due to immatu-rity as an underlying or associated cause,from 12.1 in rural communities ofSan Salvador to 30.4 per 1,000 live births in Franca. Although the underlyingcause of many of these deaths may be diarrheal disease or other infectiousdisease, preventive actions against these contributory causes may be as impor-tant or even more important than those directed toward the underlying cause.These immature and nutritionally deficient infants are highly susceptible toenvironmental hazards, mainly to infectious diseases. A significant reductionof infant mortality would thus require both the reduction of deaths in thehighly vulnerable groups, immaturity and nutritional deficiency, as well asan efficient control of infective and parasitic diseases. The interrelation-ship of these causes will be presented in a later section.
Y
.
_'`
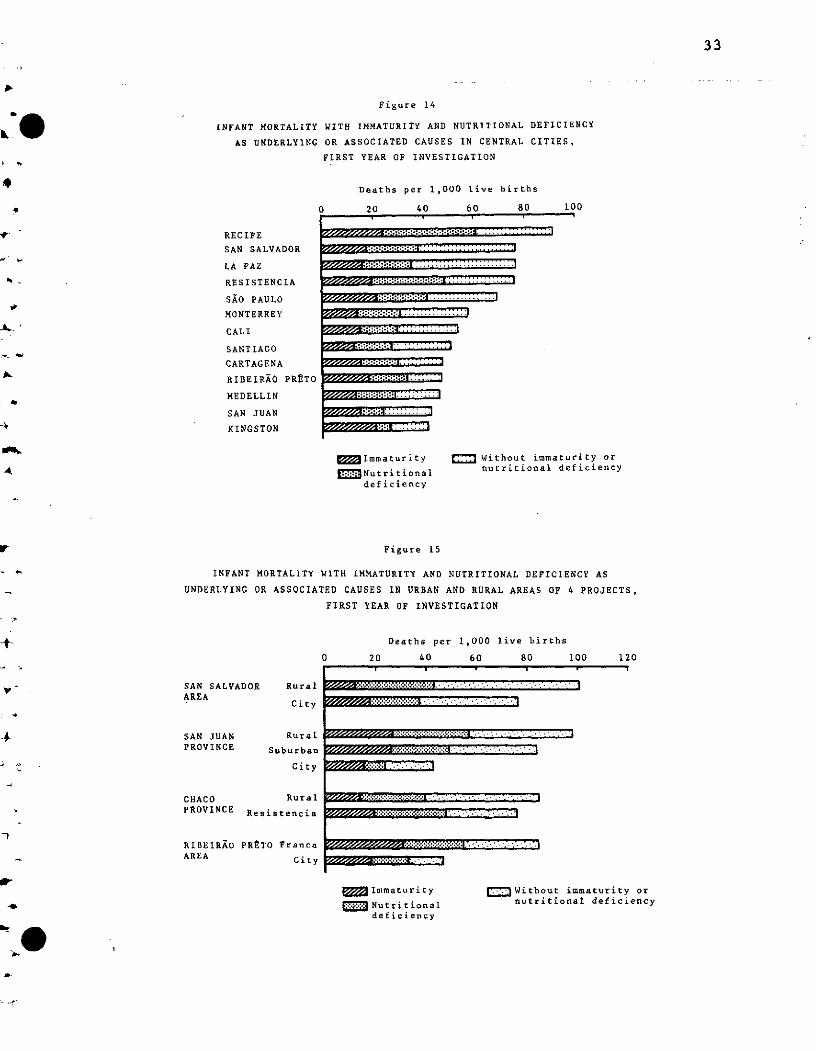
33
Figure 14
INFANT MORTALITY WITH IMMATURITY AND NUTRITIONAL DEFICIENCY
AS UNDERLYING OR ASSOCIATED CAUSES IN CENTRAL CITIES,
FIRST YEAR OF INVESTIGATION
Deaths per 1,000 live births
0 20 40 60 80 100
RECIFE
SAN SALVADOR
LA PAZ
RESISTENCIA
SAO PAULO
MONTERREY
CALI
SANTIAGO
CARTAGENA
RIBEIRAO
MEDELLIN
SAN JUAN
KINGSTON
PRETO
EZ=Immaturity
.Nutritionaldeficiency
M Without immaturity ornutritional deficiency
Figure 15
INFANT MORTALITY WITH IMMATURITY AND NUTRITIONAL DEFICIENCY AS
UNDERLYING OR ASSOCIATED CAUSES IN URBAN AND RURAL AREAS OF 4 PROJECTS,
FIRST YEAR OF INVESTIGATION
Deaths per 1,000 live births
0 20 40 60 80 100 120
SAN SALVADORAREA
Rural
City
SAN JUAN RuralPROVINCE Suburban
City
CHACO Rural
PROVINCE Resistencia
RIBEIRAO PRETO FrancaAREA City
(M Immaturity
::e Nutritionaldeficiency
.-. Without immaturity ornutritional deficiency
7~~ír/~7//~:~:~~:~:~:I:~:i:i:`·~--l m--. n- . ..
:e 4::e :a - i*4*a-4... ,-7
1 1��b.:.-.�:a-.j. --, --, -. ..1. , .... .. .. .., .., ... ... .. ..r. .
---'. -'. -.--- -_,- -.-
,5:·:·:.:.:·:.:.:·:·:·:;:.:
s....i.·.·...·.... .. -.. -7 , ..
7//~ 5~/;/~//~7~·T,:r:::~::::~:~::TS~:: -· · ·· ·--- ·
!
*: 1: 9: é: s: *:;1 * á .. . ........
.: -. -,! f * .1,
. ,
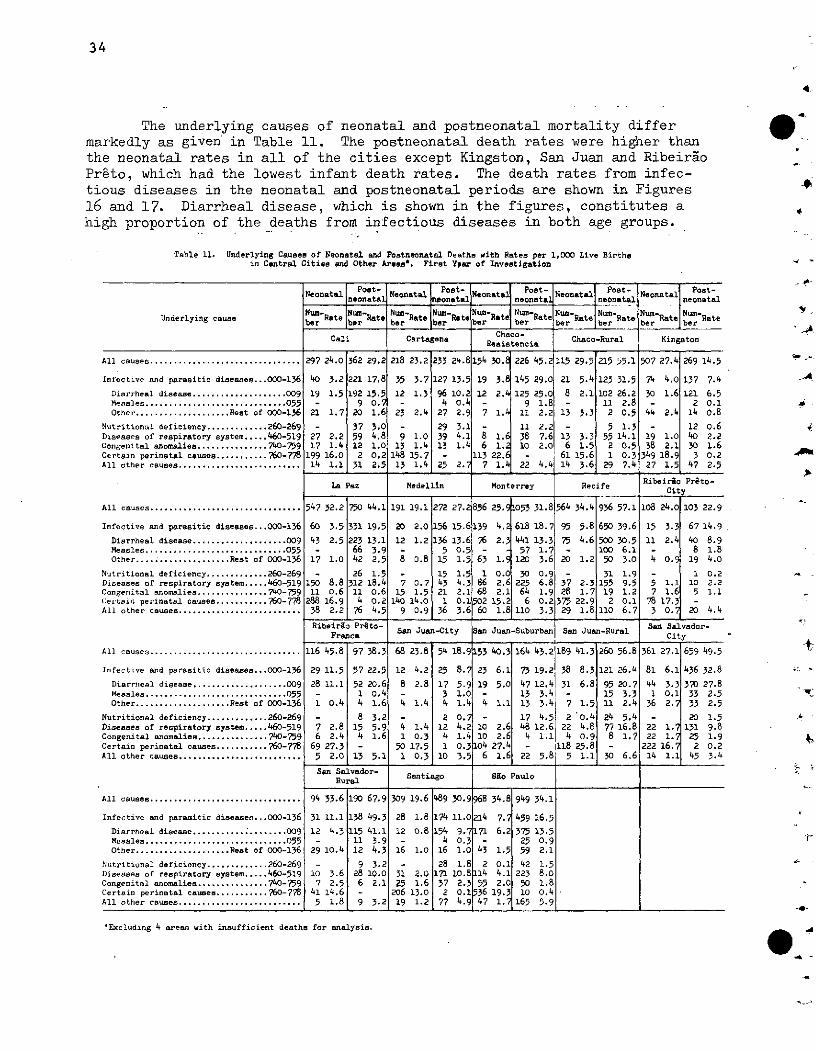
34
4
The underlying causes of neonatal and postneonatal mortality differmarkedly as given in Table 11. The postneonatal death rates were higher thanthe neonatal rates in all of the cities except Kingston, San Juan and RibeiraoPreto, which had the lowest infant death rates. The death rates from infec-tious diseases in the neonatal and postneonatal periods are shown in Figures16 and 17. Diarrheal disease, which is shown in the figures, constitutes ahigh proportion of the deaths from infectious diseases in both age groups.
Table 11. Underlying Causes of Neonatal and Postneonatal Deaths with Rates per 1,000 Live Birthsin Central Cities and Other Areas*, Firat Ypar of Investigation
e
Neonatal Neonatal ost- ostNnatal ost-__ N eonatal Poat- lneonatal neonat l ne al neonatal
Underlying cause Rat Rt Rate m Rat Nm Ra te NRate NURat Nuaf ecaber bar be ser r b ber ber Re ber be r ber
Chaco-Cali Cartagena RasistencLa Chaco-Rural Kingston
__ . , . .-~~~~~~~~~~~~~easani
All causes..............................
Infective and parasitic diseasea...OOO-136
Diarrheal disease .................... 009Measles .............................. 055Other ................... Rest of 000-136
Nutritional deficiency ............. 260-269Diseases of respiratory system..... 460-519Congenital anomalies ............... 740-759Certain perinatal causes ........... 760-778All other causes..........................
All causes ................................
Infective and parasitic diseases...000-136
Diarrheal disease .................... 009Measles .............................. 055Other .................... Rest of 000-136
Nutritional deficiency ............. 260-269Diseases of respiratory system ..... 460-519Congenital anomalies ............... 740-759Certain perinatal causes ........... 760-778All other causes..........................
All causes ................................
Infective and parasitic diseases...000-136
Diarrheal disease .................... 009Measles .............................. 055Other .................... Rest of 000-136
Nutritional deficiency ............. 260-269Diseases of respiratory system ..... 460-519Congenital anomalies ............... 740-759Certain perinatal causes ........... 760-778All other causes ..........................
All causes ................................ 94 33.61190
Infective and parasitic diseases...000-136
Diarrheal disease ................... 009Measles .......................... 055Other .................. Rest of 000-136
Nutritional deficiency ............. 260-269Diseases of respiratory system ..... 460-519Congenital anomalies ............... 740-759Certain perinatal causes ........... 760-778All other causes..........................
31 11.1
12 4.3
29 10.4
10 3.67 2.5
41 14.65 1.8
362 29.2
221 17.8
192 15.59 0.7
20 1.6
37 3.059 4.812 1.0
2 0.231 2.5
44.1
19.5
13.13.92.5
1.518.40.60.24.5
218 23.2 233 24.8
35 3.7 127 13.5
12 1.3 96 10.2- 4 0.4
23 2.4 27 2.9
- 29 3.19 1.0 39 4.1
13 1.4 13 1.4148 15.7 -
13 1.4 25 2.i
Medellin
191 19.1
20 2.0
12 1.2
8 0.8
7 0.715 1.5
140 14.09 0.9
154 30.1
19 3.A
12 2.1
7 1.W
8 1.¿6 1.;
113 22.d7 1.1
226 45.2
145 29.C
125 25.C9 1.E
11 2.2
113810
22
2.27.62.0
4.4
Monterrey
272 27.2856 25.9f053 31.8
156 15.6139 4.2 618 18.7
76 2.3
63 1.9
1 0.086 2.668 2.1
502 15.260 1.8
441 13.357 1.7120 3.6
30 O.9225 6.864 1.9
6 0.2110 3.3
115 29.5
21 5.4
8 2.1
13 3.3
13 3.36 1.5
61 15.614 3.6
215 95.1
123 31.5
102 26.211 2.82 0.5
5 1.355 14.12 0.51 0.3
29 7.4
Recife
564 34.4
95 5.8
75 4.6
20 1.2
37 2.328 1.7
375 22.929 1.8
936 57.1
650 39.6
500 30.5100 6.150 3.0
31 1.9155 9.519 1.2
2 0.1110 6.7
507 27.4
74 4.0
30 1.6
44 2.4
19 1.038 2.1
349 18.927 1.5
. I _ _-_ _ -
RibeiraoCit
108 24.0
15 3.3
11 2.4
4 0.9
5 1.17 1.6
78 17.33 0.
269 14.5
137 7.4
121 6.52 0.1
14 0.8
1240303
47
0.62.21.60.22.5
Préto-y
103 22.9
67 14.9
40 8.98 1.8
19 4.0
1 0.210 2.25 1.1
20 4.4
297 24.0
40 3.2
19 1.5
21 1.7
27 2.217 1.4
199 16.014 1.1
La Paz
750
531
2236642
26312
114
76
547 32.2
60 3.5
43 2.5
17 1.0
150 8.811 0.6
288 16.938 2.2
136 13.65 0.5
15 1.5
15 1.543 4.321 2.1
1 0.136 3.6
Ribeirao Préto- San Salvador-Fra San Juan-City an Juan-Suburban[ San Juan-Rural Sa Salvador-
116 45.8 97 38.3 68 23.8 54 18.9 153 40.3 164 43.2 189 41.3 260 56.8 361 27.1 659 49.5
29 11.5 57 22.5 12 4.2 25 8. 23 6.1 73 19.2 38 8.3 121 26.4 81 6.1 436 32.8
28 11.1 52 20.6 8 2.8 17 5.9 19 5.0 47 12.41 31 6.8 95 20.7 44 3.3 370 27.8- 1 0.4 - 3 1.0 13 3.41 - 15 3.3 1 0.1 33 2.51 0.4 4 1.6 4 1.4 4 1.4 4 i.i 13 3.4: 7 1.5 11 2.4 36 2.? 33 2.5
- 8 3.2 - 2 0. - 17 4.5 2 '0.4 24 5.4 - 20 1.57 2.8 15 5.9 4 1.4 12 4.2 10 2.6 48 12.6 22 4.8 77 16.8 22 1.7 131 9.86 2.4 4 1.6 1 0.3 4 1.4 10 2.6 4 1.1 4 0.9 8 1.7 22 1.7 25 1.9
69 27.3 - 50 17.5 1 0.3104 27.4 - 118 25.8 - 222 16.7 2 0.25 2.0 13 5.1 1 0.3 10 3.5 6 1.6 22 5.8 5 1.1 30 6.6 14 1.1 45 3.4
San Salvador- Santiago Sño PauloRural
67.9
138 49.3
115 41.111 3.912 4.3
9 3.228 10.06 2.1
9 3.2
309 19.6
28 1.8
12 0.8
16 1.O
31 2.025 1.6
206 13.019 1.2
489 30.9
174 11.0
154 9.74 O.316 1.0
28 1.8171 10.8
37 2.32 0.177 4.9
968 34.8
214 7.7
171 6.2
43 1.5
2 0.1[14 4.155 2.0536 19.347 1.7
949 34.1
459 16.5
375 13.525 0.959 2.1
42 1.5223 8.0
50 1.810 0.4
165 5.9
'Excluding 4 areas with insufficient deaths for analysis. O
;4 -
-
4-
-A
---,
yt
'f'
LL L
.9
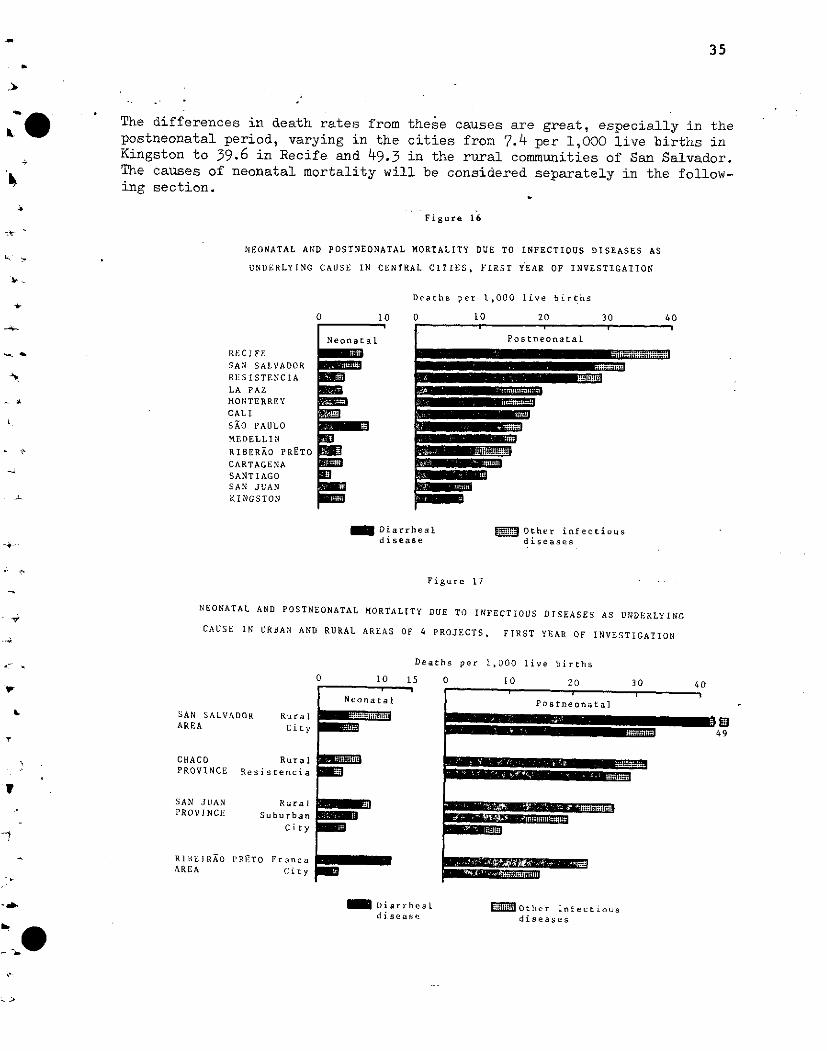
35
The differences in death rates from these causes are great, especially in thepostneonatal period, varying in the cities from 7.4 per 1,000 live births inKingston to 39.6 in Recife and 49.3 in the rural communities of San Salvador.The causes of neonatal mortality will be considered separately in the follow-ing section.
Figure 16
NEONATAL AND POSTNEONATAL MORTALITY DUE TO INFECTIOUS DISEASES AS
UNDERLYING CAUSE IN CENTRAL CITIES, FIRST YEAR OF INVESTIGATION
Deaths per 1,000 live births
RECIFESAN SALVADORRESISTENCIA
LA PAZMONTERREYCALI
SAO PAULO
MEDELLIN
RIBERAO PRETOCARTAGENASANTIAGOSAN JUANKINGSTON
0 105 .----------- 9
Neonatal
_=aM
biM=
E_FMPr
M~S
10 20 30 401 1 i
Postneonatal
d; -
_. _. I i. Ih ~~~ .11 _l | 1 l 11 :::
BB
in
- Diarrhealdisease
Ei} Other infectiousdiseases
Figure 17
NEONATAL AND POSTNEONATAL MORTALITY DUE TO INFECTIOUS DISEASES AS UNDERLYING
CAUSE IN URBAN AND RURAL AREAS OF 4 PROJECTS, FIRST YEAR OF INVESTIGATION
SAN SALVADORAREA
Rural
City
CHACO RuralPROVINCE Resistencia
SAN .JUAN RuralPROVINCI Suburban
City
RIBEIRAO PRrTO FrancaAREA City y
0 10 1
Neonatal
_:m
Deaths per 1,000 live births
5 0 10 20 30 40
Postneonatal
49
;l Otiher infectiousdiseases
Diarrhealdisease
IIBI~SA~d~llRR~· ~ liwMiPrr~~~s~BBiri~~i~~iEa 4 a M
amo~"
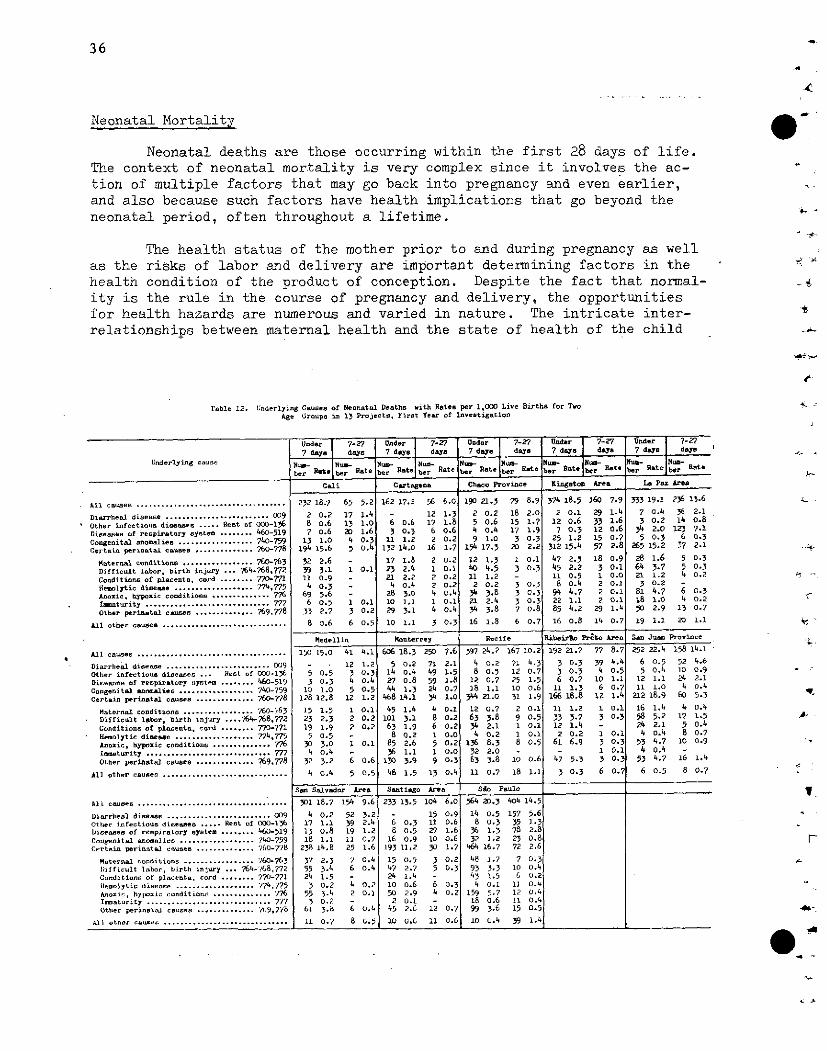
36
Neonatal Mortality
Neonatal deaths are those occurring within the first 28 days of life.
The context of neonatal mortality is very complex since it involves the ac-
tion of multiple factors that may go back into pregnancy and even earlier,
and also because such factors have health implications that go beyond the
neonatal period, often throughout a lifetime.
The health status of the mother prior to and during pregnancy as well
as the risks of labor and delivery are important determining factors in the
health condition of the product of conception. Despite the fact that normal-
ity is the rule in the course of pregnancy and delivery, the opportunities
for health hazards are numerous and varied in nature. The intricate inter-
relationships between maternal health and the state of health of the child
Table 12. Unoderlying Causes of Neonatal Deatha with Rates per 1,000 Live Birtha for TwoAge Groups in 13 Projecte. First Year of Investigation
Undor i7-27 Usnder 7-2 ? Undr 7-27 UlderI 77-2 UnIder 7-2?7 dayo daya 7 dsya day j daa 7daoy dsyo 7 das daya
Underlying Hcau seR- Ru Nuo.- N N R-bun Nra - IeN Rate b R-- .RatoeiNuRet Ro t Rst. RataNo Rat b Rat Rate
Cali Cartagena Chaco Province Kingaton Ares La Paz Are*
ll cause.. ................. 232 18.7 65 5.2 162 17.2 56 6.0 90 21.3 79 8.9 374 18.5 60 7.9 333 19.1 236 13.6
Diarrheal disease ......................... 009 2 0.2 17 1.4 - 12 13 20.2 18 2.0 2 0.1 29 1.4 7 0.4 36 2.1Other infectios dianew ..... R.t of 00-136 8 0.6 13 1.0 6 0.6 17 1.8 5 0.6 15 1.7 12 0.6 33 1.6 3 0.2 14 0.8Diseases of respiratory ystea ........ 460-519 7 0.6 2 1.6 3 0.3 6 0.6 4 0.4 17 1.9 7 0.3 12 0.6 34 2.0 123 7.1
Congecnital anomalies .................. 740-759 13 1.0 4 0.3 11 1.2 2 0.2 9 1.0 3 0.3 25 1.2 15 0.7 5 0.3 6 0.3
Certain priínatal caue s . ............. 760-778 194 15.6 5 0.4 132 14.0 16 1.7 154 17.3 20 2.2 312 15.4 57 2.8 26515.2 7 2.1
Maternal conditiona ................. 760-763 32 2.6 - 17 1.8 2 0.2 12 1.3 1 0.1 47 2.3 18 0.9 28 1.6 5 0.3
Difficult labor, birth injury ... 764-768,772 39 3.1 1 0.1 23 2.4 1 0.1 40 4.5 3 0.3 45 2.2 3 01 64 3.7 5 03Conditions of placenta, cord ........ 770-771 11 0.9 - 21 2.2 Z 0.2 11 1.2 - 11 0.5 1 0.0 21 1.2 4 0.2Hemytic die.as .................... 774,775 4o 03 - 4 0.4 2 0.2 2 0.2 3 0.3 8 0.4 2 0.1 3 0.2 -
Anoxic, hypoxic conditiona .............. 76 69 5.6 - 28 3.0 4 0.4 34 3.8 3 0.3 94 4.7 2 0.1 81 4.7 6 0.3Imaturity ........................ 777 6 0.5 1 0.1 10 1.1 1 0. 21 2.4 3 0.3 22 1.1 2 0.1 18 1.0 4 0.2
Other perinatal causes .............. 769,778 33 2.7 3 0.2 29 3.1 4 0.4 34 3.8 7 0.8 85 4.2 29 1.4 50 2.9 13 0.7
All other causea .............................. 8 0.6 6 0.5 10 1.1 3 0.3 16 i.8 6 0.7 16 o.8 14 0.7 19 1.1 20 1.1
Medellin Monterrey Reoife Ribei &o Prito Area San Juan Province
All causes .................................... 150 15.0 41 4.1 606 18.3 250 7.6 397 24.2 167 10.2 192 21.7 77 8.7 252 22.4 158 14.1
Diarrhel discase ......................... 009 - 1.2 1.2 5 0.2 71 2.1 4 0.2 71 4.3 3 O.3 39 4.4 6 0.5 52 4.6
Other infectious dioeane .. Rest of 000o-136 5 0.5 3 0.3 14 0.4 49 1.5 80.5 12 0.7 3 0.3 40.5 50.4 10 0.9Diseases of rOspiratory yntem . ....... 460-519 3 0.3 4 0.4 2 0.8 59 1.8 12 0.7 25 1.5 6 0.7 10 1.1 12 1.1 24 2.1
Congenital anoalies ....... 74... .... . 70-759 10 1.0 5 0.5 44 1.3 24 0.7 18 1.1 10 0.6 11 1.3 6 0.7 11 1.0 4 0.4
Certsin prinatsl causc .............. 760-778 128 12.8 12 1.2 468 14.1 34 1.0 344 21.0 31 1.9 166 18.8 12 1.4 212 18.9 60 5.3
Maternal conditíions .... ....... 760-763 15 1.5 1 0.1 45 1.4 4 0.1 12 0.7 2 0.1 11 1.2 1 0.1 16 1.4 4 0.4Difflicult labor, birth injury .... 764-768,772 23 2.3 2 0.2 101 3.1 8 0.2 63 3.8 9 0.5 33 3.7 3 0.3 58 5.2 17 1.5
Conditions of placenta, cord ........ 770-771 19 1.9 2 0.2 63 1.9 6 0.2 34 2.1 1 0.1 12 1.4 - 24 2.1 5 0.4Hemsolyric disease ................... 774,775 5 0.5 - 8 0.2 1 0.0 4 0.2 1 0.1 2 0.2 10. 4 0.4 8 0.7
Anoxic, hypoxic conditiono ............. 776 30 3.0 1 0.1 85 2.6 5 0.2 136 8.3 8 0.5 61 6.9 3 0.3 53 4.7 10 0.9Immaturity ........................ 7... 777 40.4 - 36 1.1 1 0.0 32 2.0 - - 10.1 4 0.4 -
Other perinstal caues .............. 769.778 32 3.2 6 0.6 130 3.9 9 0.3 63 3.8 o10 0.6 47 5.3 3 0.3 53 4.7 16 1.4
A1] other causes .............................. 4 0.4 5 0.5 48 1.5 13 0.4 11 0.7 18 1.1 30.3 6 0.7 60.5 8 0.7
San Salvador Areo Santiago Are. Sdo Paulo
Al -causes e ............... 3..01 18.7 154 9.6 233 13.5 104 6.0 564 21.3 404 14.5
Diarrheal disease ...................... 009 4 0.2 52 3.2 - 15 0.9 14 0.5 157 5.6Other infectious dise~s ..... Rest of 000-136 17 1.1 39 2.4 6 0.3 11 0.6 8 0.3 35 1.3Diseases of respiratory system ........ 460-519 13 .8 19 1.2 8 0.5 27 1.6 36 1.3 78 2.8Congenital anomanlies ............... 740-759 18 1.1 11 0.7 16 0.9 10 0.6 32 1.2 23 0.8Certain perintaled canuses .............. 760-778 238 14.8 25 1.6 193 11.2 30 1.7 464 16.7 72 2.6
Maternal conditions ........ 0....... ..'-763 37 2.3 7 0.4 15 0.9 3 0.2 48 1.7 7 0.3lDifficult labor, birth injury ... 764-768.772 55 5.4 6 0.4 47 2.7 5 0.3 93 3.3 lo 0.4Conditions of placenta, ord ........ 770-771 24 1.5 - 24 1.4 43 1.5 6 0.2lleaolytic dismene ................... 74,775 3 0.2 4 0.2 10 0.6 6 0.3 4 0.1 11 0.4Anaoxic, hypoxic conditionc .............. 776 55 3.4 2 O.1 50 2.9 4 0.2 159 5.7 12 0.4Inatcrity ........................... 777 3 0.2 - 20.1 - 18 0.6 11 0.4Other perinatal causes .............. 7,9,778 61 3.b 6 0.4 45 2.6 12 0.7 99 3.6 15 0.5
l] olther ca-ua ........... 1.......... ..... 11 0.7 8 0.5 10 0.6 11 0.6 10 0.4 39 1.4
.T-
/k
4j
I.
-·I
,C
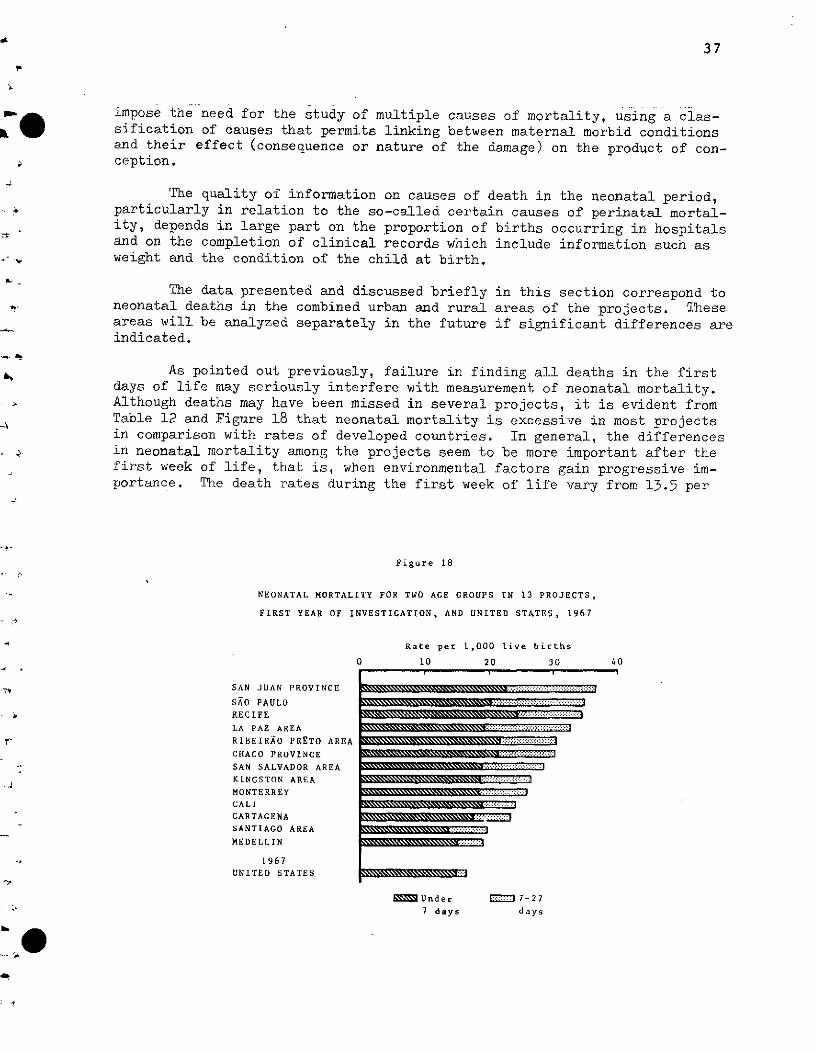
37
impose the need for the study of multiple causes of mortality, using a clas-sification of causes that permits linking between maternal morbid conditionsand their effect (consequence or nature of the damage) on the product of con-ception.
The quality of information on causes of death in the neonatal period,particularly in relation to the so-called certain causes of perinatal mortal-ity, depends in large part on the proportion of births occurring in hospitalsand on the completion of clinical records which include information such asweight and the condition of the child at birth.
The data presented and discussed brieflyneonatal deaths in the combined urban and ruralareas will be analyzed separately in the futureindicated.
in this section correspond toareas of the projects. Theseif significant differences are
As pointed out previously, failure in finding all deaths in the firstdays of life may seriously interfere with measurement of neonatal mortality.Although deaths may have been missed in several projects, it is evident fromTable 12 and Figure 18 that neonatal mortality is excessive in most projectsin comparison with rates of developed countries. In general, the differencesin neonatal mortality among the projects seem to be more important after thefirst week of life, that is, when environmental factors gain progressive im-portance. The death rates during the first week of life vary from 13.5 per
Figure 18
NEONATAL MORTALITY FOR TWO AGE GROUPS IN 13 PROJECTS,
FIRST YEAR OF INVESTIGATION, AND UNITED STATES, 1967
SAN JUAN PROVINCE
SAO PAULO
RECIFE
LA PAZ AREA
RIBEIRAO PRETO AREACHACO PROVINCE
SAN SALVADOR AREAKINGSTON AREA
MONTERREYCALICARTAGENASANTIAGO AREA
MEDELLIN
1967UNITED STATES
Rate per 1,000 live births
10 20 30O
kS~Under .-' 7-27
7 days days
40__
~~`~\\\~\~\\\\\f\\\\\~~~i~N\\\\\RN·':;...............~~u~~,~~,~,~~\\\\\\p\\~~~~~,~~,\m\ ~ ~ . ... .. . . .
~~\\m\~,\\\~,\\\\\\m\\~\\~~··;·;;·--; ······-··...... ...
~m\\\\Pm\\~\\~~\~\~,\R ~ ........... ·
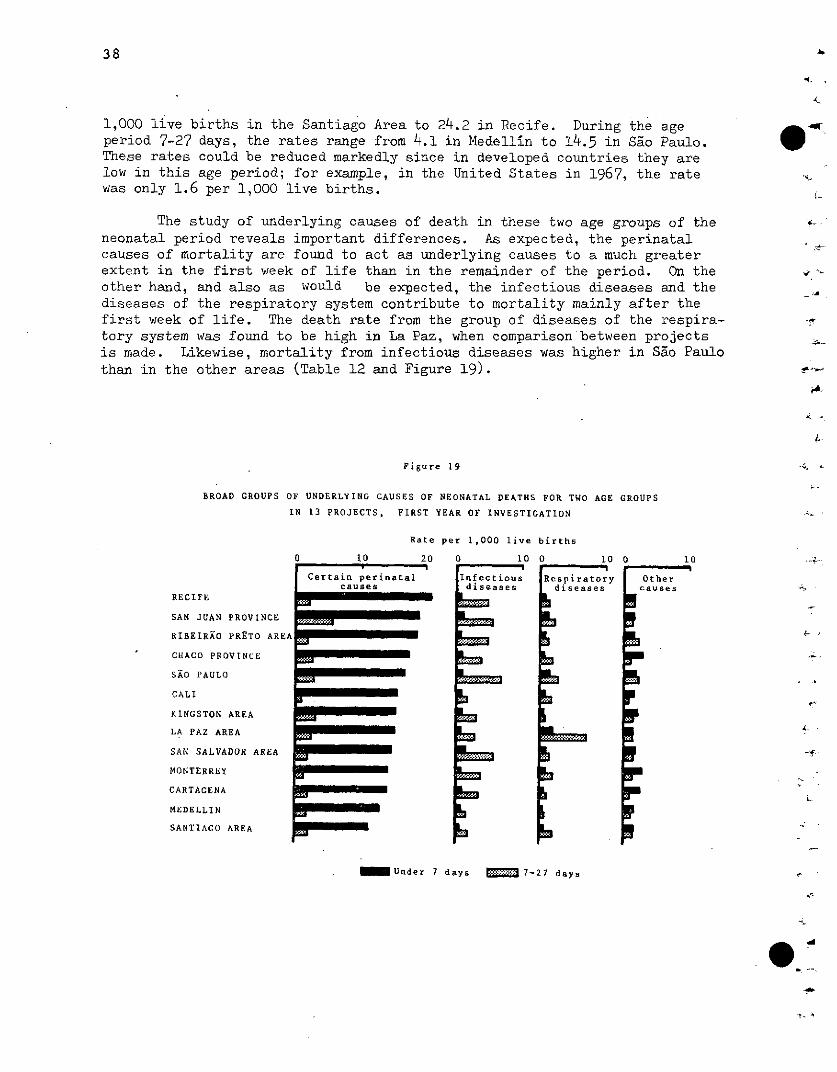
38
1,000 live births in the Santiago Area to 24.2 in Recife. During the ageperiod 7-27 days, the rates range from 4.1 in Medellín to 14.5 in Sao Paulo.These rates could be reduced markedly since in developed countries they arelow in this age period; for example, in the United States in 1967, the ratewas only 1.6 per 1,000 live births.
The study of underlying causes of death in these two age groups of theneonatal period reveals important differences. As expected, the perinatalcauses of mortality are found to act as underlying causes to a much greaterextent in the first week of life than in the remainder of the period. On theother hand, and also as would be expected, the infectious diseases and thediseases of the respiratory system contribute to mortality mainly after thefirst week of life. The death rate from the group of diseases of the respira-tory system was found to be high in La Paz, when comparison between projectsis made. Likewise, mortality from infectious diseases was higher in Sao Paulothan in the other areas (Table 12 and Figure 19).
Figure 19
BROAD GROUPS OF UNDERLYING CAUSES OF NEONATAL DEATHS FOR TWO AGE GROUPS
IN 13 PROJECTS, FIRST YEAR OF INVESTIGATION
Rate per 1,000 live births
.
RECIFE
SAN JUAN PROVINCE
RIBEIRAO PRETO AREA
CHACO PROVINCE
SAO PAULO
CALI
KINGSTON AREA
LA PAZ AREA
SAN SALVADOR AREA
MONTERREY
CARTAGENA
MEDELLIN
SANTIAGO AREA
0 10 20
Certain perinatalcauses
,,L_
aa
-!rm
ma
4~
0 10
Infectiousdiseases
0 10
Respiratorydiseases
0 10
Othercauses
~ Under 7 days *': 7-27 days
A.
,e
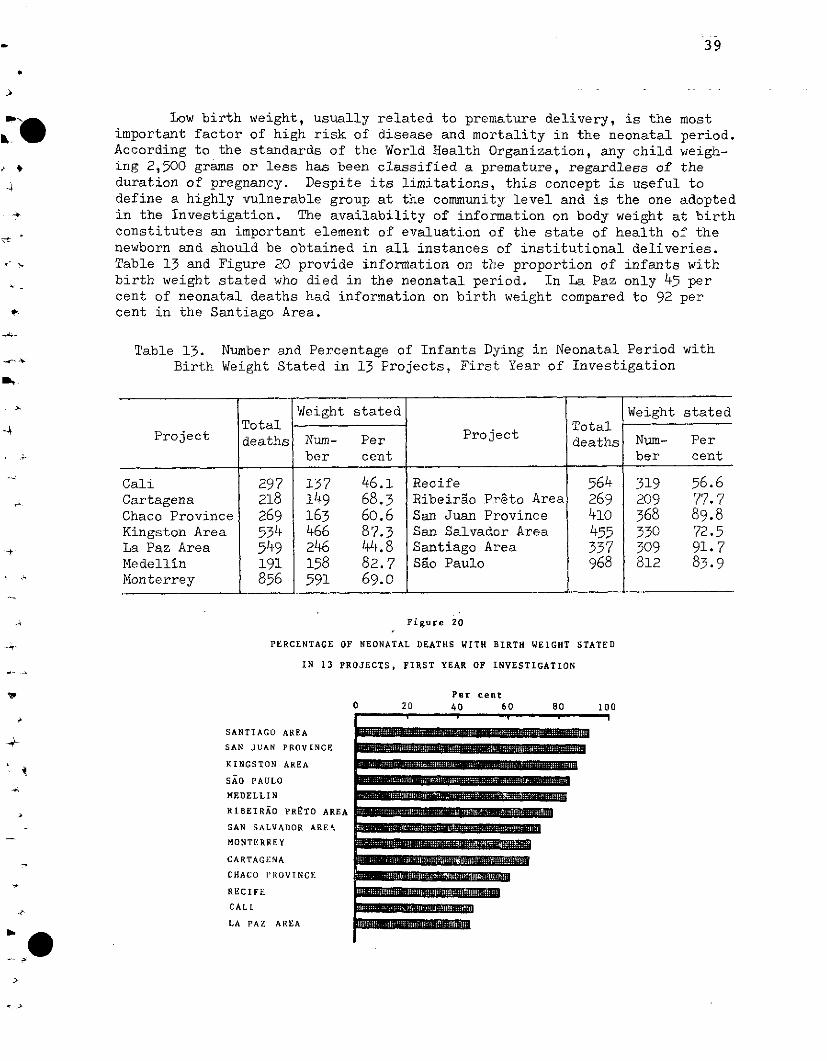
39
Low birth weight, usually related to premature delivery, is the mostimportant factor of high risk of disease and mortality in the neonatal period.According to the standards of the World Health Organization, any child weigh-ing 2,500 grams or less has been classified a premature, regardless of theduration of pregnancy. Despite ita limitations, this concept is useful todefine a highly vulnerable group at the community level and is the one adoptedin the Investigation. The availability of information on body weight at birthconstitutes an important element of evaluation of the state of health of thenewborn and should be obtained in all instances of institutional deliveries.Table 13 and Figure 20 provide information on the proportion of infants withbirth weight stated who died in the neonatal period. In La Paz only 45 percent of neonatal deaths had information on birth weight compared to 92 percent in the Santiago Area.
Table 13. Number and Percentage of Infants Dying in Neonatal Period withBirth Weight Stated in 13 Projects, First Year of Investigation
Weight stated Weight statedTotal Total
Project deaths Num- Per Project deaths Num- Perber cent ber cent
Cali 297 137 46.1 Recife 564 319 56.6Cartagena 218 149 68.3 Ribeirao Preto Area 269 209 77.7Chaco Province 269 163 60.6 San Juan Province 410 368 89.8Kingston Area 534 466 87.3 San Salvador Area 455 330 72.5La Paz Area 549 246 44.8 Santiago Area 337 309 91.7Medellin 191 158 82.7 Sao Paulo 968 812 83.9Monterrey 856 591 69.0
Figure 20
PERCENTAGE OF NEONATAL DEATHS WITH BIRTH WEIGHT STATED
IN 13 PROJECTS, FIRST YEAR OF INVESTIGATION
SANTIAGO AREA
SAN JUAN PROVINCE
KINGSTON AREA
SAO PAULO
MEDELLIN
RIBEIRAO PRETO AREA
SAN SALVADOR AREA^
MONTERREY
CARTAGENA
CHACO PROVINCE
RECIFE
CALI
LA PAZ AREA
Per cen0 20 40 60 80 100
1 1I~
BII~~EEMEi~~~~slOlae~~~~~~~~~~~llllR1AIRrrr~~~~~~~~~~~~~~~~~~~~~
iffiPwuxff~ia affialmm=~B<Illllnn - 1aa~p
~f~g ama~mm&Blg
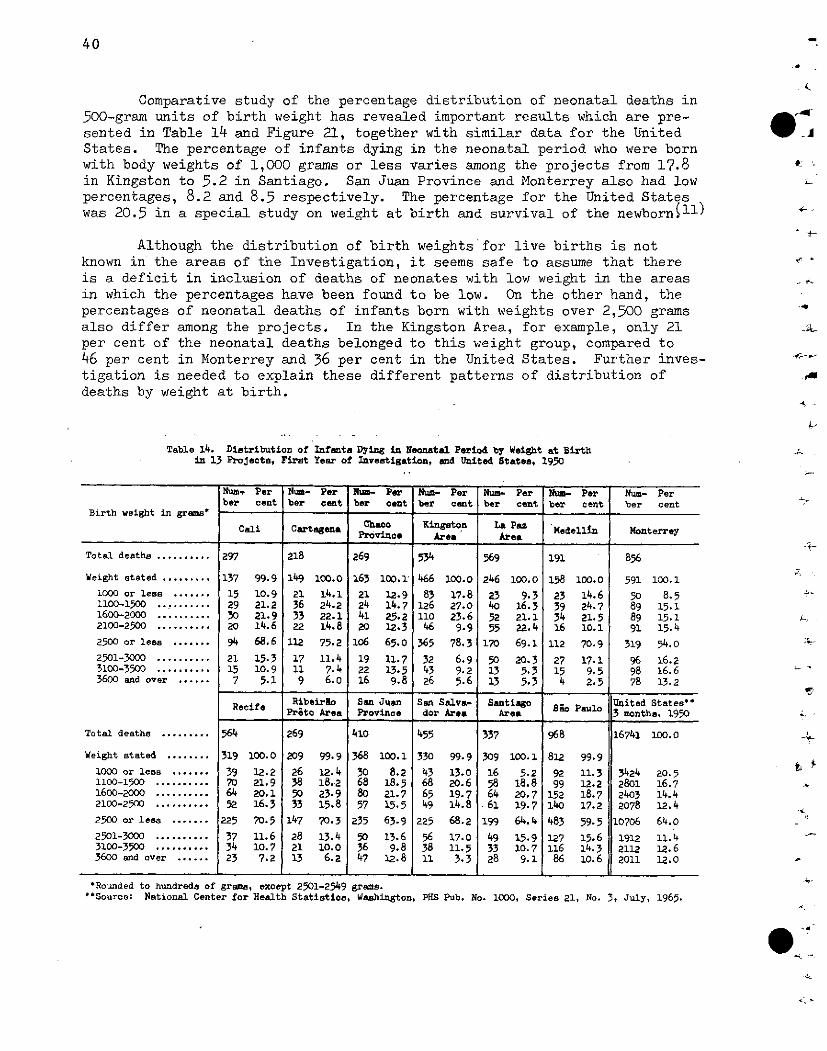
40
Comparative study of the percentage distribution of neonatal deaths in500-gram units of birth weight has revealed important results which are pre-sented in Table 14 and Figure 21, together with similar data for the UnitedStates. The percentage of infants dying in the neonatal period who were bornwith body weights of 1,000 grams or less varies among the projects from 17.8in Kingston to 5.2 in Santiago. San Juan Province and Monterrey also had lowpercentages, 8.2 and 8.5 respectively. The percentage for the United Stateswas 20.5 in a special study on weight at birth and survival of the newborn l l)
Although the distribution of birth weights for live births is notknown in the areas of the Investigation, it seems safe to assume that thereis a deficit in inclusion of deaths of neonates with low weight in the areasin which the percentages have been found to be low. On the other hand, thepercentages of neonatal deaths of infants born with weights over 2,500 gramsalso differ among the projects. In the Kingston Area, for example, only 21per cent of the neonatal deaths belonged to this weight group, compared to46 per cent in Monterrey and 36 per cent in the United States. Further inves-tigation is needed to explain these different patterns of distribution ofdeaths by weight at birth.
Table 14. Distribution of Infanta Dying in Neonatal Period by Weight at Birthin 13 ProJects, Frest Year of Inveetigation, end United States, 1950
Num. Per Num- Per Num- Per Num- Per Num- Per Nu Per Num- Perber cent ber cent ber cent ber cent ber cent ber cent ber cent
Birth weight in gramsoCali Cartegena Chaco Kingaton La Paz Medellin Monterrey
Province Área Area
Total deaths .......... 297 218 269 534 569 191 856
Weight stated ......... 137 99.9 149 100.0 163 100.1 466 100.0 246 100.0 158 100.0 591 100.1
1000 or lees ....... 15 10.9 21 14.1 21 12.9 83 17.8 23 9.3 23 14.6 50 8.51100-1500 .. ....... 29 21.2 36 24.2 24 14.7 126 27.0 40 16.3 39 24.7 89 15.11600-2000 .......... 30 21.9 33 22.1 41 25.2 110 23.6 52 21.1 34 21.5 89 15.12100-2500 .......... 20 14.6 22 14.8 20 12.3 46 9.9 55 22.4 16 10.1 91 15.4
2500 or less ....... 94 68.6 112 75.2 106 65.0 365 78.3 170 69.1 112 70.9 319 54.0
2501-3000 .......... 21 15.3 17 11.4 19 11.7 32 6.9 50 20.3 27 17.1 96 16.23100-3500 .......... 15 10.9 11 7.4 22 13.5 43 9.2 13 5.3 15 9.5 98 16.63600 and over ...... 7 5.1 9 6.0 16 9.8 26 5.6 13 5.3 4 2.5 78 13.2
i Riboirlo San Juan San Salva- Santiago United States'Recife Si PauloPreto Area Povino. dor Areae Ar.a 3 months, 1950
Total deatha ......... 564 269 410 455 337 968 16741 100.0
Weight stated ........ 319 100.0 209 99.9 368 100.1 330 99.9 309 100.1 812 99.9
1000 or less ....... 39 12.2 26 12.4 30 8.2 43 13.0 16 5.2 92 11.3 3424 20.51100-1500 .......... 70 21.9 38 18.2 68 18.5 68 20.6 58 18.8 99 12.2 2801 16.71600-2000 .......... 64 20.1 50 23.9 80 21.7 65 19.7 64 20.7 152 18.7 2403 14.42100-2500 .......... 52 16.3 33 15.8 57 15.5 49 14.8 61 19.7 140 17.2 2078 12.4
2500 or leas ....... 225 70.5 147 70.3 235 63.9 225 68.2 199 64.4 483 59.5 10706 64.0
2501-3000 .......... 37 11.6 28 13.4 50 13.6 56 17.0 49 15.9 127 15.6 1912 11.43100-3500 .......... 34 10.7 21 10.0 36 9.8 38 11.5 33 10.7 116 14.3 2112 12.63600 and over ...... 23 7.2 13 6.2 47 12.8 11 3.3 28 9.1 86 10. 6 2011 12.0
·Rounded to hundreds of grams, except 2501-2549 grams.''Source: National Center for Health Statistics, Washington, PHS Pub. No. 1000, Series 21, No. 3, July, 1965.
-
4-
fa
i1~
,.
4G
e
- Es1
9 -
1-
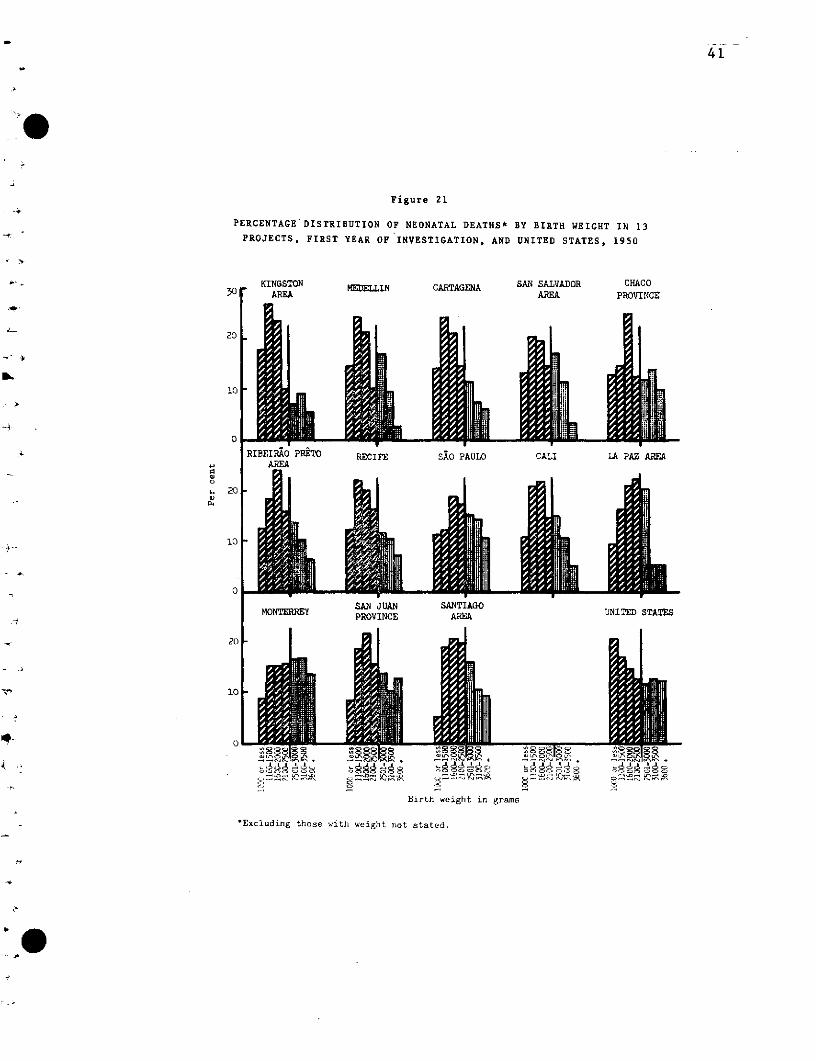
41
Figure 21
PERCENTAGE'DISTRIBUTION OF NEONATAL DEATHS* BY BIRTH WEIGHT IN 13PROJECTS, FIRST YEAR OF INVESTIGATION, AND UNITED STATES, 1950
KINGSTONAREA
MEDELLIN CARTAGENA SAN SALVADORAREA
jCALI
CHACOPROVINCE
LA PAZ AREA
UNITED STATES
KodoáocJ
1,8 Xigh so
Birth weight in grams
*Excluding those with weight not stated.
a>
1ae888 8
Zi$ :a ,gL 1 M'
42
With respect to causes of death, the conditions included in the Section ^'
of Certain Causes of Perinatal Mortality in the International Classificationof Diseases play the most important role in neonatal mortality and involverelevant interrelationships. This broad group of causes include among othersthe following conditions:
Maternal conditions, categories 760-763, including those related tothe pregnancy state and others independent of gestation.
Difficult labor and injury occurring at birth, categories 764-768and 772, which provide linkage between the type of distocia or causeand effect on the product of gestation through a fourth digit.
Important complications of pregnancy, category 769, such as prematurerupture of membranes, hydramnios, multiple pregnancy, antepartumhemorrhage and others.
Abnormal conditions of placenta and cord, categories 770 and 771.
Hemolytic disease of the newborn, categories 774-775, with or with-out kernicterus.
Hypoxic and anoxic conditions of unspecified cause, category 776,which includes hyaline membrane disease, respiratory distress syn-drome, fetal distress, and others.
Immaturity or prematurity, unqualified, category 777.
Other complications of the newborn, category 778.
Essentially all deaths due to these causes occurred in the neonatal period -tand constitute more than one-half of the deaths in this period of life.
Among the broad group of infective and parasitic diseases, diarrhealdisease is by far the most important underlying cause of death in the neona-tal period, as previously shown in Figures 16 and 17. In Cartagena, theKingston Area, the Ribeiráo Preto Area and San Juan Province, over 60 percent of these deaths from diarrheal disease occurred in immature neonates.In some areas, the lack of data on immaturity makes it difficult to establishthis relationship. In Sao Paulo, for example, 36 of the 171 neonatal deaths ,from diarrhea were of infants with clinical evidence of deficient growthwhich had to be classified in categories of nutritional deficiency becauseweights at birth or other evidence of immaturity were not available. A sim- -Filar situation occurred in Recife.
Certain specific infectious diseases act as causes of death principallyin the neonatal period. For example, tetanus was the underlying cause of 92deaths in the neonatal period out of a total of 103 deaths under 5 years ofage from tetanus in all projects. Septicemia was the underlying cause of 160deaths in the neonatal period; the total number of deaths from this causewas 196. Congenital syphilis was the underlying cause of 28 deaths in theneonatal period out of 48 deaths under 5 years of age.
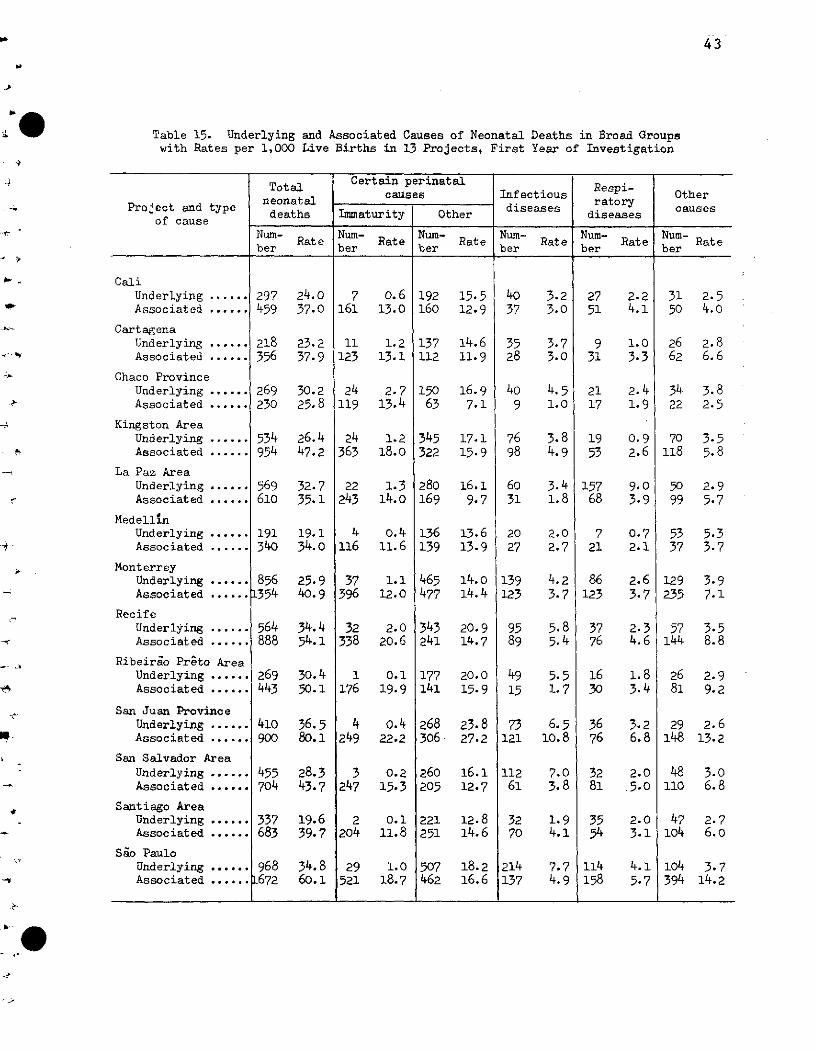
43
Table 15. Underlying and Associated Causes of Neonatal Deaths in Broad Groupswith Rates per 1,000 Live Births in 13 Projects, First Year of Investigation
Total Certain perinatal Respi-Teotadtal tpecauses Infectious ratory Other
Project and typediseases disasedeaths Immaturity Other diseases diseasesof cause
Num- Num- Num- Num- Num- Num-Rate Rate Rate Rate Rate Rateber ber ber ber ber ber
CaliUnderlying .Associated
CartagenaUnderlyingAssociated
Chaco ProvinceUnderlyingAssociated
Kingston AreaUnderlyingAssociated
La Paz AreaUnderlyingAssociated
MedellinUnderlyingAssociated
MonterreyUnderlyingAssociated
RecifeUnderlyingAssociated
297459
...... 218
...... 356
...... 269
...... 230
...... 534.... .9 54
569610
....... 191...... .. 340
...... 856
...... 1354
...... 564
...... 888
Ribeirao Preto AreaUnderlying ......Associated ......
San Juan ProvinceUnderlying ......Associated ......
San Salvador Area
269443
410900
Underlying ...... 455Associated ...... 704
Santiago AreaUnderlyingAssociated
Sao PauloUnderlying ......Associated ......
...... 337
...... 683
24.037.0
23.237.9
30.225.8
26.447.2
32.735.1
19.134.0
25.940.9
34.454.1
3o.450.1
36.580.1
28.343.7
19.639.7
968 34.81672 60.1
7 0.6161 13.0
11 1.2123 13.1
24 2.7119 13.4
24 1.2363 18.0
22243
1.314.0
4 0.4116 11.6
37 1.1396 12.0
32 2.0338 20.6
1176
192 15.5160 12.9
137112
15063
14.611.9
4037
3528
16.9 407.1 9
345 17.1322 15.9
280 16.1169 9.7
136 13.6139 13.9
465477
14.014.4
343 20.9241 14.7
0.1 17719.9 141
4 0.4249 22.2
3 0.2247 15.3
2204
29521
0.111.8
1.018.7
268306
260205
221251
507462
20.015.9
23.827.2
16.112.7
12.814.6
18.216.6
7698
6031
3.23.0
3.73.0
4.51.0
3.84.9
3.41.8
20 2.027 2.7
139123
9589
4915
4.23.7
5.85.4
5.51.7
73 6.5121 10.8
11261
3270
7.03.8
1.94.1
214 7.7137 4.9
2751
931
2117
1953
2.24.1
1.03.3
2.41.9
0.92.6
157 9.068 3.9
721
3150
2662
3422
70118
5099
0.7 532.1 37
86 2.6123 3.7
3776
163o
3676
3281
3554
114158
2.34.6
1.83.4
3.26.8
2.05.0
2.03.1
4.15.7
2.54.0
2.86.6
3.82.5
3.55.8
2.95.7
5.33.7
129 3.9235 7.1
57144
2681
29148
48110
47104
3.58.8
2.99.2
2.613.2
3.06.8
2.76.0
104 3.7394 14.2
-- -1
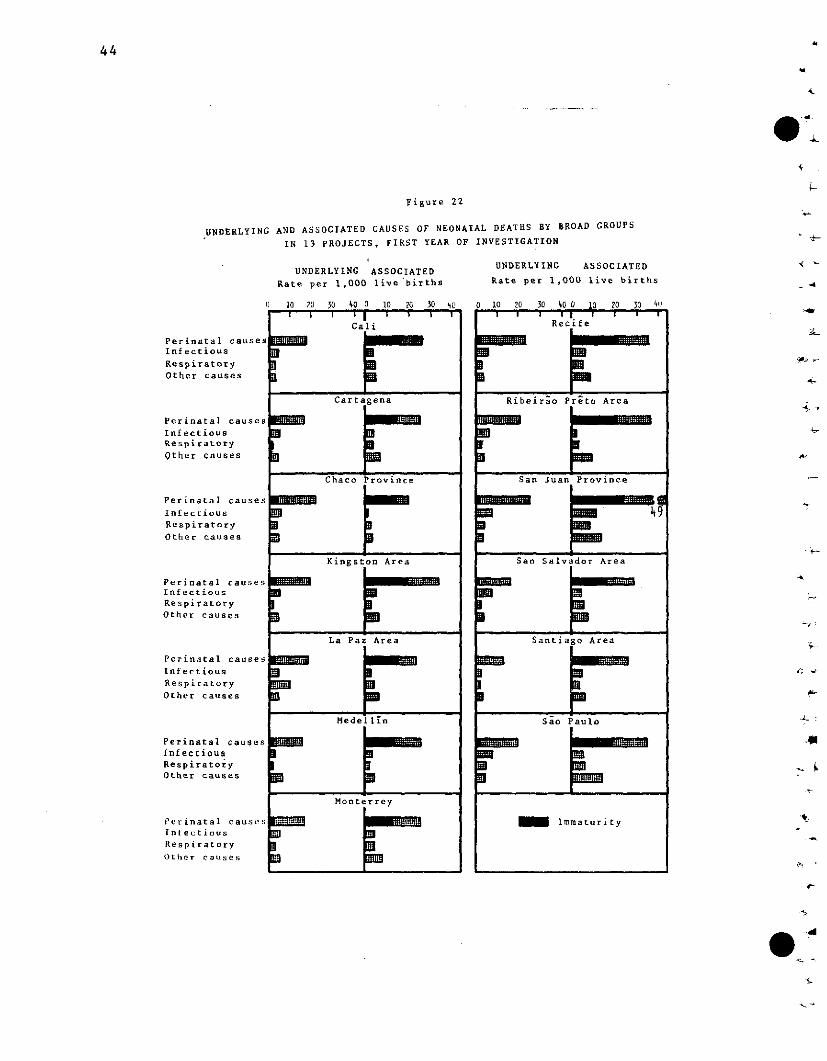
44
*-
Figure 22
UNDERLYING AND ASSOCIATED CAUSES OF NEONATAL DEATHS BY BROAD GROUPS
IN 13 PROJECTS, FIRST YEAR OF INVESTIGATION
UNDERLYING ASSOCIATED <UNDERLYING ASSOCIATED
Rate per 1,000 live births Rate per 1,000 live births
10 20 30 40 0 10 20 30 41 0 10 20 30 400 10 20 30 4'0
Cali Recife
Perinatal causesInfectious
RespiratoryOther causes
Cartagena Ribeirao Preto Area
Perinatal causes
InfectiousRespiratory
Other causes b[B
Chaco Province San Juan Province
Perinatal causes
Infectious _ 4RespiratoryOther causes
Kingston Area San Salvador Area
Perinatal causes _InfectiousRespiratoryOther causes
La Paz Area SantiaDo Area
Perinatal causesInfectious BRespiratory __]Other causes _& _ _ _
Medellin Sio P aulo .
Perinatal causes - -_Infectious 3
RespiratoryOther causes
Monterrey
Perinatal causes ImmaturityInfectiousRespiratoryOther causes
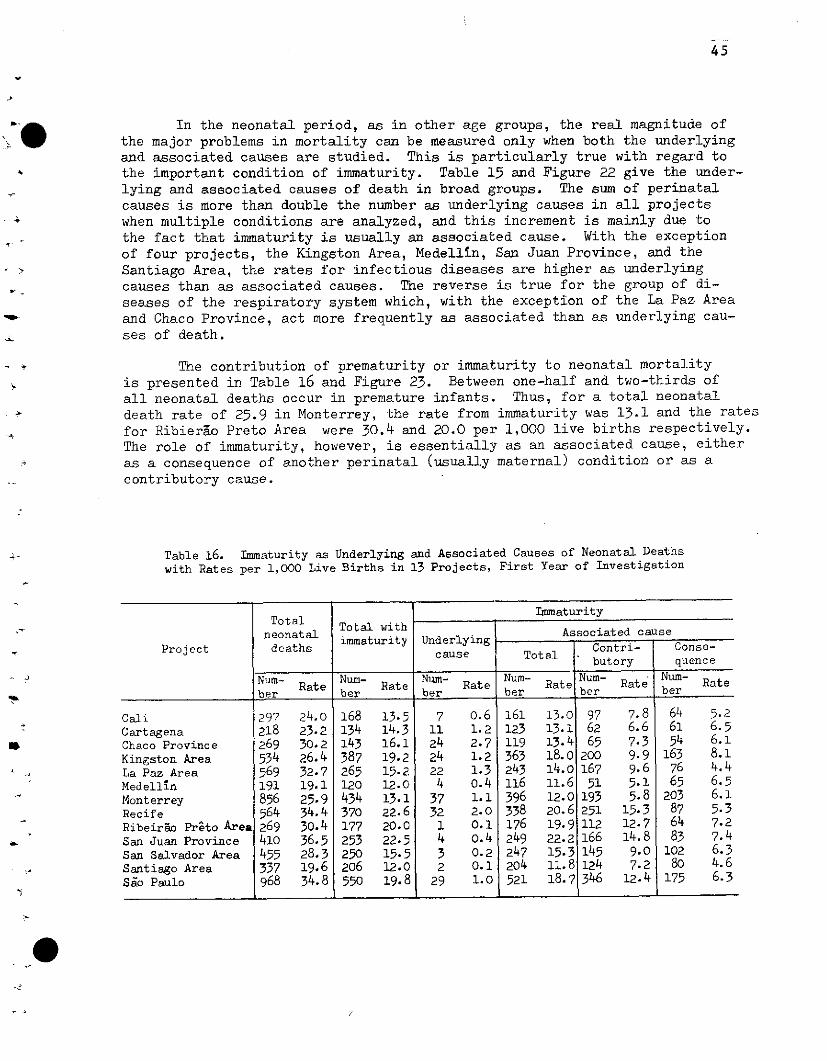
45
In the neonatal period, as in other age groups, the real magnitude of
the major problems in mortality can be measured only when both the underlyingand associated causes are studied. This is particularly true with regard tothe important condition of immaturity. Table 15 and Figure 22 give the under-lying and associated causes of death in broad groups. The sum of perinatal
causes is more than double the number as underlying causes in all projectswhen multiple conditions are analyzed, and this increment is mainly due tothe fact that immaturity is usually an associated cause. With the exception
of four projects, the Kingston Area, Medellin, San Juan Province, and the
Santiago Area, the rates for infectious diseases are higher as underlying
causes than as associated causes. The reverse is true for the group of di-
seases of the respiratory system which, with the exception of the La Paz Area
and Chaco Province, act more frequently as associated than as underlying cau-
ses of death.
The contribution of prematurity or immaturity to neonatal mortality
is presented in Table 16 and Figure 23. Between one-half and two-thirds of
all neonatal deaths occur in premature infants. Thus, for a total neonatal
death rate of 25.9 in Monterrey, the rate from immaturity was 13.1 and the rates
for Ribierao Preto Area were 30.4 and 20.0 per 1,000 live births respectively.The role of immaturity, however, is essentially as an associated cause, either
as a consequence of another perinatal (usually maternal) condition or as a
contributory cause.
Table 16. Immaturity as Underlying and Associated Causes of Neonatal Deathswith Rates per 1,000 Live Births in 13 Projects, First Year of Investigation
ImmaturityTotal withneTotal Total with Associated cause
neonatal immaturity UnderlyingProject deaths Contri- Conse-
butory quence
Num- Num- Num- Num- Num- Num-m Rate Rate e Rate Rate Nurn- at Num- ate
ber ber b er ber b er ber
Cali 297 24.0 168 13.5 7 0.6 161 13.0 97 7.8 64 5.2
Cartagena 218 23.2 134 14.3 11 1.2 123 13.1 62 6.6 61 6.5
Chaco Province 269 30.2 143 16.1 24 2.7 119 13.4 65 7.3 54 6.1Kingston Area 534 26.4 387 19.2 24 1.2 363 18.0 200 9.9 163 8.1La Paz Area 569 32.7 265 15.2 22 1.3 243 14.0 167 9.6 76 4.4
Medellin 191 19.1 120 12.0 4 0.4 116 11.6 51 5.1 65 6.5Monterrey 856 25.9 434 13.1 37 1.1 396 12.0 193 5.8 203 6.1Recife 564 34.4 370 22.6 32 2.0 338 20.6 251 15.3 87 5.3
Ribeirao Preto Area 269 30.4 177 20.0 1 0.1 176 19.9 112 12.7 64 7.2San Juan Province 410 36.5 253 22.5 4 0.4 249 22.2 166 14.8 83 7.4San Salvador Area 455 28.3 250 15.5 3 0.2 247 15.3 145 9.0 102 6.3Santiago Area 337 19.6 206 12.0 2 0.1 204 11.8 124 7.2 80 4.6Sao Paulo 968 34.8 550 19.8 29 1.0 521 18.7 346 12.4 175 6.3
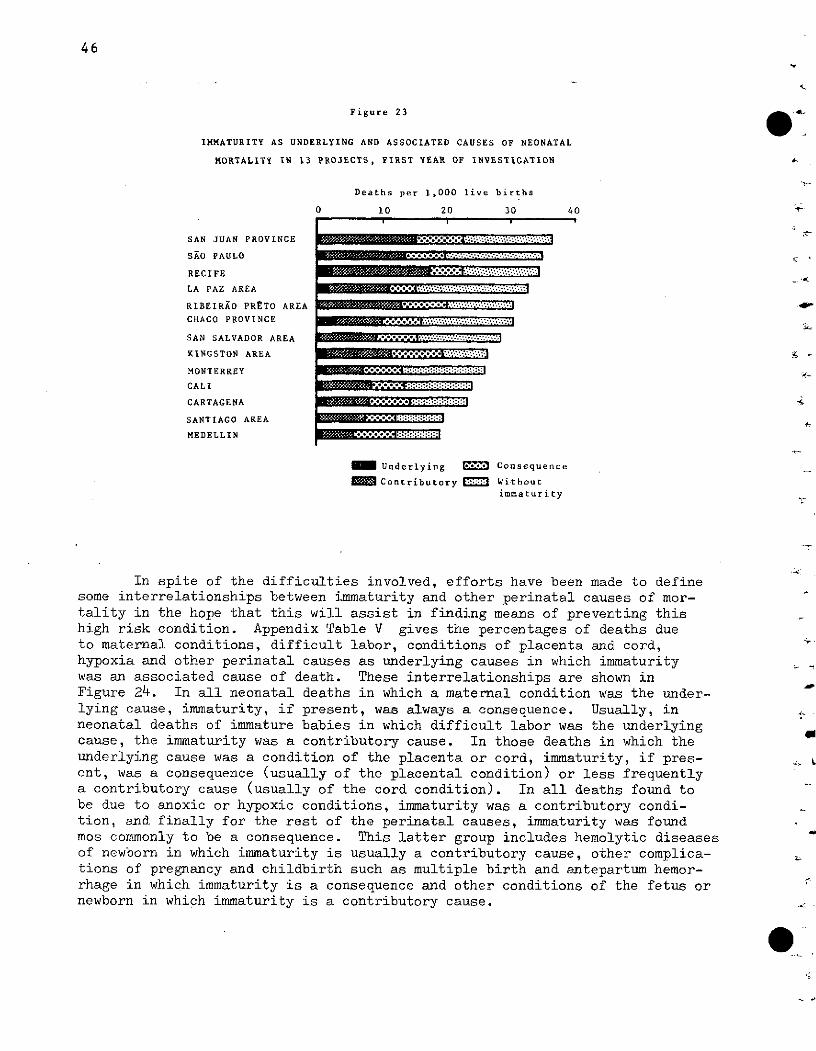
46
Figure 23
IMMATURITY AS UNDERLYING AND ASSOCIATED CAUSES OF NEONATAL
MORTALITY IN 13 PROJECTS, FIRST YEAR OF INVESTIGATION
Deaths per 1,000 live births
0 10 20 30 40
SAN JUAN PROVINCE .. .. ::
SAO PAULO .
RECIFE
LA PAZ AREA
RIBEIRAO PRETO AREA .CHACO PROVINCE
SAN SALVADOR AREA .,..
KINGSTON AREA .fff......... _
MONTERREY
CALI
CARTAGENA : - : . : ,',,.,.,.,::::::::::::: i:::
SANTIAGO AREA
MEDELLIN - IB i,2 -::::::::::!
_ Underlying *-[" Consequence
Contributory *:. Without
immaturity
In spite of the difficulties involved, efforts have been made to definesome interrelationships between immaturity and other perinatal causes of mor-tality in the hope that this will assist in finding means of preventing thishigh risk condition. Appendix Table V gives the percentages of deaths dueto maternal conditions, difficult labor, conditions of placenta and cord,hypoxia and other perinatal causes as underlying causes in which immaturitywas an associated cause of death. These interrelationships are shown inFigure 24. In all neonatal deaths in which a maternal condition was the under-lying cause, immaturity, if present, was always a consequence. Usually, inneonatal deaths of immature babies in which difficult labor was the underlyingcause, the immaturity was a contributory cause. In those deaths in which theunderlying cause was a condition of the placenta or cord, immaturity, if pres-ent, was a consequence (usually of the placental condition) or less frequentlya contributory cause (usually of the cord condition). In all deaths found tobe due to anoxic or hypoxic conditions, immaturity was a contributory condi-tion, and finally for the rest of the perinatal causes, immaturity was foundmos commonly to be a consequence. This latter group includes hemolytic diseasesof newborn in which immaturity is usually a contributory cause, other complica-tions of pregnancy and childbirth such as multiple birth and antepartum hemor-rhage in which immaturity is a consequence and other conditions of the fetus ornewborn in which immaturity is a contributory cause.
. .~~~~
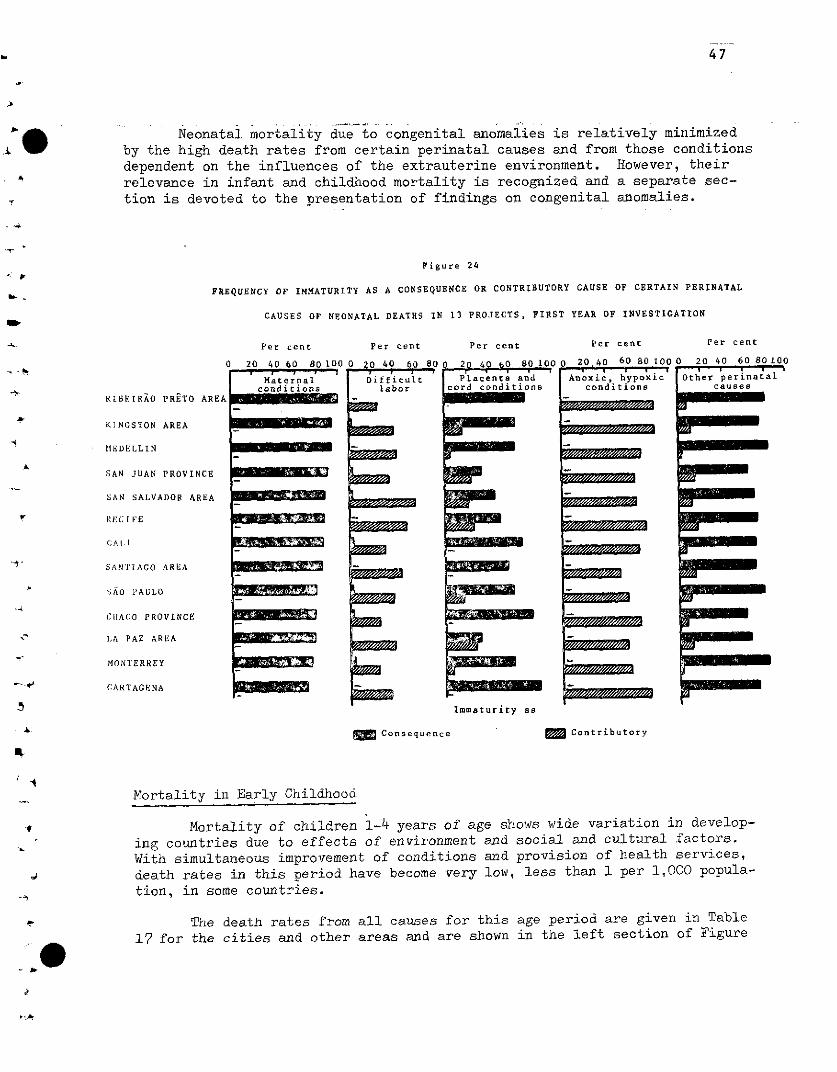
47
Neonatal mortality due to congenital anomalies is relatively minimized
by the high death rates from certain perinatal causes and from those conditions
dependent on the influences of the extrauterine environment. However, their
relevance in infant and childhood mortality is recognized and a separate sec-
tion is devoted to the presentation of findings on congenital anomalies.
Figure 24
FREQUENCY OF IMNATURITY AS A CONSEQUENCE OR CONTRIBUTORY CAUSE OF CERTAIN PERINATAL
CAUSES OF NEONATAL DEATHS IN 13 PROJECTS, FIRST YEAR OF INVESTIGATION
Per cent Per cent Per cent Per cent Per cent
RIBEIRAO PRETO ARE,
KINGSTON AREA
MEDELLIN
SAN JUAN PROVINCE
SAN SALVADOR AREA
RECIFE
CAl. I
SANTIAGO AREA
SAO PAULO
CHACO PROVINCE
_-
_-
LA PAZ AREA
_-
MON TERREY
CARTAGENA
2 40 60 80 l0 20,40 60 80100
Pilacenta and Anoxic, hypoxiccord conditions conditions
_ -=/////.////////
k 5-
3_
Immaturity as
Consequence ] Contributory
Mortality in Early Childhood
Mortality of children 1-4 years of age shows wide variation in develop-
ing countries due to effects of environment and social and cultural factors.
With simultaneous improvement of conditions and provision of health services,
death rates in this period have become very low, less than 1 per 1,000 popula-
tion, in some countries.
The death rates from all causes for this age period are given in Table
17 for the cities and other areas and are shown in the left section of Figure
e
m=
Em~PL?B~PMI
ME~~Bm=eLSBII~S
zff~1-1~
1-ar~
w_~=~~p
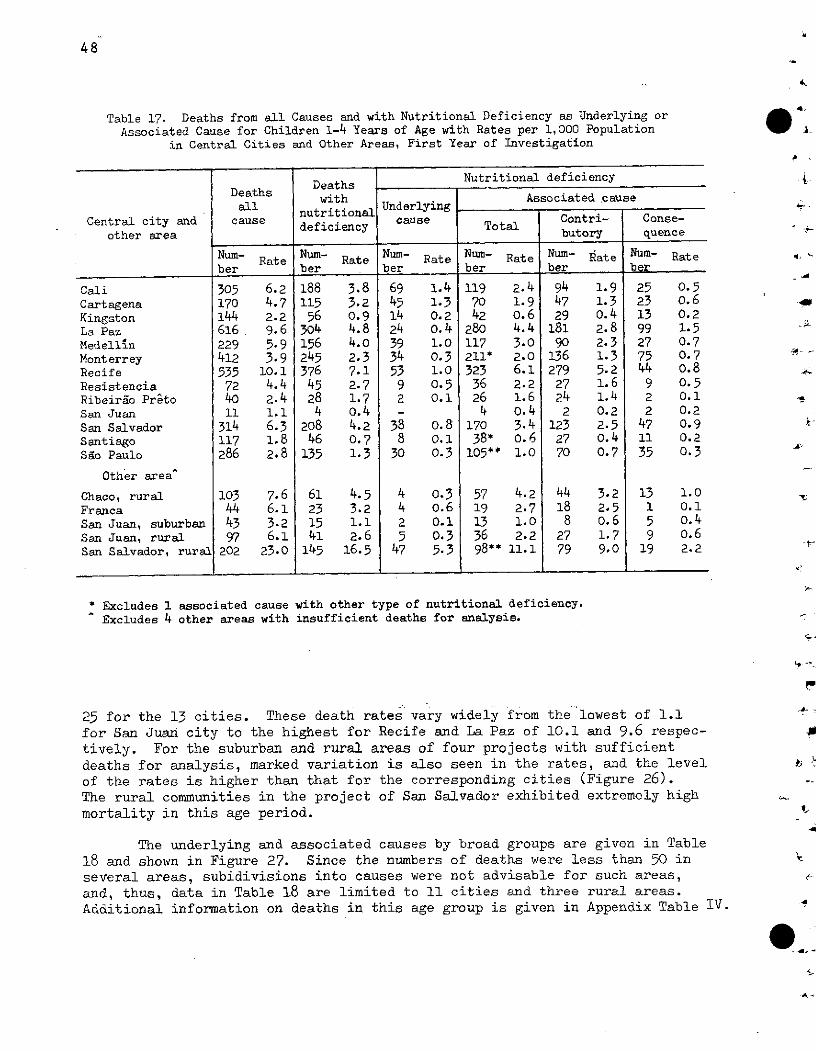
48
Table 17. Deaths from all Causes and with Nutritional Deficiency as Underlying orAssociated Cause for Children 1-4 Years of Age with Rates per 1,000 Population
in Central Cities and Other Areas, First Year of Investigation
Daths Deaths . Nutritional deficiency
with Associated causeall nutritional
Central city and cause nutritional cause Contri- Conse-
other area butory quence
Num ate ate Nu- ate Num- Rate Nu- Rate Num- Rateber ber ber ber ber ber
Cali 305 6.2 188 3.8 69 1.4 119 2.4 94 1.9 25 0.5Cartagena 170 4.7 115 3.2 45 1.3 70 1.9 47 1.3 23 o.6
Kingston 144 2.2 56 0.9 14 0.2 42 0.6 29 0.4 13 0.2
La Paz 616 9.6 304 4.8 24 0.4 280 4.4 181 2.8 99 1.5
Medellin 229 5.9 156 4.0 39 1.0 117 3.0 90 2.3 27 0.7
Monterrey 412 3.9 245 2.3 34 0.3 211* 2.0 136 1.3 75 0.7Recife 535 10.1 376 7.1 53 1.0 323 6.1 279 5.2 44 0.8
Resistencia 72 4.4 45 2.7 9 0.5 36 2.2 27 1.6 9 0.5Ribeirao Preto 40 2.4 28 1.7 2 0.1 26 1.6 24 1.4 2 0.1
San Juan 11 1.1 4 0.4 - 4 0.4 2 0.2 2 0.2
San Salvador 314 6.3 208 4.2 38 0.8 170 3.4 123 2.5 47 0.9
Santiago 117 1.8 46 .7 8 0.1 38* o.6 27 .4 11 0.2
Sao Paulo 286 2.8 135 1.3 30 0.3 105** 1.O 70 0.7 35 0.3
Other area'
Chaco, rural 103 7.6 61 4.5 4 0.3 57 4.2 44 3.2 13 1.0Franca 44 6.1 23 3.2 4 0.6 19 2.7 18 2.5 1 0.1
San Juan, suburban 43 3.2 15 1.1 2 0.1 13 1. 8 .6 5 0.4
San Juan, rural 97 6.1 41 2.6 5 0.3 36 2.2 27 1.7 9 0.6
San Salvador, rural 202 23.0 145 16.5 47 5.3 98** 11.1 79 9.0 19 2.2
* Excludes 1 associated cause with other type of nutritional deficiency.Excludes 4 other areas with insufficient deaths for analysis.
25 for the 13 cities. These death rates vary widely from the lowest of 1.1
for San Juan city to the highest for Recife and La Paz of 10.1 and 9.6 respec-
tively. For the suburban and rural areas of four projects with sufficient
deaths for analysis, marked variation is also seen in the rates, and the level
of the rates is higher than that for the corresponding cities (Figure 26).The rural communities in the project of San Salvador exhibited extremely high
mortality in this age period.
The underlying and associated causes by broad groups are given in Table
18 and shown in Figure 27. Since the numbers of deaths were less than 50 in
several areas, subidivisions into causes were not advisable for such areas,
and, thus, data in Table 18 are limited to 11 cities and three rural areas.
Additional information on deaths in this age group is given in Appendix Table IV.
&
. 4
-u
'4
-A
i_
t·
0 �d, -
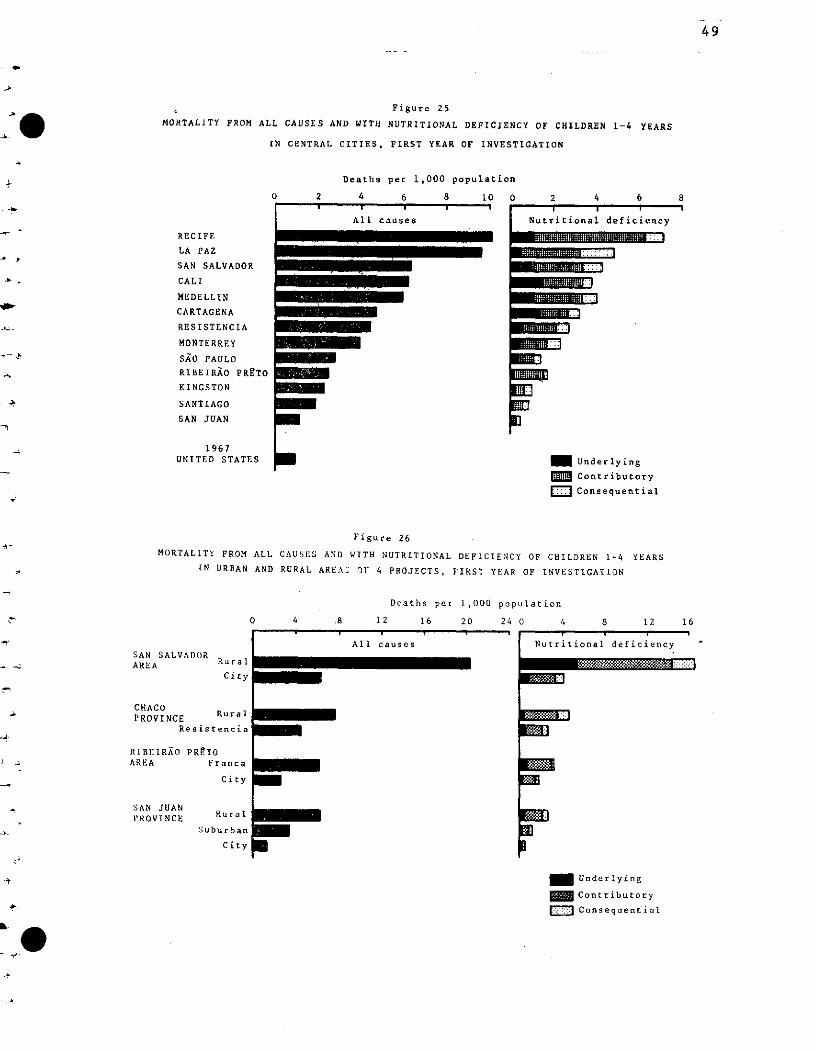
49
Figure 25
MORTALITY FROM ALL CAUSES AND WITH NUTRITIONAL DEFICIENCY OF CHILDREN 1-4 YEARS
IN CENTRAL CITIES, FIRST YEAR OF INVESTIGATION
Deaths per 1,000 population
RECIFE
LA PAZ
SAN SALVADOR
CALI
MEDELLIN
CARTAGENA
RESISTENCIA
MONTERREY
SAO PAULO
RIBEIRAO PRETO
KINGSTON
SANTIAGO
SAN JUAN
1967UNITED STATES
0 2 4 6 8 10
All causes
II
0 2 4 6 8
Nutritíonal deficiency
. ...... - --- ~~~~~~~~::i5: :: ::: ,
ENEEH~ I : :: :a
_1
EEnm
M Underlying
E Contributory
: Consequential
Figure 26
MORTALTY FROM ALL CAUSES AND WITH NUTRITIONAL DEFICIENCY OF CHILDREN 1-4 YEARS
IN URBAN AND RURAL AREA_ OF 4 PROJECTS, FIRST YEAR OF INVESTIGATION
Deaths per 1,000 population
0 4 8 12 16 20 24 0 4 8 12 16
SAN SALVADORAREA Rural
City
All causes
CHACOPROVINCE
Resistencia
RIBEIRAO PRETOAREA Franca
City
SAN JUANPROVINCE Ru r al
Suburban
City m
aI
Nutritional deficiency
., -f . .;'; .:.; .
nElo
_ Underlying
= Contributory
::iConsequential
IICM c,,l
m l~l
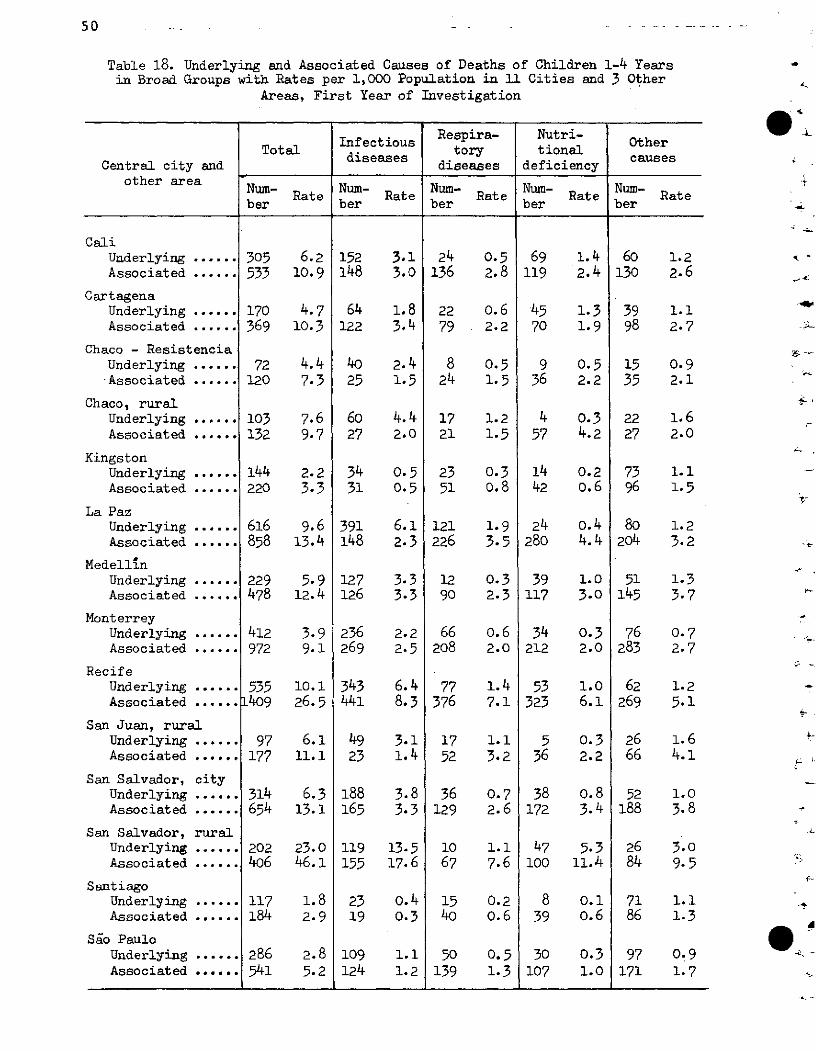
50
Table 18. Underlying and Associated Causes of Deaths of Children 1-4 Yearsin Broad Groups with Rates per 1,000 Population in 11 Cities and 3 Other
Areas, First Year of Investigation
. 4
Infectious Respira- Nutri- OtherTotal tory tionaldiseases toy tional causes
Central city and diseases deficiency
other area Num- Num- Num- Num- Num-Rate Rate Rate Rate Rate
ber ber ber ber ber
CaliUnderlyingAssociated
CartagenaUnderlyingAssociated
...... 305
.... 533
.... 170
...... 369
Chaco - ResistenciaUnderlying ...... 72Associated ...... 120
Chaco, ruralUnderlying ......Associated ......
KingstonUnderlying ......Associated ......
La PazUnderlying ......Associated ......
MedellinUnderlying .Associated .
MonterreyUnderlying .Associated ..
RecifeUnderlying .Associated .
San Juan, ruralUnderlying .Associated .
San Salvador, c:Underlying .Associated .
San Salvador, riUnderlying .Associated .
SantiagoUnderlying .Associated .
Sao PauloUnderlying .Associated .
6.210.9
4.710.3
4.47.3
103 7.6132 9.7
144 2.2220 3.3
616 9.6858 13.4
..... 229..... 478
...... 535
..... 409
..... 97.. 177
314654
20240 6
..... 117..... .184
286541
5.912.4
3.99.1
10.126.5
6.111.1
6.3i3.1
23.046.1
1.82.9
2.85.2
152 3.1148 3.0
64 1.8122 3 .4
4025
6027
3431
2.41.5
4.42.0
0.50.5
391 6.1148 2.3
127 3.3126 3.3
236 2.2269 2.5
343441
4923
6.48.3
3.11.4
188 3.8i65 3.3
119 13.5155 17.6
2319
o.40.3
109 1.1124 1.2
24136
2279
824
1721
2351
0.52.8
0.62.2
0.51.5
1.21.5
0.30.8
121 1.9226 3.5
1290
66208
77376
1752
0.32.3
0.62.0
1.47.1
1.13.2
36 0.7129 2.6
1067
1540
1.17.6
0.20.6
50 0.5139 1.3
69119
4570
936
457
1442
24280
1.42.4
1.31.9
0.52.2
0.34.2
0.20.6
0.44.4
39 1.01ii7 3.0
34212
0.32.0
53 1.o323 6.1
536
38172
0.32.2
0.83.4
47 5.31oo 11.4
839
0.10.6
30 0.3107 1.0
60 1.2130 2.6
3998
1535
2227
7396
1.12.7
0.92.1
1.62.0
1.11.5
80 1.2204 3.2
51 1.3145 3.7
76283
62269
2666
0.72.7
1.25.1
1.64.1
52 1.0188 3.8
2684
7186
3.09-5
1.11.3
--
.97 .g9
171 1.7
ity... e.
ural.....
.....
1
.... 1 412. 1972
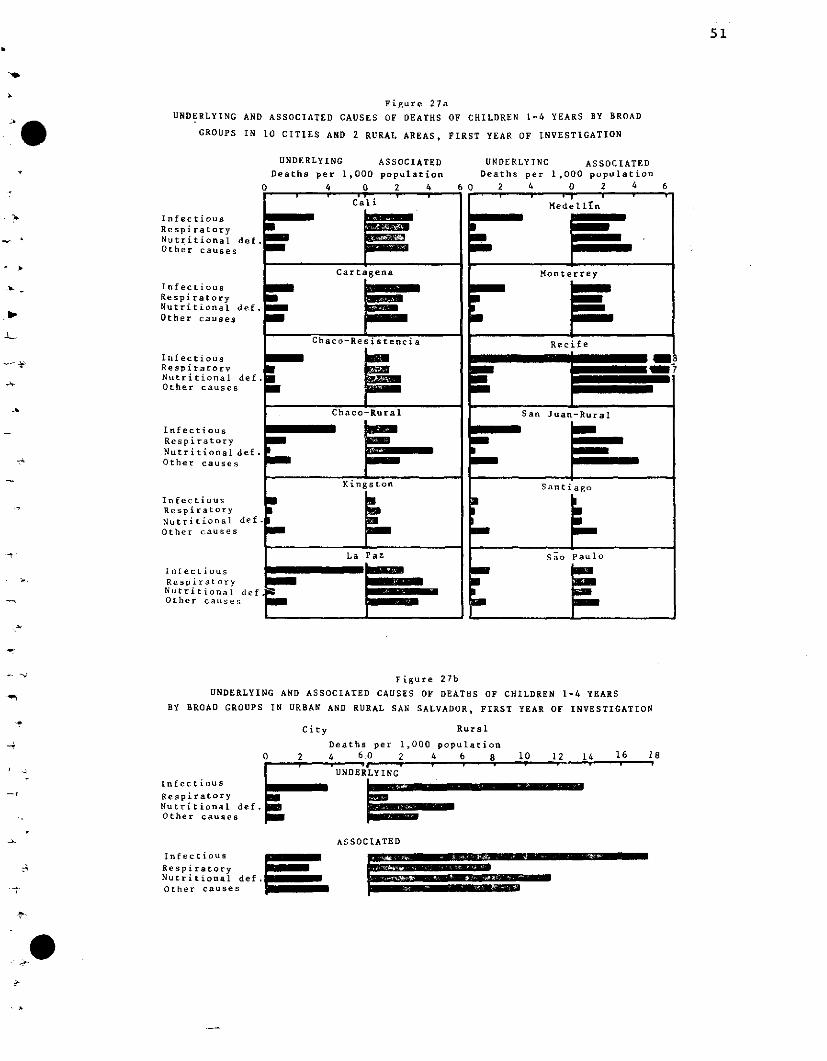
51
Figure 27a
UNDERLYING AND ASSOCIATED CAUSES OF DEATHS OF CHILDREN 1-4 YEARS BY BROAD
GROUPS IN 10 CITIES AND 2 RURAL AREAS, FIRST YEAR OF INVESTIGATION
UNDERLYING ASSOCIATED
Deaths per 1,000 population
4 0 2 4! 1 ii CaliCal.
UNDERLYING ASSOCIATEDDeaths per 1,000 population
2 4 0 2 4
Medellin
Figure 27b
UNDERLYING AND ASSOCIATED CAUSES OF DEATHS OF CHILDREN 1-4 YEARS
BY BROAD GROUPS IN URBAN AND RURAL SAN SALVADOR, FIRST YEAR OF INVESTIGATION
City Rural
Infectious
RespiratoryNutritional def.Other causes
Deaths per 1,000 population0 2 4 60 2 4 6 8 10 12 14 16 18
[1 ' 0UNDERLYING
ASSOCIATED
! .---.
_ ____~liuz
InfectiousRespiratory iNutritional def.Other causes
WL - p-
_
52
In Recife and La Paz the infectious diseases were the underlying cau-ses of nearly two-thirds of all deaths occurring in early childhood, with mea-sles the largest single cause in Recife. While the role of diarrheal diseasein the production of excessive mortality in this age group has been known, the E
seriousness of measles has not been recognized. In children 1-4 years of age,measles was the underlying cause of more deaths than diarrheal disease in threecities and one rural area; namely, Monterrey, Recife, Sao Paulo and the rural ~area of San Juan Province. During the second year of the Investigation, vac-cination programs against measles were undertaken in Recife and La Paz, wheremortality from this disease was unusually high, and it is hoped that the use ~of this vaccine on a sustained basis will be made in all countries of theAmericas. As a result of early findings in the Investigation, a specificrecommendation for such action was made at the Meeting of the Ministers ofHealth(12)in October 1968. X
In the cities of Kingston and Santiago, with favorable death rates from ~--all causes in early childhood, the pattern of underlying causes was distinctly _
different; in Santiago, for example, external causes became the leading causeof death in this group, with 27 deaths, while all infectious diseases producedonly 23 deaths. The broad miscellaneous group of other causes which includesthe neoplasms, congenital anomalies, diseases of the central nervous systemand others acquires higher status in areas with low death rates. This illus-trates the changes in mortality through prevention of infectious diseases.
As in the case of infant mortality, the study of multiple causes ofdeath in early childhood permits measurement of the real size of morbid condi--tions which is otherwise masked by the use of single cause analyses. The data
given in Table 18 and presented in Figure 27 show interesting interrelation- t
ships. Thus, the rates from the group of infectious diseases as underlyingcauses generally exceed those as associated causes, while the opposite isobserved with the rates from diseases of the respiratory system, nutritionaldeficiency and other causes. In the rural communities near San Salvador, itwas found that death rates were unusually high from all causes (Figure 27),and the infectious diseases and nutritional deficiency as underlying and as-sociated causes are largely responsible for these excessive death rates.
In considering nutritional deficiency as a cause of death, it is evi-dent that it is a major contributor to mortality in this age group. Thedeaths from nutritional deficiency as underlying or associated causes havebeen combined to reveal the true role of this condition in mortality (Table17). The specific way in which nutritional deficiency operates as underlyingor contributory cause or as a consequence of the underlying and other causesis given in the table. The resulting death rates are shown in the right handside of Figures 25 and 26 to relate to the death rates from all causes whichare shown in the left sections. It is evident that the size of the problemof nutritional deficiency in mortality is minimized when only the underlyingcause is considered. In Recife and Ribeirao Preto in the age group 1-4 years,70 per cent of the deaths occurred in children with nutritional deficiency.In Cali, Cartagena, Medellin and San Salvador, the percentages varied from 62
-e
* *:
.
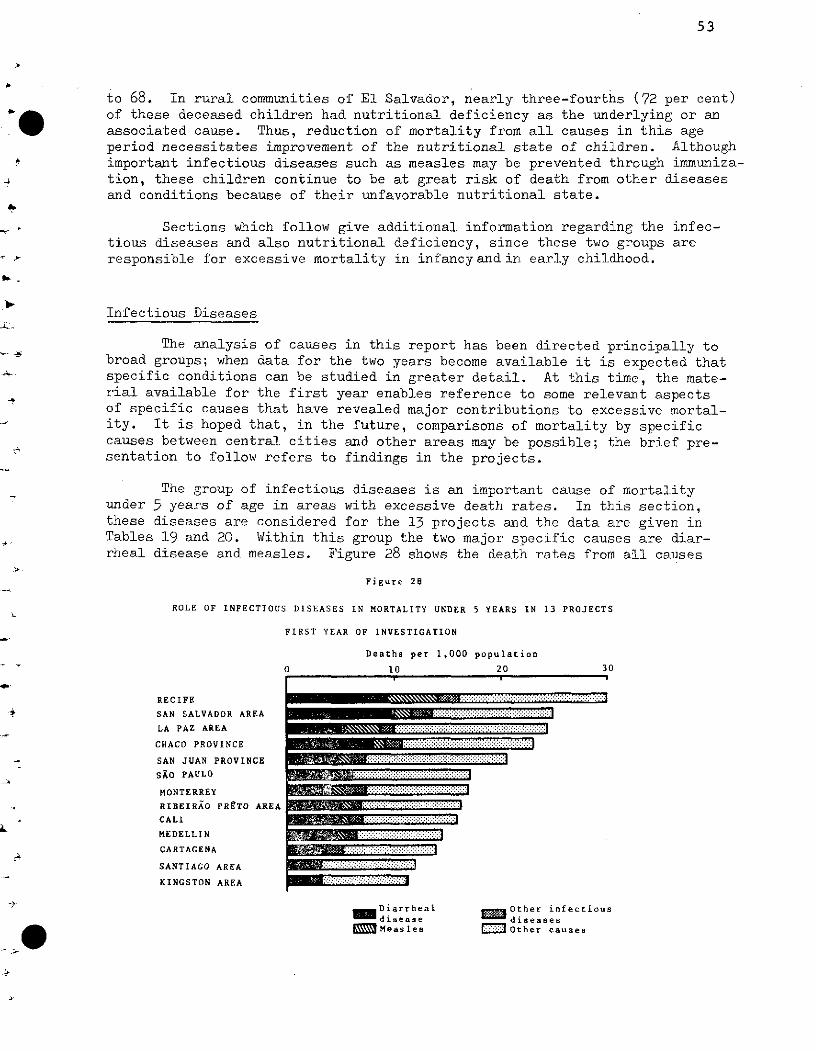
53
to 68. In rural communities of El Salvador, nearly three-fourths (72 per cent)of these deceased children had nutritional deficiency as the underlying or anassociated cause. Thus, reduction of mortality from all causes in this ageperiod necessitates improvement of the nutritional state of children. Althoughimportant infectious diseases such as measles may be prevented through immuniza-tion, these children continue to be at great risk of death from other diseasesand conditions because of their unfavorable nutritional state.
Sections which follow give additional information regarding the infec-tious diseases and also nutritional deficiency, since these two groups areresponsible for excessive mortality in infancyand in early childhood.
Infectious Diseases
The analysis of causes in this report has been directed principally tobroad groups; when data for the two years become available it is expected thatspecific conditions can be studied in greater detail. At this time, the mate-rial available for the first year enables reference to some relevant aspectsof specific causes that have revealed major contributions to excessive mortal-ity. It is hoped that, in the future, comparisons of mortality by specificcauses between central cities and other areas may be possible; the brief pre-sentation to follow refers to findings in the projects.
The group of infectious diseases is an important cause of mortalityunder 5 years of age in areas with excessive death rates. In this section,these diseases are considered for the 13 projects and the data are given inTables 19 and 20. Within this group the two major specific causes are diar-rheal disease and measles. Figure 28 shows the death rates from all causes
Figure 28
ROLE OF INFECTIOUS DISEASES IN MORTALITY UNDER 5 YEARS IN 13 PROJECTS
FIRST YEAR OF INVESTIGATION
Deaths per 1,000 population
0 10 20 30
RECIFE
SAN SALVADOR AREA
LA PAZ AREA
CHACO PROVINCE
SAN JUAN PROVINCE
SAO PAULO :: :::::::::::::::::::::::::::::::::::::::::::::
MONTERREY
RIBEIRAO PRETO AREA ...........CALI
MEDELLIN
CARTAGENA
SANTIAGO AREA
KINGSTON AREA : : :
Diarrheal Other infectiousdisease diseasesMeasles I: Other causes
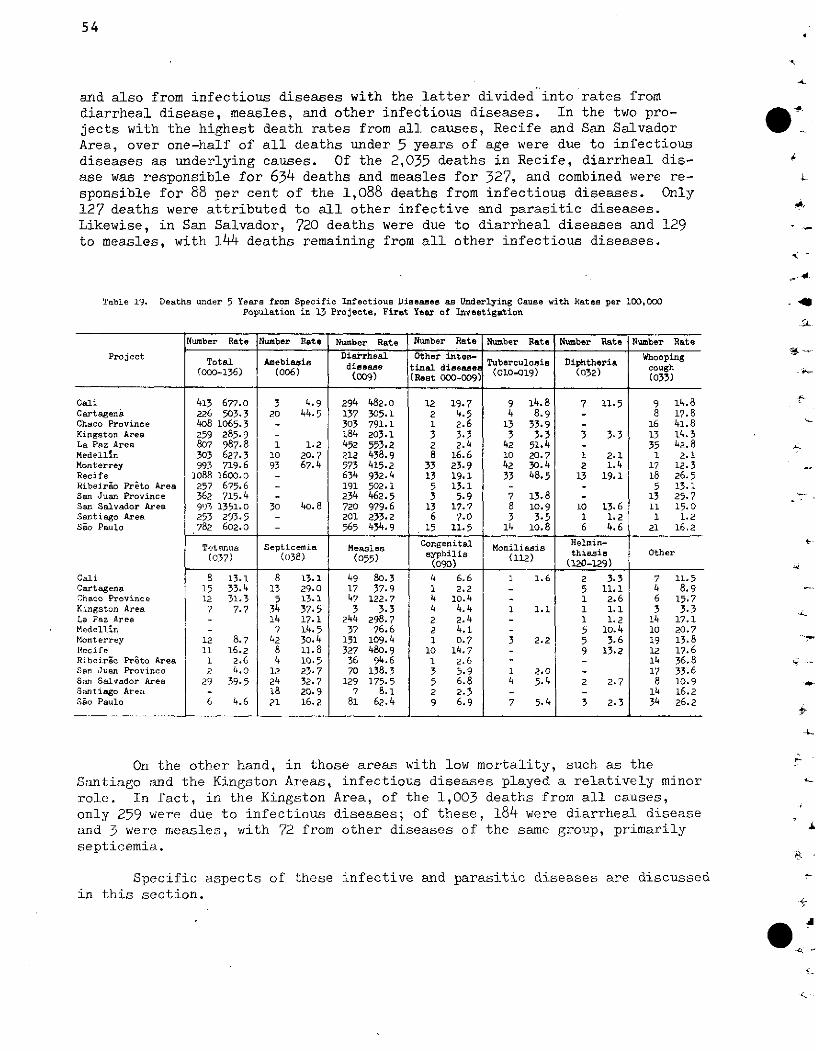
54
and also from infectious diseases with the latter divided into rates fromdiarrheal disease, measles, and other infectious diseases. In the two pro-jects with the highest death rates from all causes, Recife and San SalvadorArea, over one-half of all deaths under 5 years of age were due to infectiousdiseases as underlying causes. Of the 2,035 deaths in Recife, diarrheal dis-ase was responsible for 634 deaths and measles for 327, and combined were re-sponsible for 88 per cent of the 1,088 deaths from infectious diseases. Only127 deaths were attributed to all other infective and parasitic diseases.Likewise, in San Salvador, 720 deaths were due to diarrheal diseases and 129to measles, with 144 deaths remaining from all other infectious diseases.
i -
Table 19. Deaths under 5 Years from Specific Infectious Diseases as Underlying Cause with Rates per 100,000 .*Population in 13 Projects, First Year of Investigation
Number Rate Number Rate Number Rate Number Rate Number Rato Number Rate Number Rate
Project Total Am bi DiaFrrheal Other intes- Tuberculoe WhoopingTotal Amebiasis Tuberculosis Diphtheria
(000-136) (006) (009) t s (010-019) (032)(009) (Rest 000-009] (033)
Cali 413 677.0 3 4.9 294 482.0 12 19.7 9 14.8 7 11.5 9 14.8Cartagena 226 503.3 20 44.5 137 305.1 2 4.5 4 8.9 - 8 17.8Chaco Province 408 1065.3 - 303 791.1 1 2.6 13 33.9 - 16 41.8Kingston Area 259 285.9 - 184 203.1 3 3.3 3 3.3 3 3.3 13 14.3La Paz Area 807 987.8 1 1.2 452 553.2 2 2.4 42 51.4 - 35 42.8Medellin 303 627.3 10 20.7 212 438.9 8 16.6 10 20.7 1 2.1 1 2.1Monterrey 993 719.6 93 67.4 573 415.2 33 23.9 42 30.4 2 1.4 17 12.3Recife 1088 1600.0 - 634 932.4 13 19.1 33 48.5 13 19.1 18 26.5Ribeir.o Preto Area 257 675.6 - 191 502.1 5 13.1 - - 5 13.1San Juan Province 362 715.4 - 234 462.5 3 5-9 7 13.8 - 13 25.7San Salvador Area 993 1351.0 30 40.8 720 979.6 13 17.7 8 10.9 10 13.6 11 15.0Santiago Area 253 293.5 - 201 233.2 6 7.0 3 3.5 1 1.2 1 1.2Sao Paulo 782 602.0 - 565 434.9 15 11.5 14 10.8 6 4.6 21 16.2
Tetanus Septicemia Measles Congenit Monilae is Helmin- tl(037) 1 (038) (055) yphii (112) thiais Other
_ _ (090o) _ _1 (120-1-9) 1Cali 8 13.1 8 13.1 49 80.3 4 6.6 1 1.6 2 3.3 7 11.5Cartagena 15 33.4 13 29.0 17 37.9 1 2.2 - 5 11.1 4 8.9nhaco Province 12 31.3 5 13.1 47 122.7 4 10.4 - 1 2.6 6 15.7
Kingston Area 7 7.7 34 37.5 3 3.3 4 4.4 1 1.1 1 1.1 3 3.3La Paz Area - 14 17.1 244 298.7 2 2.4 1 1.2 14 17.1Medellin - 7 14.5 37 76.6 2 4.1 - 5 10.4 10 20.7Monterrey 12 8.7 42 30.4 151 109.4 1 0.7 3 2.2 5 3.6 19 13.8Recife 11 16.2 8 11.8 327 480.9 10 14.7 - 9 13.2 12 17.6Ribeirao Preto Area 1 2.6 4 10.5 36 94.6 1 2.6 - - 14 36.8San Juan Province 2 4.0 12 23.7 70 138.3 3 5.9 1 2.0 - 17 33.6San Salvador Area 29 39.5 24 32.7 129 175.5 5 6.8 4 5.4 2 2.7 8 10.9Santiago Area - 18 20.9 7 8.1 2 2.3 - - 14 16.2Sao Paulo 6 4.6 21 16.2 81 62.4 9 6.9 7 5.4 3 2.3 34 26.2
On the other hand, in those areas with low mortality, such as theSantiago and the Kingston Areas, infectious diseases played a relatively minorrole. In fact, in the Kingston Area, of the 1,003 deaths from all causes,only 259 were due to infectious diseases; of these, 184 were diarrheal diseaseand 3 were measles, with 72 from other diseases of the same group, primarilysepticemia.
Specific aspects of these infective and parasitic diseases are discussedin this section.
a
--
--n
tl-
-1-
Á
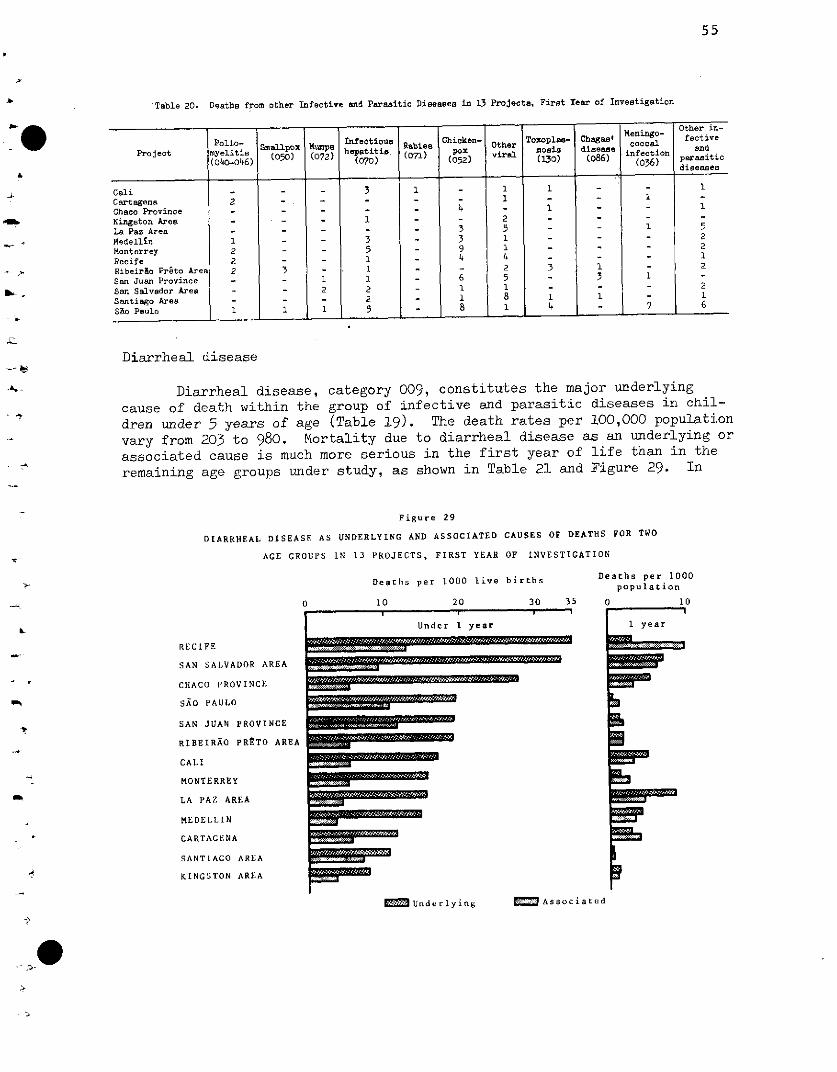
55
Table 20. Deatha from other Infective and Parasitic Diseases in 13 Projecta, First Year of Investigation
Project
CaliCartagenaChaco ProvinceKingston AreaLa Paz AreaMedellinMonterreyRecifeRibeirao Preto AreaSan Juan ProvinceSan Salvador AreaSantiago AreaSao Paulo
Polio- )Small05pomyelitis (050)(040-O46)
2
1222
1
3
1
Infectious) hepatitis
(072) (070)
12
1
3
1
35111225
abies Chicken-1pox
(071) 1 (052)Otherviral
Toxcmc(3
Other in->plas- Chageas Meningo- fectivn
coccalmosi disease cocal andO30) (086) (036> parasitic
diseaaes
i - 1- - 1 2
1 - 1- 1 54 _ - 2
- 3 I 1-- - - 21 1 - 14 7 6
Diarrheal disease
Diarrheal disease, category 009, constitutes the major underlying
cause of death within the group of infective and parasitic diseases in chil-
dren under 5 years of age (Table 19). The death rates per 100,000 population
vary from 203 to 980. Mortality due to diarrheal disease as an underlying or
associated cause is much more serious in the first year of life than in the
remaining age groups under study, as shown in Table 21 and Figure 29. In
Figure 29
DIARRHEAL DISEASE AS UNDERLYING AND ASSOCIATED CAUSES OF DEATHS FOR TWO
AGE GROUPS IN 13 PROJECTS, FIRST YEAR OF INVESTIGATION
Deaths per 1000 live births Deaths per 1000population
0 1010
1 year
RECIFE
SAN SALVADOR AREA
CHACO PROVINCE
SAO PAULO
SAN JUAN PROVINCE
RIBEIRAO PRETO AREA
CALI
MONTERREY
LA PAZ AREA
MEDELLIN
CARTAGENA
SANTIAGO AREA
KINGSTON AREA
3 10 20 30 35
I ! i ei 1Under 1 year
:::_:::::::::::::::::::::::
= Associated
I t I I1
I I L l_
�G�F��
,>
= Underlying
áíiBBB~"~
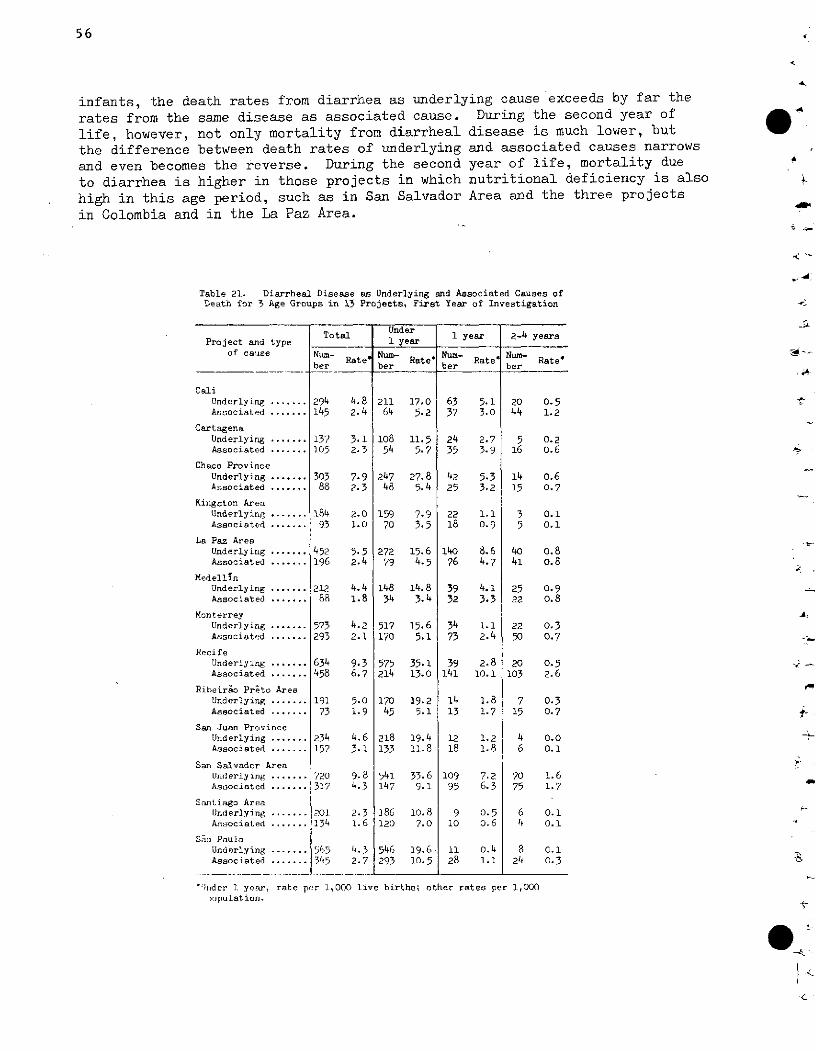
56
infants, the death rates from diarrhea as underlying cause exceeds by far the
rates from the same disease as associated cause. During the second year of
life, however, not only mortality from diarrheal disease is much lower, butthe difference between death rates of underlying and associated causes narrowsand even becomes the reverse. During the second year of life, mortality due
to diarrhea is higher in those projects in which nutritional deficiency is alsohigh in this age period, such as in San Salvador Area and the three projects
in Colombia and in the La Paz Area.
Table 21. Diarrheal Disease as Underlying and Associated Causes ofDeath for 3 Age Groups in 13 Projects, First Year of Investigation
UnderTotal Under 1 year 2-4 yearsProject and type _ __- 1 year
of cause Num- um- Nun-of causRate Num- ate Rate Num - Rate Nber ber ber ber
CaliUnderlying ....... 294 4.8 211 17.0 63 5.1 20 0.5Associated ....... 145 2.4 64 5.2 37 3.0 44 1.2
CartagenaUnderlying ....... 137 3.1 108 11.5 24 2.7 5 0.2Associated ....... 105 2.3 54 5.7 35 3.9 16 0.6
Chaco ProvinceUnderlying ....... 303 7.9 247 27.8 42 5.3 14 0.6Associated ....... 88 2.3 48 5.4 25 3.2 15 0.7
Kingston AreaUnderlying ....... 184 2.0 159 7.9 22 1.1 3 0.1Associated ....... 93 1.0 70 3.5 18 0.9 5 0.1
La Paz AreaUnderlyirg ....... 452 5.5 272 15.6 140 8.6 40 0.8Associated ....... 196 2.4 79 4.5 76 4.7 41 0.8
MedellinUnderlying ....... 212 4.4 148 14.8 39 4.1 25 0.9Associated ....... 88 1.8 34 3.4 32 3.3 22 0.8
MonterreyUnderlying ....... 573 4.2 517 15.6 34 1.1 22 0.3Associated ....... 293 2.1 170 5.1 73 2.4 50 0.7
RecifeUnderlying ....... 634 9.3 575 35.1 39 2.8 20 0.5Associated ....... 458 6.7 214 13.0 141 10.1 103 2.6
Ribeirao Preto AreaUnderlying ....... 191 5.0 170 19.2 14 1.8 7 0.3Associated ....... 73 1.9 45 5.1 13 1.7 15 0.7
San Juan ProvinceUnderlying ....... 234 4.6 218 19.4 12 1.2 4 0.0Associated ....... 157 3.1 133 11.8 18 1.8 6 . 1
San Salvador AreaUnderlying ....... 720 9.8 541 33.6 109 7.2 70 1.6Associated ....... 317 4.3 147 9.1 95 6.3 75 1.7
Santiago AreaUnderlying ....... 201 2.3 186 10.8 9 0.5 6 0.1Associated ....... 134 1.6 120 7.0 10 0.6 i4 0.1
Sao PauloUnderlying ....... 565 4.3 546 19.6 11 0.4 8 o.1Associated ....... 345 2.7 293 10.5 28 1.1 24 0.3
':lider 1. year, rate per 1,000 live births; other rates per 1,000iopulation.
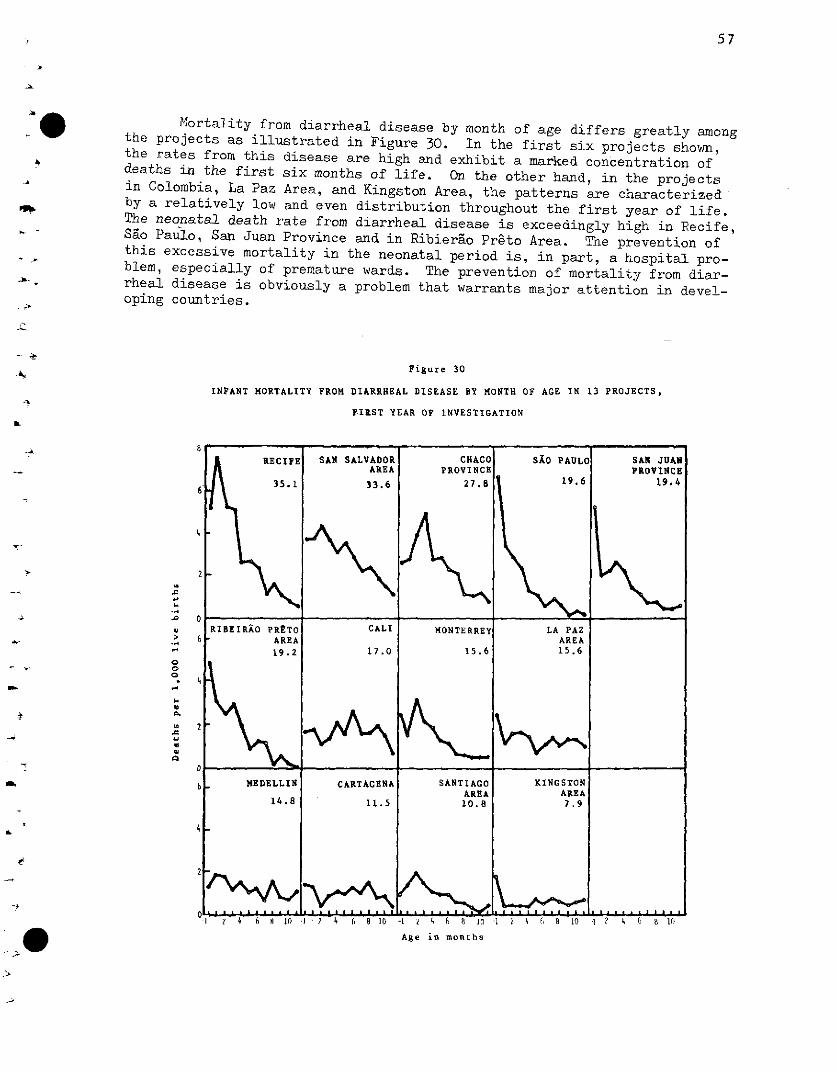
57
Mortality from diarrheal disease by month of age differs greatly amongthe projects as illustrated in Figure 30. In the first six projects shown,the rates from this disease are high and exhibit a marked concentration ofdeaths in the first six months of life. On the other hand, in the projectsin Colombia, La Paz Area, and Kingston Area, the patterns are characterizedby a relatively low and even distribution throughout the first year of life.The neonatal death rate from diarrheal disease is exceedingly high in Recife,Sao Paulo, San Juan Province and in Ribierao Preto Area. The prevention ofthis excessive mortality in the neonatal period is, in part, a hospital pro-blem, especially of premature wards. The prevention of mortality from diar-rheal disease is obviously a problem that warrants major attention in devel-oping countries.
Figure 30
INPANT MORTALITY FROM DIARRHEAL DISEASE BY MONTH OF AGE IN 13 PROJECTS,
FIRST YEAR OF INVESTIGATION
ooo.
RECIFE SAN SALVADOR CHACO SAO PAULO SAN JUANAREA PROVINCE PROVINCE
6' 35.1 33.6 27.8 19.6 19.
RIBEIRAO PR2TO CALI MONTERREY LA PAZ1)· AREA AREA
19.2 17.0 15.6 15.6
l 15.6
b MEDELLIN CARTAGENA SANTIAGO KINGSTONAREA AREA
14.8 11.5 10.8 7.9
6 10 -1 2 4 10 10 -1 4 6 ¢ l -10
Age in months
i)
,.
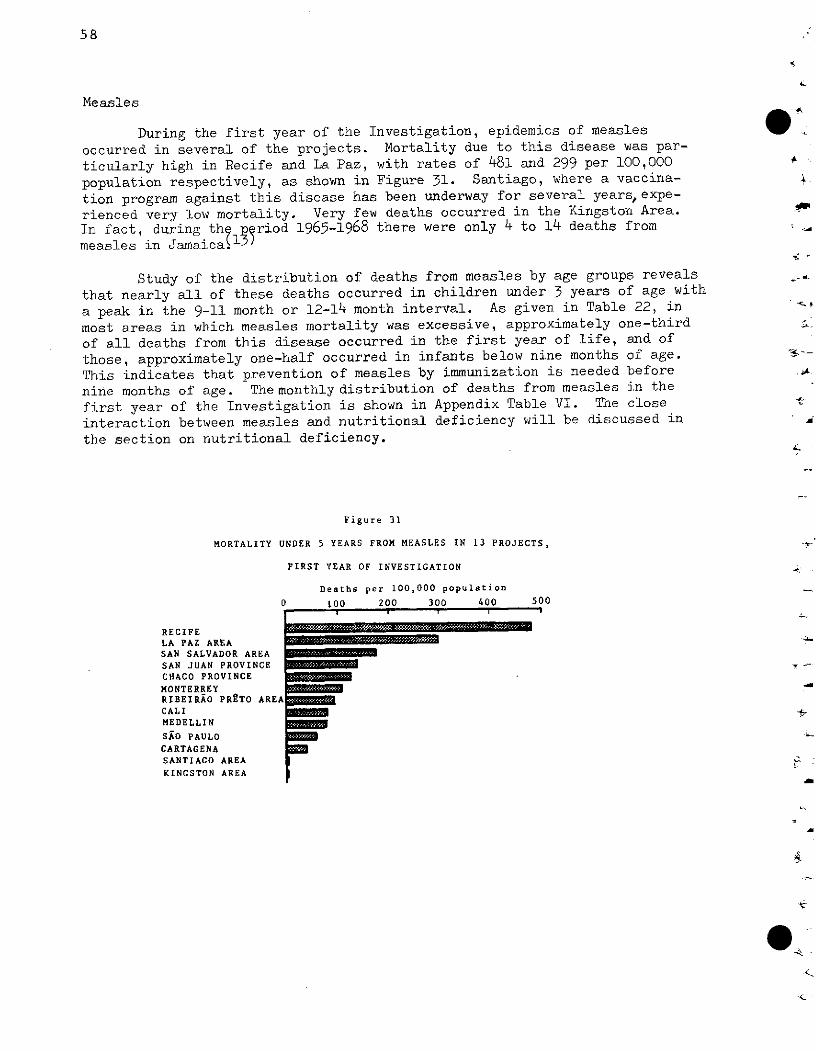
58
Measles
During the first year of the Investigation, epidemics of measles
occurred in several of the projects. Mortality due to this disease was par-
ticularly high in Recife and La Paz, with rates of 481 and 299 per 100,000
population respectively, as shown in Figure 31. Santiago, where a vaccina-
tion program against this disease has been underway for several years,expe-
rienced very low mortality. Very few deaths occurred in the Kingston Area.
In fact, during the ?priod 1965-1968 there were only 4 to 14 deaths from
measles in Jamaica.l3 )
Study of the distribution of deaths from measles by age groups reveals
that nearly all of these deaths occurred in children under 3 years of age with
a peak in the 9-11 month or 12-14 month interval. As given in Table 22, in
most areas in which measles mortality was excessive, approximately one-third
of all deaths from this disease occurred in the first year of life, and of
those, approximately one-half occurred in infants below nine months of age. --
This indicates that prevention of measles by immunization is needed before .
nine months of age. The monthly distribution of deaths from measles in the
first year of the Investigation is shown in Appendix Table VI. The close
interaction between measles and nutritional deficiency will be discussed in i
the section on nutritional deficiency.
Figure 31
MORTALITY UNDER 5 YEARS FROM MEASLES IN 13 PROJECTS,
FIRST YEAR OF INVESTIGATION
Deaths per 100,000 population
O 100 200 300 400 500
RECIFELA PAZ AREASAN SALVADOR AREASAN JUAN PROVINCECHACO PROVINCE
MONTERREYRIBEIRAO PRETO AREACALIMEDELLIN
siAO PAULOCARTAGENASANTIAGO AREA
KINGSTON AREA
--i ! i i i
1 1 1
-El
~~~~~~~~-
~~~~d~~~~~R~~~~~B~~~~~s g ~ ~ ~ ~ ~ ~ ~ ~ . -
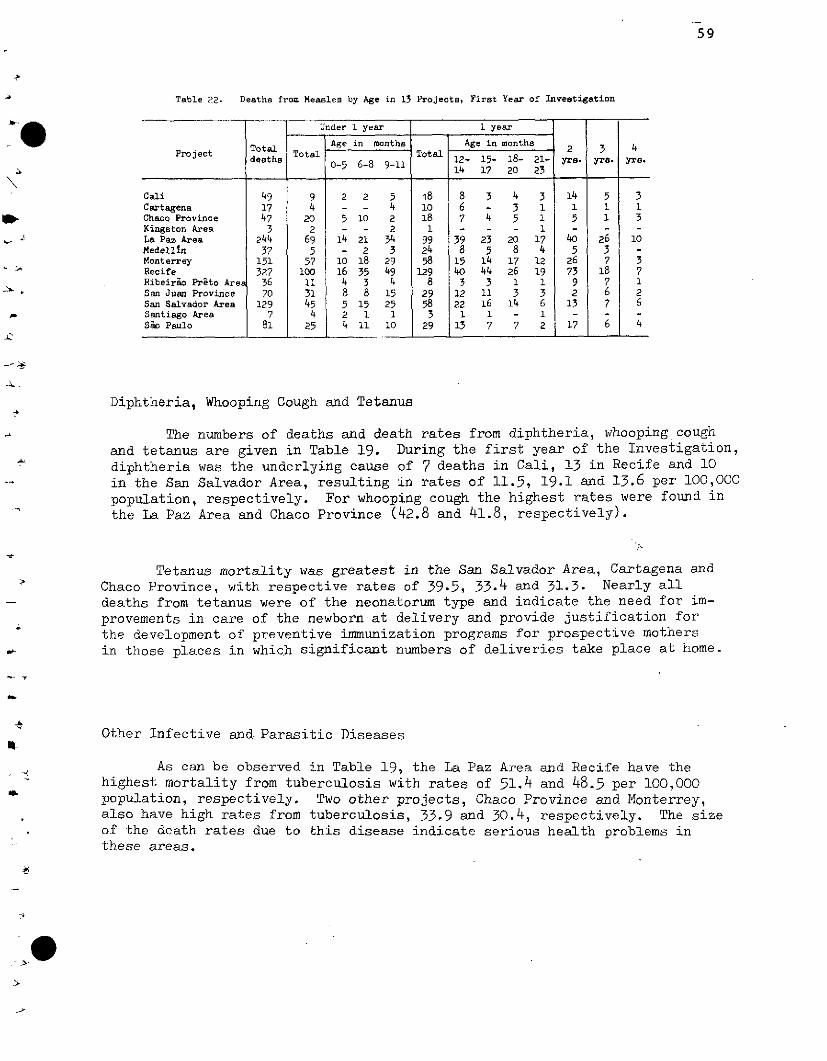
59
Table 22. Deaths from Measles by Age in 13 Projects, First Year of Investigation
--- nder 1 year 1 year
Project ToT Age in monthe Age in monthe 4
Project T Otahl Total nontadeatha0- 6-8 91 Total 12- 15- 18- 21- yra. yra. yr.0-5 6_ 114 17 20 23
Cali 49 9 2 2 5 18 8 3 4 3 14 5 3Cartagena 17 4 - - 4 10 6 - 3 1 1 1 1Chaco Province 47 20 5 10 2 18 7 4 5 1 5 1 3Kingeton Area 3 2 - - 2 1 -- - 1 -La Paz Area 244 69 14 21 34 99 39 23 20 17 40 26 10Medellln 37 5 - 2 3 24 8 5 8 4 5 3 -Monterrey 151 57 10 18 29 58 15 14 17 12 26 7 3Recife 327 100oo 16 35 49 129 4044269 1273 18 7Ribeirao Preto Area 36 11 4 3 4 8 3 3 1 1 9 7 1San Juan Province 70 31 8 8 15 29 12 11 3 3 2 6 2San Salvador Area 129 45 5 15 25 58 22 16 14 6 13 7 6Santiago Area 7 4 2 1 1 3 1 1 - 1 - - -
Sao Paulo 81 25 4 11 10 29 13 7 7 2 17 6 4
Diphtheria, Whooping Cough and Tetanus
The numbers of deaths and death rates from diphtheria, whooping coughand tetanus are given in Table 19. During the first year of the Investigation,diphtheria was the underlying cause of 7 deaths in Cali, 13 in Recife and 10in the San Salvador Area, resulting in rates of 11.5, 19.1 and 13.6 per 100,000population, respectively. For whooping cough the highest rates were found inthe La Paz Area and Chaco Province (42.8 and 41.8, respectively).
Tetanus mortality was greatest in the San Salvador Area, Cartagena andChaco Province, with respective rates of 39.5, 33.4 and 31.3. Nearly alldeaths from tetanus were of the neonatorum type and indicate the need for im-provements in care of the newborn at delivery and provide justification forthe development of preventive immunization programs for prospective mothersin those places in which significant numbers of deliveries take place at home.
Other Infective and Parasitic Diseases
As can be observed in Table 19, the La Paz Area and Recife have thehighest mortality from tuberculosis with rates of 51.4 and 48.5 per 100,000population, respectively. Two other projects, Chaco Province and Monterrey,also have high rates from tuberculosis, 33.9 and 30.4, respectively. The sizeof the death rates due to this disease indicate serious health problems inthese areas.
60
Amebiasis was the underlying cause of 156 deaths of which 93 occurredin Monterrey and 30 in San Salvador Area. In addition, in 50 other deaths, Oamebiasis was an associated cause. The seriousness of this disease in certainareas is revealed by the nature of its complications and the age periods af-fected. In Monterrey, for instance, there were 81 infant deaths due to amebi-asis as the underlying or associated cause which was two-thirds of the totaldeaths under 5 years of age involving amebiasis.
Congenital syphilis was the cause of 10 deaths in Recife and 9 in SaoPaulo. In total, there were 48 deaths due to congenital syphilis; this doesnot include deaths in which the underlying cause was maternal syphilis with-out manifested disease in the product.
In the column of other intestinal diseases in Table 19, typhoid feverwas responsible for 7 deaths; other salmonellosis including paratyphoid feverproduced 17 deaths; bacillary disentery was the underlying cause of 16 deathsand other enteric infections due to specific agents (category 008) caused 74 kdeaths in this group.
In 17 deaths, moniliasis was the underlying cause while it was an asso-ciated cause in 563 deaths. Likewise, 34 deaths were due to helminthiasis.This group of conditions (categories 120-129) contributed with 552 associatedcauses, often more than one type of helminthiasis was diagnosed in a deceasedchild.
The numbers of deaths from the remainder of the group of infectiousdiseases (last column of Table 19) are specified by cause in Table 20. Polio-myelitis produced only 10 deaths in all of these areas combined during thefirst year of the Investigation, distributed as follows: 2 each in Cartagena,Monterrey, Recife and Ribeiráo Preto Area, 1 in Medellin and l in Sao Paulo.Judging from the findings on vaccinations obtained through interviews withfamilies of dead children, vaccination against poliomyelitis has been widelyused in the areas of the Investigation.
Relatively few deaths were due to miscellaneous infectious diseases.The numbers of these deaths are given in Table 20.
*
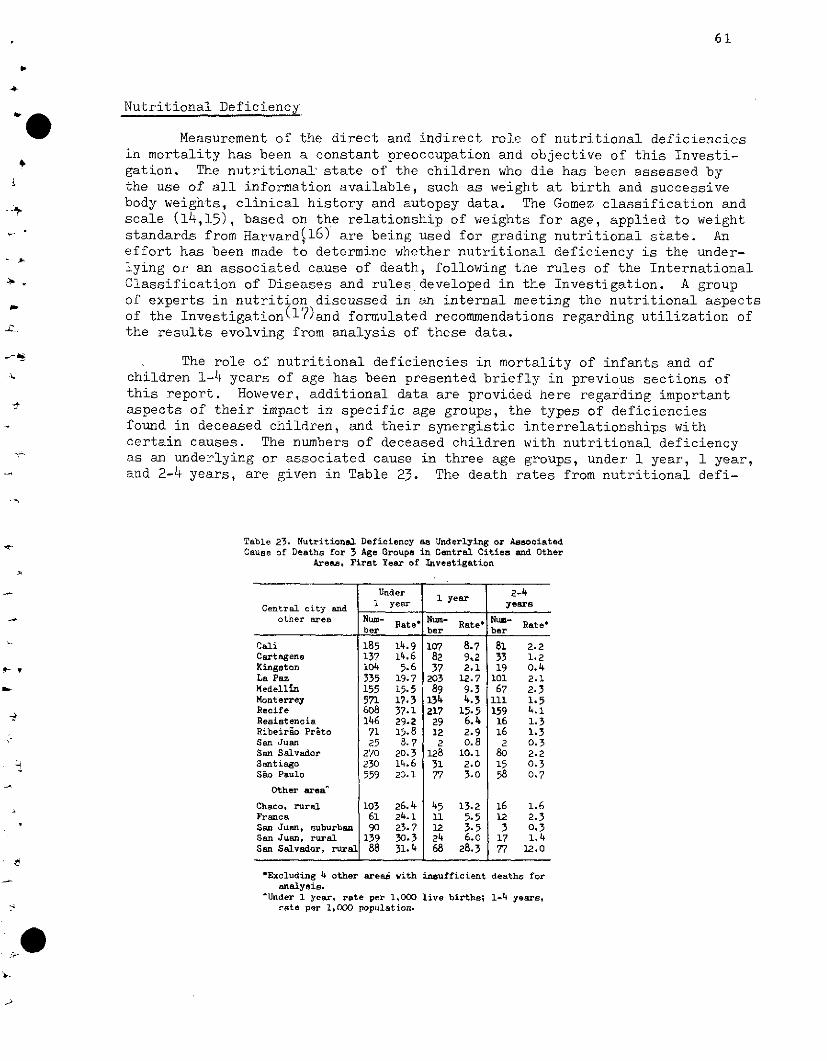
61
Nutritional Deficiency
Measurement of the direct and indirect role of nutritional deficienciesin mortality has been a constant preoccupation and objective of this Investi-gation. The nutritional state of the children who die has been assessed bythe use of all information available, such as weight at birth and successivebody weights, clinical history and autopsy data. The Gomez classification andscale (14,15), based on the relationship of weights for age, applied to weightstandards from HarvardIl 6) are being used for grading nutritional state. Aneffort has been made to determine whether nutritional deficiency is the under-lying or an associated cause of death, following the rules of the InternationalClassification of Diseases and rules developed in the Investigation. A groupof experts in nutrition discussed in an internal meeting the nutritional aspectsof the Investigation(17)and formulated recommendations regarding utilization ofthe results evolving from analysis of these data.
The role of nutritional deficiencies in mortality of infants and ofchildren 1-4 years of age has been presented briefly in previous sections ofthis report. However, additional data are provided here regarding importantaspects of their impact in specific age groups, the types of deficienciesfound in deceased children, and their synergistic interrelationships withcertain causes. The numbers of deceased children with nutritional deficiencyas an underlying or associated cause in three age groups, under 1 year, 1 year,and 2-4 years, are given in Table 23. The death rates from nutritional defi-
Table 23. Nutritional Deficiency as Underlying or AssociatedCause of Deaths for 3 Age Groupe in Central Cities and Other
Areas, Firat Year of Investigation
Under 1 year 2-4
Central city and 1 year yearsother area Num- Num- Rate Num-Rate
ber ber ber
Cali 185 14.9 107 8.7 81 2.2Cartagena 137 14.6 82 9,2 33 1.2Kingston 104 5.6 37 2.1 19 o.4La Paz 335 19.7 203 12.7 101 2.1Medellín 155 15.5 89 9.3 67 2.3Monterrey 571 17.3 134 4.3 111 1.5Recife 608 37.1 217 15.5 159 4.1Resistencia 146 29.2 29 6.4 16 1.3Ribeirao Preto 71 15.8 12 2.9 16 1.3San Juan 25 8.7 2 0.8 2 0.3San Salvador 270 20.3 128 10.1 80 2.2Santiago 230 14.6 31 2.0 15 0.3Sao Paulo 559 20.1 77 3.0 58 0.7
Other area^
Chaco, rural 103 26.4 45 13.2 16 1.6Franca 61 24.1 11 5.5 12 2.3San Juan, suburban 90 23.7 12 3.5 3 0.3San Juan, rural 139 30.3 24 6.0 17 1.4San Salvador, rural 88 31.4 68 28.3 77 12.0
'Excluding 4 other areaá with insufficient deatha foranalysis.
^Under 1 year, rate per 1,000 live birthe; 1-4 years,rate per 1,000 population.
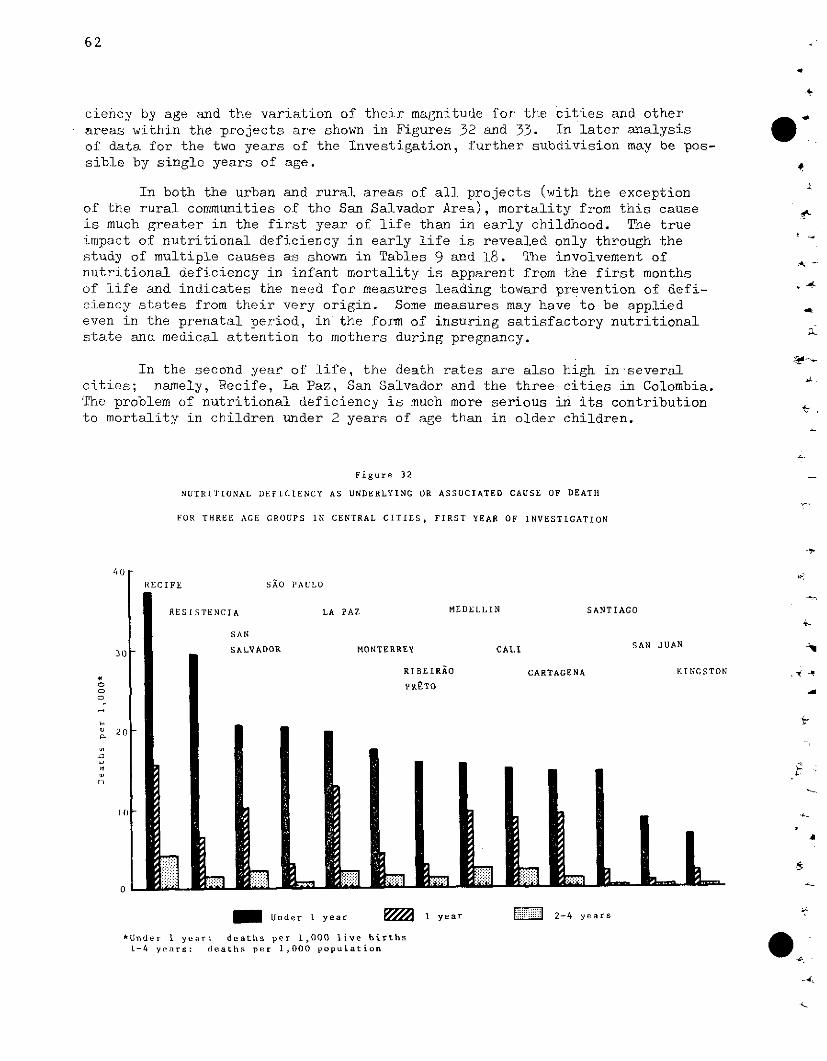
62
ciency by age and the variation of their magnitude for the cities and otherareas within the projects are shown in Figures 32 and 33. In later analysisof data for the two years of the Investigation, further subdivision may be pos-sible by single years of age.
In both the urban and rural areas of all projects (with the exceptionof the rural communities of the San Salvador Area), mortality from this causeis much greater in the first year of life than in early childhood. The trueimpact of nutritional deficiency in early life is revealed only through thestudy of multiple causes as shown in Tables 9 and 18. The involvement ofnutritional deficiency in infant mortality is apparent from the first monthsof life and indicates the need for measures leading toward prevention of defi- -
~
ciency states from their very origin. Some measures may have to be appliedeven in the prenatal period, in the form of insuring satisfactory nutritionalstate and medical attention to mothers during pregnancy.
In the second year of life, the death rates are also high inseveralcities; namely, Recife, La Paz, San Salvador and the three cities in Colombia.The problem of nutritional deficiency is much more serious in its contributionto mortality in children under 2 years of age than in older children.
Figure 32
NUTRITIONAL DEFICIENCY AS UNDERLYING OR ASSOCIATED CAUSE OF DEATH
FOR THREE AGE GROUPS IN CENTRAL CITIES, FIRST YEAR OF INVESTIGATION
4O
RECIFE SAO PAULO
RESISTENCIA LA PAZ MEDELLIN SANTIAGO
SAN
3030 _SALVADOR MONTERREY CALI SAN JUAN
RIBEIRAO CARTAGENA KINGSTON .i-_
o PR~TOo
r I I Izo
:1 L LLLLUnder 1 year = 1 year :E 2-4 years
*Under 1 year: deaths per 1,000 live births1-4 years: deaths per 1,000 population
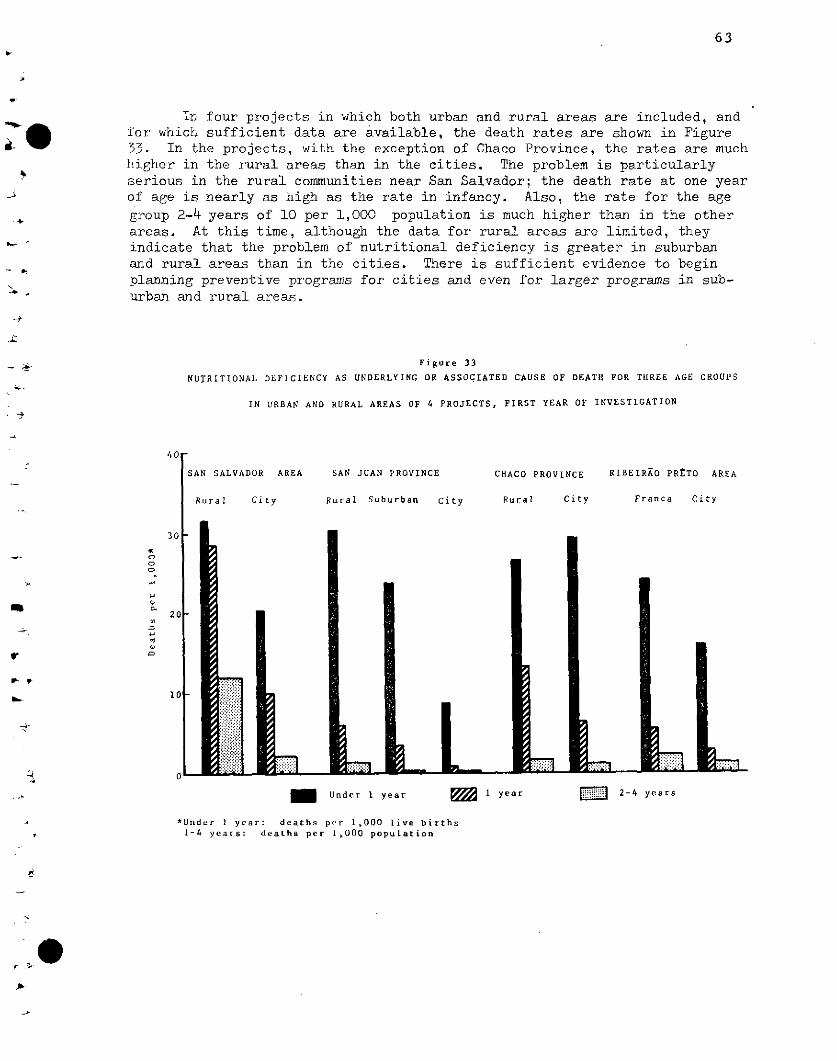
63
In four projects in which both urban and rural areas are included, andfor which sufficient data are available, the death rates are shown in Figure33. In the projects, with the exception of Chaco Province, the rates are muchhigher in the rural areas than in the cities. The problem is particularlyserious in the rural communities near San Salvador; the death rate at one yearof age is nearly as high as the rate in infancy. Also, the rate for the age
group 2-4 years of 10 per 1,000 population is much higher than in the otherareas. At this time, although the data for rural areas are limited, theyindicate that the problem of nutritional deficiency is greater in suburbanand rural areas than in the cities. There is sufficient evidence to beginplanning preventive programs for cities and even for larger programs in sub-urban and rural areas.
Figure 33
NUTRITIONAL DEFICIENCY AS UNDERLYING OR ASSOCIATED CAUSE OF DEATH FOR THREE AGE GROUPS
IN URBAN AND RURAL AREAS OF 4 PROJECTS, FIRST YEAR OF INVESTIGATION
40
SAN SALVADOR AREA SAN JUAN PROVINCE CHACO PROVINCE RIBEIRAO PRETO AREA
Rural City Rural Suburban City Rural City Franca City
30
20
m Under 1 year = 1 year m 2-4 years
*Under 1 year: deaths per 1,000 live births1-4 years: deaths per 1,000 population
, > .
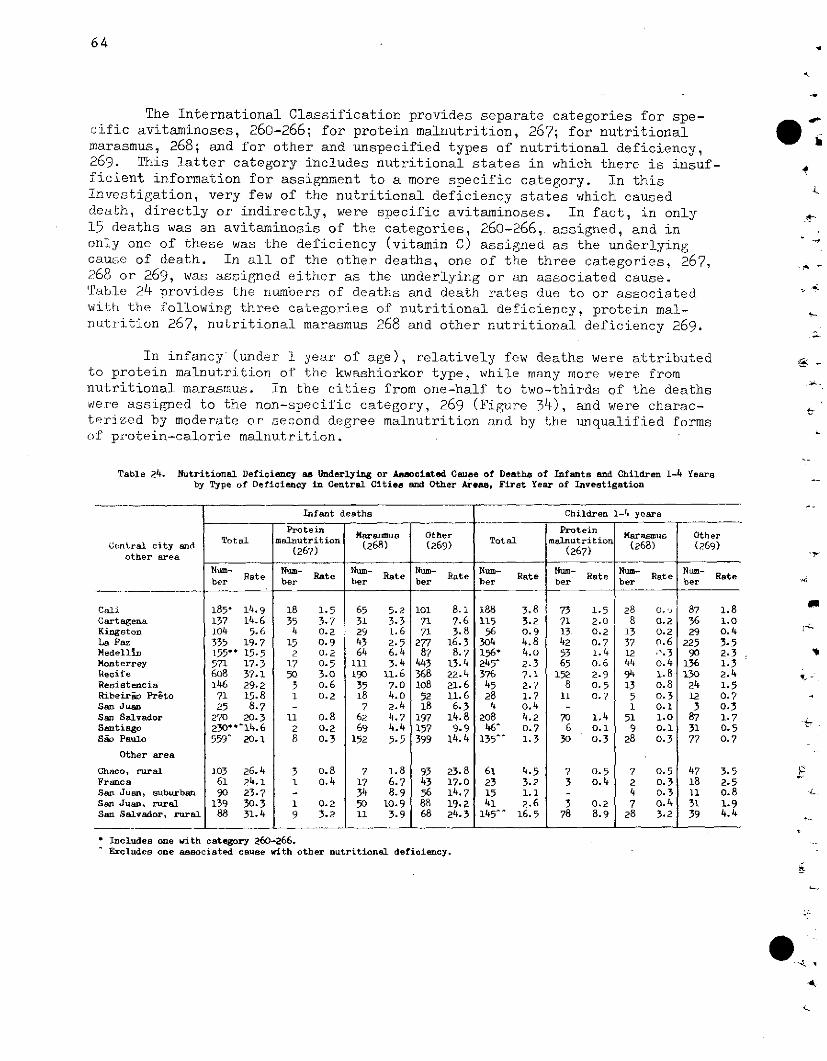
64
The International Classification provides separate categories for spe-cific avitaminoses, 260-266; for protein malnutrition, 267; for nutritionalmarasmus, 268; and for other and unspecified types of nutritional deficiency,269. This latter category includes nutritional states in which there is insuf-ficient information for assignment to a more specific category. In thisInvestigation, very few of the nutritional deficiency states which causeddeath, directly or indirectly, were specific avitaminoses. In fact, in only15 deaths was an avitaminosis of the categories, 260-266, assigned, and inonly one of these was the deficiency (vitamin C) assigned as the underlyingcause of death. In all of the other deaths, one of the three categories, 267,268 or 269, was assigned either as the underlying or an associated cause.Tablae 24 provides the numbers of deaths and death rates due to or associatedwith the following three categories of nutritional deficiency, protein mal-nutrition 267, nutritional marasmus 268 and other nutritional deficiency 269.
In infancy (under 1 year of age), relatively few deaths were attributedto protein malnutrition of the kwashiorkor type, while many more were fromnutritional marasmus. In the cities from one-half to two-thirds of the deathswere assigned to the non-specific category, 269 (Figure 34), and were charac-terized by moderate or second degree malnutrition and by the unqualified formsof protein-calorie malnutrition.
Table 24. Nutritional Deficiency as Underlying or Asmociated Cause of Deaths of Infanta and Children 1-4 Yearsby Type of Deficiency in Central Cities and Other Areas, Firet Year of Investigation
Infant deaths Children 1-4 years
Protein ProteinMareasmus Other Maraamus OtherTotal malnutrition Total manutrition OtherCentral city nd (267) (268) (269) (267) (268) (269)other area
RNX e Pate Rate Rate Rate Rate Rateber er te er ter ter Rate ber ber ber
Cali 185' 14.9 18 1.5 65 5.2 101 8.1 188 3.8 73 1.5 28 o.', 87 1.8Cartagena 137 14.6 35 3.7 31 3.3 71 7.6 115 3.2 71 2.0 8 0.2 36 1.0Kingston 104 5.6 4 0.2 29 1.6 71 3.8 56 0.9 13 0.2 13 0.2 29 0.4La Paz 335 19.7 15 0.9 43 2.5 277 16.3 304 4.8 42 0.7 37 0.6 225 3.5Medellin 155* 15.5 2 0.2 64 6.4 87 8.7 156* 4.0 53 1.4 12 · ;.3 90 2.3Monterrey 571 17.3 17 0.5 111 3.4 443 13.4 245' 2.3 65 o.6 44 0.4 136 1.3Recife 608 37.1 50 3.0 190 1.6 368 22.4 376 7.1 152 2.9 94 1.8 130 2.4Resistencia 146 29.2 3 0.6 35 7.0 108 21.6 45 2.7 8 0.5 13 0.8 24 1.5Ribeirao Preto 71 15.8 1 0.2 18 4.0 52 11. 6 28 1.7 11 0.7 5 0.3 12 0.7San Juan 25 8.7 - 7 2.4 18 6.3 4 0.4 - 1 .1 3 0.3San Salvador 270 20.3 11 0.8 62 4.7 197 14.8 208 4.2 70 1.4 51 1.0 87 1.7Santiago 230 '^14.6 2 0.2 69 4.4 157 9.9 46^ 0.7 6 o.1 9 o.1 31 0.5Sao Paulo 559^ 20.1 8 0.3 152 5.5 399 14.4 135-^ 1.3 30 0.3 28 0.3 77 0.7
Other area
Chaco, rural 103 26.4 3 0.8 7 1.8 93 23.8 61 4.5 7 0.5 7 0.5 47 3.5Franca 61 24.1 1 0.4 17 6.7 43 17.0 23 3.2 3 0.4 2 0.3 18 2.5San Juan, suburban 90 23.7 - 34 8.9 56 14.7 15 1.1 - 4 0.3 11 o.8San Juan, rural 139 30.3 1 0.2 50 10.9 88 19.2 41 2.6 3 0.2 7 0.4 31 1.9San Salvador, rural 88 31.4 9 3.2 11 3.9 68 24.3 145
A^ 16.5 78 8.9 28 3.2 39 4.4
* Includes one with category 260-266.Excludes one associated cauae with other nutritional deficiency.
'u
e;
-e
C- -
-y
1*
.
t_
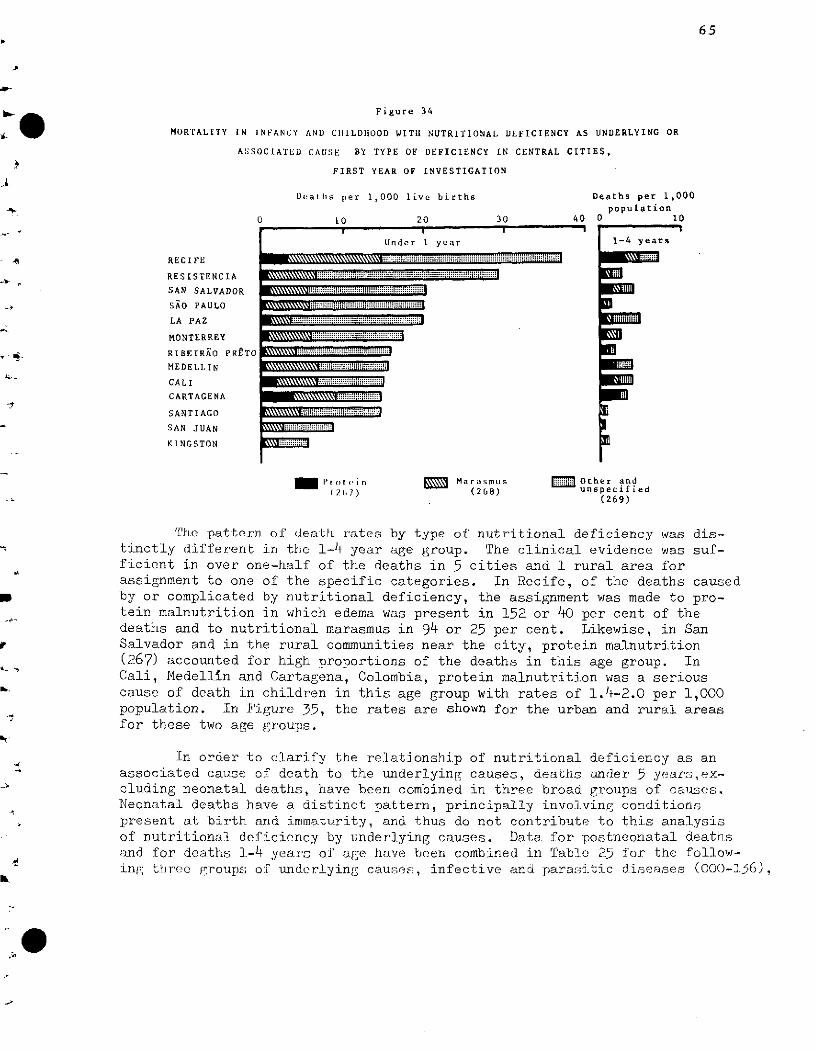
65
Figure 34
MORTALITY IN INFANCY AND CllILDIIOOD WITH NUTRITIONAL DEFICIENCY AS UNDERLYING OR
ASSOCIATED CAUSE BY TYPE OF DEFICIENCY IN CENTRAL CITIES,
FIRST YEAR OF INVESTIGATION
Deathlis per 1,000 live births
RECIFE
RESISTENCIA
SAN SALVADOR
SAO PAULO
LA PAZ
MONTERREY
RIBEIRAO PROTO
MEDELLIN
CALI
CARTAGENA
SANTIAGO
SAN JUAN
KINGSTON
10 20 30
Under 1 year
_ \\\\\\ \ \\\\\\\\\:::'::!:: :,iiii::::::::1 iii:: i:ii i
· ,\\\\\1\ x\\i: i::: ::: :::: : ::::i:i :::: :,
e a U»1 ¡" ] .= ..................... .................................. ...................
*\\\n\\\\, :::iiiiiiiiiii
¡ . ,......................... ~~~.. .........
_x\\\\\\\Yiii,:ii I: :: :: iii e
|\z¡¡¡¡¡\~~~~~7- = -M
JSN\n\ -::::: :.:- :iiii
Lm,\.z .-
P I'rot, i(26(7)
03 Marsinmus(268)
40
Deaths per 1,000population
0 10
1-4 years
M Other andunspecified
(269)
Thfe pattern of deathl rates by type of nutritional deficiency was dis-tinctly different in the 1-4 year age group. The clinical evidence was suf-ficient in over one-half of the deaths in 5 cities and 1 rural area forassignment to one of the specific categories. In Recife, of the deaths causedby or complicated by nutritional deficiency, the assignment was made to pro-tein malnutrition in which edema was present in 152 or 40 per cent of thedeaths and to nutritional marasmus in 94 or 25 per cent. Likewise, in SanSalvador and in the rural communities near the city, protein malnutrition(267) accounted for high proportions of the deaths in this age group. InCali, Medellin and Cartagena, Colombia, protein malnutrition was a seriouscause of death in children in this age group with rates of 1.4-2.0 per 1,000population. In Figure 35, the rates are shown for the urban and rural areasfor these two age groups.
In order to clarify the relationship of nutritional deficiency as anassociated cause of death to the underlying causes, deaths under 5 years,ex-cluding neonatal deaths, have been combined in three broad groups of ca!u.es.Neonatal deaths have a distinct pattern, principally involving conditionspresent at birth and imma.turity, and. thus do not contribute -to this analysisof nutritional deficiency by underlying causes. Data for postneonatal deathsa:nd for deaths 1-4 years of age have been combined in Table 25 for the follow-in'; three grroups of underlying causes, infective and. parasitic diseases (000-136),
· ·1
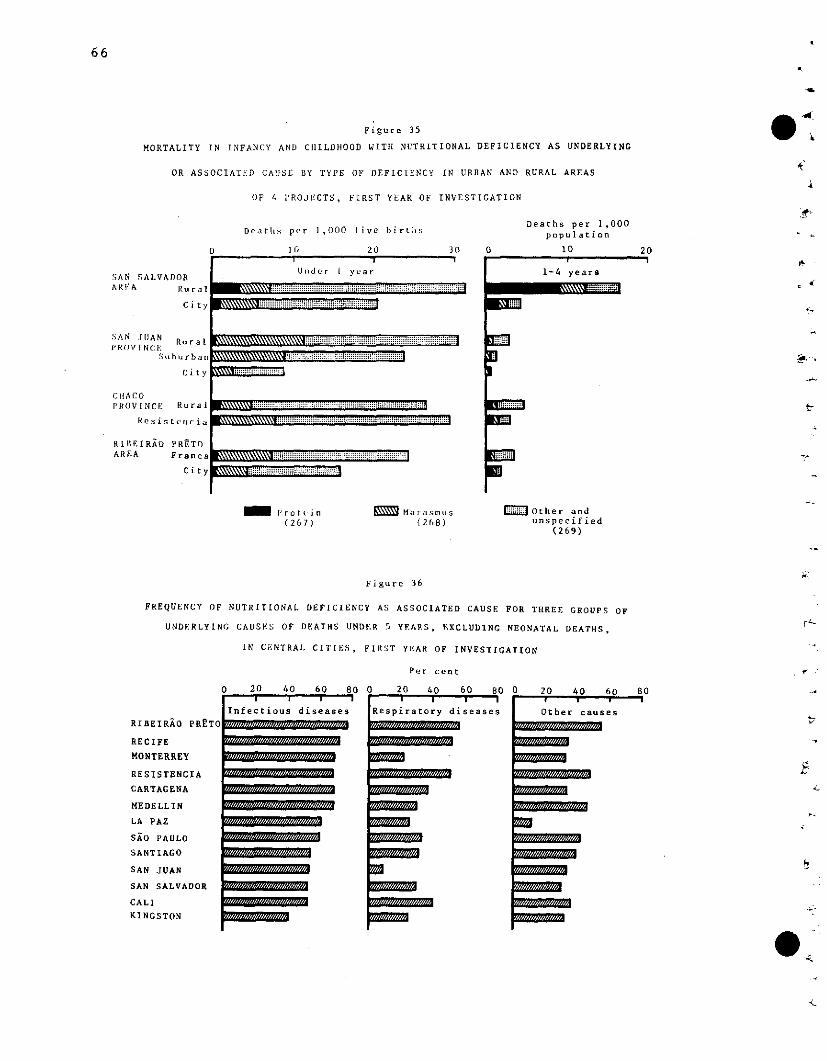
Figure 35
MORTALITY IN INFANCY AND CNILDHOOD WITH NUTRITIONAL DEFICIENCY AS UNDERLYING
OR ASSOCIATED CAUSE BY TYPE OF DEFICIENCY IN URBAN AND RURAL AREAS
OF 4 PROJECTS, FIRST YEAR OF INVESTIGATION
Deatlhs per 1,000 livc births
SAN SALVADORARE:A Rural
City
SAN JUAN RurPR(V f NC E
Su bu rb
C i
iVINACOPROVINCE Rur
Resiste ri
RIBEIRAO PRETnAREA Franca
City
] ( 20 30 O
Ulider ¡ year
: 2\\\\~:ia~íiiíiiii ....................
ran
ty
,al
ia
_ =
Deaths per 1,000population
10 20
1-4 yeara
{] a
[mE~iiii
M Protelin(267)
EM Marasmsus(268)
E:Other andunspecified
(269)
Figure 36
FREQUENCY OF NUTRITIONAL DEFICIENCY AS ASSOCIATED CAUSE FOR THREE GROUPS OF
UNDERLYING CAUSES OF DEATHS UNDER 5 YEARS, EXCLUDING NEONATAL DEATHS,
IN CENTRAl, CITIES, FIRST YEAR OF INVESTIGATION
Per cent
RIBEIRAO PRETO
RECIFE
MONTERREY
RESISTENCIA
CARTAGENA
MEDELLIN
LA PAZ
SAO PAULO
SANTIAGO
SAN JUAN
SAN SALVADOR
CALI
KINGSTON
0 20 40 60 801 y1 1 1 iInfectious diseases
-///ll111==1/1111111/1111
= a=IIIIlJIIIIIIIlIIIIl/IIJ
_ =a1111111111/11/11]1112
_ _////////////////////
0 20 40 60 80 0 20 40 60 80
Respiratory diseases Other causes
.
66
. 'L
4.
m~m~
7ií7í7ií»iffí7M
m7,177~
MARMAM71717AM~
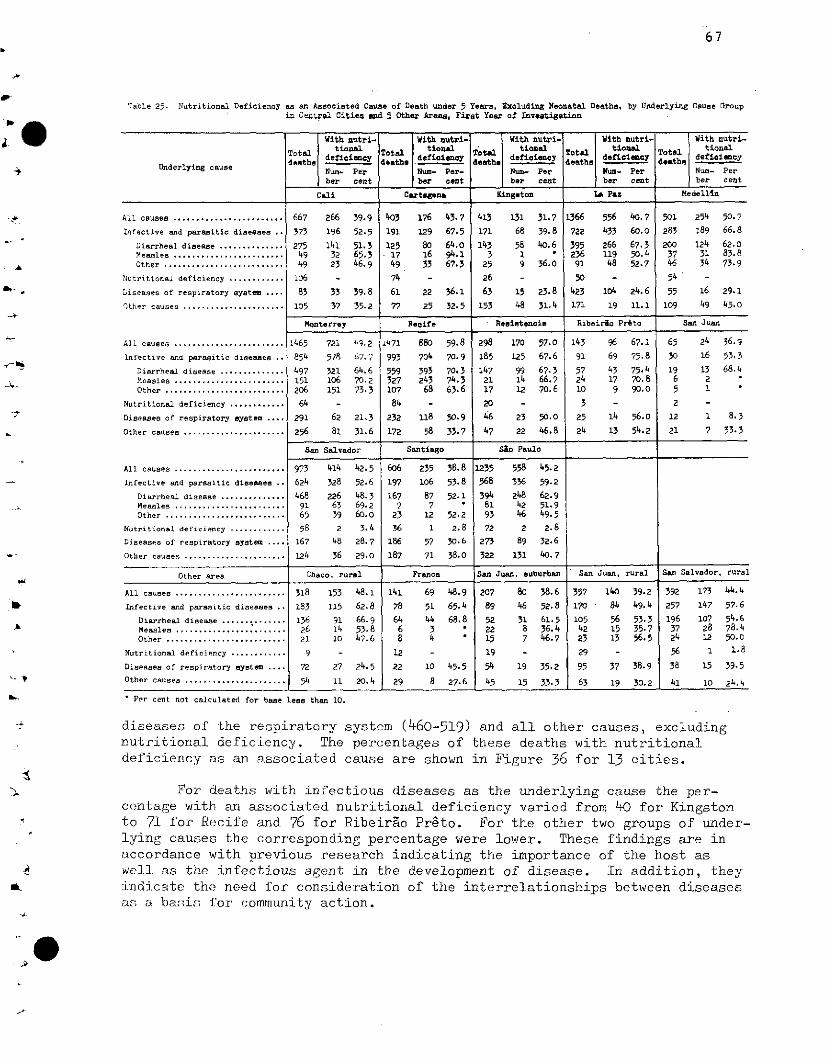
67
Table 25. Nutritional Deficiency as an Associated Cause of Death under 5 Yeara, Excluding Neonatal Deaths, by Underlying Cause Oroupin Central Cities .ad 5 Other Areas, First Year of Investigation
With nutri- With nutri- With nutri- With autri- With nutri-Tioa tii ,t· in ioal tionalTotal tional T tioaota ti otal tioal tionl
a defíiciency 4a dsfisí deficenoy ea deficiíenoy a deficioaey dee efaiencyUnder gcuZ as deaths deathse
Underlying cause Num- Per Num- Per- Nun- Per Num- Per Num- Perber cent ber cent ber cent ber cent ber cent
Cali Cartagena Kingston La Paz Medellín
All causes ........................ 667 266 39.9 403 176 43.7 413 131 31.7 1366 556 40.7 501 254 50.7
Infective and parasitic diseases .. 373 196 52.5 191 129 67.5 171 68 39.8 722 433 60.0 283 189 66.8
Diarrheal disease .............. 275 141 51.3 125 80 64.0 143 58 40.6 395 266 67.3 200 124 62.0Measles ........................ 49 32 65.3 17 16 94.·1 3 1 ' 236 119 50.4 37 31 83.8Other .......................... 49 23 46.9 49 33 67.3 25 9 36.0 91 48 52.7 46 34 73.9
Nutritional deficiency ........... 106 - 74 - 26 - 50 - 54 -
Liseases of respiratory system .... 83 33 39.8 61 22 36.1 63 15 23.8 423 104 24.6 55 16 29.1
Other causes ..................... 105 37 35.2 77 25 32.5 153 48 31.4 171 19 11.1 109 49 45.O
Monterrey Resoie ' esistencia Ribeirgo Prato San Juan
All causes ....................... 1465 72.i '1.2 i471 880 59.8 298 170 57.0 143 96 67.1 65 24 36.9
Infective and paraasitic diaeases . 854 57'8 t6'.7 993 704 70.9 185 125 67.6 91 69 75.8 30 16 53.3
Diarrheal disease ............. 497 321 64.6 559 393 70.3 147 99 67.3 57 43 75.4 19 13 68.4Measles ........................ 151 106 70.2 327 243 74.3 21 14 66.7 24 17 70.8 6 2Other .......................... 206 151 73.3 107 68 63.6 17 12 70.6 10 9 90.0 5 1
Nutritional deficiency ............ 64 - 84 - 20 - 3 - 2 -
Diseases of respiratory system .... 291 62 21.3 232 118 50.9 46 23 50.0 25 14 56.0 12 1 8.3
Other causes ...................... 256 81 31.6 172 58 33.7 47 22 46.8 24 13 54.2 21 7 33.3
San Salvador Santiago Slo Paulo
All causes ........................ 973 414 42.5 606 235 38.8 1235 558 45.2
Infective and parasitic diseases .. 624 328 52.6 197 106 53.8 568 336 59.2
Diarrheal disease .............. 468 226 48.3 167 87 52-1 394 248 62.9Measles ........................ 91 63 69.2 7 7 ' 81 42 51.9Other .......................... 65 39 60.0 23 12 52.2 93 46 49.5
Nutritional deficiency ............ 58 2 3.4 36 1 2.8 72 2 2.8
Diseases of respiratory system .... 167 48 28.7 186 57 30.6 273 89 32.6
Other causes ...................... 124 36 29.0 187 71 38.0 322 131 40.7
Other area Chaco. rural Franca San Juan, suburban San Juan, rural San Salvador, rural
All causes ....................... 318 153 48.1 141 69 48.9 207 80 38.6 357 140 39.2 392 173 44.4
Infective and parasitic diseases .. 183 115 62.8 78 51 65.4 89 46 52.8 170 84 49.4 257 147 57.6
Diarrheal disease ............. 136 91 66.9 64 44 68.8 52 31 61.5 105 56 53.3 196 107 54.6Measles ........................ 26 14 53.8 6 3 ' 22 8 36.4 42 15 35.7 37 28 78.4Other .......................... 21 10 47.6 8 4 * 15 7 46.7 23 13 56.5 24 12 50.0
Nutritional deficiency ............ 9 - 12 - 19 - 29 56 1 1.8
Diseases of respiratory system .... 72 27 24.5 22 10 45.5 54 19 35.2 95 37 38.9 38 15 39.5
Other causes ..................... 1y54 11 20.4 29 8 27.6 45 15 33.3 63 19 30.2 41 o10 24.4
Per cent not calculated for base leas than 10.
diseases of the respiratory system (460-519) and all other causes, excludingnutritional deficiency. The percentages of these deaths with nutritionaldeficiency as an associated cause are shown in Figure 36 for 13 cities.
For deaths with infectious diseases as the underlying cause the per-centage with an associated nutritional deficiency varied from 40 for Kingstonto 71 for Recife and 76 for Ribeir5o Preto. For the other two groups of under-lying causes th.e corresponding percentage were lower. These findings are inaccordance with previous research indicating the importance of the host aswell as the infectious agent in the development of disease. In addition, theyindicate the need for consideration of the interrelationships between diseasesas a basis for community action.
o
68
As pointed out in the previous section, the two principal infectious Odiseases are diarrheal disease and measles. Table 25 also provides data regard-ing the number and percentages of such deaths in which nutritional deficiencywas an associated cause. For diarrheal disease, the percentages of the deathswith nutritional deficiency also were over 70 per cent in Recife and RibeiraoPreto. In early infancy, nutritional deficiency is frequently a result (con-sequence) of repeated episodes of diarrheal disease. Later in infancy and inearly childhood, the deficiency state acts more often as a contributory causeof deaths due to specific causes such as measles.
In projects with high death rates from measles, such as Recife, nutri-tional deficiency was an associated cause (usually contributory) in high per-centages of the deaths (74 per cent in Recife). This interrelationship betweennutritional deficiency and infectious diseases in early childhood is probablya major factor in the excessive death rates from measles, both in the size ofthe death rate and in the age group affected. These interrelationships alsoindicate the need for combined actions for prevention of infections and improve-ment of the nutritional state, within the context of comprehensive health pro-grams.
Congeri-tal Anomalies
In this section for discussion of the role of congenital anomalies in
mortality in infancy and early childhood,there are included those conditions
listed in categories 740-759 (section of congenital anomalies) of the
International Calssification of Diseases and also other anomalies present at
birth, such as congenital hernias, congenital blindness and deafness, congen-
ital phimosis, and congenital dento-facial anomalies which appear in other
categories of the Classification. Appendix Table VII provides detailed data
by three-digit categories of the deaths under 5 years of age included in this
discussion of congenital anomalies. In Appendix Table I, however, and other
sections of this report, inclusions under the term "congenital anomalies" are
restricted to categories 740-759 of the International Classification in order
to allow comparisons at the international basis.
In the Investigation, congenital anomalies have been classified as under-
lying or associated causes of death and also as anomalies which were present
but were not part of the process of death either as underlying or associated
causes. l'or this report, however, only the anomalies that were significant
as causes of death (underlying or associated) have been analyzed. Since the
numbers of deatYhs with anomalies were small for several areas, combined data <
£or the projects are presented.
Table 26 gives the number of deceased infants and children 1-4 years
of age with anomalies as underlying or associated causes of death. Duplica-
tion within systems has been eliminated in this presentation even though more
than one anomaly of the same system may have been coded, so that the number
of infants with anomalies in a given system can be obtained easily. The totalnumber of infants with congenital anomalies is the sum of those with anomalies
* .
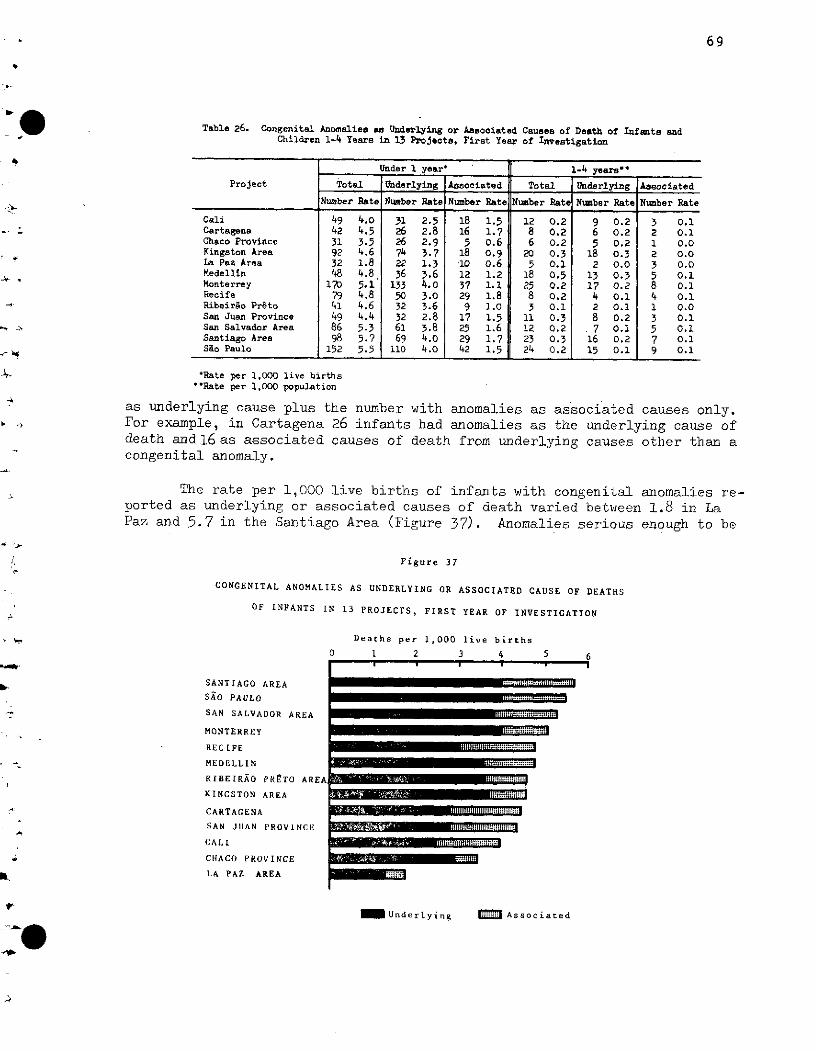
69
Table 26. Congenital Anomalies as Underying or Aasociated Causes of Death of Infante andChildren 1-4 Years in 13 Projecto, First Year of Investigation
Under 1 year 1-4 yearso*
Project Total Underlying Associated Total Underlying Associated
Number Rat Number Rate Number Rate Number Rate Number Rate Number Rate
Cali 49 4.0 31 2.5 18 1.5 12 0.2 9 0.2 3 0.1Cartagena 42 4.5 26 2.8 16 1.7 8 0.2 6 0.2 2 0.1Chaco Province 31 3.5 26 2.9 5 0.6 6 0.2 5 0.2 1 0.0Kingston Area 92 4.6 74 3.7 18 0.9 20 0.3 18 0.3 2 o.oLa Paz Area 32 1.8 22 1.3 10 0.6 5 0.1 2 0.0 3 0.0Medellín 48 4.8 36 3.6 12 1.2 18 0.5 13 0.3 5 0.1Monterrey 170 5.1 133 4.0 37 1.1 25 0.2 17 0.2 8 O.1Recife 79 4.8 50 3.0 29 1.8 8 0.2 4 O.1 4 0.1Ribeirio Prato 41 4.6 32 3.6 9 1.0 3 0.1 2 0.1 1 o.oSan Juan Province 49 4.4 32 2.8 17 1.5 11 0.3 8 0.2 3 0.1San Salvador Area 86 5.3 61 3.8 25 1.6 12 0.2 7 0.1 5 0.1Santiago Area 98 5.7 69 4.0 29 1.7 23 0.3 16 0.2 7 0.1Sao Paulo 152 5.5 110 4.0 42 1.5 24 0.2 15 0.1 9 0.1
'Rate per 1,000 live births"Rate per 1,000 population
as underlying cause plus the number with anomalies as associated causes only.For example, in Cartagena 26 infants had anomalies as the underlying cause ofdeath andl6 as associated causes of death from underlying causes other than acongenital anomaly.
The rate per 1,000 live births of infants with congenital anomalies re-ported as underlying or associated causes of death varied between 1.8 in LaPaz and 5.7 in the Santiago Area (Figure 37). Anomalies serious enough to be
Figure 37
CONGENITAL ANOMALIES AS UNDERLYING OR ASSOCIATED CAUSE OF DEATHS
OF INFANTS IN 13 PROJECTS, FIRST YEAR OF INVESTIGATION
SANTIAGO AREA
SAO PAULO
SAN SALVADOR AREA
MONTERREY
RECIFE
MEDELLIN
RIBEIRAO PRETO ARI
KINGSTON AREA
CARTAGENA
SAN JUAN PROVINCE
CAL
CHACO PROVINCE
LA PAZ AREA
Deaths per 1,000 live births
0 1 2 3 4
EAl 11
. Underlying M: Associated
' .' .... 7
i L~~~ WLiZ4
ii i diin~:l:~::;1it::li
--i bri~~~~~~~~~~~~~~~~~~~~~~~~~~~~~~~~;....
i~~~s~~~"~~ae~~~i n~~~~i~.....
mmtW j_
M >.
5 6
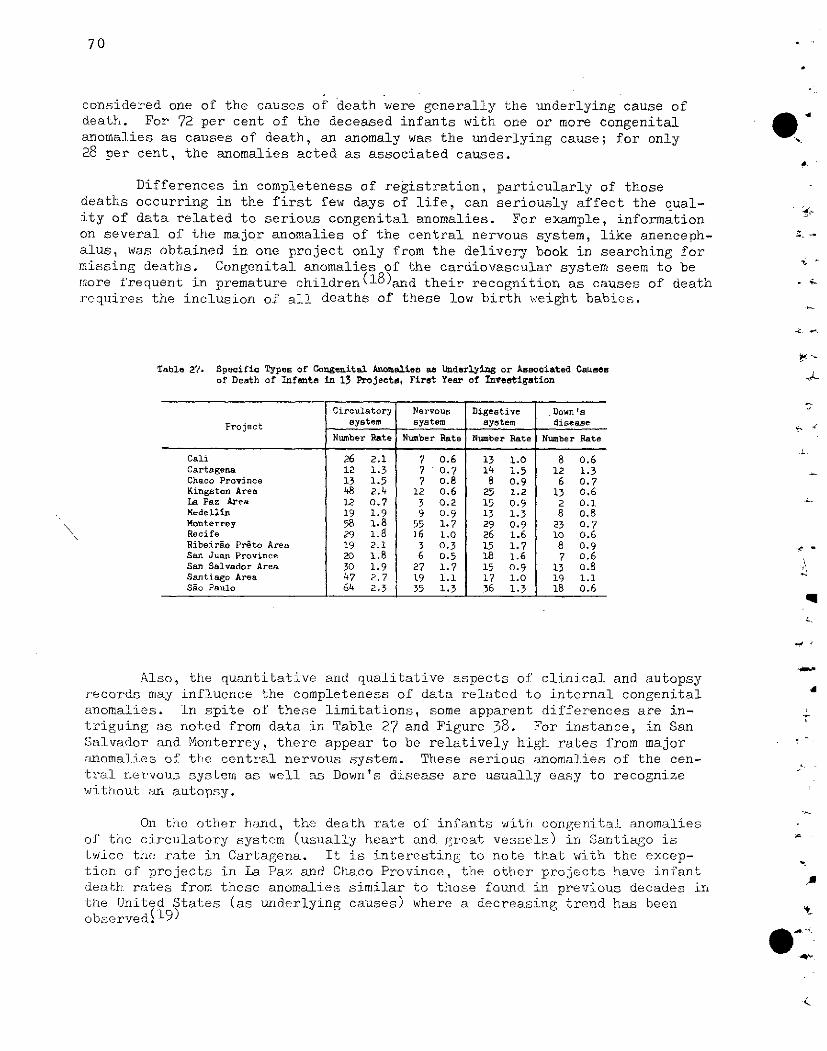
70
considered one of the causes of death were generally the underlying cause ofdeath. For 72 per cent of the deceased infants with one or more congenitalanomalies as causes of death, an anomaly was the underlying cause; for only28 per cent, the anomalies acted as associated causes.
Differences in completeness of registration, particularly of thosedeaths occurring in the first few days of life, can seriously affect the qual-ity of data related to serious congenital anomalies. For example, informationon several of the major anomalies of the central nervous system, like anenceph-alus, was obtained in one project only from the delivery book in searching formissing deaths. Congenital anomalies of the cardiovascular system seem to bemore frequent in premature children(1 8)and their recognition as causes of death -requires the inclusion of all deaths of these low birth weight babies.
Table 27. Specific Types of Gongenital Anomelies as Underlying or Associated Causesof Death of Infante in 13 ProJects, Firet Year of T=vestigation L
Circulatory Nervous Digestive .Down'sProject seyetem sem ystem disease
Number Rate Number Rate Number Rate Number Rate
Cali 26 2.1 7 0.6 13 1.0 8 0.6Cartagena 12 1.3 7 0.7 14 1.5 12 1.3Chaco Province 13 1.5 7 0.8 8 0.9 6 0.7Kingston Area 48 2.4 12 0.6 25 1.2 13 0.6La Paz Area 12 0.7 3 0.2 15 0.9 2 0.1Medellín 19 1.9 9 0.9 13 1.3 8 0.8Monterrey 58 1.8 55 1.7 29 0.9 23 0.7Recife 29 1.8 16 1.O 26 1.6 10 0.6Ribeirao Préto Area 19 2.1 3 0.3 15 1.7 8 0.9San Juan Province 20 1.8 6 0.5 18 1.6 7 0.6San Salvador Area 30 1.9 27 1.7 15 0.9 13 0.8Santiago Area 47 2.7 19 1.1 17 1.0 19 1.1Sao Paulo 64 2.3 35 1.3 36 1.3 18 0.6
Also, the quantitative and qualitative aspects of clinical and autopsyrecords may influence the completeness of data related to internal congenitalanomalies. In spite of these limitations, some apparent differences are in-triguing as noted from data in Table 27 and Figure 38. For instance, in SanSalvador and Monterrey, there appear to be relatively high rates from majoranomalies of the central nervous system. These serious anomalies of the cen-tral nervous system as well as Down's disease are usually easy to recognizewithout an autopsy.
On tfle other hcand, the death rate of infants with congenital anomaliesof the circulatory system (usually heart and great vessels) in Santiago istwice the rate in Cartagena. It is interesting to note that with the excep-tion of projects in La Paz and Chaco Province, the other projects have infantdeath rates from these anomalies similar to those found in previous decades inthe United States (as underlying causes) where a decreasing trend has beenobserved!l9)
q
-d
i
1!
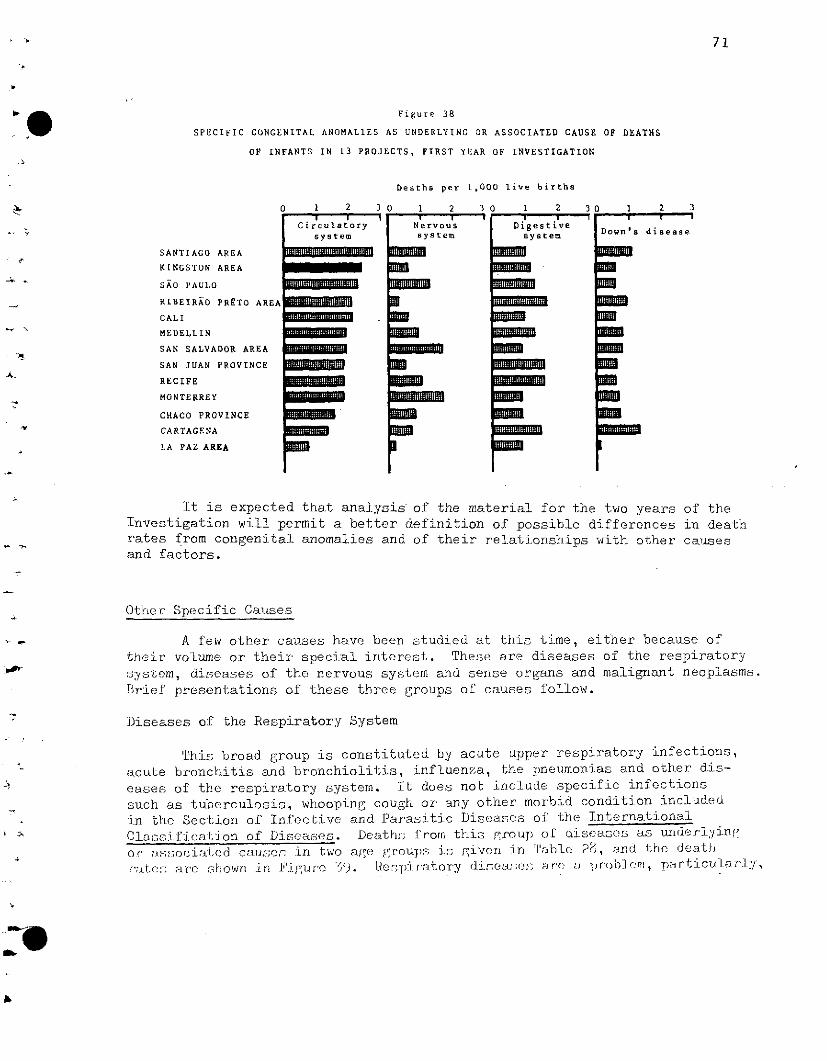
71
Figure 38
SPECIFIC CONGENITAL ANOMALIES AS UNDERLYING OR ASSOCIATED CAUSE OF DEATHS
OF INFANTS IN 13 PROJECTS, FIRST YEAR OF INVESTIGATION
Deaths per 1,000 live births
0 1 2 3 e
Circulatorys ystem
SANTIAGO AREA
KINGSTON AREA
SAO PAULO
RIBEIRAO PR£TO AREA
CALI
MEDELLIN
SAN SALVADOR AREA
SAN JUAN PROVINCE
RECIFE
MONTERREY
CHACO PROVINCE
CARTAGENA
LA PAZ AREA
1 2 3
Nervoussystem
mE~
cmm
_m
NE~~H
a 1tanimt
a=~i
It is expected that analysis of the material for the two years of theInvestigation will permit a better definition of possible differences in deathrates from congenital anomalies and of their relationships with other causesand factors.
Other Specific Causes
A few other causes have been studied at this time, either because oftheir volume or their special interest. These are diseases of the respiratorysystem, diseases of the nervous system and sense organs and malignant neoplasms.
Brief presentations of these three groups of causes follow.
Diseases of the Respiratory System
This broad group is constituted by acute upper respiratory infections,
acute bronchitis and bronchiolitis, influenza, the pneumonias and other dis-
eases of the respiratory system. It does not include specific infections
such as tuberculosis, whooping cough or any other morbid condition includedin the Section of Infective and Parasitic Diseases of the InternationalClascsification of Diseases. Dea-ths from thiis group o£ diseases as underlyinf,or asoci:tLd causen irn two alre gi;roUp is given in riable PT, and the deathr'ate:; are shown in Jigur' e ,'- lepir'atory disea:;en are u pr'ob]em, particuilarl y,
disease
4. -
kmm~~miml n
0 1 2 3 0
Digestivesystem
_4 .
_ ?.
~mmmBAlnfflffl«N~99ERMUAHrnIA fZZE2~~RmnEZZ~WmrmME=~lWtBifB
Iguy~8Wlift9909fI11~I1
BDBllnllA
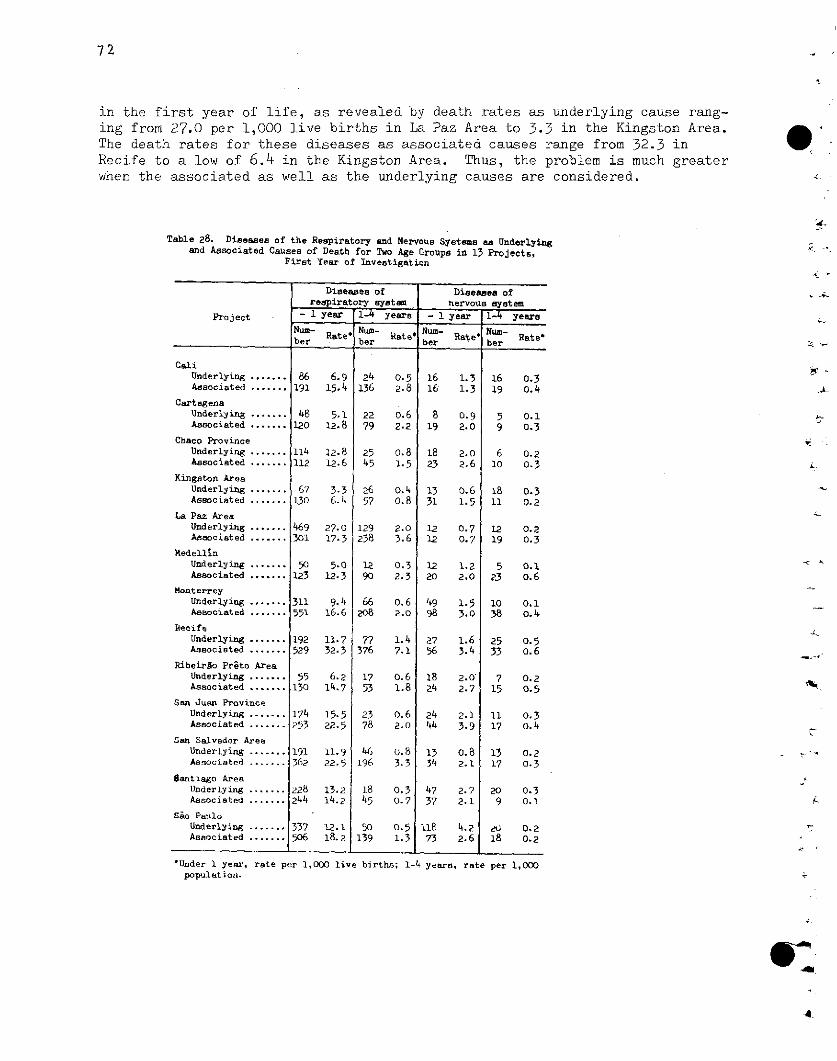
72
in the first year of life, as revealed by death rates as underlying cause rang-ing from 27.0 per 1,000 live births in La Paz Area to 3.3 in the Kingston Area.The death rates for these diseases as associated causes range from 32.3 inRecife to a low of 6.4 in the Kingston Area. Thus, the problem is much greaterwhen the associated as well as the underlying causes are considered.
Table 28. Diseases of the Respiratory and Nervous Systems as Underlyingand Associated Causes of Death for Two Age Groups in 13 Projects,
First Year of Investigation
Diseases of Diseases ofrespirat ry syatm nrervous system
Project - I year 1-4 years - 1 year 1-4 years
Num- R .be N.um- Num-Rbet Rate Rate Rate Rate__ __ _ __ __ _ __ _ b er __________r
CaliUnderlying ....... 86 6.9 24 0.5 16 1.3 16 0.3Associated ....... 191 15.4 136 2.8 16 1.3 19 o.4
CartagenaUnderlying ....... 48 5.1 22 0.6 8 O.9 5 0.1Associated ....... 120 12.8 79 2.2 19 2.0 9 0.3
Chaco ProvinceUnderlying ....... 114 12.8 25 0.8 18 2.0 6 0.2Associated ....... 112 12.6 45 1.5 23 2.6 10 0.3
Kingston AreaUnderlying ....... 67 3.3 26 0.4 13 0.6 18 o.3Associated ....... 130 6.4 57 0.8 31 1.5 11 0.2
La Paz AreaUnderlying ....... 469 27.0 129 2.0 12 0.7 12 0.2Associated ....... 301 17.3 238 3.6 12 0.7 19 0.3
MedellinUnderlying ....... 50 5.0 12 0.3 12 1.2 5 0.1Associated ....... 123 12.3 90 2.3 20 2.0 23 0.6
MonterreyUnderlying ....... 311 9.4 66 0.6 49 1.5 lo0 0.1Associated ....... 551 16.6 208 2.0 98 3.O 38 o.4
RecifeUnderlying ....... 192 11.7 77 1.4 27 1.6 25 0.5Associated ....... 529 32.3 376 7.1 56 3.4 33 0.6
Ribeirao Preto AreaUnderlying ....... 55 6.2 17 o.6 18 2.0O 7 0.2Associated ....... 130 14.7 53 1.8 24 2.7 15 0.5
San Juan ProvinceUnderlying ....... 174 15.5 23 0.6 24 2.1 11 0.3Associated ....... 253 22.5 78 2.0 44 3.9 17 0.4
San Salvador AreaUnderlying ....... 191 11.9 46 o.8 13 0.8 13 0.2Associated .... 362 22.5 196 3.3 34 2.1 17 0.3
Santiago AreaUlnderlying ....... ]228 13.2 18 o.3 47 2.7 20 0.3Associated ....... 244 14.2 45 0.7 37 2.1 9 0.1
Sao PauloUnderlying ....... 337 12.1 50 0.5 118 4.2 ¿O 0.2Aseociated ....... 506 18.2 139 1.3 73 2.6 18 0.2
__ __ ....
'Under 1 year, rate per 1,000 live births; 1-4 years, rate per 1,000population.
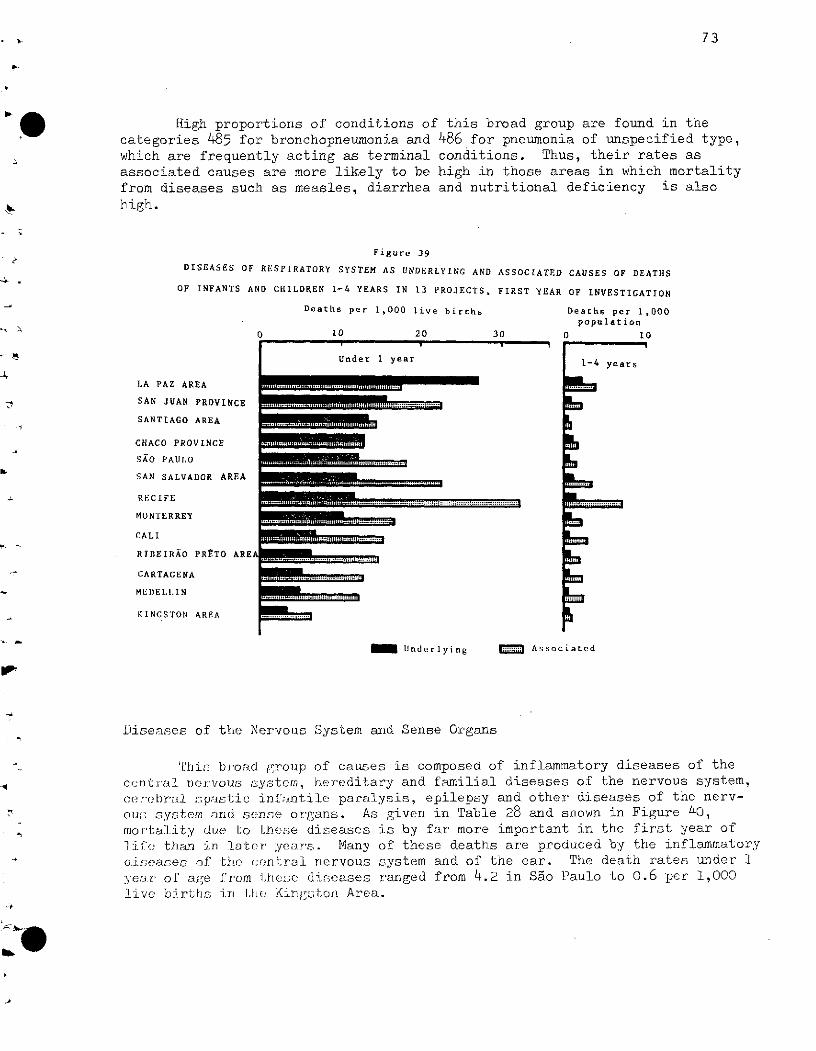
73
High proportions of conditions of this broad group are found in thecategories 485 for bronchopneumonia and 486 for pneumonia of unspecified type,which are frequently acting as terminal conditions. Thus, their rates asassociated causes are more likely to be high in those areas in which mortalityfrom diseases such as measles, diarrhea and nutritional deficiency is alsohigh.
Figure 39
DISEASES OF RESPIRATORY SYSTEM AS UNDERLYING AND ASSOCIATED CAUSES OF DEATHS
OF INFANTS AND CHILDREN 1-4 YEARS IN 13 PROJECTS, FIRST YEAR OF INVESTIGATION
Deaths per 1,000 live births
LA PAZ AREA
SAN JUAN PROVINCE
SANTIAGO AREA
CHACO PROVINCE
SAO PAULO
SAN SALVADOR AREA
RECIFE
MONTERREY
CALI
RIBEIRAO PR2TO AREA
CARTAGENA
MEDELLIN
KINGSTON AREA
10 20 30
Under 1 year
........................ .f i! li
.................. j....... .~ ; ......
....... L. .. .................................. .................... ......I;i......., .................
,l ............. !~'%"~',-,;-l---::ii:i::i ..........................:!:?::,::',:
..... __........lit-~il!,i..........'
. -.=--tirf- ;f;; ~f=;;;:;:
Deaths per 1,000population
0 10
1-4 years
I Underlying ;--. Associated
Diseases of the Nervous System and Sense Organs
'This broad group of causes is composed of inflammatory diseases of thecenL:iaZ norvous system, hereditary and familial diseases of the nervous system,cerebr¿al p;lastic inif.ntile paralysis, epilepsy and other diseases of the nerv-otin system and sense organs. As given in Table 28 and shown in Figure 40,mortality due to these diseases is by far more important in the first year ofif'<e than in lator years. Many of these deaths are produced by the inflammatorydiseases of the cinl;ral nervous system and of the ear. The death rates under 1yeor of age from I;he-e dieases ranged from 4.2 in Sao Paulo to 0.6 per 1,000live births in tiL King;ton Area.
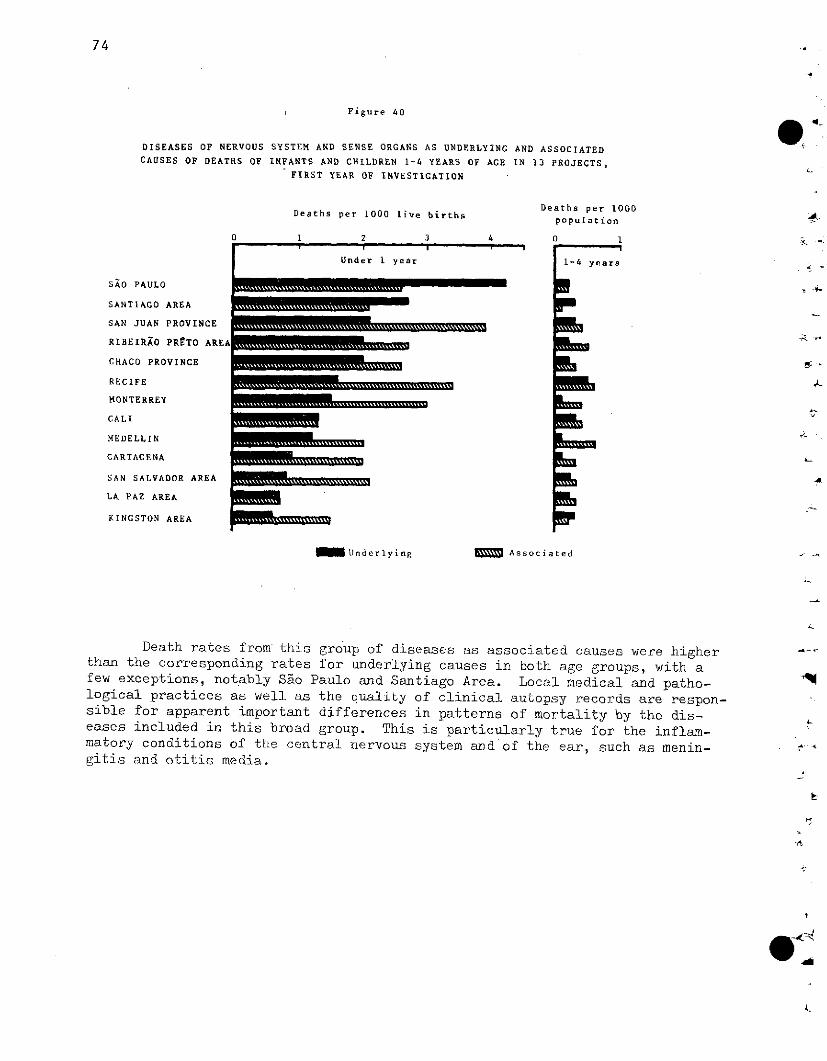
Figure 40
DISEASES OF NERVOUS SYSTEM AND SENSE ORGANS AS UNDERLYING AND ASSOCIATEDCAUSES OF DEATHS OF INFANTS AND CHILDREN 1-4 YEARS OF AGE IN 13 PROJECTS,
FIRST YEAR OF INVESTIGATION
Deaths per 1000 live births
SAO PAULO
SANTIAGO AREA
SAN JUAN PROVINCE
RIBEIRAO PRCTO AR]
CHACO PROVINCE
RECIFE
MONTERREY
CALI
MEDELLIN
CARTAGENA
SAN SALVADOR AREA
LA PAZ AREA
KINGSTON AREA
EA.
0 1 2 3 4
Under 1 year
Deaths per 1000population
0 1
1-4 years
p,
B'
~ Underlying [VB« Associated
Death rates from this group of diseases as associated causes were higherthan the corresponding rates for underlying causes in both age groups, with afew exceptions, notably Sáo Paulo and Santiago Area. Local medical and patho-logical practices as well as the quality of clinical autopsy records are respon-sible for apparent important differences in patterns of mortality by the dis-eases included in this broad group. This is particularly true for the inflam-matory conditions of the central nervous system and of the ear, such as menin-gitis and otitis media.
74
.
4 '-
_ _
�S�rm\\�\\\nu\\\\\�nmn
i · I
~~Y~~~\rz~~~~ mu~~..
a -i y~
·c
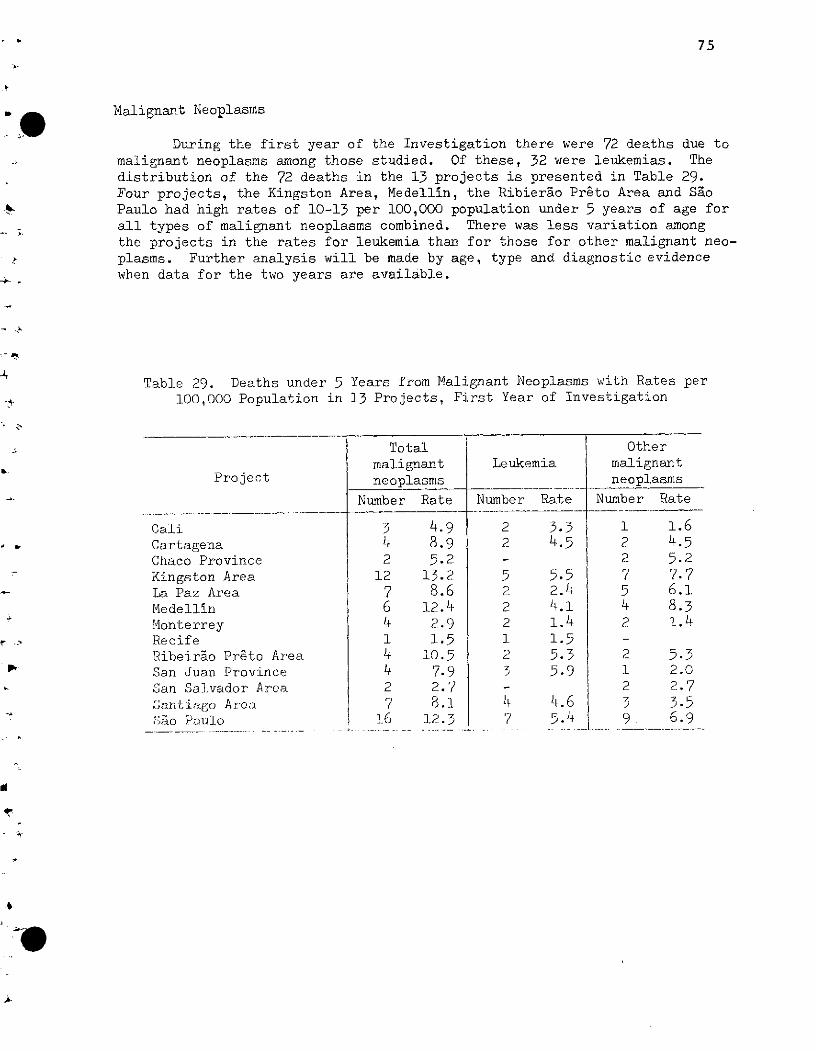
75
Malignant Neoplasms
During the first year of the Investigation there were 72 deaths due tomalignant neoplasms among those studied. Of these, 32 were leukemias. Thedistribution of the 72 deaths in the 13 projects is presented in Table 29.Four projects, the Kingston Area, Medellín, the Ribierao Preto Area and SaoPaulo had high rates of 10-13 per 100,000 population under 5 years of age forall types of malignant neoplasms combined. There was less variation amongthe projects in the rates for leukemia than for those for other malignant neo-plasms. Further analysis will be made by age, type and diagnostic evidencewhen data for the two years are available.
Table 29. Deaths under 5 Years from Malignant Neoplasms with Rates per100,000 Population in 13 Projects, First Year of Investigation
Project
CaliCartagenaChaco ProvinceKingston AreaLa Paz AreaMedellínMonterreyRecifeRibeirao Preto AreaSan Juan ProvinceSan Salvador Area,Santiago Are;aXa4o Paulo
Tr .
Totalmalignantneoplasms
Number Rate
3 4.94 8.92 5.2
12 13.27 8.66 12.44 2.91 1.54 10.54 7.92 2.77 8.1
16 12.3
Leukemia
Number Rate
22
522212
1717
3.34.5
5.52.44.11.41.55.35.9
4.65.4
Othermalignantneoplasms
Number Rate
1 1.62 4.52 5.27 7.75 6.14 8.32 1.4
2 5.31 2.02 2.7
3 3.59 6.9
.

77
IV. MEDICAL AND HEALTH SERVICES
Medical and health services provided to mothers during their preg-nancies and for deliveries of the children included in the Investigation,as well as the medical attention to those children, can be studied from datacollected in interviews with the families. In certain instances, data fromhospitals or other sources complemented the information obtained in homeinterviews. In this report, reference will be made to services and indica-tors pertaining to deceased children and their mothers. Later, such informa-tion will become available for the general population of these areas fromthe probability sample of households so that comparisons may be made. It ishoped that the following brief presentation will stimulate actions directedtoward solving the problems indicated, as well as the initiation of studiesregarding factors regulating the qualitative and quantitative aspects ofhealth services and their utilization.
Interviews with families of deceased children were carried out in 90per cent or more of the deaths in 5 cities and 7 other areas (Appendix TableIX). All families were interviewed in rural St. Andrew and high propor-tions in the projects of Chaco and San Juan Provinces and the San SalvadorArea. Several projects, particularly those in Colombia and Bolivia, expe-rienced great difficulty in locating families, in large part due to unsat-isfactory addresses on death certificates and hospital records.
In order to obtain information on the reproductive history and prena-tal care of the mother, and on facts about the delivery, breast feeding, andgrowth and development of the child, the mother was considered the preferablesource of information in the home. In a few areas, the father preferred toprovide the information to the nurse or social worker, and in others thegrandmother often was the source of the data. Appendix Table IX gives thenumbers and percentages of families of deceased children with family inter-views and those in which the mother provided the data.
Prenatal Care
Close surveillance is required if the serious complications of preg-nancy and delivery are to be discovered early enough to avoid excessive lossof life. The success in collecting this important information varied amongthc projects, depending on the possibility of carrying out family interviews;thus, the data presented here relate only to mothers in families with inter-views.
For consideration of the prenatal care received by these mothers, the(data are sufficient for combining into three groups (1) those with at leastfour prenatal visits to a doctor or clinic, (2) those with one, two or threevisits, including those in which at least one visit was made but the totalnumber was not known, and (3) those with no visits or with no informationavailable regarding prenatal care (Table 30). As shown in Figure 41, thecity of San Juan was found to have the highest percentage of mothers with
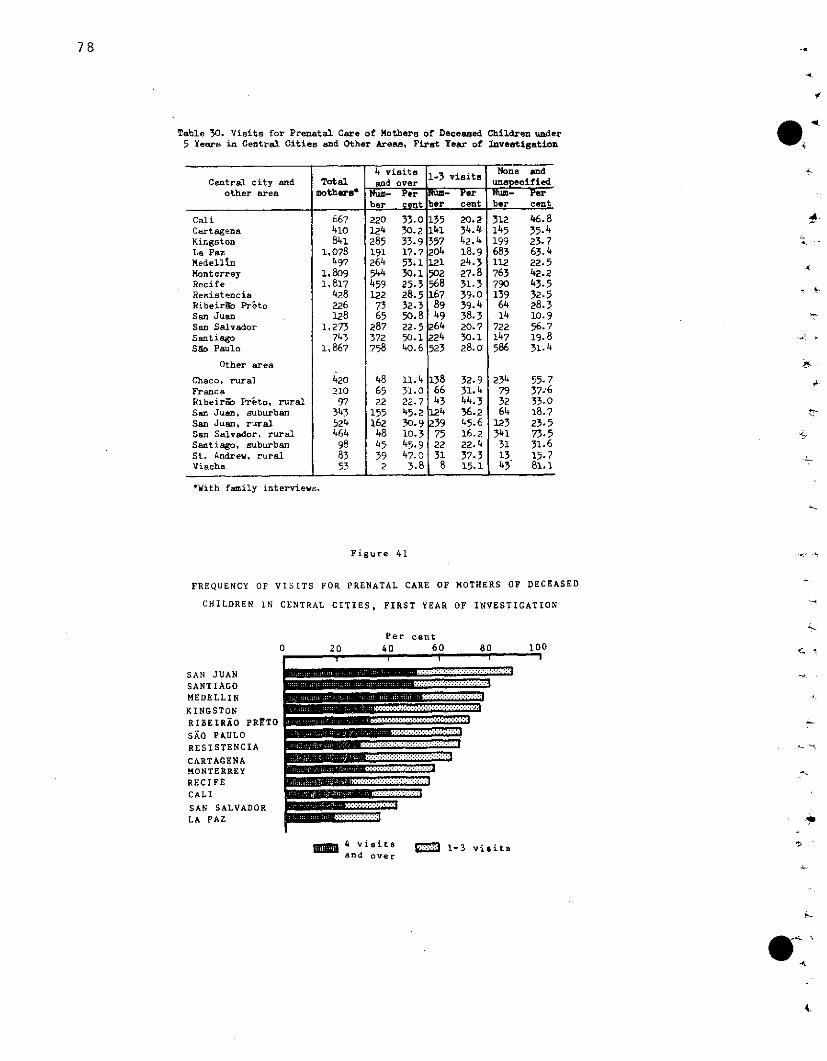
Table 30. Visits for Prenatal Care of Mothers of Deceased Children under5 Years in Central Cities and Other Aresa, First Year of Investigation
4 visita 1-3 visita None andCentral city and Total and over unspecified
other area mother r - er Pber cent ber cent ber cent
Cali 667 220 33.0 135 20.2 312 46.8Cartagena 410 124 30.2 141 34.4 145 35.4Kingston 841 285 33.9 357 42.4 199 23.7La Paz 1,078 191 17.7 204 18.9 683 63.4Medellin 497 264 53.1 121 24.3 112 22.5Monterrey 1,809 544 30.1 502 27.8 763 42.2Recife 1,817 459 25.3 568 31.3 790 43.5Resistencia 428 122 28.5 167 39.0 139 32.5Ribeirao Preto 226 73 32.3 89 39.4 64 28.3San Juan 128 65 50.8 49 38.3 14 10.9San Salvador 1,273 287 22.5 264 20.7 722 56.7Santiago 743 372 50.1 224 30.1 147 19.8Sao Paulo 1,867 758 40.6 523 28.0 586 31.4
Other area
Chaco, rural 420 48 11.4 138 32.9 234 55.7Franca 210 65 31.0 66 31.4 79 37.6Ribeirao Préto, rural 97 22 22.7 43 44.3 32 33.0San Juan. suburban 343 155 45.2 124 36.2 64 18.7San Juan, rural 524 162 30.9 39 45.6 123 23.5San Salvador, rural 464 48 10.3 75 16.2 341 73.5Santiago, suburban 98 45 45.9 22 22.4 31 31.6St. Andrew, rural 83 39 47.0 31 37.3 13 15.7Viacha 53 2 3.8 8 15.1 43 81.1
*With family interviews.
Figure 41
FREQUENCY OF VISITS FOR PRENATAL CARE OF MOTHERS OF DECEASED
CHILDREN IN CENTRAL CITIES, FIRST YEAR OF INVESTIGATION
Per centO 20 40 60 80 100
SAN JUANSANTIAGOMEDELLIN
KINGSTONRIBEIRAO PRETOSAO PAULORESISTENCIACARTAGENAMONTERREYRECIFECALI
SAN SALVADORLA PAZ
IE 4 visitas 4 1-3 visitaand over
78 ,
.
J,
.s
. s
i -i -i i~~~~~~~~~~~~~~~~
.. .. ... .
g l" .~ ~C. ............... ··.··. ·
· 8AliB~~~r~D1B~~·s~~.·~·í. .. ... ....
I
,
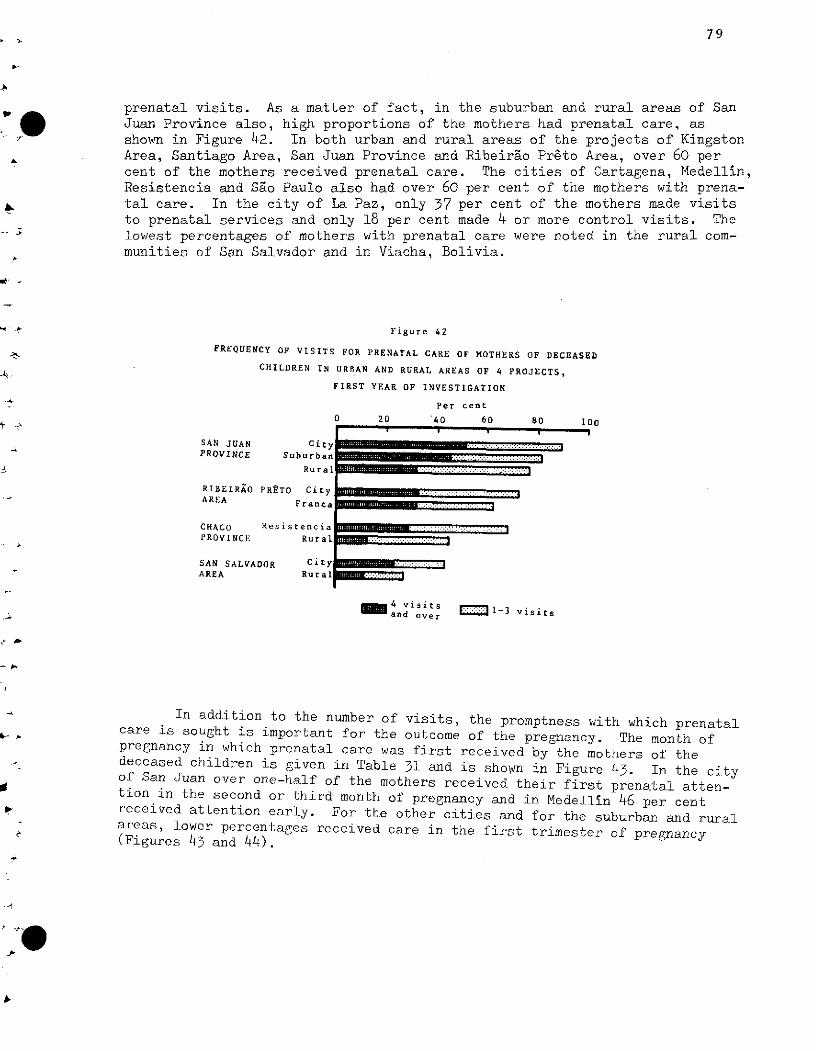
79
prenatal visits. As a matter of fact, in the suburban and rural areas of SanJuan Province also, high proportions of the mothers had prenatal care, asshown in Figure 42. In both urban and rural areas of the projects of KingstonArea, Santiago Area, San Juan Province and Ribeirao Preto Area, over 60 percent of the mothers received prenatal care. The cities of Cartagena, Medellin,Resistencia and Sao Paulo also had over 60 per cent of the mothers with prena-tal care. In the city of La Paz, only 37 per cent of the mothers made visitsto prenatal services and only 18 per cent made 4 or more control visits. Thelowest percentages of mothers with prenatal care were noted in the rural com-munities of San Salvador and in Viacha, Bolivia.
Figure 42
FREQUENCY OF VISITS FOR PRENATAL CARE OF MOTHERS OF DECEASED
CHILDREN IN URBAN AND RURAL AREAS OF 4 PROJECTS,
FIRST YEAR OF INVESTIGATION
Per cent
O 20 40 60 80 10l
SAN JUAN CityPROVINCE Suburban
Rural
RIBEIRAO PRETO CityAREA Franca
CHACO ResistenciaPROVINCE Rural ::
SAN SALVADOR CityAREA Rural ::
4 vis'tsand over 1-3 visits
In addition to the number of visits, the promptness with which prenatalcare is sought is important for the outcome of the pregnancy. The month ofpregnancy in which prenatal care was first received by the mothers of thedeceased children is given in Table 31 and is shown in Figure 43. In the cityof San Juan over one-half of the mothers received their first prenatal atten-tion in the second or third month of pregnancy and in Medellin 46 per centreceived attention early. For the other cities and for the suburban and ruralareas, lower percentages received care in the first trimester of pregnancy(Figures 43 and 44).
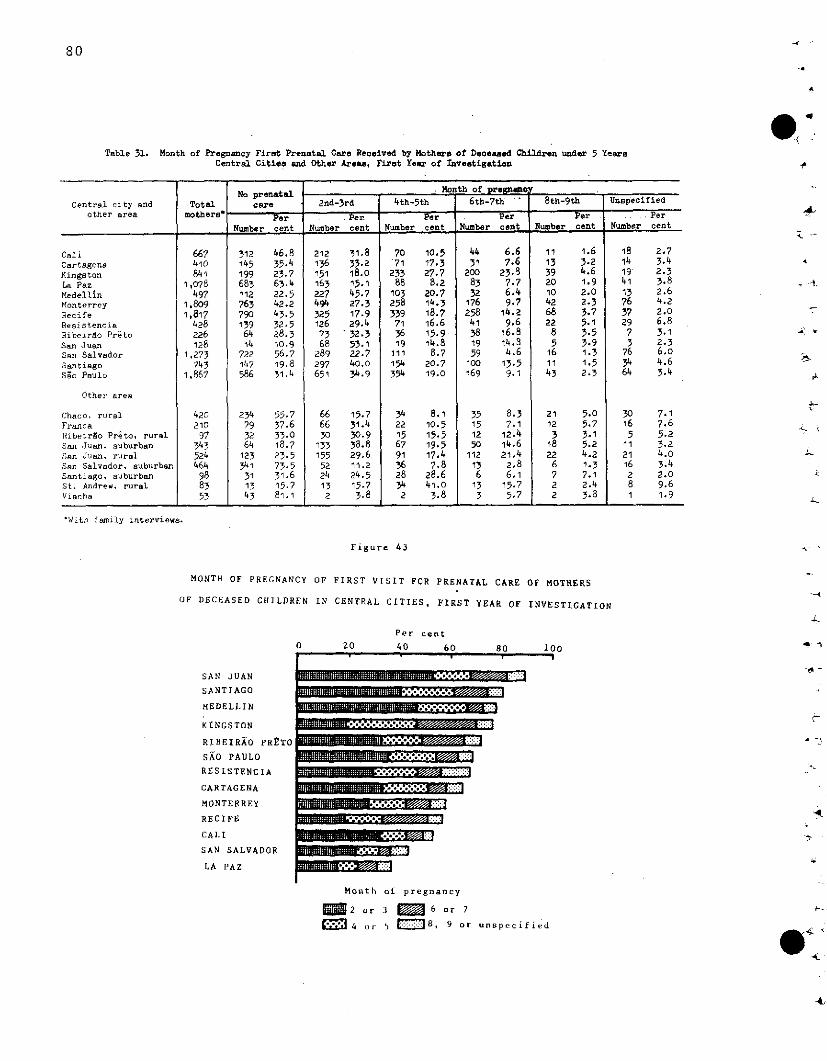
Table 31. Month of Pregnancy First Prenatal Care Received by Mothera of Deceased Children under 5 YearsCentral Cities and Other Areas, First Year of Investigation
No prenatal Month of pregnirCentral city and Total care 2nd-3rd 4th-5th 6th-7th 8th-9th Unspecified
other area mothersPer Per P er Pr Pr Pr Pr Per
Number cent Number cent Number cent Number cent Number cent Number cent
Cali 667 312 46.8 212 31.8 70 10.5 44 6.6 11 1.6 18 2.7Cartagena 410 145 35.4 136 33.2 71 17.3 31 7.6 13 3.2 14 3.4Kingston 841 199 23.7 151 18.0 233 27.7 200 23.8 39 4.6 19 2.3La Paz 1,078 683 63.4 163 15.1 88 8.2 83 7.7 20 1.9 41 3.8Medellin 497 112 22.5 227 45.7 103 20.7 32 6.4 10 2.0 13 2.6Monterrey 1.809 763 42.2 494 27.3 258 14.3 176 9.7 42 2.3 76 4.2Recife 1,817 790 43.5 325 17-9 339 18.7 258 14.2 68 3.7 37 2.0Resistencia 428 139 32.5 126 29.4 71 16.6 41 9.6 22 5.1 29 6.8Ribeirgo Preto 226 64 28.3 73 '32.3 36 15.9 38 16.8 8 3.5 7 3.1San Juan 128 14 10.9 68 53.1 19 14.8 19 14.
35 3.9 3 2.3
San Salvador 1,273 722 56.7 289 22.7 111 8.7 59 4.6 16 1.3 76 6.0Santiago 743 147 19.8 297 40.O 154 20.7 100 13.5 11 1.5 34 4.6
SEo Paulo 1,867 586 31.4 651 34.9 354 19.0 169 9.1 43 2.3 64 3.4
Other area
Chaco, rural 420 234 55.7 66 15.7 34 8.1 35 8-3 21 5.0 30 7.1Franca 210 79 37.6 66 31.4 22 10.5 15 7.1 12 5.7 16 7.6Ribeirio Preto, rural 97 32 33.0 30 30.9 15 15.5 12 12.4 3.1 5 5.2San Juan, suburban 343 64 18.7 133 38.8 67 19.5 50 14.6 18 5.2 11 3.2San Juan, rural 524 123 23.5 155 29.6 91 17.4 112 21.4 22 4.2 21 4.0
San Salvador, suburban 464 341 73.5 52 11.2 36 7.8 13 2.8 6 1.3 16 3.4Santiago, suburban 98 31 31.6 24 24.5 28 28.6 6 6.1 7 7.1 2 2.0St. Andrew. rural 83 13 15.7 13 15.7 34 41.0 13 15.7 2 2.4 8 9.6Viacha 53 43 81.1 2 3.8 2 3.8 3 5.7 2 3.8 1 1.9
'With family interviews.
Figure 43
MONTH OF PREGNANCY OF FIRST VISIT FOR PRENATAL CARE OF MOTHERS
OF DECEASED CHILDREN IN CENTRAL CITIES, FIRST YEAR OF INVESTIGATION
Per cent
0 20 40 60 80 100
SAN JUAN
SANTIAGO
MEDELLIN
KINGSTON
RIBEIRAO PRETO
SAO PAULO
RESISTENCIA
CARTAGENA
MONTERREY
RECIFE
CALI
SAN SALVADOR
LA PAZ
.iH.iD.i/_ :.-.-.// EW/ :;: :!
Month of pregnancy
= 2 or 3 [M 6 or 7
3 4 or 5 '.: 8, 9 or unspecified C
-k
80
.· l11
14,
.4
,,
1 1
Ilf<RW -mllp rsnt~=··;·-rímfrlRm#nr.l rrrrr~::
WIlUiiiftnr# i~Bf~li~tt~ i 7 77. Z Z -.-
fiBRAff#l1~;:·.l;~y;...i; .. e- 7
---------------------------------- ...·-·-,-
*
e-
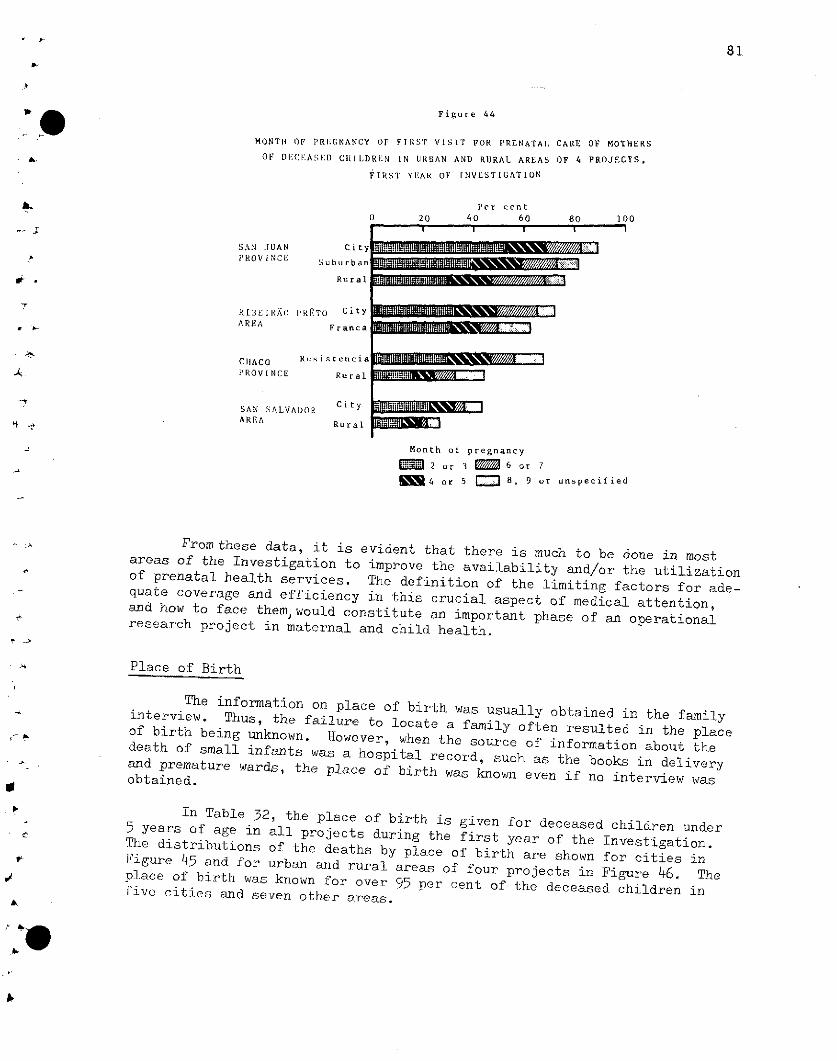
81
Figure 44
MONTH OF PREGNANCY OF FIRST VISIT FOR PRENATAI.OF [)(::EAS:ED CHILDRiEN IN L1URBAN AND RURAL AREAS
FlRST'I YEAR OF INVESTIGATION
Per cent0 20 40 60r 0 4 6 1 1
CARE OF MOTHERS
OF 4 PROJECTS,
80 100
SAN JUAN CityP'ROVINCE Suburban
Rural
RIBEIRAO I'RETO CityAREA Franca
CIIHACO RsistcnciaI'ROVINCE Rural
SAN SALVADORAREA
City
Rural 0
Month of pregnancy
Mii~ 2 or 3 E 6 or 7
= ~ 4 or 5 = 8, 9 or unspecified
Fromthese data, it is evident that there is much to be done in mostareas of the Investigation to improve the availability and/or the utilizationof prenatal health services. The definition of the limiting factors for ade-quate coverage and efficiency in this crucial aspect of medical attention,and how to face them,would constitute an important phase of an operationalresearch project in maternal and child health.
Place of Birth
The information on place of birth was usually obtained in the familyinterview. Thus, the failure to locate a family often resulted in the placeof birth being unknown. However, when the source of information about thedeath of small infants was a hospital record, such as the books in deliveryand premature wards, the place of birth was known even if no interview wasobtained.
In Table 32, the place of birth is given for deceased children under5 years of age in all projects during the first year of the Investigation.The distributions of the deaths by place of birth are shown for cities inl'igure 45 and for urban and rural areas of four projects in Figure 46. Theplace of birth was known for over 95 per cent of the deceased children inLive cities and seven other a-reas.
o' .
a ------nffltI 1111n1\\\~ i__. .... I
M,
�� , 1
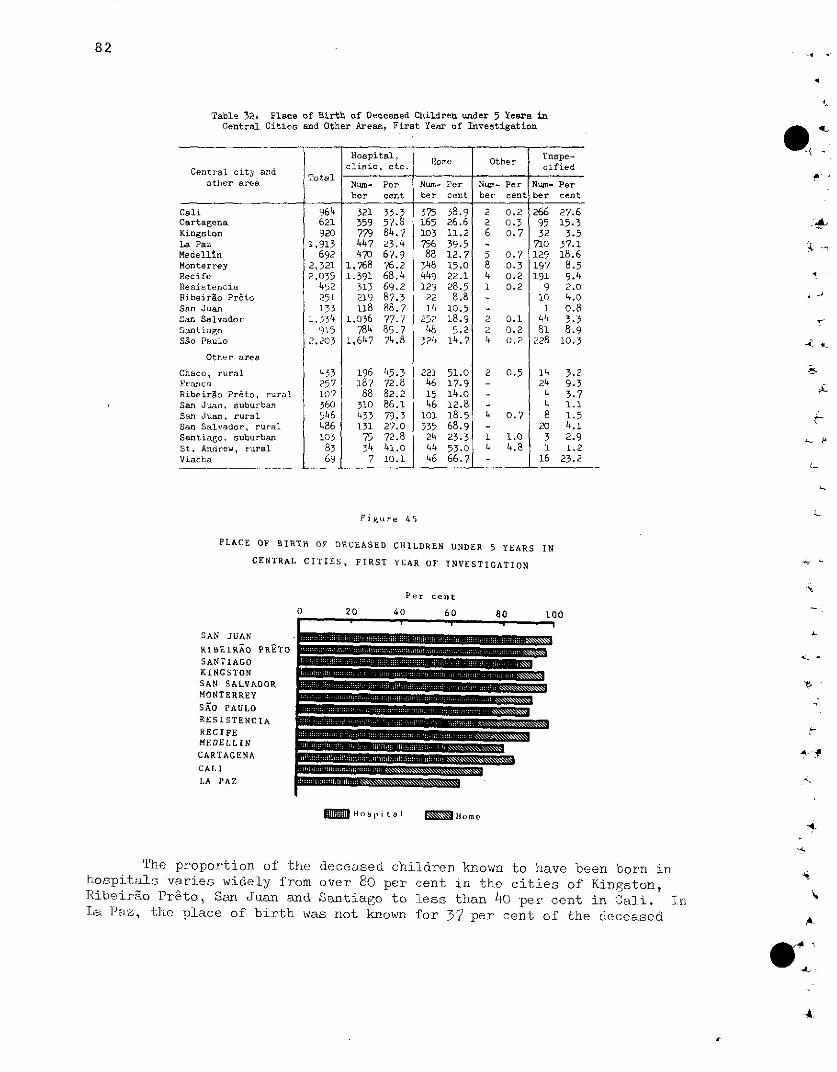
82
Table 32. Place of Birth of Deceaaed Children under 5 Yeara iniCentral Cities and Other Areas, First Year of Investigation _ «
Hospital, oe Other Unspe-clinic, etc. cifiedCentral city andnc etc cfedTotal
other area Num- Per Num- Per Num- Per Num- Perber cent ber cent ber cent ber cent
CaliCartagenaKingstonLa PazMedellinMonterreyRecifeResistenciaRibeirao PretoSan JuanSan SalvadorSantiagoSao Paulo
Other area
Chaco, ruralFrancaRibeirao Preto, ruralSan Juan, suburbanSan Juan, ruralSan Salvador, ruralSantiago, suburbanSt. Andrew, ruralViacha
964621920
1,913692
2,3212,035
452251133
1,534915
2,2(03
433257107360546486
69
32135977944747o
1,7681,391
313219118
1,036784
1,647
196187
88310433131
75347
33.357.884.723.467.976.268.469.287.388.777.785.774.8
45.372.882.286.179.327.072.841.010.1
37516510375688
348449129
2214
25248
3241
221461546
101335244446
38.926.611.239.512.715.022.128.5
8.810.518.95.2
14.7
51.017.914.012.818.568.923.353.066.7
226
5841
224
2
4
14
0.20.30.7
0.70.30.20.2
0.10.20.2
0.5
0.7
1.04.8
2669532
710129197191
9101
4481
228
1424448
2031
16
27.615.3
3.537.118.6
8.59.42.04.00.83.38.9
10.3
4i,
- k.
3.29.33.71.11.54.12.91.2
23.2
Figure 45
PLACE OF BIRTH OF DECEASED CHILDREN UNDER 5 YEARS IN
CENTRAL CITIES, FIRST YEAR OF INVESTIGATION
SAN JUAN
RIBEIRAO PRETOSANTIAGOKINGSTONSAN SALVADORMONTERREY
SAO PAULORESISTENCIA
RECIFEMEDELLINCARTAGENA
CAII
LA PAZ
Per cent
0 20 40 60 80 10(
-i= i
...........- xx<~xxxx~~xxx .xxEZ=
= 11o31p ta 1 Hoe=
4-
4,-f
4
The proportion of the deceased children known to have been born inhospitals varies widely from over 80 per cent in the cities of Kingston,Ribeirao Preto, San Juan and Santiago to less than 40 per cent in Cali. InLa Paz, tihe place of birth was not known for 37 per cent of the deceased
.4-
0
$
W -
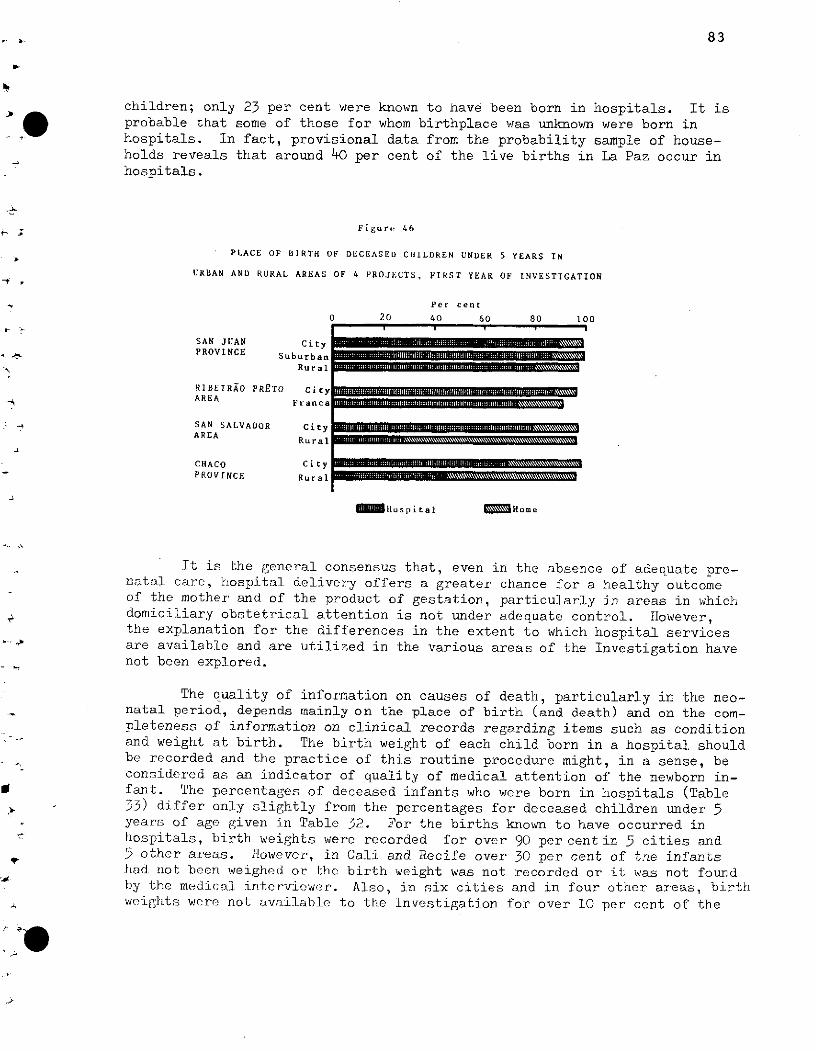
83
children; only 23 per cent were known to have been born in hospitals. It isprobable that some of those for whom birthplace was unknown were born inhospitals. In fact, provisional data from the probability sample of house-holds reveals that around 40 per cent of the live births in La Paz occur inhospitals.
Figure 46
PLACE OF BIRTH OF DECEASED CIIILDREN UNDER 5 YEARS IN
URBAN AND RURAL AREAS OF 4 PROJECTS, FIRST YEAR OF INVESTIGATION
Per cent
0 20 40 60 80 100
SAN JUAN CityPROVINCE Suburban
Rural
RIBEIRAO PRtTO CityAREA Franca
SAN SALVADOR CityAREA
CHACO CityPROVINCE Rural
~l Hospital = Home
It is the general consensus that, even in the absence of adequate pre-natal care, hospital delivery offers a greater chance for a healthy outcomeof the mother and of the product of gestation, particularly in areas in whichdomiciliary obstetrical attention is not under adequate control. However,the explanation for the differences in the extent to which hospital servicesare available and are utilized in the various areas of the Investigation havenot been explored.
The quality of information on causes of death, particularly in the neo-natal period, depends mainly on the place of birth (and death) and on the com-pleteness of information on clinical records regarding items such as conditionand weight at birth. The birth weight of each child born in a hospital shouldbe recorded and the practice of this routine procedure might, in a sense, beconsidered as an indicator of quality of medical attention of the newborn in-fant. The percentages of deceased infants who were born in hospitals (Table33) differ only slightly from the percentages for deceased children under 5years of age given in Table 32. For the births known to have occurred inlhospitals, birth weights were recorded for over 90 per cent in 5 cities and5 other areas. I-owever, in Cali and Recife over 30 per cent of tne infantshad not been weighed or the birth weight was not recorded or it was not foundby the medical inter'viewer. Also, in six cities and in four other areas, birthweights were not available to the Investigation for over 10 per cent of the
�BII1WI1AaB�AIABBAA181��
IBI1II�QRABBDRIA1AIIiB1��
nitiulRiRaRwi��r�Hna\\�\\�\\\Y�
53ee
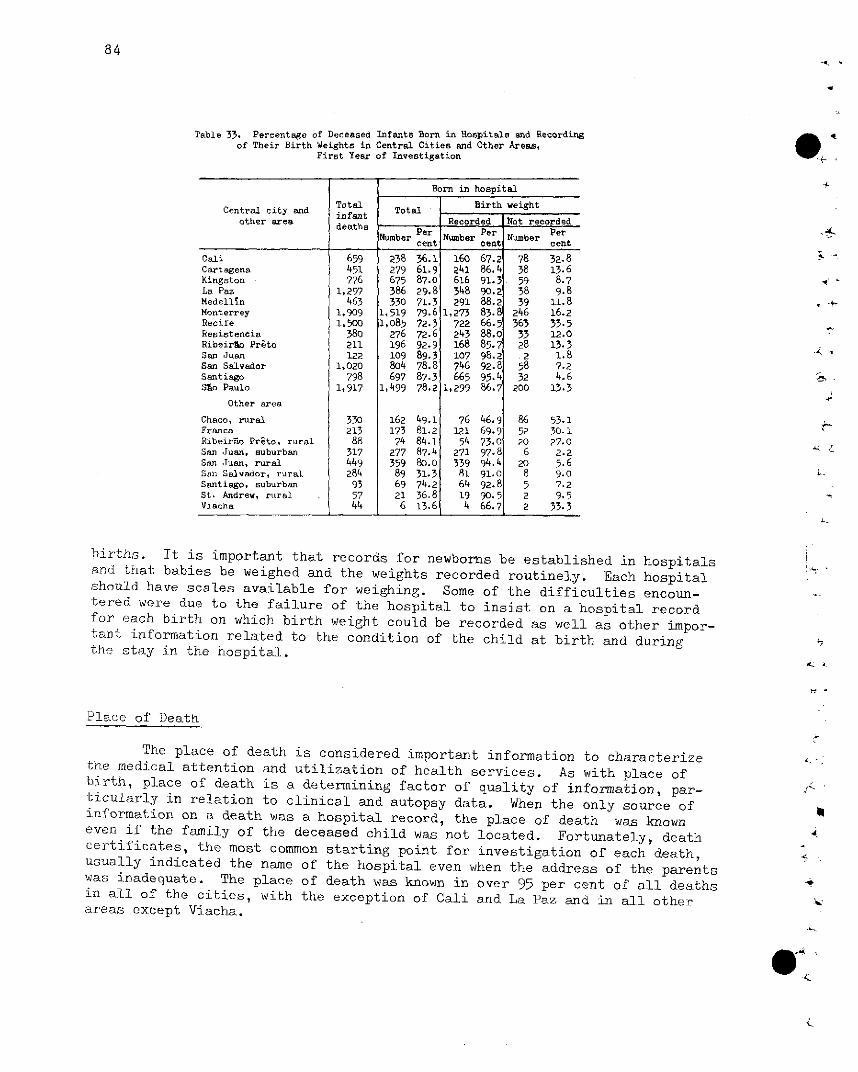
84
Table 33. Percentage of Deceased Infants Born in Hospitala and Recordingof Their Birth Weights in Central Cities and Other Areas,
First Year of Investigation
Born in hospital
Total Birth weightCentral city and fa Totalother area death Recorded Not recordeddeaths
umer Per Number Pe r Percent cent cent
Cali 659 238 36.1 160 67.2 78 32.8Cartagena 451 279 61.9 241 86.4 38 13.6Kingston 776 675 87.0 616 91.3 59 8.7La Paz 1,297 386 29.8 348 90.2 38 9.8Medellin 463 330 71.3 291 88.2 39 11.8Monterrey 1,909 1,519 79.6 1,273 83.8 246 16.2Recife 1,500 1,085 72.3 722 66.5 363 33.5Resistencia 380 276 72.6 243 88.0 33 12.0Ribeirio Preto 211 196 92.9 168 85.7 28 13.3San Juan 122 109 89.3 107 98.2 2 1.8San Salvador 1,020 804 78.8 746 92.8 58 7.2Santiago 798 697 87.3 665 95.4 32 4.6SAo Paulo 1,917 1,499 78.2 1,299 86.7 200 13.3
Other area
Chaco, rural. 330 162 49.1 76 46.9 86 53.1Franca 213 173 81.2 121 69.9 52 30.1Ribeirao Preto, rural 88 74 84.1 54 73.0 20 27.0San Juan, suburban 317 277 87.4 271 97.8 6 2.2San Juan, rural 449 359 80.0 339 94.4 20 5.6San Salvador, rural 284 89 31.3 81 91.0 8 9.0Santiago, suburban 93 69 74.2 64 92.8 5 7.2St. Andrew, rural 57 21 36.8 19 90.5 2 9.5Viacha 44 6 13.6 4 66.71 2 33.3
births. It is important that records for newborns be established in hospitalsand that babies be weighed and the weights recorded routinely. Each hospitalshould have scales available for weighing. Some of the difficulties encoun-tered were due to the failure of the hospital to insist on a hospital recordfor each birth on which birth weight could be recorded as well as other impor-tant information related to the condition of the child at birth and duringthe stay in the hospital.
Place of Death
The place of death is considered important information to characterizethe medical attention and utilization of health services. As with place ofbirth, place of death is a determining factor of quality of information, par-ticularly in relation to clinical and autopsy data. When the only source ofinformation on a death was a hospital record, the place of death was knowneven if the family of the deceased child was not located. Fortunately, deathcertificates, the most common starting point for investigation of each death,usually indicated the name of the hospital even when the address of the parentswas inadequate. The place of death was known in over 95 per cent of all deathsin all of the cities, with the exception of Cali and La Paz and in all otherareas except Viacha.
. -
-4
11
-L
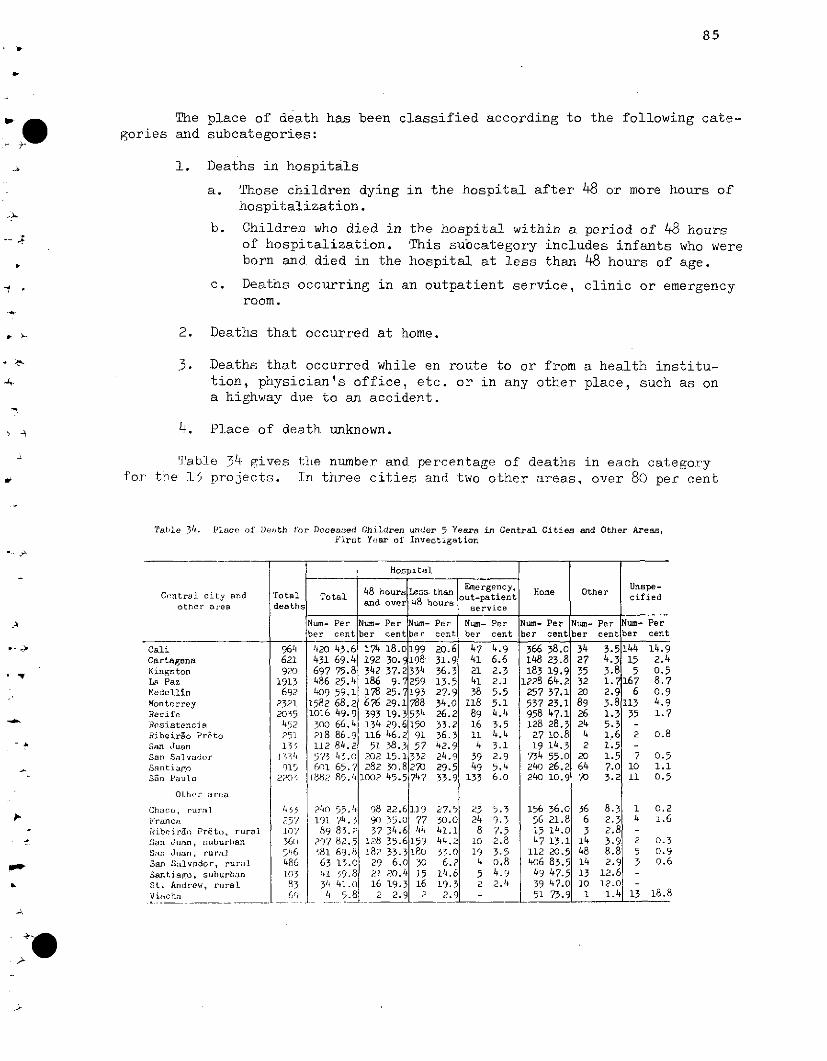
85
The place of death has been classified according to the following cate-gories and subcategories:
1. Deaths in hospitals
a. Those children dying in the hospital after 48 or more hours ofhospitalization.
b. Children who died inof hospitalization.born and died in the
the hospital within a period of 48 hoursThis subcategory includes infants who werehospital at less than 48 hours of age.
c. Deaths occurring in an outpatient service, clinic or emergencyroom.
2. Deaths that occurred at home.
3. Deaths that occurred while en route to or fromtion, physician's office, etc. or in any othera highway due to an accident.
a health institu-place, such as on
4. Place of death unknown.
Table 34 gives thle number and percentage of deaths in each categoryfor the 15 projects. In three cities and two other areas, over 80 per cent
Table 34. Place of Deaath f'or Deceaaed Children under 5 Yeare in Central Cities and Other Areas,first Year of Investigation
Hospital
Central city and Total Total hour ess than Emergecy Home Other cipey tal ut-patient cifiedother area deaths and over 4 hours service
Num- Per Nunm- Per N- Per Num- Per Num- Per Num-Per Num-Per Num- Perber cent ber cent ber cent ber cent ber cent ber cent ber cent
CaliCartagenaKingstonLa PazMedellinMonterreyRecifeResistenciaRibeirao Pr&toSan JuanSan Salvador
SantiagoS5o Paulo
Otiher arca
Chaco, ruralFrancaRibeirao Prato, ruralSan Juan, suburbanSan Juian, rural
San Salvador, ruralSantiago, suburbanSt. Andrew, ruralViacha
964621920
1913692
23212035
452251135
915
455257107361546486103
83691
420 43.6431 69.4697 75.8486 25.4409 59.1
1582 68.2o106 49.9300 66.4218 86.9112 84.25'/3 43.0601 65.71 82 85.4
240 55.41)1 74.5
89 83.2297 82.5',81 69.863 13.04 539.834 41.04 5.8
17419234218617867639313411651
202282
1002
18.030.37.29.~
25. i29.119.329.646.38.315.130.845.5
98 22.69o 35.037 34.6
128 35.618? 33.3
29 6.021 20.416 19.3
2 2.9
199198334259193788534150
9157
332270747
1.197744
15918o
3015162
20.631.936.313.527.934.026.233.236.342.924.929.533.9
27.530.041.144.233.0
6.214.619.32.c
47 4.941 6.621 2.341 2.138 5.5
118 5.189 4.416 3.511 4.4
4 3.139 2.949 5.4
133 6.0
23248
1019452
5.39.37.52.83.50.84.92.4
366 38.0148 23.8183 19.9
1228 64.2257 37.1537 23.1958 47.1128 28.3
27 10.819 14.3
734 55.0240 26.2240 10.9
156561547
112406493951
36.021.814.013.120.583.547.547.C73.6
342735322089262442
206470
3663
14481413101
3.54.33.81.72.93.81.35.31.61.51.57.03.2
8.32.32.83.98.82.9
12.612.01.4
144155
1676
11335
2
71011
14
253
13
14.92.40.58.7o.9
4.91.7
o.8
0.51.10.5
0.21.6
0.3o.9o.6
18.8
1
W 1..
-
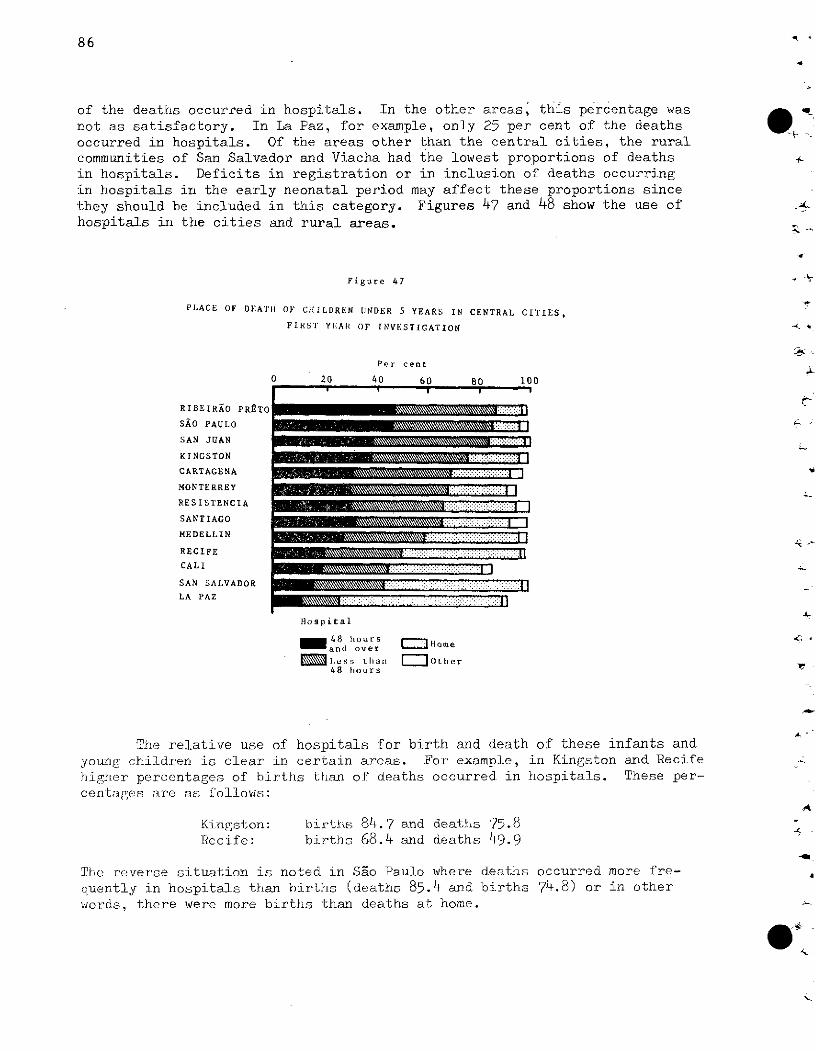
86
of the deaths occurred in hospitals. In the other areas, this percentage wasnot as satisfactory. In La Paz, for example, only 25 per cent of the deathsoccurred in hospitals. Of the areas other than the central cities, the ruralcommunities of San Salvador and Viacha had the lowest proportions of deathsin hospitals. Deficits in registration or in inclusion of deaths occurringin hospitals in the early neonatal period may affect these proportions sincethey should be included in this category. Figures 47 and 48 show the use ofhospitals in the cities and rural areas.
Figure 47
PLACE OF DEATH OF CHILDREN UNDER 5 YEARS IN CENTRAL CITIES,
FIRST YLAR OF INVESTIGATION
Per cent
20 40 601 .1
Rn 100
RIBEIRAO PRETO
SAO PAULO
SAN JUAN
KINGSTON
CARTAGENA
MONTERREY
RESISTENCIA
SANTIAGO
MEDELLIN
RECIFE
CALI
SAN SALVADOR
LA PAZ
A-
The relative use of hospitals for birth and death of these infants andyoung children is clear in certain areas. For example, in Kingston and Recifehigher percentages of births than of deaths occurred in hospitals. These per-centages are as i1ollows:
Kingston:Recife:
births 84.7 and deaths 75.8births 68.4 and deaths 49.9
The reverse situation is noted in Sao Paulo where deaths occurred more fre-quently in hospitals than births (deaths 85.4 and births 74.8) or in otherwords, there were more births than deaths at home.
. '
-w
·
-
.*.
-m
0
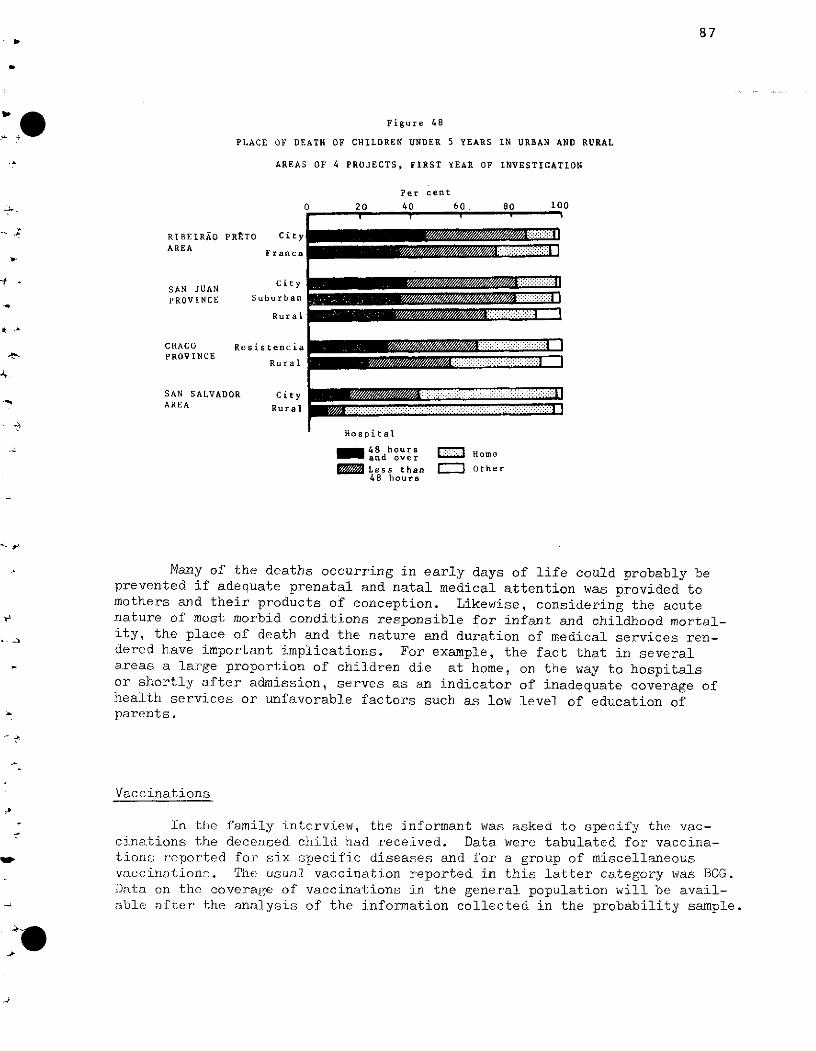
87
Figure 48
PLACE OF DEATH OF CHILDREN UNDER 5 YEARS IN URBAN AND RURAL
AREAS OF 4 PROJECTS, FIRST YEAR OF INVESTIGATION
Per cent
0 20 40 60. 80 100f I I i , i
RIBEIRAO PR2TO CityAREA Franca
SAN JUAN CityPROVINCE Suburban
Rural
CHACO ResistenciaPROVINCE
Rural
SAN SALVADOR CityAREA RuralRural
Hospital
48 hours "' Hom eand over Home
Less than 0J Other48 hours
Many of the deaths occurring in early days of life could probably beprevented if adequate prenatal and natal medical attention was provided tomothers and their products of conception. Likewise, considering the acutenature of most morbid conditions responsible for infant and childhood mortal-ity, the place of death and the nature and duration of medical services ren-dered have important implications. For example, the fact that in severalareas a large proportion of children die at home, on the way to hospitalsor shortly after admission, serves as an indicator of inadequate coverage ofhealth services or unfavorable factors such as low level of education ofparents.
Vaccinations
In the family interview, the informant was asked to specify the vac-cina-tions the deceased child liad received. Data were tabulated for vaccina-tions reported for six specific diseases and for a group of miscellaneousvaccinations. The usual vaccination reported in this latter category was BCG.Data on the coverage of vaccinations in the general population will be avail-able after the analysis of the information collected in the probability sample.
II
r E�·m////�·////�·/m//�7///////�t:::::::::iR---iL-�·/�m/�?�l//n/l�·nmlllm�7/�-�·:· irraiiPii�iiIL�,
Iia LB E�·�7/�7�7///////�1�m:j:l:j:::::::::j·l:· I �·Y////////////////////////////��·:::;:; i
·-�/��:::�·�´-�:��;:;::·:"::::::·:��::::: ::�::::.::::1::i�-�:::::i:�:�:�� 1
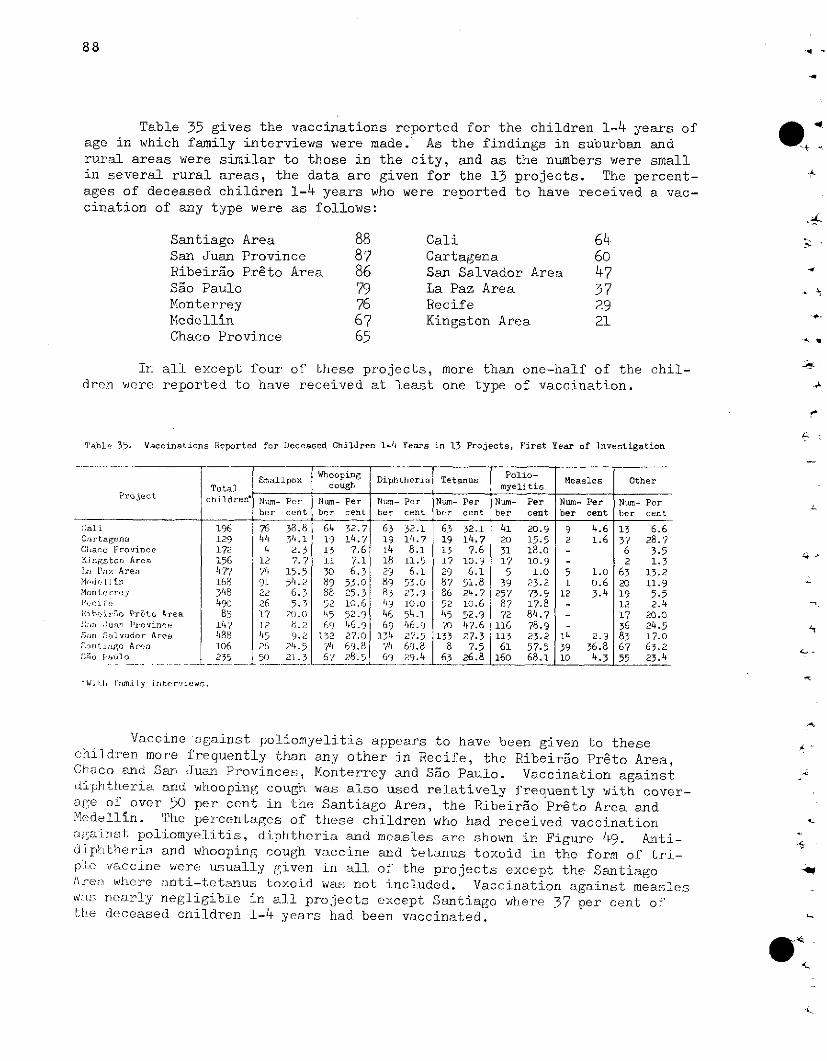
88
Table 35 gives the vaccinations reported for the children 1-4 years ofage in which family interviews were made. As the findings in suburban andrural areas were similar to those in the city, and as the numbers were smallin several rural areas, the data are given for the 13 projects. The percent-ages of deceased children 1-4 years who were reported to have received a vac-cination of any type were as follows:
Santiago AreaSan Juan ProvinceRibeirao Pr&to AreaSao PauloMonterreyMedellinChaco Province
88878679766765
CaliCartagenaSan Salvador AreaLa Paz AreaRecifeKingston Area
646047372921
.4
-'. a
In all except four of these projects, more than one-half of the chil-dren were reported to have received at least one type of vaccination.
Table 35. Vaccinations Reported for Deceased Children 1-4 Years in 13 Projects, First Year of Investigation
PrGject
CaliCartagenaChaco ProvinceKingston AreaJa Paz AreaM(,de11 ínMonterrey,_ .:i 'eiibei"r.ro Preto AreaS;rn Juan iProvince;nlri Salvadnr AreaS:,r7tago Arenflno Paulo
Totalchildren'
19612917215647716834849o85147488106235
Smallpox Whoopingcough
Num- Per Num- Perber cent ber cent
7644412
7491222617124526550
38.834.12.37.7
15.554.26.35.3
20.0
9.2
21 .32]. 3
64191311308988524569)
13261467
32.714.77.67.16.3
53.025.310.652.946.927.069.828.5
Diphtheria Tetanus
Num- 1ber
631914182989P,3
4669
134/469'
Per:ent
Polio-myelitis
Measles Other
Num Per Num- Per Num- Per Num- Perber cent ber cent ber cent ber cent
52.1 63 32.1 41 20.9 9 4.6 13 6.614.7 19 14.7 20 15.5 2 1.6 37 28.78.1 13 7.6 31 18.0 - 6 3.511.5 17 10.9 17 10.9 - 2 1.36.1 29 6.1 5 1.0 5 1.0 63 13.253.0 87 51.8 39 23.2 1 0.6 20 11.9?2.9 86 24.7 257 73.9 12 3.4 19 5.510.0 52 10.6 87 17.8 - 12 2.454.1 45 52.9 72 84.7 - 17 20.046.9 '/O 47.6 116 78.9 - 36 24.527.5 133 27.3 113 23.2 14 2.9 83 17.069.8 8 7.5 61 57.5 39 36.8 67 63.2?9.it 63 26.8 160 68.1 10 4.3 55 23.4
"Wi t. lamity iriterviews.
Vaccine against poliomyelitis appears to have been given to thesechildren more frequently than any other in Recife, the Ribeirao Preto Area,Chaco and San Juan Provinces, Monterrey and Sao Paulo. Vaccination againstdiphtheria and whooping cough was also used relatively frequently with cover-age of over 50 per cent in the Santiago Area, the Ribeirao Preto Area andMedellin. The percentages of these children who had received vaccinationagairist poliomyelitis, diphtheria and measles are shown in Figure 49. Anti-diphitheria and whooping cough vaccine and tetanus toxoid in the form of tri-ple vaccine were usually given in all of the projects except the SantiagoArea where anti-tetanus toxoid was not included. Vaccination against measleswas nearl]y negligible in all projects except Santiago where 37 per cent ofthe deceased children 1-4 years had been vaccinated.
*.
-k
.4
4-
4-
· · I I I1I
�1 ________� I
-
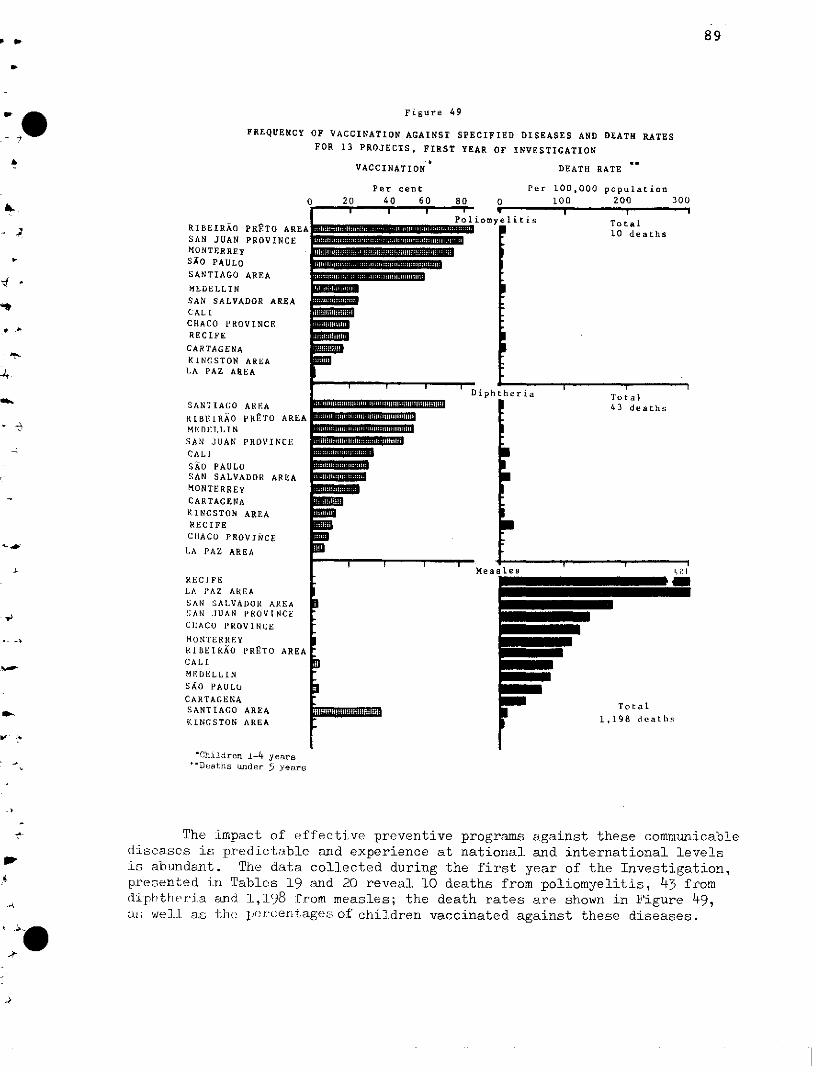
89
Figure 49
FREQUENCY OF VACCINATION AGAINST SPECIFIED DISEASES AND DEATH RATESFOR 13 PROJECTS, FIRST YEAR OF INVESTIGATION
VACCINATION"
RIBEIRAO PRETO AREASAN JUAN PROVINCEMONTERREySAO PAULo
SANTIAGO AREA
MEDELLINSAN SALVADOR AREACALICHACO PROVINCERECIFE
CARTAGENAKINCSTON AREALA PAZ AREA
SANTIAGO AREA
RIBEIRAO PRETO AREAM EDEELLINSAN JUAN PROVINCECALI
SAO PAULOSAN SALVADOR AREAMONTERREY
CARTAGENAKINGSTON AREARECIFECHACO PROVINCE
LA PAZ AREA
RECIFELA PAZ AREASAN SALVADOR AREA.SAN JUAN PROVINCECHACO P'ROVINCE
MONTERREYKIBEIRAO PRETO AREACALIMEDELLIN
SAO PAULO
CARTAGENASANTIAGO AREAKINGSTON AREA
W- ~.
Per cent
20 40 60
Diph
u.,#rll llniutllllHllllflltHll t tit l Jl t ti
~WmmITinamlmlrll1llml m
ulmmmunm
_==3lini
DEATH RATE
Per 100,000 population80 0 100 200
I t I iMea!
_11amm
*Children 1-4 years'-Deaths under 5 years
itis
300
Total10 deaths
heria Total43 deaths
les
e
m Total
1,198 deaths
The impact of effective preventive programs against these communicablediseases is predictable and experience at national and international levelsis abundant. The data collected during the first year of the Investigation,presented in Tables 19 and 20 reveal 10 deaths from poliomyelitis, 43 fromdipht1Whe.ria and 1,198 :from measles; the death rates are shown in Figure 49,a¿; well as tih ie('cenrltagesof children vaccinated against these diseases.
__ c . .
1, i1l
bun y 11 1... Rlifflnffiffttliuiipm
1 1 P. i ~Poiomy e
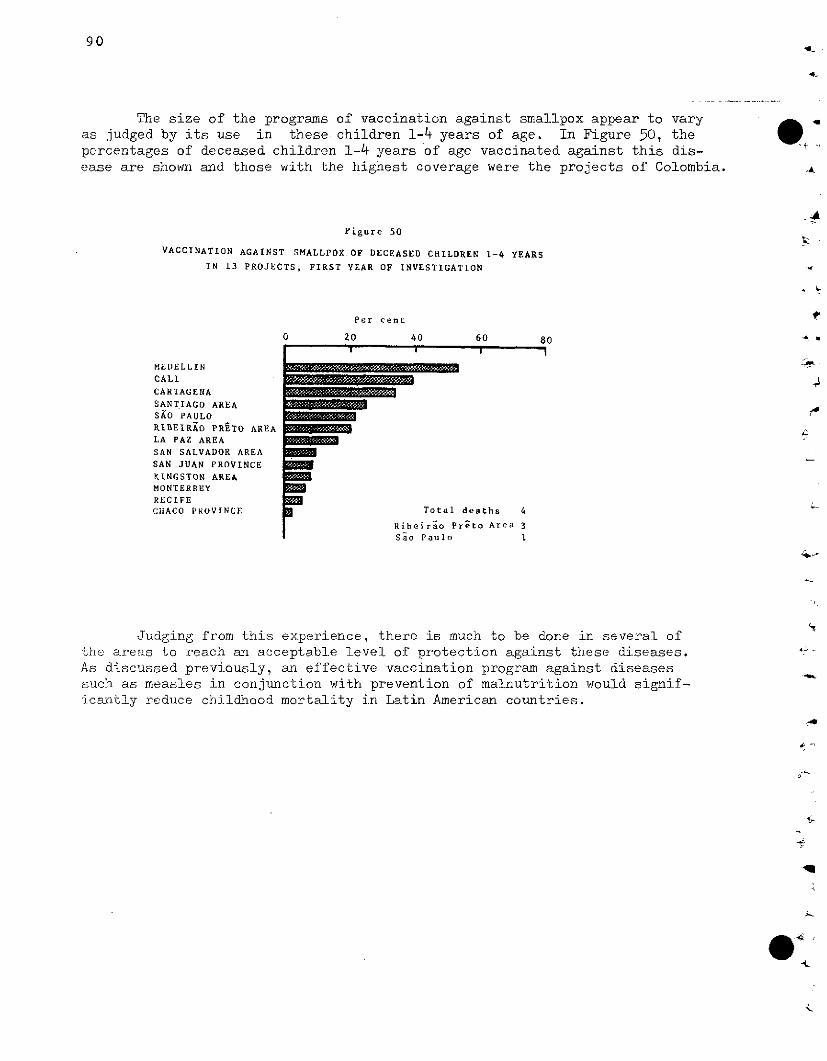
90
The size of the programs of vaccination against smallpox appear to varyas judged by its use in these children 1-4 years of age. In Figure 50, thepercentages of deceased children 1-4 years of age vaccinated against this dis-ease are shown and those with the highest coverage were the projects of Colombia.
Figure 50
VACCINATION AGAINST SMALLPOX.OF DECEASED CHILDREN 1-4 YEARS
IN 13 PROJECTS, FIRST YEAR OF INVESTIGATION
Per cent
o 20 40 60 80
i i 1
MEDELLINCALI
CARTAGENA
SANTIAGO AREASAO PAULO
RIBEIRAO PRETO AREALA PAZ AREASAN SALVADOR AREA
SAN JUAN PROVINCEKINGSTON AREAMONTERREYRECIFECHACO PROVINCE
W
am Total deaths
Ribeirao Preto AreaSao Paulo
Judging from this experience, there is much to be done in several ofthe areas to reach an acceptable level of protection against these diseases.As discussed previously, an effective vaccination program against diseasessuch as measles in conjunction with prevention of malnutrition would signif-icantly reduce childhood mortality in Latin American countries.
.4
u .
14
4
3
1 y
-
la-1
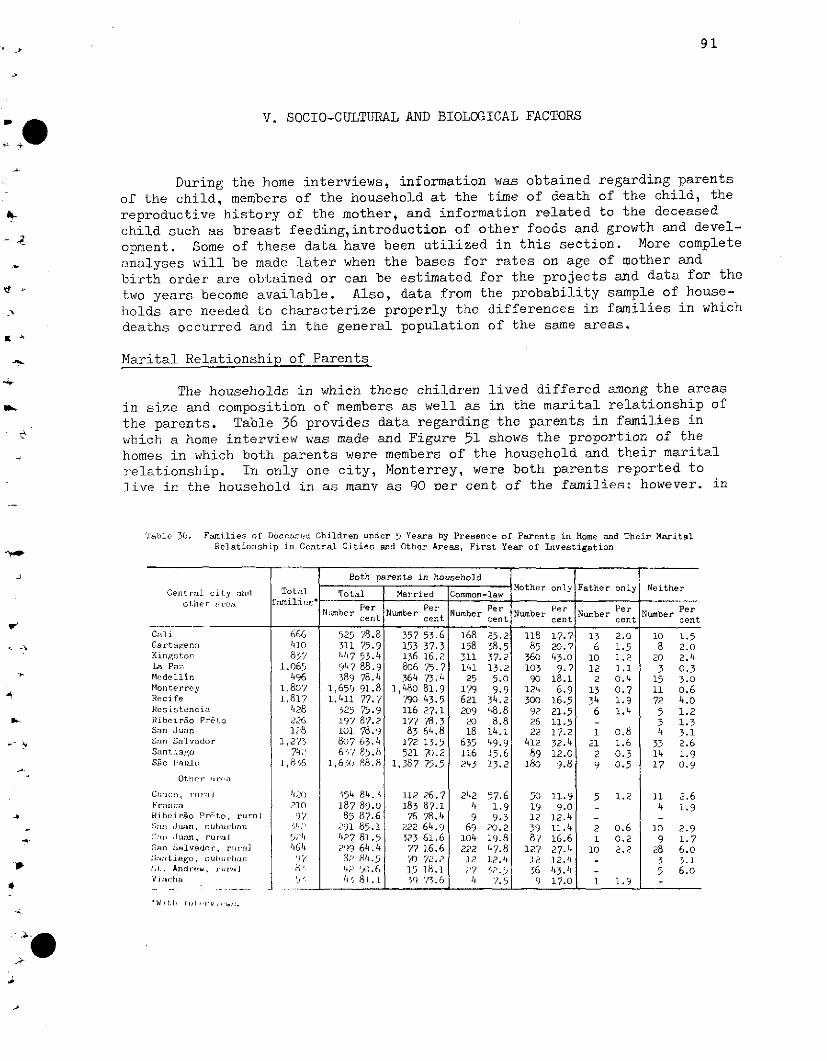
91
V. SOCIO-CULTURAL AND BIOLOGICAL FACTORS
During the home interviews, information was obtained regarding parentsof the child, members of the household at the time of death of the child, thereproductive history of the mother, and information related to the deceasedchild such as breast feeding,introduction of other foods and growth and devel-opment. Some of these data have been utilized in this section. More completeanalyses will be made later when the bases for rates on age of mother andbirth order are obtained or can be estimated for the projects and data for thetwo years become available. Also, data from the probability sample of house-holds are needed to characterize properly the differences in families in whichdeaths occurred and in the general population of the same areas.
Marital Relationship of Parents
The households in which these children lived differed among the areasin size and composition of members as well as in the marital relationship ofthe parents. Table 36 provides data regarding the parents in families inwhich a home interview was made and Figure 51 shows the proportion of thehomes in which both parents were members of the household and their maritalrelationship. In only one city, Monterrey, were both parents reported tolive in the household in as manv as 90 Der cent of the families: however. in
Table 36. Families of Deceased Children under 5 Years by Presence of Parents in Home and Their MaritalRelationship in Central Cities and Other Areas, First Year of Investigation
Both parents in household
Central city ;rld Total Total Married Common-law Mother ony Father on1y Neitherorher ar;a framili(_;.o r a Per PerPa Per Per Per Per
Number Number Nunber Number PNumber Number P
C;ali 666 525 ',8.8 357 53.6 168 25.2 118 17.7 13 2.0 10 1.5Cartagena 410 311 75.9 153 37.3 158 38.5 85 20.7 6 1.5 8 2.0Kingston 837 447 53.4 136 16.2 311 37.2 360 43.0 10 1.2 20 2.4La Pa, 1,065 947 88.9 806 75.7 141 13.2 103 9.7 12 1.1 3 0.3Medellin 496 389 78.4 364 73.4 25 5.0 90 18.1 2 0.4 15 3.0Monterrey 1,807 1,659 91.8 1,480 81.9 179 9.9 124 6.9 13 0.7 11 0.6Recife 1,817 1,411 77.7 790 43.5 621 34.2 300 16.5 34 1.9 72 4.0Resistencia 428 325 '5.9 116 27.1 209 48.8 92 21.5 6 1.4 5 1.2Ribeirao Preto 226 197 87.2 177 78.3 20 8.8 26 11.5 - 3 1.3San Juan 128 101 78.9 83 64.8 18 14.1 22 17.2 i 0.8 4 3.1San Salvador 1,275 807 63.4 172 13.5 635 49.9 412 32.4 21 1.6 33 2.6Sanlltrago 742 6,'7 85.8 521 7C.2 116 15.6 89 12.0 2 0.3 14 1.9S¿o Plaulo 1,8 6 1,650 88.8 1,387 75.5 243 13.2 180 9.8 9 0.5 17 0.9
Other ]ar,-a
Chlaco, r1 ,li 4,-Io 454 84.4 112 26.7 242 57.6 50 11.9 5 1.2 11 2.6Franca 210 187 89.0 183 87.1 4 1.9 19 9.0 - 4 1.9Ribeirao Pr;.to, rural 97 85 87.6 76 '78.4 9 9.3 12 12.4 - -San .luan, nuburb:n 542 291 85.1 222 64.9 69 20.2 33 11.4 2 0.6 10 2.9.l:,n Juain, rural 5;)s 427 81.5 523 61.6 104 19.8 87 16.6 1 0.2 9 1.7San italvndor, rural 464 299 64.4 77 16.6 222 47.8 127 27.4 10 2.2 28 6.0
:~;.'mtiaugo, :4u llrar;rn 9? 8; 8.5 ') 72'.? 12 12.4 1 2 12.4 3 3.1!;I. Anriew, ural ? 5).6 l6'j5 18.1 '7 , '.5 56 l43.4 - 5 6.o
Vi ;:lla i ',' 81.1 5'39 7'.6 4 7.5 1 17.0 1 1.9 -
W LW bi l ;) V J 'w::.
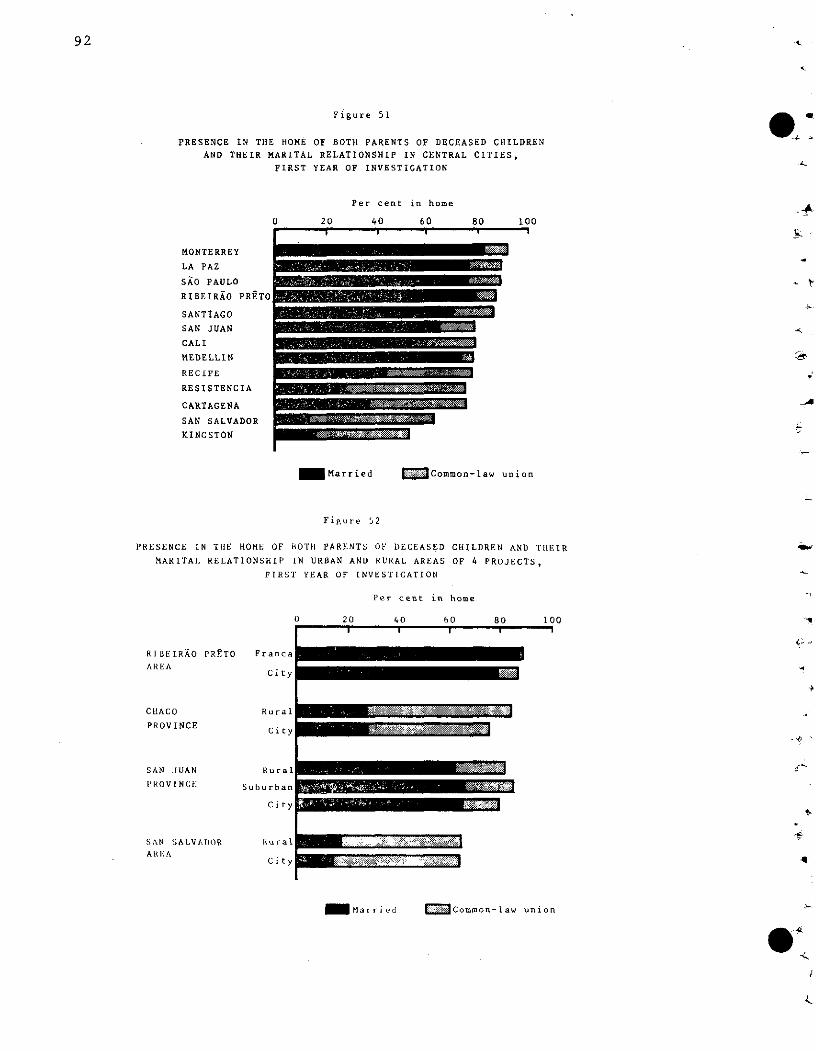
Figure 51
PRESENCE IN THE HOME OF BOTH PARENTS OF DECEASED CHILDREN
AND THEIR MARITAL RELATIONSHIP IN CENTRAL CITIES,
FIRST YEAR OF INVESTIGATION
Per cent in home
MONTERREY
LA PAZ
SAO PAULO
RIBEIRAO PRE1
SANTIAGO
SAN JUAN
CALI
MEDELLIN
RECIFE
RESISTENCIA
CARTAGENA
SAN SALVADOR
KINGSTON
Married .Common-law union
Figure 52
PRESENCE IN THiE HOME OF BOTHi PARENTS OF DECEASED CHILDREN AND THEIR
MARITAL RELATIONSHIP IN URBAN AND RURAL AREAS OF 4 PROJECTS,
FIRST YEAR OF INVESTIGATION
Per cent in home
0 20 40 60 80 100
RIBEIRAO PRETO
AREA
CHIACO
PROVINCE
SAN JUAN
PROVINCI: Su
Franca
city
Rural
Rural _, ,
hurhanr
C i
SAN SALVADORARI:A
Rur
Ci
ty ¡
1 a - -*: -, : #;':,'l'' 11 .. 1:
4q
= Common-law union
92 -t
_+
0+
_Married
.
1 1 1 1 1
--------;a·ru;oa- - ,,,,r,
t y � 7, 7, 1, � � , -
r
I-a
.1
93
the others, except two, both parents were members of at least 70 per cent ofi. + _the households of the deceased children. Common-law unions were reported
most frequently in the cities of Resistencia and San Salvador. Actually inKingston and San Salvador, only small proportions of the parents were married.In Kingston, children are often placed in the homes of grandparents so thatthe mother is free to work. The relatively unstable forms of marital unions
4 in Jamaica a~d in other Caribbean Islands are known to be common, as reportedby Marino.2 0)
In the comparison of urban and rural areas of four projects (Figure 52)similar differences are noted. In the rural communities of San Salvador pro-ject, only 64.4 per cent of families of deceased children had both parentsliving together in marriage or common-law union. In these two areas, as inthe rural area of Chaco Province, the parents were living in common-law unionmore frequently than in marriage.
Age of Mother and Birth Order
The age distribution of mothers at the birth of deceased infants andthe birth order of those infants have been obtained in order to establishtheir relationship to mortality. Since the numbers are small in severalareas and the differences are minor, divisions are not made into urban andrural areas but the projects are treated as a whole. However, for SanSalvador, where differences were noted, the data are presented for the cityand for the rural communities. When the material is available for two years,divisions of other areas may be made.
The distribution of mothers by age at birth of the infant who died,~ shows distinct patterns in these projects (Table 37 and Figure 53). These
distributions are influenced by the levels of the birth rates which in sev-eral cities have been lowered by family planning. Also if the death rate isexcessive for infants of very young and of older mothers, such high rateswould influence the age distributions of mothers, that is, the proportionsof births in the maternal groups of highest risk influence these distributions.
In Figure 53, the age distributions are given in decreasing order ofpercentage of mothers in the age group under 20 years. In Chaco Province,27.6 per cent of the mothers were less than 20 years of age and another 25.9per cent were 20-24- years of age. This pattern is distinctly different fromtlint of the other areas in which the highest percentages of mothers were in
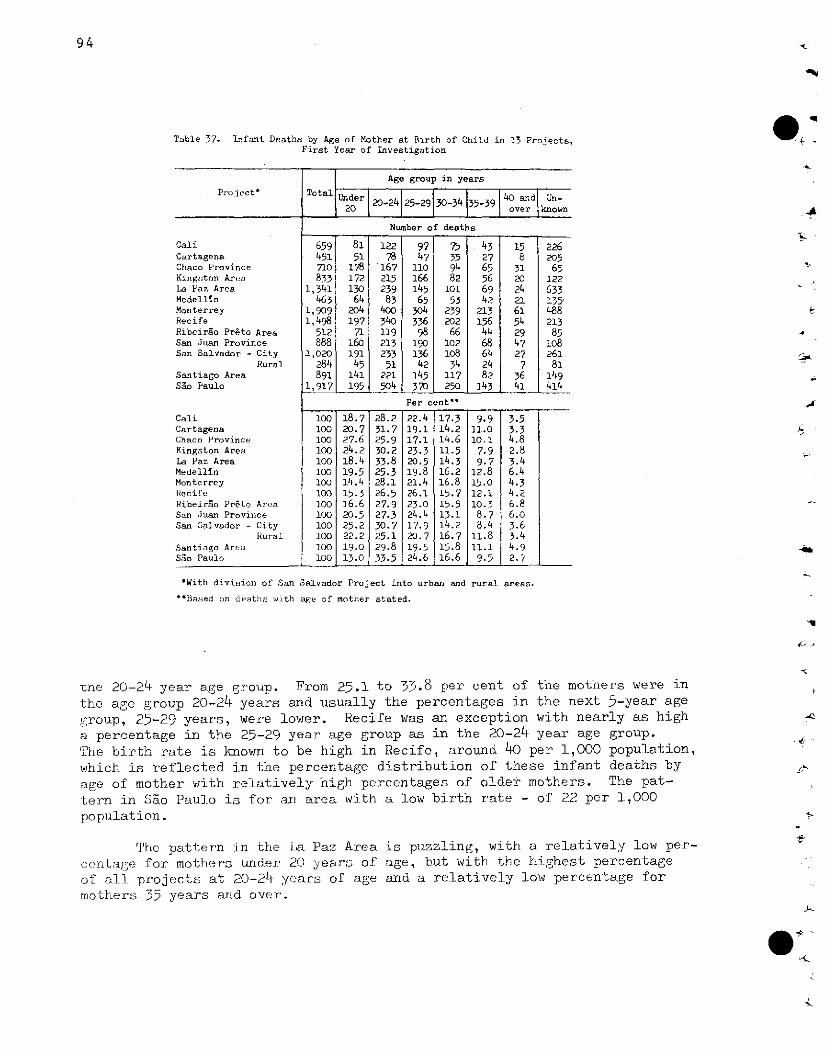
94
.-Table 37. Infant Deaths by Age of Mother at Birth of Child in 13 Projects,First Year of Investigation
Age group in years
Project' Total Under IP20 20-24125-29130-34 35°39| over known20 ~ '' 1' over known
Number of deaths
Cali 659 81 122 97 75 43 15 226Cartagena 451 51 78 47 35 27 8 205Chaco Province 710o 78 167 lio 94 65 31 65Kingston Area 833 172 215 166 82 56 2 122La Paz Area 1,341 130 239 145 101 69 24 633Medellin 463 64 83 65 53 42 21 135Monterrey 1,909 204 400 304 239 213 61 488Recife 1,498 197 340 336 202 156 54 213Ribeirao Preto Area 512 71 119 98 66 44 29 85San Juan Province 888 160 213 190 102 68 47 108San Salvador -City 1,020 191 233 136 108 64 27 261
Rural 284 45 51 42 34 24 7 81Santiago Area 891 141 221 145 117 82 36 149Sao Paulo 1,917 195 504 370 250 143 41 414
Per cent'*
Cali 100 18.7 28.2 22.4 17.3 9.9 3.5Cartagena 100 20.7 31.7 19.1 14.2 11.0 3.3Chaco Province 100 27.6 25.9 17.1 14.6 10.1 4.8Kingston Area 100 24.2 30.2 23.3 11.5 7.9 2.8La Paz Area 100 18.4 33.8 20.5 14.3 9.7 3.4Medellin 100 19.5 25.3 19.8 16.2 12.8 6.4Monterrey 100 14.4 28.1 21.4 16.8 15.0 4.3Recife 100 15.3 26.5 26.1 15.7 12.1 4.2Ribeirao Preto Area 100 16.6 27.9 23.0 15.5 10.3 6.8San Juan Province 100 20.5 27.3 24.4 13.1 8.7 6.0San Salvador - City 100 25.2 30.7 17.9 14.2 8.4 3.6
Rural 100 22.2 25.1 20.7 16.7 11.8 3.4Santiago Area 100 19.0 29.8 195 529.8 11.1 4.9Sao Paulo 100 13.0 33.5 24.6 16.6 9.5 2.7
'With division of San Salvador Project into urban and rural areas.
`Based on deaths with age of mother stated.
tne 20-24 year age group. From 25.1 to 33.8 per cent of the mothers were in
the age group 20-24 years and usually the percentages in the next 5-year age
group, 25-29 years, were lower. Recife was an exception with nearly as higha percentage in the 25-29 year age group as in the 20-24 year age group.The birth rate is known to be high in Recife, around 40 per 1,000 population,which is reflected in the percentage distribution of these infant deaths by
age of mother with relatively high percentages of older mothers. The pat-tern in Sao Paulo is for an area with a low birth rate - of 22 per 1,000population.
The pattern in the La Paz Area is puzzling, with a relatively low per-centage for mothers under 20 years of age, but with the highest percentageof all projects at 20-24 years of age and a relatively low percentage formothers 35 years and over.
.
-4
e
J
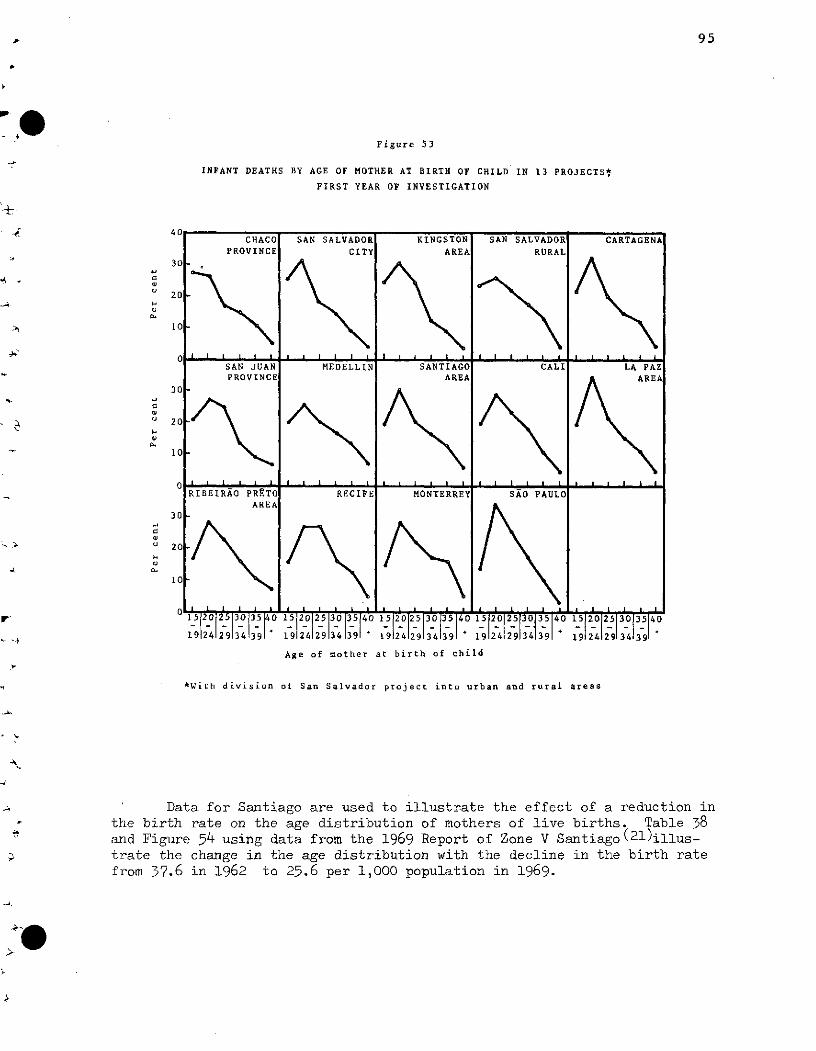
95
Figure 53
INFANT DEATHS BY AGE OF MOTHER AT BIRTH OF CHILD IN 13 PROJECTS*
FIRST YEAR OF INVESTIGATION
o
eU
á.
GA
Pi
CHACO SAN SALVADOR KINGSTON SAN SALVADOR CARTAGENAPROVINCE CITY AREA RURAL
20 -
t I I . ¡ I ,SAN JUAN MEDELLIN SANTIAGO CALI LA PAZ
PROVINCE AREA
20
RIBEIRAO PRAT0 RECIFE MONTERREY SAO PAULOAREA
30
20 -
512025 30 35 40 15 2002530 2 35 40 15 20 25 30 35 4 0 15 320 513035140
19124129 34 39 19124129134139 ' 19124129 341391 191241291341391 19124129134139
Age of mother at birth of child
*With division of San Salvador project into urban and rural areas
Data for Santiago are used to illustrate the effect of a reduction inthe birth rate on the age distribution of mothers of live births. Table 38and Figure 54 using data from the 1969 Report of Zone V Santiago(21)illus-
trate the change in the age distribution with the decline in the birth ratefrom 37.6 in 1962 to 25.6 per 1,000 population in 1969.
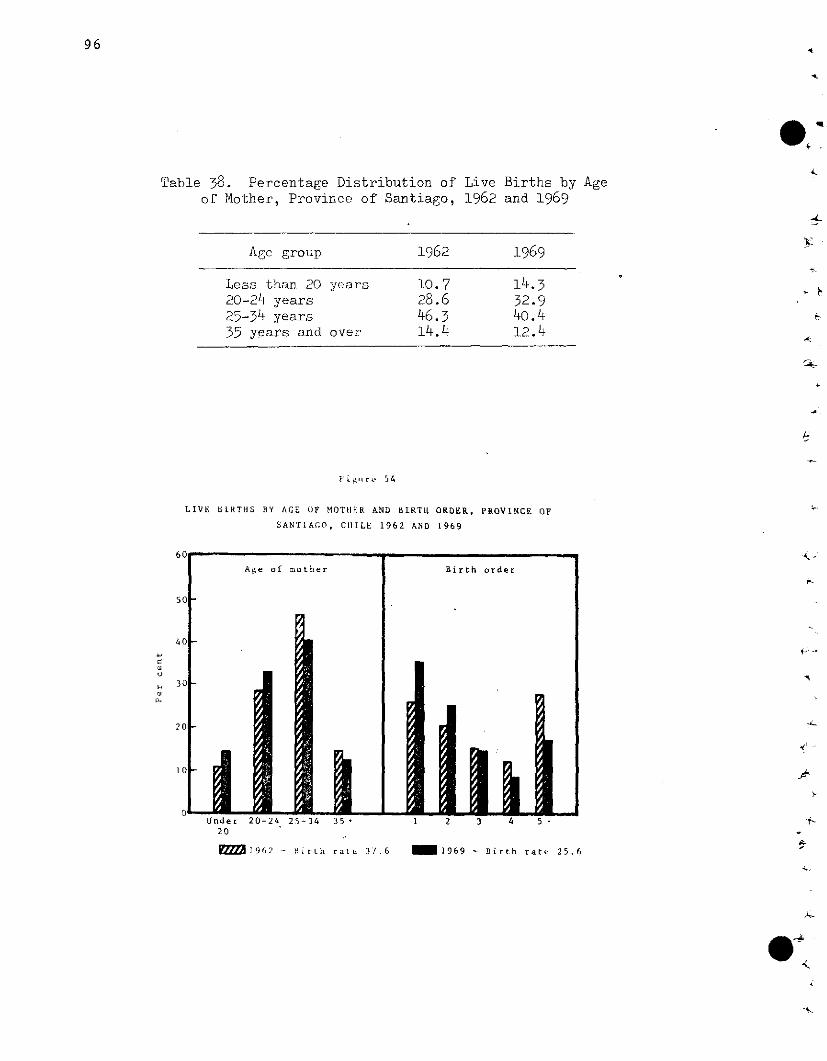
Table 38. Percentage Distribution ofof Mother, Province of Santiago,
Live Births by Age1962 and 1969
-L
Age group 1962 1969
Less than 20 years 10.7 14.320-24 years 28.6 32.925-34 years 46.3 40.435 years and over 14.4 12.4
F i igre 54
LIVE BIRTHS BY AGE OF MOTHER AND BIRTH ORDER, PROVINCE OF
SANTIAGO, CHILE 1962 AND 1969
Under 20-24 25-34 35 1 2 3 4 520
E= 1962 - Birth rate 37.6 1969 - Birth rate 25.6
96
.
'k
·,`
J.,
o
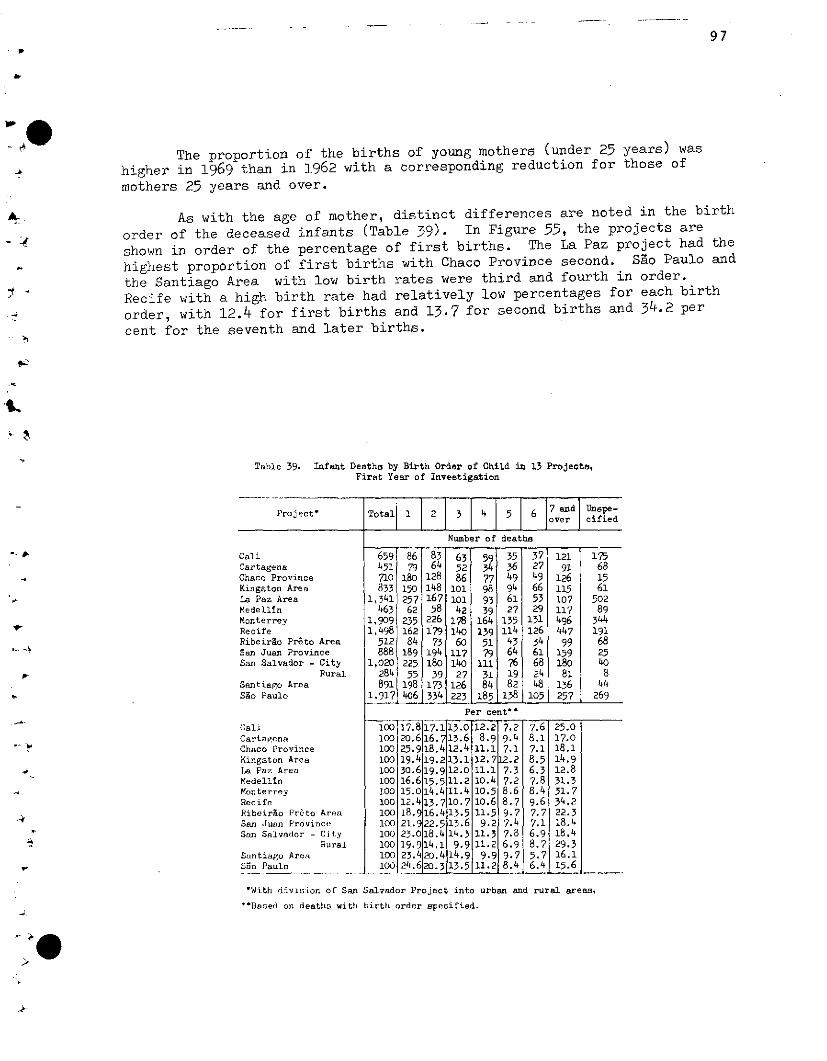
97
The proportion of the births of young mothers (under 25 years) washigher in 1969 than in 1962 with a corresponding reduction for those of
mothers 25 years and over.
As with the age of mother, distinct differences are noted in the birth
order of the deceased infants (Table 39). In Figure 55, the projects are
shown in order of the percentage of first births. The La Paz project had the
highest proportion of first births with Chaco Province second. Sao Paulo and
the Santiago Area with low birth rates were third and fourth in order.
Recife with a high birth rate had relatively low percentages for each birth
order, with 12.4 for first births and 13.7 for second births and 34.2 per
cent for the seventh and later births.
Table 39. Infant Deaths by Birth Order of Child in 13 Projecta,First Year of Investigation
Project' Total 1 2 3 4 5 6 7aad Unape-
Numbertal_ 1 [3over cified
Number of deaths
CaliCartagenaChaco ProvinceKingston AreaLa Paz AreaMedellinMonterreyRecifeRibeirao Préto AreaSan Juan ProvinceSan Salvador -City
RuralSantiapgo AreaSao Paulo
659 86 83 63 59 35 37 121 175451 79 64 52 34 36 27 91 68710 180 128 86 77 49 49 126 15833 150 148 lol 98 94 66 115 61
1,341 257 167 lo 93 61 53 107 502463 62 58 42 39 27 29 117 89
1,909 235 226 178 164 135 131 496 3441,498 162 179 140 139 114 126 447 191
512 84 73 60 51 43 34 99 68888 189 194 117 79 64 61 159 25
1,020 225 180 140 111 76 68 180 40284 55 39 27 31 19 24 81 8891 198 173 126 84 82 48 136 44
1,917 406 334 223 185 138 105 257 269
Per cent-*
Cali o100 17.8 17.1 13.0 12.2 7.2 7.6 25.0Cartagena 100 20.616.713.6 8.9 9.4 8.1 17.0Chaco Province 100 25.9 18.4 12.4 11.1 7.1 7.1 18.1Kingston Area 100oo 19.4 19.2 13.1 12.712.2 8.5 14.9
La Paz Area 100 30.619.912.0 11.1 7.3 6.3 12.8Medelln o100 16.615.5 11.2 10.4 7.2 7.8 31.3Monterrey 100 15.0 14.4 11.4 10.5 8.6 8.4 31.7Recife 100 12.4 13.7 10.7 10.6 8.7 9.6 34.2Ribeirao Pré¿to Area 100 18.9 16.4 13.5 11.5 9.7 7.7 22.3San Juan Province 100 21.9 22.5 13.6 9.2 7.4 7.1 18.4San Salvador -City 100 23.0 18.4 14.3 11.3 7.8 6.9 18.4
Rural 100 19.9 14.1 9.9 11.2 6.9 8.7 29.3Santiago Aren 100 23.4 20.4 14.9 9.9 9.7 5.7 16.1Sño Paulo 100 24.620.3 13.5 11.2 8.4 6.4 15.6
*With division of San Salvador Project into urban and rural areas.
'·Based on deaths with birth order specified.
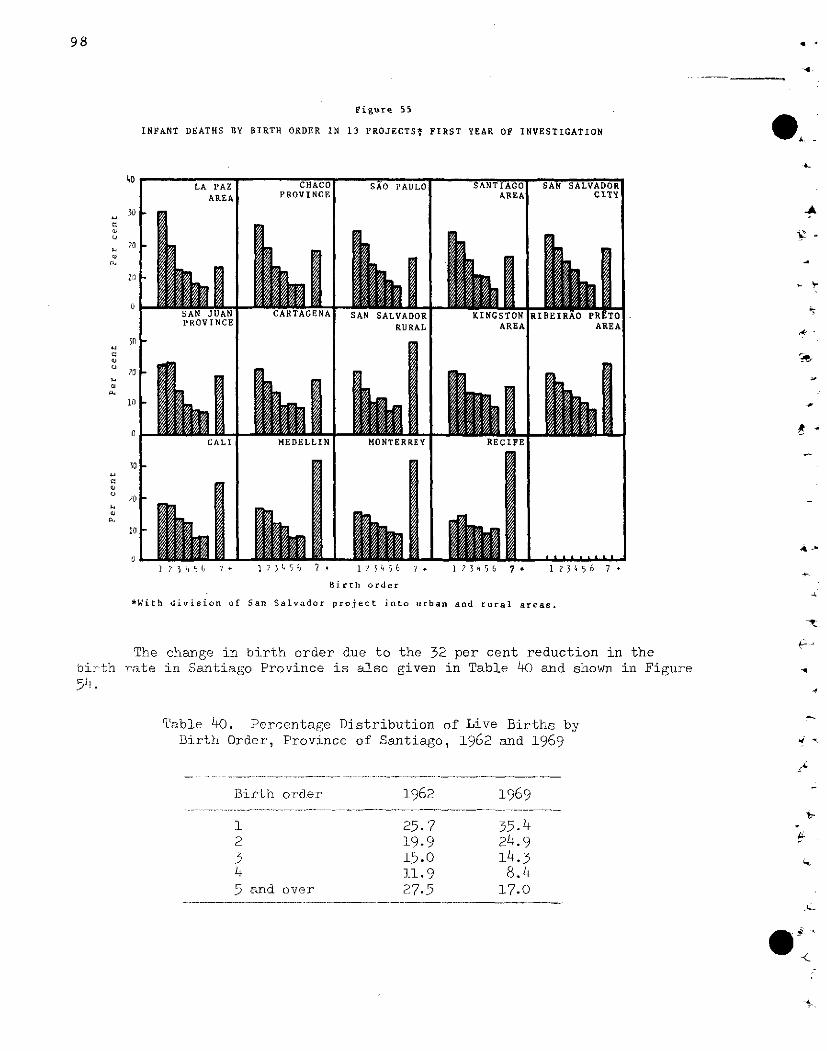
98
Figure 55
INFANT DEATHS BY BIRTH ORDER IN 13 PROJECTS? FIRST YEAR OF INVESTIGATION
Birth order
*With division of San Salvador project into urban and rural areas.
The change in birth order due to the 32 per cent reduction in therate in Santiago Province is also given in Table 40 and shown in Figure
Table 40. Percentage Distribution of Live Births byBirth Order, Province of Santiago, 1962 and 1969
Birth order 1962 1969
1 25.7 35.42 19.9 24.93 15.0 14.34 11.9 8.45 and over 27.5 17.0
40
30
70
10
5D
10
/0
10
qo
a
o)a~
c
o)
birth
5L
-A
V- _
4-
-n
$
.
_*1
_?l
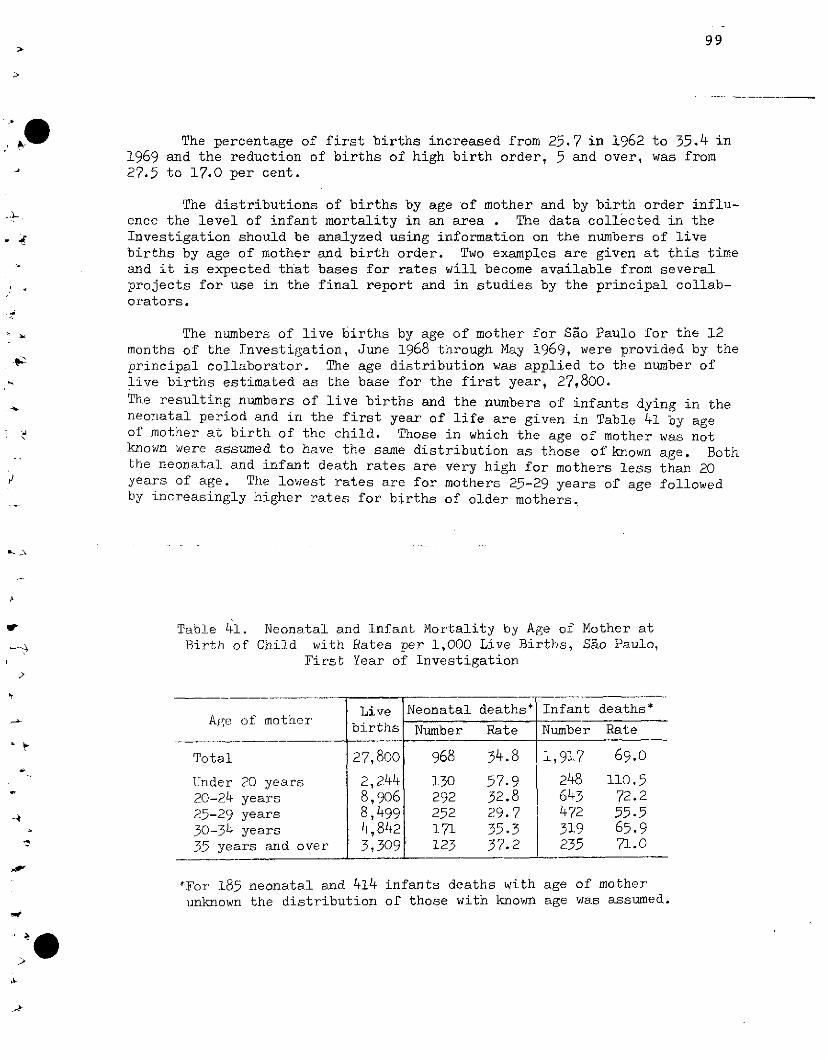
99
The percentage of first births increased from 25.7 in 1962 to 35.4 in1969 and the reduction of births of high birth order, 5 and over, was from27.5 to 17.0 per cent.
The distributions of births by age of mother and by birth order influ-ence the level of infant mortality in an area . The data collécted in theInvestigation should be analyzed using information on the numbers of livebirths by age of mother and birth order. Two examples are given at this timeand it is expected that bases for rates will become available from severalprojects for use in the final report and in studies by the principal collab-orators.
The numbers of live births by age of mother for Sao Paulo for the 12months of the Investigation, June 1968 through May 1969, were provided by theprincipal collaborator. The age distribution was applied to the number oflive births estimated as the base for the first year, 27,800.
The resulting numbers of live births and the numbers of infants dying in theneonatal period and in the first year of life are given in Table 41 by ageof mother at birth of the child. Those in which the age of mother was notknown were assumed to have the same distribution as those of known age. Boththe neonatal and infant death rates are very high for mothers less than 20years of age. The lowest rates are for mothers 25-29 years of age followedby increasingly higher rates for births of older mothers.
Table 41. Neonatal and Infant Mortality by Age of Mother atBirth of Child with Rates per 1,000 Live Births, Sao Paulo,
First Year of Investigation
Live Neonatal deaths* Infant deaths*Age of mother births Number Rate Number Rate
Total 27,800 968 34.8 1,917 69.0
Under 20 years 2,244 130 57.9 248 110.520-24 years 8,906 292 32.8 643 72.225-29 years 8,499 252 29.7 472 55.530-34 years 4,842 171 35.3 319 65.935 years and over 3,309 123 37.2 235 71.0
*For 185 neonatal and 414 infants deaths with age of motherunknown the distribution of those with known age was assumed.
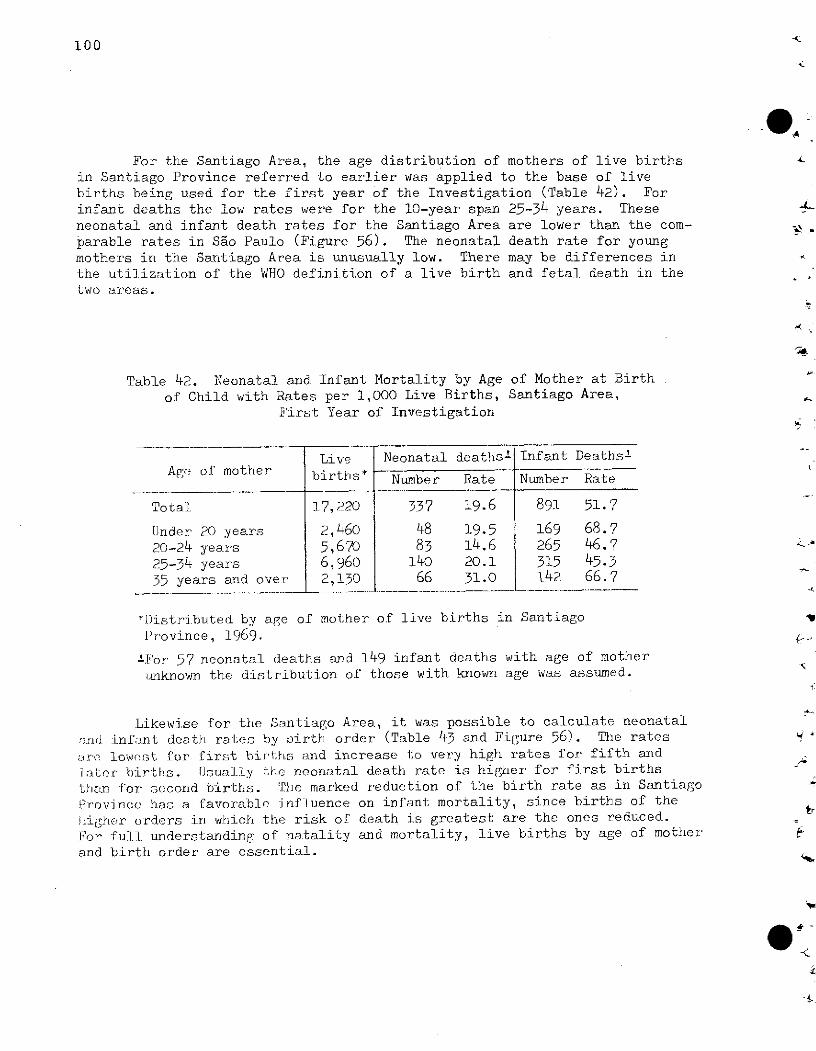
100
For the Santiago Area, the age distribution of mothers of live births
in Santiago Province referred to earlier was applied to the base of live
births being used for the first year of the Investigation (Table 42). For
infant deaths the low rates were for the 10-year span 25-34 years. These -k
neonatal and infant death rates for the Santiago Area are lower than the com- Y.
parable rates in Sao Paulo (Figure 56). The neonatal death rate for young
mothers in the Santiago Area is unusually low. There may be differences in
the utilization of the WHO definition of a live birth and fetal death in the
two areas.
Table 42. Neonatal and Infant Mortality by Age of Mother at Birth
of Child with Rates per 1,000 Live Births, Santiago Area,First Year of Investigation
Live Neonatal deatlhs' Infant Deaths'
Age ofí motherN birtes* Number Rate Number Rate
Total 17,220 337 19.6 891 51.7
Under 20 years 2,460 48 19.5 169 68.720-24 years 5,670 83 14.6 265 46.725-34 years 6,960 140 20.1 315 45.3
35 years and over 2,130 66 31.0 142 66.7
*Distributed by age of mother of live births in Santiago
Province, 1969.
±For 57 neonatal deaths and 149 infant deathis with age of motherunknown the distribution of those with known age was assumed.
Likewise for the Santiago Area, it was possible to calculate neonatal
and infant death rates by birth order (Table 43 and Figure 56). The rates
arc lowes-t for :first birUths and increase to very high rates for fifth and
later birthns. Usually fhe neonatal death rate is higher for first births
tihan for sccond births. The marked reduction of the birth rate as in Santiago
Province has a favorable influence on infant mortality, since births of the
higher orders in which the risk of death is greatest are the ones reduced.
For full understanding of natality and mortality, live births by age of mother
and birth order are essential.a
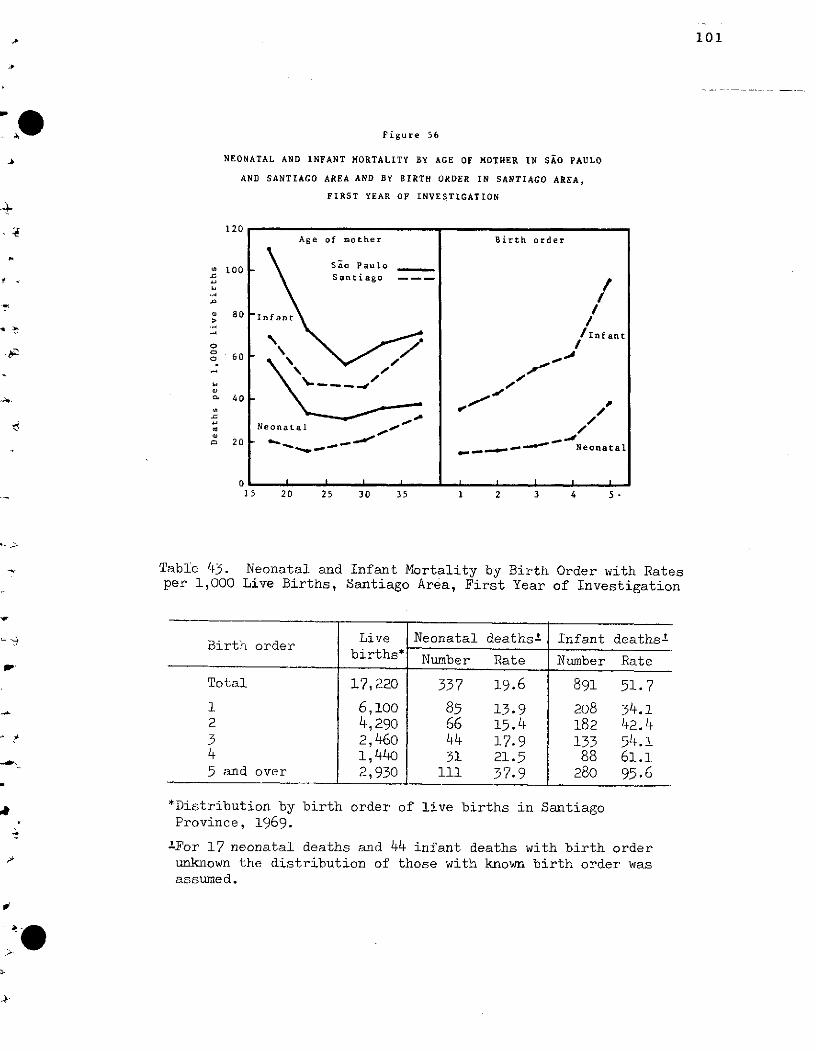
101
Figure 56
NEONATAL AND INFANT MORTALITY BY AGE OF MOTHER IN SAO PAULO
AND SANTIAGO AREA AND BY BIRTH ORDER IN SANTIAGO AREA,
FIRST YEAR OF INVESTIGATION
120
100
. 80o
e..
oo 60
f 40
o 20
1-
o1
Age �f mother Bjrth order
of mother
Sao PauloSantiago - -
1/Infant
1 1-~~
Neonatal
I I I ~~.~.
.4-
e---
__ -a. Neonatal
15 20 25 30 35 1 2 3 4 5
Table 43. Neonatal and Infant Mortality by Birth Order with Ratesper 1,000 Live Births, Santiago Area, First Year of Investigation
Live Neonatal deaths! Infant deaths'Birth orderbirths* Number Rate Number Rate
Total 17,220 337 19.6 891 51.7
i 6,100 85 13.9 208 34.12 4,290 66 15.4 182 42.43 2,460 44 17.9 133 54.14 1,440 31 21.5 88 61.15 and over 2,930 111 37.9 280 95.6
....~~~~~~~~~~~~~~~~~~~~~~~~~~~~
*Distribution by birth order of live births in SantiagoProvince, 1969.
'For 17 neonatal deaths and 44 infant deaths with birth orderunknown the distribution of those with known birth order wasassumed.
-
Age o Birth order
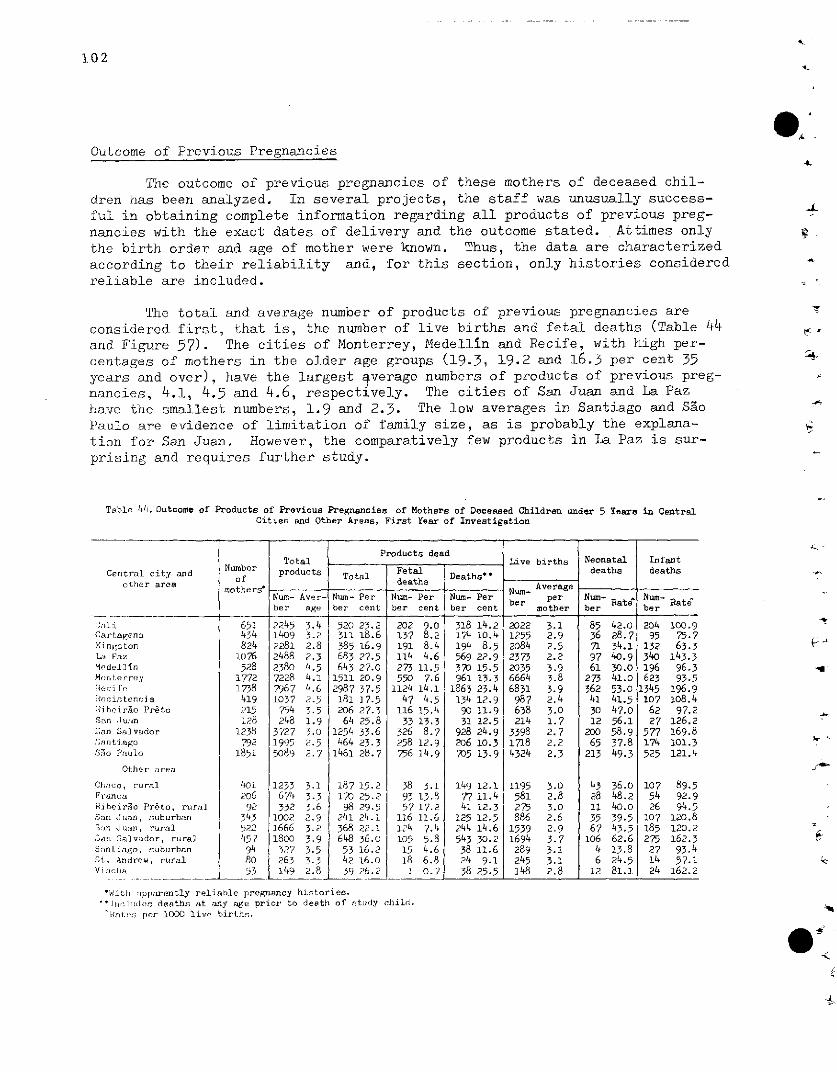
102
e;Outcome of Previous Pregnancies
The outcome of previous pregnancies of these mothers of deceased chil-dren has been analyzed. In several projects, the staff was unusually success-ful in obtaining complete information regarding all products of previous preg-nancies with the exact dates of delivery and the outcome stated. Attimes onlythe birth order and age of mother were known. Thus, the data are characterizedaccording to their reliability and, for this section, only histories consideredreliable are included.
The total and average number of products of previous pregnancies areconsidered first, that is, the number of live births and fetal deaths (Table 44 r.and Figure 57). The cities of Monterrey, Medellin and Recife, with high per-centages of mothers in the older age groups (19.3, 19.2 and 16.3 per cent 35years and over), have the largest 4verage numbers of products of previous preg-nancies, 4.1, 4.5 and 4.6, respectively. The cities of San Juan and La Pazhave the smallest numbers, 1.9 and 2.3. The low averages in Santiago and SaoPaulo are evidence of limitation of family size, as is probably the explana-tion for San Juan. However, the comparatively few products in La Paz is sur-prising and requires further study.
Table 44. Outcome of Products of Previous Pregnancies of Mothers of Deceaaed Children under 5 Yeara in CentralCities and Other Areas, First Year of Investigation
Products deadTotal Live births Neonatal Infant
Central city and Number products Total Fetal Deathdeat deathsother area of deaths Deaths'
motherds N AverageNum- Aver- Num- Per Num- Per Num- Per per Num- Num-ber age ber cent ber cent ber cent mother ber ber
a]nli 651 2245 3.4 520 23.2 202 9.0 318 14.2 2022 3.1 85 42.0 204 100.9Cartagena 434 1409 3.2 311 18.6 137 8.2 174 10.4 1255 2.9 36 28.7 95 75.7Kingston 824 2281 2.8 385 16.9 191 8.4 194 8.5 2084 2.5 71 34.1 132 63.3Li4 Paz 1076 2488 2.3 683 27.5 114 4.6 569 22.9 2373 2.2 97 40.9 340 143.3MedellSn 528 2380 4.5 643 27.0 273 11.5 370 15.5 2035 3.9 61 30.0 196 96.3Monterrey 1772 7228 4.1 1511 20.9 550 7.6 961 13.3 6664 3.8 273 41.o 623 93.5-eci re 1738 7967 4.6 2987 37.5 1124 14.1 1863 23.4 6831 3.9 362 53.0 1345 196.9ea-istencia 419 1037 2.5 181 17.5 47 4.5 134 12.9 987 2.4 41 41.5 107 108.4íihciráo Preto 215 754 3.5 206 27.3 116 15.4 90 11.9 638 3.0 30 47.0 62 97.2San luan 128 248 1.9 64 25.8 33 13.3 31 12.5 214 1.7 12 56.1 27 126.2:fan Salvador 1238 3727 3.0 1254 33.6 326 8.7 928 24.9 3398 2.7 200 58.9 577 169.8Santiago 792 1995 2.5 464 23.3 258 12.9 206 10.3 1718 2.2 65 37.8 174 101.3SSo Paulo 1851 5089 2.7 1461 28.7 756 14.9 705 13.9 4324 2.3 213 49.3 525 121.4
Other nrea
Chaco, rural 401 1233 3.1 187 15.2 38 3.1 149 12.1 1195 3.0 43 36.0o 107 89.5!Franca 206 674 3.3 170 25.2 93 13.8 77 11.4 581 2.8 28 48.2 54 92.9Ribeirao Preto, rural 9? 332 3.6 98 29.5 57 17.2 41 12.3 275 3.0 11 40.0 26 94.5San Juan, .suburban 343 1002 2.9 241 24.1 116 11.6 125 12.5 886 2.6 35 39.5 107 120.83'Jn Juan, rural 522 1666 3.2 368 22.1 124 7.4 244 14.6 1539 2.9 67 43.5 185 120.2;¿San Salvador, rural 457 1800 3.9 648 36.0 105 5.8 543 30.2 1694 3.7 106 62.6 275 162.3Simtiago, sauburban 294 ?27 3-.5 53 16.2 15 4.6 38 11.6 289 3.1 4 13.8 27 93.4St. Andrew, rural 80 263 3.3 42 16.0 18 6.8 24 9.1 245 3.1 6 24.5 14 57.1Vi:ha 53 149 2.8 39 26.2 1 0.7 38 25.5 148 2.8 12 81.1 24 162.2
'Witi aipparently reliable pregnancy histories.'inlc;.eden deaths at any age prior to death of Etludy child.
^{art.-:; per 1000 live births.
*,
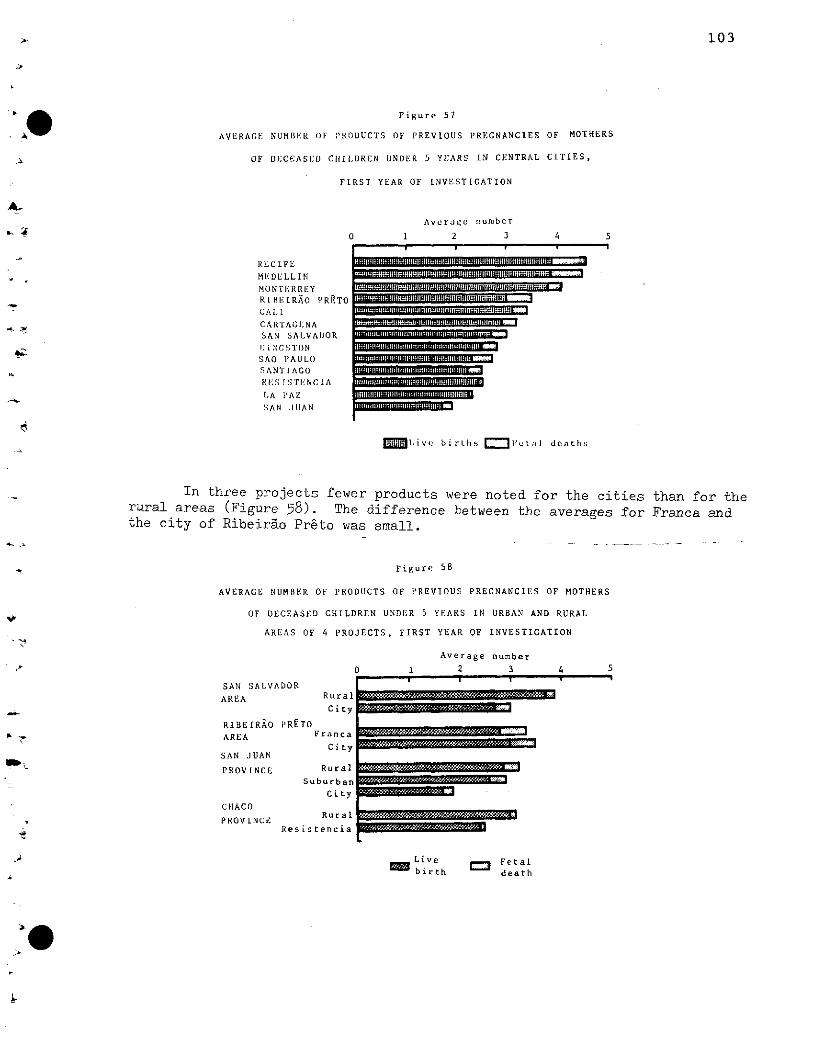
103
Figure 57
AVERAGE NUMBER O(:F 'RODUCTS OF PREVIOUS PREGNANCIES OF MOTHERS
OF DECEASEO CliILDREN UNDER 5 YEARS IN CENTRAL CITIES,
FIRST YEAR OF INVESTICATION
Averagc number
0 1 2 3 4 5
RECI FE
MEDELLIN
MONTEiRREY
RIBEIRAO PRETO
CALI.I
CARTACEGINA
SAN SALVADOR
': iNCSTONSAO PAULO
SANTI AGO
RES [ STIENC IA
l,A P'AZ
SAN .JUAN
MI¡ live birth s _ Fr t~l tal deaths
In three projects fewer products were noted for the cities than for therural areas (Figure 58). The difference between the averages for Franca andthe city of Ribeiráo Preto was small.
Figure 58
AVERAGE NUMBER OF PRODUCTS OF PREVIOUS PREGNANCIES OF MOTHERS
OF DECEASED CHILDREN UNDER 5 YEARS IN URBAN AND RURAL
AREAS OF 4 PROJECTS, FIRST YEAR OF INVESTIGATION
Average number
0 1 2 3 4 5
SAN SALVADOR
AREA
RIBEIRAO PRETO
AREA
SAN JUAN
PROVINCE
Su
Rural
City
Franca
City
Rural
uburban
City
C HACORural
PROVINCEResistencia
=_S=
L
Live = Fetal
= birth death
* .rRys«z.E.. 1s<^r,ç,.Z.@:x ::
_~~~~ · · ·
e~ I l
llm
- '1 ........... 1.............1.........7 1
Inmmnnnnmrnnmmmutitilziil:
.... 11.11.....11,11-1
= I
1
1
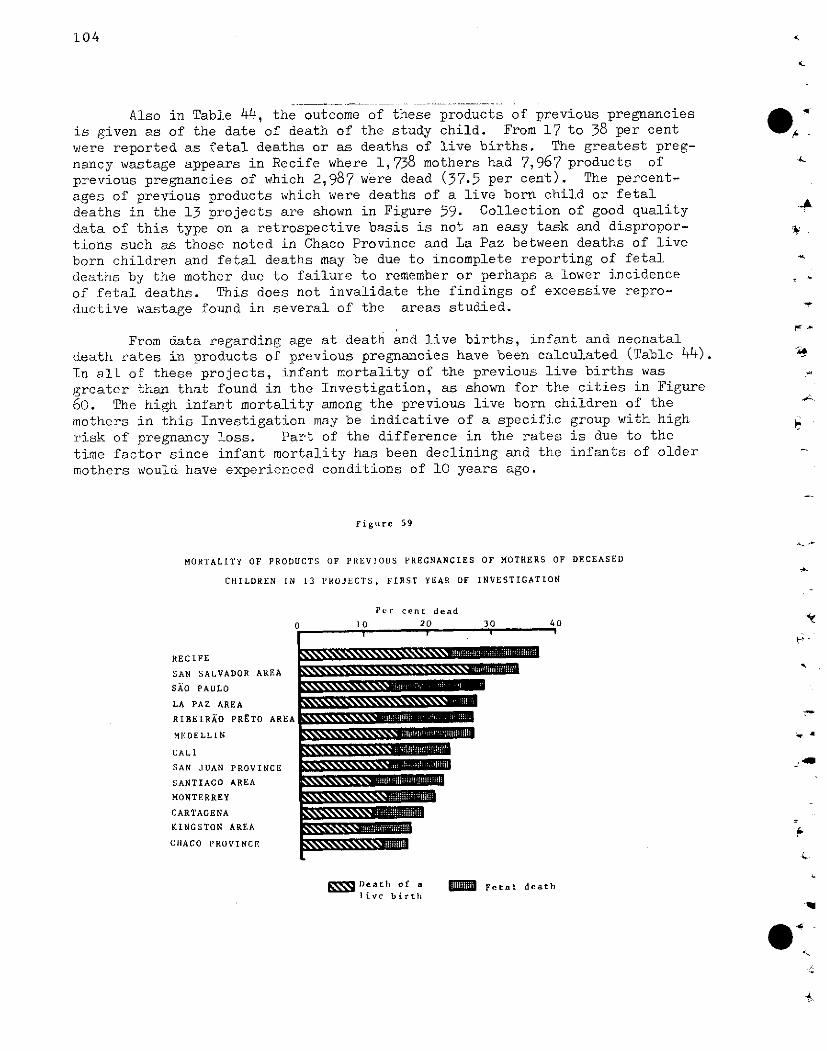
104
Also in Table 44, the outcome of these products of previous pregnanciesis given as of the date of death of the study child. From 17 to 38 per cent
were reported as fetal deaths or as deaths of live births. The greatest preg-
nancy wastage appears in Recife where 1,738 mothers had 7,967 products of
previous pregnancies of which 2,987 were dead (37.5 per cent). The percent-
ages of previous products which were deaths of a live born child or fetal
deaths in the 13 projects are shown in Figure 59. Collection of good quality
data of this type on a retrospective basis is not an easy task and dispropor-
tions such as those noted in Chaco Province and La Paz between deaths of liveborn children and fetal deaths may be due to incomplete reporting of fetal
deaths by the mother due to failure to remember or perhaps a lower incidence
of fetal deaths. This does not invalidate the findings of excessive repro-
ductive wastage found in several of the areas studied.
From data regarding age at death and live births, infant and neonatal
death rates in products of previous pregnancies have been calculated (Table 44).
In all of these projects, infant mortality of the previous live births was
greater than that found in the Investigation, as shown for the cities in Figure
60. The high infant mortality among the previous live born children of the
mothers in this Investigation may be indicative of a specific group with high
risk of pregnancy loss. Part of the difference in the rates is due to the
time factor since infant mortality has been declining and the infants of older
mothers would have experienced conditions of 10 years ago.
Figure 59
MORTALITY OF PRODUCTS OF PREVIOUS PREGNANCIES OF MOTHERS OF DECEASED
CHILDREN IN 13 PROJECTS, FIRST YEAR OF INVESTIGATION
Per cent dead
20--y
30 40! w
RECIFE
SAN SALVADOR AREA
SAO PAULO
LA PAZ AREA
RIBE1RAO PRETO AREA
MEDELLIN
CALI
SAN JUAN PROVINCE
SANTIAGO AREA
MONTERREY
CARTAGENA
KINGSTON AREA
CHACO PROVINCE
-4L
'A&
O 10
4
E Death of alive birth
_=i Fetal death
4
-w
w
a
R§ZDEMSSZE~
L
!!
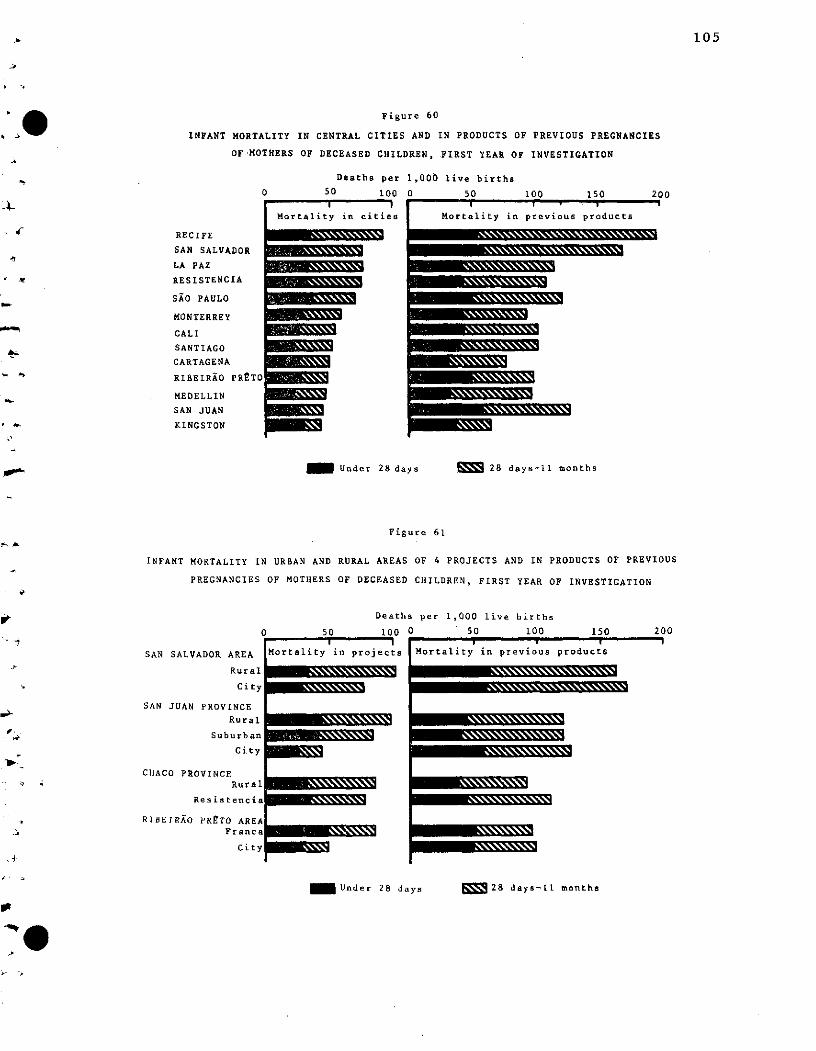
105
Figure 60
INFANT MORTALITY IN CENTRAL CITIES AND IN PRODUCTS OF PREVIOUS PREGNANCIES
OF MOTHERS OF DECEASED CHILDREN, FIRST YEAR OF INVESTIGATION
Deaths per 1,000 live births
0 50 100 0 50
Mortality in cities M ortality inMortality in cities Mortality in
100 150previous produ
previous products
200
RECIFE
SAN SALVADOR
LA PAZ
RESISTENCIA
SAO PAULO
MONTERREY
CALI
SANTIAGO
CARTAGENA
RIBEIRAO PRETO
MEDELLIN
SAN JUAN
KINGSTON
Under 28 days E= 28 days-ll months
Figure 61
INFANT MORTALITY IN URBAN AND RURAL AREAS OF 4 PROJECTS AND IN PRODUCTS OF PREVIOUS
PREGNANCIES OF MOTHERS OF DECEASED CHILDREN, FIRST YEAR OF INVESTIGATION
Deaths per 1,000 live births
0 50 100 0 50 100 150 2(
SAN SALVADOR AREA Mortalityin roject LNortality in previous products
Rural
SAN JUAN PROVINCE
Rural
Suburban
City
CHACO PROVINCERural
Resistencia
RIBEIRAO PRETO AREAFranca
City
Under 28 days E-q28 days-ll months
-
B
1 S~
----- ~~
)00
City
m~i
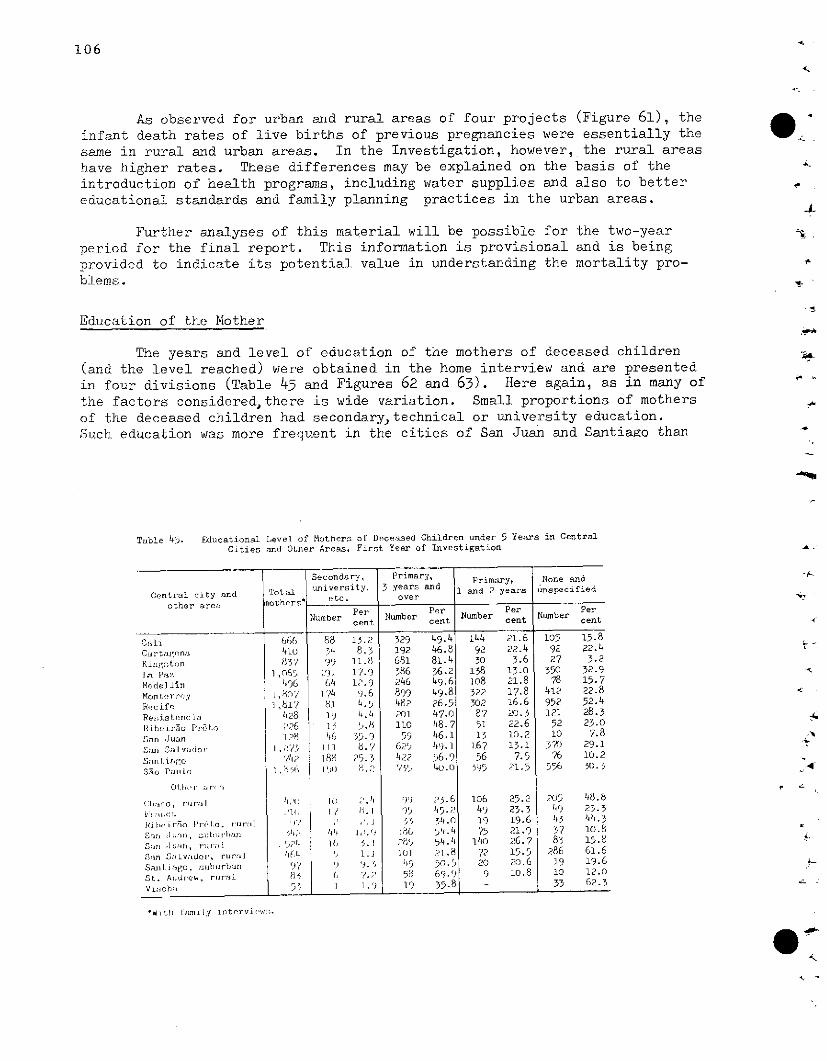
106
As observed for urban anid rural areas of four projects (Figure 61), theinfant death rates of live births of previous pregnancies were essentially thesame in rural and urban areas. In the Investigation, however, the rural areashave higher rates. These differences may be explained on the basis of theintroduction of health programs, including water supplies and also to bettereducational standards and family planning practices in the urban areas.
Further analyses of this material will be possible for the two-yearperiod for the final report. This information is provisional and is beingprovided to indicate its potential value in understanding the mortality pro-blems.
Education of the Mother
The years and level of education of the mothers of deceased children(and the level reached) were obtained in the home interview and are presentedin four divisions (Table 45 and Figures 62 and 63). Here again, as in many of
the factors considered,there is wide variation. Small proportions of mothersof the deceased children had secondary>technical or university education.Such education was more frequent in the cities of San Juan and Santiaao than
Table 45. Educat;ional Level of Mothers of Deceased Children under 5 Years in CentralCities and Other Areas, First Year of Investigation
Secondary, Primary, Primary, None and
Centiral city and Total e t 3 years and 1 and 2 years unspecified
other area oth'rsPer Per Per Per
Number e Number Number Numbercent cet eent cent
Cali 666 88 13.2 329 49.4 144 21.6 105 15.8
Cartagrcena 410 34 8.3 192 46.8 92 22.4 92 22.4
Kingr-ton 837 99 11.8 681 81.4 30 3.6 27 3.2La Pa. 1 ,065 191 17.9 386 36.2 138 13.0 350 32.9Medell]n 496 64 1 246 49.6 108 21.8 78 15.7Moni erry I,80;7 174 9.6 899 49.8 322 17.8 41? 22.8Recife 1,817 81 4.5 482 26.5 302 16.6 952 52.4
Resistencia 428 19 4.4 201 47.0 87 20.3 121 28.3IRihcirao 1' r to 7226 15 5.8 110 48.7 51 22.6 52 23.0
Snn Juan 128 46 55.9 59 46.1 13 10.2 10 '7.8
S:r SCalvador 1,"'/5 1] 8.7 625 49.1 167 13.1 371 29.1 +
Sn lt irio 742 188 25.3 422 56.9 56 7.5 76 10.2
Sao Pa ulo i I, o ( P, y 755 4 .0 595 21.5 556 30.3 4
OI. lu~ r atro i
hlrc o, rcral 42( 1() .4 99 25.6 106 25.2 205 48.8" v ,; ,'l)o 17 ¿ H. ¡I 95 45.
2 49 23.3 49 23.3ll<¡irñro rtlo, rur;l i'/ 2 '.1 55 ,4.0 19 19.6 ¡43 44.3
Sa1 Juro, 0 ajj)lralr.4tí I;L9 44 1 512.4 75 21.9 37 10.8
Csr .l a , r l 5-94 16 . 89 54. 4 i40 26.7 83 15.8
S;n CSrLvidxior , rar:al if4 9 1 .1 101 21.8 72 15.5 286 61.6
Sauotiíra~:go, iahurban 93'7 1) 3i. 4, ?9 53.5 20 20.6 19 19.6 i
St. Andrew, rural 8' /" 58 69.<9 9 10.8 10 12.0Vinchr 5 1 1.9 19 35.8 33 62.3
Wit), urrmuily interviw,.
O'·
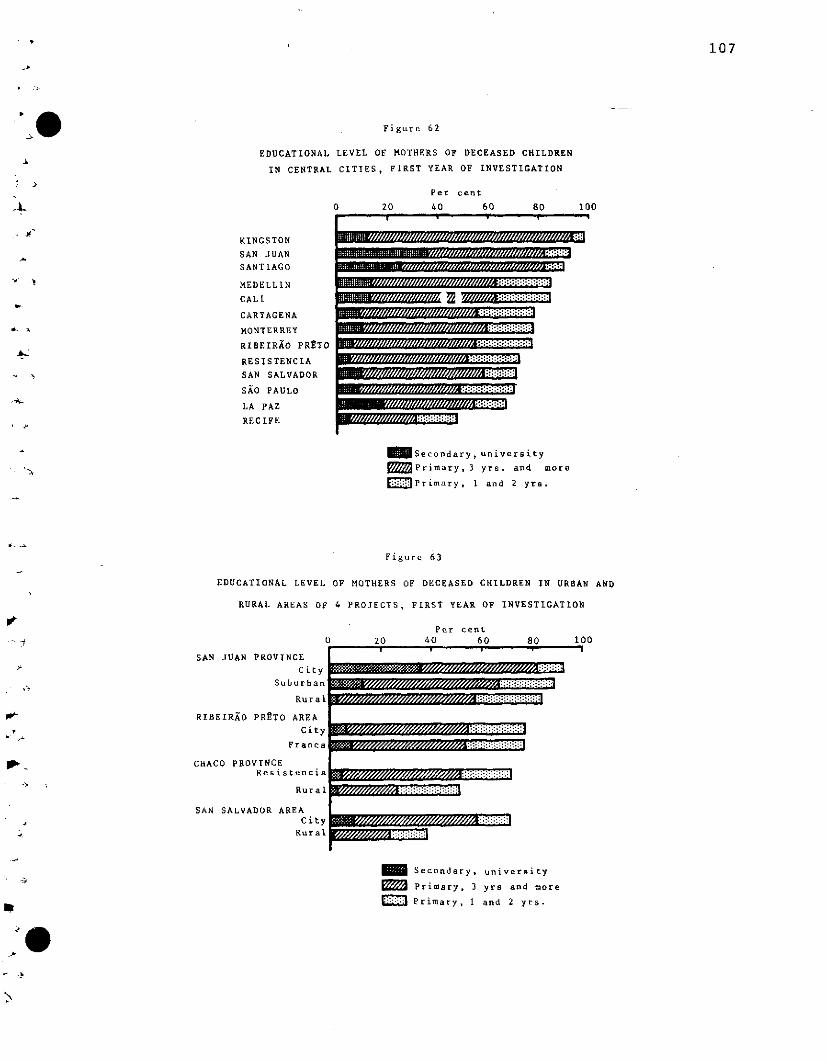
107
Figure 62
EDUCATIONAL LEVEL OF MOTHERS OF DECEASED CHILDREN
IN CENTRAL CITIES, FIRST YEAR OF INVESTIGATION
Per cent
0 20 40 60 80 100
KINGSTON
SAN JUAN
SANTIAGO
MEDELLIN
CALI
CARTAGENA
MONTERREY
RIBEIRAO PRETO
RESISTENCIA
SAN SALVADOR
SAO PAULO
LA PAZ
RECIFE
~ Secondary, university
E7 Primary,3 yrs. and more
M Primary, 1 and 2 yrs.
Figure 63
EDUCATIONAL LEVEL OF MOTHERS OF DECEASED CHILDREN IN URBAN AND
RURAL AREAS OF 4 PROJECTS, FIRST YEAR OF INVESTIGATION
SAN JUAN PROVINCE
City
Suburban
Rural
RIBEIRAO PRETO AREA
City
Pcr cent20 40 60 80 100
'1: : - : -:::...I10/%z0X0¿////z/XzM:::::::::::
Y3¿z»/X05SSSS/X»///Xgz¿X000SA.:.:.:.:.:: :.: :.:lFranca / [////// A:i::
ClHACO PROVINCEResistencia
Rural
SAN SALVADOR AREACity
Rural
1~~~~~~~~~~~~~:::::
Secondary, university
Primary, 3 yrs and more
I :Primary, 1 and 2 yrs.
· · ·
Iffflt#�Rfm////�'/////m//�7�7�'m///mV�'/�
ABfUAli�#intnr�RBtl#tnn�'n/v//m�7/n/m/m/
WetnnRtim�m�lllllrrrrnlr�lllr�m�lrr�mlm
I1IA#H1I1I�'�'�'//////�////m�5�/////�n(�
Ba#111Rll�'�n/�7//�'///, p ·co/////�;�i·�:i:i��:3
8ti�rt�m//////m//mm/�/nn//�::��Iirr:�·i
�'////////�'/Vm//m//////mm�:�:�:i:i:�:�:
srai�/�7//////n//�'///U7/��:�:�:i:�5�:i:
irai�liamnnrm�i�mn�r��
1 1 1 1
::: : : :·
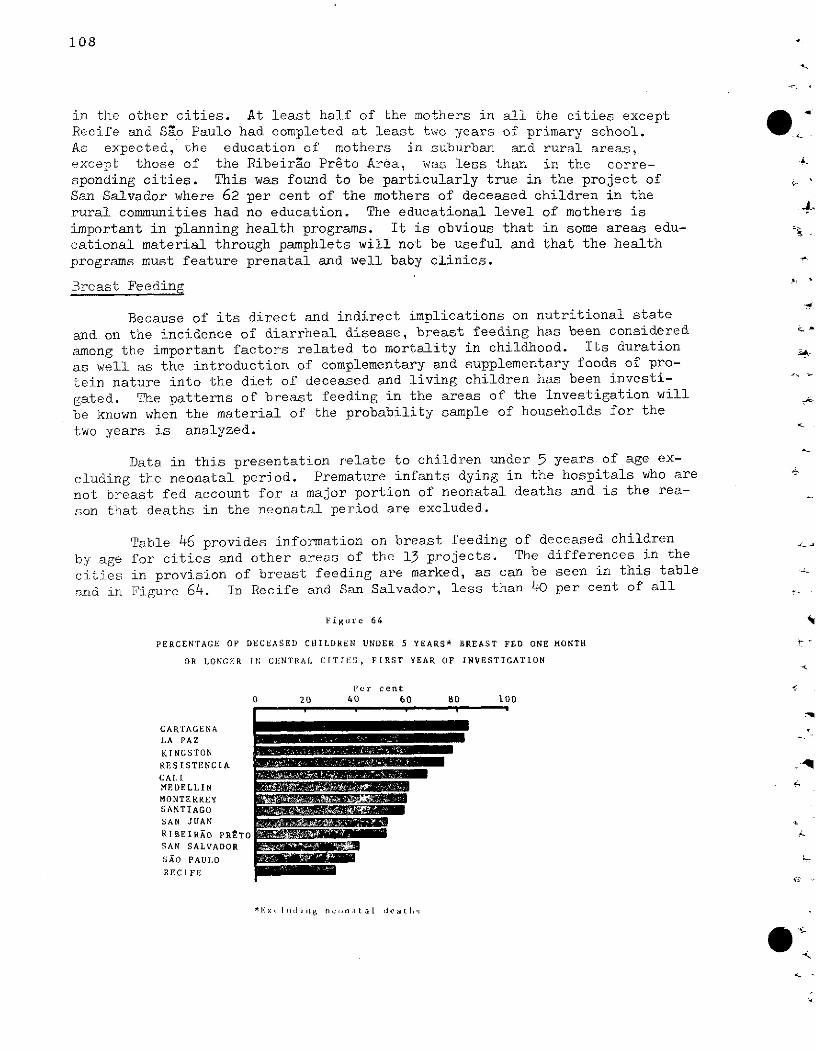
108
in the other cities. At least half of the mothers in all the cities exceptRecife and Sao Paulo had completed at least two years of primary school.
As expected, the education of mothers in suburban and rural areas,except those of the Ribeirao Preto Area, was less than in the corre-sponding cities. This was found to be particularly true in the project ofSan Salvador where 62 per cent of the mothers of deceased children in the
rural communities had no education. The educational level of mothers is
important in planning health programs. It is obvious that in some areas edu-
cational material through pamphlets will not be useful and that the health
programs must feature prenatal and well baby clinics.
Breast Feeding
Because of its direct and indirect implications on nutritional state
and on the incidence of diarrheal disease, breast feeding has been consideredamong the important factors related to mortality in childhood. Its duration
as well as the introduction of complementary and supplementary foods of pro-
tein nature into the diet of deceased and living children has been investi-
gated. The patterns of breast feeding in the areas of the Investigation will
be known when the material of the probability sample of households for the
two years is analyzed.
Data in this presentation relate to children under 5 years of age ex-
cluding the neonatal period. Premature infants dying in the hospitals who are
not breast fed account for a major portion of neonatal deaths and is the rea-
son that deaths in the neonatal period are excluded.
Table 46 provides information on breast feeding of deceased children
by age for cities and other areas of the 13 projects. The differences in the
cities in provision of breast feeding are marked, as can be seen in this table
and in Figure 64. In Recife and San Salvador, less than 40 per cent of all
Figure 64
PERCENTAGE OF DECEASED CIllLDREN UNDER 5 YEARS* BREAST FED ONE MONTH
OR LONGER IN CENTRAL CITIES, FIRST YEAR OF INVESTIGATION
IPer cent
0 20 40 60 80 100
CARTAGENA
LA PAZ
KINGSTON
RESISTENCIACALMEDELLINMONTERREYSANTIAGO
SAN JUAN
RIBEIRAO PRTTO .
SAN SALVADOR
SAO PAULO
RECIFE
* I:x. x ldi g r le nit1 l death ;
*O,,
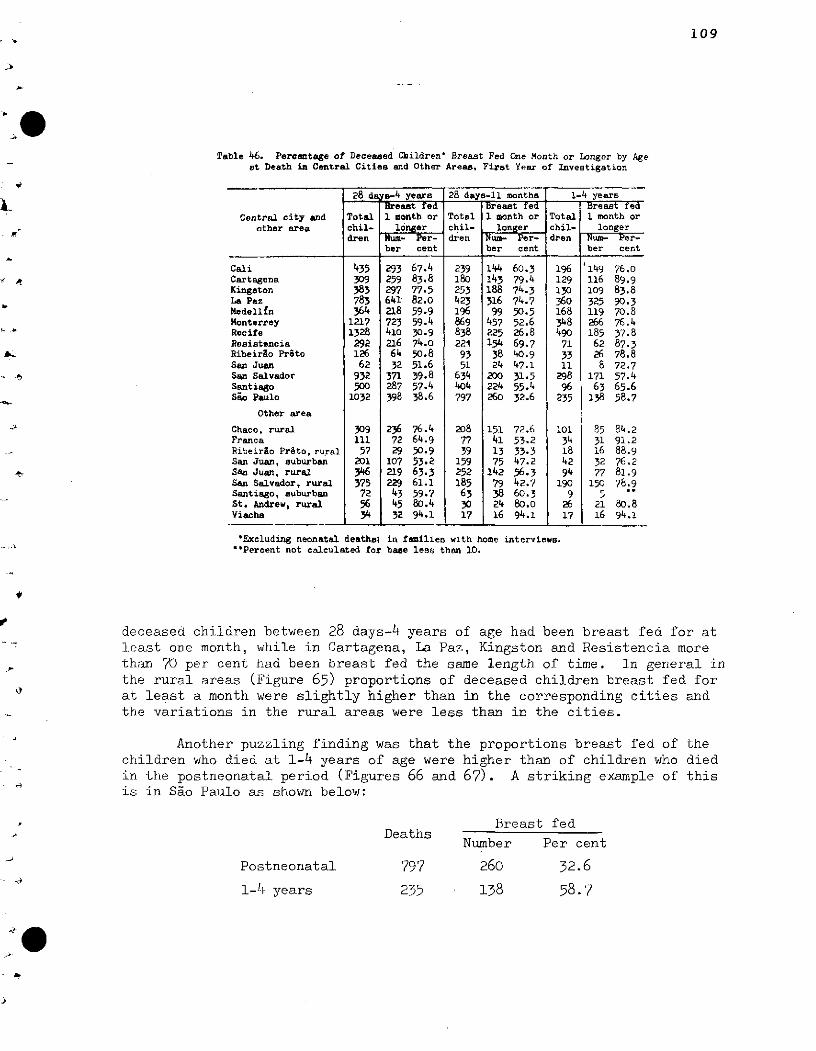
109
Table 46. Percentage of Deceased CLildren' Breast Fed One Month or Longer by Ageat Death in Central Cities and Other Areas, Firat Year of Investigation
28 da Ys-4 years 28 daya-ll months 1-4 yearsBreast fed Breast fed Breast fed
Central city and Total 1 month or Total 1 month or Total 1 month orother area chil- longer chil- longer chil- longer
dren Num- Per- dren Num- Per- dren Num- Per-ber cent ber cent ber cent
Cali 435 293 67.4 239 144 60.3 196 '149 76.0Cartagena 309 259 83.8 180 143 79.4 129 116 89.9Kingaton 383 297 77.5 253 188 74.3 130 109 83.8La Paz 783 641 82.0 423 316 74.7 360 325 90.3Medellfn 364 218 59.9 196 99 50.5 168 119 70.8Monterrey 1217 723 59.4 869 457 52.6 348 266 76.4Recite 1328 410 30.9 838 225 26.8 490 185 37.8Resistencia 292 216 74.0 221 154 69.7 71 62 87.3Ribeirlo PrSto 126 64 50.8 93 38 40.9 33 26 78.8San Juan 62 32 51.6 51 24 47.1 11 8 72.7San Salvador 932 371 39.8 634 200 31.5 298 171 57.4Santiago 500 287 57.4 404 224 55.4 96 63 65.6Seo Paulo 1032 398 38.6 797 260 32.6 235 138 58.7
Other area
Chaco, rural 309 236 76.4 208 151 72.6 101 85 84.2Franca 111 72 64.9 77 41 53.2 34 31 91.2Ribeirao Préto, rural 57 29 50.9 39 13 33.3 18 16 88.9San Juan, suburban 201 107 53.2 159 75 47.2 42 32 76.2San Juan, rural 346 219 63-.3 252 142 56.3 94 77 81.9San Salvador, rural 375 229 61.1 185 79 42.7 190 150 78.9Santiago, suburban 72 43 59-7 63 38 60.3 9 5St. Andrew, rural 56 45 80.4 30 24 80.0 26 21 80.8Viacha 34 32 94.1 17 16 94.1 17 16 94.1
*Excluding neonatal deatha; in families with home interviews.`'Percent not calculated for base less than 10.
deceased children between 28 days-4 years of age had been breast fed for atleast one month, while in Cartagena, La Paz, Kingston and Resistencia morethan 70 per cent had been breast fed the same length of time. In general inthe rural areas (Figure 65) proportions of deceased children breast fed forat least a month were slightly higher than in the corresponding cities andthe variations in the rural areas were less than in the cities.
Another puzzling finding was that the proportions breast fed of thechildren who died at 1-4 years of age were higher than of children who diedin the postneonatal period (Figures 66 and 67). A striking example of thisis in Sao Paulo as shown below:
Breast fedDeaths
Number Per cent
Postneonatal 797
1-4 years 235
260
138
32.6
58.7
1,
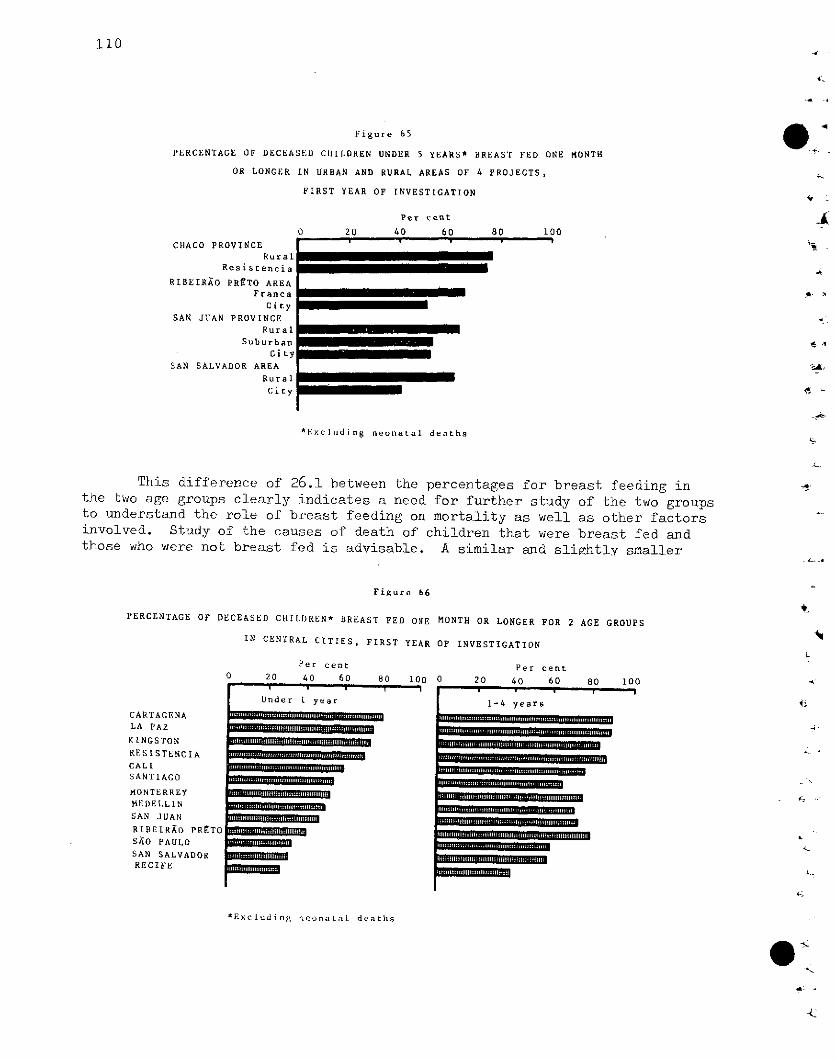
Figure 65
PERCENTAGE OF DECEASED CHILDREN UNDER 5 YEARS* BREAST FED ONE MONTH
OR LONGER IN URBAN AND RURAL AREAS OF 4 PROJECTS,
FIRST YEAR OF INVESTIGATION
Per cent
0 20 40 60 80 100CHACO PROVINCE
RuralResistencia
RIBEIRAO PR£TO AREAFranca
CitySAN JUAN PROVINCE
RuralSuburban
CitySAN SALVADOR AREA
Rural
City
*Excluding neunatal deaths
This difference of 26.1 between the percentages for breast feeding inthe two age groups clearly indicates a need for further study of the two groupsto understand the role of breast feeding on mortality as well as other factorsinvolved. Study of the causes of death of children that were breast fed andthose who were not breast fed is advisable. A similar and slightly smaller
Figure 66
PERCENTAGE OF DECEASED CHILDREN* BREAST FED ONE MONTH OR LONGER FOR 2 AGE GROUPS
IN CENTRAL CITIES, FIRST YEAR OF INVESTIGATION
Per cent0 20 40 60 80 100
CARTAGENALA PAZ
KINGSTON
RESISTENCIA
CALISANTIAGO
MONTERREYMEDELLIN
SAN JUAN
RIBEIRAO PRETOSAO PAULOSAN SALVADORRECIFE
Per cent0 20 40 60 80 100
1-4 years__1,1...............
*Excluding neonaLal deaths
.
110
-4
4
4XIw I i l
C
-= I~~~~
iI
1
II
bzzz==""1
wwaymawmwwww~ ...... nmmi
~BUflOllffl~tnlll ~~¡Mlllfl
~m~.UnHl~íHIU In.n MEMBE~~mAIIli m 1110n111 ... . .......... MEZMnl=
11,1---.......11 .... ---...IB~nll
.
Under 1 year
mmmwrmmwmmwmw
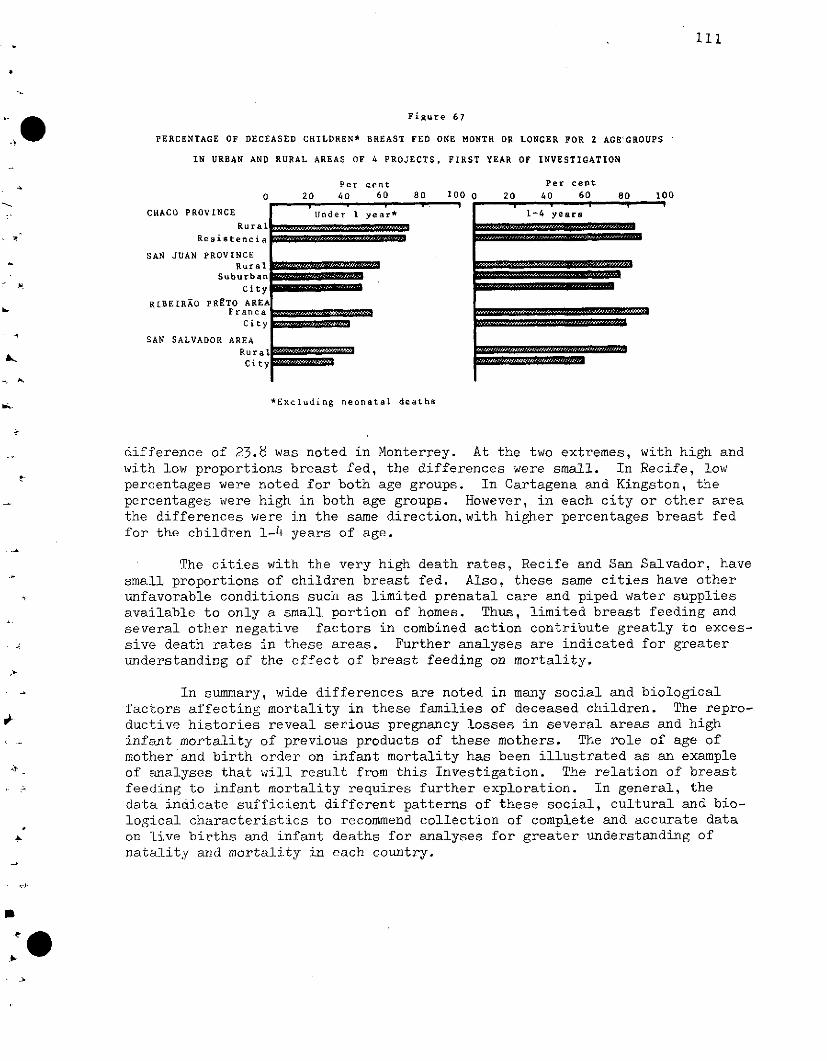
111
Figure 67
PERCENTAGE OF DECEASED CHILDREN* BREAST FED ONE MONTH OR LONGER FOR 2 AGE'GROUPS
IN URBAN AND RURAL AREAS OF 4 PROJECTS, FIRST YEAR OF INVESTIGATION
Per cent Per cent
0 20 40 60 80 100 0 20 40 60 80 100
CHACO PROVINCE Under 1 year* 1-4 yearsRural
Resistencia
SAN JUAN PROVINCERural
Suburban ...City
RIBEIRAO PRETO AREAFranca
City _
SAN SALVADOR AREARuralcity . .
*Excluding neonatal deaths
difference of 23.8 was noted in Monterrey. At the two extremes, with high andwith low proportions breast fed, the differences were small. In Recife, lowpercentages were noted for both age groups. In Cartagena and Kingston, thepercentages were high in both age groups. However, in each city or other areathe differences were in the same direction,with higher percentages breast fedfor the children 1-4 years of age.
The cities with the very high death rates, Recife and San Salvador, havesmall proportions of children breast fed. Also, these same cities have otherunfavorable conditions such as limited prenatal care and piped water suppliesavailable to only a small portion of homes. Thus, limited breast feeding andseveral other negative factors in combined action contribute greatly to exces-sive death rates in these areas. Further analyses are indicated for greaterunderstanding of the effect of breast feeding on mortality.
In summary, wide differences are noted in many social and biologicalfactors affecting mortality in these families of deceased children. The repro-ductive histories reveal serious pregnancy losses in several areas and highinfant mortality of previous products of these mothers. The role of age ofmother and birth order on infant mortality has been illustrated as an exampleof analyses that will result from this Investigation. The relation of breastfeeding to infant mortality requires further exploration. In general, thedata indicate sufficient different patterns of these social, cultural and bio-logical characteristics to recommend collection of complete and accurate dataon live births and infant deaths for analyses for greater understanding ofnatality and mortality in each country.

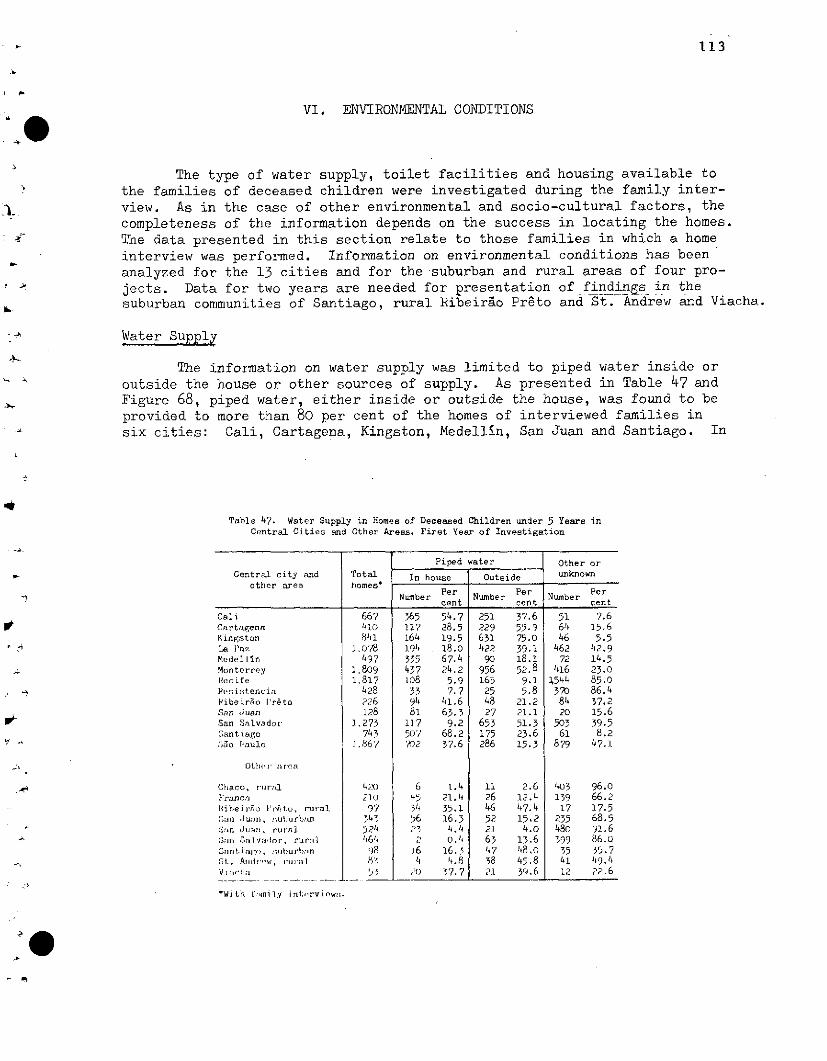
113
VI. ENVIRONMENTAL CONDITIONS
The type of water supply, toilet facilities and housing available tothe families of deceased children were investigated during the family inter-view. As in the case of other environmental and socio-cultural factors, thecompleteness of the information depends on the success in locating the homes.The data presented in this section relate to those families in which a homeinterview was performed. Information on environmental conditions has beenanalyzed for the 13 cities and for the suburban and rural areas of four pro-jects. Data for two years are needed for presentation of findings in thesuburban communities of Santiago, rural Ribeiráo Preto and St. Andrew and Viacha.
Water Supply
The information on water supply was limited to piped water inside or
outside the house or other sources of supply. As presented in Table 47 andFigure 68, piped water, either inside or outside the house, was found to beprovided to more than 80 per cent of the homes of interviewed families insix cities: Cali, Cartagena, Kingston, Medellin, San Juan and Santiago. In
Table 47. Water Supply in Homes of Deceased Children under 5 Years inCentral Cities and Other Areas, Firat Year of Investigation
Piped water Other or
Central city and Total In house Outnide unknownother area homes'
Per Per PerNumber Nwumber Numbercent cent cent
Cali 667 365 54.7 251 37.6 51 7.6Cartagena 410 117 28.5 229 55.9 64 15.6Kingston 841 164 19.5 631 75.0 46 5.5la 'Pa5: J(.078 194 18.0 422 39.1 462 42.9Medellin 497 335 67.4 90 18.1 72 14.5Monterrey 1,809 437 24.2 956 52.8 416 23.0Hecife 1,817 108 5.9 165 9.1 1544 85.0RPeintencia 428 33 7.7 25 5.8 370 86.4Ribeir5o 'réto 226 94 41.6 48 21.2 84 37.2San Juan 128 81 63.3 27 21.1 20 15.6San Salvador 1.273 117 9.2 653 51.3 503 39.5Santiago 743 507 68.2 175 23.6 61 8.22,So lPaulo 1.867 ')02 37.6 286 15.3 879 47.1
Other area
Chaco, rural 420 6 1.4 11 2.6 403 96.0Franca 210 45 21.4 26 12.4 139 66.2Ribeirñ I'rito, rural 97 34 35.1 46 47.4 17 17.5fSan Juan, r;uurtbni 543 5b6 16.3 52 15.2 235 68.5
:ln Juran, rural 524 23 4.4 2l 4.0 480 91.6San ialvndor, rural 464 2 0.4 63 13.6 399 86.0Sanrt iafro, :iuburblin 9)8 L6 16.5 47 48.0 35 35.7S1. Ai,irw, rial M'' 4 4.8 38 45.8 41 49'.4V ,'cha 5_ .0,o 57.7 21 39.6 12 ,2.6
*With ;inmily inltrvirw:i.
_ a,
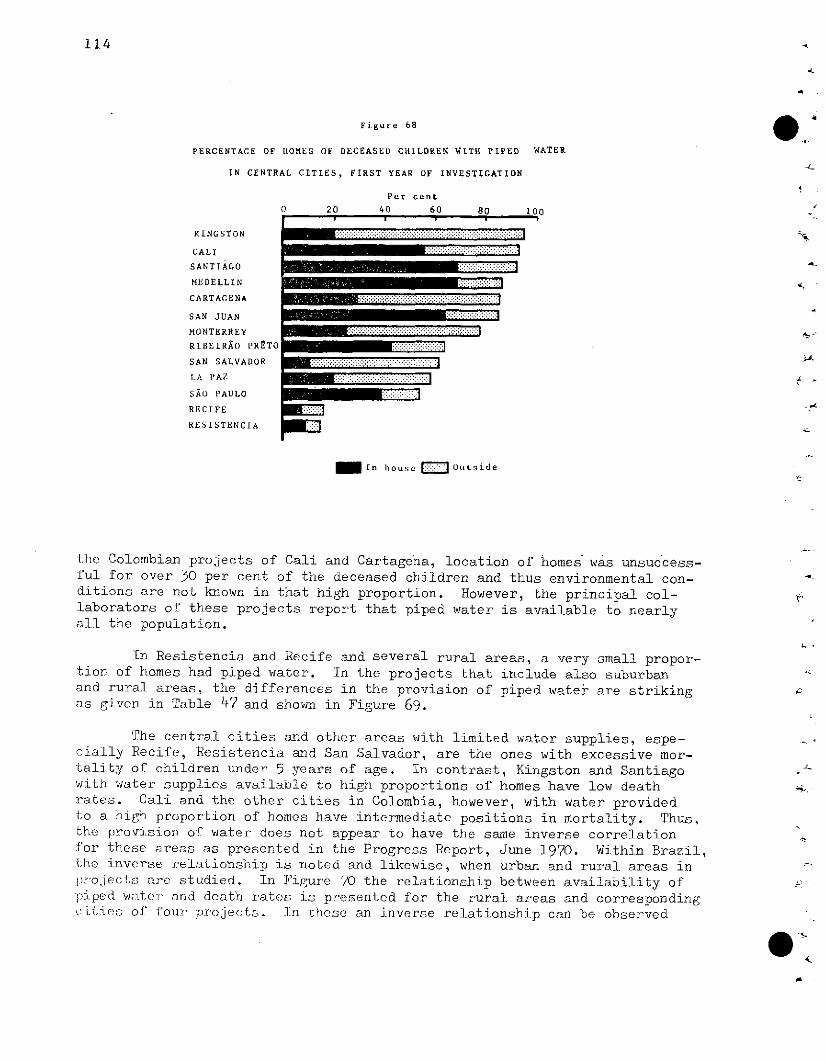
114
Figure 68
PERCENTAGE OF HOMES OF DECEASED CHILDREN WITH PIPED WATER
IN CENTRAL CITIES, FIRST YEAR OF INVESTIGATION
KINGSTON
CALI
SANTIAGO
MEDELLIN
CARTAGENA
SAN JUAN
MONTERREY
RIBEIRAO PR2TO
SAN SALVADOR
LA PAZ
SAO PAULO
RECIFE
RESISTENCIA
Per cent
20 40 60 80 100
-========================== S
m In house :: Outside
the Colombian projects of Cali and Cartageha, location of homes was unsuccess-ful for over 30 per cent of the deceased children and thus environmental con-ditions are not known in that high proportion. However, the principal col-laborators of these projects report that piped water is available to nearlyall the population.
In Resistencia and Recife and several rural areas, a very small propor-tion of homes had piped water. In the projects that include also suburbanand rural areas, the differences in the provision of piped water are strikingas given in Table 47 and shown in Figure 69.
The central cities and other areas with limited water supplies, espe-cially Recife, Resistencia and San Salvador, are the ones with excessive mor-tality of children under 5 years of age. In contrast, Kingston and Santiagowith water supplies available to high proportions of homes have low deathrates. Cali and the other cities in Colombia, however, with water providedto a high proportion of homes have intermediate positions in mortality. Thus,the provision of water does not appear to have the same inverse correlationfor these areas as presented in the Progress Report, June 1970. Within Brazil,the inverse relationship is noted and likewise, when urban and rural areas inprojec-s are stuodied. In Figure 70 the relationship between availability ofpiped water and death rates isi presented for the rural areas and corresponding.ities of four projects. In these an inverse relationship can be observed
4
r
iI:i:i:
....... ~
1(
::.::.-.--:::::::::::::::::::
.
-
*o
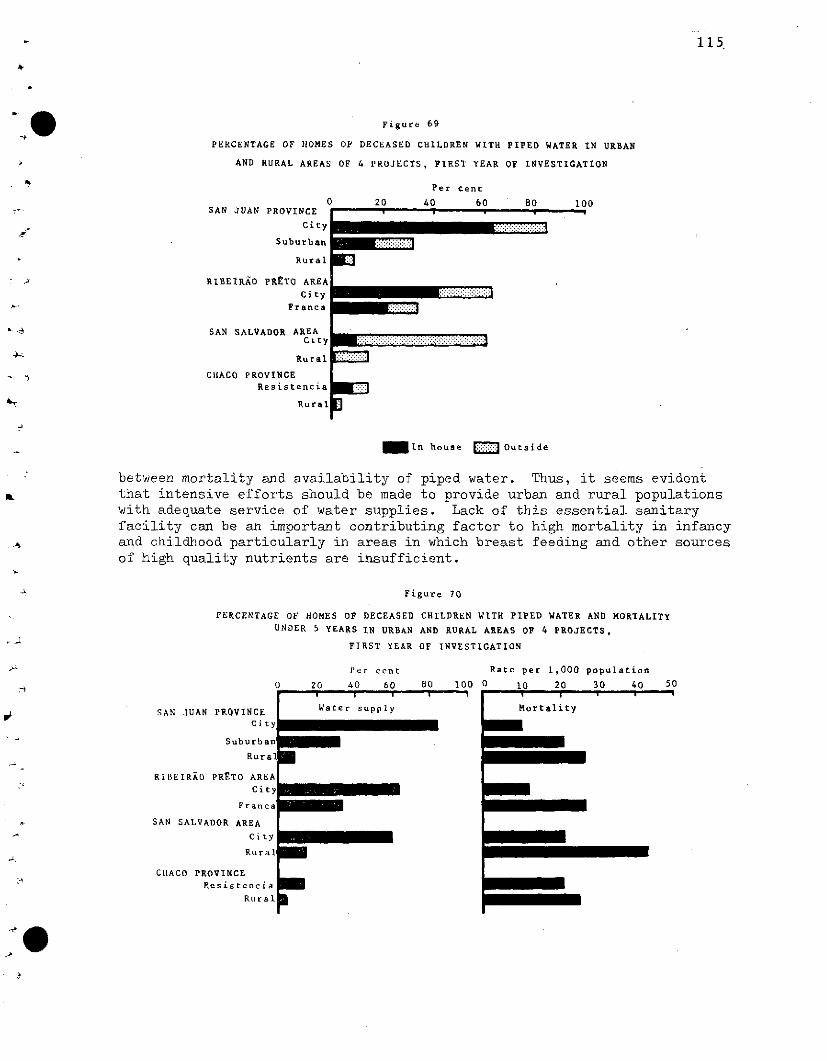
Figure 69
PERCENTAGE OF HOMES OF DECEASED CHILDREN WITH
AND RURAL AREAS OF 4 PROJECTS, FIRST YEAR
PIPED WATER IN URBAN
OF INVESTIGATION
SAN JUAN PROVINCE
City
Suburban
Rural
RIBEIRAO PRETO AREA
CityFranca
SAN SALVADOR AREAClty
Rural
CHACO PROVINCEResistencia
Rural
20 4
':::':,:: .:::':".: '::':::;:rEa
~ In house : Outside
between mortality and availability of piped water. Thus, it seems evidentthat intensive efforts should be made to provide urban and rural populationswith adequate service of water supplies. Lack of this essential sanitaryfacility can be an important contributing factor to high mortality in infancyand childhood particularly in areas in which breast feeding and other sourcesof high quality nutrients are insufficient.
Figure 70
PERCENTAGE OF HOMES OF DECEASED CHILDREN WITH PIPED WATER AND MORTALITY
UNDER 5 YEARS IN URBAN AND RURAL AREAS OF 4 PROJECTS,
FIRST YEAR OF INVESTIGATION
SAN JUAN PROVINCECity
Suburban
Rural
RIBEIRAO PRETO AREA
City
Franca
SAN SALVADOR AREA
City
Rural
CIlACO PROVINCE
Resistencia
Ru ral
Per cent
20 40 601 y 1
Water supply
80 100 0
¡
a
Mm
Rate per 1,000
10 20
population
30 40 50
Mortality
115
Per cent
0 60 80 100~1 -· 1
,, I ~~~~:~~~~:~::::::::i:~~~~~~::::::i- -
Ib3
- .- s
- .
_i
�l
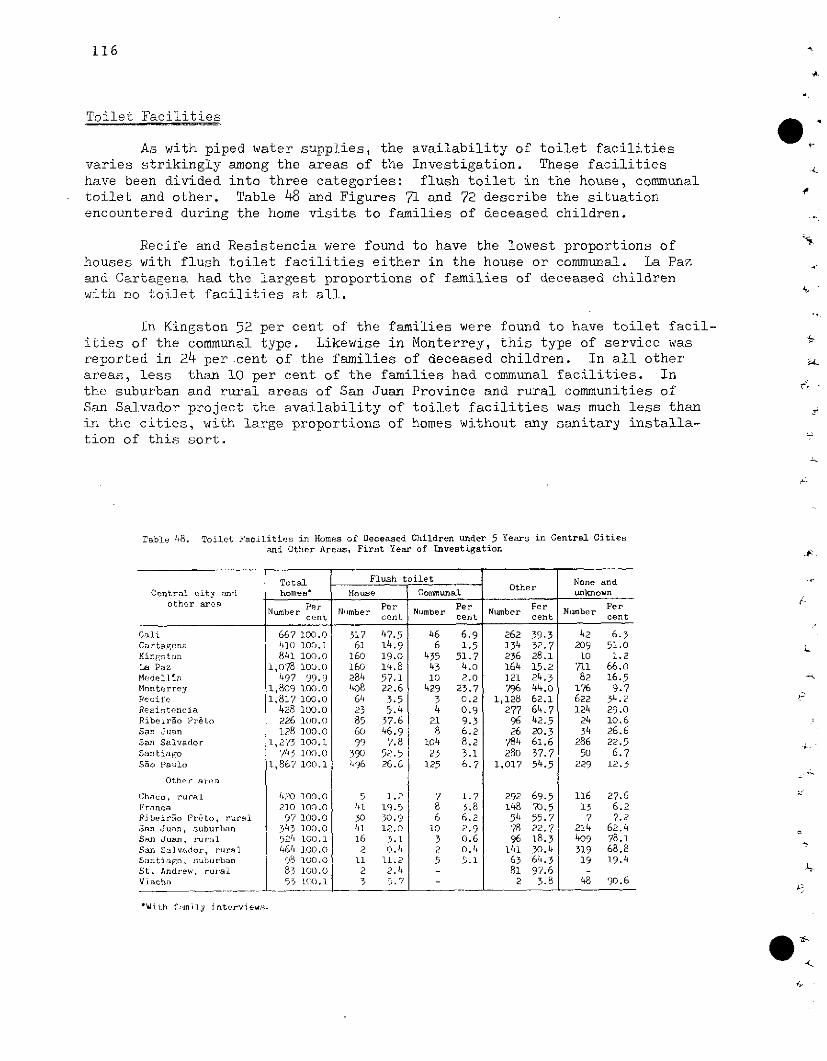
116
Toilet Facilities
As with piped water supplies, the availability of toilet facilitiesvaries strikingly among the areas of the Investigation. These facilitieshave been divided into three categories: flush toilet in the house, communaltoilet and other. Table 48 and Figures 71 and 72 describe the situationencountered during the home visits to families of deceased children.
Recife and Resistencia were found to have the lowest proportions ofhouses with flush toilet facilities either in the house or communal. La Pazand Cartagena had the largest proportions of families of deceased childrenwith no toilet facilities at all.
In Kingston 52 per cent of the families were found to have toilet facil-ities of the communal type. Likewise in Monterrey, this type of service wasreported in 24 per cent of the families of deceased children. In all otherareas, less than 10 per cent of the families had communal facilities. Inthe suburban and rural areas of San Juan Province and rural communities ofSan Salvador project the availability of toilet facilities was much less thanin the cities, with large proportions of homes without any sanitary installa-tion of this sort.
Table 48. Toilet Facilities in Homes of Deceased Children under 5 Years in Central Citiesand Other Areas, First Year of Investigation
Total Flush toilet O None andCentral city and homes' House Communal ter unknown
othcr 9o Per Per Per Per PerNumber Number Number Number Number
cent cent cent cent cent
Cali 667 100.0 317 47.5 46 6.9 262 39.3 42 6.3Cartagena 410 100.1 61 14.9 6 1.5 134 32.7 209 51.0Kingston 841 100.0 160 19.0 435 51.7 236 28.1 10 1.2La Paz 1,078 100.0 160 14.8 43 4.0 164 15.2 711 66.0Medellin 497 99.9 284 57.1 10 2.0 121 24.3 82 16.5Monterrey 1,809 100.0 408 22.6 429 23.7 796 44.0 176 9.7Recife 1,817 100.0 64 3.5 3 0.2 1,128 62.1 622 34.2Resistencia 428 100.0 23 5.4 4 0.9 277 64.7 124 29.0Ribeirgo Preto 226 100.0 85 37.6 21 9.3 96 42.5 24 10.6San Juan 128 100.0 60 46.9 8 6.2 26 20.3 34 26.6San Salvador 1,273 100.1 99' 7.8 104 8.2 784 61.6 286 22.5Santiago 743 100.0 390 52.5 23 3.1 280 37.7 50 6.7Sao Paulo 1,867 100oo.1 496 26.6 125 6.7 1,017 54.5 229 12.3
Other area
Chaco, rural 420 100.0 5 1.2 7 1.7 292 69.5 116 27.6Franca 210 100.0 41 19.5 8 3.8 148 70.5 13 6.2Ribeirao Preto, rural 97 100.0 30 30.9 6 6.2 54 55.7 7 7.2San Juan, suburban 343 10.O 41 12.0 10 2.9 78 22.7 214 62.4San Juan, rural 524 100.1 16 3.1 3 0.6 96 18.3 409 78.1San Salvador, rural 464 100.0 2 0.4 2 0.4 141 30.4 319 68.8Santiago, suburban 98 100.0 11 11.2 5 5.1 63 64.3 19 19.4St. Andrew, rural 83 100.0 2 2.4 - 81 97.6 1Viacha 53 f10.l 3 5.7 - 2 3.8 48 90.6
_ _ _ Ch,~~~~~~~~~~~~~
'With fiunily interviews.
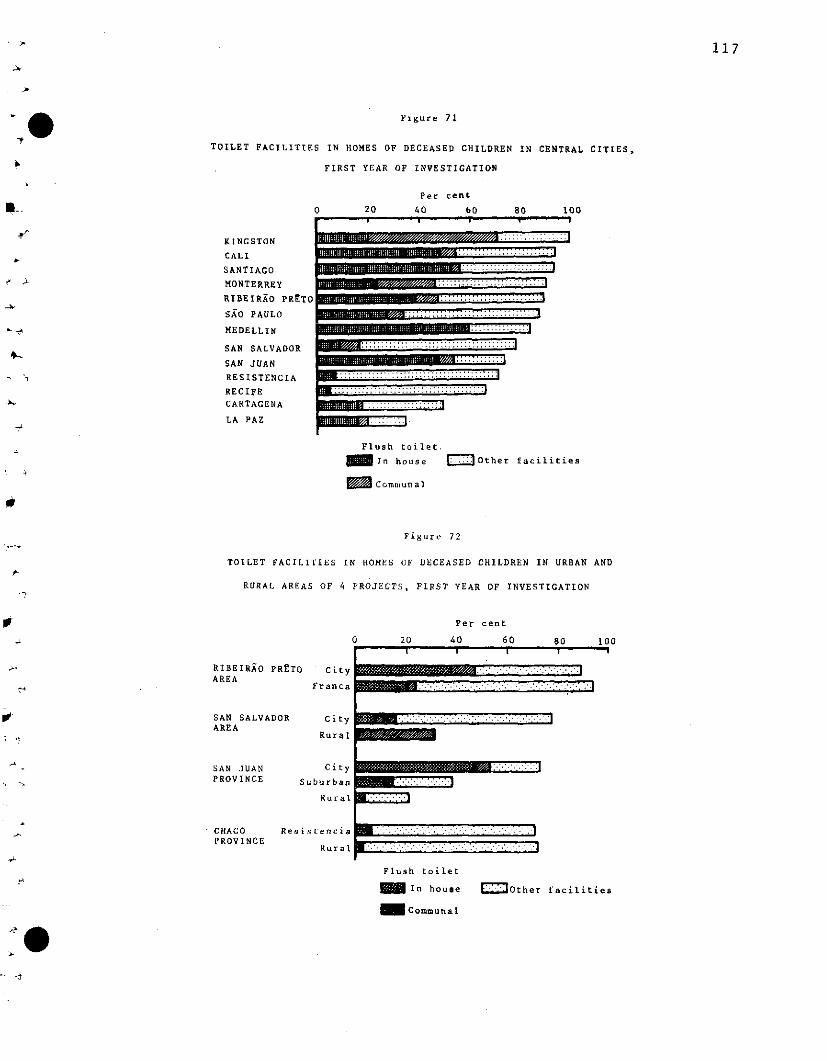
117
Figure 71
TOILET FACILITIES IN HOMES OF DECEASED CHILDREN IN CENTRAL CITIES,
FIRST YEAR OF INVESTIGATION
Per cent
0 20 40 60 80 100
KINGSTON
CALI
SANTIAGO
MONTERREY
RIBEIRÁO PREl
SAO PAULO
MEDELLIN
SAN SALVADOR
SAN JUAN
RESISTENCIA
RECIFECARTAGENA
LA PAZ
CTO
Flush toilet.
I In house M Other facilities
W Communal
Figure 72
TOILET FACILITIES IN itOMES OF DECEASED CHILDREN IN URBAN AND
RURAL AREAS OF 4 PROJECTS, FIRST YEAR OF INVESTIGATION
Per cent
RIBEIRAO PRETO CityAREA
Franca
SAN SALVADORAREA
City
Rural
SAN JUAN CityPROVINCE Suburban
Rural
CHACO ResistenciaPROVINCE
Rural
20 40 60 80 100
~:':';,, :'.'.':';.;.:,':'..1' ~ .. ,:.:,;...:./ ?.~i:.'....:.:. '..:. .. :.-..
m,- _ .-. '. .'. -.- .... z.-'. .1
u-:.- . .
Flush toilet
_ In house 'Other facilities
I Communal
1 -1 1 1
IlirBWillBlf~~i~í~c~7~:::*á4av.,: .. :: ::::: w:::
~1191417vdlpl/~ , 111,1911A ........... .. :
,...-..,.~, m ....................... · ·
~RWW::::::::M::::::::::::
' ' ' � �'· ·:::·:·:·::'-:·'····:·:·:·::·:·::·'·
BBBBBi~kRnSESE~: .as: -BB -, ·:: :
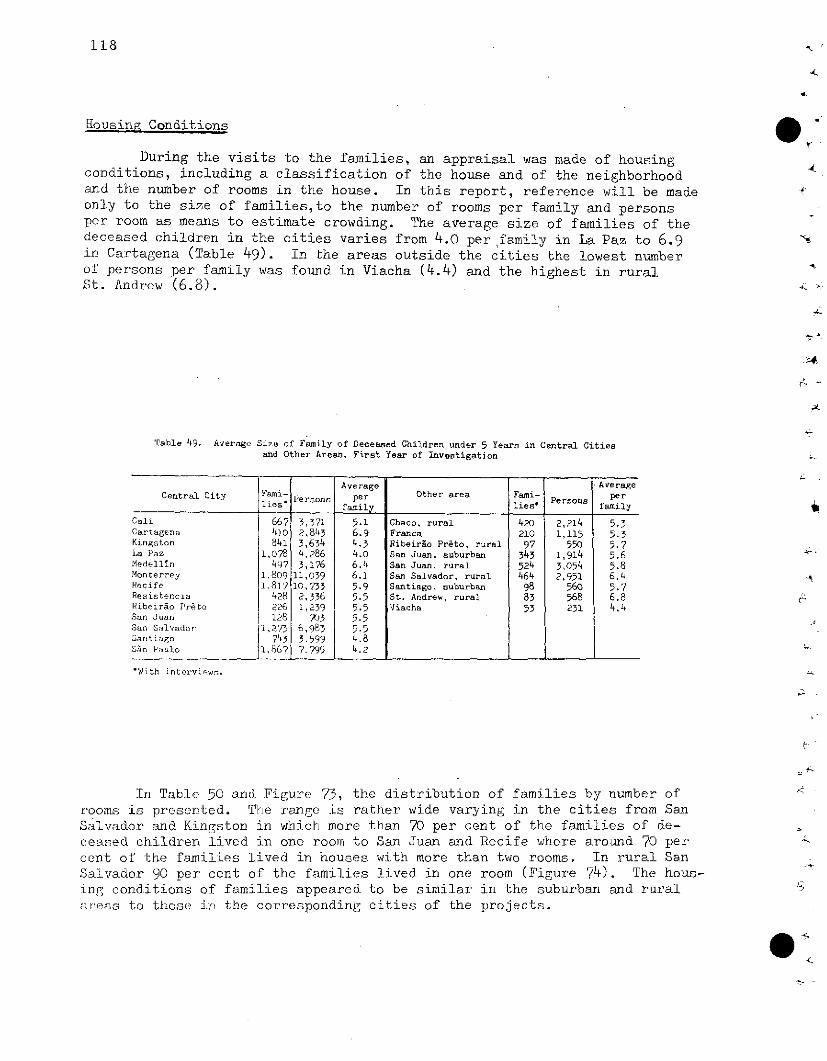
118
Housing Conditions
During the visits to the families, an appraisal was made of housingconditions, including a classification of the house and of the neighborhoodand the number of rooms in the house. In this report, reference will be madeonly to the size of families,to the number of rooms per family and personsper room as means to estimate crowding. The average size of families of thedeceased children in the cities varies from 4.0 per family in La Paz to 6.9in Cartagena (Table 49). In the areas outside the cities the lowest numberof persons per family was found in Viacha (4.4) and the highest in ruralSt. Andrew (6.8).
4..
Table 49. Average Size of Family of Deceased Children under 5 Years in Central Citiesand Other Areas, First Year of Investigation
Average AverageCentral City Fami- er Other area Fam- per
lies Person per Personslies_ family liesg Persons family
Cali 667 3,371 5.1 Chaco, rural 420 2,214 5.3Cartagena 410 2,843 6.9 Franca 210 1,115 5.3Kingston 841 3,634 4.3 Ribeirao Preto, rural 97 550 5.7La Paz 1,078 4,286 4.0 San Juan, suburban 343 1,914 5.6Medellín 497 3,176 6.4 San Juan, rural 524 3,054 5.8Monterrey 1,809 11,039 6.1 San Salvador, rural 464 2,951 6.4Recife 1,817 10,733 5.9 Santiago, suburban 98 560 5.7Resistencia 428 2,336 5.5 St. Andrew, rural 83 568 6.8Ribeirao Preto 226 1,239 5.5 Viacha 53 231 4.4San Juan 128 703 5.5San Salvador i,2'3 6,983 5.5Santiago 743 3.599 4.8Sao Paulo 1,
867 7.795 4.2
'With interview.s.
In Table 50 and Figure 73, the distribution of families by number ofrooms is presented. The range is rather wide varying in the cities from SanSalvador and Kingston in which more than 70 per cent of the families of de-ceased children lived in one room to San Juan and Recife where around 70 percent of the families lived in houses with more than two rooms. In rural SanSalvador 90 per cent of the families lived in one room (Figure 74). The hous-ing conditions of families appeared to be similar in the suburban and ruralareas to those in the corresponding cities of the projects.
4.
,-
1,
. ,
Y
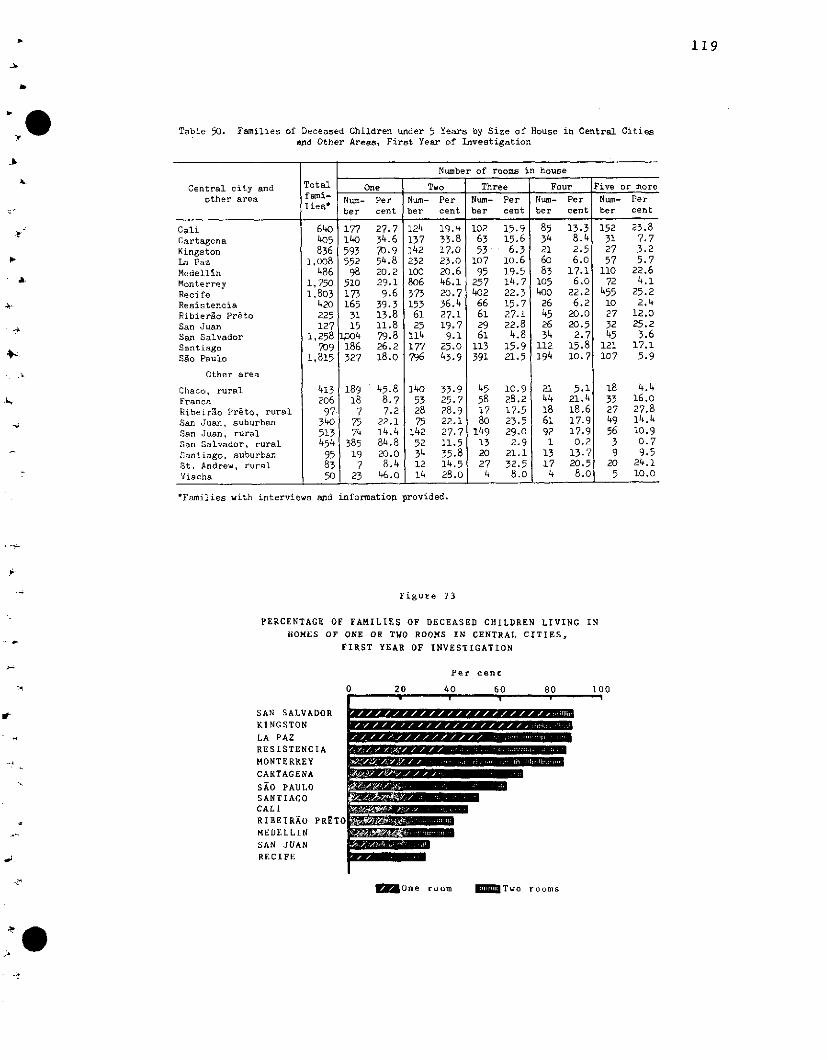
119
Table 50. Families of Deceased Children under 5 Years by Size of House in Central Citiesand Other Areas, First Year of Investigation
Number of rooms in house
Central city and Total One Two Three Four Five or moreother area fami- Per Numum- Per
ber cent ber cent ber cent ber cent ber cent
Cali 640 177 27.7 124 19.4 102 15.9 85 13.3 152 23.8Cartagena 405 140 34.6 137 33.8 63 15.6 34 8.4 31 7.7Kingston 836 593 70.9 142 17.0 53 6.3 21 2-5 27 3.2La Paz 1,008 552 54.8 232 23.0 107 10.6 60 6.0 57 5.7Medellin 486 98 20.2 100 20.6 95 19.5 83 17.1 llo 22.6Monterrey 1,750 510 29.1 806 46.1 257 14.7 105 6.0 72 4.1Recife 1,803 173 9.6 373 20.7 402 22.3 400 22.2 455 25.2Resistencia 420 165 39.3 153 36.4 66 15.7 26 6.2 10 2.4Ribierao Preto 225 31 13.8 61 27.1 61 27.1 45 20.0 27 12.0San Juan 127 15 11.8 25 19.7 29 22.8 26 20.5 32 25.2San Salvador 1,258 O4 79.8 114 9.1 61 4.8 34 2.7 45 3.6Santiago 709 186 26.2 177 25.0 113 15.9 112 15.8 121 17.1Sao Paulo 1,815 327 18.o 796 43.9 391 21.5 194 10.7 107 5.9
Other area
Chaco, rural 413 189 45.8 140 33.9 45 10.9 21 5.1 18 4.4Franca 206 18 8.7 53 25.7 58 28.2 44 21.4 33 16.0Ribeirao Preto, rural 97 7 7.2 28 28.9 17 17.5 18 18.6 27 27.8San Juan, suburban 340 75 22.1 75 22.1 80 23.5 61 17.9 49 14.4San Juan, rural 513 74 14.4 142 27.7 149 29.0 92 17.9 56 10.9San Salvador, rural 454 385 84.8 52 11.5 13 2.9 1 0.2 3 0.7Santiago. suburban 95 19 20.0 34 35.8 20 21.1 13 13.7 9 9.5St. Andrew, rural 83 7 8.4 12 14.5 27 32.5 17 20.5 20 24.1Viacha 50 23 46.0 14 28.0 4 8.0 4 8.0 5 1o.o
'Families with interviews and information provided.
Figure 73
PERCENTAGE OF FAMILIES OF DECEASED CHILDREN LIVING IN
HOMES OF ONE OR TWO ROOMS IN CENTRAL CITIES,
FIRST YEAR OF INVESTIGATION
Per cent
SAN SALVADORKINGSTONLA PAZRESISTENCIAMONTERREYCARTAGENA
SAO PAULOSANTIAGOCALIRIBEIRAO PRETOMEDELLINSAN JUANRECIFE
1 20 40 60 80 100
o--c_ r 7 __
_' ~ -xmmmmmmm ~
_a .mm~ma, ~mmmmmd · ....
~ One room _ Two rooms
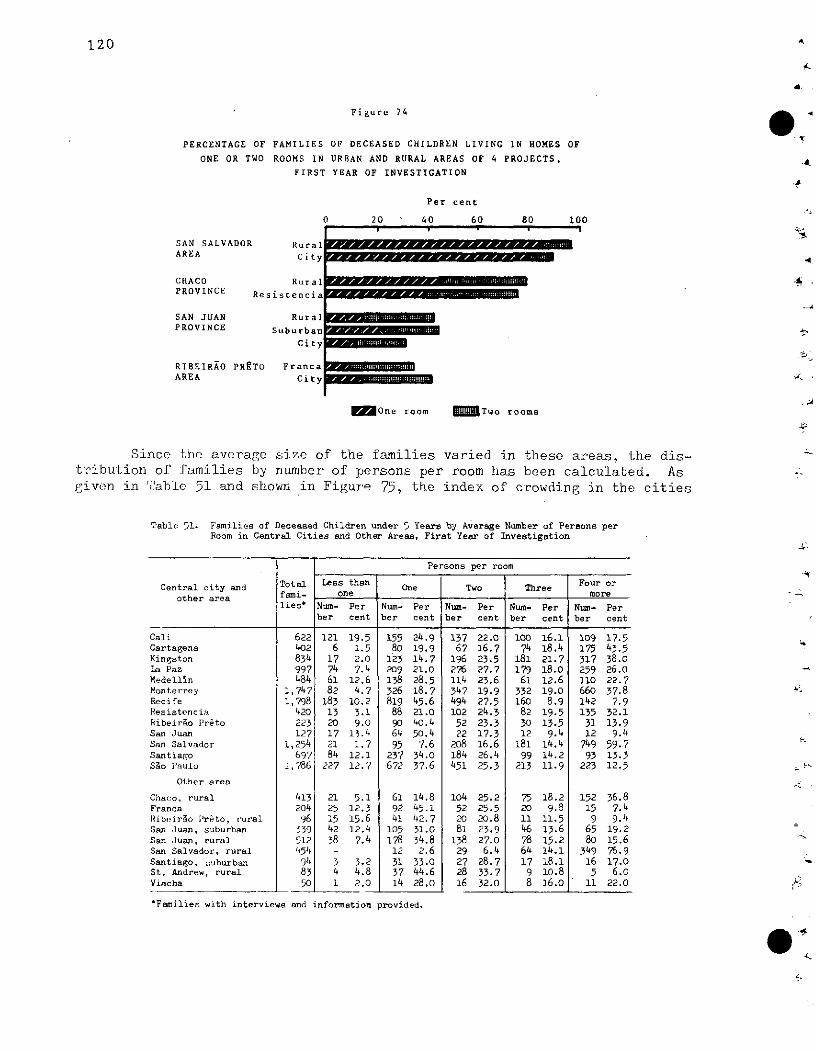
120
Figure 74
PERCENTAGE OF FAMILIES OF DECEASED CHILDREN LIVING IN HOMES OF
ONE OR TWO ROOMS IN URBAN AND RURAL AREAS OF 4 PROJECTS,FIRST YEAR OF INVESTIGATION
Per cent
0 20 40 60 80 100
SAN SALVADOR RuralAREA City
CHACO RuraPROVINCE Resistencia
SAN JUAN RuralPROVINCE Suburbar
City
RIBEIRAO PRETO FrancaAREA City
MOne room =Two rooms
Since the average size of the families varied in these areas, the dis-tribution of families by number of persons per room has been calculated. Asgiven in Table 51 and shown in Figure 75, the index of crowding in the cities
Table 51. Families of Deceased Children under 5 Yeare by Average Number of Persona perRoom in Central Cities and Other Areas, Firat Year of Investigation
Persons per room
Central city and Total Less than One Two Three Four orother area fami- one more
lies' Num- Per Num- Per Num- Per Num- Per Num- Perber cent ber cent ber cent ber cent ber cent
Cali 622 121 19.5 155 24.9 137 22.0 100 16.1 109 17.5Cartagena 402 6 1.5 80 19.9 67 16.7 74 18.4 175 43.5Kingston 834 17 2.0 123 14.7 196 23.5 181 21.7 317 38.0La Paz 997 74 7.4 209 21.0 276 27.7 179 18.0 259 26.0Medellin 484 61 12.6 138 28.5 114 23.6 61 12.6 110 22.7Monterrey 1,747 82 4.7 326 18.7 347 19.9 332 19.0 660 37.8 ~-Recife 1,798 183 10.2 819 45.6 494 27.5 160 8.9 142 7.9Resistencia 420 13 3.1 88 21.0 102 24.3 82 19.5 135 32.1Ribeirao Préto 223 20 9.0 90 40.4 52 23.3 30 13.5 31 13.9San Juan 127 17 13.4 64 50.4 22 17.3 12 9.4 12 9.4San Salvador 1,254 21 1.7 95 7.6 208 16.6 181 14.4 749 59.7Santiago 697 84 12.1 237 34.0 184 26.4 99 14.2 93 13.3Sao Paulo 1.786 227 12.7 672 37.6 451 25.3 213 11.9 223 12.5
Other area
Chaco, rural 413 21 5.1 61 14.8 104 25.2 75 18.2 152 36.8Franca 204 25 12.3 92 45.1 52 25.5 20 9.8 15 7.4Ribeirgo Preto, rural 96 15 15.6 41 42.7 20 20.8 11 11.5 9 9.4San Juan, suburban 339 42 12.4 105 31.0 81 23.9 46 13.6 65 19.2San Juan, rural 512 38 7.4 178 34.8 138 27.0 78 15.2 80 15.6San Salvador, rural 454 - 12 2.6 29 6.4 64 14.1 349 76.9Santiago, suburban 94 3 3.2 31 33.0 27 28.7 17 18.1 16 17.0St. Andrew, rural 83 4 4.8 37 44.6 28 33.7 9 10.8 5 6.0Viacha 50 1 2.0 14 28.0 16 32.0 8 16.0 11 22.0
*Families with interviews and information provided.
$ ,
Illlllll�nsrmni�·11111��
1
9~
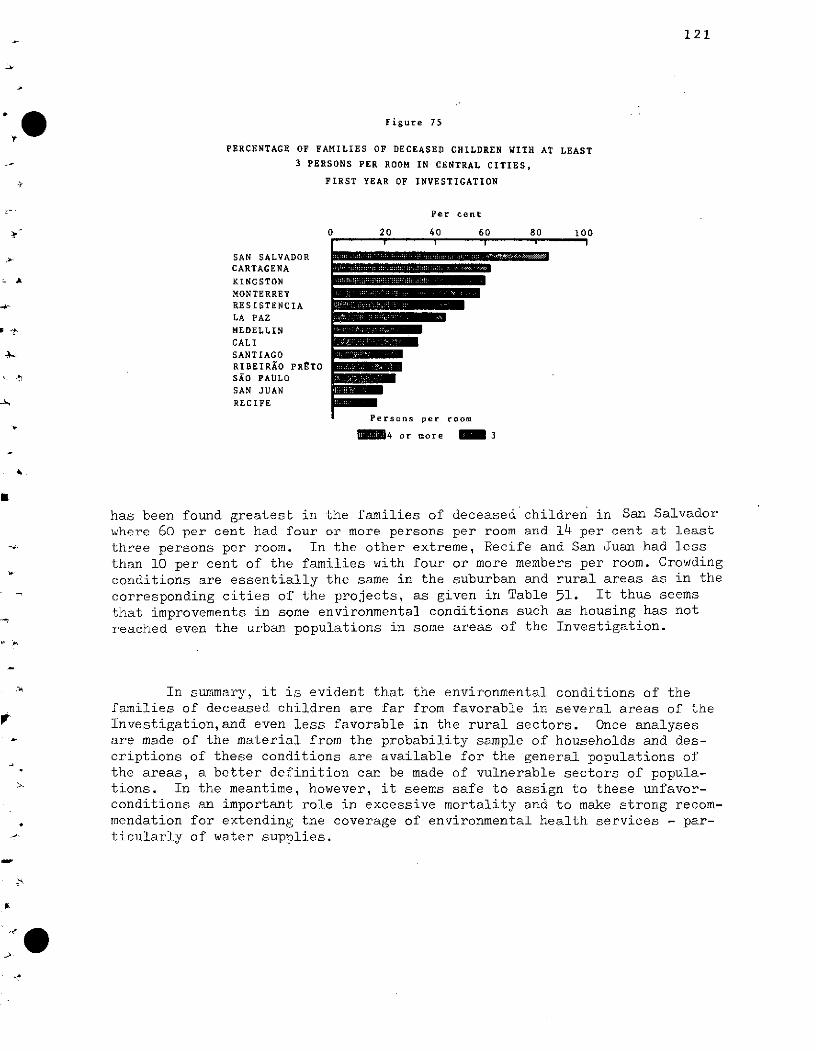
121
Figure 75
PERCENTAGE OF FAMILIES OF DECEASED CHILDREN WITH AT LEAST
3 PERSONS PER ROOM IN CENTRAL CITIES,
FIRST YEAR OF INVESTIGATION
Per cent
0 20 40 60 80 100
SAN SALVADORCARTAGENA
KINGSTONMONTERREYRESISTENCIALA PAZ
MEDELLINCALI
SANTIAGORIBEIRAO PRETOSAO PAULOSAN JUAN
RECIFE
Persons per room
~ 4 or more ~ 3
has been found greatest in the families of deceased children in San Salvadorwhere 60 per cent had four or more persons per room and 14 per cent at leastthree persons per room. In the other extreme, Recife and San Juan had lessthan 10 per cent of the families with four or more members per room. Crowdingconditions are essentially the same in the suburban and rural areas as in thecorresponding cities of the projects, as given in Table 51. It thus seemsthat improvements in some environmental conditions such as housing has notreached even the urban populations in some areas of the Investigation.
In summary, it is evident that the environmental conditions of thefamilies of deceased children are far from favorable in several areas of theInvestigation,and even less favorable in the rural sectors. Once analysesare made of the material from the probability sample of households and des-criptions of these conditions are available for the general populations ofthe areas, a better definition can be made of vulnerable sectors of popula-tions. In the meantime, however, it seems safe to assign to these unfavor-conditions an important role in excessive mortality and to make strong recom-mendation for extending the coverage of environmental health services - par-ticularly of water supplies.

123
VII. UTILIZATION OF RESULTS
An important objective of the Investigation is full utilization of thefindings for local, national and international actions. Although the pro-jects were conducted in specific areas, certain results serve also for indica-tion of problems in other areas of the countries and for neighboring regions.Serious problems revealed, such as nutritional deficiency, deserve additionalstudies for measurement and actions at the local level. There are severalimportant fields for action.
First, Integrated Maternal and Child Health Programs. The comprehen-
sive study of mortality in childhood, taking into account the multiple causes
of death and the determination of contributing factors, provides measurementof the major problems in child health. This knowledge should be utilized in
planning activities for improvement of the health of mother and child.
Throughout this report, the interrelationships of diseases and condi-
tions such as immaturity, nutritional deficiency and infectious diseases havebeen analyzed. The availability and use of adequate food supplies by mothers
and their children is probably the most important factor to be stressed for
the prevention of mortality. Several factors have been analyzed such as breast
feeding, prenatal care, vaccinations and provision of water supplies which
indicate the need for actions in these specific fields.
From the preliminary analysis of the information obtained during the
first year of data collection, it seems evident that in several areas and pos-
sibly in several countries the health problems are serious. Indeed there
seems to exist an unavailability and/or subutilization of basic health serv-ices, such as prenatal care, hospital services for delivery, and prophylactichealth services against childhood diseases and nutritional deficiency.
The magnitude of these deficiencies is increased by the reciprocal
actions of unfavorable factors prevalent in these areas. Such is the case
in the low level of education in general, the inadequate environmental sanita-
tion, especially in relation to water supplies and housing conditions. All
these and other adverse factora result in excessive biological wastage.
The solution to the complex health problems of mother and child re-
quires comprehensive and coordinated actions within a multisectorial and
multidisciplinary approach. For example, immunization programs against an
infectious disease as measles will succeed in the prevention of measles, but
without improvement of the nutritional state, the susceptible child will
probably continue to be at risk of death from another infectious disease.
Without provision of water for the family, the risk of spread of diarrheal
diseases continues. Thus, an attack on these problems simultaneously is
strongly recommended.
124
Second, Research and Teaching. Community centered research in health -problems is an ideal method for faculties of medicine and public health toobtain knowledge of local conditions and to teach from their findings andexperiences locally. The patterns of mortality in infancy and childhood varywidely and only through knowledge of the specific problems can actions betaken. Problems have been revealed in the Investigation that can be solvedby the leadership of health authorities and faculties of such schools. Thisprogram is only a beginning, involving 14 schools of medicine or public health.Greater participation in research by such faculties in the Americas will haveimmeasurable benefits.
In the area of education, the material collected locally should be usedfor teaching in schools of medicine and public health and in the schools ofother health sciences. Seminars, analyses and discussions of specific phasesof the Investigation as well as studies of local problems with field work bystudents would contribute to understanding the role of community centered re-search and the actions required for solution of problems. The analyses couldserve in the orientation, in the methology of teaching and in the content ofcurricula, principally in the fields of maternal and child health, epidemiology,social medicine and statistics. The development of important disciplines, suchas pathology in general and pediatric pathology in particular, is highly recom-mended in order that the standard of teaching and practice in the disciplinesrelated to maternal and child health be elevated.
Operational research in the delivery of health services is urgentlyneeded. Once the serious health problems are measured and the related fac-tors described, practical solutions within the context of the resources avail-able should be found and applied.
The improvement of nutritional status and prevention of infectious dis-eases deserve the highest priority for operation research leading to develop-ment of practical procedures adaptable to local needs and characteristics ofareas.
Epidemiological studies of the longitudinal type in human reproductiontaking into account biological, social and environmental factors are highlyrecommended in order to understand the differences in patterns of vital wast-age. This knowledge is essential for sound programs oriented to attainingoptimal reproduction and health of the product of conception.
Third, Vital Statistics. Difficulties encountered in the conduct ofthe research program have indicated the importance of the improvement of vitaland hospital statistics. Procedures are needed for the immediate registrationof each birth and each death at the time of occurrence of these events. Sincehigh proportions of births and deaths occur in hospitals, these events shouldbe registered in the same institution. In several countries, procedures havebeen modernized so that the data obtained on admission to the hospital of awoman for delivery are recorded and used on the birth certificate. Theinfant's birth weight as well as other pertinent data on the conditions atbirth can be added to that document. Likewise, if death occurs, the deathcertificate should be completed before the body is released for burial.
*$
125
The hospital records completed by physicians and other attending staffin the hospital are the best source of data for the facts regarding the infantor child as well as for the multiple causes of death. The development, im-provement and surveillance of these records in each hospital is mandatory inorder to attain quality in vital statistics.
The international standards and definitions of WHO should be followedin all countries. Without registration of each death of a liveborn infantand of each birth, comparability is impossible in respect to infant mortality,mortality from all causes and life expectancy. Measurement on progress towardthe goals of the Charter of Punta del Este is hampered by lack of quality inthe basic vital statistics data.
In the field of natality and fertility as in mortality, basic informa-tion regarding each live birth is essential. The Investigation has revealedunusually low birth weights in neonatal deaths in several areas and distinctlydifferent patterns of birth order and age of mothers of infant deaths. Thehigh altitude area of the study, La Paz, has intriguing differences whichwarrant further studies of human reproduction.
The study of mortality should be broadened from the use of the under-lying cause only to inclusion of the associated causes of death. Because ofclassification procedures in the past, infectious diseases have been givenpreference as underlying causes and the role of nutritional deficiency as animportant contributor to mortality has been ignored. Thus, improvementsin the analysis of vital statistics data as well as in the systems of collec-tion of data are essential especially for knowledge of the health problems ofinfants and young children.
Fourth, Hospital Statistics. Hospital directors and administrators aswell as the clinical staff have an important role in the improvement of clin-ical data and administrative procedures related to infants and young children.Records should be completed routinely with the facts regarding the birth, thetime (hour and day), the condition of the child, its birth weight, etc. Aclear distinction is necessary between those born alive and those born deadin accordance with the WHO definition*
If death of the infant occurs, the exact time, hour and day as well asthe age and the multiple causes of death should be clearly stated. For im-provement of procedures and reduction of mortality, a summary of these vitalevents is recommended with daily, weekly, monthly and annual reports. Thedirector of the hospital needs to know currently the results of deliveries,the size of perinatal mortality as well as mortality by causes and age.
*"Live birth is the complete expulsion or extraction from its mother of aproduct of conception, irrespective of the duration of the pregnancy, which,after such separation, breathes or shows any other evidence of life, suchas beating of the heart, pulsation of the umbilical cord, or definite move-ment of voluntary muscles, whether or not the umbilical cord has been cutor the glacenta is attached; each product of such a birth is considered liveborn.'( )
126
All staff in hospitals, including administrative, professional andauxiliary personnel, should participate in cooperative efforts to introduceand follow standard definitions and procedures in the recording and handlingof basic information. For instance, only through coordinated activity ofobstetricians, pediatricians, pathologists, nurses and midwives can complete ~information be obtained on perinatal, neonatal and even infant morbidity andmortality for understanding the problems and for application of sound preven-tive measures.
Fifth, Environmental Health. The provision of piped water to homeshas an important relationship to mortality. The data presented for the cen-tral cities show wide variations in the provision of piped water. The deathrates in childhood are usually higher in rural areas than in the cities and 4water supplies in the rural areas are available for much smaller proportions 4
of the population. Thus, provision of water supplies for rural as well asurban areas, that is for all sectors of the population, is an important com-ponent of a program for reduction of mortality in infancy and childhood. 4.
Sixth, Other Actions. A meeting of the principal collaborators isscheduled in January 1972 in which the findings in the first year will be tsubject to critical review in order that the final reports may be as completeand useful as possible. For example, if unregistered deaths which are missingcan be found, they should be included in the final report. The live birthsused as bases for the rates and estimated populations under 5 years of age aresubject to revision after census data and data on live births in the periodbecome available. Also, the experience of the principal collaborators in thefield work and in the analysis and interpretation of data will be translatedinto progressive development of activities leading to solution of problems,education in health sciences and community centered research.
Specific objectives for the meeting of principal collaborators includethe following:
1. Recommendations for local and national actions for registrationof births and deathswith special attention to those in hospitals,for establishment of registration offices in hospitals and forcurrent hospital reports.
2. Review of results of analyses of multiple causes of death anddevelopment of plans for their use for improvement of maternaland child health programs with special attention to the incorpo-ration of nutritional aspects.
3. Plans for use of the material in teaching in schools of publichealth and medicine, not only in those participating in theInvestigation, but in all schools in Latin America.
4. Development of procedures whereby local and national health author-ities may take full advantage of the results of the Investigationfor future actions especially in planning.
*,
127
5. Development of operational research for determining methods ofpreventing nutritional deficiency and for further studies of
community health problems revealed by the Investigation.
The main purpose of this progress report which presents the provisionalresults of the first year of the Investigation is to promote actions leadingto the solution of the problems revealed. More comprehensive analyses willbe made of all the material collected on deaths for the two-year period and
on the probability sample of households for the two years of the Investigation.In the meantime, however, these findings can be utilized for development ofindicated actions, and by doing so reducing mortality, and above all improvinghealth conditions.

129
REFERENCES
(1) Puffer, R. R. and Griffith, G. W.: Patterns of Urban Mortality, Pan AmericanHealth Organization,Scientific Publication No. 151, 1967.
(2) Pan American Union: Alliance for Progress, Washington, D. C. OEA/Ser. H/XII.l.
Rev. 2, 1961, p.31.
(3) Puffer, R. R.: Initial Phases of the IntercAmerican Investigation of Morta-lity in Childhood, English Edition of Boletín de la Oficina Sanitaria Pana-mericana, 196 8.
(4) Shapiro, S., Schlesinger, E. R. and Nesbitt, R. E. L., Jr.: Infant, Perinatal,
Maternal and Childhood Mortality in the United States, Harvard UniversityPress, Cambridge, Mass., 1960, pp 6-9.
(5) Use of Samples of Households and Other Measures to Check Completeness ofVital Statistics. Consultation on Fetal,Infant and Childhood Mortality,WHO, Geneva, Switzerland, 1971.
(6) International Classification of Diseases, World Health Organization, Geneva,1967, page 469.
(7) Ministerio de Salud Púablica y Asistencia Social, El Salvador, Boletín No. 3,1970, p.3.
(8) International Classification of Diseases, 1965 Revision, WHO, Geneva, 1967,
pages 417-436.
(9) Serrano, C. V. Study of MultiDle Causes of Death in the Inter-American In-vestigation of Mortality in Childhood. Document prepared for Consultationon Multiple Cause Analysis, WHO, Geneva 1969.
(10) International Classification of Diseasesg 1955 Revision, WHO Geneva, 1957.
(11) Weight at Birth and Survival of the Newborn, United States, Early 1950.PHS Pub. No. 1000, Series 21, No. 3, National Center for Health Statistics,Dept. of Health, Education, and Welfare, Washington, 1965.
(12) Final Report and Speeches of the Special Meeting of the Ministers of Healthof the Americas. Official Document PAHO No. 89, 1969.
(13) Health Conditions in the Americas, Pan American Health Organization,ScientificPublication No. 207, 1970.
(14) Gómez, F., Galván, R. R., Cravioto, J. and Frank, S. "Malnutrition inInfancy and Childhood with Special Reference to Kwashiorkor (1955)." In
Levine, S. (ed.), Advances in Pediatrics,New York, Year Book Publishers,Vol. 7, p. 131
· · (15) Ramos-Galván, R., Cravioto, J. and Navarrete, A. "La letalidad en el niño* desnutrido,"México City, Boletin Médico del Hospital Infantil, 1958, p. 875
130
(16) Nelson, W. E. Textbook of Pediatrics, Philadelphia, W. B. Saunders Co.,1959, 1462 pp. (Pages 50-57 contain data on weights from Studies of ChildHealth and Development, Department of Maternal and Child Health, HarvardSchool of Public Health.).
(17) Nutritional Aspects of the InvestigationsReport of Internal Meeting, 16-18 .March 1970, Pan American Health Organization-
(18) Richards, M. R., Congenital Malformations of the Cardiovascular System ina Series of 6053 Infants. Pediatriis,,Vol. 55: 12-32, 1955.
(19) Moriyama, I., fCueger, D. E. and Stamler,/.J.: Cardiovascular Diseases in ithe United States. Vital and Health Statistics Monographs, AmericanPublic Health Association, Harvard University Press, Cambridge, Mass.,1971, page 263
(20) Marino, A.: Family, Fertility and Sex Ratios in the British Caribbean,Population Studies, Vol. 24, No. 2, July 1970
(21) Memoria Anual, 1969, V Zona, Servicio Nacional de Salud, Santiago, Chile
.1
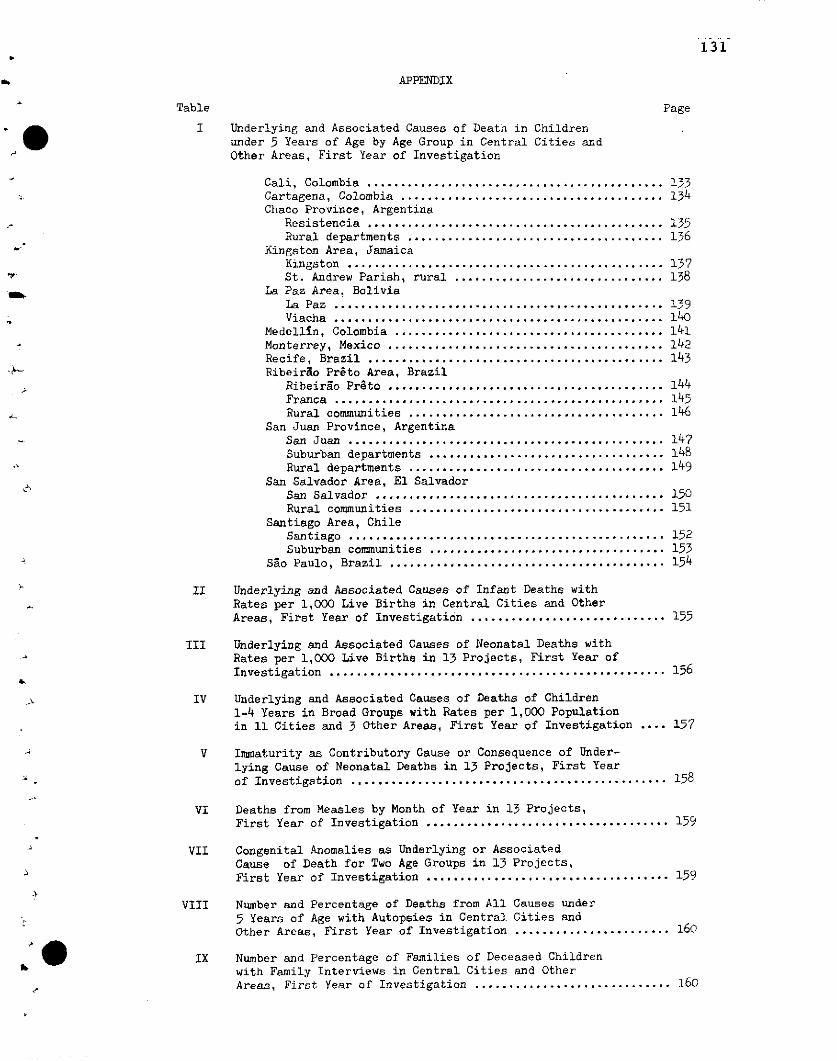
131
APPENDIX
Table Page
I Underlying and Associated Causes of Death in Childrenunder 5 Years of Age by Age Group in Central Cities andOther Areas, First Year of Investigation
Cali, Colombia ............................. 1.............. 133Cartagena, Colombia ....................................... 134Chaco Province, Argentina
Resistencia ............................................ 135Rural departments ...................................... 136
Kingston Area, JamaicaKingston ............................................... 137St. Andrew Parish, rural ............................... 138
La Paz Area, BoliviaLa Paz ................................................. 139Viacha ................................................. 140
Medellin, Colombia ........................................ 141Monterrey, Mexico ......................................... 142Recife, Brazil ............................................ 143Ribeirao Preto Area, Brazil
Ribeirao Pr8to ......................................... 144Franca ................................................. 145Rural communities ...................................... 146
San Juan Province, ArgentinaSan Juan ............................................... 147Suburban departments ................................... 148Rural departments ...................... ................ 149
San Salvador Area, El SalvadorSan Salvador ...................................... 150Rural communities ...................................... 151
Santiago Area, ChileSantiago ............................................... 152Suburban communities ............................. 1.... 153
Sao Paulo, Brazil ......................................... 154
II Underlying and Associated Causes of Infant Deaths withRates per 1,000 Live Births in Central Cities and OtherAreas, First Year of Investigation ............................. 155
III Underlying and Associated Causes of Neonatal Deaths withRates per 1,000 Live Births in 13 Projects, First Year ofInvestigation ........................................... 156
IV Underlying and Associated Causes of Deaths of Children1-4 Years in Broad Groups with Rates per 1,000 Populationin 11 Cities and 3 Other Areas, First Year of Investigation .... 157
V Immaturity as Contributory Cause or Consequence of Under-lying Cause of Neonatal Deaths in 13 Projects, First Yearof Investigation ............................................... 158
VI Deaths from Measles by Month of Year in 13 Projects,First Year of Investigation .............................. ...... 159
VII Congenital Anomalies as Underlying or AssociatedCause of Death for Two Age Groups in 13 Projects,First Year of Investigation .............................. ...... 159
VIII Number and Percentage of Deaths from All Causes under5 Years of Age with Autopsies in Central Cities andOther Areas, First Year of Investigation .................. ..... 160
IX Number and Percentage of Families of Deceased Childrenwith Family Interviews in Central Cities and OtherAreas, First Year of Investigation ............................. 160

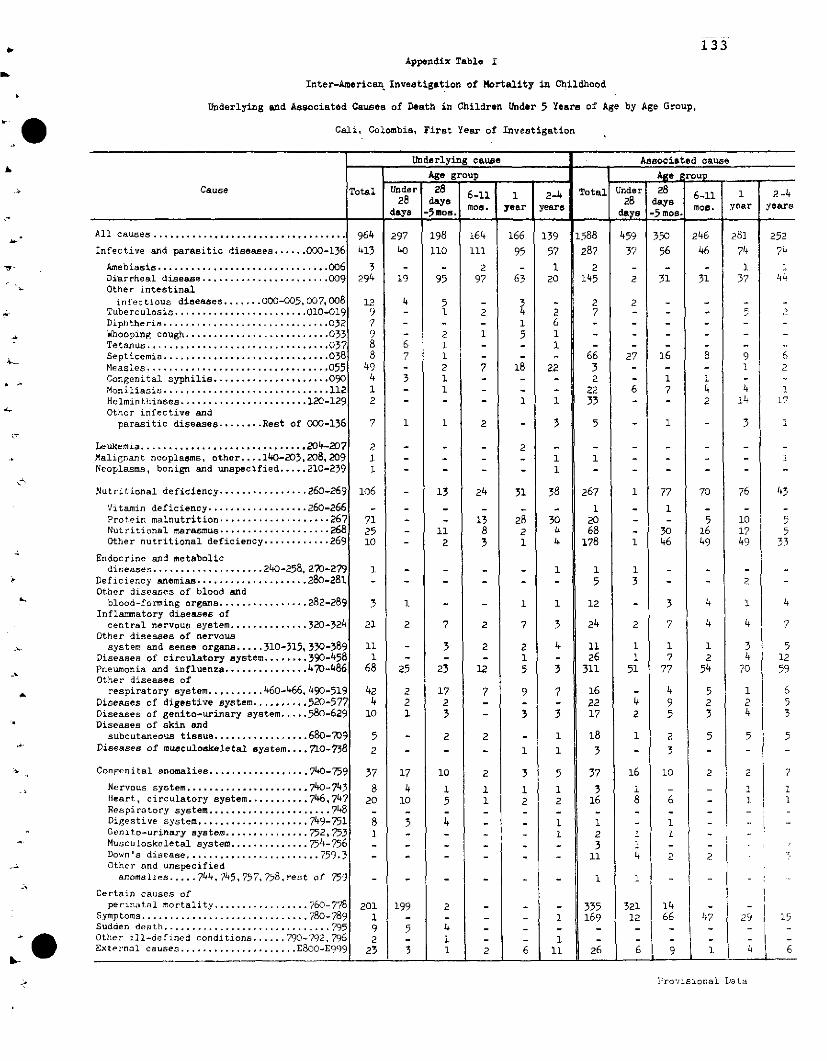
133Appendix Table I
Inter-American Investigation of Mortality in Childhood
Underlying and Associated Causes of Death in Children Under 5 Years of Age by Age Group,
Cali, Colombia, First Year of Investigation
Underlying cause Associated causeAge group Age ro
Cause Total 28 nder 1 2 -4 Total Under 28 i 1 2-428 dadaya 28 day.
days - . .1 . yeay yfas mos. year yearsd~~.ys I-5mos.~day -5
All causes ................................... 964 297 198 164 166 139 1588 459 350 246 281 252
Infective and parasitic diseases ...... 000-136 413 40 110 111 95 57 287 37 56 46 74 74
Amebiasis ............................... 006 3 - - 2 - 1 2 - - - 3 1Diarrheal disease ...................... 0. 09 294 19 95 97 63 20 145 2 31 31 37 44Other intestinal
infectious diseases ....... 000-005,007,008 12 4 5 - 2 2 - -Tuberculosis ....................... 0. 10-019 9 - 1 2 2 7 5 2Diphtheria .............................. 032 7 _- _ _ 1 6 . .Whooping cough .......................... 033 9 - 2 1 5 1 - - - - -Tetanus ................................. 037 8 6 1 - - 1 -Septicemia .............................. 038 8 7 1 - - - 66 27 16 8 9 6Measles ................................ 055 49 - 2 7 18 22 3 - - 1 2Congenital syphilis ..................... 090 4 3 1 - - - 2 - 1 1Moniliasis .............................. 112 1 - 1 - - - 22 6 7 4 4 1Helminthiases ....................... 120-129 2 - - - 1 1 33 - - 2 14 17Other infective andparasitic diseases ........ Rest of 000-136 7 1 1 2 - 3 5 - 1 - 3 1
Leukemia .............................. 204-207 2 - - - 2 - - - - -Malignant neoplasms, other .... 140-203,20
8, 209 1 - - - - 1 1 - - - - 1
Neoplasms, benign and unspecified ..... 210-239 1 - - - 1 - - - - -
Nutritional deficiency ................ 260-269 106 - 13 24 31 38 267 1 77 70 76 43
Vitamin deficiency .................. 260-266 - - - - - - 1 - i - - -Protein malnutrition .................... 267 71 - - 13 28 30 20 - - 5 10 5Nutritional marasmus ................... 268 25 - 11 8 2 4 68 - 30 16 17 5Other nutritional deficiency ............ 269 10 - 2 3 1 4 178 1 46 49 49 33
Endocrine and metabolicdiseases .................... 240-258, 270-279 - - - 1 1 1 - - - -
Deficiency anemias .................... 280-281 - - - - - - 5 3 - - 2 -Other diseases of blood andblood-forming organe ................ 282-289 3 1 - - 1 1 12 - 3 4 1 4
Inflammatory diseases ofcentral nervous system .............. 320-324 21 2 7 2 7 3 24 2 7 4 4 7
Other diseases of nervoussystem and sense organs ..... 310-315, 330-389 11 - 3 2 2 4 11 1 1 1 3 5
Diseases of circulatory system ........ 390-458 1 - - - 1 - 26 1 7 2 4 12Pneumonia and influenza ............... 470-486 68 25 23 12 5 3 311 51 77 54 70 59Other diseases of
respiratory system .......... 460-466, 490-519 42 2 17 7 9 7 16 - 4 5 1 6Diseases of digestive system .......... 520-577 4 2 2 - - - 22 4 9 2 2 5Diseases of genito-urinary system ..... 580-629 10 1 3 - 3 3 17 2 5 3 4 3Diseases of skin and
subcutaneous tissue ................. 680-709 5 - 2 2 - 1 18 1 2 5 5 5Diseases of musculoskeletal system .... 710-738 2 _ - - 1 1 3 - 3 -
Congenital anomalies .................. 740-759 37 17 10 2 3 5 37 16 10 2 2 7
Nervous system ...................... 740-743 8 4 1 1 1 1 3 1 - - 1 1Heart, circulatory system ........... 746,747 20 10 5 1 2 2 16 8 6 - 1 1Respiratory system ...................... 748 ....Digestive system .................... 749-751 8 3 4 - - 1 1 -Genito-urinary system ............... 752, 753 1 - - 1 2 1 1Musculoskeletal system .............. 754-756 - - - - - - 3 1 -
Down's disease ....................... 759.3 - .... - - - - 11 4 2 2Other and unspecified
anomalies ..... 744, 745.757, 758,rest of 759 .... - - 1 1 -
Certain causes ofpeririatal mortality ................. 760-778 201 199 2 - - - 335 321 14
Symptoms .............................. 780-789 1 - - - - 1 169 12 66 147 29 1 15Sudden death .............................. 795 9 5 4Other ill-defined conditions ...... 790-792,796 2 - 1 - 1 - -_External causes ..................... E8O-E99 23 3 1 2 11 26 6 9 1 4 6
Provisional Lata
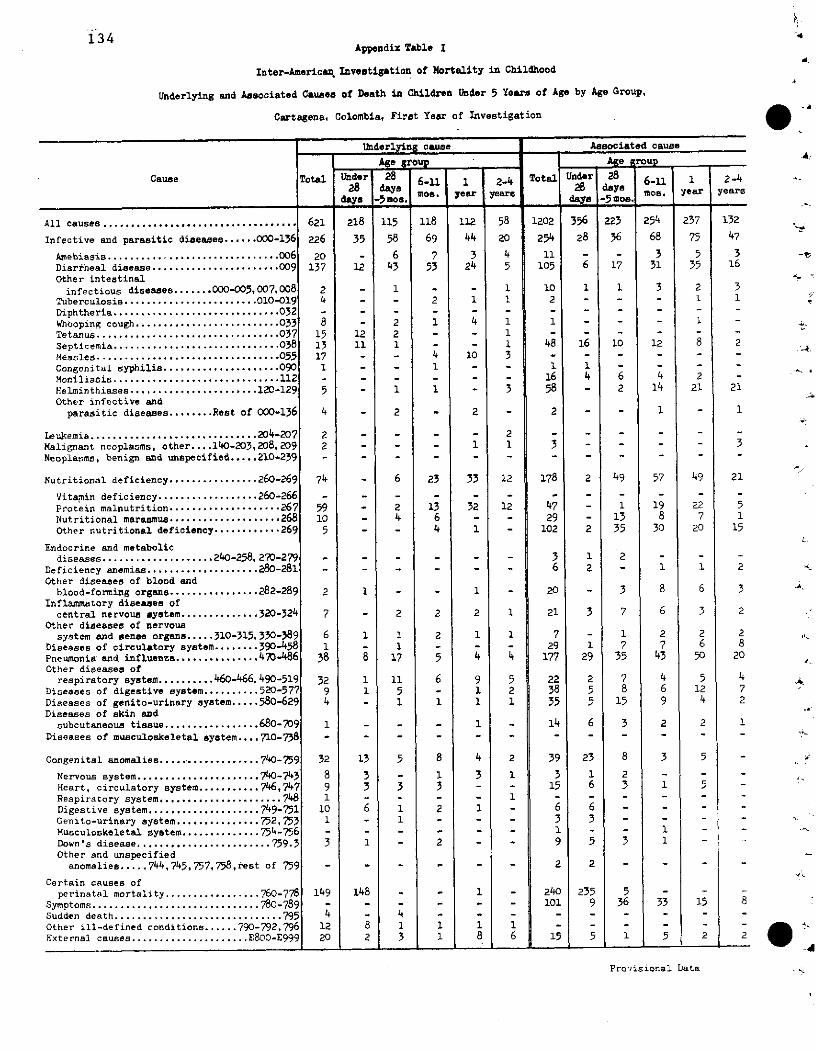
134Appendix Table I
Inter-Americaz, Investigation of Hortality in Childhood
Underlying and Associated Causes of Death in Children Under 5 Yeara of Age by Age Group,
Cartagena, Colombia, Firet Year of Investigation
Underlying cause Aseociated cause
Ag group A Ae IroupCause Total Und1r 28 Und6-1i1 1 2-4 6-u
-- e iayears days year year
All causes ................................... 621 218 115 118 112 58 1202 356 223 254 237 132
Infective and parasitic diseases ...... 000-136 226 35 58 69 44 20 254 28 36 68 75 47
Amebiasis .......... 00.......... ........ 006 20 - 6 7 3 4 11 - - 3 5 3Diarrheal disease ....................... 009 137 12 43 53 24 5 105 6 17 31 35 16Other intestinalinfectious diseases ....... 000-005,007.008 2 - 1 - - 1 10 1 1 3 2 3
Tuberculosis ............... ......... 010-019 4 - - 2 1 1 2 - - - 1 1
Diphtheria .......................... .032 - - - ..... - -
Whooping cough .......................... O33 8 - 2 1 4 1 1 - - - 1
Tetanus .......... 03..... . .......... 037 15 12 2 - - 1 - - - - -
Septicemia ............................ 038 13 11 1 - - 1 48 16 10 12 8 2Measles ..... ............................ 055 1 17 - -4 10 3
Congenital syphilis ..................... 090 1 - - 1 - - 1 1 - - - -
Moniliasis ............ 1................ .. 112 16 4 6 4 2 -Helminthiases .......... 1............ 120-129 5 - 1 1 - 3 58 - 2 14 21 21Other infective and
parasitic diseases ........ Rest of 000-136 4 - 2 - 2 - 2 - - 1 - 1
Leukemia ............................ .. 204-207 2 - - - - 2 - - - - -
Malignant neoplasms, other .... 140-203,208, 209 2 - - - 1 1 3 - - - - 3
Neoplasms, benign and unspecified ..... 210-239 - - - - - - - - - - - -
Nutritional deficiency ................ 260-269 74 - 6 23 33 12 178 2 49 57 49 21
Vitamin deficiency .. ................ 26 0-266Protein malnutrition .................... 267 59 - 2 13 32 12 47 - 1 19 22 5Nutritional marasmus .................... 268 10 - 4 6 - - 29 - 13 8 7 1Other nutritional deficiency ............ 269 5 - - 4 1 - 102 2 35 30 20 15
Endocrine and metabolicdiseases ..... ............... 240-258,270-279 - - - - - - 3 1 2 - - -
Deficiency anemias .................... 280-281 - - - - - - 6 2 - 1 1 2
Other diseases of blood andblood-forming organs ................ 282-289 2 1 - - 1 - 20 - 3 8 6 3
Inflammatory diseases ofcentral nervous system .............. 320-324 7 - 2 2 2 1 21 3 7 6 3 2
Other diseases of nervouasystem and sense organs ..... 310-315,330-389 6 1 1 2 1 1 7 - 1 2 2 2
Diseases of circulatory system ........ 390-458 1 - 1 - - - 29 1 7 7 6 8Pneumonia and influenza ............... 470-486 38 8 17 5 4 4 177 29 35 43 50 20Other diseases ofrespiratory system .......... 460-466, 490-519 32 1 11 6 9 5 22 2 7 4 5 4
Diseases of digestive system .......... 520-577 9 1 5 - 1 2 38 5 8 6 12 7Diseases of genito-urinary system ..... 580-629 4 - 1 1 1 1 35 5 15 9 4 2Diseases of skin andsubcutaneous tiasue ................. 680-709 1 - - - 1 - 14 6 3 2 2 1
Diseases of musculoskeletal system .... 710-738 - - - - - - - - - - - -
Congenital anomalies .................. 740-759 32 13 5 8 4 2 39 23 8 3 5 -
Nervous system ...................... 740-743 8 3 - 1 3 1 3 1 2 - - -Heart, circulatory system ........... 746,747 9 3 3 3 - - 15 6 3 1 5 -
Respiratory system ...................... 748 1 - - - - 1 - - - - -
Digestive system .................... 749-751 10 6 1 2 1 - 6 6 - - - -
Genito-urinary system ............... 752,753 1 - 1 - - - 3 3 - -Musculoskeletal system .............. 754-756 1 1
Down's disease ........................ 759.3 3 1 - 2 - - 9 5 3 1 -
Other and unspecifiedanomalies ..... 744,745,757,758,rest of 759 - .- - - 2 2 - - -_
Certain causes ofperinatal mortality ................. 760-778 149 148 - - 1 - 240 235 5 - -
Symptoms ................... ........... 78-789 - - 101 9 36 33 15 8
Sudden death ................... ........... 79 4Other ill-defined conditiona ...... 790-792,796 12 8 1 1 1 1 - - - - - -
External causes ..................... E800-E999 20 2 3 1 8 6 15 5 1 5 2 2_ _~~~~~~~~~~ 2
Provisional Lata
-Ir
1
-r.
ii
_t_
1
4rs
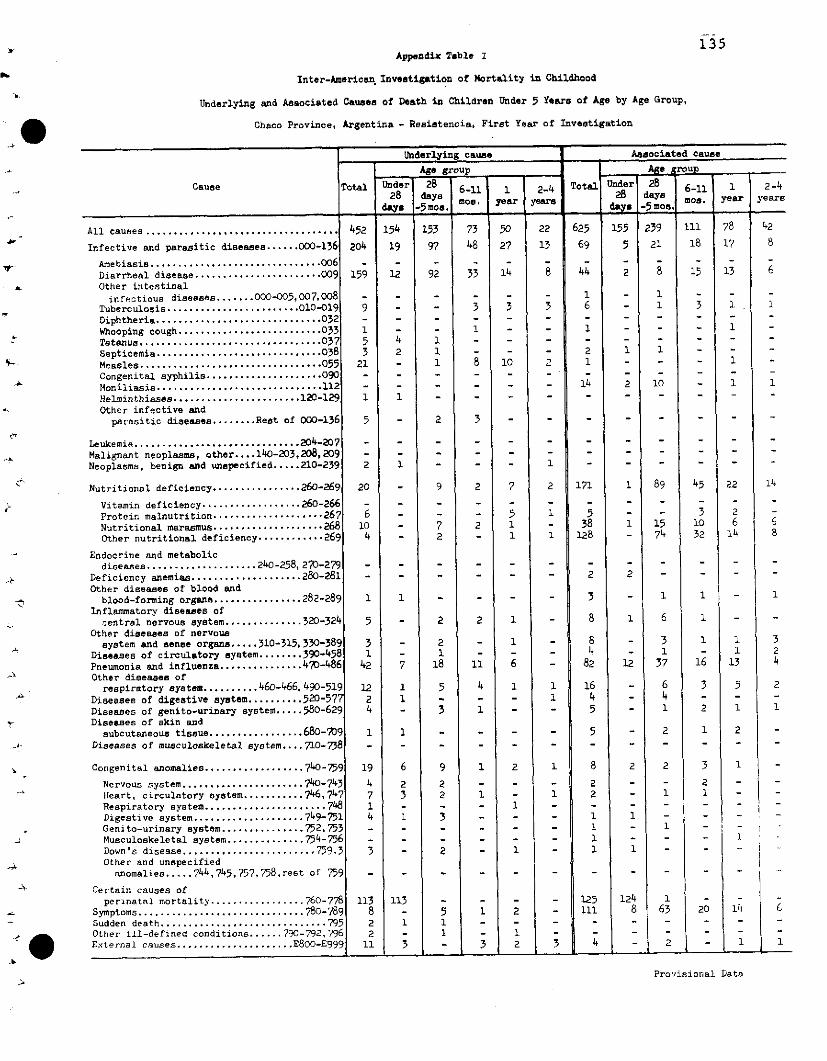
135Appendix Table I
Inter-American Investigation of Mortality in Childhood
Underlying and Aesociated Causes of Death in Children Under 5 Years of Age by Age Group,
Chaco Province, Argentina - Resistencia, First Year of Investigation
Underlying cause . Associated cause
Age group
Cause Total Under 28 6-11 1 2-4 Total Under 28 6- 1 1 2-4
28 day s 28 days m year yearday -a ms. -5
All causes ................................... 452 154 153 73 50 22 625 155 239 111 78 42
Infective and parasitic diseases ...... 000-136 204 19 97 48 27 13 69 5 21 18 17 8
Amebiasis ......... 006 .... _... 006 - - - - -
Diarrheal disease ................. ...... 009 159 12 92 33 14 8 44 2 8 15 13 6Other intestinal
infectious diseases ....... 0OOO-005,007,008 - - - - - - 1 - 1 - - -
Tuberculosis ........................ 010-01 9 - - 3 3 3 6 - 1 3 1 IDiphtheria ........................ 032...... 032
Whooping cough .......................... 033 1 - 1 - - 1
Tetanus .......... ...... ..... 03...... 4 - -1- - -
Septicemia ................... .......... 038 3 2 1 - - - 2 1 1
Measles ................................. 055 21 - 1 8 10 2 1 - - - 1
Congenital syphilis ..................... 090
M oniliasis .................. ............ 14 2 10 -1 1
Helminthiases ....................... 120-129 1 1 - - - - - -
Other infective andparasitic diseases ........ Rest of 000-136 5 - 2 3 - - - -
Leukemia .............................. 4-27
Malignant neoplasma, other .... 140-203,208,209 .........
Neoplasms, benign and unspecified ..... 210-239 2 1 - 1 - --
Nutritional deficiency ................ 260-269 20 - 9 2 7 2 171 1 89 45 22 14
Vitamin deficiency .................. 260-266 ....
Protein malnutrition .................... 26 6 - 5 1 5 3 2
Nutritional marasmus .................... 268 10 - 7 2 1 - 38 1 15 10 6 6Other nutritional deficiency ............ 269 4 - 2 - 1 1 128 - 74 32 14 8
Endocrine and metabolicdiseases . .... ... ... 240-258,270-279 .......
Deficiency anemias ........ ............ 280-281 - - - - - 2 2 -
Other diseases of blood andblood-forming organs ................ 282-289 1 1 - - - - 3 - 1 1 - 1
Inflammatory diseases ofcentral nervous system .............. 320-324 5 - 2 2 1 - 8 1 6 1 -
Other diseases of nervoussystem and sense organs ..... 310-315, 330-389 3 - 2 - 1 - 8 3 1 1 3
Diseases of circulatory system ........ 390-458 1 - 1 - - - 4 - 1 - 1 2
Pneumonia and influenza ............... 470-486 42 7 18 11 6 - 82 12 37 16 13 4Other diseases of
respiratory system .......... 460-466, 490-519 12 1 5 4 1 1 16 - 6 3 5 2Diseases of digestive system .......... 520-577 2 1 - - - 1 4 - 4 - - -
Diseases of genito-urinary system ..... 580-629 4 - 3 1 - - 5 - 1 2 1 1
Diseases of skin andsubcutaneous tissue ................. 680-709 1 1 - - - - 5 - 2 1 2
Diseases of musculoskeletal system .... 710-738 ...... - - - - -
Congenital anomalies .................. 740-7591 19 6 9 1 2 1 8 2 2 3 1 -
Nervous system ...................... 740-743 4 2 2 - - - 2 - - 2 _
Heart, circulatory system ........... 746,747 7 3 2 1 - 1 2 - 1 1 - -Respiratory system ............... ....... 74 - - 1 - -
Digestive system .................... 749-751 4 1 3 - - - 1 1 - -
Genito-urinary system ............... 752,753 .... 1 - 1 -
Musculoskeletal system .............. 754-756 - - - - 1 - - - 1
Down's disease ........................ 759.3 3 - 2 - 1 - 1 1 .. -
Other and unspecifiedanomalies ..... 744,745,757,758,rest of 759 - - - - - - - - - -
Certain causes ofperinatal mortality ................. 760-778 113 113 - - - - 125 124 1 - -
Symptoms .............................. 780-789 8 - 5 1 2 - 111 8 63 20 14 6Sudden death ............................ 795 2 1 1 - - - - - - - - -
Other ill-defined conditions ...... 790-792,796 2 - 1 - 1 - - - - - -
External causes ..................... E800-E999 11 3 - 3 2 3 4 - 2 - 1 1
Provisional Data
I 1 I I I I__ -
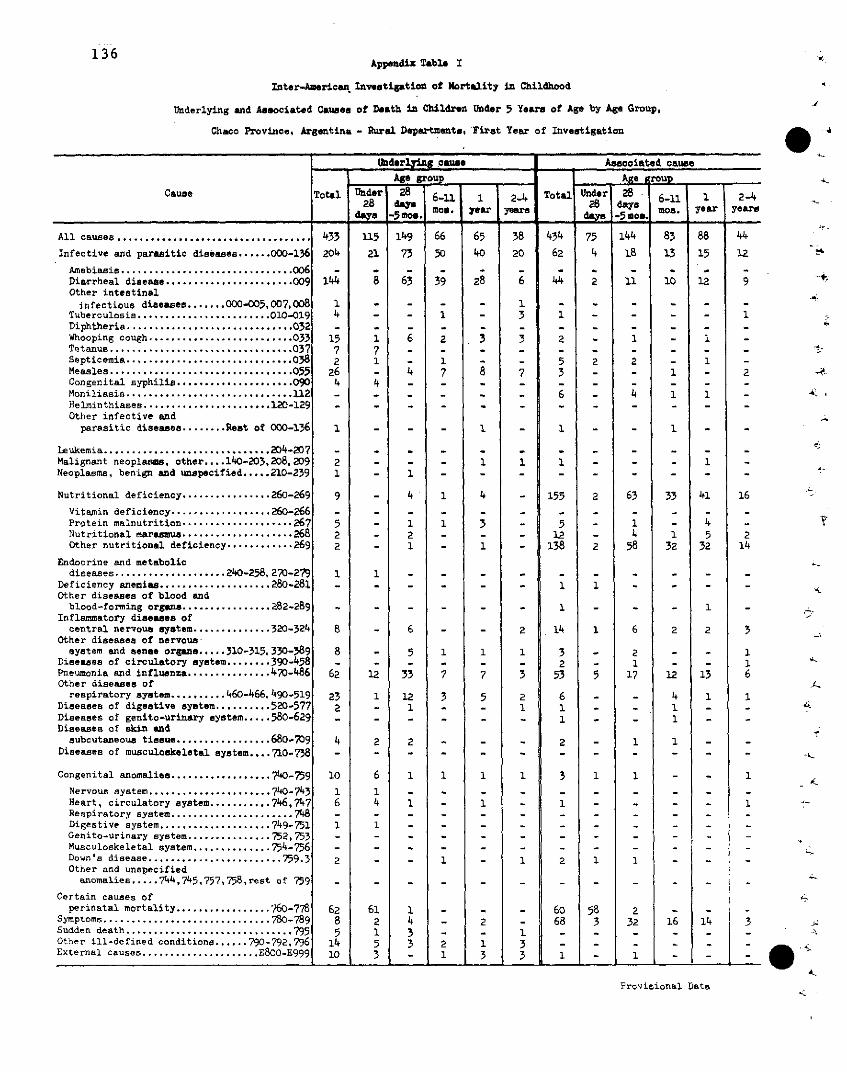
13 61 ~~~~~13 ~~~6 Appendix Tab:. I
Inter-American Investigation o£ Nortality in Childhood
Underlying and Associated Causes of Death in Children hUndr 5 Years of Age by Age Group,
Chaco Province, Argentina - Rural Departments, First Year of Investigation
iderlyU#is aie Assooiated cause
-' AV grou . ... ARe y -oupCause Total OiiderJ t8 Total U-- r 28
6-1% I 2-4 61Cause Total 1nder[ 28 6_1Iye 2-4 Total 6-11 1 2-4_ _ _ _ _ _ _ _ _ _ _ _ _ _ _ _ _ _ _ 8 _ _ _ _ _ _8 d ay s - ~ ~ L . . . .. _ _ _ _ _ae28 Ttl 28 6 y mos. year yearsIdym. ye ar year,, a-Sms
All causes .................................. 433 115 149 66 65 38 434 75 144 83 88 44
Infective and parasitic diseases ...... 000-136 204 21 73 50 40 20 62 4 18 13 15 12 -'
Amebiasie ............................... 006 - - - - -Diarrhealdiseaae ...................... 009 144 8 63 39 28 6 44 2 11 10 1 9Other intestinal
infectious diseases ....... 000-005,007,008 1 - - - 1 - - - - - -Tuberculosis ........................ 010-019 4 - - 1 - 3 1 - - - - 1Diphtheria .............................. 032 - - - -
Whooping cough .......................... 033 15 1 6 2 3 3 2 1 -Tetanu ................................. 037 7 7 - - - - - - - - -Septicemia .............................. 038 2 I - 1 -5 - 12 2 - 1Measles ................................. 055 26 - 4 7 8 7 3 - -1 2 -
Congenital syphilis ..................... 090 4 4 - - - -Moniliasis .............................. 112 - - - - - 1 - 6 4 1 1Helminthiases ....................... 12-129 - - - - - - - -Other infective andparasitic diseases ........ Rest of 000-136 1 - - - 1 - 1 - 1 -
Leukemia .............................. 4-207 - - - - - - - -Malignant neoplasma, other....
140-203,208,209 2 - - - 1 1 1 - - -
Neoplasms, benign and unspecified.....210-239 1 - 1 - - -
Nutritional deficiency................ 260-269 9 - 4 1 4 - 155 2 63 33 41 16
Vitamin deficiency......... ......... 260 - - - - - - - - - - -
Protein malnutrition .................... 267 5 - 1 1 3 - 5 - 1 4 -
Nutritional marasmus................... 268 2 - 2 - - 12 - 4 1 5 2Other nutritional deficiency ............ 269 2 - 1 - 1 - 138 2 58 32 32 14
Endocrine and metabolicdiseases .................... 240-258, 270-279 1 1 . . . .
Deficiency anemias.................... 280-281 - - - - 1 1Other diseases of blood and
blood-formnning organ ...... .......... 282289 1 - - - 1 -Inflammatory diseases of
central nervous system .............. 320-324 8 - 6 - - 2 14 1 6 2 2 3Other diseases of nervoussystem and sense organs .....310-315, 330-389 8 - 5 1 1 1 3 - 2 - - 1
Diseases of circulatory system ........ 390-458 - - - - - - 2 - 1 - - 1Pneumonia and influenza .............. 470-486 62 12 33 7 7 3 53 5 17 12 13 6Other diseases of .,
respiratory systm .......... 460-466, 490-519 23 1 12 3 5 2 6 - - 4 1 1Diseases of digestive system.......... 520-577 2 - 1 - - 1 1 - - 1 - --Diseases of genito-urinary system.....580-629 - - - - - - 1 - - 1 - -Diseases of skin and
subcutaneous tiesue................. 680-709 4 2 2 - - - 2 - 1 1 - -Diseases of musculoskeletal system ... 710-738 - - - - - - - - - -
Congenital anomalies ................. 740-759 10 6 1 1 1 1 3 1 1 - - 1
Nervous system ...................... 740-743 1 1 - - - - - - - - - -Heart, circulatory syatem........... 746,747 6 4 1 - 1 - 1 - - - - 1Respiratory system......................748 - - - - - - - - - - - -Digestive system ................... 749-751 1 1 - - - - - - - - - -Genito-urinary system ............... 752,753 - - - - - - - - - -Musculoskeletal system ............. 754-756 - - - - - - - - - -
Down's disease........................759.3 2 - - 1 - 1 2 1 1 - -Other and unspecifiedanomalies.....7
44,7
45,757,758,rest of 759 - - - - - -
Certain causes of iperinatal mortality ................ 760-778 62 61 1 - - - 60 8 2 - - -
Symptoms .............................. 780-789 8 2 4 - 2 - 68 3 32 16 14 3Sudden death .............................. 795 $ 1 3 - - 1 - - - - - -Other ill-defined conditions...... 790-792,796 14 5 3 2 1 3 - - - - - -External causes.....................E800-E999 10 3 - 1 3 3 1 - 1 - - -
Provisional Data
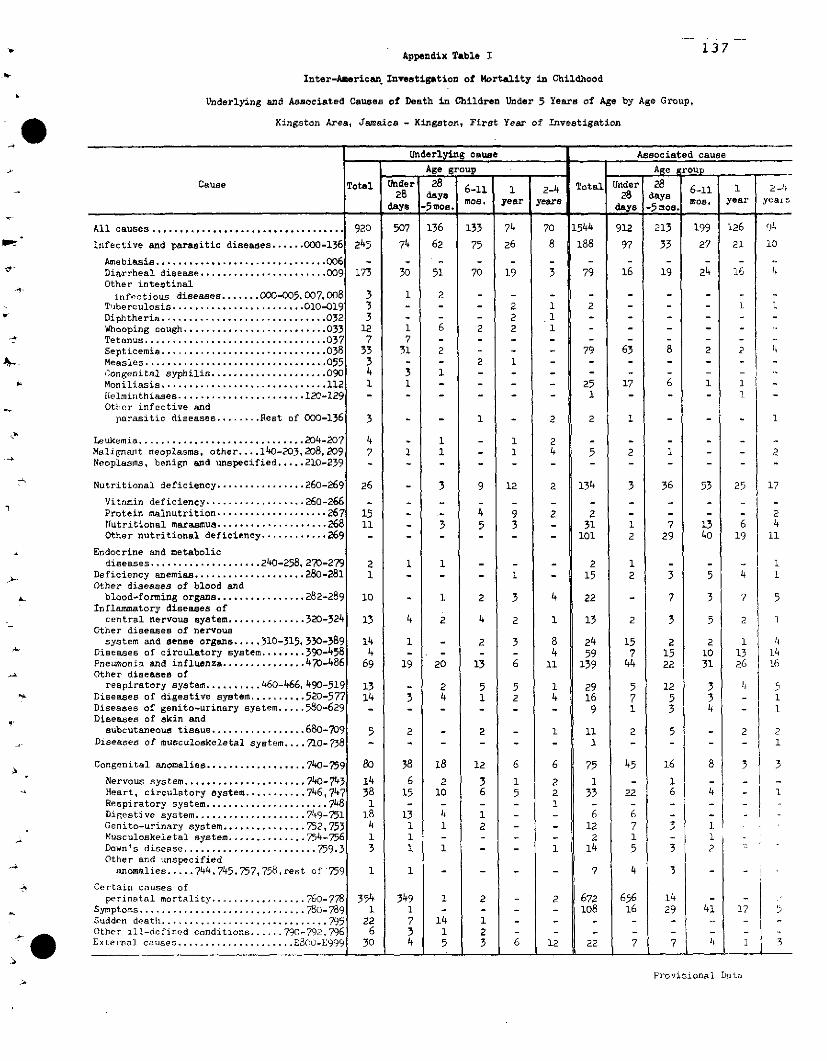
Appendix Table 1 3 7
Inter-American Investigation of Mortality in Childhood
Underlying and Associated Causes of Death in Children Under 5 Years of Age by Age Group,
Kingston Area, Jamaica - Kingaton, First Year of Investigation
Underlying cause Associated causeAge group Age proup -
Cause Total nder( 28 1 2-4 Total Under 28 6 1 -
28 days - 28 days -k__________dy Smn mos. ear years d year y s
days ~~~~~~~~~~~-mos. -
All causes ................................... 920 507 136 133 74 70 1544 912 213 199 126 ('
Infective and parasitic diseases ...... 000-136 245 74 62 75 26 8 188 97 33 27 21 10
Amebiasis ............................... 006
Diarrheal disease ....................... 009 173 30 51 70 19 3 79 16 19 24 16 4Other intestinalinfectious diseases ....... 000-005, 007, 008 3 1 2 - - - - - - - -
Tuberculosis ........................ 010-019 3 - - - 2 1 2 - - - 1 1Diphtheria .............................. 032 3 - - - 2 1 -
Whooping cough .......................... 033 12 1 6 2 2 1 - - - - -
Tetanus .............................. 037 7 7 - - - - - - - - -
Septicemia ............................. 038 33 31 2 - - - 79 63 8 2 2 4Measles ................................ 055 3 - - 2 1 - - - - - -
C;ongenital syphilis ..................... 090 4 3 1 -
Moniliasis ................ ............. 112 1 1 - - - - 25 17 6 1 1 iilelminthiases ....................... 120-129 - - - - - 1 - - - 1
Othier infective andparasitic diseases ........ Rest of 000-136 3 - - 1 - 2 2 1 - - - 1
Leukemia .............................. 204-207 4 - 1 - 1 2 - - - -Malignant neoplasma, other .... 140-203,208,209 7 1 1 - 1 4 5 2 1 - - 2Neoplasmsa, benign and unspecified ..... 210-239 - - - - - - - - - - -
Nutritional deficiency ................ 260-269 26 - 3 9 12 2 134 3 36 53 25 17
Vitamin deficiency .................. 260-266
Protein malnutrition .................... 267 15 - - 4 9 2 2 - - - - 2Nutritional marasmus .................... 26 8 11 - 3 5 3 - 31 1 7 13 6 4Other nutritional deficiency ............ 269 - - - - 101 2 29 40 19 11
Endocrine and metabolicdiseases .................. 240-258, 270-279 2 1 1 -_ - 2 1 - - - 1
Deficiency anemias .................... 280-281 1 - - - 1 - 15 2 3 5 4 1Other diseases of blood andblood-forming organs ................ 282-289 10 - 1 2 3 4 22 - 7 3 7 5
Inflammatory diseases ofcentral nervous system .............. 320-324 13 4 2 4 2 1 13 2 3 5 2 1
Other diseases of nervoussystem and sense organs ..... 310-315, 330-389 14 1 - 2 3 8 24 15 2 2 1 4
Diseases of circulatory system ........ 390-458 4 - - - - 4 59 7 15 10 13 14Pneumonia and influenza ............... 470-486 69 19 20 13 6 11 139 44 22 31 26 16Other diseases of
respiratory system .......... 460-466,490-519 13 - 2 5 5 1 29 5 12 3 4 5Diseases of digestive system .......... 520-577 14 3 4 1 2 4 16 7 5 3 - 1Diseases of genito-urinary system ..... 580-629 - - - - - - 9 1 3 4 - 1Diseases of skin and
subcutaneous tissue ................. 680-709 5 2 - 2 - 1 11 2 5 - 2 2Diseases of musculoskeletal system .... 710-738 - - - - - - 1 - - - - 1
Congenital anomalies .................. 740-759 80 38 18 12 6 6 75 45 16 8 3 3
Nervous system ...................... 740-743 14 6 2 3 1 2 1 - 1 -Heart, circulatory system ........... 746,747 38 15 10 6 5 2 33 22 6 4 IRespiratory system ...................... 748 1 I - - - - 1 - - -Digestive system .................... 749-751 18 13 4 1 - - 6 6 - - -Genito-urinary system ............... 752,753 4 1 1 2 - - 12 7 7 ]1Musculoskeletal system. ............ 754-756 1 1 - - - - 2 1 - 1Down's disease ........................ 759.3 3 1 1 - - 1 14 5 3 2Ottiher and unspecified
anomalies ..... 744,745,757,758,rest of 759 1 1 - - - - 7 4 3 -_
Certain causes ofperinatal mortality ................. 760-778 354 349 1 2 - 2 672 656 14 - -
Symptoms .............................. 780-789 1 1 - - - - 108 16 29 41 17 5Sudden death .............................. 795 22 7 14 1 - -
Other ill-defined conditions ...... 790-792.796 6 3 1 2 - - -External causes ..................... E800 -E999 30 4 5 3 6 12 22 7 7 4 1 l
Provisional bata
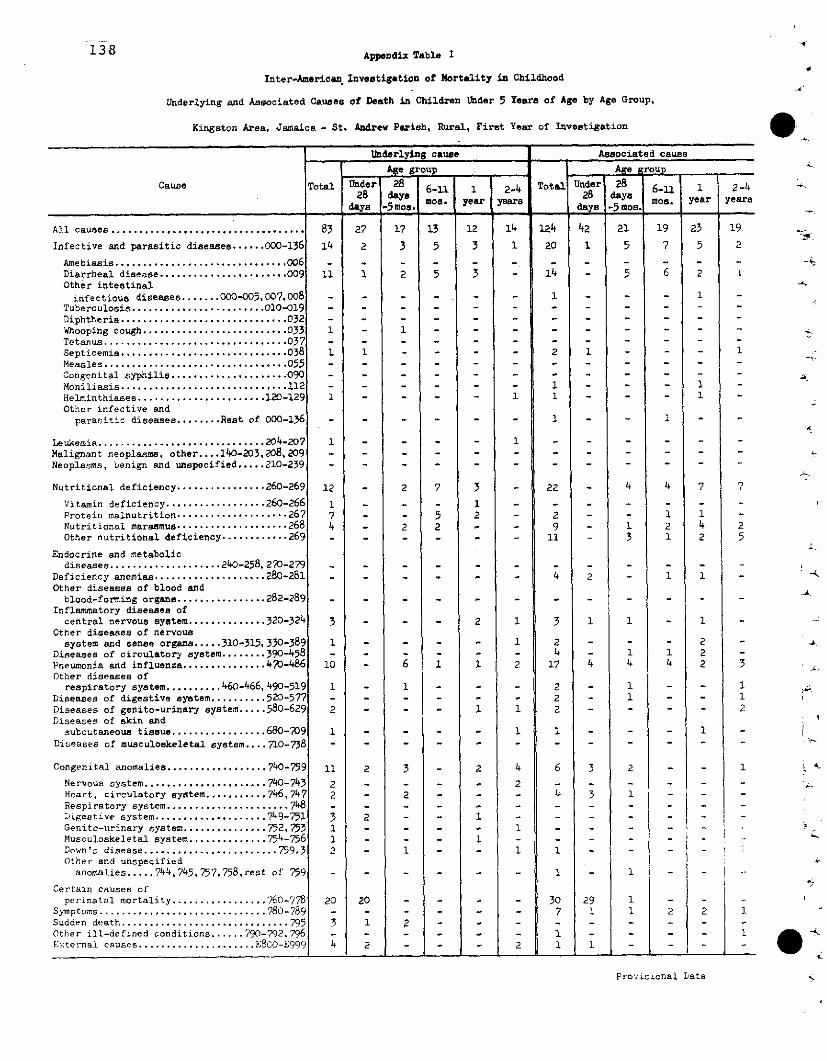
138 Appendix Table I
Inter-American Investigation of Mortality in Childhood
Underlying and Associated Causes of Death in Children Under 5 Years of Age by Age Group,
Kingston Area, Jamaica - St. Andrew Parish, Rural, First Year of Investigation
Underlyng cause Associated causeAge group e ro
Cause Total Under( 28 14 Total Under 8 2-46-11 1 2-428 days 28 days o e years
-dayas oa. 5~~~~~~~~~~~~-5 sfnq os.
All causes ................................... 83 27 17 13 12 14 124 42 21 19 23 19
Infective and parasitic diseases ...... 000-136 14 2 3 5 3 1 20 1 5 7 5 2
Amebiasis ............................... 006 - - - - - - - - - - - -
Diarrheal disease ....................... 009 11 1 2 5 3 - 14 - 5 6 2 1Other intestinalinfectious diseases....... 000-005,007,008 - - - - - 1 - - -
Tuberculosis ........................ 010-019 - - - - -
Diphtheria .............................. 032 - - - - -
Whooping cough ......................... 033 1 - 1 - - - - -Tetanus ................................ 037 - - - - -
Septicemia .............................. 038 1 1 - - - - 2 1 - - - 1Measles ................... ..............05 - - - - - - - - - - -Corigenital syphilis ........... ...... 090 -... - - - - - - - - - - -
Moniliasis .............................. 1121 - - - - - - 1 - - - 1
Helminthiases ....................... 120-129 1 - - - - 1 1 - - - 1Othcr infective and
parasitic diseases ...... Rest of 000-136 - - - - - - 1 - - 1 -
Leukemia ............................. 204- 7 1 - - - - 1 - - - - -
Malignant neoplasma, other .... 140-203,208,209 - - - - - - - - - - -
Neoplasms, benign and unspecified..... 210-239 - - - - - - - - - - -
Nutritional deficiency ................ 260-269 12 - 2 7 3 - 22 - 4 4 7 7
Vitamin deficiency .................. 260-266 1 - - - 1 - - - - - - -
Protein mrnalnutrition .................... 267 7 - - 5 2 - 2 - - 1 1 -Nutritional marasmus .................... 268 4 - 2 2 - - 9 - 1 2 4 2Other nutritional deficiency ............ 269 - - - - - - 11 - 3 1 2 5
Endocrine and metabolícdiseases................. 240- 258, 270-279 - - - - - - - - - -
Deficiency anemias.................. 280-281 - - - - - 4 2 - 1 1 -Other diseases of blood and
blood-forming organs .............. 282-289 .- - - - - - - - - -
Inflardmatory diseases ofcentral nervous system.............. 320-324 3 - - - 2 1 3 1 1 - 1 -
Other diseases of nervoussystem and sense organs.....310-315, 330-389 1 - - - - 1 2 - - - 2
Diseases of circulatory system........390-458 - - - - - - 4 - 1 1 2 -Pneumonia and influenza .............. 470-486 10 - 6 1 1 2 17 4 4 4 2 3Other diseases of
respiratory system.......... 460-466, 490-519 1 - 1 - - - 2 - 1 - - 1
Diseases of digestive syatem.......... 520-577 - - - - - 2 - 1 - - 1Diseases of genito-urinary system ..... 580-629 2 - - - 1 1 2 - - - - 2Diseases of skin and
subcutaneous tissue................. 680-709 1 - - - - 1 1 - - - 1 -
Diseases of musculoskeletal system ....710-738 - - .- - - - - - - -
Congenital anomalies ................. 740-759 11 2 3 2 4 6 3 2 - - 1
Nervous system ...................... 740-743 2 - - - 2 - - - - -Heart, circulatory system........... 746,747 2 - 2 - 4 3 1 - - -Respiratory system ...................... 748 - - - - - - -
Digestive system ................... 749-751 3 2 - - - -
Genito-urinary system .............. 752, 753 1 - - - 1 .- -
Musculoskeletal system ............. 754-756 1 - 1
Down's disease ....................... 759.3 2 1 - 1 1 1 1Other and unspecifiedanomalies.....744,745,757,758,rest of 759 - - - 1 - 1 - -
Certain causes ofperinatal mortality ................ 760-778 20 20 - - - 30 29 1 -
Svmptoms ............................. 7. 80-789 - - - . 7 1 1 2 2 1
Sudden death .............................. 795 3 1 - - - - -
Other ill-defined conditions ...... 790-792,796 - - - - - 1 - - - 1 -External causes.................... E8 ECO-E999 4 2 - - 2 1 1 - -
_ _ _ _ _ _ _ _ _ _ _ _ _ _ _ _ _ _ _ _ _ _ _ _ _ _ _ _ _ _ _ _ _ _ - -¿~~~~~~~~~~~~~~~~~~~~~~~~~~~
Provisional Data
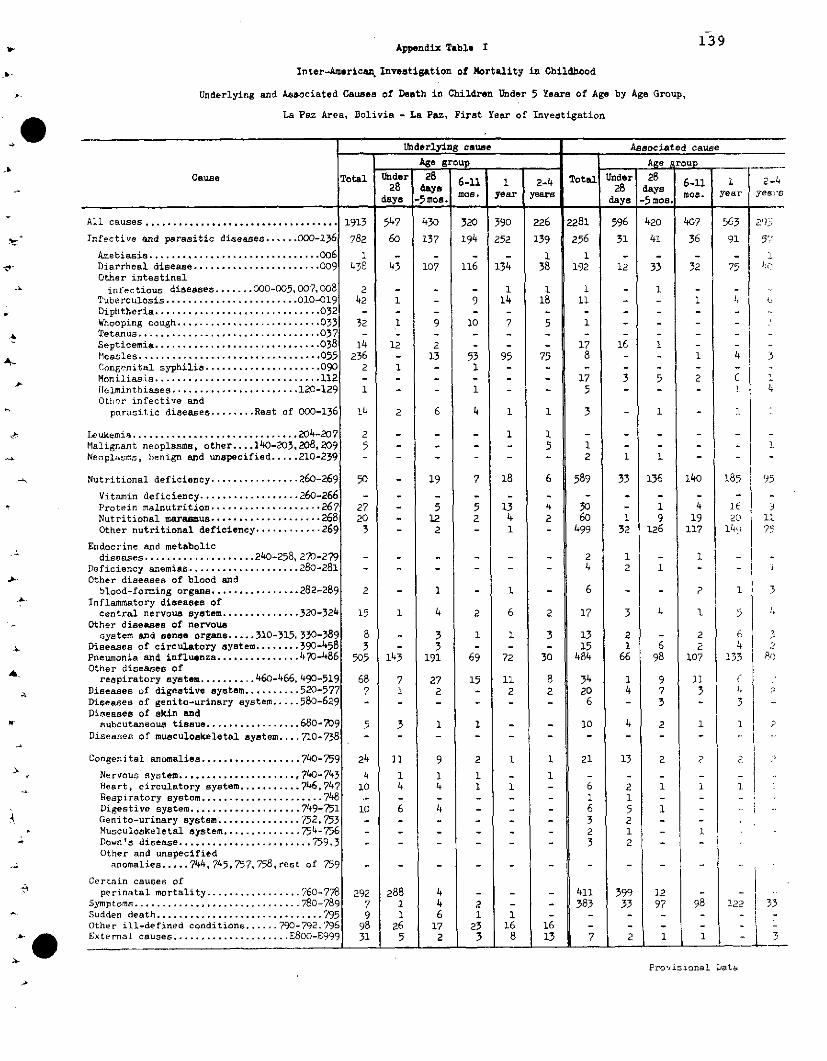
1-39Appendix Tabla I 139
Inter-America Investigation of Nortality in Childhood
Underlying and Associated Causes of Death in Children Under 5 Years of Age by Age Group,
La Paz Area, Bolivia - La Paz, First Year of Investigation
Underlying cause Associated cause -Age group Age roup
Cause Total Underl 28 Total Under 286-11 1 2-4 l -
28 days 128 days 6-lir, esrmos. year years mos.-Sos ays m os. -
All causes ................................... 1913 547 430 320 390 226 2281 596 420 407 563 293;
Infective and parasitic diseases...... 000-136 782 60 137 194 252 139 256 31 41 36 91 57:
Amebiasis ............................... 006 1 - - - - 1 1 - - - - 1Diarrheal disease . ........ .......... 009 438 43 107 116 134 38 192 12 33 32 75 lOther intestinal
infectious diseases....... 000-005,007,008 2 - - - 1 1 1 - 1 - -Tuberculosis ........................ 010-019 42 1 - 9 14 18 11 - - 1Diphtheria.............................032 - - - - - - - - - -.Whooping cough .......................... 033 32 1 9 10 7 5 1 - - -Tetanus ................................. 037 - - - - - - - -Septicemia .............................. 038 14 12 2 - - - 17 16 1 -Measles ................................. 055 236 - 13 53 95 75 8 1 - - 1 4 3C:ongrenital syphilis .................. 090 2 1 - 1 - - - - -Moniliasis.... ............ ............. 112 .- - - - - - 17 3 5 2 6ilelminthiases ........... ......... 120-129 1 - - 1 - - 5 - - - i 4Ottiher infective and
parasitic diseases ........ Rest of 000-136 14 2 6 4 1 1 3 - 1 - i
Leukemia .............................. 204-207 2 - - - 1 1 - - - - -Malignant neopleasma, other.... 140-203,208 ,209 5 - - - - 5 1 - - - 1Neoplasms, benign and unspecified..... 210-239 - - - - - - 2 1 1 - - -
Nutritional deficiency ................ 26-269 50 - 19 7 18 6 589 33 136 140 185 95
Vitamin deficiency......2......... 260-266 - - - - - - - - - - -Protein malnutrition .................... 267 27 - 5 5 13 4 30 - 1 4 l t 3Nutritional marasmus .................... 268 20 - 12 2 4 2 60 1 9 19 20 iOther nutritional deficiency............ 269 3 - 2 - I 4- 99 32 126 117 149 75
Endocrine and metabolicdiseases ................... 240-258, 270-279 - - - - - - 2 1 - 1 -
Deficiency anemias .................... 280-281 - - - - - - 4 2 1 -Other diseases of blood and
blood-forming organsa ............... 282-289 2 - 1 - 1 - 6 - - 2 1 3Inflammatory diseases ofcentral nervous system..............320-324 15 1 4 2 6 2 17 3 4 1 5
Other diseases of nervoussystem and sense organs.....310-315, 330-389 8 - 3 1 1 3 13 2 - 2 6
Diseases of circulatory system........ 390-458 3 - 3 - - - 15 1 6 2 4 2Pneumonia and influenza ............... 470-486 505 143 191 69 72 30 484 66 98 107 133 20Other diseases of
respiratory system.......... 460-466, 490-519 68 7 27 15 11 8 34 1 9 11Diseases of digestive system .......... 520-577 7 1 2 - 2 2 20 4 7 3 4 7Diseases of genito-urinary system ..... 580-629 - - - - 6 - 3 - 3Diseases of skin andsubcutaneous tissue ................ 680-709 5 3 1 1 - - 10 4 2 1 1
Diseases of musculoakeletal system .... 710-738 - - - - - -
Congenital anomalies .................. 740-759 24 11 9 2 1 1 21 13 2 2 2
Nervous system ..................... , 740-743 4 1 1 1 - 1 - - - -Heart, circulatory system........... 746,747 10 4 4 1 1 - 6 2 1 1 1Respiratory system ...................... 748 . - - - - - 1 1Digestive system ................... 749-751 10 6 4 - - - 6 5 1 -Genito-urinary system ............... 752,753 - - - - - 3 2 - -Musculoskeletal system ............. 754-756 - - - - - 2 1 - 1Down's disease ........................ 759.3 - - - - - - 3 2 - -Other and unspecified
anomalies.....744,745,757,758,rest of 759 - - - - - - - - -
Certain causes ofperinatal mortality ................ 760-778 292 288 4 - - - 411 399 12 -
Symptoms .............................. 780-789 7 1 4 2 - 383 33 97 98 122 3Sudden death .............................. 795 9 1 6 1 1 - - - - - -Other ill-defined conditions ...... 790-792,796 98 26 17 23 16 16 - - - -
External causes .................... E800-E999 31 5 2 3 8 13 7 2 1 1 - 3
Provisional Data
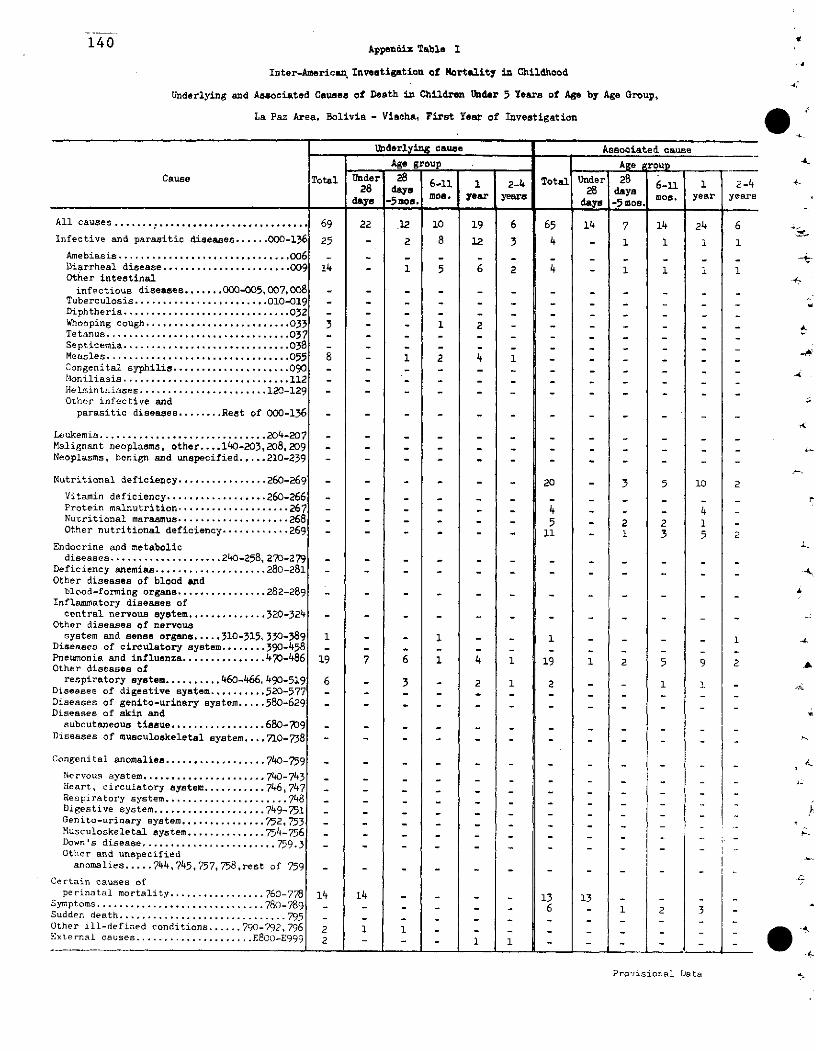
14 0 Appendi x Table 1
Inter-American Investigation of Mortality in Childhood
Underlying and Associated Causes of Death ia Children Under 5 Years of Age by Age Group,
La Paz Area, Bolivia - Viacha, First Year of Investigation
1Underlying cause Associated causeAge group Ae group
Cause Total raye5 28s-6-11 i1 2-4 Total Under 28 6-11 1 2-4
Ttamls. ear yeara year years~?1 mos. days e y
All causes .................................. 69 22 12 10 19 6 65 14 7 14 24 6Infective and parasitic diseases..... 000-136 25 - 2 8 12 3 4 - 1 1 1 1
Amebiasis .............................. 006 - -Diarrheal disease ....................... 009 14 1 5 6 2 4 - 1 1 1 1Other intestinalinfectious diseases ....... 000-005,007,008 - - - - - - -.......
Tuberculosis ........................ 010-019 .......Diphtheria .......................... 032 .... 032 ........Whooping cough .......................... 033 3 - - 1 2Tetanus ................................. 03 - - - - -Septicemia .............................038 - - - - -Measles ................................. 055 8 - 1 2 4 1Congenital syphilis ..................... 090 - -Moniliasis .......................... 1.... 112 -
Helmintihiases ....................... 120-129 .......Other infective andparasitic diseases ........ Rest of 000-136 - - - - - -........
Leukemia .............................. 24-207 - - - - -Malignant neoplasms, other .... 140-203,208,209 .......Neoplasms, benign and unspecified ..... 210-239 ........
Nutritional deficiency ................ 260-269 - - - - 20 - 3 5 10 2
Vitamin deficiency .................. 260-266 - - - - - - - - - -Protein malnutrition .................... 267 - - - - - 4 - - 4Nutritional marasmus .................... 268 ...... 5 2 2 1Other nutritional deficiency ............ 269 - - - - - 11 1 3 5 2
Endocrine and metabolicdiseases .................... 240-258, 270-279 - - - - - - -..........
Deficiency anemias .................... 280-281 - - -Other diseases of blood andblood-forming organs ................ 282-289 ........
Inflammatory diseases ofcentral nervous system .............. 320-324 ........
Other diseases of nervoussystem and sense organe ..... 310-315, 330-389 1 - 1 _ _ 1 _ _ _ 1
Diseases of circulatory system ........ 390-458 .......- - - - -Pneumonia and influenza ............... 470-486 19 7 6 1 4 1 19 1 2 5 9 2Other diseases ofrespiratory system .......... 460-466, 490-519 6 - 3 - 2 1 2 - - 1 1
Diseases of digestive system .......... 520-577 - - - - - - - - - - -Diseases of genito-urinary system ..... 580-629 - - - - - - - - - - -Diseases of skin and
subcutaneous tissue ................. 680-709Diseases of musculoskeletal system .... 710-738 - - - - - - - - - -_
Congenital anomalies ................. 740-759 - - -
Nervous system ..................... 740-743 - - -- - - - - - - - -Heart, circulatory system ........... 746,747 - - -Respiratory system ...................... 748 - -Digestive system ................... 749-751 -Genito-urinary system .............. 752,753 - - -Musculoskeletal system .............. 754-756 - -Down's disease ....................... 759.3 - -Other and unspecified
anomalies ..... 744,7
45,757,75
8,rest of 759 -
Certain causes of
perinatal mortality ................. 760-778 14 14 13 13 - -Symptoms .............................. 780-789 6 - 1 2 3Sudden death ............................ 795 ........Other ill-defined conditions ...... 790-792,796 2 1 1External causes ..................... E800-E999 2 1 1
._.
.Pro visional Data S
-A
-4-
4
-4
-01
;i
r,
A-C
Jt
-1
,0
--k
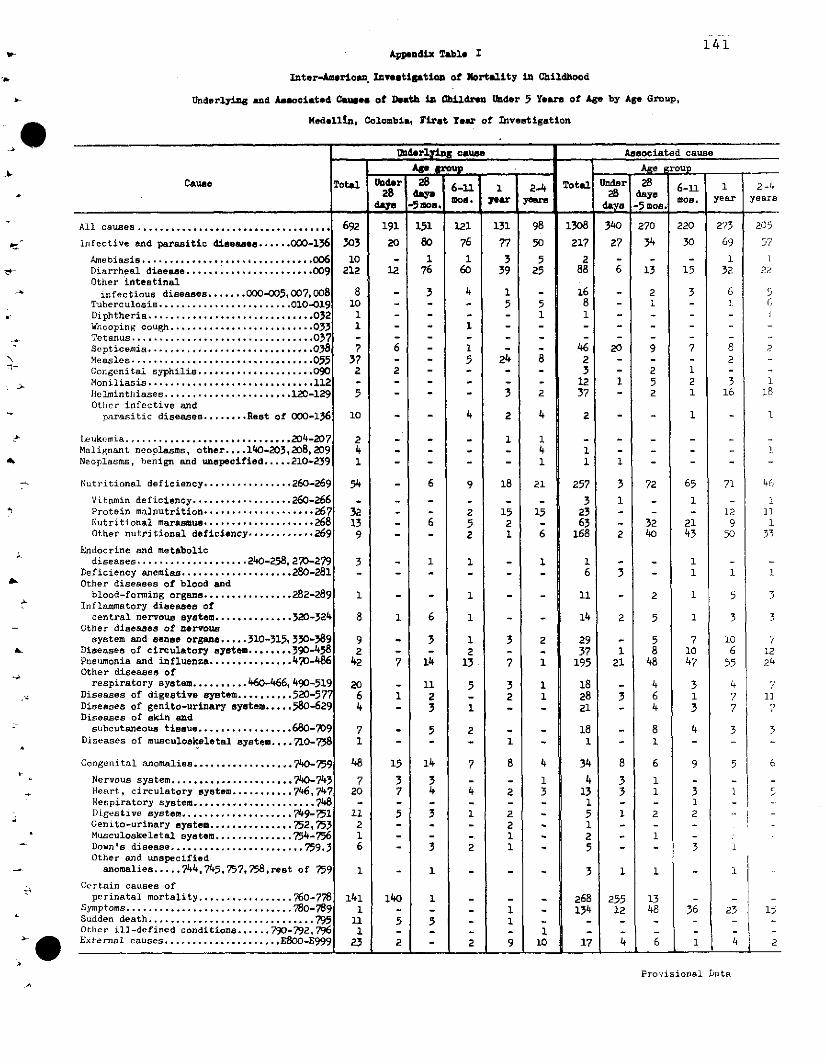
Appendix Table I 141
Inter-Americnz. Inweatitgtion of Nortality in Childhood
Underlying and Aaociated Causes of Death la ChLldren Under 5 Yaors of Age by Age Group,
Medellín, Colombia, First Year of Investigation
_Ue rlyi&g cause Assocíated cause
AS. bp Ao te roup
Cause To r 28 6 1 -112-4 Total Underi 2-46-11 1 2-4 -So.
28 _" mos. 8V y . mos. Year years
All causes ................................... 692 191 151 121 131 98 1308 340 270 220 273 205
Infective and parasitic diseases ...... 00-136 303 20 80 76 77 50 217 27 34 30 69 57
Amebiasis ............................. 00.. O 10 - 1 1 3 5 2 - - - 1 1Diarrheal disease ....................... 009 212 12 76 60 39 25 88 6 13 15 32 2?Other intestinal
infectious diseases ....... 000-005,007,008 8 - 3 4 1 - 16 - 2 3 6 5Tuberculosis ....................... 0. 10-019 10 - - - 5 5 8 - 1 - 1]
Diphtheria ............................. 032 1 - _ - 1 1 - - -Whooping cough ......................... 0. 33 1 - - 1 - -.Tetanus ................................. 037 - -
Septicemia .............................. 038 7 6 - 1 - - 46 20 9 7 8 2Measles ................................. 055 37 - - 5 24 8 2 - -_ 2
Congenital syphilis ..................... 090 2 2 - - - - 3 - 2 1 -Moniliasis .............................. 112 - - - 12 1 5 2 3 1
llelminthiases ....................... 120-129 5 - - - 3 2 37 - 2 1 16 18Othcr infective and
parasitic diseases ........ Rest of 000-136 10 - - 4 2 4 2 - - 1 - 1
Leukemia .............................. 204-207 2 - - - 1 1 - - - - -
Malignant neoplasms, other .... 140-203,208,209 4 - - - - 4 1 - - - _-Neoplasms, benign and unspecified ..... 210-239 1 - - - - 1 1 1 - - -
7- Nutritional deficiency ............... 260-269 54 - 6 9 18 21 257 3 72 65 71 46
Vitamin deficiency .................. 260-266 - -. - _ - - 3 1 - 1 - 1
Protein malnutrition .. ................. 267 32 - - 2 15 15 23 - - - 12 11Nutritional marasmus.. ........ 268 13 - 6 5 2 - 63 - 32 21 9 1Other nutritional deficiency-- -.........269 9 - - 2 1 6 168 2 40 43 50 33
Endocrine and metabolicdiseases .................... 240-258, 270-279 3 - 1 1 - 1 1 - - 1 -
Deficiency anemias .................... 280-281 - - - - - - 6 3 - 1 1 1Other diseases of blood and
blood-forming organs ............... 282-289 1 - - 1 - - 11 - 2 1 5 3Inflammatory diseases ofcentral nervous system .............. 320-324 8 1 6 1 - - 14 2 5 1 3 3
Other diseases of nervoussystem and sense organe ..... 310-315, 330-389 9 - 3 1 3 2 29 - 5 7 10 7
Diseases of circulatory system ........ 390-458 2 - - 2 - - 37 1 8 10 6 12Pneumonia and influenza ............... 470-486 42 7 14 13 7 1 195 21 48 47 55 24Other diseases of
respiratory system .......... 460-466, 490-519 20 - 11 5 3 1 18 - 4 3 4 7Diseases of digestive eystem .......... 520-577 6 1 2 - 2 1 28 3 6 1 7 11Diseases of genito-urinary system ..... 580-629 4 - 3 1 - - 21 - 4 3 7 7Diseases of skin andsubcutaneous tissue ................. 680-709 7 5 2 - - 18 - 8 4 3 3
Diseases of musculoskeletal system .... 710-738 1 - - - 1 1 1 -1_
Congenital anomalies .................. 740-759 48 15 14 7 8 4 34 8 6 9 5 6
Nervous system ...................... 740-743 7 3 3 - - 1 4 3 1Heart, circulatory system ........... 746,747 20 7 4 4 2 3 13 3 1 3 1 5Respiratory system ...................... 748 - - - - - - 1 1Digestive system .................... 749-751 11 5 3 1 2 - 5 1 2 2 -¡Genito-urinary system ............... 752,753 2 - - - 2 - - -_Musculoskeletal system .............. 754-756 1 -_ - 1 2 - 1 -
Down's disease . ................... 759.3 6 - 3 2 1 - 5 - - 3 1Other and unspecified
anomalies ..... 744, 745, 757, 758,rest of 759 1 - 1 - - - 3 1 1 - 1
Certain causes ofperinatal mortality ................ 760-778 141 140 1 - - - 268 255 13 - -
Symptoms .............................. 780-789 1 - - - 1 _ 134 12 48 36 23 15Sudden death .............................. 795 11 5 5 1Other ill-defined conditions ...... 790-792,796 1 - - - - 1 - - - _ _External causes ....... 2............800-999 3 2 - 2 9 10 17 4 6 1 4 2
Provisional Data
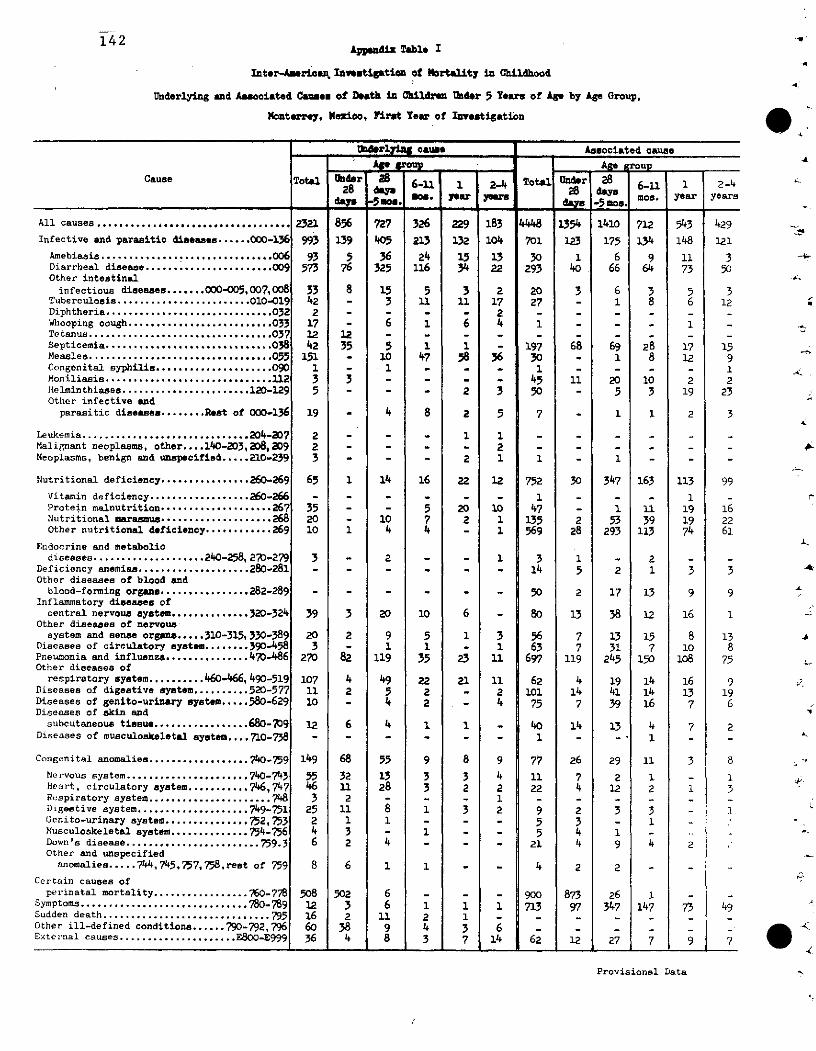
142Appendix Table I
Inter-A~ericam Inayetisgtioc of Nortality in Childhood
Underlying and As~ociated Causee of Death in CbIldAre Uhder 5 Years of Age by Age Group,
Monterrey, Nexioo, tFirt Year of Inventigation
_~rl~ ! oaus. Asuociated oause
Cause Total 3X8 r 8 U28 r||2 Tt a|a6-1 ¡tr 6-11 1 2-428 s . , 1 .. mas. 1 2~ 1 yearsd~3m -. o.. ,,. ~ar3man,-So.
All causes ................................... 2321 856 727 326 229 183 4448 1354 1410 712 543 429Infective and parasitic diseasee ...... 000-136 993 139 405 213 132 104 701 123 175 134 148 121
Amebiasis ...............................006 93 5 36 24 15 13 30 1 6 9 11 3Diarrheal disease ....................... 090 573 76 325 116 34 22 293 40 66 64 73 50Other intestinalinfectious diseases ....... 000-05,007,008 33 8 15 5 3 2 20 3 6 3 5 3
Tuberculosis ....................... 0. 10-0191 42 - 3 11 11 17 27 - 1 8 6 12Diphtheria ............................ 032 2 - 2 - - - - - -Whooping cough .......................... 033 17 - 6 1 6 4 1 - - - 1 -Tetanus ................................. 12 12Septicemia ................. 3.........8... 03. 42 35 5 1 1 - 197 68 69 28 17 15Measles ................................ 055 151 - 10 47 58 36 30 - 1 8 12 9Congenital syphilis .....................090 1 - 1 - - - 1 - - - - 1Moniliasis ................... ........... 3 3 - - - - 45 11 20 10 2 2Helminthiases .......................12D-129 5 - - 1 2 3 5 3 19 23Otiher infective and
parasitic diseases ........ Rest of 000-136 19 - 4 8 2 5 7 - 1 1 2 3
Leukemia ............................. 204-7207 2 - - - 1 1 - - - - - -Malignant neoplasms, other .... 140-203,2 8,209 2 - - - - 2 - - - -Neoplasms, benign and unspecified ..... 210-239 3 - - - 2 1 1 - 1 - - -
Nutritional deficiency ................ 260-269| 65 1 14 16 22 12 752 30 347 163 113 99Vitamin deficiency .................. 260-266 - - - - - - 1 - - - 1 -Protein malnutrition .................... 267 35 - - 5 20 10 47 - 1 11 19 16Nutritional marasmus ..... 2....8... X 20 - 10 7 2 1 135 2 53 39 19 22Other nutritional deficiency .......... .. 269 10 1 4 4 - 1 569 28 293 113 74 61
Endocrine and metabolicdiseases .................... 240-258,270-279 3 - 2 - - 1 3 1 - 2 - -
Deficiency anemias .................... 280-281 - - - - - - 14 5 2 1 3 3Other diseases of blood and
blood-forming organa ................ 282-289 - ..- ..- - - 50 2 17 13 9 9Inflammatory diseases of
central nervous system .............. 20-324 39 3 20 10 6 - 80 13 38 12 16 1Other diseases of nervoussystem and sensee orgEas ..... 310-315,330-389 20 2 9 5 1 3 56 7 13 15 8 13
Diseases of circulatory system ........ 390-458 3 - 1 1 - 1 63 7 31 7 10 8Pneumonia and influenza ............... 470-486 270 82 119 35 23 11 697 119 245 150 108 75Other diseases of
respiratory system .......... 460-466,490-519 107 4 49 22 21 11 62 4 19 14 16 9Diseases of digestive system .......... 520-577 11 2 5 2 - 2 101 14 41 14 13 19Diseases of genito-urinary system ..... 580-629 10 - 4 2 - 4 75 7 39 16 7 6Diseases of skin and
subcutaneous tissue ................. 680-709 12 6 4 1 1 - 40 14 13 4 7 2Diseases of musculoskeletal system .... 710-738 - .... - - - 1 - 1 -
Congenital anomalies .................. 740-759 149 68 55 9 8 9 77 26 29 11 3 8
Nervous system......................740-7473 55 32 13 3 3 4 11 7 2 1 - 1Heart, circulatory system ........... 746,747 46 11 28 3 2 2 22 4 12 2 1 3Respiratory system ...................... 748 3 2 - _- 1 - - - - -Digeetive system .................... 749-751 25 11 8 1 3 2 9 2 3 3 - 1Cenito-urinary system ............... 752,753 2 1 1 - - - 5 3 - 1Musculoskeletal system .............. 754-756 4 3 - 1 - - 5 4 1 -Down's disease ........................ 759. 3 6 2 4 - - - 21 4 9 4 2Other and unspecifiedanomalies ..... 744,745, 757,758,rest of 759 8 6 1 1 - - 4 2 2 - -
Certain causes ofperinatal mortality ................. 760-778 508 502 6 - - - 900 873 26 1 -
Symptoms .............................. 780-78 12 3 6 1 1 1 713 97 347 147 73 49Sudden death .............................. 795 16 2 11 2 1 - - - - - - -Other ill-defined conditions ...... 790-792,796 60 38 9 4 3 6 - - - - - -External causes ..................... E800-E999 36 4 8 3 7 14 62 12 27 7 9 7
Provisional Data
-1
A.
-
-j
-4
r,
l^.
-c
4 s
1
L
0 -¿
L · · · · · I · · · · ·
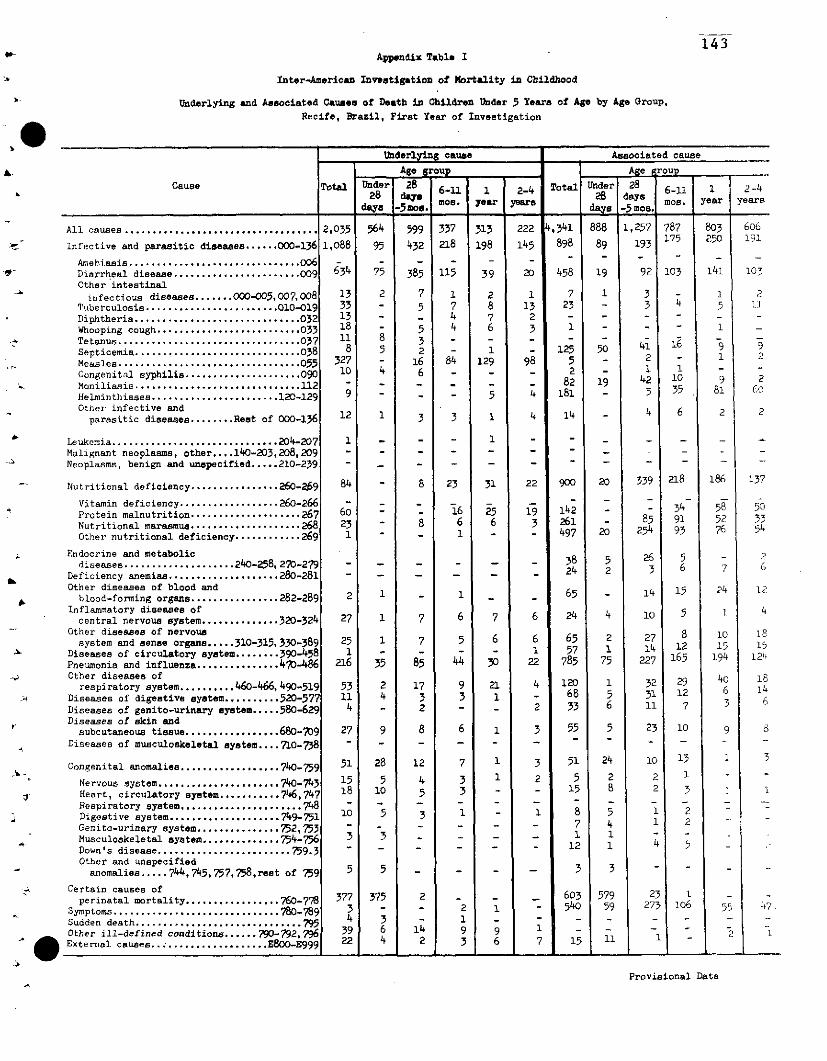
143Appendir Table I
Inter-American Investigation of Mortality in Childhood
Underying anid Associated Causes of Death in Children Under 5 Years of Age by Age Group,Recife, Brazil, First Year of Investigation
tVhderlying cause 1 Asociated causeAge group Age roup
Cause Total Under 282-4 Total Under 28 6-1 1 2-4das6-11 1 2-4 61
28 db', 1 6¡11 28 days28y 5 mos . yeara day mos. year yearrs
_ _ _ __ - _mo_ _. days -5
All causes ................................... 2,035 564 599 337 313 222 4,341 888 1257 787 803 b
Infective and parasitic diseases ...... 000-136 1,088 95 432 218 198 145 898 89 193 175 250 19
Amebiasis .............................. 006 - - - - - -Diarrheal disease....................... 009 634 75 385 115 39 20 458 19 92 103 141 103Other intestinalinfectious diseases....... 000-005,007,008 13 2 7 1 2 1 7 1 3 - 1 2
Tuberculosis ........................ 010-019 33 - 5 7 8 13 23 - 3 4 5 1Diphtheria .............................. 032 13 - - 4 7 2 - - - - -Whooping cough .......................... 033 18 - 5 4 6 3 1 - - - 1 -
Tetanus ................................. 037 11 8 - - - - -Septicemia. ...... .......................038 8 5 2 - 1 - 125 50 41Measles ................................. 5 327 - 16 84 129 98 5 - 2 - 1 2Congenital syphilis ..................... 090 10 4 6 - - - 2 - 1 1 - -Moniliasis .............................. 82 ig 42 10 9 2Moniliasi~~~.112 ~ - . - . - 82 19 42 10 9 2Helminthiases ....................... 120-129 9 - - - 5 4 181 - 35 81 B1Other infective and 4 6 2parasitic diseases ........ Rest of 000-136 12 1 3 1 4 14
Leukemia .............................. 204-207 1 - - - 1 - - - - -Malignant neoplasms, other.... 140-203,208,209 -. - - - -Neoplasms, benign and unspecified..... 210-239 - - - -..
Nutritional deficiency ................ 260-269 84 - 8 23 31 22 900 20 339 218 186 137
Vitamin deficiency.............. 260-266 - - - - - - - -Protein malnutrition...267 60 - 16 25 19 142 - - 34 58 50Nutritional marasmus ................... 268 23 8 6 6 3 261 - 85 91 52 336~~~~~9 620 254 93 76 54Other nutritional deficiency..... ....... 269 i - 1 497 254 93 76 54
Endocrine and metabolicdiseases .................... 240-258, 270-279 38 5 26 5 - 2
Deficiency anemias............. ...... 280-281 24 2 3 6 6Other diseases of blood andblood-forming organs................ 282-289 2 1 - 1 - - 65 - 14 15 24 1
Inflammatory diseases of 4central nervous system ............. 320-324 27 1 7 6 7 6 24 4 10 5 4
Other diseases of nervous 8 10 15system and sense organs ..... 310-315,330-389 25 1 7 5 6 6 65 2 271 -- - - 57 1 14 2 27 1
Diseases of circulatory system ........ 390-458 1 57 i 14 15 15Pneumonia and influenza .............. 470-486 216 35 8; 44 30 22 785 75 227 165 194 24Other diseases of 40
respiratory system.......... 460-466,490-519 53 2 17 9 21 4 120 1 32 29 1Diseases of digestive system .......... 520-577 11 4 3 3 1 - 68 5 31 12 6Diseases of genito-urinary system.....580-629 4 - 2 - - 2 33 6 11 7 3 6Diseases of skin sand
subcutaneous tissue................. 680-709 27 9 8 6 1 55 5 23Diseases of musculoskeletal system .... 710-738 - - - -.
Congenital anomalies .................. 740-759 51 28 12 7 1 3 51 24 10 13 1 313
Nervous system ...................... 740-743 15 5 4 3 1 2 5 2 2 1Heart, circulatory system........... 746,747 18 10 3 - - 15 8 2 3 1Respiratory system ...................... 748 - - - - - - - - --Digestive system ................... 749-751 10 5 3 - 8 5 1 21 7 4 18 2Genito-urinary system ............... 752,753 - - 7Musculoskeletal system ............. 754-756 3 3 - - -1 .... I 1Down's disease ........................ 759.3 - - - - - 12 1 4 5Other and unspecifiedanomalies.....744,745,757,758 ,rest of 759 5 5 - - - -
Certain causes ofperinatal mortality ................. 760-778 77 375 2 - 603 579 23 1 -
Symptoms .............................. 780-789 3 - - 2 1 540 59 273 lo6 5543~~~~~~~~4 592310 5Sudden death..............................795 41 - - - -
Other ill-defined conditions ...... 790-792,796 39 6 14 9 93 1 -
External causes..e .................. E800-E999 22 4 2 6 7 15 11 1
Provisional Data
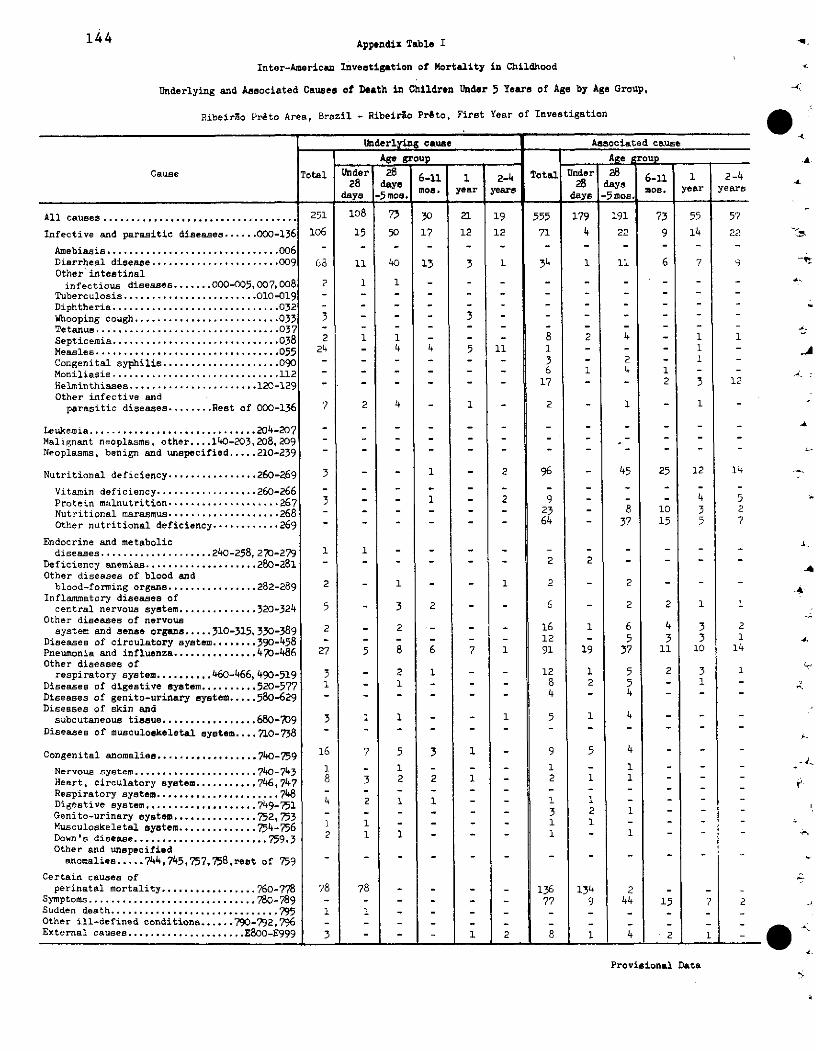
144 Appendix Table I
Inter-American Investigation of Mortality in Childhood
Underlying and Associated Causes of Death in Children Under 5 Yeara of Age by Age Group,
Ribeirao Pr&to Area, Brazil - Ribeirlo PrSto, First Year of Investigation
y ~... -. 1 . .. l . <nIderlyng causee Aseociatecd cause
Age group A-e roup
Cause Total Under 282-4 Tot Undr 2 -1 1 -4~28 1daya 1y6-11 1 2-4MOS. yeardy-28 days o.yere a28 days.
s os. y1 í yeare yearsday- _os. days -5
All causes .................. ................ 251 108 73 30 21 19 555 179 191 73 55 57
Infective and parasitic diseases ...... 000-136 106 15 50 17 12 12 71 4 22 9 14 22
Amebiasis ................... ............ 006
Diarrheal disease ....................... 009 63 11 40 13 3 1 34 1 11 6 7 9Other intestinalinfectious diseases ....... 000-005,007,008 2 1 1 - - - - - -
Tuberculosis ........................ 010-019 - - - - - - - - -
Diphtheria .......................... 03... 032Whooping cough .......................... 033 3 - - - 3Tetanus ................................. 037Septicemia ............................. 038 2 1 1 - - - 8 2 4 - 1 1
Measles ................................. 055 24 4 4 5 1 _Congenital syphilis ..................... 090 3 2 1Moniliasis ........................... 112 ... 6 1 4Helminthiases .......................120-129 - - - - 17 - - 2 3 12Other infective andparasitic diseases ........ Rest of 000-136 7 2 4 - 1 - 2 - 1 - 1
Leukemia .............................. 204-207 - - - - - - - -Malignant neoplasms, other .... 140-203,208,209 .......Neoplasms, benign and unspecified ..... 210-239 - -
Nutritional deficiency ................ 260-69 3 2 96 0-6 45 25 12 14
Vitamin deficiency ................ 260-266 - -Protein malnutrition ....................267 3 1 2 9 4 5Nutritional marasmus ................... 268 23 8 10 3 2Other nutritional deficiency ........... 269 64 37 15 5 7
Endocrine and metabolicdiseases .................... 240-258, 270-279 1 1 - - - -
Deficiency anemias .................... 280-281 2 2Other diseases of blood and
blood-forming organs ................ 282-289 2 - 1 - - 1 2 - 2
Inflammatory diseases ofcentral nervous system .............. 320-324 5 3 2 6 - 2 2 1 1
Other diseases of nervoussystem and sense organs ..... 310-315,330-389 2 - 2 - - 16 1 6 4 3 2
Diseases of circulatory system ........ 390-458 - - - - 12 5 3 3 1Pneumonia and influenza ............... 47-486 27 5 8 6 7 1 91 19 37 11 10 14Other diseases of
respiratory system .......... 460-466, 490-519 3 - 2 1 - - 12 1 5 2 3 1Diseases of digestive system .......... 520-577 1 - 1 - - - 8 2 5 - 1Diseases of genito-urinary system ..... 580-629 - - - - - - 4 - 4 - -
Diseases of skin andsubcutaneoua tissue ................. 680-39 3 1 1 - - 1 5 1 4 - -
Diseases of musculoskeletal system .... 710-738 - - - - - -
Congenital anomalies .................. 740-759 16 7 5 3 -9 5 4
Nervous system ...................... 740-743 1 - 1 - - 1 1
Heart, circulatory system........... 746,747 8 3 2 2 1 - 2 1 1Respiratory system ...................... 748Digestive system .................... 749-751 4 2 1 1 1Genito-urinary system ............... 752,753 ..... 3 2 1
Musculoskeletal system .............. 754-756 1 1 1 1Down's disease ....................... 759.3 2 1 1 1 1Other and unspecifiedanomalies ..... 7
44,7
45,757,75
8,rest of 759
Certain causes ofperinatal mortality ................. 760-778 78 78 - - - - 136 134 2 -
Symptoms ............................ 780-789 ... 77 9 44 15 7 2Sudden death ............................. 795 1 1 - - - - - -Other ill-defined conditions ...... 790-792,796 - - - - - - - -External causes ..................... E800-E999 3 - - _ 1 2 8 1 4 2 1 -
Provisional Data
-A
-L
-A
'
-É
-A-41
0 s
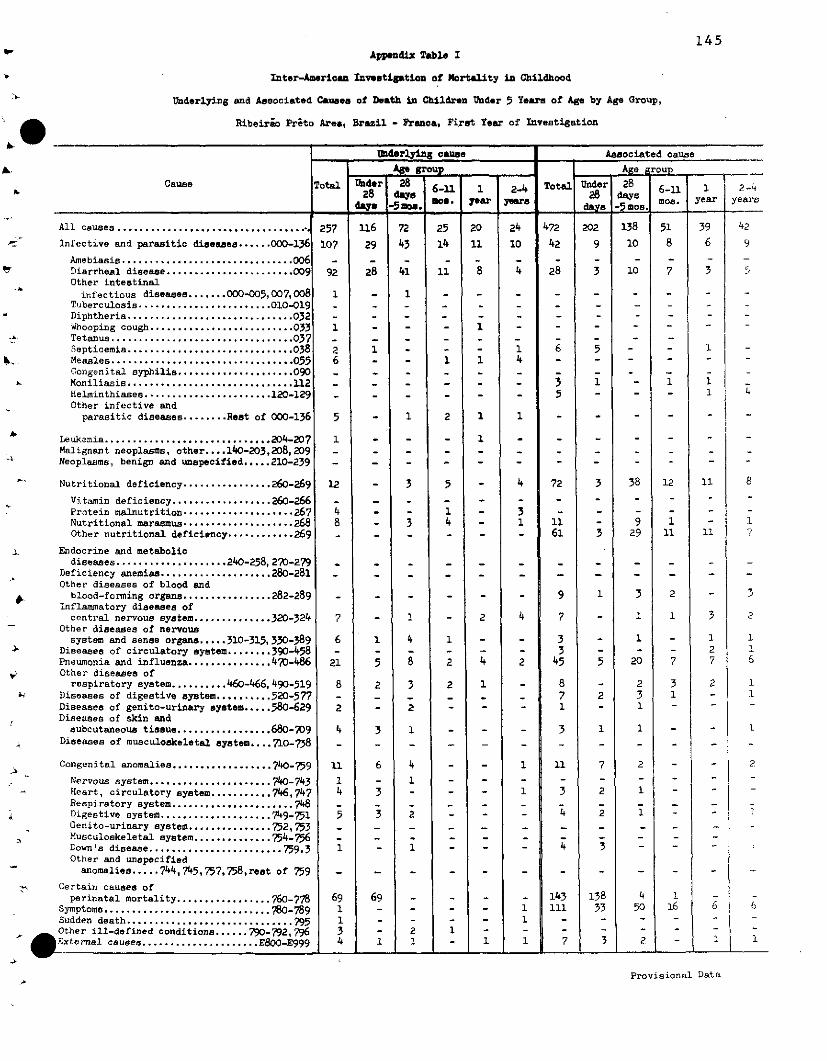
145Appendix Table I
Inter-Aiaerica Investigation of Nortality in Childhood
Underlying and Associated Causes of Death in Children Uindr 5 Yearas of Age by Age Group,
Ribeirao Prito Ares, Brazil - Franca, Firest Year of Investigation
_ derlyi¡n cause Associated cause
- Age grou , Age groupCause Total Undert 28 6- Total Ider 28 1- -6-11 1 2J -4128 da 1e1 128 1 d a
_ _ _ _ _ _ _ _1 _ r. - 1 m o I. year -4 yearamoe. · a ar o.year years-~ S. a~
All causes ................................... 257 116 72 25 20 24 472 202 138 51 39 42
Infective and parasitic diseases ...... 000-136 107 29 43 14 11 10 42 9 10 8 6 9
Amebiasis...............................006 - - - - - - - - - - - -Diarrheal disease....................... 009 92 28 41 11 8 4 28 3 10 7 3 5Other intestinal
infectious diseases ....... 000-005,007,008 1 - 1 - - - - - - - - -Tuberculosis ........................ 010-019 - - - - - -Diphtheria .............................. 032 - - - - - -Whooping cough .......................... 033 1 - - 1 ..Tetanus ................................. 037 - -Septicemia .............................. 038 2 -- 6 5Meaalea ................................. 055 6 - - 1 1 4 - -Congenital syphilis .................... 090 - - -Moniliasis .............................. 112 - - 3HeLninthiases ....................... 120-129 - - - - - 5 - 1 4Other infective and
parasitic diseases ........ Rest of 000-136 5 - 1 2 1 1 -
Leukemia .............................. 204-207 1 - - - 1. .Malignant neoplasma, other .... 140-203,208,209 .- -Neoplasms, benign and unspecified ..... 210-239 - -. . .
Nutritional deficiency ............... 260-a69 12 - 3 5 - 4 72 3 38 12 11 8
Vitamin deficiency ................. 260-266 - - - - - - - - -Protein malnutrition .................... 267 4 - - 1 - 3 - - - -Nutritional marasmus .................... 268 8 - 3 4 - 1 11 - 9 1 - 1Other nutritional deficiency .... ........ 269 - - - - - - 61 3 29 11 11 7
Endocrine and metabolicdiseases .................... 240-258, 270-279 - - - - - - - - - -
Deficiency anemias.................... 280-281 - - - - - - -Other diseases of blood and
blood-formning organs ................ 282-289 - - - - 9 1 3 2 - 3Inflammatory diseases ofcentral nervous system .............. 320-324 7 - 1 - 2 4 7 1 1 3 2
Other diseases of nervoussystem and aenoe organa.....310-315, 330-389 6 1 4 1 - - 3 - 1 - 1 1
Diseases of circulatory syetem........390-458 - - - - - - 3 - - - 2 1Pneumonia and influenza .............. 470-486 21 5 8 2 4 2 45 5 20 7 7 6Other diseases of
respiratory system.......... 460-466, 490-519 8 2 3 2 1 - 8 - 2 3 2 1Diseases of digestive system .......... 520-577 - - - - - - 7 2 3 1 - 1Diseases of genito-urinary system.....580-629 2 - a - - - 1 - 1 - -1Diseases of skin and
subcutaneous tiseue.................680-709 4 3 1 - - - 3 1 1 - - 1Diseases of musculoskeletal system.... 710-738 - - - - - - - - - - -
Congenital anomalies ................. 740-759 11 6 4 - - 1 11 7 2 - - 2
Nervous system ...................... 740-743 1 - 1 - - - - - - -Heart, circulatory system........... 746,747 4 3 - - - 1 3 2 1 - -
Respiratory syatem ...................... 748 - - - - - - - - - -Digestive system ................... 749-751 5 3 2 4 2 1Genito-urinary system ............... 752,753 - - - - - -Musculoskeletal aystem .............. 754-756 - - - - -Down's disease ....................... 9.1 - 1 - - 4 3 -Other and unspecifiedanomalies.....744,745,757,758,resat of 759 - - -..
Certain causes ofperinatal mortality ................ 760-778 69 69 - - 143 138 4 1
Symptoma .............................. 780-789 1 - - 1 11i 33 50 16 6 6Sudden death .............................. 795 1 - - - -1
Other ill-defined conditions ...... 790-792,796 3 - 2 1- - - - -External causes ..................... E8oo00-E999 4 1 1 1 7 3 2 - 1 1
Provisional Data
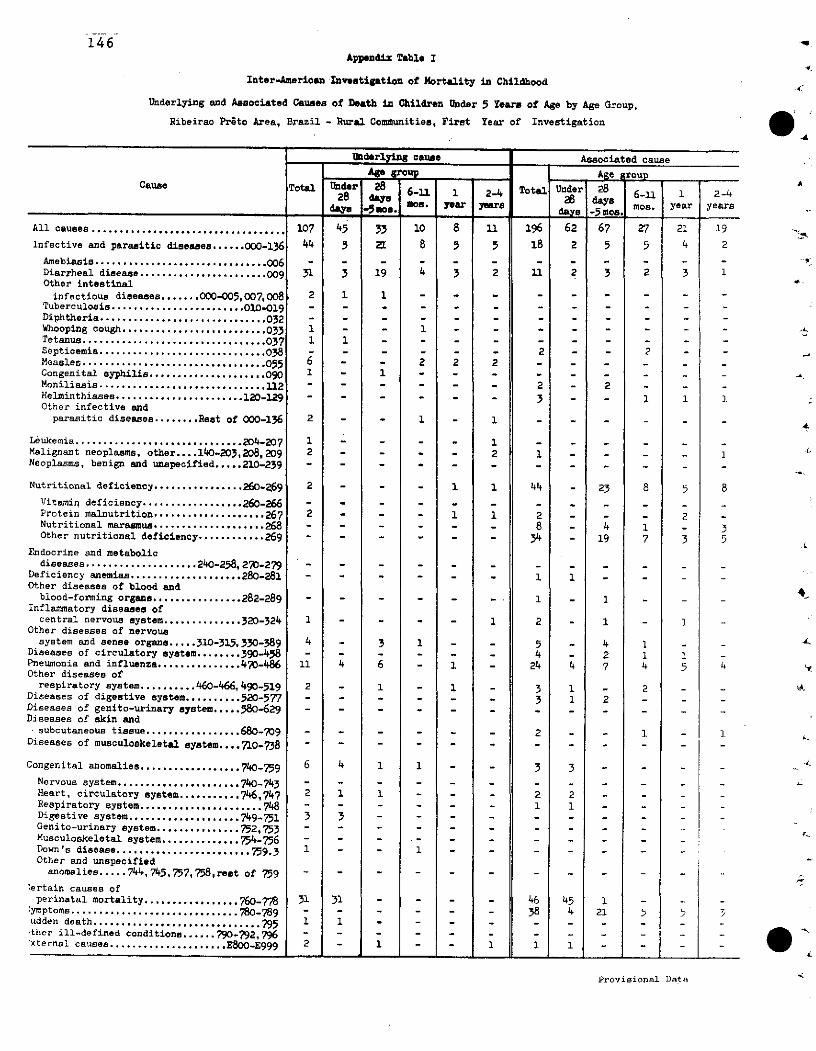
146Appendix Table I
Inter-American Investigation of Hortality in Childhood
Underlying and Associated Causes of Death in Children Under 5 Yeara of Age by Age Group,
Ribeirao Preto Area, Brazil - Rural Communities, First Year of Investigation i
-Uderl~y± cause Associated cause
Cause T ndor 28 Total Under 286·y~ days
28ys daya mO. L da I os. year years____________________ _______________ daya -Saos. c'1__ _ . -5 08All causes ................................... 107 45 33 10 8 11 196 62 67 27 21 19Infective and parasitic diseases ...... 000-136 44 5 2 8 5 5 18 2 5 5 4 2
Amebiasis ............................... 006 -Diarrheal disease ....................... 009 31 3 19 4 3 2 11 2 3 2 3 1Other intestinal
infectious diseases ....... 000-005,007,008 2 1 1 - - - - - - -Tuberculosis ........................ 10-19Diphtheria .............................. 032Whooping cough ................... ....... 03- - 1 -1 -Tetanus ................... .............. 037 1Septicemia .............................. 8 2 - 2Measles ................................ 055 6 - 2 2 2 -_Congenital syphilis ..................... 090 1 - -1- -Moniliasis .............................. 112 - 2 - 2Helminthiases ....................... 120-129 ..... 3 - - 1Other infective and
parasitic diseases ........ Reat of 000-136 2 - 1 - 1 -
Leukemia .............................. 204-207 1 - _ - 1 -Malignant neoplasms, other .... 140-203,208, 209 2 - _ - - 2 1 - - - 1Neoplasms, benign and unspecified ..... 210-239 - - -_ -
Nutritional deficiency ................ 260-269 2 - 1 1 44 - 23 8 5 8Vitamin deficiency .................. 260266 - - - - - - - -Protein malnutrition .................... 267 2 - _ _ 1 1 2 - - 2 -Nutritional marasmus ................... 268 - - 8 - 4 1 - 3Other nutritional deficiency ............ 269 .... - 34 19 7 3 5
Endocrine and metabolicdiseases .................... 240-258, 20-279
Deficiency anemias .................... 280-281 .....- - 1 1 - -Other diseases of blood and
blood-forming organs ................ 282-289 ..... 1 - 1 -Inflammatory diseases of
central nervous system .............. 320-324 1 - 1 2 - 1 1Other diseases of nervous
system and sense organa ..... 310-315,330-389 4 - 3 1 - - 5 - 4 1 _- _Diseases of circulatory system ........ 390-458 - - -_ _ - 4 - 2 1 1Pneumonia and influenza ............... 470-486 11 4 6 - 1 - 24 4 7 4 5 4Other diseases of
respiratory system .......... 460-466, 490-519 2 - 1 - 1 3 1 - 2 -Diseases of digestive system .......... 520-577 - - - 3 1 2 - -Diseases of genito-urinary system ..... 580-629 - - - - - - - -Diseases of skin and
subcutaneous tissue ................. 680-709 .... 2 - 1Diseases of musculoskeletal system .... 710-738 .....- - -
Congenital anomalies .................. 740-759 6 4 1 1 - - 3 - - -Nervous system ...................... 740-743 - - .... - - - - -Heart, circulatory system ........... 746,747 2 1 1 - - - 2 2 - - -Respiratory system ...................... 748 ..... - 1 1 - -Digestive system .................... 749-751 3 3 - - - - - - - - -Genito-urinary system ............... 752,753Musculoskeletal system .............. 754-756 - - - - - - - -Down's disease ........................ 759.3 1 - - -Other and unspecified
anomalies ..... 744,745,757,758,rest of 759 ........
:ertain causes ofperinatal mortality ................. 760-778 31 31 - - - 46 45 1 - -
ymptoms .............................. 780-789 .... - 38 4 21 5 5 3udden death ................. ..... 1.... 795 1 I*ther ill-defined conditions ...... 790-792,796 -'xternal causes E800................... E00-E999 2 1 - - 1 1 1 - - -
Provisional Data
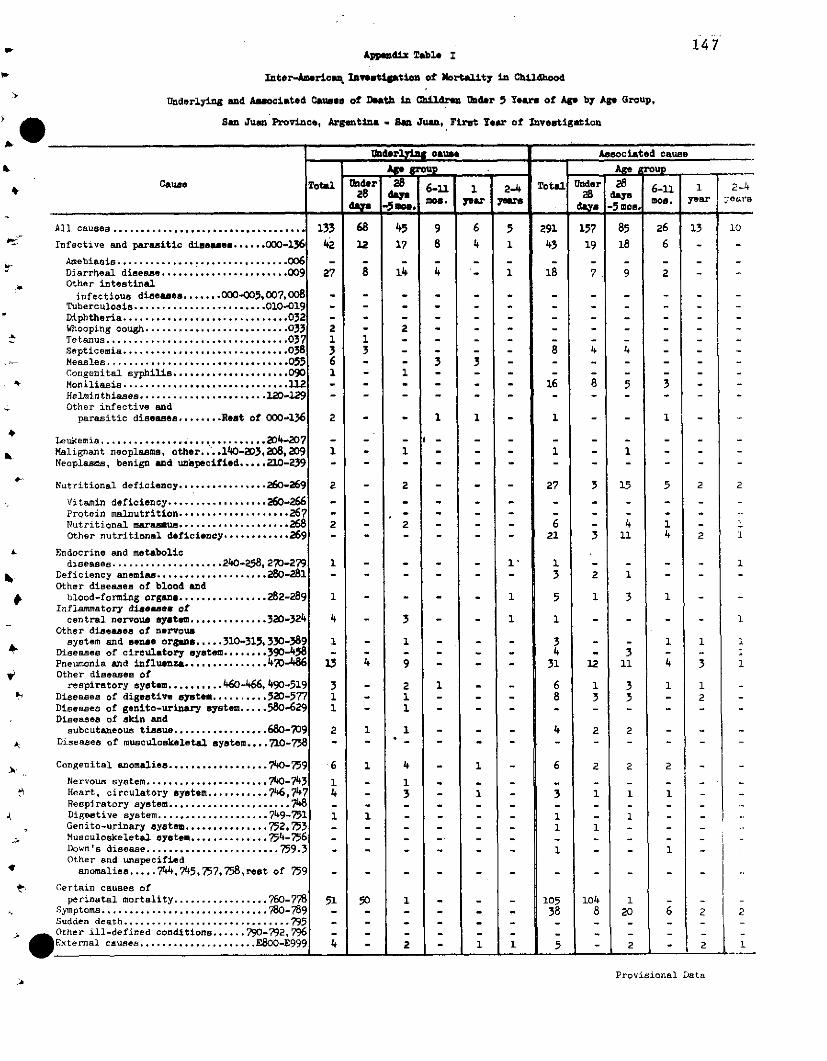
147A»ppedix Table I
Inter-A~ricosa Ivesti±ation of Mortality in Chlldhood
Underlying and A~ociated Causes of D"ath in Chíldrrn Undr 5 YTar of Age by Age Group,
San Juan Provinoe, Argentina - sen Juan, Firet YeToar of Investigation
Uaderl~ cause Aasociated cause
Cause Total d 1 28 6-11 1 2-4 Total Under 6-11 1 2-4
_ dol year yr mos . ¡ear :yerPD·'
All causes ................................... 133 68 45 9 6 5 291 157 85 26 13 10
Infective and parasitic diasase ...... 000-136 4 12 17 8 4 1 43 19 18 6 -
Amebiasis ............................... 006 ......
Diarrheal disease ....................... 009 27 8 14 4 - 1 18 7 9 2 -Other intestinal
infectious diseases ....... 000-005,007,008 ............Tuberculosis ........................ 010-019 ..........
Diphtheria ..............................032 .........Whooping cough .......................... 0 22 2 - 2 _ .Tetanus ............................. 03 1 1Septicemia ......................... 38 ..... 038 3 - - - - 8 4 4 - - -Measles ............... .... ........ 0.....55 6 - - 3 3Congenital syphilis ..................... 09 1 - 1 - -Moniliasis ................... ............. 11 - - - - - 16 8 5 3Helminthiases ................... .... - - - - - - -Other infective and
parasitic diseases ........ Rest of 000-136 2 - - 1 1 - 1 - - 1 - _
Leukemia .......................... .... -207 -..Malignant neoplasma, other.....140-23, 208, |09 1 - 1 - - - 1 - 1 - - -
Neoplasmas, benign and unapecified ...... 210.-29 - ......
Nutritional deficiency................ 260-269 2 - 2 - - - 27 3 15 5 2 2
Vitamin deficiency .................. 260-266 ..........
PrQtein malnutrition ..... ............... 267 - - -Nutritional marasmus . ...... ......... 68 2 - 2 - - - 6 - 4 1 - 1Other nutritional deficincy ......... 269... ..... 21 3 11 4 2 1
Endocrine and metabolicdiseases .................... 240-258, 270-279 1 - -- 1 - - - - 1
h- Deficiency anemias .................... 280-281 - ...- - 3 2 1 - -Other diseases of blood and
blood-forming organa ................ 282-289 1 - - - - 1 5 1 3 1 -Inflammatory diseases of
central nervous system .............. 320-324 4 - 3 - - 1 1 - - - - 1Other diseases of nervous
system and sense organs ..... 310-315, 330-389 1 - 1 - - - 3 - 1 1 1Diseaees of circulatory system ...... 390-458 - - - - - - 4 - 3 1Pneumonia and influenza ...............4-46 13 4 9 - - - 31 12 11 4 3 1Other diseases ofrespiratory system .......... 460-66, 490-519 3 - 2 1 - - 6 1 3 1 1
F' Diseases of digestive system .......... 520-577 1 - 1 - . - 8 3 3 - 2 -Diseases of genito-urinary system ..... 580-629 1 - 1 - - - - - -Diseases of skin and
subcutaneous tiasue ................. 680-709 2 1 1 - - - 4 2 2 - -Diseases of musculoskeletal system .... 710-78 - - ...... - - -
Congenital anomalies .................. 740-759 6 1 4 - 1 - 6 2 2 2 -
Nervous system ..................... 740-743 1 - 1 - -
Heart, circulatory system ........... 746,74 4 - 3 - 1 - 1 1 1 -Respiratory system ...................... 748 .......
Digestive system .................... 749-751 1 1 - - 1 -1Genito-urinary system ............... 752,753 - ...... 1 1Musculoskeletal system .............. 754-756 ......Down's disease ........................ 759.3 ...... - - 1 - - 1
Other and unspecifiedanomalies ..... 7
44,7
45,757,75
8,rest of 759 ..........
C? Certain causes ofperinatal mortality ................. 760-778 51 50 1 - _ _ 105 104 1 - -
Symptoms .............................. 780-789 - - - 38 8 20 6 2 2Sudden death .............................. 795 - - - -
Other ill-defined conditione...... 790-792,796 ........External causes ..................... E800-E999 4 2 1 1 5 2 2 1
Provisional -- 2 ata-
Provisional Data
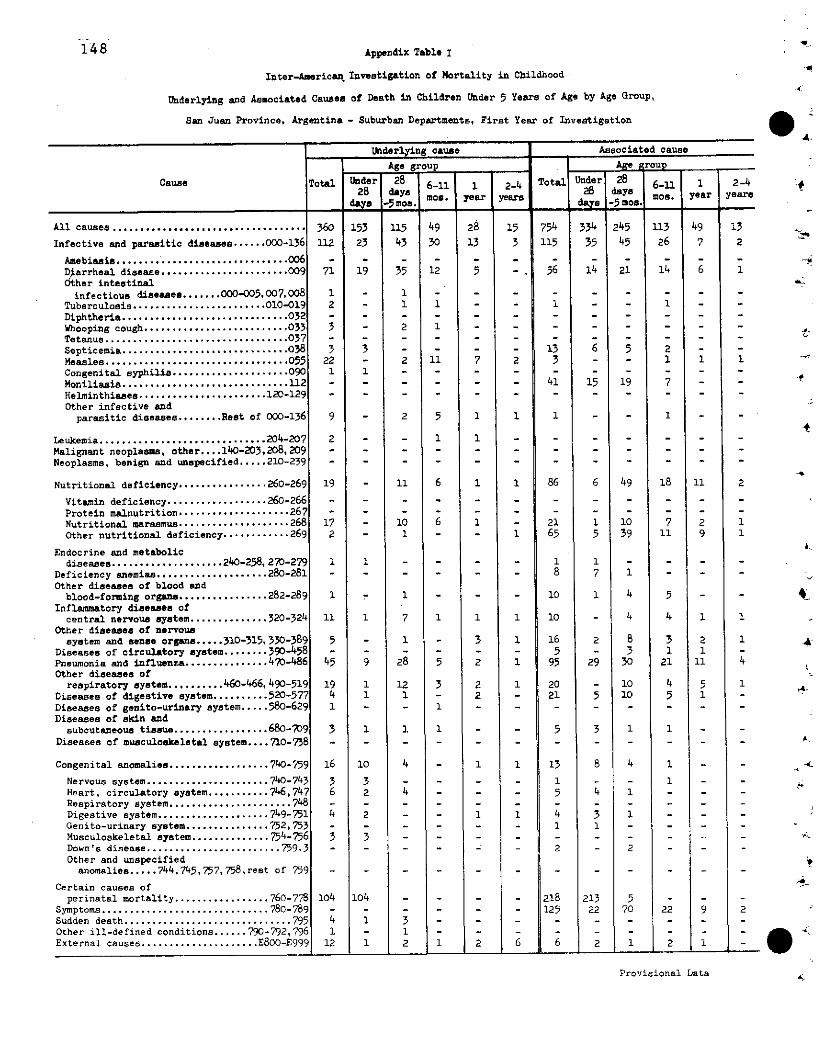
148 Appendix Table I
Inter-American. Inveatigation of Mortality in Childhood
Underlying and Associated Causes of Death in Children Under 5 Years of Age by Age Group,
San Juan Province, Argentina - Suburban Departments, First Year of Investigation ^
Unhderlying cause , Aseociated cause
Age group Age group
-CausoTotal r 28 6-11 1 M4 Total n 6-1 1 2-4os. Fear years os. ear
All causes ................................... 360 153 115 49 28 15 754 334 245 113 49 13
Infective and parasitic diseases ...... 000-136 112 23 43 30 13 3 115 35 45 26 7 2
Amebiasis ... 006 - -................ ...- -Diarrheal disea.e ....................... o09 71 19 35 12 5 56 14 21 14 6 1dther intestinalinfectious diseasee ....... 000-05,007,008 1 - 1 - - - - - - -
Tuberculosis ........................ 010-019 2 - 1 1 - 1 - - 1 - -
Diphtheria .................. 032............Whooping cough ......................... 033 3 2 1 - - - - - - _
Tetanus ......................... 037........ 037
Septicemia .............................. O38 3 3 - - - - 13 6 5 2 -Measles ................................. 055 22 - 2 11 7 2 3 - - 1 1 1
Congenital syphilis ..................... 90 1 1
Moniliasis ................... ...... 112 - - - - - - 41 15 19 7
Helminthiase ....................... 120-129
Other infective andparasitic diseases ........ Rest of 000-136 9 - 2 5 1 1 1 - - 1 - -
Leukemia ......................... 204-207 2 - - 1 1 - - - - - - -
Malignant neoplasms, other .... 140-203,208,209 - - - - - - - - - - -
Neoplasms, benign and unspecified ..... 210-239 - - - - - - - - - - -
Nutritional deficiency ........... ..... 260-269 19 - 11 6 1 1 86 6 49 18 11 2
Vitamin deficiency .................. 260-266 .........
Protein malnutrition .................... 26 - - - - - - - - - - -Nutritional marasmus .................... 268 17 - 10 6 1 - 21 1 10 7 2 1Other nutritional deficiency ............ 269 2 - 1 - - 1 65 5 39 11 9 1
Endocrine and metabolicdiseases .................... 240-258,270-279 1 1 - - - - 1 1 - - - -
Deficiency anemias .................... 280-281 - - - - - 8 7 1 - - -
Other diseases of blood andblood-forming organa ................ 282-289 1 - 1 - - - 10 1 4 5 - -
Inflammatory diseases ofcentral nervous system .............. 320-324 11 1 7 1 1 1 10 - 4 4 1 1
Other diseases of nervoussystem and sense organas ..... 310-315, 330-389 5 - 1 - 3 1 16 2 8 3 2 1
Diseases of circulatory system ........ 390-458 - - - - 3 1 1 -
Pneumonia and influenza ............... 47-486 45 9 28 5 2 1 95 29 30 21 11 4Other diseases ofrespiratory system .......... 460-466, 490-519 19 1 12 3 2 1 20 - 10 4 5 1
Diseases of digestive system .......... 520-577 4 1 1 - 2 - 21 5 10 5 1 -
Diseases of genito-urinary system.....580-629 1 - - 1 - - - - - - - -
Diseases of skin andsubcutaneous tissue ................. 680-709 3 1 1 1 - - 5 3 1 1 - -
Diseases of musculoekeletal system .... 710-738 - - - - - - - - - - - -
Congenital anomalies .................. 740-759 16 10 4 - 1 1 13 8 4 1 - -
Nervous system ...................... 740-743 3 3 - - - - 1 - - 1 - -
Heart, circulatory system ........... 746,747 6 2 4 - - - 5 4 1 - - -
Respiratory system ...................... 748Digestive system .................... 749-751 4 2 - - 1 1 4 3 1 - -
Genito-urinary system ............... 752,753 - ..- - - 1 1 - - - -
Musculoskeletal system .............. 754-756 3 3 - - - - - - - -
Down's disease ........................ 759.3 - - - - - - 2 - 2 -Other and unspecifiedanomalies ..... 744,745,757,758,rest of 759 - - - - - - - - -
Certain causes ofperinatal mortality ................. 760-778 104 104 - - - 218 213 5 - -
Symptoms .............................. 780-789 - - - - - 125 22 70 22 9 2
Sudden death .............................. 795 4 1 3 - - - - - - - - -
Other ill-defined conditions ...... 790-792,796 1 - I1 - - - - - - - -
External causes ..................... E800-E999 12 1 2 1 2 6 6 2 1 2 1 -
Provisional Data
4-t-01
4-Ii
Z
-t
4
la.
y4-A
'4-
l�
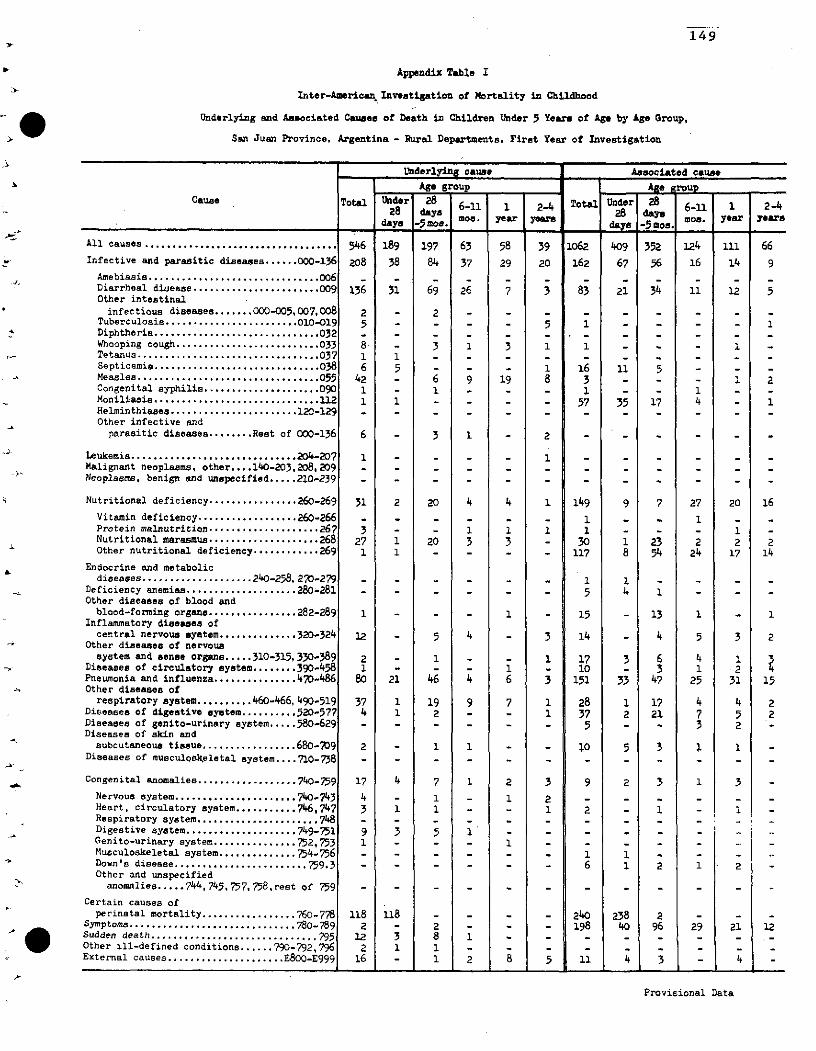
149
Appendix Table I
Inter-American. Investigation Mo ortality in Childhood
Underlying and Associated Causes of Death in Children Under 5 Yeara of Age by Age Group,
San Juan Province, Argentina - Rural Departments, First Year of Investigation
Underlying cause Asaociated cause
Age group -Ae !roupCause 6-11 1 Total Under 228 Tota 1 der
¡ ¡2 1 ___ 1281 daya 6-11 1 2-4d-y_ mos. year year2 ao mos. year yeare-5 mos -1 1 1 dayo 1-5 mos. -
Al causes ................................... 546 189 197 63 58 39 1062 409 352 124 111 66Infective and parasitic diseases ...... 000-136 208 38 84 37 29 20 162 67 56 16 14 9Amebiasis ...............................Diarrheal diease .................. 009 136 31 69 26 7 3 83 21 34 11 12 5Other intestinalinfectious diseases ....... 000-005,007, 008 2 - 2 - - - - - - -
Tuberculosis ....................... 0. 10-019 5 - - - - 5 1 1Diphtheria ............................. 032Whooping cough .......................... 033 8 - 3 1 3 1 1 - 1Tetanus ................................. 037 1 1 - - -Septicemia ................... ........... 038 5 - - - 1 16 11 5Measles ................................ 055 42 - 6 9 19 8 3 _ _ 1 2Congenital syphilis ..................... 090 1 - 1 - - - 1 - - 1 -Moniliasie ................... ........... 1 1 - - - - 57 35 17 4 - 1Helminthiases ....................... 120-129 ..........Other infective andparasitic diseases ........ Rest of 000-136 6 - 3 1 - 2 - - -
Leukemia .............................. 204-207 1 - - - - 1 - - -Malignant neoplasms, other .... 140-203,208,209 .........Neoplasms, benign and unspecified ..... 210-239 ..........
Nutritional deficiency ................ 260-269 31 2 20 4 4 1 149 9 7 27 20 16Vitamin deficiency .................. 260-266 - - - - - - 1 - - 1 - -Protein malnutrition .................... 267 3 - - 1 1 1 1 - - - 1 -Nutritional marasmus .................... 268 27 1 20 3 3 3 1 23 2 2 2Other nutritional deficiency ............ 269 1 1 - - - - 117 8 54 24 17 14
Endocrine and metabolicdiseases .................... 240-258, 270-279 -. - - - - 1 1 - -
Deficiency anemias .................... 280-281 - - - - - - 5 4 1 - -Other diseases of blood and
blood-forming organo ................ 282-289 1 - - - 1 - 15 - 13 1 - 1Inflammatory diseases of
central nervous system ............. 320-324 12 - 5 4 - 3 14 - 4 5 3 2Other diseases of nervous
system and sense organ ..... 310-315, 330-389 2 - 1 _ - 1 17 3 6 4 1Diseases of circulatory system ........ 390-458 1 - - - 1 - 10 - 3 1 2Pneumonia and influenza ............... 470-486 80 21 46 4 6 3 151 33 47 25 31 15Other diseaees of
respiratory system .......... 460-466, 490-519 37 1 19 9 7 1 28 1 17 4 4 2Diseases of digestive system .......... 520-577 4 1 2 - - 1 37 2 21 7 5 2Diseases of genito-urinary system ..... 580-629 - ..- ..- - - - 5 - - 3 2 -Diseases of skin and
subcutaneous tissue ................. 680-709 2 - 1 1 - - 10 5 3 1 1Diseases of musculQskeletal system .... 710-738 - - - - - - - - - - - -
Congenital anomalies .................. 740-759 17 4 7 1 2 3 9 2 3 1 3Nervous system ...................... 740-743 4 - 1 - 1 2 - -Heart, circulatory system ........... 746, 747 3 1 1 - - 1 2 - 1 -Respiratory system ...................... 748 - - - - - - -Digestive system .................... 749-751 9 3 5 1 - - - - -Genito-urinary system ............... 752,753 1 - - - 1Musculoskeletal system .............. 754-756 -. - - - 1 1 ..Down's disease ........................ 759.3 - - - - 6 1 2 1 2 -Other and unspecified
.-~ anomalies ..... 744, 7
45. 757, 75
8, rest of 759 - - - - - - - - - - -
Certain causes ofperinatal mortality ................ 760-778 118 118 - - - - 240 238 2 - -
Symptoms .............................. 780-789 2 - 2 - - 198 40 96 29 21 12Sudden death .............................. 79 12 3 8 1 -
External causes ..................... E800-E999 16 - 1 2 8 5 11 4 3 - 4
Provisional Data

150
Appendix Table 1 -<I
Inter-American Investigation of Nortality in Childhood
Underlyng and Associated Causes of Death in Children Under 5 Years of Age by Age Group, o
San Salvador Area, El Salvador - San Salvador, First Year of Investigation
: Usderl~g cause Associated causeAg roup Age proup
,aya MOS.yar ¡ year 2 d OS. ea yearsCauseda6 Total '"Under1-8 6-11 1 -4
se.year years- - 1 - 7daya ~~~-5 mos.
All causes ................................... 1334 361 411 248 193 121 2419 604 701 460 421 233Infective and parasitic diseaae......000-136 705 81 259 177 115 73 357 49 64 79 103 62Amebiasis ............................... 006 25 - 6 9 6 4 4 - - 1 1 2Diarrhea disease.................... 009 512 44 237 133 62 36 201 12 42 55 66 26Other intestinalinfectious diseases....... 000-005,007,008 9 3 5 - 1 I - 7 1 2 2 2 -
Tuberculosis ........................ 010-019 6 - - 2 - 4 3 - - 1 - 2Diphtheria .............................. 032 8 - - - 1 7 - - - - - -Whooping cough .......................... 033 5 - 1 1 2 1 2 - - 1 1 -Tetanus ................................. 037 12 11 1 - - - - - - - - -Septicemia ................... ........... 8 1 16 3 2 - - 56 32 10 4 6 41Measles ................................. 055 92 1 3 30 42 16 2 - - - 1 1Congenital syphilis .....................090 5 4 1 - - - - 1 - 2 -Moniliasis .............................. 112 2 1 1 - - - 23 4 6 7 6 -Helminthiases ....................... 120-129 2 - - - - 2 53 - I 1 8 18 26Other infective and
parasitic diseases ........ Rest of 000-136 6 1 1 - 1 3 3 - 2 - - 1
Leukemia .............................. 204-207 - - - - - - - - - - - -Malignant neoplasms, other .... 140-2 03 ,208,20 9 2 - - - 1 1 1 - - - - 1Neoplasms, benign and unspecified.....210-239 - - - - - - - - - - - -
Nutritional deficiency ................ 260-269 58 - 7 13 29 9 422 8 140 102 100 72
Vitamin deficiency.................. 260-266 - - - - - - 2* - - - 1 1Protein malnutrition .................. 267 30 - 1 5 18 6 51 - 1 4 23 23Nutritional marasmus ................... 268 27 - 6 7 11 3 86 - 22 27 25 12Other nutritional deficiency ........... 269 1 - - 1 - - 283 8 117 71 51 36
Endocrine and metabolicdiseases ................... 240-258, 270-279 1 - - - 1 - 1 - 1 - - -
Deficiency anemias .................... 280-281 - - - - - - - - - - - -Other diseases of blood and
blood-forming organsa ............... 282-289 1 - - - - 1 42 1 17 10 8 6Inflammatory diseases of
central nervous syatem..............320-324 10 1 4 4 1 - 22 3 8 3 6 2Other diseases of nervous
system and sense organs ..... 310-315,330-389 7 - - 1 4 2 19 4 5 4 4 2Diseases of circulatory system........ 390-458 - - - - - - 54 3 28 8 8 7Pneumonia and influenza .............. 470-486 118 20 58 23 11 6 386 70 122 82 78 34Other diseases of
respiratory system.......... 460-466, 490-519 71 2 34 16 15 4 37 - 16 4 13 4Diseases of digestive system.......... 520-577 5 - 1 - 2 2 56 7 21 13 11 4Diseases of genito-urinary system.....580-629 - - - - - - 13 - 4 4 4 1Diseases of skin and
subcutaneous tissue ................ 680-7o9 7 3 2 - 1 1 17 4 7 1 3 2Diseases of musculoskeletal system .... 710-738 - - - - - - - - - - - -
Congenital anomalies..................740-759 53 22 21 4 2 4 40 14 18 5 2 1Nervous system ...................... 740-743 16 11 4 - - 1 8 5 2 - - 1Heart, circulatory system...........746,747 17 5 7 1 1 3 15 1 10 3 1Respiratory system......................748 - - - - - - - - - -Digestive system ................... 749-751 10 5 5 - - - 3 1 1 - 1Genito-urinary system ............... 752,753 1 - - 1 - - 3 2 1 - -Musculoskeletal system ............. 754-756 2 - 2 - - - 2 2 - - -Down's disease ........................ 759. 3 5 - 2 2 1 - 9 3 4 2 - -Other and unspecifiedanomalies.....7
4 4,7
45,757,75
8,rest of 759 2 1 1 - - - - - - - - -
'ertain causes ofperinatal mortality ................ 760-778 224 222 2 - - - 418 400 18 - - -
,ymptoms .............................. 780-789 2 - 2 - - - 527 39 228 144 81 35udden death .............................. 795 10 3 5 1 1 - - - - - - -ther ill-defined conditions ...... 790-792,796 43 6 12 9 7 9 - - - - -xternal causes ..................... E800-E999 17 1 4 - 3 9 2 4 1 - -
Underlying cause 267 T.,- nf+1 1 i -- -1- -- 1
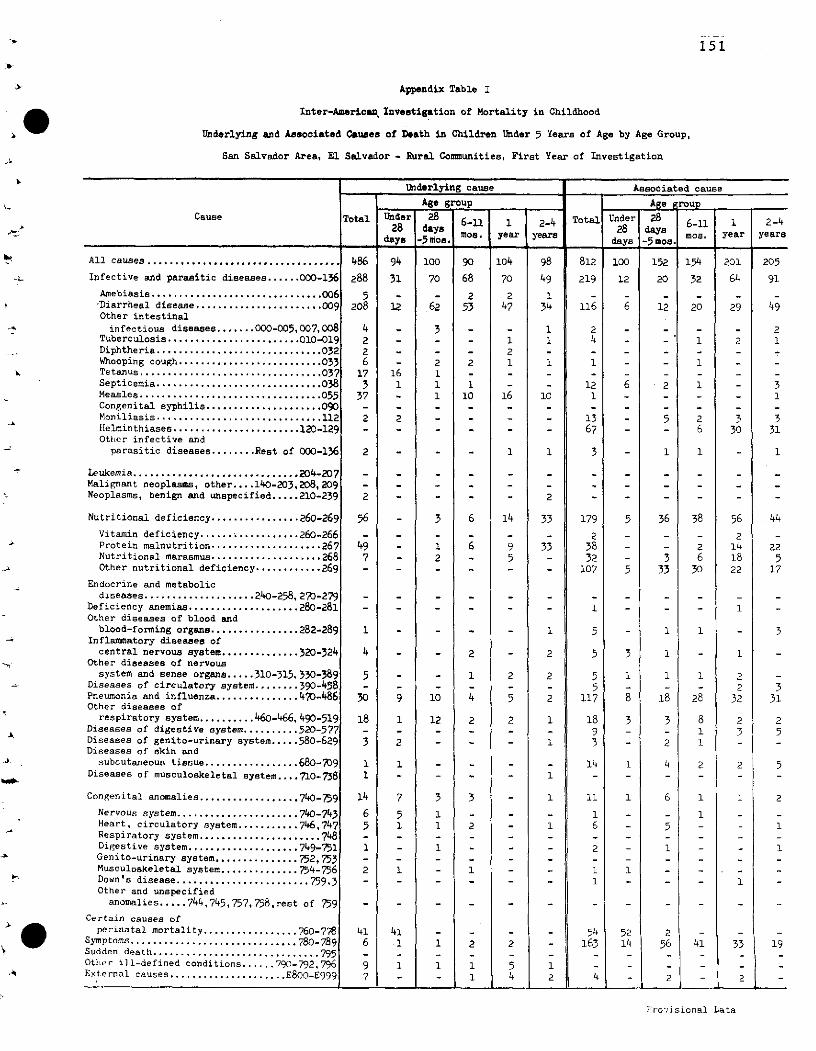
151
Appendix Table I
Inter-American Investigation of Mortality in Childhood
Underlying and Associated Causes of Death in Children Under 5 Years of Age by Age Group,
San Salvador Area, El Salvador - Rural Communities, First Year of Investigation
Underlying cause Associated causeAge group Age roup
Cause Total Under 28 6- Total Under 281 6-11 1 2-46-11 1 2-4 year i28 days 28 day sdaya 5m oeoss. year years
-Sins. days -
All causes ................................... 486 94 o10o 90 104 98 812 100 152 154 201 205Infective and parasitic diseases ...... 000-136 288 31 70 68 70 49 219 12 20 32 64 91
Amebiasis ............................... 006 5 - - 2 2 1 - - - - - -Diarrheal disease ....................... 009 208 12 62 53 47 34 116 6 12 20 29 49Other intestinal
infectious diseases.......000-005,007,008 4 - 3 - - 1 2 - - - - 2Tuberculosis ........................010-019 2 - - - 1 í 4 - - 1 2Diphtheria .............................. 032 2 - - - 2 - - - - - - -Whooping cough .......................... 033 6 - 2 2 1 1 1 - - 1 - -Tetanus ................................. 037 17 16 1 - - - - - - - - -Septicemia .............................. 038 3 1 1 1 - - 12 6 2 1 - 3Measles ................................. 055 37 - 1 10 16 10 1 - - - - 1Congenital syphilis ..................... 090 - - - - - - - - - - - -Moniliasis .............................. 112 2 2 - - - - 13 - 5 2 3 3l{elminthiases ...................... 120-129 - - - - - - 67 - - 6 30 31Other infective andparasitic diseases ........ Rest of 000-136 2 - - - 1 1 3 - 1 1 - 1
Leukemia .............................. 204-207 - - - - - - - - - - - -Malignant neoplasms, other .... 140-203,208,209 - - - - - - - - - - - -Neoplasms, benign and unspecified.....210-239 2 - - - - 2 - - - - - -
Nutritional deficiency ............... 260-269 56 - 3 6 14 33 179 5 36 38 56 44
Vitamin deficiency...... ........... 260-266 - - - - - 2 - - - 2 -Protein malnutrition .................... 267 49 - 1 6 9 33 38 - - 2 14 22Nutritional marasmus ................... 268 7 - 2 - 5 - 32 - 3 6 18 5Other nutritional deficiency ............ 269 - - - - - - 107 5 33 30 22 17
Endocrine and metabolicdiseases ................... 240-258, 270-279 - - - - - - - - - - - -
Deficiency anemias....................280-281 - - - - - - 1 - - - 1 -Other diseases of blood andblood-forming organs ................ 282-289 1 - - - - 1 5 - 1 1 - 3
Inflammatory diseases ofcentral nervous system ............. 320-324 4 - - 2 - 2 5 3 1 - 1 -
Other diseases of nervoussystem and sense organs .....310-315,330-389 5 - - 1 2 2 5 1 1 1 2 -
Diseases of circulatory system ........ 390-458 - - - - - - 5 - - - 2 3Pneumonia and influenza .............. 470-486 30 9 10 4 5 2 117 8 18 28 32 31Other diseases of
respiratory system.......... 460-466, 490-519 18 1 12 2 2 1 18 3 3 8 2 2Diseases of digestive system .......... 520-577 - - - - - - 9 - - 1 3 5Diseases of genito-urinary system ..... 580-629 3 2 - - - 1 3 - 2 1 - -Diseases of skin andsubcutaneous tiesue ................ 680-09 1 1 - - - - 14 1 4 2 2 5
Diseases of musculoskeletal system .... 710-738 1 - - - - 1 - - - - - -
Congenital anomalies ................. 740-759 14 7 3 3 - 1 11 1 6 ! 1 2
Nervous system ...................... 740-743 6 5 1 - - - 1 - - 1 - -Heart, circulatory system........... 746,747 5 1 1 2 - 1 6 - 5 - - 1Respiratory system......................748 - - - - - - - - - - - -Digestive system ................... 749-751 1 - 1 - - - 2 - 1 - - 1Genito-urinary system ............... 752,753 - - - - - - - - - - -Musculoskeletal system ............. 754-756 2 1 - 1 - - 1 1 - - -Down's disease........................759.3 - I - - - - 1 - - 1Other and unspecifiedanomalies.....7
44,745,757,758,rest of 759 - - - - - - -
Certain causes ofperinatal mortality.................760-778 41 41 - - - - 54 52 2 -O· Symptoms .............................. 780- 789 6 4 1 2 - 163 1 6 4 3 16 1 1 2 2 - 163 14 56 41 33 19
Sudden death..............................795 - - - - - - - - - - - -Other ill-defined conditions...... 790-792,796 9 1 1 1 5 1 - - - - - -External causes .....................E8o00-E999 7 - - 1 4 2 4 - 2 2
Provisional LData
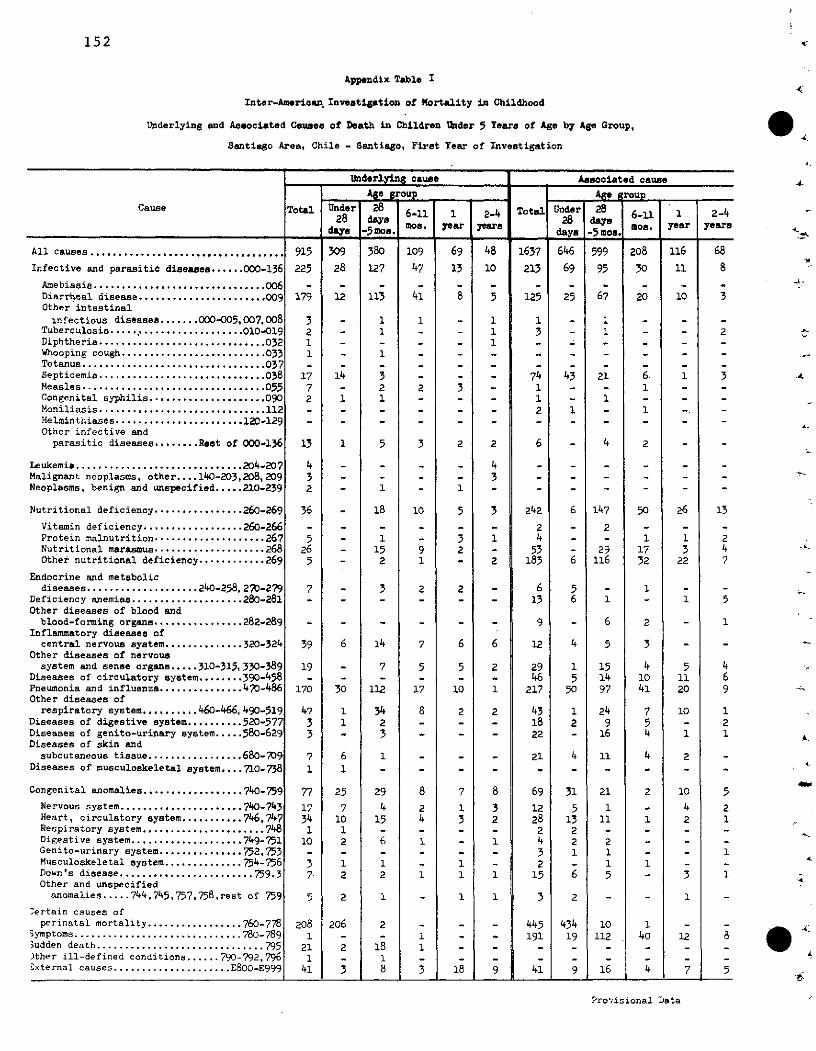
152
Appendix Table I
Inter-American. Invetigation of Mortality in Childhood
Underlying and Asociated Causes of Death in Children Under 5 Yeara of Age by Age Group, l
Santiago Area, Chile - Santiago, First Year of Investigation
Underlying cause Associated cause
Age group A-e groupCause Total Undr 2_ 6-11 T- Under -5 a21 - -2 4
me. daysd~~~~~~~~~~~~~os.ye a e r
All causes .................................. 915 309 380 109 69 48 1637 646 599 208 116 68
Infective and parasitic diseases ...... 000-136 225 28 127 47 13 10 213 69 95 30 11 8
Amebiasis ............................... 006Diarrheal disease ....................... 009 179 12 113 41 8 5 125 25 67 20 10 3Other intestinalinfectious diseases ....... 000-005,007,008 3 - 1 1 - 1 1 - 1 - - -
Tuberculosis ........................ 010-019 2 - 1 - - 1 3 1 - -1 2Diphtheria ...... ...................... 032 1 - 1 - - - -Whooping cough .......................... 033 1 - 1 - - - - - - - -Tetanus ................................. 037Septicemia .............................. 038 17 14 3 - - - 74 43 21 6 1 3Measles ............................... 055 7 - 2 2 3 - 1 - - 1 - -Congenital syphilis ..................... 090 2 1 1 - - - 1 - 1 - - -Moniliasis .............................. 112 - - - - - - 2 1 - 1 - -Helminthiases ....................... 120-129 - - - - - - - - - - - -Other infective andparasitic diseases ........ Rest of 000-136 13 1 5 3 2 2 6 - 4 2 - -
Leukemia .............................. 204-207 4 - - _- 4 - - - -Malignant neoplasms, other .... 140-203,208, 209 3 - - - - 3 - - - -_Neoplasms, benign and unspecified ..... 210-239 2 - 1 - 1 - - - - -
Nutritional deficiency ................ 260-269 36 - 18 10 5 3 242 6 147 50 26 13
Vitamin deficiency .................. 260-266 - ...- - - - - 2 - 2 - - -Protein malnutrition ................ ....267 5 - 1 - 3 1 4 - - 1 1 2Nutritional marasmus .... ........... 268 26 - 15 9 2 - 53 - 29 17 3 4Other nutritional deficiency . ........... 269 5 - 2 1 - 2 183 6 116 32 22 7
Endocrine and metabolicdiseases .................... 240-258, 270-279 7 - 3 2 2 - 6 5 - 1 - -
Deficiency anemias .................... 280-281 - - - - - 13 6 1 - 1 5Other diseases of blood andblood-forming organa ................ 282-289 - - .- - - 9 - 6 2 - 1
Inflammatory diseases ofcentral nervous system .............. 320-324 39 6 14 7 6 6 12 4 5 3 - -
Other diseases of nervoussystem and sense organs ..... 310-315, 330-389 19 - 7 5 5 2 29 1 15 4 5 4
Diseases of circulatory system ........ 390-458 - - - - - - 46 5 14 10 11 6Pneumonia and influenza ............... 470-486 170 30 112 17 10 1 217 50 97 41 20 9Other diseases ofrespiratory system .......... 460-466, 490-519 47 1 34 8 2 2 43 1 24 7 10 1
Diseases of digestive system .......... 520-577 3 1 2 - - - 18 2 9 5 - 2Diseases of genito-urinary system ..... 580-629 3 - 3 - - - 22 - 16 4 1 1Diseases of skin and
subcutaneous tissue ................. 680-709 7 6 1 - - - 21 4 11 4 2 -Diseases of musculoskeletal system .... 710-738 1 1 - - - -_ - - - - -
Congenital anomalies .................. 740-759 77 25 29 8 7 8 69 31 21 2 10 5Nervous system ...................... 740-743 17 7 4 2 1 3 12 5 1 - 4 2Heart, circulatory system ........... 746, 747 34 10 15 4 3 2 28 13 11 1 2 1Respiratory system ...................... 748 1 1 - - - - 2 2 - - - -Digestive system .................... 749-751 10 2 6 1 - 1 4 2 2 - - -Genito-urinary system ............... 752,753 - - - - - - 3 1 1 - - 1Musculoskeletal system .............. 754-756 3 1 1 - 1 - 2 - 1 1 - -Down's disease ........................ 3759. 7. 2 2 1 1 1 15 6 5 - 3 1Other and unspecified
anomalies ..... 74 4,7
45,757,75
8,rest of 759 5 2 1 - 1 1 3 2 - - 1 -
'ertain causes ofperinatal mortality ................. 760-778 208 206 2 - - - 445 434 10 1 - -
iymptoms .............................. 780-789 1 - - 1 - 191 19 112 40 12 8;udden death .............................. 795 21 2 18 1)ther ill-defined conditions ...... 790-792,796 1 - 1 - - - - - - -'xternal causes ..................... E800-E999 41 3 8 3 18 9 41 9 16 4 7 5
Provisional Data
4-
-4
;L
-4
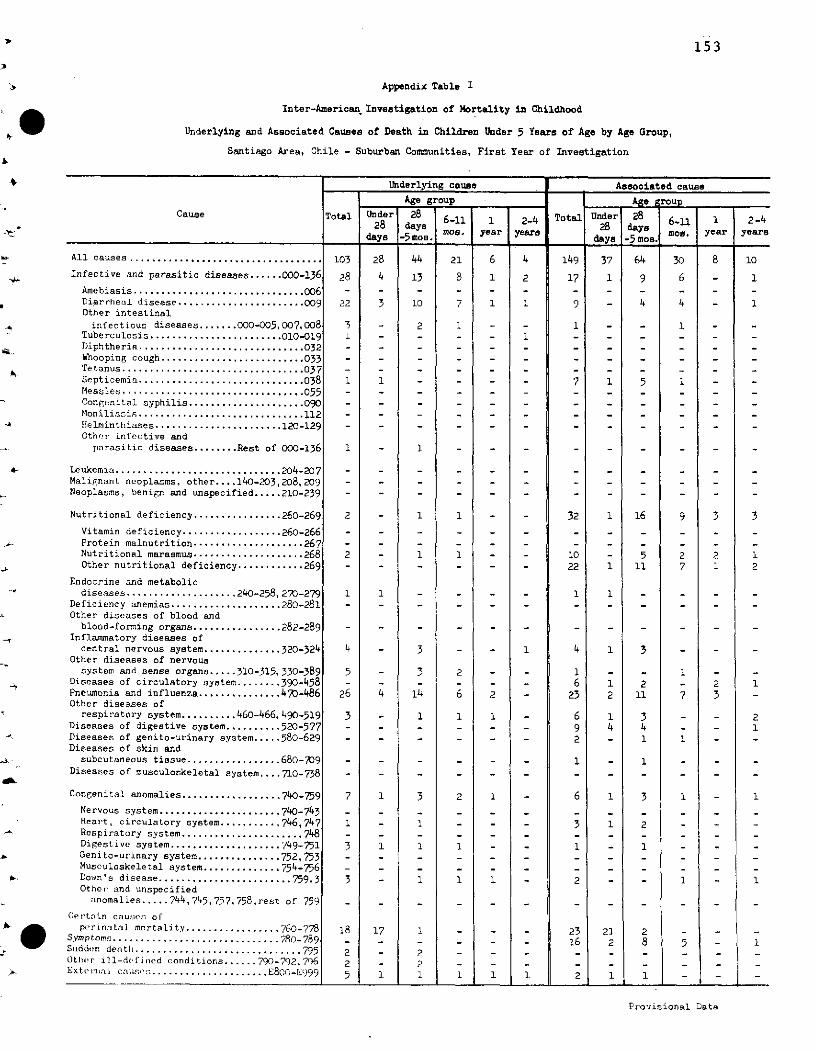
153
Appendix Table I
Inter-American. Investigation of 4ortality in Childhood
Underlying and Associated Causes of Death in Children Under 5 Years of Age by Age Group,
Santiago Area, Chile - Suburban Communities, First Year of Investigation
4 Underlying cause Associated causeAge group Ae roup
Cause Total Under 28 Under 2 - 1 2-428 days 28 days. mos. year yeara MOS. year yearsdaya -5 mos. days -5 .
All causes ................................. 103 28 44 21 4 149 37 64 30 8 10Infective and parasitic diseases ...... 000-136 28 4 13 8 1 2 17 1 9 6 - 1Amebiasis ............................... 006Diarrheal disease ....................... 009 22 3 10 7 1 1 9 - 4 4 - 1Other intestinalinfectiour diseases ....... 000-005,007,008 3 - 2 1 i 1 - - 1 -
Tuberculosis ........................ 010-019. 1 - - - - - -Diphtheria .............................. 032 - -Whooping cough .......................... 033 - -Tetanus ................................. 037 - - -Septicemia .............................. 1 1 - 7 1 5 1 - -Measles ............................ 055.....Congenital syphilis ..................... 090 ........Moniliasis .......................... 112 ....llelminthiases ....................... 12-129Other infective andparasitic diseases ........ Rest of 000-136 1 - 1 . -
Leukemia ............................. 204-207 - - - - -Malignant neoplasms, other .... 140-203,208,209 .........Neoplasms, benign and unspecified ..... 210-239 - - - - -
Nutritional deficiency ............... 260-269 2 - 1 1 - - 32 1 16 9 3 3
Vitamin deficiency ................. 260-266Protein malnutrition ................... 267Nutritional marasmus .................... 268 2 - 1 1 - 10 5 2 2 1Other nutritional deficiency ............ 269 - ..- _- 22 1 11 7 1 2
Endocrine and metabolicdiseases .................... 240-258, 270-279 1 1 - - 1 1 - - - -
Deficiency anemias .................... 280-281 .......Other diseases of blood and
blood-forming organs ................ 282-289Inflammatory diseases of
central nervous system .............. 320-324 4 - 3 - - 1 4 1 3 - -Other diseases of nervoussystem and sense organs ..... 310-315, 330-389 5 - 3 2 - 1 - - 1 - -
Diseases of circulatory system ........ 390-458 - - - -_ 6 1 2 - 2 1Pneumonia and influenza ............... 470-486 26 4 14 6 2 - 23 2 11 7 3Other diseases of
respiratory system .......... 460-466, 490-519 3 - 1 1 1 - 6 1 3 - - 2Diseases of digestive system .......... 520-577 - - - - - - 9 4 4 - - 1Diseases of genito-urinary system ..... 580-629 - - .- - - 2 - 1 1 - -Diseases of skin and
subcutaneous tissue ................. 680-709 - - .... 1 - 1 - - -Diseases of musculoskeletal system .... 710-738 - - - - - - - - - - -
Congenital anomalies .................. 740-759 7 1 3 2 1 - 6 1 3 1 - 1Nervous system ...................... 740-743Heart, circulatory system ........... 746,747 1 - 1 - - - 3 1 2 - - -Respiratory system ...................... 748 -Digestive system .................... 749-751 3 1 1 1 - - 1 - 1 - - -Genito-urinary system ............... 752,753 - - - - - - - - - - - -Musculoskeletal system .............. 754-756Down's disease ........................ 759.3 3 - 1 1 1 - 2 - - I1 1Other and unspecified
anomalies ..... 74 4,7
45,757,75
8,rest of 759 - - - - - - - - - -
Certain causes ofperinatal mortality ................. 760-778 18 17 1 - - - 23 21 2 -
Symptoms .............................. 780-789 - - - - - - 16 2 8 5 - 1Sudden death .............................. 795 2 - 2 - - - - - - -Other ill-de fined conditions ...... 790-792, 796 2 - 2 - - - - - - - -External callsa ..................... E80O-E')99 5 1 1 1 1 1 1t 1 i 1 1 1 2 1 1 -________ _______ _______~~ ~~~~~~~ - z
Provisional Data
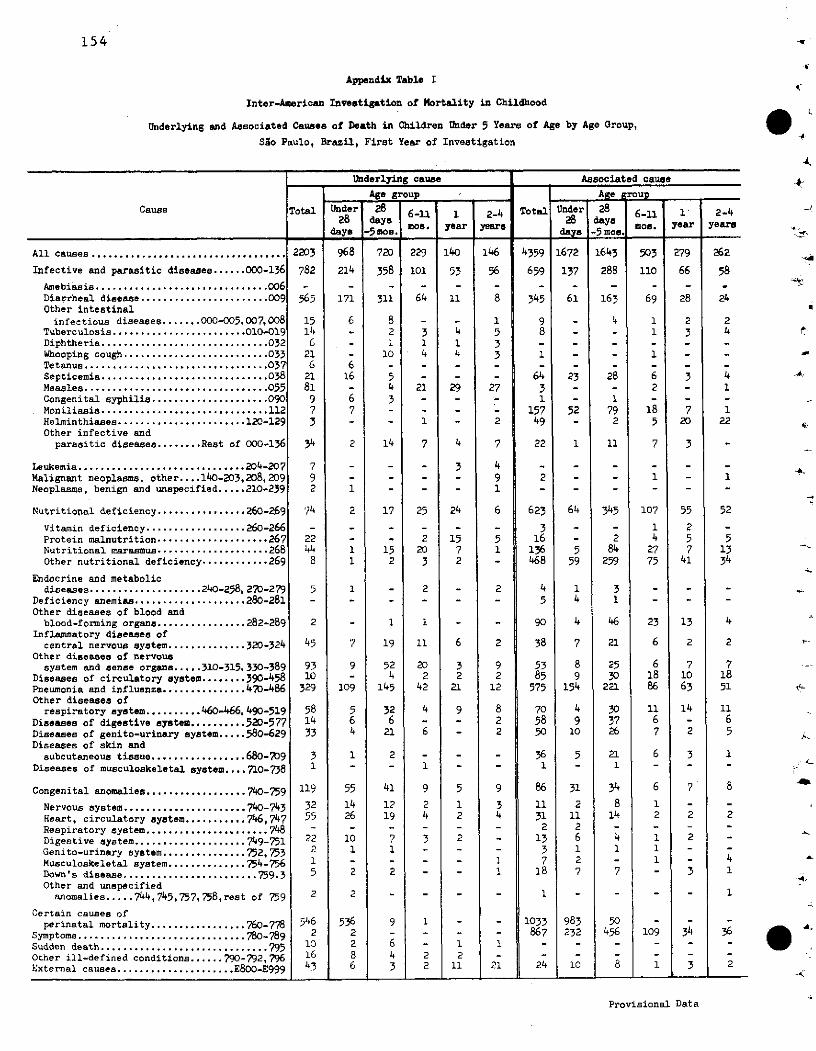
154
Appendix Table I
Inter-American Investigation of Nortality in Childhood
Underlying and Associated Causes of Death in Children Under 5 Years of Age by Age Group, oSao Paulo, Brazil, First Year of Investigation
Underlying cause Associated cause
Age group - Age rou -
Cause Total nder1 28 1 2-4 Total Under 28 6-11 1 2-428 daya year years days mos. year years
-_smos. da -5 mos.
All causes ................................... 2203 968 720 229 140 146 4359 1672 1643 503 279 262
Infective and parasitic diseases ...... 000-136 782 214 358 101 53 56 659 137 288 110 66 58
Amebiasis ............................... 006 - - - - - - - - - - -Diarrheal disease ....................... 009 565 171 311 64 11 8 345 61 163 69 28 24Other intestinalinfectious diseases ....... 000-005,007,008 15 6 8 - - 1 9 - 4 1 2 2
Tuberculosis ........................ 010-019 14 - 2 3 4 5 8 - - 1 3 4Diphtheria .............................. 032 6 - 1 1 1 3 - - - - - -Whooping cough ................... ....... 033 21 - 10 4 4 3 1 - - 1 - -Tetanus ................................. 037 6Septicemia ............................. 038 21 16 5 - - - 64 23 28 6 3 4Measles ................................. 055 81 - 4 21 29 27 3 - - 2 - 1Congenital syphilis ..................... 090 9 6 3 - - 1 - 1 - - -Moniliasis .............................. 112 7 7 - - - - 157 52 79 18 7 1Helminthiases ....................... 120-129 3 - - 1 - 2 49 - 2 5 20 22Other infective and
parasitic diseases ........ Rest of 000-136 34 2 14 7 4 7 22 1 11 7 3 -
Leukemia ............................. 204-207 7 - - - 3 4 - - - - - -Malignant neoplasms, other .... 140-203,208,209 9 - - - - 9 2 - - 1 - 1Neoplasms, benign and unspecified ..... 210-239 2 1 - _ _ 1 - - - - - -
Nutritiopal deficiency ................ 260-269 74 2 17 25 24 6 623 64 345 107 55 52
Vitamin deficiency .................. 260-266 ... - - - 3 - - 1 2 -Protein malnutrition .................... 267 22 - - 2 15 5 16 - 2 4 5 5Nutritional marasmus .................... 268 44 1 15 20 7 1 136 5 84 27 7 13Other nutritional deficiency ............ 269 8 1 2 3 2 - 468 59 259 75 41 34
Endocrine and metabolicdiseases .................... 240-258, 270-279 5 1 - 2 - 2 4 1 3 - - -
Deficiency anemias .................... 280-281 - - - - - 5 4 1 - - -Other diseases of blood andblood-forming organa ................ 282-289 2 - 1 1 - - 90 4 46 23 13 4
Inflammatory diseases ofcentral nervous system .............. 320-324 45 7 19 11 6 2 38 7 21 6 2 2
Other diseases of nervoussystem and sense organa ..... 310-315,330-389 93 9 52 20 3 9 53 8 25 6 7 7
Diseases of circulatory system ........ 390-458 10 - 4 2 2 2 85 9 30 18 10 18Pneumonia and influenza ............... 470-486 329 109 145 42 21 12 575 154 221 86 63 51Other diseases ofrespiratory system .......... 460-466, 490-519 58 5 32 4 9 8 70 4 30 11 14 11
Diseases of digestive system .......... 520-577 14 6 6 - - 2 58 9 37 6 - 6Diseases of genito-urinary system ..... 580-629 33 4 21 6 - 2 50 10 26 7 2 5Diseases of skin and
subcutaneous tissue ................. 680-709 3 1 2 - - - 36 5 21 6 3 1Diseases of musculoskeletal system .... 710-738 1 - - 1 - - 1 - 1 - - -
Congenital anomalies .................. 740-759 119 55 41 9 5 9 86 31 34 6 7 8
Nervous system .................. .. 740-743 32 14 12 2 1 3 11 2 8 1 - -Heart, circulatory system ........... 746, 747 55 26 19 4 2 4 31 11 14 2 2 2Respiratory system ...................... 748 2 2 - - - -Digestive system .................... 749-751 22 10 7 3 2 - 13 6 4 1 2 -Genito-urinary system ............... 752,753 2 1 1 - - - 3 1 1 1Musculoskeletal system .............. 754-756 1 - - - 1 7 2 - 1 4Down's disease ........................ 759.3 5 2 2 - 1 18 7 7 - 3 1Other and unspecifiedanomalies ..... 7
44,7
45,757,75
8,rest of 759 2 2 - - - - 1 - - - - 1
Certain causes ofperinatal mortality ................. 760-778 546 536 9 1 -_ 1033 983 50 - - -
Symptoms .............................. 780-789 2 2 - - - - 867 232 456 109 34 36Sudden death .............................. 95 10 2 6 - 1 1 - - - - - -Other ill-defined conditions ...... 790-792,796 16 8 4 2 2 - - - - - - -External causes ..................... E800-E999 43 6 3 2 11 21 24 10 8 1 3 2
-a9
1-1
-4f
1i
4
rA
9 ,
Provisional Data
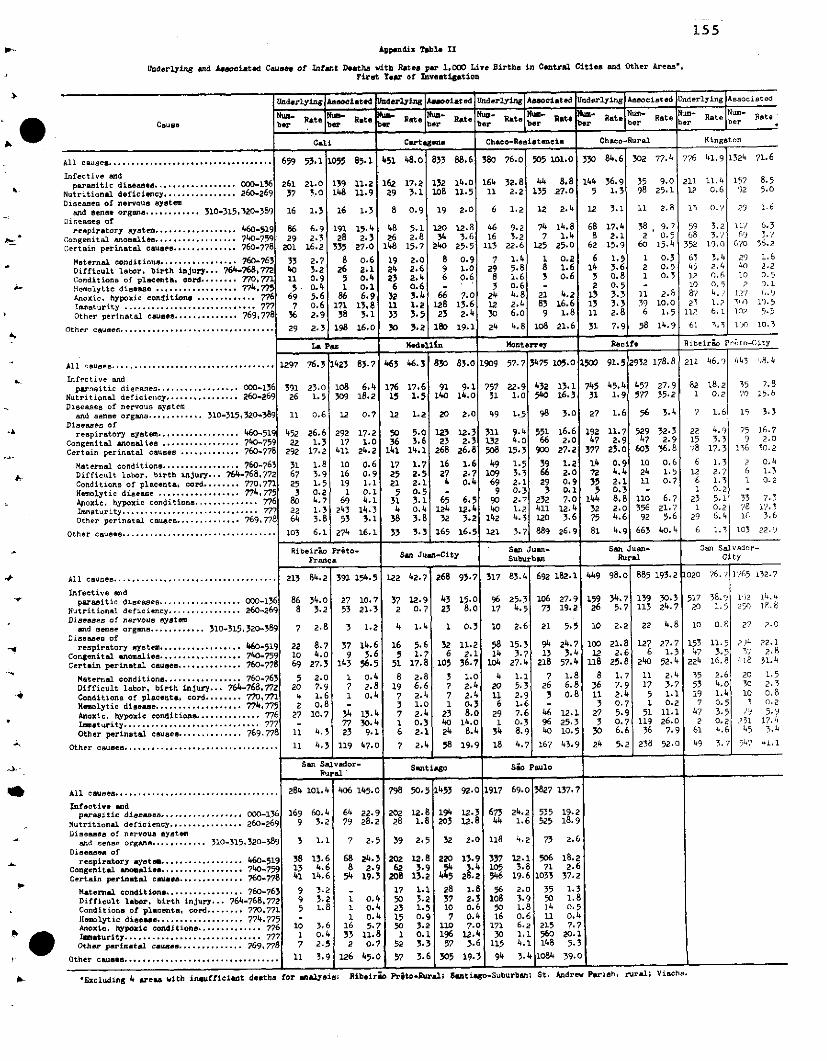
155Appendix Tabla II
Underlying and Aasciated Causes of Intant Deaths with iteos par 1,000 Live Births in Central Cities and Other Areas',First YeToar of Invetiation
Underlying Asaocieted Ulnderlying Aaeooiated Underlyin t rlying Astsocist sd Underlying Associated
Nu-a- Nu N NPu u um-Rato Ratte Rate Rt Rato Rte Rato Rate Rate
Cause bheara a b a r bar aerh e
Cali Cartagen j Chaco-Ressitencia Chaco-Rural KingstonCaiston r 1
All causes....................................
Infective andparasitic diseases ................. -136
Nutritional deficiency ................ 260-269Diseases of nervous system
and sense organo ............ 310-315,320-389Diseases of
respiratory system .................. 460-519Congenital anomalies ................ 740-759Certain perinatal causes .............. 760-778
Maternal conditions ................. 760-763Difficult labor, birth injury... 764-768,772Conditions of placenta, cord ........ 770,771liemolytic disease .................. 774,775Anoxic, hypoxic conditions ...... ....... 7?Immaturity ........................ ..... 777Other perinatal causes .............. 769,778
Other cause ..................................
All causes ..... .............................
Infective andparasitic diseanes .................. 000-136
Nutritional deficiency ................ 260-269Diseases of nervolis system
and sense organs............ 310-315,320-389Diseases of
respiratory system .................. 460-519Congenital anomalies ................. 740-759Certoin perinatal causes ............. 760-778
Maternal condition s ......... 7.. .. ?60-763»-1 Difficult labor, birth injury... 764-768,772
Conditions of placenta,. cord........ 770,771Hemolytic disease ................. 74,775AAnoxic, hypoxic conditions......... 776Immaturity ............................. 777Other perinatal causes .............. 769,778
Other causes....... ........................
All causes ..............................
Infective andparasitic diseases ................... 000-136
Nutritional deficiency ................ 260-269Diseases of nervous aystes
and sense organs ............ 310-315,320-389Diseases of
respiratory yestem .................. 460-519Congenital anomalies .................. 740759Certein perinatal cau es.............. 760-778
Maternal condition ............... 760-763Difficult labor, birth injury... 764-768,772Conditions of placenta, cord........ 770,771Hemolytic diseas e .................. 4775Anoxic, hypoxic condition ........... 776Iaouturity ........................ ... 777Other perinatal causes .............. 769,778
Other causes........... ......................
All causes .................... .............
Infective andparasitic diocases .... ........... 000-136
Nutritional deficiency . . 260-269Diseases of nervous system
and sense organa ............ 310-315,320-389Diseases of
respiratory yoste ... . . 460-519Congenital anomalies . ........... 740-759Certain perinatal causes .............. 760-778
Maternal conditiona ................. 760-763Difficult labor. birth injury... 764-768,772Conditions of placenta, cord ........ 770,771Hemolytic disease ................... 774,775Anoxic. hypoxic conditions .............. 776
k Iaturity ............................. 777Other perinatal caues .............. 769, 778
Other cauese................. ...........
659 53.1 1055 85.11 451
26137
16
8629
201
3340115697
36
29
21.03.0
1.3
6.92.316.2
2.73.20.90.45.60.62.9
2.3
139 11.2148 11.9
16 1.3
191 15.428 2.3
335 27.08 0.6
26 2.15 o.41 0.1
86 6.9171 13.838 3.1
198 16.0
La Pez
1297
39126
11
45222
292
316725
802264
103
76.3
23.01.5
0.6
26.61.3
17.2
1.83.91.50.24.71.33.8
6.1
1423 83.7
108 6.4309 18.2
12 0.7
292 17.217 1.0
411 24.2
10 0.616 o.919 1.1
1 0.169 4.1243 14.353 3.1274 16.1
16229
8
4826
148
1924236
321133
30
48.0 833 88.6
17.2 132 14.03.1 108 11.5
0.9 19 2.0
5.1 120 12.82.8 34 3.6
15.7 ¿40 25.5
2.0 8 0.92.6 9 1.02.4 6 0.60.6 -3.4 66 7.01.2 128 13.63.5 23 2.4
3.2 180 19.1
Medellin
463 46.3
176 17.615 1.5
12 1.2
50 5.036 3.6141 14.1
17 1.725 2.521 2.1
5 0.531 3.14 0.4
38 3.8
33 3.3
830 83.o
91 9.1140 14.0
20 2.0
123 12.323 2.3
268 26.8
16 1.627 2.7
4 0.4
65 6.5124 12.432 3.2
165 16.5
380 76.0 505 101.0
164 32.8 44 8.811 2.2 135 27.0
6 1.2 12 2.4
46 9.2 74 14.816 3.2 7 1.4
113 22.6 125 25.0
7 1.4 1 0.229 5.8 8 1.6
8 1.6 3 0.63 0.6 .
24 4.8 21 4.212 2.4 83 16.630 6.0 9 1.8
24 4.8 108 21.6
Monterrey
57.7
22.91.0
1.5
9.44.015.3
1.3.32.10o.2.71.24.3
3.7
3475 105.011500
432540
98
55166
900
3966293
232411120
889
13.116.3
3.0
16.62.0
27.2
1.22.00.90.17.0
12.43.6
26.9
74531
27
19247
377147235
144327581
1909
75731
49
311132508
49109
6999040
142
121
330 84.6
144 36.95 1.3
12 3.1
68 17.48 2.1
62 15.9
6 1.514 3.6
3 0.82 0.5
13 3.313 3.311 2.8
31 7.9
302 77.41 776
35 g.o98 25-1
11 2.8
38, 9.72 O0.5
60 15.4
1 0.32 0.51 0.3
11 2.839 10.0
6 1.5
58 14.9
_ -. _ei ^.Rrs Vrt r y
91.5
45.41.9
1.6
11.712.9
23.0
0.94.42.10.38.82.o4.6
4.9
2932 178.8
457 27.9577 35.2
56 3.4
529 32.347 2.9
603 36.8
10 0.624 1.511 0.7
llo 6.7356 21.7
92 5.6
663 40.4
21112
13
5968
352
63451?1087?23
112
61
41.9
11. 40.6
0.7
3.23.719.0
3.42.40.60.54.?1.26.1
" .3
1324
15792
29
11'?6'9
670
2')4010
12?
10?'n ,
71.6
8.55.0
1.3
3.736.2
1.62.20.50.1
1). 5'1.5i5-.
10.3
211
821
7
221578
61261
231
29
6
46. 9 443 '8. 4
18.2 35 7.80.2 70 15.6
1.6 15 3.3
4.9 75 16.73.3 9 2.0
17.3 136 0,.2
1.3 2 0.42.7 6 1.31.3 1 0.20.25.1 33 7.30.2 78 17.36.4 1i 3.6
1.3 103 22.9
Ribeirao Preto- San Juan- San Juan- San Salvador-Fra Sanc Jun-City Suburban Rural Ciey
213 84.2 391 154.5 122 42.7 268 93.7 317 83.4 692 182.1 449 98.0 885 193.2 020 76.? 1 (,5 132.7
86 34.0 27 10.7 37 12.9 43 15.0 96 25.3 106 27.9 159 34.7 139 30.3 517 38.9 1,P 14.4
8 3.2 53 21.3 2 0.7 23 8.0 17 4.5 73 19.2 26 5.7 113 24.7 20 1.5 25o 1R.8
7 2.8 3 1.2 4 1.4 1 0.3 10 2.6 21 5.5 10 2.2 22 4.8 l1 o.8 27 2.0
22 8.7 37 14.6 16 5.6 32 11.2 58 15.3 94 24.7 100 21.8 127 27.7 153 11.5 ? 4 22.1lo 4.0 9 3.6 5 1.7 6 2.1 14 3.7 13 3.4 12 2.6 6 1.3 47 3.5 Y 2.869 27.3 143 56.5 51 17.8 105 36.7 104 27.4 218 57.4 118 25.8 240 52.4 224 16.8 'i]P, 31.4
5 2.0 1 0.4 8 2.8 3 1.0 4 1.1 7 1.8 8 1.7 11 2.4 35 2.6 20 1.5
20 7.9 7 2.8 19 6.6 7 2.4 20 5.3 26 6.8 36 7.9 17 3.7 53 4.0 30 2.34 1.6 1 o.4 7 2.4 7 2.4 11 2.9 3 0.8 11 2.4 5 1.1 19 1.4 10 0.82 0.8 - 3 1.0 1 0.3 6 1.6 - 3 0.7 1 0.2 7 0.5 .2
27 10.7 34 13.4 7 2.4 23 8.0 29 7.6 46 12.1 27 5.9 51 11.1 47 3.5 '9 5.9377 30.4 1 0.3 40 14.0 1 o.3 96 25.3 3 0.7 119 26.0 2 0.2 ?31 17.4
11 4.3 23 9.1 6 2.1 24 8.4 34 8.9 40 10.5 30 6.6 36 7.9 61 4.6 45 3.4
11 4.3 119 47.0 7 2.4 58 19.9 18 4.7 167 43.9 24 5.2 238 52.0 49 3.7 547 41.1
Se Salvador- Santiago Sio PauloRural
284 101.4
169 60.49 3.2
3 1.1
38 13.613 4.641 14.6
9 3.29 3.25 1.8
10 3.61 0.47 2.5
11 3.9
406 145.0
64 22.979 28.2
7 2.5
68 24.38 2.9
54 19.3
1 0.41 0.41 0.4
16 5.733 11.82 0.7
126 45.0
798
20228
39
20262
208
1750231550
52
57
50.5
12.81.8
2.5
12.83 .913.2
1.13.21.50.93.20.13.3
3.6
1453
194203
32
2837107
11019657
305
92.0
12.312.8
2.0
13.93.4
28.2
1.82.30.60.47.0
12.43.6
19.3
1917
67344
118
337105
56108
5016
17130115
94
69.o
24.21.6
3827 137.7
535 19.2525 18.9
4.2 73 2.6
12.1 506 18.23.8 71 2.6
19.6 1033 37.2
2.0 35 1.33.9 50 1.81.8 i.4 0.50.6 11 0.46.2 215 7.71.1 560 20o.4.1 148 5.3
3.4 1084 39.0
'Excluding 4 areas with insufficient deaths for analyais: Ribeirio Prto-Rural; Santiago-Suburban; St. Andrew Parish, rural; Viacha.
1 - -_ _ «_ . 1I
_
__ | _
1 1 11 1
1
1
Recife Ribeirao preto-(;ity
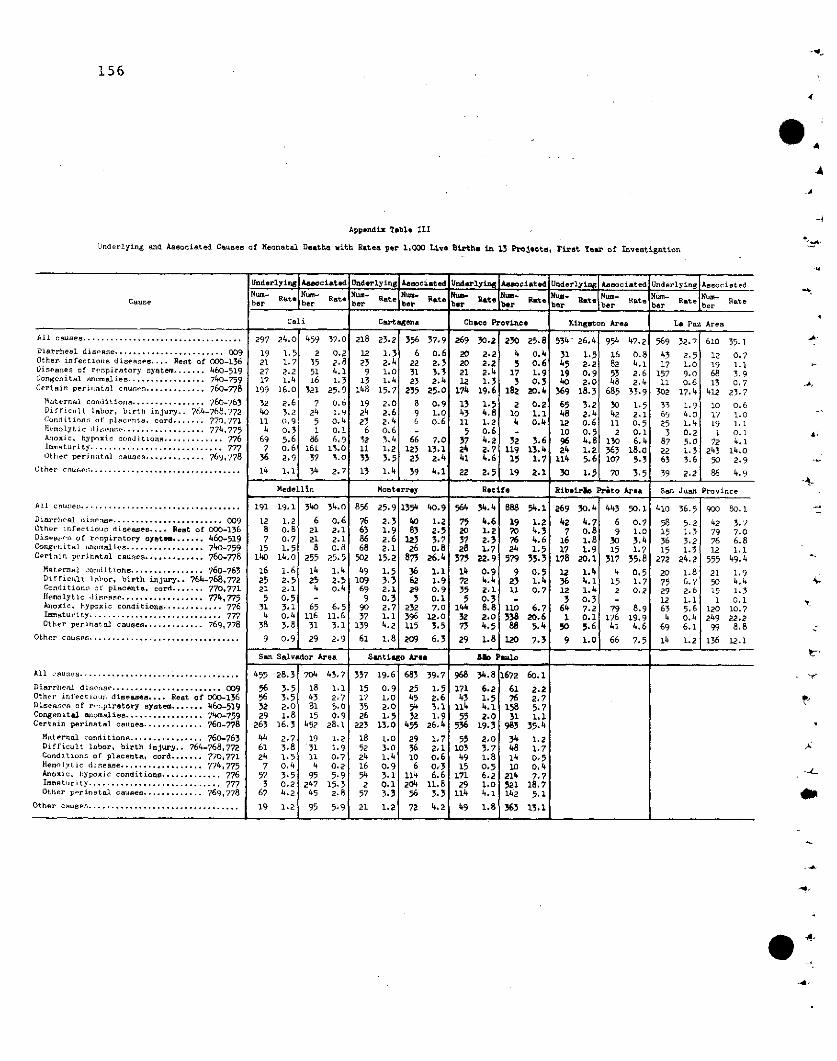
156
A
A
Appendix Table III
Underlying and Associated Causea of Neonatal Deatha with Ratea per 1,000 Liva Births in 13 Projecta, First Year of InveBtigation
Undorlying Asaociatedl UndrlyinAgl aoci.ted Undrlyi Asociated Underlying Ansociated Underlying As ociatedNum- Rat N- Rte Num- Nu at a at Num- at Nun- Nu-
bcr bcr ~~~~~~ber aer bebr be Ra eauze be. 'br ate" b I'"~
Cali Cartegena Chaco Province Kingston Area La Paz Area
A cause................................... 297 24.0 459 37.0 218 23.2 356 )7.9 269 30.2 230 25.8 534' 26.4 954 47.2 569 32.7 610 35.1
iarhea disese ....................... 009 19 1.5 2 0.2 12 1.3 6 0.6 20 2.2 4 0.4 31 1.5 16 0.8 43 2.5 12 0.7Other infectioius dsenes .... Reat of 000-136 21 1.7 35 2.8 25 2.4 22 2.3 20 2.2 5 0.6 45 2.2 82 4.1 17 1.0 19 1.1Diseases of respiratory syatem....... 460-519 27 2.2 51 4.1 9 1.0 31 3.3 21 2.4 17 1.9 19 0.9 53 2.6 157 9.0 68 3.9
ongental oalie ................ 740-759 17 1.4 16 1.3 13 1.4 23 2.4 12 1.3 3 0.3 40 2.0 48 2.4 11 0.6 13 0.7Certain periRtal causn............. 760-778 199 16.0 321 25.9 148 15.71 235 25.0 174 19.6 182 20.4 369 18.3 685 33.9 302 17.4 412 23.7
Maternal conditions................ 760-763 32 2.6 7 0.6 19 2.0 8 0.9 13 1.5 2 0.2 65 3.2 30 1.5 33 1.9 10 0.6Difficult labor, birth injury.. 764-768,772 40 3.2 24 1.9 24 2.6 9 1.0 43 4.8 10 1.1 48 2.4 42 2.1 69 4.0 1? 1.0Conditionr. o placnta. cord....... 770,771 11 .9 5 0.4 23 2.4 6 0.6 11 1.2 4 0.4 12 0.6 11 0.5 25 1.4 19 1.1lmolytic ................... 774,775 4 0.3 1 0.1 6 0.6 - 5 0.6 - 10 0.5 2 0.1 3 0.2 1 0.1Anxi, hypoxic condton............. 76 69 5.6 86 6.9 32 3.4 66 7.0 37 4.2 32 3.6 96 4.8 130 6.4 87 5.0 72 4.1Immaturity ................... ......... 777 7 0.6 161 13.0 11 1.2 123 13.1 24 2.7 119 13.4 24 1.2 363 18.0 22 1.3 243 14.0Oter perintAl auces............. 769,'78 36 2.9 37 3.0 33 3.5 23 2.4 41 4.6 15 1.7 114 5.6 107 5.3 65 3.6 50 2.9
Uther cause s ................................. 14 1.1 34 2.7 13 1.4 39 4.1 22 2.5 19 2.1 30 1.5 70 3.5 39 2.2 86 4.9
Medellín Monterrey Recsife Ribirb Pr&to Area San Juan Province
All caue .. ................................. 191 19.1 340 )4.0 856 25.9 1354 40.9 564 34.4 888 54.1 269 30.4 443 50.1 410 365 900 50.1
Diarrheal d¡isease........................ 009 12 1.2 6 0.6 76 2.3 40 1.2 75 4.6 19 1.2 42 4.7 6 0.7 58 5.2 42 3.?Other infectious diseases .... Reat of 000-136 8 0.8 21 2.1 63 1.9 83 2.5 20 1.2 0 4.3 7 0.8 9 1.0 15 1.3 79 7.0Dises:wes of respiratory syate ....... 460-519 7 0.7 21 2.1 86 2.6 123 3.7 37 2.3 76 4.6 16 1.8 30 3.4 36 3.2 76 6.8Congenitl uonalic .................. 740-759 15 1.5 8 o.8 68 2.1 26 0.8 28 1.7 24 1.5 17 1.9 15 1.7 15 1.3 12 1.1Cert.in perinatal causes............. 760-778 140 14.0 255 25.5 502 15.2 873 26.4 375 22.9 579 35.3 178 20.1 317 35.8 272 24.2 555 49.4
Maternal conitions ............... 760-763 16 1.6 14 1.4 49 1.5 36 1.1 14 0.9 9 0.5 12 1.4 4 05 20 1.8 21 1.9Difficult ,lIor, bírth injury.. 764-768,772 25 2.5 25 2.5 109 3.3 62 1.9 72 4.4 23 1.4 36 4.1 15 1.7 75 6.7 50 4.4Condition o placenta, cord....... 770,771 21 2.1 4 0.4 69 2.1 29 0.9 35 2.1 11 0.7 12 1.4 2 0.2 29 2.6 15 1.3
emoytic inse ................. 774,775 5 0.5 - 9 0.3 3 0.1 5 0.3 - 3 0.3 12 1.1 1 0.1Anox. hypoxic conditiona ............ 776 31 3.1 65 6.5 90 2.7 232 7.0 144 8.8 110o 6.7 64 7.2 79 8.9 63 5.6 120 10.7maturity ............................. 777 4 0.4 116 11.6 37 1.1 396 12.0 32 2.0 338 2.6 1 0.1 176 19.9 4 0.4 249 22.2Other perinatal causes ............. 769,778 38 3,8 31 3.1 139 4.2 115 3.5 73 4.5 88 5.4 50 5.6 41 4.6 69 6.1 99 8.8
Other causes ................................ 9 0.9 29 2.9 61 1.8 2O9 6.3 29 1.8 120 7.3 9 1.0 66 7.5 14 1.2 136 12.1
San Salvador Area Santiago Area Sao Paulo
All causes ................................... 455 28.3 704 43.7 337 19.6 683 39.7 968 34.8 1672 60.1
Diarrheal diease ........................ 009 56 3.5 18 1.1 15 0.9 25 1.5 171 6.2 61 2.2Other infectious diseases .... Rest of 000-136 56 3.5 43 2.7 17 10O 45 2.6 43 1.5 76 2.7Diseases. of rc:;piratory system....... 460-519 32 2.0 81 5.0 35 2.0 54 3.1 114 4.1 158 5.7Congenital anomalies ................ 740-759 29 1.8 15 0.9 26 1.5 32 1.9 55 2.0 31 1.1Certin perintal cause............. 760-778 263 16.3 452 28.1 223 13.0 455 26.4 536 19.3 983 35.4
Maternal conditionsa ............... 760-763 44 2.7 19 1.2 18 1.0 29 1.7 55 2.0 34 1.2Difficult labor, birth injury.. 764-768,772 61 3.8 31 1.9 52 3.0 36 2.1 103 3.7 48 1.7Conditions of placenta, cord....... 770.,771 24 1.5 11 0.7 24 1.4 10 0.6 49 1.8 14 0.5Hemolytic disease ................. 774,775 7 0.4 4 0.2 16 0.9 6 0.3 15 0.5 10 0.4Anoxi. hypoxc condition............. 776 57 3.5 95 5.9 54 3.1 114 6.6 171 6.2 214 7.7Immaturity ............................. 777 3 0.2 247 15.3 2 0.1 204 11.8 29 1.0 521 18.7Other perinatal causes ............. 769,778 67 4.2 45 2.8 57 3.3 56 3.3 114 4.1 142 5.1
Other cause' ................................. 19 1.2 95 5.9 21 1.2 72 4.2 49 1.8 365 153.1
-4~
-A.
4.
-*
0u
e
--4
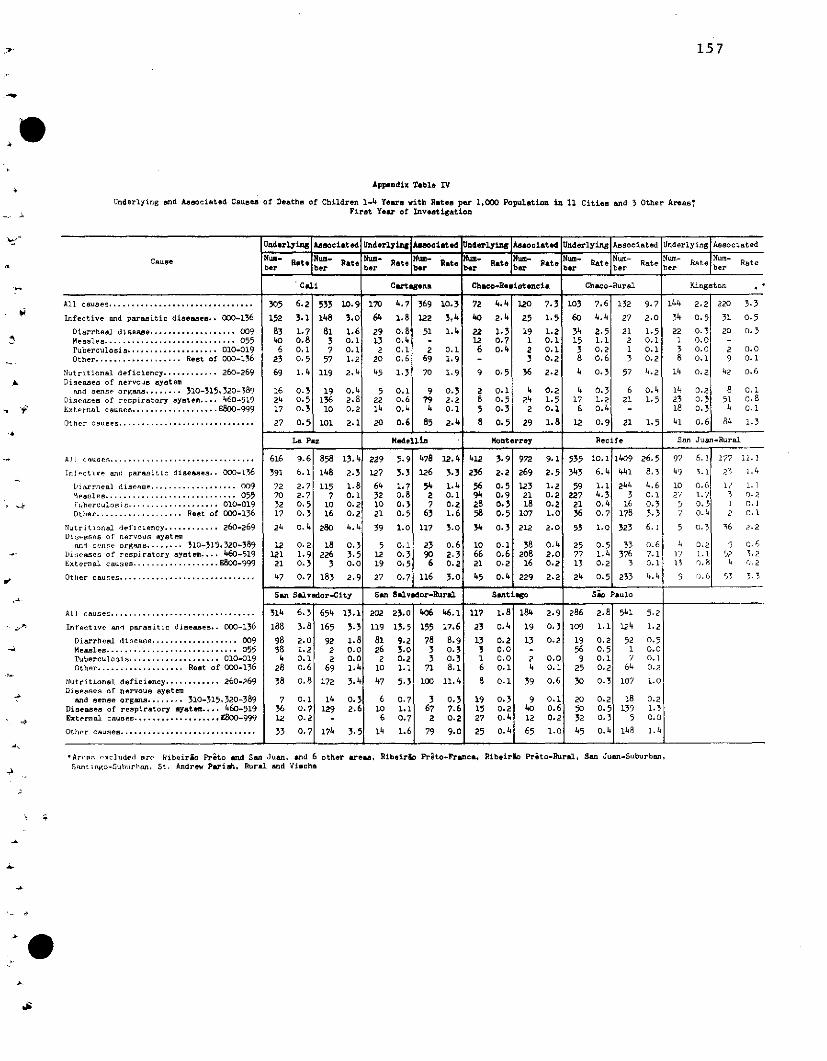
157
Appeandix Table IV
Underlying and Associated Causes of Deaths of Children 1-4 Years with Rates per 1,000 Population in 11 Cities and 3 Other Areas'First Year of Investigation
Underlyin Aaaociatod Underlying aociated AnderlyingAseociated Underying Associated Underlying Associated
Numi- Num- Nue NM NU u um - - Num-Cause Rato Rato Rat- Rata u Rate Rato Rate - Rate Rateb Ratebar ber bar ber ber ber
Cali Cartagena Chaco-Resistencia Chaco-Rural Kingston
All causes ................................ 05 6.2 533 10.9 170 4.7 369 10.3 72 4.4 120 7.3 103 7.6 132 9.7 144 2.2 220 3.3
Infective and parasitic diseases.. 000-136 152 3.1 148 3.0 64 1.8 122 3.4 40 2.4 25 1.5 60 4.4 27 2.0 34 0.5 31 0.5
Diarrheal disease ................... 009 83 1.7 81 1.6 29 O.8 51 1.4 22 1.3 19 1.2 34 2.5 21 1.5 22 0.3 20 0.3Measles ............................. 055 40 0.8 3 0.1 13 0.4 - 12 0.7 1 0.1 15 1.1 2 0.1 1 0.0 -Tuberculosis.................... 010-019 6 0.1 7 O.1 2 0.1 2 0.1 6 0.4 2 0.1 3 0.2 1 0.1 3 0.0 2 0.0Other .................. Rest of 000-136 23 0.5 57 1.2 20 0.6 69 1.9 - 3 0.2 8 0.6 3 0.2 8 0.1 9 0.1
Nutritional deficiency ........... 260-269 69 1.4 119 2.4 45 1.3 70 1.9 9 0.5 36 2.2 4 0.3 57 4.2 14 0.2 42 0.6Diseases of nervous syetem
and sens. organs ........ 310-315,320-389 16 0.3 19 0.4 5 0.1 9 0.3 2 0.1 4 0.2 4 0.3 6 0.4 14 0.2 8 0.1Diseases of respiratory aytem .... 460-519 24 0.5 136 2.8 22 0.6 79 2.2 8 0.5 24 1.5 17 1.2 21 1.5 23 0.3 51 0.8External causes ................... E800-999 17 0.3 10 0.2 14 0.4 4 0.1 5 0.3 2 0.1 6 0.4 - 18 0.3 4 0ol
Other causes.............................. 27 0.5 101 2.1 20 0.6 85 2.4 8 0.5 29 1.8 12 0.9 21 1.5 41 0.6 84 1.3
La Paz Hedellín Monterrey Recife San Juan-Rural
All causes. ................... ..... ..... 616 9.6 858 13.4 229 5.9 478 12.4 412 3.9 972 9.1 535 10.1 1409 26.5 97 6.1 177 11.2
Ini.crtive sncJ parasitic diseases.. 000-136 591 6.1 148 2.3 127 3.3 126 3.3 236 2.2 269 2.5 343 6.4 441 8.3 49 3.1 23 1.4
Diarrheal diseas ................... 009 72 2.7 115 1.8 64 1.7 54 1.4 56 0.5 123 1.2 59 1.1 244 4.6 10 0.6 1/ 1.1Mrarles . ............................ 055 70 2.7 7 O.1 32 0.8 2 0.1 94 0.9 21 0.2 227 4.3 3 0.1 27 1.7 3 0.2'Tuberculosi .................... 010-019 32 0.5 10 0.2 10 0.3 7 0.2 28 0.3 18 0.2 21 0.4 16 0.3 5 0.3 1 0.1Other................... Rest of 000-136 17 0.3 16 0.2 21 0.5 63 1.6 58 0.5 107 1.0 36 0.7 178 3.3 7 0.4 2 0.1
Nutritional deficiency ........... 260-269 24 0.4 280 4.4 39 1.0 117 3.0 34 0.3 212 2.0 53 1.0 323 6.1 5 0.' 36 2.2Dis-sses of nervous system
and sense organs........ 310-315,320-389 12 0.2 18 0.3 5 0.1 23 0.6 10 0.1 38 0.4 25 0.5 33 0.6 4 0.2 9 0.6Diseases of respiratory aystem .... 460-519 121 1.9 226 3.5 12 0.3 90 2.3 66 0.6 208 2.0 77 1.4 376 7.1 17 1.1 52 3,.2External causes ................... E80 -999 21 0.3 3 0.0 19 0.5 6 0.2 21 0.2 16 0.2 13 0.2 3 0.1 13 r).4 4 rO.2Otiher causes .............................. 47 0.7 183 2.9 27 0.7 116 3.0 45 0.4 229 2.2 24 0.5 233 4.4 9 0.6 53 3.3
San Salvador-City San $alvador-lRural Santiago Sao Paulo
All causes................................ 314 6.3 654 13.1 202 23.0 406 46.1 117 1.8 184 2.9 286 2.8 541 5.2
Infective and parasitic diseases.. 000-136 188 3.8 165 3.3 119 13.5 155 17.6 23 0.4 19 0.3 109 1.1 124 1.2
Diarrheal disease .................. 009 98 2.0 92 1.8 81 9.2 78 8.9 13 0.2 13 0.2 19 0.2 52 0.5Measles .............. ..... ..... 055 58 1.2 2 0.0 26 3.0 3 0.3 3 0.0 - 56 0.5 1 0.0Tuberculosis .................... 010-019 4 0.1 2 0.0 2 0.2 3 0.3 1 0.0 2 0.0 9 0.1 7 0.1Other .................. Rest of 000-136 28 0.6 69 1.4 10 1.1 71 8.1 6 0.1 4 0.1 25 0.2 64 0.2
Nutritional deficiency............ 260-269 38 0.8 172 3.4 47 5.3 100 11.4 8 0.1 39 0.6 30 0.3 107 1.0Diseases of nervous system
and asense organa........ 310-315,320-389 7 0.1 14 0.3 6 0.7 3 0.3 19 0.3 9 0.1 20 0.2 18 0.2Diseases of respiratory system .... 460-519 36 0.71 129 2.6 10 1.1 67 7.6 15 0.2 40 0.6 50 0.5 139 1.3External causes........80.........E80-999 12 0.2 - 6 0.7 2 0.2 27 0.4 12 0.2 32 0.3 5 0.0
Othr causes.............................. 33 0.7 174 3.5 14 1.6 79 9.0 25 0.4 65 1.0 45 0.4 148 1.4
*Aur.'.:s ,xc]uded are Ribeirio Prito and San Juan, and 6 othar areas, Ribeirlo Prato-Franca, Ribeirgo Prtto-Rural, San Juan-Suburban,Snt iuso-Suhusrlan. St. Andrew Pariah. Rural and Viacha
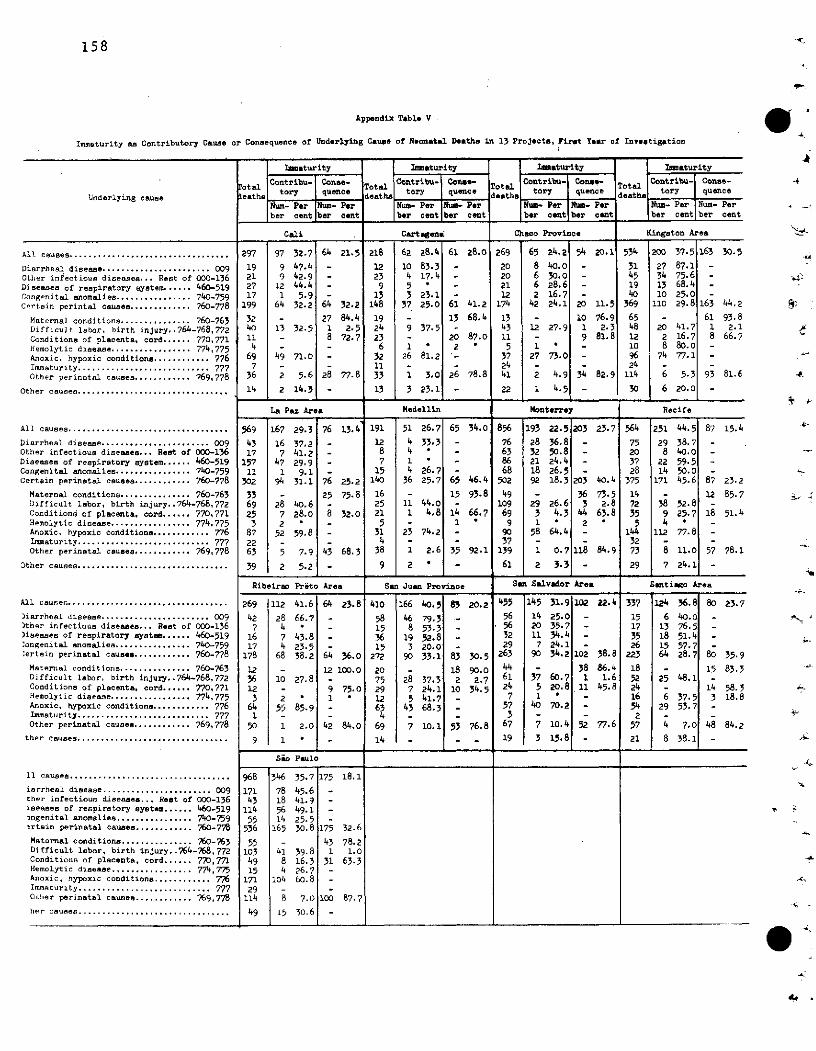
158
Appendix Table V
Immaturity as Contributory Cause or Consequence of Underlying Cause of Neonatal Deatha in 13 Projects, Firat Year of Investigation
Imaturity Ieaturity _tImnn turity Immaturityniu- Cone- ntribu- oContribu- Cone_- Total Contribu- Conse-
tory tory qusnce Con b-' ce tory quenceUnderlying cause leth qunc d to quencdeathe toy qunc
Num- Per Num- Per Num- Per Z- Per Nu- Per Num- Per Num- Per Num- Perber centlbr cnt bar cent bbr cent er cntb br cent ber cent ber cent
Cali Cartagena Chaco Province Kingston Area
All causes ..................................
Diarrheal disease ....................... 009Other infectious diseases... Rest of 000-136Diseases of respiratory system ..... 460-519Congenital anomalies ................ 740-759Certain perintal causes ............. 760-778
Maternal conditions ............... 760-763Difficult labor, birth injury..764-768,772Conditions of placenta, cord ...... 770,771Hemolytic disease ................. 774,775Anoxic, hypoxic conditiona ............ 776Immaturity ............................ 777Other perinatal causes ............ 769,778
Other causes ................................
All causes ..................................
Diarrheal disease ....................... 009Other infectious diseases... Rest of 000-136Diseases of respiratory system ...... 460-519Congenital anomalies ................ 740-759Certain perinatal causes ............ 760-778
Maternal conditions ............... 760-763Difficult labor, birth injury..764-768,772Conditionsí of placenta, cord ...... 770,771Hemolytic disease ................. 774,775Anoxic, hypoxic conditions ............ 776Irmmaturity ............................ 777Other perinatal causes ............ 769,778
Dther causes................................
All causes .................................
)iarrheal disease ....................... 009)ther infectious diseaesa... Rest of 000-136)iseases of respiratory system...... 460-5192ongenital anomalies ................ 740-759,ertain perinatal causes ............ 760-778
Maternal conditiona ............... 760-763Difficult labor. birth injury..764-768,772Conditions of placenta, cord ...... 770,771Hemolytic disease ................. 774,775Anoxic, hypoxic conditions ............ 776Immaturity ............................ 777Other perinatal causes ............ 769,778
ther causes................................
11 causes..................................
iarrheal disease ....................... 009ther infectious diseases... Rest of 000-136iseames of respiratory system ...... 460-5195ngenital anomalies ................ 740-759irtain perinatal causes ............ 760-778
Maternal conditiona ............... 760-763Difficult labor, birth injury..764-768,772Conditionr, of placenta, cord ...... 770,771Hemolytic disease ................. 774,775Anoxic, hypoxic conditiona ............ 776Immaturity ............................ 777OLher perinatal causea ............ 769,778
her causes................................
297
19212717
199
3240114
697
36
14
97 32.79 47.49 42.9
12 44.41 5.9
64 32.2
13 32.5
49 71.0
2 5.6
2 14.3
64 21.5
64 32.227 84.4
1 2.58 72.7
28 77.8
218
12239
13148
1924236
321133
13
6210453
37
9
126
1
3
28.4
83.317.4
23.125.0
37.5
81.2
3.0
23.1
61 28.0
61 41.2
13 68.4
20 87.02 .
26 78.8
269
20202112
174
1345115
372441
22
65 24.28 40.06 30.06 28.62 16.7
42 24.1
12
127
2
1
27.9
73.0
4.9
4.5
54 20.1
20 11.5
10 76.91 2.39 81.8
34 82.9
534
31451940
369
654812109624
114
30
200O
27341310
110
202874
6
6
37.5 163
87.1 -75.6 -68.4 -25.0 -29.8 163
6141.7 116.7 880.o77.1 -
20.0 -
10.
30.5
44.2
93.82.166.7
81.6
La Paz Area Medellin Monterrey | Recife
569 167 29.3 76 13.4 191 51 26.7 65 34.0 856 193 22.5 203 23.7 564 251 44.5 87 15.4
43 16 37.2 - 12 4 33.3 - 76 28 36.8 - 75 29 38.7 -17 7 41.2 - 8 4 * 63 32 50.8 - 20 8 40.0 -
157 47 29.9 - 7 1 · 86 21 24.4 37 22 59.5 -11 1 9.1 - 15 4 26.7 - 68 18 26.5 - 28 14 50.0 -
302 94 31.1 76 25.2 140 36 25.7 65 46.4 502 92 18.3 203 40.4 375 171 45.6 87 23.233 - 25 75.8 16 - 15 93.8 49 - 36 73.5 14 12 85.769 28 40.6 - 25 11 44.0 - 109 29 26.6 3 2.8 72 38 52.8 -25 7 28.0 8 32.0 21 1 4.8 14 66.7 69 3 4.3 44 63.8 35 9 25.7 18 51.43 2 ' - 5 - 1 * 9 1 ' 2 ' 5 4 -
87 52 59.8 31 23 74.2 - 90 58 64.4 - 144 112 77.822 - 4 - - 37 - - 32 -63 5 7.9 43 68.3 38 1 2.6 35 92.1 139 1 0.7 118 84.9 73 8 11.0 57 78.139 2 5.2 - 9 2 ·' 61 2 3.3 - 29 7 24.1 -
Ribeiren Preto Areas San Juan Province Son Salvdor Área Santiago Area
269 112 41.6 64 23.8 410 166 40.5 83 20.2 455 145 31.9 102 22.4 337 i24 36.8 80 23.742 28 66.7 - 58 46 79.3 - 56 14 25.0 - 15 6 40.0
7 4 _- 15 8 53.3 - 56 20 35.7 - 17 13 76.5 -16 7 43.8 - 36 19 52.8 - 32 11 34.4 - 35 18 51.4 -17 4 23.5 - 15 3 20.0 29 7 24.1 - 26 15 57.7178 68 38.2 64 36.0 272 90 33.1 83 30.5 263 90 34.2 102 38.8 223 64 28.7 80 35.912 12 100.0 20 - 18 90.0 44 - 38 86.4 18 - 15 83.336 10 27.8 - 75 28 37.3 2 2.7 61 37 60.7 1 1.6 52 25 48.1 -12 - 9 75.0 29 7 24.1 10 34.5 24 5 20.8 11 45.8 24 14 58.33 2 ' 1 12 5 41.7 - 7 1 - 16 6 37.5 3 18.8
64 55 85.9 - 63 43 68.3 - 57 40 70.2 - 54 29 53.7 -1 - - 4 - - 3 - 2 - -
50 1 2.0 42 84.0 69 7 10.1 53 76.8 67 7 10.4 52 77.6 57 4 7.0 48 84.2
9 1 _- 14 - - - 19 3 15.8 - 21 8 38.1 -
Sio Paulo
968
17143
11455
536
55103
4915
17129
114
49
34678185614
165
4184
104
8
15
35.7
45.641.949.125.530.8
39.816.326.760.8
7.0
30.6
175 18.1
175 32.6
43 78.21 1.0
31 63.3
100 87.7
4
4
4c
.-4.
* .
. 1
···
's
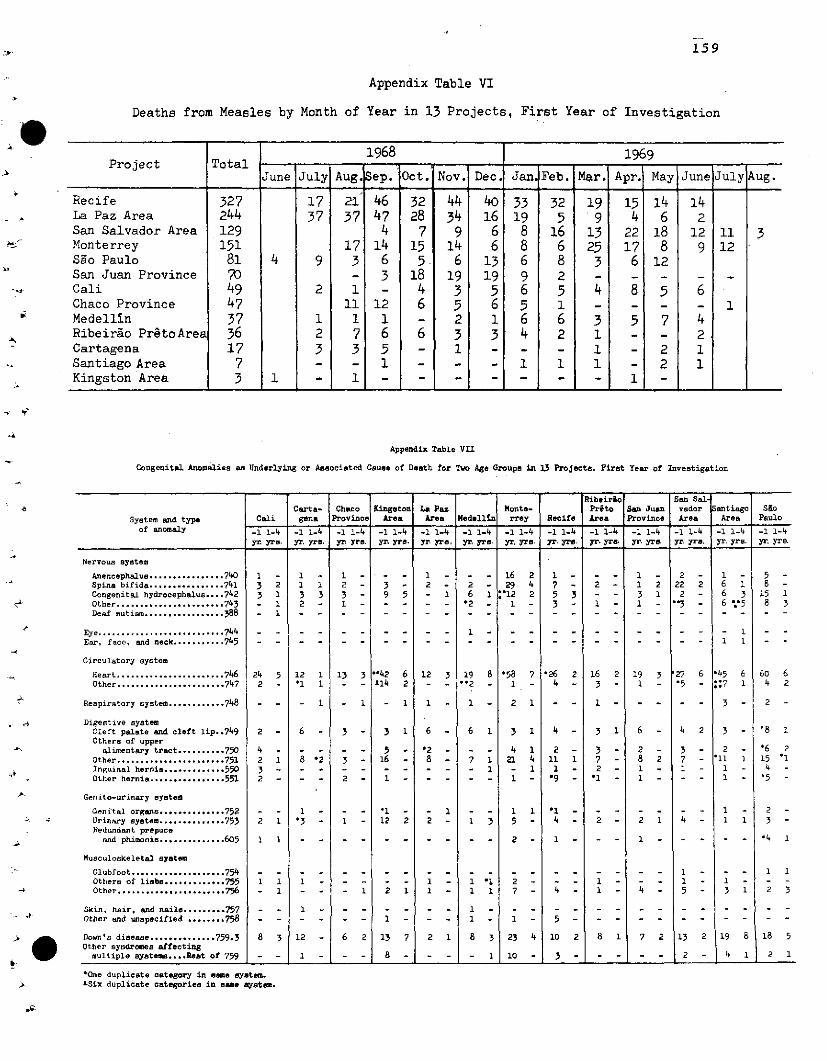
159
Appendix Table VI
Deaths from Measles by Month of Year in 13 Projects, First Year of Investigation
1968 1969Project Total 1968 1969
June July Aug. ep. Oct. Nov. Dec. Jan Feb. Mar. Apr. May June July Aug.
Recife 327 17 21' 46 32 44 40 33 32 19 15 14 14La Paz Area 244 37 7 47 28 34 16 19 5 9 4 6 2San Salvador Area 129 4 7 9 6 8 16 13 22 18 12 11 3Monterrey 151 17 14 15 14 6 8 6 25 17 8 9 12Sao Paulo 81 4 9 3 6 5 6 13 6 8 3 6 12San Juan Province 70 - 3 18 19 19 9 2 - - - - -
Cali 49 2 1 - 4 3 5 6 5 4 8 5 6Chaco Province 47 11 12 6 5 6 5 1 - - - - 1Medellin 37 1 1 1 - 2 1 6 6 3 5 7 4Ribeiráo PretoArea 36 2 7 6 6 3 4 2 1 - - 2Cartagena 17 3 3 5 - 1 - - - 1 - 2 1Santiago Area 7 - - 1 - - - 1 1 1 - 2 1Kingston Area 3 1 - 1 - - - - - - - 1 -
Appendix Table VII
Congenital Anomalies as Underlying or Associated Cause of Death for Two Age Groupa in 13 ProJects, Firet Year of Investigation
Ribeirío San SalCarta- Chaco Kingston La Paz Monte- Prto Sn Januan vador Santiago Sao
System and type Cali gena Province Area Arerea Medelln rrey Recife Area Province Area Area Pauloof anomaly -4 -11-4 -_ 1-4 -11-4of anomaly -1 1-4 - 141-4 - 1 1-4 -1 11- 4 -14 -11-4 -1 1-4 -1 1- 4 - 1 4 -11- 4 -1 1-4 _ 1114
y. yrs. yr. yrs. yr. yrs yr. yrs yyrs yr.rs yr.s. yr. yre yr yr yr yr. yrye yr yra yr. yrs yr yrs. yr. yrs. yr. yr.
Nervous saytem
Anencephalus ................ 740 1- 1 - 1 - 1 _ - -16 2 1 - -_ 1 - 2 - 1 - 5Spina bifida ................ 741 3 2 1 1 2 3 2 2 - 29 4 7 - 2 - 1 2 22 2 6 1 8Congenital hydrocephalus .... 742 31 3 3 3 9 5 - 1 6 1 1'12 2 5 3 - - 3 1 2 - 6 3 15 1Other.. 743 - 1 2 -1 1 - - - 2 - 1 - 3 - 1 - 1 - -'3 - 6'V5 8 3Deaf mutiasm ................. 388 - 1
Eye ........................... 744 .. - -_ - - 1 _ - -_ - -_ _ - -_ . 1Ear, face, and neck ........... 745 .- - - - - - - - - - - - - - - - - 1 1
Circulatory system
Heart ..................... 746 24 5 12 1 13 3 "42 6 12 3 19 8 '58 7 '26 2 16 2 19 3 27 6 '45 6 60 6Other .... 747 2 -_ 1 1_ - - 114 2 - -_ 2 1 - 4 3 - 1 - '5 :7 1 4 2
Respiratory system ............ 748 - - - 1 - 1 1 - 1 - 2 1 - - 1 - 3 ' 2
Digestive systemCleft palate and cleft lip..7
49 2 6 -3 3 3 1 6 - 6 1 3 1 4 - 3 1 6 - 4 2 3 - '8 1
Others of upperalimentary tract .......... 750 4 - - -_ 5 _ *2 _ - - 4 1 2 - 3 - 2 - 3 - 2 - *6 2
Other ....................... 751 2 1 8 2 3 16 8 4 11 1 7 - 8 2 7 - 11 1 15 '1Inguinal hernia ............. 550 3 - - 1 1 - 2 - 1 - 1 - 1 - 4Other hernia ................ 551 2 - 2- -29 1 - 1 -9 - 1 - 1 '5
Genito-urinary systes
Genital organa ............ 752 - 1 - 1 - - 1 1 1 1 *1 - 2Urinary system .............. 753 2 1 *3 1 12 2 2 - 1 3 5 - 4 - 2 - 2 1 4 - 1 1 3Redundant prepuce
and phimosis .............. 605 1 1 - 2 - 1 - - - 1 - - - - *4 1
HMuculoskeletal syetem
Clubfoot .................... 754 .... - - - 1 1Others of limbs ............. 755 1 1 1 -1 1 2 1 2 - 1 - 1 - - -Other ....................... 756 - 1 - 1 2 1 1 1 1 7 4 41 - 3 1 2 3
Skin, hair, and nails ......... 757 1…- _ _ 1 _- 1 .Other and unspecified ........ 758 - - 1 - 1 - -5 - - -
Down's disease .............. 759.3 8 3 12 - 6 2 13 7 2 1 8 3 23 4 10 2 8 1 7 2 13 2 19 8 18 5Other syndromes affectingmultiple syateme .... Rest of 759 - - 1 - - 8 -1 10 - - - 1 10 - 3 - - - - - 2 - 4 1 2 1
*One duplicate category in seme system.LSix duplicate categories in ame system.
-- C
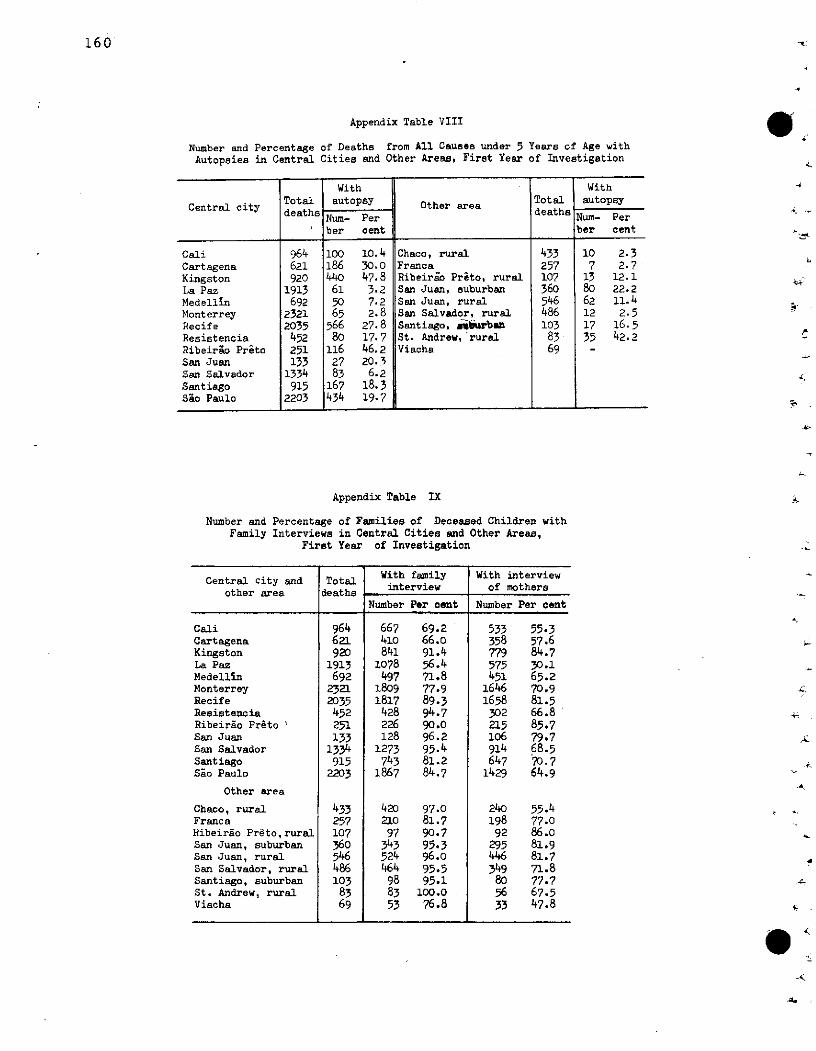
Appendix Table VIII
Number and Percentage of Deaths from All Causes under 5 Years of Age withAutopsies in Central Cities and Other Areas, First Year of Investigation
With WithTotal autopsy Total autopsy
Central city Other areaNum- Per Num- Perber cent ber cent
Cali 964 100 10.4 Chaco, rural 433 10 2.3Cartagena 621 186 30.0 Franca 257 7 2.7Kingston 920 440 47.8 Ribeirao Preto, rural 107 13 12.1La Paz 1913 61 3.2 San Juan, suburban 360 80 22.2Medellin 692 50 7.2 San Juan, rural 546 62 11.4Monterrey 2321 65 2.8 San Salvador, rural 486 12 2.5Recife 2035 566 27.8 Santiago, Wiburban 103 17 16.5Resistencia 452 80 17.7 St. Andrew, rural 83 35 42.2Ribeirao Preto 251 116 46.2 Viacha 69 -San Juan 133 27 20.3San Salvador 1334 83 6.2Santiago 915 167 18.3Sao Paulo 2203 434 19.7
Appendix Table IX s
Number and Percentage of Families of Deceased Children withFamily Interviews in Central Cities and Other Areas,
Firet Year of Investigation
Central city and Total With family With interviewother are deaths interview of mothersother area deaths
Number Per cent Number Per cent
Cali 964 667 69.2 533 55.3Cartagena 621 410 66.o 358 57.6Kingston 920 841 91.4 779 84.7La Paz 1913 1078 56.4 575 30.1Medellin 692 497 71.8 451 65.2Monterrey 2321 1809 77.9 1646 70.9Recife 2035 1817 89.3 1658 81.5Resistencia 452 428 94.7 302 66.8Ribeiráo Preto ' 251 226 90.0 215 85.7San Juan 133 128 96.2 106 79.7San Salvador 1334 1273 95.4 914 68.5Santiago 915 743 81.2 647 70.7Sao Paulo 2203 1867 84.7 1429 64.9
Other area
Chaco, rural 433 420 97.0 240 55.4Franca 257 210 81.7 198 77.0Ribeirao Préto,rural 107 97 90.7 92 86.0San Juan, suburban 360 343 95-3 295 81.9San Juan, rural 546 524 96.o 446 81.7San Salvador, rural 486 464 95.5 349 71.8Santiago, suburban 103 98 95.1 80 77.7St. Andrew, rural 83 83 100.0 56 67.5Viacha 69 53 76.8 33 47.8
160
L
4
L.
-
,í


