Embed Size (px)
Citation preview
Ozone photochemistry during the U.K. heat wave of August 2003.
James. D. Leea, Alastair. C. Lewisa, Paul. S. Monksb, Mark Jacobb, Jacqueline. F. Hamiltona, James. R.
Hopkinsa, Nicola Watsona, Julie. Saxtona, Christopher Ennisa, Lucy J Carpentera, Zoe Flemingb, Brian J.
Bandyc, Graham Millsc, David E Oramc, Stuart A. Penkettc, Jana Slemrc, Emily Nortond, Geraint
Vaughand, Andrew Rickarde, Lisa K Whalleye, Dwayne E. Hearde, William J. Blosse, Thomas
Gravestocke, Gavin Johnsone, Trevor Inghame, Shona Smithe, Paul W. Seakinse, David Cryere, Jenny
Stantone, Michael J Pillinge, James B McQuaidf, Michael E Jenking, Steven Utembeg, David Johnsong,
Hugh Coeh, Keith Bowerh, Martin Gallagherh, Gordon McFiggansh, Nicola Carslawi, Katherine
Emersoni.
a Department of Chemistry, University of York, York, YO10 5DD, UK
b Department of Chemistry, University of Leicester, Leicester, UK
c School of Environmental Sciences, University of East Anglia, Norwich, UK
d The University of Wales, Aberystwyth, UK
e Department of Chemistry, University of Leeds, Leeds, LS2 9JT, UK
f School of the Environment, University of Leeds, Leeds, LS2 9JT, UK
g Department of Environmental Science and Technology, Imperial College London, London, UK
h Department of Earth, Atmospheric and Environmental Science, University of Manchester,
Manchester, UK
i Environment Department, University of York, York, YO10 5DD, UK
Correspondence to: [email protected], [email protected] or [email protected]
Abstract
A wide range of chemical and physical parameters have been observed over the course of a severe
Europe-wide air pollution episode in August 2003. Detailed surface observations made at the rural
perimeter edge of London, U.K. indicated significantly elevated levels of primary VOCs, ozone
(>110ppb), other photochemical by-products such as PAN, HCHO, and higher oxygenates but not NOx.
Reactive organic tracers in combination with surface Doppler wind radar and back trajectory analysis
have been used to establish that initial rapid morning rises in O3 during the episode were caused by
entrainment of air from aloft, polluted on regional scales from mainland Europe. Total VOC reactivity
to OH approximately doubled during this episode, with similar distribution between functional groups,
but showing a temperature dependant exponentially increasing contribution from biogenic isoprene
(max 1.2 ppbV). In addition to entrainment of regional air pollution, ozone formation rates within the
U.K. boundary layer on the day of observation have been determined using measured peroxy radicals in
combination with other chemical data. Under episodic conditions total peroxy radicals in excess
120pptV were observed in late afternoon with strong correlation to a later and higher peak in ozone
when compared to non-episodic conditions. During the daytime under episodic conditions alkyl peroxy
radical formation was dominated by PAN thermolysis, whose afternoon lifetime averaged only 18.3
min, but which was sustained at a concentration greater than 750 pptV. Low episodic wind speeds
resulted in a relatively small possible spatial footprint for emissions of reactive precursors to PAN, and a
strong correlation between isoprene and PAN production rate suggest this species may have contributed
to the later afternoon increases seen in surface O3.
1. Introduction.
Public association of poor air quality with extremely warm weather is firmly established in the United
Kingdom and is a very visible area where atmospheric chemistry impacts on quality of life and public
health. Significantly enhanced levels of pollutants such as ozone (O3), particles and the oxides of
nitrogen (collectively termed NOx) experienced during photochemical pollution ‘episodes’, are the result
of combinations of meteorological effects, atmospheric chemical reactions and changes to both the rates
and types of terrestrial emissions, which occur at elevated temperatures. Simplistically, for the U.K., the
degree of severity of summertime photochemical episodes tends to scale with daytime air temperature,
and very high summertime air pollution events (for example with ozone concentration > 90 parts per
billion) are almost always associated with anticyclonic conditions and temperatures in excess of 28-
30°C.
The removal of organic compounds from the atmosphere is driven by the hydroxyl radical (OH), which
in combination during the daytime with the hydroperoxy radical (HO2) and larger peroxy radicals (RO2)
is responsible for ozone production (Logan et al., 1981). The main urban HOx sources are the photolysis
of ozone, formaldehyde (HCHO) and nitrous acid (HONO), with the latter two often being the most
significant, especially in early morning and late evening. OH and HO2 undergo propagation reactions
that lead to rapid interconversion between these two radicals. OH reacts with CO or O3 to produce HO2,
and the oxidation of hydrocarbons by OH leads to formation of peroxy radicals RO2 and HO2. In the
presence of NO, RO2 is converted to HO2, which reacts with NO or O3 to reform OH. Hydrocarbon
oxidation may also lead to the formation of HCHO, increasing this source of HOx. The reaction of HO2
or RO2 with NO during daytime leads to the in situ production of ozone through photolysis of the
resulting NO2. Steady-state theory suggests that ozone production from HO2 should decrease as NO
increases to more than a few ppb, due to the reaction of OH with NO2 (which is often in steady state
with NO), increasing and terminating the cycle. Thus ozone production should be most efficient at
moderate levels of NO of around 1 ppb, depending on the production rate of HOx and on the changing
partitioning of radicals between HO2 and RO2 (Ehhalt, 1999). These are chemical conditions often
associated with rural and semi rural locations.
U.K. terrestrial emissions of both nitrogen oxides and volatile organic compounds (VOCs), the key
chemical precursors to ozone production, have been reduced with some modest success over the past 10
years (Goodwin and Salway, 2002), albeit matched by a gradual increase in background ozone values
(Derwent et al., 2003). The ability to predict the magnitude of U.K. ozone events and understand the
controlling chemistry under very high temperature conditions has been little studied or tested since
periods with air temperature in excess of 30-35°C are currently rare.
The potential importance of improving control during high temperature air pollution episodes was
highlighted in August 2003. During a 10-day period, a blocking anticyclone persisted over Western
Europe, with air temperatures of up to 40 oC. This led to severe health problems, particularly in France,
where around 15000 extra deaths were reported. In the U.K., temperatures regularly exceeded 30 °C
with the Office of National Statistics reporting over 2000 excess deaths during the heatwave period.
Between 400 – 800 of these deaths were directly attributed to poor air quality (Stedman, 2003) through a
combination of elevation in ozone and PM10. Put in a national perspective, between 20-40% of all excess
U.K. deaths over this heat wave period were attributable to air pollution. A similar number of excess
deaths were reported in the Netherlands during the same period (Fischer et al., 2004). The
meteorological conditions were causal to an unusually long photochemical episode, with peak ozone
values in excess of 110 ppb being measured by the U.K. air monitoring network (data available from
www.airquality.co.uk) at a number of locations in the S.E. of England. Figure 1 shows distribution of
ozone data taken from 76 of the air quality monitoring sites in the U.K. on 6th August. It demonstrates
the centering of maximum levels of ozone over Southern England on this day
It is important to understand the chemical and physical processes occurring under such albeit currently
rare conditions, as climate models suggest that the occurrence of extreme high temperature periods is
likely to significantly increase over the period to 2080 (Schar et al., 2004). The current probability in the
U.K. of exceeding 35 °C is 0.6 %, however by 2080 it is estimated to become 6 %, (e.g. temperatures in
excess of 35 °C currently occur roughly one day every two years whereas in 2080 we may expect 5 days
yr-1, or once every 2.5 weeks during summer. An extrapolation of deaths brought forward from the 2003
example to 2080 frequencies is clearly highly significant. Understanding the complex interplay between
the dynamical properties of the atmosphere under high temperature conditions and the chemical and
emissions processes occurring within it are important if we are to predict and control air quality under
these predicted future climate scenarios.
Limited mixing and dilution under typically clear sky anticyclonic conditions are key factors in allowing
high pollutant concentrations to establish, as are the synoptic transport pathways that often bring already
highly polluted air from mainland Europe to the U.K. Derwent and Jenkin, (1991) reported the
importance of atmospheric transport in contributing to high U.K. ozone events (see also Jenkin et al.,
2002). In this study we aim to demonstrate that active ozone chemistry is occurring within the boundary
layer during high temperature conditions, and that the enhanced pollutant levels experienced are a
combination of relatively local processes in combination with more regional transport. Calculating the
relative contributions from background, regional and local scale ozone sources is extremely complex
however due to not only scale issues in models, but also that chemical processing leading to ozone under
episodic high temperatures may be substantially different to that which occurs at lower more typical
temperatures. This may be a consequence of gas kinetic properties, (e.g. T dependant kOH), thermal
decomposition processes (e.g. peroxyacetylnitrate), photolysis conditions, and importantly non-linear
temperature dependencies of terrestrial primary pollutant emission rates.
In this paper we report a series of detailed chemical observations relating to ozone, non methane
hydrocarbons, nitrogen oxides, a range of carbonyl species and reactive intermediates such as RO2 made
during summer 2003 at a rural site outside the edge of London. The observational period covered the
period of extreme temperatures and high ozone concentrations as well as more typical Westerly cyclonic
conditions both before and after this event. The paper will use observations to determine possible
sources of ozone within the boundary layer on day of observation, with particular reference to increased
concentrations of biogenic hydrocarbons and peroxy radicals, and use tracers to demonstrate the extent
of mixing-in of polluted air from the wider regional background.
2. Experimental
2.1 Site description.
In August 2003 seven University institutes in the United Kingdom took part in a field measurement
programme as part of the Tropospheric ORganic CHemistry experiment (TORCH). Measurements were
made at Writtle College, Writtle, Essex (51o:44’:12’’N; 0o:25’:28’’E), a location approximately 25 miles
North East of central London. The site comprised several shipping container laboratories and temporary
buildings located in a grass field situated to the South East of the main college buildings, which was
little influenced by local road sources of pollutants. The site was over 2 miles from the nearest busy road
(to the South), with the prevailing wind direction (South Westerly) coming from an area of flat arable
farmland with scattered agricultural buildings for a distance of ~ 2 miles. Electricity for the
measurement instruments was provided by a diesel powered generator situated ~ 200 metres to the East
of the sampling location. Data from this sector was automatically removed from the dataset. The
location of the site had been chosen as a typical rural location in the South East of England, relatively
close to London, which would allow for the study of freshly polluted air masses that had passed over
densely populated areas of London and the South East of England.
2.2 Measurement details.
The observations reported here encompass a wide range of gas phase measurements including O3, NO,
NO2, CO, C2 – C10 non methane hydrocarbons (NMHCs), C2 – C7 carbonyl compounds, PAN, OH, HO2
and peroxy radicals. Measurements were also made of a range of photolysis rates including j(O1D),
j(NO2) and j(HCHO) along with a large suite of aerosol number and composition measurements. A
brief description of the instrumentation relevant to this paper is given below.
Ozone was measured on site using a UV absorption detector (Thermo Environmental Instruments,
Model 49C). The estimated uncertainty in the O3 concentrations was ± 2 ppb. In addition measurements
were made using a mobile laboratory in the regions around the measurement location to examine
homogeneity of distribution. NO was measured using a NO/O3 chemiluminescence analyzer (Thermo
Environmental Instruments, Model 42C – trace level), with the instrument sequentially measuring NO
and NOx (NO + NO2) by use of a heated Molybdenum converter. Detection limit for the instrument was
approximately 0.1 ppb for NO and total NOx. Calibrations for NO and NO2 were carried out using a gas
standard (Air Products) and a resulting uncertainty for NO and NO2 measurements was estimated to be ±
0.2 ppb. A direct measurement of NO2 was also made using a tunable diode laser system, and, although
there was limited data coverage, it showed good agreement with the converted NO2 measurement for
periods when both instruments were measuring simultaneously. C2 – C7 NMHCs and C2 – C5
oxygenated volatile organic compounds (o – VOCs) including alcohols, aldehydes and ketones were
measured using a two-column, gas chromatograph (GC) with flame-ionisation detector (Hopkins et al.,
2002). Briefly, a multi-bed, Peltier cooled adsorbent trap, consisting of Carboxen 1000 and Carbopack
B, was used to acquire the sample (100 ml min-1 for 10 minutes). Upon injection, the sample was split in
an approximately 50:50 ratio between a 50 m aluminium oxide (Al2O3) porous layer open tubular
(PLOT) column and a 10 m LOWOX column. Eluent from each column was then detected using flame
ionisation detection (FID). Regular calibration of the system was carried out using a standard cylinder
mixture at the ppbv level (NPL) containing 27 NMHCs. O – VOC concentrations were calculated using
relative detector response factors compared to n-hexane, with response factors calculated from liquid
standards. The entire analysis process took around 1 hour, and was fully automated. Detection limits
were between 1 and 10 pptv for NMHCs and 10 – 40 pptv for o-VOCs.
Higher molecular weight hydrocarbons (C6-C10) were measured using comprehensive gas
chromatography (GCXGC), with modulation between the columns enabled by a high-speed switching
valve (Hamilton and Lewis, 2003). The column set used provided an initial volatility based separation
followed by a secondary polarity based separation. GCXGC instrumentation was based on a HP 6890
Gas Chromatograph (Agilent Technologies, Wilmington, DE, USA) equipped with a flame ionization
detector operating at 100Hz. Analytes were trapped using a similar technique as the lightweight
hydrocarbons, with a mixed absorbent bed of Tenax and carbon based materials. Valve switching
modulation diverted part of the sample to waste and large air volumes were required to achieve the
required sensitivity. Therefore the sampling frequency of the heavy weight VOCs was lower with a 2-
hour integrated sample (25 ml min-1) collected every three hours. Daily calibration was performed via
direct gaseous sampling of a 74 component Apel Reimer standard, to monitor the performance of the
modulator. The GCxGC approach adds additional uncertainty since there is a degree of peak
reconstruction from the individual secondary chromatograms, where the primary peak is sub-sampled at
a level that is not optimal. Errors on heavy weight hydrocarbon concentrations are around 10 %, and
species that overlap with the dual channel approach, generally correlate within 10 %.
Formaldehyde was measured by an instrument using the liquid phase reaction of formaldehyde with
acetylacetone (2,4 pentadione) and an amine. This reaction produces α-α’-dimethyl-β-β’-diacetyl-
pyridine, that is excited at 400 nm (Hg-lamp) and the fluorescence is detected at 510 nm. Measurements
of peorxyacetylnitrate (PAN) were carried out using a custom built two channel GC with electron
capture detection (Ai Qualitek, Cambridge U.K.). Calibration of the instrument was performed using
gaseous PAN generated by the photolysis of NO with excess acetone, diluted using zero air. The
uncertainty of the measurements was found to be less than 5 %, with a time resolution of 90s.
Measurements of OH and HO2 radicals were made by the University of Leeds using on-resonance, low
pressure laser-induced fluorescence (LIF) at 308 nm, through the FAGE (Fluorescence Assay with Gas
Expansion) technique (Heard and Pilling, 2003) and references therein). The instrument was based upon
the design deployed in previous campaigns, most recently described in Smith et al. (2005) (and
references therein). In brief, the Leeds FAGE system employs an all solid-state, Nd:YAG pumped
Ti:Sapphire laser to generate 308 nm radiation for LIF excitation (see Bloss et al. (2003) for a full
description of the laser system) which is directed into two low pressure fluorescence cells using fibre
optic cables. Thus, using two separate fluorescence cells it is possible to simultaneously detect OH and
HO2 (the latter through chemical conversion to OH via addition of NO), by collecting the resultant OH
fluorescence, at ~ 308 nm, using gated photomultipliers. Calibrations were carried out on most days of
the campaign using the photolysis of water vapour at 185 nm coupled with O3 actinometry (Smith et al.,
2005) with average daytime detection limits of 3.75 × 10⁵ and 2.77 × 10⁶ molecule cm-3 for OH and HO2
respectively. The instrument was housed in an air conditioned sea-container with the fluorescence cells,
photomultipliers and gating electronics housed in a weatherproof box on the roof of the container. In
order to increase the sampling height the FAGE container was stacked on top of the University of York
GC container giving an overall sampling height of ~ 10 m above the ground.
Measurements of peroxy radicals (HO2 + ΣRO2) were carried out using the jointly operated University
of Leicester – University of East Anglia (UEA) PEroxy Radical Chemical Amplifier (PERCA IV)
instrument, reported for the first time in (Fleming et al., 2005). The technique was pioneered by
(Cantrell et al., 1984) and described by (Clemitshaw et al., 1997; Green et al., 2003; Monks et al., 1998)
and uses a dual channel inlet and detection system (as in (Cantrell et al., 1996)).
Briefly, the method relies upon the HO2 and OH radical-catalysed conversion of NO and CO into CO2
and NO2 respectively, through addition of NO and CO into the inlet region viz.,
HO2 + NO → OH + NO2 (1)
OH + CO → H + CO2 (2)
H + O2 + M → HO2 + M (3)
Overall: NO + CO + O2 → NO2 + CO2 (4)
Organic peroxy radicals are readily converted into HO2 in the presence of NO with varying efficiencies
(Ashbourn et al., (1998)). The yield of both CO2 and NO2 is equal to CL * ([RO2] + [HO2] + [OH]),
where CL is the chain length, i.e. the number of HO2/OH inter-conversion cycles that occur before
radical termination. The ratio of [HO2]/[OH] ranges from ~ 50 – 200 in the atmosphere, therefore the
PERCA technique effectively measures the sum of inorganic and organic peroxy radicals. The yield of
NO2 is measured using commercial LMA-3 detectors (calibrated daily using NO2 permeation sources)
and this is converted into [HO2 + ΣRO2] using Δ[NO2]/CL. The chain length was calculated on a weekly
basis, using a calibration source based upon the photolysis of CH3I at 253.7 nm to yield CH3O2 at
varying concentrations (Clemitshaw et al. (1997)). A humidity correction factor equation (using
ambient humidity and inlet temperatures) was derived and applied to all PERCA data following
Salisbury et al, (2002). Using a dual-inlet configuration gives a frequency of raw data capture of 1Hz .
Peroxy radical mixing ratios where derived on a one minute basis. The errors on a 1 minute
measurement are 35%.
The rates of photolysis of a variety of species were measured using a 2πsr spectral radiometer (Edwards
and Monks, 2003). 2πsr filter radiometers were also employed to measure j(O1D) and j(NO2) (Monks et
al, 1996). Measurements of wind speed and direction, temperature and relative humidity were also
taken through the campaign. Measurements of NMHCs, o-VOCs, CO and met were taken at the top of a
14 m high tower, with all other gas phase measurements sampled at ~ 7 m. Data analysis was aided by 5
day back trajectory calculated every 2 hours using the ECMWF (European Centre for Medium Range
Weather Forecast) package supplied by BADC (British Atmospheric Data Centre).
3. Results - Climatology
Time series of meteorology and trace gas measurements from the TORCH campaign are shown in figure
2. Data is presented here for 1st – 30th August 2003, and during this period, the 5 day back trajectory
calculations showed the site was subjected to a range of air mass types. From 1st – 3rd August, the air
was Atlantic in origin, passing subsequently over the Southern U.K and London before arriving at the
site from a Southerly / South-Westerly direction. On 4th and 5th August the air was also Atlantic in
origin, but then passing over northern France, and the North Sea before arriving at the site from an
Easterly direction. For these 5 days, wind speeds at the site ranged between 5 – 8 ms-1 and peak daytime
temperatures ranged from 19 – 25oC. The period from the 6th – 10th August 2003 a high pressure
weather system was present over the U.K. and much of Western Europe. This period saw very low wind
speeds, ranging from 0.5 – 5 ms-1, with local wind direction being typically westerly. Temperatures
reached a daily maximum of 26 – 37oC, with the temperatures of > 35oC on 6th, 9th and 10th August,
these being particularly unusual for the U.K. The highest ever recorded U.K. air temperature was
observed during this period at Faversham, Kent (around 30 miles from the site) at 38.5°C. The period
from 13th – 24th August, the air was again Atlantic in origin, passing over the U.K. and arriving at the
site in a Westerly / North Westerly direction. Wind speed was generally higher during this period,
ranging from 7 – 15 ms-1, with temperatures between 20 and 25oC. From 25th – 30th August, the air was
Arctic in Origin, traveling over the North Sea, before arriving at Writtle from a Northerly / North
Easterly direction. Wind speeds ranged from 5 – 8 ms-1 during this period, with maximum temperatures
between 17 – 20oC.
The most interesting period from the point of view of air pollution is from 5th – 11th August and will be
described as the ‘heatwave period’, and is indicated on figure 2. Although back trajectories under these
conditions are less reliable than under cyclonic flow, they demonstrate that air arriving at the Writtle site
at midday on all days from 6th – 10th August had been slow moving over the U.K. or Europe for at least
the previous 5 days, providing an unusually long period for the accumulation of photochemical
pollutants. This stagnation of air over areas of elevated emissions, allowed both primary and secondary
pollutants to build to significant levels.
3.1 Ozone / NOx
Surface ozone concentrations showed a marked difference during the heatwave period compared to the
rest of August 2003. Ozone is plotted alongside ambient temperature in figure 2 and, during the non
heatwave period, exhibits a diurnal cycle, typically peaking at 40 – 60 ppbv, around 1-2 hours after solar
noon. At night, ozone falls to between 0 – 10 ppbv. This behaviour is very typical of moderately
polluted suburban locations. However on 6th – 11th August, the period when maximum daytime
temperatures were 27 – 37 oC, peak ozone was observed > 100 ppb, with one minute concentrations
measured from the mobile laboratory as high as 150 ppb on 6th August. The nights of 6 - 7th and 10th -
11th August also saw elevated nighttime concentrations of ozone. The very high (> 80 ppb)
concentrations on the night of 10th - 11th correspond to a change in wind direction and were due to air
being transported to the site from the North Sea, where ozone surface deposition was much less than for
an equivalent airmass over land. The difference in the behaviour of measured species between the
heatwave period and the rest of the campaign is further demonstrated by examining the average diurnal
profiles for the two periods, summarized in figure 3. Similar average ozone concentrations were
observed during the early morning, and in both cases, they start to rise just after 08:00. However in the
heatwave period, the steep increase in ozone begins early in the day and is sustained later through the
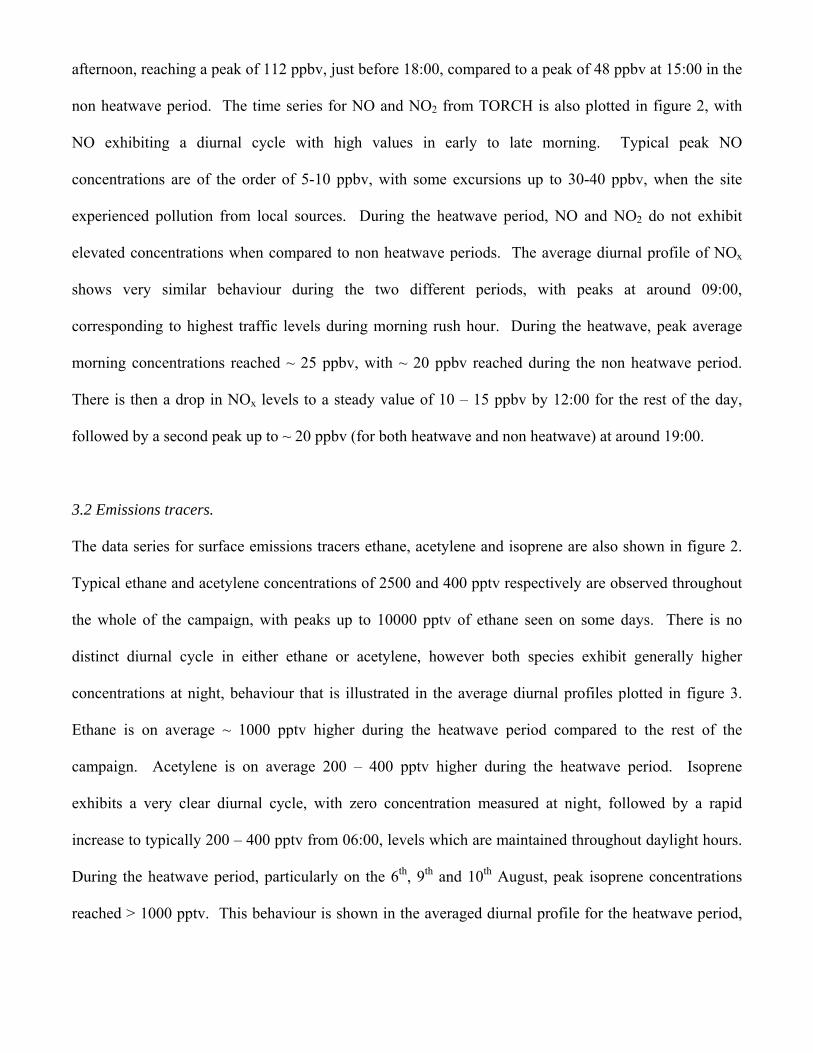
afternoon, reaching a peak of 112 ppbv, just before 18:00, compared to a peak of 48 ppbv at 15:00 in the
non heatwave period. The time series for NO and NO2 from TORCH is also plotted in figure 2, with
NO exhibiting a diurnal cycle with high values in early to late morning. Typical peak NO
concentrations are of the order of 5-10 ppbv, with some excursions up to 30-40 ppbv, when the site
experienced pollution from local sources. During the heatwave period, NO and NO2 do not exhibit
elevated concentrations when compared to non heatwave periods. The average diurnal profile of NOx
shows very similar behaviour during the two different periods, with peaks at around 09:00,
corresponding to highest traffic levels during morning rush hour. During the heatwave, peak average
morning concentrations reached ~ 25 ppbv, with ~ 20 ppbv reached during the non heatwave period.
There is then a drop in NOx levels to a steady value of 10 – 15 ppbv by 12:00 for the rest of the day,
followed by a second peak up to ~ 20 ppbv (for both heatwave and non heatwave) at around 19:00.
3.2 Emissions tracers.
The data series for surface emissions tracers ethane, acetylene and isoprene are also shown in figure 2.
Typical ethane and acetylene concentrations of 2500 and 400 pptv respectively are observed throughout
the whole of the campaign, with peaks up to 10000 pptv of ethane seen on some days. There is no
distinct diurnal cycle in either ethane or acetylene, however both species exhibit generally higher
concentrations at night, behaviour that is illustrated in the average diurnal profiles plotted in figure 3.
Ethane is on average ~ 1000 pptv higher during the heatwave period compared to the rest of the
campaign. Acetylene is on average 200 – 400 pptv higher during the heatwave period. Isoprene
exhibits a very clear diurnal cycle, with zero concentration measured at night, followed by a rapid
increase to typically 200 – 400 pptv from 06:00, levels which are maintained throughout daylight hours.
During the heatwave period, particularly on the 6th, 9th and 10th August, peak isoprene concentrations
reached > 1000 pptv. This behaviour is shown in the averaged diurnal profile for the heatwave period,
with a maximum observed at around 16:30. Isoprene behaviour will be discussed further in later
sections.
3.3 Other photochemical by-products.
The middle panels on figure 2 show products of photochemical activity such as PAN, acetone and
HCHO. These species clearly show significant enhancement during the heatwave period, much greater
than was seen in many of the precursor NMHCs, with peak daytime concentrations more than double for
both species. This behaviour was also seen in other secondary products such as the higher aldehydes and
ketones, although not in acetaldehyde. A diverse range of organic nitrate species at elevated
concentrations were also seen during the heatwave, although a lack of standards limits the presentation
of quantitative data.
The bottom panel of figure 2 shows the data series obtained for the reactive peroxy radical intermediates
HO2+ΣRO2. Overlaid on this plot is a measure of photolysis frequency for generation of O1D from
ozone – j(O1D). During the heatwave period mixing ratios of peroxy radicals reached 120 pptv during
mid-afternoon. The peroxy radicals had an average mixing ratio of 80 pptv at 15:00 GMT over the 5
days of the heatwave over twice that of the average for the rest of the campaign, which peaked at 13:00
GMT. These levels are lower than values recorded during the ESCOMPTE campaign of summer 2001 in
Southern France where mixing ratios of up to 200 pptv were observed (Coll et al., 2005). During the
heatwave period, peroxy radicals were strongly correlated to ozone, PAN and peroxides, i.e. secondary
products of photochemical oxidation. The average peroxy radical diurnal profile over the whole TORCH
campaign is similar in shape and magnitude to that from the suburban Berlioz campaign that took place
outside Berlin in 1998 (Mihelcic et al., 2003). As with BERLIOZ, in TORCH peroxy radical mixing
ratios increase with j(O1D) to a maximum shortly after solar noon. They also show a nighttime phase
with radical mixing ratios rising from a minimum at approximately 18:00 GMT when the main source of
peroxy radicals switches from photochemical to so called ‘dark reactions’ i.e., oxidation of VOCs via
oxidation by NO3 and ozone (see for example (Salisbury et al., 2001)).
During the TORCH campaign measurements of [OH] and [HO2] were made on 23 and 22 days of the
campaign respectively, on dates between 27th July - 7th August and 18th - 31st August. No measurements
of OH or HO2 are available over the heat wave period due to technical difficulties with the laser system.
Measurements of [OH] show a diurnal cycle with daytime maxima between 1.2 - 7.5 × 10⁶ molecule cm-
3. There were six nights on which [OH] of up to 8.5 × 10⁵ were measured (mean night-time detection
limit 3.41 × 10⁴ molecule cm-3) indicative of significant night-time sources of OH in the polluted air
experienced during TORCH. Rate of Production Analyses (ROPA) carried out using the Master
Chemical Mechanism (version 3.1) by Emmerson et al. 2005, found the main night-time sources of OH
to be recycling of HO2 though reaction with NO, and reaction of O3 with alkenes. The average [OH]
profile shows a rise that starts early in the morning (~ 05:00 GMT) and persists into the evening (~
18:30 GMT) when levels of j(O1D) are not significant, and in fact [OH] appears to track the wider
diurnal profile of j(HONO). The average diurnal profile of [HO2] also tracks that of j(HCHO) at these
times providing further evidence to support the photolysis of HONO and HCHO becoming relatively
more important to HOx production when sunlight is of a lower intensity, as both species are photolysed
by longer wavelengths of light than O3 (Alicke et al., 2003; Holland et al., 2003; Martinez et al., 2003).
The 24 hour mean [OH] for the entire campaign (derived from hourly means) was found to be 1.38 × 10⁶
molecule cm-3. Diurnal profiles in [HO2] were much less pronounced and in several cases asymmetric
about noon with secondary peaks in [HO2] occurring in the late afternoon / early evening. Noon-time
maxima varied between 0.16 - 3.3 × 10⁸ molecule cm-3. There were night-time HO2 radicals above the
daily calculated night-time detection limit on nine nights of the campaign (mean night-time detection
limit 1.26 × 10⁶ molecule cm-3) with concentrations of between 0.02 and 1.00 × 10⁸ molecule cm-3. A
peak in NO at ~ 06:00 GMT (attributed to a combination of the collapse in the boundary layer and
morning rush hour traffic) causes a concurrent suppression in HO2. Despite a rise in the rate of recycling
of HO2 via reaction with NO, there is no rise in [OH] as this increased OH production is balanced out by
an increased destruction through reaction with NO2 and other OH sinks that are expelled with NOx (e.g.
VOCs). The 24 hour mean [HO2] for the entire campaign (derived from hourly averages) was found to
be 6.19 × 10⁷ molecule cm-3.
Table 1 shows measurements of 65 different VOC species, averaged over daytime (05:00 – 20:00 GMT)
and nighttime (20:01 – 04:59 GMT) periods and then averaged for the heatwave period and the rest of
the campaign. The table demonstrates that for the vast majority of species concentrations are elevated
during the heatwave period, both for primary organic compounds emitted directly, and those produced
from the photo-oxidation of primary species. Also shown on table 1 for the daytime concentrations, is
the product of the average concentration of each species with its OH reactivity. This gives a measure of
the contribution with which the hydrocarbon produces free radicals, which in turn lead to the oxidation
of NO to NO2, and eventually to O3 formation. Total organic OH reactivity is almost double during the
heatwave period, compared to the rest of the campaign. In non-heatwave periods the largest contribution
to reactivity is from acetaldehyde, contributing 25 % of the total hydrocarbon reactivity, with the total
contribution from all oxygenated secondary species being 36 %. The two other largest contributors are
Formaldehyde and Isoprene which contribute 16% and 14% of the total reactivity respectively. During
the heatwave period, acetaldehyde again contributes the most to total reactivity (~ 25 %). The total from
oxygenated species is very similar at 35 %, with formaldehyde also the same at 16%. However the
contribution of isoprene to the total reactivity during the heatwave period increases to 20 %. Clearly
between heat wave and non-heat wave periods the balance of reactivity between functional group types
is broadly similar, but absolute concentrations of organic compounds are generally increased.
The major compositional differences between heat wave and non-heat wave periods may be identified
therefore as significantly increased daytime ambient isoprene, ozone, PAN, HCHO and peroxy radicals,
and a generally elevated background of anthropogenic VOCs and non-heatwave equivalent levels of
NOx.
4. Discussion
The data series presented in figure 2 shows the increases in a wide range of air pollutants that occurred
during the 2003 U.K. heatwave. We believe that these observations are likely to be broadly similar at
other rural locations since we do not identify there to be any unique sources or processes occurring at
this location.
The exceptionally hot, dry and sunny weather that occurred during the summers of 1976 and 1995, also
led to very high levels of ozone in the U.K. Although the amount of ozone monitoring data available in
1976 is limited, two major ozone episodes were encountered. From 22nd to 29th June, ozone peaked at
211 ppb at Teddington, Middlesex and from 3rd – 5th July when 254 ppb was measured at Harwell
Oxfordshire (4th PORG report, 1997). Air mass back trajectories to the South of England for these
episodes show that although the air masses arrived by different routes, on both occasions they had
travelled over high emission areas of Europe, where photochemical pollution would have accumulated.
For the period 1986-1995, there was a reduction in the magnitude of the maximum ozone values
occurring during summer photochemical episodes. Ozone concentrations during the 1995 heatwave
never reached the levels of 1976, but were significantly higher than those reported in previous and
subsequent years. Levels reached 90 ppb at rural monitoring sites on several occasions during July and
August, with 4 episodes where concentrations reached > 110 ppb. Back trajectory analysis during these
episodes showed a different pattern to those seen in 1976, with the majority of the trajectories passing
through relatively unpolluted regions, before entering the UK (4th PORG report, 1997).
Finding elevated concentrations during a heat wave is not therefore surprising. Given the reductions in
emissions of VOCs and NOx over the past decade it is perhaps unexpected however that peak ozone in
2003 exceeded levels above 100 ppb, since the reduction in the magnitude of such peaks has been
considered a generally successful outcome of U.K. emissions reduction policy. It is therefore useful to
attempt to determine why ozone was so high over this period, and whether this is likely to occur again
should temperatures of 2003 be seen in future years.
A key part of understanding the 2003 highs is to determine the relative sources of ozone observed at the
Writtle site and any potential nonlinearities in this generation process. For the longer lived secondary
products such as ozone (and also species such as acetone etc), what is observed at this location during a
heat wave will be a combination of the general Northern Hemisphere background + regionally produced
products (at this location likely to be predominantly from mainland Europe but will also include some
production from the local area). During the heatwave of 2003, ozone data from other air quality
monitoring sites in SE England (Harwell (Oxon), Wicken Fen (Cambs), Rochester (Kent) and
Lullington Heath (E Sussex) (Air quality archive, 2005) exhibited the same characteristics as the Writtle
site, indicative of a regional scale phenomenon. Model studies such as that by Jenkin et al., (2002),
point to Europe as a very major source of ozone during such anticyclones and that will also hold true
also for this case. However the direct (and perhaps unexpected) observation of extremely active
chemistry locally in this study, through non-linear reactive emissions of isoprene, elevated peroxy
radical intermediates and labile products such as PAN suggests at least a prime facie case for significant
additional local (that is, within the boundary layer of the U.K., and on the day of observation) generation
of ozone, to be added on top of an already enhanced regional background. This scenario assumes that
physical loss processes to the surface remain constant in both episodic and non-episodic conditions.
The meteorological conditions during the heat wave were such that a daytime convective boundary layer
(mixed layer) developed throughout the day reaching a maximum height of approximately 1800 m by
15:00 (UTC). This is shown in data from a Doppler wind radar (Norton et al., 2005) that was deployed
at the site. During the night there was evidence of a shallow surface inversion decoupled from the
residual boundary layer. During the morning surface heating caused this shallow inversion layer to be
entrained with the residual layer aloft to form a single well mixed layer. Given the generally low wind
speeds (<5m/s) during this period, it is during this entrainment from aloft whereby the regional ozone
influence was introduced. The mixing down of highly polluted air is likely to be the primary driver
behind the rapid increases in ozone seen during the heatwave morning periods. From a measurement
solely of ozone at the surface it is impossible however to differentiate ‘older’ ozone (i.e. that which has
been produced over mainland Europe over the previous 2 – 5 days) from that which has been produced
close to the measurement site (i.e. over the last 24 hours), and so other tracers must be used to make an
estimate of this. In the next section we discuss the use of reactive aromatic tracers for this purpose.
4.1 Ratios of aromatic compounds
Typically benzene : toluene (b:t) ratios are used as indicators of air mass processing and the degrees to
which OH and dilution affect an air mass when integrated over the day timescale. The dominant
emissions of benzene and toluene are from petrochemical sources at a ratio of approximately 1:4. The
atmospheric removal of toluene is faster than benzene, due to its greater reactivity with the OH radical.
The b:t ratio has been calculated for the TORCH campaign using the longer time integrated
concentrations obtained using GCXGC (3 hr frequency) and is shown in figure 4 with a ratio that varies
between 0.3 and 1.8. Generally, the ratio has a maximum during the day (indicating active OH removal)
but there is no significant difference in the behaviour of this ratio during the heatwave period compared
to other times.

The OH reactivity of aromatic compounds increases with substitution of the aromatic ring, from benzene
(kOH = 1.3 x 1012 cm3 mol-1 s-1) and toluene (kOH = 5.96 x 1012 cm3 mol-1 s-1) to the most reactive
measured in this study, 1,3,5-trimethyl-benzene (1,3,5-TMB) (kOH = 5.75 x 1011 cm3 mol-1 s-1). The
higher aromatics have similar emissions sources to benzene and toluene, but are much more sensitive to
changes in OH reactivity and / or transport timescale, since their atmospheric lifetimes are much shorter
Also shown on figure 4 is the ratio of b:1,3,5-TMB observed at Writtle over the course of the campaign.
During established Westerly conditions with airflow from London, b:1,3,5-TMB are close to the ratio
predicted by the National Atmospheric Emissions Inventory (NAEI). This indicates that under Westerly
airflow emissions and dilution are the dominant factors controlling abundance measured at Writtle.
From the 3rd to 11th of August, the period of high temperatures, the ratio became diurnally varying with
b:1,3,5-TMB peaking during the afternoon, where [1,3,5-TMB] drops to very low levels. During the
nights over this period b:1,3,5-TMB returned rapidly to the predicted emission ratio. The implication is
that OH chemistry is a more visible factor in controlling the distribution during heatwave periods.
Assuming an arbitrary air mass age of two hours from a remote point source, the OH concentration
required to force the change in b:1,3,5-TMB ratio from 20:1 to 250:1 can be calculated to be 5 x 10⁶
molecules cm-3 integrated over the previous two hours. This is close to the measured OH
concentrations and on first inspection is not unreasonable, however it does not allow for any further
local emissions along the air masses trajectory. Emissions close to the end of a trajectory
disproportionately force the ratio to low values, so to maintain a 250:1 ratio and counter balance such
emissions requires extremely high levels of OH, - this can be calculated to be as high as 1 x 10⁸
molecules cm-3 given diffuse petrochemical and solvent aromatic sources. Any 1,3,5-TMB observed at
the site during the daytime of the heat-wave period would be primarily from a small local footprint, as
its reactivity was high and windspeeds were low.
A strongly depleted daytime 1,3,5-TMB can therefore only be sustained if either OH is exceptionally
high (described above) or there are proportionally reduced emissions of 1,3,5-TMB compared to less
reactive species entering the air around Writtle. The diffuse and universal nature of the surface source of
aromatics, and the observation of notable close range traffic influence seen in NOx data, means this
change in source type cannot be supported. An effectively isolated observation location is also at odds
with exceptionally high concentrations of many other tracers, and so this explanation does not seem
reasonable. A more likely description is that this behaviour it is driven by mixing and entrainment of air
from aloft during the morning collapse of the shallow inversion layer to form the daytime boundary
layer. Trajectories would indicate that the air entrained from aloft is likely to be significantly polluted
but also highly processed, and had no contact with fresh surface emissions for many hours. Hence the air
within this region would be fully depleted in 1,3,5-TMB and have a very high b:1,3,5-TMB ratio, but not
be necessarily depleted in longer lived tracers such as toluene. As air mixes down a high ratio is
induced, implying also that air from aloft dominates the aromatic composition over local surface
emissions – the opposite to the case seen in strong Westerly flow. We may therefore use the absence of
1,3,5-TMB as a proxy for likely inclusion of regionally produced secondary species such as ozone, and
use this ratio change to estimate the possible fraction of ozone entrained from above. This by extension
gives some approximation to the amount of ozone that is derived from regional sources versus that
produced on the day of observation. Using a b:1,3,5-TMB aloft ratio of 1:1000 (equivalent to around 24
hours OH processing with no fresh emissions) then a crude estimate can be made of the relative
proportions of ‘surface’ and ‘aloft’ air which make up the mixture observed at the site. From the
perspective of anthropogenic VOCs this is falls in the range of 1 : 10 ± 5 with significant uncertainty
introduced due to not only the estimate of the aloft ratio but also in surface emission ratio and OH rate
constants. If ozone could be treated as a entity which simply scaled linearly with surface VOC emissions
then a similar ratio could be expected for the relative proportions of ‘old’ aloft ozone and versus more
recently produced surface ozone. This is not likely to be the case however as biogenic VOCs, major
contributors to O3 formation, do not follow the same emission pattern as anthropogenic species and this
will be discussed in later sections. In summary however, the very short lived tracers such as multi
substituted aromatics (the behaviour is seen in other aromatics in addition to 1,3,5-TMB) provide strong
evidence of the very significant mixing down of polluted air during the early and middle part of day, and
this air from aloft dominates the composition with respect to anthropogenic organic compounds.
Utembe et al., (2005) discussed how tracers such as NMHCs and their by-products such as carbonyls
and ozone could be simulated at the Writtle site in 2003 using a trajectory model including detailed
chemical reaction schemes. In general NMHCs could be recreated well in terms of levels and variability
although naturally some small scale features differed between measurement and model. The model
could also predict the observed change in b:1,3,5-TMB supporting that this is a widespread regional
phenomena and not a peculiarity of local meteorology, and also that the treatment of boundary layer
behaviour in the model was representative. One of the key conclusions from the Utembe 2005 work is
that the emissions inventory for anthropogenic VOCs and their chemistry within the trajectory model is
well represented, but that estimation of ozone during the heat wave is not straightforward. The ability to
correctly simulate ozone over this heat wave period using a trajectory model was closely tied to the
biogenic emissions that were introduced by that model from the surface.
4.2 Measurements of isoprene
Whilst biogenic emissions inventories exist for the U.K. (Simpson et al., 1995) in general it is not
considered a geographic region which is strongly influenced by biogenic VOCs. Isoprene is known to
be emitted globally from plants and trees (Guenther et al., 1993) and also, to a lesser extent from
combustion sources (McLaren et al., 1996). European isoprene emissions are estimated to be
approximately 4000 kt C yr-1 (Simpson et al., 1995) which, combined with its short atmospheric lifetime
(approximately 5 hours, assuming an average OH concentration of 5.5 x 10⁵ molecules cm-3), make
isoprene highly important in the atmosphere in terms of an OH sink and ozone and radical source.
Biogenic emissions of isoprene are dependent upon both light and temperature (Guenther et al., 1993)
and consequently atmospheric concentrations of isoprene exhibit a strong diurnal cycle (figure 3) with a
maximum in the daytime falling to zero at night. Over the heatwave period in 2003 isoprene
concentrations were seen to increase dramatically with a non-linear relationship to temperature in line
with the algorithms developed by Guenther. A plot of isoprene concentration versus temperature is
shown in figure 5(a) using data collected throughout August 2003 and shows the strongly temperature
dependant nature of the relationship.
The nature of the site was such that only limited trees were present in the vicinity, and the dominant
vegetation type was grazing grassland. Although on-line measurements were not made, a small number
of monoterpene measurements were made using carbon adsorbent tubes, sampled and then analysed off-
site using GC-time of flight mass spectrometry. The average data for these observations is given in table
1, and although data is limited, there is a strong indication of monoterpenes elevation in addition to
isoprene. The high concentrations of isoprene observed in the late afternoon on episodic days, coupled
with their high reactivity and ozone forming potential suggest that ozone may be generated on the day of
observation in addition to that which has been mixed down from the regional background during the
morning to midday periods. It is also notable that the average profile of ozone on the episodic days
continued to increase into the very late afternoon. A determinant of ozone generation is the abundance
of peroxy radicals, and these were also seen to reach their maximum in the late afternoon on episodic
days. The links between the two species are not necessarily direct however and in the next section we
discuss the role of isoprene and other species in controlling peroxy radical abundance and rate of
generation of ozone on day of observation.
There is evidence that the emission of additional isoprene over the heat wave was not limited solely to
rural locations such as Writtle. Measurements taken at Marylebone Road in central London showed
concentrations as high as 1.6 ppb in August 2003, and where the relationship becomes clearly
temperature rather than vehicle pollution dependant as the dominant source switches from anthropogenic
to biogenic (Dollard, 2005).
4.3 Peroxy radicals
Peroxy radicals are key intermediates and chain carriers in the gas phase oxidation of volatile organic
compounds, and owing to their short lifetime can give an indication of in situ photochemical ozone
production. In this section, the chemistry of the peroxy radicals will be explored as an indicator of the
local photochemical environment.
In order to delineate the different contributions to the peroxy radical chemistry, a steady state analysis of
ROx production/loss, in which intraconversions among ROx radicals are not considered, was carried out
(Mihele and Hastie, 2003; Penkett et al., 1997). In steady-state the change in peroxy radical
concentration can be represented as,
0][2=−−= NOSRRO
x LLPdtROd
x (5)
the term ROx includes organic peroxy radicals as well as HOx, PROx is the total ROx production, LSR the
losses owing to self reactions and LNO2 the losses owing to reactions with NOx.. The peroxy-radical
production term can be written as
PROx = 2f⋅j(O1D)[O3](1+γ) (6)
essentially comprising ROx production from O3 photolysis (primary production) and a term γ
representing production of ROx from other sources related as a function of primary production. When γ
= 1, additional sources of ROx are equal to those from O3 photolysis. As can be seen from Tables 2 and
3, for the heatwave period, γ values were greater than one for the afternoon period indicating that other
sources beyond primary production are necessary to account for the measured peroxy radical mixing
ratios and are indeed much more significant than ozone photolysis.
As discussed in section 1, the main photochemical sources of HOx in a polluted environment are
photolysis of ozone, HCHO and HONO (Monks, 2005). Additional sources of ROx are photolysis of
higher aldehydes and thermolysis of PAN and PAN analogues. Table 4 shows the relative significance
of four of these sources for which data is available. While HONO was not measured, its contribution to
ROx production in a semi-rural location such as Writtle is considered more significant in the early
morning hours as it builds up overnight and is therefore present in lower concentrations in the afternoon
(Alicke et al., 2003). Average radical production rates for the heatwave period from ozone photolysis,
formaldehyde photolysis, ozonolysis of alkenes and thermolysis of PAN for the afternoon period (12:00
– 18:00) are shown in Table 4. Thermolysis of PAN is the largest source of ROx production at this time
(1.85 × 10⁷ radicals cm-3 s-1) with 67% of radical production attributed to it, with ozone photolysis (5.22
× 106 radicals cm-3 s-1) accounting for 24%. Formaldehyde photolysis and ozonolysis of alkenes make
up 3.4 and 5.3% of ROx production respectively. The magnitude of ROx production from PAN is much
greater than that of maximum ozone photolysis for the 6th, 9th, and 10th of August, coinciding with the
days when ozone mixing ratios were at their highest.
The dominance of PAN as an afternoon source of ROx is not surprising considering its extremely short
lifetime at temperatures experienced during this heatwave period (figure 6), the PAN lifetime being as
low as 7.5 minutes for temperatures of 36°C. In order to sustain such high mixing ratios a very local
source is necessary as average wind speed was 5.5 ms-1 and average PAN lifetime 18.3 minutes (12:00 –
18:00, 6th – 10th August). Therefore, PAN would need to be produced or recycled within a small
footprint of around 6km around the observing location, rather than being a species transported in from
regional sources. Figure 7 shows the correlation between PAN production (calculated assuming PAN is
in steady state) and isoprene mixing ratios for the 6th – 9th August although the 10th does not seem to fit
this pattern. It is noticeable however that wind speeds were significantly higher on the 10th, resulting in
a larger footprint emission and production footprint. The average values for PAN production rate and
isoprene for the afternoon period (12:00 – 18:00) display a striking correlation of R2 = 0.99 (excluding
the 10th) although the relationship is not necessarily causal. A direct chemical link does however exist
between isoprene and PAN through the formation of the CH3CO3 radical formed through both
methacrolein and methyl vinyl ketone channel in isoprene degradation which can subsequently react
with NO2. Interestingly acetaldehyde, a key possible precursor to the CH3CO3 radical did not exhibit the
diurnally varying behaviour seen in the production of PAN. Variability in this species was in line with
longer lived tracers of photochemical processing such as methanol and acetone. We conclude that
isoprene and its oxidation products were the only measured precursor species to CH3CO3 with a
temporal profile matching that of PAN / ROx. There are also other PAN type species formed from
isoprene although not measured in this study.
Rate of Ozone production
Peroxy radical mixing ratios can be used to investigate the in situ production rate of ozone, and by
extension estimate O3 formation which may have occurred on the day of observation. The ozone
tendency or net photochemical in situ production rate of ozone (N(O3)) is a measure of the ozone
productivity of an air mass and neglects transport and deposition processes (Monks et al., 2000). N(O3)
is made up of a production term, P(O3) minus the loss term, L(O3):
N(O3) = kp[NO][HO2+ΣRO2] – {f.j(O1D) + kx[OH] + kx[HO2]}[O3] (7)
Where kp is a combined rate coefficient for the oxidation of NO to NO2 by all peroxy radicals and
f.j(O1D)[O3] represents the fraction of ozone photolysed to yield O(1D) atoms and then OH (with f being
the proportion of O(1D) atoms which react with H2O to give OH rather than being collisionally
deactivated). The rate constants kx and kx are from the ozone loss reactions:
OH + O3 → HO2 + O2 (8)
HO2 + O3 → OH + 2O2 (9)
The average P(O3) for 07:00 to 16:00 for the heatwave period is 42 ppbv h-1 compared to 21 ppbv h-1 for
Westerly conditions of 19th –23rd August. Kleinmen et al., (2005), sampled plumes from five American
cities and found that in an urban plume under conditions where P(O3) > 25ppb h-1 there is a potential to
transform a typical regional background into a severe ozone episode. Average O3 mixing ratios for the
same section of day for the heatwave and Westerly periods are 72 ppbv and 30 ppbv respectively
implying that radical chemistry within the boundary layer is more active during the heatwave than
during the cooler period. Using a deposition velocity of 0.5 cm s-1, loss rates at the surface are around 2
ppb hr-1 for 100ppbv O3 and a 1000m boundary layer height. This is small compared to N(O3) and
indicates that deposition plays a relatively minor role during heatwave conditions. Since boundary layer
height and ozone mixing ratio both increase through the day and surface loss can be calculated to remain
fairly constant.
As well as being characteristically different from the rest of August, the values of P(O3) during the
heatwave exhibit some variability (Figure 8). The close correlation (R2 = 0.93) of average in situ P(O3)
and the peak O3 value for each day of the heatwave (Figure 9) are indicative of a link between in situ
(day of observation) chemistry and final O3 concentrations and that this is effectively additive to that via
regional entrainment. The implication therefore is that vegetation in the U.K. is capable of sustaining a
significant boundary layer concentration of isoprene and this in combination with anthropogenic
emissions may well provide an additional heatwave source of ozone on top of regional entrainment
occurring during to mixing between residual and surface layers. Since biogenic emissions have strong
sensitivities to climate factors the control of the peaks in photochemical ozone during episodes may be
complicated by these emissions.
5. Summary and Conclusions
A comprehensive set of gas-phase measurements and meteorological parameters were made at Writtle,
Essex, during the TORCH field campaign in August 2003. The measurement period included a period
(6th – 10th August) of high pressure over the UK and most of Western Europe that was characterized by
low wind speeds (0.5 – 5 ms-1) and exceptionally high U.K. maximum temperatures (26 – 37oC). This
period was also characterized by high ozone concentrations, with peak levels > 110ppb observed on
each of the five days of the heatwave period. Concentrations of NO and NO2 did not exhibit
significantly elevated concentrations during this heatwave period when compared to the rest of the
month of August. Anthropogenic VOCs showed a significant enhancement in concentrations during the
heatwave (e.g. ethane and acetylene 1000pptv and 400 pptv) when compared to non-heatwave periods.
Reactive aromatic hydrocarbon ratios indicated that the morning collapse of a shallow inversion layer
resulted in significant entrainment of air from the polluted residual boundary layer aloft, and that this air,
which had been polluted on a regional scale, controls the abundance of anthropogenic VOCs and longer
lived photochemical byproducts on episodic days. The profile of ozone on episodic days, showed both a
more rapid rise in the morning, which we attribute to entrainment of high ozone air from European
sources, and sustained and continued increases into the late afternoon. We identify that the late
afternoon maximum in ozone coincides with a high maximum in peroxy radicals and photochemical by-
products such as PAN, peak values of which were an order of magnitude higher in the heat wave.
Instantaneous O3 production rates as high as 100 ppb h-1 have been calculated, where the major source
of alkyl peroxy radicals in the afternoon was the thermolysis of PAN. The PAN lifetime during the
afternoon periods during the heat wave was on average only 18 mins and as short as 7.5 mins, yet
concentrations above 750pptV were sustained. Low wind speeds dictate that production of PAN must be
occurring within a small footprint around the measurement location, and that this PAN is not necessarily
a conserved tracer transported with other VOCs. Although PAN has many precursors, the types of
VOCs observed in heat wave and non-heat wave periods were somewhat similar, albeit that total VOC
reactivity was around double during the episode with proportionally higher concentrations. The
distribution of carbonyl to aliphatic to aromatic reactivity remained broadly constant between periods.
The most noticeable difference between periods was the strong temperature dependence of ambient
isoprene, increasing exponentially with T to a maximum in excess of 1.2 ppbV. The maximum in
concentration was coincident in the late afternoon with maximum PAN and O3, and a strong relationship
between ambient isoprene and calculated PAN production rate existed. Our conclusions therefore are
that the potential for net ozone production exists on the day of observation building on a high
background in ozone which may be entrained at the beginning of an episodic day. The abundance of
ozone on the final day of an airmass trajectory arriving in the in the U.K during an anticyclone may
therefore be strongly influenced not only by longer range transport, but also by U.K. biogenic species
which have nonlinear emissions, and which have a clear sensitivity to changes in meteorology and
climate.
Acknowledgements
The authors acknowledge the staff at Writtle college for their assistance in staging this experiment and I
particular Mr Reece Andrew the Facilities Director. Support for this project has come from the NERC
Polluted Troposphere programme, via grants NER/T/S/2002/00498, xxx, xxx. Many authors and
research groups involved in this experiment are grateful for underpinning financial support from the
NERC Centres for Atmospheric Science.
6. References
4th PORG report, 1997, Ozone in the United Kingdom.
Air quality archive, 2005, available at airquality.co.uk.
Alicke, B., Geyer, A., Hofzumahaus, A., Holland, F., Konrad, S., Patz, H.W., Schafer, J., Stutz, J., Volz-Thomas, A., and Platt, U., 2003, OH formation by HONO photolysis during the BERLIOZ experiment, Journal of Geophysical Research, 108, 8247.
Bloss, W. J., Gravestock, T. J., Heard, D. E., Ingham, T., Johnson, G. P., and Lee, J. D., 2003, Application of a compact all solid-state laser system to the in situ detection of atmospheric OH, HO2, NO and IO by laser-induced fluorescence, Journal of Environmental Monitoring, 5 (21-28).
Cantrell, C.A., Shetter, R.E., and Calvert, J.G., 1996, Dual-inlet chemical amplifier for atmospheric peroxy radical measurements, Analytical Chemistry, 68, 4194-4199.
Cantrell, C.A., Stedman, D.H., and Wendel, G.J., 1984, Measurement of atmosheric peroxy radicals by chemical amplification, Analytical Chemistry, 56, 1496.
Clemitshaw, K.C., Carpenter, L.J., Penkett, S.A., and Jenkin, M.E., 1997, A calibrated peroxy radical chemical amplifier for ground-based tropospheric measurements, Journal of Geophysical Research-Atmospheres, 102, 25405-25416.
Derwent, R.G. and Jenkin, M.E., 1991, Hydrocarbons and the Long-Range Transport of Ozone and Pan across Europe, Atmospheric Environment Part a-General Topics, 25, 1661-1678.
Derwent, R.G., Jenkin, M.E., Saunders, S.M., Pilling, M.J., Simmonds, P.G., Passant, N.R., Dollard, G.J., Dumitrean, P., and Kent, A., 2003, Photochemical ozone formation in north west Europe and its control, Atmospheric Environment, 37, 1983-1991.
Dollard, G.J., 2005, Personal Communication.
Ehhalt, D.H., 1999, Photooxidation of trace gases in the troposphere, Physical Chemistry Chemical Physics, 1, 5401-5408.
Fischer, P.H., Brunekreff, B., and Lebret, E., 2004, Air pollution related deaths during the 2003 heatwave inthe Netherlands, Atmospheric Environment, 38, 1083-1085.
Fleming, Z., Monks, P.S., Rickard, A.R., Heard, D.E., Bloss, W.J., Still, T., Sommariva, R., Pilling, M.J., Morgan, R.B., Green, T.J., Brough, N., Penkett, S.A., Lewis, A.C., Lee, J.D., Saiz-Lopez, A., and Plane, J.M.C., 2005, Peroxy radical chemistry at Mace Head, Ireland during the summer of 2002, Atmospheric Chemistry and Physics, Submitted.
Goodwin, J.W.L. and Salway, A.G., 2002, UK emissions of air pollutants 1970 to 2000, AEA Technology Report AEAT/ENV/R/1283, ISBN 1-85580-33-0.
Green, T.J., Reeves, C.E., Brough, N., Edwards, G.D., Monks, P.S., and Penkett, S.A., 2003, Airborne measurements of peroxy radicals using the PERCA technique, Journal of Environmental Monitoring, 5, 75-83.
Guenther, A.B., Zimmerman, P.R., Harley, P.C., Monson, R.K., and Fall, R., 1993, Isoprene and Monoterpene Emission Rate Variability - Model Evaluations and Sensitivity Analyses, Journal of Geophysical Research-Atmospheres, 98, 12609-12617.
Hamilton, J.F. and Lewis, A.C., 2003, Monoaromatic complexity in urban air and gasoline assessed using comprehensive GC and fast GC-TOF/MS, Atmospheric Environment, 37, 589-602.
Heard, D. E., and Pilling, M. J., 2003, Measurement of OH and HO2 in the troposphere, Chemical Reviews, 103, 5163-5198.
Holland, F., Hofzumahaus, A., Schafer, R., Kraus, A., and Patz, H. W., 2003, Measurements of OH and HO2 radical concentrations and photolysis frequencies during BERLIOZ, Journal of Geophysical Research-Atmospheres, 108 (D4), art. no.-8246.
Hopkins, J.R., Lewis, A.C., and Read, K.A., 2002, A Two-column method for long-term monitoring of Non-methane hydrocarbons (NMHC) and oxygenated volatile organic compounds (o-VOCs), J.Environ.Monitor., 5, 8-13.
Jenkin, M.E., Davies, T.J., and Stedman, J.R., 2002, The origin and day-of-week dependence of photochemical ozone episodes in the UK, Atmospheric Environment, 36, 999-1012.
Kleinmen, L.I., Daum, P.H., Lee, Y.N., Nunnermacker, S.R., Springston, S.R., Weinstein-Lloyd, J., and Rudolph, J., 2005, A comparative study of ozone production in five U.S. metropolitan areas, Journal of Geophysical Research, 110, doi:10.1029/2004JD005096.
Logan, J.A., Prather, M.J., Wofsy, S.C., and McElroy, M.B., 1981, Tropospheric chemistry: A global perspective, Journal of Geophysical Research, 86, 7210-7254.
Martinez, M., Harder, H., Kovacs, T. A., Simpas, J. B., Bassis, J., Lesher, R., Brune, W. H., Frost, G. J., Williams, E. J., Stroud, C. A., Jobson, B. T., Roberts, J. M., Hall, S. R., Shetter, R. E., Wert, B., Fried, A., Alicke, B., Stutz, J., Young, V. L., White, A. B., and Zamora, R. J., 2003, OH and HO2 concentrations, sources and loss rates during the Southern Oxidants Study in Nashville, Tennesee, summer 1999, Journal of Geophysical Research, 108, 4617-4633.
McLaren, R., Singleton, D.L., Lai, J.Y.K., Khouw, B., Singer, E., Wu, Z., and Niki, H., 1996, Analysis of motor vehicle sources and their contribution to ambient hydrocarbon distributions at urban sites in Toronto during the Southern Ontario oxidants study, Atmospheric Environment, 30, 2219-2232.
Mihelcic, D., Holland, F., Hofzumahaus, A., Hoppe, L., Konrad, S., Musgen, P., Patz, H.W., Schafer, H.J., Schmitz, T., Volz-Thomas, A., Bachmann, K., Schlomski, S., Platt, U., Geyer, A., Alicke, B., and Moortgat, G.K., 2003, Peroxy radicals during BERLIOZ at Pabstthum: Measurements, radical budgets and ozone production, Journal of Geophysical Research-Atmospheres, 108, art-8254.
Mihele, C.M. and Hastie, A.L.S., 2003, Radical chemistry and a forested continental site: Results from the PROPHET 1997 campaign, Journal of Geophysical Research, 108, 4450-4478.
Monks, P.S., 2005, Gas-phase radical chemistry in the tropopshere, Chemical Society Reviews, 34, 376-395.
Monks, P.S., Carpenter, L.J., Penkett, S.A., Ayers, G.P., Gillet, R.W., Galbally, I.E., and Meyer, C.P., 1998, Fundamental ozone photochemistry in the remote marine boundary layer: The SOAPEX experiment, measurement and theory, Atmospheric Environment, 32, 3647-3664.
Monks, P.S., Salisbury, G., Holland, G., Penkett, S.A., and Ayers, G.P., 2000, A seasonal comparison of ozone photochemistry in the remote marine boundary layer, Atmospheric Environment, 34, 2547-2561.
Norton, E.G., Vaughan, G., Methven , J., Coe, H., Brooks, B., Gallagher, M., and Longley, I., 2005, Boundary layer structure and decoupling from synoptic scale flow during NAMBLEX, Atmospheric Chemistry and Physics, 5, 3191-3223.
Penkett, S.A., Monks, P.S., Carpenter, L.J., and Clemitshaw, K.C., 1997, Relationships between ozone photolysis rates and peroxy radical concentrations in clean marine air over the Southern Ocean, Journal of Geophysical Research, 102, 12805-12817.
Salisbury, G., Rickard, A.R., Monks, P.S., Allan, B.J., Bauguitte, S., Penkett, S.A., Carslaw, N., Lewis, A.C., Creasey, D.J., Heard, D.E., Jacobs, P.J., and Lee, J.D., 2001, Production of peroxy radicals at night via reactions of ozone and the nitrate radical in the marine boundary layer, J.Geophys.Res, 106, 12669-12687.
Schar, C., Vidale, P.-L., Luthi, D., Frei, C., Harberli, C., Liniger, M.A., and Appenzeller, C., 2004, The role of increasing temperature variability in European summer heatwaves, Nature, 427, 332-336.
Simpson, D., Guenther, A., Hewitt, C.N., and Steinbrecher, R., 1995, Biogenic emmisions in Europe. 1. Estimates and uncertainties, Journal of Geophysical Research, 100, 22875-22890.
Smith, S. C., Lee, J. D., Bloss, W. J., Johnson, G. P., and Heard, D. E., 2005, Concentration of OH and HO2 during NAMBLEX: Measurements and Steady State analysis., Atmospheric Chemistry and Physics, submitted (NAMBLEX special issue).
Stedman, J.R., 2003, The predicted number of air pollution related deaths in the UK during the August 2003 heatwave, Atmospheric Environment, 38, 1087-1090.
Stedman, J.R., 2004, The predicted number of air pollution related deaths in the UK during the August 2003 heatwave, Atmospheric Environment, 38, 1087-1090.
Utembe, S.R., Jenkin, M.E., Derwent, R.G., Lewis, A.C., Hopkins, J.R., and Hamilton, J.F., 2005, Modelling the ambient distribution of organic compounds during the August 2003 ozone episode in the southern UK, Faraday Discussions, 130, 311-326.


